
Wireless Charging of Electric Taxis: Understanding the ... - MDPI
Upload
khangminh22Category
view
0download
0
applied sciences
Article
Electric Turbocharging for Energy Regeneration andIncreased Efficiency at Real Driving Conditions
Pavlos Dimitriou 1,*, Richard Burke 1, Qingning Zhang 1, Colin Copeland 1 and Harald Stoffels 2
1 Department of Mechanical Engineering, University of Bath, Bath BA2 7AY, UK; [email protected] (R.B.);[email protected] (Q.Z.); [email protected] (C.C.)
2 Powertrain Research & Advanced, Ford-Werke GmbH, Köln-Merkenich, Cologne D-50725, Germany;[email protected]
* Correspondence: [email protected]; Tel.: +44-1225-38-3313
Academic Editor: Jose Ramon SerranoReceived: 23 January 2017; Accepted: 14 March 2017; Published: 1 April 2017
Abstract: Modern downsized internal combustion engines benefit from high-efficiency turbochargingsystems for increasing their volumetric efficiency. However, despite the efficiency increase,turbochargers often lack fast transient response due to the nature of the energy exchange withthe engine, which deteriorates the vehicle’s drivability. An electrically-assisted turbocharger can beused for improving the transient response without any parasitic losses to the engine while providingenergy recovery for increasing overall system efficiency. The present study provides a detailednumerical investigation on the potential of e-turbocharging to control load and if possible replacethe wastegate valve. A parametric study of the optimum compressor/turbine sizing and wastegatearea was performed for maximum torque, fast response time and energy regeneration across the realdriving conditions speed/load area of the engine. The results showed that the implementation of amotor-generator could contribute to reducing the response time of the engine by up to 90% whileimproving its thermal efficiency and generating up to 6.6 kWh of energy. Suppressing the wastegatecan only be achieved when a larger turbine is implemented, which as a result deteriorates the engine’sresponse and leads to energy provision demands at low engine speeds.
Keywords: turbocharger; e-turbo; boosting; electrically-assisted; turbo-compound; energyregeneration; internal combustion engines; 1D simulation
1. Introduction
The demand for low fuel consumption and CO2 generation vehicles over the last few yearshas popularly increased the necessity of downsizing and increasing the overall thermal efficiency ofInternal Combustion (IC) engines. Downsizing is the process of reducing the volumetric capacityof an engine for reduced throttling and friction losses while its boosting capabilities need to beincreased for higher specific heat. This can be achieved by the implementation of a boosting device(turbocharger or supercharger) for increased air pressure at the intake of the engine and thereforehigher volumetric efficiency.
A turbocharger is a device that recovers the waste energy from the engine’s exhaust gasses anduses it to compress the air at the engine’s intake. The level of compression is directly linked to theamount of air passing through the turbine, and it can be controlled by either bypassing part of the flowthrough a Wastegate (WG) or by changing the nozzle position of the turbine (VGT, Variable-geometryturbocharger). The proportion of the waste-gated flow can be up to 50% for high speed and loadconditions, which imply a vast amount of unexploited energy. The drawback of this device is that dueto the nature of the energy exchange between the engine and the turbocharger (filling of the intake andexhaust manifolds and low exhaust energy at low speeds/loads), the transient performance during
Appl. Sci. 2017, 7, 350; doi:10.3390/app7040350 www.mdpi.com/journal/applsci
Appl. Sci. 2017, 7, 350 2 of 25
engine load increase is relatively poor, which deteriorates the drivability of the vehicle [1]. On the otherhand, a supercharger is a device mechanically driven by the engine to increase its volumetric efficiency.It has a very fast response time in transient conditions, but the power required for its operation is aparasitic loss for the engine; therefore, it is not widely used in recent technologies.
The parallel use of a turbocharger and a supercharger could potentially improve the transientperformance of the system during load increase while reducing the engine losses compared to a solelysupercharger boosted system. However, this will increase the complexity, as a two-stage boostingsystem is required [2,3]. An electrically-assisted turbocharger of a larger size and with higher efficiencycould be used in case a simpler one-stage boosting system is needed. The motor can provide theelectricity required at the periods of load increase for a faster response, while the turbocharger worksas a conventional system during steady-state and tip-out conditions.
Katrasnik et al. [4] investigated the influence of an electric motor attached to the turbo shaft onthe transient response of a diesel engine. It was found that the time required to perform transientpower increase was reduced from 3.9 s for the original conventional turbocharger down to 1.7 s.Ibaraki et al. [5] tested a hybrid turbo developed by Mitsubishi Heavy Industries under transientoperating conditions. An improved engine peak torque and enhanced transient response comparedto a conventional system was demonstrated. Torque was enhanced by 18% at low engine speeds,while the response time was reduced by 70% when 2 kW of turbo motor assistance was provided.Millo et al. [6] investigated the potential of an electrically-assisted turbocharger for a heavy-duty dieselengine to evaluate the turbo-lag reductions and the fuel consumption savings that could be obtained inan urban bus at different operating conditions. The system allowed fuel consumption reductions of 6%to 1%, depending on the driving cycle, with lower values corresponding to congested traffic conditions.
Burke [7] applied various electric boosting systems to a gasoline and a diesel engine and evaluatedtheir steady state and transient performance from the perspective of the air path. The author comparedthe performance characteristics of an electrically-assisted turbocharger with those of a two-stage systemwith an electrically-driven compressor placed before or after the main waste-gated turbocharger. Hefound that under steady-state operating conditions, there was significant system efficiency to installingthe electric compressor downstream of the turbocharger’s compressor. The author also concludedthat an electrically-assisted turbocharger is not ideal as a replacement for the second compressor in atwo-stage system, as it will push the compressor into surge. However, it was mentioned that this couldbe overcome through re-matching of the compressor. Bumby et al. [8,9] investigated the technicalproblems in selecting an appropriate machine to use with an electrically-assisted turbocharger. Theauthors also demonstrated that the required time for accelerating an electrically-assisted turbochargerfrom 40 to 110 krpm could be around 50% less than a conventional turbocharger.
However, albeit an electrically-assisted turbocharged engine requires less energy for its operationthan a solemnly supercharged engine, the power required is still a parasitic loss for the engine, whichresults in an increased fuel consumption. Divekar et al. [10] proposed an electrical supercharging anda turbo-generation system integrated in a diesel engine for overcoming the issue of parasitic losses.The proposed system showed distinct transient response improvement benefits over a conventionalturbocharged system and 7% improvement in fuel consumption over the Federal Urban DrivingSchedule (FUDS) cycle. Furthermore, during transients and high load operation, the proposed systemdid not build up exhaust backup pressure in order to accelerate the supercharger, and as such,no additional pumping losses were incurred. However, the authors commented that the electricalenergy required by the supercharger can be only partially obtained by the turbo-generation system,which still leads to additional energy losses.
Panting et al. [11] was one of the first research groups to implement the idea of a motor-generatorelectrical turbocharger for a 5.2 L truck diesel engine in a theoretical study. Adding a directly-coupledmotor-generator offers tremendous advantages to the operation of the turbocharger. It abolishes therequirement of the turbine and compressor power to be matched under steady-state conditions whileit assists the acceleration and deceleration of the shaft during transients with no engine energy needs.
Appl. Sci. 2017, 7, 350 3 of 25
Over the last few years, keen interest has been shown in the numerical and experimental investigationof the motor-generator technology application in high-duty engines by several research groups.Terdich and Martinez-Botas [12] experimentally characterized a variable geometry turbochargerwith a motor-generator technology. The authors found that the motor-generator is capable ofdelivering a maximum shaft power of 3.5 kW in motoring mode and 5.4 kW in generating mode.The peak electrical efficiency was more than 90% in both modes and occurred at 120,000 revs/min.Airse et al. [13] developed a comprehensive powertrain model to evaluate the benefits of an electricturbo-compound, working in both generator and motor mode, in reducing CO2 emissions from smalldiesel passenger cars. The simulations showed a reduction in CO2 and fuel consumption of over 4%for the New European Driving Cycle (NEDC). Algrain [14] developed an advanced control systemfor a motor-generator fitted in a heavy-duty diesel engine for improving the overall fuel efficiency.The simulation results showed that at the rated power, the fuel consumption of a Class-8 on-highwaytruck engine could be reduced by almost 10%, while the overall reduction in fuel consumption wasestimated to be around 5%. Pasini et al. [15] focused on the evaluation of the benefits resulting fromthe application of an Electric Turbo Compound (ETC) to a small-sized twin-cylinder Spark-Ignition(SI) engine and to a four-cylinder Compression-Ignition (CI) engine with the same power rating. Theyfound that by absorbing electrical energy from the battery, the ETC can lead to significant Brake-SpecificFuel Consumption (BSFC) reductions of up to 4% at the highest engine speeds and loads for the SIengine and up to 6% for the CI engine at 4000 rpm half load. Furthermore, calculations have shownthat in the case of the CI engine, the maximum electric power that can be recovered by the ETC isaround 4 kW at 4000 rpm full load, while in the case of the SI engine, the maximum power is 1.5 kW.
Tavcar et al. [16] presented a comprehensive study on engine performance improvementattributable to the application of different electrically-assisted turbocharger topologies, includinga single-stage turbocharger, an electrically-assisted turbocharger, a turbocharger with anadditional electrically-driven compressor and an electrically-split turbocharger (supercharger andturbo-generator). The results revealed that all of the electrically-assisted turbocharger topologiesimprove the transient response of the engine and, thus, the drivability of the vehicle. However, noelectrically-assisted turbocharger topology could clearly be favoured in general.
In this paper, a detailed investigation of the potential of e-turbocharging to control load whileproviding energy recovery for increasing the overall system efficiency and if possible replace thewastegate boost control is provided. The current approach of e-turbocharging requires larger turbinesystems that do not build up backup pressure and provide electrical assistance at low engine speeds.However, with this configuration, the energy regeneration occurs only at high speed and load areas ofthe engine, as shown in Figure 1a. The proposed study focusses on shifting the energy regenerationtowards the low-speed area, which represents more realistic driving conditions, as shown in Figure 1b.Energy assistance is provided to the engine when the maximum power characteristics of the engineneed to be met. The study is performed on a 2.0 L turbocharged SI engine under steady-state andtransient driving conditions. The research work focuses on the availability of energy and the effects ofcomponent sizing, the transient behaviour for eliminating turbo lag and the overall system energybalance during various driving conditions.
After a comprehensive introduction in this section, Section 2 outlines the engine model usedfor the study and any relatively small modifications occurring for the purpose of electrifying theturbocharger. A detailed model validation against experimental data is also presented in ModelValidation. Section 3 describes the methodology followed for all of the simulation studies conductedunder steady-state and transient conditions. The simulation results for all of the studies performed areanalysed and discussed in Section 4. Finally, Section 5 summarizes the main findings of this work andproposes future work in the area of the electrification of turbocharging systems.

Appl. Sci. 2017, 7, 350 4 of 25Appl. Sci. 2017, 7, 350 4 of 25
Figure 1. Energy regeneration areas over the load/speed map of an engine: (a) current approach; (b) desired operation.
2. Computational Model
The present numerical study was performed on a 1D gas dynamic environment using the GT-Power software tool (v7.5.0, Gamma Technologies, LLC., Westmont, IL, USA, 2014). The model used for this study, shown in Figure 2, represents a 2.0 L spark-ignition turbocharged engine. The model, previously used in [17], was provided by the engine supplier, and it has been validated against experimental data in both steady-state and transients by POWERTECH Engineering (see Section 2.1).
Figure 2. 1D model of the baseline 2.0 L turbocharged engine used in the present study.
Figure 1. Energy regeneration areas over the load/speed map of an engine: (a) current approach;(b) desired operation.
2. Computational Model
The present numerical study was performed on a 1D gas dynamic environment using theGT-Power software tool (v7.5.0, Gamma Technologies, LLC., Westmont, IL, USA, 2014). The model usedfor this study, shown in Figure 2, represents a 2.0 L spark-ignition turbocharged engine. The model,previously used in [17], was provided by the engine supplier, and it has been validated againstexperimental data in both steady-state and transients by POWERTECH Engineering (see ModelValidation).
Appl. Sci. 2017, 7, 350 4 of 25
Figure 1. Energy regeneration areas over the load/speed map of an engine: (a) current approach; (b) desired operation.
2. Computational Model
The present numerical study was performed on a 1D gas dynamic environment using the GT-Power software tool (v7.5.0, Gamma Technologies, LLC., Westmont, IL, USA, 2014). The model used for this study, shown in Figure 2, represents a 2.0 L spark-ignition turbocharged engine. The model, previously used in [17], was provided by the engine supplier, and it has been validated against experimental data in both steady-state and transients by POWERTECH Engineering (see Section 2.1).
Figure 2. 1D model of the baseline 2.0 L turbocharged engine used in the present study. Figure 2. 1D model of the baseline 2.0 L turbocharged engine used in the present study.
Appl. Sci. 2017, 7, 350 5 of 25
The baseline 2.0 L engine model was used only for the Phase 1 study of the steady-statesimulations, which included a wastegate enthalpy loss study for quantifying the energy availabilityacross the speed/load map of the engine.
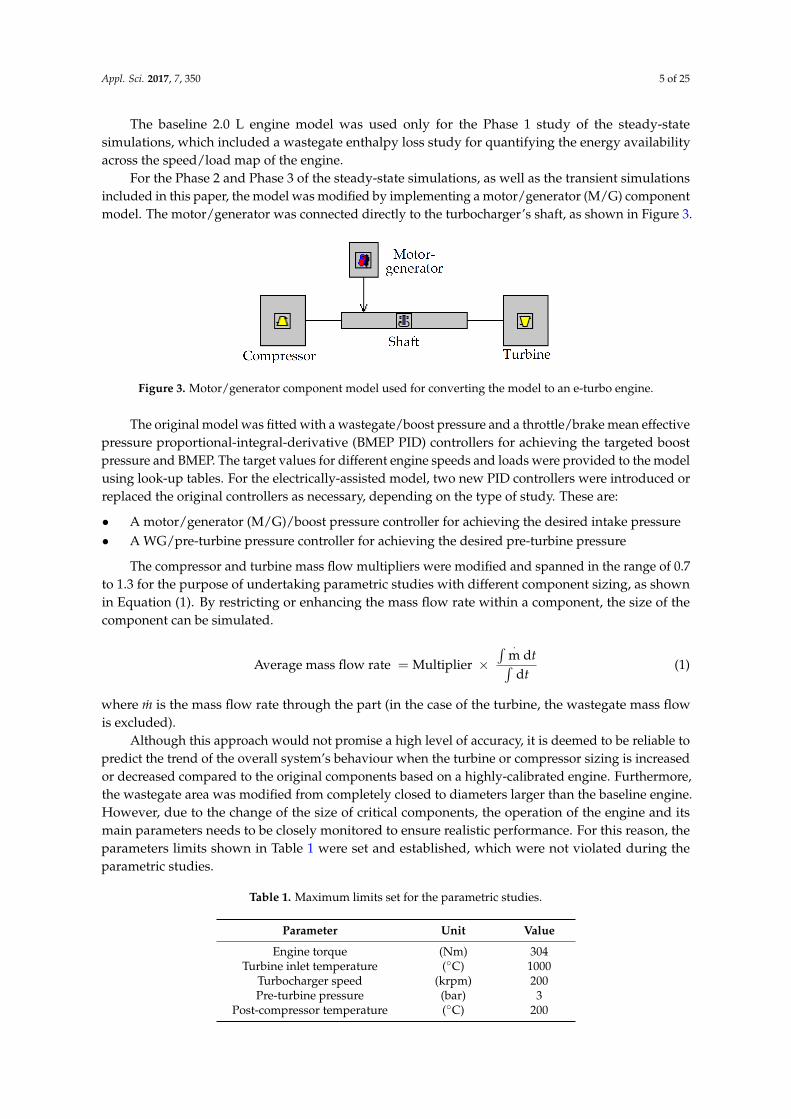
For the Phase 2 and Phase 3 of the steady-state simulations, as well as the transient simulationsincluded in this paper, the model was modified by implementing a motor/generator (M/G) componentmodel. The motor/generator was connected directly to the turbocharger’s shaft, as shown in Figure 3.
Appl. Sci. 2017, 7, 350 5 of 25
The baseline 2.0 L engine model was used only for the Phase 1 study of the steady-state simulations, which included a wastegate enthalpy loss study for quantifying the energy availability across the speed/load map of the engine.
For the Phase 2 and Phase 3 of the steady-state simulations, as well as the transient simulations included in this paper, the model was modified by implementing a motor/generator (M/G) component model. The motor/generator was connected directly to the turbocharger’s shaft, as shown in Figure 3.
Figure 3. Motor/generator component model used for converting the model to an e-turbo engine.
The original model was fitted with a wastegate/boost pressure and a throttle/brake mean effective pressure proportional-integral-derivative (BMEP PID) controllers for achieving the targeted boost pressure and BMEP. The target values for different engine speeds and loads were provided to the model using look-up tables. For the electrically-assisted model, two new PID controllers were introduced or replaced the original controllers as necessary, depending on the type of study. These are:
• A motor/generator (M/G)/boost pressure controller for achieving the desired intake pressure • A WG/pre-turbine pressure controller for achieving the desired pre-turbine pressure
The compressor and turbine mass flow multipliers were modified and spanned in the range of 0.7 to 1.3 for the purpose of undertaking parametric studies with different component sizing, as shown in Equation (1). By restricting or enhancing the mass flow rate within a component, the size of the component can be simulated. Averagemass flow rate = Multiplier × ∫ṁ d∫ d (1)
where ṁ is the mass flow rate through the part (in the case of the turbine, the wastegate mass flow is excluded).
Although this approach would not promise a high level of accuracy, it is deemed to be reliable to predict the trend of the overall system’s behaviour when the turbine or compressor sizing is increased or decreased compared to the original components based on a highly-calibrated engine. Furthermore, the wastegate area was modified from completely closed to diameters larger than the baseline engine. However, due to the change of the size of critical components, the operation of the engine and its main parameters needs to be closely monitored to ensure realistic performance. For this reason, the parameters limits shown in Table 1 were set and established, which were not violated during the parametric studies.
Table 1. Maximum limits set for the parametric studies.
Parameter Unit ValueEngine torque (Nm) 304
Turbine inlet temperature (°C) 1000
Turbocharger speed (krpm) 200 Pre-turbine pressure (bar) 3
Post-compressor temperature (°C) 200
Figure 3. Motor/generator component model used for converting the model to an e-turbo engine.
The original model was fitted with a wastegate/boost pressure and a throttle/brake mean effectivepressure proportional-integral-derivative (BMEP PID) controllers for achieving the targeted boostpressure and BMEP. The target values for different engine speeds and loads were provided to the modelusing look-up tables. For the electrically-assisted model, two new PID controllers were introduced orreplaced the original controllers as necessary, depending on the type of study. These are:
• A motor/generator (M/G)/boost pressure controller for achieving the desired intake pressure• A WG/pre-turbine pressure controller for achieving the desired pre-turbine pressure
The compressor and turbine mass flow multipliers were modified and spanned in the range of 0.7to 1.3 for the purpose of undertaking parametric studies with different component sizing, as shownin Equation (1). By restricting or enhancing the mass flow rate within a component, the size of thecomponent can be simulated.
Average mass flow rate = Multiplier ×∫ ·
m dt∫dt
(1)
where m is the mass flow rate through the part (in the case of the turbine, the wastegate mass flowis excluded).
Although this approach would not promise a high level of accuracy, it is deemed to be reliable topredict the trend of the overall system’s behaviour when the turbine or compressor sizing is increasedor decreased compared to the original components based on a highly-calibrated engine. Furthermore,the wastegate area was modified from completely closed to diameters larger than the baseline engine.However, due to the change of the size of critical components, the operation of the engine and itsmain parameters needs to be closely monitored to ensure realistic performance. For this reason, theparameters limits shown in Table 1 were set and established, which were not violated during theparametric studies.
Table 1. Maximum limits set for the parametric studies.
Parameter Unit Value
Engine torque (Nm) 304Turbine inlet temperature (◦C) 1000
Turbocharger speed (krpm) 200Pre-turbine pressure (bar) 3
Post-compressor temperature (◦C) 200

Appl. Sci. 2017, 7, 350 6 of 25
Model Validation
A high fidelity engine model validated against experimental data for a conventional layout,in both steady-state and transients, has been applied in this study. The calibration of the combustionmodel (SI Wiebe) was performed by isolating Cylinder 1 of the engine and performing a Three PressureAnalysis (TPA). Figure 4 represents the comparison between measurements and simulation results forall engine cylinders at low loads.
Appl. Sci. 2017, 7, 350 6 of 25
Model Validation
A high fidelity engine model validated against experimental data for a conventional layout, in both steady-state and transients, has been applied in this study. The calibration of the combustion model (SI Wiebe) was performed by isolating Cylinder 1 of the engine and performing a Three Pressure Analysis (TPA). Figure 4 represents the comparison between measurements and simulation results for all engine cylinders at low loads.
(a) (b)
(c) (d)
Figure 4. Simulated cylinder pressure from Three Pressure Analysis (TPA) and measured pressure at low loads. (a) Cylinder 1; (b) Cylinder 2; (c) Cylinder 3; (d) Cylinder 4.
The small cylinder-to-cylinder variations observed in the measured data were difficult to capture in the 1D simulation. These variations may be a result of several factors, such as 3D air and gas flow behaviours at the intake and exhaust or different thermal conditions. Although there were slight variations, a good agreement between measured and simulated mass air flow and averaged indicated mean effective pressure (IMEP) (error of less than 2%) was observed for full load conditions, as shown in Table 2.
Table 2. Measured data and simulation results at full loads. IMEP, indicated mean effective pressure.
Attribute Value Cylinder 1 Cylinder 2 Cylinder 3 Cylinder 4Measured total mass air flow (kg/h) 258.69 Simulated total mass air flow (kg/h) 263.65 Error in total mass air flow (%) 1.92 Measured net IMEP (bar) 20.71 21.19 20.75 18.29 Simulated net IMEP (bar) 20.44 20.76 20.30 18.02 Absolute error in net IMEP prediction (bar) 0.39 0.43 0.45 0.27 Error in net IMEP prediction (%) 1.87 2.05 2.15 1.47 Averaged absolute error in net IMEP (bar) 0.36 Averaged error in net IMEP (%) 1.89
For part-load cases, the discrepancy between measured and simulated results was slightly larger, as can be found in Table 3. However, despite the 9.37% error in the averaged IMEP for the low-load case, the averaged absolute error in net IMEP was below 0.3 bar. Therefore, the modelling of the scavenging system and combustion system at low engine load is satisfactory.
Figure 4. Simulated cylinder pressure from Three Pressure Analysis (TPA) and measured pressure atlow loads. (a) Cylinder 1; (b) Cylinder 2; (c) Cylinder 3; (d) Cylinder 4.
The small cylinder-to-cylinder variations observed in the measured data were difficult to capturein the 1D simulation. These variations may be a result of several factors, such as 3D air and gas flowbehaviours at the intake and exhaust or different thermal conditions. Although there were slightvariations, a good agreement between measured and simulated mass air flow and averaged indicatedmean effective pressure (IMEP) (error of less than 2%) was observed for full load conditions, as shownin Table 2.
Table 2. Measured data and simulation results at full loads. IMEP, indicated mean effective pressure.
Attribute Value Cylinder 1 Cylinder 2 Cylinder 3 Cylinder 4
Measured total mass air flow (kg/h) 258.69Simulated total mass air flow (kg/h) 263.65Error in total mass air flow (%) 1.92Measured net IMEP (bar) 20.71 21.19 20.75 18.29Simulated net IMEP (bar) 20.44 20.76 20.30 18.02Absolute error in net IMEP prediction (bar) 0.39 0.43 0.45 0.27Error in net IMEP prediction (%) 1.87 2.05 2.15 1.47Averaged absolute error in net IMEP (bar) 0.36Averaged error in net IMEP (%) 1.89
For part-load cases, the discrepancy between measured and simulated results was slightly larger,as can be found in Table 3. However, despite the 9.37% error in the averaged IMEP for the low-loadcase, the averaged absolute error in net IMEP was below 0.3 bar. Therefore, the modelling of thescavenging system and combustion system at low engine load is satisfactory.

Appl. Sci. 2017, 7, 350 7 of 25
Table 3. Summary of combustion model validation at 2000 rpm.
Attribute Value Low-Load Medium-Load Full-Load
Error in total mass air flow prediction (%) 0.69 3.26 1.92Averaged error in net IMEP prediction (bar) (Cylinder 1) 0.19 0.39 0.39Averaged error in net IMEP prediction (%) (Cylinder 1) 7.39 2.56 1.87
The overall shape of the port pressures at three operating points was captured. Figure 5 outlinesthe measured and simulated instantaneous pressure at the exhaust port of Cylinder 1 for mediumengine loads. As can be seen from the figure, the magnitude of the pressure wave reflections waswell predicted.
Appl. Sci. 2017, 7, 350 7 of 25
Table 3. Summary of combustion model validation at 2000 rpm.
Attribute Value Low-Load Medium-Load Full-LoadError in total mass air flow prediction (%) 0.69 3.26 1.92 Averaged error in net IMEP prediction (bar) (Cylinder 1) 0.19 0.39 0.39 Averaged error in net IMEP prediction (%) (Cylinder 1) 7.39 2.56 1.87
The overall shape of the port pressures at three operating points was captured. Figure 5 outlines the measured and simulated instantaneous pressure at the exhaust port of Cylinder 1 for medium engine loads. As can be seen from the figure, the magnitude of the pressure wave reflections was well predicted.
Figure 5. Instantaneous pressure at exhaust port of Cylinder 1, 2000 rpm medium-load.
The validation of the transient performance of the model was also performed against experimental data collected from transient tests performed with various wastegate positions. The calibration was performed for three different boost pressures and the comparison between measured and simulated mass air flow is presented in Figure 6. The experimental and simulation results show a good agreement with small variations (5%) that could be a result of the scavenging model in the 1D engine simulation.
Figure 6. Comparison between measurement and simulation results of transient performance for different boost targets with imposed turbocharger rotational speed.
3. Methodology
The simulations performed in this paper are divided into two main subsections of steady-state and transient analysis. Each of the subsections is further divided into smaller segments to represent
Figure 5. Instantaneous pressure at exhaust port of Cylinder 1, 2000 rpm medium-load.
The validation of the transient performance of the model was also performed against experimentaldata collected from transient tests performed with various wastegate positions. The calibration wasperformed for three different boost pressures and the comparison between measured and simulatedmass air flow is presented in Figure 6. The experimental and simulation results show a good agreementwith small variations (5%) that could be a result of the scavenging model in the 1D engine simulation.
Appl. Sci. 2017, 7, 350 7 of 25
Table 3. Summary of combustion model validation at 2000 rpm.
Attribute Value Low-Load Medium-Load Full-LoadError in total mass air flow prediction (%) 0.69 3.26 1.92 Averaged error in net IMEP prediction (bar) (Cylinder 1) 0.19 0.39 0.39 Averaged error in net IMEP prediction (%) (Cylinder 1) 7.39 2.56 1.87
The overall shape of the port pressures at three operating points was captured. Figure 5 outlines the measured and simulated instantaneous pressure at the exhaust port of Cylinder 1 for medium engine loads. As can be seen from the figure, the magnitude of the pressure wave reflections was well predicted.
Figure 5. Instantaneous pressure at exhaust port of Cylinder 1, 2000 rpm medium-load.
The validation of the transient performance of the model was also performed against experimental data collected from transient tests performed with various wastegate positions. The calibration was performed for three different boost pressures and the comparison between measured and simulated mass air flow is presented in Figure 6. The experimental and simulation results show a good agreement with small variations (5%) that could be a result of the scavenging model in the 1D engine simulation.
Figure 6. Comparison between measurement and simulation results of transient performance for different boost targets with imposed turbocharger rotational speed.
3. Methodology
The simulations performed in this paper are divided into two main subsections of steady-state and transient analysis. Each of the subsections is further divided into smaller segments to represent
Figure 6. Comparison between measurement and simulation results of transient performance fordifferent boost targets with imposed turbocharger rotational speed.

Appl. Sci. 2017, 7, 350 8 of 25
3. Methodology
The simulations performed in this paper are divided into two main subsections of steady-stateand transient analysis. Each of the subsections is further divided into smaller segments to representdifferent types of studies. A detailed flowchart of all of the simulations performed in this paper isshown in Figure 7.
Appl. Sci. 2017, 7, 350 8 of 25
different types of studies. A detailed flowchart of all of the simulations performed in this paper is shown in Figure 7.
Figure 7. Flowchart of the simulation process. WG, wastegate.
Finally, it needs to be highlighted that all of the studies presented in this paper show the potential available energy in the system. Any electrical losses such as alternator, converter and battery losses have not been considered at this point.
3.1. Steady-State Simulations
The steady state analysis of the model was performed in the area of three axes, compressor and turbine size and WG area, as shown in Figure 8. The purpose of the study was to understand the effects of the compressor and turbine sizing on the amount of energy that needs to be provided/harvested by the motor/generator and to identify any regions where the e-turbo can replace the wastegate for load control.
Figure 8. Area of investigation for the steady-state simulations.
The steady-state simulations are divided into three phases based on the type of investigation. • Phase 1: Assessment of the amount of enthalpy loss for the baseline engine across the speed/load
map and how this is affected by the compressor and turbine’s size. • Phase 2: Investigation of the potential of suppressing WG and using e-turbo to control boosting. • Phase 3: Reinstatement of the WG to control exhaust manifold pressure and explore the
trade-off between WG and turbine size.
Figure 7. Flowchart of the simulation process. WG, wastegate.
Finally, it needs to be highlighted that all of the studies presented in this paper show the potentialavailable energy in the system. Any electrical losses such as alternator, converter and battery losseshave not been considered at this point.
3.1. Steady-State Simulations
The steady state analysis of the model was performed in the area of three axes, compressor andturbine size and WG area, as shown in Figure 8. The purpose of the study was to understand the effectsof the compressor and turbine sizing on the amount of energy that needs to be provided/harvestedby the motor/generator and to identify any regions where the e-turbo can replace the wastegate forload control.
Appl. Sci. 2017, 7, 350 8 of 25
different types of studies. A detailed flowchart of all of the simulations performed in this paper is shown in Figure 7.
Figure 7. Flowchart of the simulation process. WG, wastegate.
Finally, it needs to be highlighted that all of the studies presented in this paper show the potential available energy in the system. Any electrical losses such as alternator, converter and battery losses have not been considered at this point.
3.1. Steady-State Simulations
The steady state analysis of the model was performed in the area of three axes, compressor and turbine size and WG area, as shown in Figure 8. The purpose of the study was to understand the effects of the compressor and turbine sizing on the amount of energy that needs to be provided/harvested by the motor/generator and to identify any regions where the e-turbo can replace the wastegate for load control.
Figure 8. Area of investigation for the steady-state simulations.
The steady-state simulations are divided into three phases based on the type of investigation. • Phase 1: Assessment of the amount of enthalpy loss for the baseline engine across the speed/load
map and how this is affected by the compressor and turbine’s size. • Phase 2: Investigation of the potential of suppressing WG and using e-turbo to control boosting. • Phase 3: Reinstatement of the WG to control exhaust manifold pressure and explore the
trade-off between WG and turbine size.
Figure 8. Area of investigation for the steady-state simulations.
The steady-state simulations are divided into three phases based on the type of investigation.
Appl. Sci. 2017, 7, 350 9 of 25
• Phase 1: Assessment of the amount of enthalpy loss for the baseline engine across the speed/loadmap and how this is affected by the compressor and turbine’s size.
• Phase 2: Investigation of the potential of suppressing WG and using e-turbo to control boosting.• Phase 3: Reinstatement of the WG to control exhaust manifold pressure and explore the trade-off
between WG and turbine size.
3.1.1. Phase 1: WG Enthalpy Loss Study
The first phase of the study was performed to calculate the amount of energy that is lost throughthe wastegate of a modern 2.0 L turbocharged gasoline engine. The amount of power loss wascalculated using the equation:
Q = m × cp × ∆T, (2)
where Q is the amount of heat to the system (power), m is the mass flow rate through the wastegate, cp
is the specific heat of the gas and ∆T is the temperature difference.A Design of Experiment (DoE) analysis was performed to evaluate the effects of the compressor
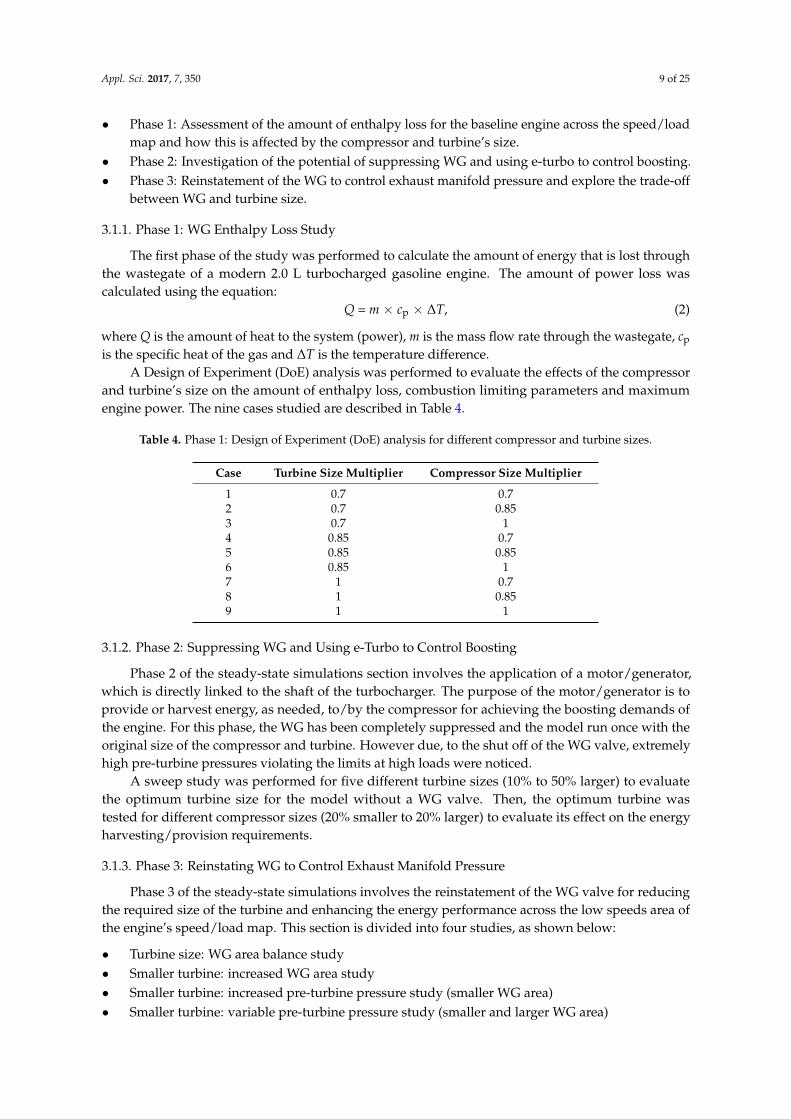
and turbine’s size on the amount of enthalpy loss, combustion limiting parameters and maximumengine power. The nine cases studied are described in Table 4.
Table 4. Phase 1: Design of Experiment (DoE) analysis for different compressor and turbine sizes.
Case Turbine Size Multiplier Compressor Size Multiplier
1 0.7 0.72 0.7 0.853 0.7 14 0.85 0.75 0.85 0.856 0.85 17 1 0.78 1 0.859 1 1
3.1.2. Phase 2: Suppressing WG and Using e-Turbo to Control Boosting
Phase 2 of the steady-state simulations section involves the application of a motor/generator,which is directly linked to the shaft of the turbocharger. The purpose of the motor/generator is toprovide or harvest energy, as needed, to/by the compressor for achieving the boosting demands ofthe engine. For this phase, the WG has been completely suppressed and the model run once with theoriginal size of the compressor and turbine. However due, to the shut off of the WG valve, extremelyhigh pre-turbine pressures violating the limits at high loads were noticed.
A sweep study was performed for five different turbine sizes (10% to 50% larger) to evaluatethe optimum turbine size for the model without a WG valve. Then, the optimum turbine wastested for different compressor sizes (20% smaller to 20% larger) to evaluate its effect on the energyharvesting/provision requirements.
3.1.3. Phase 3: Reinstating WG to Control Exhaust Manifold Pressure
Phase 3 of the steady-state simulations involves the reinstatement of the WG valve for reducingthe required size of the turbine and enhancing the energy performance across the low speeds area ofthe engine’s speed/load map. This section is divided into four studies, as shown below:
• Turbine size: WG area balance study• Smaller turbine: increased WG area study• Smaller turbine: increased pre-turbine pressure study (smaller WG area)• Smaller turbine: variable pre-turbine pressure study (smaller and larger WG area)
Appl. Sci. 2017, 7, 350 10 of 25
3.2. Transient Simulations
The findings in the steady-state simulations section (see the Results Section) demonstrated thata model fitted with a motor-generator and a turbine 10% smaller than the original could provideenergy harvesting and thermal efficiency gain across the speed/load map of the engine. The transientbehaviour of the model with this configuration, an original size compressor and increased pre-turbinepressures was tested by performing three different types of simulations, as shown below:
• Load step transient• Fixed gear vehicle speed transient• Energy balance study for various driving cycles and real driving conditions
The purpose of the transient study was to reveal the response time improvement under differentlevels of energy provision to the compressor, as well as to perform an energy balance review. This isrequired in order to identify whether the e-turbocharger can operate without energy consumptionfrom the engine and if any excess on the total energy generated.
3.2.1. Load Step Transient Simulations
The load tip-in study was performed for two engine speeds of interest, 1600 and 1100 rpm, closeto the surge limit of the compressor. The load tip-in step requested was from 2 bar BMEP to full loadBMEP (19 bar). However, due to the engine speeds at which the tests were performed, the requestedBMEP could not be achieved.
The study was initially performed for the model with all of the PID controllers. However,for ensuring that the results are not affected by the tuning of the controllers, the study was repeatedin an open-loop environment (no PID controllers). The PID controllers in the model were removedand replaced by look-up tables for controlling the boost pressure and throttle position of the engine,as shown in Table 5. This allows a hardware capability investigation to be performed by eliminatingany effects of the PID controllers. The energy provided to the compressor was divided into foursections of 0.25 seconds, and different levels of power (1, 3 and 5 kW) were provided in each section.
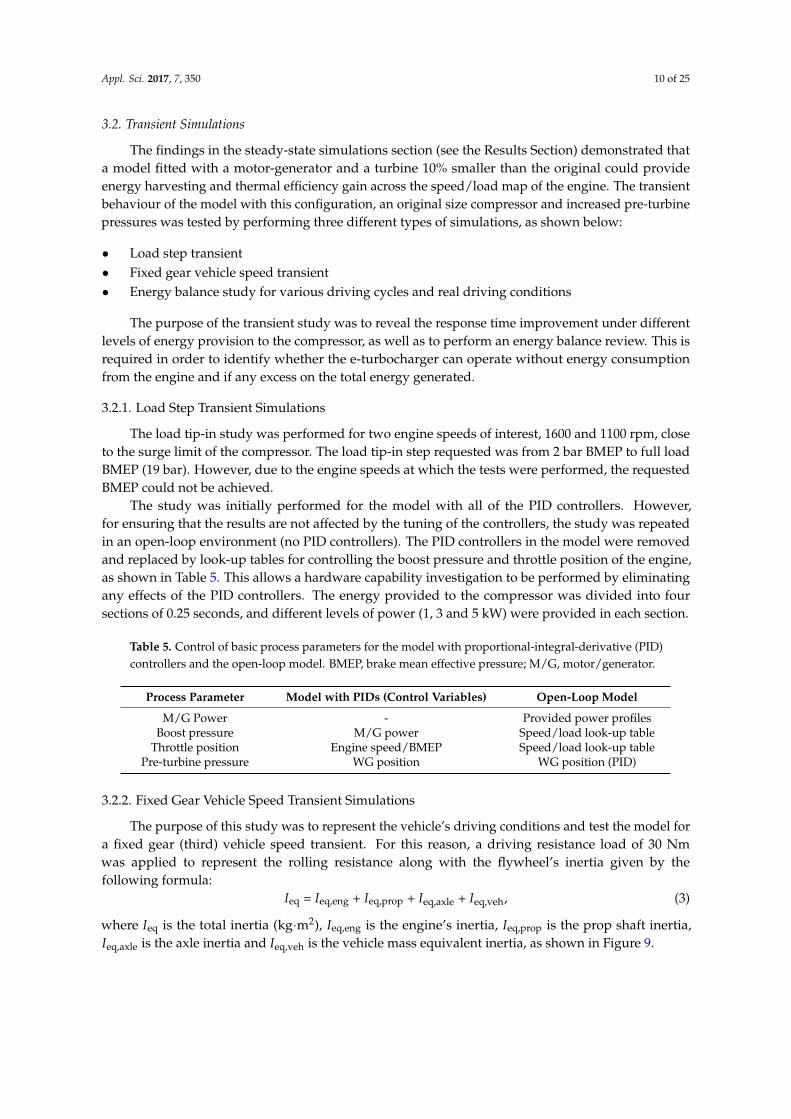
Table 5. Control of basic process parameters for the model with proportional-integral-derivative (PID)controllers and the open-loop model. BMEP, brake mean effective pressure; M/G, motor/generator.
Process Parameter Model with PIDs (Control Variables) Open-Loop Model
M/G Power - Provided power profilesBoost pressure M/G power Speed/load look-up table
Throttle position Engine speed/BMEP Speed/load look-up tablePre-turbine pressure WG position WG position (PID)
3.2.2. Fixed Gear Vehicle Speed Transient Simulations
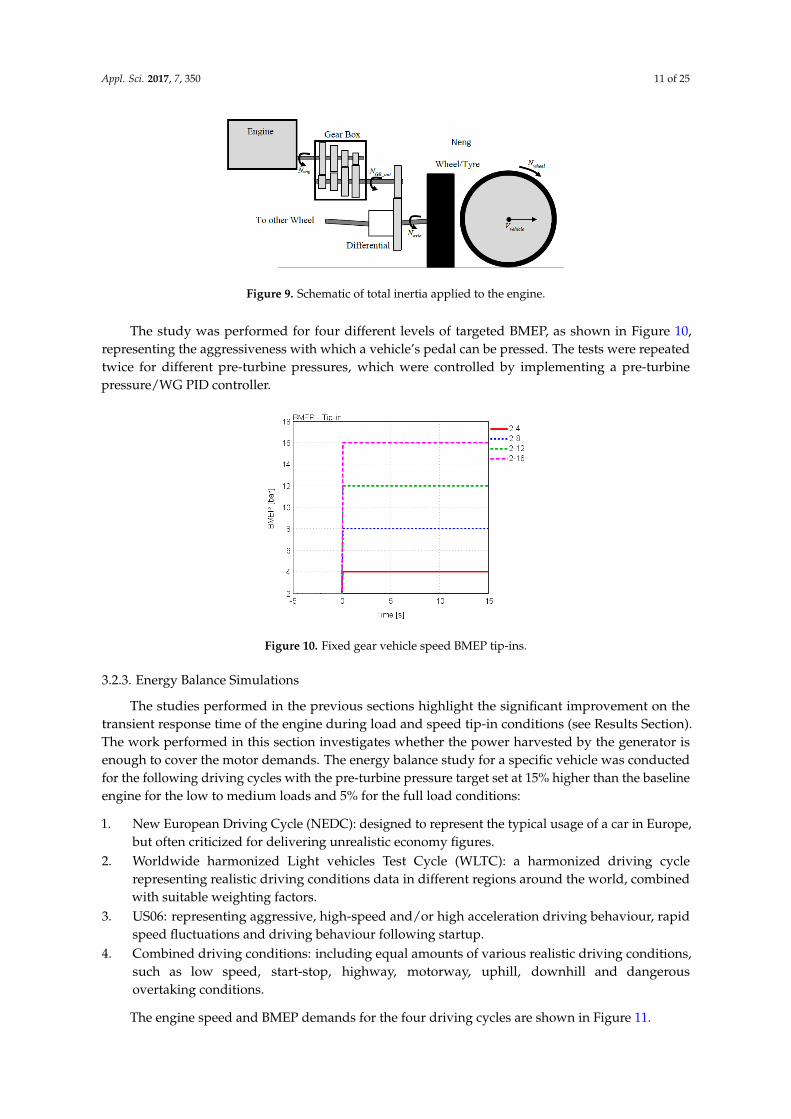
The purpose of this study was to represent the vehicle’s driving conditions and test the model fora fixed gear (third) vehicle speed transient. For this reason, a driving resistance load of 30 Nmwas applied to represent the rolling resistance along with the flywheel’s inertia given by thefollowing formula:
Ieq = Ieq,eng + Ieq,prop + Ieq,axle + Ieq,veh, (3)
where Ieq is the total inertia (kg·m2), Ieq,eng is the engine’s inertia, Ieq,prop is the prop shaft inertia,Ieq,axle is the axle inertia and Ieq,veh is the vehicle mass equivalent inertia, as shown in Figure 9.
Appl. Sci. 2017, 7, 350 11 of 25
Appl. Sci. 2017, 7, 350 10 of 25
• Load step transient • Fixed gear vehicle speed transient • Energy balance study for various driving cycles and real driving conditions
The purpose of the transient study was to reveal the response time improvement under different levels of energy provision to the compressor, as well as to perform an energy balance review. This is required in order to identify whether the e-turbocharger can operate without energy consumption from the engine and if any excess on the total energy generated.
3.2.1. Load Step Transient Simulations
The load tip-in study was performed for two engine speeds of interest, 1600 and 1100 rpm, close to the surge limit of the compressor. The load tip-in step requested was from 2 bar BMEP to full load BMEP (19 bar). However, due to the engine speeds at which the tests were performed, the requested BMEP could not be achieved.
The study was initially performed for the model with all of the PID controllers. However, for ensuring that the results are not affected by the tuning of the controllers, the study was repeated in an open-loop environment (no PID controllers). The PID controllers in the model were removed and replaced by look-up tables for controlling the boost pressure and throttle position of the engine, as shown in Table 5. This allows a hardware capability investigation to be performed by eliminating any effects of the PID controllers. The energy provided to the compressor was divided into four sections of 0.25 seconds, and different levels of power (1, 3 and 5 kW) were provided in each section.
Table 5. Control of basic process parameters for the model with proportional-integral-derivative (PID) controllers and the open-loop model. BMEP, brake mean effective pressure; M/G, motor/generator.
Process Parameter Model with PIDs (Control Variables) Open-Loop Model M/G Power - Provided power profiles
Boost pressure M/G power Speed/load look-up table Throttle position Engine speed/BMEP Speed/load look-up table
Pre-turbine pressure WG position WG position (PID)
3.2.2. Fixed Gear Vehicle Speed Transient Simulations
The purpose of this study was to represent the vehicle’s driving conditions and test the model for a fixed gear (third) vehicle speed transient. For this reason, a driving resistance load of 30 Nm was applied to represent the rolling resistance along with the flywheel’s inertia given by the following formula:
Ieq = Ieq,eng + Ieq,prop + Ieq,axle + Ieq,veh, (3)
where Ieq is the total inertia (kg·m2), Ieq,eng is the engine’s inertia, Ieq,prop is the prop shaft inertia, Ieq,axle is the axle inertia and Ieq,veh is the vehicle mass equivalent inertia, as shown in Figure 9.
Figure 9. Schematic of total inertia applied to the engine. Figure 9. Schematic of total inertia applied to the engine.
The study was performed for four different levels of targeted BMEP, as shown in Figure 10,representing the aggressiveness with which a vehicle’s pedal can be pressed. The tests were repeatedtwice for different pre-turbine pressures, which were controlled by implementing a pre-turbinepressure/WG PID controller.
Appl. Sci. 2017, 7, 350 11 of 25
The study was performed for four different levels of targeted BMEP, as shown in Figure 10, representing the aggressiveness with which a vehicle’s pedal can be pressed. The tests were repeated twice for different pre-turbine pressures, which were controlled by implementing a pre-turbine pressure/WG PID controller.
Figure 10. Fixed gear vehicle speed BMEP tip-ins.
3.2.3. Energy Balance Simulations
The studies performed in the previous sections highlight the significant improvement on the transient response time of the engine during load and speed tip-in conditions (see Results Section). The work performed in this section investigates whether the power harvested by the generator is enough to cover the motor demands. The energy balance study for a specific vehicle was conducted for the following driving cycles with the pre-turbine pressure target set at 15% higher than the baseline engine for the low to medium loads and 5% for the full load conditions:
1. New European Driving Cycle (NEDC): designed to represent the typical usage of a car in Europe, but often criticized for delivering unrealistic economy figures.
2. Worldwide harmonized Light vehicles Test Cycle (WLTC): a harmonized driving cycle representing realistic driving conditions data in different regions around the world, combined with suitable weighting factors.
3. US06: representing aggressive, high-speed and/or high acceleration driving behaviour, rapid speed fluctuations and driving behaviour following startup.
4. Combined driving conditions: including equal amounts of various realistic driving conditions, such as low speed, start-stop, highway, motorway, uphill, downhill and dangerous overtaking conditions.
The engine speed and BMEP demands for the four driving cycles are shown in Figure 11.
Figure 11. Driving cycles conditions: (a) engine speed; (b) engine BMEP. NEDC, New European Driving Cycle; WLTC, Worldwide harmonized Light vehicles Test Cycle.
Figure 10. Fixed gear vehicle speed BMEP tip-ins.
3.2.3. Energy Balance Simulations
The studies performed in the previous sections highlight the significant improvement on thetransient response time of the engine during load and speed tip-in conditions (see Results Section).The work performed in this section investigates whether the power harvested by the generator isenough to cover the motor demands. The energy balance study for a specific vehicle was conductedfor the following driving cycles with the pre-turbine pressure target set at 15% higher than the baselineengine for the low to medium loads and 5% for the full load conditions:
1. New European Driving Cycle (NEDC): designed to represent the typical usage of a car in Europe,but often criticized for delivering unrealistic economy figures.
2. Worldwide harmonized Light vehicles Test Cycle (WLTC): a harmonized driving cyclerepresenting realistic driving conditions data in different regions around the world, combinedwith suitable weighting factors.
3. US06: representing aggressive, high-speed and/or high acceleration driving behaviour, rapidspeed fluctuations and driving behaviour following startup.
4. Combined driving conditions: including equal amounts of various realistic driving conditions,such as low speed, start-stop, highway, motorway, uphill, downhill and dangerousovertaking conditions.
The engine speed and BMEP demands for the four driving cycles are shown in Figure 11.

Appl. Sci. 2017, 7, 350 12 of 25
Appl. Sci. 2017, 7, 350 11 of 25
The study was performed for four different levels of targeted BMEP, as shown in Figure 10, representing the aggressiveness with which a vehicle’s pedal can be pressed. The tests were repeated twice for different pre-turbine pressures, which were controlled by implementing a pre-turbine pressure/WG PID controller.
Figure 10. Fixed gear vehicle speed BMEP tip-ins.
3.2.3. Energy Balance Simulations
The studies performed in the previous sections highlight the significant improvement on the transient response time of the engine during load and speed tip-in conditions (see Results Section). The work performed in this section investigates whether the power harvested by the generator is enough to cover the motor demands. The energy balance study for a specific vehicle was conducted for the following driving cycles with the pre-turbine pressure target set at 15% higher than the baseline engine for the low to medium loads and 5% for the full load conditions:
1. New European Driving Cycle (NEDC): designed to represent the typical usage of a car in Europe, but often criticized for delivering unrealistic economy figures.
2. Worldwide harmonized Light vehicles Test Cycle (WLTC): a harmonized driving cycle representing realistic driving conditions data in different regions around the world, combined with suitable weighting factors.
3. US06: representing aggressive, high-speed and/or high acceleration driving behaviour, rapid speed fluctuations and driving behaviour following startup.
4. Combined driving conditions: including equal amounts of various realistic driving conditions, such as low speed, start-stop, highway, motorway, uphill, downhill and dangerous overtaking conditions.
The engine speed and BMEP demands for the four driving cycles are shown in Figure 11.
Figure 11. Driving cycles conditions: (a) engine speed; (b) engine BMEP. NEDC, New European Driving Cycle; WLTC, Worldwide harmonized Light vehicles Test Cycle.
Figure 11. Driving cycles conditions: (a) engine speed; (b) engine BMEP. NEDC, New EuropeanDriving Cycle; WLTC, Worldwide harmonized Light vehicles Test Cycle.
4. Results and Discussion
The results of the simulation studies performed in this paper are categorized in a similar mannerto that of the Methodology Section.
4.1. Steady-State Analysis
4.1.1. Phase 1: WG Enthalpy Loss Study (Baseline Engine)
The results in Figure 12 show that the energy loss through the wastegate for the model with theoriginal size of compressor and turbine (Case 9) can reach the amount of 5 kW at high engine speedsand loads. The amount of the potential energy dismissed at medium load and engine speed conditionsis of lower magnitude, up to 2 kW. At low loads and speeds, there is no wasted energy, as the WG iscompletely closed.
Appl. Sci. 2017, 7, 350 12 of 25
4. Results and Discussion
The results of the simulation studies performed in this paper are categorized in a similar manner to that of the Methodology Section.
4.1. Steady-State Analysis
4.1.1. Phase 1: WG Enthalpy Loss Study (Baseline Engine)
The results in Figure 12 show that the energy loss through the wastegate for the model with the original size of compressor and turbine (Case 9) can reach the amount of 5 kW at high engine speeds and loads. The amount of the potential energy dismissed at medium load and engine speed conditions is of lower magnitude, up to 2 kW. At low loads and speeds, there is no wasted energy, as the WG is completely closed.
Figure 12. Phase 1: DoE analysis of the waste-gated enthalpy loss for the different compressor and turbine sizes; the blue line represents the maximum torque line of the baseline engine’s model as provided by the manufacturer (λ < 1); the ○ symbols indicate data points; the ⨂ symbol indicates a limit violation at specific points.
Figure 12 highlights the effect of a smaller turbine and compressor on the amount of waste-gated flow and the maximum power of the engine. As can be seen, a smaller compressor (Cases 7 and 8) cannot provide the boosting requirements needed to achieve maximum engine’s power at medium and high engine speeds. On the other hand, a smaller turbine (Cases 3 and 6) can slightly increase the amount of waste-gated flow at medium engine speed and load conditions. However, a smaller turbine leads to increased pre-turbine pressure, in some cases violating the maximum limit set, and reduces the maximum torque of the engine.
Figure 12. Phase 1: DoE analysis of the waste-gated enthalpy loss for the different compressor andturbine sizes; the blue line represents the maximum torque line of the baseline engine’s model asprovided by the manufacturer (λ < 1); the # symbols indicate data points; the
⊗symbol indicates a
limit violation at specific points.
Appl. Sci. 2017, 7, 350 13 of 25
Figure 12 highlights the effect of a smaller turbine and compressor on the amount of waste-gatedflow and the maximum power of the engine. As can be seen, a smaller compressor (Cases 7 and 8)cannot provide the boosting requirements needed to achieve maximum engine’s power at mediumand high engine speeds. On the other hand, a smaller turbine (Cases 3 and 6) can slightly increase theamount of waste-gated flow at medium engine speed and load conditions. However, a smaller turbineleads to increased pre-turbine pressure, in some cases violating the maximum limit set, and reducesthe maximum torque of the engine.
4.1.2. Phase 2: Suppressing WG and Using e-Turbo to Control Boosting
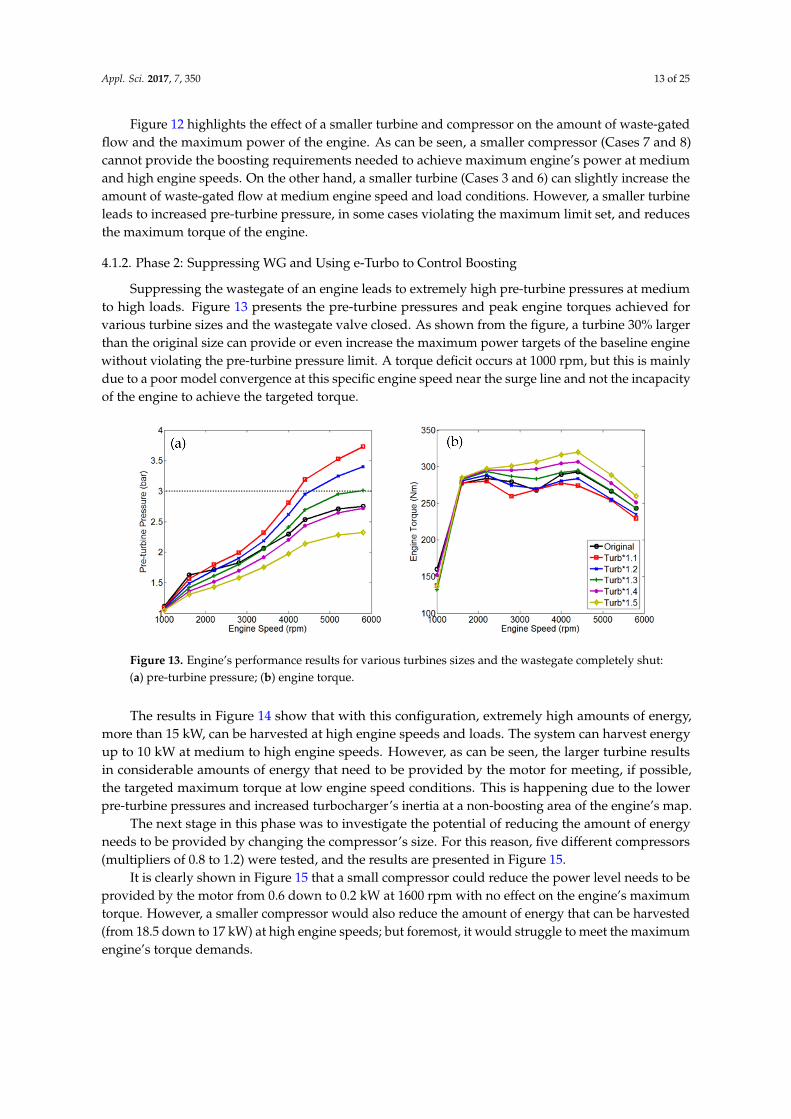
Suppressing the wastegate of an engine leads to extremely high pre-turbine pressures at mediumto high loads. Figure 13 presents the pre-turbine pressures and peak engine torques achieved forvarious turbine sizes and the wastegate valve closed. As shown from the figure, a turbine 30% largerthan the original size can provide or even increase the maximum power targets of the baseline enginewithout violating the pre-turbine pressure limit. A torque deficit occurs at 1000 rpm, but this is mainlydue to a poor model convergence at this specific engine speed near the surge line and not the incapacityof the engine to achieve the targeted torque.
Appl. Sci. 2017, 7, 350 13 of 25
4.1.2. Phase 2: Suppressing WG and Using e-Turbo to Control Boosting
Suppressing the wastegate of an engine leads to extremely high pre-turbine pressures at medium to high loads. Figure 13 presents the pre-turbine pressures and peak engine torques achieved for various turbine sizes and the wastegate valve closed. As shown from the figure, a turbine 30% larger than the original size can provide or even increase the maximum power targets of the baseline engine without violating the pre-turbine pressure limit. A torque deficit occurs at 1000 rpm, but this is mainly due to a poor model convergence at this specific engine speed near the surge line and not the incapacity of the engine to achieve the targeted torque.
Figure 13. Engine’s performance results for various turbines sizes and the wastegate completely shut: (a) pre-turbine pressure; (b) engine torque.
The results in Figure 14 show that with this configuration, extremely high amounts of energy, more than 15 kW, can be harvested at high engine speeds and loads. The system can harvest energy up to 10 kW at medium to high engine speeds. However, as can be seen, the larger turbine results in considerable amounts of energy that need to be provided by the motor for meeting, if possible, the targeted maximum torque at low engine speed conditions. This is happening due to the lower pre-turbine pressures and increased turbocharger’s inertia at a non-boosting area of the engine’s map.
Figure 14. Phase 2: Motor-generator average energy for the case with original compressor, 30% larger turbine and the WG valve completely shut; negative values indicate energy harvesting; positive values indicate the need for energy provision; the blue line represents the maximum torque line of the baseline engine’s model as provided by the manufacturer (λ < 1); the ⨂ symbol indicates limit violation; ⌼ indicates energy provision area.
The next stage in this phase was to investigate the potential of reducing the amount of energy needs to be provided by changing the compressor’s size. For this reason, five different compressors (multipliers of 0.8 to 1.2) were tested, and the results are presented in Figure 15.
Figure 13. Engine’s performance results for various turbines sizes and the wastegate completely shut:(a) pre-turbine pressure; (b) engine torque.
The results in Figure 14 show that with this configuration, extremely high amounts of energy,more than 15 kW, can be harvested at high engine speeds and loads. The system can harvest energyup to 10 kW at medium to high engine speeds. However, as can be seen, the larger turbine resultsin considerable amounts of energy that need to be provided by the motor for meeting, if possible,the targeted maximum torque at low engine speed conditions. This is happening due to the lowerpre-turbine pressures and increased turbocharger’s inertia at a non-boosting area of the engine’s map.
The next stage in this phase was to investigate the potential of reducing the amount of energyneeds to be provided by changing the compressor’s size. For this reason, five different compressors(multipliers of 0.8 to 1.2) were tested, and the results are presented in Figure 15.
It is clearly shown in Figure 15 that a small compressor could reduce the power level needs to beprovided by the motor from 0.6 down to 0.2 kW at 1600 rpm with no effect on the engine’s maximumtorque. However, a smaller compressor would also reduce the amount of energy that can be harvested(from 18.5 down to 17 kW) at high engine speeds; but foremost, it would struggle to meet the maximumengine’s torque demands.

Appl. Sci. 2017, 7, 350 14 of 25
Appl. Sci. 2017, 7, 350 13 of 25
4.1.2. Phase 2: Suppressing WG and Using e-Turbo to Control Boosting
Suppressing the wastegate of an engine leads to extremely high pre-turbine pressures at medium to high loads. Figure 13 presents the pre-turbine pressures and peak engine torques achieved for various turbine sizes and the wastegate valve closed. As shown from the figure, a turbine 30% larger than the original size can provide or even increase the maximum power targets of the baseline engine without violating the pre-turbine pressure limit. A torque deficit occurs at 1000 rpm, but this is mainly due to a poor model convergence at this specific engine speed near the surge line and not the incapacity of the engine to achieve the targeted torque.
Figure 13. Engine’s performance results for various turbines sizes and the wastegate completely shut: (a) pre-turbine pressure; (b) engine torque.
The results in Figure 14 show that with this configuration, extremely high amounts of energy, more than 15 kW, can be harvested at high engine speeds and loads. The system can harvest energy up to 10 kW at medium to high engine speeds. However, as can be seen, the larger turbine results in considerable amounts of energy that need to be provided by the motor for meeting, if possible, the targeted maximum torque at low engine speed conditions. This is happening due to the lower pre-turbine pressures and increased turbocharger’s inertia at a non-boosting area of the engine’s map.
Figure 14. Phase 2: Motor-generator average energy for the case with original compressor, 30% larger turbine and the WG valve completely shut; negative values indicate energy harvesting; positive values indicate the need for energy provision; the blue line represents the maximum torque line of the baseline engine’s model as provided by the manufacturer (λ < 1); the ⨂ symbol indicates limit violation; ⌼ indicates energy provision area.
The next stage in this phase was to investigate the potential of reducing the amount of energy needs to be provided by changing the compressor’s size. For this reason, five different compressors (multipliers of 0.8 to 1.2) were tested, and the results are presented in Figure 15.
Figure 14. Phase 2: Motor-generator average energy for the case with original compressor, 30% largerturbine and the WG valve completely shut; negative values indicate energy harvesting; positive valuesindicate the need for energy provision; the blue line represents the maximum torque line of the baselineengine’s model as provided by the manufacturer (λ < 1); the
⊗symbol indicates limit violation;
Appl. Sci. 2017, 7, 350 13 of 25
4.1.2. Phase 2: Suppressing WG and Using e-Turbo to Control Boosting
Suppressing the wastegate of an engine leads to extremely high pre-turbine pressures at medium to high loads. Figure 13 presents the pre-turbine pressures and peak engine torques achieved for various turbine sizes and the wastegate valve closed. As shown from the figure, a turbine 30% larger than the original size can provide or even increase the maximum power targets of the baseline engine without violating the pre-turbine pressure limit. A torque deficit occurs at 1000 rpm, but this is mainly due to a poor model convergence at this specific engine speed near the surge line and not the incapacity of the engine to achieve the targeted torque.
Figure 13. Engine’s performance results for various turbines sizes and the wastegate completely shut: (a) pre-turbine pressure; (b) engine torque.
The results in Figure 14 show that with this configuration, extremely high amounts of energy, more than 15 kW, can be harvested at high engine speeds and loads. The system can harvest energy up to 10 kW at medium to high engine speeds. However, as can be seen, the larger turbine results in considerable amounts of energy that need to be provided by the motor for meeting, if possible, the targeted maximum torque at low engine speed conditions. This is happening due to the lower pre-turbine pressures and increased turbocharger’s inertia at a non-boosting area of the engine’s map.
Figure 14. Phase 2: Motor-generator average energy for the case with original compressor, 30% larger turbine and the WG valve completely shut; negative values indicate energy harvesting; positive values indicate the need for energy provision; the blue line represents the maximum torque line of the baseline engine’s model as provided by the manufacturer (λ < 1); the ⨂ symbol indicates limit violation; ⌼ indicates energy provision area.
The next stage in this phase was to investigate the potential of reducing the amount of energy needs to be provided by changing the compressor’s size. For this reason, five different compressors (multipliers of 0.8 to 1.2) were tested, and the results are presented in Figure 15.
indicates energy provision area.Appl. Sci. 2017, 7, 350 14 of 25
Figure 15. Effect of compressor’s size on average power and torque: (a) 1600 rpm; (b) 5800 rpm.
It is clearly shown in Figure 15 that a small compressor could reduce the power level needs to be provided by the motor from 0.6 down to 0.2 kW at 1600 rpm with no effect on the engine’s maximum torque. However, a smaller compressor would also reduce the amount of energy that can be harvested (from 18.5 down to 17 kW) at high engine speeds; but foremost, it would struggle to meet the maximum engine’s torque demands.
4.1.3. Phase 3: Reinstating WG to Control Exhaust Manifold Pressure
Turbine Size: WG Area Balance Study
The first part of this phase includes a DoE study for investigating the benefits on the engine’s maximum power and energy recovery for a smaller turbine (multipliers less than 1.3) and the WG valve open at different positions (smaller than the original model), as shown in Table 6.
Table 6. Phase 3: DoE analysis for different turbine sizes and WG areas.
Case Turbine Size Compared to the Original Model WG Area Compared to the Original ModelTurb×1.1–WG/2 10% larger 50% smaller Turb×1.1–WG/3 10% larger 67% smaller Turb×1.2–WG/2 20% larger 50% smaller Turb×1.2–WG/3 20% larger 67% smaller
The results in Figure 16 show that with a 20% larger turbine (rather than 30%) and the WG valve open at half the size as the baseline engine, maximum engine torque can be achieved. The smaller turbine and the open WG reduced the maximum amount of energy harvested at high speeds from 18 down to 12 kW. However, the benefit on the low-speed side of the map was relatively low, as the amount of energy that needs to be provided by the motor at 1600 rpm went from 0.6 down to 0.45 kW.
Figure 16. Balance study for different turbine sizes and wastegate areas for meeting the baseline engine’s maximum torque.
Figure 15. Effect of compressor’s size on average power and torque: (a) 1600 rpm; (b) 5800 rpm.
4.1.3. Phase 3: Reinstating WG to Control Exhaust Manifold Pressure
Turbine Size: WG Area Balance Study
The first part of this phase includes a DoE study for investigating the benefits on the engine’smaximum power and energy recovery for a smaller turbine (multipliers less than 1.3) and the WGvalve open at different positions (smaller than the original model), as shown in Table 6.
Table 6. Phase 3: DoE analysis for different turbine sizes and WG areas.
Case Turbine Size Compared to theOriginal Model
WG Area Compared to theOriginal Model
Turb×1.1–WG/2 10% larger 50% smallerTurb×1.1–WG/3 10% larger 67% smallerTurb×1.2–WG/2 20% larger 50% smallerTurb×1.2–WG/3 20% larger 67% smaller
The results in Figure 16 show that with a 20% larger turbine (rather than 30%) and the WG valveopen at half the size as the baseline engine, maximum engine torque can be achieved. The smallerturbine and the open WG reduced the maximum amount of energy harvested at high speeds from18 down to 12 kW. However, the benefit on the low-speed side of the map was relatively low, as theamount of energy that needs to be provided by the motor at 1600 rpm went from 0.6 down to 0.45 kW.

Appl. Sci. 2017, 7, 350 15 of 25
Appl. Sci. 2017, 7, 350 14 of 25
Figure 15. Effect of compressor’s size on average power and torque: (a) 1600 rpm; (b) 5800 rpm.
It is clearly shown in Figure 15 that a small compressor could reduce the power level needs to be provided by the motor from 0.6 down to 0.2 kW at 1600 rpm with no effect on the engine’s maximum torque. However, a smaller compressor would also reduce the amount of energy that can be harvested (from 18.5 down to 17 kW) at high engine speeds; but foremost, it would struggle to meet the maximum engine’s torque demands.
4.1.3. Phase 3: Reinstating WG to Control Exhaust Manifold Pressure
Turbine Size: WG Area Balance Study
The first part of this phase includes a DoE study for investigating the benefits on the engine’s maximum power and energy recovery for a smaller turbine (multipliers less than 1.3) and the WG valve open at different positions (smaller than the original model), as shown in Table 6.
Table 6. Phase 3: DoE analysis for different turbine sizes and WG areas.
Case Turbine Size Compared to the Original Model WG Area Compared to the Original ModelTurb×1.1–WG/2 10% larger 50% smaller Turb×1.1–WG/3 10% larger 67% smaller Turb×1.2–WG/2 20% larger 50% smaller Turb×1.2–WG/3 20% larger 67% smaller
The results in Figure 16 show that with a 20% larger turbine (rather than 30%) and the WG valve open at half the size as the baseline engine, maximum engine torque can be achieved. The smaller turbine and the open WG reduced the maximum amount of energy harvested at high speeds from 18 down to 12 kW. However, the benefit on the low-speed side of the map was relatively low, as the amount of energy that needs to be provided by the motor at 1600 rpm went from 0.6 down to 0.45 kW.
Figure 16. Balance study for different turbine sizes and wastegate areas for meeting the baseline engine’s maximum torque. Figure 16. Balance study for different turbine sizes and wastegate areas for meeting the baseline
engine’s maximum torque.
Smaller Turbine: Increased WG Area Study
Despite the fact that a large turbine allows energy harvesting within the pre-turbine pressurelimit at the high speed and load conditions, it also leads to low speeds and loads’ poor performance.This could be theoretically resolved by implementing a small turbine and controlling the pre-turbinepressure limits by increasing the wastegate area. The following DoE study results show the effects ofthree compressors smaller than the original (multipliers of 0.7 to 0.9) and the WG area open at values10% to 50% larger (multipliers of 1.1 to 1.5) than in the baseline engine.
The results in Figure 17 illustrate that a small turbine can lead to lower energy demands and powergeneration at low speed/load conditions. However, the smaller the turbine, the higher the pre-turbinepressures, which deteriorate the engine’s power output at full load conditions. By increasing the WGarea, the pre-turbine pressure drops, and therefore, the full load performance of the engine increases.However, even a 10% increase in the WG area leads to high levels of energy requirements for meetingthe baseline engine’s power characteristics.
Appl. Sci. 2017, 7, 350 15 of 25
Smaller Turbine: Increased WG Area Study
Despite the fact that a large turbine allows energy harvesting within the pre-turbine pressure limit at the high speed and load conditions, it also leads to low speeds and loads’ poor performance. This could be theoretically resolved by implementing a small turbine and controlling the pre-turbine pressure limits by increasing the wastegate area. The following DoE study results show the effects of three compressors smaller than the original (multipliers of 0.7 to 0.9) and the WG area open at values 10% to 50% larger (multipliers of 1.1 to 1.5) than in the baseline engine.
The results in Figure 17 illustrate that a small turbine can lead to lower energy demands and power generation at low speed/load conditions. However, the smaller the turbine, the higher the pre-turbine pressures, which deteriorate the engine’s power output at full load conditions. By increasing the WG area, the pre-turbine pressure drops, and therefore, the full load performance of the engine increases. However, even a 10% increase in the WG area leads to high levels of energy requirements for meeting the baseline engine’s power characteristics.
Figure 17. Phase 3: DoE analysis of the motor-generator average energy for different turbine sizes and WG areas; negative values indicate energy harvesting; positive values indicate need for energy provision; blue line represents the maximum torque line of the baseline engine’s model as provided by the manufacturer (λ < 1); ⨂ symbol indicates limit violation; ⌼ indicates energy provision area.
Smaller Turbine: Increased Pre-Turbine Pressure Study
The next study in phase 3 focuses on the effects of a smaller turbine with a reduced WG area compared to the baseline engine for benefiting from a good energy balance across the low and high load areas of the engine’s speed/load map. For this study, the WG area is controlled indirectly by setting up a PID controller between the WG valve and the pre-turbine pressure. The targeted value
Figure 17. Phase 3: DoE analysis of the motor-generator average energy for different turbine sizesand WG areas; negative values indicate energy harvesting; positive values indicate need for energyprovision; blue line represents the maximum torque line of the baseline engine’s model as provided bythe manufacturer (λ < 1);
⊗symbol indicates limit violation;
Appl. Sci. 2017, 7, 350 13 of 25
4.1.2. Phase 2: Suppressing WG and Using e-Turbo to Control Boosting
Suppressing the wastegate of an engine leads to extremely high pre-turbine pressures at medium to high loads. Figure 13 presents the pre-turbine pressures and peak engine torques achieved for various turbine sizes and the wastegate valve closed. As shown from the figure, a turbine 30% larger than the original size can provide or even increase the maximum power targets of the baseline engine without violating the pre-turbine pressure limit. A torque deficit occurs at 1000 rpm, but this is mainly due to a poor model convergence at this specific engine speed near the surge line and not the incapacity of the engine to achieve the targeted torque.
Figure 13. Engine’s performance results for various turbines sizes and the wastegate completely shut: (a) pre-turbine pressure; (b) engine torque.
The results in Figure 14 show that with this configuration, extremely high amounts of energy, more than 15 kW, can be harvested at high engine speeds and loads. The system can harvest energy up to 10 kW at medium to high engine speeds. However, as can be seen, the larger turbine results in considerable amounts of energy that need to be provided by the motor for meeting, if possible, the targeted maximum torque at low engine speed conditions. This is happening due to the lower pre-turbine pressures and increased turbocharger’s inertia at a non-boosting area of the engine’s map.
Figure 14. Phase 2: Motor-generator average energy for the case with original compressor, 30% larger turbine and the WG valve completely shut; negative values indicate energy harvesting; positive values indicate the need for energy provision; the blue line represents the maximum torque line of the baseline engine’s model as provided by the manufacturer (λ < 1); the ⨂ symbol indicates limit violation; ⌼ indicates energy provision area.
The next stage in this phase was to investigate the potential of reducing the amount of energy needs to be provided by changing the compressor’s size. For this reason, five different compressors (multipliers of 0.8 to 1.2) were tested, and the results are presented in Figure 15.
indicates energy provision area.

Appl. Sci. 2017, 7, 350 16 of 25
Smaller Turbine: Increased Pre-Turbine Pressure Study
The next study in phase 3 focuses on the effects of a smaller turbine with a reduced WG areacompared to the baseline engine for benefiting from a good energy balance across the low and highload areas of the engine’s speed/load map. For this study, the WG area is controlled indirectly bysetting up a PID controller between the WG valve and the pre-turbine pressure. The targeted valueis the pre-turbine pressure, which is set to increased values of 5%, 10% and 15% (multipliers of 1.05to 1.15) compared to the baseline engine, but always within the set pre-turbine pressure limit.
Figure 18 shows that for a 10% smaller turbine (multiplier of 0.9) than the baseline engine,the e-turbo can harvest energy (up to 4 kW) at most points of the map, except the 1000 rpm speed,where the results are not highly trusted due to non-convergence of the model. Although, the increasedpre-turbine pressure leads to increased energy harvesting levels, it also, as expected, reduces themaximum power output of the engine. A 5% pre-turbine pressure increase leads to a 5% penaltyon the engine’s maximum torque, while for the case with the pre-turbine pressure set at 15% higher,the torque penalty is around 10%.
Appl. Sci. 2017, 7, 350 16 of 25
is the pre-turbine pressure, which is set to increased values of 5%, 10% and 15% (multipliers of 1.05 to 1.15) compared to the baseline engine, but always within the set pre-turbine pressure limit.
Figure 18 shows that for a 10% smaller turbine (multiplier of 0.9) than the baseline engine, the e-turbo can harvest energy (up to 4 kW) at most points of the map, except the 1000 rpm speed, where the results are not highly trusted due to non-convergence of the model. Although, the increased pre-turbine pressure leads to increased energy harvesting levels, it also, as expected, reduces the maximum power output of the engine. A 5% pre-turbine pressure increase leads to a 5% penalty on the engine’s maximum torque, while for the case with the pre-turbine pressure set at 15% higher, the torque penalty is around 10%.
Figure 18. Phase 3: DoE analysis of the motor-generator average energy for different turbine sizes and pre-turbine pressures; negative values indicate energy harvesting; positive values indicate the need for energy provision; the blue line represents the maximum torque line of the baseline engine’s model as provided by the manufacturer (λ < 1); the ⨂ symbol indicates limit violation; ⌼ indicates energy provision area.
Smaller Turbine: Variable Pre-Turbine Pressure Study
The previous study showed that with the right component sizing, energy harvesting could be achieved across most of the speed/load map area of the engine. However, this leads to torque sacrifice at full load conditions. This penalty can be reduced or even eliminated by adjusting the targeted pre-turbine pressure of the engine when running at full load conditions. The present study shows the effects of various pre-turbine targeted values, larger and smaller than the baseline engine, to the maximum power output of the engine and the average power harvested or that needs to be provided by the motor-generator.
Figure 18. Phase 3: DoE analysis of the motor-generator average energy for different turbine sizes andpre-turbine pressures; negative values indicate energy harvesting; positive values indicate the needfor energy provision; the blue line represents the maximum torque line of the baseline engine’s modelas provided by the manufacturer (λ < 1); the
⊗symbol indicates limit violation;
Appl. Sci. 2017, 7, 350 13 of 25
4.1.2. Phase 2: Suppressing WG and Using e-Turbo to Control Boosting
Suppressing the wastegate of an engine leads to extremely high pre-turbine pressures at medium to high loads. Figure 13 presents the pre-turbine pressures and peak engine torques achieved for various turbine sizes and the wastegate valve closed. As shown from the figure, a turbine 30% larger than the original size can provide or even increase the maximum power targets of the baseline engine without violating the pre-turbine pressure limit. A torque deficit occurs at 1000 rpm, but this is mainly due to a poor model convergence at this specific engine speed near the surge line and not the incapacity of the engine to achieve the targeted torque.
Figure 13. Engine’s performance results for various turbines sizes and the wastegate completely shut: (a) pre-turbine pressure; (b) engine torque.
The results in Figure 14 show that with this configuration, extremely high amounts of energy, more than 15 kW, can be harvested at high engine speeds and loads. The system can harvest energy up to 10 kW at medium to high engine speeds. However, as can be seen, the larger turbine results in considerable amounts of energy that need to be provided by the motor for meeting, if possible, the targeted maximum torque at low engine speed conditions. This is happening due to the lower pre-turbine pressures and increased turbocharger’s inertia at a non-boosting area of the engine’s map.
Figure 14. Phase 2: Motor-generator average energy for the case with original compressor, 30% larger turbine and the WG valve completely shut; negative values indicate energy harvesting; positive values indicate the need for energy provision; the blue line represents the maximum torque line of the baseline engine’s model as provided by the manufacturer (λ < 1); the ⨂ symbol indicates limit violation; ⌼ indicates energy provision area.
The next stage in this phase was to investigate the potential of reducing the amount of energy needs to be provided by changing the compressor’s size. For this reason, five different compressors (multipliers of 0.8 to 1.2) were tested, and the results are presented in Figure 15.
indicates energyprovision area.
Smaller Turbine: Variable Pre-Turbine Pressure Study
The previous study showed that with the right component sizing, energy harvesting could beachieved across most of the speed/load map area of the engine. However, this leads to torque sacrifice

Appl. Sci. 2017, 7, 350 17 of 25
at full load conditions. This penalty can be reduced or even eliminated by adjusting the targetedpre-turbine pressure of the engine when running at full load conditions. The present study showsthe effects of various pre-turbine targeted values, larger and smaller than the baseline engine, to themaximum power output of the engine and the average power harvested or that needs to be providedby the motor-generator.
As is shown in Figure 19, at full load conditions, the maximum power output of the baselineengine can be met by running the engine at the original pre-turbine pressures or slightly lower.However, this leads to energy provision demands by the e-turbo of up to 2 kW. Higher power outputs,which often work as selling points for automotive manufacturers, can be achieved by running at lowerpressures and providing significant amounts of power to the compressor.
Appl. Sci. 2017, 7, 350 17 of 25
As is shown in Figure 19, at full load conditions, the maximum power output of the baseline engine can be met by running the engine at the original pre-turbine pressures or slightly lower. However, this leads to energy provision demands by the e-turbo of up to 2 kW. Higher power outputs, which often work as selling points for automotive manufacturers, can be achieved by running at lower pressures and providing significant amounts of power to the compressor.
Figure 19. Effect of pre-turbine pressure % change on: (a) engine’s torque at full load; (b) M/G performance at full load; negative values indicate energy harvesting.
4.1.4. Overall Engine Efficiency
The overall efficiency of the baseline engine, which is calculated using the brake power achieved over the total fuel power, can reach levels higher than 35% at medium to high load conditions. On the other hand, the overall efficiency of the electrically-assisted turbocharged engine is given by the brake power achieved plus the energy harvested or provided by the e-turbo divided by the total fuel power. Figure 20 shows the comparison charts between the overall efficiency of the baseline engine and four cases studied in Phase 2 and Phase 3 of the steady-state simulations.
It is evident in Figure 20 that the implementation of a motor-generator linked to the turbocharger leads to an overall engine efficiency increase at medium and high loads and engine speeds for all of the cases. The cases with a reduced turbine size (multiplier of 0.9) benefit from an increased overall efficiency across the whole map. Finally, the high pre-turbine pressures show a significant effect on the overall efficiency gain of the model.
By assessing the work presented in the three phases of the steady-state simulations, the ideal engine layout can be summarized as shown in Figure 21.
Figure 19. Effect of pre-turbine pressure % change on: (a) engine’s torque at full load; (b) M/Gperformance at full load; negative values indicate energy harvesting.
4.1.4. Overall Engine Efficiency
The overall efficiency of the baseline engine, which is calculated using the brake power achievedover the total fuel power, can reach levels higher than 35% at medium to high load conditions. On theother hand, the overall efficiency of the electrically-assisted turbocharged engine is given by the brakepower achieved plus the energy harvested or provided by the e-turbo divided by the total fuel power.Figure 20 shows the comparison charts between the overall efficiency of the baseline engine and fourcases studied in Phase 2 and Phase 3 of the steady-state simulations.
It is evident in Figure 20 that the implementation of a motor-generator linked to the turbochargerleads to an overall engine efficiency increase at medium and high loads and engine speeds for all ofthe cases. The cases with a reduced turbine size (multiplier of 0.9) benefit from an increased overallefficiency across the whole map. Finally, the high pre-turbine pressures show a significant effect on theoverall efficiency gain of the model.
By assessing the work presented in the three phases of the steady-state simulations, the idealengine layout can be summarized as shown in Figure 21.

Appl. Sci. 2017, 7, 350 18 of 25
Appl. Sci. 2017, 7, 350 17 of 25
As is shown in Figure 19, at full load conditions, the maximum power output of the baseline engine can be met by running the engine at the original pre-turbine pressures or slightly lower. However, this leads to energy provision demands by the e-turbo of up to 2 kW. Higher power outputs, which often work as selling points for automotive manufacturers, can be achieved by running at lower pressures and providing significant amounts of power to the compressor.
Figure 19. Effect of pre-turbine pressure % change on: (a) engine’s torque at full load; (b) M/G performance at full load; negative values indicate energy harvesting.
4.1.4. Overall Engine Efficiency
The overall efficiency of the baseline engine, which is calculated using the brake power achieved over the total fuel power, can reach levels higher than 35% at medium to high load conditions. On the other hand, the overall efficiency of the electrically-assisted turbocharged engine is given by the brake power achieved plus the energy harvested or provided by the e-turbo divided by the total fuel power. Figure 20 shows the comparison charts between the overall efficiency of the baseline engine and four cases studied in Phase 2 and Phase 3 of the steady-state simulations.
It is evident in Figure 20 that the implementation of a motor-generator linked to the turbocharger leads to an overall engine efficiency increase at medium and high loads and engine speeds for all of the cases. The cases with a reduced turbine size (multiplier of 0.9) benefit from an increased overall efficiency across the whole map. Finally, the high pre-turbine pressures show a significant effect on the overall efficiency gain of the model.
By assessing the work presented in the three phases of the steady-state simulations, the ideal engine layout can be summarized as shown in Figure 21.
Appl. Sci. 2017, 7, 350 18 of 25
Figure 20. Absolute difference in overall efficiency between four different e-turbo configurations and the baseline engine; negative values indicate efficiency loss; positive values indicate efficiency gain; the area in red circle indicates non-convergence of the model: (a) model with 30% larger turbine and WG completely shut; (b) model with 20% larger turbine and WG half opened compared to the baseline engine; (c) model with 10% smaller turbine and 5% increased pre-turbine pressure compared to the baseline engine; (d) model with 10% smaller turbine and 15% increased pre-turbine pressure compared to the baseline engine.
Figure 21. Ideal component sizing for maximum power and energy harvesting.
4.2. Transient Analysis
The results in the steady-state simulations section demonstrated that a model fitted with a motor-generator and a turbine 10% smaller than the original could provide energy harvesting and thermal efficiency gain across the speed/load map of the engine. The transient behaviour of the model with this configuration, an original size compressor and increased pre-turbine pressures were tested by performing three different types of simulations.
4.2.1. Load Step Transient
Model with PID Controllers
The load step transient study was repeated five times for 1600 and 1100 engine speeds by limiting the amount of power (from 1 to 5 kW) provided as electrical assistance to the compressor, as shown in Figure 22.
Figure 20. Absolute difference in overall efficiency between four different e-turbo configurations andthe baseline engine; negative values indicate efficiency loss; positive values indicate efficiency gain;the area in red circle indicates non-convergence of the model: (a) model with 30% larger turbine andWG completely shut; (b) model with 20% larger turbine and WG half opened compared to the baselineengine; (c) model with 10% smaller turbine and 5% increased pre-turbine pressure compared to thebaseline engine; (d) model with 10% smaller turbine and 15% increased pre-turbine pressure comparedto the baseline engine.
Appl. Sci. 2017, 7, 350 18 of 25
Figure 20. Absolute difference in overall efficiency between four different e-turbo configurations and the baseline engine; negative values indicate efficiency loss; positive values indicate efficiency gain; the area in red circle indicates non-convergence of the model: (a) model with 30% larger turbine and WG completely shut; (b) model with 20% larger turbine and WG half opened compared to the baseline engine; (c) model with 10% smaller turbine and 5% increased pre-turbine pressure compared to the baseline engine; (d) model with 10% smaller turbine and 15% increased pre-turbine pressure compared to the baseline engine.
Figure 21. Ideal component sizing for maximum power and energy harvesting.
4.2. Transient Analysis
The results in the steady-state simulations section demonstrated that a model fitted with a motor-generator and a turbine 10% smaller than the original could provide energy harvesting and thermal efficiency gain across the speed/load map of the engine. The transient behaviour of the model with this configuration, an original size compressor and increased pre-turbine pressures were tested by performing three different types of simulations.
4.2.1. Load Step Transient
Model with PID Controllers
The load step transient study was repeated five times for 1600 and 1100 engine speeds by limiting the amount of power (from 1 to 5 kW) provided as electrical assistance to the compressor, as shown in Figure 22.
Figure 21. Ideal component sizing for maximum power and energy harvesting.
4.2. Transient Analysis
The results in the steady-state simulations section demonstrated that a model fitted with amotor-generator and a turbine 10% smaller than the original could provide energy harvesting andthermal efficiency gain across the speed/load map of the engine. The transient behaviour of the modelwith this configuration, an original size compressor and increased pre-turbine pressures were testedby performing three different types of simulations.
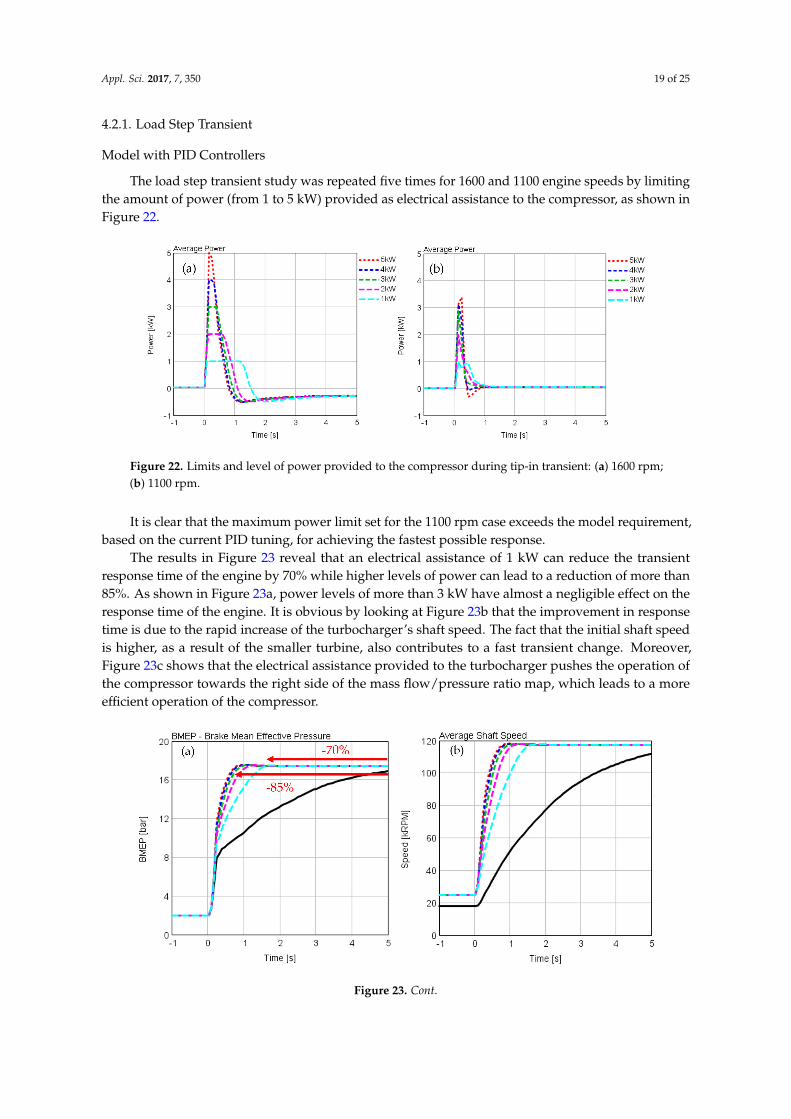
Appl. Sci. 2017, 7, 350 19 of 25
4.2.1. Load Step Transient
Model with PID Controllers
The load step transient study was repeated five times for 1600 and 1100 engine speeds by limitingthe amount of power (from 1 to 5 kW) provided as electrical assistance to the compressor, as shown inFigure 22.Appl. Sci. 2017, 7, 350 19 of 25
Figure 22. Limits and level of power provided to the compressor during tip-in transient: (a) 1600 rpm; (b) 1100 rpm.
It is clear that the maximum power limit set for the 1100 rpm case exceeds the model requirement, based on the current PID tuning, for achieving the fastest possible response.
The results in Figure 23 reveal that an electrical assistance of 1 kW can reduce the transient response time of the engine by 70% while higher levels of power can lead to a reduction of more than 85%. As shown in Figure 23a, power levels of more than 3 kW have almost a negligible effect on the response time of the engine. It is obvious by looking at Figure 23b that the improvement in response time is due to the rapid increase of the turbocharger’s shaft speed. The fact that the initial shaft speed is higher, as a result of the smaller turbine, also contributes to a fast transient change. Moreover, Figure 23c shows that the electrical assistance provided to the turbocharger pushes the operation of the compressor towards the right side of the mass flow/pressure ratio map, which leads to a more efficient operation of the compressor.
Figure 22. Limits and level of power provided to the compressor during tip-in transient: (a) 1600 rpm;(b) 1100 rpm.
It is clear that the maximum power limit set for the 1100 rpm case exceeds the model requirement,based on the current PID tuning, for achieving the fastest possible response.
The results in Figure 23 reveal that an electrical assistance of 1 kW can reduce the transientresponse time of the engine by 70% while higher levels of power can lead to a reduction of more than85%. As shown in Figure 23a, power levels of more than 3 kW have almost a negligible effect on theresponse time of the engine. It is obvious by looking at Figure 23b that the improvement in responsetime is due to the rapid increase of the turbocharger’s shaft speed. The fact that the initial shaft speedis higher, as a result of the smaller turbine, also contributes to a fast transient change. Moreover,Figure 23c shows that the electrical assistance provided to the turbocharger pushes the operation ofthe compressor towards the right side of the mass flow/pressure ratio map, which leads to a moreefficient operation of the compressor.
Appl. Sci. 2017, 7, 350 19 of 25
Figure 22. Limits and level of power provided to the compressor during tip-in transient: (a) 1600 rpm; (b) 1100 rpm.
It is clear that the maximum power limit set for the 1100 rpm case exceeds the model requirement, based on the current PID tuning, for achieving the fastest possible response.
The results in Figure 23 reveal that an electrical assistance of 1 kW can reduce the transient response time of the engine by 70% while higher levels of power can lead to a reduction of more than 85%. As shown in Figure 23a, power levels of more than 3 kW have almost a negligible effect on the response time of the engine. It is obvious by looking at Figure 23b that the improvement in response time is due to the rapid increase of the turbocharger’s shaft speed. The fact that the initial shaft speed is higher, as a result of the smaller turbine, also contributes to a fast transient change. Moreover, Figure 23c shows that the electrical assistance provided to the turbocharger pushes the operation of the compressor towards the right side of the mass flow/pressure ratio map, which leads to a more efficient operation of the compressor.
Figure 23. Cont.

Appl. Sci. 2017, 7, 350 20 of 25Appl. Sci. 2017, 7, 350 20 of 25
Figure 23. Load tip-in results at 1600 rpm engine speed: (a) BMEP response time; (b) turbocharger speed response time; (c) compressor performance.
On the other hand, the transient improvement at very low engine speeds is of higher magnitude, as shown in Figure 24a,b. This happens due to the very low pre-turbine pressures occurring at 1100 rpm. Moreover, as illustrated in Figure 24c, the electrical assistance provided to the turbocharger pushes the operation of the compressor towards the surge line of the map.
Figure 24. Load tip-in results at 1100 rpm engine speed; the two peaks highlighted in the red circle are a result of the mass flow rate fluctuation when the throttle valve opens: (a) BMEP response time; (b) turbocharger speed response time; (c) compressor performance.
Figure 23. Load tip-in results at 1600 rpm engine speed: (a) BMEP response time; (b) turbochargerspeed response time; (c) compressor performance.
On the other hand, the transient improvement at very low engine speeds is of higher magnitude,as shown in Figure 24a,b. This happens due to the very low pre-turbine pressures occurring at1100 rpm. Moreover, as illustrated in Figure 24c, the electrical assistance provided to the turbochargerpushes the operation of the compressor towards the surge line of the map.
Appl. Sci. 2017, 7, 350 20 of 25
Figure 23. Load tip-in results at 1600 rpm engine speed: (a) BMEP response time; (b) turbocharger speed response time; (c) compressor performance.
On the other hand, the transient improvement at very low engine speeds is of higher magnitude, as shown in Figure 24a,b. This happens due to the very low pre-turbine pressures occurring at 1100 rpm. Moreover, as illustrated in Figure 24c, the electrical assistance provided to the turbocharger pushes the operation of the compressor towards the surge line of the map.
Figure 24. Load tip-in results at 1100 rpm engine speed; the two peaks highlighted in the red circle are a result of the mass flow rate fluctuation when the throttle valve opens: (a) BMEP response time; (b) turbocharger speed response time; (c) compressor performance.
Figure 24. Load tip-in results at 1100 rpm engine speed; the two peaks highlighted in the red circleare a result of the mass flow rate fluctuation when the throttle valve opens: (a) BMEP response time;(b) turbocharger speed response time; (c) compressor performance.
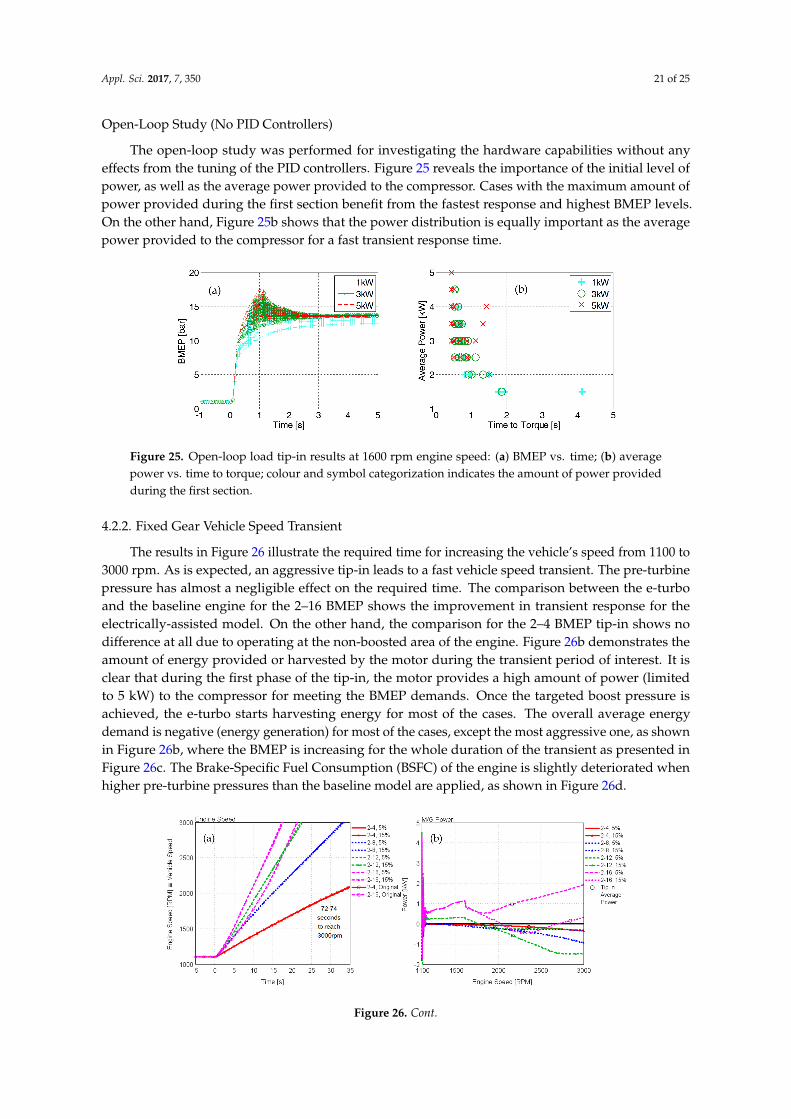
Appl. Sci. 2017, 7, 350 21 of 25
Open-Loop Study (No PID Controllers)
The open-loop study was performed for investigating the hardware capabilities without anyeffects from the tuning of the PID controllers. Figure 25 reveals the importance of the initial level ofpower, as well as the average power provided to the compressor. Cases with the maximum amount ofpower provided during the first section benefit from the fastest response and highest BMEP levels.On the other hand, Figure 25b shows that the power distribution is equally important as the averagepower provided to the compressor for a fast transient response time.
Appl. Sci. 2017, 7, 350 21 of 25
Open-Loop Study (No PID Controllers)
The open-loop study was performed for investigating the hardware capabilities without any effects from the tuning of the PID controllers. Figure 25 reveals the importance of the initial level of power, as well as the average power provided to the compressor. Cases with the maximum amount of power provided during the first section benefit from the fastest response and highest BMEP levels. On the other hand, Figure 25b shows that the power distribution is equally important as the average power provided to the compressor for a fast transient response time.
Figure 25. Open-loop load tip-in results at 1600 rpm engine speed: (a) BMEP vs. time; (b) average power vs. time to torque; colour and symbol categorization indicates the amount of power provided during the first section.
4.2.2. Fixed Gear Vehicle Speed Transient
The results in Figure 26 illustrate the required time for increasing the vehicle’s speed from 1100 to 3000 rpm. As is expected, an aggressive tip-in leads to a fast vehicle speed transient. The pre-turbine pressure has almost a negligible effect on the required time. The comparison between the e-turbo and the baseline engine for the 2–16 BMEP shows the improvement in transient response for the electrically-assisted model. On the other hand, the comparison for the 2–4 BMEP tip-in shows no difference at all due to operating at the non-boosted area of the engine. Figure 26b demonstrates the amount of energy provided or harvested by the motor during the transient period of interest. It is clear that during the first phase of the tip-in, the motor provides a high amount of power (limited to 5 kW) to the compressor for meeting the BMEP demands. Once the targeted boost pressure is achieved, the e-turbo starts harvesting energy for most of the cases. The overall average energy demand is negative (energy generation) for most of the cases, except the most aggressive one, as shown in Figure 26b, where the BMEP is increasing for the whole duration of the transient as presented in Figure 26c. The Brake-Specific Fuel Consumption (BSFC) of the engine is slightly deteriorated when higher pre-turbine pressures than the baseline model are applied, as shown in Figure 26d.
Figure 25. Open-loop load tip-in results at 1600 rpm engine speed: (a) BMEP vs. time; (b) averagepower vs. time to torque; colour and symbol categorization indicates the amount of power providedduring the first section.
4.2.2. Fixed Gear Vehicle Speed Transient
The results in Figure 26 illustrate the required time for increasing the vehicle’s speed from 1100 to3000 rpm. As is expected, an aggressive tip-in leads to a fast vehicle speed transient. The pre-turbinepressure has almost a negligible effect on the required time. The comparison between the e-turboand the baseline engine for the 2–16 BMEP shows the improvement in transient response for theelectrically-assisted model. On the other hand, the comparison for the 2–4 BMEP tip-in shows nodifference at all due to operating at the non-boosted area of the engine. Figure 26b demonstrates theamount of energy provided or harvested by the motor during the transient period of interest. It isclear that during the first phase of the tip-in, the motor provides a high amount of power (limitedto 5 kW) to the compressor for meeting the BMEP demands. Once the targeted boost pressure isachieved, the e-turbo starts harvesting energy for most of the cases. The overall average energydemand is negative (energy generation) for most of the cases, except the most aggressive one, as shownin Figure 26b, where the BMEP is increasing for the whole duration of the transient as presented inFigure 26c. The Brake-Specific Fuel Consumption (BSFC) of the engine is slightly deteriorated whenhigher pre-turbine pressures than the baseline model are applied, as shown in Figure 26d.
Appl. Sci. 2017, 7, 350 21 of 25
Open-Loop Study (No PID Controllers)
The open-loop study was performed for investigating the hardware capabilities without any effects from the tuning of the PID controllers. Figure 25 reveals the importance of the initial level of power, as well as the average power provided to the compressor. Cases with the maximum amount of power provided during the first section benefit from the fastest response and highest BMEP levels. On the other hand, Figure 25b shows that the power distribution is equally important as the average power provided to the compressor for a fast transient response time.
Figure 25. Open-loop load tip-in results at 1600 rpm engine speed: (a) BMEP vs. time; (b) average power vs. time to torque; colour and symbol categorization indicates the amount of power provided during the first section.
4.2.2. Fixed Gear Vehicle Speed Transient
The results in Figure 26 illustrate the required time for increasing the vehicle’s speed from 1100 to 3000 rpm. As is expected, an aggressive tip-in leads to a fast vehicle speed transient. The pre-turbine pressure has almost a negligible effect on the required time. The comparison between the e-turbo and the baseline engine for the 2–16 BMEP shows the improvement in transient response for the electrically-assisted model. On the other hand, the comparison for the 2–4 BMEP tip-in shows no difference at all due to operating at the non-boosted area of the engine. Figure 26b demonstrates the amount of energy provided or harvested by the motor during the transient period of interest. It is clear that during the first phase of the tip-in, the motor provides a high amount of power (limited to 5 kW) to the compressor for meeting the BMEP demands. Once the targeted boost pressure is achieved, the e-turbo starts harvesting energy for most of the cases. The overall average energy demand is negative (energy generation) for most of the cases, except the most aggressive one, as shown in Figure 26b, where the BMEP is increasing for the whole duration of the transient as presented in Figure 26c. The Brake-Specific Fuel Consumption (BSFC) of the engine is slightly deteriorated when higher pre-turbine pressures than the baseline model are applied, as shown in Figure 26d.
Figure 26. Cont.
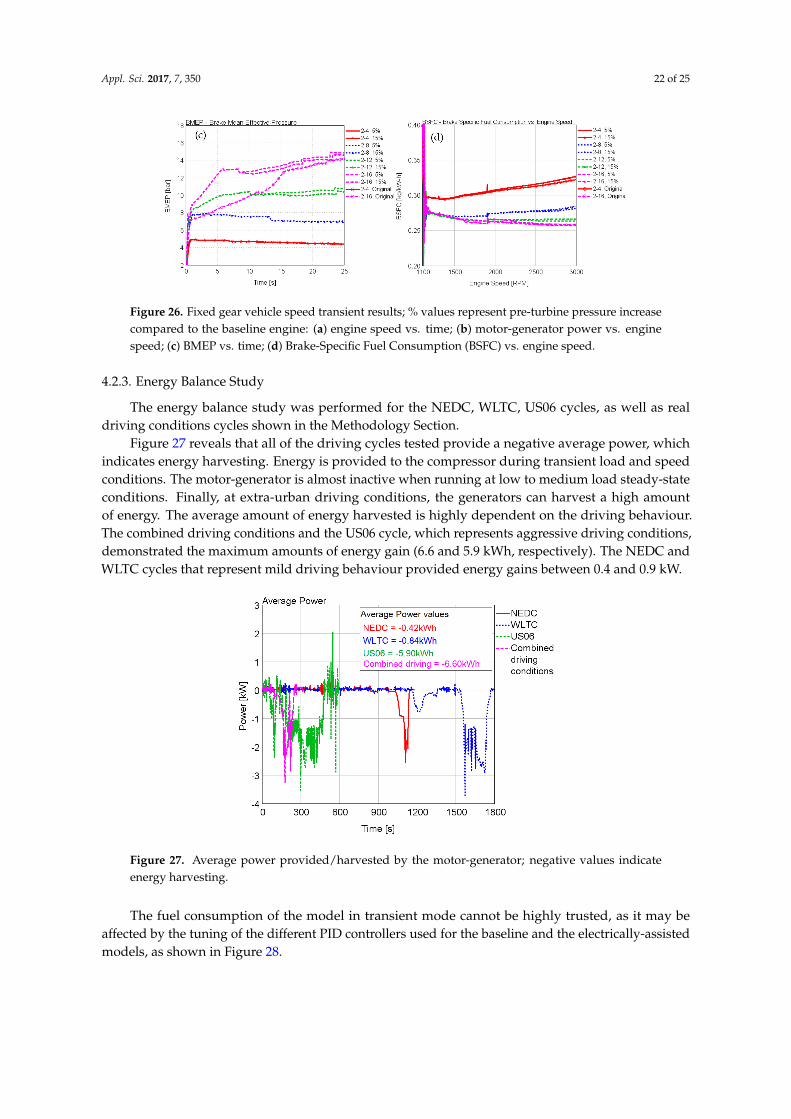
Appl. Sci. 2017, 7, 350 22 of 25Appl. Sci. 2017, 7, 350 22 of 25
Figure 26. Fixed gear vehicle speed transient results; % values represent pre-turbine pressure increase compared to the baseline engine: (a) engine speed vs. time; (b) motor-generator power vs. engine speed; (c) BMEP vs. time; (d) Brake-Specific Fuel Consumption (BSFC) vs. engine speed.
4.2.3. Energy Balance Study
The energy balance study was performed for the NEDC, WLTC, US06 cycles, as well as real driving conditions cycles shown in the Methodology Section.
Figure 27 reveals that all of the driving cycles tested provide a negative average power, which indicates energy harvesting. Energy is provided to the compressor during transient load and speed conditions. The motor-generator is almost inactive when running at low to medium load steady-state conditions. Finally, at extra-urban driving conditions, the generators can harvest a high amount of energy. The average amount of energy harvested is highly dependent on the driving behaviour. The combined driving conditions and the US06 cycle, which represents aggressive driving conditions, demonstrated the maximum amounts of energy gain (6.6 and 5.9 kWh, respectively). The NEDC and WLTC cycles that represent mild driving behaviour provided energy gains between 0.4 and 0.9 kW.
Figure 27. Average power provided/harvested by the motor-generator; negative values indicate energy harvesting.
The fuel consumption of the model in transient mode cannot be highly trusted, as it may be affected by the tuning of the different PID controllers used for the baseline and the electrically-assisted models, as shown in Figure 28.
Figure 26. Fixed gear vehicle speed transient results; % values represent pre-turbine pressure increasecompared to the baseline engine: (a) engine speed vs. time; (b) motor-generator power vs. enginespeed; (c) BMEP vs. time; (d) Brake-Specific Fuel Consumption (BSFC) vs. engine speed.
4.2.3. Energy Balance Study
The energy balance study was performed for the NEDC, WLTC, US06 cycles, as well as realdriving conditions cycles shown in the Methodology Section.
Figure 27 reveals that all of the driving cycles tested provide a negative average power, whichindicates energy harvesting. Energy is provided to the compressor during transient load and speedconditions. The motor-generator is almost inactive when running at low to medium load steady-stateconditions. Finally, at extra-urban driving conditions, the generators can harvest a high amountof energy. The average amount of energy harvested is highly dependent on the driving behaviour.The combined driving conditions and the US06 cycle, which represents aggressive driving conditions,demonstrated the maximum amounts of energy gain (6.6 and 5.9 kWh, respectively). The NEDC andWLTC cycles that represent mild driving behaviour provided energy gains between 0.4 and 0.9 kW.
Appl. Sci. 2017, 7, 350 22 of 25
Figure 26. Fixed gear vehicle speed transient results; % values represent pre-turbine pressure increase compared to the baseline engine: (a) engine speed vs. time; (b) motor-generator power vs. engine speed; (c) BMEP vs. time; (d) Brake-Specific Fuel Consumption (BSFC) vs. engine speed.
4.2.3. Energy Balance Study
The energy balance study was performed for the NEDC, WLTC, US06 cycles, as well as real driving conditions cycles shown in the Methodology Section.
Figure 27 reveals that all of the driving cycles tested provide a negative average power, which indicates energy harvesting. Energy is provided to the compressor during transient load and speed conditions. The motor-generator is almost inactive when running at low to medium load steady-state conditions. Finally, at extra-urban driving conditions, the generators can harvest a high amount of energy. The average amount of energy harvested is highly dependent on the driving behaviour. The combined driving conditions and the US06 cycle, which represents aggressive driving conditions, demonstrated the maximum amounts of energy gain (6.6 and 5.9 kWh, respectively). The NEDC and WLTC cycles that represent mild driving behaviour provided energy gains between 0.4 and 0.9 kW.
Figure 27. Average power provided/harvested by the motor-generator; negative values indicate energy harvesting.
The fuel consumption of the model in transient mode cannot be highly trusted, as it may be affected by the tuning of the different PID controllers used for the baseline and the electrically-assisted models, as shown in Figure 28.
Figure 27. Average power provided/harvested by the motor-generator; negative values indicateenergy harvesting.
The fuel consumption of the model in transient mode cannot be highly trusted, as it may beaffected by the tuning of the different PID controllers used for the baseline and the electrically-assistedmodels, as shown in Figure 28.

Appl. Sci. 2017, 7, 350 23 of 25Appl. Sci. 2017, 7, 350 23 of 25
Figure 28. Fuel flow mass flow rate comparison between e-turbo and baseline model for the WLTC cycle; highlighted area indicates the disturbance of PID tuning on the accuracy of the results.
The obtained results for the transient cycles show that with the implementation of the e-turbocharger, the fuel economy of the engine is deteriorated by up to 1.8% (Table 7) due to the increased pre-turbine pressures. However, this fuel consumption increase is compensated by the generated power of the e-turbocharger. The combined driving cycle demonstrates the maximum net gain of 5.5 kWh, followed by the US06 cycle with 3.8 kWh. The WLTC is the only cycle that provides a marginally negative energy gain when considering the increased fuel consumption.
Table 7. Fuel consumption difference between baseline and e-turbo models for various cycles; energy gain = average power values − heat loss (Q) due to increased fuel consumption, Q (kJ) = Calorific value of fuel (CV) (kJ/kg) × fuel (kg), CV of gasoline = 47,300 kJ/kg; * considering the increased fuel consumption.
Cycle Difference (g/h) Difference (%) Energy Gain * (kWh) NEDC −3.7 −0.12 +0.37 WLTC −66.4 −1.34 −0.03 US06 −161.3 −1.80 +3.78
Combined driving −81.8 −1.26 +5.52
5. Conclusions
The present paper provides a detailed theoretical analysis on the potential of e-turbocharging to control load while providing energy recovery for increasing the overall system efficiency and if possible replacing wastegate boost control. The initial results show that at medium to high loads, significant amounts of enthalpy, up to 5 kW, are lost through the WG valve of a 2.0 L turbocharged spark-ignition engine at medium to high loads. A significant amount of this enthalpy loss can be recovered by the implementation of a motor-generator directly linked to the shaft of the turbocharger.
The study reveals that replacing the wastegate is only achievable when a 30% larger turbine is used for non-violating the pre-turbine pressure limit of the engine. However, a large turbine leads to very poor performance and energy provision needs at the low loads and speeds. A 10% smaller turbine when combined with increased pre-turbine pressures was found to provide efficiency gains and energy harvesting conditions across the whole area of the engine’s load/speed map. However, this energy harvesting and efficiency gain come with a 5% penalty on the maximum power output of the engine. Increased power outputs are still achievable by reducing the pre-turbine pressure (opening the WG) and providing extra energy to the compressor.
The transient response time of the electrically-assisted engine showed an improvement between 70% and 90% depended on the engine speed and the power provided to the compressor (~1 to 5 kW).
Figure 28. Fuel flow mass flow rate comparison between e-turbo and baseline model for the WLTCcycle; highlighted area indicates the disturbance of PID tuning on the accuracy of the results.
The obtained results for the transient cycles show that with the implementation of thee-turbocharger, the fuel economy of the engine is deteriorated by up to 1.8% (Table 7) due to theincreased pre-turbine pressures. However, this fuel consumption increase is compensated by thegenerated power of the e-turbocharger. The combined driving cycle demonstrates the maximum netgain of 5.5 kWh, followed by the US06 cycle with 3.8 kWh. The WLTC is the only cycle that provides amarginally negative energy gain when considering the increased fuel consumption.
Table 7. Fuel consumption difference between baseline and e-turbo models for various cycles; energygain = average power values − heat loss (Q) due to increased fuel consumption, Q (kJ) = Calorificvalue of fuel (CV) (kJ/kg) × fuel (kg), CV of gasoline = 47,300 kJ/kg; * considering the increasedfuel consumption.
Cycle Difference (g/h) Difference (%) Energy Gain * (kWh)
NEDC −3.7 −0.12 +0.37WLTC −66.4 −1.34 −0.03US06 −161.3 −1.80 +3.78
Combined driving −81.8 −1.26 +5.52
5. Conclusions
The present paper provides a detailed theoretical analysis on the potential of e-turbochargingto control load while providing energy recovery for increasing the overall system efficiency and ifpossible replacing wastegate boost control. The initial results show that at medium to high loads,significant amounts of enthalpy, up to 5 kW, are lost through the WG valve of a 2.0 L turbochargedspark-ignition engine at medium to high loads. A significant amount of this enthalpy loss can berecovered by the implementation of a motor-generator directly linked to the shaft of the turbocharger.
The study reveals that replacing the wastegate is only achievable when a 30% larger turbine isused for non-violating the pre-turbine pressure limit of the engine. However, a large turbine leadsto very poor performance and energy provision needs at the low loads and speeds. A 10% smallerturbine when combined with increased pre-turbine pressures was found to provide efficiency gainsand energy harvesting conditions across the whole area of the engine’s load/speed map. However,this energy harvesting and efficiency gain come with a 5% penalty on the maximum power output ofthe engine. Increased power outputs are still achievable by reducing the pre-turbine pressure (openingthe WG) and providing extra energy to the compressor.

Appl. Sci. 2017, 7, 350 24 of 25
The transient response time of the electrically-assisted engine showed an improvement between70% and 90% depended on the engine speed and the power provided to the compressor (~1 to5 kW). Testing the system under various driving cycles showed that the average amount of energygenerated exceeds by up to 1 kW on average (6.6 kWh) the energy required by the motor during thetransient events. The e-turbocharged engine demonstrated a fuel deterioration of up to 1.8% during thetransient due to the increased pre-turbine pressures. However, this was compensated by the additionalgenerated power. The maximum net energy gain of 5.5 kWh when considering the fuel consumptionincrease was for the combined driving cycle followed by the US06 cycle with a net gain of 3.8 kWh.
Finally, it needs to be mentioned again that none of the results presented in this study take intoaccount any electrical losses, such as alternator, converter and battery losses, which will obviouslyreduce the net amount of harvested energy. Future work will include investigations on gasoline andmulti-turbo systems with a comprehensive turbine/compressor matching and the electrification of VGTturbocharging systems. Finally, the simulation studies can be supported by experimental investigationswith actual hardware testing and e-turbocharger emulation studies (using an externally-boosted enginetransient facility located at the University of Bath) for a comprehensive in-cylinder combustion analysis.
Acknowledgments: The authors would like to acknowledge Ford Motor Company and Jaguar Land Rover fortheir funding support for this research work.
Author Contributions: Pavlos Dimitriou, Richard Burke and Harald Stoffels conceived of and designedthe experiments. Pavlos Dimitriou performed the experiments, analysed the data and wrote the paper.Qingning Zhang and Colin Copeland contributed with their experience on electrically-assisted turbochargers andsimulation tools.
Conflicts of Interest: The authors declare no conflict of interest. The founding sponsors have agreed to publishthe findings of this work.
References
1. Winterbone, D.E.; Benson, R.S.; Mortimer, A.G.; Kenyon, P.; Stotter, A. Transient response of turbochargeddiesel engines. SAE Technical Paper 1977. [CrossRef]
2. Turner, J.W.G.; Popplewell, A.; Marshall, D.J.; Johnson, T.R.; Barker, L.; King, J.; Martin, J.; Lewis, A.G.J.;Akehurst, S.; Brace, C.J.; et al. SuperGen on ultraboost: Variable-speed centrifugal supercharging as anenabling technology for extreme engine downsizing. SAE Int. J. Engines 2015, 8, 1602–1615. [CrossRef]
3. Rose, A.J.M.; Akehurst, S.; Brace, C.J. Investigation into the trade-off between the part-load fuel efficiencyand the transient response for a highly boosted downsized gasoline engine with a supercharger driventhrough a continuously variable transmission. Proc. Inst. Mech. Eng. Part D 2013, 227, 1674–1686. [CrossRef]
4. Katrašnik, T.; Rodman, S.; Trenc, F.; Hribernik, A.; Medica, V. Improvement of the dynamic characteristic ofan automotive engine by a turbocharger assisted by an electric motor. J. Eng. Gas Turbines Power 2003, 125,590–595.
5. Ibaraki, S.; Yamashita, Y.; Sumida, K.; Ogita, H.; Jinnai, Y. Development of the “hybrid turbo”,an electrically-assisted turbocharger. Mitsubishi Heavy Ind. Tech. Rev. 2006, 43, 1–5.
6. Millo, F.; Mallamo, F.; Pautasso, E.; Ganio Mego, G. The potential of electric exhaust gas turbocharging forHD diesel engines. SAE Tech. Pap. 2006. [CrossRef]
7. Burke, R.D. A numerical study of the benefits of electrically-assisted boosting systems. J. Eng. GasTurbines Power 2016, 138, 092808. [CrossRef]
8. Bumby, J.R.; Spooner, E.S.; Carter, J.; Tennant, H.; Ganio Mego, G.; Dellora, G.; Gstrein, W.; Sutter, H.;Wagner, J. Electrical machines for use in electrically-assisted turbochargers. In Proceedings of the SecondInternational Conference on Power Electronics, Machines and Drives, Edinburgh, UK, 31 March–2 April2004; IET: Stevenage, Hertfordshire, UK, 2004; Volume 1, pp. 344–349.
9. Bumby, J.; Crossland, S.; Carter, J. Electrically-assisted turbochargers: Their potential for energy recovery.In Proceedings of the IET The Institution of Engineering and Technology Hybrid Vehicle Conference,Coventry, UK, 12–13 December 2006; IET: Stevenage, Hertfordshire, UK, 2006; pp. 43–52.
10. Divekar, P.S.; Ayalew, B.; Prucka, R. Coordinated electric supercharging and turbo-generation for a dieselengine. SAE Tech. Pap. 2010. [CrossRef]

Appl. Sci. 2017, 7, 350 25 of 25
11. Panting, J.; Pullen, K.R.; Martinez-Botas, R.F. Turbocharger motor-generator for improvement of transientperformance in an internal combustion engine. Proc. Inst. Mech. Eng. Part D 2001, 215, 369–383. [CrossRef]
12. Terdich, N.; Martinez-Botas, R. Experimental efficiency characterization of an electrically-assistedturbocharger. SAE Tech. Pap. 2013. [CrossRef]
13. Arsie, I.; Cricchio, A.; Pianese, C.; De Cesare, M.; Nesci, W. A comprehensive powertrain model to evaluatethe benefits of electric turbo compound (ETC) in reducing CO2 emissions from small diesel passenger cars.SAE Tech. Pap. 2014. [CrossRef]
14. Algrain, M. Controlling an electric turbo compound system for exhaust gas energy recovery in a dieselengine. In Proceedings of the 2005 IEEE International Conference on Electro information Technology, Lincoln,NE, USA, 22–25 May 2005; IEEE: New York, NY, USA, 2005; p. 6.
15. Pasini, G.; Frigo, S.; Marelli, S. Numerical comparison of an electric turbo compound applied to a SI and a CIengine. In Proceedings of the ASME 2015 Internal Combustion Engine Division Fall Technical Conference(ICEF2015), Houston, TX, USA, 8–11 November 2015.
16. Tavcar, G.; Bizjan, F.; Katrašnik, T. Methods for improving transient response of diesel engines—Influencesof different electrically-assisted turbocharging topologies. Proc. Inst. Mech. Eng. Part D 2011, 225, 1167–1185.[CrossRef]
17. Tang, H. Application of Variable Geometry Turbine on Gasoline Engine and the Optimisation of TransientBehaviours. Ph.D. Dissertation, University of Bath, Bath, UK, 2015.
© 2017 by the authors. Licensee MDPI, Basel, Switzerland. This article is an open accessarticle distributed under the terms and conditions of the Creative Commons Attribution(CC BY) license (http://creativecommons.org/licenses/by/4.0/).
Copyright © 2022 FDOKUMEN