El Camino Real Corridor Study - City of Menlo Park
567
A El Camino Real Corridor Study APPENDIX A El Camino Real Corridor Study Community Survey Report
-
Upload
khangminh22 -
Category
Documents
-
view
0 -
download
0
Transcript of El Camino Real Corridor Study - City of Menlo Park

AEl Camino Real Corridor Study
A P P E N D I X A
El Camino Real Corridor Study Community Survey Report


El Camino Real Corridor Study
Community Survey ReportFebruary 2015
www.MenloPark-ElCamino.com


Community Survey ReportFebruary 2015
El Camino Real Corridor Study
Prepared for City of Menlo Park
by


Table of Contents
Executive Summary ........................................................................................................... 1
1. Introduction .................................................................................................................. 3
2. Methodology ................................................................................................................. 3
3. Survey Results ............................................................................................................... 4
Location .................................................................................................................................................... 4
Reasons to Travel on El Camino Real ............................................................................................... 6
Transportation Modes .......................................................................................................................... 8
Opinions and Concerns ...................................................................................................................... 15
Potential Changes on El Camino Real ............................................................................................. 25
Open-Ended Questions ...................................................................................................................... 29
4. Summary of Key Issues .............................................................................................. 34
Transportation Needs ......................................................................................................................... 34
Traffic ...................................................................................................................................................... 35
Safety ....................................................................................................................................................... 35
Appendix A: El Camino Real SurveyMonkey Transportation Survey ...................... A-1
Appendix B: El Camino Real Transportation Survey Responses .............................. B-1
Appendix C: El Camino Real Transportation Survey Open-Ended Responses ....... C-1

El Camino Real Corridor Study
ii
List of Figures and Charts
Chart 1: Where Respondents Live ................................................................................................................ 4 Figure 1: Study Area .......................................................................................................................................... 5 Chart 2: Where Respondents Work ............................................................................................................ 6 Chart 3: Why Respondents Travel on El Camino Real ............................................................................. 7 Chart 4: How Respondents Travel El Camino Real ................................................................................... 8 Chart 5: Frequency that Respondents Drive on El Camino Real ......................................................... 10 Chart 6: Frequency that Respondents Walk along El Camino Real ..................................................... 11 Chart 7: Frequency that Respondents Bike El Camino Real .................................................................. 12 Chart 8: Frequency that Respondents Use Local Bus Transit Services on El Camino Real .......... 14 Chart 9: How Respondents Commonly Access the Menlo Park Caltrain Station ........................... 15 Chart 10: Opinions on General Safety and Environmental Concerns ................................................. 16 Chart 11: Opinions on Walking Environment ........................................................................................... 17 Chart 12: Opinions on Transit ...................................................................................................................... 19 Chart 13: Opinions on Vehicle Traffic Environment ............................................................................... 20 Chart 14: Opinions on Bicycle Environment ............................................................................................. 22 Chart 15: Opinions on Parking Environment ............................................................................................ 24 Chart 16: Preferences for Potential Changes on El Camino Real ........................................................ 27
List of Tables
Table 1: Where Respondents Live ................................................................................................................. 4 Table 2: Where Respondents Work ............................................................................................................. 6 Table 3: Why Respondents Travel on El Camino Real ............................................................................. 8 Table 4: How Respondents Travel El Camino Real ................................................................................... 9 Table 5: Frequency that Respondents Drive on El Camino Real .......................................................... 10 Table 6: Frequency that Respondents Walk along El Camino Real ..................................................... 11 Table 7: Frequency that Respondents Bike El Camino Real .................................................................. 13 Table 8: Frequency that Respondents Use Local Bus Transit Services on El Camino Real ............ 14 Table 9: How Respondents Commonly Access the Menlo Park Caltrain Station ............................ 15 Table 10: Opinions on General Safety and Environmental Concerns ................................................. 16 Table 11: Opinions on Walking Environment ........................................................................................... 18 Table 12: Opinions on Transit ...................................................................................................................... 19 Table 13: Opinions on Vehicle Traffic Environment ................................................................................ 21 Table 14: Opinions on Bicycle Environment .............................................................................................. 23 Table 15: Opinions on Parking Environment ............................................................................................. 25 Table 16: Preferences for Potential Changes on El Camino Real ......................................................... 28 Table 17: Intersections of Concern ............................................................................................................. 32 Table 18: Intersections in Segments of Concern ...................................................................................... 34

1
Executive Summary
This report presents the findings of the community survey conducted by the City of Menlo Park in the between June and September 2014 for the El Camino Real Corridor Study. The Study is an effort to evaluate potential transportation and safety improvements to the Menlo Park segment of El Camino Real. The study will consider alternatives for modifying the Corridor to allow for a possible addition of a bicycle lane and/or additional through lanes. Ultimately, the project will be consistent with the goals outlined in the El Camino Real/Downtown Specific Plan for balanced capacity, bicyclist and pedestrian connectivity, transit access, parking, and safety, as well as the City’s Complete Streets Policy.
The online survey gauged participants’ perceptions and priorities on a variety of transportation issues, including safety and the environment, walking, transit, vehicular travel, bicycling, and parking, and also sought participants’ reactions to ideas for potential improvements along the corridor. Questions served as a follow-up to the first community workshop, and assessed community members’ feelings on a number of statements and improvement ideas that arose during the workshop. The survey also provided a sense of how participants tend to travel along the corridor, why, when, and from where, thus giving the City context to interpret the other responses, and helping the City anticipate the needs that participants may have when accessing El Camino Real.
Analysis of the survey results revealed key issues related to transportation needs, traffic, and safety along El Camino Real. These are summarized as follows:
• Transportation Needs
Most respondents use multiple forms of transportation along El Camino Real—mainly a combination of driving, bicycling, and walking. They mostly travel the Corridor to access shopping and local businesses, and half of respondents use it to commute to work. Most of the survey respondents reported using the Menlo Park Caltrain Station. These Caltrain users tend to favor bicycling or walking to the station.
Respondents desire multi-modal improvements along the Corridor regardless of which modes they currently use most. The majority agreed that if pedestrian and bicycling improvements were made, they would prefer to take advantage of those transportation options rather than drive.
There may need to be a closer examination of public transit needs along the corridor. The sample of transit riders responding to the survey was too small to draw supportable generalizations. However, survey responses suggest that frequent transit riders—unlike frequent users of other transportation modes—are less willing or less able to drive as an alternative to transit, meaning that this group may have a greater need for non-automotive transportation options. Additionally, there were some open-ended responses from non-transit users that showed interest in improving public transportation along the corridor.

El Camino Real Corridor Study
2
• Traffic
Traffic was a prevalent concern throughout responses to the open-ended questions. Respondents connected traffic conditions with a number of the Corridor’s safety issues as frustrated drivers participate in risky behavior, such as running red lights, cutting through adjacent neighborhoods, and speeding. In discussing potential improvements to vehicle traffic, most respondents did not feel that vehicle capacity was a problem in the Corridor, and additional vehicle lanes on El Camino Real were not considered a desirable improvement. Respondents’ explanations for traffic causes focused on bottlenecks at specific intersections or along specific segments of the Corridor due to signal timing and lane design. Problematic intersections tended to be those adjacent to major destinations (such as Menlo/Ravenswood) or which serve as connections for regional traffic (such as Sand Hill). Signalization changes were a desired improvement. According to the responses to the open-ended questions, important considerations for signal timing include crossing signals for pedestrians and cyclists and ensuring that signals facilitate east-west movement as well as north-south flow.
• Safety
Safety in the Corridor was a major concern, particularly for those traveling by bicycle or on foot. Pedestrian safety and crossing improvements, bike lanes, bike parking, and landscaped buffers for pedestrians and cyclists were among the most desired improvements. Additionally, though travel by vehicle was considered the safest way to travel El Camino Real, vehicle safety improvements were still considered desirable. Open-ended responses indicated that vehicle safety may need to address driving behavior such as speeding, opportunistic use of turn lanes for passing purposes, running red lights, U-turns, and stopping in the intersection during red lights.
Student safety and the safety of children using El Camino Real was a priority for respondents, regardless of whether or not respondents have children who need to cross El Camino Real for school. Nineteen percent of respondents have children who need to make this crossing, though responses to open-ended questions suggested that there were additional respondents who are uncomfortable with letting their children travel El Camino Real alone and use alternate means of getting them to school. Student safety concerns include traveling by foot and by bicycle, particularly at crossings.
These survey results were used to inform and refine a set of alternatives for consideration by the public. The alternatives present different combinations of roadway improvements, examining the potential for ideas such as additional travel lanes, buffered bike lanes, and separated bike lanes, which were evaluated by participants for the survey. Development of the alternatives also took into consideration various concerns and priorities expressed by community members in their survey responses, and seek to respond the issues summarized above. The next steps will be the further evaluation of the alternatives through a workshop and additional community feedback in order to formulate a preferred plan that reflects the community’s needs for safety, efficiency, and transportation opportunities along the El Camino Real corridor.

Community Survey Report Internal Draft
3
1. Introduction
The City of Menlo Park is conducting the El Camino Real Corridor Study to evaluate potential transportation and safety improvements to El Camino Real in the City of Menlo Park. The study will consider alternatives for modifying the Corridor to allow for a possible addition of a bicycle lane and/or additional through lanes. Ultimately, the project will be consistent with the goals outlined in the El Camino Real/Downtown Specific Plan for balanced capacity, bicyclist and pedestrian connectivity, transit access, parking, and safety, as well as the City’s Complete Streets Policy. Figure 1 shows the Study Area.
The City conducted an online survey during the initial phase of the Study, following the project’s first community workshop. Survey questions were focused on learning how and why different members of the community use the El Camino Real Corridor and on eliciting feedback on potential improvements to the Corridor. Many of the questions were based directly on the ideas gathered at the first community workshop, and were intended to assess which of these ideas had the greatest appeal to the broader community. The survey was active between June 16 and September 12, 2014, during which time 309 community members participated. Initial results were presented at an open house on October 2, 2014, where seven additional responses were collected, for a total of 316 responses.
This report presents and analyzes the results of the survey. Appendix A contains the original survey questions as they appeared online. Appendix B contains the summary tables and cross-tabulations used in this analysis. A list of the open-ended responses provided for questions 9, 17, 18, and 19 can be found in Appendix C.
2. Methodology
The survey was conducted using SurveyMonkey, an online service, and was announced via the City’s El Camino Real project website and e-mail announcements. The survey was also advertised using flyers distributed at local businesses and destinations, such as Downtown, the Caltrain Station and grocery stores; public spaces and events, including the Chamber of Commerce Summer Block Party, the Menlo Park Library, and the Arrillaga Family Gymnasium; and via school newsletters for local public and private schools. Results were exported from the site as summary files and cross-tabulations.
Questions included three general types of questions: multiple choice questions about respondents’ location and habits; questions that asked respondents to rate their agreement with a given statement or to rate the desirability of a proposed improvement; and open-ended questions. Questions 1 through 9 were used in cross-tabulations to assess whether respondents’ location or habits had a significant relationship to the ratings they assigned to different statements or improvements. Notable correlations are discussed in the analysis.

El Camino Real Corridor Study
4
3. Survey Results
LOCATION
Questions 1 and 2 asked participants where they live or work in relation to the El Camino Real Corridor—in Menlo Park within a half-mile of the Corridor, in Menlo Park farther than a half-mile from the Corridor, outside of Menlo Park within a half-mile of the Corridor, or none of the above (outside of Menlo Park, farther than a half-mile from the Corridor). Responses are described in Chart 1 and Table 1 for where participants live, and Chart 2 and Table 2 for where participants work.
The majority of survey respondents live in Menlo Park, with the largest portion of respondents (47 percent) living in Menlo Park within a half-mile of the Corridor. The next-largest portion of respondents (32 percent) lives in Menlo Park, but farther than a half-mile from the Corridor. For participants living outside of Menlo Park, more live within a half-mile of the Corridor (13 percent) than beyond (8 percent).
Table 1: Where Respondents Live
Location Number of
Respondents Percent of Total
In Menlo Park, within 1/2 mile of the Corridor 147 47%
In Menlo Park, farther than 1/2 mile of the Corridor 102 32%
Outside of Menlo Park, within 1/2 mile of the Corridor 41 13%
Outside of Menlo Park, farther than 1/2 mile of the Corridor 26 8%
Total 316 100%
47%
32%
13%
8%
Chart 1: Where Respondents Live
In Menlo Park, within 1/2 mile of the corridor
In Menlo Park, farther than 1/2 mile of the corridor
Outside of Menlo Park, within 1/2 mile of the corridor
Outside of Menlo Park, farther than 1/2 mile of the corridor

Match Line
Match Line
9
8
7
5
6
lae
R on
ima
C lE
Encinal Avenue
Glenwood Av enueValparaiso Avenue
Oak Grov e Avenue
Santa Cr uz Av enue
Menlo Avenue
MenloCollege
MenloSchool
Caltr
ain S
tatio
nA
lma
Stre
et
teert S l eruaL
Rave nswoodAvenue
4
Live Oak Avenue
Roble Avenue
Sand Hill Road
4
3
1
2
lae
R on
im
aC l
E
Middle Avenue
Cambridge Avenue
Roble Avenue
Live Oak Avenue
NealonPark
BurgessPark
Alm
aSt
reet
Alm
a St
reet
College Avenue
Partridge Avenue
Harvard Avenue
Cre ek Driv e
RavenswoodAvenue
Menlo Avenue
Burgess Drive
Willow Road
Figure 1: Study Area
014mpa.ai 9/14
El Camino Real Corridor Study
North
Not to Scale
LEGEND
Study Intersection
El Camino Real Corridor Study
6
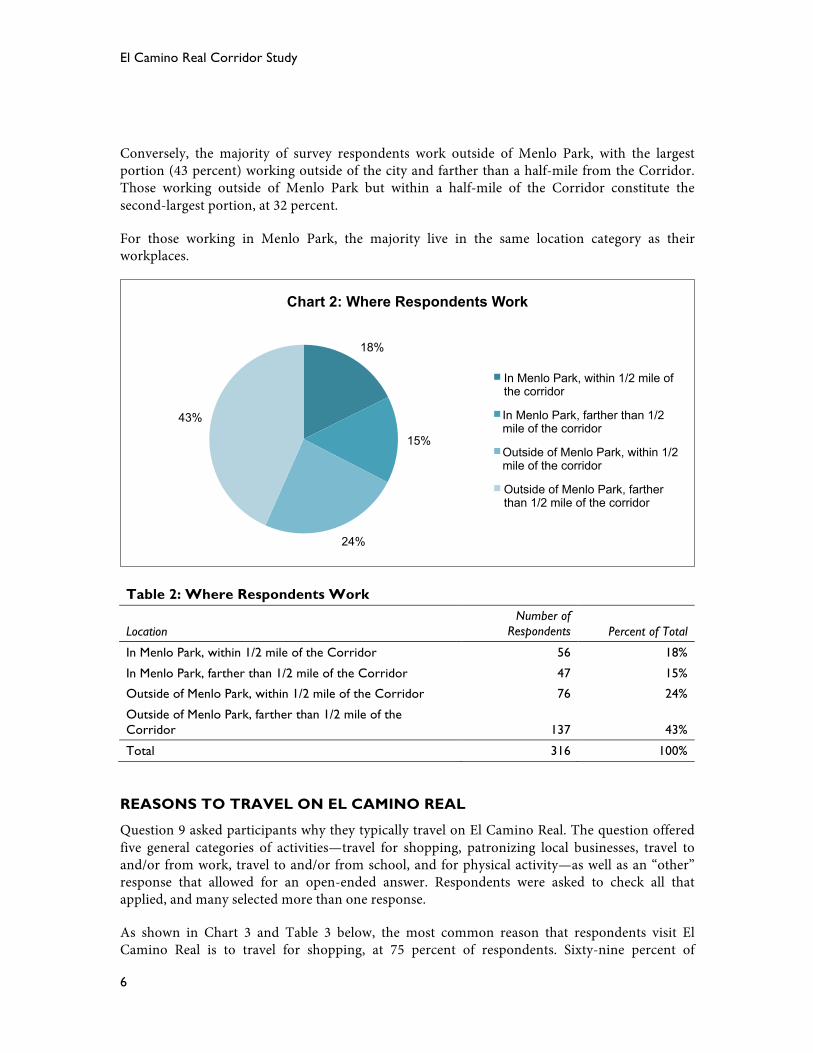
Conversely, the majority of survey respondents work outside of Menlo Park, with the largest portion (43 percent) working outside of the city and farther than a half-mile from the Corridor. Those working outside of Menlo Park but within a half-mile of the Corridor constitute the second-largest portion, at 32 percent.
For those working in Menlo Park, the majority live in the same location category as their workplaces.
Table 2: Where Respondents Work
Location Number of
Respondents Percent of Total
In Menlo Park, within 1/2 mile of the Corridor 56 18%
In Menlo Park, farther than 1/2 mile of the Corridor 47 15%
Outside of Menlo Park, within 1/2 mile of the Corridor 76 24%
Outside of Menlo Park, farther than 1/2 mile of the Corridor 137 43%
Total 316 100%
REASONS TO TRAVEL ON EL CAMINO REAL
Question 9 asked participants why they typically travel on El Camino Real. The question offered five general categories of activities—travel for shopping, patronizing local businesses, travel to and/or from work, travel to and/or from school, and for physical activity—as well as an “other” response that allowed for an open-ended answer. Respondents were asked to check all that applied, and many selected more than one response.
As shown in Chart 3 and Table 3 below, the most common reason that respondents visit El Camino Real is to travel for shopping, at 75 percent of respondents. Sixty-nine percent of
18%
15%
24%
43%
Chart 2: Where Respondents Work
In Menlo Park, within 1/2 mile of the corridor
In Menlo Park, farther than 1/2 mile of the corridor
Outside of Menlo Park, within 1/2 mile of the corridor
Outside of Menlo Park, farther than 1/2 mile of the corridor

Community Survey Report Internal Draft
7
respondents travel to patronize local business, and 50 percent travel for work. Smaller percentages use it to travel for school (19 percent) and for physical activity (17 percent).
Within each category, the largest share of respondents tended to live in Menlo Park, primarily within half a mile of the El Camino Real Corridor. For those who travel for shopping, local businesses, work, or school, 45 to 50 percent of respondents live in Menlo Park within a half-mile of the Corridor, while another 25 to 40 percent live in Menlo Park farther than a half-mile from the Corridor. The smallest percentages of respondents for each response category live outside of Menlo Park farther than half a mile from the Corridor. Among those who use El Camino Real for physical activity, over 90 percent live in Menlo Park.
The “other” responses tended to fall into one of six general categories of responses:
1. To connect to other cities in the region
2. To access the library and recreation center
3. For events and children’s activities
4. To cross from east to west
5. To visit friends and family
6. To access services
A full list of the open-ended responses can be viewed in Appendix C.
76% 69%
50%
19% 17% 11%
0%
20%
40%
60%
80%
Travel for shopping
Patronizing local
businesses
Travel to and/or from work
Travel to and/or from school
For physical activity
Other
Per
cent
of a
ll re
spon
dent
s
Chart 3: Why Respondents Travel on El Camino Real

El Camino Real Corridor Study
8
Table 3: Why Respondents Travel on El Camino Real
Reason Number of
Respondents Percent of Total
Travel for shopping 240 76%
Patronizing local businesses 216 69%
Travel to and/or from work 159 50%
Travel to and/or from school 60 19%
For physical activity 55 17%
Other 36 11%
Total 315
TRANSPORTATION MODES
Questions 3 through 8 asked respondents about their use of various modes of travel on El Camino Real. Questions 3 through 6 focused on the frequencies with which participants drive a vehicle, ride a bike, use local bus transit, or walk along El Camino Real.
The majority of respondents use multiple forms of transportation to access El Camino Real. In fact, only 22 percent of respondents exclusively drive along El Camino Real, only 5 percent exclusively bicycle there, and less than 1 percent exclusively walks (only one respondent). No respondents use bus transit as their only form of transportation along El Camino Real.
Chart 4 and Table 4 describe the percentage of respondents who use each of the four modes at least sometimes compared to those who stated that they “almost never” use each mode. As each respondent may select multiple modes, each column shows a percentage of the total number of respondents. The transportation mode used by the largest share of survey respondents was driving, with 84 percent of respondents driving El Camino Real at least a few times a week. Walking and bicycling each have similar shares of respondents, with 61 percent of respondents walking and 60 percent bicycling at least sometimes on weekends. Comparatively few respondents, only 6 percent, use bus transit service along El Camino Real.
84%
60% 61%
6% 0%
20%
40%
60%
80%
100%
Driving Bicycling Walking Transit
Chart 4: How Respondents Travel El Camino Real
Almost Never
Sometimes or Frequently

Community Survey Report Internal Draft
9
Table 4: How Respondents Travel El Camino Real
Transportation Method Number of
Respondents Percent of Total
Driving 265 84%
Bicycling 191 60%
Walking 194 61%
Transit 18 6%
Total Respondents 316
Driving
Driving was the most common form of transportation among survey respondents, with 84 percent driving El Camino Real at least a few times a week. Most respondents who drive on El Camino Real drive on a daily basis, with nearly 50 percent of respondents driving on the Corridor at least once a day. Chart 5 and Table 5 describe the frequency with which respondents drive El Camino Real.
Those driving most frequently tend to live in Menlo Park and work outside of Menlo Park. Following the overall trend for reasons respondents visit El Camino Real, those driving at the highest frequencies tend to be visiting for shopping, to patronize local businesses, and to commute to work. Those driving a few times a week are more likely traveling to shop (75 percent) and patronize local businesses (68 percent) and commute (39 percent), than to travel for school or physical activity, though the percentage of commuters is still much lower than among those driving multiple times a day. If a respondent drives and travels El Camino Real for work, he or she is more likely to be driving multiple times a day.
A majority of the respondents who drive along El Camino Real travel the Corridor using other forms of transportation in addition to driving, mainly bicycling and walking. For instance, 55 percent of drivers also bike, 62 percent also walk, and 4 percent also use bus transit. Over a quarter of drivers at all frequencies walk along or across El Camino Real at least a few times a week.
Of those 16 percent of respondents who almost never drive El Camino Real, most use an alternative form of transportation to access the Corridor, with bicycle being the most common form. Ninety percent of those not driving ride a bicycle on El Camino Real at least sometimes, with 82 percent of those not driving bicycling several times a week or daily. Sixty-one percent of those not driving walk along El Camino Real; 29 percent of those not driving walk several times a week or daily. Fourteen percent of those not driving use bus transit along the Corridor; only six out of seven respondents use transit several times a week, and one uses transit mostly on weekends.

El Camino Real Corridor Study
10
Table 5: Frequency that Respondents Drive on El Camino Real
Frequency Number of
Respondents Percent of Total
Multiple times per day 106 34%
Approximately once per day 45 14%
A few times a week 114 36%
Almost never 51 16%
Total 316 100%
Walking
Walking was the second-most common form of transportation among respondents, with 61 percent walking along or across the Corridor at least sometimes. Among those who walk, more tend to do so on weekends (26 percent of respondents) or several times per week (25 percent of respondents), while a smaller portion walks on a daily basis (10 percent). Chart 6 and Table 6 describe the frequency that respondents walk along or across El Camino Real.
Respondents who walk along El Camino Real are more likely to live in Menlo Park within a half mile of the Corridor (84 percent of those walking live in this area), and are far less likely to live outside of Menlo Park farther than half a mile from the Corridor. There is no significant pattern that describes where they tend to work.
Reasons that those who walk along El Camino Real have for traveling the Corridor follow the overall trend, with most traveling for shopping and patronizing local businesses, followed, to a lesser degree, by travel to and from work. There is a difference, however, among those who walk El Camino Real on a daily basis, for which 55 percent of respondents who walk the Corridor
34%
14%
36%
16%
Chart 5: Frequency that Respondents Drive on El Camino Real
Multiple times per day
Approximately once per day
A few times a week
Almost never

Community Survey Report Internal Draft
11
selected physical activity as a reason that they travel there (a higher percentage than among respondents in general).
Most of the 38 percent of respondents who almost never walk El Camino Real access the Corridor using a vehicle or a bicycle, while few use bus transit. Eighty-three percent of those who do not walk the Corridor tend to drive. Forty percent tend to use bicycle, with most cycling several times per week or daily. Only 2 percent said that they use bus transit on El Camino Real.
Most of the respondents who do walk along El Camino Real also travel the Corridor using other transportation modes, generally driving or bicycling. Eighty-four percent also drive, while 73 percent also bike.
Survey participants were also asked if they had children who have to cross El Camino Real to get to school, to which 19 percent of respondents said yes. Thirty-seven percent of these respondents also walk at least several times per week, 27 percent walk mostly on weekends, and 37 percent almost never walk.
Table 6: Frequency that Respondents Walk along El Camino Real
Frequency Number of
Respondents Percent of Total
On a daily basis 31 10%
Several times per week 80 25%
Mostly on weekends 83 26%
Almost never 121 38%
Total 315 100%
10%
25%
26%
38%
Chart 6: Frequency that Respondents Walk along El Camino Real
On a daily basis
Several times per week
Mostly on weekends
Almost never

El Camino Real Corridor Study
12
Bicycling
Bicycling was the third-most common form of transportation among respondents, with just three respondents fewer than walking. Sixty percent of respondents bike along El Camino Real at least sometimes. Most respondents who bike do so on a weekly basis, with 22 percent of respondents biking several times a week and another 19 percent biking on a daily basis. Chart 7 and Table 7 describe the frequency with which respondents bicycle along El Camino Real.
Those cycling most frequently are more likely to live in Menlo Park and work outside of Menlo Park, though those cycling on a daily basis are also generally more likely to live and work within half a mile of the Corridor.
Reasons that bicyclists on El Camino Real may visit the Corridor are similar to the overall trend, with the exception of those cycling daily – for those cycling at this frequency, the most common reason to travel El Camino Real is travel to and from work (74 percent), just barely more common than travel for shopping (72 percent). At least half of those cycling several times a week or mostly on weekends travel for work. If a respondent bikes and travels El Camino Real for work, he or she is more likely to be cycling on a daily basis.
Of those 40 percent of respondents who almost never cycle along El Camino Real, most drive to access the Corridor.
A majority of the respondents who bike along El Camino Real travel the Corridor using other forms of transportation in addition to biking, mainly driving and walking. There is nearly the same number of those driving (76 percent of bicyclists) as those walking (74 percent of bicyclists). Generally, cycling and driving frequencies appear inversely related, with those driving more often cycling less often and vice versa.
19%
22%
19%
40%
Chart 7: Frequency that Respondents Bike El Camino Real
On a daily basis
Several times per week
Mostly on weekends
Almost never

Community Survey Report Internal Draft
13
Table 7: Frequency that Respondents Bike El Camino Real
Frequency Number of
Respondents Percent of Total
On a daily basis 61 19%
Several times per week 70 22%
Mostly on weekends 60 19%
Almost never 125 40%
Total 316 100%
Transit
Local bus transit was the least common form of transportation used among respondents, with only 6 percent of respondents using the bus at least sometimes. Most transit users responding to the survey ride at a frequency of several times a week (4 percent of respondents) with smaller numbers riding mostly on weekends (1 percent of respondents) and on a daily basis (1 percent of respondents). Chart 8 and Table 8 describe the frequency with which respondents use transit along El Camino Real. The sample size for this transportation mode was very small and may not be indicative of the habits of all users of transit along El Camino Real in Menlo Park.
Those respondents using transit along El Camino Real live and work in all four location categories. Reasons for traveling El Camino Real differ by frequency of transit usage. Both daily riders travel the Corridor for work, school, and local businesses. Those riding several times per week followed nearly the same distribution as survey respondents overall, with the highest share (92 percent of transit users) traveling for shopping, followed by patronizing local businesses (75 percent of transit users) and traveling to and from work (58 percent of transit users). For the four respondents using transit mostly on weekends, all travel the Corridor for work, three for shopping and local businesses, and one for school. For those who do use transit on El Camino Real, most also bike, walk, and drive.
Of the 94 percent of respondents who almost never use local bus transit along El Camino Real, most drive along the Corridor, though a majority also bicycles and walks. Respondents in this transportation category differ from the others in that driving is not the most common form of transportation used in addition to transit. The most common is biking, as 89 percent of transit users also bike the Corridor, while 83 percent of transit users also walk there. Sixty-one percent of transit users also drive, the lowest percentage of drivers among the bicycling, walking, and transit using categories.

El Camino Real Corridor Study
14
Table 8: Frequency that Respondents Use Local Bus Transit Services on El Camino Real
Frequency Number of
Respondents Percent of Total
On a daily basis 2 1%
Several times per week 12 4%
Mostly on weekends 4 1%
Almost never 298 94%
Total 316 100%
Caltrain
Question 8 asked participants how they commonly travel to the Menlo Park Caltrain station, which can be accessed from El Camino Real via Oak Grove Avenue and Santa Cruz Avenue. Most respondents (57 percent) use the station in some capacity. Of those who use the Caltrain station, the most common transportation method used to access Caltrain is bicycle, which accounts for 37 percent. The second-most common mode of transportation to the station is walking, at 34 percent of station users. Twenty-two percent of station users (12 percent of respondents) drive to Caltrain and park there. Only 7 percent of station users (4 percent of respondents) said that they commonly are dropped off at the station by another vehicle or transit. Chart 9 and Table 9 describe how respondents commonly access the Menlo Park Caltrain station.
1% 4%
1%
94%
Chart 8: Frequency that Respondents Use Local Bus Transit Services on El Camino Real
On a daily basis
Several times per week
Mostly on weekends
Almost never

Community Survey Report Internal Draft
15
Table 9: How Respondents Commonly Access the Menlo Park Caltrain Station
Transportation Method Number of
Respondents Percent of Total
I rarely use Caltrain 136 43%
I ride my bike to Caltrain 66 21%
I walk to Caltrain 61 19%
I drive and park at Caltrain 39 12%
I am dropped off by another vehicle or transit at Caltrain 13 4%
Total 315 100%
OPINIONS AND CONCERNS
Questions 11 through 14 asked participants to indicate their opinions on a series of statements on safety, the environment, and the walking, transit, vehicle traffic, bicycle, and parking environments on El Camino Real. The statements included in the survey were originally made by community members at the community workshop on April 30, 2014.
Safety and Environmental
These statements gauged respondents’ opinions on general safety, children’s safety, air quality, and signage. Chart 10 and Table 10 describe respondents’ agreement with these statements. Responses showed agreement that safety on El Camino Real could be improved. A large majority of respondents agreed that children’s safety when crossing the Corridor for school should be a high priority for the community, and only a very small portion of respondents disagreed. Though a very high percentage of respondents with children who cross El Camino Real strongly agreed (70 percent) or agreed (17 percent) with this statement, the majority of respondents without children who cross the Corridor also strongly agreed (47 percent) or agreed (29 percent).
43%
21%
19%
12% 4%
Chart 9: How Respondents Commonly Access the Menlo Park Caltrain Station
I rarely use Caltrain
I ride my bike to Caltrain
I walk to Caltrain
I drive and park at Caltrain
I am dropped off by another vehicle or transit at Caltrain

El Camino Real Corridor Study
16
A majority of respondents also agreed that the Corridor is only safe for vehicles regardless of which transportation modes they tend to use. Air quality was also a concern, with a majority of respondents agreeing that it should be a high priority to mitigate poor air quality resulting from traffic congestion. Regarding the clarity of signage for cross streets and turns, respondents tended to be neutral or split evenly between agreement and disagreement.
Table 10: Priorities for General Safety and Environmental Concerns
Strongly
agree Somewhat
agree
Neutral/ No
opinion Somewhat
disagree Strongly disagree
Response Count
Ensuring that children can safely cross ECR to get to and from school should be a high priority.
56% 29% 11% 4% 1% 294
ECR is only safe if you are in a vehicle.
30% 42% 7% 16% 5% 295
Mitigating poor air quality from vehicle traffic/congestion should be a high priority.
32% 29% 25% 8% 5% 294
Signage (for cross streets, turns) is not clear enough and needs to be improved.
8%
18%
46%
20%
7%
293
0% 10% 20% 30% 40% 50% 60% 70% 80% 90% 100%
Signage (for cross streets, turns) is not clear enough and needs to be improved.
Mitigating poor air quality from vehicle traffic/congestion should be a high priority.
ECR is only safe if you are in a vehicle.
Ensuring that children can safely cross ECR to get to and from school should be a high priority.
Chart 10: Priorities for General Safety and Environmental Concerns
Strongly agree Somewhat agree Neutral/No opinion Somewhat disagree Strongly disagree

Community Survey Report Internal Draft
17
Walking Environment
The statements in Question 12 focused on pedestrian facilities and safety, and addressed concerns about paths, bicycles on the sidewalk, vehicle speeds, and crossing signals. Chart 11 and Table 11 describe respondents’ levels of agreement with these statements. Despite the responses to Question 11, in which the majority of respondents believed that the Corridor was only safe if you were in a vehicle and that ensuring safe crossing for school children should be a high priority, most respondents agreed that signal lengths are currently appropriate for pedestrian safety. Similarly, nearly equal numbers of respondents agreed, disagreed, or were neutral to the idea that vehicle speeds should be slowed to improve pedestrian safety. There was not a strong difference in responses between participants who walk and respondents who drive. There was, however, also a sense that bicycles on the sidewalk pose a danger to pedestrians, as more than 60 percent agreed and just over 20 percent disagreed. A majority (nearly 70 percent) of respondents also agreed that there should be a parallel separated pedestrian path; less than 10 percent disagreed. Both cyclists and pedestrians tended to agree with this statement. Most respondents claimed that they would walk rather than drive for short trips if pedestrian conditions improved on El Camino Real. Agreement was strongest among those living in Menlo Park near the Corridor, those working within half a mile of the Corridor, those frequently bicycling, and those already walking.
0% 10% 20% 30% 40% 50% 60% 70% 80% 90% 100%
Signals are long enough to allow people to walk across ECR safely.
Vehicle speeds should be slower to make the road safer for people walking.
Bicycles on the sidewalks are a threat to pedestrian safety.
A parallel pedestrian path/trail should be provided, separated from the main roadway, possibly adjacent to
the railroad tracks.
If conditions for pedestrians on and across ECR were improved, I would walk rather than drive a car for some
short trips and errands.
Chart 11: Opinions on Walking Environment
Strongly agree Somewhat agree Neutral/no opinion Somewhat disagree Strongly disagree

El Camino Real Corridor Study
18
Table 11: Opinions on Walking Environment
Strongly
agree Somewhat
agree
Neutral/No
opinion Somewhat
disagree Strongly disagree
Response Count
If conditions for pedestrians on and across ECR were improved, I would walk rather than drive a car for some short trips and errands.
38% 22% 20% 13% 7% 290
A parallel pedestrian path/trail should be provided, separated from the main roadway, possibly adjacent to the railroad tracks.
45% 24% 20% 7% 4% 291
Bicycles on the sidewalks are a threat to pedestrian safety.
27% 37% 16% 14% 8% 291
Vehicle speeds should be slower to make the road safer for people walking.
13% 20% 34% 23% 10% 291
Signals are long enough to allow people to walk across ECR safely.
20% 41% 16% 19% 4% 290

Community Survey Report Internal Draft
19
Transit
This statement evaluated participants’ interest in a dedicated bus or bus rapid transit (BRT) lane. Chart 12 and Table 12 describe respondents’ levels of agreement with this statement. Most respondents disagreed that there should be BRT along El Camino Real through Menlo Park (40 percent) and nearly the same amount were neutral or had no opinion. Those more likely to agree with the statement tended to live outside of Menlo Park, almost never drive, or frequently walk or bike.
Table 12: Opinions on Transit
Strongly
agree Somewhat
agree
Neutral/No
opinion Somewhat
disagree Strongly disagree
Response Count
Dedicated bus/BRT (Bus Rapid Transit) lanes on ECR should be accommodated through Menlo Park.
10% 12% 39% 19% 21% 289
Vehicle Traffic Environment
These statements represented opinions on priorities and actions to be taken regarding vehicle traffic conditions on El Camino Real. Chart 13 and Table 13 describe respondents’ levels of agreement with these statements. Most (more than 60 percent) of respondents agreed that there is already adequate capacity for automobiles, and that improvements should prioritize alternative transportation modes. Respondents who said that they drive on El Camino Real were more likely to agree with this statement, even among the most frequent drivers. Respondents who frequently bicycle were particularly likely to support this statement, with 80 percent of daily riders in strong support. Pedestrians also tended to be in strong support.
Along the same lines, respondents were more likely to disagree than agree with the statement that improving automobile traffic flow should be the highest priority for the Corridor. Those who drive on El Camino Real were more likely than the other demographics to agree with this statement, with over 50 percent of those driving multiple times a day, and 60 percent of those driving once per day agreeing that improving traffic flow should be the highest priority.
0% 10% 20% 30% 40% 50% 60% 70% 80% 90% 100%
Dedicated bus/BRT (Bus Rapid Transit) lanes on ECR should be accommodated through Menlo Park.
Chart 12: Opinions on Transit
Strongly agree Somewhat agree Neutral/No opinion Somewhat disagree Strongly disagree

El Camino Real Corridor Study
20
Responses generally revealed preferences for statements that prioritized convenience for locals. Respondents were far more likely to:
• Agree than disagree that controlling spillover traffic in neighborhoods adjacent to the Corridor should be a priority;
• Very strongly disagree with the prioritization of regional through-traffic; and • Strongly disagree that lanes should be widened to accommodate large trucks and delivery
vehicles.
There was a relatively balanced response to the statement that regional through-traffic and local traffic should be separated—though respondents were most likely to agree, nearly the same number of respondents were neutral, and only slightly fewer disagreed.
0% 10% 20% 30% 40% 50% 60% 70% 80% 90% 100%
Improving the flow of traffic for automobiles should be the highest priority for ECR.
There is enough capacity for automobiles right now; improvements should focus on other modes of travel
(bicycles, pedestrians, transit)
Lanes should be made wider in order to better accommodate large trucks and delivery vehicles.
Solutions for ECR should attempt to separate regional through traffic from local traffic.
Regional through traffic should be prioritized on ECR; short local trips should be routed along other roads
through the community.
Controlling “spillover” traffic in the neighborhoods adjacent to ECR should be a high priority.
Chart 13: Opinions on Vehicle Traffic Environment
Strongly agree Somewhat agree Neutral/No opinion Somewhat disagree Strongly disagree

Community Survey Report Internal Draft
21
Table 13: Opinions on Vehicle Traffic Environment Strongly
agree Somewhat
agree Neutral/
No opinion Somewhat
disagree Strongly disagree
Response Count
Controlling “spillover” traffic in the neighborhoods adjacent to ECR should be a high priority.
27% 21% 29% 17% 6% 288
Regional through traffic should be prioritized on ECR; short local trips should be routed along other roads through the community.
3% 8% 28% 26% 35% 289
Solutions for ECR should attempt to separate regional through traffic from local traffic.
16% 20% 35% 20% 9% 288
Lanes should be made wider in order to better accommodate large trucks and delivery vehicles.
1% 6% 25% 31% 39% 290
There is enough capacity for automobiles right now; improvements should focus on other modes of travel (bicycles, pedestrians, transit)
44% 21% 9% 15% 12% 289
Improving the flow of traffic for automobiles should be the highest priority for ECR.
14% 24% 17% 20% 25% 288
Bicycle Environment
Question 15 included statements about bicycle safety and potential bicycle improvements, and parallel routes. Two statements gauged opinions on the best place to accommodate bicycle traffic—one stated that there should be continuous bike lanes along El Camino Real, and another stated that bicycles are best accommodated on parallel routes. Chart 14 and Table 14 describe respondents’ levels of agreement with these statements.
A majority of respondents agreed with both statements, though 11 percent more agreed that there should be bike lanes, and more respondents tended to disagree that bicycles were best accommodated on parallel routes. Preferences tended to differ based on whether the respondent was a daily or frequent cyclist, versus primarily a driver: frequent cyclists were generally more likely to favor bike lanes, with daily cyclists 61 percent more likely to strongly agree with bike

El Camino Real Corridor Study
22
lanes than with parallel routes. On the other hand, frequent drivers were more likely to prefer parallel routes than bike lanes. Respondents indicated that existing parallel routes are not currently effective for bicycle travel, with over 80 percent agreeing that they are too discontinuous or conflicted. Regarding potential bike lanes, most respondents agreed that they should be physically separated from vehicle traffic. A large majority of cyclists agreed with this statement, as did a majority of drivers.
Respondents also largely agreed that the Corridor is not currently safe or convenient for crossing by bicycle. Over 70 percent of respondents agreed that they would consider bicycling rather than driving for short trips if bicycle conditions on El Camino Real were improved. This includes the majority of frequent drivers, frequent and weekend cyclists, and all but two transit-riding respondents.
0% 10% 20% 30% 40% 50% 60% 70% 80% 90% 100%
ECR is not safe or convenient to cross by bicycle.
Continuous bike lanes should be provided on ECR in both directions, because it is the most direct way for bicyclists to travel within and through Menlo Park.
If bicycle lanes are provided, they should be separated from vehicle traffic by a physical barrier to enhance
safety.
Bicycles are best accommodated on adjacent parallel routes, not on ECR.
Currently, routes parallel to ECR are too discontinuous or conflicted for effective bike travel.
If conditions for bicyclists on and across ECR were improved, I would consider bicycling rather than driving
for some short trips and errands.
Chart 14: Opinions on Bicycle Environment
Strongly agree Somewhat agree Neutral/No opinion Somewhat disagree Strongly disagree

Community Survey Report Internal Draft
23
Table 14: Opinions on Bicycle Environment
Strongly
agree Somewhat
agree Neutral/
No opinion Somewhat
disagree Strongly disagree
Response Count
If conditions for bicyclists on and across ECR were improved, I would consider bicycling rather than driving for some short trips and errands.
57% 16% 12% 6% 8% 290
Currently, routes parallel to ECR are too discontinuous or conflicted for effective bike travel.
56% 27% 10% 3% 2% 287
Bicycles are best accommodated on adjacent parallel routes, not on ECR.
32% 23% 16% 15% 14% 291
If bicycle lanes are provided, they should be separated from vehicle traffic by a physical barrier to enhance safety.
40% 25% 19% 10% 7% 291
Continuous bike lanes should be provided on ECR in both directions, because it is the most direct way for bicyclists to travel within and through Menlo Park.
43% 23% 14% 9% 10% 289
ECR is not safe or convenient to cross by bicycle.
36% 33% 12% 13% 6% 291

El Camino Real Corridor Study
24
Parking Environment
These statements gauged participants’ opinions on parking along El Camino Real. Chart 15 and Table 15 describe respondents’ agreement with these statements. Respondents were more likely to agree with statements that the space currently occupied by on-street parking could be used more effectively for purposes other than parking. Respondents were more likely to strongly disagree than agree with the statement that on-street parking on El Camino Real is essential for customers of small businesses there. If parking were to be replaced by another use, bicycle lanes were the alternative use with the highest and strongest levels of agreement, with nearly 70 percent in agreement. There was less agreement with converting parking to space for vehicle travel (at 45 percent, less than a majority); however, respondents were still more likely to agree with converting parking to space for vehicles than they were to agree that street parking is essential on El Camino Real. Regardless of the reason for parking removal, a majority of respondents agreed that any parking removed from El Camino Real should be replaced as off-street parking located nearby.
0% 10% 20% 30% 40% 50% 60% 70% 80% 90% 100%
Street parking on ECR is essential for the convenience of customers of small businesses located there.
Parking on ECR should be eliminated to free up more space for vehicle travel.
Parking on ECR should be eliminated to free up more space for bicycle lanes.
Any parking that is removed from ECR should be replaced with parking lots or garages off the roadway,
nearby.
Chart 15: Opinions on Parking Environment
Strongly agree Somewhat agree Neutral/No opinion Somewhat disagree Strongly disagree

Community Survey Report Internal Draft
25
Table 15: Opinions on Parking Environment
Strongly
agree Somewhat
agree Neutral/
No opinion Somewhat
disagree Strongly disagree
Response Count
Any parking that is removed from ECR should be replaced with parking lots or garages off the roadway, nearby.
27% 37% 24% 8% 5% 289
Parking on ECR should be eliminated to free up more space for bicycle lanes.
40% 26% 16% 7% 12% 288
Parking on ECR should be eliminated to free up more space for vehicle travel.
19% 26% 26% 13% 16% 289
Street parking on ECR is essential for the convenience of customers of small businesses located there.
7% 13% 24% 30% 27% 288
POTENTIAL CHANGES ON EL CAMINO REAL
Question 10 offered 17 ideas for potential improvements along El Camino Real, and asked participants to rate each on a scale from least desirable (with a score of 1) to most desirable (with a score of 5). Chart 16 and Table 16 describe the responses for each item; the table also includes an average rating score for each item.
The idea rated as most desirable based on its average score is “Enhanced pedestrian safety and crossings on El Camino Real.” Over 80 percent of respondents considered this option desirable, with 57 percent considering it most desirable (more than a majority, and more than was received by any other item). It also received the least amount of undesirable or least desirable responses.
Other items that received a majority of desirable responses were:
• Inclusion of bike lanes on El Camino Real, which also received more than a majority of most desirable responses and also the fewest neutral responses
• More bike parking close to downtown
• More landscaping along El Camino Real (providing buffers between pedestrians or bicyclists and vehicles)
• Timing traffic signals to favor continuous north-south flow on El Camino Real
• Reduction in delay at signalized intersections on El Camino Real
• Wider sidewalks on El Camino Real
• Increased vehicle safety on El Camino Real

El Camino Real Corridor Study
26
These included all of these bicycle- and pedestrian-related improvements, two improvements to signalization, and an improvement related to vehicle safety.
The least-desirable improvement, based on average score, was “More convenient on-street parking on El Camino Real.” Over 60 percent of respondents considered this an undesirable improvement, with over 40 percent considering it least desirable. Only eight percent responded that it would be a desirable improvement.
Other items where there were more undesirable responses than desirable responses were:
• Additional through lanes on El Camino Real
• Lower travel speeds on El Camino Real
• Higher travel speeds on El Camino Real
• More convenient on-street parking on El Camino Real
These were mainly vehicle-related improvements that altered travel speeds or that would increase the number of through-lanes or on-street parking spaces on El Camino Real.
There were also three improvements that received more neutral responses than either desirable or undesirable responses, though each of these items was still considered more desirable than undesirable:
• More landscaped medians on ECR
• Additional transit service along ECR
• Timing traffic signals to favor east-west access
Responses to this question generally corresponded to the opinions expressed in responses to questions 11 through 16. For example, the desirability of pedestrian and bicycle improvements reflects respondents’ tendency to agree with statements promoting pedestrian and cyclist safety. Likewise, the relative unpopularity of additional through-lanes and on-street parking reflects respondents’ opinions that there is adequate vehicle capacity on El Camino Real, and that on-street parking along the Corridor is nonessential and could be eliminated.

Com
mun
ity S
urve
y R
epor
t In
tern
al D
raft 27
0%
20%
40
%
60%
80
%
100%
Mor
e co
nven
ient
on-
stre
et p
arki
ng o
n E
CR
Hig
her t
rave
l spe
eds
on E
CR
Low
er tr
avel
spe
eds
on E
l Cam
ino
Rea
l (E
CR
)
Add
ition
al th
roug
h la
nes
on E
l Cam
ino
Rea
l
Tim
ing
traffi
c si
gnal
s to
favo
r eas
t wes
t acc
ess
Add
ition
al tr
ansi
t ser
vice
alo
ng E
CR
Mor
e co
nven
ient
par
king
with
in w
alki
ng d
ista
nce
to E
CR
Mor
e la
ndsc
aped
med
ians
on
EC
R
Red
uctio
n of
veh
icle
mile
s tra
velle
d on
EC
R (r
educ
tion
in tr
affic
pas
sing
thro
ugh
Men
lo P
ark
on E
CR
)
Incr
ease
d ve
hicl
e sa
fety
on
EC
R
Wid
er s
idew
alks
on
EC
R
Red
uctio
n in
del
ay a
t sig
naliz
ed in
ters
ectio
ns o
n E
CR
Tim
ing
traffi
c si
gnal
s to
favo
r con
tinuo
us n
orth
-sou
th fl
ow o
n E
CR
Mor
e la
ndsc
apin
g al
ong
EC
R (p
rovi
ding
buf
fers
bet
wee
n pe
dest
rians
or b
icyc
lists
and
ve
hicl
es)
Mor
e bi
ke p
arki
ng c
lose
to d
ownt
own
Incl
usio
n of
bic
ycle
lane
s on
EC
R
Enh
ance
d pe
dest
rian
safe
ty a
nd c
ross
ings
on
EC
R
Cha
rt 1
6: P
refe
renc
es fo
r Pot
entia
l Cha
nges
on
El C
amin
o R
eal
5 (M
ost d
esira
ble)
4
3 (N
eutra
l) 2
1 (L
east
des
irabl
e)

El C
amin
o R
eal C
orri
dor
Stud
y
28 Tab
le 1
6: P
refe
renc
es fo
r P
oten
tial
Cha
nges
on
El C
amin
o R
eal
Perc
ent o
f Tot
al
Pote
ntia
l Im
prov
emen
t Ra
ting
Aver
age
1 Le
ast
Des
irabl
e
2 3
Neu
tral
4 5
Mos
t D
esira
ble
Num
ber
of
Resp
onde
nts
Enha
nced
ped
estr
ian
safe
ty a
nd c
ross
ings
on
ECR
4.
32
2%
1%
16%
24
%
57%
31
6
Incl
usio
n of
bic
ycle
lane
s on
EC
R
3.95
13
%
5%
10%
18
%
54%
31
6
Mor
e bi
ke p
arki
ng c
lose
to
dow
ntow
n 3.
92
5%
3%
23%
34
%
36%
31
5
Mor
e la
ndsc
apin
g al
ong
ECR
(pr
ovid
ing
buffe
rs b
etw
een
pede
stri
ans
or
bicy
clis
ts a
nd v
ehic
les)
3.
89
5%
5%
24%
27
%
39%
31
5
Tim
ing
traf
fic s
igna
ls t
o fa
vor
cont
inuo
us n
orth
-sou
th fl
ow o
n EC
R
3.87
6%
6%
24
%
24%
41
%
316
Red
uctio
n in
del
ay a
t si
gnal
ized
inte
rsec
tions
on
ECR
3.
72
3%
4%
38%
30
%
25%
31
5
Wid
er s
idew
alks
on
ECR
3.
72
6%
9%
30%
17
%
38%
31
5
Incr
ease
d ve
hicl
e sa
fety
on
ECR
3.
64
3%
6%
41%
27
%
24%
31
5
Red
uctio
n of
veh
icle
mile
s tr
avel
led
on E
CR
(re
duct
ion
in t
raffi
c pa
ssin
g th
roug
h M
enlo
Par
k on
EC
R)
3.58
6%
9%
36
%
20%
29
%
315
Mor
e la
ndsc
aped
med
ians
on
ECR
3.
21
11%
11
%
40%
21
%
17%
31
5
Mor
e co
nven
ient
par
king
with
in w
alki
ng d
ista
nce
to E
CR
3.
17
12%
12
%
38%
25
%
14%
31
6
Add
ition
al t
rans
it se
rvic
e al
ong
ECR
3.
12
9%
8%
53%
20
%
10%
31
5
Tim
ing
traf
fic s
igna
ls t
o fa
vor
east
wes
t ac
cess
3.
06
10%
16
%
43%
18
%
13%
31
5
Add
ition
al t
hrou
gh la
nes
on E
l Cam
ino
Rea
l 2.
89
23%
14
%
29%
18
%
16%
31
6
Low
er t
rave
l spe
eds
on E
l Cam
ino
Rea
l (EC
R)
2.86
22
%
8%
47%
9%
15
%
314
Hig
her
trav
el s
peed
s on
EC
R
2.31
40
%
12%
31
%
10%
7%
31
5
Mor
e co
nven
ient
on-
stre
et p
arki
ng o
n EC
R
2.06
43
%
20%
30
%
5%
3%
315

Community Survey Report Internal Draft
29
OPEN-ENDED QUESTIONS
Questions 17 through 19 asked open-ended questions and allowed respondents to identify specific concerns and problematic locations along El Camino Real. Full text of the open-ended responses can be found in Appendix C.
Q17. In your opinion, how well does El Camino Real currently serve your transportation needs?
There were a total of 235 responses to this question. Responses generally corresponded to the following categories:
• Well: El Camino Real adequately serves the respondent’s current needs
• Not well: El Camino Real does not adequately serve the respondent’s needs or desires
• Mixed: The respondent that some needs may be met, but others are not
• Other: The respondent’s opinion could not be determined from the response
In many cases, respondents also offered details about their transportation needs, and how they related to the El Camino Real Corridor. Common themes among the responses included concerns about the visual environment, future development, alternative transportation, safety, signalization, east/west crossings, and congestion, and a tendency for respondents to seek alternative routes in order to avoid the Corridor.
Most responses, 59 percent, could be categorized as “not well.” These stated outright that the Corridor failed to serve their needs or were composed entirely of complaints. Congestion and safety were the main issues cited overall by respondents who felt that their needs were not being met. Specifically, respondents were concerned that traffic and congestion made vehicular travel along El Camino Real too time-consuming or dangerous, particularly during commute times. Thus, the Corridor is not serving the needs of these respondents who would use it in order to commute.
Meanwhile, nearly half of the “not well” responses cited their needs as bicyclists, pedestrians, and transit riders as being neglected along the Corridor. Those who must travel by these modes (as well as those who would prefer to but are afraid or are unable to do so), highlighted a lack of facilities and unsafe conditions as a barrier to their use of the Corridor. Many respondents described difficulty crossing El Camino Real. This was mentioned in relation to driving, bicycling, and walking, and was attributed to the congested and dangerous intersections along the Corridor. One safety concern related specifically to children—many respondents pointed out that the Corridor was too dangerous to serve the needs of children, particularly students, who live in the area and find it challenging to travel the Corridor to reach the destinations such as schools, the Library, and the Recreation Center. Many of the responses in this category (over 25 percent) indicated that as a result of the concerns discussed above, the respondent regularly seeks alternative routes to avoid El Camino Real.
Additionally, 25 percent of responses were “mixed,” where respondents identified both needs that were and were not met, or where respondents indicated that the Corridor was “OK” but then identified an area where their needs were not being met. Concerns described in these responses

El Camino Real Corridor Study
30
were similar to those in the “not well” category. Most responses followed a similar pattern, first stating something positive about the Corridor—it is “OK” or “adequate,” is a direct route for the respondent’s travel needs, is effective during non-commute hours, is effective for car travel, is adequate for pedestrians at crosswalks—and then stating that the respondent finds it difficult during commute hours or during active times of the day, dangerous for walking or bicycling, too congested or dangerous, or that the respondent actually tends to avoid the route when possible.
About 12 percent of responses could be categorized as “well.” These stated that El Camino Real adequately served their needs and did not note any complaints about needs that were not being met. However, the responses revealed that in many cases, needs were only just being met. Characteristic responses included statements like “OK,” “just tolerable,” “barely adequately,” and similar phrases suggesting that respondents still find aspects of traveling the Corridor to be unpleasant.
Four percent of the responses were categorized as “other.” These included suggested improvements, descriptions of conditions on El Camino Real that did not indicate whether or not the respondent felt their needs were being met, and other comments. These responses can be found in Appendix C.
Q18. Specifically, what is the most important traffic/transportation/circulation issue to you on the El Camino Real Corridor in the City of Menlo Park?
There were a total of 239 responses to this question. In many cases, respondents noted more than one issue; these are also included in the following discussion. The issues identified by respondents can be divided into the following categories, and many of these sentiments mirror the priorities expressed in the earlier questions:
• Alternatives to driving: Sixty-two percent of responses identified a need for more alternatives to automobile travel along the Corridor, including improved public transportation options, bicycling, and walking, to accommodate both the needs and desires of different travelers, and the reduction of the number of cars traveling the Corridor.
• Bicycle facilities and safety: Fifty-six percent of responses included bicycle facilities and safety as important issues. Responses called for safety improvements both at crossings and along El Camino Real, with the primary improvement being the addition of bike lanes. Some responses indicated a need for separated bike lanes to ensure the safety of riders. Many responses focused specifically on the safety of students who may bicycle along or across the Corridor.
• Safety: Forty-one percent of respondents were concerned about safety along the Corridor, including bicycle, pedestrian, and student safety.
• Traffic: Thirty-two percent of responses mentioned traffic as a concern. The issue of traffic was often related to other issues, such as potential causes (such as on-street parking, poorly-timed lights, no alternatives to driving), and impacts (such as frustrated drivers behaving dangerously, safety concerns for cyclists and pedestrians, cars cutting through neighborhoods to avoid El Camino Real). Some respondents were also concerned about traffic impacts of future development in the city and along the Corridor.

Community Survey Report Internal Draft
31
• Pedestrian facilities and safety: Twenty-six percent of responses mentioned pedestrian facilities and safety. Respondents were particularly concerned with safety at pedestrian crossings, and requested improvements in pedestrian-friendliness at intersections. Requests for pedestrian improvements tended to be grouped with requests for bicycle improvements.
• Crossing El Camino Real: Nineteen percent of responses were concerned with the safety and convenience of crossing El Camino Real. Pedestrian crossings were a main concern, as were bicycle crossings. Drivers also reported frustration with long lights, blockages, and risky behavior at crossings.
• Traffic lights: Fifteen percent of respondents brought up traffic lights in their responses. Most often, the context involved the timing of the lights—many respondents felt that the lights are currently poorly timed, and that changing the timing could improve traffic flow along the Corridor. Many considered their experiences with waiting at individual traffic lights through multiple signal cycles as an indicator of poor traffic performance on the street. Some discussed unsafe driving behaviors at lights, as well as the need to improve signals and safety for cyclists and pedestrians at intersections.
• Vehicle lanes: Eleven percent of responses to this question mentioned vehicle travel lanes as an important issue. Regarding the number of lanes desired on El Camino Real, there were both responses suggesting that traffic is too great for existing lanes or that additional lanes are needed, and that there should not be any additional lanes or that existing lanes could be eliminated (Question 10 specifically asked participants whether or not they considered additional lanes desirable; responses were more likely to indicate undesirability though the most common response category was “neutral”). Respondents also identified the points where three lanes merge into two as problem areas responsible for bottlenecks. There were also some mentions of unsafe or problematic behavior at specific turn lanes along the Corridor that contribute to traffic and safety concerns.
• Parking: Five percent of respondents mentioned parking as an issue. These respondents indicated that parking along El Camino Real may contribute to traffic and safety problems, either by causing bottlenecks or by endangering cyclists or pedestrians. Some had suggestions for improving or removing parking along the Corridor.
• East-west connections: Five percent of responses specifically mentioned El Camino Real as a barrier when traveling between the eastern and western portions of the city.
• Less common themes:
− Transit: Three percent of responses specifically mentioned a need for more public transit options.
− Student Safety: Three percent of responses focused on improving safety and accessibility for students and children to walk and bike along and across El Camino Real.
− Overpass/Underpass: Three percent of responses requested the construction of an overpass or underpass to facilitate crossings on El Camino Real.
− Streetscaping: Two percent of responses emphasized the need to improve the appearance of El Camino Real, requesting plantings, landscaping, and multi-modal design.

El Camino Real Corridor Study
32
− Desirable uses: One percent responses suggested that the Corridor could be improved by adding more retail businesses or restaurants, markets, and housing.
− Other: There were six other issues highlighted in responses, which include minimizing delays caused by the train and the need for more roads connecting to Middlefield.
Q19. Specifically, what intersection or portion of El Camino Real do you have concerns with traffic/transportation/circulation, if any?
There were a total of 210 responses to this question. Respondents indicated specific intersections and/or segments of El Camino Real that they felt were problematic, and many discussed their concerns with those intersections or segments.
Table 17 describes the frequency with which specific intersections were mentioned. The most frequently mentioned intersection by far was the intersection between El Camino Real and Menlo Avenue/Ravenswood Avenue, followed by Middle Avenue and Sand Hill Road.
Table 17: Intersections of Concern Intersection Number of Mentions
Menlo/Ravenswood 73
Middle 34
Sand Hill 26
Oak Grovea 21
Santa Cruz 17
Cambridge 14
Valparaiso/Glenwood 10
Encinal 7
Roble 5
Creek 5
Live Oak 3
Partridge 3 Notes:
a. One of these mentions is ambiguous; it was written as “[O…],” and assumed to refer to Oak Grove.
Many respondents also described concerns that they had with specific intersections.
• Encinal: Respondents were mainly concerned with crossing El Camino Real.
• Valparaiso/Glenwood: Some respondents were concerned with the crossing, some were concerned with turns off El Camino Real.
• Oak Grove: Concerns included vehicles running red lights, and safety of pedestrians and cyclists trying to cross El Camino Real.

Community Survey Report Internal Draft
33
• Santa Cruz: Concerns included unsafe pedestrian crossings, signal timing, and vehicles running red lights.
• Menlo/Ravenswood: Respondents cited a range of concerns including poor bicycle and pedestrian safety; large amounts of traffic, congestion, and conflict between different modes due to the popularity of destinations in the vicinity; turning; and signal timing.
• Roble: The only specific concern for Roble was cars blocking cross-traffic at the intersection.
• Middle: Concerns included congestion, particularly congestion related to the Safeway and gas station, and the unsafe and inconvenient crossing for pedestrians and cyclists.
• Cambridge: Concerns included U-turns and pedestrian crossings.
• Creek: The only specific concern noted for Creek Drive is that the bridge is too narrow for pedestrians.
• Sand Hill: Concerns included signal timing and vehicles running red lights.
Live Oak Avenue and Partridge Avenue are counted here based on responses that indicated “all intersections” in the Study Area, and have no specific concerns associated with them. The general concerns discussed in these responses are related to safety or, specifically, bicycle safety.
Table 18 describes the frequency that intersections were mentioned as part of problematic segments of the Corridor. Segments of concern included intersections throughout the Study Area. The frequency of inclusion peaks at Menlo Avenue/Ravenswood Avenue, and generally decreases towards the northern and southern boundaries of the Study Area. Many respondents described segments using landmarks such as the Caltrain station, the Stanford Shopping Center, and Palo Alto; these were associated with the nearest intersection and included in the analysis.

El Camino Real Corridor Study
34
Table 18: Intersections in Segments of Concern Intersectiona Number of Mentions
Encinal 10
Valparaiso/Glenwood 29
Oak Grove 34
Santa Cruz 44
Menlo/Ravenswoodb 50
Live Oakb 43
Robleb 41
Middleb 44
Partridgeb 34
Cambridgeb 33
Creekb 32
Sand Hillb 30 Notes:
a. Intersections are listed from north to south.
b. One response described a segment from the Stanford Shopping Center to “Ringwood,” which was assumed for this analysis to include intersections from Ravenwood to Sand Hill Road.
Descriptions of respondents’ concerns about these segments were focused mainly on congestion or bicycle safety. The areas mentioned most frequently, such as Menlo/Ravenswood, may be considered the most congested and most challenging for cyclists.
4. Summary of Key Issues
TRANSPORTATION NEEDS
Most respondents use multiple forms of transportation along El Camino Real—mainly a combination of driving, bicycling, and walking. They mostly travel the Corridor to access shopping and local businesses, and half of respondents use it to commute to work. Most of the survey respondents reported using the Menlo Park Caltrain Station. These Caltrain users tend to favor bicycling or walking to the station.
Respondents desire multi-modal improvements along the Corridor regardless of which modes they currently use most. The majority agreed that if pedestrian and bicycling improvements were made, they would prefer to take advantage of those transportation options rather than drive.
There may need to be a closer examination of public transit needs along the corridor. The sample of transit riders responding to the survey was too small to draw supportable generalizations. However, survey responses suggest that frequent transit riders—unlike frequent users of other transportation modes—are less willing or less able to drive as an alternative to transit, meaning that this group may have a greater need for non-automotive transportation options. Additionally,

Community Survey Report Internal Draft
35
there were some open-ended responses from non-transit users that showed interest in improving public transportation along the corridor.
TRAFFIC
Traffic was a prevalent concern throughout responses to the open-ended questions. Respondents connected traffic conditions with a number of the Corridor’s safety issues as frustrated drivers participate in risky behavior, such as running red lights, cutting through adjacent neighborhoods, and speeding. In discussing potential improvements to vehicle traffic, most respondents did not feel that vehicle capacity was a problem in the Corridor, and additional vehicle lanes on El Camino Real were not considered a desirable improvement. Respondents’ explanations for traffic causes focused on bottlenecks at specific intersections or along specific segments of the Corridor due to signal timing and lane design. Problematic intersections tended to be those adjacent to major destinations (such as Menlo/Ravenswood) or which serve as connections for regional traffic (such as Sand Hill). Signalization changes were a desired improvement. According to the responses to the open-ended questions, important considerations for signal timing include crossing signals for pedestrians and cyclists and ensuring that signals facilitate east-west movement as well as north-south flow.
SAFETY
Safety in the Corridor was a major concern, particularly for those traveling by bicycle or on foot. Pedestrian safety and crossing improvements, bike lanes, bike parking, and landscaped buffers for pedestrians and cyclists were among the most desired improvements. Additionally, though travel by vehicle was considered the safest way to travel El Camino Real, vehicle safety improvements were still considered desirable. Open-ended responses indicated that vehicle safety may need to address driving behavior such as speeding, opportunistic use of turn lanes for passing purposes, running red lights, U-turns, and stopping in the intersection during red lights.
Student safety and the safety of children using El Camino Real was a priority for respondents, regardless of whether or not respondents have children who need to cross El Camino Real for school. Nineteen percent of respondents have children who need to make this crossing, though responses to open-ended questions suggested that there were additional respondents who are uncomfortable with letting their children travel El Camino Real alone and use alternate means of getting them to school. Student safety concerns include traveling by foot and by bicycle, particularly at crossings.

El Camino Real Corridor Study
36
This page intentionally left blank.

Appendix A El Camino Real SurveyMonkey Transportation Survey

El Camino Real Corridor Study
A-ii
This page intentionally left blank.

Page 1
El Camino Real Transportation SurveyEl Camino Real Transportation SurveyEl Camino Real Transportation SurveyEl Camino Real Transportation Survey
The survey includes 19 questions and is estimated to take no more than 10 minutes to fill out. Thank you for your time!
1. Indicate the condition which applies to the location of your residence. (Select one)
2. Indicate the condition which applies to the location of your work. (Select one)
3. Do you drive a vehicle on El Camino Real? (Select one)
4. Do you ride a bike on or across El Camino Real? (Select one)
5. Do you use local bus transit services that travel on El Camino Real? (Select one)
*
*
*
*
*
I live in Menlo Park within a half mile (45 blocks) of the El Camino Real Corridor.
nmlkj
I live in Menlo Park, but farther than a half mile of the El Camino Real Corridor
nmlkj
I don’t live in Menlo Park, but I do live within a half mile (45 blocks) of the El Camino Real Corridor.
nmlkj
None of the above.
nmlkj
I work in Menlo Park within a half mile (45 blocks) of the El Camino Real Corridor.
nmlkj
I work in Menlo Park, but farther than a half mile of the El Camino Real Corridor
nmlkj
I don’t work in Menlo Park, but I do work within a half mile (45 blocks) of the El Camino Real Corridor.
nmlkj
None of the above
nmlkj
Multiple times per day
nmlkj
Approximately once per day
nmlkj
A few times a week
nmlkj
Almost never
nmlkj
On a daily basis
nmlkj
Several times per week
nmlkj
Mostly on weekends
nmlkj
Almost never
nmlkj
On a daily basis
nmlkj
Several times per week
nmlkj
Mostly on weekends
nmlkj
Almost never
nmlkj

Page 2
El Camino Real Transportation SurveyEl Camino Real Transportation SurveyEl Camino Real Transportation SurveyEl Camino Real Transportation Survey6. Do you walk along or across El Camino Real? (Select one)
7. Do you have a child that has to cross El Camino Real to get to school? (Select one)
8. Please indicate the most common condition which applies to your use of the Menlo Park Caltrain station. (Select one)
9. Why do you typically travel on El Camino Real? (Select all that apply)
*
*
*
*
On a daily basis
nmlkj
Several times per week
nmlkj
Mostly on weekends
nmlkj
Almost never
nmlkj
Yes
nmlkj
No
nmlkj
I walk to Caltrain
nmlkj
I ride my bike to Caltrain
nmlkj
I am dropped off by another vehicle or transit at Caltrain
nmlkj
I drive and park at Caltrain
nmlkj
I rarely use Caltrain
nmlkj
Travel to and/or from work
gfedc
Travel to and/or from school
gfedc
Travel for shopping
gfedc
Patronizing local businesses
gfedc
For physical activity
gfedc
Other (please specify)

Page 3
El Camino Real Transportation SurveyEl Camino Real Transportation SurveyEl Camino Real Transportation SurveyEl Camino Real Transportation Survey10. Please score each of the following items that you would like to see on El Camino
Real from 1 (least desirable) to 5 (most desirable).*
1 Least desirable 2 3 Neutral 4 5 Most desirable
Lower travel speeds on El Camino Real (ECR)
nmlkj nmlkj nmlkj nmlkj nmlkj
Higher travel speeds on ECR
nmlkj nmlkj nmlkj nmlkj nmlkj
More convenient onstreet parking on ECR
nmlkj nmlkj nmlkj nmlkj nmlkj
More convenient parking within walking distance to ECR
nmlkj nmlkj nmlkj nmlkj nmlkj
More bike parking close to downtown
nmlkj nmlkj nmlkj nmlkj nmlkj
Inclusion of bicycle lanes on ECR
nmlkj nmlkj nmlkj nmlkj nmlkj
Enhanced pedestrian safety and crossings on ECR
nmlkj nmlkj nmlkj nmlkj nmlkj
Wider sidewalks on ECR nmlkj nmlkj nmlkj nmlkj nmlkj
Additional through lanes on El Camino Real
nmlkj nmlkj nmlkj nmlkj nmlkj
Increased vehicle safety on ECR
nmlkj nmlkj nmlkj nmlkj nmlkj
Additional transit service along ECR
nmlkj nmlkj nmlkj nmlkj nmlkj
Timing traffic signals to favor continuous northsouth flow on ECR
nmlkj nmlkj nmlkj nmlkj nmlkj
Timing traffic signals to favor east west access
nmlkj nmlkj nmlkj nmlkj nmlkj
Reduction of vehicle miles travelled on ECR (reduction in traffic passing through Menlo Park on ECR)
nmlkj nmlkj nmlkj nmlkj nmlkj
Reduction in delay at signalized intersections on ECR
nmlkj nmlkj nmlkj nmlkj nmlkj
More landscaped medians on ECR
nmlkj nmlkj nmlkj nmlkj nmlkj
More landscaping along ECR (providing buffers between pedestrians or bicyclists and vehicles)
nmlkj nmlkj nmlkj nmlkj nmlkj

Page 4
El Camino Real Transportation SurveyEl Camino Real Transportation SurveyEl Camino Real Transportation SurveyEl Camino Real Transportation Survey
Instructions for Questions 1116: The following generalized statements were made at the project’s first community workshop on April 30, 2014, each representing an opinion of an individual attending the meeting. Please indicate your opinion on each of these statements using 1 (strongly disagree), 2 (somewhat disagree), 3 (neutral/no opinion), 4 (somewhat agree) or 5 (strongly agree) for each item. The City will evaluate which statements represent options most supported by the community before identifying feasible improvements to the El Camino corridor in the coming stages of the study.
11. General Safety and Environmental Concerns
12. Walking Environment
Strongly disagree Somewhat disagree Neutral/No opinion Somewhat agree Strongly agree
ECR is only safe if you are in a vehicle.
nmlkj nmlkj nmlkj nmlkj nmlkj
Ensuring that children can safely cross ECR to get to and from school should be a high priority.
nmlkj nmlkj nmlkj nmlkj nmlkj
Mitigating poor air quality from vehicle traffic/congestion should be a high priority.
nmlkj nmlkj nmlkj nmlkj nmlkj
Signage (for cross streets, turns) is not clear enough and needs to be improved.
nmlkj nmlkj nmlkj nmlkj nmlkj
Strongly disagree Somewhat disagree Neutral/no opinion Somewhat agree Strongly agree
Signals are long enough to allow people to walk across ECR safely.
nmlkj nmlkj nmlkj nmlkj nmlkj
Vehicle speeds should be slower to make the road safer for people walking.
nmlkj nmlkj nmlkj nmlkj nmlkj
Bicycles on the sidewalks are a threat to pedestrian safety.
nmlkj nmlkj nmlkj nmlkj nmlkj
A parallel pedestrian path/trail should be provided, separated from the main roadway, possibly adjacent to the railroad tracks.
nmlkj nmlkj nmlkj nmlkj nmlkj
If conditions for pedestrians on and across ECR were improved, I would walk rather than drive a car for some short trips and errands.
nmlkj nmlkj nmlkj nmlkj nmlkj

Page 5
El Camino Real Transportation SurveyEl Camino Real Transportation SurveyEl Camino Real Transportation SurveyEl Camino Real Transportation Survey13. Transit
14. Vehicle Traffic Environment
Strongly disagree Somewhat disagree Neutral/No opinion Somewhat agree Strongly agree
Dedicated bus/BRT (Bus Rapid Transit) lanes on ECR should be accommodated through Menlo Park.
nmlkj nmlkj nmlkj nmlkj nmlkj
Strongly disagree Somewhat disagree Neutral/No opinion Somewhat agree Strongly agree
Improving the flow of traffic for automobiles should be the highest priority for ECR.
nmlkj nmlkj nmlkj nmlkj nmlkj
There is enough capacity for automobiles right now; improvements should focus on other modes of travel (bicycles, pedestrians, transit)
nmlkj nmlkj nmlkj nmlkj nmlkj
Lanes should be made wider in order to better accommodate large trucks and delivery vehicles.
nmlkj nmlkj nmlkj nmlkj nmlkj
Solutions for ECR should attempt to separate regional through traffic from local traffic.
nmlkj nmlkj nmlkj nmlkj nmlkj
Regional through traffic should be prioritized on ECR; short local trips should be routed along other roads through the community.
nmlkj nmlkj nmlkj nmlkj nmlkj
Controlling “spillover” traffic in the neighborhoods adjacent to ECR should be a high priority.
nmlkj nmlkj nmlkj nmlkj nmlkj

Page 6
El Camino Real Transportation SurveyEl Camino Real Transportation SurveyEl Camino Real Transportation SurveyEl Camino Real Transportation Survey15. Bicycling Environment
16. Parking Environment
Strongly disagree Somewhat disagree Neutral/No opinion Somewhat agree Strongly agree
ECR is not safe or convenient to cross by bicycle.
nmlkj nmlkj nmlkj nmlkj nmlkj
Continuous bike lanes should be provided on ECR in both directions, because it is the most direct way for bicyclists to travel within and through Menlo Park.
nmlkj nmlkj nmlkj nmlkj nmlkj
If bicycle lanes are provided, they should be separated from vehicle traffic by a physical barrier to enhance safety.
nmlkj nmlkj nmlkj nmlkj nmlkj
Bicycles are best accommodated on adjacent parallel routes, not on ECR.
nmlkj nmlkj nmlkj nmlkj nmlkj
Currently, routes parallel to ECR are too discontinuous or conflicted for effective bike travel.
nmlkj nmlkj nmlkj nmlkj nmlkj
If conditions for bicyclists on and across ECR were improved, I would consider bicycling rather than driving for some short trips and errands.
nmlkj nmlkj nmlkj nmlkj nmlkj
Strongly disagree Somewhat disagree Neutral/No opinion Somewhat agree Strongly agree
Street parking on ECR is essential for the convenience of customers of small businesses located there.
nmlkj nmlkj nmlkj nmlkj nmlkj
Parking on ECR should be eliminated to free up more space for vehicle travel.
nmlkj nmlkj nmlkj nmlkj nmlkj
Parking on ECR should be eliminated to free up more space for bicycle lanes.
nmlkj nmlkj nmlkj nmlkj nmlkj
Any parking that is removed from ECR should be replaced with parking lots or garages off the roadway, nearby.
nmlkj nmlkj nmlkj nmlkj nmlkj

Page 7
El Camino Real Transportation SurveyEl Camino Real Transportation SurveyEl Camino Real Transportation SurveyEl Camino Real Transportation Survey
17. In your opinion, how well does El Camino Real currently serve your transportation needs?
18. Specifically, what is the most important traffic/transportation/circulation issue to you on the El Camino Real corridor in the City of Menlo Park?
19. Specifically, what intersection or portion of El Camino Real do you have concerns with traffic/transportation/circulation, if any?
55
66
55
66
55
66

El Camino Real Corridor Study
A-8
This page intentionally left blank

Appendix B El Camino Real Transportation Survey Responses

El Camino Real Corridor Study
B-ii
This page intentionally left blank.

Community Survey Report Appendix B: Transportation Survey Responses
B-1
SUMMARY TABLES (QUESTIONS 1-16)
1. Indicate the condition which applies to the location of your residence. (Select one)
Answer Options Response Percent Response Count
I live in Menlo Park within a half mile (4-5 blocks) of the El Camino Real Corridor. 46.5% 147
I live in Menlo Park, but farther than a half mile of the El Camino Real Corridor 32.3% 102
I don’t live in Menlo Park, but I do live within a half mile (4-5 blocks) of the El Camino Real Corridor. 13.0% 41
None of the above. 8.2% 26
answered question 316 skipped question 0
2. Indicate the condition which applies to the location of your work. (Select one)
Answer Options Response Percent Response Count
I work in Menlo Park within a half mile (4-5 blocks) of the El Camino Real Corridor. 17.7% 56
I work in Menlo Park, but farther than a half mile of the El Camino Real Corridor 14.9% 47
I don’t work in Menlo Park, but I do work within a half mile (4-5 blocks) of the El Camino Real Corridor. 24.1% 76
None of the above 43.4% 137
answered question 316 skipped question 0
3. Do you drive a vehicle on El Camino Real? (Select one)
Answer Options Response Percent Response Count
Multiple times per day 33.5% 106
Approximately once per day 14.2% 45
A few times a week 36.1% 114
Almost never 16.1% 51
answered question 316 skipped question 0

El Camino Real Corridor Study
B-2
4. Do you ride a bike on or across El Camino Real? (Select one)
Answer Options Response Percent Response Count
On a daily basis 19.3% 61
Several times per week 22.2% 70
Mostly on weekends 19.0% 60
Almost never 39.6% 125
answered question 316 skipped question 0
5. Do you use local bus transit services that travel on El Camino Real? (Select one)
Answer Options Response Percent Response Count
On a daily basis 0.6% 2
Several times per week 3.8% 12
Mostly on weekends 1.3% 4
Almost never 94.3% 298
answered question 316 skipped question 0
6. Do you walk along or across El Camino Real? (Select one)
Answer Options Response Percent Response Count
On a daily basis 9.8% 31
Several times per week 25.4% 80
Mostly on weekends 26.3% 83
Almost never 38.4% 121
answered question 315 skipped question 1
7. Do you have a child that has to cross El Camino Real to get to school? (Select one)
Answer Options Response Percent Response Count
Yes 19.0% 60
No 81.0% 255
answered question 315 skipped question 1

Community Survey Report Appendix B: Transportation Survey Responses
B-3
8. Please indicate the most common condition which applies to your use of the Menlo Park Caltrain station. (Select one)
Answer Options Response Percent Response Count
I walk to Caltrain 19.4% 61
I ride my bike to Caltrain 21.0% 66
I am dropped off by another vehicle or transit at Caltrain 4.1% 13
I drive and park at Caltrain 12.4% 39
I rarely use Caltrain 43.2% 136
answered question 315 skipped question 1
9. Why do you typically travel on El Camino Real? (Select all that apply)
Answer Options Response Percent Response Count
Travel to and/or from work 50.5% 159
Travel to and/or from school 19.0% 60
Travel for shopping 76.2% 240
Patronizing local businesses 68.6% 216
For physical activity 17.5% 55
Other (please specify) 36
answered question 315 skipped question 1

El Camino Real Corridor Study
B-4
10. Please score each of the following items that you would like to see on El Camino Real from 1 (least desirable) to 5 (most desirable).
Answer Options 1
Least desirable
2 3
Neutral 4
5 Most
desirable
Rating Average
Response Count
Lower travel speeds on El Camino Real (ECR)
69 25 147 27 46 2.86 314
Higher travel speeds on ECR 127 37 99 31 21 2.31 315 More convenient on-street parking on ECR 134 63 93 16 9 2.06 315
More convenient parking within walking distance to ECR
37 37 120 79 43 3.17 316
More bike parking close to downtown 16 9 72 106 112 3.92 315
Inclusion of bicycle lanes on ECR 40 16 33 57 170 3.95 316
Enhanced pedestrian safety and crossings on ECR 6 4 51 77 178 4.32 316
Wider sidewalks on ECR 18 28 96 54 119 3.72 315 Additional through lanes on El Camino Real 73 45 92 57 49 2.89 316
Increased vehicle safety on ECR 8 18 129 84 76 3.64 315
Additional transit service along ECR 29 26 168 62 30 3.12 315
Timing traffic signals to favor continuous north-south flow on ECR
18 20 75 75 128 3.87 316
Timing traffic signals to favor east west access 33 51 134 57 40 3.06 315
Reduction of vehicle miles travelled on ECR (reduction in traffic passing through Menlo Park on ECR)
19 28 112 64 92 3.58 315
Reduction in delay at signalized intersections on ECR
8 12 119 96 80 3.72 315
More landscaped medians on ECR 36 34 125 67 53 3.21 315
More landscaping along ECR (providing buffers between pedestrians or bicyclists and vehicles)
16 17 75 85 122 3.89 315
answered question 316 skipped question 0

Community Survey Report Appendix B: Transportation Survey Responses
B-5
11. General Safety and Environmental Concerns
Answer Options Strongly disagree
Somewhat
disagree
Neutral/No
opinion
Somewhat
agree
Strongly agree
Rating Average
Response Count
ECR is only safe if you are in a vehicle.
15 47 22 123 88 3.75 295
Ensuring that children can safely cross ECR to get to and from school should be a high priority.
2 11 32 85 164 4.35 294
Mitigating poor air quality from vehicle traffic/congestion should be a high priority.
15 25 74 85 95 3.75 294
Signage (for cross streets, turns) is not clear enough and needs to be improved.
22 60 136 52 23 2.98 293
answered question 295 skipped question 21
12. Walking Environment
Answer Options Strongly disagree
Somewhat
disagree
Neutral/no opinion
Somewhat
agree
Strongly agree
Rating Average
Response Count
Signals are long enough to allow people to walk across ECR safely.
13 55 45 120 57 3.53 290
Vehicle speeds should be slower to make the road safer for people walking.
30 66 100 58 37 3.02 291
Bicycles on the sidewalks are a threat to pedestrian safety. 22 41 45 106 77 3.60 291
A parallel pedestrian path/trail should be provided, separated from the main roadway, possibly adjacent to the railroad tracks.
12 19 58 71 131 4.00 291
If conditions for pedestrians on and across ECR were improved, I would walk rather than drive a car for some short trips and errands.
19 38 58 64 111 3.72 290
answered question 292 skipped question 24

El Camino Real Corridor Study
B-6
13. Transit
Answer Options Strongly disagree
Somewhat
disagree
Neutral/No
opinion
Somewhat
agree
Strongly agree
Rating Average
Response Count
Dedicated bus/BRT (Bus Rapid Transit) lanes on ECR should be accommodated through Menlo Park.
60 55 112 34 28 2.71 289
answered question 289 skipped question 27
14. Vehicle Traffic Environment
Answer Options Strongly disagree
Somewhat
disagree
Neutral/No
opinion
Somewhat
agree
Strongly agree
Rating Average
Response Count
Improving the flow of traffic for automobiles should be the highest priority for ECR.
73 59 48 69 39 2.80 288
There is enough capacity for automobiles right now; improvements should focus on other modes of travel (bicycles, pedestrians, transit)
34 42 25 61 127 3.71 289
Lanes should be made wider in order to better accommodate large trucks and delivery vehicles.
111 89 71 16 3 2.00 290
Solutions for ECR should attempt to separate regional through traffic from local traffic.
25 59 100 57 47 3.15 288
Regional through traffic should be prioritized on ECR; short local trips should be routed along other roads through the community.
101 75 80 23 10 2.19 289
Controlling “spillover” traffic in the neighborhoods adjacent to ECR should be a high priority.
17 48 83 61 79 3.48 288
answered question 290 skipped question 26

Community Survey Report Appendix B: Transportation Survey Responses
B-7
15. Bicycling Environment
Answer Options Strongly disagree
Somewhat
disagree
Neutral/No
opinion
Somewhat
agree
Strongly agree
Rating Average
Response Count
ECR is not safe or convenient to cross by bicycle.
18 39 35 95 104 3.78 291
Continuous bike lanes should be provided on ECR in both directions, because it is the most direct way for bicyclists to travel within and through Menlo Park.
30 26 40 68 125 3.80 289
If bicycle lanes are provided, they should be separated from vehicle traffic by a physical barrier to enhance safety.
20 28 54 74 115 3.81 291
Bicycles are best accommodated on adjacent parallel routes, not on ECR.
41 44 48 66 92 3.43 291
Currently, routes parallel to ECR are too discontinuous or conflicted for effective bike travel.
7 10 30 78 162 4.32 287
If conditions for bicyclists on and across ECR were improved, I would consider bicycling rather than driving for some short trips and errands.
24 18 35 47 166 4.08 290
answered question 292 skipped question 24

El Camino Real Corridor Study
B-8
16. Parking Environment
Answer Options Strongly disagree
Somewhat
disagree
Neutral/No
opinion
Somewhat
agree
Strongly agree
Rating Average
Response Count
Street parking on ECR is essential for the convenience of customers of small businesses located there.
77 85 69 36 21 2.44 288
Parking on ECR should be eliminated to free up more space for vehicle travel.
47 37 74 75 56 3.19 289
Parking on ECR should be eliminated to free up more space for bicycle lanes.
34 21 45 74 114 3.74 288
Any parking that is removed from ECR should be replaced with parking lots or garages off the roadway, nearby.
14 23 69 106 77 3.72 289
answered question 290 skipped question 26

Community Survey Report Appendix B: Transportation Survey Responses
B-9
APPENDIX B: CROSS-TABULATIONS – QUESTION 1
1. Indicate the condition which applies to the location of your residence. (Select one)
Answer Options
I live in Menlo Park within a half mile (4-5 blocks) of the
El Camino Real Corridor.
I live in Menlo Park, but farther than a half mile
of the El Camino Real
Corridor
I don’t live in Menlo Park, but I do live within a half
mile (4-5 blocks) of the
El Camino Real Corridor.
None of the above.
Response Percent
Response Count
I live in Menlo Park within a half mile (4-5 blocks) of the El Camino Real Corridor.
147 0 0 0 46.5% 147
I live in Menlo Park, but farther than a half mile of the El Camino Real Corridor
0 102 0 0 32.3% 102
I don’t live in Menlo Park, but I do live within a half mile (4-5 blocks) of the El Camino Real Corridor.
0 0 41 0 13.0% 41
None of the above. 0 0 0 26 8.2% 26
answered question 316 skipped question 0
2. Indicate the condition which applies to the location of your work. (Select one)
Answer Options
I live in Menlo Park within a half mile (4-5 blocks) of the
El Camino Real Corridor.
I live in Menlo Park, but farther than a half mile
of the El Camino Real
Corridor
I don’t live in Menlo Park, but I do live within a half
mile (4-5 blocks) of the
El Camino Real Corridor.
None of the above.
Response Percent
Response Count
I work in Menlo Park within a half mile (4-5 blocks) of the El Camino Real Corridor.
38 8 5 5 17.7% 56
I work in Menlo Park, but farther than a half mile of the El Camino Real Corridor
16 25 4 2 14.9% 47
I don’t work in Menlo Park, but I do work within a half mile (4-5 blocks) of the El Camino Real Corridor.
28 14 23 11 24.1% 76
None of the above 65 55 9 8 43.4% 137
answered question 316 skipped question 0

El Camino Real Corridor Study
B-10
3. Do you drive a vehicle on El Camino Real? (Select one)
Answer Options
I live in Menlo Park within a half mile (4-5 blocks) of the
El Camino Real Corridor.
I live in Menlo Park, but farther than a half mile
of the El Camino Real
Corridor
I don’t live in Menlo Park, but I do live within a half
mile (4-5 blocks) of the
El Camino Real Corridor.
None of the above.
Response Percent
Response Count
Multiple times per day 63 35 7 1 33.5% 106 Approximately once per day 25 16 4 0 14.2% 45
A few times a week 51 38 15 10 36.1% 114
Almost never 8 13 15 15 16.1% 51
answered question 316 skipped question 0
4. Do you ride a bike on or across El Camino Real? (Select one)
Answer Options
I live in Menlo Park within a half mile (4-5 blocks) of the
El Camino Real Corridor.
I live in Menlo Park, but farther than a half mile
of the El Camino Real
Corridor
I don’t live in Menlo Park, but I do live within a half
mile (4-5 blocks) of the
El Camino Real Corridor.
None of the above.
Response Percent
Response Count
On a daily basis 23 13 15 10 19.3% 61
Several times per week 29 23 9 9 22.2% 70
Mostly on weekends 33 16 8 3 19.0% 60
Almost never 62 50 9 4 39.6% 125
answered question 316 skipped question 0

Community Survey Report Appendix B: Transportation Survey Responses
B-11
5. Do you use local bus transit services that travel on El Camino Real? (Select one)
Answer Options
I live in Menlo Park within a half mile (4-5 blocks) of the
El Camino Real Corridor.
I live in Menlo Park, but farther than a half mile
of the El Camino Real
Corridor
I don’t live in Menlo Park, but I do live within a half
mile (4-5 blocks) of the
El Camino Real Corridor.
None of the above.
Response Percent
Response Count
On a daily basis 0 2 0 0 0.6% 2 Several times per week 4 0 7 1 3.8% 12
Mostly on weekends 2 0 2 0 1.3% 4
Almost never 141 100 32 25 94.3% 298
answered question 316 skipped question 0
6. Do you walk along or across El Camino Real? (Select one)
Answer Options
I live in Menlo Park within a half mile (4-5 blocks) of the
El Camino Real Corridor.
I live in Menlo Park, but farther than a half mile
of the El Camino Real
Corridor
I don’t live in Menlo Park, but I do live within a half
mile (4-5 blocks) of the
El Camino Real Corridor.
None of the above.
Response Percent
Response Count
On a daily basis 26 1 4 0 9.8% 31 Several times per week 51 14 8 7 25.4% 80
Mostly on weekends 37 25 15 6 26.3% 83
Almost never 32 62 14 13 38.4% 121
answered question 315 skipped question 1
7. Do you have a child that has to cross El Camino Real to get to school? (Select one)
Answer Options
I live in Menlo Park within a half mile (4-5 blocks) of the
El Camino Real Corridor.
I live in Menlo Park, but farther than a half mile
of the El Camino Real
Corridor
I don’t live in Menlo Park, but I do live within a half
mile (4-5 blocks) of the
El Camino Real Corridor.
None of the above.
Response Percent
Response Count
Yes 32 23 4 1 19.0% 60
No 114 79 37 25 81.0% 255
answered question 315 skipped question 1

El Camino Real Corridor Study
B-12
8. Please indicate the most common condition which applies to your use of the Menlo Park Caltrain station. (Select one)
Answer Options
I live in Menlo Park within a half mile (4-5 blocks) of the
El Camino Real Corridor.
I live in Menlo Park, but farther than a half mile
of the El Camino Real
Corridor
I don’t live in Menlo Park, but I do live within a half
mile (4-5 blocks) of the
El Camino Real Corridor.
None of the above.
Response Percent
Response Count
I walk to Caltrain 51 7 2 1 19.4% 61 I ride my bike to Caltrain 17 15 20 14 21.0% 66
I am dropped off by another vehicle or transit at Caltrain
5 6 1 1 4.1% 13
I drive and park at Caltrain 17 17 3 2 12.4% 39
I rarely use Caltrain 56 57 15 8 43.2% 136
answered question 315 skipped question 1
9. Why do you typically travel on El Camino Real? (Select all that apply)
Answer Options
I live in Menlo Park within a half mile (4-5 blocks) of the
El Camino Real Corridor.
I live in Menlo Park, but farther than a half mile
of the El Camino Real
Corridor
I don’t live in Menlo Park, but I do live within a half
mile (4-5 blocks) of the
El Camino Real Corridor.
None of the above.
Response Percent
Response Count
Travel to and/or from work 75 39 25 20 50.5% 159
Travel to and/or from school 27 24 8 1 19.0% 60
Travel for shopping 119 82 27 12 76.2% 240 Patronizing local businesses 102 76 24 14 68.6% 216
For physical activity 39 11 2 3 17.5% 55
Other (please specify) 36
answered question 315 skipped question 1

Community Survey Report Appendix B: Transportation Survey Responses
B-13
10. Please score each of the following items that you would like to see on El Camino Real from 1 (least desirable) to 5 (most desirable).
Why do you typically travel on El Camino Real? (Select all that apply)
Answer Options Travel to
and/or from work
Travel to and/or from
school
Travel for shopping
Patronizing local
businesses
For physical activity
Rating Average
Response Count
Lower travel speeds on El Camino Real (ECR)
1 Least desirable 38 16 54 46 11
2 12 6 17 17 5
3 Neutral 72 23 112 102 29
4 13 7 23 16 4
5 Most desirable 24 7 32 33 5
2.83 2.71 2.84 2.87 2.76 2.83 313
Higher travel speeds on ECR
1 Least desirable 63 24 95 84 21
2 15 6 29 24 4
3 Neutral 49 19 74 76 20
4 19 6 24 20 5
5 Most desirable 13 5 17 11 5
2.40 2.37 2.33 2.30 2.44 2.35 314
More convenient on-street parking on ECR
1 Least desirable 68 27 102 84 17
2 28 12 45 45 12
3 Neutral 51 16 71 68 21
4 9 4 14 13 3
5 Most desirable 3 1 7 5 2
2.06 2.00 2.08 2.12 2.29 2.09 314
More convenient parking within walking distance to ECR
1 Least desirable 23 7 20 20 5
2 21 8 27 24 5
3 Neutral 59 25 93 86 23
4 36 9 64 61 15
5 Most desirable 20 11 36 25 7
3.06 3.15 3.29 3.22 3.25 3.20 315
More bike parking close to downtown
1 Least desirable 9 6 10 9 2
2 2 0 7 3 2
3 Neutral 30 14 59 48 8
4 62 17 79 74 23
5 Most desirable 56 23 84 81 20
3.97 3.85 3.92 4.00 4.04 3.96 314
Inclusion of bicycle lanes on ECR
1 Least desirable 18 6 32 21 5
2 4 4 14 13 2
3 Neutral 13 7 28 21 3
4 28 9 43 40 8
5 Most desirable 96 34 123 121 37

El Camino Real Corridor Study
B-14
10. Please score each of the following items that you would like to see on El Camino Real from 1 (least desirable) to 5 (most desirable).
Why do you typically travel on El Camino Real? (Select all that apply)
Answer Options Travel to
and/or from work
Travel to and/or from
school
Travel for shopping
Patronizing local
businesses
For physical activity
Rating Average
Response Count
4.13 4.02 3.88 4.05 4.27 4.03 315
Enhanced pedestrian safety and crossings on ECR
1 Least desirable 2 1 6 3 2
2 2 2 2 1 1
3 Neutral 25 6 38 31 5
4 46 10 60 54 11
5 Most desirable 84 41 134 127 36
4.31 4.47 4.31 4.39 4.42 4.35 315
Wider sidewalks on ECR
1 Least desirable 7 4 14 10 3
2 14 5 23 18 4
3 Neutral 46 21 73 63 15
4 28 7 38 37 6
5 Most desirable 64 23 91 87 27
3.81 3.67 3.71 3.80 3.91 3.77 314
Additional through lanes on El Camino Real
1 Least desirable 37 12 49 48 11
2 22 4 34 26 6
3 Neutral 49 16 65 63 20
4 29 15 47 45 10
5 Most desirable 22 13 45 34 8
2.86 3.22 3.02 2.96 2.96 2.98 315
Increased vehicle safety on ECR
1 Least desirable 4 0 7 4 3
2 13 2 12 9 1
3 Neutral 64 23 98 87 19
4 43 19 62 59 12
5 Most desirable 35 16 60 56 20
3.58 3.82 3.65 3.72 3.82 3.68 314
Additional transit service along ECR
1 Least desirable 14 5 21 19 3
2 18 6 21 18 3
3 Neutral 85 34 130 111 33
4 30 13 45 46 11
5 Most desirable 12 2 22 21 5
3.05 3.02 3.11 3.15 3.22 3.11 314
Timing traffic signals to favor continuous north-south flow on ECR
1 Least desirable 10 6 11 13 4
2 8 2 11 15 0
3 Neutral 37 15 55 52 15
4 36 13 61 46 10

Community Survey Report Appendix B: Transportation Survey Responses
B-15
10. Please score each of the following items that you would like to see on El Camino Real from 1 (least desirable) to 5 (most desirable).
Why do you typically travel on El Camino Real? (Select all that apply)
Answer Options Travel to
and/or from work
Travel to and/or from
school
Travel for shopping
Patronizing local
businesses
For physical activity
Rating Average
Response Count
5 Most desirable 68 24 102 90 26
3.91 3.78 3.97 3.86 3.98 3.91 315
Timing traffic signals to favor east west access
1 Least desirable 17 6 28 22 6
2 36 7 33 33 9
3 Neutral 68 23 102 91 22
4 24 13 46 40 11
5 Most desirable 14 11 30 29 7
2.89 3.27 3.07 3.10 3.07 3.05 314
Reduction of vehicle miles travelled on ECR (reduction in traffic passing through Menlo Park on ECR)
1 Least desirable 11 2 14 12 2
2 13 6 26 21 5
3 Neutral 51 26 81 75 25
4 38 12 46 40 11
5 Most desirable 46 14 72 67 12
3.60 3.50 3.57 3.60 3.47 3.57 314
Reduction in delay at signalized intersections on ECR
1 Least desirable 3 0 4 6 2
2 10 1 10 8 0
3 Neutral 59 22 88 77 23
4 50 19 72 62 15
5 Most desirable 37 18 65 62 15
3.68 3.90 3.77 3.77 3.75 3.76 314
More landscaped medians on ECR
1 Least desirable 23 8 25 24 7
2 16 6 30 25 7
3 Neutral 60 19 94 82 23
4 32 19 47 44 6
5 Most desirable 28 8 43 40 12
3.16 3.22 3.22 3.24 3.16 3.21 314
More landscaping along ECR (providing buffers between pedestrians or bicyclists and vehicles)
1 Least desirable 7 2 14 8 3
2 6 2 14 13 2
3 Neutral 36 16 56 48 14
4 42 14 66 60 13
5 Most desirable 68 26 89 86 23
3.99 4.00 3.85 3.94 3.93 3.93 314
answered question 315 skipped question 0

El Camino Real Corridor Study
B-16
11. General Safety and Environmental Concerns
Indicate the condition which applies to the location of your residence. (Select one)
Answer Options
I live in Menlo Park within a half mile (4-5 blocks) of the El Camino
Real Corridor.
I live in Menlo Park, but farther than a half mile of the El Camino
Real Corridor
I don’t live in Menlo Park, but I do live
within a half mile (4-5 blocks) of the El
Camino Real Corridor.
None of the above.
Rating Average
Response Count
ECR is only safe if you are in a vehicle.
Strongly disagree 2 9 3 1
Somewhat disagree 18 22 3 4
Neutral/No opinion 10 7 4 1
Somewhat agree 66 35 15 7
Strongly agree 41 26 10 11
3.92 3.47 3.74 3.96 3.75 295
Ensuring that children can safely cross ECR to get to and from school should be a high priority.
Strongly disagree 0 2 0 0
Somewhat disagree 5 3 2 1
Neutral/No opinion 16 9 3 4
Somewhat agree 36 31 12 6
Strongly agree 79 54 18 13
4.39 4.33 4.31 4.29 4.35 294
Mitigating poor air quality from vehicle traffic/congestion should be a high priority.
Strongly disagree 3 12 0 0
Somewhat disagree 10 11 3 1
Neutral/No opinion 32 22 13 7
Somewhat agree 35 35 9 6
Strongly agree 56 19 10 10
3.96 3.38 3.74 4.04 3.75 294
Signage (for cross streets, turns) is not clear enough and needs to be improved.
Strongly disagree 8 12 2 0
Somewhat disagree 30 17 8 5
Neutral/No opinion 64 43 18 11
Somewhat agree 23 17 5 7
Strongly agree 10 10 2 1
2.98 2.96 2.91 3.17 2.98 293
answered question 295 skipped question 21

Community Survey Report Appendix B: Transportation Survey Responses
B-17
12. Walking Environment
Indicate the condition which applies to the location of your residence. (Select one)
Answer Options
I live in Menlo Park within a half mile (4-5 blocks) of the El Camino
Real Corridor.
I live in Menlo Park, but farther than a half mile of the El Camino
Real Corridor
I don’t live in Menlo Park, but I do live
within a half mile (4-5 blocks) of the El
Camino Real Corridor.
None of the above.
Rating Average
Response Count
Signals are long enough to allow people to walk across ECR safely.
Strongly disagree 9 4 0 0
Somewhat disagree 23 17 9 6
Neutral/no opinion 17 17 6 5
Somewhat agree 62 36 13 9
Strongly agree 24 24 5 4
3.51 3.60 3.42 3.46 3.53 290
Vehicle speeds should be slower to make the road safer for people walking.
Strongly disagree 9 16 5 0
Somewhat disagree 33 25 4 4
Neutral/no opinion 47 29 12 12
Somewhat agree 28 18 7 5
Strongly agree 18 11 5 3
3.10 2.83 3.09 3.29 3.02 291
Bicycles on the sidewalks are a threat to pedestrian safety.
Strongly disagree 8 7 6 1
Somewhat disagree 21 10 6 4
Neutral/no opinion 22 18 2 3
Somewhat agree 48 38 15 5
Strongly agree 36 26 4 11
3.61 3.67 3.15 3.88 3.60 291 A parallel pedestrian path/trail should be provided, separated from the main roadway, possibly adjacent to the railroad tracks.
Strongly disagree 6 6 0 0
Somewhat disagree 6 6 4 3
Neutral/no opinion 25 22 5 6
Somewhat agree 35 24 5 7
Strongly agree 64 40 19 8
4.07 3.88 4.18 3.83 4.00 291 If conditions for pedestrians on and across ECR were improved, I would walk rather than drive a car for some short trips and errands.
Strongly disagree 8 11 0 0
Somewhat disagree 13 20 3 2
Neutral/no opinion 14 25 12 7
Somewhat agree 32 21 5 6
Strongly agree 69 21 12 9
4.04 3.21 3.81 3.92 3.72 290
answered question 292 skipped question 24

El Camino Real Corridor Study
B-18
13. Transit
Indicate the condition which applies to the location of your residence. (Select one)
Answer Options
I live in Menlo Park within a half mile (4-5 blocks) of the
El Camino Real Corridor.
I live in Menlo Park, but farther than a half mile of the El Camino
Real Corridor
I don’t live in Menlo Park, but I do live
within a half mile (4-5 blocks) of the El
Camino Real Corridor.
None of the above.
Rating Average
Response Count
Dedicated bus/BRT (Bus Rapid Transit) lanes on ECR should be accommodated through Menlo Park.
Strongly disagree 31 25 3 1
Somewhat disagree 27 22 5 1
Neutral/No opinion 56 29 13 14
Somewhat agree 15 13 3 3
Strongly agree 6 8 9 5
2.54 2.56 3.30 3.42 2.71 289
answered question 289 skipped question 27
14. Vehicle Traffic Environment
Indicate the condition which applies to the location of your residence. (Select one)
Answer Options
I live in Menlo Park within a half mile (4-5 blocks) of the
El Camino Real Corridor.
I live in Menlo Park, but farther than a half mile of the El Camino
Real Corridor
I don’t live in Menlo Park, but I do live
within a half mile (4-5 blocks) of the El
Camino Real Corridor.
None of the above.
Rating Average
Response Count
Improving the flow of traffic for automobiles should be the highest priority for ECR.
Strongly disagree 31 16 13 13
Somewhat disagree 31 19 5 4
Neutral/No opinion 19 20 7 2
Somewhat agree 35 25 5 4
Strongly agree 17 19 2 1
2.82 3.12 2.31 2.00 2.80 288 There is enough capacity for automobiles right now; improvements should focus on other modes of travel (bicycles, pedestrians, transit)
Strongly disagree 11 20 2 1
Somewhat disagree 24 14 4 0
Neutral/No opinion 10 13 1 1
Somewhat agree 36 17 2 6
Strongly agree 53 35 23 16
3.72 3.33 4.25 4.50 3.71 289
Lanes should be made wider in order to better accommodate large trucks and delivery vehicles.
Strongly disagree 57 31 15 8
Somewhat disagree 38 35 9 7
Neutral/No opinion 32 26 6 7
Somewhat agree 6 6 2 2
Strongly agree 2 1 0 0
1.95 2.10 1.84 2.13 2.00 290

Community Survey Report Appendix B: Transportation Survey Responses
B-19
14. Vehicle Traffic Environment
Indicate the condition which applies to the location of your residence. (Select one)
Answer Options
I live in Menlo Park within a half mile (4-5 blocks) of the
El Camino Real Corridor.
I live in Menlo Park, but farther than a half mile of the El Camino
Real Corridor
I don’t live in Menlo Park, but I do live
within a half mile (4-5 blocks) of the El
Camino Real Corridor.
None of the above.
Rating Average
Response Count
Solutions for ECR should attempt to separate regional through traffic from local traffic.
Strongly disagree 13 8 2 2
Somewhat disagree 22 26 7 4
Neutral/No opinion 45 28 13 14
Somewhat agree 29 20 6 2
Strongly agree 26 15 4 2
3.24 3.08 3.09 2.92 3.15 288 Regional through traffic should be prioritized on ECR; short local trips should be routed along other roads through the community.
Strongly disagree 55 35 7 4
Somewhat disagree 32 27 8 8
Neutral/No opinion 34 21 14 11
Somewhat agree 9 12 2 0
Strongly agree 5 3 1 1
2.09 2.19 2.44 2.42 2.19 289
Controlling “spillover” traffic in the neighborhoods adjacent to ECR should be a high priority.
Strongly disagree 7 6 3 1
Somewhat disagree 16 18 8 6
Neutral/No opinion 30 30 11 12
Somewhat agree 32 20 5 4
Strongly agree 49 24 5 1
3.75 3.39 3.03 2.92 3.48 288
answered question 290 skipped question 26
15. Bicycling Environment
Indicate the condition which applies to the location of your residence. (Select one)
Answer Options
I live in Menlo Park within a half mile (4-5 blocks) of the
El Camino Real Corridor.
I live in Menlo Park, but farther
than a half mile of the El Camino Real Corridor
I don’t live in Menlo Park, but I do live
within a half mile (4-5 blocks) of the El
Camino Real Corridor.
None of the above.
Rating Average
Response Count
ECR is not safe or convenient to cross by bicycle.
Strongly disagree 5 12 1 0
Somewhat disagree 14 20 3 2
Neutral/No opinion 16 12 3 4
Somewhat agree 47 27 14 7
Strongly agree 53 28 12 11
3.96 3.39 4.00 4.13 3.78 291

El Camino Real Corridor Study
B-20
15. Bicycling Environment
Indicate the condition which applies to the location of your residence. (Select one)
Answer Options
I live in Menlo Park within a half mile (4-5 blocks) of the
El Camino Real Corridor.
I live in Menlo Park, but farther
than a half mile of the El Camino Real Corridor
I don’t live in Menlo Park, but I do live
within a half mile (4-5 blocks) of the El
Camino Real Corridor.
None of the above.
Rating Average
Response Count
Continuous bike lanes should be provided on ECR in both directions, because it is the most direct way for bicyclists to travel within and through Menlo Park.
Strongly disagree 11 14 4 1
Somewhat disagree 13 13 0 0
Neutral/No opinion 22 14 3 1
Somewhat agree 24 32 5 7
Strongly agree 65 23 21 16
3.88 3.39 4.18 4.48 3.80 289
If bicycle lanes are provided, they should be separated from vehicle traffic by a physical barrier to enhance safety.
Strongly disagree 9 7 3 1
Somewhat disagree 10 14 1 3
Neutral/No opinion 21 25 2 6
Somewhat agree 35 22 9 8
Strongly agree 60 30 18 7
3.94 3.55 4.15 3.68 3.81 291
Bicycles are best accommodated on adjacent parallel routes, not on ECR.
Strongly disagree 18 7 8 8
Somewhat disagree 19 15 5 5
Neutral/No opinion 21 17 6 4
Somewhat agree 35 24 5 2
Strongly agree 42 35 9 6
3.47 3.66 3.06 2.72 3.43 291
Currently, routes parallel to ECR are too discontinuous or conflicted for effective bike travel.
Strongly disagree 2 5 0 0
Somewhat disagree 9 1 0 0
Neutral/No opinion 11 18 1 0
Somewhat agree 39 29 8 2
Strongly agree 72 45 23 22
4.28 4.10 4.69 4.92 4.32 287 If conditions for bicyclists on and across ECR were improved, I would consider bicycling rather than driving for some short trips and errands.
Strongly disagree 10 13 1 0
Somewhat disagree 5 12 0 1
Neutral/No opinion 16 12 3 4
Somewhat agree 21 22 3 1
Strongly agree 83 39 25 19
4.20 3.63 4.59 4.52 4.08 290
answered question 292 skipped question 24

Community Survey Report Appendix B: Transportation Survey Responses
B-21
16. Parking Environment
Indicate the condition which applies to the location of your residence. (Select one)
Answer Options
I live in Menlo Park within a half mile (4-5 blocks) of the El Camino
Real Corridor.
I live in Menlo Park, but farther than a half mile of the El Camino
Real Corridor
I don’t live in Menlo Park, but I do live
within a half mile (4-5 blocks) of the El
Camino Real Corridor.
None of the above.
Rating Average
Response Count
Street parking on ECR is essential for the convenience of customers of small businesses located there.
Strongly disagree 34 23 11 9
Somewhat disagree 47 24 6 8
Neutral/No opinion 26 25 12 6
Somewhat agree 19 13 3 1
Strongly agree 7 14 0 0
2.38 2.71 2.22 1.96 2.44 288
Parking on ECR should be eliminated to free up more space for vehicle travel.
Strongly disagree 19 20 5 3
Somewhat disagree 12 12 9 4
Neutral/No opinion 35 20 8 11
Somewhat agree 42 25 6 2
Strongly agree 27 21 4 4
3.34 3.15 2.84 3.00 3.19 289
Parking on ECR should be eliminated to free up more space for bicycle lanes.
Strongly disagree 14 18 1 1
Somewhat disagree 7 11 1 2
Neutral/No opinion 23 16 5 1
Somewhat agree 34 27 8 5
Strongly agree 55 27 17 15
3.82 3.34 4.22 4.29 3.74 288
Any parking that is removed from ECR should be replaced with parking lots or garages off the roadway, nearby.
Strongly disagree 7 1 4 2
Somewhat disagree 10 3 6 4
Neutral/No opinion 33 22 7 7
Somewhat agree 46 43 10 7
Strongly agree 38 30 5 4
3.73 3.99 3.19 3.29 3.72 289
answered question 290 skipped question 26

El Camino Real Corridor Study
B-22
APPENDIX B: CROSS-TABULATIONS – QUESTION 2
1. Indicate the condition which applies to the location of your residence. (Select one)
Indicate the condition which applies to the location of your work. (Select one)
Answer Options
I work in Menlo Park within a half mile (4-5
blocks) of the El Camino Real
Corridor.
I work in Menlo Park, but farther than a half mile
of the El Camino Real
Corridor
I don’t work in Menlo Park, but I do work within a half mile (4-5 blocks) of the El Camino Real
Corridor.
None of the above
Response Percent
Response Count
I live in Menlo Park within a half mile (4-5 blocks) of the El Camino Real Corridor.
38 16 28 65 46.5% 147
I live in Menlo Park, but farther than a half mile of the El Camino Real Corridor
8 25 14 55 32.3% 102
I don’t live in Menlo Park, but I do live within a half mile (4-5 blocks) of the El Camino Real Corridor.
5 4 23 9 13.0% 41
None of the above. 5 2 11 8 8.2% 26
answered question 316 skipped question 0
2. Indicate the condition which applies to the location of your work. (Select one)
Indicate the condition which applies to the location of your work. (Select one)
Answer Options
I work in Menlo Park within a half mile (4-5 blocks) of the El Camino
Real Corridor.
I work in Menlo Park, but farther than a half mile of the El Camino
Real Corridor
I don’t work in Menlo Park, but I do work
within a half mile (4-5 blocks) of the El
Camino Real Corridor.
None of the
above
Response Percent
Response Count
I work in Menlo Park within a half mile (4-5 blocks) of the El Camino Real Corridor.
56 0 0 0 17.7% 56
I work in Menlo Park, but farther than a half mile of the El Camino Real Corridor
0 47 0 0 14.9% 47
I don’t work in Menlo Park, but I do work within a half mile (4-5 blocks) of the El Camino Real Corridor.
0 0 76 0 24.1% 76
None of the above 0 0 0 137 43.4% 137
answered question 316 skipped question 0

Community Survey Report Appendix B: Transportation Survey Responses
B-23
3. Do you drive a vehicle on El Camino Real? (Select one)
Indicate the condition which applies to the location of your work. (Select one)
Answer Options
I work in Menlo Park within a half mile (4-5 blocks) of the El Camino
Real Corridor.
I work in Menlo Park, but farther than a half mile of the El Camino
Real Corridor
I don’t work in Menlo Park, but I do work
within a half mile (4-5 blocks) of the El
Camino Real Corridor.
None of the above
Response Percent
Response Count
Multiple times per day
18 18 27 43 33.5% 106
Approximately once per day 11 7 3 24 14.2% 45
A few times a week 17 18 28 51 36.1% 114
Almost never 10 4 18 19 16.1% 51
answered question 316 skipped question 0
4. Do you ride a bike on or across El Camino Real? (Select one)
Indicate the condition which applies to the location of your work. (Select one)
Answer Options
I work in Menlo Park within a half mile (4-5 blocks) of the El Camino
Real Corridor.
I work in Menlo Park, but farther than a half mile of the El Camino
Real Corridor
I don’t work in Menlo Park, but I do work
within a half mile (4-5 blocks) of the El
Camino Real Corridor.
None of the above
Response Percent
Response Count
On a daily basis 19 7 22 13 19.3% 61 Several times per week 11 13 12 34 22.2% 70
Mostly on weekends 10 10 16 24 19.0% 60
Almost never 16 17 26 66 39.6% 125
answered question 316 skipped question 0
5. Do you use local bus transit services that travel on El Camino Real? (Select one)
Indicate the condition which applies to the location of your work. (Select one)
Answer Options
I work in Menlo Park within a half mile (4-5 blocks) of the El Camino
Real Corridor.
I work in Menlo Park, but farther than a half mile of the El Camino
Real Corridor
I don’t work in Menlo Park, but I do work
within a half mile (4-5 blocks) of the El
Camino Real Corridor.
None of the above
Response Percent
Response Count
On a daily basis 0 0 1 1 0.6% 2 Several times per week 3 2 6 1 3.8% 12
Mostly on weekends 0 0 2 2 1.3% 4
Almost never 53 45 67 133 94.3% 298
answered question 316 skipped question 0

El Camino Real Corridor Study
B-24
6. Do you walk along or across El Camino Real? (Select one)
Indicate the condition which applies to the location of your work. (Select one)
Answer Options
I work in Menlo Park within a half
mile (4-5 blocks) of the El Camino Real
Corridor.
I work in Menlo Park, but farther than a half mile of the El Camino
Real Corridor
I don’t work in Menlo Park, but I do work
within a half mile (4-5 blocks) of the El
Camino Real Corridor.
None of the above
Response Percent
Response Count
On a daily basis 11 2 8 10 9.8% 31 Several times per week 21 11 19 29 25.4% 80
Mostly on weekends
11 17 27 28 26.3% 83
Almost never 13 17 22 69 38.4% 121
answered question 315 skipped question 1
7. Do you have a child that has to cross El Camino Real to get to school? (Select one)
Indicate the condition which applies to the location of your work. (Select one)
Answer Options
I work in Menlo Park within a half mile (4-5 blocks) of the El Camino
Real Corridor.
I work in Menlo Park, but farther than a half mile of the El Camino
Real Corridor
I don’t work in Menlo Park, but I do work
within a half mile (4-5 blocks) of the El
Camino Real Corridor.
None of the
above
Response Percent
Response Count
Yes 15 11 10 24 19.0% 60
No 41 36 66 112 81.0% 255
answered question 315 skipped question 1
8. Please indicate the most common condition which applies to your use of the Menlo Park Caltrain station. (Select one)
Indicate the condition which applies to the location of your work. (Select one)
Answer Options
I work in Menlo Park within a half mile (4-5 blocks) of the El Camino
Real Corridor.
I work in Menlo Park, but farther than a half mile of the El Camino
Real Corridor
I don’t work in Menlo Park, but I do work
within a half mile (4-5 blocks) of the El
Camino Real Corridor.
None of the
above
Response Percent
Response Count
I walk to Caltrain 14 7 18 22 19.4% 61 I ride my bike to Caltrain 9 8 26 23 21.0% 66
I am dropped off by another vehicle or transit at Caltrain
3 3 3 4 4.1% 13
I drive and park at Caltrain 7 9 9 14 12.4% 39
I rarely use Caltrain 23 20 20 73 43.2% 136
answered question 315 skipped question 1

Community Survey Report Appendix B: Transportation Survey Responses
B-25
9. Why do you typically travel on El Camino Real? (Select all that apply)
Indicate the condition which applies to the location of your work. (Select one)
Answer Options
I work in Menlo Park within a half mile (4-5 blocks) of the El Camino
Real Corridor.
I work in Menlo Park, but farther than a half mile of the El Camino
Real Corridor
I don’t work in Menlo Park, but I do work
within a half mile (4-5 blocks) of the El
Camino Real Corridor.
None of the
above
Response Percent
Response Count
Travel to and/or from work 35 25 60 39 50.5% 159
Travel to and/or from school 12 11 13 24 19.0% 60
Travel for shopping 44 38 50 108 76.2% 240 Patronizing local businesses 38 33 46 99 68.6% 216
For physical activity 10 11 8 26 17.5% 55
Other (please specify) 36
answered question 315 skipped question 1
10. Please score each of the following items that you would like to see on El Camino Real from 1 (least desirable) to 5 (most desirable).
Indicate the condition which applies to the location of your work. (Select one)
Answer Options
I work in Menlo Park within a half mile (4-5 blocks) of the El Camino
Real Corridor.
I work in Menlo Park, but farther than a half mile of the El Camino
Real Corridor
I don’t work in Menlo Park, but I do work
within a half mile (4-5 blocks) of the El
Camino Real Corridor.
None of the above
Rating Average
Response Count
Lower travel speeds on El Camino Real (ECR)
1 Least desirable 9 11 16 33
2 3 3 11 8
3 Neutral 19 24 39 65
4 8 2 4 13
5 Most desirable 17 7 6 16
3.38 2.81 2.64 2.79 2.86 314
Higher travel speeds on ECR
1 Least desirable 29 23 24 51
2 9 3 10 15
3 Neutral 14 11 25 49
4 2 6 13 10
5 Most desirable 2 4 4 11
1.91 2.26 2.51 2.38 2.31 315
More convenient on-street parking on ECR
1 Least desirable 22 19 30 63
2 12 10 12 29
3 Neutral 19 16 27 31
4 1 2 5 8
5 Most desirable 2 0 2 5
2.09 2.02 2.17 1.99 2.06 315

El Camino Real Corridor Study
B-26
10. Please score each of the following items that you would like to see on El Camino Real from 1 (least desirable) to 5 (most desirable).
Indicate the condition which applies to the location of your work. (Select one)
Answer Options
I work in Menlo Park within a half mile (4-5 blocks) of the El Camino
Real Corridor.
I work in Menlo Park, but farther than a half mile of the El Camino
Real Corridor
I don’t work in Menlo Park, but I do work
within a half mile (4-5 blocks) of the El
Camino Real Corridor.
None of the above
Rating Average
Response Count
More convenient parking within walking distance to ECR
1 Least desirable 6 4 12 15
2 7 3 9 18
3 Neutral 24 23 24 49
4 10 12 21 36
5 Most desirable 9 5 10 19
3.16 3.23 3.11 3.19 3.17 316
More bike parking close to downtown
1 Least desirable 1 1 3 11
2 0 4 0 5
3 Neutral 12 15 15 30
4 20 11 32 43
5 Most desirable 23 16 26 47
4.14 3.79 4.03 3.81 3.92 315
Inclusion of bicycle lanes on ECR
1 Least desirable 3 9 6 22
2 1 4 2 9
3 Neutral 9 4 7 13
4 10 8 11 28
5 Most desirable 33 22 50 65
4.23 3.64 4.28 3.77 3.95 316
Enhanced pedestrian safety and crossings on ECR
1 Least desirable 0 1 1 4
2 0 0 1 3
3 Neutral 8 9 17 17
4 11 11 23 32
5 Most desirable 37 26 34 81
4.52 4.30 4.16 4.34 4.32 316
Wider sidewalks on ECR
1 Least desirable 0 5 4 9
2 3 5 8 12
3 Neutral 19 14 23 40
4 12 8 12 22
5 Most desirable 22 15 29 53
3.95 3.49 3.71 3.72 3.72 315
Additional through lanes on El Camino Real
1 Least desirable 16 11 18 28
2 11 5 8 21
3 Neutral 12 16 28 36

Community Survey Report Appendix B: Transportation Survey Responses
B-27
10. Please score each of the following items that you would like to see on El Camino Real from 1 (least desirable) to 5 (most desirable).
Indicate the condition which applies to the location of your work. (Select one)
Answer Options
I work in Menlo Park within a half mile (4-5 blocks) of the El Camino
Real Corridor.
I work in Menlo Park, but farther than a half mile of the El Camino
Real Corridor
I don’t work in Menlo Park, but I do work
within a half mile (4-5 blocks) of the El
Camino Real Corridor.
None of the above
Rating Average
Response Count
4 10 8 15 24
5 Most desirable 7 7 7 28
2.66 2.89 2.80 3.02 2.89 316
Increased vehicle safety on ECR
1 Least desirable 2 2 1 3
2 4 2 5 7
3 Neutral 19 18 37 55
4 15 15 19 35
5 Most desirable 16 10 14 36
3.70 3.62 3.53 3.69 3.64 315
Additional transit service along ECR
1 Least desirable 6 1 6 16
2 4 3 8 11
3 Neutral 25 33 38 72
4 17 8 14 23
5 Most desirable 4 2 10 14
3.16 3.15 3.18 3.06 3.12 315
Timing traffic signals to favor continuous north-south flow on ECR
1 Least desirable 5 3 4 6
2 4 6 2 8
3 Neutral 7 12 18 38
4 16 14 12 33
5 Most desirable 24 12 40 52
3.89 3.55 4.08 3.85 3.87 316
Timing traffic signals to favor east west access
1 Least desirable 6 1 14 12
2 7 9 16 19
3 Neutral 23 16 32 63
4 12 15 9 21
5 Most desirable 8 6 5 21
3.16 3.34 2.67 3.15 3.06 315
Reduction of vehicle miles travelled on ECR (reduction in traffic passing through Menlo Park on ECR)
1 Least desirable 3 2 5 9
2 2 3 10 13
3 Neutral 16 18 30 48
4 13 6 13 32
5 Most desirable 22 18 18 34
3.88 3.74 3.38 3.51 3.58 315
Reduction in delay at signalized intersections on ECR

El Camino Real Corridor Study
B-28
10. Please score each of the following items that you would like to see on El Camino Real from 1 (least desirable) to 5 (most desirable).
Indicate the condition which applies to the location of your work. (Select one)
Answer Options
I work in Menlo Park within a half mile (4-5 blocks) of the El Camino
Real Corridor.
I work in Menlo Park, but farther than a half mile of the El Camino
Real Corridor
I don’t work in Menlo Park, but I do work
within a half mile (4-5 blocks) of the El
Camino Real Corridor.
None of the above
Rating Average
Response Count
1 Least desirable 3 1 2 2
2 3 1 4 4
3 Neutral 17 16 28 58
4 17 19 23 37
5 Most desirable 16 10 19 35
3.71 3.77 3.70 3.73 3.72 315
More landscaped medians on ECR
1 Least desirable 3 5 9 19
2 5 5 9 15
3 Neutral 24 18 27 56
4 13 7 15 32
5 Most desirable 11 12 16 14
3.43 3.34 3.26 3.05 3.21 315
More landscaping along ECR (providing buffers between pedestrians or bicyclists and vehicles)
1 Least desirable 0 4 2 10
2 1 2 7 7
3 Neutral 14 14 9 38
4 16 9 20 40
5 Most desirable 25 18 38 41
4.16 3.74 4.12 3.70 3.89 315
answered question 316 skipped question 0

Community Survey Report Appendix B: Transportation Survey Responses
B-29
11. General Safety and Environmental Concerns
Indicate the condition which applies to the location of your work. (Select one)
Answer Options
I work in Menlo Park within a half
mile (4-5 blocks) of the El Camino Real
Corridor.
I work in Menlo Park, but farther
than a half mile of the El Camino Real
Corridor
I don’t work in Menlo Park, but I do work
within a half mile (4-5 blocks) of the El
Camino Real Corridor.
None of the above
Rating Average
Response Count
ECR is only safe if you are in a vehicle.
Strongly disagree 1 1 4 9
Somewhat disagree 13 5 10 19
Neutral/No opinion 4 4 5 9
Somewhat agree 23 21 26 53
Strongly agree 14 13 24 37
3.65 3.91 3.81 3.71 3.75 295
Ensuring that children can safely cross ECR to get to and from school should be a high priority.
Strongly disagree 0 1 0 1
Somewhat disagree 1 1 6 3
Neutral/No opinion 4 6 8 14
Somewhat agree 13 13 24 35
Strongly agree 37 23 30 74
4.56 4.27 4.15 4.40 4.35 294
Mitigating poor air quality from vehicle traffic/congestion should be a high priority.
Strongly disagree 1 3 3 8
Somewhat disagree 3 2 5 15
Neutral/No opinion 13 12 16 33
Somewhat agree 12 11 23 39
Strongly agree 26 16 22 31
4.07 3.80 3.81 3.56 3.75 294
Signage (for cross streets, turns) is not clear enough and needs to be improved.
Strongly disagree 3 2 3 14
Somewhat disagree 9 9 19 23
Neutral/No opinion 27 21 30 58
Somewhat agree 13 8 10 21
Strongly agree 3 4 7 9
3.07 3.07 2.99 2.90 2.98 293
answered question 295 skipped question 21

El Camino Real Corridor Study
B-30
12. Walking Environment
Indicate the condition which applies to the location of your work. (Select one)
Answer Options
I work in Menlo Park within a half mile (4-5 blocks) of the El Camino
Real Corridor.
I work in Menlo Park, but farther
than a half mile of the El Camino Real Corridor
I don’t work in Menlo Park, but I do work
within a half mile (4-5 blocks) of the El
Camino Real Corridor.
None of the above
Rating Average
Response Count
Signals are long enough to allow people to walk across ECR safely.
Strongly disagree 4 3 1 5
Somewhat disagree 11 10 10 24
Neutral/no opinion 5 5 12 23
Somewhat agree 23 22 34 41
Strongly agree 12 4 9 32
3.51 3.32 3.61 3.57 3.53 290
Vehicle speeds should be slower to make the road safer for people walking.
Strongly disagree 4 3 6 17
Somewhat disagree 11 11 18 26
Neutral/no opinion 12 13 30 45
Somewhat agree 15 10 7 26
Strongly agree 13 7 5 12
3.40 3.16 2.80 2.92 3.02 291
Bicycles on the sidewalks are a threat to pedestrian safety.
Strongly disagree 5 3 6 8
Somewhat disagree 8 6 13 14
Neutral/no opinion 6 10 9 20
Somewhat agree 19 14 22 51
Strongly agree 16 11 17 33
3.61 3.55 3.46 3.69 3.60 291 A parallel pedestrian path/trail should be provided, separated from the main roadway, possibly adjacent to the railroad tracks.
Strongly disagree 2 2 1 7
Somewhat disagree 1 2 5 11
Neutral/no opinion 13 12 8 25
Somewhat agree 16 9 18 28
Strongly agree 23 19 35 54
4.04 3.93 4.21 3.89 4.00 291 If conditions for pedestrians on and across ECR were improved, I would walk rather than drive a car for some short trips and errands.
Strongly disagree 3 1 5 10
Somewhat disagree 7 12 6 13
Neutral/no opinion 6 9 14 29
Somewhat agree 14 7 11 32
Strongly agree 25 15 30 41
3.93 3.52 3.83 3.65 3.72 290
answered question 292 skipped question 24

Community Survey Report Appendix B: Transportation Survey Responses
B-31
13. Transit
Indicate the condition which applies to the location of your work. (Select one)
Answer Options
I work in Menlo Park within a half mile (4-5 blocks) of the El Camino
Real Corridor.
I work in Menlo Park, but farther
than a half mile of the El Camino Real Corridor
I don’t work in Menlo Park, but I do work
within a half mile (4-5 blocks) of the El
Camino Real Corridor.
None of the above
Rating Average
Response Count
Dedicated bus/BRT (Bus Rapid Transit) lanes on ECR should be accommodated through Menlo Park.
Strongly disagree 13 10 9 28
Somewhat disagree 9 13 8 25
Neutral/No opinion 20 16 31 45
Somewhat agree 9 2 9 14
Strongly agree 4 3 9 12
2.67 2.43 3.02 2.65 2.71 289
answered question 289 skipped question 27
14. Vehicle Traffic Environment
Indicate the condition which applies to the location of your work. (Select one)
Answer Options
I work in Menlo Park within a half
mile (4-5 blocks) of the El Camino Real
Corridor.
I work in Menlo Park, but farther than a half mile of the El Camino
Real Corridor
I don’t work in Menlo Park, but I do work
within a half mile (4-5 blocks) of the El
Camino Real Corridor.
None of the above
Rating Average
Response Count
Improving the flow of traffic for automobiles should be the highest priority for ECR.
Strongly disagree 15 13 20 25
Somewhat disagree 12 6 13 28
Neutral/No opinion 10 8 14 16
Somewhat agree 11 10 12 36
Strongly agree 6 6 7 20
2.65 2.77 2.59 2.98 2.80 288 There is enough capacity for automobiles right now; improvements should focus on other modes of travel (bicycles, pedestrians, transit)
Strongly disagree 3 4 4 23
Somewhat disagree 9 5 8 20
Neutral/No opinion 5 10 2 8
Somewhat agree 11 6 17 27
Strongly agree 26 18 35 48
3.89 3.67 4.08 3.45 3.71 289
Lanes should be made wider in order to better accommodate large trucks and delivery vehicles.
Strongly disagree 25 13 28 45
Somewhat disagree 15 14 20 40
Neutral/No opinion 15 14 13 29
Somewhat agree 0 2 4 10
Strongly agree 0 0 1 2
1.82 2.12 1.94 2.08 2.00 290

El Camino Real Corridor Study
B-32
14. Vehicle Traffic Environment
Indicate the condition which applies to the location of your work. (Select one)
Answer Options
I work in Menlo Park within a half
mile (4-5 blocks) of the El Camino Real
Corridor.
I work in Menlo Park, but farther than a half mile of the El Camino
Real Corridor
I don’t work in Menlo Park, but I do work
within a half mile (4-5 blocks) of the El
Camino Real Corridor.
None of the above
Rating Average
Response Count
Solutions for ECR should attempt to separate regional through traffic from local traffic.
Strongly disagree 3 4 2 16
Somewhat disagree 12 8 15 24
Neutral/No opinion 19 12 25 44
Somewhat agree 9 12 12 24
Strongly agree 12 7 12 16
3.27 3.23 3.26 3.00 3.15 288 Regional through traffic should be prioritized on ECR; short local trips should be routed along other roads through the community.
Strongly disagree 24 15 18 44
Somewhat disagree 16 12 15 32
Neutral/No opinion 10 10 24 36
Somewhat agree 4 6 6 7
Strongly agree 1 0 3 6
1.95 2.16 2.41 2.19 2.19 289
Controlling “spillover” traffic in the neighborhoods adjacent to ECR should be a high priority.
Strongly disagree 1 0 8 8
Somewhat disagree 5 6 17 20
Neutral/No opinion 12 11 19 41
Somewhat agree 13 13 6 29
Strongly agree 23 13 16 27
3.96 3.77 3.08 3.38 3.48 288
answered question 290 skipped question 26
15. Bicycling Environment
Indicate the condition which applies to the location of your work. (Select one)
Answer Options
I work in Menlo Park within a half mile (4-5 blocks) of the El Camino
Real Corridor.
I work in Menlo Park, but farther than a half mile of the El Camino
Real Corridor
I don’t work in Menlo Park, but I do work
within a half mile (4-5 blocks) of the El
Camino Real Corridor.
None of the above
Rating Average
Response Count
ECR is not safe or convenient to cross by bicycle.
Strongly disagree 2 4 1 11
Somewhat disagree 6 5 7 21
Neutral/No opinion 8 4 5 18
Somewhat agree 19 16 22 38
Strongly agree 20 15 32 37

Community Survey Report Appendix B: Transportation Survey Responses
B-33
15. Bicycling Environment
Indicate the condition which applies to the location of your work. (Select one)
Answer Options
I work in Menlo Park within a half mile (4-5 blocks) of the El Camino
Real Corridor.
I work in Menlo Park, but farther than a half mile of the El Camino
Real Corridor
I don’t work in Menlo Park, but I do work
within a half mile (4-5 blocks) of the El
Camino Real Corridor.
None of the above
Rating Average
Response Count
3.89 3.75 4.15 3.55 3.78 291 Continuous bike lanes should be provided on ECR in both directions, because it is the most direct way for bicyclists to travel within and through Menlo Park.
Strongly disagree 3 6 5 16
Somewhat disagree 8 4 1 13
Neutral/No opinion 7 8 6 19
Somewhat agree 13 11 14 30
Strongly agree 25 13 41 46
3.88 3.50 4.27 3.62 3.80 289
If bicycle lanes are provided, they should be separated from vehicle traffic by a physical barrier to enhance safety.
Strongly disagree 4 3 4 9
Somewhat disagree 4 3 6 15
Neutral/No opinion 9 13 9 23
Somewhat agree 15 10 13 36
Strongly agree 24 15 35 41
3.91 3.70 4.03 3.69 3.81 291
Bicycles are best accommodated on adjacent parallel routes, not on ECR.
Strongly disagree 12 5 10 14
Somewhat disagree 9 7 5 23
Neutral/No opinion 9 9 14 16
Somewhat agree 13 11 16 26
Strongly agree 13 12 22 45
3.11 3.41 3.52 3.52 3.43 291
Currently, routes parallel to ECR are too discontinuous or conflicted for effective bike travel.
Strongly disagree 2 0 1 4
Somewhat disagree 4 2 2 2
Neutral/No opinion 4 4 3 19
Somewhat agree 17 9 15 37
Strongly agree 28 28 45 61
4.18 4.47 4.53 4.21 4.32 287 If conditions for bicyclists on and across ECR were improved, I would consider bicycling rather than driving for some short trips and errands.
Strongly disagree 3 2 4 15
Somewhat disagree 1 5 0 12
Neutral/No opinion 8 8 8 11
Somewhat agree 10 7 10 20
Strongly agree 34 20 45 67
4.27 3.90 4.37 3.90 4.08 290
answered question 292 skipped question 24

El Camino Real Corridor Study
B-34
16. Parking Environment
Indicate the condition which applies to the location of your work. (Select one)
Answer Options
I work in Menlo Park within a half mile (4-5 blocks) of the El Camino
Real Corridor.
I work in Menlo Park, but farther than a half mile of the El Camino
Real Corridor
I don’t work in Menlo Park, but I do work
within a half mile (4-5 blocks) of the El
Camino Real Corridor.
None of the above
Rating Average
Response Count
Street parking on ECR is essential for the convenience of customers of small businesses located there.
Strongly disagree 12 13 19 33
Somewhat disagree 18 9 14 44
Neutral/No opinion 13 13 22 21
Somewhat agree 9 5 7 15
Strongly agree 3 3 4 11
2.51 2.44 2.44 2.41 2.44 288
Parking on ECR should be eliminated to free up more space for vehicle travel.
Strongly disagree 10 7 11 19
Somewhat disagree 8 3 9 17
Neutral/No opinion 14 17 16 27
Somewhat agree 18 7 20 30
Strongly agree 5 9 11 31
3.00 3.19 3.16 3.30 3.19 289
Parking on ECR should be eliminated to free up more space for bicycle lanes.
Strongly disagree 5 5 6 18
Somewhat disagree 3 4 5 9
Neutral/No opinion 10 10 6 19
Somewhat agree 15 10 20 29
Strongly agree 22 14 29 49
3.84 3.56 3.92 3.66 3.74 288
Any parking that is removed from ECR should be replaced with parking lots or garages off the roadway, nearby.
Strongly disagree 2 1 3 8
Somewhat disagree 6 1 7 9
Neutral/No opinion 17 17 14 21
Somewhat agree 17 17 24 48
Strongly agree 13 7 18 39
3.60 3.65 3.71 3.81 3.72 289
answered question 290 skipped question 26

Community Survey Report Appendix B: Transportation Survey Responses
B-35
APPENDIX B: CROSS-TABULATIONS – QUESTION 3
1. Indicate the condition which applies to the location of your residence. (Select one)
Do you drive a vehicle on El Camino Real? (Select one)
Answer Options Multiple times per
day
Approximately once per day
A few times a week
Almost never
Response Percent
Response Count
I live in Menlo Park within a half mile (4-5 blocks) of the El Camino Real Corridor.
63 25 51 8 46.5% 147
I live in Menlo Park, but farther than a half mile of the El Camino Real Corridor
35 16 38 13 32.3% 102
I don’t live in Menlo Park, but I do live within a half mile (4-5 blocks) of the El Camino Real Corridor.
7 4 15 15 13.0% 41
None of the above. 1 0 10 15 8.2% 26
answered question 316 skipped question 0
2. Indicate the condition which applies to the location of your work. (Select one)
Do you drive a vehicle on El Camino Real? (Select one)
Answer Options Multiple times per
day
Approximately once per day
A few times a week
Almost never
Response Percent
Response Count
I work in Menlo Park within a half mile (4-5 blocks) of the El Camino Real Corridor.
18 11 17 10 17.7% 56
I work in Menlo Park, but farther than a half mile of the El Camino Real Corridor
18 7 18 4 14.9% 47
I don’t work in Menlo Park, but I do work within a half mile (4-5 blocks) of the El Camino Real Corridor.
27 3 28 18 24.1% 76
None of the above 43 24 51 19 43.4% 137
answered question 316 skipped question 0

El Camino Real Corridor Study
B-36
3. Do you drive a vehicle on El Camino Real? (Select one)
Do you drive a vehicle on El Camino Real? (Select one)
Answer Options Multiple
times per day Approximately once per day
A few times a week
Almost never
Response Percent
Response Count
Multiple times per day 106 0 0 0 33.5% 106
Approximately once per day 0 45 0 0 14.2% 45
A few times a week 0 0 114 0 36.1% 114
Almost never 0 0 0 51 16.1% 51
answered question 316 skipped question 0
4. Do you ride a bike on or across El Camino Real? (Select one)
Do you drive a vehicle on El Camino Real? (Select one)
Answer Options Multiple times
per day Approximately once per day
A few times a week
Almost never
Response Percent
Response Count
On a daily basis 5 1 32 23 19.3% 61
Several times per week 17 6 28 19 22.2% 70
Mostly on weekends 30 10 16 4 19.0% 60
Almost never 54 28 38 5 39.6% 125
answered question 316 skipped question 0
5. Do you use local bus transit services that travel on El Camino Real? (Select one)
Do you drive a vehicle on El Camino Real? (Select one)
Answer Options Multiple times
per day Approximately once per day
A few times a week
Almost never
Response Percent
Response Count
On a daily basis 2 0 0 0 0.6% 2
Several times per week 3 0 3 6 3.8% 12
Mostly on weekends 0 0 3 1 1.3% 4
Almost never 101 45 108 44 94.3% 298
answered question 316 skipped question 0

Community Survey Report Appendix B: Transportation Survey Responses
B-37
6. Do you walk along or across El Camino Real? (Select one)
Do you drive a vehicle on El Camino Real? (Select one)
Answer Options Multiple times
per day Approximately once per day
A few times a week
Almost never
Response Percent
Response Count
On a daily basis 13 3 10 5 9.8% 31
Several times per week 26 11 33 10 25.4% 80
Mostly on weekends 29 12 26 16 26.3% 83
Almost never 38 19 44 20 38.4% 121
answered question 315 skipped question 1
7. Do you have a child that has to cross El Camino Real to get to school? (Select one)
Do you drive a vehicle on El Camino Real? (Select one)
Answer Options Multiple times
per day Approximately once per day
A few times a week
Almost never
Response Percent
Response Count
Yes 34 8 16 2 19.0% 60
No 72 37 97 49 81.0% 255
answered question 315 skipped question 1
8. Please indicate the most common condition which applies to your use of the Menlo Park Caltrain station. (Select one)
Do you drive a vehicle on El Camino Real? (Select one)
Answer Options Multiple times
per day Approximately once per day
A few times a week
Almost never
Response Percent
Response Count
I walk to Caltrain 23 8 25 5 19.4% 61 I ride my bike to Caltrain 6 2 24 34 21.0% 66
I am dropped off by another vehicle or transit at Caltrain
7 1 5 0 4.1% 13
I drive and park at Caltrain 24 2 11 2 12.4% 39
I rarely use Caltrain 46 32 48 10 43.2% 136
answered question 315 skipped question 1

El Camino Real Corridor Study
B-38
9. Why do you typically travel on El Camino Real? (Select all that apply)
Do you drive a vehicle on El Camino Real? (Select one)
Answer Options Multiple times
per day Approximately once per day
A few times a week
Almost never
Response Percent
Response Count
Travel to and/or from work 75 12 44 28 50.5% 159
Travel to and/or from school 29 9 16 6 19.0% 60
Travel for shopping 86 38 85 31 76.2% 240 Patronizing local businesses 78 30 78 30 68.6% 216
For physical activity 22 7 17 9 17.5% 55
Other (please specify) 36
answered question 315 skipped question 1
10. Please score each of the following items that you would like to see on El Camino Real from 1 (least desirable) to 5 (most desirable).
Do you drive a vehicle on El Camino Real? (Select one)
Answer Options Multiple times
per day Approximately once per day
A few times a week
Almost never
Rating Average
Response Count
Lower travel speeds on El Camino Real (ECR)
1 Least desirable 28 13 25 3
2 11 5 7 2
3 Neutral 45 18 57 27
4 7 3 8 9
5 Most desirable 13 6 17 10
2.67 2.64 2.87 3.41 2.86 314
Higher travel speeds on ECR
1 Least desirable 39 21 42 25
2 7 4 18 8
3 Neutral 37 13 35 14
4 13 3 13 2
5 Most desirable 9 4 6 2
2.49 2.22 2.32 1.98 2.31 315
More convenient on-street parking on ECR
1 Least desirable 48 21 46 19
2 17 9 27 10
3 Neutral 31 13 30 19
4 5 1 9 1
5 Most desirable 4 1 2 2
2.05 1.93 2.07 2.16 2.06 315
More convenient parking within walking distance to ECR
1 Least desirable 13 3 13 8

Community Survey Report Appendix B: Transportation Survey Responses
B-39
10. Please score each of the following items that you would like to see on El Camino Real from 1 (least desirable) to 5 (most desirable).
Do you drive a vehicle on El Camino Real? (Select one)
Answer Options Multiple times
per day Approximately once per day
A few times a week
Almost never
Rating Average
Response Count
2 11 4 16 6
3 Neutral 38 17 42 23
4 27 10 32 10
5 Most desirable 17 11 11 4
3.23 3.49 3.11 2.92 3.17 316
More bike parking close to downtown
1 Least desirable 9 4 2 1
2 2 1 6 0
3 Neutral 33 17 19 3
4 37 10 33 26
5 Most desirable 24 13 54 21
3.62 3.60 4.15 4.29 3.92 315
Inclusion of bicycle lanes on ECR
1 Least desirable 20 10 9 1
2 7 3 5 1
3 Neutral 15 6 10 2
4 24 8 19 6
5 Most desirable 40 18 71 41
3.54 3.47 4.21 4.67 3.95 316
Enhanced pedestrian safety and crossings on ECR
1 Least desirable 1 2 2 1
2 1 1 2 0
3 Neutral 15 7 19 10
4 29 10 26 12
5 Most desirable 60 25 65 28
4.38 4.22 4.32 4.29 4.32 316
Wider sidewalks on ECR
1 Least desirable 4 6 7 1
2 8 5 11 4
3 Neutral 36 11 34 15
4 17 4 24 9
5 Most desirable 40 19 38 22
3.77 3.56 3.66 3.92 3.72 315
Additional through lanes on El Camino Real
1 Least desirable 17 8 28 20
2 9 9 18 9
3 Neutral 28 11 35 18
4 28 7 20 2
5 Most desirable 24 10 13 2
3.31 3.04 2.75 2.16 2.89 316

El Camino Real Corridor Study
B-40
10. Please score each of the following items that you would like to see on El Camino Real from 1 (least desirable) to 5 (most desirable).
Do you drive a vehicle on El Camino Real? (Select one)
Answer Options Multiple times
per day Approximately once per day
A few times a week
Almost never
Rating Average
Response Count
Increased vehicle safety on ECR
1 Least desirable 1 3 3 1
2 4 2 7 5
3 Neutral 40 13 50 26
4 31 14 26 13
5 Most desirable 29 13 28 6
3.79 3.71 3.61 3.35 3.64 315
Additional transit service along ECR
1 Least desirable 9 3 13 4
2 12 3 10 1
3 Neutral 58 28 59 23
4 17 8 19 18
5 Most desirable 9 3 13 5
3.05 3.11 3.08 3.37 3.12 315
Timing traffic signals to favor continuous north-south flow on ECR
1 Least desirable 5 1 6 6
2 1 3 8 8
3 Neutral 17 5 27 26
4 25 12 33 5
5 Most desirable 58 24 40 6
4.23 4.22 3.82 2.94 3.87 316
Timing traffic signals to favor east west access
1 Least desirable 18 3 9 3
2 21 7 20 3
3 Neutral 45 17 46 26
4 11 12 23 11
5 Most desirable 10 6 16 8
2.75 3.24 3.15 3.35 3.06 315
Reduction of vehicle miles travelled on ECR (reduction in traffic passing through Menlo Park on ECR)
1 Least desirable 9 3 5 2
2 14 3 10 1
3 Neutral 31 16 45 20
4 17 6 22 19
5 Most desirable 34 17 32 9
3.50 3.69 3.58 3.63 3.58 315
Reduction in delay at signalized intersections on ECR
1 Least desirable 2 0 4 2
2 4 1 4 3
3 Neutral 29 16 43 31
4 39 16 33 8

Community Survey Report Appendix B: Transportation Survey Responses
B-41
10. Please score each of the following items that you would like to see on El Camino Real from 1 (least desirable) to 5 (most desirable).
Do you drive a vehicle on El Camino Real? (Select one)
Answer Options Multiple times
per day Approximately once per day
A few times a week
Almost never
Rating Average
Response Count
5 Most desirable 31 12 30 7
3.89 3.87 3.71 3.29 3.72 315
More landscaped medians on ECR
1 Least desirable 11 6 15 4
2 9 3 15 7
3 Neutral 37 18 45 25
4 21 10 25 11
5 Most desirable 27 8 14 4
3.42 3.24 3.07 3.08 3.21 315
More landscaping along ECR (providing buffers between pedestrians or bicyclists and vehicles)
1 Least desirable 4 5 7 0
2 6 3 6 2
3 Neutral 28 13 19 15
4 26 8 40 11
5 Most desirable 41 16 42 23
3.90 3.60 3.91 4.08 3.89 315
answered question 316 skipped question 0

El Camino Real Corridor Study
B-42
11. General Safety and Environmental Concerns
Do you drive a vehicle on El Camino Real? (Select one)
Answer Options Multiple times
per day Approximately once per day
A few times a week
Almost never
Rating Average
Response Count
ECR is only safe if you are in a vehicle.
Strongly disagree 6 3 1 5
Somewhat disagree 15 6 18 8
Neutral/No opinion 8 2 8 4
Somewhat agree 34 19 49 21
Strongly agree 32 12 36 8
3.75 3.74 3.90 3.41 3.75 295
Ensuring that children can safely cross ECR to get to and from school should be a high priority.
Strongly disagree 1 1 0 0
Somewhat disagree 6 1 2 2
Neutral/No opinion 4 6 17 5
Somewhat agree 27 11 33 14
Strongly agree 56 23 60 25
4.39 4.29 4.35 4.35 4.35 294
Mitigating poor air quality from vehicle traffic/congestion should be a high priority.
Strongly disagree 6 3 6 0
Somewhat disagree 11 5 7 2
Neutral/No opinion 26 9 24 15
Somewhat agree 25 14 34 12
Strongly agree 26 11 41 17
3.57 3.60 3.87 3.96 3.75 294 Signage (for cross streets, turns) is not clear enough and needs to be improved.
Strongly disagree 12 3 6 1
Somewhat disagree 15 9 28 8
Neutral/No opinion 42 16 51 27
Somewhat agree 16 11 18 7
Strongly agree 8 3 9 3
2.92 3.05 2.96 3.07 2.98 293
answered question 295 skipped question 21

Community Survey Report Appendix B: Transportation Survey Responses
B-43
12. Walking Environment
Do you drive a vehicle on El Camino Real? (Select one)
Answer Options Multiple times
per day Approximately once per day
A few times a week
Almost never
Rating Average
Response Count
Signals are long enough to allow people to walk across ECR safely.
Strongly disagree 6 2 5 0
Somewhat disagree 17 4 22 12
Neutral/no opinion 14 4 17 10
Somewhat agree 37 19 50 14
Strongly agree 20 13 15 9
3.51 3.88 3.44 3.44 3.53 290
Vehicle speeds should be slower to make the road safer for people walking.
Strongly disagree 12 5 11 2
Somewhat disagree 23 15 26 2
Neutral/no opinion 32 11 38 19
Somewhat agree 18 4 21 15
Strongly agree 9 7 14 7
2.88 2.83 3.01 3.51 3.02 291
Bicycles on the sidewalks are a threat to pedestrian safety.
Strongly disagree 4 2 9 7
Somewhat disagree 12 4 19 6
Neutral/no opinion 20 10 11 4
Somewhat agree 32 18 42 14
Strongly agree 27 7 29 14
3.69 3.59 3.57 3.49 3.60 291 A parallel pedestrian path/trail should be provided, separated from the main roadway, possibly adjacent to the railroad tracks.
Strongly disagree 6 3 3 0
Somewhat disagree 5 3 9 2
Neutral/no opinion 14 9 23 12
Somewhat agree 26 9 25 11
Strongly agree 44 18 50 19
4.02 3.86 4.00 4.07 4.00 291 If conditions for pedestrians on and across ECR were improved, I would walk rather than drive a car for some short trips and errands.
Strongly disagree 9 3 7 0
Somewhat disagree 15 7 14 2
Neutral/no opinion 13 7 25 13
Somewhat agree 21 9 22 12
Strongly agree 37 15 42 17
3.65 3.63 3.71 4.00 3.72 290
answered question 292 skipped question 24

El Camino Real Corridor Study
B-44
13. Transit
Do you drive a vehicle on El Camino Real? (Select one)
Answer Options Multiple times
per day Approximately once per day
A few times a week
Almost never
Rating Average
Response Count
Dedicated bus/BRT (Bus Rapid Transit) lanes on ECR should be accommodated through Menlo Park.
Strongly disagree 28 9 22 1
Somewhat disagree 26 12 13 4
Neutral/No opinion 30 14 48 20
Somewhat agree 7 4 16 7
Strongly agree 2 2 11 13
2.24 2.46 2.83 3.60 2.71 289
answered question 289 skipped question 27
14. Vehicle Traffic Environment
Do you drive a vehicle on El Camino Real? (Select one)
Answer Options Multiple times
per day Approximately once per day
A few times a week
Almost never
Rating Average
Response Count
Improving the flow of traffic for automobiles should be the highest priority for ECR.
Strongly disagree 18 2 27 26
Somewhat disagree 13 6 32 8
Neutral/No opinion 11 9 19 9
Somewhat agree 28 18 21 2
Strongly agree 21 7 11 0
3.23 3.52 2.61 1.71 2.80 288 There is enough capacity for automobiles right now; improvements should focus on other modes of travel (bicycles, pedestrians, transit)
Strongly disagree 20 7 7 0
Somewhat disagree 17 11 14 0
Neutral/No opinion 6 4 11 4
Somewhat agree 22 13 22 4
Strongly agree 28 7 55 37
3.23 3.05 3.95 4.73 3.71 289
Lanes should be made wider in order to better accommodate large trucks and delivery vehicles.
Strongly disagree 37 15 44 15
Somewhat disagree 25 15 34 15
Neutral/No opinion 25 8 24 14
Somewhat agree 4 3 8 1
Strongly agree 2 1 0 0
2.02 2.05 1.96 2.02 2.00 290
Solutions for ECR should attempt to separate regional through traffic from local traffic.
Strongly disagree 8 4 11 2
Somewhat disagree 16 12 26 5
Neutral/No opinion 32 12 33 23

Community Survey Report Appendix B: Transportation Survey Responses
B-45
14. Vehicle Traffic Environment
Do you drive a vehicle on El Camino Real? (Select one)
Answer Options Multiple times
per day Approximately once per day
A few times a week
Almost never
Rating Average
Response Count
Somewhat agree 16 10 22 9
Strongly agree 21 4 17 5
3.28 2.95 3.07 3.23 3.15 288 Regional through traffic should be prioritized on ECR; short local trips should be routed along other roads through the community.
Strongly disagree 38 16 37 10
Somewhat disagree 22 9 32 12
Neutral/No opinion 20 10 29 21
Somewhat agree 10 5 7 1
Strongly agree 3 1 5 1
2.12 2.17 2.19 2.36 2.19 289
Controlling “spillover” traffic in the neighborhoods adjacent to ECR should be a high priority.
Strongly disagree 8 2 6 1
Somewhat disagree 15 8 17 8
Neutral/No opinion 20 5 36 22
Somewhat agree 16 14 23 8
Strongly agree 33 12 28 6
3.55 3.63 3.45 3.22 3.48 288
answered question 290 skipped question 26
15. Bicycling Environment
Do you drive a vehicle on El Camino Real? (Select one)
Answer Options Multiple times
per day Approximately once per day
A few times a week
Almost never
Rating Average
Response Count
ECR is not safe or convenient to cross by bicycle.
Strongly disagree 6 3 6 3
Somewhat disagree 14 9 13 3
Neutral/No opinion 12 6 9 8
Somewhat agree 28 11 39 17
Strongly agree 34 13 43 14
3.74 3.52 3.91 3.80 3.78 291 Continuous bike lanes should be provided on ECR in both directions, because it is the most direct way for bicyclists to travel within and through Menlo Park.
Strongly disagree 17 6 7 0
Somewhat disagree 6 9 11 0
Neutral/No opinion 20 7 8 5
Somewhat agree 20 14 23 11
Strongly agree 30 5 60 30
3.43 3.07 4.08 4.54 3.80 289
If bicycle lanes are provided, they should be separated from vehicle traffic by a physical barrier to enhance safety.

El Camino Real Corridor Study
B-46
15. Bicycling Environment
Do you drive a vehicle on El Camino Real? (Select one)
Answer Options Multiple times
per day Approximately once per day
A few times a week
Almost never
Rating Average
Response Count
Strongly disagree 14 2 4 0
Somewhat disagree 7 6 9 6
Neutral/No opinion 22 9 15 8
Somewhat agree 15 14 31 14
Strongly agree 36 10 51 18
3.55 3.59 4.05 3.96 3.81 291
Bicycles are best accommodated on adjacent parallel routes, not on ECR.
Strongly disagree 9 2 19 11
Somewhat disagree 12 7 15 10
Neutral/No opinion 12 7 20 9
Somewhat agree 23 13 23 7
Strongly agree 37 13 33 9
3.72 3.67 3.33 2.85 3.43 291
Currently, routes parallel to ECR are too discontinuous or conflicted for effective bike travel.
Strongly disagree 3 1 3 0
Somewhat disagree 5 1 3 1
Neutral/No opinion 12 6 10 2
Somewhat agree 30 17 23 8
Strongly agree 43 16 70 33
4.13 4.12 4.41 4.66 4.32 287 If conditions for bicyclists on and across ECR were improved, I would consider bicycling rather than driving for some short trips and errands.
Strongly disagree 10 6 8 0
Somewhat disagree 10 2 5 1
Neutral/No opinion 8 7 13 7
Somewhat agree 20 11 11 5
Strongly agree 45 15 73 33
3.86 3.66 4.24 4.52 4.08 290
answered question 292 skipped question 24

Community Survey Report Appendix B: Transportation Survey Responses
B-47
16. Parking Environment
Do you drive a vehicle on El Camino Real? (Select one)
Answer Options Multiple times
per day Approximately once per day
A few times a week
Almost never
Rating Average
Response Count
Street parking on ECR is essential for the convenience of customers of small businesses located there.
Strongly disagree 31 6 29 11
Somewhat disagree 30 16 27 12
Neutral/No opinion 18 9 25 17
Somewhat agree 7 6 21 2
Strongly agree 6 4 8 3
2.21 2.66 2.56 2.42 2.44 288
Parking on ECR should be eliminated to free up more space for vehicle travel.
Strongly disagree 12 7 22 6
Somewhat disagree 12 6 11 8
Neutral/No opinion 17 5 32 20
Somewhat agree 28 16 24 7
Strongly agree 24 8 21 3
3.43 3.29 3.10 2.84 3.19 289
Parking on ECR should be eliminated to free up more space for bicycle lanes.
Strongly disagree 17 8 8 1
Somewhat disagree 8 3 8 2
Neutral/No opinion 10 9 18 8
Somewhat agree 26 10 26 12
Strongly agree 31 12 49 22
3.50 3.36 3.92 4.16 3.74 288
Any parking that is removed from ECR should be replaced with parking lots or garages off the roadway, nearby.
Strongly disagree 2 0 7 5
Somewhat disagree 5 3 7 8
Neutral/No opinion 17 6 34 12
Somewhat agree 40 19 29 18
Strongly agree 29 14 32 2
3.96 4.05 3.66 3.09 3.72 289
answered question 290 skipped question 26

El Camino Real Corridor Study
B-48
APPENDIX B: CROSS-TABULATIONS – QUESTION 4
1. Indicate the condition which applies to the location of your residence. (Select one)
Do you ride a bike on or across El Camino Real?
(Select one)
Answer Options On a daily
basis Several times
per week Mostly on weekends
Almost never
Response Percent
Response Count
I live in Menlo Park within a half mile (4-5 blocks) of the El Camino Real Corridor.
23 29 33 62 46.5% 147
I live in Menlo Park, but farther than a half mile of the El Camino Real Corridor
13 23 16 50 32.3% 102
I don’t live in Menlo Park, but I do live within a half mile (4-5 blocks) of the El Camino Real Corridor.
15 9 8 9 13.0% 41
None of the above. 10 9 3 4 8.2% 26
answered question 316 skipped question 0
2. Indicate the condition which applies to the location of your work. (Select one)
Do you ride a bike on or across El Camino Real?
(Select one)
Answer Options On a daily
basis Several times
per week Mostly on weekends
Almost never
Response Percent
Response Count
I work in Menlo Park within a half mile (4-5 blocks) of the El Camino Real Corridor.
19 11 10 16 17.7% 56
I work in Menlo Park, but farther than a half mile of the El Camino Real Corridor
7 13 10 17 14.9% 47
I don’t work in Menlo Park, but I do work within a half mile (4-5 blocks) of the El Camino Real Corridor.
22 12 16 26 24.1% 76
None of the above 13 34 24 66 43.4% 137
answered question 316 skipped question 0

Community Survey Report Appendix B: Transportation Survey Responses
B-49
3. Do you drive a vehicle on El Camino Real? (Select one)
Do you ride a bike on or across El Camino Real? (Select
one)
Answer Options On a daily
basis Several times
per week Mostly on weekends
Almost never
Response Percent
Response Count
Multiple times per day 5 17 30 54 33.5% 106
Approximately once per day 1 6 10 28 14.2% 45
A few times a week 32 28 16 38 36.1% 114
Almost never 23 19 4 5 16.1% 51
answered question 316 skipped question 0
4. Do you ride a bike on or across El Camino Real? (Select one)
Do you ride a bike on or across El Camino Real? (Select one)
Answer Options On a daily
basis Several times
per week Mostly on weekends
Almost never
Response Percent
Response Count
On a daily basis 61 0 0 0 19.3% 61
Several times per week 0 70 0 0 22.2% 70
Mostly on weekends 0 0 60 0 19.0% 60
Almost never 0 0 0 125 39.6% 125
answered question 316 skipped question 0
5. Do you use local bus transit services that travel on El Camino Real? (Select one)
Do you ride a bike on or across El Camino Real? (Select one)
Answer Options On a daily
basis Several times
per week Mostly on weekends
Almost never
Response Percent
Response Count
On a daily basis 1 1 0 0 0.6% 2
Several times per week 4 5 2 1 3.8% 12
Mostly on weekends 2 0 1 1 1.3% 4
Almost never 54 64 57 123 94.3% 298
answered question 316 skipped question 0

El Camino Real Corridor Study
B-50
6. Do you walk along or across El Camino Real? (Select one)
Do you ride a bike on or across El Camino Real? (Select one)
Answer Options On a daily
basis Several times
per week Mostly on weekends
Almost never
Response Percent
Response Count
On a daily basis 10 7 6 8 9.8% 31
Several times per week 24 20 16 20 25.4% 80
Mostly on weekends 10 19 30 24 26.3% 83
Almost never 17 23 8 73 38.4% 121
answered question 315 skipped question 1
7. Do you have a child that has to cross El Camino Real to get to school? (Select one)
Do you ride a bike on or across El Camino Real? (Select one)
Answer Options On a daily
basis Several times
per week Mostly on weekends
Almost never Response Percent
Response Count
Yes 11 11 15 23 19.0% 60
No 50 58 45 102 81.0% 255
answered question 315 skipped question 1
8. Please indicate the most common condition which applies to your use of the Menlo Park Caltrain station. (Select one)
Do you ride a bike on or across El Camino Real? (Select one)
Answer Options On a daily
basis Several times
per week Mostly on weekends
Almost never Response Percent
Response Count
I walk to Caltrain 13 14 12 22 19.4% 61
I ride my bike to Caltrain 34 25 5 2 21.0% 66 I am dropped off by another vehicle or transit at Caltrain 3 3 3 4 4.1% 13
I drive and park at Caltrain 3 7 8 21 12.4% 39
I rarely use Caltrain 8 20 32 76 43.2% 136
answered question 315 skipped question 1

Community Survey Report Appendix B: Transportation Survey Responses
B-51
9. Why do you typically travel on El Camino Real? (Select all that apply)
Do you ride a bike on or across El Camino Real? (Select one)
Answer Options On a daily
basis Several times
per week Mostly on weekends
Almost never Response Percent
Response Count
Travel to and/or from work 45 35 33 46 50.5% 159
Travel to and/or from school 18 11 10 21 19.0% 60
Travel for shopping 44 47 46 103 76.2% 240
Patronizing local businesses 41 46 42 87 68.6% 216
For physical activity 13 17 11 14 17.5% 55
Other (please specify) 36
answered question 315 skipped question 1
10. Please score each of the following items that you would like to see on El Camino Real from 1 (least desirable) to 5 (most desirable).
Do you ride a bike on or across El Camino Real? (Select one)
Answer Options On a daily
basis Several times
per week Mostly on weekends
Almost never
Rating Average
Response Count
Lower travel speeds on El Camino Real (ECR)
1 Least desirable 12 9 20 28
2 2 3 11 9
3 Neutral 27 39 21 60
4 9 7 4 7
5 Most desirable 11 12 4 19
3.08 3.14 2.35 2.84 2.86 314
Higher travel speeds on ECR
1 Least desirable 28 30 18 51
2 7 9 7 14
3 Neutral 17 21 21 40
4 6 7 10 8
5 Most desirable 3 3 4 11
2.16 2.20 2.58 2.31 2.31 315
More convenient on-street parking on ECR
1 Least desirable 32 29 22 51
2 10 14 14 25
3 Neutral 17 23 20 33
4 0 4 4 8
5 Most desirable 2 0 0 7
1.85 2.03 2.10 2.15 2.06 315
More convenient parking within walking distance to ECR 1 Least desirable 11 9 6 11
2 12 8 6 11
3 Neutral 21 33 26 40

El Camino Real Corridor Study
B-52
10. Please score each of the following items that you would like to see on El Camino Real from 1 (least desirable) to 5 (most desirable).
Do you ride a bike on or across El Camino Real? (Select one)
Answer Options On a daily
basis Several times
per week Mostly on weekends
Almost never
Rating Average
Response Count
4 10 15 16 38
5 Most desirable 7 5 6 25
2.84 2.99 3.17 3.44 3.17 316
More bike parking close to downtown
1 Least desirable 2 2 3 9
2 1 2 1 5
3 Neutral 1 5 18 48
4 22 31 24 29
5 Most desirable 35 30 14 33
4.43 4.21 3.75 3.58 3.92 315
Inclusion of bicycle lanes on ECR
1 Least desirable 1 4 5 30
2 0 3 2 11
3 Neutral 0 5 7 21
4 5 13 19 20
5 Most desirable 55 45 27 43
4.85 4.31 4.02 3.28 3.95 316
Enhanced pedestrian safety and crossings on ECR
1 Least desirable 1 1 0 4
2 0 1 1 2
3 Neutral 11 5 17 18
4 13 13 20 31
5 Most desirable 36 50 22 70
4.36 4.57 4.05 4.29 4.32 316
Wider sidewalks on ECR
1 Least desirable 1 5 0 12
2 6 6 6 10
3 Neutral 17 15 25 39
4 9 12 15 18
5 Most desirable 28 32 14 45
3.93 3.86 3.62 3.60 3.72 315
Additional through lanes on El Camino Real
1 Least desirable 23 19 8 23
2 9 11 7 18
3 Neutral 19 24 20 29
4 6 11 13 27
5 Most desirable 4 5 12 28
2.33 2.60 3.23 3.15 2.89 316
Increased vehicle safety on ECR
1 Least desirable 2 3 2 1
2 5 7 2 4

Community Survey Report Appendix B: Transportation Survey Responses
B-53
10. Please score each of the following items that you would like to see on El Camino Real from 1 (least desirable) to 5 (most desirable).
Do you ride a bike on or across El Camino Real? (Select one)
Answer Options On a daily
basis Several times
per week Mostly on weekends
Almost never
Rating Average
Response Count
3 Neutral 22 36 31 40
4 20 11 18 35
5 Most desirable 12 13 7 44
3.57 3.34 3.43 3.94 3.64 315
Additional transit service along ECR
1 Least desirable 8 3 7 11
2 4 6 6 10
3 Neutral 29 38 36 65
4 15 15 8 24
5 Most desirable 5 8 3 14
3.08 3.27 2.90 3.16 3.12 315
Timing traffic signals to favor continuous north-south flow on ECR
1 Least desirable 7 5 3 3
2 5 6 2 7
3 Neutral 23 21 10 21
4 9 18 14 34
5 Most desirable 17 20 31 60
3.39 3.60 4.13 4.13 3.87 316
Timing traffic signals to favor east west access
1 Least desirable 4 6 7 16
2 9 12 12 18
3 Neutral 31 30 24 49
4 9 12 12 24
5 Most desirable 8 10 5 17
3.13 3.11 2.93 3.06 3.06 315
Reduction of vehicle miles travelled on ECR (reduction in traffic passing through Menlo Park on ECR)
1 Least desirable 3 2 4 10
2 2 8 8 10
3 Neutral 21 30 27 34
4 18 19 5 22
5 Most desirable 17 11 16 48
3.72 3.41 3.35 3.71 3.58 315
Reduction in delay at signalized intersections on ECR
1 Least desirable 3 1 1 3
2 3 5 2 2
3 Neutral 32 34 24 29
4 14 15 20 47
5 Most desirable 9 15 13 43
3.38 3.54 3.70 4.01 3.72 315
More landscaped medians on ECR
1 Least desirable 8 7 7 14

El Camino Real Corridor Study
B-54
10. Please score each of the following items that you would like to see on El Camino Real from 1 (least desirable) to 5 (most desirable).
Do you ride a bike on or across El Camino Real? (Select one)
Answer Options On a daily
basis Several times
per week Mostly on weekends
Almost never
Rating Average
Response Count
2 8 8 7 11
3 Neutral 26 29 25 45
4 13 18 10 26
5 Most desirable 6 8 11 28
3.02 3.17 3.18 3.35 3.21 315
More landscaping along ECR (providing buffers between pedestrians or bicyclists and vehicles)
1 Least desirable 1 4 2 9
2 2 2 3 10
3 Neutral 15 17 17 26
4 13 20 22 30
5 Most desirable 30 27 16 49
4.13 3.91 3.78 3.81 3.89 315
answered question 316 skipped question 0

Community Survey Report Appendix B: Transportation Survey Responses
B-55
11. General Safety and Environmental Concerns
Do you ride a bike on or across El Camino Real? (Select one)
Answer Options On a daily
basis Several times
per week Mostly on weekends
Almost never
Rating Average
Response Count
ECR is only safe if you are in a vehicle.
Strongly disagree 2 4 3 6
Somewhat disagree 10 8 10 19
Neutral/No opinion 4 2 5 11
Somewhat agree 21 31 25 46
Strongly agree 19 22 12 35
3.80 3.88 3.60 3.73 3.75 295
Ensuring that children can safely cross ECR to get to and from school should be a high priority.
Strongly disagree 0 0 1 1
Somewhat disagree 0 1 4 6
Neutral/No opinion 9 5 7 11
Somewhat agree 10 17 25 33
Strongly agree 37 44 18 65
4.50 4.55 4.00 4.34 4.35 294
Mitigating poor air quality from vehicle traffic/congestion should be a high priority.
Strongly disagree 0 2 5 8
Somewhat disagree 4 4 8 9
Neutral/No opinion 14 18 16 26
Somewhat agree 11 22 16 36
Strongly agree 27 20 10 38
4.09 3.82 3.33 3.74 3.75 294
Signage (for cross streets, turns) is not clear enough and needs to be improved.
Strongly disagree 2 4 7 9
Somewhat disagree 17 10 9 24
Neutral/No opinion 21 37 31 47
Somewhat agree 10 11 7 24
Strongly agree 6 3 1 13
3.02 2.98 2.75 3.07 2.98 293
answered question 295 skipped question 21

El Camino Real Corridor Study
B-56
12. Walking Environment
Do you ride a bike on or across El Camino Real? (Select one)
Answer Options On a daily
basis Several times
per week Mostly on weekends
Almost never
Rating Average
Response Count
Signals are long enough to allow people to walk across ECR safely.
Strongly disagree 2 2 2 7
Somewhat disagree 12 21 7 15
Neutral/no opinion 7 12 7 19
Somewhat agree 24 20 23 53
Strongly agree 11 10 15 21
3.54 3.23 3.78 3.57 3.53 290
Vehicle speeds should be slower to make the road safer for people walking.
Strongly disagree 7 3 8 12
Somewhat disagree 9 9 18 30
Neutral/no opinion 21 21 20 38
Somewhat agree 10 22 4 22
Strongly agree 9 10 5 13
3.09 3.42 2.64 2.95 3.02 291
Bicycles on the sidewalks are a threat to pedestrian safety.
Strongly disagree 6 6 5 5
Somewhat disagree 9 10 7 15
Neutral/no opinion 4 14 13 14
Somewhat agree 23 19 18 46
Strongly agree 14 16 12 35
3.54 3.45 3.45 3.79 3.60 291 A parallel pedestrian path/trail should be provided, separated from the main roadway, possibly adjacent to the railroad tracks.
Strongly disagree 1 2 2 7
Somewhat disagree 1 6 2 10
Neutral/no opinion 10 11 15 22
Somewhat agree 14 13 11 33
Strongly agree 30 33 25 43
4.27 4.06 4.00 3.83 4.00 291 If conditions for pedestrians on and across ECR were improved, I would walk rather than drive a car for some short trips and errands.
Strongly disagree 0 3 2 14
Somewhat disagree 5 5 7 21
Neutral/no opinion 15 8 14 21
Somewhat agree 9 16 14 25
Strongly agree 27 32 17 35
4.04 4.08 3.69 3.40 3.72 290
answered question 292 skipped question 24

Community Survey Report Appendix B: Transportation Survey Responses
B-57
13. Transit
Do you ride a bike on or across El Camino Real? (Select one)
Answer Options On a daily
basis Several times
per week Mostly on weekends
Almost never Rating
Average Response
Count
Dedicated bus/BRT (Bus Rapid Transit) lanes on ECR should be accommodated through Menlo Park.
Strongly disagree 8 7 16 29
Somewhat disagree 7 12 12 24
Neutral/No opinion 24 27 23 38
Somewhat agree 8 8 1 17
Strongly agree 9 11 2 6
3.05 3.06 2.28 2.54 2.71 289
answered question 289 skipped question 27
14. Vehicle Traffic Environment
Do you ride a bike on or across El Camino Real? (Select one)
Answer Options On a daily
basis Several times
per week Mostly on weekends
Almost never Rating
Average Response
Count
Improving the flow of traffic for automobiles should be the highest priority for ECR.
Strongly disagree 26 24 7 16
Somewhat disagree 12 13 12 22
Neutral/No opinion 11 14 8 15
Somewhat agree 6 11 17 35
Strongly agree 1 3 10 25
2.00 2.32 3.20 3.27 2.80 288 There is enough capacity for automobiles right now; improvements should focus on other modes of travel (bicycles, pedestrians, transit)
Strongly disagree 0 1 7 26
Somewhat disagree 1 6 16 19
Neutral/No opinion 4 7 5 9
Somewhat agree 6 18 12 25
Strongly agree 45 33 15 34
4.70 4.17 3.22 3.19 3.71 289
Lanes should be made wider in order to better accommodate large trucks and delivery vehicles.
Strongly disagree 22 25 19 45
Somewhat disagree 18 21 16 34
Neutral/No opinion 15 16 16 24
Somewhat agree 1 3 4 8
Strongly agree 0 0 0 3
1.91 1.95 2.09 2.04 2.00 290
Solutions for ECR should attempt to separate regional through traffic from local traffic.
Strongly disagree 3 4 7 11
Somewhat disagree 12 11 11 25
Neutral/No opinion 23 26 21 30

El Camino Real Corridor Study
B-58
14. Vehicle Traffic Environment
Do you ride a bike on or across El Camino Real? (Select one)
Answer Options On a daily
basis Several times
per week Mostly on weekends
Almost never Rating
Average Response
Count
Somewhat agree 8 15 11 23
Strongly agree 10 9 4 24
3.18 3.22 2.89 3.21 3.15 288 Regional through traffic should be prioritized on ECR; short local trips should be routed along other roads through the community.
Strongly disagree 17 15 16 53
Somewhat disagree 13 17 18 27
Neutral/No opinion 19 24 14 23
Somewhat agree 3 6 7 7
Strongly agree 4 3 0 3
2.36 2.46 2.22 1.94 2.19 289
Controlling “spillover” traffic in the neighborhoods adjacent to ECR should be a high priority.
Strongly disagree 3 3 2 9
Somewhat disagree 11 11 11 15
Neutral/No opinion 22 23 12 26
Somewhat agree 11 12 16 22
Strongly agree 9 15 14 41
3.21 3.39 3.53 3.63 3.48 288
answered question 290 skipped question 26
15. Bicycling Environment
Do you ride a bike on or across El Camino Real? (Select one)
Answer Options On a daily
basis Several times
per week Mostly on weekends
Almost never Rating
Average Response
Count
ECR is not safe or convenient to cross by bicycle.
Strongly disagree 3 3 5 7
Somewhat disagree 6 7 8 18
Neutral/No opinion 1 5 8 21
Somewhat agree 25 22 16 32
Strongly agree 21 28 18 37
3.98 4.00 3.62 3.64 3.78 291 Continuous bike lanes should be provided on ECR in both directions, because it is the most direct way for bicyclists to travel within and through Menlo Park.
Strongly disagree 0 2 8 20
Somewhat disagree 0 5 4 17
Neutral/No opinion 3 6 10 21
Somewhat agree 10 14 15 29
Strongly agree 43 37 17 28
4.71 4.23 3.54 3.24 3.80 289

Community Survey Report Appendix B: Transportation Survey Responses
B-59
15. Bicycling Environment
Do you ride a bike on or across El Camino Real? (Select one)
Answer Options On a daily
basis Several times
per week Mostly on weekends
Almost never Rating
Average Response
Count
If bicycle lanes are provided, they should be separated from vehicle traffic by a physical barrier to enhance safety.
Strongly disagree 0 2 8 10
Somewhat disagree 4 7 2 15
Neutral/No opinion 8 9 11 26
Somewhat agree 16 18 21 19
Strongly agree 28 30 12 45
4.21 4.02 3.50 3.64 3.81 291
Bicycles are best accommodated on adjacent parallel routes, not on ECR.
Strongly disagree 19 9 7 6
Somewhat disagree 10 12 5 17
Neutral/No opinion 11 10 6 21
Somewhat agree 7 16 19 24
Strongly agree 9 19 18 46
2.59 3.36 3.65 3.76 3.43 291
Currently, routes parallel to ECR are too discontinuous or conflicted for effective bike travel.
Strongly disagree 0 1 1 5
Somewhat disagree 2 2 3 3
Neutral/No opinion 0 2 5 23
Somewhat agree 9 16 20 33
Strongly agree 44 43 26 49
4.73 4.53 4.22 4.04 4.32 287 If conditions for bicyclists on and across ECR were improved, I would consider bicycling rather than driving for some short trips and errands.
Strongly disagree 0 1 4 19
Somewhat disagree 1 0 3 14
Neutral/No opinion 5 7 8 15
Somewhat agree 4 6 16 21
Strongly agree 46 51 24 45
4.70 4.63 3.96 3.52 4.08 290
answered question 292 skipped question 24

El Camino Real Corridor Study
B-60
16. Parking Environment
Do you ride a bike on or across El Camino Real? (Select one)
Answer Options On a daily
basis Several times
per week Mostly on weekends
Almost never
Rating Average
Response Count
Street parking on ECR is essential for the convenience of customers of small businesses located there.
Strongly disagree 18 14 16 29
Somewhat disagree 14 25 14 32
Neutral/No opinion 17 15 15 22
Somewhat agree 5 6 8 17
Strongly agree 2 5 2 12
2.27 2.43 2.38 2.56 2.44 288
Parking on ECR should be eliminated to free up more space for vehicle travel.
Strongly disagree 11 10 7 19
Somewhat disagree 11 6 5 15
Neutral/No opinion 17 21 13 23
Somewhat agree 12 16 17 30
Strongly agree 6 12 12 26
2.84 3.22 3.41 3.26 3.19 289
Parking on ECR should be eliminated to free up more space for bicycle lanes.
Strongly disagree 1 4 4 25
Somewhat disagree 2 2 6 11
Neutral/No opinion 6 11 6 22
Somewhat agree 15 14 18 27
Strongly agree 33 34 21 26
4.35 4.11 3.84 3.16 3.74 288 Any parking that is removed from ECR should be replaced with parking lots or garages off the roadway, nearby.
Strongly disagree 4 6 1 3
Somewhat disagree 9 6 2 6
Neutral/No opinion 20 14 16 19
Somewhat agree 16 21 23 46
Strongly agree 8 18 13 38
3.26 3.60 3.82 3.98 3.72 289
answered question 290 skipped question 26

Community Survey Report Appendix B: Transportation Survey Responses
B-61
APPENDIX B: CROSS-TABULATIONS – QUESTION 5
1. Indicate the condition which applies to the location of your residence. (Select one)
Do you use local bus transit services that travel on
El Camino Real? (Select one)
Answer Options On a daily basis
Several times per
week
Mostly on weekends
Almost never
Response Percent
Response Count
I live in Menlo Park within a half mile (4-5 blocks) of the El Camino Real Corridor.
0 4 2 141 46.5% 147
I live in Menlo Park, but farther than a half mile of the El Camino Real Corridor
2 0 0 100 32.3% 102
I don’t live in Menlo Park, but I do live within a half mile (4-5 blocks) of the El Camino Real Corridor.
0 7 2 32 13.0% 41
None of the above. 0 1 0 25 8.2% 26
answered question 316 skipped question 0
2. Indicate the condition which applies to the location of your work. (Select one)
Do you use local bus transit services that travel on
El Camino Real? (Select one)
Answer Options On a daily basis
Several times per
week
Mostly on weekends
Almost never
Response Percent
Response Count
I work in Menlo Park within a half mile (4-5 blocks) of the El Camino Real Corridor.
0 3 0 53 17.7% 56
I work in Menlo Park, but farther than a half mile of the El Camino Real Corridor
0 2 0 45 14.9% 47
I don’t work in Menlo Park, but I do work within a half mile (4-5 blocks) of the El Camino Real Corridor.
1 6 2 67 24.1% 76
None of the above 1 1 2 133 43.4% 137
answered question 316 skipped question 0

El Camino Real Corridor Study
B-62
3. Do you drive a vehicle on El Camino Real? (Select one)
Do you use local bus transit services that travel on
El Camino Real? (Select one)
Answer Options On a daily basis
Several times per
week
Mostly on weekends
Almost never
Response Percent
Response Count
Multiple times per day 2 3 0 101 33.5% 106
Approximately once per day 0 0 0 45 14.2% 45
A few times a week 0 3 3 108 36.1% 114
Almost never 0 6 1 44 16.1% 51
answered question 316 skipped question 0
4. Do you ride a bike on or across El Camino Real? (Select one)
Do you use local bus transit services that travel on El Camino
Real? (Select one)
Answer Options On a daily
basis Several times
per week Mostly on weekends
Almost never
Response Percent
Response Count
On a daily basis 1 4 2 54 19.3% 61
Several times per week 1 5 0 64 22.2% 70
Mostly on weekends 0 2 1 57 19.0% 60
Almost never 0 1 1 123 39.6% 125
answered question 316 skipped question 0
5. Do you use local bus transit services that travel on El Camino Real? (Select one)
Do you use local bus transit services that travel on El Camino
Real? (Select one)
Answer Options On a daily basis
Several times per week
Mostly on weekends
Almost never
Response Percent
Response Count
On a daily basis 2 0 0 0 0.6% 2
Several times per week 0 12 0 0 3.8% 12
Mostly on weekends 0 0 4 0 1.3% 4
Almost never 0 0 0 298 94.3% 298
answered question 316 skipped question 0

Community Survey Report Appendix B: Transportation Survey Responses
B-63
6. Do you walk along or across El Camino Real? (Select one)
Do you use local bus transit services that travel on El Camino
Real? (Select one)
Answer Options On a daily
basis Several times
per week Mostly on weekends
Almost never
Response Percent
Response Count
On a daily basis 0 4 2 25 9.8% 31
Several times per week 0 6 1 73 25.4% 80
Mostly on weekends 0 1 1 81 26.3% 83
Almost never 2 1 0 118 38.4% 121
answered question 315 skipped question 1
7. Do you have a child that has to cross El Camino Real to get to school? (Select one)
Do you use local bus transit services that travel on El Camino
Real? (Select one)
Answer Options On a daily
basis Several times
per week Mostly on weekends
Almost never
Response Percent
Response Count
Yes 2 2 0 56 19.0% 60
No 0 10 4 241 81.0% 255
answered question 315 skipped question 1
8. Please indicate the most common condition which applies to your use of the Menlo Park Caltrain station. (Select one)
Do you use local bus transit services that travel on El Camino
Real? (Select one)
Answer Options On a daily
basis Several times
per week Mostly on weekends
Almost never
Response Percent
Response Count
I walk to Caltrain 0 3 2 56 19.4% 61 I ride my bike to Caltrain 0 7 1 58 21.0% 66
I am dropped off by another vehicle or transit at Caltrain
0 0 1 12 4.1% 13
I drive and park at Caltrain 1 0 0 38 12.4% 39
I rarely use Caltrain 1 2 0 133 43.2% 136
answered question 315 skipped question 1

El Camino Real Corridor Study
B-64
9. Why do you typically travel on El Camino Real? (Select all that apply)
Do you use local bus transit services that travel on El Camino
Real? (Select one)
Answer Options On a daily
basis Several times
per week Mostly on weekends
Almost never
Response Percent
Response Count
Travel to and/or from work 2 7 4 146 50.5% 159
Travel to and/or from school 2 1 1 56 19.0% 60
Travel for shopping 1 11 3 225 76.2% 240 Patronizing local businesses 2 9 3 202 68.6% 216
For physical activity 0 2 1 52 17.5% 55
Other (please specify) 36
answered question 315 skipped question 1
10. Please score each of the following items that you would like to see on El Camino Real from 1 (least desirable) to 5 (most desirable).
Do you use local bus transit services that travel on El
Camino Real? (Select one)
Answer Options On a daily
basis Several times
per week Mostly on weekends
Almost never
Rating Average
Response Count
Lower travel speeds on El Camino Real (ECR)
1 Least desirable 1 0 3 65
2 0 0 0 25
3 Neutral 1 5 0 141
4 0 2 1 24
5 Most desirable 0 5 0 41
2.00 4.00 1.75 2.83 2.86 314
Higher travel speeds on ECR
1 Least desirable 0 8 0 119
2 0 1 1 35
3 Neutral 2 3 1 93
4 0 0 0 31
5 Most desirable 0 0 2 19
3.00 1.58 3.75 2.31 2.31 315
More convenient on-street parking on ECR
1 Least desirable 2 4 2 126
2 0 2 1 60
3 Neutral 0 5 1 87
4 0 0 0 16
5 Most desirable 0 1 0 8
1.00 2.33 1.75 2.06 2.06 315
More convenient parking within walking distance to ECR
1 Least desirable 1 2 1 33

Community Survey Report Appendix B: Transportation Survey Responses
B-65
10. Please score each of the following items that you would like to see on El Camino Real from 1 (least desirable) to 5 (most desirable).
Do you use local bus transit services that travel on El
Camino Real? (Select one)
Answer Options On a daily
basis Several times
per week Mostly on weekends
Almost never
Rating Average
Response Count
2 0 2 0 35
3 Neutral 1 3 1 115
4 0 3 2 74
5 Most desirable 0 2 0 41
2.00 3.08 3.00 3.18 3.17 316
More bike parking close to downtown
1 Least desirable 1 1 0 14
2 0 0 0 9
3 Neutral 0 2 0 70
4 1 3 0 102
5 Most desirable 0 6 4 102
2.50 4.08 5.00 3.91 3.92 315
Inclusion of bicycle lanes on ECR
1 Least desirable 0 1 0 39
2 0 1 0 15
3 Neutral 0 0 0 33
4 0 2 1 54
5 Most desirable 2 8 3 157
5.00 4.25 4.75 3.92 3.95 316
Enhanced pedestrian safety and crossings on ECR
1 Least desirable 0 1 0 5
2 0 0 0 4
3 Neutral 0 1 1 49
4 0 1 1 75
5 Most desirable 2 9 2 165
5.00 4.42 4.25 4.31 4.32 316
Wider sidewalks on ECR
1 Least desirable 1 0 0 17
2 0 1 1 26
3 Neutral 1 3 1 91
4 0 0 1 53
5 Most desirable 0 8 1 110
2.00 4.25 3.50 3.72 3.72 315
Additional through lanes on El Camino Real
1 Least desirable 0 7 1 65
2 0 0 1 44
3 Neutral 0 2 0 90
4 1 1 1 54
5 Most desirable 1 2 1 45
4.50 2.25 3.00 2.90 2.89 316

El Camino Real Corridor Study
B-66
10. Please score each of the following items that you would like to see on El Camino Real from 1 (least desirable) to 5 (most desirable).
Do you use local bus transit services that travel on El
Camino Real? (Select one)
Answer Options On a daily
basis Several times
per week Mostly on weekends
Almost never
Rating Average
Response Count
Increased vehicle safety on ECR
1 Least desirable 0 1 0 7
2 0 2 1 15
3 Neutral 2 3 2 122
4 0 3 0 81
5 Most desirable 0 3 1 72
3.00 3.42 3.25 3.66 3.64 315
Additional transit service along ECR
1 Least desirable 1 0 1 27
2 0 1 0 25
3 Neutral 1 4 1 162
4 0 3 2 57
5 Most desirable 0 4 0 26
2.00 3.83 3.00 3.10 3.12 315
Timing traffic signals to favor continuous north-south flow on ECR
1 Least desirable 1 2 1 14
2 0 1 0 19
3 Neutral 1 5 1 68
4 0 3 1 71
5 Most desirable 0 1 1 126
2.00 3.00 3.25 3.93 3.87 316
Timing traffic signals to favor east west access
1 Least desirable 1 0 0 32
2 0 0 1 50
3 Neutral 1 7 2 124
4 0 3 0 54
5 Most desirable 0 2 1 37
2.00 3.58 3.25 3.05 3.06 315
Reduction of vehicle miles travelled on ECR (reduction in traffic passing through Menlo Park on ECR)
1 Least desirable 1 2 0 16
2 0 2 1 25
3 Neutral 0 5 1 106
4 0 1 0 63
5 Most desirable 1 2 2 87
3.00 2.92 3.75 3.61 3.58 315
Reduction in delay at signalized intersections on ECR
1 Least desirable 0 0 0 8
2 0 2 0 10
3 Neutral 2 6 2 109
4 0 2 1 93

Community Survey Report Appendix B: Transportation Survey Responses
B-67
10. Please score each of the following items that you would like to see on El Camino Real from 1 (least desirable) to 5 (most desirable).
Do you use local bus transit services that travel on El
Camino Real? (Select one)
Answer Options On a daily
basis Several times
per week Mostly on weekends
Almost never
Rating Average
Response Count
5 Most desirable 0 2 1 77
3.00 3.33 3.75 3.74 3.72 315
More landscaped medians on ECR
1 Least desirable 0 1 1 34
2 0 4 0 30
3 Neutral 1 4 3 117
4 1 2 0 64
5 Most desirable 0 1 0 52
3.50 2.83 2.50 3.24 3.21 315
More landscaping along ECR (providing buffers between pedestrians or bicyclists and vehicles)
1 Least desirable 0 0 0 16
2 0 2 0 15
3 Neutral 1 3 0 71
4 0 4 2 79
5 Most desirable 1 3 2 116
4.00 3.67 4.50 3.89 3.89 315
answered question 316 skipped question 0

El Camino Real Corridor Study
B-68
11. General Safety and Environmental Concerns
Do you use local bus transit services that travel on El
Camino Real? (Select one)
Answer Options On a daily
basis Several times
per week Mostly on weekends
Almost never
Rating Average
Response Count
ECR is only safe if you are in a vehicle.
Strongly disagree 0 1 0 14
Somewhat disagree 0 4 0 43 Neutral/No opinion 0 0 0 22
Somewhat agree 1 5 2 115
Strongly agree 1 1 2 84
4.50 3.09 4.50 3.76 3.75 295
Ensuring that children can safely cross ECR to get to and from school should be a high priority.
Strongly disagree 0 0 0 2
Somewhat disagree 0 0 0 11 Neutral/No opinion 0 1 1 30
Somewhat agree 0 1 1 83
Strongly agree 2 9 2 151
5.00 4.73 4.25 4.34 4.35 294
Mitigating poor air quality from vehicle traffic/congestion should be a high priority.
Strongly disagree 1 0 0 14
Somewhat disagree 0 1 0 24 Neutral/No opinion 0 3 1 70
Somewhat agree 1 2 0 82
Strongly agree 0 5 3 87
2.50 4.00 4.50 3.74 3.75 294
Signage (for cross streets, turns) is not clear enough and needs to be improved.
Strongly disagree 1 0 2 19
Somewhat disagree 0 3 2 55 Neutral/No opinion 0 4 0 132
Somewhat agree 0 3 0 49
Strongly agree 1 1 0 21
3.00 3.18 1.50 2.99 2.98 293
answered question 295 skipped question 21

Community Survey Report Appendix B: Transportation Survey Responses
B-69
12. Walking Environment
Do you use local bus transit services that travel on El
Camino Real? (Select one)
Answer Options On a daily
basis Several times
per week Mostly on weekends
Almost never
Rating Average
Response Count
Signals are long enough to allow people to walk across ECR safely.
Strongly disagree 0 0 0 13
Somewhat disagree 0 4 1 50
Neutral/no opinion 0 1 0 44
Somewhat agree 0 5 1 114
Strongly agree 2 1 2 52
5.00 3.27 4.00 3.52 3.53 290
Vehicle speeds should be slower to make the road safer for people walking.
Strongly disagree 0 0 2 28
Somewhat disagree 1 1 0 64
Neutral/no opinion 1 4 1 94
Somewhat agree 0 2 1 55
Strongly agree 0 4 0 33
2.50 3.82 2.25 3.00 3.02 291
Bicycles on the sidewalks are a threat to pedestrian safety.
Strongly disagree 0 2 0 20
Somewhat disagree 0 1 2 38
Neutral/no opinion 0 0 0 45
Somewhat agree 2 7 1 96
Strongly agree 0 1 1 75
4.00 3.36 3.25 3.61 3.60 291 A parallel pedestrian path/trail should be provided, separated from the main roadway, possibly adjacent to the railroad tracks.
Strongly disagree 1 0 0 11
Somewhat disagree 0 2 1 16
Neutral/no opinion 0 2 1 55
Somewhat agree 1 6 0 64
Strongly agree 0 1 2 128
2.50 3.55 3.75 4.03 4.00 291 If conditions for pedestrians on and across ECR were improved, I would walk rather than drive a car for some short trips and errands.
Strongly disagree 1 1 0 17
Somewhat disagree 0 1 1 36
Neutral/no opinion 0 2 0 56
Somewhat agree 0 0 1 63
Strongly agree 1 7 2 101
3.00 4.00 4.00 3.71 3.72 290
answered question 292 skipped question 24

El Camino Real Corridor Study
B-70
13. Transit
Do you use local bus transit services that travel on El
Camino Real? (Select one)
Answer Options On a daily
basis Several times
per week Mostly on weekends
Almost never
Rating Average
Response Count
Dedicated bus/BRT (Bus Rapid Transit) lanes on ECR should be accommodated through Menlo Park.
Strongly disagree 0 2 1 57
Somewhat disagree 2 1 1 51 Neutral/No opinion 0 2 1 109
Somewhat agree 0 1 0 33
Strongly agree 0 5 1 22
2.00 3.55 2.75 2.68 2.71 289
answered question 289 skipped question 27
14. Vehicle Traffic Environment
Do you use local bus transit services that travel on El
Camino Real? (Select one)
Answer Options On a daily
basis Several times
per week Mostly on weekends
Almost never
Rating Average
Response Count
Improving the flow of traffic for automobiles should be the highest priority for ECR.
Strongly disagree 0 7 2 64
Somewhat disagree 0 1 0 58 Neutral/No opinion 1 1 1 45
Somewhat agree 1 0 1 67
Strongly agree 0 1 0 38
3.50 1.70 2.25 2.84 2.80 288 There is enough capacity for automobiles right now; improvements should focus on other modes of travel (bicycles, pedestrians, transit)
Strongly disagree 0 0 0 34
Somewhat disagree 0 1 0 41 Neutral/No opinion 0 1 0 24
Somewhat agree 1 2 1 57
Strongly agree 1 6 3 117
4.50 4.30 4.75 3.67 3.71 289
Lanes should be made wider in order to better accommodate large trucks and delivery vehicles.
Strongly disagree 0 5 3 103
Somewhat disagree 2 4 1 82 Neutral/No opinion 0 1 0 70
Somewhat agree 0 0 0 16
Strongly agree 0 0 0 3

Community Survey Report Appendix B: Transportation Survey Responses
B-71
14. Vehicle Traffic Environment
Do you use local bus transit services that travel on El
Camino Real? (Select one)
Answer Options On a daily
basis Several times
per week Mostly on weekends
Almost never
Rating Average
Response Count
2.00 1.60 1.25 2.03 2.00 290
Solutions for ECR should attempt to separate regional through traffic from local traffic.
Strongly disagree 0 0 1 24
Somewhat disagree 1 4 0 54 Neutral/No opinion 0 4 1 95
Somewhat agree 1 0 2 54
Strongly agree 0 2 0 45
3.00 3.00 3.00 3.15 3.15 288 Regional through traffic should be prioritized on ECR; short local trips should be routed along other roads through the community.
Strongly disagree 1 4 1 95
Somewhat disagree 0 3 1 71 Neutral/No opinion 1 3 2 74
Somewhat agree 0 0 0 23
Strongly agree 0 0 0 10
2.00 1.90 2.25 2.20 2.19 289
Controlling “spillover” traffic in the neighborhoods adjacent to ECR should be a high priority.
Strongly disagree 1 1 1 14
Somewhat disagree 0 4 2 42 Neutral/No opinion 0 3 1 79
Somewhat agree 1 1 0 59
Strongly agree 0 1 0 78
2.50 2.70 2.00 3.53 3.48 288
answered question 290 skipped question 26

El Camino Real Corridor Study
B-72
15. Bicycling Environment
Do you use local bus transit services that travel on El
Camino Real? (Select one)
Answer Options On a daily
basis Several times
per week Mostly on weekends
Almost never
Rating Average
Response Count
ECR is not safe or convenient to cross by bicycle.
Strongly disagree 0 1 0 17
Somewhat disagree 0 0 0 39 Neutral/No opinion 0 1 1 33
Somewhat agree 1 6 1 87
Strongly agree 1 3 2 98
4.50 3.91 4.25 3.77 3.78 291 Continuous bike lanes should be provided on ECR in both directions, because it is the most direct way for bicyclists to travel within and through Menlo Park.
Strongly disagree 0 1 0 29
Somewhat disagree 0 0 0 26 Neutral/No opinion 0 0 0 40
Somewhat agree 0 2 0 66
Strongly agree 2 8 4 111
5.00 4.45 5.00 3.75 3.80 289 If bicycle lanes are provided, they should be separated from vehicle traffic by a physical barrier to enhance safety.
Strongly disagree 0 3 0 17
Somewhat disagree 0 2 0 26 Neutral/No opinion 0 1 0 53
Somewhat agree 0 0 2 72
Strongly agree 2 5 2 106
5.00 3.18 4.50 3.82 3.81 291
Bicycles are best accommodated on adjacent parallel routes, not on ECR.
Strongly disagree 0 6 2 33
Somewhat disagree 0 1 1 42 Neutral/No opinion 0 2 0 46
Somewhat agree 0 1 0 65
Strongly agree 2 1 1 88
5.00 2.09 2.25 3.49 3.43 291
Currently, routes parallel to ECR are too discontinuous or conflicted for effective bike travel.
Strongly disagree 0 0 0 7
Somewhat disagree 0 1 0 9 Neutral/No opinion 0 0 0 30
Somewhat agree 0 1 0 77
Strongly agree 2 8 4 148
5.00 4.60 5.00 4.29 4.32 287

Community Survey Report Appendix B: Transportation Survey Responses
B-73
15. Bicycling Environment
Do you use local bus transit services that travel on El
Camino Real? (Select one)
Answer Options On a daily
basis Several times
per week Mostly on weekends
Almost never
Rating Average
Response Count
If conditions for bicyclists on and across ECR were improved, I would consider bicycling rather than driving for some short trips and errands.
Strongly disagree 0 0 0 24
Somewhat disagree 0 0 0 18 Neutral/No opinion 0 2 0 33
Somewhat agree 0 1 0 46
Strongly agree 2 7 4 153
5.00 4.50 5.00 4.04 4.08 290
answered question 292 skipped question 24

El Camino Real Corridor Study
B-74
16. Parking Environment
Do you use local bus transit services that travel on El
Camino Real? (Select one)
Answer Options On a daily
basis Several times
per week Mostly on weekends
Almost never
Rating Average
Response Count
Street parking on ECR is essential for the convenience of customers of small businesses located there.
Strongly disagree 0 3 3 71
Somewhat disagree 1 4 0 80 Neutral/No opinion 1 2 1 65
Somewhat agree 0 1 0 35
Strongly agree 0 0 0 21
2.50 2.10 1.50 2.47 2.44 288
Parking on ECR should be eliminated to free up more space for vehicle travel.
Strongly disagree 0 1 1 45
Somewhat disagree 0 2 0 35 Neutral/No opinion 1 4 1 68
Somewhat agree 1 2 0 72
Strongly agree 0 1 2 53
3.50 3.00 3.50 3.19 3.19 289
Parking on ECR should be eliminated to free up more space for bicycle lanes.
Strongly disagree 0 0 0 34
Somewhat disagree 0 0 0 21 Neutral/No opinion 1 1 0 43
Somewhat agree 0 4 1 69
Strongly agree 1 5 3 105
4.00 4.40 4.75 3.70 3.74 288 Any parking that is removed from ECR should be replaced with parking lots or garages off the roadway, nearby.
Strongly disagree 0 1 2 11
Somewhat disagree 0 3 0 20 Neutral/No opinion 0 2 0 67
Somewhat agree 0 3 1 102
Strongly agree 2 1 1 73
5.00 3.00 2.75 3.75 3.72 289
answered question 290 skipped question 26

Community Survey Report Appendix B: Transportation Survey Responses
B-75
APPENDIX B: CROSS-TABULATIONS – QUESTION 6
1. Indicate the condition which applies to the location of your residence. (Select one)
Do you walk along or across El Camino Real?
(Select one)
Answer Options On a daily
basis Several times
per week Mostly on weekends
Almost never
Response Percent
Response Count
I live in Menlo Park within a half mile (4-5 blocks) of the El Camino Real Corridor.
26 51 37 32 46.3% 146
I live in Menlo Park, but farther than a half mile of the El Camino Real Corridor
1 14 25 62 32.4% 102
I don’t live in Menlo Park, but I do live within a half mile (4-5 blocks) of the El Camino Real Corridor.
4 8 15 14 13.0% 41
None of the above. 0 7 6 13 8.3% 26
answered question 315 skipped question 0
2. Indicate the condition which applies to the location of your work. (Select one)
Do you walk along or across El Camino Real?
(Select one)
Answer Options On a daily
basis Several times
per week Mostly on weekends
Almost never
Response Percent
Response Count
I work in Menlo Park within a half mile (4-5 blocks) of the El Camino Real Corridor.
11 21 11 13 17.8% 56
I work in Menlo Park, but farther than a half mile of the El Camino Real Corridor
2 11 17 17 14.9% 47
I don’t work in Menlo Park, but I do work within a half mile (4-5 blocks) of the El Camino Real Corridor.
8 19 27 22 24.1% 76
None of the above 10 29 28 69 43.2% 136
answered question 315 skipped question 0

El Camino Real Corridor Study
B-76
3. Do you drive a vehicle on El Camino Real? (Select one)
Do you walk along or across El Camino Real?
(Select one)
Answer Options On a daily
basis Several times
per week Mostly on weekends
Almost never
Response Percent
Response Count
Multiple times per day 13 26 29 38 33.7% 106
Approximately once per day 3 11 12 19 14.3% 45
A few times a week 10 33 26 44 35.9% 113
Almost never 5 10 16 20 16.2% 51
answered question 315 skipped question 0
4. Do you ride a bike on or across El Camino Real? (Select one)
Do you walk along or across El Camino Real?
(Select one)
Answer Options On a daily
basis Several times
per week Mostly on weekends
Almost never
Response Percent
Response Count
On a daily basis 10 24 10 17 19.4% 61
Several times per week 7 20 19 23 21.9% 69
Mostly on weekends 6 16 30 8 19.0% 60
Almost never 8 20 24 73 39.7% 125
answered question 315 skipped question 0
5. Do you use local bus transit services that travel on El Camino Real? (Select one)
Do you walk along or across El Camino Real?
(Select one)
Answer Options On a daily
basis Several times
per week Mostly on weekends
Almost never
Response Percent
Response Count
On a daily basis 0 0 0 2 0.6% 2
Several times per week 4 6 1 1 3.8% 12
Mostly on weekends 2 1 1 0 1.3% 4
Almost never 25 73 81 118 94.3% 297
answered question 315 skipped question 0

Community Survey Report Appendix B: Transportation Survey Responses
B-77
6. Do you walk along or across El Camino Real? (Select one)
Do you walk along or across El Camino Real?
(Select one)
Answer Options On a daily
basis Several times
per week Mostly on weekends
Almost never
Response Percent
Response Count
On a daily basis 31 0 0 0 9.8% 31
Several times per week 0 80 0 0 25.4% 80
Mostly on weekends 0 0 83 0 26.3% 83
Almost never 0 0 0 121 38.4% 121
answered question 315 skipped question 0
7. Do you have a child that has to cross El Camino Real to get to school? (Select one)
Do you walk along or across El Camino Real?
(Select one)
Answer Options On a daily
basis Several times
per week Mostly on weekends
Almost never
Response Percent
Response Count
Yes 3 19 16 22 19.0% 60
No 28 61 67 99 81.0% 255
answered question 315 skipped question 0
8. Please indicate the most common condition which applies to your use of the Menlo Park Caltrain station. (Select one)
Do you walk along or across El Camino Real?
(Select one)
Answer Options On a daily
basis Several times
per week Mostly on weekends
Almost never
Response Percent
Response Count
I walk to Caltrain 18 20 16 7 19.4% 61
I ride my bike to Caltrain 6 25 15 20 21.0% 66 I am dropped off by another vehicle or transit at Caltrain 1 7 2 3 4.1% 13
I drive and park at Caltrain 3 6 11 19 12.4% 39
I rarely use Caltrain 3 22 39 72 43.2% 136
answered question 315 skipped question 0

El Camino Real Corridor Study
B-78
9. Why do you typically travel on El Camino Real? (Select all that apply)
Do you walk along or across El Camino Real?
(Select one)
Answer Options On a daily
basis Several times
per week Mostly on weekends
Almost never
Response Percent
Response Count
Travel to and/or from work 19 51 42 47 50.5% 159
Travel to and/or from school 4 18 13 25 19.0% 60
Travel for shopping 26 59 66 89 76.2% 240
Patronizing local businesses 22 53 61 80 68.6% 216
For physical activity 17 13 13 12 17.5% 55
Other (please specify) 36
answered question 315 skipped question 0
10. Please score each of the following items that you would like to see on El Camino Real from 1 (least desirable) to 5 (most desirable).
Do you walk along or across El Camino Real? (Select one)
Answer Options On a daily
basis Several times
per week Mostly on weekends
Almost never
Rating Average
Response Count
Lower travel speeds on El Camino Real (ECR)
1 Least desirable 7 13 18 31
2 0 10 9 6
3 Neutral 12 28 44 63
4 5 9 5 8
5 Most desirable 6 19 7 13
3.10 3.14 2.69 2.72 2.85 313
Higher travel speeds on ECR
1 Least desirable 15 39 24 48
2 4 5 19 9
3 Neutral 10 20 30 39
4 1 11 6 13
5 Most desirable 1 4 4 12
2.00 2.19 2.36 2.44 2.31 314
More convenient on-street parking on ECR
1 Least desirable 15 32 33 53
2 5 21 14 23
3 Neutral 8 19 29 37
4 1 4 6 5
5 Most desirable 2 3 1 3
2.03 2.05 2.13 2.02 2.06 314
More convenient parking within walking distance to ECR
1 Least desirable 8 11 6 12
2 4 17 4 12

Community Survey Report Appendix B: Transportation Survey Responses
B-79
10. Please score each of the following items that you would like to see on El Camino Real from 1 (least desirable) to 5 (most desirable).
Do you walk along or across El Camino Real? (Select one)
Answer Options On a daily
basis Several times
per week Mostly on weekends
Almost never
Rating Average
Response Count
3 Neutral 7 25 38 49
4 8 16 23 32
5 Most desirable 4 11 12 16
2.87 2.99 3.37 3.23 3.17 315
More bike parking close to downtown
1 Least desirable 3 2 4 7
2 0 2 2 5
3 Neutral 4 11 20 37
4 11 31 32 32
5 Most desirable 13 33 25 40
4.00 4.15 3.87 3.77 3.91 314
Inclusion of bicycle lanes on ECR
1 Least desirable 5 6 9 20
2 1 4 5 6
3 Neutral 1 6 12 14
4 5 14 16 22
5 Most desirable 19 50 41 59
4.03 4.23 3.90 3.78 3.95 315
Enhanced pedestrian safety and crossings on ECR
1 Least desirable 0 1 1 4
2 1 1 0 2
3 Neutral 6 8 16 21
4 3 18 26 30
5 Most desirable 21 52 40 64
4.42 4.49 4.25 4.22 4.32 315
Wider sidewalks on ECR
1 Least desirable 0 1 4 13
2 3 5 7 13
3 Neutral 5 22 30 38
4 7 8 16 23
5 Most desirable 16 43 26 34
4.16 4.10 3.64 3.43 3.73 314
Additional through lanes on El Camino Real
1 Least desirable 10 19 16 27
2 4 12 13 16
3 Neutral 7 20 28 37
4 5 19 14 19
5 Most desirable 5 10 12 22
2.71 2.86 2.92 2.94 2.89 315
Increased vehicle safety on ECR

El Camino Real Corridor Study
B-80
10. Please score each of the following items that you would like to see on El Camino Real from 1 (least desirable) to 5 (most desirable).
Do you walk along or across El Camino Real? (Select one)
Answer Options On a daily
basis Several times
per week Mostly on weekends
Almost never
Rating Average
Response Count
1 Least desirable 1 2 1 4
2 2 7 3 6
3 Neutral 11 26 44 48
4 5 26 20 33
5 Most desirable 12 18 15 30
3.81 3.65 3.54 3.65 3.64 314
Additional transit service along ECR
1 Least desirable 5 6 3 15
2 3 8 8 7
3 Neutral 13 41 52 62
4 3 18 16 24
5 Most desirable 7 6 4 13
3.13 3.13 3.12 3.11 3.12 314
Timing traffic signals to favor continuous north-south flow on ECR
1 Least desirable 5 7 3 3
2 0 6 5 9
3 Neutral 9 17 19 30
4 6 18 22 28
5 Most desirable 11 32 34 51
3.58 3.78 3.95 3.95 3.87 315
Timing traffic signals to favor east west access
1 Least desirable 5 7 8 13
2 4 15 16 16
3 Neutral 12 31 35 55
4 4 17 17 19
5 Most desirable 6 9 7 18
3.06 3.08 2.99 3.11 3.06 314
Reduction of vehicle miles travelled on ECR (reduction in traffic passing through Menlo Park on ECR)
1 Least desirable 2 5 5 7
2 4 12 3 9
3 Neutral 10 24 34 43
4 4 15 16 29
5 Most desirable 11 23 25 33
3.58 3.49 3.64 3.60 3.58 314
Reduction in delay at signalized intersections on ECR
1 Least desirable 3 3 0 2
2 0 9 1 2
3 Neutral 11 24 32 51
4 5 22 32 37
5 Most desirable 12 21 18 29

Community Survey Report Appendix B: Transportation Survey Responses
B-81
10. Please score each of the following items that you would like to see on El Camino Real from 1 (least desirable) to 5 (most desirable).
Do you walk along or across El Camino Real? (Select one)
Answer Options On a daily
basis Several times
per week Mostly on weekends
Almost never
Rating Average
Response Count
3.74 3.62 3.81 3.74 3.73 314
More landscaped medians on ECR
1 Least desirable 5 5 11 15
2 5 10 7 12
3 Neutral 10 28 34 52
4 2 21 15 29
5 Most desirable 9 15 16 13
3.16 3.39 3.22 3.11 3.21 314
More landscaping along ECR (providing buffers between pedestrians or bicyclists and vehicles)
1 Least desirable 0 1 6 9
2 2 4 4 7
3 Neutral 11 12 17 34
4 3 29 23 30
5 Most desirable 15 33 33 41
4.00 4.13 3.88 3.72 3.89 314
answered question 315 skipped question 0

El Camino Real Corridor Study
B-82
11. General Safety and Environmental Concerns
Do you walk along or across El Camino Real? (Select one)
Answer Options On a daily
basis Several times
per week Mostly on weekends
Almost never
Rating Average
Response Count
ECR is only safe if you are in a vehicle.
Strongly disagree 1 1 2 11 Somewhat disagree 3 17 10 17 Neutral/No opinion 2 3 4 13
Somewhat agree 14 38 34 36
Strongly agree 9 19 22 38
3.93 3.73 3.89 3.63 3.75 294
Ensuring that children can safely cross ECR to get to and from school should be a high priority.
Strongly disagree 0 0 1 1 Somewhat disagree 1 4 3 3 Neutral/No opinion 3 8 10 11
Somewhat agree 6 17 26 36
Strongly agree 19 49 32 63
4.48 4.42 4.18 4.38 4.35 293
Mitigating poor air quality from vehicle traffic/congestion should be a high priority.
Strongly disagree 2 1 4 8 Somewhat disagree
4 5 3 13
Neutral/No opinion 6 19 22 27
Somewhat agree 6 17 24 38
Strongly agree 11 35 19 29
3.69 4.04 3.71 3.58 3.74 293
Signage (for cross streets, turns) is not clear enough and needs to be improved.
Strongly disagree 3 4 6 9 Somewhat disagree 6 16 18 20 Neutral/No opinion
14 31 34 56
Somewhat agree 4 19 10 19
Strongly agree 2 6 4 11
2.86 3.09 2.83 3.03 2.98 292
answered question 294 skipped question 21

Community Survey Report Appendix B: Transportation Survey Responses
B-83
12. Walking Environment
Do you walk along or across El Camino Real? (Select one)
Answer Options On a daily
basis Several times
per week Mostly on weekends
Almost never
Rating Average
Response Count
Signals are long enough to allow people to walk across ECR safely.
Strongly disagree 2 5 3 3
Somewhat disagree 9 18 12 16
Neutral/no opinion 2 12 7 24
Somewhat agree 13 31 30 45
Strongly agree 3 11 18 25
3.21 3.32 3.69 3.65 3.53 289
Vehicle speeds should be slower to make the road safer for people walking.
Strongly disagree 4 5 6 15
Somewhat disagree 1 20 16 29
Neutral/no opinion 10 20 33 37
Somewhat agree 9 16 8 24
Strongly agree 5 16 7 9
3.34 3.23 2.91 2.85 3.02 290
Bicycles on the sidewalks are a threat to pedestrian safety.
Strongly disagree 2 8 6 6
Somewhat disagree 1 16 8 16
Neutral/no opinion 2 14 13 16
Somewhat agree 9 27 26 43
Strongly agree 15 11 17 34
4.17 3.22 3.57 3.72 3.60 290 A parallel pedestrian path/trail should be provided, separated from the main roadway, possibly adjacent to the railroad tracks.
Strongly disagree 1 3 2 6
Somewhat disagree 1 4 3 11
Neutral/no opinion 5 14 16 22
Somewhat agree 6 17 17 31
Strongly agree 16 39 32 44
4.21 4.10 4.06 3.84 4.00 290 If conditions for pedestrians on and across ECR were improved, I would walk rather than drive a car for some short trips and errands.
Strongly disagree 1 2 3 13
Somewhat disagree 0 7 9 22
Neutral/no opinion 5 8 12 33
Somewhat agree 3 21 14 25
Strongly agree 20 39 31 21
4.41 4.14 3.88 3.17 3.72 289
answered question 291 skipped question 24

El Camino Real Corridor Study
B-84
13. Transit
Do you walk along or across El Camino Real? (Select one)
Answer Options On a daily
basis Several times
per week Mostly on weekends
Almost never
Rating Average
Response Count
Dedicated bus/BRT (Bus Rapid Transit) lanes on ECR should be accommodated through Menlo Park.
Strongly disagree 10 13 13 24
Somewhat disagree 5 14 13 23
Neutral/No opinion 4 33 32 42
Somewhat agree 5 8 6 15
Strongly agree 5 9 6 8
2.66 2.82 2.70 2.64 2.70 288
answered question 288 skipped question 27
14. Vehicle Traffic Environment
Do you walk along or across El Camino Real? (Select one)
Answer Options On a daily
basis Several times
per week Mostly on weekends
Almost never
Rating Average
Response Count
Improving the flow of traffic for automobiles should be the highest priority for ECR.
Strongly disagree 14 24 12 23
Somewhat disagree 1 14 19 24
Neutral/No opinion 3 13 15 17
Somewhat agree 6 21 15 27
Strongly agree 5 5 8 21
2.55 2.60 2.83 2.99 2.80 287 There is enough capacity for automobiles right now; improvements should focus on other modes of travel (bicycles, pedestrians, transit)
Strongly disagree 3 3 7 21
Somewhat disagree 6 9 12 15
Neutral/No opinion 1 10 6 8
Somewhat agree 7 16 13 24
Strongly agree 12 39 32 44
3.66 4.03 3.73 3.49 3.71 288
Lanes should be made wider in order to better accommodate large trucks and delivery vehicles.
Strongly disagree 14 36 23 38
Somewhat disagree 7 22 22 37
Neutral/No opinion 6 17 19 29
Somewhat agree 1 2 5 8
Strongly agree 1 0 1 1
1.90 1.81 2.13 2.09 2.00 289
Solutions for ECR should attempt to separate regional through traffic from local traffic.
Strongly disagree 3 5 5 11
Somewhat disagree 4 14 17 24

Community Survey Report Appendix B: Transportation Survey Responses
B-85
14. Vehicle Traffic Environment
Do you walk along or across El Camino Real? (Select one)
Answer Options On a daily
basis Several times
per week Mostly on weekends
Almost never
Rating Average
Response Count
Neutral/No opinion 7 27 27 39
Somewhat agree 8 18 10 21
Strongly agree 7 13 11 16
3.41 3.26 3.07 3.06 3.15 287 Regional through traffic should be prioritized on ECR; short local trips should be routed along other roads through the community.
Strongly disagree 11 27 22 40
Somewhat disagree 5 21 18 31
Neutral/No opinion 6 18 27 29
Somewhat agree 4 9 1 9
Strongly agree 3 2 2 3
2.41 2.19 2.19 2.14 2.19 288
Controlling “spillover” traffic in the neighborhoods adjacent to ECR should be a high priority.
Strongly disagree 3 5 1 8
Somewhat disagree 4 14 11 19
Neutral/No opinion 5 25 19 34
Somewhat agree 6 13 15 26
Strongly agree 10 20 24 25
3.57 3.38 3.71 3.37 3.47 287
answered question 289 skipped question 26
15. Bicycling Environment
Do you walk along or across El Camino Real? (Select one)
Answer Options On a daily
basis Several times
per week Mostly on weekends
Almost never
Rating Average
Response Count
ECR is not safe or convenient to cross by bicycle.
Strongly disagree 2 2 2 12
Somewhat disagree 1 7 11 19
Neutral/No opinion 6 4 11 14
Somewhat agree 10 32 17 36
Strongly agree 10 32 29 33
3.86 4.10 3.86 3.52 3.79 290 Continuous bike lanes should be provided on ECR in both directions, because it is the most direct way for bicyclists to travel within and through Menlo Park.
Strongly disagree 4 3 9 14
Somewhat disagree 3 4 8 11
Neutral/No opinion 3 10 9 18
Somewhat agree 3 17 21 26

El Camino Real Corridor Study
B-86
15. Bicycling Environment
Do you walk along or across El Camino Real? (Select one)
Answer Options On a daily
basis Several times
per week Mostly on weekends
Almost never
Rating Average
Response Count
Strongly agree 16 43 23 43
3.83 4.21 3.59 3.65 3.80 288 If bicycle lanes are provided, they should be separated from vehicle traffic by a physical barrier to enhance safety.
Strongly disagree 5 2 5 8
Somewhat disagree 2 7 6 12
Neutral/No opinion 6 10 12 26
Somewhat agree 4 23 16 31
Strongly agree 12 35 31 37
3.55 4.06 3.89 3.68 3.82 290
Bicycles are best accommodated on adjacent parallel routes, not on ECR.
Strongly disagree 5 15 5 15
Somewhat disagree 5 12 4 23
Neutral/No opinion 7 14 7 20
Somewhat agree 5 16 22 23
Strongly agree 7 20 32 33
3.14 3.18 4.03 3.32 3.43 290
Currently, routes parallel to ECR are too discontinuous or conflicted for effective bike travel.
Strongly disagree 1 0 2 4
Somewhat disagree 1 3 3 3
Neutral/No opinion 3 3 7 17
Somewhat agree 7 20 17 33
Strongly agree 16 51 39 56
4.29 4.55 4.29 4.19 4.32 286 If conditions for bicyclists on and across ECR were improved, I would consider bicycling rather than driving for some short trips and errands.
Strongly disagree 3 1 4 16
Somewhat disagree 1 2 4 11
Neutral/No opinion 6 10 5 14
Somewhat agree 2 15 10 20
Strongly agree 17 49 47 52
4.00 4.42 4.31 3.72 4.08 289
answered question 291 skipped question 24

Community Survey Report Appendix B: Transportation Survey Responses
B-87
16. Parking Environment
Do you walk along or across El Camino Real? (Select one)
Answer Options On a daily
basis Several times
per week Mostly on weekends
Almost never
Rating Average
Response Count
Street parking on ECR is essential for the convenience of customers of small businesses located there.
Strongly disagree 11 21 19 26 Somewhat disagree 8 24 18 35 Neutral/No opinion 5 16 21 27
Somewhat agree 2 11 8 14
Strongly agree 3 4 4 10
2.24 2.38 2.43 2.53 2.44 287
Parking on ECR should be eliminated to free up more space for vehicle travel.
Strongly disagree 3 15 10 19 Somewhat disagree 2 10 10 15 Neutral/No opinion 7 18 17 31
Somewhat agree 11 21 18 25
Strongly agree 6 13 16 21
3.52 3.09 3.28 3.13 3.19 288
Parking on ECR should be eliminated to free up more space for bicycle lanes.
Strongly disagree 5 5 9 15 Somewhat disagree 1 6 5 9 Neutral/No opinion 5 6 10 23
Somewhat agree 5 22 17 30
Strongly agree 12 37 30 35
3.64 4.05 3.76 3.54 3.74 287 Any parking that is removed from ECR should be replaced with parking lots or garages off the roadway, nearby.
Strongly disagree 5 5 0 4 Somewhat disagree 2 11 4 6 Neutral/No opinion 9 16 20 23
Somewhat agree 6 27 27 46
Strongly agree 7 18 20 32
3.28 3.55 3.89 3.86 3.73 288
answered question 289 skipped question 26

El Camino Real Corridor Study
B-88
APPENDIX B: CROSS-TABULATIONS – QUESTION 7
1. Indicate the condition which applies to the location of your residence. (Select one)
Do you have a child that has to cross El
Camino Real to get to school? (Select one)
Answer Options Yes No Response Percent
Response Count
I live in Menlo Park within a half mile (4-5 blocks) of the El Camino Real Corridor.
32 114 46.3% 146
I live in Menlo Park, but farther than a half mile of the El Camino Real Corridor
23 79 32.4% 102
I don’t live in Menlo Park, but I do live within a half mile (4-5 blocks) of the El Camino Real Corridor.
4 37 13.0% 41
None of the above. 1 25 8.3% 26
answered question 315 skipped question 0
2. Indicate the condition which applies to the location of your work. (Select one)
Do you have a child that has to cross El
Camino Real to get to school? (Select one)
Answer Options Yes No Response Percent
Response Count
I work in Menlo Park within a half mile (4-5 blocks) of the El Camino Real Corridor.
15 41 17.8% 56
I work in Menlo Park, but farther than a half mile of the El Camino Real Corridor
11 36 14.9% 47
I don’t work in Menlo Park, but I do work within a half mile (4-5 blocks) of the El Camino Real Corridor.
10 66 24.1% 76
None of the above 24 112 43.2% 136
answered question 315 skipped question 0

Community Survey Report Appendix B: Transportation Survey Responses
B-89
3. Do you drive a vehicle on El Camino Real? (Select one)
Do you have a child that has to cross El
Camino Real to get to school? (Select one)
Answer Options Yes No Response Percent
Response Count
Multiple times per day 34 72 33.7% 106
Approximately once per day 8 37 14.3% 45
A few times a week 16 97 35.9% 113
Almost never 2 49 16.2% 51
answered question 315 skipped question 0
4. Do you ride a bike on or across El Camino Real? (Select one)
Do you have a child that has to cross El
Camino Real to get to school? (Select one)
Answer Options Yes No Response Percent
Response Count
On a daily basis 11 50 19.4% 61
Several times per week 11 58 21.9% 69
Mostly on weekends 15 45 19.0% 60
Almost never 23 102 39.7% 125
answered question 315 skipped question 0
5. Do you use local bus transit services that travel on El Camino Real? (Select one)
Do you have a child that has to cross El
Camino Real to get to school? (Select one)
Answer Options Yes No Response Percent
Response Count
On a daily basis 2 0 0.6% 2
Several times per week 2 10 3.8% 12
Mostly on weekends 0 4 1.3% 4
Almost never 56 241 94.3% 297
answered question 315 skipped question 0

El Camino Real Corridor Study
B-90
6. Do you walk along or across El Camino Real? (Select one)
Do you have a child that has to cross El
Camino Real to get to school? (Select one)
Answer Options Yes No Response Percent
Response Count
On a daily basis 3 28 9.8% 31
Several times per week 19 61 25.4% 80
Mostly on weekends 16 67 26.3% 83
Almost never 22 99 38.4% 121
answered question 315 skipped question 0
7. Do you have a child that has to cross El Camino Real to get to school? (Select one)
Do you have a child that has to cross El
Camino Real to get to school? (Select one)
Answer Options Yes No Response Percent
Response Count
Yes 60 0 19.0% 60
No 0 255 81.0% 255
answered question 315 skipped question 0
8. Please indicate the most common condition which applies to your use of the Menlo Park Caltrain station. (Select one)
Do you have a child that has to cross El
Camino Real to get to school? (Select one)
Answer Options Yes No Response Percent
Response Count
I walk to Caltrain 7 54 19.4% 61
I ride my bike to Caltrain 8 58 21.0% 66 I am dropped off by another vehicle or transit at Caltrain 2 11 4.1% 13
I drive and park at Caltrain 16 23 12.4% 39
I rarely use Caltrain 27 109 43.2% 136
answered question 315 skipped question 0

Community Survey Report Appendix B: Transportation Survey Responses
B-91
9. Why do you typically travel on El Camino Real? (Select all that apply)
Do you have a child that has to cross El
Camino Real to get to school? (Select one)
Answer Options Yes No Response Percent
Response Count
Travel to and/or from work 33 126 50.5% 159
Travel to and/or from school 31 29 19.0% 60
Travel for shopping 50 190 76.2% 240
Patronizing local businesses 43 173 68.6% 216
For physical activity 8 47 17.5% 55
Other (please specify) 36
answered question 315 skipped question 0
10. Please score each of the following items that you would like to see on El Camino Real from 1 (least desirable) to 5 (most desirable).
Do you have a child that has to cross El Camino Real to get
to school? (Select one)
Answer Options Yes No Rating
Average Response
Count
Lower travel speeds on El Camino Real (ECR)
1 Least desirable 14 55
2 3 22
3 Neutral 19 128
4 12 15
5 Most desirable 12 33
3.08 2.80 2.85 313
Higher travel speeds on ECR
1 Least desirable 30 96
2 10 27
3 Neutral 12 87
4 4 27
5 Most desirable 4 17
2.03 2.38 2.31 314
More convenient on-street parking on ECR
1 Least desirable 28 105
2 11 52
3 Neutral 16 77
4 5 11
5 Most desirable 0 9
1.97 2.08 2.06 314
More convenient parking within walking distance to ECR
1 Least desirable 4 33
2 5 32
3 Neutral 28 91

El Camino Real Corridor Study
B-92
10. Please score each of the following items that you would like to see on El Camino Real from 1 (least desirable) to 5 (most desirable).
Do you have a child that has to cross El Camino Real to get
to school? (Select one)
Answer Options Yes No Rating
Average Response
Count
4 13 66
5 Most desirable 10 33
3.33 3.13 3.17 315
More bike parking close to downtown
1 Least desirable 3 13
2 3 6
3 Neutral 15 57
4 16 90
5 Most desirable 23 88
3.88 3.92 3.91 314
Inclusion of bicycle lanes on ECR
1 Least desirable 5 35
2 5 11
3 Neutral 10 23
4 12 45
5 Most desirable 28 141
3.88 3.96 3.95 315
Enhanced pedestrian safety and crossings on ECR
1 Least desirable 1 5
2 0 4
3 Neutral 5 46
4 10 67
5 Most desirable 44 133
4.60 4.25 4.32 315
Wider sidewalks on ECR
1 Least desirable 5 13
2 5 23
3 Neutral 21 74
4 9 45
5 Most desirable 20 99
3.57 3.76 3.73 314
Additional through lanes on El Camino Real
1 Least desirable 17 55
2 9 36
3 Neutral 10 82
4 11 46
5 Most desirable 13 36
2.90 2.89 2.89 315
Increased vehicle safety on ECR
1 Least desirable 0 8

Community Survey Report Appendix B: Transportation Survey Responses
B-93
10. Please score each of the following items that you would like to see on El Camino Real from 1 (least desirable) to 5 (most desirable).
Do you have a child that has to cross El Camino Real to get
to school? (Select one)
Answer Options Yes No Rating
Average Response
Count
2 2 16
3 Neutral 24 105
4 15 69
5 Most desirable 19 56
3.85 3.59 3.64 314
Additional transit service along ECR
1 Least desirable 4 25
2 8 18
3 Neutral 37 131
4 11 50
5 Most desirable 0 30
2.92 3.17 3.12 314
Timing traffic signals to favor continuous north-south flow on ECR
1 Least desirable 4 14
2 1 19
3 Neutral 17 58
4 17 57
5 Most desirable 21 107
3.83 3.88 3.87 315
Timing traffic signals to favor east west access
1 Least desirable 5 28
2 6 45
3 Neutral 29 104
4 12 45
5 Most desirable 8 32
3.20 3.03 3.06 314
Reduction of vehicle miles travelled on ECR (reduction in traffic passing through Menlo Park on ECR)
1 Least desirable 4 15
2 8 20
3 Neutral 20 91
4 11 53
5 Most desirable 17 75
3.48 3.60 3.58 314
Reduction in delay at signalized intersections on ECR
1 Least desirable 1 7
2 2 10
3 Neutral 22 96
4 19 77
5 Most desirable 16 64
3.78 3.71 3.73 314

El Camino Real Corridor Study
B-94
10. Please score each of the following items that you would like to see on El Camino Real from 1 (least desirable) to 5 (most desirable).
Do you have a child that has to cross El Camino Real to get
to school? (Select one)
Answer Options Yes No Rating
Average Response
Count
More landscaped medians on ECR
1 Least desirable 4 32
2 6 28
3 Neutral 22 102
4 17 50
5 Most desirable 11 42
3.42 3.17 3.21 314
More landscaping along ECR (providing buffers between pedestrians or bicyclists and vehicles)
1 Least desirable 0 16
2 1 16
3 Neutral 14 60
4 21 64
5 Most desirable 24 98
4.13 3.83 3.89 314
answered question 315 skipped question 0

Community Survey Report Appendix B: Transportation Survey Responses
B-95
11. General Safety and Environmental Concerns
Do you have a child that has to cross El Camino Real to get
to school? (Select one)
Answer Options Yes No Rating
Average Response
Count
ECR is only safe if you are in a vehicle.
Strongly disagree 2 13
Somewhat disagree 7 40
Neutral/No opinion 1 21
Somewhat agree 23 99
Strongly agree 21 67
4.00 3.70 3.75 294
Ensuring that children can safely cross ECR to get to and from school should be a high priority.
Strongly disagree 0 2
Somewhat disagree 2 9
Neutral/No opinion 0 32
Somewhat agree 10 75
Strongly agree 42 121
4.70 4.27 4.35 293
Mitigating poor air quality from vehicle traffic/congestion should be a high priority.
Strongly disagree 2 13
Somewhat disagree 7 18
Neutral/No opinion 11 63
Somewhat agree 17 68
Strongly agree 17 77
3.74 3.74 3.74 293
Signage (for cross streets, turns) is not clear enough and needs to be improved.
Strongly disagree 7 15
Somewhat disagree 9 51
Neutral/No opinion 24 111
Somewhat agree 9 43
Strongly agree 5 18
2.93 2.99 2.98 292
answered question 294 skipped question 21

El Camino Real Corridor Study
B-96
12. Walking Environment
Do you have a child that has to cross El Camino Real to get
to school? (Select one)
Answer Options Yes No Rating
Average Response
Count
Signals are long enough to allow people to walk across ECR safely.
Strongly disagree 3 10
Somewhat disagree 10 45
Neutral/no opinion 8 37
Somewhat agree 22 97
Strongly agree 10 47
3.49 3.53 3.53 289
Vehicle speeds should be slower to make the road safer for people walking.
Strongly disagree 6 24
Somewhat disagree 11 55
Neutral/no opinion 12 88
Somewhat agree 12 45
Strongly agree 12 25
3.25 2.97 3.02 290
Bicycles on the sidewalks are a threat to pedestrian safety.
Strongly disagree 6 16
Somewhat disagree 9 32
Neutral/no opinion 11 34
Somewhat agree 19 86
Strongly agree 9 68
3.30 3.67 3.60 290 A parallel pedestrian path/trail should be provided, separated from the main roadway, possibly adjacent to the railroad tracks.
Strongly disagree 2 10
Somewhat disagree 5 14
Neutral/no opinion 12 45
Somewhat agree 12 59
Strongly agree 23 108
3.91 4.02 4.00 290 If conditions for pedestrians on and across ECR were improved, I would walk rather than drive a car for some short trips and errands.
Strongly disagree 5 14
Somewhat disagree 6 32
Neutral/no opinion 8 50
Somewhat agree 9 54
Strongly agree 26 85
3.83 3.70 3.72 289
answered question 291 skipped question 24

Community Survey Report Appendix B: Transportation Survey Responses
B-97
13. Transit
Do you have a child that has to cross El Camino Real to get
to school? (Select one)
Answer Options Yes No Rating
Average Response
Count
Dedicated bus/BRT (Bus Rapid Transit) lanes on ECR should be accommodated through Menlo Park.
Strongly disagree 10 50
Somewhat disagree 17 38
Neutral/No opinion 20 91
Somewhat agree 3 31
Strongly agree 3 25
2.47 2.76 2.70 288
answered question 288 skipped question 27
14. Vehicle Traffic Environment
Do you have a child that has to cross El Camino Real to get
to school? (Select one)
Answer Options Yes No Rating
Average Response
Count
Improving the flow of traffic for automobiles should be the highest priority for ECR.
Strongly disagree 11 62
Somewhat disagree 11 47
Neutral/No opinion 10 38
Somewhat agree 13 56
Strongly agree 7 32
2.88 2.78 2.80 287 There is enough capacity for automobiles right now; improvements should focus on other modes of travel (bicycles, pedestrians, transit)
Strongly disagree 5 29
Somewhat disagree 10 32
Neutral/No opinion 5 20
Somewhat agree 7 53
Strongly agree 25 102
3.71 3.71 3.71 288
Lanes should be made wider in order to better accommodate large trucks and delivery vehicles.
Strongly disagree 19 92
Somewhat disagree 14 74
Neutral/No opinion 17 54
Somewhat agree 1 15
Strongly agree 1 2
2.06 1.99 2.00 289
Solutions for ECR should attempt to separate regional through traffic from local traffic.
Strongly disagree 7 17
Somewhat disagree 15 44

El Camino Real Corridor Study
B-98
14. Vehicle Traffic Environment
Do you have a child that has to cross El Camino Real to get
to school? (Select one)
Answer Options Yes No Rating
Average Response
Count
Neutral/No opinion 15 85
Somewhat agree 8 49
Strongly agree 7 40
2.87 3.22 3.15 287 Regional through traffic should be prioritized on ECR; short local trips should be routed along other roads through the community.
Strongly disagree 20 80
Somewhat disagree 17 58
Neutral/No opinion 9 71
Somewhat agree 6 17
Strongly agree 0 10
2.02 2.23 2.19 288
Controlling “spillover” traffic in the neighborhoods adjacent to ECR should be a high priority.
Strongly disagree 4 13
Somewhat disagree 9 39
Neutral/No opinion 12 71
Somewhat agree 9 51
Strongly agree 18 61
3.54 3.46 3.47 287
answered question 289 skipped question 26
15. Bicycling Environment
Do you have a child that has to cross El Camino Real to get
to school? (Select one)
Answer Options Yes No Rating
Average Response
Count
ECR is not safe or convenient to cross by bicycle.
Strongly disagree 2 16
Somewhat disagree 4 34
Neutral/No opinion 1 34
Somewhat agree 21 74
Strongly agree 26 78
4.20 3.69 3.79 290 Continuous bike lanes should be provided on ECR in both directions, because it is the most direct way for bicyclists to travel within and through Menlo Park.
Strongly disagree 6 24
Somewhat disagree 5 21
Neutral/No opinion 10 30
Somewhat agree 13 54

Community Survey Report Appendix B: Transportation Survey Responses
B-99
15. Bicycling Environment
Do you have a child that has to cross El Camino Real to get
to school? (Select one)
Answer Options Yes No Rating
Average Response
Count
Strongly agree 20 105
3.67 3.83 3.80 288 If bicycle lanes are provided, they should be separated from vehicle traffic by a physical barrier to enhance safety.
Strongly disagree 5 15
Somewhat disagree 6 21
Neutral/No opinion 7 47
Somewhat agree 17 57
Strongly agree 19 96
3.72 3.84 3.82 290
Bicycles are best accommodated on adjacent parallel routes, not on ECR.
Strongly disagree 9 31
Somewhat disagree 10 34
Neutral/No opinion 6 42
Somewhat agree 13 53
Strongly agree 16 76
3.31 3.46 3.43 290
Currently, routes parallel to ECR are too discontinuous or conflicted for effective bike travel.
Strongly disagree 1 6
Somewhat disagree 3 7
Neutral/No opinion 5 25
Somewhat agree 14 63
Strongly agree 29 133
4.29 4.32 4.32 286 If conditions for bicyclists on and across ECR were improved, I would consider bicycling rather than driving for some short trips and errands.
Strongly disagree 2 22
Somewhat disagree 3 15
Neutral/No opinion 5 30
Somewhat agree 8 39
Strongly agree 35 130
4.34 4.02 4.08 289
answered question 291 skipped question 24

El Camino Real Corridor Study
B-100
16. Parking Environment
Do you have a child that has to cross El Camino Real to get
to school? (Select one)
Answer Options Yes No Rating
Average Response
Count
Street parking on ECR is essential for the convenience of customers of small businesses located there.
Strongly disagree 14 63
Somewhat disagree 17 68
Neutral/No opinion 12 57
Somewhat agree 6 29
Strongly agree 3 18
2.37 2.45 2.44 287
Parking on ECR should be eliminated to free up more space for vehicle travel.
Strongly disagree 14 33
Somewhat disagree 8 29
Neutral/No opinion 11 62
Somewhat agree 12 63
Strongly agree 8 48
2.85 3.27 3.19 288
Parking on ECR should be eliminated to free up more space for bicycle lanes.
Strongly disagree 7 27
Somewhat disagree 3 18
Neutral/No opinion 11 33
Somewhat agree 12 62
Strongly agree 20 94
3.66 3.76 3.74 287 Any parking that is removed from ECR should be replaced with parking lots or garages off the roadway, nearby.
Strongly disagree 2 12
Somewhat disagree 4 19
Neutral/No opinion 20 48
Somewhat agree 14 92
Strongly agree 12 65
3.58 3.76 3.73 288
answered question 289 skipped question 26

Community Survey Report Appendix B: Transportation Survey Responses
B-101
APPENDIX B: CROSS-TABULATIONS – QUESTION 8
1. Indicate the condition which applies to the location of your residence. (Select one)
Please indicate the most common condition which applies to
your use of the Menlo Park Caltrain station. (Select one)
Answer Options I walk
to Caltrain
I ride my bike
to Caltrain
I am dropped off by another
vehicle or transit at Caltrain
I drive and
park at Caltrain
I rarely use
Caltrain
Response Percent
Response Count
I live in Menlo Park within a half mile (4-5 blocks) of the El Camino Real Corridor.
51 17 5 17 56 46.3% 146
I live in Menlo Park, but farther than a half mile of the El Camino Real Corridor
7 15 6 17 57 32.4% 102
I don’t live in Menlo Park, but I do live within a half mile (4-5 blocks) of the El Camino Real Corridor.
2 20 1 3 15 13.0% 41
None of the above. 1 14 1 2 8 8.3% 26
answered question 315 skipped question 0
2. Indicate the condition which applies to the location of your work. (Select one)
Please indicate the most common condition which applies to
your use of the Menlo Park Caltrain station. (Select one)
Answer Options I walk
to Caltrain
I ride my bike
to Caltrain
I am dropped off by another
vehicle or transit at Caltrain
I drive and
park at Caltrain
I rarely use
Caltrain
Response Percent
Response Count
I work in Menlo Park within a half mile (4-5 blocks) of the El Camino Real Corridor.
14 9 3 7 23 17.8% 56
I work in Menlo Park, but farther than a half mile of the El Camino Real Corridor
7 8 3 9 20 14.9% 47
I don’t work in Menlo Park, but I do work within a half mile (4-5 blocks) of the El Camino Real Corridor.
18 26 3 9 20 24.1% 76
None of the above 22 23 4 14 73 43.2% 136
answered question 315 skipped question 0

El Camino Real Corridor Study
B-102
3. Do you drive a vehicle on El Camino Real? (Select one)
Please indicate the most common condition which applies to your use
of the Menlo Park Caltrain station. (Select one)
Answer Options I walk
to Caltrain
I ride my bike to Caltrain
I am dropped off by another vehicle or transit at Caltrain
I drive and park at Caltrain
I rarely use
Caltrain
Response Percent
Response Count
Multiple times per day 23 6 7 24 46 33.7% 106 Approximately once per day 8 2 1 2 32 14.3% 45
A few times a week 25 24 5 11 48 35.9% 113
Almost never 5 34 0 2 10 16.2% 51
answered question 315 skipped question 0
4. Do you ride a bike on or across El Camino Real? (Select one)
Please indicate the most common condition which applies to your use
of the Menlo Park Caltrain station. (Select one)
Answer Options I walk
to Caltrain
I ride my bike to Caltrain
I am dropped off by another vehicle or transit at Caltrain
I drive and park at Caltrain
I rarely use
Caltrain
Response Percent
Response Count
On a daily basis 13 34 3 3 8 19.4% 61
Several times per week 14 25 3 7 20 21.9% 69
Mostly on weekends 12 5 3 8 32 19.0% 60
Almost never 22 2 4 21 76 39.7% 125
answered question 315 skipped question 0
5. Do you use local bus transit services that travel on El Camino Real? (Select one)
Please indicate the most common condition which applies to your use
of the Menlo Park Caltrain station. (Select one)
Answer Options I walk
to Caltrain
I ride my bike to Caltrain
I am dropped off by another vehicle or transit at Caltrain
I drive and park at Caltrain
I rarely use
Caltrain
Response Percent
Response Count
On a daily basis 0 0 0 1 1 0.6% 2
Several times per week 3 7 0 0 2 3.8% 12
Mostly on weekends 2 1 1 0 0 1.3% 4
Almost never 56 58 12 38 133 94.3% 297
answered question 315 skipped question 0

Community Survey Report Appendix B: Transportation Survey Responses
B-103
6. Do you walk along or across El Camino Real? (Select one)
Please indicate the most common condition which applies to your use
of the Menlo Park Caltrain station. (Select one)
Answer Options I walk
to Caltrain
I ride my bike to Caltrain
I am dropped off by another vehicle or transit at Caltrain
I drive and park at Caltrain
I rarely use
Caltrain
Response Percent
Response Count
On a daily basis 18 6 1 3 3 9.8% 31
Several times per week 20 25 7 6 22 25.4% 80
Mostly on weekends 16 15 2 11 39 26.3% 83
Almost never 7 20 3 19 72 38.4% 121
answered question 315 skipped question 0
7. Do you have a child that has to cross El Camino Real to get to school? (Select one)
Please indicate the most common condition which applies to your use
of the Menlo Park Caltrain station. (Select one)
Answer Options I walk
to Caltrain
I ride my bike to Caltrain
I am dropped off by another vehicle or transit at Caltrain
I drive and park at Caltrain
I rarely use
Caltrain
Response Percent
Response Count
Yes 7 8 2 16 27 19.0% 60
No 54 58 11 23 109 81.0% 255
answered question 315 skipped question 0
8. Please indicate the most common condition which applies to your use of the Menlo Park Caltrain station. (Select one)
Please indicate the most common condition which applies to your use
of the Menlo Park Caltrain station. (Select one)
Answer Options I walk
to Caltrain
I ride my bike to Caltrain
I am dropped off by another vehicle or transit at Caltrain
I drive and park at Caltrain
I rarely use
Caltrain
Response Percent
Response Count
I walk to Caltrain 61 0 0 0 0 19.4% 61 I ride my bike to Caltrain 0 66 0 0 0 21.0% 66
I am dropped off by another vehicle or transit at Caltrain
0 0 13 0 0 4.1% 13
I drive and park at Caltrain 0 0 0 39 0 12.4% 39
I rarely use Caltrain 0 0 0 0 136 43.2% 136
answered question 315 skipped question 0

El Camino Real Corridor Study
B-104
9. Why do you typically travel on El Camino Real? (Select all that apply)
Please indicate the most common condition which applies to your use
of the Menlo Park Caltrain station. (Select one)
Answer Options I walk
to Caltrain
I ride my bike to Caltrain
I am dropped off by another vehicle or transit at Caltrain
I drive and park at Caltrain
I rarely use
Caltrain
Response Percent
Response Count
Travel to and/or from work
35 46 8 18 52 50.5% 159
Travel to and/or from school 6 14 5 14 21 19.0% 60
Travel for shopping 50 44 13 29 104 76.2% 240 Patronizing local businesses 43 49 10 26 88 68.6% 216
For physical activity 17 12 5 4 17 17.5% 55
Other (please specify) 36
answered question 315 skipped question 0
10. Please score each of the following items that you would like to see on El Camino Real from 1 (least desirable) to 5 (most desirable).
Please indicate the most common condition which applies to your use of
the Menlo Park Caltrain station. (Select one)
Answer Options I walk
to Caltrain
I ride my bike to Caltrain
I am dropped off by another vehicle or transit at Caltrain
I drive and park at Caltrain
I rarely use
Caltrain
Rating Average
Response Count
Lower travel speeds on El Camino Real (ECR)
1 Least desirable 11 8 5 10 35
2 4 4 2 5 10
3 Neutral 28 34 5 13 67
4 5 7 0 4 11
5 Most desirable 13 13 1 6 12
3.08 3.20 2.23 2.76 2.67 2.85 313
Higher travel speeds on ECR
1 Least desirable 24 32 5 15 50
2 9 10 1 5 12
3 Neutral 19 17 4 7 52
4 7 6 2 6 10
5 Most desirable 2 1 1 6 11
2.25 2.00 2.46 2.56 2.41 2.31 314
More convenient on-street parking on ECR
1 Least desirable 26 24 6 24 53
2 13 17 5 5 23
3 Neutral 16 19 1 7 50
4 3 4 1 3 5
5 Most desirable 3 2 0 0 4
2.08 2.14 1.77 1.72 2.14 2.06 314
More convenient parking within walking distance to ECR

Community Survey Report Appendix B: Transportation Survey Responses
B-105
10. Please score each of the following items that you would like to see on El Camino Real from 1 (least desirable) to 5 (most desirable).
Please indicate the most common condition which applies to your use of
the Menlo Park Caltrain station. (Select one)
Answer Options I walk
to Caltrain
I ride my bike to Caltrain
I am dropped off by another vehicle or transit at Caltrain
I drive and park at Caltrain
I rarely use
Caltrain
Rating Average
Response Count
1 Least desirable 13 7 2 6 9
2 10 13 3 1 10
3 Neutral 14 24 4 11 66
4 14 15 3 12 35
5 Most desirable 10 7 1 9 16
2.97 3.03 2.85 3.44 3.29 3.17 315
More bike parking close to downtown
1 Least desirable 2 1 0 3 10
2 0 0 1 2 6
3 Neutral 14 1 3 10 44
4 21 27 5 12 41
5 Most desirable 24 37 4 12 34
4.07 4.50 3.92 3.72 3.61 3.91 314
Inclusion of bicycle lanes on ECR
1 Least desirable 7 1 0 9 23
2 1 0 1 4 10
3 Neutral 4 1 1 2 25
4 13 8 3 10 23
5 Most desirable 36 56 8 14 55
4.15 4.79 4.38 3.41 3.57 3.95 315
Enhanced pedestrian safety and crossings on ECR
1 Least desirable 1 1 0 1 3
2 0 0 0 2 2
3 Neutral 7 9 2 5 28
4 15 17 3 13 29
5 Most desirable 38 39 8 18 74
4.46 4.41 4.46 4.15 4.24 4.32 315
Wider sidewalks on ECR
1 Least desirable 1 1 1 4 11
2 5 6 1 2 14
3 Neutral 18 10 5 15 47
4 7 16 1 8 22
5 Most desirable 30 33 5 10 41
3.98 4.12 3.62 3.46 3.50 3.73 314
Additional through lanes on El Camino Real
1 Least desirable 19 19 2 8 24
2 8 12 3 3 19
3 Neutral 18 24 3 5 42
4 8 6 4 14 25

El Camino Real Corridor Study
B-106
10. Please score each of the following items that you would like to see on El Camino Real from 1 (least desirable) to 5 (most desirable).
Please indicate the most common condition which applies to your use of
the Menlo Park Caltrain station. (Select one)
Answer Options I walk
to Caltrain
I ride my bike to Caltrain
I am dropped off by another vehicle or transit at Caltrain
I drive and park at Caltrain
I rarely use
Caltrain
Rating Average
Response Count
5 Most desirable 8 5 1 9 26
2.64 2.48 2.92 3.33 3.07 2.89 315
Increased vehicle safety on ECR
1 Least desirable 3 1 0 0 4
2 3 7 1 0 7
3 Neutral 21 24 7 14 63
4 15 22 3 16 28
5 Most desirable 19 12 2 9 33
3.72 3.56 3.46 3.87 3.59 3.64 314
Additional transit service along ECR
1 Least desirable 6 4 0 1 18
2 10 3 0 4 9
3 Neutral 27 30 9 19 83
4 9 22 3 14 13
5 Most desirable 9 7 1 1 12
3.08 3.38 3.38 3.26 2.94 3.12 314
Timing traffic signals to favor continuous north-south flow on ECR
1 Least desirable 7 3 0 2 6
2 2 8 0 1 9
3 Neutral 13 27 4 4 27
4 15 12 3 13 31
5 Most desirable 24 16 6 19 63
3.77 3.45 4.15 4.18 4.00 3.87 315
Timing traffic signals to favor east west access
1 Least desirable 9 3 3 3 15
2 10 11 4 8 18
3 Neutral 26 31 4 16 56
4 6 14 1 8 28
5 Most desirable 10 7 1 4 18
2.97 3.17 2.46 3.05 3.12 3.06 314
Reduction of vehicle miles travelled on ECR (reduction in traffic passing through Menlo Park on ECR)
1 Least desirable 4 3 1 3 8
2 8 4 1 6 9
3 Neutral 16 25 6 13 51
4 13 22 2 8 19
5 Most desirable 20 12 3 9 48
3.61 3.55 3.38 3.36 3.67 3.58 314
Reduction in delay at signalized intersections on ECR
1 Least desirable 3 0 0 2 3

Community Survey Report Appendix B: Transportation Survey Responses
B-107
10. Please score each of the following items that you would like to see on El Camino Real from 1 (least desirable) to 5 (most desirable).
Please indicate the most common condition which applies to your use of
the Menlo Park Caltrain station. (Select one)
Answer Options I walk
to Caltrain
I ride my bike to Caltrain
I am dropped off by another vehicle or transit at Caltrain
I drive and park at Caltrain
I rarely use
Caltrain
Rating Average
Response Count
2 3 6 0 0 3
3 Neutral 21 35 4 11 47
4 19 13 7 17 40
5 Most desirable 15 12 2 9 42
3.66 3.47 3.85 3.79 3.85 3.73 314
More landscaped medians on ECR
1 Least desirable 10 8 1 5 12
2 10 9 2 3 10
3 Neutral 19 27 5 11 62
4 5 16 2 11 33
5 Most desirable 17 6 3 9 18
3.15 3.05 3.31 3.41 3.26 3.21 314
More landscaping along ECR (providing buffers between pedestrians or bicyclists and vehicles)
1 Least desirable 5 1 1 1 8
2 4 2 1 3 7
3 Neutral 10 17 3 8 36
4 15 18 3 10 39
5 Most desirable 27 28 5 17 45
3.90 4.06 3.77 4.00 3.79 3.89 314
answered question 315 skipped question 0
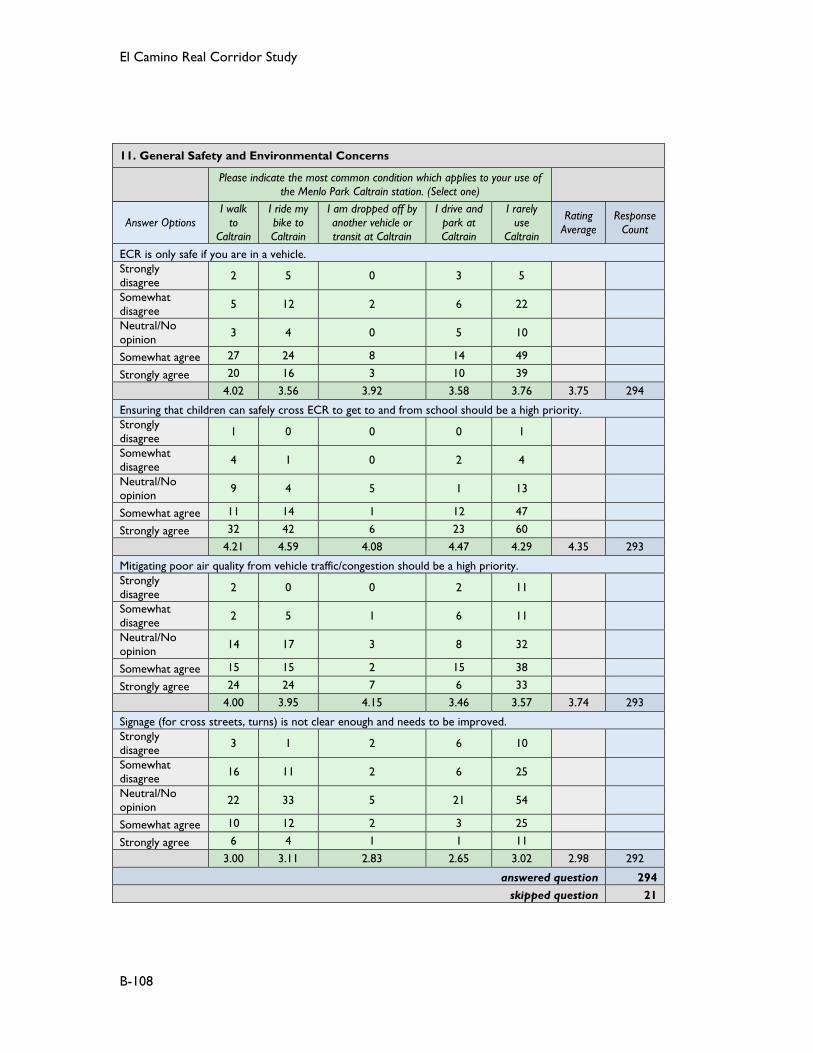
El Camino Real Corridor Study
B-108
11. General Safety and Environmental Concerns
Please indicate the most common condition which applies to your use of
the Menlo Park Caltrain station. (Select one)
Answer Options I walk
to Caltrain
I ride my bike to Caltrain
I am dropped off by another vehicle or transit at Caltrain
I drive and park at Caltrain
I rarely use
Caltrain
Rating Average
Response Count
ECR is only safe if you are in a vehicle. Strongly disagree 2 5 0 3 5 Somewhat disagree 5 12 2 6 22 Neutral/No opinion 3 4 0 5 10
Somewhat agree 27 24 8 14 49
Strongly agree 20 16 3 10 39
4.02 3.56 3.92 3.58 3.76 3.75 294
Ensuring that children can safely cross ECR to get to and from school should be a high priority. Strongly disagree 1 0 0 0 1 Somewhat disagree 4 1 0 2 4 Neutral/No opinion 9 4 5 1 13
Somewhat agree 11 14 1 12 47
Strongly agree 32 42 6 23 60
4.21 4.59 4.08 4.47 4.29 4.35 293
Mitigating poor air quality from vehicle traffic/congestion should be a high priority. Strongly disagree 2 0 0 2 11 Somewhat disagree 2 5 1 6 11 Neutral/No opinion 14 17 3 8 32
Somewhat agree 15 15 2 15 38
Strongly agree 24 24 7 6 33
4.00 3.95 4.15 3.46 3.57 3.74 293
Signage (for cross streets, turns) is not clear enough and needs to be improved. Strongly disagree 3 1 2 6 10 Somewhat disagree 16 11 2 6 25 Neutral/No opinion 22 33 5 21 54
Somewhat agree 10 12 2 3 25
Strongly agree 6 4 1 1 11
3.00 3.11 2.83 2.65 3.02 2.98 292
answered question 294 skipped question 21

Community Survey Report Appendix B: Transportation Survey Responses
B-109
12. Walking Environment
Please indicate the most common condition which applies to your use of
the Menlo Park Caltrain station. (Select one)
Answer Options I walk
to Caltrain
I ride my bike to Caltrain
I am dropped off by another vehicle or transit at Caltrain
I drive and park at Caltrain
I rarely use
Caltrain
Rating Average
Response Count
Signals are long enough to allow people to walk across ECR safely.
Strongly disagree 6 0 1 2 4
Somewhat disagree 14 18 0 7 16
Neutral/no opinion 4 9 0 7 25
Somewhat agree 25 25 7 12 50
Strongly agree 8 7 5 10 27
3.26 3.36 4.15 3.55 3.66 3.53 289
Vehicle speeds should be slower to make the road safer for people walking.
Strongly disagree 6 2 3 3 16
Somewhat disagree 11 5 2 10 38
Neutral/no opinion 15 26 6 12 41
Somewhat agree 14 15 1 8 19
Strongly agree 11 11 1 5 9
3.23 3.47 2.62 3.05 2.73 3.02 290
Bicycles on the sidewalks are a threat to pedestrian safety.
Strongly disagree 2 8 0 1 11
Somewhat disagree 6 12 5 5 13
Neutral/no opinion 11 3 2 6 23
Somewhat agree 24 19 4 13 45
Strongly agree 14 17 2 13 31
3.74 3.42 3.23 3.84 3.59 3.60 290 A parallel pedestrian path/trail should be provided, separated from the main roadway, possibly adjacent to the railroad tracks.
Strongly disagree 2 1 1 1 7
Somewhat disagree 2 5 0 0 12
Neutral/no opinion 9 13 2 10 23
Somewhat agree 14 12 5 14 26
Strongly agree 30 28 5 13 55
4.19 4.03 4.00 4.00 3.89 4.00 290 If conditions for pedestrians on and across ECR were improved, I would walk rather than drive a car for some short trips and errands.
Strongly disagree 3 1 0 3 12
Somewhat disagree 3 4 3 4 24
Neutral/no opinion 5 15 1 7 30
Somewhat agree 10 12 5 14 22
Strongly agree 36 26 4 10 35
4.28 4.00 3.77 3.63 3.36 3.72 289
answered question 291 skipped question 24

El Camino Real Corridor Study
B-110
13. Transit
Please indicate the most common condition which applies to your use of
the Menlo Park Caltrain station. (Select one)
Answer Options I walk
to Caltrain
I ride my bike to Caltrain
I am dropped off by another vehicle or transit at Caltrain
I drive and park at Caltrain
I rarely use
Caltrain
Rating Average
Response Count
Dedicated bus/BRT (Bus Rapid Transit) lanes on ECR should be accommodated through Menlo Park.
Strongly disagree 12 4 4 6 34
Somewhat disagree 6 8 1 13 27
Neutral/No opinion 23 23 6 13 46
Somewhat agree 9 9 2 4 10
Strongly agree 7 15 0 1 5
2.88 3.39 2.46 2.49 2.39 2.70 288
answered question 288 skipped question 27
14. Vehicle Traffic Environment
Please indicate the most common condition which applies to your use of
the Menlo Park Caltrain station. (Select one)
Answer Options I walk
to Caltrain
I ride my bike to Caltrain
I am dropped off by another vehicle or transit at Caltrain
I drive and park at Caltrain
I rarely use
Caltrain
Rating Average
Response Count
Improving the flow of traffic for automobiles should be the highest priority for ECR.
Strongly disagree 20 31 2 7 13
Somewhat disagree 9 12 5 4 28
Neutral/No opinion 10 9 2 7 20
Somewhat agree 13 6 3 10 37
Strongly agree 5 1 1 9 23
2.54 1.88 2.69 3.27 3.24 2.80 287 There is enough capacity for automobiles right now; improvements should focus on other modes of travel (bicycles, pedestrians, transit)
Strongly disagree 3 0 1 10 20
Somewhat disagree 7 4 3 4 24
Neutral/No opinion 3 3 1 3 15
Somewhat agree 16 7 0 9 28
Strongly agree 28 45 8 12 34
4.04 4.58 3.85 3.24 3.26 3.71 288
Lanes should be made wider in order to better accommodate large trucks and delivery vehicles.
Strongly disagree 30 23 5 14 39
Somewhat disagree 13 21 5 9 40
Neutral/No opinion 12 14 2 11 32
Somewhat agree 1 1 1 4 9
Strongly agree 1 0 0 0 2
1.77 1.88 1.92 2.13 2.14 2.00 289
Solutions for ECR should attempt to separate regional through traffic from local traffic.
Strongly disagree 5 2 0 3 14

Community Survey Report Appendix B: Transportation Survey Responses
B-111
14. Vehicle Traffic Environment
Please indicate the most common condition which applies to your use of
the Menlo Park Caltrain station. (Select one)
Answer Options I walk
to Caltrain
I ride my bike to Caltrain
I am dropped off by another vehicle or transit at Caltrain
I drive and park at Caltrain
I rarely use
Caltrain
Rating Average
Response Count
Somewhat disagree 10 5 5 15 24
Neutral/No opinion 19 29 4 12 36
Somewhat agree 8 15 2 7 25
Strongly agree 15 8 2 1 21
3.32 3.37 3.08 2.68 3.13 3.15 287 Regional through traffic should be prioritized on ECR; short local trips should be routed along other roads through the community.
Strongly disagree 21 14 5 11 49
Somewhat disagree 11 14 5 14 31
Neutral/No opinion 17 23 2 9 29
Somewhat agree 3 6 1 4 9
Strongly agree 5 2 0 0 3
2.30 2.46 1.92 2.16 2.06 2.19 288
Controlling “spillover” traffic in the neighborhoods adjacent to ECR should be a high priority.
Strongly disagree 3 2 1 4 7
Somewhat disagree 8 12 4 6 18
Neutral/No opinion 15 23 3 10 32
Somewhat agree 10 10 2 8 30
Strongly agree 21 12 2 10 34
3.67 3.31 3.00 3.37 3.55 3.47 287
answered question 289 skipped question 26
15. Bicycling Environment
Please indicate the most common condition which applies to your use of
the Menlo Park Caltrain station. (Select one)
Answer Options I walk
to Caltrain
I ride my bike to Caltrain
I am dropped off by another vehicle or transit at Caltrain
I drive and park at Caltrain
I rarely use
Caltrain
Rating Average
Response Count
ECR is not safe or convenient to cross by bicycle.
Strongly disagree 2 4 0 2 10
Somewhat disagree 6 4 2 3 23
Neutral/No opinion 3 3 1 8 20
Somewhat agree 19 24 7 12 33
Strongly agree 27 24 3 13 37
4.11 4.02 3.85 3.82 3.52 3.79 290 Continuous bike lanes should be provided on ECR in both directions, because it is the most direct way for bicyclists to travel within and through Menlo Park.
Strongly disagree 5 0 1 9 15
Somewhat disagree 2 1 1 4 18

El Camino Real Corridor Study
B-112
15. Bicycling Environment
Please indicate the most common condition which applies to your use of
the Menlo Park Caltrain station. (Select one)
Answer Options I walk
to Caltrain
I ride my bike to Caltrain
I am dropped off by another vehicle or transit at Caltrain
I drive and park at Caltrain
I rarely use
Caltrain
Rating Average
Response Count
Neutral/No opinion 8 1 1 9 21
Somewhat agree 11 13 2 7 34
Strongly agree 30 44 8 9 34
4.05 4.69 4.15 3.08 3.44 3.80 288
If bicycle lanes are provided, they should be separated from vehicle traffic by a physical barrier to enhance safety.
Strongly disagree 7 1 1 4 7
Somewhat disagree 3 10 2 5 7
Neutral/No opinion 7 6 2 9 30
Somewhat agree 13 16 4 5 36
Strongly agree 27 26 4 15 43
3.88 3.95 3.62 3.58 3.82 3.82 290
Bicycles are best accommodated on adjacent parallel routes, not on ECR.
Strongly disagree 8 16 1 5 10
Somewhat disagree 8 14 3 2 17
Neutral/No opinion 9 10 2 5 22
Somewhat agree 12 8 4 10 32
Strongly agree 20 11 3 15 43
3.49 2.73 3.38 3.76 3.65 3.43 290
Currently, routes parallel to ECR are too discontinuous or conflicted for effective bike travel.
Strongly disagree 1 0 0 3 3
Somewhat disagree 1 2 1 1 5
Neutral/No opinion 2 2 1 7 18
Somewhat agree 12 10 4 10 41
Strongly agree 40 44 7 17 54
4.59 4.66 4.31 3.97 4.14 4.32 286 If conditions for bicyclists on and across ECR were improved, I would consider bicycling rather than driving for some short trips and errands.
Strongly disagree 4 0 1 3 16
Somewhat disagree 2 1 0 6 9
Neutral/No opinion 4 7 0 5 19
Somewhat agree 9 4 3 8 23
Strongly agree 38 47 9 16 55
4.32 4.64 4.46 3.74 3.75 4.08 289
answered question 291 skipped question 24

Community Survey Report Appendix B: Transportation Survey Responses
B-113
16. Parking Environment
Please indicate the most common condition which applies to your use of
the Menlo Park Caltrain station. (Select one)
Answer Options I walk
to Caltrain
I ride my bike to Caltrain
I am dropped off by another vehicle or transit at Caltrain
I drive and park at Caltrain
I rarely use
Caltrain
Rating Average
Response Count
Street parking on ECR is essential for the convenience of customers of small businesses located there.
Strongly disagree 17 15 5 12 28
Somewhat disagree 14 19 3 17 32
Neutral/No opinion 17 18 3 2 29
Somewhat agree 4 5 1 3 22
Strongly agree 5 2 1 4 9
2.40 2.32 2.23 2.21 2.60 2.44 287
Parking on ECR should be eliminated to free up more space for vehicle travel.
Strongly disagree 7 12 2 8 18
Somewhat disagree 5 11 1 6 14
Neutral/No opinion 16 19 4 3 31
Somewhat agree 18 10 3 11 33
Strongly agree 11 7 3 10 25
3.37 2.81 3.31 3.24 3.27 3.19 288
Parking on ECR should be eliminated to free up more space for bicycle lanes.
Strongly disagree 6 2 0 8 18
Somewhat disagree 2 2 1 5 11
Neutral/No opinion 5 9 1 6 23
Somewhat agree 15 16 4 10 29
Strongly agree 27 31 7 9 40
4.00 4.20 4.31 3.18 3.51 3.74 287
Any parking that is removed from ECR should be replaced with parking lots or garages off the roadway, nearby.
Strongly disagree 6 5 0 1 2
Somewhat disagree 5 11 1 0 6
Neutral/No opinion 13 14 3 12 26
Somewhat agree 18 23 4 17 44
Strongly agree 15 7 5 8 42
3.54 3.27 4.00 3.82 3.98 3.73 288
answered question 289 skipped question 26

El Camino Real Corridor Study
B-114
APPENDIX B: CROSS-TABULATIONS – QUESTION 9
1. Indicate the condition which applies to the location of your residence. (Select one)
Why do you typically travel on El Camino Real?
(Select all that apply)
Answer Options Travel to and/or
from work
Travel to and/or
from school
Travel for
shopping
Patronizing local
businesses
For physical activity
Response Percent
Response Count
I live in Menlo Park within a half mile (4-5 blocks) of the El Camino Real Corridor.
75 27 119 102 39 46.3% 146
I live in Menlo Park, but farther than a half mile of the El Camino Real Corridor
39 24 82 76 11 32.4% 102
I don’t live in Menlo Park, but I do live within a half mile (4-5 blocks) of the El Camino Real Corridor.
25 8 27 24 2 13.0% 41
None of the above. 20 1 12 14 3 8.3% 26
answered question 315 skipped question 0
2. Indicate the condition which applies to the location of your work. (Select one)
Why do you typically travel on El Camino Real?
(Select all that apply)
Answer Options Travel to and/or
from work
Travel to and/or
from school
Travel for
shopping
Patronizing local
businesses
For physical activity
Response Percent
Response Count
I work in Menlo Park within a half mile (4-5 blocks) of the El Camino Real Corridor.
35 12 44 38 10 17.8% 56
I work in Menlo Park, but farther than a half mile of the El Camino Real Corridor
25 11 38 33 11 14.9% 47
I don’t work in Menlo Park, but I do work within a half mile (4-5 blocks) of the El Camino Real Corridor.
60 13 50 46 8 24.1% 76
None of the above 39 24 108 99 26 43.2% 136
answered question 315 skipped question 0

Community Survey Report Appendix B: Transportation Survey Responses
B-115
3. Do you drive a vehicle on El Camino Real? (Select one)
Why do you typically travel on El Camino Real?
(Select all that apply)
Answer Options Travel to and/or
from work
Travel to and/or
from school
Travel for
shopping
Patronizing local
businesses
For physical activity
Response Percent
Response Count
Multiple times per day 75 29 86 78 22 33.7% 106
Approximately once per day 12 9 38 30 7 14.3% 45
A few times a week 44 16 85 78 17 35.9% 113
Almost never 28 6 31 30 9 16.2% 51
answered question 315 skipped question 0
4. Do you ride a bike on or across El Camino Real? (Select one)
Why do you typically travel on El Camino Real?
(Select all that apply)
Answer Options Travel to and/or
from work
Travel to and/or
from school
Travel for
shopping
Patronizing local
businesses
For physical activity
Response Percent
Response Count
On a daily basis 45 18 44 41 13 19.4% 61
Several times per week 35 11 47 46 17 21.9% 69
Mostly on weekends 33 10 46 42 11 19.0% 60
Almost never 46 21 103 87 14 39.7% 125
answered question 315 skipped question 0
5. Do you use local bus transit services that travel on El Camino Real? (Select one)
Why do you typically travel on El Camino Real?
(Select all that apply)
Answer Options Travel to and/or
from work
Travel to and/or
from school
Travel for
shopping
Patronizing local
businesses
For physical activity
Response Percent
Response Count
On a daily basis 2 2 1 2 0 0.6% 2
Several times per week 7 1 11 9 2 3.8% 12
Mostly on weekends 4 1 3 3 1 1.3% 4
Almost never 146 56 225 202 52 94.3% 297
answered question 315 skipped question 0

El Camino Real Corridor Study
B-116
6. Do you walk along or across El Camino Real? (Select one)
Why do you typically travel on El Camino Real?
(Select all that apply)
Answer Options Travel to and/or
from work
Travel to and/or
from school
Travel for
shopping
Patronizing local
businesses
For physical activity
Response Percent
Response Count
On a daily basis 19 4 26 22 17 9.8% 31
Several times per week 51 18 59 53 13 25.4% 80
Mostly on weekends 42 13 66 61 13 26.3% 83
Almost never 47 25 89 80 12 38.4% 121
answered question 315 skipped question 0
7. Do you have a child that has to cross El Camino Real to get to school? (Select one)
Why do you typically travel on El Camino Real?
(Select all that apply)
Answer Options Travel to and/or
from work
Travel to and/or
from school
Travel for
shopping
Patronizing local
businesses
For physical activity
Response Percent
Response Count
Yes 33 31 50 43 8 19.0% 60
No 126 29 190 173 47 81.0% 255
answered question 315 skipped question 0
8. Please indicate the most common condition which applies to your use of the Menlo Park Caltrain station. (Select one)
Why do you typically travel on El Camino Real?
(Select all that apply)
Answer Options Travel to and/or
from work
Travel to and/or
from school
Travel for
shopping
Patronizing local
businesses
For physical activity
Response Percent
Response Count
I walk to Caltrain 35 6 50 43 17 19.4% 61
I ride my bike to Caltrain 46 14 44 49 12 21.0% 66 I am dropped off by another vehicle or transit at Caltrain 8 5 13 10 5 4.1% 13
I drive and park at Caltrain 18 14 29 26 4 12.4% 39
I rarely use Caltrain 52 21 104 88 17 43.2% 136
answered question 315 skipped question 0

Community Survey Report Appendix B: Transportation Survey Responses
B-117
9. Why do you typically travel on El Camino Real? (Select all that apply)
Why do you typically travel on El Camino Real?
(Select all that apply)
Answer Options Travel to and/or
from work
Travel to and/or
from school
Travel for
shopping
Patronizing local
businesses
For physical activity
Response Percent
Response Count
Travel to and/or from work 159 33 108 105 32 50.5% 159
Travel to and/or from school 33 60 49 52 12 19.0% 60
Travel for shopping 108 49 240 188 48 76.2% 240
Patronizing local businesses 105 52 188 216 46 68.6% 216
For physical activity 32 12 48 46 55 17.5% 55
Other (please specify) 78
answered question 315 skipped question 0
10. Please score each of the following items that you would like to see on El Camino Real from 1 (least desirable) to 5 (most desirable).
Why do you typically travel on El Camino Real? (Select all that apply)
Answer Options Travel to and/or
from work
Travel to and/or from
school
Travel for shopping
Patronizing local
businesses
For physical activity
Rating Average
Response Count
Lower travel speeds on El Camino Real (ECR)
1 Least desirable 38 16 54 46 11
2 12 6 17 17 5
3 Neutral 72 23 112 102 29
4 13 7 23 16 4
5 Most desirable 24 7 32 33 5
2.83 2.71 2.84 2.87 2.76 2.83 313
Higher travel speeds on ECR
1 Least desirable 63 24 95 84 21
2 15 6 29 24 4
3 Neutral 49 19 74 76 20
4 19 6 24 20 5
5 Most desirable 13 5 17 11 5
2.40 2.37 2.33 2.30 2.44 2.35 314
More convenient on-street parking on ECR
1 Least desirable 68 27 102 84 17
2 28 12 45 45 12
3 Neutral 51 16 71 68 21
4 9 4 14 13 3
5 Most desirable 3 1 7 5 2
2.06 2.00 2.08 2.12 2.29 2.09 314
More convenient parking within walking distance to ECR
1 Least desirable 23 7 20 20 5
2 21 8 27 24 5

El Camino Real Corridor Study
B-118
10. Please score each of the following items that you would like to see on El Camino Real from 1 (least desirable) to 5 (most desirable).
Why do you typically travel on El Camino Real? (Select all that apply)
Answer Options Travel to and/or
from work
Travel to and/or from
school
Travel for shopping
Patronizing local
businesses
For physical activity
Rating Average
Response Count
3 Neutral 59 25 93 86 23
4 36 9 64 61 15
5 Most desirable 20 11 36 25 7
3.06 3.15 3.29 3.22 3.25 3.20 315
More bike parking close to downtown
1 Least desirable 9 6 10 9 2
2 2 0 7 3 2
3 Neutral 30 14 59 48 8
4 62 17 79 74 23
5 Most desirable 56 23 84 81 20
3.97 3.85 3.92 4.00 4.04 3.96 314
Inclusion of bicycle lanes on ECR
1 Least desirable 18 6 32 21 5
2 4 4 14 13 2
3 Neutral 13 7 28 21 3
4 28 9 43 40 8
5 Most desirable 96 34 123 121 37
4.13 4.02 3.88 4.05 4.27 4.03 315
Enhanced pedestrian safety and crossings on ECR
1 Least desirable 2 1 6 3 2
2 2 2 2 1 1
3 Neutral 25 6 38 31 5
4 46 10 60 54 11
5 Most desirable 84 41 134 127 36
4.31 4.47 4.31 4.39 4.42 4.35 315
Wider sidewalks on ECR
1 Least desirable 7 4 14 10 3
2 14 5 23 18 4
3 Neutral 46 21 73 63 15
4 28 7 38 37 6
5 Most desirable 64 23 91 87 27
3.81 3.67 3.71 3.80 3.91 3.77 314
Additional through lanes on El Camino Real
1 Least desirable 37 12 49 48 11
2 22 4 34 26 6
3 Neutral 49 16 65 63 20
4 29 15 47 45 10
5 Most desirable 22 13 45 34 8
2.86 3.22 3.02 2.96 2.96 2.98 315

Community Survey Report Appendix B: Transportation Survey Responses
B-119
10. Please score each of the following items that you would like to see on El Camino Real from 1 (least desirable) to 5 (most desirable).
Why do you typically travel on El Camino Real? (Select all that apply)
Answer Options Travel to and/or
from work
Travel to and/or from
school
Travel for shopping
Patronizing local
businesses
For physical activity
Rating Average
Response Count
Increased vehicle safety on ECR
1 Least desirable 4 0 7 4 3
2 13 2 12 9 1
3 Neutral 64 23 98 87 19
4 43 19 62 59 12
5 Most desirable 35 16 60 56 20
3.58 3.82 3.65 3.72 3.82 3.68 314
Additional transit service along ECR
1 Least desirable 14 5 21 19 3
2 18 6 21 18 3
3 Neutral 85 34 130 111 33
4 30 13 45 46 11
5 Most desirable 12 2 22 21 5
3.05 3.02 3.11 3.15 3.22 3.11 314
Timing traffic signals to favor continuous north-south flow on ECR
1 Least desirable 10 6 11 13 4
2 8 2 11 15 0
3 Neutral 37 15 55 52 15
4 36 13 61 46 10
5 Most desirable 68 24 102 90 26
3.91 3.78 3.97 3.86 3.98 3.91 315
Timing traffic signals to favor east west access
1 Least desirable 17 6 28 22 6
2 36 7 33 33 9
3 Neutral 68 23 102 91 22
4 24 13 46 40 11
5 Most desirable 14 11 30 29 7
2.89 3.27 3.07 3.10 3.07 3.05 314
Reduction of vehicle miles travelled on ECR (reduction in traffic passing through Menlo Park on ECR)
1 Least desirable 11 2 14 12 2
2 13 6 26 21 5
3 Neutral 51 26 81 75 25
4 38 12 46 40 11
5 Most desirable 46 14 72 67 12
3.60 3.50 3.57 3.60 3.47 3.57 314
Reduction in delay at signalized intersections on ECR
1 Least desirable 3 0 4 6 2
2 10 1 10 8 0
3 Neutral 59 22 88 77 23

El Camino Real Corridor Study
B-120
10. Please score each of the following items that you would like to see on El Camino Real from 1 (least desirable) to 5 (most desirable).
Why do you typically travel on El Camino Real? (Select all that apply)
Answer Options Travel to and/or
from work
Travel to and/or from
school
Travel for shopping
Patronizing local
businesses
For physical activity
Rating Average
Response Count
4 50 19 72 62 15
5 Most desirable 37 18 65 62 15
3.68 3.90 3.77 3.77 3.75 3.76 314
More landscaped medians on ECR
1 Least desirable 23 8 25 24 7
2 16 6 30 25 7
3 Neutral 60 19 94 82 23
4 32 19 47 44 6
5 Most desirable 28 8 43 40 12
3.16 3.22 3.22 3.24 3.16 3.21 314
More landscaping along ECR (providing buffers between pedestrians or bicyclists and vehicles)
1 Least desirable 7 2 14 8 3
2 6 2 14 13 2
3 Neutral 36 16 56 48 14
4 42 14 66 60 13
5 Most desirable 68 26 89 86 23
3.99 4.00 3.85 3.94 3.93 3.93 314
answered question 315 skipped question 0

Community Survey Report Appendix B: Transportation Survey Responses
B-121
11. General Safety and Environmental Concerns
Why do you typically travel on El Camino Real? (Select all that apply)
Answer Options Travel to and/or
from work
Travel to and/or from
school
Travel for shopping
Patronizing local
businesses
For physical activity
Rating Average
Response Count
ECR is only safe if you are in a vehicle.
Strongly disagree 8 2 12 9 0 Somewhat disagree
23 6 37 35 5
Neutral/No opinion 12 4 16 15 7
Somewhat agree 53 30 96 93 20
Strongly agree 52 13 65 54 18
3.80 3.84 3.73 3.72 4.02 3.77 294
Ensuring that children can safely cross ECR to get to and from school should be a high priority.
Strongly disagree 1 0 2 1 0 Somewhat disagree 7 3 6 6 0 Neutral/No opinion 14 1 27 24 9
Somewhat agree 43 15 61 59 10
Strongly agree 82 36 129 115 31
4.35 4.53 4.37 4.37 4.44 4.38 293
Mitigating poor air quality from vehicle traffic/congestion should be a high priority.
Strongly disagree 6 3 13 11 1 Somewhat disagree 12 5 20 19 6 Neutral/No opinion 39 17 57 49 10
Somewhat agree 40 14 61 62 14
Strongly agree 51 16 74 65 19
3.80 3.64 3.72 3.73 3.88 3.75 293
Signage (for cross streets, turns) is not clear enough and needs to be improved.
Strongly disagree 14 6 19 15 2 Somewhat disagree 30 8 47 37 7 Neutral/No opinion 65 21 98 95 25
Somewhat agree 25 12 43 41 9
Strongly agree 13 7 17 17 6
2.95 3.11 2.96 3.04 3.20 3.01 292
answered question 294 skipped question 21

El Camino Real Corridor Study
B-122
12. Walking Environment
Why do you typically travel on El Camino Real? (Select all that apply)
Answer Options Travel to and/or
from work
Travel to and/or from
school
Travel for shopping
Patronizing local
businesses
For physical activity
Rating Average
Response Count
Signals are long enough to allow people to walk across ECR safely.
Strongly disagree 5 4 10 9 2
Somewhat disagree 32 10 42 39 13
Neutral/no opinion 22 3 32 29 4
Somewhat agree 59 24 94 84 21
Strongly agree 27 13 45 42 9
3.49 3.59 3.55 3.55 3.45 3.53 289
Vehicle speeds should be slower to make the road safer for people walking.
Strongly disagree 16 7 23 23 6
Somewhat disagree 30 16 54 42 8
Neutral/no opinion 48 15 78 72 17
Somewhat agree 31 10 43 39 12
Strongly agree 20 6 26 27 6
3.06 2.85 2.98 3.02 3.08 3.01 290
Bicycles on the sidewalks are a threat to pedestrian safety.
Strongly disagree 9 5 15 12 3
Somewhat disagree 26 11 33 27 9
Neutral/no opinion 22 9 35 31 6
Somewhat agree 50 17 84 72 17
Strongly agree 39 12 56 60 14
3.58 3.37 3.60 3.70 3.61 3.61 290 A parallel pedestrian path/trail should be provided, separated from the main roadway, possibly adjacent to the railroad tracks.
Strongly disagree 7 3 10 7 2
Somewhat disagree 8 3 14 11 1
Neutral/no opinion 28 6 43 37 7
Somewhat agree 35 13 56 57 10
Strongly agree 68 29 100 90 29
4.02 4.15 4.00 4.05 4.29 4.05 290 If conditions for pedestrians on and across ECR were improved, I would walk rather than drive a car for some short trips and errands.
Strongly disagree 6 5 17 12 0
Somewhat disagree 20 7 34 29 6
Neutral/no opinion 27 7 42 40 9
Somewhat agree 27 15 46 44 7
Strongly agree 65 20 84 78 27
3.86 3.70 3.65 3.72 4.12 3.76 289
answered question 291 skipped question 24

Community Survey Report Appendix B: Transportation Survey Responses
B-123
13. Transit
Why do you typically travel on El Camino Real? (Select all that apply)
Answer Options Travel to and/or
from work
Travel to and/or from
school
Travel for shopping
Patronizing local
businesses
For physical activity
Rating Average
Response Count
Dedicated bus/BRT (Bus Rapid Transit) lanes on ECR should be accommodated through Menlo Park.
Strongly disagree 22 11 50 40 8
Somewhat disagree 34 16 47 41 11
Neutral/No opinion 54 21 79 77 19
Somewhat agree 17 4 27 22 8
Strongly agree 18 2 19 22 3
2.83 2.44 2.63 2.73 2.73 2.69 288
answered question 288 skipped question 27
14. Vehicle Traffic Environment
Why do you typically travel on El Camino Real? (Select all that apply)
Answer Options Travel to and/or
from work
Travel to and/or from
school
Travel for shopping
Patronizing local
businesses
For physical activity
Rating Average
Response Count
Improving the flow of traffic for automobiles should be the highest priority for ECR.
Strongly disagree 51 11 49 52 14
Somewhat disagree 19 12 48 35 7
Neutral/No opinion 24 9 34 33 9
Somewhat agree 32 15 55 54 11
Strongly agree 18 6 35 26 8
2.63 2.87 2.90 2.84 2.84 2.82 287 There is enough capacity for automobiles right now; improvements should focus on other modes of travel (bicycles, pedestrians, transit)
Strongly disagree 13 6 30 22 4
Somewhat disagree 15 8 37 30 6
Neutral/No opinion 9 5 21 16 6
Somewhat agree 32 9 45 43 11
Strongly agree 76 26 89 91 22
3.99 3.76 3.57 3.75 3.84 3.75 288
Lanes should be made wider in order to better accommodate large trucks and delivery vehicles.
Strongly disagree 60 21 84 78 17
Somewhat disagree 44 20 67 58 13
Neutral/No opinion 35 12 55 51 14
Somewhat agree 5 1 14 13 4
Strongly agree 1 0 3 2 1
1.92 1.87 2.04 2.02 2.16 2.00 289
Solutions for ECR should attempt to separate regional through traffic from local traffic.
Strongly disagree 8 5 17 17 4
Somewhat disagree 27 12 52 44 9

El Camino Real Corridor Study
B-124
14. Vehicle Traffic Environment
Why do you typically travel on El Camino Real? (Select all that apply)
Answer Options Travel to and/or
from work
Travel to and/or from
school
Travel for shopping
Patronizing local
businesses
For physical activity
Rating Average
Response Count
Neutral/No opinion 57 19 75 68 19
Somewhat agree 27 10 40 38 7
Strongly agree 26 8 38 34 10
3.25 3.07 3.14 3.14 3.20 3.16 287 Regional through traffic should be prioritized on ECR; short local trips should be routed along other roads through the community.
Strongly disagree 49 20 79 70 17
Somewhat disagree 36 14 59 53 11
Neutral/No opinion 45 14 55 55 14
Somewhat agree 12 4 20 16 4
Strongly agree 3 2 9 8 3
2.20 2.15 2.19 2.20 2.29 2.20 288
Controlling “spillover” traffic in the neighborhoods adjacent to ECR should be a high priority.
Strongly disagree 10 5 12 13 4
Somewhat disagree 32 11 37 34 4
Neutral/No opinion 39 16 61 57 18
Somewhat agree 22 9 48 45 10
Strongly agree 42 13 63 53 13
3.37 3.26 3.51 3.45 3.49 3.44 287
answered question 289 skipped question 26
15. Bicycling Environment
Why do you typically travel on El Camino Real? (Select all that apply)
Answer Options Travel to and/or
from work
Travel to and/or from
school
Travel for shopping
Patronizing local
businesses
For physical activity
Rating Average
Response Count
ECR is not safe or convenient to cross by bicycle.
Strongly disagree 8 2 16 13 2
Somewhat disagree 19 4 31 29 5
Neutral/No opinion 16 2 27 23 7
Somewhat agree 40 20 78 69 17
Strongly agree 63 26 71 68 18
3.90 4.19 3.70 3.74 3.90 3.81 290 Continuous bike lanes should be provided on ECR in both directions, because it is the most direct way for bicyclists to travel within and through Menlo Park.
Strongly disagree 15 7 24 18 3
Somewhat disagree 4 3 26 17 4
Neutral/No opinion 14 12 30 29 8
Somewhat agree 30 10 53 48 10

Community Survey Report Appendix B: Transportation Survey Responses
B-125
15. Bicycling Environment
Why do you typically travel on El Camino Real? (Select all that apply)
Answer Options Travel to and/or
from work
Travel to and/or from
school
Travel for shopping
Patronizing local
businesses
For physical activity
Rating Average
Response Count
Strongly agree 82 22 87 88 24
4.10 3.69 3.70 3.86 3.98 3.85 288
If bicycle lanes are provided, they should be separated from vehicle traffic by a physical barrier to enhance safety.
Strongly disagree 11 3 16 16 4
Somewhat disagree 10 4 21 19 3
Neutral/No opinion 26 11 47 35 9
Somewhat agree 32 12 55 52 13
Strongly agree 68 24 83 80 20
3.93 3.93 3.76 3.80 3.86 3.83 290
Bicycles are best accommodated on adjacent parallel routes, not on ECR.
Strongly disagree 28 8 28 26 5
Somewhat disagree 22 10 34 32 10
Neutral/No opinion 27 8 36 32 6
Somewhat agree 31 9 56 46 14
Strongly agree 39 19 68 65 14
3.21 3.39 3.46 3.46 3.45 3.40 290
Currently, routes parallel to ECR are too discontinuous or conflicted for effective bike travel.
Strongly disagree 3 0 6 4 0
Somewhat disagree 6 2 9 5 2
Neutral/No opinion 9 7 22 25 3
Somewhat agree 33 12 61 53 11
Strongly agree 93 32 121 111 32
4.44 4.40 4.29 4.32 4.52 4.36 286 If conditions for bicyclists on and across ECR were improved, I would consider bicycling rather than driving for some short trips and errands.
Strongly disagree 7 3 22 15 3
Somewhat disagree 9 2 15 12 1
Neutral/No opinion 17 4 22 25 8
Somewhat agree 20 11 39 33 9
Strongly agree 93 34 123 115 28
4.25 4.31 4.02 4.11 4.18 4.13 289
answered question 291 skipped question 24

El Camino Real Corridor Study
B-126
16. Parking Environment
Why do you typically travel on El Camino Real? (Select all that apply)
Answer Options Travel to and/or
from work
Travel to and/or from
school
Travel for shopping
Patronizing local
businesses
For physical activity
Rating Average
Response Count
Street parking on ECR is essential for the convenience of customers of small businesses located there.
Strongly disagree 44 15 61 52 13
Somewhat disagree 40 17 68 59 17
Neutral/No opinion 35 17 49 52 13
Somewhat agree 18 3 29 27 3
Strongly agree 8 2 14 11 3
2.35 2.26 2.40 2.43 2.31 2.38 287
Parking on ECR should be eliminated to free up more space for vehicle travel.
Strongly disagree 26 11 33 31 3
Somewhat disagree 20 7 29 28 4
Neutral/No opinion 38 11 49 50 13
Somewhat agree 38 15 64 52 19
Strongly agree 24 11 47 40 10
3.10 3.15 3.28 3.21 3.59 3.23 288
Parking on ECR should be eliminated to free up more space for bicycle lanes.
Strongly disagree 15 8 28 21 4
Somewhat disagree 9 2 19 17 1
Neutral/No opinion 16 12 32 29 10
Somewhat agree 37 10 55 53 13
Strongly agree 69 23 88 80 21
3.93 3.69 3.70 3.77 3.94 3.79 287
Any parking that is removed from ECR should be replaced with parking lots or garages off the roadway, nearby.
Strongly disagree 11 2 9 9 2
Somewhat disagree 13 2 17 15 1
Neutral/No opinion 31 17 55 45 15
Somewhat agree 53 19 83 77 13
Strongly agree 37 15 59 56 19
3.63 3.78 3.74 3.77 3.92 3.75 288
answered question 289 skipped question 26

Appendix C El Camino Real Transportation Survey Open-Ended Responses

El Camino Real Corridor Study
C-ii
This page intentionally left blank.

Community Survey Report Appendix C: Transportation Survey Open-Ended Responses
C-1
Question 9
Why do you typically travel on El Camino Real? (Other)
1. To go to other local cities and activities
2. Travel to chorus
3. By far the best North/South route
4. Travel to other cities
5. to get to other cities that have better shopping options
6. travel to restaurants
7. To/from Library, to/from sports practices
8. Travel FOR work
9. Go to or through other Peninsula towns
10. Going out and coming home at night' primarily to get to the Burgess center for the library, Arrillaga gym, and classrooms
11. children's activities
12. travel to restaurants in other towns; travel to medical care; travel to volunteer activities
13. dropping off kid at daycare
14. to get to other towns - i otherwise try to avoid el camino
15. Driving child to practices/games
16. travel to friends' houses
17. the questions for 10 are BOGUS. Horrible, really.
18. it's the only way out of Allied Arts...
19. It is the most convenient and direct route north/south through the city.
20. I typically CROSS ECR
21. to go to the library
22. Attending events
23. Travel to/from doctor/dentist
24. Taking grandchildren to Burgess

El Camino Real Corridor Study
C-2
25. mostly visiting the bank, post office, hardware store and other local shops and restaurants
26. Cross El Camino to get to Downtown MP from Linfield Oaks
27. Travel to and/or from home
28. to visit parents, go to doctor, go out to eat
29. Most direct route
30. To get to the library or classes at the Arrillaga Rec Center
31. To simply get from west side to east (i.e. to 101)
32. Crossing to reach my physical therapist
33. Children's activities
34. If there were a bike friendly way to cross near downtown, I would shop by bike. But it's hard to cross El.C. on a bike.
35. usually going or coming from the north to go from or get home
36. Travel to and/or/for recreation
Question 17
In your opinion, how well does El Camino Real currently serve your transportation needs?
Well
1. O.K.
2. OK, but I know it will fail me in the future with the Stanford, Greenheart, and other local and regional projects pending.
3. just tolerable
4. Ok by car or by foot.
5. Mostly pretty well.
6. with patience at certain times of day, works fine. with railroad tracks and few crossings, it's basically ECR or Middlfield for trips into town from where I live in North Fair Oaks / the Avenues.
7. Fairly well. I like the right turn lane at Valparaiso for entrance to west Menlo. Would hate to see it go away.

Community Survey Report Appendix C: Transportation Survey Open-Ended Responses
C-3
8. Adequate but not great
9. I have to drive down it every day to get to work (Mountain view to MP), and it works, but it's not fast or fun.
10. Adequate for my needs, as I have adjusted to ECR reality
11. It's ok the timeing of the lights could be improved
12. Barely adequately.
13. El Camino Real currently serves by transportation needs just fine, though I rarely travel during commute hours.
14. OK .. enforce the laws better. Sometimes 3 - 4 cars make turned after a light is clearly red. This is terribly annoying as someone who actually stops at a stale yellow. GIVE PEOPLE tickets and they will obey the law. Also give people tickets who are talking on cell phones. They drive more slowly and without paying attention - impeding the flow of traffic.
15. El Camino Real is fine. Bicycle traffic, particularly when bikes pass on the right and don't follow traffic signals, are more of an issue than making space for them can accommodate. If people want to go faster, take another route. I enjoy El Camino's pace for looking at businesses, and understand that it is not an expressway. If the lights are not already timed, that would be a nice feature to add to encourage cars to keep within the speed limit.
16. It's been an adequate compromise.
17. Reasonably well. I bike to work every day (M-F) and ride along ECR for at least some portion of that trip.
18. moderately well, often a better option than Middlefield
19. Just moderately
20. On a bike, ECR works well both south and north
21. just barely good enough.
22. I usually go to Palo Alto for needs (although I live in the Willows, Palo Alto is closer to me), it meets my needs fine when I come to Menlo.
23. ECR serves my travel needs. It would be improved by another vehicle lane in each direction
24. I only use it to get to/from shopping. For that it's just fine.
25. Reasonably
26. Ok
27. I only travel short distances on El Camino and for those distances it serves my transportation needs. However, I wouldn't want to drive long distances on it.

El Camino Real Corridor Study
C-4
28. It's not bad, given that we need roads. Kudos to Menlo Park for the landscaping.
29. It's ok but I would love a direct route from Stanford Campus to Menlo Caltrain. In general the bike bridges are really nice but add significant time to my commute.
Not Well
1. Poor! Too much congestion because of lane merges and poorly sequenced traffic lights.
2. I mostly bike and walk to shop, exercise, and reach recreation. I need ECR for this, especially at night, but often challenged by traffic, lack of bike space, and right-turners not looking for me.
3. It is slow and stressful. I often take parallel routes which are longer and residential just to get somewhere more quickly.
4. I bike and walk for most local trips, use transit where practical, and driving when needed. I use ECR to patronize local businesses - Safeway, coffee shops, Staples, BevMo, Borrone, etc. ECR is not friendly for bicycling and walking - if it were improved, more people would be able to take short local trips without a car. Since a lot of trips are local, helping improve active transportation for local trips might relieve congestion more than additional vehicle capacity.
5. poorly
6. Harly. Too busy now. Biking is great but I doubt you get more people to ride them More empty buses won't help The survey is too long and to hard to follow. I gave up half way through.
7. Not well. Too much traffic.
8. It doesn't. I avoid ECR as much as possible and take residential streets to avoid it and its stoplights when I have to go north/south. I zig zag along side streets. The lights should be timed so traffic flows along ECR, but we may need an over or underpass for vehicles at ECR/Ravenswood intersection. Bikes and pedestrians need to be away from cars. There have been far too many deaths of drivers hitting pedestrians and bikers in and around Menlo Park. They need to be separated.
9. Poorly, and getting worse all the time. I avoid ECR as much as possible, but there's often no practical alternative.
10. It can be slow and frustrating driving El Camino. The lights should favor people traveling along El Camino.
11. Not well. Too much through traffic. Additional construction on the street will increase number of cars.
12. I avoid El Camino as much as possible. It is an ugly, dangerous street, and it is only going to get worse after you allow those monster office buildings to be constructed.

Community Survey Report Appendix C: Transportation Survey Open-Ended Responses
C-5
13. I avoid it if possible. For example, I live to the north of town. For example, if I want to travel to Little House, I go up Valpariso, left at University, then eventually down Middle.
14. too much congestion at rush hour. Looking at El Camino Real ONLY is totally missing the fact that we have really poor east/west connectivity and really poor transit options both in general and to get around within town.
El Camino Real is absolutely frightening for bike riders. The east/west connections also are really frightening because they are so narrow - think Middle and Menlo where there aren't bike lanes at all. The sidewalks are too narrow, and if we have to wait until all parcels are developed, this won't be improved in any significant way in my lifetime or even my children's lifetimes.
15. it's horrible. i avoid driving on or crossing el camino whenever possible. i would never allow my children (11, 9, and 7) to cross el camino on their own.
16. Not very well
17. Not too well. Congested traffic, people blatantly disobeying traffic laws (running red lights especially), unsafe conditions for bikers and pedestrians
18. Too much car congestion during peak travel times. Absolutely need a bike solution.
19. Poorly. It is highly congested many times of the day and traffic moves slowly with frequent stops. The back up can be extensive making it 20 minutes to go 2 miles often at rush hour from Stanford. Development of ECR will likely make this even worse.
20. terribly. the traffic is horrible (see below). It doesn't feel safe for pedestrians or bicyclists either. And it's hideosly ugly and embarrasing with the vacant lots...
21. ECR functions as a means to get in and out of Menlo Park. I try to avoid traveling along ECR during peak hours. The left turn from Southbound ECR onto Alma in Palo Alto is particularly bad. I find it frustrating when vehicles block the intersection for cross traffic, esp. x Roble.
22. ECR is too congested, particularly at peak commute times. It is also a major EW barrier. Solving these two apparently contradictory issues is a critical challenge. Don’t make ECR a bigger barrier just to improve traffic flow.
23. Not well, I avoid it as much as possible.
24. not very well, the increasing traffic indicates we need to take steps now to optimize throughput
25. I avoid El Camino if at all possible.
26. I try to avoid using ECR where possible and go across to other parallel streets at commute times due to congestion. ECR is a more direct route, so I would prefer to use it for my transportation needs if the flow were better.
27. Poorly. Almost always too much traffic and only going to get much worse if proposed development goes ahead.

El Camino Real Corridor Study
C-6
28. I hate driving on ECR. It is busy, the lights are slow, and it is ugly.
29. ECR is difficult for bicycles. As I am car-free and commute to many clients by bicycle, I am very strongly in favor of improved bicycle access along ECR.
30. I avoid El Camino whenever possible. I do love the trees that were installed a decade or so ago, it greatly improves the beauty and comfort of the road (it's nice to have shade when stopped at traffic lights, it reduces glare when driving, it just makes the whole experience more pleasant).
31. Too busy. Feels dangerous when walking along sidewalks.
32. horribly. it's dangerous and congested. try walking a stroller or biking from Cambridge to Burgess look at the left turn to Alma in the morning. watch all the red light runners from Sand Hill going left. try getting from Alma to Cambridge in the evening. look at all the cars that go thru neighborhoods instead of using ECR.
33. The flow of traffic through downtown Menlo Park is too slow due to poorly coordinated lights. Pedestrian safety is a real problem due to the lack of properly maintained audible crossing signals.
34. It's slow by car, and the empty lots and abandoned holes in the ground are scary to go by on foot or bike at night.
35. I try to avoid it.
36. I would give it a C-. It gets the job done, but just barely. It only works for cars. I'd like to ride my bike more but getting across El Camino is scary. The bike lane on Ravenswood appears and disappears right where it is most needed. I hate driving for short trips but El Camino feels like it's only for cars. Sidewalks are too narrow. Forget riding a bike!
37. It cuts my route to downtown MP. For downtown's business sake it would be great if there's a link over or under ECR.
38. not very well, since I ride my bike everywhere and it is no fun to ride my bike on ECR
39. Weak. I bike but it's so dangerous to x in bike
40. Walking or biking along El Camino, crossing El Camino is required to get to Palo Alto, Safeway, Stanford shopping center, library, pool, parks, MH school. Currently it is no fun and scary

Community Survey Report Appendix C: Transportation Survey Open-Ended Responses
C-7
41. Not great
42. We are only one block from el camino in allied arts and when i can avoid it i do. I go way out of my way to walk so i dont have to travel by foot or bike or even a car on ecr. This even affects my spending- where do i shop? At the standford mall. Why? Because its a pleasent walk or bike over with or without kids in tow. Menlo park needs to improve pedestrian and bicycle routes around town- it has such potential to be a safe and bikable city but its just unsafe. And my kids? No way would i even let them walk on ecr let alone bike.
43. Cars stalled too often so traffic crawls. Too many cars funneling onto ECR for uTurn onto Cambridge. Cars should be able to go directly from sand hill rd.
44. It is too congested at all times of day, but particularly during commute hours. It can take multiple lights to get through an intersection. Drivers are so frustrated they cut across lanes dangerously, and cut off other drivers, in order o get ahead. There are too many cars trying to make a U-turn at Cambrige and many can't negotiate the turn, then stop at the curb, and then dangerously back up into oncoming traffic! Ther is not enough space for Stanford's south-bound construction trucks to safely turn west onto Sand Hill. They often attempt to right fom the adjcent lane which is simply not safe. There are too many frustrated drivers who try to avoid getting caught in a second wait at a light who will run a yellow or red light only to be stopped "in" the intersection, blocking traffic during someone else's turn. these are not the exceptions. These things are happening multiple times a day, day in and day out.
45. Not well. It is very frustrating to drive El Camino, with too much time spent idling at lights. And I would ride my bike, but I don't feel safe doing that.
46. The vulgar way of putting it is that El Camino sucks. The more eloquent way of stating the same thing is that El Camino is discordant with the community it serves. It is an ugly, litter-strewn eyesore that is packed with cars at all hours of the day. It is unsafe for bicyclists, unpleasant for pedestrians, and a disaster for motorists. Try driving from the MP/PA border to the MP/Atherton border at 5:30 pm.
47. Not very. It's a major thoroughfare that every other community on the peninsula seems to have gotten right, but traffic once it hits Menlo Park just jams up. I think with proper traffic-dependant timing on the signals to sync them to allow through traffic it would work, but now the signals do not seem to be synced properly.
48. By car it is time consuming and always seems to be congested within Menlo Park. would love easier access across el camino to arriallga/burgess. would definitely bike and walk rather than drive if I felt safer.
49. Not well
50. Not very well. In a car, the lights are ill timed. On foot, it's unpleasant. On a bike, it's terrifying.
51. Not well too much traffic and unsafe
52. Poorly. It is currently only safe for autos, and even then the traffic speeds are too high. If we add more car lanes, we will continue to encourage more car traffic- which is mainly single occupant

El Camino Real Corridor Study
C-8
motorists. We need to encourage cycling and walking on ECR, and make it an attractive, multi-modal resource for the city.
53. Poorly
54. There is a segment through Atherton that works well for my bicycle travel because there's a pretty good shoulder and no parking. The Menlo Park segment of El Camino is very uncomfortable for me as I ride my bicycle to shop.
55. Poorly. I ride a bike and user Caltrain more than drive.
56. El Camino Real is a legacy of prioritizing cars over people. I avoid it as much as possible.
57. It's a bit scary. Cars go too fast, it's too much of a highway.
58. ECR operates as a freeway, when in fact it should operate as a neighborhood arterial. It is a very unpleasant road to bike or walk along.
59. Not that well. I mostly bike on El Camino, and it's not exactly a friendly place to ride.
60. Poorly: cycling on ECR is only good prior to 8 am. After that it becomes miserable. Bus service on ECR is unusable due to delays. I don't drive a car, and don't want to.
61. I currently avoid travel on ECR as much as possible opting instead for adjacent parallel alternatives and feel very unsafe crossing it when I do because of red light runners.
62. Not very well. It's scary to bike on ECR, but some time I have no choice since any alternate routes add considerable time or distance and often require crossing El Camino multiple times. I commute from Mountain View to Menlo Park, and many businesses are near ECR so to get to those businesses, travel on ECR is required.
63. I already travel mostly by bicycle or foot and El Camino Real is currently a very poor choice for me. I do not feel safe cycling along the road and only do so when I have no other option.
64. Poorly. As a pedestrian, it is very difficult to walk along or accross due to the traffic lights. In particular, it is a horrid situation where one is expected to press a button, and then potentially wait an entire light cycle to cross in either direction (north-south or east-west). I understand that the buttons are used to increase length of time for the signal (and thereby improve traffic flow), but it sends a strong signal that the city of Menlo Park does not want people walking along ECR, or even more generally since there are currently no contiguous walking routes that parallel ECR. As a cyclists, ECR is a large, high-speed road with no dedicated cycle lane. Additionally, there is no convenient, contiguous bike throughfare with right-of-way priorities over crossing traffic as an alternative. Again, this makes it seem as though the city is trying to encourage everyone to drive.
65. It is a dangerous road that I avoid riding my bike on at all costs. I mostly ride my bike in Menlo Park.

Community Survey Report Appendix C: Transportation Survey Open-Ended Responses
C-9
66. Poorly. I primarily travel by bike, and I virtually never travel on ECR, even though it is the most direct route. It is completely unsafe for cycling.
67. I am a bicyclist who does not own a car. I use El Camino as my main route to get to work. El Camino, going through Menlo Park, is not well configured for bicycle use. Example: southbound, from Encinal to Valparaiso: you should provide a bicycle pocket lane between the "right turn only" lane and the next through lane. Or you should re-designate the "right turn only" lane to indicate an exception for buses and bicyclists.
68. I mainly take El Camino by car to do local shopping or go to restaurants. At some times of day traffic is terrible when this becomes a commute route/alternative to the freeway. In my opinion that isn't a good use of the road. El Camino isn't an expressway; it has many intersections and is lined by shops with driveways and on street parking. It isn't optimized for high traffic volumes or high speeds, and it shouldn't be. I would love to feel like I could ride my bike on it, but I don't feel like it would be wise due to the width, amount of on street parking, and lack of a bike lane.
69. I make every effort to avoid traveling, biking, or walking along El Camino Real in Menlo Park when possible. This means putting more traffic on neighborhood streets, which is not a good alternative.
70. Being a local, I know how to circumvent the traffic on ECR, but that really doesn't solve the problem, now does it? It's a problem that only continues to get worse.
71. El Camino is a bottleneck at multiple times during the day when I try to travel to Palo Alto or Redwood City.
72. I live near El Camino Real, and use it as a motorist, a cyclist, and a pedestrian. As a motorist, El Camino in Menlo Park is the most congested and slowest portion of my commute. As a cyclist (and Bicycle Commuter), El Camino is a hazard which must be carefully navigated at the beginning and end of my daily commute. As a pedestrian, El Camino is ridiculously dangerous.
73. Not very well. There is lots of traffic and delays, especially in the afternoons
74. Very poorly due to the fact that it is extremely unsafe for cyclists. The lights on el camino are very inefficient at night, turning green for cars and pedestrians even when there is no one waiting.
75. Generally poorly. While El Camino is excellent for driving, it is dangerous to walk or bike on the corridor. Transit is too slow for effective transportation.
76. I avoid this road whenever possible. I never walk on the sidewalks there unless there aren't other options. It is invariably an unpleasant traveling experience.
77. It's a necessary evil. You can't get from one end of MP to the other without crossing it. And quite often it's the only direct route to where I need to be without taking a circuitous route through a residential neighborhood.
78. It is too congested in the Menlo park area

El Camino Real Corridor Study
C-10
79. Rather Poorly due to bad light timing
80. Not so well. It is clogged with traffic most of the time.
81. It's crowded, there should not be parking on El Camino with in a couple blocks of Santa Cruz Ave. I realize some businesses seem to need parking on the street, I have even used it. But isn't there some parking in back or side of buildings? or shouldn't there be? Often the right hand turn from ECR North at Ravenswood is blocked by cars or trucks cutting through then cutting in to a main through lane, but since it's a red light or stopped traffic, everything stops. Same for the ECR southbound at Valparaiso or Oak Grove, needs a right hand turn lane.
82. It too congested with through traffic
83. It's not great. I only travel it in my car if I have to/it's the only convenient route. Living in Linfield Oaks, I cross El Camino on foot to get to downtown. I don't enjoy standing at the intersections to get downtown with traffic roaring by. A bike barrier, slower speed limits might improve this. I never travel it on bike even though I live so close - I don't want to compete with the traffice and the parked car. Biking seems dangerous.
84. I live and work off ECR and drive from home Menlo to work in MV each day. During peak times it seems the flow of traffic could be better as I can drive up from MV with little congestion...but once I pass Sand Hill it gets very congested coming through MP. It seems the train also plays a part in cutting off through traffic East to West.
85. It is a direct route, but very slow in the mornings and afternoons. The worst part of El Camino for me is trying to cross it because the lights at the intersections are too long, and I often have to wait for two or three light cycles in order to cross in the mornings and afternoons.
86. The congestion near Santa Cruz ave and south is awful. Way too many large trucks and construction vehicles clog the corridor. I think those commerical trucks should use alternate routes.
87. Not very well. Too busy / crowded so avoid driving there. Use my bicycle on weekend but ECR is not a bike-friendly road. Vehicle traffic and parked cars create hazards.
88. It's a terrible place to be. Like a highway with stupid, long, untimed lights, and not safe for bicycles. Not nice to walk along, cross, or people watch. Just gross. Add sensors so the lights change when someone's trying to cross and there's no one else around. Be bold and make it a park with bike lanes and a local rail line.
89. Not so well.
90. It does a poor job. There are too many conflicting requirements and I don't how it can be improved.
91. El Camino Real is a barrier to cyclists and a parking lot for cars.
92. Very poorly for bicycle and pedestrian usage. Crossing is unsafe and I have witnessed many close calls between vehicle and non auto mobile traffic.

Community Survey Report Appendix C: Transportation Survey Open-Ended Responses
C-11
93. I have no choice.It has been congested and getting worse in the 25 years that I have lived in the area. It is much worse in Menlo Park that Palo Alto and Redwood City.
94. I avoid it during commute times and any other time I think it'll be crowded. I take alternate routes to get to businesses in downtown M. P..
95. Does not serve well as primary transportation corridor for either cars or bikes in any in San Mateo or Santa Clara Counties. It's the nature of a regional thoroughfare bisecting local commercial districts. It only worked optimally when vehicles moved at the speeds of bicycles (20 mph) and there was only one stop sign per town.
96. It's pretty bad at after work rush hour.
97. It is so busy during the day that I avoid it if possible. That makes me take a longer, more circuitous (but much more pleasant) route through the neighborhood.
98. I do not feel safe biking near or across ECR.
99. It does not meet my transportation needs. I am not comfortable bicycling on ECR in Menlo Park.
100. Too congested, people lane hop to get ahead. People go straight on right turn only lines to get ahead, so dangerous.
101. I mostly ride a bicycle and take caltrain, so ECR does not serve my transportation needs well, it is too auto-oriented and is dangerous for me as a bicyclist.
102. ECR barely does the job as a motorist, pedestrian and cyclist. The intersection at ECR and Menlo/Ravenswood is awful for pedestrians. Why are pedestrians only allowed East-West access on one side of the road? It is double jeopardy for pedestrians who have to cross Ravenswood to get the Menlo Park Library. If there was East-West access on both sides of the ECR Menlo/Ravenswood intersection, pedestrians wouldn't have to use the Crosswalk of Death at Alma and Ravenswood.
103. Very poorly. El Camino Real is, in its current state, hostile to pedestrians and bicyclists. I try to limit the use of my car, and make as many trips as possible on foot or on bike, so I experience this hostility on a daily basis. I do not ever ride my bike on El Camino, just getting across is intimidating enough. Car traffic is too heavy and aggressive. The sidewalks are extremely narrow in some places.
104. El Camino Real doesn't serve my transportation needs. Lights are not timed and its too dangerous for bicycles and pedestrians. Its also an eyesore.
105. North/south and south/north traffic a mess.....do something to get the traffic through the city more quickly...(timed lights, more lanes,etc)
106. In my opinion, the section of El Camino Real in downtown Menlo Park is not serving my transportation needs; rather, it is obstructing my transportation.

El Camino Real Corridor Study
C-12
107. Most of my trips within Menlo Park are by bicycle, so I tend to avoid ECR when convenient; the current traffic speeds and lane setup is not conducive for low-stress cycling.
108. When I drive, I prefer to take Central/Alma as the regional route north-south, however this is not an option in Menlo park because of the barrier at Sandhill. Consequently, when I need to traverse Menlo Park, I must take El Camino, even though I don't like it, because it is too wide, too busy, and too slow. When I bike, I avoid El Camino at all costs because it is just not safe. Currently there is no safe route to cross from the south side of Camino to the Palo Alto bike corridor (along Bryant) on the north side of Camino, except at Sand Hill, which is often out of the way.
109. Not at all well. It's a very inefficient route to take by car and one I try to avoid using. I was recently stuck through multiple signal changes attempting to cross El Camino Real in Menlo Park because cars in gridlock blocked the intersection. Traffic on ECR was barely moving.
110. I rarely bike El Camino and when I do I like to take the entire lane so that I don't get slammed by car doors or buses pulling out. I do not need a bike lane on El Camino - I don't recommend biking on El Camino. I find the traffic light coordination is not quite good enough - need longer times of green for cars on ECR and then longer stop signs particularly at Santa Cruz to cross. I'd consider overhead bridges for pedestrians, especially school children. Valparaiso is fine for bikers as it is.
111. Dangerous for pedestrians and bicyclists
112. poorly. My main use is to go to north or south from menlo park on el camino real. I generally cut through menlo park rather than use el camino until I have to.
113. Very poorly. Too much through-traffic.
114. It is unsafe to ride on a bike, and has poor flow for cars.
115. There is too much traffic. Also, very dangerous for school children to cross.
116. I live in the Willows. The traffic going through Menlo Park along the ECR has increased tremendously over the years to the point that I more frequently shop in Palo Alto or Redwood City to avoid driving along the ECR. Walking along the El Camino is NOT pleasant due the narrow width of the sidewalks interrupted by light poles and the lack of pedestrian friendly crossings. The goal of the 'Grand Boulevard" should be for pedestrians, cars and bicycles together and not just for cars.
117. I am very hesitant to walk or bike along El Camino. I have three kids and who need more space to bike. This means I take the car more often than I'd like to go for a quick shopping trip to downtown Menlo Park, to a restaurant, or to visit friends.
118. Crossing El Camino is unsafe with poorly maintained and typically nonfunctional audible crossing signals.
119. Not well. During commute and school pickup/drop off hours, it is impossible to get from Redwood City to Palo Alto via ECR in less than 15 minutes.

Community Survey Report Appendix C: Transportation Survey Open-Ended Responses
C-13
120. I avoid El Camino as much as possible because it is so often gridlocked. And with all the new development, it is going to be an absolute nightmare.
121. Horrible to bike on or across, horrendous during rush hour in a car, and usually bad. It serves it's purpose in that it's a road but it's a very infective one.
122. I tend to avoid ECR when possible, taking back streets to navigate north and south.
123. NOT WELL AT ALL! I can't cross it on my bike with anything like a feeling of safety. I can't walk on it more than a block or so because the rush of traffic is loud, obnoxious, and scary. The best place to cross on a bike now is all the way back at the Stanford Shopping Center. Even then, there is not enough time for pedestrians to get across 8 lanes of traffic. But it's impossible to ride the narrow sidewalk all the way to the MP biz district from the Stanford crossing. I've tried. Instead, you have to go way down to the Vi and cross at the bike bridge into MP there. Then you have to find your way to the business district downtown. More signs downtown to the bike bridge by the Vi and the Stanford crossing would help right now. I had to ask two people to find my way through the winding streets when I decided to leave Safeway and go back to the bike path to the Stanford Shopping Center crossing for El Camino. I love biking and this community has made it very hard to cross El Camino and get all businesses in downtown MP. I should think the Chamber of Commerce would fund the signs to and from downtown to the bike bridge by the Vi at Stanfrod Shopping Center. Have you ased them? If you made it more bike friendly, you'd need fewer parking places.
124. Poorly. I use other routes when possible.
125. Too many cars held back by poorly synced lights and poor detection. biking is dangerous. I drive off hours but bike to work.
126. The stretch where ECR goes through Menlo Park is horribly congested during traffic hours.
127. Not well at all. During rush hours it is unbearable. It is terrible for children and menlo park is a community of families. I bike everywhere and I wish it were incentivized by the city. I dont want any more downtown traffic and we need to reduce the cars in MP.
128. Not well at all. It is frightening to cross on bike or on foot. It is terrifying to use on a bicycle. It is somewhat ok for getting around in a car, but I'd prefer not to use a car. There are zero viable alternatives because El Camino has to be part of a system that gets me from home to where I need to go, and that isn't just on El Camino. Crossing El Camino is a HUGE problem that must be addressed holistically.
129. Try to avoid it, by auto, rather use bicycle.
130. Poorly - as a bicyclist, I am terrified of biking on both El Camino and on Middlefield, the two main roads that I need to bike on to efficiently get to my home from Stanford.

El Camino Real Corridor Study
C-14
131. ECR currently serves my transportation needs quite poorly. I live at the intersection of ECR and Santa Cruz Ave. and exclusively bike or walk. ECR is a death trap for cyclists, but I must cross it to get to work. My commute to work is only ~15 minutes, but a good portion of that is simply being stuck waiting to cross ECR. ECR is not much better for pedestrians...at least there is a sidewalk, but there should be more frequent crosswalks during daytime. Right now, I would never bike for any reasonable distance on ECR...it's way too dangerous. Drivers have yelled out their window for me to use the sidewalk, but that's just not right, and it's dangerous to pedestrians.
132. Not well. I live locally and do most of my errands in Menlo Park, but I always try to avoid ECR as much as possible, whether I'm in my car or on my bike. I seldom walk along ECR.
133. I think it's a really unfortunate development in Menlo Park. It cuts off businesses from pedestrian traffic. Making a more welcoming environment for pedestrians and bicyclists in dowton menlo park should be a priority for urban planning. I only use ECR for a car when I'm trying to leave Menlo Park: I live close enough to walk/bike to businesses. However I find walking/biking to be very unpleasant on ECR.
134. too fast and dangerous for bikes with no bike lanes, too slow for cars because of all the traffic lights (and them being out of sync with each other)
135. I ride my bike everywhere, and I have to take an incredibly complex route of side streets to get through Menlo Park. The times I've biked on El Camino I feel scared.
136. Poorly. It is incredibly unsafe to bike on ECR, and I often have to go far out of my way to find safe biking routes home.
137. Not well due to the multiple signalized intersections
138. El Camino is impossible in Menlo Park during rush hour. When traveling from Palo Alto on Alma at those key times, I dread getting onto El Camino because I know it will be horribly blocked. When you have to wait through a couple of light changes because the car on the other side of the intersection has not budged at all, it is depressing. It would be great to have the equivalent of the sheltered bike path through Palo Alto that runs by the train tracks, so that there would be further incentives to bike through the city instead of dealing with traffic. It would be great to have a better car route too, but if we had to choose between the two, a bicycle route would be terrific. Wouldn't it be great to have a "bike freeway" to encourage people to get out of their cars?
139. I travel on ECR mostly when I am going north and south. I try to avoid ECR during lunch and commute hours because ECR is like a parking lot. The traffic is heavy and the traffic lights are NOT set to make getting traffic through this city quickly. I have lived here for almost 25 years and the city has done nothing to improve traffic on this corridor through this city. A HUGE disappointment and the worse thing about visiting or trying to shop in this city.

Community Survey Report Appendix C: Transportation Survey Open-Ended Responses
C-15
Mixed
1. It is fine -- very busy, certain times of day are very difficult. I avoid ECR, but it is a major connector between MV, MP, Redwood City
2. El Camino is the way I get from MP to RWC and PA -- it is the only way I travel to these two neighboring communities where I frequently do errands and have business. Crossing El Camino is the ONLY way to get from West Menlo/Downtown to the Civic Center/MAHS/rest of Menlo Park. El Camino serves my needs, but I try to avoid commute hours, as the traffic bottlenecks in MP due to the reduction to 2 lanes from 3.
3. When travel time is not important -> quite well When travel time is important -> not very well
4. Functions fine for auto traffic and ok where there are pedestrian sidewalks. Need to improve bicycle safety.
5. It only serves my needs if I eant to avoid MP.
6. Somewhat, but the disjointed nature of coming off of sand hill road and making u turns is ridiculous and the traffic back up at the foot of middle road near Safeway is also ridiculous and maxed out
7. Ok, except for bike crossings for kids
8. Mediocre. It gets too congested.
9. It's fine for driving needs, though slow during rush hour. It's awful for bicycling and an impairment to my riding more frequently. I never ride along El Camino and I very much dislike crossing it due to not always being noticed by drivers who are turning or simply passing me as I cross. Not nearly enough time to cross as a pedestrian....dangerous!
10. Ecr is ok for car travel. I need it to accommodate walking and biking. If we make walk and bike viable themn car traffic will decline a bit. More bikes on ecr will make drivers accustomed to sharing the road.
11. car: acceptably walk: acceptably bike: I cross El Camino with the pedestrians' green light. I do not dare ride my bike along El Camino; I am too scared. I would only do so on a separated path. Alma between Ravenswood and the bridge to Palo Alto is pleasant.

El Camino Real Corridor Study
C-16
12. Serves my transportation needs beautifully when the traffic flow is light. When the traffic flow is heavy, sometimes I am not being transported at all, but PARKED on El Camino.
13. It does ok, considering the complexity of the area. I confess that I avoid it whenever possible.
14. It works but it's slow during rush hour and is dangerous when I cross at Sand Hill intersection to Alma in Palo Alto
15. Quite well when I am in the car, but it feels unsafe to walk along and bike along. It is also hard to bike across the train tracks. An under or overpass would be nice.
16. Most of the time it is ok, but late afternoon and evening it is very difficult to get anywhere in a timely manner thus leading to drivers cutting thru city streets to get to their destination or just to bypass El Camino from one end of MP to the other.
17. I avoid driving on El Camino during rush hours so it generally serves my needs. I would ride a bike more if there was a safe North-South route along/near ECR.
18. Moderately adequate. It is congested southbound in my am commute
19. Okay, but it could accommodate bicycles better.
20. It's the shortest route but quite dangerous!
21. 1) As an occassional motorist, ECR work OK most of the time. Of course, timing one's trip on ECR is essential. I drive ECR for occassional trips from home in RWC to Trader Joes and other trips in Palo Alto using Alma (I drive ECR perhaps once or twice per month) 2) On bike, I CROSS ECR on twice a day going to and from work. I use both at Ravenswood/Menlo and Glenwood/Valipariso. At best, the Ravenswood/Menlo crossing can be a challenge -- especially for inexperienced cyclists -- fortuneately, I'm able to travel close to the posted speed limits for short periods of time -- not everyone can (and is willing to) do this. Better, more frequent crossings would help -- including Middle/Cambridge area
22. It does well in providing north-south transportation but is a huge barrier to east-west travel.
23. Adequate for auto, inadequate for walking and cycling
24. It is the most direct route. In heavy traffic, it is very slow. There is no other choice. "how well does it serve my transportation needs?" It gets me there, but I fear the future with even more cars on it. Don't know the solution.
25. good but slow for the car; too dangerous to have cyclists on the same road; traffic signals are killer!
26. I can get where I need to go fairly easily, but the lights are too long in many cases and the congested traffic moves too slowly. I try to avoid downtown/el camino during commute time, lunch time, and school afternoon pickup time. These are the worst times to have to use El Camino. Unfortunately, this is most of the daylight hours.

Community Survey Report Appendix C: Transportation Survey Open-Ended Responses
C-17
27. In many cases the best of a bad lot but generally to be avoided if possible.
28. Problematic serving my needs. El Camino is too narrow for the number of cars on it, but I don't see how it could be widened. I get onto it from Middle, and if I am going across the tracks, I like that there is a designated right turn lane which starts a ways before Ravenswood. There should be a right turn lane from El Camino on to Middle. Most of the time, the turn left lane into PaloAlto and across the tracks is very filled with cars. Sometimes there are 12-14 cars and the lane is used up and then blocks a travel lane going south. Walking across at Middle and ECR is dangerous. Cars turning left don't wait.
29. So-so. It is too congested with cars for my local usage. I think through traffic should be strongly discouraged.
30. useful road. but traffic isbad
31. Ok, but frustrating. I tend to avoid when feasible.
32. Depends on the time of day -- during high-traffic hours, it sucks. Otherwise, it's pretty good. (this is for driving -- I don't bike much because I don't feel that it's very safe)
33. Adequately, could be better for bicycling, sidewalk widths, and pedestrian crossing, i.e. full phase signals.
34. If I were not interested in changing my driving habits, El Camino Real would be fine. However, I would like to drive less and bike/walk or take transit more, both for commuting and to run errands on evenings/weekends. At this time, El Camino Real does a poor job of encouraging alternative modes of transport.
35. As a bicyclist, In terms of connectivity -- pretty well. In terms of safety -- not well.
36. Only using a car, not cycling or walking.
37. Works fine for driving. I do bike in the area but I do not bike on ECR - it is too dangerous
38. Mostly for riding my bike to get to the train station or Palo Alto. Occassionally, I will drive but mostly I use my bike. It's not that safe for bikers-- it's direct but no dedicated bike lanes means that I'm on my own.
39. Only ok - too many cars. Need better conditions for biking, walking and ECR bus route.
40. I drive on El Camino quite often, and at certain times of day, the traffic is terrible because the lights don't seem to be timed properly to allow for traffic flow. I often bike to work and would love to take ECR as it's the most direct route; however, there are no bike lanes and I absolutely do not feel safe biking on the street.
41. It's okay, but I do find it frustrating to bike on. Cars are often annoyed that there are bikes, but we can't really bike on the sidewalks. Additionally, the edges of the right lane are often scattered with drains that are below the surface level of the road (specifically, southbound near Ravenswood). This makes it either exceptionally bumpy or forces one to bike a littler further into the right lane--either seems unsafe with the level of traffic.

El Camino Real Corridor Study
C-18
42. Barely OK.. It's a bottleneck for car traffic since traffic from Alma (and to some degree Foothill) converge onto it in Menlo Park (other North/South primary roads end at the Menlo Park / Palo Alto border). Also, the lack of good East/West connectivity pushes more traffic onto El Camino. It's generally way too hard to get to or through Menlo Park downtown from points east, west, north and south!
43. It is ok to drive on, but i would never bike on there, and i would be a little nervous having my kids cross to hillview.
44. I avoid driving across town in commuter hours.
45. It could be impro ved .
46. Too much spill over from Sand Hill Road (i.e. non-Menlo Park traffic)
47. the bottom line is there is too much traffic & too many people trying to use the same space; I make do by riding my bike on less congested streets & only driving in non rush hour times; but it could be more convenient
48. ok, i would bike if I felt safe to cross ECR>
49. Except for the bottleneck between Valparaiso and Roble, it does its job. I use Hoover to enter downtown if coming from the north. Crossing ECR on most streets is tolerable at most hours but Ringwood/Menlo is just slow.
50. Good for driving, which I do occasionally, but poor for biking, which I do every day!
51. Slow but OK for car traffic. Terrifying for bicycle riding.
52. By car: adequately. By bike: it is completely unsafe.
53. I drive down it on weekends and it is fine. I commute by bike on weekdays but always avoid El Camino because it is unsafe for bikes.
54. Well in my vehicle (though congestion is high during rush hour), but very poorly on my bicycle, requiring me to navigate on less direct roads for both safety and efficiency.
55. Depends on the time of day. Disastrous during morning and evening commutes. During day and late night there is a good flow.
56. Rush hours are terrible, otherwise not bad.
57. Moderately well, but bike lanes should be a priority especially considering the amount of bike traffic to and from Stanford.
58. ok - not great. the congestion continues to grow and it is a bottleneck both NS and EW

Community Survey Report Appendix C: Transportation Survey Open-Ended Responses
C-19
Other
1. major access to menlo park
2. I travel on ECR only when visiting businesses on ECR. Otherwise I use it for travel from Palo Alto southward, or Atherton northward.
3. no opinion
4. We don't trust Menlo Park to do what is best for Residents - this survey is a great example of that.
5. There needs to be a cut-through /underpass from El Camino Real to Burgess Park (for pedestrians & bikes) somewhere in the vicinity of Middle Road (similar to what they have in Palo Alto). It needs to go under the train tracks and provide better access to Burgess Park for the residents of Menlo Park.
6. It is the ONLY WAY to get through Menlo Park! I use it to get to Redwood City or Palo Alto.
7. Its almost unavoidable.
8. Traffic lights need to be better coordinated so that traffic can move more freely.
9. Needs bike lanes.
Question 18
Specifically, what is the most important traffic/transportation/circulation issue to you on the El Camino Real corridor in the City of Menlo Park?
1. 3 through lanes to connect with Palo Alto and Atherton as a continuous 3 lane corridor
2. Separate bike lanes!
3. Bottleneck from Valparaiso to Sandhill somewhat caused by parking allowed on ECR
4. We take the lane when on bike, so it's okay. Probably [?] unsavy bike riders feel unsafe
5. Time the lights! During commute time; put in lots of trees, plants!
6. There is not adequate safety for students who need to cross El Camino to attend school, or anyone else!
7. For the city - safe pedestrian and bicycle crossing for schoolchildren.
8. Traffic flow ! Please synchronize stop-lights to provide for maximum traffic flow. Please remove the 3=>2 lane bottleneck that often brings traffic to a stand-still in the commute hours. Please install traffic sensors to allow cross-traffic to trip the lights during non-commute hours so cross-town traffic is able to move. Please stop obstructing flow.

El Camino Real Corridor Study
C-20
9. safety and parking
10. poor east west --- too mch raffic now
11. Too much traffic now. Imagine what build-out will bring. Add lanes to El Camino with there are two lanes on either end? Insane.
12. too much Palo Alto traffic in Menlo Park
13. Vehicular (includes bicycles) crossing of ECR
14. Getting across it in no more that 1 signal cycle. And getting through more than 1 signal cycle per block while travelling on it.
15. Bicycle safety, especially for kids biking to school.
16. Too much traffic.
17. Trying to cross it on bikes is not very safe.
18. It is much too congested trying to get across town. Traffic backs up from Trader Joe's and across ECR to the other side of the train tracks, in both directions. Put a pedestrian/bike overpass with a clear acrylic roof to protect from rain, without being an eyesore, over ECR at Middle Ave., then a lane down the train tracks, for children to safely get to Burgess to and from west Menlo Park. Get rid of parking on Middle. This might decrease some of the vehicle traffic at the ECR/Ravenswood intersection, which is by far the worst, if people could safely walk/bike instead. I have imagined this solution for years. Make the overpass a beautiful, sculptural, mostly clear (obviously except for the floor) structure, and it won't be an eyesore.
19. Gridlock. For example, having to wait for three traffic light cycles to make a left turn from southbound ECR to Alma.
20. I would like to see more dedicated bike paths in Menlo Park that are not on the street. I love the idea of a dedicated bike bath that runs along side El Camino. I don't like the idea of a bike lane next to El Camino, it would be too dangerous.
21. Pedestrian/bicycle crossing (subway) under the RR tracks between Ravenwood and Sand Hill, e.g., connect Middle to Burgess
22. Safety for bikes and pedestrians
23. Completely unsafe for bicyclists, either for transit or to simply cross ECR. Safety upgrades to the approaching streets (Oak Grove, Ravenswood, etc.) need to be part of the solution.
24. Make crossings and turn directions that make sense to mitigate traffic back ups which are ridiculous
25. no opinion
26. Reducing flow of traffic through downtown

Community Survey Report Appendix C: Transportation Survey Open-Ended Responses
C-21
27. There isn't one most important. People who think they're driving on the freeway, speeding, running red lights, no enforcement. I would also like to see a turn arrow for the northbound right turn only lane on El Camino. People in that lane seem to think they have the right of way no matter what, and I have seen/experienced too many near collisions.
28. Speeding traffic north past Encinal Avenue.
29. Vehicle traffic reduction
30. rush hour congestion, safe passage along and across El Camino by bike and on foot. I believe we need to seriously re-look at undergrounding a lane or two each direction for through traffic on El Camino, funded by low interest bonds available now and by Fast Track payments per use of the lanes. And we also need to do grade separation at the train tracks - soon. Removing delays related to the trains will help intersections. PLEASE STUDY THIS in combination with the corridor.
31. Bike safety. We bike as a family a lot. Our youngest daughter attend a daycare across ECR so we need to cross and also bike along ECR. I do not feel comfortable biking along ECR on the street (especially when I have my kid on the back) so we use the sidewalk. Often there are signs, or cars (we live close to a car work shop that apparently use the sidewalk for parking cars..) blocking our way, and of course we have to look out for the occasional pedestrian. When we bike with our oldest kid (who's on her own bike) we use detours because I do not think ECR is fit for kids on bikes. I often choose the car instead when I know we have to cross ECR and I think that's a shame!
32. Lack of safe alternatives to driving alone. That's the #1 way to reduce congestion.
33. congestion caused by poorly timed lights and too few car lanes. i also think there are too many traffic lights on ecr through menlo park, considering ecr in mp is only 11 blocks long.
34. Week day traffic is very bad especially on Wednesdays
35. Ease traffic congestion and make bike/pedestrian travel safer. Consider making a more direct route from 101 to ECR, maybe via Willow to ease traffic around Burgess Park/MA, etc. Open more pedestrian routes to ECR - like at Burgess and Willow. I like the idea of a bike/pedestrian route along train corridor.
36. No bike capacity
37. Gridlock through Menlo Park
38. logjams of cars on ECR.
39. Addition of bike lanes
40. The congestion at Sand Hill Road and ECR.
41. Crossing ECR with the bike is so dangerous that I take the car when I have to go from downtown to burgess! If I have enough time I rather prefer to walk. Biking safe should be resolved. Also,

El Camino Real Corridor Study
C-22
there are not enough bike rake on ECR.
42. merging of lanes due to fewer lanes in Menlo Park on El Camino is root cause of most problems. Creates terrible traffic (the last mile of my commute takes as long as the previous 5 miles). Makes it unsafe for bicyclists and pedestrians (because of the traffic). I also suspect that the timing of the signals could be improved.
43. Providing a safe bike corridor along *and* across ECR, i.e., a bike bridge at Middle, Roble, etc. Please make sure that this accommodates bike trailers!!!
44. Lack of coordination of traffic timing between neighboring jurisdictions (primarily Menlo Park and Palo Alto).
45. The most important issue is how much of a physical barrier ECR is between the east and west sides of Menlo Park.
46. It has less capacity in Menlo Park than Atherton or Palo Alto, this causes traffic jams.
47. People who get in the Ravenswood right turn lane northbound on ECR who then pull into ECR traffic at the last minute and slow the traffic flow in the next lane. Narrow sidewalks also not good.
48. Bottled up traffic and pedestrian crossing safety. Bottled up traffic leads to frequent turns on yellow & red arrows and drivers running red lights at most intersections. Better count to 3 after the light changes before you proceed or you will get hit.
49. Pedestrian & Bicylist safety & traffic flow
50. ECR is a highway, and a much needed North/South travel route. Traffic is already too heavy and too clogged because of overdevelopment in Menlo Park and the surrounding towns. Stop overdevelopment, help the traffic flow better and faster on ECR through Menlo Park. Pedestrians and bicycles should not be mixed with cars in heavy traffic, or areas where cars are moving quickly. When a car collides with bicyclist or pedestrian, everyone loses, but the pedestrians and bicyclists could lose their life. Segregate vehicles from pedestrians and bicycles! Then everyone can move faster and safer.
51. Too many cars for too narrow a corridor .
52. I think we need to make it more bicycle/pedestrian friendly, while also doing something to improve the vehicle traffic. I would never let my children cross ECR on their own to go to Burgess because I think it is way too dangerous. This should be changed.
53. Bicycle access and usage.
54. Alma being close to through traffic in Palo Alto
55. improving bicycle and pedestrian access and safety by eliminating on street parking and widening sidewalks on both sides of the corridor.
56. Increase safety for pedestrians and cyclists. Make it more friendly for residents of Menlo Park to stroll through the neighborhood.

Community Survey Report Appendix C: Transportation Survey Open-Ended Responses
C-23
57. safety. narrow or restricted sidewalks, sharing with bikes, short 3 lane merges at Alma and Cambridge.
58. CONGESTION at most times during the day. Need to move through traffic through!
59. Pedestrian safety while walking along and attempting to cross El Camino. Access to public transit and business is hampered by difficult and dangerous crossings with poor signaling, especially for visually impaired pedestrians.
60. Wish I could bike safely from Palo Alto to Menlo Park. Currently there are no bike lanes along El Camino.
61. I would like to see the pedestrian/bike bridge over ELC from downtown to civic center move forward. It is very sketchy to bike east-west across El Camino, even with some of the latest bike lane/signage improvements.
62. Creating more pedestrian friendly zones will help businesses along the route.
63. There should be no parking on El Camino, and that space should be used to add lanes for traffic to move swiftly through MP. Traffic is worse in MP because of the bottleneck between PA and Atherton. Open up lanes and traffic will flow better. It's a terrible waste of gas and gets on everyone's nerves. Contrary to many MP residents, I don't believe that opening up lanes will increase traffic. It will make the traffic we already have get through faster.
64. Please make El Camino more pedestrian and bike friendly.
65. ECR is very ghetto and an eye sore. A city like Menlo park deserves a better looking and better functioning thorough street that also connects MP on the civic center side to the downtown area. On a regional scale, a better pedestrian/bicycle route could make it a more pleasant street. Please look at examples from countries who prioritize pedestrian and bicyclist. A slower traffic there is alright that way less people would use ECR.
66. Pending overwhelming proposed Stanford and Greenheart projects--more than general area and ECR specifically can bear
67. It takes too long for the light to change allowing me to cross ECR at Sand Hill.
68. Need more lanes
69. Being able to comfortably walk and bike
70. Too much vehicle traffic!
71. Safety for crossing El Camino on bike. The bridge sidewalk is very narrow over the creek and the crossing to Alma in Palo Alto is dangerous
72. Pedestrian and bycycle safety followed by frustration of sitting in traffic for three blocks. Unsafe to walk but a hassle to drive.
73. Biking across and along el camino, and the traffic light at ecr and alma and sand hill road.

El Camino Real Corridor Study
C-24
74. Keeping traffic moving.Cars should be able to go directly from sand hill rd.
75. Reduce the amount of traffic on our dangerously congested, already over-crowded corridor.
76. The people who speed through lights and almost kill me, whether I'm walking or biking or driving. On a more utopian note: I think el camino should eliminate one lane in each direction, in the middle, to create a bike and pedestrian median that is landscaped, and put a monorail overhead, to eliminate public transportation on the roadway. Obviously this doesn't work just for menlo park, but doesn't it sound lovely?
77. A combination of better bike routes and smoother driving times.
78. There's a two-fold issue and that appears contradictory. There are stretches of road that are absolutely packed with cars. But where the traffic lightens up, drivers speed indiscriminately. Don't believe me? Try positioning a radar speed sign at the border of MP and Atherton and watch what happens the moment cars break free of downtown MP gridlock.
79. Too many cars for the number of lanes.
80. Awful congestion during peak hours. Much of this could be ameliorated if MP would just put Palo Alto into a chokehold and get Sand Hill Road southbound to connect with Alma Expy directly like it did years ago. Now people wanting to head south on Alma Expy have to come into Menlo Park and make a U-turn on El Camino.
81. timing of traffic lights - sand hill & el camino. in the morning I commute to mountain view and this intersection is just a disaster. as a driver, bikes riding along el camino. seems incredibly unsafe for all.
82. Safety
83. Too much priority to cars, too little attention to pedestrians and bicyclists.
84. Make it more bike and pedestrian friendly. This will help get people out of their cars.
85. Safety
86. Too many people compensating for Sandhill-Alma disconnect. Also too much traffic traveling too slowly during rush hours.
87. ECR, due to high speed, multiple lane auto traffic, is very unattractive and unsafe for any other users. More auto lanes and auto traffic is not the answer. This is 2014, the era of multi-modal roadway design. Let's bring ECR into the 21st century. Let's make ECR available to all users, no matter what type of travel option they choose. Why are we even considering accommodating more auto traffic?
88. Wait times and cycles at signal lights
89. Less constriction to traffic

Community Survey Report Appendix C: Transportation Survey Open-Ended Responses
C-25
90. WIDER WIDER
91. No protected cycle path. (I'm not a huge fan of bicycle lanes per se, protected cycle paths are the way to go on a route with such high vehicle volumes (and speeds) as El Camino). This route is the place for the cycle path because it is primarily a commercial corridor, lots of businesses here.
92. The need for continuous bike lanes and lower traffic speeds on ECR. Also better pedestrian crossing and wider sidewalks.
93. Make it more bike friendly. I would ride my bike more places if El Camino didn't terrify me. Just crossing ECR in any way other than by car is already really hard. Actually riding my bike ON it is something I have never done, but would if it had protected bike lanes.
94. Needs bike lanes or at least sharrows.
95. Encourage less cars, more bicycles
96. Lack of safe bicycle and walking facilities, both along ECR and when trying to cross ECR.
97. Lack of cycling facilities, poor signal timing.
98. Bus service should be improved
99. Red light runners on ECR at Santa Cruz and Sand Hill.
100. Lack of bike lanes on El Camino Real
101. Dedicated, separated bicycle lanes.
102. As discussed in my answer to #17, I feel that the most important issues are 1) improved pedestrian access (primarily with regards to having conveniently timed traffic signals) and 2) bike lanes.
103. It is a very dangerous road for cyclists and alternative parallel routes are confusing and hard to navigate.
104. Safe biking and walking access
105. Bicyclist safety on ECR.
106. You need signage and infrastructure (lane markings) to make it clear that bicyclists are allowed to use the roadway. Southbound, just north of San Francisquito Creek, the lane markings are very confusing and daunting for bicyclists.
107. The most important issue to me regarding El Camino is bicycle access to and across the street as well as connections to public transit, especially that transit which crosses El Camino.
108. Lack of alternatives to traveling by car.
109. Better accomodation of bicycling, not only along ECR, but on other routes parallel and perpendicular to ECR. Although many of the routes have bike lanes (or in the case of Middle Ave; "School Bike Safety Corridor"), these bike lanes have shared parking and/or are too narrow

El Camino Real Corridor Study
C-26
and put the cyclist squarely in the 'Door-zone'. If substancial funds are applied to improve cycling facilities, more drivers would see that cycling could be faster then being stuck in traffic for their short trips... The biggest challenge is to undo the 80 years of heavily subsidizing motor-vehicle travel.
110. Separating through traffic from local traffic.
111. improvements in pedestrian and cycling
112. If the Caltrain were electric and ran more times a day in and out of Menlo Park, I think it would really help the traffic all along the pennisula. We need to be able to get to work and school and shopping...
113. Free flow - timed lights, more lanes (get rid of parked cars, they scare me - door could fling open, pedestrian or biker jump out from between them, they could pull out into traffic suddenly). Move more traffic faster.
114. The most important one unfortunately is something you probably cannot fix. The bottleneck created at ECR and Alma/SandHill because of East-bound drivers who want to go to Palo Alto need to turn left and then also do a u-turn sets off a chain reaction of mess in MP. (yes, I'm stating the obvious, but you asked what I think the biggest issue is…) The 2nd biggest issue to me is the Middle Ave/ECR crossing for pedestrians… Middle Ave cars turning left onto ECR are in complete conflict with pedestrians also trying to cross there. VERY dangerous, and admittedly, I can see how the cars are frustrated too because as they have to wait for pedestrians to cross, then traffic backs up on Middle.
115. Jammed traffic!
116. Allowing through traffic to move in a north/south direction
117. Pedestrians wishing to cross El Camino Real west to east at Middle Avenue get a crossing signal at the same time as motor vehicles turning left off Middle to go northbound on ECR. This results in a situation which puts pedestrians directly in the path of "green-lighted" motor vehicles. This is always absurdly dangerous, and very often results in harassment of pedestrians and unsafe operation of motor vehicles trying to get around, either in front of or behind pedestrians crossing with the pedestrian crossing signal. This absolutely must be changed, and pedestrians must have a dedicated portion of the light sufficient to cross ECR without motor vehicles trying to be in the same space.
118. Traffic delays
119. Safe travel by bicycle .
120. I think some education about sharing the roads, both for cars as well as those on bicycles. Also, this survey is a bit light on the trade-offs: how would more space for bikes be accommodated without loosing lanes? A paragraph up front would be helpful.
121. start separating bicycles from cars - folllow the rule that the worst will happen if you try and

Community Survey Report Appendix C: Transportation Survey Open-Ended Responses
C-27
mingle cars, bicycles and pedestrians.
122. 2 things: 1) Bicycling is hazardous on ECR and bike path paralleling train tracks would be very helpful, and 2) Light timing seems deliberately designed to /not/ pass traffic efficiently along and across ECR. I know a long-term Menlo Park resident familiar with transportation issues, and he is convinced that's the case.
123. Bike safety. Most drivers in MP are respectful of cyclists, but there's something about the morning commute that makes people on ECR drive like speed-drunk, incautious fools, heedless to the presence of the fragile/vulnerable cyclists sharing the road with them.
124. Inadequate bike lanes.
125. Overcrowding and slow movement on El Camino for nearly the entire length of that part of the road. Very unsafe for bike riders. People using right turn only lane at Ravenswood to move further north on El Camino, then holding up those who are turning as th4ese folks try to merge back into the thru lane to the right. This happens ALL the time.
126. Crossing El Camino as a pedestrian is dangerous (i.e., from turning cars not looking where they're going), and quite slow--crosswalks are very widely spaced, not at every intersection, or even both sides of most intersections that have crosswalks, and the light timing often means excessive waiting. These two problems collide when needing to cross three times (i.e., northbound across Menlo, eastbound across El Camino, and southbound across Menlo again to get from the residential neighborhoods west of El Camino to the library) with long wait times at each crossing.
127. This road always feels unsafe. It does not connect well with side streets and the local community. It is unsafe for biking and walking (two options that, if safer, might reduce car traffic for short trips). The traffic lights are incredibly annoying in their timing/lack of sensible programming.
128. Backup at left turn lanes. Risky behavior getting to left turn lanes.
129. The large business development planned for the Stanford property--former location of car lots. Things are bad now, imagine what it will be like once it is done but also while it is being done. I am concerned about people trying to avoid Sand Hill and traffic flowing up through neighborhoods that are residential--places where bike riding and walking are encouraged. I like the idea of a bike and pedestrian path along the back of this development and all the way up to the train station. You need to think about this although at the city meeting on the traffic plan, the consultants did not seem to want to go near the issue. You need to plan ahead!! Those developments must be located on your maps with the anticipated driveways. For example, a drive which would lead traffic across to ECR and Middle.
130. Safety for non-drivers and drivers is the top priority. Better non-car transportation (bicycles, buses) is next most important. We should be moving away from cars and toward greener modes of transportation.
131. How poorly traffic moves along ECR. Not sure if it's the timing of the lights, the fact that there is parking on ECR, or if driver's are just spending too much time on their cell phones that they don't notice when the lights change.
132. Too often there are too many large vehicles using El Camino Road which should be encouraged

El Camino Real Corridor Study
C-28
to use 191 or 280 as they seem to come off of Woodside Road and continue through Menlo Park well into Palo Alto and Mt. View.
133. lack of safe bike lanes.too much car traffic
134. Traffic
135. Insanely inefficent timing of lights end=courages cut-through traffic
136. The most important issue is clogged and dangerous streets.
137. Through traffic north and south from about Safeway / Middle to Glenwood. But the trains make it dangerous on side streets too, especially Oak Grove and Ravenswood at Alma, this affects crossing ECR. I also suggest taking down the "police red light cameras" It doesn't make any difference and I am sure there are a high percentage of people who get a ticket when they shouldn't or fight it. What a waste of time.
138. Get through traffic through town faster
139. Improve pedestrain friendliness.
140. Bike lanes is an issue so I drive on ECR usually. I would bike more to Safeway for example if ECR and the surrounding area was more pedestrian or bike friendly. A bike path separate from ECR or near caltrain would be ideal.
141. Again, it's the fact that the lights are timed to be too long of a wait to cross, and then not enough cars get through the green light at that time, making me miss the light often 2 or 3 times.
142. ECR is unsafe for bicyclists. Need a parallel route to get through Menlo Park. Palo Alto utilizes Alma to take a lot of heavy traffic off ECR. Consider developing another pathway, like Alma, through Menlo Park.
143. Make the route more friendly to cyclists and pedestrians.
144. Addition of a bike friendly lanes to ECR. The bike path along the tracks is a great idea and should be looked at seriously.
145. It's a disaster for walking and biking, and it doesn't do that well for cars, either. THE PROBLEM IS TOO MANY VEHICLES, DUE TO TOO MUCH DEVELOPMENT. You didn't ask about this in your survey.
146. Timing of the lights to handle peak traffic flows.
147. An undercrossing go the Caltrain right of way that does not require a cyclist to walk their bike. A ground level undercrossing, which is the cheapest is only possible at alma and a Willow.,
148. Empty car dealerships! More retail is desirable.
149. Bikability

Community Survey Report Appendix C: Transportation Survey Open-Ended Responses
C-29
150. Safely crossing on foot or by bicycle.
151. Less big box stores, and more cute local restaurants, shops, markets, housing - with plenty of wide sidewalks and trees/landscaping, so it looks and feels lovely and green.
152. It's not safe for biking
153. Safer pedestrian and bike lanes and crossings. Parallel streets are non connected and inconvenient.
154. Bike/pedestrian under crossings of Caltrain opposite both Cambridge and Middle Avenues.
155. Problem of few roads going from Middlefield, for example to ECR. An Palo Alto, for example there are more streets that go from Middlefield to Alma. It would be grat if there were some way to extend Alma to RedwoodCity or further North. Ain't gonna happen, however
156. Facilitating other modes of transportation up and down El Camino Real, not just driving, and ensuring those alternate modes of transportation have good access to storefronts and are supported by proper infrastructure (e.g., bike racks and/or frequent bus service at all times of day).
157. Too crowded and alternative transportation, like bicycle travel, is not safe there.
158. Flow from Sandhill Rd to Santa Cruz around 6pm is very poor.
159. It is not a very pleasant road. It is loud and congested. Pedestrians and cyclists are discouraged.
160. Bicycle safety.
161. The flow of traffic is high. The right-hooks and door-hooks are potential problems.
162. Lights sequences allow traffic to move more smoothly
163. Balance: realizing that space is at a premimum, my opinion is that there should be no more than 2 lanes of traffic each way, parallel parking buffering a bicycle track between parked cars and a widened sidewalk with street trees located in the parking lane to maximize sidewalk space.
164. It's hard to cross ECR within Menlo Park between Menlo/Ravenswood and Sand Hill Road as a pedestrian, cyclist or motorist. It's hard to believe that with all the money in this zip code, this city is so ugly, boring and difficult to get around it. Is this the best that the city can do? The only thing that is keeping me and the people I know in this municipality is the schools. Once we're done, I can't wait to get out.
165. Being able to cycle safely.
166. We need to make El Camino more friendly to people on foot or on bicycles. I strongly believe that "if you build it, they will come." Already we see people riding their bikes on El Camino. If we had better bicycle infrastructure I could leave my car at home more often and do errands by bike. We don't need six lanes of fast-moving traffic cutting through the middle of town; if people want a freeway they can go use 101 or 280. We need wider sidewalks and protected bike lanes. I do not support giving away parking for free on El Camino- that is a giveaway to a tiny number of

El Camino Real Corridor Study
C-30
merchants at the expense of many. Put bike lanes there instead of parking.
167. Crossing El camino on foot or cycling is a major problem. The issue is a lack of secure way to cross El camino to go on the East side and come back. For example, if you live on College Ave and you need to go from West to East, you essentially have only two options: go North to Ravenswood and cross the track or go South and cross the track at Sand Hill. In both cases it is just not practical on foot besides being very unpleasant. Cycling is even worst since cycling on EC is quite dangerous on these segments.
168. Too many cars making uturn at Cambridge Ave (when going north on ECR) due to sand hill traffic flow
169. Safe routes to Schools and Parks should be a top priority. many kids that are old enough to bike to soccer games, baseball practice, the library, Arillaga, etc. don't do it because its not safe to cross El Camino on a bike. All bike travel and pedestrian safety issues should be top priorities.
170. Safety of bikers and pedestrians!
171. See above comments
172. Safety
173. Safety for pedestrians and bicyclists, particularly school age children.
174. Enhanced bike access and safe cycling for all user groups, not just hardcore bike commute enthusiasts.
175. Menlo Park is a choke point for ECR. Traffic moves well in communities north and south of Menlo Park. Because it is a choke point, there is limited resources for bike/ped/transit.
176. Additional vehicle lanes in both directions
177. Improved crossings and trails for pedestrians and bicycles! There is already too much vehicle traffic in the Bay Area--adding an additional lane for cars would only encourage more. Walking and biking are pollution free and healthy; these activities are really what we should encourage!
178. Improving venhicle, pedestrian, and bike transit through this corridor. On street parking should be eliminated to avoid the bottleneck that currently plagues Menlo Park's section of ECR. Bike lanes are a must but ideally should be managed off the street, as a separate sidewalk type path. If a continuous corridor can be established between the railroad tracks and ECR similar to the bike path in Palo Alto that would be ideal. Having bikes and pedestrians utilize the same narrow sidewalk is a diservice to both and creates a risk to pedestrians and cyclists alike.
179. Lack of bike lanes. I feel like this is one of the surest ways to decrease traffic congestion. I would choose bike commuting over driving every day if I felt safe doing so.
180. Cars are frequently stopped - too many traffic lights on El Camino - too many access roads - lights need retiming to ensure continuous flow of cars.

Community Survey Report Appendix C: Transportation Survey Open-Ended Responses
C-31
I'd put an underpass on Ravenswood at the Caltrain Tracks as a much higher priority than bike or bus lanes on El Camino.
181. North-south bicycle routes through Menlo Park are poor, especially near the downtown business district where many bicyclists are heading. Please add bike lanes to El Camino Real.
182. preventing traffic from using residential streets both to avoid ECR and to access ECR.
183. Bicycle lanes
184. ECR is dividing "canyon" between East and West Menlo Park. Increase size of central island, include walking path (see European Boulevards). Improve pedestrian ECR crossing in downtown MP; make two-stage process.
185. Making travel across and through Menlo Park bicycle friendly!
186. Creating bike lanes and improving bike safety is my top issue. Secondary, improve the flow of traffic by properly timing the stop lights.
187. See above, but #1 would be to make it easier to get to/from our downtown from points north and south.
188. It is very time consuming to go from the Willows to West Menlo Park, and a lot of the time is wasted near ECR, because there are too many turns, stop signs, lights, etc. Facilitating cross town commuting to schools, practices and shopping would be a huge help.
189. Don't encourage more traffic by widening lanes or taking away parking spots.
190. Safety
191. The lack of support by the city staff to encourage a pedestrian friendly environment. We are still a suburb. The weather is perfect and it further supports a pedestrian and bicycle friendly environment. Crossing and using the ECR (by foot, car and bicycle) at most times of the day interrupts the ability of all residents to enjoy living, working and shopping in Menlo Park.
192. Timing lights to keep traffic flowing North/South during peak traffic times.
193. Effective north south corridor for bicycles.
194. Cars are not paying attention to bikers. There is no safe space for bikers. I'm currently in London on a visit and it's amazing how this town has embraced its bikers. 10 years ago it was very rare to see bikers here, but today there are tons of bikers who are seemingly successfully sharing the road with cars, often by taking up a whole car lane.
195. Bike lanes on el cami no and bike access to/from the street
196. More accessible bike lanes
197. Pedestrian safety.
198. Too many cars for 2 lanes

El Camino Real Corridor Study
C-32
199. Bicycles should be prohibited. Abike / pedestrian underpass would be good.
200. Very crowded at times.
201. balancing transportation needs for vehicles and bike commuters; ensuring safety for all
202. bike lane availability. too many cars on ECR.
203. Hundreds of thousands of new square feet of development, and the best we can hope for is elimination of parking on the street?
204. Bike and pedestrian safety.
205. It is not safe for bikers.
206. Bicycle safety.
207. Too congested.
208. I'd love to have a BIKE path off El Camino but parallel to it with a crossing at a point convenient to go east/west straight into downtown MP's biz district. I've tried riding my bike on the sidewalk along El Camino and it's almost impossible. The sidewalks are narrow to begin with and there are driveways and poles that intrude. It's really risky business. There was some talk at planning meetings for downtown's new vision several years ago about a SF-style crossing in which all traffic stops and pedestrians and bikes can to all four directions plus cross-wise. What happened to that?
209. Poor bicycle lanes and safety
210. Bike lanes.
211. Must separate bike / pedestrian crossings from the roadway, at least a couple of locations. If ECR were a river it would be a no brainer to build a bridge, why is the city too cheap to create separated bike/ped crossings?
212. Adding bike lanes!
213. Traffic not related to residents using ECR to bypass the 101.
214. Traffic on valparaiso avenue has to be decreased. El camino needs to be way more bike friendly. We have a chance here to be an internationally recognized community that promotes biking. We could be the amsterdam of the united states -- why not promote that?
215. It would help tremendously to provide a safe and efficient bike route parallel to ECR, preferably on the South/West side.
216. Crossing ECR safely and being able to get from point A to B within Menlo Park. There is NO

Community Survey Report Appendix C: Transportation Survey Open-Ended Responses
C-33
safe route other than in a car.
217. More safe bike lanes and sidewalks at the North end of El Camino near Celia's Restaurant.
218. Car backups during heavy traffic periods
219. Bicycle safety, lack of biker visibility both for bikers and drivers.
220. I would like a dedicated and safe bike lane. The Bay Area is very unique in being a bike friendly community. Having a safe bike line on ECR would fit in with that philosophy. I am originally from Boston, where you should only bike if you want to get offed by a car. I really appreciate being able to bike anywhere here; it's great for your health and for the environment. If you are able-bodied, there is no reason to drive to work if it's only several miles away. Having a safe and efficient bike route encourages that.
221. bike safety
222. I especially hate riding along it on my bike, but, to get to some places, unless I go quite far out of my way, there aren't any alternative routes. With the parked cars on one side and the moving cars on the other and people on the sidewalks, there's really nowhere a bicyclist can ride safely. Riding on ECR is a real white-knuckle experience! Having a good, safe bike lane along ECR through Menlo Park would be great. Increasing the smoothness of traffic flow by timing the lights better would be good too.
223. I would like a more direct bike corridor through Menlo Park. If it's along El Camino, it would have to be physically separated from cars and/or wide enough to give a safe separation distance from cars, and definitely not adjacent to parallel parked cars because of the danger of people opening their doors into the bike lane.
224. Bike lanes would be fantastic!
225. Personally I have the biggest problem between Partridge Ave, where I live, and Palo Alto Ave, where I would be coming from via bike or by walking from downtown Palo Alto. That section of ECR seems especially dangerous for bikes/pedestrians, and like a really good place to develop commercially if it was at all pleasant to access by bike or walking. To get to work, my bike
226. Lack of safety for bicycles. It could be a fantastic route for many.
227. Less "through" traffic. Better light timing. Improve cycling safety. I live 1 block east of ECR and cars FLY down our street trying to avoid traffic.
228. Basically unrealistic to use ECR as a biking route.

El Camino Real Corridor Study
C-34
229. bike friendliness!
230. We need space for bikes!! We don't need more for cars - remember the study that if you build more lanes, it just brings more cars?!
231. Making ECR more bike friendly.
232. Bike safety
233. Safe biking lanes.
234. I would like to see dedicated & separated bicycle and pedestrian pathways
235. Bike lanes.
236. Walkability
237. Bike safety is a bike one but so is rush hour traffic that goes through this area. It is always blocked! Better light synchronization might help? Lights are too long going west-east.
238. I would like to see safe bike crossings at key intersections and a good bike route that parallels El Camino.
239. Get traffic through this city as quickly as possible. Get the signals timed properly.
Question 19
Specifically, what intersection or portion of El Camino Real do you have concerns with traffic/transportation/circulation, if any?
1. Ravenswood
2. Stretch of ECR from Stanford Shopping Center to Ringwood -- especially at night when bike bridge is unsafe (people camp there). Cars come up behind and close to me not look for me -- even with my light and reflective vest. Trees planted on side walk keep me from riding on walkway. During the day is bad too, night is worst.
3. Turning left onto El Camino off of [O...] the light won't change for just bikes. You need to for a car to come up behind you. Bad sensors!
4. Middle Ave, Valparaiso
5. Middle Avenue/El Camino -- Pedestrian signal directs pedestrians to walk across, impatient motorists turning left from Middle Ave. Also motorists speeding through during walk signal (North/South)
6. The intersections without full pedestrian crossings are very inconvenient and convey the message that the city prefers to discourage walking. This will be even more of an issue when there is more development on El Camino Real following the Downtown/ECR Specific Plan.

Community Survey Report Appendix C: Transportation Survey Open-Ended Responses
C-35
7. The section between Middle Avenue and Oak Grove seem to be the most impacted, although often traffic is backed up all the way to Valparaiso, too. Please go back to 3 lanes of traffic. Also, a simple request is to install a pedestrian cross-walk on the south side of the Middle Avenue intersection, so kids biking to MAHS from West Menlo can easily dismount, walk their bikes across with the light, and remount their bikes on the opposite side instead of either swooping across Middle to the Safeway sidewalk in the middle of all the traffic, or waiting to cross and then cross again (and hold up left-turning vehicles).
8. menlo ave
9. Valparaiso, Middle, Ravenswood (pretty much all of them.
10. Middle / El Camino
11. From Ravenswood to Palo Alto left turns need longer stacking capacity.
12. IRavenswood, Valparaiso, Middle.
13. Crossing El Camino north of Valparaiso, very unsafe except at signaled intersections.
14. From border of Redwood City to Palo Alto.
15. Around the RR station
16. Getting across town is the biggest problem, by far, for locals. Huge numbers of children and families need to get from west Menlo Park to the entire Burgess community center often, to the pool, gym, library, classrooms, etc. The combination of traffic on ECR and having to stop for the trains makes cross-town traffic a nightmare, and utterly unsafe for bikers and pedestrians. The ECR/Ravenswood intersection is clearly the most congested and worst problem. The left turn onto Ravenswood toward ECR coming from the library and gym is a total nightmare and backs up traffic. There is not nearly enough parking at the gym/library, which creates traffic problems. It is totally unsafe for children to get to Burgess-area activities after school from west Menlo Park.
17. Sand Hill Road to Ravenswood.
18. Circulation at Alma/Ravenswood and Ravenswood/ECR.
19. Menlo Ave, Oak Grove, Valparaiso intersections with El Camino.
20. Oak Grove x ERC and Ravenswood x ERC. It would be lovely if there were a Willow x ECR intersection, even if just for bikes, peds. tunnel.
21. Foot of Middle at EL CAMINO and the foot of Sand Hill at El Camino....that whole section is a cluster f$&@
22. no opiion
23. At Sandhills rd/ Stanford the lights are short and confusing

El Camino Real Corridor Study
C-36
Left turn on ecr at ravenswood west is hard for bikes
24. Seriously? The MP portion of El Camino is not that long, and it is bad everywhere during rush hour. And now you are going to intensify rush hour use with new office buildings. Major fail.
25. Left turn onto Palo Alto Ave / Alma. Right turn onto Ravenswood. Middle Ave. gets too much traffic from ECR and is a bike-to-school route
26. Middle intersection because it is narrow and there is considerable gridlock near it because of the way the Safeway driveway and gas station driveways gum up traffic. I cannot imagine another lane of westbound traffic on Middle from El Camino. There is NO safe place for bicyclists from Kenwood east. I worry about Cambridge intersection. It's already messed up because of u-turns. Whatever is built on Stanford site will make things exponentially worse. I worry about more cut-through traffic.
27. Ravenswood Oak Grove Menlo Ave. Creek Drive (Those are the 4 I would be using frequently)
28. menlo/ravenswood is the worst. more specifically, trying to get out of burgess, cross the train tracks, and cross ecr.
29. area from Middle ave to Oak grove has the heaviest traffic on working days
30. ECR and Ravenswood
31. Ecr from palo alto border to downtown has no bike accommodation
32. Ravenswood
33. mainly between middle and valparaiso
34. ECR + Ravenswood/Santa Cruz
35. The congestion at Sand Hill Road and ECR, and the lack of timing of lights. I think the lack of timing probably leads to much of the congestion as does the lack of through traffic on ECR.
36. From Valparaiso to Sand Hill
37. between ravenswood and valporaiso is where the majority of the problems seem to be... but this spills over in both directions. It causes problems all the way as far south as the STanford shopping mall.

Community Survey Report Appendix C: Transportation Survey Open-Ended Responses
C-37
38. x Roble (cars blocking intersection, see #17)
39. Cambridge/ECR. There are a tremendous number of U turns by cars coming from Alma who want to continue onto Sand Hill Road. These should be prevented.
40. The intersection at Middle Road, including the Safeway entrance/exit on Middle.
41. Santa Cruz crossing. Ravenswood/Menlo crossing.
42. Pedestrians crossing at Santa Cruz Ave. For most people the time alotted to cross is quite sufficient, but for older or disabled pedestrians it's not always enough.
43. The section where it narrows from three lanes to two. This creates tremendous traffic logjams. I think getting rid of parking on El Camino (replacing it with close by alternative parking) creates the opportunity for 3rd lanes/turn lanes that could greatly enhance traffic flow.
44. ECR and Ravenswood/Menlo Ave
45. Oak Grove crossing is really bad for red light runners.
46. Traffic congestion north on ECR at Cambridge - many cars making a U-turn. This signal seems to take a long time to trigger the turn light even when there is no oncoming traffic. Discussion needs to be had with the City of Palo Alto to reconfigure the Alma/Sand Hill/ECR intersection. Traffic should cross from Alma to Sand Hill. Traffic congestion from south ECR onto Alma during commute will back up beyond Cambridge, reducing ECR to two lanes. Needs immediate improvement. Most importantly, sidewalk along bridge crossing San Fransicquito Creek is inadequate for pedestrian and bicyclist safety. No barrier between sidewalk and vehicle traffic. It will only take a distracted driver a second to jump the curb. Would recommend a separate pedestrian/bicycle bridge here to connect to the bike path in Palo Alto. This is an issue on both sides of the bridge.
47. ALL of the intersections on ECR are a hazard, and all intersections get clogged with traffic.
48. none specifically
49. The portion between approximately Santa Cruz Ave and Middle.
50. Alma/Sand Hill Road, Middle and ECR
51. The bridge at Creek and El Camino is far too narrow for pedestrians. The on street parking at the Shell station at Middle blocks visibility and restricts traffic flow. The Middle intersection is a mess with traffic trying to get in/out of Safeway and the Shell station.
52. Middle (I've almost been hit several times while trying to walk across ECR - with the walk sign on by people turning left onto ECR) - also, gets jammed up with cars turning into gas station and Safeway. Sandhill

El Camino Real Corridor Study
C-38
Ravenswood
53. Middle to Sand Hill.
54. None specifically
55. Santa Cruz, Oak Grove, Ravenswood. All three intersections have problems for various reasons, but especially due to improperly maintained audible signals. Also, the condition of sidewalks on the northern end of El Camino from Encinal onward is terrible. They don't exist on the southbound side, making access to the bus difficult. On the northbound side, they are filled with obstructions that make it difficult to walk. Wheelchair users are forced into the street at several places due to encroachment from vegetation or CalTrans equipment (boxes, wires, poles, etc.)
56. From the Main Menlo Park Library to downtown, there are train tracks and El Camino to cross. It could prove dangerous for young kids.
57. Middle and ECR is very dangerous for biking across to get to civic center/M-A high school. There is no bike lane, there are lanes go both left and right, and the crosswalk is on the left side when traveling eastward. I instruct my kids, who are competent cyclists, to avoid the intersection.
58. All portions that have street parking. It messes up the entire stretch.
59. Ravenswood is hard to cross on foot and bikes have to jostle with cars for space. Please make it easier to get between downtown and Burgess without a car.
60. ECR / Ravenswood
61. All of it during commute hours--total flow is insufficient
62. El Camino and Sand Hill should have a pedestrian/bike overpass for people to get to Stanford
63. Sand hill
64. The segment between Middle Ave and Palo Alto border
65. Cambridge/ECR intersection
66. Crossing as a pedestrian is challenging. The lights do not support pedestrians (especially at Cambridge and ECR)
67. Sand Hill and El Camino trying to cross into Palo Alto.
68. Ravenswood/menlo ave is the worst for traffic. Between valpariso and sand hill rd is just awful.
69. ECR and alma and sand hill intersection.
70. Cambridge ave. to middle
71. sand Hill is a problem, southbound onto Alma is a problem, Cambridge u-turns is a problem,

Community Survey Report Appendix C: Transportation Survey Open-Ended Responses
C-39
Middle is a problem, Ravenswood is a problem. The whole Menlo Park corridor is crowded!
72. cambridge ave and el camino.
73. Sand Hill Road. I live on Creek Drive and it is very difficult to even get onto El Camino from Creek due to the back up at Sand Hill Road and the dedicated right turn lane. It is very dangerous for pedestrians walking from Palo Alto to Menlo Park on the west side of El Camino because drivers are only looking south and could easily miss seeing a pedestrian.
74. All of them. Any intersection that is used by bicyclists, especially children.
75. Any left turn off of El Camino into Menlo Park.
76. From the creek on the south to about Glenwood on the north.
77. el camino & sand hill. awful. ravenswood & Alma - backs up onto el camino
78. Across Safeway
79. The entire section through Menlo Park.
80. Sand hill/Alma/El camino
81. At Cambridge there is a lot of u-turn traffic because Sandhill does not go through to Alma so drivers turn north on ECR and then u-turn at Cambridge to get onto Alma. Likewise people on Alma need to go straight onto Sandhill. Crazy --- Sandhill and Alma should connect.
82. Every intersection is dangerous on ECR- the wide boulevard and multiple lanes, with no bicycle and poor pedestrian infrastructure, encourages high speed travel, which further discourages other users, and makes every intersection dangerous. ECR needs to be made a human scale resource, not a roadway out of the 1960's.
83. Ravenswood
84. None
85. Ravenswood
86. I avoid it - last time I had trouble was at Menlo College heading south bound.
87. Ravenswood is the worst, hands down. Unfriendly to pedestrians and hostile to bicyclists.
88. Intersections with RTO lanes are sometimes problematic.
89. all of ECR through Menlo
90. Red-light running at the intersection of ECR and Oak Grove is rampant for both through traffic and left turns. There should be red light cameras installed there like in the other nearby intersections.

El Camino Real Corridor Study
C-40
91. Near train station.
92. Red light runners on ECR at Santa Cruz and Sand Hill.
93. South bound El Camino Real between Santa Cruz Avenue in Menlo Park and University Avenue in Palo Alto.
94. When cycling along El Camino Real I am mainly on the section from Sand Hill Road to Atherton Ave. I avoid cycling along El Camino Real unless I have no other option as there are no bicycle lanes and the traffic moves far too fast for me to feel safe. I would love to use the direct route El Camino Real provides if there were bike lanes, especially if they were fully separated bike lanes. I cross El Camino Real both on foot and by bike at the Ravenswood/Menlo cross street multiple times a day. On foot the wait for a crossing light is far too long, if one arrives right at the proper time to cross, but the button has been pushed there is no crossing light and you have to wait a full very long cycle to cross. I support allowing the pedestrian signal to interrupt the normal traffic signal to allow pedestrians to cross quickly. On bicycle, there are no bicycle lanes in that cross intersections, it is a share the road bike lane, but it always feels extremely dangerous and I have had encounters with aggressive drivers who attempt to edge me out. I have been nearly hit both by cars giving me far less than the three feet required passing space, and by vehicle doors that are opened into me if I am traveling farther to the right on the roadway.
95. Intersections with Oak Grove, Santa Cruz, Menlo/Ravenswood, and Roble.
96. I rarely bicycle northbound on El Camino through Menlo Park because the lanes are too narrow to accommodate a bicycle and a car to proceed side by side. Therefore, I need to ride my bicycle in the middle of the lane, to be visible, safe and legal. But motorists have no indication that this is appropriate cycling behavior. Some motorists think the logical thing to do is to "buzz" past me (pass dangerously close) or honk their horns at me, to "get out of the road." This is unacceptable, as well as dangerous.
97. I believe that the area of El Camino which needs the most attention is from Palo Alto to just north of downtown.
98. Left turn from El Camino to Alma Street in Palo Alto is a big problem for me. Sometimes lots of cars are allowed to turn left. At other times, the light is very short, allowing just a few cars to turn. The result is often a long back up that cannot be cleared for several cycles.
99. See above item with respect to Ravenswood/Menlo crossing of ECR
100. Middle and El Camino and the section between Middle and Palo Alto
101. Not specifically ECR but my cycle route to work in the Bohannon Business Park area requires riding on Marsh Road. In my opinion the number one priority for Menlo Park should be dedicated bicycle lanes on Marsh Road between Middlefield and 101. It took cycling deaths to address the problem on Page Mill, Alpine and Sand Hill Roads at 280. Hopefully I'm not the one killed on Marsh Road that results in new bike lanes there. There is no alternative way to get to the Business Park and it is very unsafe. Middlefield has a nice bike lane that disappears on Marsh Road.
102. During rush hour ECR is basically a parking lot... It's hard to cross it by either car, walking, or

Community Survey Report Appendix C: Transportation Survey Open-Ended Responses
C-41
bicycle.. We shouldn't have to "hit a button" to be able to cross the street! Pedestrians should have a higher priority!
103. Embarcadero, and any place where it tends to back up.
104. Middle/ECR. And quite frankly all pedestrian crossings at ECR seem like ridiculously long waits, and then there are impatient cars in conflict with pedestrian crossings. I have to admit, I'm hesitant to encourage my child to do a lot of biking around town, which I perceive to be even more dangerous. I personally do a LOT of walking around town, and ECR is just an ugly place to walk. I lived in Manhattan for 7+ years… I get traffic and noise, but Menlo Park/ECR area is so pedestrian unfriendly :( I would LOVE to bike more. 30 years ago, I would bike ECR all the way to Palo Alto. Not in a million years would I do that now. Good luck!! We need all the help we can get to try and improve the ECR situation.
105. Any intersection where people blatantly run red lights. The Middle Ave intersection is bad.. but they all are at certain times of day.
106. From Middle Ave through Valparaiso is a big bottleneck. I suggest creating an additional lane by eliminating on street parking.
107. El Camino Real at Middle has the extremely dangerous hazard described above. As a resident, I consider El Camino Real virtually "unpassable" from Roble to Valparaiso and avoid it as much as possible.
108. From Safeway and passed Santa Cruz avenue
109. Middle Avenue traffic speeds are not observed.
110. Where do most children cross to go to Hillview in the mornings? I think Oak Grove. But whichever it is, I suppose that is the place of my concern. Would a bike bridge be best?
111. not sure, guessing around the el camino and stanford shopping centre (where bikes and pedestrians go from there to palo alto).
112. In 30 years of driving around Menlo Park I think I have never got through town without at least 2 red lights even after midnight, especially Ravenswood/Menlo Ave intersection and Santa Cruz Ave intersection.
113. I definitely feel unsafe riding on ECR from Menlo College to University, and I would love to see a dedicated bike lane on that stretch of road.
114. Sandhill and el camino is a disaster because 90% of the traffic coming from the mall and 280 is forced to turn left through Menlo park
115. El Camino and Ravenswood. See the reasons noted above in questions 17 and 18. Folks also frequently cut thru the shopping center there to avoid the lights when they need to turn right at Ravenswood..

El Camino Real Corridor Study
C-42
116. El Camino and Menlo. El Camino and Oak Grove. El Camino and Middle. Most of the crossings (except, to some extent Santa Cruz) are terribly designed for pedestrians. At, say Live Oak and El Camino, the sidewalks even curve so far, crossing the small side street as a pedestrian is an adventure. An El Camino crossing, say to patronize the businesses across the street, isn't even possible.
117. Quarry Road/El Camino and Sandhill/El Camino These are both unnecessarily complicated and slow intersections.
118. Southbound left turn to Palo Alto plus the three full intersections: Ravenswood, Oak Grove, Glenwood/Valparaiso.
119. Middle Ave is already a big problem with the Safeway and gas station entrance. At some times of day there is a "train of cars" coming down Middle or up Middle. At those times, getting out of or into Kenwood and Morey is a problem. There are two parks; Nealon Park (includes a pre-school and senior center) and Jack Lyle park which has another senior center adjacent to it. Each of these is of concern in terms of parking(backing out along Middle) and of course seniors and kids. Further up, there is a nursery school at the Baptist Church. And then, there is Oak Knoll with 800 children.
120. The Menlo Ave/Ravenswood/ECR intersection is getting worse. The crosswalk at Alma and Ravenswood causes cars to stop and back up on the railroad tracks and behind to El Camino. Trains also cause traffic to back up onto El Camino and on Menlo Ave. We have the most automobile traffic at rush hour and the most trains stopping during rush hour as well, creating huge backups. It shouldn't take me 3 to 5 changes of the light to cross ECR from Menlo Ave. to Ravenswood. We need a grade separation for the train so traffic isn't backed up.
121. Santa Cruz and the intersection at Ravenswood.
122. Middle and ecr
123. From Valparaiso to Ravenswood
124. The area of Ravenswood and EL Camino--the intersection that includes the crossing to the library, at Alma, and the intersection at El Camino. People make illegal turns at Alma. The pedestrian crossing there is better since the flags and lights have been installed, but still hazardous.
125. Oak Grove and Ravenswood crossings at ECR. I participated in many of the planning studies, walk throughs of the area, meetings years ago, it seems like none of this has made any difference. The general plan didn't reflect what I thought was said at the early meetings and workshops that I attended. Keep a small town feel. Don't have huge buildings right on the ECR (there is already a ghastly apartment complex - way too close to the sidewalk - next to Planet Auto), have big setbacks, wider sidewalks, don't increase traffic with overly large developments. Not sure any of this helps, but... there you have it. THANK YOU for doing a survey! :-)
126. Menlo Ave/Ringwood crossing with El Camino is always busy.
127. Between Sandhill and Ravenswood seems to get the worst during rush hour.

Community Survey Report Appendix C: Transportation Survey Open-Ended Responses
C-43
128. Primarily the crossing lights at Glenwood/Valparaiso and Oak Grove.
129. Awful congestion on ECR between Valparaiso and Middle.
130. Make the Ravenswood railroad and ECR crossings more friendly to cyclists or create a bike tunnel under the tracks, preferably at Middle Ave.
131. Encinal crossing
132. Well, ECR/Ravenswood is a disaster because it's all cars speeding. Walkers and bicyclists feel very threatened there. They need a better place to cross the tracks. Middle/ECR is also too congested. WE NEED TO DECREASE DEMAND FOR TRANSPORTATION!!! Changing transportation supply (the nature of lanes, sidewalks, etc.) is a band-aid. The real problem is demand.
133. Border of Palo Alto to Atherton.
134. Oak grove needs Sharrows from ECR to University., Adding more lanes and a rt turn lane on to Ravenswood from northbound ECR will turn MP into a DeAnza Blvd..if the city does this, the lane closest to the curb should have Sharrows the entire distance through MP AND GREEN LANES AT INTERSECTIONS.
135. From Middle to Valparaiso.
136. The worst region is from the Santa Clara border through downtown MP.
137. Ravenswood & EC
138. I dislike the shopping center with Chili's, Staples, the sports store… it's very unattractive and unappealing from El Camino.
139. From Sandhill to the caltrain station.
140. All of it!
141. Ravenswood- crowded major portions of the day. I go from Ringwood to Oak Grove or Encinaljust to cross el Camino even though Ringwood is closest to my house.
142. Improving bicycle infrastructure all along the El Camino Real corridor, paying particular attention to bicycle access to/from the Caltrain and nearby shopping/other points of interest.
143. The portion between San Francisquito Creek and Valpariso.
144. Sandhill Rd to Santa Cruz
145. The portion of ECR immediately adjacent to downtown Menlo Park and Caltrain is painfully slow and congested. The vacant lots between Sand Hill and the Safeway are ugly and filled with

El Camino Real Corridor Study
C-44
homeless people who make me feel unsafe walking home alone (I've been approached in a threatening manner).
146. Menlo Ave. & El Camino.
147. Santa Cruz and El Camino Real.
148. El camino and ravens wood. People get in the right turn lane and then cut back in which ends up blocking traffic from moving down ravens wood. People lane hop to get ahead. People drive thru the cvs parking lot to skip the corner. Why not have a dedicated right turn only lane that stops traffic either re merging or going straight. Take the cross walk near the train tracks and build an overhead structure to protect the pedestrians and fence off the intersection so that traffic can move more smoothly and pedestrians aren't at risk by crossing the road.
149. Ravenswood because the west bound free right lane causes bike/ car conflicts
150. I would really like to see a bike tunnel from Middle Ave on the ECR side go under the railway tracks and connect to Willow. This would be great for kids on the east side of ECR to bike to Hillview Middle School and great option to get to the library and environs from the west side of ECR.
151. South border with Palo Alto (at Alma?) past Ravenswood headed north. Very high speed traffic; no room to ride.
152. The intersection of El Camino Real at Ravenswood is terrible for both bicyclists and pedestrians. Pedestrians cannot cross ECR on the south side of the intersection, which means that if you approaching from the south and your destination is on the south you still have to criss Ravenswood twice, needlessly, just to get across ECR. This really discourages people from walking. Bicyclists have no clear place to wait safely for the light to change without risking a right hook from a car turning right to go south on ECR. Coming from the other way, the bike lane just evaporates two blocks before the intersection, and cars do not understand that bikes have the right to the full lane!
153. The Sand hill intersection is dangerous for pedestrian and cyclist. Cars coming from Sand Hill often turns even after the light has turned green for pedestrian. Cars on El Camino stop too close to the pedestrian crossing which blocks the view for other drivers and may cause accident when pedestrian are short on time to cross. The Middle Ave and El Camino crossing is also very problematic. You can cross only at one place, but cars can turn on that side and they can come fast. It is just not safe to cross there on foot and I ask my daughters never to cross there on foot or cycling.
154. See above
155. Encinal & El Camino, Ravenswood towards el Camino. Middle and El camino, Santa Cruz & El Camino
156. Length of ECR between Encinal and Sand Hill.

Community Survey Report Appendix C: Transportation Survey Open-Ended Responses
C-45
157. Valparaiso through SandHill
158. Portion near Santa Cruz Ave. and portion near Middle Ave.
159. ECR between Sand Hill Rd and Santa Cruz Avenue in both directions.
160. Ravenswood and El Camino
161. I would love for the Ravenswood to Santa Cruz section to be more bike friendly. It's a major way to connect the residential neighborhood around Ravenswood to the downtown area on Santa Cruz, but right now the crossing from Ravenswood to Menlo Ave is really unsafe for cyclists.
162. They are all bad but the intersection at ECR and Encinal is particularly bad, especially as school traffic is involved.
163. Between Menlo College and Roble Ave.
164. When you come from Palo Alto and hit Middle Avenue the traffic seems to have a hard time choosing the lane and it gets blocked up. Maybe put El Camino underground from Safeways to Valparaiso and make a pedestrian precinct on top is the answer.
165. Please add bike lanes to the entire length of El Camino Real, including neighboring cities
166. Middle. The Safeway and Shell station make it impossible for pedestrians and bicyclists. If bike under crossing at middle extension is ever constructed, there will be no safe way to access it, not even a practical way to use it. I often ride my bike to work in palo alto, but go through stanford rather than use ECR. I would use my bike to go to East Menlo Park, but there is not practical way to get there. Even using a car I cut through neighborhoods to get to valparaiso, because only practical way to get across town E/W
167. From Middle to Valparaiso.
168. Sandhill to Valparaiso has terrible traffic flow and should be fixed. The entire stretch is unsafe for biking.
169. #1. Ravenswood/Ringwood and El Camino. Especially heading northbound on El Camino approaching that intersection.
170. El Camino and Middle, which is a major route from children from the WIllows biking to Hillview.
171. El Camino at Middle, Menlo, Oak Grove, Cambridge are the worst intersections. Lights at Ravenswood/Menlo create a North / South pile up because they are not geared to the increase traffic demands early of the commute hours. Bicycle traffic for Middle and High School students across the ECR early in the am and late in the afternoon is dangerous.
172. From British Bankers Club / McD over to Santa Cruz. From Glendale over to Valparaiso, Oak Grove crossing over El Camino. From Watkins Ave to Ravenswood along El Camino
173. Oak Grove, Santa Cruz and Ravenswood are unsafe for visually impaired pedestrians because the crossing signals are not properly installed or maintained.

El Camino Real Corridor Study
C-46
174. Oak Grove Ave intersection
175. Ecr and ravenswood
176. El Camino / Ravenswood light could be longer for pedestrians.
177. REngsdorf
178. Ravenswood always feels dangerous; the u-turns on Cambridge make it pretty scary too.
179. The cross walk on ECR just north of Buckthorn, no one stops, it is very dangerous.
180. The bike safety issue applies to the entire length of El Camino.
181. Santa Cruz, ravens wood, sand hill.
182. The area from Ravenswood to Valpariso is usually a bottleneck in both directions.
183. It's easy to ride the pedestrian/bike path along Alma east of El Camino to Ravenswood. But there is not a good place to cross over to the business district. The Ravenswood bike lane disappears beside Kepler's. The cars there are pushing to get across at the light. They are not looking for bikes. It is scary. Coming back the other way, you have to merge with the traffic, some of which is turning right on red opposite Applewood pizza. You have to be brave to cross there on a bike. Your other option is to get off you bike, walk across to Applewood Pizza corner and then wait to cross with your bike as a pedestrian. Then somehow you've got to get to other side of the street to get yourself in the correct bike lane. The SF-style crossing of all directions and diagonal crossing all at once would eliminate this dilemma. I do NOT like bikes on the sidewalks in downtown MP. But I understand why children do it. Please give them a safer option -- especially the middle schoolers going to Hillview who have to cross El Camino.
184. Cycling between Palo Alto and Menlo Park downtown
185. The worst is that the lights don't detect bikes. Also, the right hand turn lane going north to ravens wood should have a physical barrier since too many cars use it to skip the line.
186. Ravenswood is a disaster crossing ECR, Alma and the train X three different modes (bike, ped and motor vehicle). And why does all the crossing traffic have to squeeze into one lane on Menlo?
187. El Camino & Sand Hill
188. Ravenswood crossing
189. El Camino and Santa Cruz/two blocks north and south.
190. The whole thing is hazardous from a biking perspective. From an automobile perspective, the sections where it narrows from three to two lanes are the most dangerous.

Community Survey Report Appendix C: Transportation Survey Open-Ended Responses
C-47
191. Between Partridge and Glenwood. Can't cross easily or safely on foot or on bike. Can't connect between downtown and city center/Burgess.
192. Between Spruce Avenue and Encinal is not safe for bikes, especially if you want to head south. It is not realistic to cross El Camino, but biking against traffic is also not safe.
193. Ravenswood crossing.
194. Many in the Menlo Park area
195. ECR @ Santa Cruz Ave. ECR @ Ravenswood/Menlo Ave. ECR @ Sand Hill Rd.
196. ECR and Ravenswood
197. It's all pretty much the same.
198. The most congested area seems to be between Roble and Valparaiso - either adding more lanes for vehicles or removing the right turn only lanes and making them both right turn or straight, may help.
199. Sand Hill rd intersection.
200. In our household we would bike between Menlo Park and San Mateo.
201. Valparaiso/Glenwood and ECR. Single lane for turn and straight travel headed west on Glenwood is a mess. I wait 2-3 lights each morning to cross or turn right onto ECR.
202. Between safeway and Sand Hill Road is particularly bad for bikes, and dangerous for people / bikes alike.
203. None
204. Sandhill through edge of Redwood city.
205. Ravenswood-Menlo Ave and El Camino Santa Cruz Avenue and El Camino
206. & Oak Grove
207. Spruce ave to watkins
208. Ravenswood and El Camino by Bevmo is always a disaster at rush hour and it's impossible to bike there.
209. There is no way to safely get across El Camino at Ravenswood heading west--those bike markings in the car lane are a joke, there would be no way I would feel comfortable maneuvering my bike into that spot with all the trucks and SUVs jockeying for position there. Likewise, the

El Camino Real Corridor Study
C-48
sharrows on Ravenswood west of El Camino are right smack in the middle of the car lane, which seems laughable--bikes are really supposed to bike in the middle of the lane and hog the road? I realize that the city is trying to acknowledge bicyclists, but putting them in harm's way doesn't strike me as the best choice.
210. Menlo Avenue intersection mainly but I find that the traffic really bottlenecks from where you enter San Mateo County (coming north from Palo Alto) all the way through where the Atherton starts. I am convinced that nothing has ever been done with the signals to get things moving through this city. I would kill all street parking on ECR through MP as a starter. We need a narrow lane north and south for bicycles.


D Y E T T & B H AT I AUrban and Reg iona l P lanners
755 Sansome Street, Suite 400San Francisco, California 94111
415 956 4300 415 956 7315

BEl Camino Real Corridor Study
A P P E N D I X B
General Plan Goals and Policies


El Camino Real Corridor Study – Existing Conditions Report September 18, 2014 Page 37
Regulatory Setting
Menlo Park General Plan
The Menlo Park General Plan adopted in 1994 provides the framework for transportation planning within the city. The General Plan established goals that are concerned with the safe and efficient movement of people and goods in and around the city, while promoting alternative modes of transportation. Transportation-related goals and policies included in the Circulation and Transportation Element of the Menlo Park General Plan that are relevant to this study include the following:
Goal II-A: To maintain a circulation system using the Roadway Classification System that will provide for the safe and efficient movement of people and goods throughout Menlo Park for residential and commercial purposes.
• Policy II-A-1: Level of Service D (40 seconds average stopped delay per vehicle) or better shall be maintained at all City-controlled signalized intersections during peak hours, except at the intersection of Ravenswood Avenue and Middlefield Road and at intersections along Willow Road from Middlefield Road to US 101.
• Policy II-A-2: The City should attempt to achieve and maintain average travel speeds of 14 miles per hour or better on El Camino Real and other arterial roadways controlled by the State and at 46 miles per hour or better on U.S. Route 101 (Level of Service D).
Goal II-B: To promote the use of public transit.
• Policy II-B-1: The City shall consider transit modes in the design of transportation improvements and the review and approval of development projects.
• Policy II-B-2: As many activities as possible should be located within easy walking distance of transit stops, and transit stops should be convenient and close to as many activities as possible.
• Policy II-B-3: The City shall promote improved public transit service and increased transit ridership, especially to office and industrial areas and schools.
Goal II-C: To promote the use of alternatives to the single occupant automobile.
• Policy II-C-1: The City shall work with all Menlo Park employers to encourage the use of alternatives to the single occupant automobile in their commute to work.
• Policy II-C-7: Commuter shuttle service between the industrial work centers and the Downtown Transportation Center should be maintained and improved, within fiscal constraints. The City shall encourage SamTrans and other agencies to provide funding to support shuttle services.
Goal II-D: To promote the safe use of bicycles as a commute alternative and for recreation.
• Policy II-D-2: The City shall, within available funding, work to complete a system of bikeways within Menlo Park.
• Policy II-D-4: The City shall require new commercial and industrial development to provide secure bicycle storage facilities on-site.

El Camino Real Corridor Study – Existing Conditions Report September 18, 2014 Page 38
Goal II-E: To promote walking as a commute alternative and for short trips.
• Policy II-E-1: The City shall require all new development to incorporate safe and attractive pedestrian facilities on-site.
• Policy II-E-2: The City shall endeavor to maintain safe sidewalks and walkways where existing within the public right of way.
• Policy II-E-3: Appropriate traffic control shall be provided for pedestrians at intersections.
• Policy II-E-4: The City shall incorporate appropriate pedestrian facilities, traffic control, and street lighting within street improvement projects to maintain or improve pedestrian safety.
Goal II-F: To provide adequate parking in the Downtown area, especially for retail customers and Caltrain patrons.
• Policy II-F-1: Adequate off-street parking should be required for all new development in the Downtown Area
Menlo Park El Camino Real and Downtown Specific Plan
Adopted by the City Council in June 2012, the Menlo Park El Camino Real and Downtown Specific Plan establishes the framework for private development and public improvements along the El Camino Real corridor in the City of Menlo Park, as well as downtown Menlo Park and the Menlo Park Caltrain Station area. For circulation, the Specific Plan envisions the following:
• A vehicular circulation system that accommodates both local traffic and north/south through traffic on El Camino Real.
• An integrated pedestrian network of expansive sidewalks, promenades and paseos along El Camino Real and within downtown. The network provides opportunities for safe crossing of El Camino Real and the railroad tracks and connects the east and west sides of town, including the City’s civic center with downtown.
• A bicycle network that builds upon existing plans and integrates more fully with downtown and proposed public space improvements in the area.
• An integrated circulation plan that supports transit use. • A public parking strategy and management plan that efficiently accommodates downtown visitors and
supports downtown businesses. • Modified parking rates for private development based on current industry standards.
The Specific Plan includes a series of recommended enhancements to the pedestrian and bicycle networks as well as transit access along El Camino Real and within Downtown Menlo Park.
City of Menlo Park Complete Streets Policy
In January 2013, the Menlo Park City Council passed a resolution establishing the Complete Streets Policy of City of Menlo Park. The policy establishes complete streets as being those that serve all users and are developed based on the context of the situation that requires a collaborative effort between many City departments to implement. The policy further requires incorporation of a complete streets approach into all phases of all projects, unless a project is found to meet limited exemption criteria.
City of Menlo Park Comprehensive Bicycle Development Plan
The 2005 Comprehensive Bicycle Development Plan (CBDP) provides a blueprint of strategies and actions to further the integration of bike usage as a commute alternative and for recreation. The goals of this

El Camino Real Corridor Study – Existing Conditions Report September 18, 2014 Page 39
Plan provide the framework for specific policies and actions addressed in the Bike Plan. The goals of the CBDP provide a long-range vision, while the policies provide specific action descriptions to implement the Plan. Following are the relevant bicycle-related goals and policies:
Goal 1: Expand and Enhance Menlo Park’s Bikeway Network
• Policy 1.1: Complete a network of bike lanes, bike routes, and shared use paths that serve all bicycle user groups, including commuting, recreation, and utilitarian trips.
Goal 2: Plan for the Needs of Bicyclists
• Policy 2.1: Accommodate bicyclists and other non-motorized users when planning, designing, and developing transportation improvements.
• Policy 2.2: Review capital improvement projects to ensure that needs of bicyclists and other non-motorized users are considered in programming, planning, maintenance, construction, operations, and project development activities.
• Policy 2.3: Encourage traffic calming, intersection improvements, or other similar actions that improve safety for bicyclists and other non-motorized users.
• Policy 2.4: Require developers to adhere to the design standards identified in this Comprehensive Bicycle Development Plan.
Goal 3: Provide for Regular Maintenance of the Bikeway Network
• Policy 3.3: Develop a program to ensure that bicycle loop detectors are installed at all signalized intersections on the bike network and are tested regularly to ensure they remain functional.
• Policy 3.4 Require that construction or repair activities, both on street and of adjacent building, minimize disruption to bicycle facilities, ensure bicyclist safety at all times, and provide alternated routes if necessary.
Goal 4: Encourage and Educate Residents, Businesses and Employers in Menlo Park on Bicycling
• Policy 4.6: Encourage major Menlo Park employers and retailers to provide incentives and support facilities for existing and potential employees and customers that commute by bicycle.
• Policy 4.9: Promote bicycling as a healthy transportation alternative.
San Mateo County Comprehensive Bicycle and Pedestrian Plan
The City/County Association of Governments of San Mateo County (C/CAG), with support from the San Mateo County Transportation Authority (SMCTA), developed the 2011 San Mateo County Comprehensive Bicycle and Pedestrian Plan (CBPP) to address the planning, design, funding, and implementation of bicycle and pedestrian projects of countywide significance.
The following are the relevant goals and policies:
Goal 2: More People Riding and Walking for Transportation and Recreation
• Policy 2.6: Serve as a resource to county employers on promotional information and resources related to bicycling and walking.

El Camino Real Corridor Study – Existing Conditions Report September 18, 2014 Page 40
Goal 4: Complete Streets and Routine Accommodation of Bicyclists and Pedestrians
• Policy 4.1: Comply with the complete streets policy requirements of Caltrans and the Metropolitan Transportation Commission concerning safe and convenient access for bicyclists and pedestrians, and assist local implementing agencies in meeting their responsibilities under the policy.
• Policy 4.5: Encourage local agencies to adopt policies, guidelines, standards and regulations that result in truly bicycle-friendly and pedestrian-friendly land use developments, and provide them technical assistance and support in this area.
• Policy 4.6: Discourage local agencies from removing, degrading or blocking access to bicycle and pedestrian facilities without providing a safe and convenient alternative.
Caltrans Implementation of Deputy Directive 64-R1: Complete Streets – Integrating the Transportation System
El Camino Real is designated as State Route 82, so is operated by the California Department of Transportation (Caltrans) in coordination with the City of Menlo Park. Caltrans has adopted a Deputy Directive relevant to complete streets, noting that they provide safe mobility for all users, including motorists, bicyclists, pedestrians and transit riders, and contribute to the Department’s mission/vision. The goals of implementing the complete street policy are to provide more options for people to go from one place to another, reduce traffic congestion and greenhouse gas emissions, promote walkable communities, and reduce barriers for persons with disabilities.
While there are no specific goals and policies of this Directive, local agencies are working in cooperation with Caltrans to further the intent of the Deputy Directive. Deputy Directive 64-Revision #1: Complete Streets: Integrating the Transportation System (DD-64-R1) was signed on October 2, 2008. Under this Directive Caltrans is directed to provide for the needs of travelers of all ages and abilities in all planning, programming, design, construction, operations, and maintenance activities and products on the State Highway System (SHS). Caltrans views all transportation improvements (new and retrofit) as opportunities to improve safety, access, and mobility for all travelers and recognizes bicycle, pedestrian, and transit modes as integral elements of the transportation system. Bicycle, pedestrian, and transit travel is facilitated by creating “complete streets” beginning early in system planning and continuing through project delivery, maintenance, and operations.
Providing complete streets increases travel options which, in turn, reduces congestion, increases system efficiency, and enables environmentally sustainable alternatives to single driver automotive trips. Implementing complete streets and other multi-modal concepts supports the California Complete Streets Act of 2008 (AB 1358), as well as the California Global Warming Solutions Act of 2006 (AB 32) and Senate Bill 375, which outline the State’s goals of reducing greenhouse gas emissions. With AB 1358 and DD-64-R1, both Caltrans and local agencies are working to complete and address common goals.
Grand Boulevard Initiative
The Grand Boulevard Initiative is a regional collaboration of public, private, and nonprofit organizations in San Mateo and Santa Clara counties with the goal of revitalizing the El Camino Real corridor. Both the El Camino Real and Downtown Specific Plan as well as this El Camino Real study are part of Menlo Park’s efforts towards implementing the overall goals of the Grand Boulevard Initiative.

CEl Camino Real Corridor Study
A P P E N D I X C
Existing Conditions Data


El Camino Real Corridor Study –Existing Conditions Report September 2014
El Camino Real Segment Volume Data


Sand Hill Ave
Cambridge Ave
Middle Ave
Roble Ave
Ravenswood Ave/Menlo Ave
Santa Cruz Ave
Oak Grove Ave
Glenwood Ave/Valparaiso Ave
Encinal Ave
34,6
0034
,300
44,1
00
46,7
00
0
5,00
0
10,0
00
15,0
00
20,0
00
25,0
00
30,0
00
35,0
00
40,0
00
45,0
00
50,0
00
Average Daily Traffic (Two-Way, Vehicles Per Day)El
Cam
ino
Real
-Av
erag
e Da
ily T
raffi
c Vo
lum
e
Nor
thSo
uth

0
20
0
40
0
60
0
80
0
10
00
12
00
14
00
16
00
18
00
1:0
02
:00
3:0
04
:00
5:0
06
:00
7:0
08
:00
9:0
01
0:0
01
1:0
01
2:0
01
3:0
01
4:0
01
5:0
01
6:0
01
7:0
01
8:0
01
9:0
02
0:0
02
1:0
02
2:0
02
3:0
00
:00
Hourly Volume (vph)2
4-H
ou
r C
ou
nts
on
El C
amin
o R
eal a
t En
cin
al A
ve-G
len
wo
od
Ave
No
rth
bo
un
dSo
uth
bo
un
d

0
20
0
40
0
60
0
80
0
10
00
12
00
14
00
16
00
1:0
02
:00
3:0
04
:00
5:0
06
:00
7:0
08
:00
9:0
01
0:0
01
1:0
01
2:0
01
3:0
01
4:0
01
5:0
01
6:0
01
7:0
01
8:0
01
9:0
02
0:0
02
1:0
02
2:0
02
3:0
00
:00
Hourly Volume (vph)2
4-H
ou
r C
ou
nts
on
El C
amin
o R
eal a
t R
aven
swo
od
Ave
-San
ta C
ruz
Ave
No
rth
bo
un
dSo
uth
bo
un
d

0
50
0
10
00
15
00
20
00
25
00
1:0
02
:00
3:0
04
:00
5:0
06
:00
7:0
08
:00
9:0
01
0:0
01
1:0
01
2:0
01
3:0
01
4:0
01
5:0
01
6:0
01
7:0
01
8:0
01
9:0
02
0:0
02
1:0
02
2:0
02
3:0
00
:00
Hourly Volume (vph)2
4-H
ou
r C
ou
nts
on
El C
amin
o R
eal a
t M
idd
le A
ve
No
rth
bo
un
dSo
uth
bo
un
d

0
50
0
10
00
15
00
20
00
25
00
1:0
02
:00
3:0
04
:00
5:0
06
:00
7:0
08
:00
9:0
01
0:0
01
1:0
01
2:0
01
3:0
01
4:0
01
5:0
01
6:0
01
7:0
01
8:0
01
9:0
02
0:0
02
1:0
02
2:0
02
3:0
00
:00
Hourly Volume (vph)2
4-H
ou
r C
ou
nts
on
El C
amin
o R
eal a
t Sa
nd
Hill
Rd
No
rth
bo
un
dSo
uth
bo
un
d

WILTEC Phone: (626) 564-1944 Fax: (626) 564-0969
24-HOUR ADT COUNT SUMMARY
CLIENT: W-TRANSPROJECT: MENLO PARKLOCATION: EL CAMINO REAL
BETWEEN ENCINAL AND GLENWOODDATE: WEDNESDAY APRIL 2, 2014
DIRECTION: NB DIRECTION: SBSTART 00-15 15-30 30-45 45-60 HOUR START 00-15 15-30 30-45 45-60 HOUR TIME TOTALS TIME TOTALS00:00 43 17 21 24 105 00:00 14 15 11 14 5401:00 21 16 15 13 65 01:00 6 18 2 4 3002:00 1 14 13 8 36 02:00 3 6 7 9 2503:00 3 9 5 6 23 03:00 5 5 7 9 2604:00 3 13 8 14 38 04:00 14 18 12 39 8305:00 8 15 21 45 89 05:00 39 34 66 91 23006:00 34 40 57 70 201 06:00 95 103 130 176 50407:00 80 117 171 206 574 07:00 189 287 327 409 121208:00 172 177 164 204 717 08:00 372 363 377 362 147409:00 222 221 204 215 862 09:00 368 311 329 313 132110:00 221 241 246 263 971 10:00 241 273 245 303 106211:00 248 260 262 274 1044 11:00 255 256 275 294 108012:00 298 298 312 270 1178 12:00 250 307 284 310 115113:00 284 292 320 316 1212 13:00 276 267 267 107414:00 316 313 338 316 1283 14:00 229 270 274 290 106315:00 361 361 326 329 1377 15:00 265 310 264 336 117516:00 378 337 361 358 1434 16:00 282 262 279 289 111217:00 410 440 409 406 1665 17:00 285 304 269 296 115418:00 392 419 379 317 1507 18:00 291 288 250 234 106319:00 300 300 264 257 1121 19:00 209 170 148 147 67420:00 237 221 227 223 908 20:00 143 115 103 102 46321:00 203 179 165 126 673 21:00 88 79 67 57 29122:00 132 111 93 79 415 22:00 58 43 59 43 20323:00 57 66 40 32 195 23:00 37 29 13 12 91
TOTAL 17693 TOTAL 16615
AM PEAK HOUR 1100-1200 AM PEAK HOUR 0745-0845VOLUME 1044 VOLUME 1521PM PEAK HOUR 1700-1800 PM PEAK HOUR 1515-1615VOLUME 1665 VOLUME 1192
TOTAL BI-DIRECTIONAL VOLUME 34308

WILTEC Phone: (626) 564-1944 Fax: (626) 564-0969
24-HOUR ADT COUNT SUMMARY
CLIENT: W-TRANSPROJECT: MENLO PARKLOCATION: EL CAMINO REAL
BETWEEN ENCINAL AND GLENWOODDATE: THURSDAY APRIL 3, 2014
DIRECTION: NB DIRECTION: SBSTART 00-15 15-30 30-45 45-60 HOUR START 00-15 15-30 30-45 45-60 HOUR TIME TOTALS TIME TOTALS00:00 25 29 24 24 102 00:00 19 17 14 15 6501:00 17 19 12 13 61 01:00 13 5 3 8 2902:00 11 12 7 8 38 02:00 7 5 7 10 2903:00 7 5 10 6 28 03:00 4 6 7 8 2504:00 12 6 8 13 39 04:00 9 16 16 33 7405:00 7 19 26 32 84 05:00 34 35 54 81 20406:00 32 35 60 67 194 06:00 77 105 153 175 51007:00 94 125 183 220 622 07:00 195 291 333 423 124208:00 209 189 196 206 800 08:00 414 378 342 346 148009:00 162 222 216 226 826 09:00 325 347 286 334 129210:00 218 226 235 272 951 10:00 268 291 242 305 110611:00 239 257 305 291 1092 11:00 282 277 273 321 115312:00 322 312 317 292 1243 12:00 267 327 275 297 116613:00 316 321 348 322 1307 13:00 296 247 295 273 111114:00 294 313 311 333 1251 14:00 233 327 246 307 111315:00 388 367 333 352 1440 15:00 290 286 284 293 115316:00 392 372 384 349 1497 16:00 259 261 281 277 107817:00 422 438 410 397 1667 17:00 287 325 292 279 118318:00 403 389 365 344 1501 18:00 278 245 241 208 97219:00 328 293 266 244 1131 19:00 201 178 178 153 71020:00 227 242 221 211 901 20:00 134 131 116 105 48621:00 178 180 152 121 631 21:00 95 92 102 71 36022:00 130 105 89 65 389 22:00 60 54 39 35 18823:00 59 56 51 33 199 23:00 27 43 32 29 131
TOTAL 17994 TOTAL 16860
AM PEAK HOUR 1100-1200 AM PEAK HOUR 0745-0845VOLUME 1092 VOLUME 1557PM PEAK HOUR 1700-1800 PM PEAK HOUR 1215-1315VOLUME 1667 VOLUME 1195
TOTAL BI-DIRECTIONAL VOLUME 34854

WILTEC Phone: (626) 564-1944 Fax: (626) 564-0969
24-HOUR ADT COUNT SUMMARY
CLIENT: W-TRANSPROJECT: MENLO PARKLOCATION: EL CAMINO REAL
BETWEEN RAVENSWOOD AND SANTA CRUZDATE: WEDNESDAY APRIL 2, 2014
DIRECTION: NB DIRECTION: SBSTART 00-15 15-30 30-45 45-60 HOUR START 00-15 15-30 30-45 45-60 HOUR TIME TOTALS TIME TOTALS00:00 24 16 17 16 73 00:00 14 11 12 10 4701:00 15 11 11 9 46 01:00 8 6 0 15 2902:00 17 3 6 2 28 02:00 5 10 7 16 3803:00 9 12 5 10 36 03:00 5 6 8 27 4604:00 6 11 21 37 75 04:00 31 37 53 97 21805:00 30 38 41 80 189 05:00 83 130 118 196 52706:00 78 114 168 195 555 06:00 178 246 272 362 105807:00 157 191 156 204 708 07:00 397 357 375 374 150308:00 202 233 189 215 839 08:00 365 305 317 331 131809:00 211 229 216 252 908 09:00 297 270 273 313 115310:00 234 239 276 253 1002 10:00 273 260 315 318 116611:00 299 277 257 288 1121 11:00 302 332 275 353 126212:00 288 251 293 305 1137 12:00 340 294 295 292 122113:00 287 295 325 323 1230 13:00 274 284 301 287 114614:00 317 324 320 239 1200 14:00 290 331 307 332 126015:00 363 347 336 315 1361 15:00 322 287 333 274 121616:00 340 373 376 355 1444 16:00 344 323 298 325 129017:00 341 351 353 287 1332 17:00 324 321 278 254 117718:00 270 278 260 233 1041 18:00 245 192 185 167 78919:00 210 202 204 197 813 19:00 176 134 141 121 57220:00 178 162 143 114 597 20:00 128 104 80 81 39321:00 116 110 81 69 376 21:00 78 52 67 45 24222:00 44 62 32 28 166 22:00 51 35 16 17 11923:00 18 25 13 20 76 23:00 15 14 16 21 66
TOTAL 16353 TOTAL 17856
AM PEAK HOUR 1100-1200 AM PEAK HOUR 0700-0800VOLUME 1121 VOLUME 1503PM PEAK HOUR 1615-1715 PM PEAK HOUR 1415-1515VOLUME 1445 VOLUME 1292
TOTAL BI-DIRECTIONAL VOLUME 34209

WILTEC Phone: (626) 564-1944 Fax: (626) 564-0969
24-HOUR ADT COUNT SUMMARY
CLIENT: W-TRANSPROJECT: MENLO PARKLOCATION: EL CAMINO REAL
BETWEEN RAVENSWOOD AND SANTA CRUZDATE: THURSDAY APRIL 3, 2014
DIRECTION: NB DIRECTION: SBSTART 00-15 15-30 30-45 45-60 HOUR START 00-15 15-30 30-45 45-60 HOUR TIME TOTALS TIME TOTALS00:00 14 16 11 11 52 00:00 10 7 4 5 2601:00 8 7 5 5 25 01:00 8 3 8 11 3002:00 6 4 8 5 23 02:00 3 6 7 9 2503:00 8 5 8 10 31 03:00 4 11 13 27 5504:00 6 13 20 22 61 04:00 39 35 47 88 20905:00 19 23 53 75 170 05:00 62 109 130 165 46606:00 88 119 187 178 572 06:00 183 263 323 372 114107:00 183 188 162 215 748 07:00 386 388 373 384 153108:00 153 195 190 213 751 08:00 347 308 324 304 128309:00 232 197 211 240 880 09:00 318 269 311 281 117910:00 246 236 279 278 1039 10:00 329 315 249 345 123811:00 295 271 288 286 1140 11:00 298 317 324 267 120612:00 294 305 298 296 1193 12:00 319 290 309 302 122013:00 259 330 295 314 1198 13:00 292 336 266 308 120214:00 369 334 296 321 1320 14:00 292 325 311 331 125915:00 338 368 330 315 1351 15:00 318 316 299 302 123516:00 350 403 363 359 1475 16:00 315 342 331 331 131917:00 353 353 350 324 1380 17:00 304 282 281 277 114418:00 274 292 230 233 1029 18:00 176 188 199 181 74419:00 223 227 204 193 847 19:00 145 147 157 126 57520:00 177 159 143 118 597 20:00 121 111 95 97 42421:00 114 97 66 64 341 21:00 73 64 41 42 22022:00 55 54 44 27 180 22:00 44 34 34 16 12823:00 30 32 26 34 122 23:00 15 14 14 16 59
TOTAL 16525 TOTAL 17918
AM PEAK HOUR 1100-1200 AM PEAK HOUR 0700-0800VOLUME 1140 VOLUME 1531PM PEAK HOUR 1615-1715 PM PEAK HOUR 1600-1700VOLUME 1478 VOLUME 1319
TOTAL BI-DIRECTIONAL VOLUME 34443

WILTEC Phone: (626) 564-1944 Fax: (626) 564-0969
24-HOUR ADT COUNT SUMMARY
CLIENT: W-TRANSPROJECT: MENLO PARKLOCATION: EL CAMINO REAL
NORTH OF MIDDLE AVENUEDATE: WEDNESDAY APRIL 2, 2014
DIRECTION: NB DIRECTION: SBSTART 00-15 15-30 30-45 45-60 HOUR START 00-15 15-30 30-45 45-60 HOUR TIME TOTALS TIME TOTALS00:00 37 22 21 22 102 00:00 18 13 13 12 5601:00 15 12 15 10 52 01:00 9 7 0 16 3202:00 21 6 4 5 36 02:00 6 11 12 24 5303:00 10 16 9 12 47 03:00 11 12 15 22 6004:00 10 18 38 45 111 04:00 12 12 18 46 8805:00 42 53 65 107 267 05:00 29 67 64 73 23306:00 127 161 249 259 796 06:00 223 304 345 428 130007:00 246 270 252 323 1091 07:00 449 441 447 467 180408:00 338 297 277 315 1227 08:00 433 378 407 362 158009:00 289 328 265 327 1209 09:00 343 300 344 361 134810:00 304 345 325 352 1326 10:00 358 321 354 418 145111:00 389 367 385 376 1517 11:00 345 397 367 421 153012:00 381 377 366 418 1542 12:00 409 314 354 339 141613:00 378 394 427 456 1655 13:00 329 361 357 371 141814:00 436 467 410 418 1731 14:00 342 356 399 393 149015:00 459 455 458 465 1837 15:00 399 339 380 376 149416:00 478 525 503 475 1981 16:00 399 382 356 412 154917:00 474 477 467 392 1810 17:00 385 363 364 316 142818:00 377 357 321 305 1360 18:00 305 251 223 212 99119:00 269 267 276 264 1076 19:00 201 194 185 154 73420:00 231 200 194 160 785 20:00 168 123 96 99 48621:00 152 136 113 106 507 21:00 103 78 77 53 31122:00 81 79 65 38 263 22:00 52 38 19 21 13023:00 36 41 36 29 142 23:00 14 19 16 23 72
TOTAL 22470 TOTAL 21054
AM PEAK HOUR 1100-1200 AM PEAK HOUR 0700-0800VOLUME 1517 VOLUME 1804PM PEAK HOUR 1600-1700 PM PEAK HOUR 1600-1700VOLUME 1981 VOLUME 1549
TOTAL BI-DIRECTIONAL VOLUME 43524

WILTEC Phone: (626) 564-1944 Fax: (626) 564-0969
24-HOUR ADT COUNT SUMMARY
CLIENT: W-TRANSPROJECT: MENLO PARKLOCATION: EL CAMINO REAL
NORTH OF MIDDLE AVENUEDATE: THURSDAY APRIL 3, 2014
DIRECTION: NB DIRECTION: SBSTART 00-15 15-30 30-45 45-60 HOUR START 00-15 15-30 30-45 45-60 HOUR TIME TOTALS TIME TOTALS00:00 18 27 17 16 78 00:00 12 9 4 7 3201:00 13 12 10 12 47 01:00 16 5 7 17 4502:00 12 7 12 7 38 02:00 10 8 8 14 4003:00 15 12 14 14 55 03:00 8 12 21 32 7304:00 16 23 37 41 117 04:00 52 47 63 115 27705:00 41 46 91 118 296 05:00 97 160 169 245 67106:00 118 170 298 252 838 06:00 240 317 364 436 135707:00 272 300 252 310 1134 07:00 456 480 440 451 182708:00 263 303 284 277 1127 08:00 444 405 367 378 159409:00 310 288 274 326 1198 09:00 366 330 383 324 140310:00 302 317 372 333 1324 10:00 391 381 338 414 152411:00 382 371 339 429 1521 11:00 351 386 378 323 143812:00 403 401 366 409 1579 12:00 447 365 366 372 155013:00 369 446 420 466 1701 13:00 332 365 325 374 139614:00 456 456 420 441 1773 14:00 337 345 392 370 144415:00 482 492 447 497 1918 15:00 357 373 364 374 146816:00 483 502 506 502 1993 16:00 397 378 374 393 154217:00 500 489 453 420 1862 17:00 387 352 345 312 139618:00 384 370 330 276 1360 18:00 265 232 242 220 95919:00 317 291 263 242 1113 19:00 200 180 205 168 75320:00 243 219 174 152 788 20:00 151 117 106 106 48021:00 157 119 98 90 464 21:00 91 95 55 52 29322:00 81 68 77 48 274 22:00 54 45 41 27 16723:00 52 48 30 40 170 23:00 27 18 17 23 85
TOTAL 22768 TOTAL 21814
AM PEAK HOUR 1100-1200 AM PEAK HOUR 0700-0800VOLUME 1521 VOLUME 1827PM PEAK HOUR 1615-1715 PM PEAK HOUR 1200-1300VOLUME 2010 VOLUME 1550
TOTAL BI-DIRECTIONAL VOLUME 44582

WILTEC Phone: (626) 564-1944 Fax: (626) 564-0969
24-HOUR ADT COUNT SUMMARY
CLIENT: W-TRANSPROJECT: MENLO PARKLOCATION: EL CAMINO REAL
NORTH OF SAND HILL ROADDATE: WEDNESDAY APRIL 2, 2014
DIRECTION: NB DIRECTION: SBSTART 00-15 15-30 30-45 45-60 HOUR START 00-15 15-30 30-45 45-60 HOUR TIME TOTALS TIME TOTALS00:00 22 19 14 12 67 00:00 7 11 10 0 2801:00 10 20 8 8 46 01:00 9 4 9 6 2802:00 5 14 18 7 44 02:00 16 11 10 9 4603:00 17 7 12 23 59 03:00 33 41 46 59 17904:00 35 32 45 84 196 04:00 130 99 141 167 53705:00 111 139 163 255 668 05:00 227 224 287 369 110706:00 280 243 278 258 1059 06:00 471 477 478 500 192607:00 315 306 292 292 1205 07:00 545 490 392 419 184608:00 294 294 314 292 1194 08:00 412 342 347 346 144709:00 353 320 357 344 1374 09:00 385 356 370 336 144710:00 386 391 385 405 1567 10:00 419 337 389 394 153911:00 384 404 420 378 1586 11:00 391 405 377 316 148912:00 448 386 434 464 1732 12:00 382 351 345 356 143413:00 484 442 479 424 1829 13:00 371 353 365 407 149614:00 474 443 482 532 1931 14:00 412 379 360 387 153815:00 521 508 573 571 2173 15:00 423 379 359 424 158516:00 561 517 512 482 2072 16:00 389 407 385 401 158217:00 421 413 426 341 1601 17:00 348 296 263 227 113418:00 358 312 308 286 1264 18:00 239 200 203 203 84519:00 283 263 242 199 987 19:00 174 154 141 114 58320:00 199 162 151 121 633 20:00 101 109 83 81 37421:00 118 87 89 77 371 21:00 62 50 43 28 18322:00 49 43 46 31 169 22:00 25 29 20 14 8823:00 34 21 35 17 107 23:00 17 18 11 16 62
TOTAL 23934 TOTAL 22523
AM PEAK HOUR 1045-1145 AM PEAK HOUR 0630-0730VOLUME 1613 VOLUME 2013PM PEAK HOUR 1530-1630 PM PEAK HOUR 1545-1645VOLUME 2222 VOLUME 1605
TOTAL BI-DIRECTIONAL VOLUME 46457

WILTEC Phone: (626) 564-1944 Fax: (626) 564-0969
24-HOUR ADT COUNT SUMMARY
CLIENT: W-TRANSPROJECT: MENLO PARKLOCATION: EL CAMINO REAL
NORTH OF SAND HILL ROADDATE: THURSDAY APRIL 3, 2014
DIRECTION: NB DIRECTION: SBSTART 00-15 15-30 30-45 45-60 HOUR START 00-15 15-30 30-45 45-60 HOUR TIME TOTALS TIME TOTALS00:00 17 16 16 11 60 00:00 9 14 6 12 4101:00 14 14 9 14 51 01:00 4 7 11 9 3102:00 6 13 14 16 49 02:00 11 10 7 17 4503:00 16 17 26 31 90 03:00 23 57 45 60 18504:00 43 46 39 87 215 04:00 98 107 148 182 53505:00 127 131 160 266 684 05:00 239 239 307 350 113506:00 275 282 283 257 1097 06:00 481 504 519 489 199307:00 303 268 293 296 1160 07:00 523 485 438 378 182408:00 283 307 312 290 1192 08:00 416 364 395 338 151309:00 341 287 336 437 1401 09:00 404 366 393 391 155410:00 359 377 394 370 1500 10:00 387 436 357 325 150511:00 424 446 401 403 1674 11:00 322 409 412 366 150912:00 422 396 463 451 1732 12:00 404 355 330 369 145813:00 471 457 486 475 1889 13:00 366 358 397 376 149714:00 465 484 495 511 1955 14:00 412 345 368 369 149415:00 524 556 544 553 2177 15:00 404 383 408 366 156116:00 582 525 531 494 2132 16:00 409 396 377 353 153517:00 450 413 426 337 1626 17:00 352 270 294 232 114818:00 356 345 309 307 1317 18:00 231 213 206 173 82319:00 259 257 248 226 990 19:00 189 156 155 113 61320:00 164 175 143 109 591 20:00 123 96 99 77 39521:00 112 91 76 71 350 21:00 60 60 51 47 21822:00 62 55 48 30 195 22:00 23 31 21 20 9523:00 39 36 30 19 124 23:00 23 23 15 13 74
TOTAL 24251 TOTAL 22781
AM PEAK HOUR 1100-1200 AM PEAK HOUR 0615-0715VOLUME 1674 VOLUME 2035PM PEAK HOUR 1515-1615 PM PEAK HOUR 1530-1630VOLUME 2235 VOLUME 1579
TOTAL BI-DIRECTIONAL VOLUME 47032


El Camino Real Corridor Study –Existing Conditions Report September 2014
El Camino Real Vehicle Classification Data


WILTEC Phone: (626) 564-1944 Fax: (626) 564-0969 E-mail: [email protected]
MID-BLOCK AXLE CLASSIFICATION COUNT SUMMARY
CLIENT: WHITLOCK & WEINBERGER TRANSPORTATION, INC. (W-TRANS) PROJECT: MENLO PARK - EL CAMINO REAL LOCATION: EL CAMINO REAL AND CAMBRIDGE AVENUECITY: MENLO PARKDATE: WEDNESDAY APRIL 2, 2014PERIODS: 11:30 PM -1:30 PM AND 4:00 PM - 6:00 PM
MD COUNT RESULTSPERIOD NORTHBOUND SOUTHBOUND BOTH DIRECTIONS TOTALS
15 MIN COUNTS
AUTOS AND
OTHER
LIGHT DUTY
TRUCKS
HEAVY DUTY
TRUCKS
ALL VEHICLES
TOTAL
AUTOS AND
OTHER
LIGHT DUTY
TRUCKS
HEAVY DUTY
TRUCKS
ALL VEHICLES
TOTAL
AUTOS AND
OTHER
LIGHT DUTY
TRUCKS
HEAVY DUTY
TRUCKS
ALL VEHICLES
TOTAL100-115 344 9 1 354 359 6 1 366 703 15 2 720115-130 340 5 4 349 372 8 0 380 712 13 4 729130-145 359 4 2 365 329 5 2 336 688 9 4 701145-200 333 1 4 338 331 1 0 332 664 2 4 670200-215 313 2 1 316 264 7 2 273 577 9 3 589215-230 309 0 1 310 300 11 3 314 609 11 4 624230-245 300 0 2 302 327 6 0 333 627 6 2 635245-300 310 0 0 310 294 7 0 301 604 7 0 611HOUR TOTALS100-200 1376 19 11 1406 1391 20 3 1414 2767 39 14 2820115-215 1345 12 11 1368 1296 21 4 1321 2641 33 15 2689130-230 1314 7 8 1329 1224 24 7 1255 2538 31 15 2584145-245 1255 3 8 1266 1222 25 5 1252 2477 28 13 2518200-300 1232 2 4 1238 1185 31 5 1221 2417 33 9 2459
PM COUNT RESULTSPERIOD NORTHBOUND SOUTHBOUND BOTH DIRECTIONS TOTALS
15 MIN COUNTS
AUTOS AND
OTHER
LIGHT DUTY
TRUCKS
HEAVY DUTY
TRUCKS
ALL VEHICLES
TOTAL
AUTOS AND
OTHER
LIGHT DUTY
TRUCKS
HEAVY DUTY
TRUCKS
ALL VEHICLES
TOTAL
AUTOS AND
OTHER
LIGHT DUTY
TRUCKS
HEAVY DUTY
TRUCKS
ALL VEHICLES
TOTAL400-415 556 0 1 557 438 4 0 442 994 4 1 999415-430 254 3 0 257 215 1 0 216 469 4 0 473430-445 336 3 0 339 310 1 0 311 646 4 0 650445-500 374 0 0 374 313 1 1 315 687 1 1 689500-515 381 0 0 381 328 3 1 332 709 3 1 713515-530 452 0 0 452 354 0 0 354 806 0 0 806530-545 406 0 0 406 315 1 0 316 721 1 0 722545-600 422 0 0 422 322 1 1 324 744 1 1 746HOUR TOTALS400-500 1520 6 1 1527 1276 7 1 1284 2796 13 2 2811415-515 1345 6 0 1351 1166 6 2 1174 2511 12 2 2525430-530 1543 3 0 1546 1305 5 2 1312 2848 8 2 2858445-545 1613 0 0 1613 1310 5 2 1317 2923 5 2 2930500-600 1661 0 0 1661 1319 5 2 1326 2980 5 2 2987

WILTEC Phone: (626) 564-1944 Fax: (626) 564-0969 E-mail: [email protected]
MID-BLOCK AXLE CLASSIFICATION COUNT SUMMARY
CLIENT: WHITLOCK & WEINBERGER TRANSPORTATION, INC. (W-TRANS) PROJECT: MENLO PARK - EL CAMINO REAL LOCATION: EL CAMINO REAL AND MIDDLE AVENUECITY: MENLO PARKDATE: WEDNESDAY APRIL 2, 2014PERIODS: 11:30 PM -1:30 PM AND 4:00 PM - 6:00 PM
MD COUNT RESULTSPERIOD NORTHBOUND SOUTHBOUND BOTH DIRECTIONS TOTALS
15 MIN COUNTS
AUTOS AND
OTHER
LIGHT DUTY
TRUCKS
HEAVY DUTY
TRUCKS
ALL VEHICLES
TOTAL
AUTOS AND
OTHER
LIGHT DUTY
TRUCKS
HEAVY DUTY
TRUCKS
ALL VEHICLES
TOTAL
AUTOS AND
OTHER
LIGHT DUTY
TRUCKS
HEAVY DUTY
TRUCKS
ALL VEHICLES
TOTAL100-115 355 10 1 366 414 7 3 424 769 17 4 790115-130 363 11 1 375 395 10 0 405 758 21 1 780130-145 382 5 1 388 393 3 3 399 775 8 4 787145-200 306 6 4 316 394 5 0 399 700 11 4 715200-215 304 4 3 311 322 7 2 331 626 11 5 642215-230 392 5 1 398 433 6 2 441 825 11 3 839230-245 406 6 1 413 471 8 1 480 877 14 2 893245-300 340 4 0 344 348 6 1 355 688 10 1 699HOUR TOTALS100-200 1406 32 7 1445 1596 25 6 1627 3002 57 13 3072115-215 1355 26 9 1390 1504 25 5 1534 2859 51 14 2924130-230 1384 20 9 1413 1542 21 7 1570 2926 41 16 2983145-245 1408 21 9 1438 1620 26 5 1651 3028 47 14 3089200-300 1442 19 5 1466 1574 27 6 1607 3016 46 11 3073
PM COUNT RESULTSPERIOD NORTHBOUND SOUTHBOUND BOTH DIRECTIONS TOTALS
15 MIN COUNTS
AUTOS AND
OTHER
LIGHT DUTY
TRUCKS
HEAVY DUTY
TRUCKS
ALL VEHICLES
TOTAL
AUTOS AND
OTHER
LIGHT DUTY
TRUCKS
HEAVY DUTY
TRUCKS
ALL VEHICLES
TOTAL
AUTOS AND
OTHER
LIGHT DUTY
TRUCKS
HEAVY DUTY
TRUCKS
ALL VEHICLES
TOTAL400-415 475 2 1 478 415 5 0 420 890 7 1 898415-430 465 6 0 471 416 3 0 419 881 9 0 890430-445 464 2 1 467 423 2 0 425 887 4 1 892445-500 511 2 0 513 413 3 0 416 924 5 0 929500-515 512 3 0 515 435 2 0 437 947 5 0 952515-530 522 0 0 522 463 1 0 464 985 1 0 986530-545 499 1 0 500 397 2 0 399 896 3 0 899545-600 476 2 1 479 431 0 1 432 907 2 2 911HOUR TOTALS400-500 1915 12 2 1929 1667 13 0 1680 3582 25 2 3609415-515 1952 13 1 1966 1687 10 0 1697 3639 23 1 3663430-530 2009 7 1 2017 1734 8 0 1742 3743 15 1 3759445-545 2044 6 0 2050 1708 8 0 1716 3752 14 0 3766500-600 2009 6 1 2016 1726 5 1 1732 3735 11 2 3748

El Camino Real Corridor Study –Existing Conditions Report September 2014
El Camino Real Travel Time Data


El Cam
ino Re
al ‐ Travel Tim
e Stud
ies
Northbo
und El Cam
ino Re
alN
ode
Leng
thC
ross
Stre
etTr
avel
# of
Avg
Tota
lTr
avel
# of
Avg
Tota
lTr
avel
# of
Avg
Tota
l
#Ti
me
Sto
psS
peed
Del
ayTi
me
Sto
psS
peed
Del
ayTi
me
Sto
psS
peed
Del
ay
10
San
d H
ill A
ve.
212
68C
ambr
idge
Ave
.32
.30.
326
.810
.538
.10.
122
.716
.131
.50.
227
.49.
5
311
90M
iddl
e A
ve.
26.5
0.3
30.6
6.3
58.6
0.4
13.9
37.7
31.5
0.3
25.8
11.3
492
8R
oble
Ave
.19
.60.
132
.23.
942
.10.
315
.026
.373
.71.
88.
657
.7
525
1Li
ve O
ak A
ve.
5.3
0.0
32.6
1.0
5.4
0.0
31.5
1.0
24.3
0.3
7.0
19.7
642
0M
enlo
/Rav
ensw
ood
Ave
.33
.50.
48.
525
.925
.60.
311
.218
.066
.30.
54.
358
.7
742
3S
anta
Cru
z A
ve.
18.1
0.1
15.9
10.6
9.9
0.0
29.3
2.6
22.0
0.2
13.1
14.2
853
3O
ak G
rove
Ave
.16
.30.
122
.47.
012
.70.
028
.63.
614
.20.
025
.74.
7
910
84V
alpa
rais
o A
ve.
58.1
0.8
12.7
39.8
32.6
0.1
22.7
13.6
43.0
0.3
17.2
24.0
1010
25E
ncin
al A
ve.
16.1
0.0
43.3
2.6
52.0
0.6
13.4
35.9
19.5
0.0
35.8
2.0
Tota
l71
2222
5.8
2.0
21.5
107.
527
7.0
1.9
17.5
154.
732
6.0
3.7
14.9
201.
7
Southb
ound
‐ AM
Peak Pe
riod
Nod
eLe
ngth
Cro
ss S
treet
Trav
el#
ofA
vgTo
tal
Trav
el#
ofA
vgTo
tal
Trav
el#
ofA
vgTo
tal
#Ti
me
Sto
psS
peed
Del
ayTi
me
Sto
psS
peed
Del
ayTi
me
Sto
psS
peed
Del
ay
10
Enc
inal
Ave
.
211
73V
alpa
rais
o A
ve.
58.0
0.9
13.8
37.7
46.6
0.8
17.2
26.6
50.0
0.5
16.0
29.8
310
44O
ak G
rove
Ave
.43
.10.
416
.525
.135
.60.
120
.017
.673
.20.
79.
755
.2
451
8S
anta
Cru
z A
ve.
44.0
0.6
8.0
35.0
11.3
0.0
31.4
1.8
39.5
0.5
8.9
30.5
543
5M
enlo
/Rav
ensw
ood
Ave
.31
.30.
49.
523
.68.
40.
035
.40.
516
.30.
218
.28.
3
644
0Li
ve O
ak A
ve.
37.6
0.4
8.0
29.7
9.9
0.0
30.4
1.9
10.7
0.0
28.1
2.8
722
4R
oble
Ave
.5.
10.
029
.71.
17.
30.
121
.13.
34.
80.
031
.60.
5
896
1M
iddl
e A
ve.
25.9
0.1
25.3
9.0
47.6
0.6
13.8
31.0
27.7
0.2
23.7
11.5
911
26C
ambr
idge
Ave
.23
.00.
033
.43.
424
.50.
031
.35.
139
.70.
519
.420
.2
1011
64S
and
Hill
Rd
39.7
0.3
20.0
20.1
35.3
0.5
22.5
15.5
38.0
0.5
20.9
18.5
Tota
l70
8530
7.7
3.1
15.7
184.
922
6.4
2.1
21.3
103.
329
9.8
3.0
16.1
177.
3
Notes:
Statistics a
re averaged based on
a m
inim
um of six travel floatin
g car surveys per time pe
riod and direction of travel.
AM Peak Pe
riod: 7:00‐9:00
a.m
.; Midday Pe
ak Period: 11:30
a.m
. ‐ 1:30 p.m.; PM
Peak Pe
riod: 4:00‐6:00
p.m
.Travel time and de
lay are repo
rted
in se
cond
s; Spe
ed is re
ported
in m
iles p
er hou
r (mph
)Da
ta Collected
: April 2, 201
4
AM Peak Pe
riod
Midday Pe
ak Period
PM Peak Pe
riod
AM Peak Pe
riod
Midday Pe
ak Period
PM Peak Pe
riod


El Camino Real Corridor Study –Existing Conditions Report September 2014
Intersection Turning Volumes


WILTEC Phone: (626) 564-1944 Fax: (626) 564-0969 [email protected]
INTERSECTION CAR/PED/BIKE TRAFFIC COUNT RESULTS SUMMARY
CLIENT: WHITLOCK & WEINBERGER TRANSPORTATION, INC. (W-TRANS) PROJECT: MENLO PARK - EL CAMINO REAL DATE: WEDNESDAY APRIL 2, 2014PERIOD: 7:00 AM TO 9:00 AMINTERSECTION: N/S EL CAMINO REAL
E/W SANDHILL ROAD CITY: MENLO PARK
VEHICLE COUNTS15 MIN COUNTS 1 2 3 4 5 6 7 8 9 10 11 12PERIOD SBRT SBTH SBLT WBRT WBTH WBLT NBRT NBTH NBLT EBRT EBTH EBLT TOTAL700-715 51 135 53 46 0 0 1 65 32 26 0 39 448715-730 70 224 71 68 0 0 4 86 37 53 0 41 654730-745 71 303 99 105 0 0 7 103 44 61 0 54 847745-800 58 280 98 121 0 0 7 140 30 58 0 41 833800-815 74 383 88 107 0 0 3 115 36 46 0 41 893815-830 73 398 98 100 0 0 5 144 34 57 0 39 948830-845 44 417 105 107 0 0 5 127 36 56 0 36 933845-900 42 321 68 125 0 0 9 119 39 76 0 48 847HOUR TOTALS 1 2 3 4 5 6 7 8 9 10 11 12PERIOD SBRT SBTH SBLT WBRT WBTH WBLT NBRT NBTH NBLT EBRT EBTH EBLT TOTAL700-800 250 942 321 340 0 0 19 394 143 198 0 175 2782715-815 273 1190 356 401 0 0 21 444 147 218 0 177 3227730-830 276 1364 383 433 0 0 22 502 144 222 0 175 3521745-845 249 1478 389 435 0 0 20 526 136 217 0 157 3607800-900 233 1519 359 439 0 0 22 505 145 235 0 164 3621
4392111
0 439
233 1519 3590
164145 505 22
SANDHILL ROAD 399 0672
235EL CAMINO REAL
PEDESTRIAN COUNTS BICYCLE COUNTS15 MIN COUNTS NORTH EAST SOUTH WEST TOTAL 15 MIN COUNTS NORTH EAST SOUTH WEST TOTALPERIOD LEG LEG LEG LEG PERIOD LEG LEG LEG LEG700-715 2 0 0 2 4 700-715 4 0 2 1 7715-730 3 0 1 4 8 715-730 7 0 1 3 11730-745 7 0 0 8 15 730-745 10 0 2 5 17745-800 13 1 0 13 27 745-800 12 0 1 9 22800-815 13 0 0 4 17 800-815 8 0 2 13 23815-830 14 0 1 16 31 815-830 18 0 5 14 37830-845 18 0 3 17 38 830-845 13 1 1 16 31845-900 5 1 1 0 7 845-900 14 0 1 1 16HOUR TOTALS NORTH EAST SOUTH WEST TOTAL HOUR TOTALS NORTH EAST SOUTH WEST TOTALPERIOD LEG LEG LEG LEG PERIOD LEG LEG LEG LEG700-800 25 1 1 27 54 700-800 33 0 6 18 57715-815 36 1 1 29 67 715-815 37 0 6 30 73730-830 47 1 1 41 90 730-830 48 0 10 41 99745-845 58 1 4 50 113 745-845 51 1 9 52 113800-900 50 1 5 37 93 800-900 53 1 9 44 107
PEAK HOUR
800-900PEAK HOUR FACTOR
0.95

WILTEC Phone: (626) 564-1944 Fax: (626) 564-0969 [email protected]
INTERSECTION CAR/PED/BIKE TRAFFIC COUNT RESULTS SUMMARY
CLIENT: WHITLOCK & WEINBERGER TRANSPORTATION, INC. (W-TRANS) PROJECT: MENLO PARK- EL CAMINO REAL DATE: WEDNESDAY APRIL 2, 2014PERIOD: 7:00 AM TO 9:00 AMINTERSECTION: N/S EL CAMINO REAL
E/W CAMBRIDGE AVENUE CITY: MENLO PARK
VEHICLE COUNTS15 MIN COUNTS 1 2 3 4 5 6 7 8 9 10 11 12PERIOD SBRT SBTH SBLT WBRT WBTH WBLT NBRT NBTH NBLT EBRT EBTH EBLT TOTAL700-715 1 230 3 0 0 0 0 170 3 5 0 2 414715-730 1 333 2 0 0 0 0 222 11 3 0 3 575730-745 1 422 4 0 0 0 0 245 9 12 0 3 696745-800 1 476 6 0 0 0 1 291 4 20 0 2 801800-815 5 485 3 0 0 0 0 246 9 13 0 4 765815-830 6 510 5 0 0 0 0 276 6 18 0 7 828830-845 7 527 2 0 0 0 0 290 8 11 0 3 848845-900 1 563 4 0 0 0 0 326 9 12 0 6 921HOUR TOTALS 1 2 3 4 5 6 7 8 9 10 11 12PERIOD SBRT SBTH SBLT WBRT WBTH WBLT NBRT NBTH NBLT EBRT EBTH EBLT TOTAL700-800 4 1461 15 0 0 0 1 928 27 40 0 10 2486715-815 8 1716 15 0 0 0 1 1004 33 48 0 12 2837730-830 13 1893 18 0 0 0 1 1058 28 63 0 16 3090745-845 19 1998 16 0 0 0 1 1103 27 62 0 16 3242800-900 19 2085 14 0 0 0 0 1138 32 54 0 20 3362
02118
0 0
19 2085 140
2032 1138 0
CAMBRIDGE AVENUE 74 01170
54EL CAMINO REAL
PEDESTRIAN COUNTS BICYCLE COUNTS15 MIN COUNTS NORTH EAST SOUTH WEST TOTAL 15 MIN COUNTS NORTH EAST SOUTH WEST TOTALPERIOD LEG LEG LEG LEG PERIOD LEG LEG LEG LEG700-715 0 0 0 2 2 700-715 0 0 0 0 0715-730 1 1 0 0 2 715-730 0 0 0 1 1730-745 0 0 0 3 3 730-745 0 0 0 0 0745-800 3 3 0 3 9 745-800 0 0 0 0 0800-815 0 1 0 0 1 800-815 0 0 0 1 1815-830 1 0 0 0 1 815-830 0 0 0 0 0830-845 1 0 0 2 3 830-845 0 0 0 1 1845-900 0 1 0 2 3 845-900 0 0 0 0 0HOUR TOTALS NORTH EAST SOUTH WEST TOTAL HOUR TOTALS NORTH EAST SOUTH WEST TOTALPERIOD LEG LEG LEG LEG PERIOD LEG LEG LEG LEG700-800 4 4 0 8 16 700-800 0 0 0 1 1715-815 4 5 0 6 15 715-815 0 0 0 2 2730-830 4 4 0 6 14 730-830 0 0 0 1 1745-845 5 4 0 5 14 745-845 0 0 0 2 2800-900 2 2 0 4 8 800-900 0 0 0 2 2
PEAK HOUR
800-900PEAK HOUR FACTOR
0.91

WILTEC Phone: (626) 564-1944 Fax: (626) 564-0969 [email protected]
INTERSECTION CAR/PED/BIKE TRAFFIC COUNT RESULTS SUMMARY
CLIENT: WHITLOCK & WEINBERGER TRANSPORTATION, INC. (W-TRANS) PROJECT: MENLO PARK- EL CAMINO REAL DATE: WEDNESDAY APRIL 2, 2014PERIOD: 7:00 AM TO 9:00 AMINTERSECTION: N/S EL CAMINO REAL
E/W MIDDLE AVENUE CITY: MENLO PARK- EL CAMINO REAL
VEHICLE COUNTS15 MIN COUNTS 1 2 3 4 5 6 7 8 9 10 11 12PERIOD SBRT SBTH SBLT WBRT WBTH WBLT NBRT NBTH NBLT EBRT EBTH EBLT TOTAL700-715 13 200 0 0 0 0 0 122 25 30 0 17 407715-730 17 300 0 0 0 0 0 176 34 38 0 17 582730-745 20 369 0 0 0 0 0 217 47 86 0 40 779745-800 25 381 0 0 0 0 0 230 51 83 0 50 820800-815 8 395 0 0 0 0 0 220 40 79 0 45 787815-830 22 423 0 0 0 0 0 207 39 64 0 58 813830-845 17 464 0 0 0 0 0 271 36 74 0 40 902845-900 23 472 0 0 0 0 0 272 49 92 0 57 965HOUR TOTALS 1 2 3 4 5 6 7 8 9 10 11 12PERIOD SBRT SBTH SBLT WBRT WBTH WBLT NBRT NBTH NBLT EBRT EBTH EBLT TOTAL700-800 75 1250 0 0 0 0 0 745 157 237 0 124 2588715-815 70 1445 0 0 0 0 0 843 172 286 0 152 2968730-830 75 1568 0 0 0 0 0 874 177 312 0 193 3199745-845 72 1663 0 0 0 0 0 928 166 300 0 193 3322800-900 70 1754 0 0 0 0 0 970 164 309 0 200 3467
01824
0 0
70 1754 00
200164 970 0
MIDDLE AVENUE 509 01134
309EL CAMINO REAL
PEDESTRIAN COUNTS BICYCLE COUNTS15 MIN COUNTS NORTH EAST SOUTH WEST TOTAL 15 MIN COUNTS NORTH EAST SOUTH WEST TOTALPERIOD LEG LEG LEG LEG PERIOD LEG LEG LEG LEG700-715 0 0 0 1 1 700-715 0 0 0 0 0715-730 0 0 0 2 2 715-730 0 0 0 1 1730-745 1 0 0 5 6 730-745 0 0 0 3 3745-800 1 0 0 3 4 745-800 1 0 0 0 1800-815 1 0 0 0 1 800-815 2 0 0 1 3815-830 0 0 0 1 1 815-830 0 0 0 2 2830-845 0 0 0 5 5 830-845 0 0 0 1 1845-900 2 2 0 2 6 845-900 1 0 0 1 2HOUR TOTALS NORTH EAST SOUTH WEST TOTAL HOUR TOTALS NORTH EAST SOUTH WEST TOTALPERIOD LEG LEG LEG LEG PERIOD LEG LEG LEG LEG700-800 2 0 0 11 13 700-800 1 0 0 4 5715-815 3 0 0 10 13 715-815 3 0 0 5 8730-830 3 0 0 9 12 730-830 3 0 0 6 9745-845 2 0 0 9 11 745-845 3 0 0 4 7800-900 3 2 0 8 13 800-900 3 0 0 5 8
PEAK HOUR
800-900PEAK HOUR FACTOR
0.90

WILTEC Phone: (626) 564-1944 Fax: (626) 564-0969 [email protected]
INTERSECTION CAR/PED/BIKE TRAFFIC COUNT RESULTS SUMMARY
CLIENT: WHITLOCK & WEINBERGER TRANSPORTATION, INC. (W-TRANS) PROJECT: MENLO PARK- EL CAMINO REALDATE: WEDNESDAY APRIL 2, 2014PERIOD: 7:00 AM TO 9:00 AMINTERSECTION: N/S EL CAMINO REAL
E/W ROBLE AVENUE CITY: MENLO PARK
VEHICLE COUNTS15 MIN COUNTS 1 2 3 4 5 6 7 8 9 10 11 12PERIOD SBRT SBTH SBLT WBRT WBTH WBLT NBRT NBTH NBLT EBRT EBTH EBLT TOTAL700-715 4 215 1 0 0 0 2 132 2 8 1 8 373715-730 2 293 7 0 0 0 1 164 6 5 0 1 479730-745 4 352 9 0 0 0 9 235 10 6 0 7 632745-800 10 417 10 0 1 0 3 260 6 9 3 12 731800-815 8 407 7 2 0 0 9 249 7 14 1 15 719815-830 9 431 12 3 0 3 5 272 8 15 2 17 777830-845 2 459 6 1 2 0 3 254 13 10 0 12 762845-900 12 459 10 2 2 1 6 307 13 11 2 16 841HOUR TOTALS 1 2 3 4 5 6 7 8 9 10 11 12PERIOD SBRT SBTH SBLT WBRT WBTH WBLT NBRT NBTH NBLT EBRT EBTH EBLT TOTAL700-800 20 1277 27 0 1 0 15 791 24 28 4 28 2215715-815 24 1469 33 2 1 0 22 908 29 34 4 35 2561730-830 31 1607 38 5 1 3 26 1016 31 44 6 51 2859745-845 29 1714 35 6 3 3 20 1035 34 48 6 56 2989800-900 31 1756 35 8 4 4 23 1082 41 50 5 60 3099
81822
4 16
31 1756 354
6041 1082 23
ROBLE AVENUE 115 51146
50EL CAMINO REAL
PEDESTRIAN COUNTS BICYCLE COUNTS15 MIN COUNTS NORTH EAST SOUTH WEST TOTAL 15 MIN COUNTS NORTH EAST SOUTH WEST TOTALPERIOD LEG LEG LEG LEG PERIOD LEG LEG LEG LEG700-715 0 0 0 0 0 700-715 0 0 0 0 0715-730 0 0 0 0 0 715-730 0 0 0 0 0730-745 0 0 0 0 0 730-745 0 0 0 0 0745-800 0 0 0 0 0 745-800 1 0 0 0 1800-815 0 0 0 0 0 800-815 0 0 0 0 0815-830 0 0 0 0 0 815-830 0 0 0 0 0830-845 0 0 0 0 0 830-845 0 0 1 3 4845-900 0 0 0 0 0 845-900 0 0 2 1 3HOUR TOTALS NORTH EAST SOUTH WEST TOTAL HOUR TOTALS NORTH EAST SOUTH WEST TOTALPERIOD LEG LEG LEG LEG PERIOD LEG LEG LEG LEG700-800 0 0 0 0 0 700-800 1 0 0 0 1715-815 0 0 0 0 0 715-815 1 0 0 0 1730-830 0 0 0 0 0 730-830 1 0 0 0 1745-845 0 0 0 0 0 745-845 1 0 1 3 5800-900 0 0 0 0 0 800-900 0 0 3 4 7
PEAK HOUR
800-900PEAK HOUR FACTOR
0.92

WILTEC Phone: (626) 564-1944 Fax: (626) 564-0969 [email protected]
INTERSECTION CAR/PED/BIKE TRAFFIC COUNT RESULTS SUMMARY
CLIENT: WHITLOCK & WEINBERGER TRANSPORTATION, INC. (W-TRANS) PROJECT: MENLO PARK- EL CAMINO REALDATE: THURSDAY APRIL 3, 2014PERIOD: 7:00 AM TO 9:00 AMINTERSECTION: N/S EL CAMINO REAL
E/W MENLO AVENUE/RAVENSWOOD AVENUE CITY: MENLO PARK
VEHICLE COUNTS15 MIN COUNTS 1 2 3 4 5 6 7 8 9 10 11 12PERIOD SBRT SBTH SBLT WBRT WBTH WBLT NBRT NBTH NBLT EBRT EBTH EBLT TOTAL700-715 2 151 16 9 27 71 37 75 8 4 18 2 420715-730 1 226 23 10 46 105 45 112 12 2 38 3 623730-745 6 278 39 9 45 99 98 173 18 9 56 4 834745-800 2 330 40 21 87 117 81 145 17 11 83 4 938800-815 6 324 43 8 60 108 88 150 16 13 86 4 906815-830 3 313 49 9 49 115 132 173 33 10 93 6 985830-845 1 329 38 8 47 111 84 136 28 12 72 4 870845-900 4 333 40 14 54 118 107 159 29 10 62 7 937HOUR TOTALS 1 2 3 4 5 6 7 8 9 10 11 12PERIOD SBRT SBTH SBLT WBRT WBTH WBLT NBRT NBTH NBLT EBRT EBTH EBLT TOTAL700-800 11 985 118 49 205 392 261 505 55 26 195 13 2815715-815 15 1158 145 48 238 429 312 580 63 35 263 15 3301730-830 17 1245 171 47 241 439 399 641 84 43 318 18 3663745-845 12 1296 170 46 243 451 385 604 94 46 334 18 3699800-900 14 1299 170 39 210 452 411 618 106 45 313 21 3698
461478
243 740
12 1296 170451
1894 604 385
MENLO AVENUE/RAVENSWOOD AVE 398 3341083
46EL CAMINO REAL
PEDESTRIAN COUNTS BICYCLE COUNTS15 MIN COUNTS NORTH EAST SOUTH WEST TOTAL 15 MIN COUNTS NORTH EAST SOUTH WEST TOTALPERIOD LEG LEG LEG LEG PERIOD LEG LEG LEG LEG700-715 1 0 0 0 1 700-715 1 1 0 0 2715-730 4 2 1 7 14 715-730 0 0 1 0 1730-745 3 1 0 6 10 730-745 1 0 5 0 6745-800 3 1 0 4 8 745-800 1 2 4 1 8800-815 0 0 0 3 3 800-815 0 2 4 2 8815-830 2 0 0 6 8 815-830 2 0 0 2 4830-845 0 2 0 1 3 830-845 1 0 3 0 4845-900 0 2 0 4 6 845-900 3 2 1 3 9HOUR TOTALS NORTH EAST SOUTH WEST TOTAL HOUR TOTALS NORTH EAST SOUTH WEST TOTALPERIOD LEG LEG LEG LEG PERIOD LEG LEG LEG LEG700-800 11 4 1 17 33 700-800 3 3 10 1 17715-815 10 4 1 20 35 715-815 2 4 14 3 23730-830 8 2 0 19 29 730-830 4 4 13 5 26745-845 5 3 0 14 22 745-845 4 4 11 5 24800-900 2 4 0 14 20 800-900 6 4 8 7 25
PEAK HOUR
745-845PEAK HOUR FACTOR
0.94

WILTEC Phone: (626) 564-1944 Fax: (626) 564-0969 [email protected]
INTERSECTION CAR/PED/BIKE TRAFFIC COUNT RESULTS SUMMARY
CLIENT: WHITLOCK & WEINBERGER TRANSPORTATION, INC. (W-TRANS)PROJECT: MENLO PARK- EL CAMINO REAL DATE: WEDNESDAY APRIL 2, 2014PERIOD: 7:00 AM TO 9:00 AMINTERSECTION: N/S EL CAMINO REAL
E/W SANTA CRUZ AVENUE CITY: MENLO PARK
VEHICLE COUNTS15 MIN COUNTS 1 2 3 4 5 6 7 8 9 10 11 12PERIOD SBRT SBTH SBLT WBRT WBTH WBLT NBRT NBTH NBLT EBRT EBTH EBLT TOTAL700-715 10 168 0 6 4 3 4 85 0 12 1 14 307715-730 19 255 0 13 5 6 14 118 0 18 6 7 461730-745 26 283 0 2 8 6 6 174 0 12 13 12 542745-800 23 350 0 7 15 13 11 188 0 20 12 24 663800-815 18 361 0 6 16 11 10 145 0 15 13 25 620815-830 15 354 0 8 6 11 13 175 0 16 14 22 634830-845 18 364 0 7 19 25 10 169 0 25 15 19 671845-900 11 354 0 9 18 18 16 192 0 25 25 35 703HOUR TOTALS 1 2 3 4 5 6 7 8 9 10 11 12PERIOD SBRT SBTH SBLT WBRT WBTH WBLT NBRT NBTH NBLT EBRT EBTH EBLT TOTAL700-800 78 1056 0 28 32 28 35 565 0 62 32 57 1973715-815 86 1249 0 28 44 36 41 625 0 65 44 68 2286730-830 82 1348 0 23 45 41 40 682 0 63 52 83 2459745-845 74 1429 0 28 56 60 44 677 0 76 54 90 2588800-900 62 1433 0 30 59 65 49 681 0 81 67 101 2628
301495
59 154
62 1433 065
1010 681 49
SANTA CRUZ AVENUE 249 67730
81EL CAMINO REAL
PEDESTRIAN COUNTS BICYCLE COUNTS15 MIN COUNTS NORTH EAST SOUTH WEST TOTAL 15 MIN COUNTS NORTH EAST SOUTH WEST TOTALPERIOD LEG LEG LEG LEG PERIOD LEG LEG LEG LEG700-715 2 0 0 1 3 700-715 1 0 1 0 2715-730 4 4 11 2 21 715-730 3 0 0 0 3730-745 8 1 7 0 16 730-745 2 0 1 0 3745-800 2 3 8 0 13 745-800 0 0 2 0 2800-815 4 5 9 1 19 800-815 5 1 3 0 9815-830 8 5 14 1 28 815-830 2 1 2 0 5830-845 4 2 16 1 23 830-845 0 0 0 0 0845-900 13 2 11 0 26 845-900 1 0 1 0 2HOUR TOTALS NORTH EAST SOUTH WEST TOTAL HOUR TOTALS NORTH EAST SOUTH WEST TOTALPERIOD LEG LEG LEG LEG PERIOD LEG LEG LEG LEG700-800 16 8 26 3 53 700-800 6 0 4 0 10715-815 18 13 35 3 69 715-815 10 1 6 0 17730-830 22 14 38 2 76 730-830 9 2 8 0 19745-845 18 15 47 3 83 745-845 7 2 7 0 16800-900 29 14 50 3 96 800-900 8 2 6 0 16
PEAK HOUR
800-900PEAK HOUR FACTOR
0.93

WILTEC Phone: (626) 564-1944 Fax: (626) 564-0969 [email protected]
INTERSECTION CAR/PED/BIKE TRAFFIC COUNT RESULTS SUMMARY
CLIENT: WHITLOCK & WEINBERGER TRANSPORTATION, INC. (W-TRANS)PROJECT: MENLO PARK- EL CAMINO REALDATE: WEDNESDAY APRIL 2, 2014PERIOD: 7:00 AM TO 9:00 AMINTERSECTION: N/S EL CAMINO REAL
E/W OAK GROVE AVENUE CITY: MENLO PARK
VEHICLE COUNTS15 MIN COUNTS 1 2 3 4 5 6 7 8 9 10 11 12PERIOD SBRT SBTH SBLT WBRT WBTH WBLT NBRT NBTH NBLT EBRT EBTH EBLT TOTAL700-715 7 164 12 7 20 12 7 85 7 1 25 3 350715-730 16 257 26 8 36 10 6 118 9 12 36 7 541730-745 25 283 19 9 46 17 10 166 19 6 25 13 638745-800 18 362 29 9 57 21 20 175 24 15 29 17 776800-815 22 328 15 19 86 26 19 142 12 8 47 17 741815-830 21 330 25 8 40 22 13 175 26 18 38 8 724830-845 19 322 21 9 -58 25 14 165 17 20 29 13 596845-900 20 339 26 8 53 28 21 194 33 17 32 13 784HOUR TOTALS 1 2 3 4 5 6 7 8 9 10 11 12PERIOD SBRT SBTH SBLT WBRT WBTH WBLT NBRT NBTH NBLT EBRT EBTH EBLT TOTAL700-800 66 1066 86 33 159 60 43 544 59 34 115 40 2305715-815 81 1230 89 45 225 74 55 601 64 41 137 54 2696730-830 86 1303 88 45 229 86 62 658 81 47 139 55 2879745-845 80 1342 90 45 125 94 66 657 79 61 143 55 2837800-900 82 1319 87 44 121 101 67 676 88 63 146 51 2845
451477
229 360
86 1303 8886
5581 658 62
OAK GROVE AVENUE 241 139801
47EL CAMINO REAL
PEDESTRIAN COUNTS BICYCLE COUNTS15 MIN COUNTS NORTH EAST SOUTH WEST TOTAL 15 MIN COUNTS NORTH EAST SOUTH WEST TOTALPERIOD LEG LEG LEG LEG PERIOD LEG LEG LEG LEG700-715 0 0 0 2 2 700-715 1 0 1 0 2715-730 1 2 1 0 4 715-730 1 0 1 0 2730-745 1 0 8 0 9 730-745 5 0 1 0 6745-800 2 0 8 0 10 745-800 8 0 1 0 9800-815 5 1 7 0 13 800-815 3 0 0 0 3815-830 2 2 6 0 10 815-830 1 1 1 1 4830-845 4 5 8 0 17 830-845 0 0 0 0 0845-900 2 2 9 0 13 845-900 0 0 0 0 0HOUR TOTALS NORTH EAST SOUTH WEST TOTAL HOUR TOTALS NORTH EAST SOUTH WEST TOTALPERIOD LEG LEG LEG LEG PERIOD LEG LEG LEG LEG700-800 4 2 17 2 25 700-800 15 0 4 0 19715-815 9 3 24 0 36 715-815 17 0 3 0 20730-830 10 3 29 0 42 730-830 17 1 3 1 22745-845 13 8 29 0 50 745-845 12 1 2 1 16800-900 13 10 30 0 53 800-900 4 1 1 1 7
PEAK HOUR
730-830PEAK HOUR FACTOR
0.93

WILTEC Phone: (626) 564-1944 Fax: (626) 564-0969 [email protected]
INTERSECTION CAR/PED/BIKE TRAFFIC COUNT RESULTS SUMMARY
CLIENT: WHITLOCK & WEINBERGER TRANSPORTATION, INC. (W-TRANS) PROJECT: MENLO PARK- EL CAMINO REALDATE: WEDNESDAY APRIL 2, 2014PERIOD: 7:00 AM TO 9:00 AMINTERSECTION: N/S EL CAMINO REAL
E/W VALPARAISO-GLENWOOD AVENUE CITY: MENLO PARK
VEHICLE COUNTS15 MIN COUNTS 1 2 3 4 5 6 7 8 9 10 11 12PERIOD SBRT SBTH SBLT WBRT WBTH WBLT NBRT NBTH NBLT EBRT EBTH EBLT TOTAL700-715 44 176 4 2 26 8 0 84 16 8 16 19 403715-730 63 251 5 3 37 19 2 112 26 8 29 23 578730-745 108 344 6 1 55 19 4 128 41 0 35 29 770745-800 104 359 21 2 50 12 5 168 17 37 34 54 863800-815 116 332 9 2 51 18 5 172 24 20 45 57 851815-830 111 318 20 1 30 4 7 177 39 18 51 52 828830-845 116 360 14 5 38 13 18 167 30 10 37 56 864845-900 140 327 11 2 41 8 4 153 25 23 42 49 825HOUR TOTALS 1 2 3 4 5 6 7 8 9 10 11 12PERIOD SBRT SBTH SBLT WBRT WBTH WBLT NBRT NBTH NBLT EBRT EBTH EBLT TOTAL700-800 319 1130 36 8 168 58 11 492 100 53 114 125 2614715-815 391 1286 41 8 193 68 16 580 108 65 143 163 3062730-830 439 1353 56 6 186 53 21 645 121 75 165 192 3312745-845 447 1369 64 10 169 47 35 684 110 85 167 219 3406800-900 483 1337 54 10 160 43 34 669 118 71 175 214 3368
101880
169 226
447 1369 6447
219110 684 35
VALPARAISO-GLENWOOD AVENUE 471 167829
85EL CAMINO REAL
PEDESTRIAN COUNTS BICYCLE COUNTS15 MIN COUNTS NORTH EAST SOUTH WEST TOTAL 15 MIN COUNTS NORTH EAST SOUTH WEST TOTALPERIOD LEG LEG LEG LEG PERIOD LEG LEG LEG LEG700-715 0 0 1 0 1 700-715 2 0 1 0 3715-730 0 1 1 0 2 715-730 0 2 0 1 3730-745 0 0 3 0 3 730-745 2 0 2 6 10745-800 1 1 2 2 6 745-800 4 1 1 1 7800-815 0 0 3 0 3 800-815 1 0 3 0 4815-830 0 0 0 0 0 815-830 0 0 4 1 5830-845 0 2 3 0 5 830-845 1 1 2 2 6845-900 0 12 2 1 15 845-900 0 0 4 3 7HOUR TOTALS NORTH EAST SOUTH WEST TOTAL HOUR TOTALS NORTH EAST SOUTH WEST TOTALPERIOD LEG LEG LEG LEG PERIOD LEG LEG LEG LEG700-800 1 2 7 2 12 700-800 8 3 4 8 23715-815 1 2 9 2 14 715-815 7 3 6 8 24730-830 1 1 8 2 12 730-830 7 1 10 8 26745-845 1 3 8 2 14 745-845 6 2 10 4 22800-900 0 14 8 1 23 800-900 2 1 13 6 22
PEAK HOUR
745-845PEAK HOUR FACTOR
0.99
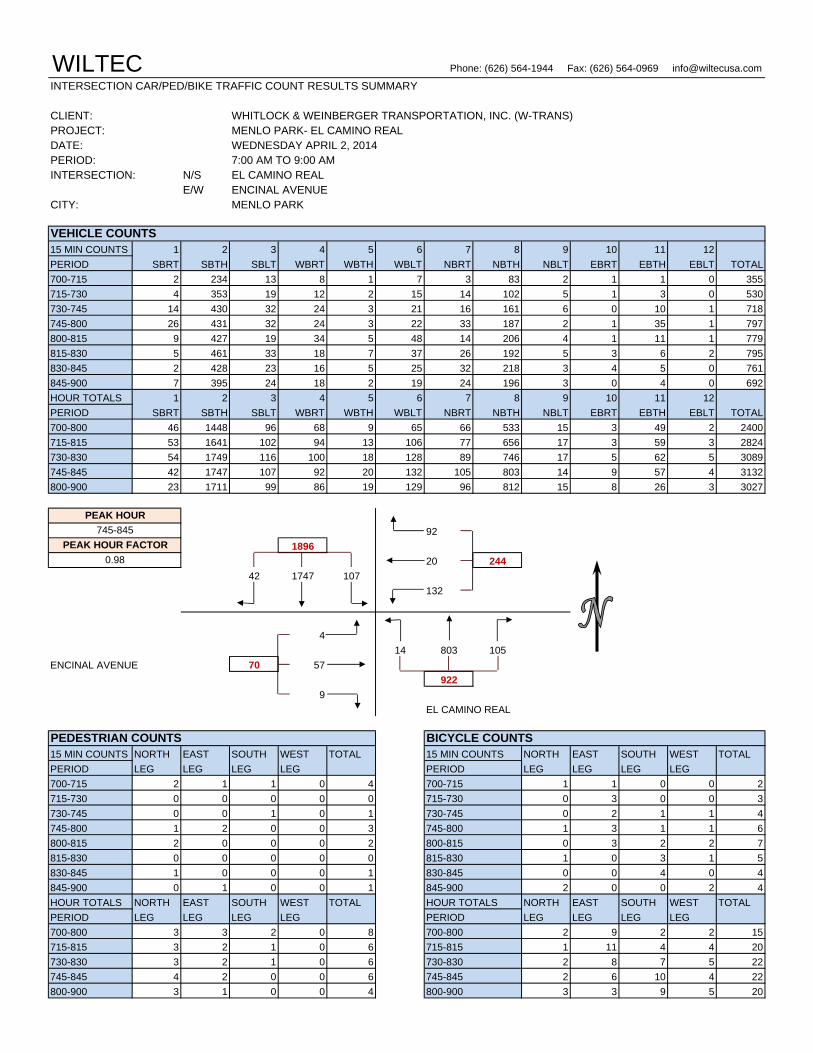
WILTEC Phone: (626) 564-1944 Fax: (626) 564-0969 [email protected]
INTERSECTION CAR/PED/BIKE TRAFFIC COUNT RESULTS SUMMARY
CLIENT: WHITLOCK & WEINBERGER TRANSPORTATION, INC. (W-TRANS) PROJECT: MENLO PARK- EL CAMINO REALDATE: WEDNESDAY APRIL 2, 2014PERIOD: 7:00 AM TO 9:00 AMINTERSECTION: N/S EL CAMINO REAL
E/W ENCINAL AVENUE CITY: MENLO PARK
VEHICLE COUNTS15 MIN COUNTS 1 2 3 4 5 6 7 8 9 10 11 12PERIOD SBRT SBTH SBLT WBRT WBTH WBLT NBRT NBTH NBLT EBRT EBTH EBLT TOTAL700-715 2 234 13 8 1 7 3 83 2 1 1 0 355715-730 4 353 19 12 2 15 14 102 5 1 3 0 530730-745 14 430 32 24 3 21 16 161 6 0 10 1 718745-800 26 431 32 24 3 22 33 187 2 1 35 1 797800-815 9 427 19 34 5 48 14 206 4 1 11 1 779815-830 5 461 33 18 7 37 26 192 5 3 6 2 795830-845 2 428 23 16 5 25 32 218 3 4 5 0 761845-900 7 395 24 18 2 19 24 196 3 0 4 0 692HOUR TOTALS 1 2 3 4 5 6 7 8 9 10 11 12PERIOD SBRT SBTH SBLT WBRT WBTH WBLT NBRT NBTH NBLT EBRT EBTH EBLT TOTAL700-800 46 1448 96 68 9 65 66 533 15 3 49 2 2400715-815 53 1641 102 94 13 106 77 656 17 3 59 3 2824730-830 54 1749 116 100 18 128 89 746 17 5 62 5 3089745-845 42 1747 107 92 20 132 105 803 14 9 57 4 3132800-900 23 1711 99 86 19 129 96 812 15 8 26 3 3027
921896
20 244
42 1747 107132
414 803 105
ENCINAL AVENUE 70 57922
9EL CAMINO REAL
PEDESTRIAN COUNTS BICYCLE COUNTS15 MIN COUNTS NORTH EAST SOUTH WEST TOTAL 15 MIN COUNTS NORTH EAST SOUTH WEST TOTALPERIOD LEG LEG LEG LEG PERIOD LEG LEG LEG LEG700-715 2 1 1 0 4 700-715 1 1 0 0 2715-730 0 0 0 0 0 715-730 0 3 0 0 3730-745 0 0 1 0 1 730-745 0 2 1 1 4745-800 1 2 0 0 3 745-800 1 3 1 1 6800-815 2 0 0 0 2 800-815 0 3 2 2 7815-830 0 0 0 0 0 815-830 1 0 3 1 5830-845 1 0 0 0 1 830-845 0 0 4 0 4845-900 0 1 0 0 1 845-900 2 0 0 2 4HOUR TOTALS NORTH EAST SOUTH WEST TOTAL HOUR TOTALS NORTH EAST SOUTH WEST TOTALPERIOD LEG LEG LEG LEG PERIOD LEG LEG LEG LEG700-800 3 3 2 0 8 700-800 2 9 2 2 15715-815 3 2 1 0 6 715-815 1 11 4 4 20730-830 3 2 1 0 6 730-830 2 8 7 5 22745-845 4 2 0 0 6 745-845 2 6 10 4 22800-900 3 1 0 0 4 800-900 3 3 9 5 20
PEAK HOUR
745-845PEAK HOUR FACTOR
0.98

WILTEC Phone: (626) 564-1944 Fax: (626) 564-0969 [email protected]
INTERSECTION CAR/PED/BIKE TRAFFIC COUNT RESULTS SUMMARY
CLIENT: WHITLOCK & WEINBERGER TRANSPORTATION, INC. (W-TRANS) PROJECT: MENLO PARK - EL CAMINO REAL DATE: WEDNESDAY APRIL 2, 2014PERIOD: 4:00 PM TO 6:00 PMINTERSECTION: N/S EL CAMINO REAL
E/W SANDHILL ROAD CITY: MENLO PARK
VEHICLE COUNTS15 MIN COUNTS 1 2 3 4 5 6 7 8 9 10 11 12PERIOD SBRT SBTH SBLT WBRT WBTH WBLT NBRT NBTH NBLT EBRT EBTH EBLT TOTAL400-415 87 181 70 138 0 0 4 182 34 55 0 141 892415-430 80 159 87 147 0 0 20 249 47 41 0 129 959430-445 92 198 82 174 0 0 27 267 47 50 0 108 1045445-500 87 227 102 164 0 0 31 276 35 37 0 156 1115500-515 110 288 132 164 0 0 37 285 46 80 0 167 1309515-530 89 197 71 184 0 0 25 324 45 47 0 139 1121530-545 85 233 111 193 0 0 43 310 42 49 0 118 1184545-600 89 184 83 173 0 0 37 347 46 59 0 112 1130HOUR TOTALS 1 2 3 4 5 6 7 8 9 10 11 12PERIOD SBRT SBTH SBLT WBRT WBTH WBLT NBRT NBTH NBLT EBRT EBTH EBLT TOTAL400-500 346 765 341 623 0 0 82 974 163 183 0 534 4011415-515 369 872 403 649 0 0 115 1077 175 208 0 560 4428430-530 378 910 387 686 0 0 120 1152 173 214 0 570 4590445-545 371 945 416 705 0 0 136 1195 168 213 0 580 4729500-600 373 902 397 714 0 0 142 1266 179 235 0 536 4744
7141672
0 714
373 902 3970
536179 1266 142
SANDHILL ROAD 771 01587
235EL CAMINO REAL
PEDESTRIAN COUNTS BICYCLE COUNTS15 MIN COUNTS NORTH EAST SOUTH WEST TOTAL 15 MIN COUNTS NORTH EAST SOUTH WEST TOTALPERIOD LEG LEG LEG LEG PERIOD LEG LEG LEG LEG400-415 1 1 1 3 6 400-415 8 1 2 2 13415-430 13 0 3 5 21 415-430 5 0 3 2 10430-445 3 0 1 4 8 430-445 5 3 3 0 11445-500 0 0 0 3 3 445-500 4 1 4 1 10500-515 4 0 1 4 9 500-515 9 0 8 0 17515-530 4 2 1 2 9 515-530 6 1 5 1 13530-545 4 4 0 2 10 530-545 8 0 7 0 15545-600 4 1 7 0 12 545-600 1 1 8 0 10HOUR TOTALS NORTH EAST SOUTH WEST TOTAL HOUR TOTALS NORTH EAST SOUTH WEST TOTALPERIOD LEG LEG LEG LEG PERIOD LEG LEG LEG LEG400-500 17 1 5 15 38 400-500 22 5 12 5 44415-515 20 0 5 16 41 415-515 23 4 18 3 48430-530 11 2 3 13 29 430-530 24 5 20 2 51445-545 12 6 2 11 31 445-545 27 2 24 2 55500-600 16 7 9 8 40 500-600 24 2 28 1 55
PEAK HOUR
500-600PEAK HOUR FACTOR
0.91

WILTEC Phone: (626) 564-1944 Fax: (626) 564-0969 [email protected]
INTERSECTION CAR/PED/BIKE TRAFFIC COUNT RESULTS SUMMARY
CLIENT: WHITLOCK & WEINBERGER TRANSPORTATION, INC. (W-TRANS)PROJECT: MENLO PARK - EL CAMINO REAL DATE: WEDNESDAY APRIL 2, 2014PERIOD: 4:00 PM TO 6:00 PMINTERSECTION: N/S EL CAMINO REAL
E/W CAMBRIDGE AVENUE CITY: MENLO PARK
VEHICLE COUNTS15 MIN COUNTS 1 2 3 4 5 6 7 8 9 10 11 12PERIOD SBRT SBTH SBLT WBRT WBTH WBLT NBRT NBTH NBLT EBRT EBTH EBLT TOTAL400-415 5 385 10 1 0 0 0 449 32 8 0 6 896415-430 7 347 7 1 0 0 0 525 44 11 0 4 946430-445 6 367 3 1 0 3 0 519 65 9 0 6 979445-500 13 458 6 0 0 1 2 555 49 9 0 4 1097500-515 3 399 4 0 0 0 0 549 36 15 0 6 1012515-530 7 388 0 0 1 0 0 588 32 15 0 7 1038530-545 4 368 1 0 0 1 1 560 23 11 0 4 973545-600 0 379 0 0 0 0 0 536 29 8 1 0 953HOUR TOTALS 1 2 3 4 5 6 7 8 9 10 11 12PERIOD SBRT SBTH SBLT WBRT WBTH WBLT NBRT NBTH NBLT EBRT EBTH EBLT TOTAL400-500 31 1557 26 3 0 4 2 2048 190 37 0 20 3918415-515 29 1571 20 2 0 4 2 2148 194 44 0 20 4034430-530 29 1612 13 1 1 4 2 2211 182 48 0 23 4126445-545 27 1613 11 0 1 2 3 2252 140 50 0 21 4120500-600 14 1534 5 0 1 1 1 2233 120 49 1 17 3976
11654
1 6
29 1612 134
23182 2211 2
CAMBRIDGE AVENUE 71 02395
48EL CAMINO REAL
PEDESTRIAN COUNTS BICYCLE COUNTS15 MIN COUNTS NORTH EAST SOUTH WEST TOTAL 15 MIN COUNTS NORTH EAST SOUTH WEST TOTALPERIOD LEG LEG LEG LEG PERIOD LEG LEG LEG LEG400-415 1 2 0 4 7 400-415 0 1 1 0 2415-430 0 0 0 6 6 415-430 0 0 0 0 0430-445 0 0 0 4 4 430-445 0 0 0 1 1445-500 0 0 0 2 2 445-500 0 0 0 4 4500-515 2 3 0 2 7 500-515 0 1 0 0 1515-530 2 2 0 3 7 515-530 0 1 0 1 2530-545 2 0 0 0 2 530-545 0 0 0 0 0545-600 0 1 0 0 1 545-600 0 0 0 0 0HOUR TOTALS NORTH EAST SOUTH WEST TOTAL HOUR TOTALS NORTH EAST SOUTH WEST TOTALPERIOD LEG LEG LEG LEG PERIOD LEG LEG LEG LEG400-500 1 2 0 16 19 400-500 0 1 1 5 7415-515 2 3 0 14 19 415-515 0 1 0 5 6430-530 4 5 0 11 20 430-530 0 2 0 6 8445-545 6 5 0 7 18 445-545 0 2 0 5 7500-600 6 6 0 5 17 500-600 0 2 0 1 3
PEAK HOUR
430-530PEAK HOUR FACTOR
0.94

WILTEC Phone: (626) 564-1944 Fax: (626) 564-0969 [email protected]
INTERSECTION CAR/PED/BIKE TRAFFIC COUNT RESULTS SUMMARY
CLIENT: WHITLOCK & WEINBERGER TRANSPORTATION, INC. (W-TRANS) PROJECT: MENLO PARK- EL CAMINO REAL DATE: WEDNESDAY APRIL 2, 2014PERIOD: 4:00 PM TO 6:00 PMINTERSECTION: N/S EL CAMINO REAL
E/W MIDDLE AVENUE CITY: MENLO PARK
VEHICLE COUNTS15 MIN COUNTS 1 2 3 4 5 6 7 8 9 10 11 12PERIOD SBRT SBTH SBLT WBRT WBTH WBLT NBRT NBTH NBLT EBRT EBTH EBLT TOTAL400-415 30 333 0 0 0 0 0 434 71 56 0 61 985415-430 23 345 0 0 0 0 0 445 71 39 0 41 964430-445 21 361 0 0 0 0 0 431 70 52 0 45 980445-500 13 359 0 0 0 0 0 479 79 51 0 70 1051500-515 18 362 0 0 0 0 0 504 83 63 0 57 1087515-530 29 357 0 0 0 0 0 490 93 32 0 54 1055530-545 25 350 0 0 0 0 0 504 84 49 0 64 1076545-600 30 357 0 0 0 0 0 470 97 49 0 47 1050HOUR TOTALS 1 2 3 4 5 6 7 8 9 10 11 12PERIOD SBRT SBTH SBLT WBRT WBTH WBLT NBRT NBTH NBLT EBRT EBTH EBLT TOTAL400-500 87 1398 0 0 0 0 0 1789 291 198 0 217 3980415-515 75 1427 0 0 0 0 0 1859 303 205 0 213 4082430-530 81 1439 0 0 0 0 0 1904 325 198 0 226 4173445-545 85 1428 0 0 0 0 0 1977 339 195 0 245 4269500-600 102 1426 0 0 0 0 0 1968 357 193 0 222 4268
01513
0 0
85 1428 00
245339 1977 0
MIDDLE AVENUE 440 02316
195EL CAMINO REAL
PEDESTRIAN COUNTS BICYCLE COUNTS15 MIN COUNTS NORTH EAST SOUTH WEST TOTAL 15 MIN COUNTS NORTH EAST SOUTH WEST TOTALPERIOD LEG LEG LEG LEG PERIOD LEG LEG LEG LEG400-415 0 1 0 5 6 400-415 2 0 0 0 2415-430 5 0 0 5 10 415-430 2 1 0 1 4430-445 1 0 0 7 8 430-445 1 0 0 2 3445-500 1 3 0 0 4 445-500 2 0 0 4 6500-515 0 2 0 3 5 500-515 2 1 0 1 4515-530 1 1 0 0 2 515-530 2 0 0 1 3530-545 1 0 0 6 7 530-545 0 0 0 0 0545-600 1 0 0 5 6 545-600 0 0 0 1 1HOUR TOTALS NORTH EAST SOUTH WEST TOTAL HOUR TOTALS NORTH EAST SOUTH WEST TOTALPERIOD LEG LEG LEG LEG PERIOD LEG LEG LEG LEG400-500 7 4 0 17 28 400-500 7 1 0 7 15415-515 7 5 0 15 27 415-515 7 2 0 8 17430-530 3 6 0 10 19 430-530 7 1 0 8 16445-545 3 6 0 9 18 445-545 6 1 0 6 13500-600 3 3 0 14 20 500-600 4 1 0 3 8
PEAK HOUR
445-545PEAK HOUR FACTOR
0.98

WILTEC Phone: (626) 564-1944 Fax: (626) 564-0969 [email protected]
INTERSECTION CAR/PED/BIKE TRAFFIC COUNT RESULTS SUMMARY
CLIENT: WHITLOCK & WEINBERGER TRANSPORTATION, INC. (W-TRANS)PROJECT: MENLO PARK- EL CAMINO REAL DATE: WEDNESDAY APRIL 2, 2014PERIOD: 4:00 PM TO 6:00 PMINTERSECTION: N/S EL CAMINO REAL
E/W ROBLE AVENUE CITY: MENLO PARK
VEHICLE COUNTS15 MIN COUNTS 1 2 3 4 5 6 7 8 9 10 11 12PERIOD SBRT SBTH SBLT WBRT WBTH WBLT NBRT NBTH NBLT EBRT EBTH EBLT TOTAL400-415 11 367 18 11 2 16 8 399 14 2 1 12 861415-430 4 345 12 5 6 7 5 449 19 9 2 12 875430-445 10 320 8 10 6 11 7 509 11 8 0 14 914445-500 7 368 14 14 4 11 9 512 19 7 1 6 972500-515 4 372 20 10 1 9 2 525 27 12 1 9 992515-530 10 361 19 3 2 15 3 484 -78 6 0 21 846530-545 9 390 19 11 3 18 2 423 115 10 1 11 1012545-600 10 389 19 12 3 17 6 448 19 10 0 12 945HOUR TOTALS 1 2 3 4 5 6 7 8 9 10 11 12PERIOD SBRT SBTH SBLT WBRT WBTH WBLT NBRT NBTH NBLT EBRT EBTH EBLT TOTAL400-500 32 1400 52 40 18 45 29 1869 63 26 4 44 3622415-515 25 1405 54 39 17 38 23 1995 76 36 4 41 3753430-530 31 1421 61 37 13 46 21 2030 -21 33 2 50 3724445-545 30 1491 72 38 10 53 16 1944 83 35 3 47 3822500-600 33 1512 77 36 9 59 13 1880 83 38 2 53 3795
381593
10 101
30 1491 7253
4783 1944 16
ROBLE AVENUE 85 32043
35EL CAMINO REAL
PEDESTRIAN COUNTS BICYCLE COUNTS15 MIN COUNTS NORTH EAST SOUTH WEST TOTAL 15 MIN COUNTS NORTH EAST SOUTH WEST TOTALPERIOD LEG LEG LEG LEG PERIOD LEG LEG LEG LEG400-415 0 3 14 6 23 400-415 0 0 1 0 1415-430 0 1 3 5 9 415-430 0 0 4 0 4430-445 0 3 3 1 7 430-445 0 0 3 1 4445-500 0 1 3 1 5 445-500 0 0 1 0 1500-515 0 0 6 2 8 500-515 0 0 1 0 1515-530 0 6 6 7 19 515-530 1 0 4 0 5530-545 0 0 3 2 5 530-545 0 0 2 2 4545-600 0 0 3 1 4 545-600 1 0 0 3 4HOUR TOTALS NORTH EAST SOUTH WEST TOTAL HOUR TOTALS NORTH EAST SOUTH WEST TOTALPERIOD LEG LEG LEG LEG PERIOD LEG LEG LEG LEG400-500 0 8 23 13 44 400-500 0 0 9 1 10415-515 0 5 15 9 29 415-515 0 0 9 1 10430-530 0 10 18 11 39 430-530 1 0 9 1 11445-545 0 7 18 12 37 445-545 1 0 8 2 11500-600 0 6 18 12 36 500-600 2 0 7 5 14
PEAK HOUR
445-545PEAK HOUR FACTOR
0.94

WILTEC Phone: (626) 564-1944 Fax: (626) 564-0969 [email protected]
INTERSECTION CAR/PED/BIKE TRAFFIC COUNT RESULTS SUMMARY
CLIENT: WHITLOCK & WEINBERGER TRANSPORTATION, INC. (W-TRANS)PROJECT: MENLO PARK- EL CAMINO REAL DATE: THURSDAY APRIL 3, 2014PERIOD: 4:00 PM TO 6:00 PMINTERSECTION: N/S EL CAMINO REAL
E/W MENLO AVENUE / RAVENSWOOD AVENUE CITY: MENLO PARK
VEHICLE COUNTS15 MIN COUNTS 1 2 3 4 5 6 7 8 9 10 11 12PERIOD SBRT SBTH SBLT WBRT WBTH WBLT NBRT NBTH NBLT EBRT EBTH EBLT TOTAL400-415 9 251 49 15 55 102 150 301 39 23 72 13 1079415-430 4 272 62 22 49 93 152 329 44 25 59 7 1118430-445 7 258 38 23 76 114 134 322 29 15 64 10 1090445-500 8 246 43 10 56 102 157 301 44 25 88 16 1096500-515 10 256 65 23 66 101 173 385 39 26 78 8 1230515-530 16 291 57 28 48 97 147 317 33 19 73 10 1136530-545 13 282 52 20 80 122 152 322 31 18 67 11 1170545-600 12 275 37 9 60 121 151 322 31 18 67 11 1114HOUR TOTALS 1 2 3 4 5 6 7 8 9 10 11 12PERIOD SBRT SBTH SBLT WBRT WBTH WBLT NBRT NBTH NBLT EBRT EBTH EBLT TOTAL400-500 28 1027 192 70 236 411 593 1253 156 88 283 46 4383415-515 29 1032 208 78 247 410 616 1337 156 91 289 41 4534430-530 41 1051 203 84 246 414 611 1325 145 85 303 44 4552445-545 47 1075 217 81 250 422 629 1325 147 88 306 45 4632500-600 51 1104 211 80 254 441 623 1346 134 81 285 40 4650
801366
254 775
51 1104 211441
40134 1346 623
MENLO AVENUE / RAVENSWOOD AV 406 2852103
81EL CAMINO REAL
PEDESTRIAN COUNTS BICYCLE COUNTS15 MIN COUNTS NORTH EAST SOUTH WEST TOTAL 15 MIN COUNTS NORTH EAST SOUTH WEST TOTALPERIOD LEG LEG LEG LEG PERIOD LEG LEG LEG LEG400-415 2 3 0 9 14 400-415 1 0 1 2 4415-430 7 3 0 2 12 415-430 0 3 0 0 3430-445 1 0 0 2 3 430-445 1 0 1 0 2445-500 2 5 0 6 13 445-500 3 4 0 2 9500-515 5 5 0 3 13 500-515 1 0 1 3 5515-530 0 10 0 2 12 515-530 1 0 3 0 4530-545 1 2 1 4 8 530-545 5 1 1 0 7545-600 0 1 0 4 5 545-600 3 3 2 0 8HOUR TOTALS NORTH EAST SOUTH WEST TOTAL HOUR TOTALS NORTH EAST SOUTH WEST TOTALPERIOD LEG LEG LEG LEG PERIOD LEG LEG LEG LEG400-500 12 11 0 19 42 400-500 5 7 2 4 18415-515 15 13 0 13 41 415-515 5 7 2 5 19430-530 8 20 0 13 41 430-530 6 4 5 5 20445-545 8 22 1 15 46 445-545 10 5 5 5 25500-600 6 18 1 13 38 500-600 10 4 7 3 24
PEAK HOUR
500-600PEAK HOUR FACTOR
0.95

WILTEC Phone: (626) 564-1944 Fax: (626) 564-0969 [email protected]
INTERSECTION CAR/PED/BIKE TRAFFIC COUNT RESULTS SUMMARY
CLIENT: WHITLOCK & WEINBERGER TRANSPORTATION, INC. (W-TRANS)PROJECT: MENLO PARK - EL CAMINO REAL DATE: WEDNESDAY APRIL 2, 2014PERIOD: 4:00 PM TO 6:00 PMINTERSECTION: N/S EL CAMINO REAL
E/W SANTA CRUZ AVENUE CITY: MENLO PARK
VEHICLE COUNTS15 MIN COUNTS 1 2 3 4 5 6 7 8 9 10 11 12PERIOD SBRT SBTH SBLT WBRT WBTH WBLT NBRT NBTH NBLT EBRT EBTH EBLT TOTAL400-415 26 265 0 12 14 14 11 355 0 44 22 28 791415-430 22 252 0 13 13 15 22 324 0 30 9 38 738430-445 31 286 0 13 16 14 27 335 0 43 16 35 816445-500 24 278 0 16 11 16 12 318 0 35 25 47 782500-515 20 269 0 10 13 17 20 339 0 46 21 42 797515-530 26 291 0 13 19 14 18 364 1 26 25 49 846530-545 24 274 0 16 14 13 33 356 0 37 18 46 831545-600 26 299 0 20 26 14 21 372 0 33 21 39 871HOUR TOTALS 1 2 3 4 5 6 7 8 9 10 11 12PERIOD SBRT SBTH SBLT WBRT WBTH WBLT NBRT NBTH NBLT EBRT EBTH EBLT TOTAL400-500 103 1081 0 54 54 59 72 1332 0 152 72 148 3127415-515 97 1085 0 52 53 62 81 1316 0 154 71 162 3133430-530 101 1124 0 52 59 61 77 1356 1 150 87 173 3241445-545 94 1112 0 55 57 60 83 1377 1 144 89 184 3256500-600 96 1133 0 59 72 58 92 1431 1 142 85 176 3345
591229
72 189
96 1133 058
1761 1431 92
SANTA CRUZ AVENUE 403 851524
142EL CAMINO REAL
PEDESTRIAN COUNTS BICYCLE COUNTS15 MIN COUNTS NORTH EAST SOUTH WEST TOTAL 15 MIN COUNTS NORTH EAST SOUTH WEST TOTALPERIOD LEG LEG LEG LEG PERIOD LEG LEG LEG LEG400-415 8 2 25 2 37 400-415 2 0 1 0 3415-430 8 1 21 2 32 415-430 1 1 1 0 3430-445 7 3 16 2 28 430-445 2 0 1 0 3445-500 18 5 17 1 41 445-500 1 0 3 0 4500-515 10 4 16 3 33 500-515 0 0 3 0 3515-530 6 3 26 6 41 515-530 1 0 0 0 1530-545 7 1 21 0 29 530-545 1 0 1 0 2545-600 3 4 24 0 31 545-600 1 0 0 0 1HOUR TOTALS NORTH EAST SOUTH WEST TOTAL HOUR TOTALS NORTH EAST SOUTH WEST TOTALPERIOD LEG LEG LEG LEG PERIOD LEG LEG LEG LEG400-500 41 11 79 7 138 400-500 6 1 6 0 13415-515 43 13 70 8 134 415-515 4 1 8 0 13430-530 41 15 75 12 143 430-530 4 0 7 0 11445-545 41 13 80 10 144 445-545 3 0 7 0 10500-600 26 12 87 9 134 500-600 3 0 4 0 7
PEAK HOUR
500-600PEAK HOUR FACTOR
0.96

WILTEC Phone: (626) 564-1944 Fax: (626) 564-0969 [email protected]
INTERSECTION CAR/PED/BIKE TRAFFIC COUNT RESULTS SUMMARY
CLIENT: WHITLOCK & WEINBERGER TRANSPORTATION, INC. (W-TRANS)PROJECT: MENLO PARK- EL CAMINO REAL DATE: WEDNESDAY APRIL 2, 2014PERIOD: 4:00 PM TO 6:00 PMINTERSECTION: N/S EL CAMINO REAL
E/W OAK GROVE AVENUE CITY: MENLO PARK
VEHICLE COUNTS15 MIN COUNTS 1 2 3 4 5 6 7 8 9 10 11 12PERIOD SBRT SBTH SBLT WBRT WBTH WBLT NBRT NBTH NBLT EBRT EBTH EBLT TOTAL400-415 33 240 23 13 59 19 25 320 37 35 46 25 875415-430 17 248 20 20 51 28 25 306 27 19 32 27 820430-445 27 194 17 19 58 27 32 313 26 21 48 32 814445-500 25 288 19 13 45 29 22 337 22 28 39 25 892500-515 32 249 28 31 54 23 25 344 22 40 60 44 952515-530 21 271 30 23 45 25 23 322 25 29 54 40 908530-545 23 281 28 32 51 26 24 367 16 31 45 32 956545-600 18 304 19 14 45 33 24 377 19 17 52 22 944HOUR TOTALS 1 2 3 4 5 6 7 8 9 10 11 12PERIOD SBRT SBTH SBLT WBRT WBTH WBLT NBRT NBTH NBLT EBRT EBTH EBLT TOTAL400-500 102 970 79 65 213 103 104 1276 112 103 165 109 3401415-515 101 979 84 83 208 107 104 1300 97 108 179 128 3478430-530 105 1002 94 86 202 104 102 1316 95 118 201 141 3566445-545 101 1089 105 99 195 103 94 1370 85 128 198 141 3708500-600 94 1105 105 100 195 107 96 1410 82 117 211 138 3760
1001304
195 402
94 1105 105107
13882 1410 96
OAK GROVE AVENUE 466 2111588
117EL CAMINO REAL
PEDESTRIAN COUNTS BICYCLE COUNTS15 MIN COUNTS NORTH EAST SOUTH WEST TOTAL 15 MIN COUNTS NORTH EAST SOUTH WEST TOTALPERIOD LEG LEG LEG LEG PERIOD LEG LEG LEG LEG400-415 10 7 11 0 28 400-415 0 1 2 0 3415-430 3 4 14 2 23 415-430 0 0 2 0 2430-445 5 4 9 0 18 430-445 0 0 0 0 0445-500 6 3 10 0 19 445-500 1 1 0 0 2500-515 3 5 5 3 16 500-515 1 0 0 0 1515-530 0 0 4 4 8 515-530 0 0 1 1 2530-545 9 1 6 0 16 530-545 0 0 1 0 1545-600 10 4 4 3 21 545-600 0 0 1 0 1HOUR TOTALS NORTH EAST SOUTH WEST TOTAL HOUR TOTALS NORTH EAST SOUTH WEST TOTALPERIOD LEG LEG LEG LEG PERIOD LEG LEG LEG LEG400-500 24 18 44 2 88 400-500 1 2 4 0 7415-515 17 16 38 5 76 415-515 2 1 2 0 5430-530 14 12 28 7 61 430-530 2 1 1 1 5445-545 18 9 25 7 59 445-545 2 1 2 1 6500-600 22 10 19 10 61 500-600 1 0 3 1 5
PEAK HOUR
500-600PEAK HOUR FACTOR
0.98

WILTEC Phone: (626) 564-1944 Fax: (626) 564-0969 [email protected]
INTERSECTION CAR/PED/BIKE TRAFFIC COUNT RESULTS SUMMARY
CLIENT: WHITLOCK & WEINBERGER TRANSPORTATION, INC. (W-TRANS)PROJECT: MENLO PARK- EL CAMINO REALDATE: WEDNESDAY APRIL 2, 2014PERIOD: 4:00 PM TO 6:00 PMINTERSECTION: N/S EL CAMINO REAL
E/W VALPARAISO- GLENWOOD AVENUE CITY: MENLO PARK
VEHICLE COUNTS15 MIN COUNTS 1 2 3 4 5 6 7 8 9 10 11 12PERIOD SBRT SBTH SBLT WBRT WBTH WBLT NBRT NBTH NBLT EBRT EBTH EBLT TOTAL400-415 66 222 9 9 47 12 9 267 36 27 48 71 823415-430 55 220 7 8 31 9 8 361 50 28 32 52 861430-445 72 280 10 5 32 12 5 303 42 53 37 64 915445-500 71 231 11 1 36 18 8 350 46 24 28 93 917500-515 57 202 7 4 44 16 2 343 26 17 44 97 859515-530 63 235 15 6 55 15 6 380 30 29 26 65 925530-545 59 232 6 11 39 9 5 412 44 25 25 64 931545-600 71 249 14 3 44 10 9 332 33 53 47 56 921HOUR TOTALS 1 2 3 4 5 6 7 8 9 10 11 12PERIOD SBRT SBTH SBLT WBRT WBTH WBLT NBRT NBTH NBLT EBRT EBTH EBLT TOTAL400-500 264 953 37 23 146 51 30 1281 174 132 145 280 3516415-515 255 933 35 18 143 55 23 1357 164 122 141 306 3552430-530 263 948 43 16 167 61 21 1376 144 123 135 319 3616445-545 250 900 39 22 174 58 21 1485 146 95 123 319 3632500-600 250 918 42 24 182 50 22 1467 133 124 142 282 3636
241210
182 256
250 918 4250
282133 1467 22
VALPARAISO- GLENWOOD AVENUE 548 1421622
124EL CAMINO REAL
PEDESTRIAN COUNTS BICYCLE COUNTS15 MIN COUNTS NORTH EAST SOUTH WEST TOTAL 15 MIN COUNTS NORTH EAST SOUTH WEST TOTALPERIOD LEG LEG LEG LEG PERIOD LEG LEG LEG LEG400-415 1 3 1 0 5 400-415 0 2 1 1 4415-430 0 1 0 0 1 415-430 2 0 2 0 4430-445 0 0 0 0 0 430-445 2 0 2 1 5445-500 0 1 3 0 4 445-500 1 1 2 0 4500-515 0 1 1 0 2 500-515 1 2 0 1 4515-530 0 0 0 0 0 515-530 1 0 0 0 1530-545 0 1 1 1 3 530-545 1 2 1 0 4545-600 0 3 3 0 6 545-600 1 4 0 2 7HOUR TOTALS NORTH EAST SOUTH WEST TOTAL HOUR TOTALS NORTH EAST SOUTH WEST TOTALPERIOD LEG LEG LEG LEG PERIOD LEG LEG LEG LEG400-500 1 5 4 0 10 400-500 5 3 7 2 17415-515 0 3 4 0 7 415-515 6 3 6 2 17430-530 0 2 4 0 6 430-530 5 3 4 2 14445-545 0 3 5 1 9 445-545 4 5 3 1 13500-600 0 5 5 1 11 500-600 4 8 1 3 16
PEAK HOUR
500-600PEAK HOUR FACTOR
0.98

WILTEC Phone: (626) 564-1944 Fax: (626) 564-0969 [email protected]
INTERSECTION CAR/PED/BIKE TRAFFIC COUNT RESULTS SUMMARY
CLIENT: WHITLOCK & WEINBERGER TRANSPORTATION, INC. (W-TRANS)PROJECT: MENLO PARK- EL CAMINO REALDATE: WEDNESDAY APRIL 2, 2014PERIOD: 4:00 PM TO 6:00 PMINTERSECTION: N/S EL CAMINO REAL
E/W ENCINAL AVENUE CITY: MENLO PARK
VEHICLE COUNTS15 MIN COUNTS 1 2 3 4 5 6 7 8 9 10 11 12PERIOD SBRT SBTH SBLT WBRT WBTH WBLT NBRT NBTH NBLT EBRT EBTH EBLT TOTAL400-415 5 327 17 39 2 31 27 354 7 1 1 3 814415-430 5 347 17 34 1 27 22 332 7 3 3 3 801430-445 3 361 11 37 0 22 25 391 10 2 6 4 872445-500 7 370 15 42 2 28 17 380 5 0 7 4 877500-515 5 337 17 47 2 18 25 420 5 4 5 8 893515-530 6 338 16 47 6 19 18 432 12 1 4 5 904530-545 2 326 15 38 2 26 31 430 12 5 5 5 897545-600 6 374 19 29 2 18 22 394 7 4 3 2 880HOUR TOTALS 1 2 3 4 5 6 7 8 9 10 11 12PERIOD SBRT SBTH SBLT WBRT WBTH WBLT NBRT NBTH NBLT EBRT EBTH EBLT TOTAL400-500 20 1405 60 152 5 108 91 1457 29 6 17 14 3364415-515 20 1415 60 160 5 95 89 1523 27 9 21 19 3443430-530 21 1406 59 173 10 87 85 1623 32 7 22 21 3546445-545 20 1371 63 174 12 91 91 1662 34 10 21 22 3571500-600 19 1375 67 161 12 81 96 1676 36 14 17 20 3574
1611461
12 254
19 1375 6781
2036 1676 96
ENCINAL AVENUE 51 171808
14EL CAMINO REAL
PEDESTRIAN COUNTS BICYCLE COUNTS15 MIN COUNTS NORTH EAST SOUTH WEST TOTAL 15 MIN COUNTS NORTH EAST SOUTH WEST TOTALPERIOD LEG LEG LEG LEG PERIOD LEG LEG LEG LEG400-415 2 0 0 0 2 400-415 0 0 0 0 0415-430 1 0 0 0 1 415-430 0 1 0 1 2430-445 0 0 0 0 0 430-445 0 0 1 0 1445-500 2 0 0 0 2 445-500 0 2 0 0 2500-515 2 0 0 0 2 500-515 0 1 0 0 1515-530 2 0 0 0 2 515-530 0 1 0 0 1530-545 1 1 0 0 2 530-545 0 1 1 0 2545-600 0 0 0 0 0 545-600 0 4 1 0 5HOUR TOTALS NORTH EAST SOUTH WEST TOTAL HOUR TOTALS NORTH EAST SOUTH WEST TOTALPERIOD LEG LEG LEG LEG PERIOD LEG LEG LEG LEG400-500 5 0 0 0 5 400-500 0 3 1 1 5415-515 5 0 0 0 5 415-515 0 4 1 1 6430-530 6 0 0 0 6 430-530 0 4 1 0 5445-545 7 1 0 0 8 445-545 0 5 1 0 6500-600 5 1 0 0 6 500-600 0 7 2 0 9
PEAK HOUR
500-600PEAK HOUR FACTOR
0.99

El Camino Real Corridor Study –Existing Conditions Report September 2014
Intersection Level of Service Calculations


HCM Signalized Intersection Capacity Analysis1: El Camino Real & Sand Hill Rd/Alma St 7/22/2014
Menlo Parl El Camino Real Corridor Study Synchro 8 ReportExisting AM Peak Hour Conditions - No Project W-Trans
Movement EBL EBT EBR WBL WBT WBR NBL NBT NBR SBL SBT SBRLane ConfigurationsVolume (vph) 164 0 235 0 0 439 145 505 22 359 1519 233Ideal Flow (vphpl) 1900 1900 1900 1900 1900 1900 1900 1900 1900 1900 1900 1900Total Lost time (s) 5.0 5.0 4.0 5.0 4.5 4.5 5.0 4.5 5.0Lane Util. Factor 0.97 1.00 1.00 1.00 0.91 1.00 1.00 0.91 1.00Frpb, ped/bikes 1.00 1.00 0.99 1.00 1.00 0.98 1.00 1.00 0.98Flpb, ped/bikes 1.00 1.00 1.00 1.00 1.00 1.00 1.00 1.00 1.00Frt 1.00 0.85 0.85 1.00 1.00 0.85 1.00 1.00 0.85Flt Protected 0.95 1.00 1.00 0.95 1.00 1.00 0.95 1.00 1.00Satd. Flow (prot) 3433 1576 1561 1770 5085 1549 1770 5085 1550Flt Permitted 0.95 1.00 1.00 0.95 1.00 1.00 0.95 1.00 1.00Satd. Flow (perm) 3433 1576 1561 1770 5085 1549 1770 5085 1550Peak-hour factor, PHF 0.95 0.95 0.95 0.95 0.95 0.95 0.95 0.95 0.95 0.95 0.95 0.95Adj. Flow (vph) 173 0 247 0 0 462 153 532 23 378 1599 245RTOR Reduction (vph) 0 0 174 0 0 282 0 0 0 0 0 0Lane Group Flow (vph) 173 0 73 0 0 180 153 532 23 378 1599 245Confl. Peds. (#/hr) 2Confl. Bikes (#/hr) 4 1 8Turn Type Prot pm+ov Perm Prot NA Perm Prot NA pm+ovProtected Phases 7 5 8 5 2 1 6 7Permitted Phases 7 8 2 6Actuated Green, G (s) 11.4 35.4 24.8 24.0 25.5 25.5 39.8 41.3 52.7Effective Green, g (s) 11.4 35.4 24.8 24.0 25.5 25.5 39.8 41.3 52.7Actuated g/C Ratio 0.10 0.29 0.21 0.20 0.21 0.21 0.33 0.34 0.44Clearance Time (s) 5.0 5.0 4.0 5.0 4.5 4.5 5.0 4.5 5.0Vehicle Extension (s) 3.0 3.0 0.2 3.0 3.0 3.0 3.0 3.0 3.0Lane Grp Cap (vph) 326 464 322 354 1080 329 587 1750 680v/s Ratio Prot c0.05 0.03 0.09 0.10 c0.21 c0.31 0.03v/s Ratio Perm 0.01 c0.12 0.01 0.12v/c Ratio 0.53 0.16 0.56 0.43 0.49 0.07 0.64 0.91 0.36Uniform Delay, d1 51.8 31.3 42.7 42.0 41.6 37.8 34.1 37.6 22.4Progression Factor 1.00 1.00 1.00 1.00 1.00 1.00 0.88 0.55 0.70Incremental Delay, d2 1.7 0.2 1.3 0.8 1.6 0.4 2.0 7.6 0.3Delay (s) 53.4 31.4 44.0 42.9 43.2 38.2 32.1 28.4 16.1Level of Service D C D D D D C C BApproach Delay (s) 40.5 44.0 42.9 27.7Approach LOS D D D C
Intersection SummaryHCM 2000 Control Delay 33.9 HCM 2000 Level of Service CHCM 2000 Volume to Capacity ratio 0.74Actuated Cycle Length (s) 120.0 Sum of lost time (s) 18.5Intersection Capacity Utilization 64.5% ICU Level of Service CAnalysis Period (min) 15c Critical Lane Group

HCM Signalized Intersection Capacity Analysis2: El Camino Real & Cambridge Avenue 7/22/2014
Menlo Parl El Camino Real Corridor Study Synchro 8 ReportExisting AM Peak Hour Conditions - No Project W-Trans
Movement EBL EBT EBR WBL WBT WBR NBL NBT NBR SBL SBT SBRLane ConfigurationsVolume (vph) 20 0 54 0 0 0 32 1138 0 14 2085 19Ideal Flow (vphpl) 1900 1900 1900 1900 1900 1900 1900 1900 1900 1900 1900 1900Total Lost time (s) 4.0 4.0 4.0 4.0 4.0 4.0Lane Util. Factor 1.00 1.00 1.00 0.91 1.00 0.91Frpb, ped/bikes 1.00 0.98 1.00 1.00 1.00 1.00Flpb, ped/bikes 1.00 1.00 1.00 1.00 1.00 1.00Frt 1.00 0.85 1.00 1.00 1.00 1.00Flt Protected 0.95 1.00 0.95 1.00 0.95 1.00Satd. Flow (prot) 1765 1558 1770 5085 1770 5077Flt Permitted 0.76 1.00 0.95 1.00 0.95 1.00Satd. Flow (perm) 1407 1558 1770 5085 1770 5077Peak-hour factor, PHF 0.91 0.91 0.91 0.91 0.91 0.91 0.91 0.91 0.91 0.91 0.91 0.91Adj. Flow (vph) 22 0 59 0 0 0 35 1251 0 15 2291 21RTOR Reduction (vph) 0 0 53 0 0 0 0 0 0 0 0 0Lane Group Flow (vph) 0 22 6 0 0 0 35 1251 0 15 2312 0Confl. Peds. (#/hr) 2 2 2 4Confl. Bikes (#/hr) 2 3 6Turn Type Perm NA Perm Prot NA Prot NAProtected Phases 4 8 5 2 1 6Permitted Phases 4 4 8Actuated Green, G (s) 12.6 12.6 4.7 92.8 2.6 90.7Effective Green, g (s) 12.6 12.6 4.7 92.8 2.6 90.7Actuated g/C Ratio 0.10 0.10 0.04 0.77 0.02 0.76Clearance Time (s) 4.0 4.0 4.0 4.0 4.0 4.0Vehicle Extension (s) 3.0 3.0 3.0 3.0 3.0 3.0Lane Grp Cap (vph) 147 163 69 3932 38 3837v/s Ratio Prot c0.02 0.25 0.01 c0.46v/s Ratio Perm c0.02 0.00v/c Ratio 0.15 0.04 0.51 0.32 0.39 0.60Uniform Delay, d1 48.8 48.3 56.5 4.1 57.9 6.6Progression Factor 1.00 1.00 0.97 1.25 1.11 0.20Incremental Delay, d2 0.5 0.1 5.2 0.2 5.4 0.6Delay (s) 49.3 48.4 59.8 5.3 69.4 1.9Level of Service D D E A E AApproach Delay (s) 48.6 0.0 6.8 2.3Approach LOS D A A A
Intersection SummaryHCM 2000 Control Delay 4.9 HCM 2000 Level of Service AHCM 2000 Volume to Capacity ratio 0.54Actuated Cycle Length (s) 120.0 Sum of lost time (s) 12.0Intersection Capacity Utilization 56.5% ICU Level of Service BAnalysis Period (min) 15c Critical Lane Group

HCM Signalized Intersection Capacity Analysis3: El Camino Real & Middle Avenue 7/22/2014
Menlo Parl El Camino Real Corridor Study Synchro 8 ReportExisting AM Peak Hour Conditions - No Project W-Trans
Movement EBL EBR NBL NBT SBT SBRLane ConfigurationsVolume (vph) 200 309 164 970 1754 70Ideal Flow (vphpl) 1900 1900 1900 1900 1900 1900Total Lost time (s) 3.0 3.0 3.0 4.0 4.0Lane Util. Factor 1.00 1.00 1.00 0.91 0.91Frpb, ped/bikes 1.00 1.00 1.00 1.00 1.00Flpb, ped/bikes 1.00 1.00 1.00 1.00 1.00Frt 1.00 0.85 1.00 1.00 0.99Flt Protected 0.95 1.00 0.95 1.00 1.00Satd. Flow (prot) 1770 1583 1770 5085 5046Flt Permitted 0.95 1.00 0.95 1.00 1.00Satd. Flow (perm) 1770 1583 1770 5085 5046Peak-hour factor, PHF 0.90 0.90 0.90 0.90 0.90 0.90Adj. Flow (vph) 222 343 182 1078 1949 78RTOR Reduction (vph) 0 237 0 0 3 0Lane Group Flow (vph) 222 106 182 1078 2024 0Confl. Peds. (#/hr) 3 8Confl. Bikes (#/hr) 8Turn Type Prot Perm Prot NA NAProtected Phases 4 5 2 6Permitted Phases 4Actuated Green, G (s) 20.6 20.6 17.0 92.4 72.4Effective Green, g (s) 20.6 20.6 17.0 92.4 72.4Actuated g/C Ratio 0.17 0.17 0.14 0.77 0.60Clearance Time (s) 3.0 3.0 3.0 4.0 4.0Vehicle Extension (s) 3.0 3.0 3.0 3.0 3.0Lane Grp Cap (vph) 303 271 250 3915 3044v/s Ratio Prot c0.13 c0.10 0.21 c0.40v/s Ratio Perm 0.07v/c Ratio 0.73 0.39 0.73 0.28 0.66Uniform Delay, d1 47.1 44.1 49.3 4.0 15.8Progression Factor 1.00 1.00 1.16 0.62 0.38Incremental Delay, d2 8.8 0.9 9.9 0.2 0.8Delay (s) 55.9 45.1 67.2 2.7 6.8Level of Service E D E A AApproach Delay (s) 49.3 12.0 6.8Approach LOS D B A
Intersection SummaryHCM 2000 Control Delay 14.7 HCM 2000 Level of Service BHCM 2000 Volume to Capacity ratio 0.69Actuated Cycle Length (s) 120.0 Sum of lost time (s) 10.0Intersection Capacity Utilization 65.6% ICU Level of Service CAnalysis Period (min) 15c Critical Lane Group

HCM Signalized Intersection Capacity Analysis4: El Camino Real & Roble Avenue 7/22/2014
Menlo Parl El Camino Real Corridor Study Synchro 8 ReportExisting AM Peak Hour Conditions - No Project W-Trans
Movement EBL EBT EBR WBL WBT WBR NBL NBT NBR SBL SBT SBRLane ConfigurationsVolume (vph) 60 5 50 4 4 8 41 1082 23 35 1756 31Ideal Flow (vphpl) 1900 1900 1900 1900 1900 1900 1900 1900 1900 1900 1900 1900Total Lost time (s) 4.0 4.0 4.0 4.0 4.5 4.0 4.5Lane Util. Factor 1.00 1.00 1.00 1.00 0.91 1.00 0.95Frpb, ped/bikes 1.00 1.00 0.98 1.00 1.00 1.00 1.00Flpb, ped/bikes 1.00 1.00 1.00 1.00 1.00 1.00 1.00Frt 0.94 1.00 0.85 1.00 1.00 1.00 1.00Flt Protected 0.97 0.98 1.00 0.95 1.00 0.95 1.00Satd. Flow (prot) 1708 1817 1545 1770 5067 1770 3530Flt Permitted 0.83 0.91 1.00 0.95 1.00 0.95 1.00Satd. Flow (perm) 1458 1702 1545 1770 5067 1770 3530Peak-hour factor, PHF 0.92 0.92 0.92 0.92 0.92 0.92 0.92 0.92 0.92 0.92 0.92 0.92Adj. Flow (vph) 65 5 54 4 4 9 45 1176 25 38 1909 34RTOR Reduction (vph) 0 28 0 0 0 8 0 1 0 0 1 0Lane Group Flow (vph) 0 96 0 0 8 1 45 1200 0 38 1942 0Confl. Bikes (#/hr) 6 6Turn Type Perm NA Perm NA Perm Prot NA Prot NAProtected Phases 4 8 5 2 1 6Permitted Phases 4 8 8Actuated Green, G (s) 13.2 13.2 13.2 7.8 88.7 5.6 86.5Effective Green, g (s) 13.2 13.2 13.2 7.8 88.7 5.6 86.5Actuated g/C Ratio 0.11 0.11 0.11 0.06 0.74 0.05 0.72Clearance Time (s) 4.0 4.0 4.0 4.0 4.5 4.0 4.5Vehicle Extension (s) 3.0 3.0 3.0 3.0 3.0 3.0 3.0Lane Grp Cap (vph) 160 187 169 115 3745 82 2544v/s Ratio Prot c0.03 0.24 0.02 c0.55v/s Ratio Perm c0.07 0.00 0.00v/c Ratio 0.60 0.04 0.01 0.39 0.32 0.46 0.76Uniform Delay, d1 50.9 47.8 47.6 53.8 5.3 55.7 10.4Progression Factor 1.00 1.00 1.00 0.81 1.58 0.99 0.46Incremental Delay, d2 5.9 0.1 0.0 2.1 0.2 2.5 1.4Delay (s) 56.7 47.8 47.6 45.8 8.7 57.5 6.2Level of Service E D D D A E AApproach Delay (s) 56.7 47.7 10.0 7.1Approach LOS E D A A
Intersection SummaryHCM 2000 Control Delay 10.2 HCM 2000 Level of Service BHCM 2000 Volume to Capacity ratio 0.71Actuated Cycle Length (s) 120.0 Sum of lost time (s) 12.5Intersection Capacity Utilization 69.9% ICU Level of Service CAnalysis Period (min) 15c Critical Lane Group

HCM Signalized Intersection Capacity Analysis5: El Camino Real & Menlo Avenue/Ravenswood Avenue 7/22/2014
Menlo Parl El Camino Real Corridor Study Synchro 8 ReportExisting AM Peak Hour Conditions - No Project W-Trans
Movement EBL EBT EBR WBL WBT WBR NBL NBT NBR SBL SBT SBRLane ConfigurationsVolume (vph) 18 334 46 451 243 46 94 604 385 170 1296 12Ideal Flow (vphpl) 1900 1900 1900 1900 1900 1900 1900 1900 1900 1900 1900 1900Lane Width 12 12 12 12 12 12 8 12 12 12 12 12Total Lost time (s) 4.0 4.0 4.0 4.0 4.5 5.0 5.0 4.5 5.0 5.0Lane Util. Factor 0.95 0.97 1.00 1.00 1.00 0.95 1.00 1.00 0.95 1.00Frpb, ped/bikes 1.00 1.00 1.00 0.97 1.00 1.00 0.98 1.00 1.00 0.93Flpb, ped/bikes 1.00 1.00 1.00 1.00 1.00 1.00 1.00 1.00 1.00 1.00Frt 0.98 1.00 1.00 0.85 1.00 1.00 0.85 1.00 1.00 0.85Flt Protected 1.00 0.95 1.00 1.00 0.95 1.00 1.00 0.95 1.00 1.00Satd. Flow (prot) 3455 3433 1863 1541 1534 3539 1554 1770 3539 1475Flt Permitted 1.00 0.95 1.00 1.00 0.95 1.00 1.00 0.95 1.00 1.00Satd. Flow (perm) 3455 3433 1863 1541 1534 3539 1554 1770 3539 1475Peak-hour factor, PHF 0.94 0.94 0.94 0.94 0.94 0.94 0.94 0.94 0.94 0.94 0.94 0.94Adj. Flow (vph) 19 355 49 480 259 49 100 643 410 181 1379 13RTOR Reduction (vph) 0 9 0 0 0 39 0 0 255 0 0 8Lane Group Flow (vph) 0 414 0 480 259 10 100 643 155 181 1379 5Confl. Peds. (#/hr) 5 3 14Confl. Bikes (#/hr) 15 8 5 6Turn Type Split NA Split NA Perm Prot NA Perm Prot NA PermProtected Phases 4 4 8 8 5 2 1 6Permitted Phases 8 2 6Actuated Green, G (s) 16.0 24.3 24.3 24.3 11.5 45.3 45.3 16.9 50.7 50.7Effective Green, g (s) 16.0 24.3 24.3 24.3 11.5 45.3 45.3 16.9 50.7 50.7Actuated g/C Ratio 0.13 0.20 0.20 0.20 0.10 0.38 0.38 0.14 0.42 0.42Clearance Time (s) 4.0 4.0 4.0 4.0 4.5 5.0 5.0 4.5 5.0 5.0Vehicle Extension (s) 3.0 3.0 3.0 3.0 3.0 3.0 3.0 3.0 3.0 3.0Lane Grp Cap (vph) 460 695 377 312 147 1335 586 249 1495 623v/s Ratio Prot c0.12 c0.14 0.14 0.07 0.18 c0.10 c0.39v/s Ratio Perm 0.01 0.10 0.00v/c Ratio 0.90 0.69 0.69 0.03 0.68 0.48 0.26 0.73 0.92 0.01Uniform Delay, d1 51.2 44.4 44.3 38.4 52.5 28.4 25.8 49.3 32.8 20.1Progression Factor 1.00 1.00 1.00 1.00 1.28 0.78 2.71 1.51 0.19 1.00Incremental Delay, d2 20.5 3.0 5.1 0.0 11.8 1.2 1.1 4.9 5.8 0.0Delay (s) 71.7 47.3 49.5 38.4 78.9 23.4 71.2 79.4 11.9 20.1Level of Service E D D D E C E E B CApproach Delay (s) 71.7 47.5 45.2 19.7Approach LOS E D D B
Intersection SummaryHCM 2000 Control Delay 38.3 HCM 2000 Level of Service DHCM 2000 Volume to Capacity ratio 0.86Actuated Cycle Length (s) 120.0 Sum of lost time (s) 17.5Intersection Capacity Utilization 81.6% ICU Level of Service DAnalysis Period (min) 15c Critical Lane Group

HCM Signalized Intersection Capacity Analysis6: El Camino Real & Santa Cruz Ave 7/22/2014
Menlo Parl El Camino Real Corridor Study Synchro 8 ReportExisting AM Peak Hour Conditions - No Project W-Trans
Movement EBL EBT EBR WBL WBT WBR NBL NBT NBR SBL SBT SBRLane ConfigurationsVolume (vph) 101 67 81 65 59 30 0 681 49 0 1433 62Ideal Flow (vphpl) 1900 1900 1900 1900 1900 1900 1900 1900 1900 1900 1900 1900Total Lost time (s) 4.0 4.0 4.0 4.0 4.0 4.5 4.5 4.5 4.5Lane Util. Factor 1.00 1.00 1.00 1.00 1.00 0.95 1.00 0.95 1.00Frpb, ped/bikes 1.00 1.00 0.92 1.00 0.97 1.00 0.94 1.00 0.97Flpb, ped/bikes 1.00 1.00 1.00 1.00 1.00 1.00 1.00 1.00 1.00Frt 1.00 1.00 0.85 1.00 0.95 1.00 0.85 1.00 0.85Flt Protected 0.95 1.00 1.00 0.95 1.00 1.00 1.00 1.00 1.00Satd. Flow (prot) 1770 1863 1455 1770 1716 3539 1485 3539 1537Flt Permitted 0.95 1.00 1.00 0.95 1.00 1.00 1.00 1.00 1.00Satd. Flow (perm) 1770 1863 1455 1770 1716 3539 1485 3539 1537Peak-hour factor, PHF 0.93 0.93 0.93 0.93 0.93 0.93 0.93 0.93 0.93 0.93 0.93 0.93Adj. Flow (vph) 109 72 87 70 63 32 0 732 53 0 1541 67RTOR Reduction (vph) 0 0 71 0 15 0 0 0 28 0 0 24Lane Group Flow (vph) 109 72 16 70 80 0 0 732 25 0 1541 43Confl. Peds. (#/hr) 50 58 14 3Confl. Bikes (#/hr) 9 11 4 1Turn Type Split NA Perm Split NA NA Perm NA PermProtected Phases 4 4 8 8 2 6Permitted Phases 4 2 6Actuated Green, G (s) 21.7 21.7 21.7 30.0 30.0 55.8 55.8 55.8 55.8Effective Green, g (s) 21.7 21.7 21.7 30.0 30.0 55.8 55.8 55.8 55.8Actuated g/C Ratio 0.18 0.18 0.18 0.25 0.25 0.46 0.46 0.46 0.46Clearance Time (s) 4.0 4.0 4.0 4.0 4.0 4.5 4.5 4.5 4.5Vehicle Extension (s) 3.0 3.0 3.0 3.0 3.0 3.0 3.0 3.0 3.0Lane Grp Cap (vph) 320 336 263 442 429 1645 690 1645 714v/s Ratio Prot c0.06 0.04 0.04 c0.05 0.21 c0.44v/s Ratio Perm 0.01 0.02 0.03v/c Ratio 0.34 0.21 0.06 0.16 0.19 0.44 0.04 0.94 0.06Uniform Delay, d1 42.9 41.9 40.7 35.1 35.4 21.7 17.5 30.4 17.7Progression Factor 1.00 1.00 1.00 1.00 1.00 0.56 0.81 0.46 0.72Incremental Delay, d2 0.6 0.3 0.1 0.2 0.2 0.8 0.1 9.0 0.1Delay (s) 43.5 42.2 40.8 35.3 35.6 12.9 14.2 23.0 12.8Level of Service D D D D D B B C BApproach Delay (s) 42.3 35.5 13.0 22.6Approach LOS D D B C
Intersection SummaryHCM 2000 Control Delay 22.5 HCM 2000 Level of Service CHCM 2000 Volume to Capacity ratio 0.61Actuated Cycle Length (s) 120.0 Sum of lost time (s) 12.5Intersection Capacity Utilization 75.6% ICU Level of Service DAnalysis Period (min) 15c Critical Lane Group

HCM Signalized Intersection Capacity Analysis7: El Camino Real & Oak Grove Ave 7/22/2014
Menlo Parl El Camino Real Corridor Study Synchro 8 ReportExisting AM Peak Hour Conditions - No Project W-Trans
Movement EBL EBT EBR WBL WBT WBR NBL NBT NBR SBL SBT SBRLane ConfigurationsVolume (vph) 55 139 47 86 229 45 81 658 62 88 1303 86Ideal Flow (vphpl) 1900 1900 1900 1900 1900 1900 1900 1900 1900 1900 1900 1900Total Lost time (s) 3.0 3.5 3.5 3.0 3.5 3.5 3.5 4.5 4.5 3.5 4.5 4.5Lane Util. Factor 1.00 1.00 1.00 1.00 1.00 1.00 1.00 0.95 1.00 1.00 0.95 1.00Frpb, ped/bikes 1.00 1.00 0.94 1.00 1.00 0.96 1.00 1.00 0.97 1.00 1.00 0.98Flpb, ped/bikes 1.00 1.00 1.00 1.00 1.00 1.00 1.00 1.00 1.00 1.00 1.00 1.00Frt 1.00 1.00 0.85 1.00 1.00 0.85 1.00 1.00 0.85 1.00 1.00 0.85Flt Protected 0.95 1.00 1.00 0.95 1.00 1.00 0.95 1.00 1.00 0.95 1.00 1.00Satd. Flow (prot) 1770 1863 1492 1770 1863 1522 1770 3539 1532 1770 3539 1546Flt Permitted 0.95 1.00 1.00 0.95 1.00 1.00 0.95 1.00 1.00 0.95 1.00 1.00Satd. Flow (perm) 1770 1863 1492 1770 1863 1522 1770 3539 1532 1770 3539 1546Peak-hour factor, PHF 0.93 0.93 0.93 0.93 0.93 0.93 0.93 0.93 0.93 0.93 0.93 0.93Adj. Flow (vph) 59 149 51 92 246 48 87 708 67 95 1401 92RTOR Reduction (vph) 0 0 42 0 0 38 0 0 30 0 0 29Lane Group Flow (vph) 59 149 9 92 246 10 87 708 37 95 1401 63Confl. Peds. (#/hr) 29 10 3Confl. Bikes (#/hr) 9 13 5 5Turn Type Prot NA Perm Prot NA Perm Prot NA Perm Prot NA PermProtected Phases 7 4 3 8 5 2 1 6Permitted Phases 4 8 2 6Actuated Green, G (s) 7.0 21.4 21.4 9.4 23.8 23.8 9.6 63.7 63.7 11.0 65.1 65.1Effective Green, g (s) 7.0 21.4 21.4 9.4 23.8 23.8 9.6 63.7 63.7 11.0 65.1 65.1Actuated g/C Ratio 0.06 0.18 0.18 0.08 0.20 0.20 0.08 0.53 0.53 0.09 0.54 0.54Clearance Time (s) 3.0 3.5 3.5 3.0 3.5 3.5 3.5 4.5 4.5 3.5 4.5 4.5Vehicle Extension (s) 3.0 3.0 3.0 3.0 3.0 3.0 3.0 3.0 3.0 3.0 3.0 3.0Lane Grp Cap (vph) 103 332 266 138 369 301 141 1878 813 162 1919 838v/s Ratio Prot 0.03 0.08 c0.05 c0.13 0.05 0.20 c0.05 c0.40v/s Ratio Perm 0.01 0.01 0.02 0.04v/c Ratio 0.57 0.45 0.03 0.67 0.67 0.03 0.62 0.38 0.05 0.59 0.73 0.07Uniform Delay, d1 55.0 44.0 40.8 53.8 44.4 38.8 53.4 16.5 13.5 52.3 20.8 13.1Progression Factor 1.00 1.00 1.00 1.00 1.00 1.00 1.22 0.46 0.16 1.57 0.32 0.02Incremental Delay, d2 7.5 1.0 0.1 11.5 4.5 0.0 7.3 0.5 0.1 2.8 1.3 0.1Delay (s) 62.5 45.0 40.8 65.3 48.9 38.8 72.6 8.1 2.2 85.0 8.0 0.3Level of Service E D D E D D E A A F A AApproach Delay (s) 48.2 51.6 14.1 12.2Approach LOS D D B B
Intersection SummaryHCM 2000 Control Delay 20.7 HCM 2000 Level of Service CHCM 2000 Volume to Capacity ratio 0.71Actuated Cycle Length (s) 120.0 Sum of lost time (s) 14.5Intersection Capacity Utilization 76.8% ICU Level of Service DAnalysis Period (min) 15c Critical Lane Group

HCM Signalized Intersection Capacity Analysis8: El Camino Real & Valparaiso Ave/Glenwood Ave 7/22/2014
Menlo Parl El Camino Real Corridor Study Synchro 8 ReportExisting AM Peak Hour Conditions - No Project W-Trans
Movement EBL EBT EBR WBL WBT WBR NBL NBT NBR SBL SBT SBRLane ConfigurationsVolume (vph) 219 167 85 47 169 10 110 684 35 64 1369 447Ideal Flow (vphpl) 1900 1900 1900 1900 1900 1900 1900 1900 1900 1900 1900 1900Total Lost time (s) 3.5 3.5 3.5 3.5 3.5 4.0 4.5 4.5 4.0 4.5 4.5Lane Util. Factor 0.95 0.95 1.00 1.00 1.00 1.00 0.95 1.00 1.00 0.95 1.00Frpb, ped/bikes 1.00 1.00 0.98 1.00 1.00 1.00 1.00 0.97 1.00 1.00 0.96Flpb, ped/bikes 1.00 1.00 1.00 1.00 1.00 1.00 1.00 1.00 1.00 1.00 1.00Frt 1.00 1.00 0.85 1.00 0.99 1.00 1.00 0.85 1.00 1.00 0.85Flt Protected 0.95 0.99 1.00 0.95 1.00 0.95 1.00 1.00 0.95 1.00 1.00Satd. Flow (prot) 1681 1756 1550 1770 1845 1770 3539 1529 1770 3539 1525Flt Permitted 0.95 0.99 1.00 0.95 1.00 0.95 1.00 1.00 0.95 1.00 1.00Satd. Flow (perm) 1681 1756 1550 1770 1845 1770 3539 1529 1770 3539 1525Peak-hour factor, PHF 0.99 0.99 0.99 0.99 0.99 0.99 0.99 0.99 0.99 0.99 0.99 0.99Adj. Flow (vph) 221 169 86 47 171 10 111 691 35 65 1383 452RTOR Reduction (vph) 0 0 71 0 2 0 0 0 18 0 0 173Lane Group Flow (vph) 190 200 15 47 179 0 111 691 17 65 1383 279Confl. Peds. (#/hr) 8 1 3 2Confl. Bikes (#/hr) 7 4 12Turn Type Split NA Perm Split NA Prot NA Perm Prot NA PermProtected Phases 4 4 8 8 5 2 1 6Permitted Phases 4 2 6Actuated Green, G (s) 20.4 20.4 20.4 18.6 18.6 16.3 57.2 57.2 8.3 49.2 49.2Effective Green, g (s) 20.4 20.4 20.4 18.6 18.6 16.3 57.2 57.2 8.3 49.2 49.2Actuated g/C Ratio 0.17 0.17 0.17 0.16 0.16 0.14 0.48 0.48 0.07 0.41 0.41Clearance Time (s) 3.5 3.5 3.5 3.5 3.5 4.0 4.5 4.5 4.0 4.5 4.5Vehicle Extension (s) 3.0 3.0 3.0 3.0 3.0 3.0 3.0 3.0 3.0 3.0 3.0Lane Grp Cap (vph) 285 298 263 274 285 240 1686 728 122 1450 625v/s Ratio Prot 0.11 c0.11 0.03 c0.10 c0.06 0.20 0.04 c0.39v/s Ratio Perm 0.01 0.01 0.18v/c Ratio 0.67 0.67 0.06 0.17 0.63 0.46 0.41 0.02 0.53 0.95 0.45Uniform Delay, d1 46.6 46.7 41.7 44.0 47.5 47.8 20.4 16.6 54.0 34.3 25.6Progression Factor 1.00 1.00 1.00 1.00 1.00 0.64 1.51 1.00 1.26 0.85 0.57Incremental Delay, d2 5.8 5.8 0.1 0.3 4.3 1.3 0.7 0.1 3.9 13.8 2.1Delay (s) 52.4 52.5 41.8 44.3 51.8 31.9 31.6 16.7 72.2 42.8 16.7Level of Service D D D D D C C B E D BApproach Delay (s) 50.5 50.2 31.0 37.6Approach LOS D D C D
Intersection SummaryHCM 2000 Control Delay 38.6 HCM 2000 Level of Service DHCM 2000 Volume to Capacity ratio 0.76Actuated Cycle Length (s) 120.0 Sum of lost time (s) 15.5Intersection Capacity Utilization 81.8% ICU Level of Service DAnalysis Period (min) 15c Critical Lane Group

HCM Signalized Intersection Capacity Analysis9: El Camino Real & Encinal Ave 7/22/2014
Menlo Parl El Camino Real Corridor Study Synchro 8 ReportExisting AM Peak Hour Conditions - No Project W-Trans
Movement EBL EBT EBR WBL WBT WBR NBL NBT NBR SBL SBT SBRLane ConfigurationsVolume (vph) 4 57 9 132 20 92 14 803 105 107 1747 42Ideal Flow (vphpl) 1900 1900 1900 1900 1900 1900 1900 1900 1900 1900 1900 1900Total Lost time (s) 3.0 3.0 3.0 3.0 3.0 4.0 4.0 3.0 4.0Lane Util. Factor 1.00 1.00 1.00 1.00 1.00 0.95 1.00 1.00 0.91Frpb, ped/bikes 1.00 0.98 1.00 0.98 1.00 1.00 0.97 1.00 1.00Flpb, ped/bikes 1.00 1.00 1.00 1.00 1.00 1.00 1.00 1.00 1.00Frt 1.00 0.85 1.00 0.85 1.00 1.00 0.85 1.00 1.00Flt Protected 1.00 1.00 0.96 1.00 0.95 1.00 1.00 0.95 1.00Satd. Flow (prot) 1856 1556 1785 1549 1770 3539 1534 1770 5064Flt Permitted 0.99 1.00 0.69 1.00 0.95 1.00 1.00 0.95 1.00Satd. Flow (perm) 1836 1556 1285 1549 1770 3539 1534 1770 5064Peak-hour factor, PHF 0.98 0.98 0.98 0.98 0.98 0.98 0.98 0.98 0.98 0.98 0.98 0.98Adj. Flow (vph) 4 58 9 135 20 94 14 819 107 109 1783 43RTOR Reduction (vph) 0 0 7 0 0 78 0 0 35 0 1 0Lane Group Flow (vph) 0 62 2 0 155 16 14 819 72 109 1825 0Confl. Peds. (#/hr) 4 4 2Confl. Bikes (#/hr) 4 4 7 11Turn Type Perm NA Perm Perm NA Perm Prot NA Perm Prot NAProtected Phases 4 8 5 2 1 6Permitted Phases 4 4 8 8 2Actuated Green, G (s) 20.1 20.1 20.1 20.1 3.0 77.2 77.2 12.7 86.9Effective Green, g (s) 20.1 20.1 20.1 20.1 3.0 77.2 77.2 12.7 86.9Actuated g/C Ratio 0.17 0.17 0.17 0.17 0.02 0.64 0.64 0.11 0.72Clearance Time (s) 3.0 3.0 3.0 3.0 3.0 4.0 4.0 3.0 4.0Vehicle Extension (s) 3.0 3.0 3.0 3.0 3.0 3.0 3.0 3.0 3.0Lane Grp Cap (vph) 307 260 215 259 44 2276 986 187 3667v/s Ratio Prot 0.01 0.23 c0.06 c0.36v/s Ratio Perm 0.03 0.00 c0.12 0.01 0.05v/c Ratio 0.20 0.01 0.72 0.06 0.32 0.36 0.07 0.58 0.50Uniform Delay, d1 43.0 41.6 47.3 42.0 57.5 9.9 8.0 51.1 7.1Progression Factor 1.00 1.00 1.00 1.00 0.97 0.76 0.86 1.00 1.00Incremental Delay, d2 0.3 0.0 11.3 0.1 3.9 0.4 0.1 4.6 0.5Delay (s) 43.4 41.6 58.6 42.1 59.5 8.0 7.1 55.7 7.6Level of Service D D E D E A A E AApproach Delay (s) 43.1 52.4 8.6 10.3Approach LOS D D A B
Intersection SummaryHCM 2000 Control Delay 13.8 HCM 2000 Level of Service BHCM 2000 Volume to Capacity ratio 0.56Actuated Cycle Length (s) 120.0 Sum of lost time (s) 10.0Intersection Capacity Utilization 64.4% ICU Level of Service CAnalysis Period (min) 15c Critical Lane Group

HCM Signalized Intersection Capacity Analysis1: El Camino Real & Sand Hill Rd/Alma St 7/22/2014
Menlo Parl El Camino Real Corridor Study Synchro 8 ReportExisting PM Peak Hour Conditions - No Project W-Trans
Movement EBL EBT EBR WBL WBT WBR NBL NBT NBR SBL SBT SBRLane ConfigurationsVolume (vph) 536 0 235 0 0 714 179 1266 142 397 902 373Ideal Flow (vphpl) 1900 1900 1900 1900 1900 1900 1900 1900 1900 1900 1900 1900Total Lost time (s) 5.0 5.0 5.0 5.0 4.5 4.5 5.0 4.5 5.0Lane Util. Factor 0.97 1.00 1.00 1.00 0.91 1.00 1.00 0.91 1.00Frpb, ped/bikes 1.00 0.99 1.00 1.00 1.00 1.00 1.00 1.00 0.97Flpb, ped/bikes 1.00 1.00 1.00 1.00 1.00 1.00 1.00 1.00 1.00Frt 1.00 0.85 0.85 1.00 1.00 0.85 1.00 1.00 0.85Flt Protected 0.95 1.00 1.00 0.95 1.00 1.00 0.95 1.00 1.00Satd. Flow (prot) 3433 1566 1583 1770 5085 1583 1770 5085 1539Flt Permitted 0.95 1.00 1.00 0.95 1.00 1.00 0.95 1.00 1.00Satd. Flow (perm) 3433 1566 1583 1770 5085 1583 1770 5085 1539Peak-hour factor, PHF 0.91 0.91 0.91 0.91 0.91 0.91 0.91 0.91 0.91 0.91 0.91 0.91Adj. Flow (vph) 589 0 258 0 0 785 197 1391 156 436 991 410RTOR Reduction (vph) 0 0 186 0 0 5 0 0 0 0 0 0Lane Group Flow (vph) 589 0 72 0 0 780 197 1391 156 436 991 410Confl. Peds. (#/hr) 9 8Turn Type Prot pm+ov custom Prot NA Perm Prot NA pm+ovProtected Phases 7 5 10 5 2 1 6 7Permitted Phases 7 1 7 10 2 6Actuated Green, G (s) 18.0 35.2 85.0 17.2 31.5 31.5 31.6 45.9 63.9Effective Green, g (s) 18.0 35.2 81.0 17.2 31.5 31.5 31.6 45.9 63.9Actuated g/C Ratio 0.14 0.28 0.64 0.14 0.25 0.25 0.25 0.36 0.51Clearance Time (s) 5.0 5.0 5.0 4.5 4.5 5.0 4.5 5.0Vehicle Extension (s) 3.0 3.0 3.0 3.0 3.0 3.0 3.0 3.0Lane Grp Cap (vph) 490 437 1017 241 1271 395 443 1852 780v/s Ratio Prot c0.17 0.02 0.11 c0.27 c0.25 0.19 0.08v/s Ratio Perm 0.02 c0.49 0.10 0.19v/c Ratio 1.20 0.16 0.77 0.82 1.09 0.39 0.98 0.54 0.53Uniform Delay, d1 54.0 34.3 15.9 52.9 47.2 39.3 47.0 31.6 20.9Progression Factor 1.00 1.00 1.00 1.00 1.00 1.00 1.08 0.44 0.82Incremental Delay, d2 109.1 0.2 3.5 18.9 55.1 2.9 36.0 1.0 0.6Delay (s) 163.1 34.5 19.4 71.8 102.4 42.3 86.9 15.0 17.6Level of Service F C B E F D F B BApproach Delay (s) 123.9 19.4 93.6 32.6Approach LOS F B F C
Intersection SummaryHCM 2000 Control Delay 65.8 HCM 2000 Level of Service EHCM 2000 Volume to Capacity ratio 1.02Actuated Cycle Length (s) 126.0 Sum of lost time (s) 18.5Intersection Capacity Utilization 95.2% ICU Level of Service FAnalysis Period (min) 15c Critical Lane Group

HCM Signalized Intersection Capacity Analysis2: El Camino Real & Cambridge Avenue 7/22/2014
Menlo Parl El Camino Real Corridor Study Synchro 8 ReportExisting PM Peak Hour Conditions - No Project W-Trans
Movement EBL EBT EBR WBL WBT WBR NBL NBT NBR SBL SBT SBRLane ConfigurationsVolume (vph) 23 0 48 4 1 1 182 2211 2 13 1612 29Ideal Flow (vphpl) 1900 1900 1900 1900 1900 1900 1900 1900 1900 1900 1900 1900Total Lost time (s) 4.0 4.0 4.0 4.0 4.0 4.0 4.0Lane Util. Factor 1.00 1.00 1.00 1.00 0.91 1.00 0.91Frpb, ped/bikes 1.00 1.00 1.00 1.00 1.00 1.00 1.00Flpb, ped/bikes 1.00 1.00 1.00 1.00 1.00 1.00 1.00Frt 1.00 0.85 0.98 1.00 1.00 1.00 1.00Flt Protected 0.95 1.00 0.97 0.95 1.00 0.95 1.00Satd. Flow (prot) 1761 1583 1755 1770 5085 1770 5066Flt Permitted 0.75 1.00 0.88 0.95 1.00 0.95 1.00Satd. Flow (perm) 1397 1583 1604 1770 5085 1770 5066Peak-hour factor, PHF 0.94 0.94 0.94 0.94 0.94 0.94 0.94 0.94 0.94 0.94 0.94 0.94Adj. Flow (vph) 24 0 51 4 1 1 194 2352 2 14 1715 31RTOR Reduction (vph) 0 0 46 0 1 0 0 0 0 0 1 0Lane Group Flow (vph) 0 24 5 0 5 0 194 2354 0 14 1745 0Confl. Peds. (#/hr) 4 4 5 11Turn Type Perm NA Perm Perm NA Prot NA Prot NAProtected Phases 4 8 5 2 1 6Permitted Phases 4 4 8Actuated Green, G (s) 12.6 12.6 12.6 19.0 99.0 2.4 82.4Effective Green, g (s) 12.6 12.6 12.6 19.0 99.0 2.4 82.4Actuated g/C Ratio 0.10 0.10 0.10 0.15 0.79 0.02 0.65Clearance Time (s) 4.0 4.0 4.0 4.0 4.0 4.0 4.0Vehicle Extension (s) 3.0 3.0 3.0 3.0 3.0 3.0 3.0Lane Grp Cap (vph) 139 158 160 266 3995 33 3313v/s Ratio Prot c0.11 c0.46 0.01 0.34v/s Ratio Perm c0.02 0.00 0.00v/c Ratio 0.17 0.03 0.03 0.73 0.59 0.42 0.53Uniform Delay, d1 51.9 51.2 51.2 51.0 5.4 61.1 11.5Progression Factor 1.00 1.00 1.00 1.04 1.30 0.76 0.89Incremental Delay, d2 0.6 0.1 0.1 0.9 0.1 7.5 0.5Delay (s) 52.5 51.3 51.3 54.2 7.1 53.9 10.8Level of Service D D D D A D BApproach Delay (s) 51.7 51.3 10.6 11.1Approach LOS D D B B
Intersection SummaryHCM 2000 Control Delay 11.6 HCM 2000 Level of Service BHCM 2000 Volume to Capacity ratio 0.58Actuated Cycle Length (s) 126.0 Sum of lost time (s) 12.0Intersection Capacity Utilization 65.3% ICU Level of Service CAnalysis Period (min) 15c Critical Lane Group

HCM Signalized Intersection Capacity Analysis3: El Camino Real & Middle Avenue 7/22/2014
Menlo Parl El Camino Real Corridor Study Synchro 8 ReportExisting PM Peak Hour Conditions - No Project W-Trans
Movement EBL EBR NBL NBT SBT SBRLane ConfigurationsVolume (vph) 245 195 339 1977 1428 85Ideal Flow (vphpl) 1900 1900 1900 1900 1900 1900Total Lost time (s) 3.0 3.0 3.0 4.0 4.0Lane Util. Factor 1.00 1.00 1.00 0.91 0.91Frpb, ped/bikes 1.00 1.00 1.00 1.00 1.00Flpb, ped/bikes 1.00 1.00 1.00 1.00 1.00Frt 1.00 0.85 1.00 1.00 0.99Flt Protected 0.95 1.00 0.95 1.00 1.00Satd. Flow (prot) 1770 1583 1770 5085 5028Flt Permitted 0.95 1.00 0.95 1.00 1.00Satd. Flow (perm) 1770 1583 1770 5085 5028Peak-hour factor, PHF 0.98 0.98 0.98 0.98 0.98 0.98Adj. Flow (vph) 250 199 346 2017 1457 87RTOR Reduction (vph) 0 121 0 0 4 0Lane Group Flow (vph) 250 78 346 2017 1540 0Confl. Peds. (#/hr) 3 9Turn Type Prot Perm Prot NA NAProtected Phases 4 5 2 6Permitted Phases 4Actuated Green, G (s) 22.7 22.7 29.5 96.3 63.8Effective Green, g (s) 22.7 22.7 29.5 96.3 63.8Actuated g/C Ratio 0.18 0.18 0.23 0.76 0.51Clearance Time (s) 3.0 3.0 3.0 4.0 4.0Vehicle Extension (s) 3.0 3.0 3.0 3.0 3.0Lane Grp Cap (vph) 318 285 414 3886 2545v/s Ratio Prot c0.14 c0.20 0.40 c0.31v/s Ratio Perm 0.05v/c Ratio 0.79 0.27 0.84 0.52 0.60Uniform Delay, d1 49.3 44.5 45.9 5.8 22.1Progression Factor 1.00 1.00 1.46 0.42 0.31Incremental Delay, d2 12.1 0.5 11.8 0.4 1.0Delay (s) 61.4 45.1 78.9 2.9 7.7Level of Service E D E A AApproach Delay (s) 54.1 14.0 7.7Approach LOS D B A
Intersection SummaryHCM 2000 Control Delay 15.9 HCM 2000 Level of Service BHCM 2000 Volume to Capacity ratio 0.70Actuated Cycle Length (s) 126.0 Sum of lost time (s) 10.0Intersection Capacity Utilization 71.9% ICU Level of Service CAnalysis Period (min) 15c Critical Lane Group

HCM Signalized Intersection Capacity Analysis4: El Camino Real & Roble Avenue 7/22/2014
Menlo Parl El Camino Real Corridor Study Synchro 8 ReportExisting PM Peak Hour Conditions - No Project W-Trans
Movement EBL EBT EBR WBL WBT WBR NBL NBT NBR SBL SBT SBRLane ConfigurationsVolume (vph) 47 3 35 53 10 38 83 1944 16 72 1491 30Ideal Flow (vphpl) 1900 1900 1900 1900 1900 1900 1900 1900 1900 1900 1900 1900Total Lost time (s) 4.0 4.0 4.0 4.0 4.5 4.0 4.5Lane Util. Factor 1.00 1.00 1.00 1.00 0.91 1.00 0.91Frpb, ped/bikes 0.99 1.00 1.00 1.00 1.00 1.00 1.00Flpb, ped/bikes 1.00 0.99 1.00 1.00 1.00 1.00 1.00Frt 0.94 1.00 0.85 1.00 1.00 1.00 1.00Flt Protected 0.97 0.96 1.00 0.95 1.00 0.95 1.00Satd. Flow (prot) 1689 1762 1583 1770 5077 1770 5064Flt Permitted 0.81 0.73 1.00 0.95 1.00 0.95 1.00Satd. Flow (perm) 1412 1345 1583 1770 5077 1770 5064Peak-hour factor, PHF 0.94 0.94 0.94 0.94 0.94 0.94 0.94 0.94 0.94 0.94 0.94 0.94Adj. Flow (vph) 50 3 37 56 11 40 88 2068 17 77 1586 32RTOR Reduction (vph) 0 22 0 0 0 33 0 0 0 0 1 0Lane Group Flow (vph) 0 68 0 0 67 7 88 2085 0 77 1617 0Confl. Peds. (#/hr) 18 18 7 12Turn Type Perm NA Perm NA Perm Prot NA Prot NAProtected Phases 4 8 5 2 1 6Permitted Phases 4 8 8Actuated Green, G (s) 21.8 21.8 21.8 10.5 82.6 9.1 81.2Effective Green, g (s) 21.8 21.8 21.8 10.5 82.6 9.1 81.2Actuated g/C Ratio 0.17 0.17 0.17 0.08 0.66 0.07 0.64Clearance Time (s) 4.0 4.0 4.0 4.0 4.5 4.0 4.5Vehicle Extension (s) 3.0 3.0 3.0 3.0 3.0 3.0 3.0Lane Grp Cap (vph) 244 232 273 147 3328 127 3263v/s Ratio Prot c0.05 c0.41 0.04 0.32v/s Ratio Perm 0.05 c0.05 0.00v/c Ratio 0.28 0.29 0.03 0.60 0.63 0.61 0.50Uniform Delay, d1 45.3 45.4 43.3 55.7 12.7 56.7 11.7Progression Factor 1.00 1.00 1.00 1.01 0.77 1.00 0.70Incremental Delay, d2 0.6 0.7 0.0 5.6 0.8 5.7 0.4Delay (s) 45.9 46.0 43.3 61.8 10.5 62.6 8.6Level of Service D D D E B E AApproach Delay (s) 45.9 45.0 12.6 11.0Approach LOS D D B B
Intersection SummaryHCM 2000 Control Delay 13.5 HCM 2000 Level of Service BHCM 2000 Volume to Capacity ratio 0.57Actuated Cycle Length (s) 126.0 Sum of lost time (s) 12.5Intersection Capacity Utilization 79.7% ICU Level of Service DAnalysis Period (min) 15c Critical Lane Group

HCM Signalized Intersection Capacity Analysis5: El Camino Real & Menlo Avenue/Ravenswood Avenue 7/22/2014
Menlo Parl El Camino Real Corridor Study Synchro 8 ReportExisting PM Peak Hour Conditions - No Project W-Trans
Movement EBL EBT EBR WBL WBT WBR NBL NBT NBR SBL SBT SBRLane ConfigurationsVolume (vph) 40 285 81 441 254 80 134 1346 623 211 1104 51Ideal Flow (vphpl) 1900 1900 1900 1900 1900 1900 1900 1900 1900 1900 1900 1900Lane Width 12 12 12 12 12 12 8 12 12 12 12 12Total Lost time (s) 4.0 4.0 4.0 4.0 4.5 5.0 5.0 4.5 5.0 5.0Lane Util. Factor 0.95 0.97 1.00 1.00 1.00 0.95 1.00 1.00 0.95 1.00Frpb, ped/bikes 1.00 1.00 1.00 0.98 1.00 1.00 0.95 1.00 1.00 0.94Flpb, ped/bikes 1.00 1.00 1.00 1.00 1.00 1.00 1.00 1.00 1.00 1.00Frt 0.97 1.00 1.00 0.85 1.00 1.00 0.85 1.00 1.00 0.85Flt Protected 1.00 0.95 1.00 1.00 0.95 1.00 1.00 0.95 1.00 1.00Satd. Flow (prot) 3417 3433 1863 1553 1534 3539 1505 1770 3539 1485Flt Permitted 1.00 0.95 1.00 1.00 0.95 1.00 1.00 0.95 1.00 1.00Satd. Flow (perm) 3417 3433 1863 1553 1534 3539 1505 1770 3539 1485Peak-hour factor, PHF 0.95 0.95 0.95 0.95 0.95 0.95 0.95 0.95 0.95 0.95 0.95 0.95Adj. Flow (vph) 42 300 85 464 267 84 141 1417 656 222 1162 54RTOR Reduction (vph) 0 17 0 0 0 67 0 0 258 0 0 31Lane Group Flow (vph) 0 410 0 464 267 17 141 1417 398 222 1162 23Confl. Peds. (#/hr) 6 18 13Confl. Bikes (#/hr) 29Turn Type Split NA Split NA Perm Prot NA Perm Prot NA PermProtected Phases 4 4 8 8 5 2 1 6Permitted Phases 8 2 6Actuated Green, G (s) 16.0 25.0 25.0 25.0 14.9 48.5 48.5 19.0 52.6 52.6Effective Green, g (s) 16.0 25.0 25.0 25.0 14.9 48.5 48.5 19.0 52.6 52.6Actuated g/C Ratio 0.13 0.20 0.20 0.20 0.12 0.38 0.38 0.15 0.42 0.42Clearance Time (s) 4.0 4.0 4.0 4.0 4.5 5.0 5.0 4.5 5.0 5.0Vehicle Extension (s) 3.0 3.0 3.0 3.0 3.0 3.0 3.0 3.0 3.0 3.0Lane Grp Cap (vph) 433 681 369 308 181 1362 579 266 1477 619v/s Ratio Prot c0.12 0.14 c0.14 0.09 c0.40 c0.13 c0.33v/s Ratio Perm 0.01 0.26 0.02v/c Ratio 0.95 0.68 0.72 0.05 0.78 1.04 0.69 0.83 0.79 0.04Uniform Delay, d1 54.6 46.8 47.3 40.9 54.0 38.8 32.4 52.0 31.8 21.7Progression Factor 1.00 1.00 1.00 1.00 1.19 1.01 1.15 1.40 0.53 1.18Incremental Delay, d2 29.6 2.8 6.9 0.1 15.7 33.3 5.3 15.8 3.3 0.1Delay (s) 84.2 49.6 54.1 41.0 79.8 72.5 42.6 88.6 20.3 25.8Level of Service F D D D E E D F C CApproach Delay (s) 84.2 50.2 64.1 31.0Approach LOS F D E C
Intersection SummaryHCM 2000 Control Delay 53.8 HCM 2000 Level of Service DHCM 2000 Volume to Capacity ratio 0.91Actuated Cycle Length (s) 126.0 Sum of lost time (s) 17.5Intersection Capacity Utilization 90.6% ICU Level of Service EAnalysis Period (min) 15c Critical Lane Group

HCM Signalized Intersection Capacity Analysis6: El Camino Real & Santa Cruz Ave 7/22/2014
Menlo Parl El Camino Real Corridor Study Synchro 8 ReportExisting PM Peak Hour Conditions - No Project W-Trans
Movement EBL EBT EBR WBL WBT WBR NBL NBT NBR SBL SBT SBRLane ConfigurationsVolume (vph) 176 85 142 58 72 59 0 1431 92 0 1133 96Ideal Flow (vphpl) 1900 1900 1900 1900 1900 1900 1900 1900 1900 1900 1900 1900Total Lost time (s) 4.0 4.0 4.0 4.0 4.0 4.5 4.5 4.5 4.5Lane Util. Factor 1.00 1.00 1.00 1.00 1.00 0.95 1.00 0.95 1.00Frpb, ped/bikes 1.00 1.00 0.88 1.00 0.98 1.00 0.94 1.00 0.95Flpb, ped/bikes 1.00 1.00 1.00 1.00 1.00 1.00 1.00 1.00 1.00Frt 1.00 1.00 0.85 1.00 0.93 1.00 0.85 1.00 0.85Flt Protected 0.95 1.00 1.00 0.95 1.00 1.00 1.00 1.00 1.00Satd. Flow (prot) 1770 1863 1394 1770 1703 3539 1496 3539 1510Flt Permitted 0.95 1.00 1.00 0.95 1.00 1.00 1.00 1.00 1.00Satd. Flow (perm) 1770 1863 1394 1770 1703 3539 1496 3539 1510Peak-hour factor, PHF 0.96 0.96 0.96 0.96 0.96 0.96 0.96 0.96 0.96 0.96 0.96 0.96Adj. Flow (vph) 183 89 148 60 75 61 0 1491 96 0 1180 100RTOR Reduction (vph) 0 0 113 0 24 0 0 0 36 0 0 23Lane Group Flow (vph) 183 89 35 60 112 0 0 1491 60 0 1180 77Confl. Peds. (#/hr) 87 26 12 9Turn Type Split NA Perm Split NA NA Perm NA PermProtected Phases 4 4 8 8 2 6Permitted Phases 4 2 6Actuated Green, G (s) 30.0 30.0 30.0 25.5 25.5 58.0 58.0 58.0 58.0Effective Green, g (s) 30.0 30.0 30.0 25.5 25.5 58.0 58.0 58.0 58.0Actuated g/C Ratio 0.24 0.24 0.24 0.20 0.20 0.46 0.46 0.46 0.46Clearance Time (s) 4.0 4.0 4.0 4.0 4.0 4.5 4.5 4.5 4.5Vehicle Extension (s) 3.0 3.0 3.0 3.0 3.0 3.0 3.0 3.0 3.0Lane Grp Cap (vph) 421 443 331 358 344 1629 688 1629 695v/s Ratio Prot c0.10 0.05 0.03 c0.07 c0.42 0.33v/s Ratio Perm 0.03 0.04 0.05v/c Ratio 0.43 0.20 0.11 0.17 0.33 0.92 0.09 0.72 0.11Uniform Delay, d1 40.8 38.4 37.5 41.5 42.9 31.7 19.1 27.5 19.3Progression Factor 1.00 1.00 1.00 1.00 1.00 0.33 0.00 0.49 0.43Incremental Delay, d2 0.7 0.2 0.1 0.2 0.6 3.2 0.1 2.4 0.3Delay (s) 41.5 38.6 37.7 41.7 43.5 13.7 0.2 15.8 8.6Level of Service D D D D D B A B AApproach Delay (s) 39.5 42.9 12.9 15.2Approach LOS D D B B
Intersection SummaryHCM 2000 Control Delay 18.7 HCM 2000 Level of Service BHCM 2000 Volume to Capacity ratio 0.66Actuated Cycle Length (s) 126.0 Sum of lost time (s) 12.5Intersection Capacity Utilization 77.8% ICU Level of Service DAnalysis Period (min) 15c Critical Lane Group

HCM Signalized Intersection Capacity Analysis7: El Camino Real & Oak Grove Ave 7/22/2014
Menlo Parl El Camino Real Corridor Study Synchro 8 ReportExisting PM Peak Hour Conditions - No Project W-Trans
Movement EBL EBT EBR WBL WBT WBR NBL NBT NBR SBL SBT SBRLane ConfigurationsVolume (vph) 138 211 117 107 195 100 82 1410 96 105 1105 94Ideal Flow (vphpl) 1900 1900 1900 1900 1900 1900 1900 1900 1900 1900 1900 1900Total Lost time (s) 3.0 3.5 3.5 3.0 3.5 3.5 3.5 4.5 4.5 3.5 4.5 4.5Lane Util. Factor 1.00 1.00 1.00 1.00 1.00 1.00 1.00 0.95 1.00 1.00 0.95 1.00Frpb, ped/bikes 1.00 1.00 0.96 1.00 1.00 0.96 1.00 1.00 0.95 1.00 1.00 0.95Flpb, ped/bikes 1.00 1.00 1.00 1.00 1.00 1.00 1.00 1.00 1.00 1.00 1.00 1.00Frt 1.00 1.00 0.85 1.00 1.00 0.85 1.00 1.00 0.85 1.00 1.00 0.85Flt Protected 0.95 1.00 1.00 0.95 1.00 1.00 0.95 1.00 1.00 0.95 1.00 1.00Satd. Flow (prot) 1770 1863 1526 1770 1863 1520 1770 3539 1503 1770 3539 1503Flt Permitted 0.95 1.00 1.00 0.95 1.00 1.00 0.95 1.00 1.00 0.95 1.00 1.00Satd. Flow (perm) 1770 1863 1526 1770 1863 1520 1770 3539 1503 1770 3539 1503Peak-hour factor, PHF 0.98 0.98 0.98 0.98 0.98 0.98 0.98 0.98 0.98 0.98 0.98 0.98Adj. Flow (vph) 141 215 119 109 199 102 84 1439 98 107 1128 96RTOR Reduction (vph) 0 0 97 0 0 85 0 0 29 0 0 28Lane Group Flow (vph) 141 215 22 109 199 17 84 1439 69 107 1128 68Confl. Peds. (#/hr) 19 22 10 10Turn Type Prot NA Perm Prot NA Perm Prot NA Perm Prot NA PermProtected Phases 7 4 3 8 5 2 1 6Permitted Phases 4 8 2 6Actuated Green, G (s) 12.5 22.6 22.6 10.5 20.6 20.6 10.8 66.9 66.9 11.5 67.6 67.6Effective Green, g (s) 12.5 22.6 22.6 10.5 20.6 20.6 10.8 66.9 66.9 11.5 67.6 67.6Actuated g/C Ratio 0.10 0.18 0.18 0.08 0.16 0.16 0.09 0.53 0.53 0.09 0.54 0.54Clearance Time (s) 3.0 3.5 3.5 3.0 3.5 3.5 3.5 4.5 4.5 3.5 4.5 4.5Vehicle Extension (s) 3.0 3.0 3.0 3.0 3.0 3.0 3.0 3.0 3.0 3.0 3.0 3.0Lane Grp Cap (vph) 175 334 273 147 304 248 151 1879 798 161 1898 806v/s Ratio Prot c0.08 c0.12 0.06 0.11 0.05 c0.41 c0.06 0.32v/s Ratio Perm 0.01 0.01 0.05 0.05v/c Ratio 0.81 0.64 0.08 0.74 0.65 0.07 0.56 0.77 0.09 0.66 0.59 0.08Uniform Delay, d1 55.6 48.0 43.1 56.4 49.4 44.6 55.3 23.4 14.5 55.4 19.9 14.2Progression Factor 1.00 1.00 1.00 1.00 1.00 1.00 1.32 0.28 0.07 0.63 1.74 2.49Incremental Delay, d2 23.0 4.2 0.1 18.1 5.0 0.1 2.3 1.6 0.1 8.9 1.2 0.2Delay (s) 78.5 52.2 43.2 74.5 54.4 44.7 75.2 8.1 1.1 44.0 35.8 35.5Level of Service E D D E D D E A A D D DApproach Delay (s) 57.7 57.3 11.1 36.5Approach LOS E E B D
Intersection SummaryHCM 2000 Control Delay 30.6 HCM 2000 Level of Service CHCM 2000 Volume to Capacity ratio 0.74Actuated Cycle Length (s) 126.0 Sum of lost time (s) 14.5Intersection Capacity Utilization 83.7% ICU Level of Service EAnalysis Period (min) 15c Critical Lane Group

HCM Signalized Intersection Capacity Analysis8: El Camino Real & Valparaiso Ave/Glenwood Ave 7/22/2014
Menlo Parl El Camino Real Corridor Study Synchro 8 ReportExisting PM Peak Hour Conditions - No Project W-Trans
Movement EBL EBT EBR WBL WBT WBR NBL NBT NBR SBL SBT SBRLane ConfigurationsVolume (vph) 282 142 124 50 182 24 133 1467 22 42 918 250Ideal Flow (vphpl) 1900 1900 1900 1900 1900 1900 1900 1900 1900 1900 1900 1900Total Lost time (s) 3.5 3.5 3.5 3.5 3.5 4.0 4.5 4.5 4.0 4.5 4.5Lane Util. Factor 0.95 0.95 1.00 1.00 1.00 1.00 0.95 1.00 1.00 0.95 1.00Frpb, ped/bikes 1.00 1.00 0.98 1.00 1.00 1.00 1.00 0.97 1.00 1.00 0.98Flpb, ped/bikes 1.00 1.00 1.00 1.00 1.00 1.00 1.00 1.00 1.00 1.00 1.00Frt 1.00 1.00 0.85 1.00 0.98 1.00 1.00 0.85 1.00 1.00 0.85Flt Protected 0.95 0.98 1.00 0.95 1.00 0.95 1.00 1.00 0.95 1.00 1.00Satd. Flow (prot) 1681 1740 1555 1770 1831 1770 3539 1533 1770 3539 1547Flt Permitted 0.95 0.98 1.00 0.95 1.00 0.95 1.00 1.00 0.95 1.00 1.00Satd. Flow (perm) 1681 1740 1555 1770 1831 1770 3539 1533 1770 3539 1547Peak-hour factor, PHF 0.98 0.98 0.98 0.98 0.98 0.98 0.98 0.98 0.98 0.98 0.98 0.98Adj. Flow (vph) 288 145 127 51 186 24 136 1497 22 43 937 255RTOR Reduction (vph) 0 0 105 0 4 0 0 0 11 0 0 135Lane Group Flow (vph) 213 220 22 51 206 0 136 1497 11 43 937 120Confl. Peds. (#/hr) 5 3 1Turn Type Split NA Perm Split NA Prot NA Perm Prot NA PermProtected Phases 4 4 8 8 5 2 1 6Permitted Phases 4 2 6Actuated Green, G (s) 22.2 22.2 22.2 19.4 19.4 16.3 61.4 61.4 7.5 52.6 52.6Effective Green, g (s) 22.2 22.2 22.2 19.4 19.4 16.3 61.4 61.4 7.5 52.6 52.6Actuated g/C Ratio 0.18 0.18 0.18 0.15 0.15 0.13 0.49 0.49 0.06 0.42 0.42Clearance Time (s) 3.5 3.5 3.5 3.5 3.5 4.0 4.5 4.5 4.0 4.5 4.5Vehicle Extension (s) 3.0 3.0 3.0 3.0 3.0 3.0 3.0 3.0 3.0 3.0 3.0Lane Grp Cap (vph) 296 306 273 272 281 228 1724 747 105 1477 645v/s Ratio Prot c0.13 0.13 0.03 c0.11 c0.08 c0.42 0.02 0.26v/s Ratio Perm 0.01 0.01 0.08v/c Ratio 0.72 0.72 0.08 0.19 0.73 0.60 0.87 0.01 0.41 0.63 0.19Uniform Delay, d1 49.0 49.0 43.4 46.4 50.8 51.7 28.7 16.7 57.1 29.1 23.2Progression Factor 1.00 1.00 1.00 1.00 1.00 1.11 0.46 1.00 1.01 0.91 1.14Incremental Delay, d2 8.1 7.8 0.1 0.3 9.5 2.8 4.3 0.0 2.5 2.0 0.6Delay (s) 57.1 56.8 43.5 46.8 60.3 60.3 17.6 16.7 60.3 28.5 27.1Level of Service E E D D E E B B E C CApproach Delay (s) 53.9 57.6 21.1 29.3Approach LOS D E C C
Intersection SummaryHCM 2000 Control Delay 31.4 HCM 2000 Level of Service CHCM 2000 Volume to Capacity ratio 0.80Actuated Cycle Length (s) 126.0 Sum of lost time (s) 15.5Intersection Capacity Utilization 82.4% ICU Level of Service EAnalysis Period (min) 15c Critical Lane Group

HCM Signalized Intersection Capacity Analysis9: El Camino Real & Encinal Ave 7/22/2014
Menlo Parl El Camino Real Corridor Study Synchro 8 ReportExisting PM Peak Hour Conditions - No Project W-Trans
Movement EBL EBT EBR WBL WBT WBR NBL NBT NBR SBL SBT SBRLane ConfigurationsVolume (vph) 20 17 14 81 12 161 36 1676 96 67 1375 19Ideal Flow (vphpl) 1900 1900 1900 1900 1900 1900 1900 1900 1900 1900 1900 1900Total Lost time (s) 3.0 3.0 3.0 3.0 3.0 4.0 4.0 3.0 4.0Lane Util. Factor 1.00 1.00 1.00 1.00 1.00 0.95 1.00 1.00 0.91Frpb, ped/bikes 1.00 1.00 1.00 0.98 1.00 1.00 0.98 1.00 1.00Flpb, ped/bikes 1.00 1.00 1.00 1.00 1.00 1.00 1.00 1.00 1.00Frt 1.00 0.85 1.00 0.85 1.00 1.00 0.85 1.00 1.00Flt Protected 0.97 1.00 0.96 1.00 0.95 1.00 1.00 0.95 1.00Satd. Flow (prot) 1809 1583 1785 1555 1770 3539 1546 1770 5075Flt Permitted 0.85 1.00 0.73 1.00 0.95 1.00 1.00 0.95 1.00Satd. Flow (perm) 1579 1583 1355 1555 1770 3539 1546 1770 5075Peak-hour factor, PHF 0.99 0.99 0.99 0.99 0.99 0.99 0.99 0.99 0.99 0.99 0.99 0.99Adj. Flow (vph) 20 17 14 82 12 163 36 1693 97 68 1389 19RTOR Reduction (vph) 0 0 12 0 0 99 0 0 14 0 1 0Lane Group Flow (vph) 0 37 2 0 94 64 36 1693 83 68 1407 0Confl. Peds. (#/hr) 5 5 1Turn Type Perm NA Perm Perm NA Perm Prot NA Perm Prot NAProtected Phases 4 8 5 2 1 6Permitted Phases 4 4 8 8 2Actuated Green, G (s) 16.1 16.1 16.1 16.1 4.8 91.6 91.6 8.3 95.1Effective Green, g (s) 16.1 16.1 16.1 16.1 4.8 91.6 91.6 8.3 95.1Actuated g/C Ratio 0.13 0.13 0.13 0.13 0.04 0.73 0.73 0.07 0.75Clearance Time (s) 3.0 3.0 3.0 3.0 3.0 4.0 4.0 3.0 4.0Vehicle Extension (s) 3.0 3.0 3.0 3.0 3.0 3.0 3.0 3.0 3.0Lane Grp Cap (vph) 201 202 173 198 67 2572 1123 116 3830v/s Ratio Prot 0.02 c0.48 c0.04 0.28v/s Ratio Perm 0.02 0.00 c0.07 0.04 0.05v/c Ratio 0.18 0.01 0.54 0.32 0.54 0.66 0.07 0.59 0.37Uniform Delay, d1 49.1 48.0 51.5 50.0 59.5 9.0 5.0 57.2 5.2Progression Factor 1.00 1.00 1.00 1.00 1.23 0.29 0.04 1.00 1.00Incremental Delay, d2 0.4 0.0 3.5 0.9 4.8 0.8 0.1 7.4 0.3Delay (s) 49.5 48.0 55.0 50.9 77.9 3.4 0.3 64.5 5.5Level of Service D D D D E A A E AApproach Delay (s) 49.1 52.4 4.7 8.2Approach LOS D D A A
Intersection SummaryHCM 2000 Control Delay 10.2 HCM 2000 Level of Service BHCM 2000 Volume to Capacity ratio 0.64Actuated Cycle Length (s) 126.0 Sum of lost time (s) 10.0Intersection Capacity Utilization 74.0% ICU Level of Service DAnalysis Period (min) 15c Critical Lane Group

El Camino Real Corridor Study –Existing Conditions Report September 2014
El Camino Real Queuing Calculations


Queuing and Blocking ReportExisting AM Peak Hour Conditions - No Project 7/22/2014
Menlo Parl El Camino Real Corridor Study SimTraffic ReportW-Trans Page 1
Intersection: 1: El Camino Real & Sand Hill Rd/Alma St
Movement EB EB EB WB NB NB NB NB SB SB SB SBDirections Served L L R R L T T T L T T TMaximum Queue (ft) 87 134 118 86 200 236 192 88 326 286 291 344Average Queue (ft) 34 79 66 27 124 150 112 28 236 134 160 18195th Queue (ft) 88 141 122 89 202 253 206 93 351 322 342 381Link Distance (ft) 349 329 525 525 525 746 746 746Upstream Blk Time (%)Queuing Penalty (veh)Storage Bay Dist (ft) 235 235 190 535Storage Blk Time (%) 2 5 0 5Queuing Penalty (veh) 3 7 0 12
Intersection: 1: El Camino Real & Sand Hill Rd/Alma St
Movement SBDirections Served RMaximum Queue (ft) 236Average Queue (ft) 8095th Queue (ft) 230Link Distance (ft)Upstream Blk Time (%)Queuing Penalty (veh)Storage Bay Dist (ft) 240Storage Blk Time (%) 0Queuing Penalty (veh) 0
Intersection: 2: El Camino Real & Cambridge Avenue
Movement EB EB NB NB NB NB SB SB SB SBDirections Served LT R L T T TR L T T TRMaximum Queue (ft) 58 48 78 112 107 110 40 109 154 170Average Queue (ft) 17 23 36 40 38 42 13 40 49 7695th Queue (ft) 54 49 82 116 117 121 41 110 139 167Link Distance (ft) 284 269 269 269 284 284 284Upstream Blk Time (%)Queuing Penalty (veh)Storage Bay Dist (ft) 100 200 100Storage Blk Time (%) 0 2Queuing Penalty (veh) 0 0

Queuing and Blocking ReportExisting AM Peak Hour Conditions - No Project 7/22/2014
Menlo Parl El Camino Real Corridor Study SimTraffic ReportW-Trans Page 2
Intersection: 3: El Camino Real & Middle Avenue
Movement EB EB NB NB NB NB SB SB SBDirections Served L R L T T T T T TRMaximum Queue (ft) 222 196 164 105 94 78 203 184 232Average Queue (ft) 151 127 112 38 47 34 105 103 12895th Queue (ft) 239 212 172 102 101 76 211 198 240Link Distance (ft) 251 310 310 310 382 382 382Upstream Blk Time (%) 1Queuing Penalty (veh) 0Storage Bay Dist (ft) 100 270Storage Blk Time (%) 27 15Queuing Penalty (veh) 83 31
Intersection: 4: El Camino Real & Roble Avenue
Movement EB WB WB NB NB NB NB SB SB SBDirections Served LTR LT R L T T TR L T TRMaximum Queue (ft) 151 31 24 86 137 166 214 97 208 248Average Queue (ft) 88 10 7 44 73 78 91 40 102 12295th Queue (ft) 156 31 28 89 150 167 198 103 219 244Link Distance (ft) 238 182 182 432 432 432 196 196Upstream Blk Time (%) 0 1 2Queuing Penalty (veh) 0 8 20Storage Bay Dist (ft) 200 119Storage Blk Time (%) 0 4Queuing Penalty (veh) 0 1

Queuing and Blocking ReportExisting AM Peak Hour Conditions - No Project 7/22/2014
Menlo Parl El Camino Real Corridor Study SimTraffic ReportW-Trans Page 3
Intersection: 5: El Camino Real & Menlo Avenue/Ravenswood Avenue
Movement EB EB WB WB WB WB NB NB NB NB SB SBDirections Served LT TR L L T R L T T R L TMaximum Queue (ft) 298 235 281 333 229 118 159 210 232 156 194 281Average Queue (ft) 227 161 182 235 156 44 88 140 155 82 122 13395th Queue (ft) 312 244 282 332 234 121 158 224 245 155 225 281Link Distance (ft) 315 397 397 332 332 332 359Upstream Blk Time (%) 1 1 0Queuing Penalty (veh) 0 0 0Storage Bay Dist (ft) 225 275 135 319 240Storage Blk Time (%) 6 0 0 2 17 2Queuing Penalty (veh) 12 0 0 6 8 3
Intersection: 5: El Camino Real & Menlo Avenue/Ravenswood Avenue
Movement SB SBDirections Served T RMaximum Queue (ft) 292 2Average Queue (ft) 134 095th Queue (ft) 285 3Link Distance (ft) 359Upstream Blk Time (%) 0Queuing Penalty (veh) 2Storage Bay Dist (ft) 75Storage Blk Time (%) 34Queuing Penalty (veh) 4
Intersection: 6: El Camino Real & Santa Cruz Ave
Movement EB EB EB WB WB NB NB NB SB SB SBDirections Served L T R L TR T T R T T RMaximum Queue (ft) 110 73 85 74 106 166 146 49 398 392 124Average Queue (ft) 60 34 41 36 51 91 79 17 334 338 5195th Queue (ft) 119 80 91 69 113 166 144 47 490 484 155Link Distance (ft) 292 220 359 359 359 416 416Upstream Blk Time (%) 4 3Queuing Penalty (veh) 31 24Storage Bay Dist (ft) 140 140 150 100Storage Blk Time (%) 1 0 59Queuing Penalty (veh) 1 0 36

Queuing and Blocking ReportExisting AM Peak Hour Conditions - No Project 7/22/2014
Menlo Parl El Camino Real Corridor Study SimTraffic ReportW-Trans Page 4
Intersection: 7: El Camino Real & Oak Grove Ave
Movement EB EB EB WB WB WB NB NB NB NB SB SBDirections Served L T R L T R L T T R L TMaximum Queue (ft) 98 129 48 162 226 139 101 104 97 26 173 320Average Queue (ft) 55 88 24 91 143 35 73 53 57 10 116 13695th Queue (ft) 102 138 52 169 239 124 123 103 110 30 222 358Link Distance (ft) 248 245 416 416 988Upstream Blk Time (%) 1Queuing Penalty (veh) 0Storage Bay Dist (ft) 90 115 115 115 280 115 195Storage Blk Time (%) 3 12 5 13 0 7Queuing Penalty (veh) 5 13 15 16 0 6
Intersection: 7: El Camino Real & Oak Grove Ave
Movement SB SBDirections Served T RMaximum Queue (ft) 325 103Average Queue (ft) 143 3895th Queue (ft) 351 140Link Distance (ft) 988Upstream Blk Time (%)Queuing Penalty (veh)Storage Bay Dist (ft) 135Storage Blk Time (%) 16Queuing Penalty (veh) 14

Queuing and Blocking ReportExisting PM Peak Hour Conditions - No Project 7/22/2014
Menlo Parl El Camino Real Corridor Study SimTraffic ReportW-Trans Page 1
Intersection: 1: El Camino Real & Sand Hill Rd/Alma St
Movement EB EB EB WB WB NB NB NB NB NB SB SBDirections Served L L R T R L T T T R L TMaximum Queue (ft) 260 381 260 129 312 250 522 451 329 149 352 154Average Queue (ft) 246 348 202 9 209 209 384 315 212 39 245 6395th Queue (ft) 292 432 362 97 374 297 584 508 369 160 403 146Link Distance (ft) 349 329 329 525 525 525 746Upstream Blk Time (%) 46 1 5 5 1Queuing Penalty (veh) 0 0 0 0 0Storage Bay Dist (ft) 235 235 190 100 535Storage Blk Time (%) 15 53 0 5 39 17 3 0Queuing Penalty (veh) 75 265 2 23 71 23 14 0
Intersection: 1: El Camino Real & Sand Hill Rd/Alma St
Movement SB SB SBDirections Served T T RMaximum Queue (ft) 174 182 218Average Queue (ft) 81 86 9495th Queue (ft) 182 193 212Link Distance (ft) 746 746Upstream Blk Time (%)Queuing Penalty (veh)Storage Bay Dist (ft) 240Storage Blk Time (%) 1Queuing Penalty (veh) 2
Intersection: 2: El Camino Real & Cambridge Avenue
Movement EB EB WB NB NB NB NB SB SB SB SBDirections Served LT R LTR L T T TR L T T TRMaximum Queue (ft) 58 55 35 227 297 279 250 34 199 209 245Average Queue (ft) 23 31 7 138 156 147 142 12 140 149 20095th Queue (ft) 63 55 31 238 325 299 285 35 203 229 270Link Distance (ft) 284 139 269 269 269 284 284 284Upstream Blk Time (%) 0 1 1 1 0Queuing Penalty (veh) 0 11 8 4 1Storage Bay Dist (ft) 100 200 100Storage Blk Time (%) 0 1 3 17Queuing Penalty (veh) 0 8 5 2

Queuing and Blocking ReportExisting PM Peak Hour Conditions - No Project 7/22/2014
Menlo Parl El Camino Real Corridor Study SimTraffic ReportW-Trans Page 2
Intersection: 3: El Camino Real & Middle Avenue
Movement EB EB NB NB NB NB SB SB SBDirections Served L R L T T T T T TRMaximum Queue (ft) 266 192 299 352 241 179 230 242 278Average Queue (ft) 181 116 241 170 110 74 124 137 17695th Queue (ft) 292 223 321 353 226 158 233 239 288Link Distance (ft) 251 310 310 310 382 382 382Upstream Blk Time (%) 5 2 3 0 0Queuing Penalty (veh) 0 0 25 0 0Storage Bay Dist (ft) 100 270Storage Blk Time (%) 34 6 10 5Queuing Penalty (veh) 67 14 68 16
Intersection: 4: El Camino Real & Roble Avenue
Movement EB WB WB NB NB NB NB SB SB SB SBDirections Served LTR LT R L T T TR L T T TRMaximum Queue (ft) 115 103 47 188 379 388 378 128 165 181 188Average Queue (ft) 65 50 30 92 265 288 247 71 101 111 12295th Queue (ft) 121 102 58 220 494 499 461 131 178 198 210Link Distance (ft) 241 182 182 432 432 432 197 197 197Upstream Blk Time (%) 14 16 8 0 1 1Queuing Penalty (veh) 95 113 55 1 3 5Storage Bay Dist (ft) 200 119Storage Blk Time (%) 25 2 3Queuing Penalty (veh) 20 10 2

Queuing and Blocking ReportExisting PM Peak Hour Conditions - No Project 7/22/2014
Menlo Parl El Camino Real Corridor Study SimTraffic ReportW-Trans Page 3
Intersection: 5: El Camino Real & Menlo Avenue/Ravenswood Avenue
Movement EB EB WB WB WB WB NB NB NB NB SB SBDirections Served LT TR L L T R L T T R L TMaximum Queue (ft) 267 216 224 284 311 170 296 420 415 332 239 266Average Queue (ft) 217 162 147 206 186 69 146 352 360 206 163 19095th Queue (ft) 318 266 263 298 330 171 348 479 482 364 258 274Link Distance (ft) 315 397 397 332 332 332 359Upstream Blk Time (%) 3 0 1 0 37 41 3Queuing Penalty (veh) 0 0 0 0 252 283 17Storage Bay Dist (ft) 225 275 135 319 240Storage Blk Time (%) 11 3 1 22 0 38 4 0Queuing Penalty (veh) 24 6 2 17 1 51 22 1
Intersection: 5: El Camino Real & Menlo Avenue/Ravenswood Avenue
Movement SB SBDirections Served T RMaximum Queue (ft) 268 82Average Queue (ft) 211 2595th Queue (ft) 299 92Link Distance (ft) 359Upstream Blk Time (%)Queuing Penalty (veh)Storage Bay Dist (ft) 75Storage Blk Time (%) 49 0Queuing Penalty (veh) 25 0
Intersection: 6: El Camino Real & Santa Cruz Ave
Movement EB EB EB WB WB NB NB NB SB SB SBDirections Served L T R L TR T T R T T RMaximum Queue (ft) 177 171 123 80 135 215 177 39 229 257 133Average Queue (ft) 114 59 52 34 76 124 121 16 136 151 3995th Queue (ft) 188 160 121 93 172 220 187 41 244 266 117Link Distance (ft) 292 220 359 359 359 416 416Upstream Blk Time (%) 0 0Queuing Penalty (veh) 0 0Storage Bay Dist (ft) 140 140 150 100Storage Blk Time (%) 7 0 4 21Queuing Penalty (veh) 15 1 2 20

Queuing and Blocking ReportExisting PM Peak Hour Conditions - No Project 7/22/2014
Menlo Parl El Camino Real Corridor Study SimTraffic ReportW-Trans Page 4
Intersection: 7: El Camino Real & Oak Grove Ave
Movement EB EB EB WB WB WB NB NB NB NB SB SBDirections Served L T R L T R L T T R L TMaximum Queue (ft) 139 264 165 149 219 149 118 163 167 110 219 537Average Queue (ft) 110 181 90 110 137 66 63 112 119 35 157 38895th Queue (ft) 161 304 197 177 267 157 127 173 179 112 287 533Link Distance (ft) 248 245 416 416 988Upstream Blk Time (%) 10 5Queuing Penalty (veh) 0 0Storage Bay Dist (ft) 90 115 115 115 280 115 195Storage Blk Time (%) 37 32 0 25 9 1 13 25Queuing Penalty (veh) 123 83 0 75 19 2 12 27
Intersection: 7: El Camino Real & Oak Grove Ave
Movement SB SBDirections Served T RMaximum Queue (ft) 546 185Average Queue (ft) 408 9995th Queue (ft) 537 235Link Distance (ft) 988Upstream Blk Time (%)Queuing Penalty (veh)Storage Bay Dist (ft) 135Storage Blk Time (%) 29Queuing Penalty (veh) 27

El Camino Real Corridor Study –Existing Conditions Report September 2014
El Camino Real Curb Ramp Data


Men
lo Park ‐ E
l Cam
ino Re
al Ped
estrian Cu
rb Ram
psDate: ________________________________________
Southe
rn Lim
itNortheast
corner
Southe
ast
corner
Southw
est
corner
Northwest
corner
Intersection
Num
ber of Ped
estrian Cu
rb Ram
ps
El Cam
ino Re
al at Encinal A
venu
eGlenw
ood Avenu
e‐Va
lparaiso Avenu
e2
11
1El Cam
ino Re
alGlenw
ood Avenu
e‐Va
lparaiso Avenu
eOak Grove Avenu
e2
22
1El Cam
ino Re
alOak Grove Avenu
eSanta Cruz Avenu
e1
11
1El Cam
ino Re
alSanta Cruz Avenu
eMen
lo Avenu
e‐Ra
venswoo
d Avenu
e1
11
1El Cam
ino Re
alMen
lo Avenu
e‐Ra
venswoo
d Avenu
eLive Oak Avenu
e2
11
1El Cam
ino Re
alLive Oak Avenu
eRo
ble Avenu
e1
1ElC
iR
lR
blA
Middl
A0
11
1El Cam
ino Re
alRo
ble Avenu
eMiddle Avenu
e0
11
1El Cam
ino Re
alMiddle Avenu
eCo
llege Avenu
e1
01
1El Cam
ino Re
alCo
llege Avenu
ePartridge Avenu
e1
1El Cam
ino Re
alPartridge Avenu
eCambridge Avenu
e1
1El Cam
ino Re
alCambridge Avenu
eHarvard Avenu
e1
01
1El Cam
ino Re
alHarvard Avenu
eCreek Drive
11
ElCaminoRe
alCreekDrive
Sand
HillRo
ad2
2El Cam
ino Re
alCreek Drive
Sand
Hill Road
22
Exam
ple ‐ N
umbe
r of Ped
estrian Cu
rb Ram
ps on each corne
r
This corne
r wou
ld be coun
ted as having tw
o curb ram
ps
This corne
r wou
ld be coun
ted as having on
e curb ram
p


El Camino Real Corridor Study –Existing Conditions Report September 2014
El Camino Real Collision Records


MIDDLE AVE
OAK GROVE AVE
COLLEGE AVE
VALPARAISO AVE
ALEJANDRA AVE
LIVE OAK AVE
ENCINAL AVE
PARTRIDGE AVE
GLENWOOD AVE
STONE PINE LN
MENLO AVE
EL
CA
MIN
O R
EA
L
ROBLE AVE
SANTA CRUZ AVE
RAVENSWOOD AVE
CAMBRIDGE AVE
HARVARD AVE
CREEK DR
SAND HILL RD
Figu
re 1
0 –
All
Col
lisio
ns a
t In
ters
ecti
ons
(5-y
ear
peri
od)
014m
pa.
ai
7/14
El C
amin
o Re
al C
orrid
or S
tudy
– E
xist
ing
Cond
ition
s Re
port
LEG
END
Tota
l Col
lisio
ns
162
No
rth
No
t to
Sca
le
1 2 3 -
4
5 -
6
7 -
8
9 -
10
11 -
15
16 -
20
21 -
25
26 -
30

MIDDLE AVE
OAK GROVE AVE
COLLEGE AVE
VALPARAISO AVE
ALEJANDRA AVE
LIVE OAK AVE
ENCINAL AVE
PARTRIDGE AVE
GLENWOOD AVE
STONE PINE LN
MENLO AVE
EL
CA
MIN
O R
EA
L
ROBLE AVE
SANTA CRUZ AVE
RAVENSWOOD AVE
CAMBRIDGE AVE
HARVARD AVE
CREEK DR
SAND HILL RD
Figu
re 1
1 –
All
Col
lisio
ns b
etw
een
Inte
rsec
tion
s (5
-yea
r pe
riod
)
014m
pa.
ai
7/14
El C
amin
o Re
al C
orrid
or S
tudy
– E
xist
ing
Cond
ition
s Re
port
LEG
END
Tota
l Col
lisio
ns
109
No
rth
No
t to
Sca
le
1 2 3 4 -
6
7 -
9
10 -
12
13 -
15

MIDDLE AVE
OAK GROVE AVE
COLLEGE AVE
VALPARAISO AVE
ALEJANDRA AVE
LIVE OAK AVE
ENCINAL AVE
PARTRIDGE AVE
GLENWOOD AVE
STONE PINE LN
MENLO AVE
EL
CA
MIN
O R
EA
L
ROBLE AVE
SANTA CRUZ AVE
RAVENSWOOD AVE
CAMBRIDGE AVE
HARVARD AVE
CREEK DR
SAND HILL RD
Figu
re 1
2 –
Pede
stri
an C
ollis
ions
(10
-yea
r pe
riod
)
014m
pa.
ai
7/14
El C
amin
o Re
al C
orrid
or S
tudy
– E
xist
ing
Cond
ition
s Re
port
LEG
END
Tota
l Col
lisio
ns
23N
ort
h
No
t to
Sca
le
4 C
ollis
ion
s w
ith
in I
nte
rsec
tion
2 C
ollis
ion
s w
ith
in I
nte
rsec
tion
1 C
ollis
ion
wit
hin
In
ters
ecti
on1
Col
lisio
n o
uts
ide
Inte
rsec
tion

MIDDLE AVE
OAK GROVE AVE
COLLEGE AVE
VALPARAISO AVE
ALEJANDRA AVE
LIVE OAK AVE
ENCINAL AVE
PARTRIDGE AVE
GLENWOOD AVE
STONE PINE LN
MENLO AVE
EL
CA
MIN
O R
EA
L
ROBLE AVE
SANTA CRUZ AVE
RAVENSWOOD AVE
CAMBRIDGE AVE
HARVARD AVE
CREEK DR
SAND HILL RD
Figu
re 1
3 –
Bic
ycle
Col
lisio
ns (
10-y
ear
peri
od)
014m
pa.
ai
7/14
El C
amin
o Re
al C
orrid
or S
tudy
– E
xist
ing
Cond
ition
s Re
port
No
rth
No
t to
Sca
le
LEG
END
Tota
l Col
lisio
ns
30
1 C
ollis
ion
wit
hin
In
ters
ecti
on
1 C
ollis
ion
ou
tsid
e In
ters
ecti
on
2 C
ollis
ion
s w
ith
in I
nte
rsec
tion
2 C
ollis
ion
s ou
tsid
e In
ters
ecti
on
3 C
ollis
ion
s w
ith
in I
nte
rsec
tion

Date of Count:
Number of Collisions: 8Number of Injuries: 3
Number of Fatalities: 0ADT: 47400
Start Date: End Date:
Number of Years: 5
Intersection Type: Four-LeggedControl Type: Signals
Area: Urban
8 x47,400 x x 5
Study Intersection 0.09 c/mveStatewide Average* 0.27 c/mve
c/mve = collisions per million vehicles entering intersection* 2010 Collision Data on California State Highways, Caltrans
Date of Count:
Number of Collisions: 18Number of Injuries: 8
Number of Fatalities: 0ADT: 41300
Start Date: End Date:
Number of Years: 5
Intersection Type: Four-LeggedControl Type: Signals
Area: Urban
18 x41,300 x x 5
Study Intersection 0.24 c/mveStatewide Average* 0.27 c/mve
c/mve = collisions per million vehicles entering intersection* 2010 Collision Data on California State Highways, Caltrans
City of Menlo Park - El Camino Real Corridor Study
Wednesday, April 02, 2014
Wednesday, April 02, 2014
41.9%
Intersection Collision Rate Calculaions
January 1, 2009December 31, 2013
Intersection # El Camino Real & Sand Hill Road
collision rate = 1,000,000
El Camino Real & Cambridge Avenue
41.9%
ADT = average daily total vehicles entering intersection
January 1, 2009
365
Intersection #
December 31, 2013
Number of Collisions x 1 Millioncollision rate =
1:
Collision Rate Injury Rate
44.4%Collision Rate Fatality Rate
collision rate = 365
2:
Number of Collisions x 1 Million
0.4%
collision rate = ADT x 365 Days per Year x Number of Years
37.5%
1,000,000
Injury Rate
Fatality Rate0.0%
ADT x 365 Days per Year x Number of Years
0.0%
ADT = average daily total vehicles entering intersection
0.4%
Whitlock & Weinberger Transportation, Inc.9/18/2014
Page 1 of 5

Date of Count:
Number of Collisions: 16Number of Injuries: 7
Number of Fatalities: 0ADT: 42700
Start Date: End Date:
Number of Years: 5
Intersection Type: TeeControl Type: Signals
Area: Urban
16 x42,700 x x 5
Study Intersection 0.21 c/mveStatewide Average* 0.21 c/mve
c/mve = collisions per million vehicles entering intersection* 2010 Collision Data on California State Highways, Caltrans
Date of Count:
Number of Collisions: 22Number of Injuries: 9
Number of Fatalities: 0ADT: 38200
Start Date: End Date:
Number of Years: 5
Intersection Type: Four-LeggedControl Type: Signals
Area: Urban
22 x38,200 x x 5
Study Intersection 0.32 c/mveStatewide Average* 0.27 c/mve
c/mve = collisions per million vehicles entering intersection* 2010 Collision Data on California State Highways, Caltrans
collision rate =
Collision Rate
Wednesday, April 02, 2014
0.4%0.0% 40.9%
1,000,000365
ADT x 365 Days per Year x Number of YearsNumber of Collisions x 1 Million
El Camino Real & Roble Avenue
ADT = average daily total vehicles entering intersection
0.3%
Wednesday, April 02, 2014
43.8%
4:
0.0%
December 31, 2013
collision rate =
ADT = average daily total vehicles entering intersection
Intersection Collision Rate Calculaions
Intersection #
Fatality Rate
365
Collision Rate
3: El Camino Real & Middle Avenue
collision rate = 1,000,000
Number of Collisions x 1 MillionADT x 365 Days per Year x Number of Years
Injury Rate
December 31, 2013
City of Menlo Park - El Camino Real Corridor Study
January 1, 2009
41.9%
Fatality Rate Injury Rate
January 1, 2009
collision rate =
Intersection #
42.4%
Whitlock & Weinberger Transportation, Inc.9/18/2014
Page 2 of 5

Date of Count:
Number of Collisions: 34Number of Injuries: 15
Number of Fatalities: 0ADT: 46500
Start Date: End Date:
Number of Years: 5
Intersection Type: Four-LeggedControl Type: Signals
Area: Urban
34 x46,500 x x 5
Study Intersection 0.40 c/mveStatewide Average* 0.27 c/mve
c/mve = collisions per million vehicles entering intersection* 2010 Collision Data on California State Highways, Caltrans
Date of Count:
Number of Collisions: 23Number of Injuries: 11
Number of Fatalities: 0ADT: 33500
Start Date: End Date:
Number of Years: 5
Intersection Type: Four-LeggedControl Type: Signals
Area: Urban
23 x33,500 x x 5
Study Intersection 0.38 c/mveStatewide Average* 0.27 c/mve
c/mve = collisions per million vehicles entering intersection* 2010 Collision Data on California State Highways, Caltrans
Wednesday, April 02, 2014
ADT = average daily total vehicles entering intersection
0.0%Injury Rate
44.1%
ADT x 365 Days per Year x Number of Years
collision rate = 1,000,000365
Collision Rate Fatality Rate
41.9%
Intersection # 6: El Camino Real & Santa Cruz Avenue
0.4%
El Camino Real & Ravenswood Avenue-Menlo Avenue
Number of Collisions x 1 Million
0.4% 41.9%
collision rate = 1,000,000365
ADT = average daily total vehicles entering intersection
Collision Rate Fatality Rate Injury Rate
Wednesday, April 02, 2014
Intersection # 5:
January 1, 2009December 31, 2013
0.0%
collision rate = Number of Collisions x 1 Million
47.8%
ADT x 365 Days per Year x Number of Years
City of Menlo Park - El Camino Real Corridor Study
January 1, 2009December 31, 2013
collision rate =
Intersection Collision Rate Calculaions
Whitlock & Weinberger Transportation, Inc.9/18/2014
Page 3 of 5

Date of Count:
Number of Collisions: 36Number of Injuries: 16
Number of Fatalities: 0ADT: 37600
Start Date: End Date:
Number of Years: 5
Intersection Type: Four-LeggedControl Type: Signals
Area: Urban
36 x37,600 x x 5
Study Intersection 0.52 c/mveStatewide Average* 0.27 c/mve
c/mve = collisions per million vehicles entering intersection* 2010 Collision Data on California State Highways, Caltrans
Date of Count:
Number of Collisions: 24Number of Injuries: 9
Number of Fatalities: 0ADT: 36400
Start Date: End Date:
Number of Years: 5
Intersection Type: Four-LeggedControl Type: Signals
Area: Urban
24 x36,400 x x 5
Study Intersection 0.36 c/mveStatewide Average* 0.27 c/mve
c/mve = collisions per million vehicles entering intersection* 2010 Collision Data on California State Highways, Caltrans
ADT = average daily total vehicles entering intersection
collision rate = 1,000,000365
Collision Rate Fatality Rate Injury Rate0.0% 37.5%0.4% 41.9%
January 1, 2009December 31, 2013
collision rate = Number of Collisions x 1 MillionADT x 365 Days per Year x Number of Years
ADT = average daily total vehicles entering intersection
Intersection # 8: El Camino Real & Glenwood Avenue-Valparaiso Avenue
Wednesday, April 02, 2014
collision rate = 1,000,000365
Collision Rate Fatality Rate Injury Rate0.0% 44.4%0.4% 41.9%
January 1, 2009December 31, 2013
collision rate = Number of Collisions x 1 MillionADT x 365 Days per Year x Number of Years
Intersection Collision Rate CalculaionsCity of Menlo Park - El Camino Real Corridor Study
Intersection # 7: El Camino Real & Oak Grove Avenue
Wednesday, April 02, 2014
Whitlock & Weinberger Transportation, Inc.9/18/2014
Page 4 of 5

Date of Count:
Number of Collisions: 6Number of Injuries: 5
Number of Fatalities: 0ADT: 35700
Start Date: End Date:
Number of Years: 5
Intersection Type: Four-LeggedControl Type: Signals
Area: Urban
6 x35,700 x x 5
Study Intersection 0.09 c/mveStatewide Average* 0.27 c/mve
c/mve = collisions per million vehicles entering intersection* 2010 Collision Data on California State Highways, Caltrans
0.0% 83.3%0.4% 41.9%
ADT = average daily total vehicles entering intersection
collision rate = Number of Collisions x 1 MillionADT x 365 Days per Year x Number of Years
collision rate = 1,000,000365
Collision Rate Fatality Rate Injury Rate
Wednesday, April 02, 2014
January 1, 2009December 31, 2013
Intersection Collision Rate CalculaionsCity of Menlo Park - El Camino Real Corridor Study
Intersection # 9: El Camino Real & Encinal Avenue
Whitlock & Weinberger Transportation, Inc.9/18/2014
Page 5 of 5

Dat
eTi
me
Loca
tion
Spee
d Li
mit
Min
or
Inju
ries
Maj
or
Inju
ries
Fata
l In
jurie
sPr
imar
y C
ollis
ion
Fact
or
Dire
ctio
n of
Tra
vel
Rel
ativ
e Lo
catio
nC
ollis
ion
Type
Adj
acen
t or
Stre
et A
ddre
ssPa
rtie
s In
volv
ed
1/3/
2009
0E
L C
AM
INO
RE
AL/
CO
LLE
GE
AV
350
00
2210
7U
nkno
wn
Inte
rese
ctio
nU
nkno
wn
Col
lege
Car
and
Lig
ht P
ole
2/9/
2009
656
RA
VE
NS
WO
OD
AV
/EL
CA
MIN
O
RE
AL
250
00
2235
0 V
CW
/B R
aven
swoo
dS
top
Ligh
t at L
ocat
ion
Rea
rend
EC
R2
Car
s
2/9/
2009
748
EL
CA
MIN
O R
EA
L/R
OB
LE A
V35
00
021
658(
a) V
CS
/B E
CR
100
ft N
/O R
oble
Sid
esw
ipe-
Cha
ngin
g La
nes
Rob
le3
Car
s
2/12
/200
918
3152
5 E
L C
AM
INO
RE
AL
351
00
2210
7 V
CN
/B E
CR
-Tur
ning
into
Par
king
Lo
t52
5 E
CR
Bro
adsi
deM
iddl
e2
Car
s
2/15
/200
923
40M
EN
LO A
V/E
L C
AM
INO
RE
AL
350
00
2315
2 V
CS
/B E
CR
Inte
rsec
tion
Sid
esw
ipe
Rav
ensw
ood
2 C
ars
2/18
/200
921
00O
AK
GR
OV
E A
V/E
L C
AM
INO
R
EA
L35
20
022
350
VC
N/B
EC
RS
top
Ligh
t at L
ocat
ion
Rea
rend
- Hit
and
Run
Oak
Gro
ve2
Car
s
2/19
/200
920
42E
L C
AM
INO
RE
AL/
CO
LLE
GE
AV
350
00
2235
0 V
CS
/B E
CR
Inte
rsec
tion
Rea
rend
Col
lege
2 C
ars
3/12
/200
975
0E
L C
AM
INO
RE
AL/
VA
LPA
RA
ISO
A
V35
10
021
453
VC
Bik
e E
/B E
CR
Aga
inst
Red
Li
ght
Cro
ssw
alk
Car
vs
Bik
eC
ar S
/B E
CR
Car
vs
Bik
e
3/12
/200
921
33O
AK
GR
OV
E A
V/E
L C
AM
INO
R
EA
L25
00
022
350
VC
E/B
Oak
Gro
veS
top
Ligh
t at L
ocat
ion
Rea
rend
EC
R2
Car
s
3/17
/200
918
16E
L C
AM
INO
RE
AL/
RO
BLE
AV
351
00
2235
0 V
CN
/B E
CR
100
ft N
/O R
oble
Rea
rend
Rob
le2
Car
s
4/20
/200
982
0E
L C
AM
INO
RE
AL/
CA
MB
RID
GE
A
V35
00
022
107
VC
S/B
EC
RM
akin
g U
Tur
n at
C
ambr
idge
Sid
esw
ipe
Cam
brid
geC
ar a
nd P
edes
trian
S
igna
l Pol
e
5/6/
2009
1138
EL
CA
MIN
O R
EA
L/M
EN
LO A
V35
00
021
750
VC
S/B
EC
RS
top
Ligh
t at L
ocat
ion
Sid
esw
ipe-
Mov
ing
for A
mbu
lanc
eM
enlo
2
Car
s
5/10
/200
913
42E
L C
AM
INO
RE
AL/
CA
MB
RID
GE
A
V35
20
021
453(
a) V
CS
/B E
CR
Sto
p Li
ght a
t Loc
atio
nB
road
side
- Ran
Red
Li
ght
Cam
brid
ge2
Car
s
5/14
/200
917
1265
EL
CA
MIN
O R
EA
L35
10
022
350
VC
S/B
EC
RS
top
Ligh
t at L
ocat
ion
Rea
rend
San
d H
ill3
Car
s
5/21
/200
913
40E
L C
AM
INO
R
EA
L/R
AV
EN
SW
OO
D A
V30
10
022
350
VC
N/B
EC
RS
top
Ligh
t at L
ocat
ion
Rea
rend
Rav
ensw
ood
2 C
ars
5/29
/200
917
00O
AK
GR
OV
E A
V/E
L C
AM
INO
R
EA
L25
00
021
755
CV
CW
/B O
ak G
rove
100
E/O
EC
RS
ides
wip
eE
CR
2 C
ars
6/4/
2009
1230
1422
EL
CA
MIN
O R
EA
L35
10
022
350
VC
N/B
EC
R10
0 ft
N/O
Gle
nnw
ood
Rea
rend
Gle
nwoo
d3
Car
s
6/4/
2009
1410
888
EL
CA
MIN
O R
EA
L35
00
022
350
VC
N/B
EC
RS
top
Ligh
t at L
ocat
ion
Rea
rend
Rav
ensw
ood
4 C
ars
6/12
/200
913
25E
L C
AM
INO
RE
AL/
OA
K G
RO
VE
A
V35
00
022
107
VC
N/B
EC
R tu
rnin
g E
/B G
lenw
ood
Inte
rsec
tion
Sid
esw
ipe
Gle
nwoo
dC
ar a
nd T
raffi
c S
igna
l
6/18
/200
916
20E
L C
AM
INO
RE
AL/
STO
NE
PIN
E
LN35
10
0O
ther
N/B
EC
R10
0 ft
S/O
Sto
nepi
neS
ides
wip
eS
tone
pine
2 C
ars-
Med
ical
Issu
e
6/19
/200
914
1530
1 E
L C
AM
INO
RE
AL
352
00
2170
3 V
CN
/B E
CR
300
Blk
EC
RR
eare
ndP
artri
dge
3 C
ars
Men
lo P
ark:
El C
amin
o R
eal 5
-yea
r Col
lisio
n R
ecor
ds (2
009-
2013
)
El C
amin
o R
eal 5
-yea
r Col
lisio
n R
ecor
dsPa
ge 1

Dat
eTi
me
Loca
tion
Spee
d Li
mit
Min
or
Inju
ries
Maj
or
Inju
ries
Fata
l In
jurie
sPr
imar
y C
ollis
ion
Fact
or
Dire
ctio
n of
Tra
vel
Rel
ativ
e Lo
catio
nC
ollis
ion
Type
Adj
acen
t or
Stre
et A
ddre
ssPa
rtie
s In
volv
edM
enlo
Par
k: E
l Cam
ino
Rea
l 5-y
ear C
ollis
ion
Rec
ords
(200
9-20
13)
7/9/
2009
738
EL
CA
MIN
O R
EA
L/M
EN
LO A
V35
00
022
350(
a) V
CN
/B E
CR
Sto
p Li
ght a
t Loc
atio
nR
eare
ndM
enlo
2
Car
s
7/10
/200
917
00E
L C
AM
INO
RE
AL/
GLE
NW
OO
D
AV
351
00
2235
0 V
CN
/B E
CR
Sto
p Li
ght a
t Loc
atio
nR
eare
ndG
lenw
ood
2 C
ars
7/16
/200
918
3014
60 E
L C
AM
INO
RE
AL
350
00
2210
7 V
CN
/B E
CR
1460
EC
RS
ides
wip
e- H
it an
d R
un14
60 E
CR
2 C
ars
8/5/
2009
1635
751
EL
CA
MIN
O R
EA
L35
00
022
107
VC
S/B
EC
R75
1 E
CR
Hea
d O
n75
1 E
CR
Car
and
Wal
l8/
9/20
0911
00E
L C
AM
INO
RE
AL/
MID
DLE
AV
350
00
2210
7 V
CS
/B E
CR
100
ft N
/O S
anta
Cru
zS
ides
wip
e- C
hang
ing
Lane
sS
anta
Cru
z2
Car
s
8/26
/200
973
0E
L C
AM
INO
R
EA
L/R
AV
EN
SW
OO
D A
V35
10
022
350
VC
N/B
EC
RS
top
Ligh
t at L
ocat
ion
Rea
rend
Rav
ensw
ood
2 C
ars
8/27
/200
991
8S
AN
TA C
RU
Z A
V/E
L C
AM
INO
R
EA
L35
10
022
517
VC
Car
Par
ked
S/B
EC
R- B
ike
Hit
Ope
n C
ar D
oor
1081
EC
RC
ar v
s B
ike
Bik
e S
/B E
CR
Car
vs
Bik
e
9/10
/200
913
26M
EN
LO A
V/E
L C
AM
INO
RE
AL
351
00
11.5
6.12
0 C
O
Ped
E/B
Men
lo
Inte
rsec
tion
Ped
vs
Bik
eB
ike
S/B
EC
RP
ed v
s B
ike
9/11
/200
922
00E
L C
AM
INO
RE
AL/
ME
NLO
AV
250
00
2210
6 C
VC
E/B
Men
loS
top
Ligh
t at L
ocat
ion
Rea
rend
EC
R2
Car
s
9/13
/200
911
34O
AK
GR
OV
E A
V/E
L C
AM
INO
R
EA
L35
00
022
350
VC
S/B
EC
RS
top
Ligh
t at L
ocat
ion
Rea
rend
Oak
Gro
ve2
Car
s
9/13
/200
917
40M
IDD
LE A
V/E
L C
AM
INO
RE
AL
250
00
2180
4(a)
VC
E/B
Mid
dle
100
ft W
/O E
CR
Rea
rend
EC
R2
Car
s
9/13
/200
918
45E
L C
AM
INO
RE
AL/
MID
DLE
AV
351
00
2235
0 V
CN
/B E
CR
Inte
rsec
tion
Rea
rend
Mid
dle
2 C
ars
10/9
/200
918
19E
L C
AM
INO
RE
AL/
GLE
NW
OO
D
AV
E25
00
021
804(
a) V
CW
/B e
xitin
g P
rivat
e P
arki
ng L
ot49
5 E
CR
-Driv
eway
on
Gle
nwoo
dB
road
side
EC
R2
Car
s
10/2
2/20
0916
00O
AK
GR
OV
E A
V/E
L C
AM
INO
R
EA
L30
20
022
350
VC
S/B
EC
RS
top
Ligh
t at L
ocat
ion
Rea
rend
Oak
Gro
ve2
Car
s
10/2
9/20
0984
9E
L C
AM
INO
R
EA
L/R
AV
EN
SW
OO
D A
V35
00
022
350
VC
S/B
EC
RS
top
Ligh
t at L
ocat
ion
Rea
rend
San
ta C
ruz
2 C
ars
11/4
/200
912
42E
L C
AM
INO
RE
AL/
RO
BLE
AV
350
00
2235
0 V
CN
/B E
CR
Sto
p Li
ght a
t Loc
atio
nR
eare
ndR
oble
3 C
ars
11/2
9/20
0970
5E
L C
AM
INO
RE
AL/
CA
MB
RID
GE
A
V35
10
021
453A
VC
S/B
EC
RTu
rnin
g fro
m
Cam
brid
ge to
EC
RB
orad
side
Cam
brid
ge2
Car
s
12/8
/200
918
00E
L C
AM
INO
RE
AL/
CA
MB
RID
GE
A
V35
00
021
658A
VC
N/B
EC
R10
0 ft
S/O
Inte
rsec
tion
Sid
esw
ipe-
Cha
ngin
g La
nes
Cam
brid
ge2
Car
s
12/9
/200
984
0E
NC
INA
L A
V/E
L C
AM
INO
RE
AL
300
00
2145
3 V
CN
/B E
CR
Ran
Red
Lig
htB
road
side
Enc
inal
2 C
ars
12/1
2/20
0919
00E
L C
AM
INO
RE
AL/
EN
CIN
AL
AV
352
00
2315
2(a)
VC
N/B
EC
R15
0 ft
S/O
Enc
inal
Hea
d O
nE
ncin
alC
ar a
nd a
Tre
e
El C
amin
o R
eal 5
-yea
r Col
lisio
n R
ecor
dsPa
ge 2

Dat
eTi
me
Loca
tion
Spee
d Li
mit
Min
or
Inju
ries
Maj
or
Inju
ries
Fata
l In
jurie
sPr
imar
y C
ollis
ion
Fact
or
Dire
ctio
n of
Tra
vel
Rel
ativ
e Lo
catio
nC
ollis
ion
Type
Adj
acen
t or
Stre
et A
ddre
ssPa
rtie
s In
volv
edM
enlo
Par
k: E
l Cam
ino
Rea
l 5-y
ear C
ollis
ion
Rec
ords
(200
9-20
13)
12/2
2/20
0912
05E
L C
AM
INO
RE
AL/
ME
NLO
AV
350
00
2210
7 V
CS
/B E
CR
100
ft N
/O S
anta
Cru
zS
ides
wip
e- C
hang
ing
Lane
sM
enlo
2
Car
s
12/2
2/20
0916
45E
L C
AM
INO
RE
AL/
MID
DLE
AV
300
00
2235
0 C
VC
N/B
EC
RTu
rn L
ane
for W
/B
Mid
dle
Rea
rend
San
ta C
ruz
3 C
ars
12/2
8/20
0912
43C
RE
EK
DR
/EL
CA
MIN
O R
EA
L35
10
021
802(
a) V
CC
ar E
/B C
reek
to S
/B E
CR
Inte
rsec
tion
Car
vs
Bik
eB
ike
N/B
EC
RC
ar v
s B
ike
1/3/
2010
1530
EL
CA
MIN
O R
EA
L/C
RE
EK
DR
350
00
2235
0 V
CS
/B E
CR
Inte
rset
ion
Bro
adsi
de- C
hang
ing
Lane
sC
reek
Dr
2 C
ars
1/6/
2010
726
100
EL
CA
MIN
O R
EA
L35
10
021
804
VC
Car
Exi
ting
Driv
eway
Driv
eway
to 1
00 E
CR
Car
vs
Bik
eB
ike
S/B
EC
RC
ar v
s B
ike
1/14
/201
014
45E
L C
AM
INO
RE
AL/
RO
BLE
AV
352
00
2235
0 V
CN
/B E
CR
Inte
rsec
tion
Rea
rend
Rob
le2
Car
s
1/14
/201
014
46E
L C
AM
INO
RE
AL/
RO
BLE
AV
350
00
2180
6(a)
(1) V
CS
/B E
CR
Sto
p Li
ght a
t Loc
atio
nS
ides
wip
e-M
ovin
g fo
r Fi
re E
ngin
eR
oble
2 C
ars
1/15
/201
022
710
0 E
L C
AM
INO
RE
AL
350
00
2210
7 V
CN
/B E
CR
300
ft N
/O S
and
Hill
Sid
esw
ipe-
Hit
and
Run
San
d H
illC
ar a
nd C
emen
t Cur
b
1/15
/201
023
02R
AV
EN
SW
OO
D A
V/E
L C
AM
INO
R
EA
L30
00
022
107
VC
W/B
Rav
ensw
ood
150
ft E
/O E
CR
Sid
esw
ipe
EC
R2
Car
s
1/30
/201
092
0R
AV
EN
SW
OO
D A
V/E
L C
AM
INO
R
EA
L35
10
021
658a
VC
N/B
EC
R10
0 ft
S/O
R
aven
swoo
dR
eare
ndR
aven
swoo
d3
Car
s
2/19
/201
019
15E
L C
AM
INO
RE
AL/
OA
K G
RO
VE
A
V25
00
021
453a
W/B
Oak
Gro
veS
top
Ligh
t at L
ocat
ion
Bro
adsi
de- R
an R
ed
Ligh
tE
CR
2 C
ars
3/1/
2010
1631
RA
VE
NS
WO
OD
AV
/EL
CA
MIN
O
RE
AL
350
00
2235
0 C
VC
S/B
EC
RS
top
Ligh
t at L
ocat
ion
Rea
rend
Rav
ensw
ood
2 C
ars
3/10
/201
012
4112
85 E
L C
AM
INO
RE
AL
350
00
2210
7 cv
cS
/B E
CR
- Par
ked
Car
1285
EC
RS
ides
wip
e- H
it an
d R
un12
85 E
CR
2 C
ars
3/23
/201
016
58E
L C
AM
INO
RE
AL/
MID
DLE
AV
300
00
2210
7 C
VC
S/B
EC
R- P
arke
d C
ar42
5 E
CR
Sid
esw
ipe-
Hit
and
Run
425
EC
R2
Car
s
4/7/
2010
1719
VA
LPA
RA
ISO
AV
/EL
CA
MIN
O
RE
AL
303
00
2235
0 V
CE
/B V
alpa
rais
oS
top
Ligh
t at L
ocat
ion
Rea
rend
EC
R2
Car
s
4/12
/201
016
55E
L C
AM
INO
RE
AL/
RO
BLE
AV
353
00
2235
0 C
VC
S/B
EC
RS
top
Ligh
t at L
ocat
ion
Rea
rend
Rob
le3
Car
s
6/7/
2010
1735
1170
EL
CA
MIN
O R
EA
L35
00
021
755
CV
CN
/B E
CR
Turn
ing
into
Priv
ate
Driv
eway
Sid
esw
ipe
1170
EC
R2
Car
s
6/8/
2010
1000
444
EL
CA
MIN
O R
EA
L35
00
022
106
CV
CN
/B E
CR
Leav
ing
Priv
ate
Driv
eway
Sid
esw
ipe
444
EC
R2
Car
s
6/12
/201
012
46E
L C
AM
INO
RE
AL/
VA
LPA
RA
ISO
A
V35
20
022
350
CV
CN
/B E
CR
Sto
p Li
ght a
t Loc
atio
nR
eare
ndV
alpa
rais
o2
Car
s
6/16
/201
012
41E
L C
AM
INO
RE
AL/
VA
LPA
RA
ISO
A
V35
00
022
107
CV
C
E/B
Val
para
iso
Sto
p Li
ght a
t Loc
atio
nS
ides
wip
eE
CR
2 C
ars
and
Ligh
t Pol
e
El C
amin
o R
eal 5
-yea
r Col
lisio
n R
ecor
dsPa
ge 3

Dat
eTi
me
Loca
tion
Spee
d Li
mit
Min
or
Inju
ries
Maj
or
Inju
ries
Fata
l In
jurie
sPr
imar
y C
ollis
ion
Fact
or
Dire
ctio
n of
Tra
vel
Rel
ativ
e Lo
catio
nC
ollis
ion
Type
Adj
acen
t or
Stre
et A
ddre
ssPa
rtie
s In
volv
edM
enlo
Par
k: E
l Cam
ino
Rea
l 5-y
ear C
ollis
ion
Rec
ords
(200
9-20
13)
6/17
/201
018
28E
L C
AM
INO
RE
AL/
SA
NTA
CR
UZ
AV
350
00
2146
1(a)
CV
CN
/B E
CR
Inte
rset
ion
Bro
adsi
de- M
ade
Turn
Aga
inst
Sig
nS
anta
Cru
z2
Car
s
6/28
/201
010
15M
IDD
LE A
V/E
L C
AM
INO
RE
AL
250
00
2180
4 (a
) CV
CE
/B M
iddl
eS
afew
ay D
rivew
ay-
525
EC
R-M
iddl
eB
road
side
EC
R2
Car
s
7/1/
2010
1208
EL
CA
MIN
O R
EA
L/R
OB
LE A
V35
10
021
703
CV
CN
/B E
CR
150
ft N
/O R
oble
Rea
rend
Rob
le2
Car
s
7/1/
2010
1623
ME
NLO
AV
/EL
CA
MIN
O R
EA
L25
00
024
002(
a) C
VC
E/B
Men
lo15
0 ft
W/O
EC
RS
ides
wip
e- U
tility
D
oor O
pene
dE
CR
Car
and
Util
ity P
ole
7/6/
2010
1928
CA
MB
RID
GE
AV
/EL
CA
MIN
O
RE
AL
350
00
2235
0 V
CS
/B E
CR
200
ft N
/O C
ambr
idge
Rea
rend
- Chi
ld R
an
in R
oadw
ayC
ambr
idge
2 C
ars
7/16
/201
011
37E
L C
AM
INO
RE
AL/
HA
RV
AR
D A
V35
10
021
950(
a) C
VC
Car
E/B
Har
vard
to S
/B E
CR
Inte
rsec
tion
Car
vs
Bik
eB
ike
N/B
EC
RC
ar v
s B
ike
7/29
/201
051
7E
L C
AM
INO
RE
AL/
OA
K G
RO
VE
A
V35
10
021
453(
b) V
CC
ar E
/B O
ak G
rove
to S
/B E
CR
Inte
rsec
tion
Car
vs
Bik
eB
ike
S/B
EC
RC
ar v
s B
ike
8/2/
2010
851
MID
DLE
AV
/EL
CA
MIN
O R
EA
L35
00
022
107
CV
CC
ar S
/B E
CR
Tur
ning
into
495
E
CR
495
EC
RC
ar v
s B
ike
Bik
e S
/B E
CR
Car
vs
Bik
e- H
it an
d R
un
8/10
/201
011
2012
65 E
L C
AM
INO
RE
AL
352
00
2235
0 C
VC
S/B
EC
RS
top
Ligh
t at L
ocat
ion
Rea
rend
Oak
Gro
ve2
Car
s
8/20
/201
016
05S
AN
TA C
RU
Z A
V/E
L C
AM
INO
R
EA
L35
10
022
650
CV
CS
/B E
CR
Sto
p Li
ght a
t Loc
atio
nR
eare
ndS
anta
Cru
z2
Car
s
8/26
/201
015
16E
L C
AM
INO
RE
AL/
RO
BLE
AV
351
00
2235
0S
/B E
CR
200
ft N
/O R
oble
Rea
rend
Rob
le3
Car
s
8/27
/201
013
31E
L C
AM
INO
RE
AL/
MID
DLE
AV
350
00
2210
7 C
VC
Car
Exi
ting
Driv
eway
525
EC
RB
road
side
EC
R2
Car
s
9/2/
2010
1220
EL
CA
MIN
O
RE
AL/
RA
VE
NS
WO
OD
AV
351
00
2235
0S
/B E
CR
Sto
p Li
ght a
t Loc
atio
nR
eare
ndR
aven
swoo
d2
Car
s
9/10
/201
017
39C
AM
BR
IDG
E A
V/E
L C
AM
INO
R
EA
L35
00
022
350
CV
CS
/B E
CR
Sto
p Li
ght a
t Loc
atio
nR
eare
ndC
ambr
idge
2 C
ars
9/21
/201
015
44E
L C
AM
INO
RE
AL/
SA
NTA
CR
UZ
AV
351
00
2235
0 C
VC
S/B
EC
RS
top
Ligh
t at L
ocat
ion
Rea
rend
San
ta C
ruz
2 C
ars
10/1
/201
015
45E
L C
AM
INO
RE
AL/
OA
K G
RO
VE
A
V35
10
022
350
VC
S/B
EC
RS
top
Ligh
t at L
ocat
ion
Rea
rend
Oak
Gro
ve2
Car
s
10/2
9/20
1018
30E
L C
AM
INO
RE
AL/
RO
BLE
AV
350
00
2180
4(A
) CV
C
S/B
EC
RIn
ters
ectio
- Tur
ning
on
to E
CR
Bro
adsi
deR
oble
2 C
ars
11/4
/201
018
5311
5 E
L C
AM
INO
RE
AL
350
00
2235
0 C
VC
S/B
EC
R75
ft S
/O C
ambr
idge
Rea
rend
115
EC
R2
Car
s
11/2
1/20
1010
31E
L C
AM
INO
RE
AL/
MID
DLE
AV
351
00
2210
7 V
CS
/B E
CR
Driv
eway
525
EC
RR
eare
nd52
5 E
CR
2 C
ars
11/2
9/20
1011
58E
L C
AM
INO
RE
AL/
GLE
NW
OO
D
AV
350
00
2210
6 C
VC
N/B
EC
RS
top
Ligh
t at L
ocat
ion
Rea
rend
Gle
nwoo
d2
Car
s
El C
amin
o R
eal 5
-yea
r Col
lisio
n R
ecor
dsPa
ge 4

Dat
eTi
me
Loca
tion
Spee
d Li
mit
Min
or
Inju
ries
Maj
or
Inju
ries
Fata
l In
jurie
sPr
imar
y C
ollis
ion
Fact
or
Dire
ctio
n of
Tra
vel
Rel
ativ
e Lo
catio
nC
ollis
ion
Type
Adj
acen
t or
Stre
et A
ddre
ssPa
rtie
s In
volv
edM
enlo
Par
k: E
l Cam
ino
Rea
l 5-y
ear C
ollis
ion
Rec
ords
(200
9-20
13)
12/2
5/20
1020
08E
L C
AM
INO
RE
AL/
CA
MB
RID
GE
A
V35
00
022
107
cvc
S/B
EC
RIn
tere
sect
ion
Hea
d O
nC
ambr
idge
Car
and
Sig
n
12/2
5/20
1018
0010
29 E
L C
AM
INO
RE
AL
150
00
unkn
own
EC
RP
arke
d at
102
9 E
CR
Sid
esw
ipe-
Hit
and
Run
1029
EC
R2
Car
s
12/3
0/20
1071
4E
L C
AM
INO
RE
AL/
RO
BLE
AV
351
00
2235
0 C
VC
N/B
EC
RS
top
Ligh
t at L
ocat
ion
Rea
rend
Rob
le2
Car
s
1/9/
2011
1915
EL
CA
MIN
O R
EA
L/E
NC
INA
L A
V35
30
022
350
CV
CN
/B E
CR
Sto
p Li
ght a
t Loc
atio
nR
eare
ndE
ncin
al3
Car
s
1/20
/201
173
5E
L C
AM
INO
RE
AL/
CA
MB
RID
GE
A
V35
10
022
350
cvc
S/B
EC
RS
top
Ligh
t at L
ocat
ion
Rea
rend
Cam
brid
ge2
Car
s
1/29
/201
134
5R
OB
LE A
V/E
L C
AM
INO
RE
AL
350
00
2315
2 (a
)&(b
)S
/B E
CR
Sto
p Li
ght a
t Loc
atio
nR
eare
ndR
oble
2 C
ars
2/4/
2011
930
EL
CA
MIN
O R
EA
L/M
IDD
LE A
V5
10
021
202(
a) C
VC
Car
Exi
ting
Driv
eway
200
ft W
/O E
CR
Car
vs
Bik
eB
ike
E/B
Mid
dle
Car
vs
Bik
e
2/4/
2011
1444
EL
CA
MIN
O R
EA
L/S
AN
TA C
RU
Z A
V35
00
0O
THE
RS
/B E
CR
200
ft N
/O S
anta
Cru
zR
eare
ndS
anta
Cru
z2
Car
s
2/9/
2011
1150
EL
CA
MIN
O R
EA
L/S
AN
TA C
RU
Z A
V35
00
022
350
CV
CS
/B E
CR
Sto
p Li
ght a
t Loc
atio
nR
eare
ndS
anta
Cru
z2
Car
s
2/16
/201
181
6E
L C
AM
INO
RE
AL/
SA
NTA
CR
UZ
AV
351
00
2235
0 C
VC
S/B
EC
RS
top
Ligh
t at L
ocat
ion
Rea
rend
San
ta C
ruz
2 C
ars
3/11
/201
115
35E
L C
AM
INO
R
EA
L/R
AV
EN
SW
OO
D A
V35
00
022
107
cvc
N/B
EC
RS
top
Ligh
t at L
ocat
ion
Sid
esw
ipe-
Hit
and
Run
Rav
ensw
ood
2 C
ars
3/14
/201
115
1752
5 E
L C
AM
INO
RE
AL
352
00
2180
1(a)
CV
CN
/B E
CR
Driv
eway
525
EC
RB
road
side
525
EC
R2
Car
s
4/6/
2011
1145
EL
CA
MIN
O R
EA
L/M
IDD
LE A
V35
01
021
950
cvc
Car
W/B
Mid
dle
to N
/B E
CR
Cro
ssw
alk
Car
vs
Ped
Ped
N/B
EC
RC
ar v
s P
ed
4/7/
2011
1344
EL
CA
MIN
O
RE
AL/
RA
VE
NS
WO
OD
AV
351
00
2235
0 C
VC
N/B
EC
RS
top
Ligh
t at L
ocat
ion
Rea
rend
Rav
ensw
ood
2 C
ars
4/7/
2011
1759
EL
CA
MIN
O R
EA
L/C
AM
BR
IDG
E
AV
353
00
2235
0 C
VC
S/B
EC
RS
top
Ligh
t at L
ocat
ion
Rea
rend
Cam
brid
ge2
Car
s
5/10
/201
118
0740
1 E
L C
AM
INO
RE
AL
352
00
2210
7 C
VC
S/B
EC
R40
1 E
CR
Sid
esw
ipe-
Cha
ngin
g La
nes
401
EC
R2
Car
s
5/19
/201
112
00R
OB
LE A
V/E
L C
AM
INO
RE
AL
350
00
2210
7 C
VC
S/B
EC
RIn
ters
etio
n- M
akin
g U
Tu
rnB
road
side
Rob
leC
ar a
nd P
edes
trian
S
igna
l Pol
e
6/1/
2011
836
1137
EL
CA
MIN
O R
EA
L35
10
022
350
S/B
EC
R11
37 E
CR
Rea
rend
1137
EC
R2
Car
s6/
4/20
1111
31O
AK
GR
OV
E A
V/E
L C
AM
INO
R
EA
L30
10
022
350
S/B
EC
R20
0 ft
N/O
Oak
Gro
veR
eare
ndO
ak G
rove
2 C
ars
6/10
/201
111
05E
L C
AM
INO
RE
AL/
SA
NTA
CR
UZ
AV
350
00
2210
7 C
VC
S/B
EC
R- P
arke
d C
ar10
0 ft
N/O
San
ta C
ruz
Sid
esw
ipe-
Hit
and
Run
San
ta C
ruz
2 C
ars
6/15
/201
110
42E
L C
AM
INO
RE
AL/
MID
DLE
AV
300
00
2315
2(a)
CV
CE
/B M
iddl
e75
FT
W/O
EC
RH
ead
On
EC
R2
Car
s
El C
amin
o R
eal 5
-yea
r Col
lisio
n R
ecor
dsPa
ge 5

Dat
eTi
me
Loca
tion
Spee
d Li
mit
Min
or
Inju
ries
Maj
or
Inju
ries
Fata
l In
jurie
sPr
imar
y C
ollis
ion
Fact
or
Dire
ctio
n of
Tra
vel
Rel
ativ
e Lo
catio
nC
ollis
ion
Type
Adj
acen
t or
Stre
et A
ddre
ssPa
rtie
s In
volv
edM
enlo
Par
k: E
l Cam
ino
Rea
l 5-y
ear C
ollis
ion
Rec
ords
(200
9-20
13)
6/16
/201
112
02E
L C
AM
INO
RE
AL/
VA
LPA
RA
ISO
A
V35
10
022
350
CV
CS
/B E
CR
Sto
p Li
ght a
t Loc
atio
nR
eare
ndV
alpa
rais
o2
Car
s
6/23
/201
110
30E
L C
AM
INO
RE
AL/
SA
NTA
CR
UZ
AV
351
00
2251
7 C
VC
Car
Par
ked
S/B
EC
R-B
ike
Hit
Ope
n C
ar D
oor
100
ft S
/O O
ak G
rove
Car
vs
Bik
eB
ike
S/B
EC
RC
ar v
s B
ike
7/1/
2011
1455
RO
BLE
AV
/EL
CA
MIN
O R
EA
L35
10
022
350
CV
CN
/B E
CR
Sto
p Li
ght a
t Loc
atio
nR
eare
ndR
oble
3 C
ars
7/13
/201
119
2810
00 E
L C
AM
INO
RE
AL
300
00
2210
7 C
VC
E/B
Rav
ensw
ood
100
ft E
/O E
CR
Non
e10
00 E
CR
Car
and
Law
n of
B
usin
ess
7/20
/201
117
0014
36 E
L C
AM
INO
RE
AL
250
00
2210
7 C
VC
Priv
ate
Driv
eway
at 1
436
EC
RD
rivew
ay o
f 143
6 E
CR
Sid
esw
ipe
1436
EC
R2
Car
s
7/21
/201
118
05E
L C
AM
INO
RE
AL/
RO
BLE
AV
350
00
2145
3(a)
CV
CE
/B R
oble
Inte
rsec
tion
Sid
esw
ipe
EC
R2
Car
s
7/23
/201
123
0C
AM
BR
IDG
E A
V/E
L C
AM
INO
R
EA
L25
10
022
107
CV
CW
/B C
ambr
idge
100
ft W
/O E
CR
Sid
esw
ipe
EC
RC
ar a
nd L
ight
Pol
e
7/26
/201
182
4E
L C
AM
INO
RE
AL/
ALE
JAN
DR
A
AV
350
10
2195
0(b)
CV
CC
ar N
/B E
CR
Cro
ssw
alk
Car
vs
Ped
W/B
EC
R in
C
ross
wal
kC
ar v
s P
ed
7/26
/201
118
32P
AR
TRID
GE
AV
/EL
CA
MIN
O
RE
AL
350
00
2315
2(a)
CV
CS
/B E
CR
Inte
rsec
tion
Rea
rend
Par
tridg
e2
Car
s
8/5/
2011
1631
EL
CA
MIN
O R
EA
L/R
OB
LE A
V35
00
021
703
CV
CN
/B E
CR
200
ft S
/O R
oble
nR
eare
nd- H
it an
d R
unR
oble
2 C
ars
8/13
/201
118
12E
L C
AM
INO
RE
AL/
CA
MB
RID
GE
A
V35
10
022
107
CV
CN
/B E
CR
Inte
rsec
tion-
Mak
ing
U
Turn
Sid
esw
ipe
Cam
brid
geC
ar a
nd a
Tre
e
8/15
/201
118
45E
L C
AM
INO
RE
AL/
SA
NTA
CR
UZ
AV
351
00
2235
0 C
VC
S/B
EC
RS
top
Ligh
t at L
ocat
ion
Rea
rend
San
ta C
ruz
2 C
ars
8/21
/201
116
48E
L C
AM
INO
R
EA
L/R
AV
EN
SW
OO
D A
V35
00
021
658(
a) C
VC
S/B
EC
RS
top
Ligh
t at L
ocat
ion
Rea
rend
Rav
ensw
ood
2 C
ars
8/22
/201
112
42E
L C
AM
INO
RE
AL/
RO
BLE
AV
352
00
2235
0 C
VC
S/B
EC
RS
top
Ligh
t at L
ocat
ion
Rea
rend
Rob
le2
Car
s
8/24
/201
116
00E
L C
AM
INO
RE
AL/
VA
LPA
RA
ISO
A
V25
00
022
107
CV
CP
rivat
e D
rivew
ay a
t 127
9 E
CR
Turn
ing
S/B
EC
RS
ides
wip
eV
alpa
rais
o2
Car
s
8/24
/201
117
00E
L C
AM
INO
RE
AL/
GLE
NW
OO
D
AV
300
00
2210
7 C
VC
S/B
EC
R13
80 E
CR
Sid
esw
ipe-
Tur
ning
in
to D
rivew
ay13
80 E
CR
2 C
ars
8/29
/201
111
58E
L C
AM
INO
RE
AL/
RO
BLE
AV
350
00
2235
0 C
VC
N/B
EC
RS
top
Ligh
t at L
ocat
ion
Rea
rend
Rob
le3
Car
s
9/1/
2011
143
EL
CA
MIN
O R
EA
L/M
IDD
LE A
V35
00
022
107
CV
CN
/B E
CR
200
ft S
/O M
iddl
eH
ead
On
Mid
dle
Car
and
a T
ree
9/20
/201
114
27E
NC
INA
L A
V/E
L C
AM
INO
RE
AL
251
00
2180
4(a)
VC
W/B
Enc
inal
Driv
eway
155
0 E
ncin
alS
ides
wip
e- E
xitin
g D
rivew
ayE
ncin
al2
Car
s
9/20
/201
115
5452
5 E
L C
AM
INO
RE
AL
351
00
2235
0 C
VC
S/B
EC
RIn
ters
ectio
nR
eare
ndM
iddl
e2
Car
s9/
21/2
011
900
MID
DLE
AV
/EL
CA
MIN
O R
EA
L30
10
021
950
CV
CC
ar E
/B M
iddl
e to
S/B
EC
RC
ross
wal
kC
ar v
s P
edN
/B E
CR
in
Cro
ssw
alk
Car
vs
Ped
El C
amin
o R
eal 5
-yea
r Col
lisio
n R
ecor
dsPa
ge 6
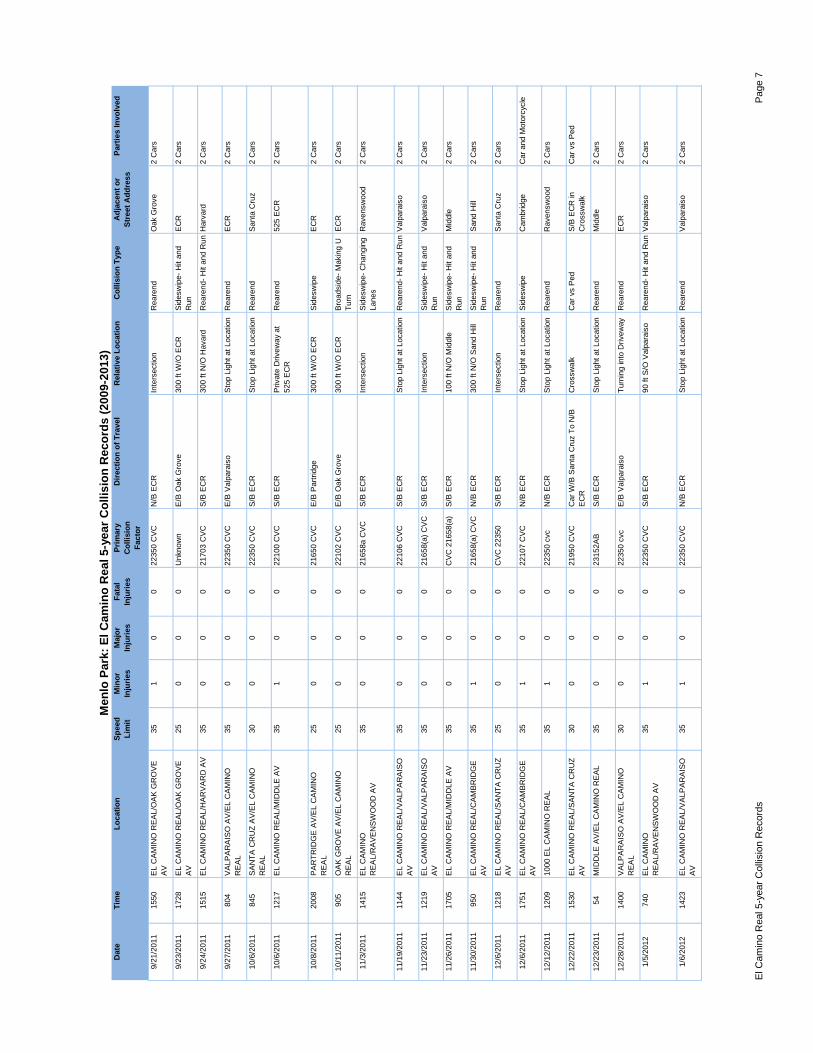
Dat
eTi
me
Loca
tion
Spee
d Li
mit
Min
or
Inju
ries
Maj
or
Inju
ries
Fata
l In
jurie
sPr
imar
y C
ollis
ion
Fact
or
Dire
ctio
n of
Tra
vel
Rel
ativ
e Lo
catio
nC
ollis
ion
Type
Adj
acen
t or
Stre
et A
ddre
ssPa
rtie
s In
volv
edM
enlo
Par
k: E
l Cam
ino
Rea
l 5-y
ear C
ollis
ion
Rec
ords
(200
9-20
13)
9/21
/201
115
50E
L C
AM
INO
RE
AL/
OA
K G
RO
VE
A
V35
10
022
350
CV
CN
/B E
CR
Inte
rsec
tion
Rea
rend
Oak
Gro
ve2
Car
s
9/23
/201
117
28E
L C
AM
INO
RE
AL/
OA
K G
RO
VE
A
V25
00
0U
nkno
wn
E/B
Oak
Gro
ve30
0 ft
W/O
EC
RS
ides
wip
e- H
it an
d R
unE
CR
2 C
ars
9/24
/201
115
15E
L C
AM
INO
RE
AL/
HA
RV
AR
D A
V35
00
021
703
CV
CS
/B E
CR
300
ft N
/O H
avar
dR
eare
nd- H
it an
d R
unH
arva
rd2
Car
s
9/27
/201
180
4V
ALP
AR
AIS
O A
V/E
L C
AM
INO
R
EA
L35
00
022
350
CV
CE
/B V
alpa
rais
oS
top
Ligh
t at L
ocat
ion
Rea
rend
EC
R2
Car
s
10/6
/201
184
5S
AN
TA C
RU
Z A
V/E
L C
AM
INO
R
EA
L30
00
022
350
CV
CS
/B E
CR
Sto
p Li
ght a
t Loc
atio
nR
eare
ndS
anta
Cru
z2
Car
s
10/6
/201
112
17E
L C
AM
INO
RE
AL/
MID
DLE
AV
351
00
2210
0 C
VC
S/B
EC
RP
rivat
e D
rivew
ay a
t 52
5 E
CR
Rea
rend
525
EC
R2
Car
s
10/8
/201
120
08P
AR
TRID
GE
AV
/EL
CA
MIN
O
RE
AL
250
00
2165
0 C
VC
E/B
Par
tridg
e30
0 ft
W/O
EC
RS
ides
wip
eE
CR
2
Car
s
10/1
1/20
1190
5O
AK
GR
OV
E A
V/E
L C
AM
INO
R
EA
L25
00
022
102
CV
CE
/B O
ak G
rove
300
ft W
/O E
CR
Bro
adsi
de- M
akin
g U
Tu
rnE
CR
2 C
ars
11/3
/201
114
15E
L C
AM
INO
R
EA
L/R
AV
EN
SW
OO
D A
V35
00
021
658a
CV
CS
/B E
CR
Inte
rsec
tion
Sid
esw
ipe-
Cha
ngin
g La
nes
Rav
ensw
ood
2 C
ars
11/1
9/20
1111
44E
L C
AM
INO
RE
AL/
VA
LPA
RA
ISO
A
V35
00
022
106
CV
CS
/B E
CR
Sto
p Li
ght a
t Loc
atio
nR
eare
nd- H
it an
d R
unV
alpa
rais
o2
Car
s
11/2
3/20
1112
19E
L C
AM
INO
RE
AL/
VA
LPA
RA
ISO
A
V35
00
021
658(
a) C
VC
S/B
EC
RIn
ters
ectio
nS
ides
wip
e- H
it an
d R
unV
alpa
rais
o2
Car
s
11/2
6/20
1117
05E
L C
AM
INO
RE
AL/
MID
DLE
AV
350
00
CV
C 2
1658
(a)
S/B
EC
R10
0 ft
N/O
Mid
dle
Sid
esw
ipe-
Hit
and
Run
Mid
dle
2 C
ars
11/3
0/20
1195
0E
L C
AM
INO
RE
AL/
CA
MB
RID
GE
A
V35
10
021
658(
a) C
VC
N/B
EC
R30
0 ft
N/O
San
d H
illS
ides
wip
e- H
it an
d R
unS
and
Hill
2 C
ars
12/6
/201
112
18E
L C
AM
INO
RE
AL/
SA
NTA
CR
UZ
AV
250
00
CV
C 2
2350
S/B
EC
RIn
ters
ectio
nR
eare
ndS
anta
Cru
z2
Car
s
12/6
/201
117
51E
L C
AM
INO
RE
AL/
CA
MB
RID
GE
A
V35
10
022
107
CV
CN
/B E
CR
Sto
p Li
ght a
t Loc
atio
nS
ides
wip
eC
ambr
idge
Car
and
Mot
orcy
cle
12/1
2/20
1112
0910
00 E
L C
AM
INO
RE
AL
351
00
2235
0 cv
cN
/B E
CR
Sto
p Li
ght a
t Loc
atio
nR
eare
ndR
aven
swoo
d2
Car
s
12/2
2/20
1115
30E
L C
AM
INO
RE
AL/
SA
NTA
CR
UZ
AV
300
00
2195
0 C
VC
Car
W/B
San
ta C
ruz
To N
/B
EC
RC
ross
wal
kC
ar v
s P
edS
/B E
CR
in
Cro
ssw
alk
Car
vs
Ped
12/2
3/20
1154
MID
DLE
AV
/EL
CA
MIN
O R
EA
L35
00
023
152A
BS
/B E
CR
Sto
p Li
ght a
t Loc
atio
nR
eare
ndM
iddl
e2
Car
s
12/2
8/20
1114
00V
ALP
AR
AIS
O A
V/E
L C
AM
INO
R
EA
L30
00
022
350
cvc
E/B
Val
para
iso
Turn
ing
into
Driv
eway
R
eare
ndE
CR
2 C
ars
1/5/
2012
740
EL
CA
MIN
O
RE
AL/
RA
VE
NS
WO
OD
AV
351
00
2235
0 C
VC
S/B
EC
R90
ft S
/O V
alpa
rais
oR
eare
nd- H
it an
d R
unV
alpa
rais
o2
Car
s
1/6/
2012
1423
EL
CA
MIN
O R
EA
L/V
ALP
AR
AIS
O
AV
351
00
2235
0 C
VC
N/B
EC
RS
top
Ligh
t at L
ocat
ion
Rea
rend
Val
para
iso
2 C
ars
El C
amin
o R
eal 5
-yea
r Col
lisio
n R
ecor
dsPa
ge 7

Dat
eTi
me
Loca
tion
Spee
d Li
mit
Min
or
Inju
ries
Maj
or
Inju
ries
Fata
l In
jurie
sPr
imar
y C
ollis
ion
Fact
or
Dire
ctio
n of
Tra
vel
Rel
ativ
e Lo
catio
nC
ollis
ion
Type
Adj
acen
t or
Stre
et A
ddre
ssPa
rtie
s In
volv
edM
enlo
Par
k: E
l Cam
ino
Rea
l 5-y
ear C
ollis
ion
Rec
ords
(200
9-20
13)
1/20
/201
214
43R
OB
LE A
V/E
L C
AM
INO
RE
AL
352
00
2145
3(a)
CV
CW
/B R
oble
Inte
rsec
tion
Rea
rend
that
B
road
side
d C
arE
CR
3 C
ars
1/20
/201
219
54E
L C
AM
INO
RE
AL/
EN
CIN
AL
AV
351
00
2145
3(a)
CV
CN
/B E
CR
Inte
rsec
tion
Bro
adsi
de- R
an R
ed
Ligh
tE
ncin
al2
Car
s
2/1/
2012
1645
EL
CA
MIN
O R
EA
L/E
NC
INA
L A
V25
10
022
350
CV
CN
/B E
CR
Inte
rsec
tion-
Ped
C
ross
ing
Rea
rend
Enc
inal
2 C
ars
2/2/
2012
1404
EL
CA
MIN
O R
EA
L/LI
VE
OA
K A
V35
10
021
658a
cvc
N/B
EC
RIn
ters
ectio
n- T
urn
Lane
Rea
rend
Live
Oak
3 C
ars
2/14
/201
212
30E
L C
AM
INO
RE
AL/
CA
MB
RID
GE
A
V35
10
022
107
CV
CC
ar S
/B E
CR
to W
/B
Cam
brid
geIn
ters
ectio
nC
ar v
s B
ike
Bik
e S
/B E
CR
Car
vs
Bik
e
2/23
/201
221
3010
0 E
L C
AM
INO
RE
AL
350
00
2210
6 cv
cN
/B E
CR
100
EC
RH
ead
On
100
EC
RC
ar a
nd a
Tre
e2/
28/2
012
2012
1200
EL
CA
MIN
O R
EA
L35
00
022
350
CV
CN
/B E
CR
Leav
ing
Driv
eway
of
1200
EC
RR
eare
nd12
00 E
CR
2 C
ars
3/6/
2012
1405
EL
CA
MIN
O R
EA
L/R
OB
LE A
V35
00
0U
NK
NO
WN
N/B
EC
R50
ft N
/O R
oble
Sid
esw
ipe-
Cha
ngin
g La
nes
Rob
le2
Car
s
3/9/
2012
1750
EL
CA
MIN
O
RE
AL/
RA
VE
NS
WO
OD
AV
350
00
2210
7 C
VC
S/B
EC
RS
top
Ligh
t at L
ocat
ion
Sid
esw
ipe-
Hit
and
Run
Rav
ensw
ood
2 C
ars
3/13
/201
217
17R
AV
EN
SW
OO
D A
V/E
L C
AM
INO
R
EA
L35
00
022
107
CV
CW
/B R
aven
swoo
dIn
ters
ectio
nS
ides
wip
e- H
it an
d R
unE
CR
2 C
ars
3/21
/201
217
29E
L C
AM
INO
RE
AL/
ME
NLO
AV
351
00
2235
0 C
VC
S/B
EC
RS
top
Ligh
t at L
ocat
ion
Rea
rend
- Hit
and
Run
Men
lo
2 C
ars
3/23
/201
215
4244
4 E
L C
AM
INO
RE
AL
351
00
2235
0 C
VC
N/B
EC
RIn
ters
etio
nR
eare
ndP
artri
dge
3 C
ars
3/23
/201
216
35E
L C
AM
INO
RE
AL/
CR
EE
K D
R30
10
022
350
CV
CS
/B E
CR
Sto
p Li
ght a
t Loc
atio
nR
eare
ndC
reek
Dr
2 C
ars
3/27
/201
213
56R
OB
LE A
V/E
L C
AM
INO
RE
AL
350
00
2145
3(a)
CV
CN
/B E
CR
Inte
rsec
tion
Bro
adsi
de- R
an R
ed
Ligh
tR
oble
2 C
ars
3/28
/201
220
40E
L C
AM
INO
R
EA
L/R
AV
EN
SW
OO
D A
V35
10
022
530
CV
CN
/B E
CR
Sto
p Li
ght a
t Loc
atio
nR
eare
nd- H
it an
d R
unR
aven
swoo
d2
Car
s
4/9/
2012
1424
525
EL
CA
MIN
O R
EA
L35
00
022
107
CV
CS
/B E
CR
turn
ing
into
Driv
eway
52
5 E
CR
Driv
eway
of 5
25 E
CR
Rea
rend
525
EC
R2
Car
s
4/19
/201
20
1295
EL
CA
MIN
O R
EA
L35
00
022
350
CV
CS
/B E
CR
Par
king
at 1
295
EC
RS
ides
wip
e- H
it an
d R
un12
95 E
CR
Car
and
Lig
ht P
ole
4/20
/201
216
00M
EN
LO A
V/E
L C
AM
INO
RE
AL
251
00
2235
0 C
VC
E/B
Men
loS
top
Ligh
t at L
ocat
ion
Rea
rend
EC
R2
Car
s
4/20
/201
217
43E
L C
AM
INO
RE
AL/
STO
NE
PIN
E
LN35
00
1O
THE
RN
/B E
CR
Inte
rsec
tion-
Sho
ulde
rS
ides
wip
e- M
edic
al
Issu
eS
tone
pine
2 C
ars
5/11
/201
218
2540
1 E
L C
AM
INO
RE
AL
351
00
CV
C 2
2350
N/B
EC
RS
top
Ligh
t at L
ocat
ion
Rea
rend
401
EC
R2
Car
s an
d a
Tree
5/22
/201
216
30E
L C
AM
INO
RE
AL/
OA
K G
RO
VE
A
V30
00
022
350
VC
S/B
EC
RS
top
Ligh
t at L
ocat
ion
Rea
rend
Oak
Gro
ve2
Car
s
El C
amin
o R
eal 5
-yea
r Col
lisio
n R
ecor
dsPa
ge 8

Dat
eTi
me
Loca
tion
Spee
d Li
mit
Min
or
Inju
ries
Maj
or
Inju
ries
Fata
l In
jurie
sPr
imar
y C
ollis
ion
Fact
or
Dire
ctio
n of
Tra
vel
Rel
ativ
e Lo
catio
nC
ollis
ion
Type
Adj
acen
t or
Stre
et A
ddre
ssPa
rtie
s In
volv
edM
enlo
Par
k: E
l Cam
ino
Rea
l 5-y
ear C
ollis
ion
Rec
ords
(200
9-20
13)
5/25
/201
215
1512
00 E
L C
AM
INO
RE
AL
351
00
11.5
6.12
0 C
OB
ike
N/B
EC
R-o
n S
idew
alk
Driv
eway
to 1
200
EC
RB
ike
vs C
arC
ar N
/B E
CR
into
D
rivew
ayB
ike
vs C
ar
6/3/
2012
0E
L C
AM
INO
RE
AL/
OA
K G
RO
VE
A
V35
10
022
350
cvc
S/B
EC
R20
0 ft
N/O
Oak
Gro
veR
eare
ndO
ak G
rove
2 C
ars
6/8/
2012
1421
OA
K G
RO
VE
AV
/EL
CA
MIN
O
RE
AL
350
00
2210
7 C
VC
E/B
Oak
Gro
ve T
urni
ng o
nto
EC
RIn
ters
ectio
nS
ides
wip
eE
CR
Car
and
Lig
ht P
ole
6/13
/201
221
3050
0 E
L C
AM
INO
RE
AL
350
00
2210
7 C
VC
S/B
EC
R in
to D
rivew
ay a
t 525
E
CR
Driv
eway
of 5
25 E
CR
Sid
esw
ipe
525
EC
RC
ar a
nd L
ight
Pol
e
6/14
/201
211
56E
L C
AM
INO
RE
AL/
GLE
NW
OO
D
AV
350
00
2235
0 cv
cS
/B E
CR
Sto
p Li
ght a
t Loc
atio
nR
eare
ndG
lenw
ood
2 C
ars
6/18
/201
212
28E
L C
AM
INO
RE
AL/
VA
LPA
RA
ISO
A
V35
00
022
350
cvc
S/B
EC
RS
top
Ligh
t at L
ocat
ion
Rea
rend
Val
para
iso
3 C
ars
6/20
/201
211
36E
L C
AM
INO
RE
AL/
SA
NTA
CR
UZ
AV
350
00
2235
0 C
VC
S/B
EC
RS
top
Ligh
t at L
ocat
ion
Rea
rend
San
ta C
ruz
2 C
ars
6/28
/201
214
01E
L C
AM
INO
RE
AL/
CO
LLE
GE
AV
351
00
2235
0 C
VC
S/B
EC
RIn
ters
ectio
n-
Cro
ssw
alk
Rea
rend
Col
lege
2 C
ars
7/2/
2012
1032
400
EL
CA
MIN
O R
EA
L35
20
022
107
cvc
S/B
EC
T40
0 E
CR
-Par
ked
on
Roa
dsid
eS
ides
wip
e40
0 E
CR
2 C
ars
7/3/
2012
1507
1259
EL
CA
MIN
O R
EA
L35
40
022
350
cvc
N/B
EC
R20
0 ft
N/O
Oak
Gro
veR
eare
ndO
ak G
rove
2 C
ars
7/3/
2012
1554
EL
CA
MIN
O R
EA
L/O
AK
GR
OV
E
AV
301
00
2165
0.1
CV
CC
ar W
/B O
ak G
rove
to N
/B
EC
RIn
ters
ectio
nC
ar v
s B
ike
Bik
e S
/B E
CR
Car
vs
Bik
e
7/6/
2012
1034
GLE
NW
OO
D A
V/E
L C
AM
INO
R
EA
L25
00
022
350
CV
CS
/B E
CR
300
ft N
/O G
lenw
ood
Rea
rend
Gle
nwoo
d3
Car
s
7/13
/201
213
47E
L C
AM
INO
RE
AL/
MID
DLE
AV
350
00
2235
0 C
VC
S/B
EC
R15
0 ft
S/O
Mid
dle
Rea
rend
Mid
dle
2 C
ars
7/14
/201
222
35E
L C
AM
INO
RE
AL/
OA
K G
RO
VE
A
V0
00
2210
7 C
VC
N/B
EC
R20
0 ft
N/O
Oak
Gro
veS
ides
wip
e- H
it an
d R
unO
ak G
rove
Car
and
a T
ree
7/19
/201
291
6E
L C
AM
INO
R
EA
L/R
AV
EN
SW
OO
D A
V30
00
022
107
CV
CN
/B E
CR
Inte
rsec
tion
Sid
esw
ipe
Rav
ensw
ood
Car
and
Lig
ht P
ole
7/23
/201
290
0E
L C
AM
INO
RE
AL/
MID
DLE
AV
350
00
2235
0 C
VC
S/B
EC
R30
0 ft
N/O
Mid
dle
Sid
esw
ipe-
Hit
and
Run
Mid
dle
2 C
ars
7/24
/201
214
30E
L C
AM
INO
RE
AL/
OA
K G
RO
VE
A
V35
20
022
350
CV
CS
/B E
CR
Sto
p Li
ght a
t Loc
atio
nR
eare
ndO
ak G
rove
2 C
ars
7/24
/201
218
05M
IDD
LE A
V/E
L C
AM
INO
RE
AL
300
00
2210
0(3)
(b) V
CW
/B M
iddl
eD
rivew
ay fo
r 495
EC
R
off M
iddl
eR
eare
ndE
CR
2 C
ars
7/26
/201
217
05E
L C
AM
INO
RE
AL/
SA
NTA
CR
UZ
AV
350
00
2235
0 V
CS
/B E
CR
Sto
p Li
ght a
t Loc
atio
nR
eare
ndS
anta
Cru
z3
Car
s
7/28
/201
219
10M
EN
LO A
V/E
L C
AM
INO
RE
AL
351
00
2145
3(a)
CV
CE
/B M
enlo
Inte
rsec
tion
Bro
adsi
de- R
an R
ed
Ligh
tE
CR
2 C
ars
8/1/
2012
1745
VA
LPA
RA
ISO
AV
/EL
CA
MIN
O
RE
AL
350
00
2235
0 C
VC
N/B
EC
RS
top
Ligh
t at L
ocat
ion
Rea
rend
Val
para
iso
2 C
ars
8/1/
2012
1745
VA
LPA
RA
ISO
AV
/EL
CA
MIN
O
RE
AL
350
00
2235
0 C
VC
N/B
EC
RS
top
Ligh
t at L
ocat
ion
Rea
rend
Val
para
iso
2 C
ars
El C
amin
o R
eal 5
-yea
r Col
lisio
n R
ecor
dsPa
ge 9

Dat
eTi
me
Loca
tion
Spee
d Li
mit
Min
or
Inju
ries
Maj
or
Inju
ries
Fata
l In
jurie
sPr
imar
y C
ollis
ion
Fact
or
Dire
ctio
n of
Tra
vel
Rel
ativ
e Lo
catio
nC
ollis
ion
Type
Adj
acen
t or
Stre
et A
ddre
ssPa
rtie
s In
volv
edM
enlo
Par
k: E
l Cam
ino
Rea
l 5-y
ear C
ollis
ion
Rec
ords
(200
9-20
13)
8/2/
2012
1729
EL
CA
MIN
O R
EA
L/R
OB
LE A
V35
00
021
453(
a) C
VC
N/B
EC
RIn
ters
ectio
nB
road
side
- Ran
Red
Li
ght/H
it an
d R
unR
oble
2 C
ars
8/3/
2012
1726
MID
DLE
AV
/EL
CA
MIN
O R
EA
L35
00
021
801
(a) C
VC
N/B
EC
RD
rivew
ay fo
r 525
EC
RB
road
side
525
EC
R2
Car
s
8/13
/201
214
31E
L C
AM
INO
RE
AL/
EN
CIN
AL
AV
352
00
2145
3(c)
VC
N/B
EC
RS
top
Ligh
t at L
ocat
ion
Bro
adsi
de- R
an R
ed
Ligh
tE
ncin
al2
Car
s
8/13
/201
216
00E
L C
AM
INO
RE
AL/
SA
NTA
CR
UZ
AV
350
00
2235
0 C
VC
N/B
EC
RS
top
Ligh
t at L
ocat
ion
Rea
rend
San
ta C
ruz
2 C
ars
8/16
/201
210
42E
L C
AM
INO
RE
AL/
CA
MB
RID
GE
A
V35
00
022
107
CV
CS
/B E
CR
Inte
rsec
tion
Hea
d O
n24
3 E
CR
Car
and
a B
uild
ing
and
a Tr
ee
8/22
/201
20
EL
CA
MIN
O R
EA
L/G
LEN
WO
OD
A
V35
00
022
350
CV
CN
/B E
CR
Sto
p Li
ght a
t Loc
atio
nR
eare
ndG
lenw
ood
2 C
ars
8/22
/201
213
14O
AK
GR
OV
E A
V/E
L C
AM
INO
R
EA
L35
00
022
107
CV
CS
/B E
CR
100
ft N
/O O
ak G
rove
Rea
rend
Oak
Gro
ve2
Car
s
8/31
/201
274
5E
L C
AM
INO
RE
AL/
OA
K G
RO
VE
A
V35
10
022
350
CV
CS
/B E
CR
Sto
p Li
ght a
t Loc
atio
nR
eare
nd- H
it an
d R
unO
ak G
rove
2 C
ars
9/2/
2012
1218
EL
CA
MIN
O R
EA
L/V
ALP
AR
AIS
O
AV
352
00
2235
0 C
VC
N/B
EC
RS
top
Ligh
t at L
ocat
ion
Rea
rend
Val
para
iso
2 C
ars
9/2/
2012
1417
1540
EL
CA
MIN
O R
EA
L35
10
022
350
CV
CN
/B E
CR
1540
EC
RR
eare
nd15
40 E
CR
2 C
ars
9/4/
2012
1130
SA
NTA
CR
UZ
AV
/EL
CA
MIN
O
RE
AL
351
00
2195
5 C
VC
Car
N/B
EC
RC
ross
wal
kC
ar v
s P
edW
/B E
CR
in
Cro
ssw
alk
Car
vs
Ped
9/13
/201
210
3630
1 E
L C
AM
INO
RE
AL
250
00
2210
7 C
VC
E/B
Par
tridg
eD
rivew
ay 2
75 E
CR
off
Par
tridg
eB
road
side
- Par
ked
Car
EC
R2
Car
s
9/13
/201
213
2750
0 E
L C
AM
INO
RE
AL
350
00
2210
7 C
VC
N/B
EC
RD
rivew
ay fo
r 525
EC
RB
road
side
525
EC
R2
Car
s
9/28
/201
221
13E
L C
AM
INO
R
EA
L/R
AV
EN
SW
OO
D A
V35
00
022
350
CV
CN
/B E
CR
Sto
p Li
ght a
t Loc
atio
nR
eare
ndR
aven
swoo
d2
Car
s
9/30
/201
22
EL
CA
MIN
O R
EA
L/C
RE
EK
DR
351
10
2195
4(a)
CV
CC
ar S
/B E
CR
Run
ning
acr
oss
EC
RC
ar v
s P
edR
unni
ng E
/B
acro
ss E
CR
Car
vs
Ped
- Hit
and
Run
10/4
/201
214
33E
L C
AM
INO
RE
AL/
CO
LLE
GE
AV
350
00
2251
7 C
VC
S/B
EC
RP
arke
d C
ar a
t 300
E
CR
Sid
esw
ipe-
Ope
n C
ar
Doo
r30
0 E
CR
2 C
ars
10/5
/201
212
4470
0 E
L C
AM
INO
RE
AL
351
00
2253
0 C
VC
N/B
EC
R70
0 E
CR
Rea
rend
700
EC
R2
Car
s10
/6/2
012
1602
CA
MB
RID
GE
AV
/EL
CA
MIN
O
RE
AL
350
00
2210
7 C
VC
E/B
Cam
brid
geIn
ters
ectio
nH
ead
On
EC
RC
ar a
nd P
edes
trian
S
ign
10/8
/201
210
1E
L C
AM
INO
RE
AL/
SA
NTA
CR
UZ
AV
351
00
2315
3 (a
) (b
)CV
CN
/B E
CR
Sto
p Li
ght a
t Loc
atio
nR
eare
ndS
anta
Cru
z2
Car
s
10/1
0/20
1265
0E
L C
AM
INO
RE
AL/
LIV
E O
AK
AV
351
00
2180
4 C
VC
S/B
EC
RIn
ters
ectio
nS
ides
wip
eLi
ve O
ak2
Car
s
10/1
4/20
1240
4E
L C
AM
INO
RE
AL/
EN
CIN
AL
AV
451
00
2235
0 C
VC
S/B
EC
RS
top
Ligh
t at L
ocat
ion
Rea
rend
Enc
inal
2 C
ars
El C
amin
o R
eal 5
-yea
r Col
lisio
n R
ecor
dsPa
ge 1
0

Dat
eTi
me
Loca
tion
Spee
d Li
mit
Min
or
Inju
ries
Maj
or
Inju
ries
Fata
l In
jurie
sPr
imar
y C
ollis
ion
Fact
or
Dire
ctio
n of
Tra
vel
Rel
ativ
e Lo
catio
nC
ollis
ion
Type
Adj
acen
t or
Stre
et A
ddre
ssPa
rtie
s In
volv
edM
enlo
Par
k: E
l Cam
ino
Rea
l 5-y
ear C
ollis
ion
Rec
ords
(200
9-20
13)
10/1
7/20
1291
5E
L C
AM
INO
RE
AL/
GLE
NW
OO
D
AV
300
00
2210
7 C
VC
S/B
EC
RIn
ters
ectio
nS
ides
wip
e-H
it an
d R
unG
lenw
ood
2 C
ars
10/1
9/20
1211
00E
L C
AM
INO
RE
AL/
SA
NTA
CR
UZ
AV
351
00
2235
0 C
VC
S/B
EC
RS
top
Ligh
t at L
ocat
ion
Rea
rend
- Hit
and
Run
San
ta C
ruz
2 C
ars
10/1
9/20
1214
0012
00 E
L C
AM
INO
RE
AL
350
00
2210
7 C
VC
N/B
EC
R
1200
EC
RS
ides
wip
e12
00 E
CR
2 C
ars
11/2
/201
218
23E
L C
AM
INO
RE
AL/
SA
NTA
CR
UZ
AV
351
00
2235
0 C
VC
Car
N/B
EC
R-R
eare
nded
Bik
e50
ft S
/O S
anta
Cru
zC
ar v
s B
ike
Bik
e N
/B E
CR
Car
vs
Bik
e
11/5
/201
220
2210
0 E
L C
AM
INO
RE
AL
350
10
2315
2 C
VC
Bik
e N
/B E
CR
100
EC
RB
ike
vs U
nkno
wn
Non
eB
ike
vs U
nkno
wn
11/5
/201
216
30E
NC
INA
L A
V/E
L C
AM
INO
RE
AL
351
00
2235
0 C
VC
Bik
e W
/B M
enlo
300
ft W
/O E
CR
Sol
o B
ike,
Gra
vel
Non
eS
olo
Bik
e, G
rave
l
11/6
/201
260
0R
AV
EN
SW
OO
D A
V/E
L C
AM
INO
R
EA
L25
10
022
350
CV
CW
/B M
enlo
10
0 ft
E/O
EC
RS
olo
Bik
e, G
rave
lN
one
Sol
o B
ike,
Gra
vel
11/6
/201
214
37E
L C
AM
INO
RE
AL/
MID
DLE
AV
350
00
2165
8(a)
CV
CS
/B E
CR
Driv
eway
for 4
95 E
CR
- P
arke
d C
arS
ides
wip
e49
5 E
CR
2 C
ars
11/6
/201
216
50E
L C
AM
INO
RE
AL/
SA
NTA
CR
UZ
AV
350
00
2235
0 C
VC
N/B
EC
RIn
ters
ectio
nR
eare
ndS
anta
Cru
z5
Car
s
11/8
/201
211
1652
5 E
L C
AM
INO
RE
AL
151
00
2210
6 C
VC
S/B
EC
RD
rivew
ay to
525
EC
RR
eare
nd52
5 E
CR
2 C
ars
11/1
7/20
1219
40E
L C
AM
INO
RE
AL/
CA
MB
RID
GE
A
V35
00
022
107
VC
S/B
EC
R30
0 ft
S/O
Mid
dle
Sid
esw
ipe-
Hit
and
Run
Mid
dle
2 C
ars
11/2
6/20
1221
25E
L C
AM
INO
RE
AL/
ME
NLO
AV
351
00
2145
3 C
VC
N/B
EC
R50
ft N
/O M
enlo
Bro
adsi
deM
enlo
2
Car
s
12/1
/201
275
0E
L C
AM
INO
RE
AL/
GLE
NW
OO
D
AV
251
00
2145
3(a)
CV
CW
/B G
lenw
ood
Sto
p Li
ght a
t Loc
atio
nR
eare
ndE
CR
2 C
ars
12/6
/201
218
3650
0 E
L C
AM
INO
RE
AL
351
00
2120
2(a)
CV
CC
ar N
/B E
CR
Tur
n La
neD
rivew
ay to
525
EC
RC
ar v
s B
ike
Bik
e N
/B E
CR
Car
vs
Bik
e
12/7
/201
214
46E
L C
AM
INO
RE
AL/
CA
MB
RID
GE
A
V35
00
021
658(
a) V
CN
/B E
CR
250
ft S
/O C
ambr
idge
Sid
esw
ipe
Cam
brid
ge2
Car
s
12/1
0/20
1281
5O
AK
GR
OV
E A
V/E
L C
AM
INO
R
EA
L25
00
022
107
CV
CW
/B O
ak G
rove
100
ft W
/O E
CR
Sid
esw
ipe-
Med
ical
Is
sue
EC
RC
ar a
nd T
elep
hone
P
ole
12/2
7/20
1282
5E
L C
AM
INO
RE
AL/
MID
DLE
AV
350
00
2210
7 C
VC
S/B
EC
R20
0 ft
S/O
Mid
dle
Sid
esw
ipe
Mid
dle
Car
and
2 P
arke
d C
ars
12/2
7/20
1223
24E
L C
AM
INO
RE
AL/
STO
NE
PIN
E
LN35
10
023
152(
a) C
VC
N/B
EC
R15
0 ft
N/O
Sto
nepi
neS
ides
wip
e- P
arke
d C
arS
tone
pine
2 C
ars
1/7/
2013
1757
EL
CA
MIN
O R
EA
L/C
OLL
EG
E A
V35
00
022
350
CV
CN
/B E
CR
Inte
rsec
tion
Rea
rend
- H
it an
d R
unC
olle
ge2
Car
s
1/15
/201
371
0E
L C
AM
INO
RE
AL/
CA
MB
RID
GE
A
V35
00
022
100(
A) C
VC
S/B
EC
RIn
ters
ectio
nS
ides
wip
eP
artri
dge
2 C
ars
1/21
/201
317
45E
L C
AM
INO
R
EA
L/R
AV
EN
SW
OO
D A
V35
10
022
350
CV
CS
/B E
CR
100
ft N
/O
Rav
ensw
ood
Rea
rend
Rav
ensw
ood
2 C
ars
and
Cen
ter
Med
ian
El C
amin
o R
eal 5
-yea
r Col
lisio
n R
ecor
dsPa
ge 1
1

Dat
eTi
me
Loca
tion
Spee
d Li
mit
Min
or
Inju
ries
Maj
or
Inju
ries
Fata
l In
jurie
sPr
imar
y C
ollis
ion
Fact
or
Dire
ctio
n of
Tra
vel
Rel
ativ
e Lo
catio
nC
ollis
ion
Type
Adj
acen
t or
Stre
et A
ddre
ssPa
rtie
s In
volv
edM
enlo
Par
k: E
l Cam
ino
Rea
l 5-y
ear C
ollis
ion
Rec
ords
(200
9-20
13)
1/24
/201
310
52E
L C
AM
INO
R
EA
L/R
AV
EN
SW
OO
D A
V35
10
021
703
CV
CS
/B E
CR
Sto
p Li
ght a
t Loc
atio
nR
eare
ndR
aven
swoo
d2
Car
s
1/24
/201
318
25E
L C
AM
INO
RE
AL/
CO
LLE
GE
AV
320
00
2210
6 C
VC
S/B
EC
R30
0 ft
N/O
Col
lege
Sid
esw
ipe-
Hit
and
Run
Col
lege
2 C
ars
1/28
/201
310
21E
L C
AM
INO
RE
AL/
MID
DLE
AV
352
00
2235
0 C
VC
N/B
EC
RS
top
Ligh
t at L
ocat
ion
Rea
rend
Mid
dle
4 C
ars
2/25
/201
320
56R
OB
LE A
V/E
L C
AM
INO
RE
AL
350
00
xN
/B E
CR
Inte
rsec
tion
Bro
adsi
deR
oble
2 C
ars
3/2/
2013
1443
EL
CA
MIN
O R
EA
L/A
LEJA
ND
RA
A
V35
20
022
350
CV
CN
/B E
CR
Inte
rsec
tion-
C
ross
wal
kR
eare
ndA
leja
ndra
2 C
ars
3/13
/201
313
30E
L C
AM
INO
RE
AL/
OA
K G
RO
VE
A
V30
00
021
658(
a) C
VC
S/B
EC
RIn
ters
ectio
nS
ides
wip
e- C
hang
ing
Lane
sO
ak G
rove
2 C
ars
3/20
/201
314
00E
L C
AM
INO
RE
AL/
OA
K G
RO
VE
A
V35
00
021
703
CV
CS
/B E
CR
Inte
rsec
tion
Rea
rend
Oak
Gro
ve2
Car
s
4/15
/201
380
0E
L C
AM
INO
RE
AL/
VA
LPA
RA
ISO
A
V25
00
021
658(
A) C
VC
N/B
EC
R20
0 ft
S/O
Val
para
iso
Sid
esw
ipe-
Hit
and
Run
Val
para
iso
2 C
ars
4/15
/201
315
50O
AK
GR
OV
E A
V/E
L C
AM
INO
R
EA
L25
00
021
658(
a) V
CW
/B O
ak G
rove
50 ft
E/O
EC
RS
ides
wip
e- C
hang
ing
Lane
sO
ak G
rove
2 C
ars
4/20
/201
322
01C
AM
BR
IDG
E A
V/E
L C
AM
INO
R
EA
L30
00
021
658(
A) C
VC
N/B
EC
RIn
ters
ectio
nS
ides
wip
e- H
it an
d R
unC
ambr
idge
2 C
ars
5/20
/201
310
18M
IDD
LE A
V/E
L C
AM
INO
RE
AL
252
00
2175
5 C
VC
E/B
Mid
dle
Driv
eway
495
EC
R-
Mid
dle
Sid
eB
road
side
EC
R2
Car
s
5/21
/201
319
03E
L C
AM
INO
RE
AL/
CA
MB
RID
GE
A
V35
10
0O
THE
R T
HA
N
DR
IVE
RB
ike
N/B
EC
R10
0 ft
N/O
Cam
brid
geS
olo
Bik
e, B
ag
Cau
ght
Non
eS
olo
Bik
e, B
ag
Cau
ght
5/26
/201
315
33O
AK
GR
OV
E A
V/E
L C
AM
INO
R
EA
L40
00
0ot
her
S/B
EC
RS
top
Ligh
t at L
ocat
ion
Rea
rend
- Med
ical
Is
sue
Oak
Gro
ve2
Car
s
5/31
/201
315
45E
L C
AM
INO
RE
AL/
RO
BLE
AV
350
00
2235
0 C
VC
N/B
EC
RS
top
Ligh
t at L
ocat
ion
Rea
rend
Rob
le2
Car
s
6/7/
2013
012
61 E
L C
AM
INO
RE
AL
301
00
2235
0 C
VC
S/B
EC
R12
61 E
CR
Rea
rend
12
61 E
CR
2 C
ars
6/12
/201
317
4712
46 E
L C
AM
INO
RE
AL
401
00
2235
0 C
VC
N/B
EC
R12
46 E
CR
Rea
rend
1246
EC
R3
Car
s6/
13/2
013
1506
PA
RTR
IDG
E A
V/E
L C
AM
INO
R
EA
L35
00
021
703
CV
CN
/B E
CR
Inte
rsec
tion
Rea
rend
Par
tridg
e2
Car
s
6/20
/201
317
47E
L C
AM
INO
RE
AL/
OA
K G
RO
VE
A
V40
10
022
350
CV
CN
/B E
CR
Sto
p Li
ght a
t Loc
atio
nR
eare
ndO
ak G
rove
2 C
ars
6/24
/201
310
16O
AK
GR
OV
E A
V/E
L C
AM
INO
R
EA
L35
00
022
107
CV
CS
/B E
CR
Inte
rsec
tion
Sid
esw
ipe
Oak
Gro
veC
ar a
nd L
ight
Pol
e
6/28
/201
394
1E
L C
AM
INO
RE
AL/
MID
DLE
AV
401
00
2210
7CV
CN
/B E
CR
250
ft N
/O M
iddl
eS
ides
wip
e an
d H
ead
On
Mid
dle
3 C
ars
7/2/
2013
1850
STO
NE
PIN
E L
N/E
L C
AM
INO
R
EA
L25
00
022
350
CV
CE
/B S
tone
pine
100
ft E
/O E
CR
Sid
esw
ipe-
Par
ked
Car
EC
R2
Car
s
El C
amin
o R
eal 5
-yea
r Col
lisio
n R
ecor
dsPa
ge 1
2

Dat
eTi
me
Loca
tion
Spee
d Li
mit
Min
or
Inju
ries
Maj
or
Inju
ries
Fata
l In
jurie
sPr
imar
y C
ollis
ion
Fact
or
Dire
ctio
n of
Tra
vel
Rel
ativ
e Lo
catio
nC
ollis
ion
Type
Adj
acen
t or
Stre
et A
ddre
ssPa
rtie
s In
volv
edM
enlo
Par
k: E
l Cam
ino
Rea
l 5-y
ear C
ollis
ion
Rec
ords
(200
9-20
13)
7/12
/201
317
53S
AN
TA C
RU
Z A
V/E
L C
AM
INO
R
EA
L35
10
023
153
CV
CS
/B E
CR
Sto
p Li
ght a
t Loc
atio
nS
ides
wip
e- H
it an
d R
unS
anta
Cru
z3
Car
s
7/12
/201
317
53S
AN
TA C
RU
Z A
V/E
L C
AM
INO
R
EA
L40
00
023
152(
a) C
VC
S/B
EC
RS
top
Ligh
t at L
ocat
ion
Sid
esw
ipe-
Hit
and
Run
San
ta C
ruz
2 C
ars
7/14
/201
314
10E
L C
AM
INO
RE
AL/
OA
K G
RO
VE
A
V40
00
022
350(
a) C
VC
S/B
EC
RS
top
Ligh
t at L
ocat
ion
Rea
rend
Oak
Gro
ve2
Car
s
7/30
/201
315
15E
NC
INA
L A
V/E
L C
AM
INO
RE
AL
350
00
2235
0 C
VC
N/B
EC
R20
0 ft
N/O
Enc
inal
Rea
rend
Enc
inal
2 C
ars
8/1/
2013
1415
EL
CA
MIN
O R
EA
L/C
AM
BR
IDG
E
AV
350
00
2210
7 C
VC
S/B
EC
R20
0 B
lk E
CR
Sid
esw
ipe-
Par
ked
Car
Cam
brid
ge2
Car
s
8/20
/201
322
19E
L C
AM
INO
R
EA
L/R
AV
EN
SW
OO
D A
V35
20
021
453(
c) C
VC
S/B
EC
RS
top
Ligh
t at L
ocat
ion
Rea
rend
Rav
ensw
ood
2 C
ars
8/21
/201
384
8E
L C
AM
INO
RE
AL/
MID
DLE
AV
351
00
unkn
own
Bik
e N
/B E
CR
700
Blk
of E
CR
Sol
o B
ike,
Unk
now
nN
one
Sol
o B
ike,
Unk
now
n
8/23
/201
313
20O
AK
GR
OV
E A
V/E
L C
AM
INO
R
EA
L35
10
022
350
CV
CN
/B E
CR
Sto
p Li
ght a
t Loc
atio
nR
eare
ndO
ak G
rove
2 C
ars
9/18
/201
362
8E
L C
AM
INO
RE
AL/
OA
K G
RO
VE
A
V35
00
022
106
CV
CS
/B E
CR
D
rivew
ay o
f 126
5 E
CR
Bra
odsi
de12
65 E
CR
2 C
ars
9/24
/201
315
24E
L C
AM
INO
RE
AL/
OA
K G
RO
VE
A
V40
10
022
350(
a) C
VC
S/B
EC
RS
top
Ligh
t at L
ocat
ion
Rea
rend
Oak
Gro
ve2
Car
s
10/1
0/20
1310
36E
L C
AM
INO
RE
AL/
MID
DLE
AV
300
00
2235
0 C
VC
S/B
EC
RD
rivew
ay fo
r 525
EC
RR
eare
nd52
5 E
CR
2 C
ars
10/1
1/20
1314
1010
0 E
L C
AM
INO
RE
AL
350
00
2210
7 C
VC
N/B
EC
RD
rivew
ay fo
r 100
EC
RS
ides
wip
e- H
it an
d R
un10
0 E
CR
2 C
ars
10/1
5/20
1315
44C
AM
BR
IDG
E A
V/E
L C
AM
INO
R
EA
L35
20
022
350(
a) C
VC
S/B
EC
R20
0 ft
N/O
Cam
brid
geR
eare
ndC
ambr
idge
2 C
ars
10/1
8/20
1311
08E
L C
AM
INO
RE
AL/
GLE
NW
OO
D
AV
350
00
2180
4 C
VC
N/B
EC
RD
rivew
ay fo
r 138
0 E
CR
Bro
adsi
de13
80 E
CR
2 C
ars
10/1
9/20
1314
19M
IDD
LE A
V/E
L C
AM
INO
RE
AL
351
00
2210
7 C
VC
Bik
e N
/B E
CR
Inte
rsec
tion
Sol
o B
ike,
Unk
now
nN
one
Sol
o B
ike,
Unk
now
n
10/2
2/20
1316
30E
L C
AM
INO
RE
AL/
STO
NE
PIN
E
LN35
00
022
350(
a) C
VC
N/B
EC
RIn
ters
ectio
nR
eare
ndS
tone
pine
2 C
ars
10/2
5/20
1322
00E
L C
AM
INO
RE
AL/
OA
K G
RO
VE
A
V35
00
023
152(
B) C
VC
N/B
EC
R42
5 ft
N/O
Oak
Gro
veS
ides
wip
eO
ak G
rove
2 C
ars
11/4
/201
319
00M
IDD
LE A
V/E
L C
AM
INO
RE
AL
250
00
2210
7 C
VC
E/B
Mid
dle
Driv
eway
for 5
25 E
CR
- M
iddl
e S
ide
Rea
rend
525
EC
R- M
iddl
e S
ide
2 C
ars
11/8
/201
373
0E
L C
AM
INO
RE
AL/
LIV
E O
AK
AV
250
00
2195
0 C
VC
Bik
e E
/B E
CR
in C
ross
wal
kC
ross
wal
kB
ike
vs C
arC
ar N
/B E
CR
Bik
e vs
Car
11/1
2/20
1318
02V
ALP
AR
AIS
O A
V/E
L C
AM
INO
R
EA
L25
00
021
751
CV
CE
/B V
alpa
rais
o10
0 ft
W/O
EC
RS
ides
wip
e- C
hang
ing
Lane
sE
CR
2 C
ars
11/2
2/20
1383
0E
L C
AM
INO
RE
AL/
OA
K G
RO
VE
A
V35
00
022
350
CV
CN
/B E
CR
Sto
p Li
ght a
t Loc
atio
nR
eare
ndO
ak G
rove
2 C
ars
El C
amin
o R
eal 5
-yea
r Col
lisio
n R
ecor
dsPa
ge 1
3

Dat
eTi
me
Loca
tion
Spee
d Li
mit
Min
or
Inju
ries
Maj
or
Inju
ries
Fata
l In
jurie
sPr
imar
y C
ollis
ion
Fact
or
Dire
ctio
n of
Tra
vel
Rel
ativ
e Lo
catio
nC
ollis
ion
Type
Adj
acen
t or
Stre
et A
ddre
ssPa
rtie
s In
volv
edM
enlo
Par
k: E
l Cam
ino
Rea
l 5-y
ear C
ollis
ion
Rec
ords
(200
9-20
13)
11/2
2/20
1317
54E
L C
AM
INO
RE
AL/
OA
K G
RO
VE
A
V35
00
022
107
CV
CS
/B E
CR
50 ft
S/O
127
9 E
CR
Sid
esw
ipe-
Hit
and
Run
Oak
Gro
ve2
Car
s
11/2
4/20
1313
24E
L C
AM
INO
RE
AL/
ME
NLO
AV
350
00
2210
7 C
VC
S/B
EC
R- P
arke
d C
ar94
9 E
CR
Sid
esw
ipe-
Hit
and
Run
949
EC
R2
Car
s
11/2
9/20
1315
10E
L C
AM
INO
RE
AL/
GLE
NW
OO
D
AV
351
00
2235
0(a)
CV
CN
/B E
CR
Driv
eway
for 1
540
EC
RR
eare
nd15
40 E
CR
2 C
ars
11/3
0/20
1365
7E
L C
AM
INO
RE
AL/
SA
NTA
CR
UZ
AV
351
00
2235
0 C
VC
S/B
EC
RS
top
Ligh
t at L
ocat
ion
Rea
rend
San
ta C
ruz
2 C
ars
12/2
/201
316
30E
L C
AM
INO
RE
AL/
RO
BLE
AV
351
00
2235
0 C
VC
N/B
EC
RS
top
Ligh
t at L
ocat
ion
Rea
rend
- Hit
and
Run
Rob
le2
Car
s
12/7
/201
373
9E
L C
AM
INO
RE
AL/
SA
NTA
CR
UZ
AV
350
00
2145
3(a)
CV
CE
/B S
anta
Cru
zIn
ters
ectio
nB
road
side
- Ran
Red
Li
ght
EC
R
2 C
ars
12/1
2/20
1316
20E
L C
AM
INO
RE
AL/
OA
K G
RO
VE
A
V35
00
022
107
CV
CS
/B E
CR
150
ft N
/O O
ak G
rove
Rea
rend
Oak
Gro
ve2
Car
s
12/1
3/20
1310
00O
AK
GR
OV
E A
V/E
L C
AM
INO
R
EA
L35
00
022
107
CV
CS
/B E
CR
Sto
p Li
ght a
t Loc
atio
nR
eare
nd- H
it an
d R
unO
ak G
rove
2 C
ars
12/1
9/20
1313
30R
AV
EN
SW
OO
D A
V/E
L C
AM
INO
R
EA
L30
00
022
350
CV
CW
/B R
aven
swoo
d50
0 ft
E/O
EC
RR
eare
ndE
CR
2 C
ars
12/2
6/20
1314
30V
ALP
AR
AIS
O A
V/E
L C
AM
INO
R
EA
L35
00
022
107
CV
CE
/B V
alpa
rais
oIn
ters
ectio
n- T
urne
d To
o W
ide
Bra
odsi
deE
CR
2 C
ars
12/2
9/20
1317
32E
L C
AM
INO
RE
AL/
GLE
NW
OO
D
AV
351
00
2145
3(a)
CV
CC
ar N
/B E
CR
Cro
ssw
alk
Car
vs
Bik
eB
ike
E/B
EC
R in
C
ross
wal
kC
ar v
s B
ike
El C
amin
o R
eal 5
-yea
r Col
lisio
n R
ecor
dsPa
ge 1
4

Dat
eTi
me
Loca
tion
Spee
d Li
mit
Min
or
Inju
ries
Maj
or
Inju
ries
Fata
l In
jurie
sPr
imar
y C
ollis
ion
Fact
or
Ped
or
Bic
ycle
Dire
ctio
n of
Tra
vel
Rel
ativ
e Lo
catio
nC
olls
ion
Type
Adj
acen
t or S
tree
t A
ddre
ssPa
rtie
s In
volv
ed
1/5/
2004
1202
OA
K G
RO
VE
AV
/EL
CA
MIN
O R
251
00
2165
0.1V
CB
ike
Car
E/B
Oak
Gro
ve to
N/B
E
CR
Cro
ssw
alk
Car
vs
Bik
eB
ike
S/B
EC
RC
ar v
s B
ike
6/14
/200
413
53C
AM
BR
IDG
E A
V/E
L C
AM
INO
R35
10
021
950
(b)
Ped
Car
S/B
EC
RIn
ters
ectio
nC
ar v
s B
ike
Ped
S/B
EC
R in
Roa
dway
Car
vs
Ped
8/17
/200
414
20LI
VE
OA
K A
V/E
L C
AM
INO
RE
251
00
2195
0(A
)P
edC
ar E
/B L
ive
Oak
to S
/B
EC
R10
ft W
/O E
CR
Car
vs
Ped
Bik
e S
/B E
CR
Car
vs
Ped
9/17
/200
423
39E
L C
AM
INO
RE
AL/
RO
BLE
AV
350
10
2195
0(b)
CV
CP
edC
ar N
/B E
CR
Cro
ssw
alk
Car
vs
Ped
Ped
W/B
in C
ross
wal
kC
ar v
s P
ed
10/1
9/20
0415
0552
5 E
L C
AM
INO
RE
AL
351
00
2165
0.1
CV
CB
ike
Car
Exi
ting
Driv
eway
Driv
eway
to 5
25 E
CR
Car
vs
Bik
eB
ike
N/B
EC
RC
ar v
s B
ike
10/3
1/20
0420
0724
1 E
L C
AM
INO
RE
AL
351
00
2180
4b V
CP
edC
ar B
acki
ng o
ut o
f Driv
eway
Driv
eway
to 2
41 E
CR
Car
vs
Bik
eB
ike
N/B
EC
RC
ar v
s B
ike
11/1
6/20
0463
5C
RE
EK
DR
/EL
CA
MIN
O R
EA
L25
10
021
802(
a) V
CB
ike
Car
E/B
Cre
ek to
S/B
EC
R10
ft W
/O E
CR
Car
vs
Bik
eB
ike
S/B
EC
RC
ar v
s B
ike
1/16
/200
514
10M
EN
LO A
V/E
L C
AM
INO
RE
AL
300
00
2145
3(b)
VC
Bik
eC
ar N
/B E
CR
to E
/B M
enlo
Inte
rsec
tion
Car
vs
Bik
eB
ike
E/B
Men
lo A
vC
ar v
s B
ike
3/3/
2005
1700
1150
EL
CA
MIN
O R
EA
L35
10
021
202(
a) V
CB
ike
Car
W/B
from
Driv
eway
to
N/B
EC
R20
0 ft
N/O
San
ta
Cru
zC
ar v
s B
ike
Bik
e S
/B E
CR
Car
vs
Bik
e
3/10
/200
511
0011
50 E
L C
AM
INO
RE
AL
251
00
2120
2(a)
VC
Ped
Car
W/B
from
Driv
eway
to
N/B
EC
RD
rivew
ay o
f 115
0 E
CR
Car
vs
Bik
eB
ike
S/B
EC
RC
ar v
s B
ike
6/16
/200
514
16M
IDD
LE A
V/E
L C
AM
INO
RE
AL
351
00
2165
0.1
VC
Ped
Car
from
Driv
eway
to S
/B
EC
RD
rivew
ay o
f 115
0 E
CR
Bik
e vs
Car
Bik
e S
/B E
CR
Bik
e vs
Car
7/23
/200
591
5E
L C
AM
INO
RE
AL/
SA
NTA
CR
UZ
AV
251
00
2210
7 V
CP
edC
ar E
/B S
anta
Cru
z to
S/B
E
CR
Cro
ssw
alk
Car
vs
Ped
E/B
acr
oss
EC
RC
ar v
s P
ed
8/23
/200
518
13E
L C
AM
INO
RE
AL/
EN
CIN
AL
AV
E35
10
021
950
VC
Ped
Car
E/B
Enc
inal
to N
/B E
CR
Men
lo C
olle
ge
Ent
ranc
eC
ar v
s P
edS
/B E
CR
in C
ross
wal
kC
ar v
s P
ed
3/13
/200
615
3649
5 E
L C
AM
INO
RE
AL
01
00
Oth
erP
edP
arki
ng L
ot- V
eh N
ot in
G
ear a
nd R
olle
d49
5 E
CR
Car
vs
Ped
Par
king
Lot
495
EC
RC
ar v
s P
ed
8/4/
2006
1646
935
EL
CA
MIN
O R
EA
L35
10
021
950
VC
Bik
eC
ar fr
om E
/B D
rivew
ay to
N
/B E
CR
935
EC
RC
ar v
s B
ike
Bik
e S
/B E
CR
Car
vs
Bik
e
11/2
4/20
0616
02E
L C
AM
INO
RE
AL/
RO
BLE
AV
351
00
2195
2 V
CP
edC
ar fr
om E
/B D
rivew
ay to
S
/B E
CR
Driv
eway
to 7
21 E
CR
Car
vs
Bik
eB
ike
S/B
EC
RC
ar v
s B
ike
11/2
8/20
0614
20E
L C
AM
INO
RE
AL/
HA
RV
AR
D A
V35
01
021
200
VC
Bik
eC
ar E
/B H
arva
rd to
S/B
E
CR
Inte
rsec
tion
Car
vs
Bik
eB
ike
S/B
EC
RC
ar v
s B
ike
2/21
/200
783
8C
AM
BR
IDG
E A
V/E
L C
AM
INO
RE
AL
351
00
2195
0(a)
VC
Ped
Car
E/B
Cam
brid
ge to
N/B
E
CR
Cro
ssw
alk
Car
vs
Ped
W/B
EC
R in
Cro
ssw
alk
Car
vs
Ped
3/24
/200
717
08E
L C
AM
INO
RE
AL/
MID
DLE
AV
351
00
2210
7 C
VC
Bik
eC
ar S
/B E
CR
to W
/B in
to
Priv
ate
Par
king
Lot
400
ft N
/O M
iddl
e on
E
CR
Car
vs
Bik
eB
ike
S/B
EC
RC
ar v
s B
ike
5/24
/200
715
4570
0 E
L C
AM
INO
RE
AL
251
00
2145
6(b)
VC
Ped
Car
N/B
EC
R to
E/B
Rob
leC
ross
wal
kC
ar v
s P
edN
/B E
CR
in C
ross
wal
kC
ar v
s P
ed
Men
lo P
ark:
El C
amin
o R
eal 1
0-ye
ar P
edes
tria
n an
d B
icyc
le C
ollis
ion
Rec
ords
(200
4-20
13)
El C
amin
o R
eal 1
0-ye
ar P
edes
trian
and
Bic
ycle
Col
lisio
n R
ecor
dsPa
ge 1

Dat
eTi
me
Loca
tion
Spee
d Li
mit
Min
or
Inju
ries
Maj
or
Inju
ries
Fata
l In
jurie
sPr
imar
y C
ollis
ion
Fact
or
Ped
or
Bic
ycle
Dire
ctio
n of
Tra
vel
Rel
ativ
e Lo
catio
nC
olls
ion
Type
Adj
acen
t or S
tree
t A
ddre
ssPa
rtie
s In
volv
ed
Men
lo P
ark:
El C
amin
o R
eal 1
0-ye
ar P
edes
tria
n an
d B
icyc
le C
ollis
ion
Rec
ords
(200
4-20
13)
8/17
/200
774
5E
L C
AM
INO
RE
AL/
CA
MB
RID
GE
AV
351
00
2145
3(a)
CV
CB
ike
Car
S/B
EC
R to
W/B
C
ambr
idge
Inte
rsec
tion
Car
vs
Bik
eB
ike
E/B
Cam
brid
geC
ar v
s B
ike
9/5/
2007
2316
EL
CA
MIN
O R
EA
L/S
AN
TA C
RU
Z A
V25
10
022
107
CV
CP
edC
ar E
/B S
anta
Cru
z to
S/B
E
CR
Cro
ssw
alk
Car
vs
Ped
E/B
EC
R in
Cro
ssw
alk
Car
vs
Ped
1/6/
2008
1039
EL
CA
MIN
O R
EA
L/P
AR
TRID
GE
AV
01
00
2235
0 V
CB
ike
Car
E/B
from
Driv
eway
to
S/B
EC
RD
rivew
ay to
275
EC
RB
ike
vs C
arB
ike
N/B
EC
RB
ike
vs C
ar
1/17
/200
817
4675
1 E
L C
AM
INO
RE
AL
51
00
Oth
erP
edC
ar B
acki
ng U
pP
rivat
e P
arki
ng L
ot
751
EC
RC
ar v
s P
edP
ed in
Par
king
Lot
Car
vs
Ped
4/2/
2008
1841
MID
DLE
AV
/EL
CA
MIN
O R
EA
L35
10
0un
know
nB
ike
Car
E/B
Mid
dle
to S
/B E
CR
Cro
ssw
alk
Car
vs
Bik
eN
/B E
CR
in C
ross
wal
kC
ar v
s B
ike
4/19
/200
833
8E
L C
AM
INO
RE
AL/
EN
CIN
AL
AV
250
00
2210
6 V
CB
ike
Car
W/B
Enc
inal
to N
/B
EC
RIn
ters
ectio
nC
ar v
s B
ike
Bik
e N
/B E
CR
Car
vs
Bik
e
6/12
/200
815
19E
L C
AM
INO
RE
AL/
SA
NTA
CR
UZ
AV
351
00
2251
7 V
CB
ike
Car
S/B
EC
R- B
ike
Hit
Ope
n C
ar D
oor
50 ft
S/O
San
ta C
ruz
Car
vs
Bik
eB
ike
S/B
EC
RC
ar v
s B
ike
9/23
/200
815
4730
1 E
L C
AM
INO
RE
AL
50
00
Unk
now
nB
ike
Bik
e S
/B E
CR
301
EC
RB
ike
vs
Ligh
tpol
eN
one
Bik
e vs
Li
ghtp
ole
11/1
2/20
0816
29S
AN
TA C
RU
Z A
V/E
L C
AM
INO
RE
AL
251
00
Oth
erB
ike
Car
Exi
ting
Driv
eway
to W
/B
San
ta C
ruz
1010
EC
R D
rivew
ayC
ar v
s B
ike
Bik
e E
/B S
anta
Cru
zC
ar v
s B
ike
3/12
/200
975
0E
L C
AM
INO
RE
AL/
VA
LPA
RA
ISO
AV
351
00
2145
3 V
CP
edB
ike
E/B
EC
R A
gain
st R
ed
Ligh
tC
ross
wal
kC
ar v
s B
ike
Car
S/B
EC
RC
ar v
s B
ike
8/27
/200
991
8S
AN
TA C
RU
Z A
V/E
L C
AM
INO
RE
AL
351
00
2251
7 V
CB
ike
Car
Par
ked
S/B
EC
R- B
ike
Hit
Ope
n C
ar D
oor
1081
EC
RC
ar v
s B
ike
Bik
e S
/B E
CR
Car
vs
Bik
e
9/10
/200
913
26M
EN
LO A
V/E
L C
AM
INO
RE
AL
351
00
11.5
6.12
0 C
O
Ped
Ped
E/B
Men
lo
Inte
rsec
tion
Ped
vs
Bik
eB
ike
S/B
EC
RP
ed v
s B
ike
12/2
8/20
0912
43C
RE
EK
DR
/EL
CA
MIN
O R
EA
L35
10
021
802(
a) V
CB
ike
Car
E/B
Cre
ek to
S/B
EC
RIn
ters
ectio
nC
ar v
s B
ike
Bik
e N
/B E
CR
Car
vs
Bik
e
1/6/
2010
726
100
EL
CA
MIN
O R
EA
L35
10
021
804
VC
Bik
eC
ar E
xitin
g D
rivew
ayD
rivew
ay to
100
EC
RC
ar v
s B
ike
Bik
e S
/B E
CR
Car
vs
Bik
e
7/16
/201
011
37E
L C
AM
INO
RE
AL/
HA
RV
AR
D A
V35
10
021
950(
a) C
VC
Ped
Car
E/B
Har
vard
to S
/B
EC
RIn
ters
ectio
nC
ar v
s B
ike
Bik
e N
/B E
CR
Car
vs
Bik
e
7/29
/201
051
7E
L C
AM
INO
RE
AL/
OA
K G
RO
VE
AV
351
00
2145
3(b)
VC
Bik
eC
ar E
/B O
ak G
rove
to S
/B
EC
RIn
ters
ectio
nC
ar v
s B
ike
Bik
e S
/B E
CR
Car
vs
Bik
e
8/2/
2010
851
MID
DLE
AV
/EL
CA
MIN
O R
EA
L35
00
022
107
CV
CB
ike
Car
S/B
EC
R T
urni
ng in
to
495
EC
R49
5 E
CR
Car
vs
Bik
eB
ike
S/B
EC
RC
ar v
s B
ike-
H
it an
d R
un
2/4/
2011
930
EL
CA
MIN
O R
EA
L/M
IDD
LE A
V5
10
021
202(
a) C
VC
Bik
eC
ar E
xitin
g D
rivew
ay20
0 ft
W/O
EC
RC
ar v
s B
ike
Bik
e E
/B M
iddl
eC
ar v
s B
ike
4/6/
2011
1145
EL
CA
MIN
O R
EA
L/M
IDD
LE A
V35
01
021
950
cvc
Ped
Car
W/B
Mid
dle
to N
/B E
CR
Cro
ssw
alk
Car
vs
Ped
Ped
N/B
EC
RC
ar v
s P
ed
6/23
/201
110
30E
L C
AM
INO
RE
AL/
SA
NTA
CR
UZ
AV
351
00
2251
7 C
VC
Bik
eC
ar P
arke
d S
/B E
CR
-Bik
e H
it O
pen
Car
Doo
r10
0 ft
S/O
Oak
Gro
veC
ar v
s B
ike
Bik
e S
/B E
CR
Car
vs
Bik
e
7/26
/201
182
4E
L C
AM
INO
RE
AL/
ALE
JAN
DR
A A
V35
01
021
950(
b) C
VC
Ped
Car
N/B
EC
RC
ross
wal
kC
ar v
s P
edW
/B E
CR
in C
ross
wal
kC
ar v
s P
ed
El C
amin
o R
eal 1
0-ye
ar P
edes
trian
and
Bic
ycle
Col
lisio
n R
ecor
dsPa
ge 2

Dat
eTi
me
Loca
tion
Spee
d Li
mit
Min
or
Inju
ries
Maj
or
Inju
ries
Fata
l In
jurie
sPr
imar
y C
ollis
ion
Fact
or
Ped
or
Bic
ycle
Dire
ctio
n of
Tra
vel
Rel
ativ
e Lo
catio
nC
olls
ion
Type
Adj
acen
t or S
tree
t A
ddre
ssPa
rtie
s In
volv
ed
Men
lo P
ark:
El C
amin
o R
eal 1
0-ye
ar P
edes
tria
n an
d B
icyc
le C
ollis
ion
Rec
ords
(200
4-20
13)
9/21
/201
190
0M
IDD
LE A
V/E
L C
AM
INO
RE
AL
301
00
2195
0 C
VC
Ped
Car
E/B
Mid
dle
to S
/B E
CR
Cro
ssw
alk
Car
vs
Ped
N/B
EC
R in
Cro
ssw
alk
Car
vs
Ped
12/2
2/20
1115
30E
L C
AM
INO
RE
AL/
SA
NTA
CR
UZ
AV
300
00
2195
0 C
VC
Ped
Car
W/B
San
ta C
ruz
To N
/B
EC
RC
ross
wal
kC
ar v
s P
edS
/B E
CR
in C
ross
wal
kC
ar v
s P
ed
2/14
/201
212
30E
L C
AM
INO
RE
AL/
CA
MB
RID
GE
AV
351
00
2210
7 C
VC
Bik
eC
ar S
/B E
CR
to W
/B
Cam
brid
geIn
ters
ectio
nC
ar v
s B
ike
Bik
e S
/B E
CR
Car
vs
Bik
e
5/25
/201
215
1512
00 E
L C
AM
INO
RE
AL
351
00
11.5
6.12
0 C
OB
ike
Bik
e N
/B E
CR
-on
Sid
ewal
kD
rivew
ay to
120
0 E
CR
Bik
e vs
Car
Car
N/B
EC
R in
to
Driv
eway
Bik
e vs
Car
7/3/
2012
1554
EL
CA
MIN
O R
EA
L/O
AK
GR
OV
E A
V30
10
021
650.
1 C
VC
Bik
eC
ar W
/B O
ak G
rove
to N
/B
EC
RIn
ters
ectio
nC
ar v
s B
ike
Bik
e S
/B E
CR
Car
vs
Bik
e
9/4/
2012
1130
SA
NTA
CR
UZ
AV
/EL
CA
MIN
O R
EA
L35
10
021
955
CV
CP
edC
ar N
/B E
CR
Cro
ssw
alk
Car
vs
Ped
W/B
EC
R in
Cro
ssw
alk
Car
vs
Ped
9/30
/201
22
EL
CA
MIN
O R
EA
L/C
RE
EK
DR
351
10
2195
4(a)
CV
CP
edC
ar S
/B E
CR
Run
ning
acr
oss
EC
RC
ar v
s P
edR
unni
ng E
/B a
cros
s E
CR
Car
vs
Ped
- H
it an
d R
un
11/2
/201
218
23E
L C
AM
INO
RE
AL/
SA
NTA
CR
UZ
AV
351
00
2235
0 C
VC
Bik
eC
ar N
/B E
CR
-Rea
rend
ed
Bik
e50
ft S
/O S
anta
Cru
zC
ar v
s B
ike
Bik
e N
/B E
CR
Car
vs
Bik
e
11/5
/201
220
2210
0 E
L C
AM
INO
RE
AL
350
10
2315
2 C
VC
Bik
eB
ike
N/B
EC
R10
0 E
CR
Bik
e vs
U
nkno
wn
Non
eB
ike
vs
Unk
now
n
11/6
/201
260
0M
EN
LO A
V/E
L C
AM
INO
RE
AL
251
00
2235
0 C
VC
Bik
eB
ike
W/B
Men
lo30
0 ft
W/O
EC
RS
olo
Bik
e,
Gra
vel
Non
eS
olo
Bik
e,
Gra
vel
12/6
/201
218
3650
0 E
L C
AM
INO
RE
AL
351
00
2120
2(a)
CV
CB
ike
Car
N/B
EC
R T
urn
Lane
Driv
eway
to 5
25 E
CR
Car
vs
Bik
eB
ike
N/B
EC
RC
ar v
s B
ike
5/21
/201
319
03E
L C
AM
INO
RE
AL/
CA
MB
RID
GE
AV
351
00
OTH
ER
TH
AN
D
RIV
ER
Bik
eB
ike
N/B
EC
R10
0 ft
N/O
Cam
brid
geS
olo
Bik
e,
Bag
Cau
ght
Non
eS
olo
Bik
e,
Bag
Cau
ght
8/21
/201
384
8E
L C
AM
INO
RE
AL/
MID
DLE
AV
351
00
unkn
own
Bik
eB
ike
N/B
EC
R70
0 B
lk o
f EC
RS
olo
Bik
e,
Unk
now
nN
one
Sol
o B
ike,
U
nkno
wn
10/1
9/20
1314
19M
IDD
LE A
V/E
L C
AM
INO
RE
AL
351
00
2210
7 C
VC
Bik
eB
ike
N/B
EC
RIn
ters
ectio
nS
olo
Bik
e,
Unk
now
nN
one
Sol
o B
ike,
U
nkno
wn
11/8
/201
373
0E
L C
AM
INO
RE
AL/
LIV
E O
AK
AV
250
00
2195
0 C
VC
Ped
Bik
e E
/B E
CR
in C
ross
wal
kC
ross
wal
kB
ike
vs C
arC
ar N
/B E
CR
Bik
e vs
Car
12/2
9/20
1317
32E
L C
AM
INO
RE
AL/
GLE
NW
OO
D A
V35
10
021
453(
a) C
VC
Bik
eC
ar N
/B E
CR
Cro
ssw
alk
Car
vs
Bik
eB
ike
E/B
EC
R in
C
ross
wal
kC
ar v
s B
ike
El C
amin
o R
eal 1
0-ye
ar P
edes
trian
and
Bic
ycle
Col
lisio
n R
ecor
dsPa
ge 3

El Camino Real Corridor Study –Existing Conditions Report September 2014
El Camino Real On-Street Parking Inventory


Menlo Park ‐ El Camino Real Weekday Parking SurveyDate: 6‐Jun‐14
Location Northern Limit Southern Limit East side West sideA El Camino Real Encinal Avenue Glenwood Avenue‐Valparaiso Avenue 0 14 N/A Unmarked: 14
B El Camino Real Glenwood Avenue‐Valparaiso Avenue Oak Grove Avenue 16 152 hr [7‐6]: 2 spots, 1 hr [7‐6]: 4 spots, 15 min: 4 spots, Unmarked: 6 spots 1 hr [9‐6]: 14 spots, 15 min: 1 spot
C El Camino Real Oak Grove Avenue Santa Cruz Avenue 0 4 N/A 2 hr[9‐6]: 1 spot, 1 hr [9‐6]: 3 spotsD El Camino Real Santa Cruz Avenue Menlo Avenue‐Ravenswood Avenue 0 8 N/A 2 hr[9‐6]: 8 spots
E El Camino Real Menlo Avenue‐Ravenswood Avenue Live Oak Avenue 0 10 N/A1 hr [9‐6]: 2 spots, 3 min: 3 spots, Loading: 2 spots, Unmarked: 3 spots
F El Camino Real Live Oak Avenue Roble Avenue 20 01 hr [7‐6]: 7 spots, Drop off/Pick up: 2 spots, Unmarked: 11 spots N/A
G El Camino Real Roble Avenue Middle Avenue 0 0 N/A N/AH El Camino Real Middle Avenue College Avenue 0 8 N/A 1 hr [7‐6]: 8 spotsI El Camino Real College Avenue Partridge Avenue 12 6 2 hr [7‐6]: 5 spots, Unmarked: 7 Unmarked: 6 spotsJ El Camino Real Partridge Avenue Cambridge Avenue 11 0 2 hr [7‐6]: 2 spots, Unmarked: 9 N/AK El Camino Real Cambridge Avenue Harvard Avenue 8 0 N/A N/AL El Camino Real Harvard Avenue Creek Drive 18 6 Unmarked: 18 spots 1 hr ]7‐6]: 4 spots, Loading: 2 spotsM El Camino Real Creek Drive Sand Hill Road 0 0 N/A N/A
El Camino Real Total 85 71
Street Name Eastern Limit Western Limit North side South side1 Encinal Avenue (east of ECR) San Antonio Avenue El Camino Real 8 5 Unmarked: 8 Spots Unmarked: 5 spots2 Valparaiso Avenue (west of ECR) El Camino Real Hoover Street 0 3 N/A Unmarked: 3 spots3 Glenwood Avenue (east of ECR) San Antonio Avenue El Camino Real 10 2 Unmarked: 10 spots Loading: 2 spots
4 Oak Grove Avenue (west of ECR) El Camino Real Hoover Street 5 9 2 hr [9‐6]: 5 spots2 hr [9‐6]: 5 spots, 15 min [9‐6]: 3 spots, Unmarked: 1 spot
5 Oak Grove Avenue (east of ECR) Merrill Street El Camino Real 7 9 2 hr [9‐6]: 7 spots 2 hr [9‐6]: 8 spots, Loading: 1 spot6 Santa Cruz Avenue (west of ECR) El Camino Real Doyle Street 5 4 1 hr [9‐6]: 4 spots, 15 min: 1 spot 1 hr [9‐6]: 4 spots7 Santa Cruz Avenue (east of ECR) Merrill Street El Camino Real 8 4 1 hr [7‐6]: 7 spots, 15 min: 1 spot Loading: 4 spots8 Menlo Avenue (west of ECR) El Camino Real Doyle Street 0 0 N/A N/A9 Ravenswood Avenue (east of ECR) Merrill Street El Camino Real 0 0 N/A N/A10 Live Oak Avenue (west of ECR) El Camino Real 100 feet west of El Camino Real 2 2 1 hr [7‐6]: 2 spots 1 hr: 2 spots11 Roble Avenue (west of ECR) El Camino Real 100 feet west of El Camino Real 0 0 N/A N/A12 Middle Avenue (west of ECR) El Camino Real 100 feet west of El Camino Real 0 0 N/A N/A13 College Avenue (west of ECR) El Camino Real 100 feet west of El Camino Real 2 3 1 hr [7‐6]: 2 spots Unmarked: 3 spots14 Partridge Avenue (west of ECR) El Camino Real 100 feet west of El Camino Real 3 3 1 hr [7‐6]: 3 spots Unmarked: 3 spots15 Cambridge Avenue (west of ECR) El Camino Real 100 feet west of El Camino Real 0 0 N/A N/A16 Harvard Avenue (west of ECR) El Camino Real 100 feet west of El Camino Real 3 4 2 hr [7‐6]: 3 spots 2 hr [7‐6]: 4 spots17 Creek Drive (west of ECR) El Camino Real 100 feet west of El Camino Real 0 4 N/A Unmarked: 4 spots18 Palo Alto Avenue (east of ECR) 100 feet east of El Camino Real El Camino Real 0 0 N/A N/A19 Sand Creek Road (west of ECR) El Camino Real 100 feet west of El Camino Real 0 0 N/A N/A
**All restrictions excempt on holidays and weekends
Current Parking Regulations & Price
East Side West Side
Current Parking Regulations & Price
North Side
El Camino Real Block
Number of Spaces
South SideSide
Street #Number of Spaces


DEl Camino Real Corridor Study
A P P E N D I X D
Best Practices Toolbox


1
Summary of Best Practices
Introduction
The Menlo Park El Camino Real Downtown Specific Plan, adopted in June 2012, emphasizes the character and extent of enhanced public spaces, the character and intensity of private infill development, and circulation and connectivity improvements to preserve and enhance community life. The plan focuses on improvements along the El Camino Read corridor in the City of Menlo Park, as well as downtown Menlo Park and the Menlo Park Caltrain Station area. For transportation circulation, the Specific Plan envisions the following:
• A vehicular circulation system that accommodates both local traffic and north/south through traffic on El Camino Real.
• An integrated pedestrian network of expansive sidewalks, promenades and paseos along El Camino Real and within downtown. The network provides opportunities for safe crossing of El Camino Real and the railroad tracks and connects the east and west sides of town, including the City’s civic center with downtown.
• A bicycle network that builds upon existing plans and integrates more fully with downtown and proposed public space improvements in the area.
• An integrated circulation plan that supports transit use. • A public parking strategy and management plan that efficiently accommodates downtown visitors and
supports downtown businesses. • Modified parking rates for private development based on current industry standards.
Through the completion of these visions, the Specific Plan accommodates all travel modes, with an emphasis on pedestrians, bicyclists, transit users and parking for downtown. The Specific Plan focuses development in areas well served by transit with a mix of uses in close proximity in order to reduce the reliance on private motor vehicles. The Specific Plan outlines specific pedestrian, bicycle, and transit policies which support each mode’s individual goals while fulfilling the overall goals of the Specific Plan. Based on these goals from the Downtown Specific Plan, following is a “toolbox” of potential improvement measures for the El Camino Real corridor which would support the goals of each mode. This toolbox focuses on curb to curb improvements within the public right-of-way to create Complete Streets. The details of additional circulation improvements outside of the roadway are summarized in the Specific Plan. Images and specific examples of these measures which have been implemented in the Bay Area are shown.
Pedestrian Improvements Through new development and redevelopment, the Specific Plan anticipates an increase in the number of pedestrians along El Camino Real and in the station area and downtown, the Specific Plan focuses on pedestrian east-west connectivity across El Camino Real, north-south connectivity along El Camino Real, and circulation through the downtown area supported by the following modifications:
• Improved pedestrian comfort and accommodation • Addition of track-separated pedestrian/bicycle access across the railroad tracks • Reduced pedestrian crossing distances across El Camino Real

2
The following improvement measures, and accompanying examples, would aid in the improvement of the pedestrian environment along the El Camino Real Corridor as outlined by the Specific Plan:
1. High Visibility Crosswalks – Clearly delineated pedestrian crossing areas to enhance visibility and the pedestrian environment.
Figure 1 Ladder Crosswalk (Main Street/Harrison Street, San Francisco)
Figure 2 Brick Crosswalk (El Camino Real/Stanford Avenue, Palo Alto)
2. Curb Extensions – Increase the visibility of pedestrians while reducing intersection crossing distance by aligning pedestrians with the edge of the parking lane.

3
Figure 3 Curb Extensions and High Visibility Elements (Mission Street at Alp Avenue, Daly City)
3. Pedestrian Refuge Median – Reduce the exposure time experienced by pedestrians in the intersection and provide the ability to cross in two separate legs. In Menlo Park, there would be a desire to ensure that the existing median trees are not impacted by these refuge areas.
Figure 4 Pedestrian Refuge Island (Van Ness Avenue/McAllister Street, San Francisco)

4
4. Enhanced Pedestrian Signal Functions – Leading Pedestrian Intervals provide pedestrians a head start when entering the intersection in order to increase the visibility of pedestrians in the intersection. Countdown signal heads will inform pedestrians of the available time to cross.
Figure 5 Leading Pedestrian Interval (Mission Street/6th Street, San Francisco)
Figure 6 Pedestrian Countdown Signal

5
5. Enhanced Crossing Signage – Intended to increase pedestrian visibility, but should not replace
geometric design strategies. Provides motorists more warning of approaching pedestrian crossing
Figure 7 Enhanced Active when Present Signage (San Pablo Avenue/Madison Avenue, El Cerrito)
6. Turn Limitations – Prohibiting and/or limiting motorists turning movements to reduce conflicts with pedestrians.
Figure 8 No Right Turn on Red (Winchester Boulevard/Daves Street, Los Gatos)

6
7. Enhanced Pedestrian Railroad Crossings – Provide pedestrians a direct crossing of the tracks in order to increase safety and reduce exposure time.
Figure 9 Pedestrian Gates at Railroad Crossings
Note: All of the pedestrian crossings of El Camino Real are at signalized intersections, so additional enhancements which apply to uncontrolled intersection crossings are not included in this discussion.
Bicycle Improvements The Specific Plan highlights bicycling as an important mode of transportation for the City. Many Menlo Park residents commute to work by bicycle taking advantage of a mild climate and relatively flat terrain to access many destinations within close proximity to their home or place of employment. In accordance with the Menlo Park Comprehensive Bicycle Development Plan (CBDP), the Specific Plan establishes a comprehensive bicycle network for the El Camino Real corridor, downtown area, and Caltrain station area. This network recommends a combination of bicycle paths, bicycle lanes, and bicycle routes. The Specific Plan includes recommended facilities included in the DBDP, upgraded recommendations from the DBDP, and new recommendations to improve east-west connectivity and north-south facilities. The concept of El Camino Real in the Specific Plan embraces providing a continuous bike route along the length of the corridor, with the potential for a dedicated bike lane in the future. The following improvement measures, and accompanying examples, would aid in the implementation of bicycle network improvements along El Camino Real as outlined in the Specific Plan:

7
1. Conventional Bike Lanes – Designate an exclusive space for bicyclists through pavement markings and signage. Located adjacent to travel lanes and flows in the same direction as traffic.
Figure 10 Conventional Bike Lane (Folsom Street, San Francisco)
2. Buffered Bike Lanes – Conventional bike lanes paired with a designated buffer space to separate the bicycle lane from the adjacent travel lane or parking lane.
Figure 11 Buffered Bike Lane (Fourth Street, San Jose)
3. Cycle Tracks – Exclusive bicycle facilities physically separated and sometimes elevated from vehicle traffic and distinct from the sidewalk. These can be configured as either one-way or two-way depending on the available width.

8
Figure 12 Two Way Cycle Track (Fernside Boulevard, Alameda)
4. Shared Lane Markings – Also known as Sharrows, these are road markings used to indicate a shared lane environment for bicycles and vehicles which recommend proper bicycle positioning and offer directional guidance. These markings are generally used on both local and arterial streets where there is not adequate width for full bike lanes.
Figure 13 Shared Lane Markings (Scott Street, San Francisco)
5. Parallel Bicycle Boulevard – Parallel streets with low motorized traffic volumes and speeds, designated and designed to give bicycle travel priority.

9
Figure 14 Bicycle Boulevard (Milvia Street which is parallel to Shattuck Avenue, Berkeley)
6. Colored Bike Facilities – Increases the visibility of the bicycle facility, identifies potential conflict areas, and reinforces bicycle priority in conflict areas.
Figure 15 Green Conflict Zone Markings at driveways (Fell Street, San Francisco)
7. Bicycle Through Lanes at Intersections – Enable bicyclists to correctly position themselves to
travel through the intersection, minimizing conflict and creating predictability

10
Figure 16 Through Bike Lane (Oak Street/Lake Merritt Boulevard, Oakland)
8. Intersection/Bicycle Crossing Markings – Increase bicycle visibility and reduce exposure in the intersection.
Figure 17 Intersection Bicycle Crossing Markings (Market Street/Octavia Blvd, San Francisco)
9. Bike Boxes – A designated area ahead of the travel lane that provides bicyclists with a safe and visible way to get ahead of queuing traffic.

11
Figure 18 Green Bike Box (Scott Street/Oak Street, San Francisco)
10. Two-Stage Turn Queue Boxes – Orient bicyclists properly for turning movements, provide a better way to make left turns at multi-lane signalized intersections.
Figure 19 Two-State Turn Queue Boxes (Eighth Street/Folsom Street (top) and 11th Street/ Howard Street (bottom), San Francisco)

12
11. Bicycle Turn Signal Heads – Provide for specific bicycle turn movement at signalized intersections.
Example Pending
12. Full Bicycle Signal – Standard three lens signal specifically for bicycles provide priority to bicycle
movements at intersections and accommodates bicycle-only movements.
Figure 20 Bicycle Signal (Panhandle Park along Fell Street, San Francisco)
13. Increased Bicycle Parking and Storage – Safe and convenient bicycle parking racks and storage would encourage bicycle trips to the Downtown and Caltrain.

13
Figure 21 Bicycle Parking (Embarcadero BART Station, San Francisco)
Transit Improvements The land use intensification as part of the Specific Plan will result in increased travel along El Camino Real and around downtown Menlo Park. Transit must play an important role in accommodating the increases travel to reduce the reliance on private vehicles and relieve pressure from the roadway network. The Specific Plan supports transit improvements by recommending the following:
• Increase shuttle service to serve added travel demand; • Improve east-west connectivity and reduce demand for parking in the plan area; and • Continue employer-sponsored programs that support and increase transit use.
The following improvement measures, and accompanying examples, would aid in the improvement of transit services in the El Camino Real corridor and connectivity to the Caltrain Station as outlined by the Specific Plan:
1. Bus Bulbs – Curb extensions that align the bus stop with the parking lane, allowing busses to stop and board passengers without ever leaving the travel lane.

14
Figure 22 Bus Bulb (San Francisco)
2. Far-Side Bus Stops – Located at the far side of an intersection, these allow for passengers to cross behind the bus improving visibility of crossing pedestrians for drivers waiting at the intersection.
Figure 23 Far-Side Bus Stop (San Pablo Avenue/Stanford Avenue, Oakland)
3. Midblock Bus Stops – Recommended for important destinations or locations where multiple buses may queue.

15
Figure 24 Midbock Bus Stop (Broadway at the 12th Street BART Station, Oakland)
4. Transit Signal Priority – Modifications to normal signal operation process to better
accommodate transit vehicles through preferential treatment.
5. Bus Stop Facilities – All bus stops should have improved shelters, bike racks, and expanded sidewalks to separate the waiting area from the walking area of the sidewalk.
Figure 25 Real Time Arrival Display (VTA Bus Stop)

16
Figure 26 Bus Shelter (Muni Bus Stop, San Francisco)
Streetscape Improvements The Specific Plan proposes streetscape improvements on El Camino Real that unify the street experience by using a common language of trees, paving materials, and lighting elements. The intent of these improvements is to encourage walking and pedestrian activity along El Camino Real with improved walkability and comfort. These streetscape improvements should incorporate the green street standards of the San Mateo County Sustainable Green Streets and Parking Lots Design Guidebook. This guidebook recommends sustainable stormwater facilities to minimize pollution, stream degradation, and localized flooding. The following improvement measures, and accompanying examples, would aid in streetscape improvements as outlined by the Specific Plan:
1. Street Trees – Provide tree cover to create substantial shaded pathways to encourage walking and completing tree canopy or shade where possible. Mitigate heat island effects.

17
Figure 27 Street Trees (Shattuck Avenue, Berkeley)
2. Median Enhancements – Additional trees and landscaping to complete tree canopy or shade where possible.
Figure 28 Medians (Octavia Boulevard, San Francisco)
3. Parklet – Public seating platforms that convert curbside parking spaces into community spaces along narrow or congested sidewalk to increase public space and seating.

18
Figure 29 Parklet (Clement Street, San Francisco)
Figure 29 Streetview of Parklet (Clement Street, San Francisco)
4. Temporary Street Closures – Allow cities to take better advantage of roadways and call attention to neighborhood businesses and increase foot traffic on designated corridors.

19
Figure 30 Art & Soul Festival (Downtown Oakland)
Figure 31 Farmers Market (Center Street, Berkeley)
5. Interim Public Plazas – Transforms underutilized areas of roadway into public spaces for surrounding residents and businesses.

20
Figure 323 Temporary Plaza (Telegraph Avenue at Broadway, Oakland)
Figure 33 Jane Warner Plaza (17th Street/Castro Street, San Francisco)
6. Vegetated Swales – Shallow landscaped areas designed to capture, convey, and potentially
infiltrate stormwater runoff as it moves downstream.
Figure 34 Vegetated Swale (Freedom Park Road, Sacramento County)

21
7. Infiltration/Flow-Through Planters – Contained landscaping areas designed to capture and retain stormwater runoff.
Figure 35 Flow-Through Planters (San Pablo Avenue, El Cerrito)
8. Pervious Pavement – Allows rainwater to either pass through the paving system itself or through joint openings between the pavers.
Figure 36 Porous Asphalt (Bay Street Demonstration Parking Lot, Fremont)
9. Rain Gardens – Shallow landscaped areas that can collect, slow, filter, and absorb large volumes of water delaying discharge into the watershed system.

22
Figure 37 Rain Garden (Cesar Chavez Street, San Francisco)
10. Stormwater Curb Extensions – Landscaped areas within the parking zone of a street that capture stormwater and allow it to interact with plants and soil.
Figure 29 Green Curb Extension (Donnelly Avenue, Burlingame)

23
11. Pavement Reallocation - The available pavement should be delineated to serve all needs, including travel lanes, safety islands, bike lanes, and landscaping. Therefore, it is necessary under certain circumstances to reallocate the pavement space to better serve all users. The reallocation of pavement could reduce travel speeds, improve safety and operations, enhance neighborhood character, improve access, and reduce imperious pavement area to decrease water run-off. Pavement reallocation could include the narrowing of travel lanes, the removal of supplemental turn lanes, or the removal of on-street parking. The additional space could be used to add buffers to bike lanes, construct green infrastructure elements, or extend the width of sidewalks.
Parking The proposed improvements of the Specific Plan to create additional public space, such as widened sidewalks, will affect the amount and availability of on-street parking supplies. In order to mitigate these affects, the Specific Plan recommends the construction of up to two new parking garages and the creation of a Parking Management Plan to improve the utilization of parking in downtown Menlo Park. Focusing on the Parking Management Plan, as it affects part of the curb-to-curb focus of this summary of best practices, it is recommended that it could encompass varied time limits for parking, parking pricing, and the accommodation of car-share program. Additionally, changing the design of on-street parking could have a positive effect on the available parking supply. The following management strategies and design standards, and accompanying examples, would aid in parking improvements as outlined by the Specific Plan:
1. Short On-Street Parking Time Limits – Used to encourage turnover in areas where high turnover is expected or warranted.
Figure 38 Short-Term Parking Restrictions (Berkeley)
2. Long Off-Street Parking Time Limits – Encourage employees and multi-purpose trips to park off-street to free up available spaces to improve convenience.

24
Figure 39 Early Bird Off-Street Parking Rates (Oakland)
3. Parking Pricing Strategies – Price convenient/desirable spaces at a higher rate. Set parking prices so that 85 percent of curbside spaces are occupied during peak periods.
Figure 40 Variable Parking Rates (Berkeley)

25
Figure 41 Single Point of Payment Parking Meter (Oakland)
4. Vegetated Parking Lanes – Utilize street trees or planters to separate parking spaces.
Figure 42 Trees used as buffers in parking lane (Grant Avenue, Novato)
5. Parking Lanes as Buffers – Place the parking lane between the bicycle lane and the travel lane to
increase bicycle protection.

26
Figure 43 Parking used as buffers for bike lane (JF Kenndy Drive, San Francisco)

EEl Camino Real Corridor Study
A P P E N D I X E
Traffic Forecasting Procedure


FILENAME: N:\AAA\SMX\MPA\MPA014\MODEL FORECASTING\EL_CAMINO_REAL_FORECASTS_KAI.DOCX
155 Grand Avenue, Suite 900, Oakland, CA 94612 510.839.1742 510.839.0871P F
K i t t e l s o n As s o c i a t e s , I n c .&T R A N S P O R T A T I O N E N G I N E E R I N G P L A N N I N G/
MEMORANDUM
Date: January 27, 2015 Project #: 18016
To: Steve Weinberger
W‐Trans
490 Mendocino Avenue, Suite 201
Santa Rosa. CA 95401
CC: Sam Lam
From: Damian Stefanakis, Kittelson & Associates
Project: Menlo Park El Camino Real Corridor Study
Subject: Documentation of Travel Forecasting Procedure
This memo summarizes the approach, methodology and results from the travel demand forecasting
for the Menlo Park El Camino Real Corridor study conducted by Kittelson and Associates (KAI).
KAI utilized the C/CAG‐VTA Bi‐County Travel Demand Model with 2010 and 2035 ABAG Draft SCS
(Sustainable Communities Strategy) socio‐demographic assumptions. This version of the model
represented the most current model at the commencement of the study (in June 2014).
KAI obtained permission from CCAG to use the model, and requested the latest modeling files from
CCAG and VTA staff. KAI reviewed the model input assumptions, including networks and land uses for
all Traffic Analysis Zones (TAZ) within Menlo Park. KAI also reviewed the model validation for 2010
and compared these to the study intersection counts supplied by W‐Trans. KAI transmitted network
plots and land use assumptions to W‐Trans and City staff for review and comment. Comments on
both were provided and KAI incorporated these into the model.
Network
The Countywide Model has a coarse network representation within the study area. Therefore not all
the cross streets of interest to this study are represented. So the network modifications primarily
involved the addition of missing cross streets to better represent all legs of the identified study

Menlo Park El Camino Real Corridor Study Project #: 18016 January 27, 2015 Page 2
Kittelson & Associates, Inc. Oakland, California
intersections. The plots in the Appendix describe the model network, before and after the additional
street network was coded in to better represent the 9 study intersections within the model.
Land Use
The Countywide model land uses primarily reflect ABAG assumptions at the census tract level, and
are not necessarily accurate at the individual TAZ level, especially with representing future projects
for 2035 conditions (CCAG and VTA are in the process of updating the model to Plan Bay Area
Projections and requesting input from San Mateo County jurisdictions on future general plans to
better allocate the land uses to individual TAZs. This version of the model will be released in mid‐
2015). KAI provided City of Menlo Park staff the 2010 and 2035 socio‐demographic input data. City
staff reviewed these and made appropriate adjustments to the growth and location of key future
projects in the corridor, primarily to reflect the approved El Camino Real Downtown Specific Plan.
The tables below represent the land uses before and after changes were made. Changes were
reflected primarily to the 2035 inputs.
BASELINE MODEL RUNS
KAI then ran the CCAG model with the corrected 2010 No‐Project and 2035 No‐Project scenarios. The
results were reviewed using model difference plots and finetuned based on a review of the traffic
counts until the model reasonably matched the mainline and cross street volumes. Model plots were
transmitted to W‐Trans for review and approval. Following the approval of the baseline forecasts,
KAI then extracted intersection turning volumes at the 9 study intersections for 2010 and 2035 no‐
project conditions. The turning volumes were processed using KAI’s TURNS program that uses an
industry standard NCHRP‐255 incremental adjustment method with Furness balancing. The process
essentially compares the base year model to the counts (i.e.: describes the model versus count
turning volume error at the 9 study intersections) and incrementally removes, or adjusts, the model
error out of the 2035 forecasts. KAI then made further appropriate manual adjustments to the 2035
forecasts to be consistent with turn volumes from the El Camino Real Downtown Specific Plan
primarily at the intersections at Middle Road and Cambridge Avenue where model TAZs were too
large (and in some cases the boundary crossed El Camino Real) to produce accurate turn volumes.
ALTERNATIVES
The three project alternatives consisted of a roadway capacity increase, and two bicycle alternatives.
The road capacity increase was straight forward as it represents a lane addition from 2 lanes to 3
lanes in each direction on El Camino Real within the Menlo Park City Limits. The bicycle alternatives
consisted of a buffered bike lane and a separate cycle track, and were more complex to code into the
model as they required an understanding of the model’s non‐motorized mode forecasting
procedures. KAI identified the procedures used in the model and coded the bike lanes per the
alternatives definition. KAI then conducted a sensitivity run to see how the model’s mode split and

Menlo Park El Camino Real Corridor Study Project #: 18016 January 27, 2015 Page 3
Kittelson & Associates, Inc. Oakland, California
trip assignment would respond to the new bicycle alternatives. The sensitivity runs indicated the
mode split is reasonably sensitive to addition of new bicycle infrastructure. However, the trip
assignment was very sensitive to improved bicycle facility speeds as it uses an all‐or‐nothing travel
time algorithm and diverted more bike trips than expected onto El Camino Real. This led to an
improved understanding of how the model would react and what the results mean. As a result, the
team decided that the large increase in bicycle trips in the corridor evident in the trip assignment was
more optimistic as it did not represent net new bicycle trips but more related to redistribution of
existing bicycle trips using the improved speeds in the corridor and therefore the team had less
confidence on the trip assignment results. The team decided the mode split was a better indicator of
the bicycle alternatives performance. These results were used to scale any reduction in peak hour
vehicle trips for the bicycle alternatives.
2035 Alternative 1 – Increase El Camino Real to 6‐lanes
KAI then ran the model for 2035 Alternative 1 which assumed a lane increase from 2‐lanes to 3‐lanes
in each direction in the El Camino Real corridor throughout the Menlo Park City Limits. The results
were reviewed using model difference plots and intersection turn volumes were extracted and
adjusted using the same methods described above for NCHRP‐255 and further manual adjustments to
reflect the Specific Plan.
2035 Alternative 2 – Add Buffered Bike Lane on El Camino Real
The model has a non‐motorized mode choice and trip assignment procedure. Using the model’s
built‐in bicycle parameters, KAI coded the model to represent a buffered bike lane per Alternative 2.
KAI then ran the model for 2035 Alternative 2 and reviewed the mode split results and trip
assignment results. As mentioned above, the mode split results were deemed a more reliable
indicator of the change in bicycle and vehicle trips in the corridor and therefore they were used to
compute the peak hour vehicle trips reduction for Alternative 2. The resulting vehicle trip reduction
in the corridor under Alternative 2 was very minimal (0‐1 vehicle trips per peak hour).
2035 Alternative 3 – Add Buffered Cycle Track on El Camino Real
KAI then ran the model for 2035 Alternative 3 and reviewed the mode split results and trip
assignment results. As mentioned above, the mode split results were deemed a more reliable
indicator of the change in bicycle and vehicle trips in the corridor and therefore they were used to
compute the peak hour vehicle trips reduction for Alternative 3. The resulting vehicle trip reduction
in the corridor under Alternative 2 was more significant (from 62‐94 vehicle trips per peak hour and
split for both northbound and southbound directions).

Menlo Park El Camino Real Corridor Study Project #: 18016 January 27, 2015 Page 4
Kittelson & Associates, Inc. Oakland, California
ADDITIONAL ADJUSTMENTS
W‐Trans provided KAI with the forecasts from the El Camino Real Downtown Specific Plan at the
intersections common to both studies. KAI used these forecasts to make appropriate adjustments to
the El Camino Real forecasts, primarily at two intersections of El Camino Real at Middle Road and
Cambridge Avenue. The adjustments consisted of modifying inbound and outbound trips accessing
the Specific Plan developments on the east side of El Camino Real to match the results from the
Specific Plan and reduce any double counting of trips by the model (associated with the coarse TAZ
boundary crossing El Camino Real). Adjustments on individual movements ranged from ‐24 to +64
vehicles per hour.
RESULTS
Results from the travel demand forecasting are summarized in the Appendix.

Menlo Park El Camino Real Corridor Study Project #: 18016 January 27, 2015 Page 5
Kittelson & Associates, Inc. Oakland, California
APPENDIX
Study Intersections (shown in red)

Menlo Park El Camino Real Corridor Study Project #: 18016 January 27, 2015 Page 6
Kittelson & Associates, Inc. Oakland, California
CCAG Model Network ‐ (prior to adjustments)

Menlo Park El Camino Real Corridor Study Project #: 18016 January 27, 2015 Page 7
Kittelson & Associates, Inc. Oakland, California
CCAG Model Network ‐(with additional network adjustments)

Menlo Park El Camino Real Corridor Study Project #: 18016 January 27, 2015 Page 8
Kittelson & Associates, Inc. Oakland, California
TAZ Map (Menlo Park Area TAZs)

Menlo Park El Camino Real Corridor Study Project #: 18016 January 27, 2015 Page 9
Kittelson & Associates, Inc. Oakland, California
Land Use Adjustments
Table 1: CCAG‐VTA Model ‐ 2010 & 2035 Socio‐Demographic data City Edits in red
Model TAZs in Menlo Park El Camino Study Area
Tota l Reta i l Service Other Ag Manuf Wholesa le
2010 households Jobs Jobs Jobs Jobs Jobs jobs Jobs
ZONE TOTHH HHPOP TOTPOP EMPRES SFHH MFHH TEMP RETEMP SEREMP OTHEMP AGEMP MANEMP WHOEMP
429 0 0 0 0 0 0 2679 1352 493 93 0 0 741
465 10 10 1120 431 0 10 402 0 311 91 0 0 0
466 840 1315 1316 620 240 600 1419 294 245 252 5 516 107
519 0 0 0 0 0 0 4 4 0 0 0 0 0
1584 207 495 496 182 207 0 173 47 112 11 0 0 3
1585 1282 2344 2448 1258 410 872 2193 528 34 1623 4 0 4
1586 402 812 845 400 135 267 467 62 319 51 0 2 33
1587 132 386 412 249 131 1 495 93 346 6 1 23 26
1633 208 598 600 240 208 0 110 13 83 3 0 8 3
1685 520 1333 1423 490 518 2 535 91 358 67 1 13 5
1686 89 615 656 165 89 0 400 30 265 86 1 15 3
2040 847 1602 1673 826 271 576 3234 389 633 2106 4 56 46
2041 1784 3012 3138 1623 601 1183 2033 435 921 328 5 55 289
2043 812 2138 2141 717 812 0 271 14 194 6 1 45 11
Sum 7133 14415 3352 4314 4723 22 733 1271
2035
ZONE TOTHH HHPOP TOTPOP EMPRES SFHH MFHH TEMP RETEMP SEREMP OTHEMP AGEMP MANEMP WHOEMP
429 0 0 0 0 0 0 2772 1350 501 118 0 0 803
465 10 12 1505 703 1 9 458 12 345 91 0 0 10
466 840 1314 1315 642 270 570 1608 238 219 335 5 692 119
519 0 0 0 0 0 0 6 4 0 0 0 0 2
1584 211 498 498 187 211 0 180 49 116 12 0 0 3
1585 1791 3523 3635 1820 435 1356 2395 578 154 1655 4 0 4
1586 488 1049 1086 503 143 345 1457 62 1099 261 0 2 33
1587 138 394 428 263 137 1 527 98 374 6 1 22 26
1633 212 602 604 246 212 0 114 13 87 3 0 8 3
1685 541 1356 1470 514 539 2 549 95 365 70 1 13 5
1686 93 625 681 174 93 0 407 33 270 86 1 14 3
2040 1182 2407 2483 1193 423 759 3574 491 667 2298 4 64 50
2041 2166 3883 4015 2041 639 1527 2423 545 1141 388 5 55 289
2043 887 2318 2321 812 887 0 291 14 212 8 1 45 11
Sum 8559 16761 3582 5550 5331 22 915 1361

Menlo Park El Camino Real Corridor Study Project #: 18016 January 27, 2015 Page 10
Kittelson & Associates, Inc. Oakland, California
Land Use Adjustments Cont/d
Growth
ZONE TOTHH HHPOP TOTPOP EMPRES SFHH MFHH TEMP RETEMP SEREMP OTHEMP AGEMP MANEMP WHOEMP
429 0 0 0 0 0 0 93 ‐2 8 25 0 0 62
465 0 2 385 272 1 ‐1 56 12 34 0 0 0 10
466 0 ‐1 ‐1 22 30 ‐30 189 ‐56 ‐26 83 0 176 12
519 0 0 0 0 0 0 2 0 0 0 0 0 2
1584 4 3 2 5 4 0 7 2 4 1 0 0 0
1585 509 1179 1187 562 25 484 202 50 120 32 0 0 0
1586 86 237 241 103 8 78 990 0 780 210 0 0 0
1587 6 8 16 14 6 0 32 5 28 0 0 ‐1 0
1633 4 4 4 6 4 0 4 0 4 0 0 0 0
1685 21 23 47 24 21 0 14 4 7 3 0 0 0
1686 4 10 25 9 4 0 7 3 5 0 0 ‐1 0
2040 335 805 810 367 152 183 340 102 34 192 0 8 4
2041 382 871 877 418 38 344 390 110 220 60 0 0 0
2043 75 180 180 95 75 0 20 0 18 2 0 0 0
Growth 1426 3321 3773 1897 368 1058 2346 230 1236 608 0 182 90
Percent Growth
ZONE TOTHH HHPOP TOTPOP EMPRES SFHH MFHH TEMP RETEMP SEREMP OTHEMP AGEMP MANEMP WHOEMP
429 0% 0% 0% 0% 0% 0% 3% 0% 2% 27% 0% 0% 8%
465 0% 20% 34% 63% 0% ‐10% 14% 0% 11% 0% 0% 0% 0%
466 0% 0% 0% 4% 13% ‐5% 13% ‐19% ‐11% 33% 0% 34% 11%
519 0% 0% 0% 0% 0% 0% 50% 0% 0% 0% 0% 0% 0%
1584 2% 1% 0% 3% 2% 0% 4% 4% 4% 9% 0% 0% 0%
1585 40% 50% 48% 45% 6% 56% 9% 9% 353% 2% 0% 0% 0%
1586 21% 29% 29% 26% 6% 29% 212% 0% 245% 412% 0% 0% 0%
1587 5% 2% 4% 6% 5% 0% 6% 5% 8% 0% 0% ‐4% 0%
1633 2% 1% 1% 3% 2% 0% 4% 0% 5% 0% 0% 0% 0%
1685 4% 2% 3% 5% 4% 0% 3% 4% 2% 4% 0% 0% 0%
1686 4% 2% 4% 5% 4% 0% 2% 10% 2% 0% 0% ‐7% 0%
2040 40% 50% 48% 44% 56% 32% 11% 26% 5% 9% 0% 14% 9%
2041 21% 29% 28% 26% 6% 29% 19% 25% 24% 18% 0% 0% 0%
2043 9% 8% 8% 13% 9% 0% 7% 0% 9% 33% 0% 0% 0%
% Growth 20% 16% 7% 29% 13% 0% 25% 7%

FEl Camino Real Corridor Study
A P P E N D I X F
Alternatives Analysis


Arterial Level of ServiceFuture AM Peak Hour Conditions - No Project 2/9/2015
Menlo Parl El Camino Real Corridor Study SimTraffic ReportW-Trans Page 1
Arterial Level of Service: NB El Camino Real
Delay Travel Dist ArterialCross Street Node (s/veh) time (s) (mi) SpeedAlma St 1 24.7 294.4 0.1 12Driveway Entrance 2 18.4 42.3 0.2 19
3 23.1 44.4 0.2 18Driveway Entrance 4 6.5 24.6 0.2 26Ravenswood Avenue 5 15.1 26.7 0.1 17Santa Cruz Ave 6 10.1 18.5 0.1 17Oak Grove Ave 7 10.9 20.1 0.1 17Glenwood Ave 8 61.8 80.0 0.2 9Encinal Ave 9 7.7 28.4 0.2 26Total 178.4 579.4 1.4 16
Arterial Level of Service: SB El Camino Real
Delay Travel Dist ArterialCross Street Node (s/veh) time (s) (mi) SpeedEncinal Ave 9 19.5 32.4 0.1 15Valparaiso Ave 8 107.8 126.0 0.2 6Oak Grove Ave 7 7.7 28.6 0.2 26Santa Cruz Ave 6 10.7 20.0 0.1 17Menlo Avenue 5 9.9 18.4 0.1 17Roble Avenue 4 2.0 15.2 0.1 30Middle Avenue 3 12.4 29.8 0.2 21Cambridge Avenue 2 5.2 26.4 0.2 30Sand Hill Rd 1 25.4 46.0 0.2 17Total 200.6 342.7 1.5 15

Arterial Level of ServiceFuture PM Peak Hour Conditions - No Project 2/9/2015
Menlo Parl El Camino Real Corridor Study SimTraffic ReportW-Trans Page 1
Arterial Level of Service: NB El Camino Real
Delay Travel Dist ArterialCross Street Node (s/veh) time (s) (mi) SpeedAlma St 1 65.8 84.6 0.1 5Cambridge Avenue 2 14.4 38.5 0.2 21
3 18.1 40.0 0.2 20Driveway Entrance 4 12.1 29.2 0.2 22Ravenswood Avenue 5 52.9 65.1 0.1 7Santa Cruz Ave 6 12.9 21.4 0.1 15Oak Grove Ave 7 22.1 31.0 0.1 11Glenwood Ave 8 68.5 87.1 0.2 8Encinal Ave 9 15.7 36.3 0.2 21Total 282.7 433.3 1.4 12
Arterial Level of Service: SB El Camino Real
Delay Travel Dist ArterialCross Street Node (s/veh) time (s) (mi) SpeedEncinal Ave 9 25.8 59.8 0.1 12Valparaiso Ave 8 27.3 46.0 0.2 16Oak Grove Ave 7 46.2 65.0 0.2 11Santa Cruz Ave 6 10.5 19.9 0.1 17Menlo Avenue 5 27.3 35.6 0.1 9Roble Avenue 4 2.7 14.9 0.1 31Middle Avenue 3 33.0 50.2 0.2 13Cambridge Avenue 2 11.3 32.8 0.2 24Sand Hill Rd 1 16.2 37.5 0.2 21Total 200.3 361.8 1.5 16

Arterial Level of ServiceFuture AM Peak Hour Conditions - Alternative 1 4/23/2015
Menlo Parl El Camino Real Corridor Study SimTraffic ReportW-Trans Page 1
Arterial Level of Service: NB El Camino Real
Delay Travel Dist ArterialCross Street Node (s/veh) time (s) (mi) SpeedAlma St 1 36.5 126.8 0.1 9Driveway Entrance 2 15.8 39.6 0.2 20
3 24.0 46.0 0.2 17Driveway Entrance 4 39.1 56.4 0.2 11Ravenswood Avenue 5 105.8 127.6 0.1 4Santa Cruz Ave 6 15.5 24.3 0.1 13Oak Grove Ave 7 20.5 29.9 0.1 11Glenwood Ave 8 40.6 59.9 0.2 12Encinal Ave 9 7.0 27.7 0.2 27Total 304.8 538.2 1.4 12
Arterial Level of Service: SB El Camino Real
Delay Travel Dist ArterialCross Street Node (s/veh) time (s) (mi) SpeedEncinal Ave 9 98.2 165.7 0.1 4Valparaiso Ave 8 155.8 173.4 0.2 4Oak Grove Ave 7 12.9 32.7 0.2 22Santa Cruz Ave 6 42.0 54.9 0.1 7Menlo Avenue 5 20.3 28.6 0.1 11Roble Avenue 4 2.1 14.5 0.1 32Middle Avenue 3 11.2 28.6 0.2 22Cambridge Avenue 2 6.9 28.0 0.2 28Sand Hill Rd 1 21.0 42.4 0.2 19Total 370.4 568.7 1.5 10

Arterial Level of ServiceFuture PM Peak Hour Conditions - Alternative 1 4/23/2015
Menlo Parl El Camino Real Corridor Study SimTraffic ReportW-Trans Page 1
Arterial Level of Service: NB El Camino Real
Delay Travel Dist ArterialCross Street Node (s/veh) time (s) (mi) SpeedAlma St 1 85.3 128.6 0.1 4Cambridge Avenue 2 12.7 36.5 0.2 22
3 17.7 39.6 0.2 20Driveway Entrance 4 19.8 36.8 0.2 17Ravenswood Avenue 5 63.9 76.0 0.1 6Santa Cruz Ave 6 32.9 43.4 0.1 8Oak Grove Ave 7 49.8 58.5 0.1 6Glenwood Ave 8 114.5 131.4 0.2 6Encinal Ave 9 7.9 28.8 0.2 26Total 404.4 579.7 1.4 10
Arterial Level of Service: SB El Camino Real
Delay Travel Dist ArterialCross Street Node (s/veh) time (s) (mi) SpeedEncinal Ave 9 20.9 33.6 0.1 14Valparaiso Ave 8 102.8 119.3 0.2 6Oak Grove Ave 7 15.3 34.2 0.2 21Santa Cruz Ave 6 13.6 22.8 0.1 15Menlo Avenue 5 28.8 37.2 0.1 8Roble Avenue 4 5.3 17.9 0.1 26Middle Avenue 3 32.9 49.6 0.2 13Cambridge Avenue 2 8.4 29.8 0.2 26Sand Hill Rd 1 12.9 33.8 0.2 23Total 241.0 378.2 1.5 14

Arterial Level of ServiceFuture AM Peak Hour Conditions - Alternative 2 4/23/2015
Menlo Parl El Camino Real Corridor Study SimTraffic ReportW-Trans Page 1
Arterial Level of Service: NB El Camino Real
Delay Travel Dist ArterialCross Street Node (s/veh) time (s) (mi) SpeedAlma St 1 33.8 593.7 0.1 9Driveway Entrance 2 16.5 40.4 0.2 20
3 21.4 43.6 0.2 18Driveway Entrance 4 4.3 22.1 0.2 29Ravenswood Avenue 5 19.5 31.5 0.1 15Santa Cruz Ave 6 11.6 20.1 0.1 15Oak Grove Ave 7 9.9 19.1 0.1 18Glenwood Ave 8 50.7 68.5 0.2 11Encinal Ave 9 6.4 27.0 0.2 28Total 174.1 866.0 1.4 16
Arterial Level of Service: SB El Camino Real
Delay Travel Dist ArterialCross Street Node (s/veh) time (s) (mi) SpeedEncinal Ave 9 91.0 276.7 0.1 5Valparaiso Ave 8 139.2 156.1 0.2 5Oak Grove Ave 7 4.6 24.6 0.2 30Santa Cruz Ave 6 9.7 19.0 0.1 18Menlo Avenue 5 11.4 19.9 0.1 16Roble Avenue 4 2.3 14.6 0.1 32Middle Avenue 3 11.4 29.0 0.2 22Cambridge Avenue 2 4.3 25.4 0.2 31Sand Hill Rd 1 23.0 43.8 0.2 18Total 297.0 608.9 1.5 12

Arterial Level of ServiceFuture PM Peak Hour Conditions - Alternative 2 4/23/2015
Menlo Parl El Camino Real Corridor Study SimTraffic ReportW-Trans Page 1
Arterial Level of Service: NB El Camino Real
Delay Travel Dist ArterialCross Street Node (s/veh) time (s) (mi) SpeedAlma St 1 56.2 68.4 0.1 6Cambridge Avenue 2 14.4 38.4 0.2 21
3 17.0 38.9 0.2 20Driveway Entrance 4 9.8 26.9 0.2 24Ravenswood Avenue 5 46.1 58.0 0.1 8Santa Cruz Ave 6 16.1 24.6 0.1 13Oak Grove Ave 7 25.6 34.6 0.1 10Glenwood Ave 8 78.1 96.7 0.2 8Encinal Ave 9 18.1 39.0 0.2 19Total 281.3 425.5 1.4 12
Arterial Level of Service: SB El Camino Real
Delay Travel Dist ArterialCross Street Node (s/veh) time (s) (mi) SpeedEncinal Ave 9 41.1 207.6 0.1 9Valparaiso Ave 8 34.0 52.2 0.2 14Oak Grove Ave 7 42.9 61.5 0.2 12Santa Cruz Ave 6 9.1 18.4 0.1 18Menlo Avenue 5 24.1 32.5 0.1 10Roble Avenue 4 2.7 14.8 0.1 31Middle Avenue 3 25.9 43.3 0.2 15Cambridge Avenue 2 9.0 30.5 0.2 26Sand Hill Rd 1 14.3 36.1 0.2 22Total 203.2 497.0 1.5 15

Arterial Level of ServiceFuture AM Peak Hour Conditions - Alternative 3 4/23/2015
Menlo Parl El Camino Real Corridor Study SimTraffic ReportW-Trans Page 1
Arterial Level of Service: NB El Camino Real
Delay Travel Dist ArterialCross Street Node (s/veh) time (s) (mi) SpeedAlma St 1 34.7 495.2 0.1 9Driveway Entrance 2 17.6 41.4 0.2 19
3 21.1 43.1 0.2 18Driveway Entrance 4 5.6 23.5 0.2 27Ravenswood Avenue 5 24.9 36.9 0.1 13Santa Cruz Ave 6 11.0 19.6 0.1 16Oak Grove Ave 7 13.8 23.1 0.1 15Glenwood Ave 8 48.3 66.2 0.2 11Encinal Ave 9 8.8 29.4 0.2 26Total 185.9 778.3 1.4 16
Arterial Level of Service: SB El Camino Real
Delay Travel Dist ArterialCross Street Node (s/veh) time (s) (mi) SpeedEncinal Ave 9 99.9 309.6 0.1 4Valparaiso Ave 8 154.2 170.6 0.2 4Oak Grove Ave 7 5.6 26.0 0.2 28Santa Cruz Ave 6 5.4 14.7 0.1 23Menlo Avenue 5 17.1 25.5 0.1 12Roble Avenue 4 1.9 14.2 0.1 32Middle Avenue 3 8.2 25.9 0.2 25Cambridge Avenue 2 3.8 25.1 0.2 31Sand Hill Rd 1 23.0 44.3 0.2 18Total 319.0 655.8 1.5 12

Arterial Level of ServiceFuture PM Peak Hour Conditions - Alternative 3 4/23/2015
Menlo Parl El Camino Real Corridor Study SimTraffic ReportW-Trans Page 1
Arterial Level of Service: NB El Camino Real
Delay Travel Dist ArterialCross Street Node (s/veh) time (s) (mi) SpeedAlma St 1 58.2 75.4 0.1 6Cambridge Avenue 2 14.4 38.6 0.2 21
3 16.1 37.8 0.2 21Driveway Entrance 4 24.1 41.0 0.2 16Ravenswood Avenue 5 79.7 92.0 0.1 5Santa Cruz Ave 6 25.6 34.6 0.1 9Oak Grove Ave 7 20.7 29.7 0.1 11Glenwood Ave 8 73.5 92.1 0.2 8Encinal Ave 9 24.9 45.3 0.2 17Total 337.3 486.4 1.4 11
Arterial Level of Service: SB El Camino Real
Delay Travel Dist ArterialCross Street Node (s/veh) time (s) (mi) SpeedEncinal Ave 9 39.5 205.7 0.1 9Valparaiso Ave 8 54.7 72.9 0.2 10Oak Grove Ave 7 43.2 61.3 0.2 12Santa Cruz Ave 6 8.6 17.9 0.1 19Menlo Avenue 5 21.9 30.2 0.1 10Roble Avenue 4 2.6 15.1 0.1 31Middle Avenue 3 25.6 42.8 0.2 15Cambridge Avenue 2 8.8 30.2 0.2 26Sand Hill Rd 1 13.0 34.3 0.2 23Total 217.9 510.4 1.5 15

HCM Signalized Intersection Capacity Analysis1: El Camino Real & Sand Hill Rd/Alma St 7/22/2014
Menlo Parl El Camino Real Corridor Study Synchro 8 ReportExisting AM Peak Hour Conditions - No Project W-Trans
Movement EBL EBT EBR WBL WBT WBR NBL NBT NBR SBL SBT SBRLane ConfigurationsVolume (vph) 164 0 235 0 0 439 145 505 22 359 1519 233Ideal Flow (vphpl) 1900 1900 1900 1900 1900 1900 1900 1900 1900 1900 1900 1900Total Lost time (s) 5.0 5.0 4.0 5.0 4.5 4.5 5.0 4.5 5.0Lane Util. Factor 0.97 1.00 1.00 1.00 0.91 1.00 1.00 0.91 1.00Frpb, ped/bikes 1.00 1.00 0.99 1.00 1.00 0.98 1.00 1.00 0.98Flpb, ped/bikes 1.00 1.00 1.00 1.00 1.00 1.00 1.00 1.00 1.00Frt 1.00 0.85 0.85 1.00 1.00 0.85 1.00 1.00 0.85Flt Protected 0.95 1.00 1.00 0.95 1.00 1.00 0.95 1.00 1.00Satd. Flow (prot) 3433 1576 1561 1770 5085 1549 1770 5085 1550Flt Permitted 0.95 1.00 1.00 0.95 1.00 1.00 0.95 1.00 1.00Satd. Flow (perm) 3433 1576 1561 1770 5085 1549 1770 5085 1550Peak-hour factor, PHF 0.95 0.95 0.95 0.95 0.95 0.95 0.95 0.95 0.95 0.95 0.95 0.95Adj. Flow (vph) 173 0 247 0 0 462 153 532 23 378 1599 245RTOR Reduction (vph) 0 0 174 0 0 282 0 0 0 0 0 0Lane Group Flow (vph) 173 0 73 0 0 180 153 532 23 378 1599 245Confl. Peds. (#/hr) 2Confl. Bikes (#/hr) 4 1 8Turn Type Prot pm+ov Perm Prot NA Perm Prot NA pm+ovProtected Phases 7 5 8 5 2 1 6 7Permitted Phases 7 8 2 6Actuated Green, G (s) 11.4 35.4 24.8 24.0 25.5 25.5 39.8 41.3 52.7Effective Green, g (s) 11.4 35.4 24.8 24.0 25.5 25.5 39.8 41.3 52.7Actuated g/C Ratio 0.10 0.29 0.21 0.20 0.21 0.21 0.33 0.34 0.44Clearance Time (s) 5.0 5.0 4.0 5.0 4.5 4.5 5.0 4.5 5.0Vehicle Extension (s) 3.0 3.0 0.2 3.0 3.0 3.0 3.0 3.0 3.0Lane Grp Cap (vph) 326 464 322 354 1080 329 587 1750 680v/s Ratio Prot c0.05 0.03 0.09 0.10 c0.21 c0.31 0.03v/s Ratio Perm 0.01 c0.12 0.01 0.12v/c Ratio 0.53 0.16 0.56 0.43 0.49 0.07 0.64 0.91 0.36Uniform Delay, d1 51.8 31.3 42.7 42.0 41.6 37.8 34.1 37.6 22.4Progression Factor 1.00 1.00 1.00 1.00 1.00 1.00 0.88 0.55 0.70Incremental Delay, d2 1.7 0.2 1.3 0.8 1.6 0.4 2.0 7.6 0.3Delay (s) 53.4 31.4 44.0 42.9 43.2 38.2 32.1 28.4 16.1Level of Service D C D D D D C C BApproach Delay (s) 40.5 44.0 42.9 27.7Approach LOS D D D C
Intersection SummaryHCM 2000 Control Delay 33.9 HCM 2000 Level of Service CHCM 2000 Volume to Capacity ratio 0.74Actuated Cycle Length (s) 120.0 Sum of lost time (s) 18.5Intersection Capacity Utilization 64.5% ICU Level of Service CAnalysis Period (min) 15c Critical Lane Group

HCM Signalized Intersection Capacity Analysis2: El Camino Real & Cambridge Avenue 7/22/2014
Menlo Parl El Camino Real Corridor Study Synchro 8 ReportExisting AM Peak Hour Conditions - No Project W-Trans
Movement EBL EBT EBR WBL WBT WBR NBL NBT NBR SBL SBT SBRLane ConfigurationsVolume (vph) 20 0 54 0 0 0 32 1138 0 14 2085 19Ideal Flow (vphpl) 1900 1900 1900 1900 1900 1900 1900 1900 1900 1900 1900 1900Total Lost time (s) 4.0 4.0 4.0 4.0 4.0 4.0Lane Util. Factor 1.00 1.00 1.00 0.91 1.00 0.91Frpb, ped/bikes 1.00 0.98 1.00 1.00 1.00 1.00Flpb, ped/bikes 1.00 1.00 1.00 1.00 1.00 1.00Frt 1.00 0.85 1.00 1.00 1.00 1.00Flt Protected 0.95 1.00 0.95 1.00 0.95 1.00Satd. Flow (prot) 1765 1558 1770 5085 1770 5077Flt Permitted 0.76 1.00 0.95 1.00 0.95 1.00Satd. Flow (perm) 1407 1558 1770 5085 1770 5077Peak-hour factor, PHF 0.91 0.91 0.91 0.91 0.91 0.91 0.91 0.91 0.91 0.91 0.91 0.91Adj. Flow (vph) 22 0 59 0 0 0 35 1251 0 15 2291 21RTOR Reduction (vph) 0 0 53 0 0 0 0 0 0 0 0 0Lane Group Flow (vph) 0 22 6 0 0 0 35 1251 0 15 2312 0Confl. Peds. (#/hr) 2 2 2 4Confl. Bikes (#/hr) 2 3 6Turn Type Perm NA Perm Prot NA Prot NAProtected Phases 4 8 5 2 1 6Permitted Phases 4 4 8Actuated Green, G (s) 12.6 12.6 4.7 92.8 2.6 90.7Effective Green, g (s) 12.6 12.6 4.7 92.8 2.6 90.7Actuated g/C Ratio 0.10 0.10 0.04 0.77 0.02 0.76Clearance Time (s) 4.0 4.0 4.0 4.0 4.0 4.0Vehicle Extension (s) 3.0 3.0 3.0 3.0 3.0 3.0Lane Grp Cap (vph) 147 163 69 3932 38 3837v/s Ratio Prot c0.02 0.25 0.01 c0.46v/s Ratio Perm c0.02 0.00v/c Ratio 0.15 0.04 0.51 0.32 0.39 0.60Uniform Delay, d1 48.8 48.3 56.5 4.1 57.9 6.6Progression Factor 1.00 1.00 0.97 1.25 1.11 0.20Incremental Delay, d2 0.5 0.1 5.2 0.2 5.4 0.6Delay (s) 49.3 48.4 59.8 5.3 69.4 1.9Level of Service D D E A E AApproach Delay (s) 48.6 0.0 6.8 2.3Approach LOS D A A A
Intersection SummaryHCM 2000 Control Delay 4.9 HCM 2000 Level of Service AHCM 2000 Volume to Capacity ratio 0.54Actuated Cycle Length (s) 120.0 Sum of lost time (s) 12.0Intersection Capacity Utilization 56.5% ICU Level of Service BAnalysis Period (min) 15c Critical Lane Group

HCM Signalized Intersection Capacity Analysis3: El Camino Real & Middle Avenue 7/22/2014
Menlo Parl El Camino Real Corridor Study Synchro 8 ReportExisting AM Peak Hour Conditions - No Project W-Trans
Movement EBL EBR NBL NBT SBT SBRLane ConfigurationsVolume (vph) 200 309 164 970 1754 70Ideal Flow (vphpl) 1900 1900 1900 1900 1900 1900Total Lost time (s) 3.0 3.0 3.0 4.0 4.0Lane Util. Factor 1.00 1.00 1.00 0.91 0.91Frpb, ped/bikes 1.00 1.00 1.00 1.00 1.00Flpb, ped/bikes 1.00 1.00 1.00 1.00 1.00Frt 1.00 0.85 1.00 1.00 0.99Flt Protected 0.95 1.00 0.95 1.00 1.00Satd. Flow (prot) 1770 1583 1770 5085 5046Flt Permitted 0.95 1.00 0.95 1.00 1.00Satd. Flow (perm) 1770 1583 1770 5085 5046Peak-hour factor, PHF 0.90 0.90 0.90 0.90 0.90 0.90Adj. Flow (vph) 222 343 182 1078 1949 78RTOR Reduction (vph) 0 237 0 0 3 0Lane Group Flow (vph) 222 106 182 1078 2024 0Confl. Peds. (#/hr) 3 8Confl. Bikes (#/hr) 8Turn Type Prot Perm Prot NA NAProtected Phases 4 5 2 6Permitted Phases 4Actuated Green, G (s) 20.6 20.6 17.0 92.4 72.4Effective Green, g (s) 20.6 20.6 17.0 92.4 72.4Actuated g/C Ratio 0.17 0.17 0.14 0.77 0.60Clearance Time (s) 3.0 3.0 3.0 4.0 4.0Vehicle Extension (s) 3.0 3.0 3.0 3.0 3.0Lane Grp Cap (vph) 303 271 250 3915 3044v/s Ratio Prot c0.13 c0.10 0.21 c0.40v/s Ratio Perm 0.07v/c Ratio 0.73 0.39 0.73 0.28 0.66Uniform Delay, d1 47.1 44.1 49.3 4.0 15.8Progression Factor 1.00 1.00 1.16 0.62 0.38Incremental Delay, d2 8.8 0.9 9.9 0.2 0.8Delay (s) 55.9 45.1 67.2 2.7 6.8Level of Service E D E A AApproach Delay (s) 49.3 12.0 6.8Approach LOS D B A
Intersection SummaryHCM 2000 Control Delay 14.7 HCM 2000 Level of Service BHCM 2000 Volume to Capacity ratio 0.69Actuated Cycle Length (s) 120.0 Sum of lost time (s) 10.0Intersection Capacity Utilization 65.6% ICU Level of Service CAnalysis Period (min) 15c Critical Lane Group

HCM Signalized Intersection Capacity Analysis4: El Camino Real & Roble Avenue 7/22/2014
Menlo Parl El Camino Real Corridor Study Synchro 8 ReportExisting AM Peak Hour Conditions - No Project W-Trans
Movement EBL EBT EBR WBL WBT WBR NBL NBT NBR SBL SBT SBRLane ConfigurationsVolume (vph) 60 5 50 4 4 8 41 1082 23 35 1756 31Ideal Flow (vphpl) 1900 1900 1900 1900 1900 1900 1900 1900 1900 1900 1900 1900Total Lost time (s) 4.0 4.0 4.0 4.0 4.5 4.0 4.5Lane Util. Factor 1.00 1.00 1.00 1.00 0.91 1.00 0.95Frpb, ped/bikes 1.00 1.00 0.98 1.00 1.00 1.00 1.00Flpb, ped/bikes 1.00 1.00 1.00 1.00 1.00 1.00 1.00Frt 0.94 1.00 0.85 1.00 1.00 1.00 1.00Flt Protected 0.97 0.98 1.00 0.95 1.00 0.95 1.00Satd. Flow (prot) 1708 1817 1545 1770 5067 1770 3530Flt Permitted 0.83 0.91 1.00 0.95 1.00 0.95 1.00Satd. Flow (perm) 1458 1702 1545 1770 5067 1770 3530Peak-hour factor, PHF 0.92 0.92 0.92 0.92 0.92 0.92 0.92 0.92 0.92 0.92 0.92 0.92Adj. Flow (vph) 65 5 54 4 4 9 45 1176 25 38 1909 34RTOR Reduction (vph) 0 28 0 0 0 8 0 1 0 0 1 0Lane Group Flow (vph) 0 96 0 0 8 1 45 1200 0 38 1942 0Confl. Bikes (#/hr) 6 6Turn Type Perm NA Perm NA Perm Prot NA Prot NAProtected Phases 4 8 5 2 1 6Permitted Phases 4 8 8Actuated Green, G (s) 13.2 13.2 13.2 7.8 88.7 5.6 86.5Effective Green, g (s) 13.2 13.2 13.2 7.8 88.7 5.6 86.5Actuated g/C Ratio 0.11 0.11 0.11 0.06 0.74 0.05 0.72Clearance Time (s) 4.0 4.0 4.0 4.0 4.5 4.0 4.5Vehicle Extension (s) 3.0 3.0 3.0 3.0 3.0 3.0 3.0Lane Grp Cap (vph) 160 187 169 115 3745 82 2544v/s Ratio Prot c0.03 0.24 0.02 c0.55v/s Ratio Perm c0.07 0.00 0.00v/c Ratio 0.60 0.04 0.01 0.39 0.32 0.46 0.76Uniform Delay, d1 50.9 47.8 47.6 53.8 5.3 55.7 10.4Progression Factor 1.00 1.00 1.00 0.81 1.58 0.99 0.46Incremental Delay, d2 5.9 0.1 0.0 2.1 0.2 2.5 1.4Delay (s) 56.7 47.8 47.6 45.8 8.7 57.5 6.2Level of Service E D D D A E AApproach Delay (s) 56.7 47.7 10.0 7.1Approach LOS E D A A
Intersection SummaryHCM 2000 Control Delay 10.2 HCM 2000 Level of Service BHCM 2000 Volume to Capacity ratio 0.71Actuated Cycle Length (s) 120.0 Sum of lost time (s) 12.5Intersection Capacity Utilization 69.9% ICU Level of Service CAnalysis Period (min) 15c Critical Lane Group

HCM Signalized Intersection Capacity Analysis5: El Camino Real & Menlo Avenue/Ravenswood Avenue 7/22/2014
Menlo Parl El Camino Real Corridor Study Synchro 8 ReportExisting AM Peak Hour Conditions - No Project W-Trans
Movement EBL EBT EBR WBL WBT WBR NBL NBT NBR SBL SBT SBRLane ConfigurationsVolume (vph) 18 334 46 451 243 46 94 604 385 170 1296 12Ideal Flow (vphpl) 1900 1900 1900 1900 1900 1900 1900 1900 1900 1900 1900 1900Lane Width 12 12 12 12 12 12 8 12 12 12 12 12Total Lost time (s) 4.0 4.0 4.0 4.0 4.5 5.0 5.0 4.5 5.0 5.0Lane Util. Factor 0.95 0.97 1.00 1.00 1.00 0.95 1.00 1.00 0.95 1.00Frpb, ped/bikes 1.00 1.00 1.00 0.97 1.00 1.00 0.98 1.00 1.00 0.93Flpb, ped/bikes 1.00 1.00 1.00 1.00 1.00 1.00 1.00 1.00 1.00 1.00Frt 0.98 1.00 1.00 0.85 1.00 1.00 0.85 1.00 1.00 0.85Flt Protected 1.00 0.95 1.00 1.00 0.95 1.00 1.00 0.95 1.00 1.00Satd. Flow (prot) 3455 3433 1863 1541 1534 3539 1554 1770 3539 1475Flt Permitted 1.00 0.95 1.00 1.00 0.95 1.00 1.00 0.95 1.00 1.00Satd. Flow (perm) 3455 3433 1863 1541 1534 3539 1554 1770 3539 1475Peak-hour factor, PHF 0.94 0.94 0.94 0.94 0.94 0.94 0.94 0.94 0.94 0.94 0.94 0.94Adj. Flow (vph) 19 355 49 480 259 49 100 643 410 181 1379 13RTOR Reduction (vph) 0 9 0 0 0 39 0 0 255 0 0 8Lane Group Flow (vph) 0 414 0 480 259 10 100 643 155 181 1379 5Confl. Peds. (#/hr) 5 3 14Confl. Bikes (#/hr) 15 8 5 6Turn Type Split NA Split NA Perm Prot NA Perm Prot NA PermProtected Phases 4 4 8 8 5 2 1 6Permitted Phases 8 2 6Actuated Green, G (s) 16.0 24.3 24.3 24.3 11.5 45.3 45.3 16.9 50.7 50.7Effective Green, g (s) 16.0 24.3 24.3 24.3 11.5 45.3 45.3 16.9 50.7 50.7Actuated g/C Ratio 0.13 0.20 0.20 0.20 0.10 0.38 0.38 0.14 0.42 0.42Clearance Time (s) 4.0 4.0 4.0 4.0 4.5 5.0 5.0 4.5 5.0 5.0Vehicle Extension (s) 3.0 3.0 3.0 3.0 3.0 3.0 3.0 3.0 3.0 3.0Lane Grp Cap (vph) 460 695 377 312 147 1335 586 249 1495 623v/s Ratio Prot c0.12 c0.14 0.14 0.07 0.18 c0.10 c0.39v/s Ratio Perm 0.01 0.10 0.00v/c Ratio 0.90 0.69 0.69 0.03 0.68 0.48 0.26 0.73 0.92 0.01Uniform Delay, d1 51.2 44.4 44.3 38.4 52.5 28.4 25.8 49.3 32.8 20.1Progression Factor 1.00 1.00 1.00 1.00 1.28 0.78 2.71 1.51 0.19 1.00Incremental Delay, d2 20.5 3.0 5.1 0.0 11.8 1.2 1.1 4.9 5.8 0.0Delay (s) 71.7 47.3 49.5 38.4 78.9 23.4 71.2 79.4 11.9 20.1Level of Service E D D D E C E E B CApproach Delay (s) 71.7 47.5 45.2 19.7Approach LOS E D D B
Intersection SummaryHCM 2000 Control Delay 38.3 HCM 2000 Level of Service DHCM 2000 Volume to Capacity ratio 0.86Actuated Cycle Length (s) 120.0 Sum of lost time (s) 17.5Intersection Capacity Utilization 81.6% ICU Level of Service DAnalysis Period (min) 15c Critical Lane Group

HCM Signalized Intersection Capacity Analysis6: El Camino Real & Santa Cruz Ave 7/22/2014
Menlo Parl El Camino Real Corridor Study Synchro 8 ReportExisting AM Peak Hour Conditions - No Project W-Trans
Movement EBL EBT EBR WBL WBT WBR NBL NBT NBR SBL SBT SBRLane ConfigurationsVolume (vph) 101 67 81 65 59 30 0 681 49 0 1433 62Ideal Flow (vphpl) 1900 1900 1900 1900 1900 1900 1900 1900 1900 1900 1900 1900Total Lost time (s) 4.0 4.0 4.0 4.0 4.0 4.5 4.5 4.5 4.5Lane Util. Factor 1.00 1.00 1.00 1.00 1.00 0.95 1.00 0.95 1.00Frpb, ped/bikes 1.00 1.00 0.92 1.00 0.97 1.00 0.94 1.00 0.97Flpb, ped/bikes 1.00 1.00 1.00 1.00 1.00 1.00 1.00 1.00 1.00Frt 1.00 1.00 0.85 1.00 0.95 1.00 0.85 1.00 0.85Flt Protected 0.95 1.00 1.00 0.95 1.00 1.00 1.00 1.00 1.00Satd. Flow (prot) 1770 1863 1455 1770 1716 3539 1485 3539 1537Flt Permitted 0.95 1.00 1.00 0.95 1.00 1.00 1.00 1.00 1.00Satd. Flow (perm) 1770 1863 1455 1770 1716 3539 1485 3539 1537Peak-hour factor, PHF 0.93 0.93 0.93 0.93 0.93 0.93 0.93 0.93 0.93 0.93 0.93 0.93Adj. Flow (vph) 109 72 87 70 63 32 0 732 53 0 1541 67RTOR Reduction (vph) 0 0 71 0 15 0 0 0 28 0 0 24Lane Group Flow (vph) 109 72 16 70 80 0 0 732 25 0 1541 43Confl. Peds. (#/hr) 50 58 14 3Confl. Bikes (#/hr) 9 11 4 1Turn Type Split NA Perm Split NA NA Perm NA PermProtected Phases 4 4 8 8 2 6Permitted Phases 4 2 6Actuated Green, G (s) 21.7 21.7 21.7 30.0 30.0 55.8 55.8 55.8 55.8Effective Green, g (s) 21.7 21.7 21.7 30.0 30.0 55.8 55.8 55.8 55.8Actuated g/C Ratio 0.18 0.18 0.18 0.25 0.25 0.46 0.46 0.46 0.46Clearance Time (s) 4.0 4.0 4.0 4.0 4.0 4.5 4.5 4.5 4.5Vehicle Extension (s) 3.0 3.0 3.0 3.0 3.0 3.0 3.0 3.0 3.0Lane Grp Cap (vph) 320 336 263 442 429 1645 690 1645 714v/s Ratio Prot c0.06 0.04 0.04 c0.05 0.21 c0.44v/s Ratio Perm 0.01 0.02 0.03v/c Ratio 0.34 0.21 0.06 0.16 0.19 0.44 0.04 0.94 0.06Uniform Delay, d1 42.9 41.9 40.7 35.1 35.4 21.7 17.5 30.4 17.7Progression Factor 1.00 1.00 1.00 1.00 1.00 0.56 0.81 0.46 0.72Incremental Delay, d2 0.6 0.3 0.1 0.2 0.2 0.8 0.1 9.0 0.1Delay (s) 43.5 42.2 40.8 35.3 35.6 12.9 14.2 23.0 12.8Level of Service D D D D D B B C BApproach Delay (s) 42.3 35.5 13.0 22.6Approach LOS D D B C
Intersection SummaryHCM 2000 Control Delay 22.5 HCM 2000 Level of Service CHCM 2000 Volume to Capacity ratio 0.61Actuated Cycle Length (s) 120.0 Sum of lost time (s) 12.5Intersection Capacity Utilization 75.6% ICU Level of Service DAnalysis Period (min) 15c Critical Lane Group

HCM Signalized Intersection Capacity Analysis7: El Camino Real & Oak Grove Ave 7/22/2014
Menlo Parl El Camino Real Corridor Study Synchro 8 ReportExisting AM Peak Hour Conditions - No Project W-Trans
Movement EBL EBT EBR WBL WBT WBR NBL NBT NBR SBL SBT SBRLane ConfigurationsVolume (vph) 55 139 47 86 229 45 81 658 62 88 1303 86Ideal Flow (vphpl) 1900 1900 1900 1900 1900 1900 1900 1900 1900 1900 1900 1900Total Lost time (s) 3.0 3.5 3.5 3.0 3.5 3.5 3.5 4.5 4.5 3.5 4.5 4.5Lane Util. Factor 1.00 1.00 1.00 1.00 1.00 1.00 1.00 0.95 1.00 1.00 0.95 1.00Frpb, ped/bikes 1.00 1.00 0.94 1.00 1.00 0.96 1.00 1.00 0.97 1.00 1.00 0.98Flpb, ped/bikes 1.00 1.00 1.00 1.00 1.00 1.00 1.00 1.00 1.00 1.00 1.00 1.00Frt 1.00 1.00 0.85 1.00 1.00 0.85 1.00 1.00 0.85 1.00 1.00 0.85Flt Protected 0.95 1.00 1.00 0.95 1.00 1.00 0.95 1.00 1.00 0.95 1.00 1.00Satd. Flow (prot) 1770 1863 1492 1770 1863 1522 1770 3539 1532 1770 3539 1546Flt Permitted 0.95 1.00 1.00 0.95 1.00 1.00 0.95 1.00 1.00 0.95 1.00 1.00Satd. Flow (perm) 1770 1863 1492 1770 1863 1522 1770 3539 1532 1770 3539 1546Peak-hour factor, PHF 0.93 0.93 0.93 0.93 0.93 0.93 0.93 0.93 0.93 0.93 0.93 0.93Adj. Flow (vph) 59 149 51 92 246 48 87 708 67 95 1401 92RTOR Reduction (vph) 0 0 42 0 0 38 0 0 30 0 0 29Lane Group Flow (vph) 59 149 9 92 246 10 87 708 37 95 1401 63Confl. Peds. (#/hr) 29 10 3Confl. Bikes (#/hr) 9 13 5 5Turn Type Prot NA Perm Prot NA Perm Prot NA Perm Prot NA PermProtected Phases 7 4 3 8 5 2 1 6Permitted Phases 4 8 2 6Actuated Green, G (s) 7.0 21.4 21.4 9.4 23.8 23.8 9.6 63.7 63.7 11.0 65.1 65.1Effective Green, g (s) 7.0 21.4 21.4 9.4 23.8 23.8 9.6 63.7 63.7 11.0 65.1 65.1Actuated g/C Ratio 0.06 0.18 0.18 0.08 0.20 0.20 0.08 0.53 0.53 0.09 0.54 0.54Clearance Time (s) 3.0 3.5 3.5 3.0 3.5 3.5 3.5 4.5 4.5 3.5 4.5 4.5Vehicle Extension (s) 3.0 3.0 3.0 3.0 3.0 3.0 3.0 3.0 3.0 3.0 3.0 3.0Lane Grp Cap (vph) 103 332 266 138 369 301 141 1878 813 162 1919 838v/s Ratio Prot 0.03 0.08 c0.05 c0.13 0.05 0.20 c0.05 c0.40v/s Ratio Perm 0.01 0.01 0.02 0.04v/c Ratio 0.57 0.45 0.03 0.67 0.67 0.03 0.62 0.38 0.05 0.59 0.73 0.07Uniform Delay, d1 55.0 44.0 40.8 53.8 44.4 38.8 53.4 16.5 13.5 52.3 20.8 13.1Progression Factor 1.00 1.00 1.00 1.00 1.00 1.00 1.22 0.46 0.16 1.57 0.32 0.02Incremental Delay, d2 7.5 1.0 0.1 11.5 4.5 0.0 7.3 0.5 0.1 2.8 1.3 0.1Delay (s) 62.5 45.0 40.8 65.3 48.9 38.8 72.6 8.1 2.2 85.0 8.0 0.3Level of Service E D D E D D E A A F A AApproach Delay (s) 48.2 51.6 14.1 12.2Approach LOS D D B B
Intersection SummaryHCM 2000 Control Delay 20.7 HCM 2000 Level of Service CHCM 2000 Volume to Capacity ratio 0.71Actuated Cycle Length (s) 120.0 Sum of lost time (s) 14.5Intersection Capacity Utilization 76.8% ICU Level of Service DAnalysis Period (min) 15c Critical Lane Group
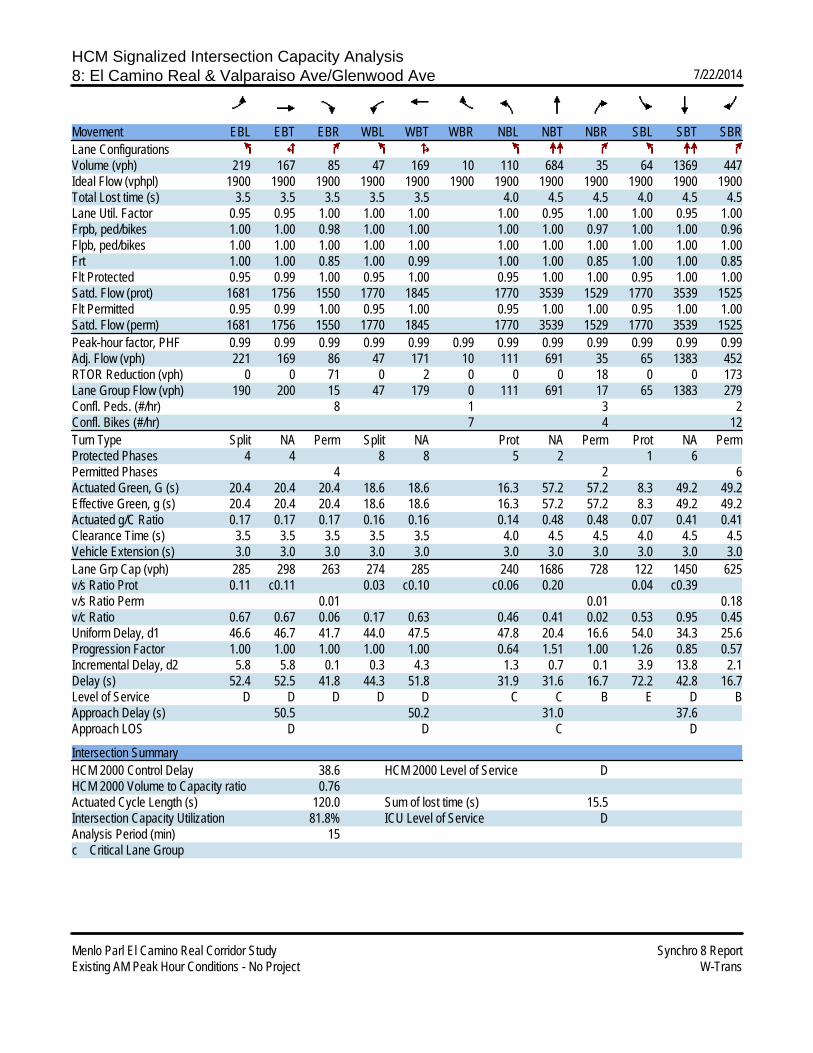
HCM Signalized Intersection Capacity Analysis8: El Camino Real & Valparaiso Ave/Glenwood Ave 7/22/2014
Menlo Parl El Camino Real Corridor Study Synchro 8 ReportExisting AM Peak Hour Conditions - No Project W-Trans
Movement EBL EBT EBR WBL WBT WBR NBL NBT NBR SBL SBT SBRLane ConfigurationsVolume (vph) 219 167 85 47 169 10 110 684 35 64 1369 447Ideal Flow (vphpl) 1900 1900 1900 1900 1900 1900 1900 1900 1900 1900 1900 1900Total Lost time (s) 3.5 3.5 3.5 3.5 3.5 4.0 4.5 4.5 4.0 4.5 4.5Lane Util. Factor 0.95 0.95 1.00 1.00 1.00 1.00 0.95 1.00 1.00 0.95 1.00Frpb, ped/bikes 1.00 1.00 0.98 1.00 1.00 1.00 1.00 0.97 1.00 1.00 0.96Flpb, ped/bikes 1.00 1.00 1.00 1.00 1.00 1.00 1.00 1.00 1.00 1.00 1.00Frt 1.00 1.00 0.85 1.00 0.99 1.00 1.00 0.85 1.00 1.00 0.85Flt Protected 0.95 0.99 1.00 0.95 1.00 0.95 1.00 1.00 0.95 1.00 1.00Satd. Flow (prot) 1681 1756 1550 1770 1845 1770 3539 1529 1770 3539 1525Flt Permitted 0.95 0.99 1.00 0.95 1.00 0.95 1.00 1.00 0.95 1.00 1.00Satd. Flow (perm) 1681 1756 1550 1770 1845 1770 3539 1529 1770 3539 1525Peak-hour factor, PHF 0.99 0.99 0.99 0.99 0.99 0.99 0.99 0.99 0.99 0.99 0.99 0.99Adj. Flow (vph) 221 169 86 47 171 10 111 691 35 65 1383 452RTOR Reduction (vph) 0 0 71 0 2 0 0 0 18 0 0 173Lane Group Flow (vph) 190 200 15 47 179 0 111 691 17 65 1383 279Confl. Peds. (#/hr) 8 1 3 2Confl. Bikes (#/hr) 7 4 12Turn Type Split NA Perm Split NA Prot NA Perm Prot NA PermProtected Phases 4 4 8 8 5 2 1 6Permitted Phases 4 2 6Actuated Green, G (s) 20.4 20.4 20.4 18.6 18.6 16.3 57.2 57.2 8.3 49.2 49.2Effective Green, g (s) 20.4 20.4 20.4 18.6 18.6 16.3 57.2 57.2 8.3 49.2 49.2Actuated g/C Ratio 0.17 0.17 0.17 0.16 0.16 0.14 0.48 0.48 0.07 0.41 0.41Clearance Time (s) 3.5 3.5 3.5 3.5 3.5 4.0 4.5 4.5 4.0 4.5 4.5Vehicle Extension (s) 3.0 3.0 3.0 3.0 3.0 3.0 3.0 3.0 3.0 3.0 3.0Lane Grp Cap (vph) 285 298 263 274 285 240 1686 728 122 1450 625v/s Ratio Prot 0.11 c0.11 0.03 c0.10 c0.06 0.20 0.04 c0.39v/s Ratio Perm 0.01 0.01 0.18v/c Ratio 0.67 0.67 0.06 0.17 0.63 0.46 0.41 0.02 0.53 0.95 0.45Uniform Delay, d1 46.6 46.7 41.7 44.0 47.5 47.8 20.4 16.6 54.0 34.3 25.6Progression Factor 1.00 1.00 1.00 1.00 1.00 0.64 1.51 1.00 1.26 0.85 0.57Incremental Delay, d2 5.8 5.8 0.1 0.3 4.3 1.3 0.7 0.1 3.9 13.8 2.1Delay (s) 52.4 52.5 41.8 44.3 51.8 31.9 31.6 16.7 72.2 42.8 16.7Level of Service D D D D D C C B E D BApproach Delay (s) 50.5 50.2 31.0 37.6Approach LOS D D C D
Intersection SummaryHCM 2000 Control Delay 38.6 HCM 2000 Level of Service DHCM 2000 Volume to Capacity ratio 0.76Actuated Cycle Length (s) 120.0 Sum of lost time (s) 15.5Intersection Capacity Utilization 81.8% ICU Level of Service DAnalysis Period (min) 15c Critical Lane Group

HCM Signalized Intersection Capacity Analysis9: El Camino Real & Encinal Ave 7/22/2014
Menlo Parl El Camino Real Corridor Study Synchro 8 ReportExisting AM Peak Hour Conditions - No Project W-Trans
Movement EBL EBT EBR WBL WBT WBR NBL NBT NBR SBL SBT SBRLane ConfigurationsVolume (vph) 4 57 9 132 20 92 14 803 105 107 1747 42Ideal Flow (vphpl) 1900 1900 1900 1900 1900 1900 1900 1900 1900 1900 1900 1900Total Lost time (s) 3.0 3.0 3.0 3.0 3.0 4.0 4.0 3.0 4.0Lane Util. Factor 1.00 1.00 1.00 1.00 1.00 0.95 1.00 1.00 0.91Frpb, ped/bikes 1.00 0.98 1.00 0.98 1.00 1.00 0.97 1.00 1.00Flpb, ped/bikes 1.00 1.00 1.00 1.00 1.00 1.00 1.00 1.00 1.00Frt 1.00 0.85 1.00 0.85 1.00 1.00 0.85 1.00 1.00Flt Protected 1.00 1.00 0.96 1.00 0.95 1.00 1.00 0.95 1.00Satd. Flow (prot) 1856 1556 1785 1549 1770 3539 1534 1770 5064Flt Permitted 0.99 1.00 0.69 1.00 0.95 1.00 1.00 0.95 1.00Satd. Flow (perm) 1836 1556 1285 1549 1770 3539 1534 1770 5064Peak-hour factor, PHF 0.98 0.98 0.98 0.98 0.98 0.98 0.98 0.98 0.98 0.98 0.98 0.98Adj. Flow (vph) 4 58 9 135 20 94 14 819 107 109 1783 43RTOR Reduction (vph) 0 0 7 0 0 78 0 0 35 0 1 0Lane Group Flow (vph) 0 62 2 0 155 16 14 819 72 109 1825 0Confl. Peds. (#/hr) 4 4 2Confl. Bikes (#/hr) 4 4 7 11Turn Type Perm NA Perm Perm NA Perm Prot NA Perm Prot NAProtected Phases 4 8 5 2 1 6Permitted Phases 4 4 8 8 2Actuated Green, G (s) 20.1 20.1 20.1 20.1 3.0 77.2 77.2 12.7 86.9Effective Green, g (s) 20.1 20.1 20.1 20.1 3.0 77.2 77.2 12.7 86.9Actuated g/C Ratio 0.17 0.17 0.17 0.17 0.02 0.64 0.64 0.11 0.72Clearance Time (s) 3.0 3.0 3.0 3.0 3.0 4.0 4.0 3.0 4.0Vehicle Extension (s) 3.0 3.0 3.0 3.0 3.0 3.0 3.0 3.0 3.0Lane Grp Cap (vph) 307 260 215 259 44 2276 986 187 3667v/s Ratio Prot 0.01 0.23 c0.06 c0.36v/s Ratio Perm 0.03 0.00 c0.12 0.01 0.05v/c Ratio 0.20 0.01 0.72 0.06 0.32 0.36 0.07 0.58 0.50Uniform Delay, d1 43.0 41.6 47.3 42.0 57.5 9.9 8.0 51.1 7.1Progression Factor 1.00 1.00 1.00 1.00 0.97 0.76 0.86 1.00 1.00Incremental Delay, d2 0.3 0.0 11.3 0.1 3.9 0.4 0.1 4.6 0.5Delay (s) 43.4 41.6 58.6 42.1 59.5 8.0 7.1 55.7 7.6Level of Service D D E D E A A E AApproach Delay (s) 43.1 52.4 8.6 10.3Approach LOS D D A B
Intersection SummaryHCM 2000 Control Delay 13.8 HCM 2000 Level of Service BHCM 2000 Volume to Capacity ratio 0.56Actuated Cycle Length (s) 120.0 Sum of lost time (s) 10.0Intersection Capacity Utilization 64.4% ICU Level of Service CAnalysis Period (min) 15c Critical Lane Group

HCM Signalized Intersection Capacity Analysis1: El Camino Real & Sand Hill Rd/Alma St 7/22/2014
Menlo Parl El Camino Real Corridor Study Synchro 8 ReportExisting PM Peak Hour Conditions - No Project W-Trans
Movement EBL EBT EBR WBL WBT WBR NBL NBT NBR SBL SBT SBRLane ConfigurationsVolume (vph) 536 0 235 0 0 714 179 1266 142 397 902 373Ideal Flow (vphpl) 1900 1900 1900 1900 1900 1900 1900 1900 1900 1900 1900 1900Total Lost time (s) 5.0 5.0 5.0 5.0 4.5 4.5 5.0 4.5 5.0Lane Util. Factor 0.97 1.00 1.00 1.00 0.91 1.00 1.00 0.91 1.00Frpb, ped/bikes 1.00 0.99 1.00 1.00 1.00 1.00 1.00 1.00 0.97Flpb, ped/bikes 1.00 1.00 1.00 1.00 1.00 1.00 1.00 1.00 1.00Frt 1.00 0.85 0.85 1.00 1.00 0.85 1.00 1.00 0.85Flt Protected 0.95 1.00 1.00 0.95 1.00 1.00 0.95 1.00 1.00Satd. Flow (prot) 3433 1566 1583 1770 5085 1583 1770 5085 1539Flt Permitted 0.95 1.00 1.00 0.95 1.00 1.00 0.95 1.00 1.00Satd. Flow (perm) 3433 1566 1583 1770 5085 1583 1770 5085 1539Peak-hour factor, PHF 0.91 0.91 0.91 0.91 0.91 0.91 0.91 0.91 0.91 0.91 0.91 0.91Adj. Flow (vph) 589 0 258 0 0 785 197 1391 156 436 991 410RTOR Reduction (vph) 0 0 186 0 0 5 0 0 0 0 0 0Lane Group Flow (vph) 589 0 72 0 0 780 197 1391 156 436 991 410Confl. Peds. (#/hr) 9 8Turn Type Prot pm+ov custom Prot NA Perm Prot NA pm+ovProtected Phases 7 5 10 5 2 1 6 7Permitted Phases 7 1 7 10 2 6Actuated Green, G (s) 18.0 35.2 85.0 17.2 31.5 31.5 31.6 45.9 63.9Effective Green, g (s) 18.0 35.2 81.0 17.2 31.5 31.5 31.6 45.9 63.9Actuated g/C Ratio 0.14 0.28 0.64 0.14 0.25 0.25 0.25 0.36 0.51Clearance Time (s) 5.0 5.0 5.0 4.5 4.5 5.0 4.5 5.0Vehicle Extension (s) 3.0 3.0 3.0 3.0 3.0 3.0 3.0 3.0Lane Grp Cap (vph) 490 437 1017 241 1271 395 443 1852 780v/s Ratio Prot c0.17 0.02 0.11 c0.27 c0.25 0.19 0.08v/s Ratio Perm 0.02 c0.49 0.10 0.19v/c Ratio 1.20 0.16 0.77 0.82 1.09 0.39 0.98 0.54 0.53Uniform Delay, d1 54.0 34.3 15.9 52.9 47.2 39.3 47.0 31.6 20.9Progression Factor 1.00 1.00 1.00 1.00 1.00 1.00 1.08 0.44 0.82Incremental Delay, d2 109.1 0.2 3.5 18.9 55.1 2.9 36.0 1.0 0.6Delay (s) 163.1 34.5 19.4 71.8 102.4 42.3 86.9 15.0 17.6Level of Service F C B E F D F B BApproach Delay (s) 123.9 19.4 93.6 32.6Approach LOS F B F C
Intersection SummaryHCM 2000 Control Delay 65.8 HCM 2000 Level of Service EHCM 2000 Volume to Capacity ratio 1.02Actuated Cycle Length (s) 126.0 Sum of lost time (s) 18.5Intersection Capacity Utilization 95.2% ICU Level of Service FAnalysis Period (min) 15c Critical Lane Group

HCM Signalized Intersection Capacity Analysis2: El Camino Real & Cambridge Avenue 7/22/2014
Menlo Parl El Camino Real Corridor Study Synchro 8 ReportExisting PM Peak Hour Conditions - No Project W-Trans
Movement EBL EBT EBR WBL WBT WBR NBL NBT NBR SBL SBT SBRLane ConfigurationsVolume (vph) 23 0 48 4 1 1 182 2211 2 13 1612 29Ideal Flow (vphpl) 1900 1900 1900 1900 1900 1900 1900 1900 1900 1900 1900 1900Total Lost time (s) 4.0 4.0 4.0 4.0 4.0 4.0 4.0Lane Util. Factor 1.00 1.00 1.00 1.00 0.91 1.00 0.91Frpb, ped/bikes 1.00 1.00 1.00 1.00 1.00 1.00 1.00Flpb, ped/bikes 1.00 1.00 1.00 1.00 1.00 1.00 1.00Frt 1.00 0.85 0.98 1.00 1.00 1.00 1.00Flt Protected 0.95 1.00 0.97 0.95 1.00 0.95 1.00Satd. Flow (prot) 1761 1583 1755 1770 5085 1770 5066Flt Permitted 0.75 1.00 0.88 0.95 1.00 0.95 1.00Satd. Flow (perm) 1397 1583 1604 1770 5085 1770 5066Peak-hour factor, PHF 0.94 0.94 0.94 0.94 0.94 0.94 0.94 0.94 0.94 0.94 0.94 0.94Adj. Flow (vph) 24 0 51 4 1 1 194 2352 2 14 1715 31RTOR Reduction (vph) 0 0 46 0 1 0 0 0 0 0 1 0Lane Group Flow (vph) 0 24 5 0 5 0 194 2354 0 14 1745 0Confl. Peds. (#/hr) 4 4 5 11Turn Type Perm NA Perm Perm NA Prot NA Prot NAProtected Phases 4 8 5 2 1 6Permitted Phases 4 4 8Actuated Green, G (s) 12.6 12.6 12.6 19.0 99.0 2.4 82.4Effective Green, g (s) 12.6 12.6 12.6 19.0 99.0 2.4 82.4Actuated g/C Ratio 0.10 0.10 0.10 0.15 0.79 0.02 0.65Clearance Time (s) 4.0 4.0 4.0 4.0 4.0 4.0 4.0Vehicle Extension (s) 3.0 3.0 3.0 3.0 3.0 3.0 3.0Lane Grp Cap (vph) 139 158 160 266 3995 33 3313v/s Ratio Prot c0.11 c0.46 0.01 0.34v/s Ratio Perm c0.02 0.00 0.00v/c Ratio 0.17 0.03 0.03 0.73 0.59 0.42 0.53Uniform Delay, d1 51.9 51.2 51.2 51.0 5.4 61.1 11.5Progression Factor 1.00 1.00 1.00 1.04 1.30 0.76 0.89Incremental Delay, d2 0.6 0.1 0.1 0.9 0.1 7.5 0.5Delay (s) 52.5 51.3 51.3 54.2 7.1 53.9 10.8Level of Service D D D D A D BApproach Delay (s) 51.7 51.3 10.6 11.1Approach LOS D D B B
Intersection SummaryHCM 2000 Control Delay 11.6 HCM 2000 Level of Service BHCM 2000 Volume to Capacity ratio 0.58Actuated Cycle Length (s) 126.0 Sum of lost time (s) 12.0Intersection Capacity Utilization 65.3% ICU Level of Service CAnalysis Period (min) 15c Critical Lane Group

HCM Signalized Intersection Capacity Analysis3: El Camino Real & Middle Avenue 7/22/2014
Menlo Parl El Camino Real Corridor Study Synchro 8 ReportExisting PM Peak Hour Conditions - No Project W-Trans
Movement EBL EBR NBL NBT SBT SBRLane ConfigurationsVolume (vph) 245 195 339 1977 1428 85Ideal Flow (vphpl) 1900 1900 1900 1900 1900 1900Total Lost time (s) 3.0 3.0 3.0 4.0 4.0Lane Util. Factor 1.00 1.00 1.00 0.91 0.91Frpb, ped/bikes 1.00 1.00 1.00 1.00 1.00Flpb, ped/bikes 1.00 1.00 1.00 1.00 1.00Frt 1.00 0.85 1.00 1.00 0.99Flt Protected 0.95 1.00 0.95 1.00 1.00Satd. Flow (prot) 1770 1583 1770 5085 5028Flt Permitted 0.95 1.00 0.95 1.00 1.00Satd. Flow (perm) 1770 1583 1770 5085 5028Peak-hour factor, PHF 0.98 0.98 0.98 0.98 0.98 0.98Adj. Flow (vph) 250 199 346 2017 1457 87RTOR Reduction (vph) 0 121 0 0 4 0Lane Group Flow (vph) 250 78 346 2017 1540 0Confl. Peds. (#/hr) 3 9Turn Type Prot Perm Prot NA NAProtected Phases 4 5 2 6Permitted Phases 4Actuated Green, G (s) 22.7 22.7 29.5 96.3 63.8Effective Green, g (s) 22.7 22.7 29.5 96.3 63.8Actuated g/C Ratio 0.18 0.18 0.23 0.76 0.51Clearance Time (s) 3.0 3.0 3.0 4.0 4.0Vehicle Extension (s) 3.0 3.0 3.0 3.0 3.0Lane Grp Cap (vph) 318 285 414 3886 2545v/s Ratio Prot c0.14 c0.20 0.40 c0.31v/s Ratio Perm 0.05v/c Ratio 0.79 0.27 0.84 0.52 0.60Uniform Delay, d1 49.3 44.5 45.9 5.8 22.1Progression Factor 1.00 1.00 1.46 0.42 0.31Incremental Delay, d2 12.1 0.5 11.8 0.4 1.0Delay (s) 61.4 45.1 78.9 2.9 7.7Level of Service E D E A AApproach Delay (s) 54.1 14.0 7.7Approach LOS D B A
Intersection SummaryHCM 2000 Control Delay 15.9 HCM 2000 Level of Service BHCM 2000 Volume to Capacity ratio 0.70Actuated Cycle Length (s) 126.0 Sum of lost time (s) 10.0Intersection Capacity Utilization 71.9% ICU Level of Service CAnalysis Period (min) 15c Critical Lane Group

HCM Signalized Intersection Capacity Analysis4: El Camino Real & Roble Avenue 7/22/2014
Menlo Parl El Camino Real Corridor Study Synchro 8 ReportExisting PM Peak Hour Conditions - No Project W-Trans
Movement EBL EBT EBR WBL WBT WBR NBL NBT NBR SBL SBT SBRLane ConfigurationsVolume (vph) 47 3 35 53 10 38 83 1944 16 72 1491 30Ideal Flow (vphpl) 1900 1900 1900 1900 1900 1900 1900 1900 1900 1900 1900 1900Total Lost time (s) 4.0 4.0 4.0 4.0 4.5 4.0 4.5Lane Util. Factor 1.00 1.00 1.00 1.00 0.91 1.00 0.91Frpb, ped/bikes 0.99 1.00 1.00 1.00 1.00 1.00 1.00Flpb, ped/bikes 1.00 0.99 1.00 1.00 1.00 1.00 1.00Frt 0.94 1.00 0.85 1.00 1.00 1.00 1.00Flt Protected 0.97 0.96 1.00 0.95 1.00 0.95 1.00Satd. Flow (prot) 1689 1762 1583 1770 5077 1770 5064Flt Permitted 0.81 0.73 1.00 0.95 1.00 0.95 1.00Satd. Flow (perm) 1412 1345 1583 1770 5077 1770 5064Peak-hour factor, PHF 0.94 0.94 0.94 0.94 0.94 0.94 0.94 0.94 0.94 0.94 0.94 0.94Adj. Flow (vph) 50 3 37 56 11 40 88 2068 17 77 1586 32RTOR Reduction (vph) 0 22 0 0 0 33 0 0 0 0 1 0Lane Group Flow (vph) 0 68 0 0 67 7 88 2085 0 77 1617 0Confl. Peds. (#/hr) 18 18 7 12Turn Type Perm NA Perm NA Perm Prot NA Prot NAProtected Phases 4 8 5 2 1 6Permitted Phases 4 8 8Actuated Green, G (s) 21.8 21.8 21.8 10.5 82.6 9.1 81.2Effective Green, g (s) 21.8 21.8 21.8 10.5 82.6 9.1 81.2Actuated g/C Ratio 0.17 0.17 0.17 0.08 0.66 0.07 0.64Clearance Time (s) 4.0 4.0 4.0 4.0 4.5 4.0 4.5Vehicle Extension (s) 3.0 3.0 3.0 3.0 3.0 3.0 3.0Lane Grp Cap (vph) 244 232 273 147 3328 127 3263v/s Ratio Prot c0.05 c0.41 0.04 0.32v/s Ratio Perm 0.05 c0.05 0.00v/c Ratio 0.28 0.29 0.03 0.60 0.63 0.61 0.50Uniform Delay, d1 45.3 45.4 43.3 55.7 12.7 56.7 11.7Progression Factor 1.00 1.00 1.00 1.01 0.77 1.00 0.70Incremental Delay, d2 0.6 0.7 0.0 5.6 0.8 5.7 0.4Delay (s) 45.9 46.0 43.3 61.8 10.5 62.6 8.6Level of Service D D D E B E AApproach Delay (s) 45.9 45.0 12.6 11.0Approach LOS D D B B
Intersection SummaryHCM 2000 Control Delay 13.5 HCM 2000 Level of Service BHCM 2000 Volume to Capacity ratio 0.57Actuated Cycle Length (s) 126.0 Sum of lost time (s) 12.5Intersection Capacity Utilization 79.7% ICU Level of Service DAnalysis Period (min) 15c Critical Lane Group

HCM Signalized Intersection Capacity Analysis5: El Camino Real & Menlo Avenue/Ravenswood Avenue 7/22/2014
Menlo Parl El Camino Real Corridor Study Synchro 8 ReportExisting PM Peak Hour Conditions - No Project W-Trans
Movement EBL EBT EBR WBL WBT WBR NBL NBT NBR SBL SBT SBRLane ConfigurationsVolume (vph) 40 285 81 441 254 80 134 1346 623 211 1104 51Ideal Flow (vphpl) 1900 1900 1900 1900 1900 1900 1900 1900 1900 1900 1900 1900Lane Width 12 12 12 12 12 12 8 12 12 12 12 12Total Lost time (s) 4.0 4.0 4.0 4.0 4.5 5.0 5.0 4.5 5.0 5.0Lane Util. Factor 0.95 0.97 1.00 1.00 1.00 0.95 1.00 1.00 0.95 1.00Frpb, ped/bikes 1.00 1.00 1.00 0.98 1.00 1.00 0.95 1.00 1.00 0.94Flpb, ped/bikes 1.00 1.00 1.00 1.00 1.00 1.00 1.00 1.00 1.00 1.00Frt 0.97 1.00 1.00 0.85 1.00 1.00 0.85 1.00 1.00 0.85Flt Protected 1.00 0.95 1.00 1.00 0.95 1.00 1.00 0.95 1.00 1.00Satd. Flow (prot) 3417 3433 1863 1553 1534 3539 1505 1770 3539 1485Flt Permitted 1.00 0.95 1.00 1.00 0.95 1.00 1.00 0.95 1.00 1.00Satd. Flow (perm) 3417 3433 1863 1553 1534 3539 1505 1770 3539 1485Peak-hour factor, PHF 0.95 0.95 0.95 0.95 0.95 0.95 0.95 0.95 0.95 0.95 0.95 0.95Adj. Flow (vph) 42 300 85 464 267 84 141 1417 656 222 1162 54RTOR Reduction (vph) 0 17 0 0 0 67 0 0 258 0 0 31Lane Group Flow (vph) 0 410 0 464 267 17 141 1417 398 222 1162 23Confl. Peds. (#/hr) 6 18 13Confl. Bikes (#/hr) 29Turn Type Split NA Split NA Perm Prot NA Perm Prot NA PermProtected Phases 4 4 8 8 5 2 1 6Permitted Phases 8 2 6Actuated Green, G (s) 16.0 25.0 25.0 25.0 14.9 48.5 48.5 19.0 52.6 52.6Effective Green, g (s) 16.0 25.0 25.0 25.0 14.9 48.5 48.5 19.0 52.6 52.6Actuated g/C Ratio 0.13 0.20 0.20 0.20 0.12 0.38 0.38 0.15 0.42 0.42Clearance Time (s) 4.0 4.0 4.0 4.0 4.5 5.0 5.0 4.5 5.0 5.0Vehicle Extension (s) 3.0 3.0 3.0 3.0 3.0 3.0 3.0 3.0 3.0 3.0Lane Grp Cap (vph) 433 681 369 308 181 1362 579 266 1477 619v/s Ratio Prot c0.12 0.14 c0.14 0.09 c0.40 c0.13 c0.33v/s Ratio Perm 0.01 0.26 0.02v/c Ratio 0.95 0.68 0.72 0.05 0.78 1.04 0.69 0.83 0.79 0.04Uniform Delay, d1 54.6 46.8 47.3 40.9 54.0 38.8 32.4 52.0 31.8 21.7Progression Factor 1.00 1.00 1.00 1.00 1.19 1.01 1.15 1.40 0.53 1.18Incremental Delay, d2 29.6 2.8 6.9 0.1 15.7 33.3 5.3 15.8 3.3 0.1Delay (s) 84.2 49.6 54.1 41.0 79.8 72.5 42.6 88.6 20.3 25.8Level of Service F D D D E E D F C CApproach Delay (s) 84.2 50.2 64.1 31.0Approach LOS F D E C
Intersection SummaryHCM 2000 Control Delay 53.8 HCM 2000 Level of Service DHCM 2000 Volume to Capacity ratio 0.91Actuated Cycle Length (s) 126.0 Sum of lost time (s) 17.5Intersection Capacity Utilization 90.6% ICU Level of Service EAnalysis Period (min) 15c Critical Lane Group

HCM Signalized Intersection Capacity Analysis6: El Camino Real & Santa Cruz Ave 7/22/2014
Menlo Parl El Camino Real Corridor Study Synchro 8 ReportExisting PM Peak Hour Conditions - No Project W-Trans
Movement EBL EBT EBR WBL WBT WBR NBL NBT NBR SBL SBT SBRLane ConfigurationsVolume (vph) 176 85 142 58 72 59 0 1431 92 0 1133 96Ideal Flow (vphpl) 1900 1900 1900 1900 1900 1900 1900 1900 1900 1900 1900 1900Total Lost time (s) 4.0 4.0 4.0 4.0 4.0 4.5 4.5 4.5 4.5Lane Util. Factor 1.00 1.00 1.00 1.00 1.00 0.95 1.00 0.95 1.00Frpb, ped/bikes 1.00 1.00 0.88 1.00 0.98 1.00 0.94 1.00 0.95Flpb, ped/bikes 1.00 1.00 1.00 1.00 1.00 1.00 1.00 1.00 1.00Frt 1.00 1.00 0.85 1.00 0.93 1.00 0.85 1.00 0.85Flt Protected 0.95 1.00 1.00 0.95 1.00 1.00 1.00 1.00 1.00Satd. Flow (prot) 1770 1863 1394 1770 1703 3539 1496 3539 1510Flt Permitted 0.95 1.00 1.00 0.95 1.00 1.00 1.00 1.00 1.00Satd. Flow (perm) 1770 1863 1394 1770 1703 3539 1496 3539 1510Peak-hour factor, PHF 0.96 0.96 0.96 0.96 0.96 0.96 0.96 0.96 0.96 0.96 0.96 0.96Adj. Flow (vph) 183 89 148 60 75 61 0 1491 96 0 1180 100RTOR Reduction (vph) 0 0 113 0 24 0 0 0 36 0 0 23Lane Group Flow (vph) 183 89 35 60 112 0 0 1491 60 0 1180 77Confl. Peds. (#/hr) 87 26 12 9Turn Type Split NA Perm Split NA NA Perm NA PermProtected Phases 4 4 8 8 2 6Permitted Phases 4 2 6Actuated Green, G (s) 30.0 30.0 30.0 25.5 25.5 58.0 58.0 58.0 58.0Effective Green, g (s) 30.0 30.0 30.0 25.5 25.5 58.0 58.0 58.0 58.0Actuated g/C Ratio 0.24 0.24 0.24 0.20 0.20 0.46 0.46 0.46 0.46Clearance Time (s) 4.0 4.0 4.0 4.0 4.0 4.5 4.5 4.5 4.5Vehicle Extension (s) 3.0 3.0 3.0 3.0 3.0 3.0 3.0 3.0 3.0Lane Grp Cap (vph) 421 443 331 358 344 1629 688 1629 695v/s Ratio Prot c0.10 0.05 0.03 c0.07 c0.42 0.33v/s Ratio Perm 0.03 0.04 0.05v/c Ratio 0.43 0.20 0.11 0.17 0.33 0.92 0.09 0.72 0.11Uniform Delay, d1 40.8 38.4 37.5 41.5 42.9 31.7 19.1 27.5 19.3Progression Factor 1.00 1.00 1.00 1.00 1.00 0.33 0.00 0.49 0.43Incremental Delay, d2 0.7 0.2 0.1 0.2 0.6 3.2 0.1 2.4 0.3Delay (s) 41.5 38.6 37.7 41.7 43.5 13.7 0.2 15.8 8.6Level of Service D D D D D B A B AApproach Delay (s) 39.5 42.9 12.9 15.2Approach LOS D D B B
Intersection SummaryHCM 2000 Control Delay 18.7 HCM 2000 Level of Service BHCM 2000 Volume to Capacity ratio 0.66Actuated Cycle Length (s) 126.0 Sum of lost time (s) 12.5Intersection Capacity Utilization 77.8% ICU Level of Service DAnalysis Period (min) 15c Critical Lane Group

HCM Signalized Intersection Capacity Analysis7: El Camino Real & Oak Grove Ave 7/22/2014
Menlo Parl El Camino Real Corridor Study Synchro 8 ReportExisting PM Peak Hour Conditions - No Project W-Trans
Movement EBL EBT EBR WBL WBT WBR NBL NBT NBR SBL SBT SBRLane ConfigurationsVolume (vph) 138 211 117 107 195 100 82 1410 96 105 1105 94Ideal Flow (vphpl) 1900 1900 1900 1900 1900 1900 1900 1900 1900 1900 1900 1900Total Lost time (s) 3.0 3.5 3.5 3.0 3.5 3.5 3.5 4.5 4.5 3.5 4.5 4.5Lane Util. Factor 1.00 1.00 1.00 1.00 1.00 1.00 1.00 0.95 1.00 1.00 0.95 1.00Frpb, ped/bikes 1.00 1.00 0.96 1.00 1.00 0.96 1.00 1.00 0.95 1.00 1.00 0.95Flpb, ped/bikes 1.00 1.00 1.00 1.00 1.00 1.00 1.00 1.00 1.00 1.00 1.00 1.00Frt 1.00 1.00 0.85 1.00 1.00 0.85 1.00 1.00 0.85 1.00 1.00 0.85Flt Protected 0.95 1.00 1.00 0.95 1.00 1.00 0.95 1.00 1.00 0.95 1.00 1.00Satd. Flow (prot) 1770 1863 1526 1770 1863 1520 1770 3539 1503 1770 3539 1503Flt Permitted 0.95 1.00 1.00 0.95 1.00 1.00 0.95 1.00 1.00 0.95 1.00 1.00Satd. Flow (perm) 1770 1863 1526 1770 1863 1520 1770 3539 1503 1770 3539 1503Peak-hour factor, PHF 0.98 0.98 0.98 0.98 0.98 0.98 0.98 0.98 0.98 0.98 0.98 0.98Adj. Flow (vph) 141 215 119 109 199 102 84 1439 98 107 1128 96RTOR Reduction (vph) 0 0 97 0 0 85 0 0 29 0 0 28Lane Group Flow (vph) 141 215 22 109 199 17 84 1439 69 107 1128 68Confl. Peds. (#/hr) 19 22 10 10Turn Type Prot NA Perm Prot NA Perm Prot NA Perm Prot NA PermProtected Phases 7 4 3 8 5 2 1 6Permitted Phases 4 8 2 6Actuated Green, G (s) 12.5 22.6 22.6 10.5 20.6 20.6 10.8 66.9 66.9 11.5 67.6 67.6Effective Green, g (s) 12.5 22.6 22.6 10.5 20.6 20.6 10.8 66.9 66.9 11.5 67.6 67.6Actuated g/C Ratio 0.10 0.18 0.18 0.08 0.16 0.16 0.09 0.53 0.53 0.09 0.54 0.54Clearance Time (s) 3.0 3.5 3.5 3.0 3.5 3.5 3.5 4.5 4.5 3.5 4.5 4.5Vehicle Extension (s) 3.0 3.0 3.0 3.0 3.0 3.0 3.0 3.0 3.0 3.0 3.0 3.0Lane Grp Cap (vph) 175 334 273 147 304 248 151 1879 798 161 1898 806v/s Ratio Prot c0.08 c0.12 0.06 0.11 0.05 c0.41 c0.06 0.32v/s Ratio Perm 0.01 0.01 0.05 0.05v/c Ratio 0.81 0.64 0.08 0.74 0.65 0.07 0.56 0.77 0.09 0.66 0.59 0.08Uniform Delay, d1 55.6 48.0 43.1 56.4 49.4 44.6 55.3 23.4 14.5 55.4 19.9 14.2Progression Factor 1.00 1.00 1.00 1.00 1.00 1.00 1.32 0.28 0.07 0.63 1.74 2.49Incremental Delay, d2 23.0 4.2 0.1 18.1 5.0 0.1 2.3 1.6 0.1 8.9 1.2 0.2Delay (s) 78.5 52.2 43.2 74.5 54.4 44.7 75.2 8.1 1.1 44.0 35.8 35.5Level of Service E D D E D D E A A D D DApproach Delay (s) 57.7 57.3 11.1 36.5Approach LOS E E B D
Intersection SummaryHCM 2000 Control Delay 30.6 HCM 2000 Level of Service CHCM 2000 Volume to Capacity ratio 0.74Actuated Cycle Length (s) 126.0 Sum of lost time (s) 14.5Intersection Capacity Utilization 83.7% ICU Level of Service EAnalysis Period (min) 15c Critical Lane Group

HCM Signalized Intersection Capacity Analysis8: El Camino Real & Valparaiso Ave/Glenwood Ave 7/22/2014
Menlo Parl El Camino Real Corridor Study Synchro 8 ReportExisting PM Peak Hour Conditions - No Project W-Trans
Movement EBL EBT EBR WBL WBT WBR NBL NBT NBR SBL SBT SBRLane ConfigurationsVolume (vph) 282 142 124 50 182 24 133 1467 22 42 918 250Ideal Flow (vphpl) 1900 1900 1900 1900 1900 1900 1900 1900 1900 1900 1900 1900Total Lost time (s) 3.5 3.5 3.5 3.5 3.5 4.0 4.5 4.5 4.0 4.5 4.5Lane Util. Factor 0.95 0.95 1.00 1.00 1.00 1.00 0.95 1.00 1.00 0.95 1.00Frpb, ped/bikes 1.00 1.00 0.98 1.00 1.00 1.00 1.00 0.97 1.00 1.00 0.98Flpb, ped/bikes 1.00 1.00 1.00 1.00 1.00 1.00 1.00 1.00 1.00 1.00 1.00Frt 1.00 1.00 0.85 1.00 0.98 1.00 1.00 0.85 1.00 1.00 0.85Flt Protected 0.95 0.98 1.00 0.95 1.00 0.95 1.00 1.00 0.95 1.00 1.00Satd. Flow (prot) 1681 1740 1555 1770 1831 1770 3539 1533 1770 3539 1547Flt Permitted 0.95 0.98 1.00 0.95 1.00 0.95 1.00 1.00 0.95 1.00 1.00Satd. Flow (perm) 1681 1740 1555 1770 1831 1770 3539 1533 1770 3539 1547Peak-hour factor, PHF 0.98 0.98 0.98 0.98 0.98 0.98 0.98 0.98 0.98 0.98 0.98 0.98Adj. Flow (vph) 288 145 127 51 186 24 136 1497 22 43 937 255RTOR Reduction (vph) 0 0 105 0 4 0 0 0 11 0 0 135Lane Group Flow (vph) 213 220 22 51 206 0 136 1497 11 43 937 120Confl. Peds. (#/hr) 5 3 1Turn Type Split NA Perm Split NA Prot NA Perm Prot NA PermProtected Phases 4 4 8 8 5 2 1 6Permitted Phases 4 2 6Actuated Green, G (s) 22.2 22.2 22.2 19.4 19.4 16.3 61.4 61.4 7.5 52.6 52.6Effective Green, g (s) 22.2 22.2 22.2 19.4 19.4 16.3 61.4 61.4 7.5 52.6 52.6Actuated g/C Ratio 0.18 0.18 0.18 0.15 0.15 0.13 0.49 0.49 0.06 0.42 0.42Clearance Time (s) 3.5 3.5 3.5 3.5 3.5 4.0 4.5 4.5 4.0 4.5 4.5Vehicle Extension (s) 3.0 3.0 3.0 3.0 3.0 3.0 3.0 3.0 3.0 3.0 3.0Lane Grp Cap (vph) 296 306 273 272 281 228 1724 747 105 1477 645v/s Ratio Prot c0.13 0.13 0.03 c0.11 c0.08 c0.42 0.02 0.26v/s Ratio Perm 0.01 0.01 0.08v/c Ratio 0.72 0.72 0.08 0.19 0.73 0.60 0.87 0.01 0.41 0.63 0.19Uniform Delay, d1 49.0 49.0 43.4 46.4 50.8 51.7 28.7 16.7 57.1 29.1 23.2Progression Factor 1.00 1.00 1.00 1.00 1.00 1.11 0.46 1.00 1.01 0.91 1.14Incremental Delay, d2 8.1 7.8 0.1 0.3 9.5 2.8 4.3 0.0 2.5 2.0 0.6Delay (s) 57.1 56.8 43.5 46.8 60.3 60.3 17.6 16.7 60.3 28.5 27.1Level of Service E E D D E E B B E C CApproach Delay (s) 53.9 57.6 21.1 29.3Approach LOS D E C C
Intersection SummaryHCM 2000 Control Delay 31.4 HCM 2000 Level of Service CHCM 2000 Volume to Capacity ratio 0.80Actuated Cycle Length (s) 126.0 Sum of lost time (s) 15.5Intersection Capacity Utilization 82.4% ICU Level of Service EAnalysis Period (min) 15c Critical Lane Group

HCM Signalized Intersection Capacity Analysis9: El Camino Real & Encinal Ave 7/22/2014
Menlo Parl El Camino Real Corridor Study Synchro 8 ReportExisting PM Peak Hour Conditions - No Project W-Trans
Movement EBL EBT EBR WBL WBT WBR NBL NBT NBR SBL SBT SBRLane ConfigurationsVolume (vph) 20 17 14 81 12 161 36 1676 96 67 1375 19Ideal Flow (vphpl) 1900 1900 1900 1900 1900 1900 1900 1900 1900 1900 1900 1900Total Lost time (s) 3.0 3.0 3.0 3.0 3.0 4.0 4.0 3.0 4.0Lane Util. Factor 1.00 1.00 1.00 1.00 1.00 0.95 1.00 1.00 0.91Frpb, ped/bikes 1.00 1.00 1.00 0.98 1.00 1.00 0.98 1.00 1.00Flpb, ped/bikes 1.00 1.00 1.00 1.00 1.00 1.00 1.00 1.00 1.00Frt 1.00 0.85 1.00 0.85 1.00 1.00 0.85 1.00 1.00Flt Protected 0.97 1.00 0.96 1.00 0.95 1.00 1.00 0.95 1.00Satd. Flow (prot) 1809 1583 1785 1555 1770 3539 1546 1770 5075Flt Permitted 0.85 1.00 0.73 1.00 0.95 1.00 1.00 0.95 1.00Satd. Flow (perm) 1579 1583 1355 1555 1770 3539 1546 1770 5075Peak-hour factor, PHF 0.99 0.99 0.99 0.99 0.99 0.99 0.99 0.99 0.99 0.99 0.99 0.99Adj. Flow (vph) 20 17 14 82 12 163 36 1693 97 68 1389 19RTOR Reduction (vph) 0 0 12 0 0 99 0 0 14 0 1 0Lane Group Flow (vph) 0 37 2 0 94 64 36 1693 83 68 1407 0Confl. Peds. (#/hr) 5 5 1Turn Type Perm NA Perm Perm NA Perm Prot NA Perm Prot NAProtected Phases 4 8 5 2 1 6Permitted Phases 4 4 8 8 2Actuated Green, G (s) 16.1 16.1 16.1 16.1 4.8 91.6 91.6 8.3 95.1Effective Green, g (s) 16.1 16.1 16.1 16.1 4.8 91.6 91.6 8.3 95.1Actuated g/C Ratio 0.13 0.13 0.13 0.13 0.04 0.73 0.73 0.07 0.75Clearance Time (s) 3.0 3.0 3.0 3.0 3.0 4.0 4.0 3.0 4.0Vehicle Extension (s) 3.0 3.0 3.0 3.0 3.0 3.0 3.0 3.0 3.0Lane Grp Cap (vph) 201 202 173 198 67 2572 1123 116 3830v/s Ratio Prot 0.02 c0.48 c0.04 0.28v/s Ratio Perm 0.02 0.00 c0.07 0.04 0.05v/c Ratio 0.18 0.01 0.54 0.32 0.54 0.66 0.07 0.59 0.37Uniform Delay, d1 49.1 48.0 51.5 50.0 59.5 9.0 5.0 57.2 5.2Progression Factor 1.00 1.00 1.00 1.00 1.23 0.29 0.04 1.00 1.00Incremental Delay, d2 0.4 0.0 3.5 0.9 4.8 0.8 0.1 7.4 0.3Delay (s) 49.5 48.0 55.0 50.9 77.9 3.4 0.3 64.5 5.5Level of Service D D D D E A A E AApproach Delay (s) 49.1 52.4 4.7 8.2Approach LOS D D A A
Intersection SummaryHCM 2000 Control Delay 10.2 HCM 2000 Level of Service BHCM 2000 Volume to Capacity ratio 0.64Actuated Cycle Length (s) 126.0 Sum of lost time (s) 10.0Intersection Capacity Utilization 74.0% ICU Level of Service DAnalysis Period (min) 15c Critical Lane Group

HCM Signalized Intersection Capacity Analysis1: El Camino Real & Sand Hill Rd/Alma St 6/2/2015
Menlo Parl El Camino Real Corridor Study Synchro 8 ReportExisting AM Peak Hour Conditions plus Alternative 1 W-Trans
Movement EBL EBT EBR WBL WBT WBR NBL NBT NBR SBL SBT SBRLane ConfigurationsVolume (vph) 165 0 235 0 0 442 157 510 21 358 1534 255Ideal Flow (vphpl) 1900 1900 1900 1900 1900 1900 1900 1900 1900 1900 1900 1900Total Lost time (s) 5.0 5.0 4.0 5.0 4.5 4.5 5.0 4.5 5.0Lane Util. Factor 0.97 1.00 1.00 1.00 0.91 1.00 1.00 0.91 1.00Frpb, ped/bikes 1.00 1.00 0.99 1.00 1.00 0.98 1.00 1.00 0.98Flpb, ped/bikes 1.00 1.00 1.00 1.00 1.00 1.00 1.00 1.00 1.00Frt 1.00 0.85 0.85 1.00 1.00 0.85 1.00 1.00 0.85Flt Protected 0.95 1.00 1.00 0.95 1.00 1.00 0.95 1.00 1.00Satd. Flow (prot) 3433 1576 1561 1770 5085 1550 1770 5085 1550Flt Permitted 0.95 1.00 1.00 0.95 1.00 1.00 0.95 1.00 1.00Satd. Flow (perm) 3433 1576 1561 1770 5085 1550 1770 5085 1550Peak-hour factor, PHF 0.95 0.95 0.95 0.95 0.95 0.95 0.95 0.95 0.95 0.95 0.95 0.95Adj. Flow (vph) 174 0 247 0 0 465 165 537 22 377 1615 268RTOR Reduction (vph) 0 0 176 0 0 373 0 0 0 0 0 0Lane Group Flow (vph) 174 0 71 0 0 92 165 537 22 377 1615 268Confl. Peds. (#/hr) 2Confl. Bikes (#/hr) 4 1 8Turn Type Prot pm+ov Perm Prot NA Perm Prot NA pm+ovProtected Phases 7 5 8 5 2 1 6 7Permitted Phases 7 8 2 6Actuated Green, G (s) 11.7 36.3 24.8 24.6 34.3 34.3 36.7 46.4 58.1Effective Green, g (s) 11.7 36.3 24.8 24.6 34.3 34.3 36.7 46.4 58.1Actuated g/C Ratio 0.09 0.29 0.20 0.20 0.27 0.27 0.29 0.37 0.46Clearance Time (s) 5.0 5.0 4.0 5.0 4.5 4.5 5.0 4.5 5.0Vehicle Extension (s) 3.0 3.0 0.2 3.0 3.0 3.0 3.0 3.0 3.0Lane Grp Cap (vph) 318 454 307 345 1384 421 515 1872 714v/s Ratio Prot c0.05 0.03 0.09 0.11 c0.21 c0.32 0.03v/s Ratio Perm 0.01 c0.06 0.01 0.14v/c Ratio 0.55 0.16 0.30 0.48 0.39 0.05 0.73 0.86 0.38Uniform Delay, d1 54.6 33.4 43.2 45.0 37.3 33.9 40.2 36.9 22.1Progression Factor 1.00 1.00 1.00 1.00 1.00 1.00 0.98 0.59 0.47Incremental Delay, d2 1.9 0.2 0.2 1.0 0.8 0.2 4.5 4.7 0.3Delay (s) 56.5 33.6 43.4 46.1 38.1 34.1 43.7 26.4 10.8Level of Service E C D D D C D C BApproach Delay (s) 43.1 43.4 39.8 27.4Approach LOS D D D C
Intersection SummaryHCM 2000 Control Delay 33.4 HCM 2000 Level of Service CHCM 2000 Volume to Capacity ratio 0.68Actuated Cycle Length (s) 126.0 Sum of lost time (s) 18.5Intersection Capacity Utilization 65.5% ICU Level of Service CAnalysis Period (min) 15c Critical Lane Group

HCM Signalized Intersection Capacity Analysis2: El Camino Real & Cambridge Avenue 6/2/2015
Menlo Parl El Camino Real Corridor Study Synchro 8 ReportExisting AM Peak Hour Conditions plus Alternative 1 W-Trans
Movement EBL EBT EBR WBL WBT WBR NBL NBT NBR SBL SBT SBRLane ConfigurationsVolume (vph) 20 0 53 0 0 0 32 1149 0 14 2115 19Ideal Flow (vphpl) 1900 1900 1900 1900 1900 1900 1900 1900 1900 1900 1900 1900Total Lost time (s) 4.0 4.0 4.0 4.0 4.0 4.0Lane Util. Factor 1.00 1.00 1.00 0.91 1.00 0.91Frpb, ped/bikes 1.00 0.98 1.00 1.00 1.00 1.00Flpb, ped/bikes 1.00 1.00 1.00 1.00 1.00 1.00Frt 1.00 0.85 1.00 1.00 1.00 1.00Flt Protected 0.95 1.00 0.95 1.00 0.95 1.00Satd. Flow (prot) 1765 1557 1770 5085 1770 5077Flt Permitted 0.76 1.00 0.95 1.00 0.95 1.00Satd. Flow (perm) 1407 1557 1770 5085 1770 5077Peak-hour factor, PHF 0.91 0.91 0.91 0.91 0.91 0.91 0.91 0.91 0.91 0.91 0.91 0.91Adj. Flow (vph) 22 0 58 0 0 0 35 1263 0 15 2324 21RTOR Reduction (vph) 0 0 52 0 0 0 0 0 0 0 0 0Lane Group Flow (vph) 0 22 6 0 0 0 35 1263 0 15 2345 0Confl. Peds. (#/hr) 2 2 2 4Confl. Bikes (#/hr) 2 3 6Turn Type Perm NA Perm Prot NA Prot NAProtected Phases 4 8 5 2 1 6Permitted Phases 4 4 8Actuated Green, G (s) 12.6 12.6 4.8 98.7 2.7 96.6Effective Green, g (s) 12.6 12.6 4.8 98.7 2.7 96.6Actuated g/C Ratio 0.10 0.10 0.04 0.78 0.02 0.77Clearance Time (s) 4.0 4.0 4.0 4.0 4.0 4.0Vehicle Extension (s) 3.0 3.0 3.0 3.0 3.0 3.0Lane Grp Cap (vph) 140 155 67 3983 37 3892v/s Ratio Prot c0.02 0.25 0.01 c0.46v/s Ratio Perm c0.02 0.00v/c Ratio 0.16 0.04 0.52 0.32 0.41 0.60Uniform Delay, d1 51.8 51.2 59.5 3.9 60.9 6.4Progression Factor 1.00 1.00 0.76 2.09 1.23 0.21Incremental Delay, d2 0.5 0.1 6.7 0.2 5.7 0.6Delay (s) 52.4 51.3 51.7 8.4 80.4 1.9Level of Service D D D A F AApproach Delay (s) 51.6 0.0 9.6 2.4Approach LOS D A A A
Intersection SummaryHCM 2000 Control Delay 6.0 HCM 2000 Level of Service AHCM 2000 Volume to Capacity ratio 0.55Actuated Cycle Length (s) 126.0 Sum of lost time (s) 12.0Intersection Capacity Utilization 57.1% ICU Level of Service BAnalysis Period (min) 15c Critical Lane Group

HCM Signalized Intersection Capacity Analysis3: El Camino Real & Middle Avenue 6/2/2015
Menlo Parl El Camino Real Corridor Study Synchro 8 ReportExisting AM Peak Hour Conditions plus Alternative 1 W-Trans
Movement EBL EBR NBL NBT SBT SBRLane ConfigurationsVolume (vph) 206 302 177 970 1796 81Ideal Flow (vphpl) 1900 1900 1900 1900 1900 1900Total Lost time (s) 3.0 3.0 3.0 4.0 4.0Lane Util. Factor 1.00 1.00 1.00 0.91 0.91Frpb, ped/bikes 1.00 1.00 1.00 1.00 1.00Flpb, ped/bikes 1.00 1.00 1.00 1.00 1.00Frt 1.00 0.85 1.00 1.00 0.99Flt Protected 0.95 1.00 0.95 1.00 1.00Satd. Flow (prot) 1770 1583 1770 5085 5041Flt Permitted 0.95 1.00 0.95 1.00 1.00Satd. Flow (perm) 1770 1583 1770 5085 5041Peak-hour factor, PHF 0.90 0.90 0.90 0.90 0.90 0.90Adj. Flow (vph) 229 336 197 1078 1996 90RTOR Reduction (vph) 0 225 0 0 3 0Lane Group Flow (vph) 229 111 197 1078 2083 0Confl. Peds. (#/hr) 3 8Confl. Bikes (#/hr) 8Turn Type Prot Perm Prot NA NAProtected Phases 4 5 2 6Permitted Phases 4Actuated Green, G (s) 21.6 21.6 18.6 97.4 75.8Effective Green, g (s) 21.6 21.6 18.6 97.4 75.8Actuated g/C Ratio 0.17 0.17 0.15 0.77 0.60Clearance Time (s) 3.0 3.0 3.0 4.0 4.0Vehicle Extension (s) 3.0 3.0 3.0 3.0 3.0Lane Grp Cap (vph) 303 271 261 3930 3032v/s Ratio Prot c0.13 c0.11 0.21 c0.41v/s Ratio Perm 0.07v/c Ratio 0.76 0.41 0.75 0.27 0.69Uniform Delay, d1 49.7 46.5 51.5 4.1 17.0Progression Factor 1.00 1.00 1.17 0.86 0.33Incremental Delay, d2 10.3 1.0 11.4 0.2 1.1Delay (s) 59.9 47.5 71.7 3.7 6.7Level of Service E D E A AApproach Delay (s) 52.6 14.2 6.7Approach LOS D B A
Intersection SummaryHCM 2000 Control Delay 15.7 HCM 2000 Level of Service BHCM 2000 Volume to Capacity ratio 0.71Actuated Cycle Length (s) 126.0 Sum of lost time (s) 10.0Intersection Capacity Utilization 67.8% ICU Level of Service CAnalysis Period (min) 15c Critical Lane Group

HCM Signalized Intersection Capacity Analysis4: El Camino Real & Roble Avenue 6/2/2015
Menlo Parl El Camino Real Corridor Study Synchro 8 ReportExisting AM Peak Hour Conditions plus Alternative 1 W-Trans
Movement EBL EBT EBR WBL WBT WBR NBL NBT NBR SBL SBT SBRLane ConfigurationsVolume (vph) 64 4 46 3 3 8 38 1092 20 37 1827 34Ideal Flow (vphpl) 1900 1900 1900 1900 1900 1900 1900 1900 1900 1900 1900 1900Total Lost time (s) 4.0 4.0 4.0 4.0 4.5 4.0 4.5Lane Util. Factor 1.00 1.00 1.00 1.00 0.91 1.00 0.91Frpb, ped/bikes 1.00 1.00 0.98 1.00 1.00 1.00 1.00Flpb, ped/bikes 1.00 1.00 1.00 1.00 1.00 1.00 1.00Frt 0.95 1.00 0.85 1.00 1.00 1.00 1.00Flt Protected 0.97 0.98 1.00 0.95 1.00 0.95 1.00Satd. Flow (prot) 1713 1817 1545 1770 5069 1770 5071Flt Permitted 0.82 0.93 1.00 0.95 1.00 0.95 1.00Satd. Flow (perm) 1448 1726 1545 1770 5069 1770 5071Peak-hour factor, PHF 0.92 0.92 0.92 0.92 0.92 0.92 0.92 0.92 0.92 0.92 0.92 0.92Adj. Flow (vph) 70 4 50 3 3 9 41 1187 22 40 1986 37RTOR Reduction (vph) 0 23 0 0 0 8 0 1 0 0 1 0Lane Group Flow (vph) 0 101 0 0 6 1 41 1208 0 40 2022 0Confl. Bikes (#/hr) 6 6Turn Type Perm NA Perm NA Perm Prot NA Prot NAProtected Phases 4 8 5 2 1 6Permitted Phases 4 8 8Actuated Green, G (s) 14.0 14.0 14.0 7.2 92.3 7.2 92.3Effective Green, g (s) 14.0 14.0 14.0 7.2 92.3 7.2 92.3Actuated g/C Ratio 0.11 0.11 0.11 0.06 0.73 0.06 0.73Clearance Time (s) 4.0 4.0 4.0 4.0 4.5 4.0 4.5Vehicle Extension (s) 3.0 3.0 3.0 3.0 3.0 3.0 3.0Lane Grp Cap (vph) 160 191 171 101 3713 101 3714v/s Ratio Prot c0.02 0.24 0.02 c0.40v/s Ratio Perm c0.07 0.00 0.00v/c Ratio 0.63 0.03 0.01 0.41 0.33 0.40 0.54Uniform Delay, d1 53.5 50.0 49.8 57.3 5.9 57.3 7.5Progression Factor 1.00 1.00 1.00 1.04 0.99 1.36 0.17Incremental Delay, d2 7.8 0.1 0.0 2.6 0.2 2.1 0.5Delay (s) 61.4 50.0 49.8 62.0 6.1 79.8 1.8Level of Service E D D E A E AApproach Delay (s) 61.4 49.9 7.9 3.3Approach LOS E D A A
Intersection SummaryHCM 2000 Control Delay 7.3 HCM 2000 Level of Service AHCM 2000 Volume to Capacity ratio 0.55Actuated Cycle Length (s) 126.0 Sum of lost time (s) 12.5Intersection Capacity Utilization 56.4% ICU Level of Service BAnalysis Period (min) 15c Critical Lane Group

HCM Signalized Intersection Capacity Analysis5: El Camino Real & Menlo Avenue/Ravenswood Avenue 6/2/2015
Menlo Parl El Camino Real Corridor Study Synchro 8 ReportExisting AM Peak Hour Conditions plus Alternative 1 W-Trans
Movement EBL EBT EBR WBL WBT WBR NBL NBT NBR SBL SBT SBRLane ConfigurationsVolume (vph) 24 4 46 310 310 82 74 663 304 404 1653 28Ideal Flow (vphpl) 1900 1900 1900 1900 1900 1900 1900 1900 1900 1900 1900 1900Lane Width 12 12 12 12 12 12 8 12 12 12 12 12Total Lost time (s) 4.0 4.0 4.0 4.0 4.5 5.0 5.0 4.5 5.0Lane Util. Factor 0.95 0.97 1.00 1.00 1.00 0.91 1.00 1.00 0.91Frpb, ped/bikes 0.95 1.00 1.00 0.97 1.00 1.00 0.98 1.00 1.00Flpb, ped/bikes 1.00 1.00 1.00 1.00 1.00 1.00 1.00 1.00 1.00Frt 0.91 1.00 1.00 0.85 1.00 1.00 0.85 1.00 1.00Flt Protected 0.98 0.95 1.00 1.00 0.95 1.00 1.00 0.95 1.00Satd. Flow (prot) 3002 3433 1863 1542 1534 5085 1552 1770 5067Flt Permitted 0.98 0.95 1.00 1.00 0.95 1.00 1.00 0.95 1.00Satd. Flow (perm) 3002 3433 1863 1542 1534 5085 1552 1770 5067Peak-hour factor, PHF 0.94 0.94 0.94 0.94 0.94 0.94 0.94 0.94 0.94 0.94 0.94 0.94Adj. Flow (vph) 26 4 49 330 330 87 79 705 323 430 1759 30RTOR Reduction (vph) 0 47 0 0 0 67 0 0 236 0 1 0Lane Group Flow (vph) 0 32 0 330 330 20 79 705 87 430 1788 0Confl. Peds. (#/hr) 5 3 14Confl. Bikes (#/hr) 15 8 5 6Turn Type Split NA Split NA Perm Prot NA Perm Prot NAProtected Phases 4 4 8 8 5 2 1 6Permitted Phases 8 2Actuated Green, G (s) 6.2 29.0 29.0 29.0 11.2 33.8 33.8 39.5 62.1Effective Green, g (s) 6.2 29.0 29.0 29.0 11.2 33.8 33.8 39.5 62.1Actuated g/C Ratio 0.05 0.23 0.23 0.23 0.09 0.27 0.27 0.31 0.49Clearance Time (s) 4.0 4.0 4.0 4.0 4.5 5.0 5.0 4.5 5.0Vehicle Extension (s) 3.0 3.0 3.0 3.0 3.0 3.0 3.0 3.0 3.0Lane Grp Cap (vph) 147 790 428 354 136 1364 416 554 2497v/s Ratio Prot c0.01 0.10 c0.18 0.05 0.14 c0.24 c0.35v/s Ratio Perm 0.01 0.06v/c Ratio 0.22 0.42 0.77 0.06 0.58 0.52 0.21 0.78 0.72Uniform Delay, d1 57.6 41.3 45.4 37.8 55.1 39.2 35.7 39.2 25.0Progression Factor 1.00 1.00 1.00 1.00 0.98 0.71 1.64 1.33 0.19Incremental Delay, d2 0.8 0.4 8.4 0.1 6.0 1.4 1.1 2.3 0.6Delay (s) 58.3 41.7 53.7 37.9 60.0 29.3 59.7 54.4 5.3Level of Service E D D D E C E D AApproach Delay (s) 58.3 46.6 40.4 14.9Approach LOS E D D B
Intersection SummaryHCM 2000 Control Delay 28.2 HCM 2000 Level of Service CHCM 2000 Volume to Capacity ratio 0.74Actuated Cycle Length (s) 126.0 Sum of lost time (s) 17.5Intersection Capacity Utilization 81.8% ICU Level of Service DAnalysis Period (min) 15c Critical Lane Group

HCM Signalized Intersection Capacity Analysis6: El Camino Real & Santa Cruz Ave 6/2/2015
Menlo Parl El Camino Real Corridor Study Synchro 8 ReportExisting AM Peak Hour Conditions plus Alternative 1 W-Trans
Movement EBL EBT EBR WBL WBT WBR NBL NBT NBR SBL SBT SBRLane ConfigurationsVolume (vph) 134 67 122 24 51 72 0 760 49 0 2178 74Ideal Flow (vphpl) 1900 1900 1900 1900 1900 1900 1900 1900 1900 1900 1900 1900Total Lost time (s) 4.0 4.0 4.0 4.0 4.0 4.5 4.5Lane Util. Factor 1.00 1.00 1.00 1.00 1.00 0.91 0.91Frpb, ped/bikes 1.00 1.00 0.92 1.00 0.95 1.00 1.00Flpb, ped/bikes 1.00 1.00 1.00 1.00 1.00 1.00 1.00Frt 1.00 1.00 0.85 1.00 0.91 0.99 1.00Flt Protected 0.95 1.00 1.00 0.95 1.00 1.00 1.00Satd. Flow (prot) 1770 1863 1451 1770 1608 5019 5055Flt Permitted 0.95 1.00 1.00 0.95 1.00 1.00 1.00Satd. Flow (perm) 1770 1863 1451 1770 1608 5019 5055Peak-hour factor, PHF 0.93 0.93 0.93 0.93 0.93 0.93 0.93 0.93 0.93 0.93 0.93 0.93Adj. Flow (vph) 144 72 131 26 55 77 0 817 53 0 2342 80RTOR Reduction (vph) 0 0 108 0 40 0 0 5 0 0 3 0Lane Group Flow (vph) 144 72 23 26 92 0 0 865 0 0 2419 0Confl. Peds. (#/hr) 50 58 14 3Confl. Bikes (#/hr) 9 11 4 1Turn Type Split NA Perm Split NA NA NAProtected Phases 4 4 8 8 2 6Permitted Phases 4Actuated Green, G (s) 22.6 22.6 22.6 30.0 30.0 60.9 60.9Effective Green, g (s) 22.6 22.6 22.6 30.0 30.0 60.9 60.9Actuated g/C Ratio 0.18 0.18 0.18 0.24 0.24 0.48 0.48Clearance Time (s) 4.0 4.0 4.0 4.0 4.0 4.5 4.5Vehicle Extension (s) 3.0 3.0 3.0 3.0 3.0 3.0 3.0Lane Grp Cap (vph) 317 334 260 421 382 2425 2443v/s Ratio Prot c0.08 0.04 0.01 c0.06 0.17 c0.48v/s Ratio Perm 0.02v/c Ratio 0.45 0.22 0.09 0.06 0.24 0.36 0.99Uniform Delay, d1 46.2 44.1 43.1 37.1 38.8 20.3 32.3Progression Factor 1.00 1.00 1.00 1.00 1.00 0.73 0.26Incremental Delay, d2 1.0 0.3 0.2 0.1 0.3 0.4 11.4Delay (s) 47.2 44.5 43.3 37.2 39.1 15.2 19.7Level of Service D D D D D B BApproach Delay (s) 45.2 38.8 15.2 19.7Approach LOS D D B B
Intersection SummaryHCM 2000 Control Delay 21.8 HCM 2000 Level of Service CHCM 2000 Volume to Capacity ratio 0.69Actuated Cycle Length (s) 126.0 Sum of lost time (s) 12.5Intersection Capacity Utilization 84.4% ICU Level of Service EAnalysis Period (min) 15c Critical Lane Group

HCM Signalized Intersection Capacity Analysis7: El Camino Real & Oak Grove Ave 6/2/2015
Menlo Parl El Camino Real Corridor Study Synchro 8 ReportExisting AM Peak Hour Conditions plus Alternative 1 W-Trans
Movement EBL EBT EBR WBL WBT WBR NBL NBT NBR SBL SBT SBRLane ConfigurationsVolume (vph) 49 127 65 109 222 37 102 700 66 91 2074 105Ideal Flow (vphpl) 1900 1900 1900 1900 1900 1900 1900 1900 1900 1900 1900 1900Total Lost time (s) 3.0 3.5 3.5 3.0 3.5 3.5 3.5 4.5 3.5 4.5Lane Util. Factor 1.00 1.00 1.00 1.00 1.00 1.00 1.00 0.91 1.00 0.91Frpb, ped/bikes 1.00 1.00 0.94 1.00 1.00 0.96 1.00 1.00 1.00 1.00Flpb, ped/bikes 1.00 1.00 1.00 1.00 1.00 1.00 1.00 1.00 1.00 1.00Frt 1.00 1.00 0.85 1.00 1.00 0.85 1.00 0.99 1.00 0.99Flt Protected 0.95 1.00 1.00 0.95 1.00 1.00 0.95 1.00 0.95 1.00Satd. Flow (prot) 1770 1863 1488 1770 1863 1520 1770 5005 1770 5043Flt Permitted 0.95 1.00 1.00 0.95 1.00 1.00 0.95 1.00 0.95 1.00Satd. Flow (perm) 1770 1863 1488 1770 1863 1520 1770 5005 1770 5043Peak-hour factor, PHF 0.93 0.93 0.93 0.93 0.93 0.93 0.93 0.93 0.93 0.93 0.93 0.93Adj. Flow (vph) 53 137 70 117 239 40 110 753 71 98 2230 113RTOR Reduction (vph) 0 0 58 0 0 32 0 8 0 0 4 0Lane Group Flow (vph) 53 137 12 117 239 8 110 816 0 98 2339 0Confl. Peds. (#/hr) 29 10 3Confl. Bikes (#/hr) 9 13 5 5Turn Type Prot NA Perm Prot NA Perm Prot NA Prot NAProtected Phases 7 4 3 8 5 2 1 6Permitted Phases 4 8Actuated Green, G (s) 6.9 21.7 21.7 9.0 23.8 23.8 11.5 69.2 11.6 69.3Effective Green, g (s) 6.9 21.7 21.7 9.0 23.8 23.8 11.5 69.2 11.6 69.3Actuated g/C Ratio 0.05 0.17 0.17 0.07 0.19 0.19 0.09 0.55 0.09 0.55Clearance Time (s) 3.0 3.5 3.5 3.0 3.5 3.5 3.5 4.5 3.5 4.5Vehicle Extension (s) 3.0 3.0 3.0 3.0 3.0 3.0 3.0 3.0 3.0 3.0Lane Grp Cap (vph) 96 320 256 126 351 287 161 2748 162 2773v/s Ratio Prot 0.03 0.07 c0.07 c0.13 c0.06 0.16 0.06 c0.46v/s Ratio Perm 0.01 0.00v/c Ratio 0.55 0.43 0.05 0.93 0.68 0.03 0.68 0.30 0.60 0.84Uniform Delay, d1 58.0 46.6 43.5 58.2 47.6 41.7 55.5 15.3 55.0 23.8Progression Factor 1.00 1.00 1.00 1.00 1.00 1.00 0.90 1.92 1.23 0.46Incremental Delay, d2 6.7 0.9 0.1 57.8 5.4 0.0 10.8 0.3 0.6 0.3Delay (s) 64.8 47.5 43.6 116.0 52.9 41.7 60.5 29.6 68.4 11.2Level of Service E D D F D D E C E BApproach Delay (s) 50.0 70.4 33.3 13.5Approach LOS D E C B
Intersection SummaryHCM 2000 Control Delay 26.0 HCM 2000 Level of Service CHCM 2000 Volume to Capacity ratio 0.80Actuated Cycle Length (s) 126.0 Sum of lost time (s) 14.5Intersection Capacity Utilization 85.4% ICU Level of Service EAnalysis Period (min) 15c Critical Lane Group

HCM Signalized Intersection Capacity Analysis8: El Camino Real & Valparaiso Ave/Glenwood Ave 6/2/2015
Menlo Parl El Camino Real Corridor Study Synchro 8 ReportExisting AM Peak Hour Conditions plus Alternative 1 W-Trans
Movement EBL EBT EBR WBL WBT WBR NBL NBT NBR SBL SBT SBRLane ConfigurationsVolume (vph) 194 173 169 130 247 12 133 701 41 47 1931 333Ideal Flow (vphpl) 1900 1900 1900 1900 1900 1900 1900 1900 1900 1900 1900 1900Total Lost time (s) 3.5 3.5 3.5 3.5 3.5 4.0 4.5 4.0 4.5Lane Util. Factor 0.95 0.95 1.00 1.00 1.00 1.00 0.91 1.00 0.91Frpb, ped/bikes 1.00 1.00 0.98 1.00 1.00 1.00 1.00 1.00 0.99Flpb, ped/bikes 1.00 1.00 1.00 1.00 1.00 1.00 1.00 1.00 1.00Frt 1.00 1.00 0.85 1.00 0.99 1.00 0.99 1.00 0.98Flt Protected 0.95 0.99 1.00 0.95 1.00 0.95 1.00 0.95 1.00Satd. Flow (prot) 1681 1761 1549 1770 1848 1770 5034 1770 4945Flt Permitted 0.95 0.99 1.00 0.95 1.00 0.95 1.00 0.95 1.00Satd. Flow (perm) 1681 1761 1549 1770 1848 1770 5034 1770 4945Peak-hour factor, PHF 0.99 0.99 0.99 0.99 0.99 0.99 0.99 0.99 0.99 0.99 0.99 0.99Adj. Flow (vph) 196 175 171 131 249 12 134 708 41 47 1951 336RTOR Reduction (vph) 0 0 143 0 2 0 0 4 0 0 18 0Lane Group Flow (vph) 176 195 28 131 259 0 134 745 0 47 2269 0Confl. Peds. (#/hr) 8 1 3 2Confl. Bikes (#/hr) 7 4 12Turn Type Split NA Perm Split NA Prot NA Prot NAProtected Phases 4 4 8 8 5 2 1 6Permitted Phases 4Actuated Green, G (s) 20.7 20.7 20.7 23.2 23.2 19.4 59.0 7.6 47.2Effective Green, g (s) 20.7 20.7 20.7 23.2 23.2 19.4 59.0 7.6 47.2Actuated g/C Ratio 0.16 0.16 0.16 0.18 0.18 0.15 0.47 0.06 0.37Clearance Time (s) 3.5 3.5 3.5 3.5 3.5 4.0 4.5 4.0 4.5Vehicle Extension (s) 3.0 3.0 3.0 3.0 3.0 3.0 3.0 3.0 3.0Lane Grp Cap (vph) 276 289 254 325 340 272 2357 106 1852v/s Ratio Prot 0.10 c0.11 0.07 c0.14 c0.08 0.15 0.03 c0.46v/s Ratio Perm 0.02v/c Ratio 0.64 0.67 0.11 0.40 0.76 0.49 0.32 0.44 1.23Uniform Delay, d1 49.1 49.5 44.8 45.3 48.8 48.8 20.9 57.2 39.4Progression Factor 1.00 1.00 1.00 1.00 1.00 1.26 0.74 1.36 0.84Incremental Delay, d2 4.8 6.1 0.2 0.8 9.7 1.4 0.3 2.5 105.7Delay (s) 53.9 55.6 45.0 46.1 58.5 62.8 15.9 80.2 138.6Level of Service D E D D E E B F FApproach Delay (s) 51.7 54.4 23.0 137.5Approach LOS D D C F
Intersection SummaryHCM 2000 Control Delay 94.1 HCM 2000 Level of Service FHCM 2000 Volume to Capacity ratio 0.90Actuated Cycle Length (s) 126.0 Sum of lost time (s) 15.5Intersection Capacity Utilization 93.7% ICU Level of Service FAnalysis Period (min) 15c Critical Lane Group

HCM Signalized Intersection Capacity Analysis9: El Camino Real & Encinal Ave 6/2/2015
Menlo Parl El Camino Real Corridor Study Synchro 8 ReportExisting AM Peak Hour Conditions plus Alternative 1 W-Trans
Movement EBL EBT EBR WBL WBT WBR NBL NBT NBR SBL SBT SBRLane ConfigurationsVolume (vph) 3 55 12 164 18 69 17 814 120 85 2041 37Ideal Flow (vphpl) 1900 1900 1900 1900 1900 1900 1900 1900 1900 1900 1900 1900Total Lost time (s) 3.0 3.0 3.0 3.0 3.0 4.0 3.0 4.0Lane Util. Factor 1.00 1.00 1.00 1.00 1.00 0.91 1.00 0.91Frpb, ped/bikes 1.00 0.98 1.00 0.98 1.00 1.00 1.00 1.00Flpb, ped/bikes 1.00 1.00 1.00 1.00 1.00 1.00 1.00 1.00Frt 1.00 0.85 1.00 0.85 1.00 0.98 1.00 1.00Flt Protected 1.00 1.00 0.96 1.00 0.95 1.00 0.95 1.00Satd. Flow (prot) 1858 1557 1782 1549 1770 4967 1770 5069Flt Permitted 0.99 1.00 0.69 1.00 0.95 1.00 0.95 1.00Satd. Flow (perm) 1843 1557 1285 1549 1770 4967 1770 5069Peak-hour factor, PHF 0.98 0.98 0.98 0.98 0.98 0.98 0.98 0.98 0.98 0.98 0.98 0.98Adj. Flow (vph) 3 56 12 167 18 70 17 831 122 87 2083 38RTOR Reduction (vph) 0 0 10 0 0 50 0 11 0 0 1 0Lane Group Flow (vph) 0 59 2 0 185 20 17 942 0 87 2120 0Confl. Peds. (#/hr) 4 4 2Confl. Bikes (#/hr) 4 4 7 11Turn Type Perm NA Perm Perm NA Perm Prot NA Prot NAProtected Phases 4 8 5 2 1 6Permitted Phases 4 4 8 8Actuated Green, G (s) 23.1 23.1 23.1 23.1 3.2 81.4 11.5 89.7Effective Green, g (s) 23.1 23.1 23.1 23.1 3.2 81.4 11.5 89.7Actuated g/C Ratio 0.18 0.18 0.18 0.18 0.03 0.65 0.09 0.71Clearance Time (s) 3.0 3.0 3.0 3.0 3.0 4.0 3.0 4.0Vehicle Extension (s) 3.0 3.0 3.0 3.0 3.0 3.0 3.0 3.0Lane Grp Cap (vph) 337 285 235 283 44 3208 161 3608v/s Ratio Prot 0.01 0.19 c0.05 c0.42v/s Ratio Perm 0.03 0.00 c0.14 0.01v/c Ratio 0.18 0.01 0.79 0.07 0.39 0.29 0.54 0.59Uniform Delay, d1 43.4 42.1 49.1 42.6 60.4 9.7 54.7 9.0Progression Factor 1.00 1.00 1.00 1.00 0.72 1.60 1.00 1.00Incremental Delay, d2 0.2 0.0 15.9 0.1 5.4 0.2 3.7 0.7Delay (s) 43.7 42.1 65.0 42.7 48.6 15.8 58.4 9.7Level of Service D D E D D B E AApproach Delay (s) 43.4 58.8 16.4 11.6Approach LOS D E B B
Intersection SummaryHCM 2000 Control Delay 17.0 HCM 2000 Level of Service BHCM 2000 Volume to Capacity ratio 0.63Actuated Cycle Length (s) 126.0 Sum of lost time (s) 10.0Intersection Capacity Utilization 71.4% ICU Level of Service CAnalysis Period (min) 15c Critical Lane Group

HCM Signalized Intersection Capacity Analysis1: El Camino Real & Sand Hill Rd/Alma St 6/2/2015
Menlo Parl El Camino Real Corridor Study Synchro 8 ReportExisting PM Peak Hour Conditions plus Alternative 1 W-Trans
Movement EBL EBT EBR WBL WBT WBR NBL NBT NBR SBL SBT SBRLane ConfigurationsVolume (vph) 555 0 244 0 0 719 180 1320 143 402 948 379Ideal Flow (vphpl) 1900 1900 1900 1900 1900 1900 1900 1900 1900 1900 1900 1900Total Lost time (s) 5.0 5.0 5.0 5.0 4.5 4.5 5.0 4.5 5.0Lane Util. Factor 0.97 1.00 1.00 1.00 0.91 1.00 1.00 0.91 1.00Frpb, ped/bikes 1.00 0.99 1.00 1.00 1.00 1.00 1.00 1.00 0.97Flpb, ped/bikes 1.00 1.00 1.00 1.00 1.00 1.00 1.00 1.00 1.00Frt 1.00 0.85 0.85 1.00 1.00 0.85 1.00 1.00 0.85Flt Protected 0.95 1.00 1.00 0.95 1.00 1.00 0.95 1.00 1.00Satd. Flow (prot) 3433 1566 1583 1770 5085 1583 1770 5085 1537Flt Permitted 0.95 1.00 1.00 0.95 1.00 1.00 0.95 1.00 1.00Satd. Flow (perm) 3433 1566 1583 1770 5085 1583 1770 5085 1537Peak-hour factor, PHF 0.91 0.91 0.91 0.91 0.91 0.91 0.91 0.91 0.91 0.91 0.91 0.91Adj. Flow (vph) 610 0 268 0 0 790 198 1451 157 442 1042 416RTOR Reduction (vph) 0 0 192 0 0 4 0 0 0 0 0 0Lane Group Flow (vph) 610 0 76 0 0 786 198 1451 157 442 1042 416Confl. Peds. (#/hr) 9 8Turn Type Prot pm+ov custom Prot NA Perm Prot NA pm+ovProtected Phases 7 5 10 5 2 1 6 7Permitted Phases 7 1 7 10 2 6Actuated Green, G (s) 21.0 39.9 93.0 18.9 37.5 37.5 35.0 53.6 74.6Effective Green, g (s) 21.0 39.9 89.0 18.9 37.5 37.5 35.0 53.6 74.6Actuated g/C Ratio 0.15 0.28 0.64 0.13 0.27 0.27 0.25 0.38 0.53Clearance Time (s) 5.0 5.0 5.0 4.5 4.5 5.0 4.5 5.0Vehicle Extension (s) 3.0 3.0 3.0 3.0 3.0 3.0 3.0 3.0Lane Grp Cap (vph) 514 446 1006 238 1362 424 442 1946 819v/s Ratio Prot c0.18 0.02 0.11 c0.29 c0.25 0.20 0.08v/s Ratio Perm 0.03 c0.50 0.10 0.19v/c Ratio 1.19 0.17 0.78 0.83 1.07 0.37 1.00 0.54 0.51Uniform Delay, d1 59.5 37.6 18.4 59.0 51.2 41.7 52.5 33.5 20.9Progression Factor 1.00 1.00 1.00 1.00 1.00 1.00 1.36 0.87 0.32Incremental Delay, d2 102.3 0.2 4.0 21.3 43.9 2.5 40.6 1.0 0.4Delay (s) 161.8 37.8 22.4 80.3 95.1 44.1 112.2 30.1 7.1Level of Service F D C F F D F C AApproach Delay (s) 124.0 22.4 89.0 44.2Approach LOS F C F D
Intersection SummaryHCM 2000 Control Delay 69.1 HCM 2000 Level of Service EHCM 2000 Volume to Capacity ratio 1.02Actuated Cycle Length (s) 140.0 Sum of lost time (s) 18.5Intersection Capacity Utilization 97.1% ICU Level of Service FAnalysis Period (min) 15c Critical Lane Group
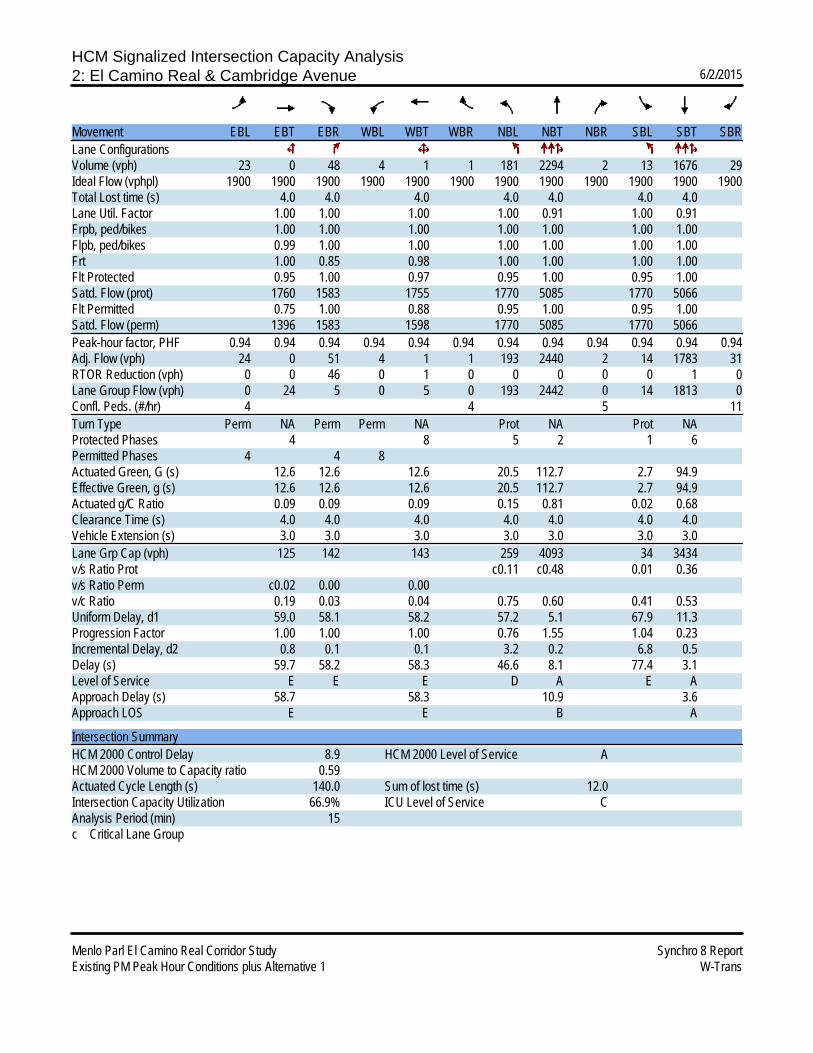
HCM Signalized Intersection Capacity Analysis2: El Camino Real & Cambridge Avenue 6/2/2015
Menlo Parl El Camino Real Corridor Study Synchro 8 ReportExisting PM Peak Hour Conditions plus Alternative 1 W-Trans
Movement EBL EBT EBR WBL WBT WBR NBL NBT NBR SBL SBT SBRLane ConfigurationsVolume (vph) 23 0 48 4 1 1 181 2294 2 13 1676 29Ideal Flow (vphpl) 1900 1900 1900 1900 1900 1900 1900 1900 1900 1900 1900 1900Total Lost time (s) 4.0 4.0 4.0 4.0 4.0 4.0 4.0Lane Util. Factor 1.00 1.00 1.00 1.00 0.91 1.00 0.91Frpb, ped/bikes 1.00 1.00 1.00 1.00 1.00 1.00 1.00Flpb, ped/bikes 0.99 1.00 1.00 1.00 1.00 1.00 1.00Frt 1.00 0.85 0.98 1.00 1.00 1.00 1.00Flt Protected 0.95 1.00 0.97 0.95 1.00 0.95 1.00Satd. Flow (prot) 1760 1583 1755 1770 5085 1770 5066Flt Permitted 0.75 1.00 0.88 0.95 1.00 0.95 1.00Satd. Flow (perm) 1396 1583 1598 1770 5085 1770 5066Peak-hour factor, PHF 0.94 0.94 0.94 0.94 0.94 0.94 0.94 0.94 0.94 0.94 0.94 0.94Adj. Flow (vph) 24 0 51 4 1 1 193 2440 2 14 1783 31RTOR Reduction (vph) 0 0 46 0 1 0 0 0 0 0 1 0Lane Group Flow (vph) 0 24 5 0 5 0 193 2442 0 14 1813 0Confl. Peds. (#/hr) 4 4 5 11Turn Type Perm NA Perm Perm NA Prot NA Prot NAProtected Phases 4 8 5 2 1 6Permitted Phases 4 4 8Actuated Green, G (s) 12.6 12.6 12.6 20.5 112.7 2.7 94.9Effective Green, g (s) 12.6 12.6 12.6 20.5 112.7 2.7 94.9Actuated g/C Ratio 0.09 0.09 0.09 0.15 0.81 0.02 0.68Clearance Time (s) 4.0 4.0 4.0 4.0 4.0 4.0 4.0Vehicle Extension (s) 3.0 3.0 3.0 3.0 3.0 3.0 3.0Lane Grp Cap (vph) 125 142 143 259 4093 34 3434v/s Ratio Prot c0.11 c0.48 0.01 0.36v/s Ratio Perm c0.02 0.00 0.00v/c Ratio 0.19 0.03 0.04 0.75 0.60 0.41 0.53Uniform Delay, d1 59.0 58.1 58.2 57.2 5.1 67.9 11.3Progression Factor 1.00 1.00 1.00 0.76 1.55 1.04 0.23Incremental Delay, d2 0.8 0.1 0.1 3.2 0.2 6.8 0.5Delay (s) 59.7 58.2 58.3 46.6 8.1 77.4 3.1Level of Service E E E D A E AApproach Delay (s) 58.7 58.3 10.9 3.6Approach LOS E E B A
Intersection SummaryHCM 2000 Control Delay 8.9 HCM 2000 Level of Service AHCM 2000 Volume to Capacity ratio 0.59Actuated Cycle Length (s) 140.0 Sum of lost time (s) 12.0Intersection Capacity Utilization 66.9% ICU Level of Service CAnalysis Period (min) 15c Critical Lane Group

HCM Signalized Intersection Capacity Analysis3: El Camino Real & Middle Avenue 6/2/2015
Menlo Parl El Camino Real Corridor Study Synchro 8 ReportExisting PM Peak Hour Conditions plus Alternative 1 W-Trans
Movement EBL EBR NBL NBT SBT SBRLane ConfigurationsVolume (vph) 261 203 358 2048 1483 92Ideal Flow (vphpl) 1900 1900 1900 1900 1900 1900Total Lost time (s) 3.0 3.0 3.0 4.0 4.0Lane Util. Factor 1.00 1.00 1.00 0.91 0.91Frpb, ped/bikes 1.00 1.00 1.00 1.00 1.00Flpb, ped/bikes 1.00 1.00 1.00 1.00 1.00Frt 1.00 0.85 1.00 1.00 0.99Flt Protected 0.95 1.00 0.95 1.00 1.00Satd. Flow (prot) 1770 1583 1770 5085 5025Flt Permitted 0.95 1.00 0.95 1.00 1.00Satd. Flow (perm) 1770 1583 1770 5085 5025Peak-hour factor, PHF 0.98 0.98 0.98 0.98 0.98 0.98Adj. Flow (vph) 266 207 365 2090 1513 94RTOR Reduction (vph) 0 106 0 0 4 0Lane Group Flow (vph) 266 101 365 2090 1603 0Confl. Peds. (#/hr) 3 9Turn Type Prot Perm Prot NA NAProtected Phases 4 5 2 6Permitted Phases 4Actuated Green, G (s) 25.7 25.7 33.9 107.3 70.4Effective Green, g (s) 25.7 25.7 33.9 107.3 70.4Actuated g/C Ratio 0.18 0.18 0.24 0.77 0.50Clearance Time (s) 3.0 3.0 3.0 4.0 4.0Vehicle Extension (s) 3.0 3.0 3.0 3.0 3.0Lane Grp Cap (vph) 324 290 428 3897 2526v/s Ratio Prot c0.15 c0.21 0.41 c0.32v/s Ratio Perm 0.06v/c Ratio 0.82 0.35 0.85 0.54 0.63Uniform Delay, d1 54.9 49.8 50.7 6.5 25.4Progression Factor 1.00 1.00 1.07 0.78 0.48Incremental Delay, d2 15.3 0.7 13.2 0.5 1.1Delay (s) 70.2 50.6 67.4 5.5 13.3Level of Service E D E A BApproach Delay (s) 61.6 14.7 13.3Approach LOS E B B
Intersection SummaryHCM 2000 Control Delay 19.1 HCM 2000 Level of Service BHCM 2000 Volume to Capacity ratio 0.73Actuated Cycle Length (s) 140.0 Sum of lost time (s) 10.0Intersection Capacity Utilization 75.0% ICU Level of Service DAnalysis Period (min) 15c Critical Lane Group

HCM Signalized Intersection Capacity Analysis4: El Camino Real & Roble Avenue 6/2/2015
Menlo Parl El Camino Real Corridor Study Synchro 8 ReportExisting PM Peak Hour Conditions plus Alternative 1 W-Trans
Movement EBL EBT EBR WBL WBT WBR NBL NBT NBR SBL SBT SBRLane ConfigurationsVolume (vph) 50 2 32 49 9 41 79 2045 14 74 1567 33Ideal Flow (vphpl) 1900 1900 1900 1900 1900 1900 1900 1900 1900 1900 1900 1900Total Lost time (s) 4.0 4.0 4.0 4.0 4.5 4.0 4.5Lane Util. Factor 1.00 1.00 1.00 1.00 0.91 1.00 0.91Frpb, ped/bikes 0.99 1.00 1.00 1.00 1.00 1.00 1.00Flpb, ped/bikes 1.00 0.98 1.00 1.00 1.00 1.00 1.00Frt 0.95 1.00 0.85 1.00 1.00 1.00 1.00Flt Protected 0.97 0.96 1.00 0.95 1.00 0.95 1.00Satd. Flow (prot) 1693 1760 1583 1770 5078 1770 5062Flt Permitted 0.80 0.74 1.00 0.95 1.00 0.95 1.00Satd. Flow (perm) 1400 1357 1583 1770 5078 1770 5062Peak-hour factor, PHF 0.94 0.94 0.94 0.94 0.94 0.94 0.94 0.94 0.94 0.94 0.94 0.94Adj. Flow (vph) 53 2 34 52 10 44 84 2176 15 79 1667 35RTOR Reduction (vph) 0 17 0 0 0 36 0 0 0 0 1 0Lane Group Flow (vph) 0 72 0 0 62 8 84 2191 0 79 1701 0Confl. Peds. (#/hr) 18 18 7 12Turn Type Perm NA Perm NA Perm Prot NA Prot NAProtected Phases 4 8 5 2 1 6Permitted Phases 4 8 8Actuated Green, G (s) 25.2 25.2 25.2 11.1 91.1 11.2 91.2Effective Green, g (s) 25.2 25.2 25.2 11.1 91.1 11.2 91.2Actuated g/C Ratio 0.18 0.18 0.18 0.08 0.65 0.08 0.65Clearance Time (s) 4.0 4.0 4.0 4.0 4.5 4.0 4.5Vehicle Extension (s) 3.0 3.0 3.0 3.0 3.0 3.0 3.0Lane Grp Cap (vph) 252 244 284 140 3304 141 3297v/s Ratio Prot c0.05 c0.43 0.04 0.34v/s Ratio Perm c0.05 0.05 0.01v/c Ratio 0.28 0.25 0.03 0.60 0.66 0.56 0.52Uniform Delay, d1 49.6 49.3 47.3 62.3 15.0 62.0 12.8Progression Factor 1.00 1.00 1.00 1.14 0.74 1.00 0.46Incremental Delay, d2 0.6 0.6 0.0 5.7 0.9 4.1 0.5Delay (s) 50.2 49.9 47.3 76.7 12.1 66.4 6.3Level of Service D D D E B E AApproach Delay (s) 50.2 48.8 14.4 9.0Approach LOS D D B A
Intersection SummaryHCM 2000 Control Delay 13.8 HCM 2000 Level of Service BHCM 2000 Volume to Capacity ratio 0.58Actuated Cycle Length (s) 140.0 Sum of lost time (s) 12.5Intersection Capacity Utilization 81.6% ICU Level of Service DAnalysis Period (min) 15c Critical Lane Group

HCM Signalized Intersection Capacity Analysis5: El Camino Real & Menlo Avenue/Ravenswood Avenue 6/2/2015
Menlo Parl El Camino Real Corridor Study Synchro 8 ReportExisting PM Peak Hour Conditions plus Alternative 1 W-Trans
Movement EBL EBT EBR WBL WBT WBR NBL NBT NBR SBL SBT SBRLane ConfigurationsVolume (vph) 89 313 58 310 305 174 96 1762 400 382 1315 103Ideal Flow (vphpl) 1900 1900 1900 1900 1900 1900 1900 1900 1900 1900 1900 1900Lane Width 12 12 12 12 12 12 8 12 12 12 12 12Total Lost time (s) 4.0 4.0 4.0 4.0 4.5 5.0 5.0 4.5 5.0Lane Util. Factor 0.95 0.97 1.00 1.00 1.00 0.91 1.00 1.00 0.91Frpb, ped/bikes 1.00 1.00 1.00 0.98 1.00 1.00 0.95 1.00 1.00Flpb, ped/bikes 1.00 1.00 1.00 1.00 1.00 1.00 1.00 1.00 1.00Frt 0.98 1.00 1.00 0.85 1.00 1.00 0.85 1.00 0.99Flt Protected 0.99 0.95 1.00 1.00 0.95 1.00 1.00 0.95 1.00Satd. Flow (prot) 3439 3433 1863 1551 1534 5085 1497 1770 5006Flt Permitted 0.99 0.95 1.00 1.00 0.95 1.00 1.00 0.95 1.00Satd. Flow (perm) 3439 3433 1863 1551 1534 5085 1497 1770 5006Peak-hour factor, PHF 0.95 0.95 0.95 0.95 0.95 0.95 0.95 0.95 0.95 0.95 0.95 0.95Adj. Flow (vph) 94 329 61 326 321 183 101 1855 421 402 1384 108RTOR Reduction (vph) 0 8 0 0 0 95 0 0 175 0 6 0Lane Group Flow (vph) 0 476 0 326 321 88 101 1855 246 402 1486 0Confl. Peds. (#/hr) 6 18 13Confl. Bikes (#/hr) 29Turn Type Split NA Split NA Perm Prot NA Perm Prot NAProtected Phases 4 4 8 8 5 2 1 6Permitted Phases 8 2Actuated Green, G (s) 20.0 28.1 28.1 28.1 14.0 46.0 46.0 28.4 60.4Effective Green, g (s) 20.0 28.1 28.1 28.1 14.0 46.0 46.0 28.4 60.4Actuated g/C Ratio 0.14 0.20 0.20 0.20 0.10 0.33 0.33 0.20 0.43Clearance Time (s) 4.0 4.0 4.0 4.0 4.5 5.0 5.0 4.5 5.0Vehicle Extension (s) 3.0 3.0 3.0 3.0 3.0 3.0 3.0 3.0 3.0Lane Grp Cap (vph) 491 689 373 311 153 1670 491 359 2159v/s Ratio Prot c0.14 0.09 c0.17 0.07 c0.36 c0.23 0.30v/s Ratio Perm 0.06 0.16v/c Ratio 0.97 0.47 0.86 0.28 0.66 1.11 0.50 1.12 0.69Uniform Delay, d1 59.7 49.4 54.1 47.4 60.7 47.0 37.8 55.8 32.2Progression Factor 1.00 1.00 1.00 1.00 1.40 0.74 0.45 1.44 0.57Incremental Delay, d2 32.9 0.5 18.0 0.5 8.4 57.5 3.0 80.0 1.5Delay (s) 92.6 49.9 72.0 47.9 93.5 92.1 20.1 160.2 19.9Level of Service F D E D F F C F BApproach Delay (s) 92.6 58.0 79.4 49.6Approach LOS F E E D
Intersection SummaryHCM 2000 Control Delay 67.3 HCM 2000 Level of Service EHCM 2000 Volume to Capacity ratio 1.03Actuated Cycle Length (s) 140.0 Sum of lost time (s) 17.5Intersection Capacity Utilization 100.6% ICU Level of Service GAnalysis Period (min) 15c Critical Lane Group

HCM Signalized Intersection Capacity Analysis6: El Camino Real & Santa Cruz Ave 6/2/2015
Menlo Parl El Camino Real Corridor Study Synchro 8 ReportExisting PM Peak Hour Conditions plus Alternative 1 W-Trans
Movement EBL EBT EBR WBL WBT WBR NBL NBT NBR SBL SBT SBRLane ConfigurationsVolume (vph) 157 85 257 75 73 38 0 2090 92 0 1427 95Ideal Flow (vphpl) 1900 1900 1900 1900 1900 1900 1900 1900 1900 1900 1900 1900Total Lost time (s) 4.0 4.0 4.0 4.0 4.0 4.5 4.5Lane Util. Factor 1.00 1.00 1.00 1.00 1.00 0.91 0.91Frpb, ped/bikes 1.00 1.00 0.87 1.00 0.98 1.00 1.00Flpb, ped/bikes 1.00 1.00 1.00 1.00 1.00 1.00 1.00Frt 1.00 1.00 0.85 1.00 0.95 0.99 0.99Flt Protected 0.95 1.00 1.00 0.95 1.00 1.00 1.00Satd. Flow (prot) 1770 1863 1375 1770 1737 5040 5022Flt Permitted 0.95 1.00 1.00 0.95 1.00 1.00 1.00Satd. Flow (perm) 1770 1863 1375 1770 1737 5040 5022Peak-hour factor, PHF 0.96 0.96 0.96 0.96 0.96 0.96 0.96 0.96 0.96 0.96 0.96 0.96Adj. Flow (vph) 164 89 268 78 76 40 0 2177 96 0 1486 99RTOR Reduction (vph) 0 0 174 0 14 0 0 3 0 0 5 0Lane Group Flow (vph) 164 89 94 78 102 0 0 2270 0 0 1580 0Confl. Peds. (#/hr) 87 26 12 9Turn Type Split NA Perm Split NA NA NAProtected Phases 4 4 8 8 2 6Permitted Phases 4Actuated Green, G (s) 30.0 30.0 30.0 25.6 25.6 71.9 71.9Effective Green, g (s) 30.0 30.0 30.0 25.6 25.6 71.9 71.9Actuated g/C Ratio 0.21 0.21 0.21 0.18 0.18 0.51 0.51Clearance Time (s) 4.0 4.0 4.0 4.0 4.0 4.5 4.5Vehicle Extension (s) 3.0 3.0 3.0 3.0 3.0 3.0 3.0Lane Grp Cap (vph) 379 399 294 323 317 2588 2579v/s Ratio Prot c0.09 0.05 0.04 c0.06 c0.45 0.31v/s Ratio Perm 0.07v/c Ratio 0.43 0.22 0.32 0.24 0.32 0.88 0.61Uniform Delay, d1 47.6 45.4 46.4 48.9 49.7 30.1 24.2Progression Factor 1.00 1.00 1.00 1.00 1.00 0.59 0.57Incremental Delay, d2 0.8 0.3 0.6 0.4 0.6 1.3 0.9Delay (s) 48.4 45.7 47.0 49.3 50.3 19.0 14.6Level of Service D D D D D B BApproach Delay (s) 47.2 49.9 19.0 14.6Approach LOS D D B B
Intersection SummaryHCM 2000 Control Delay 22.0 HCM 2000 Level of Service CHCM 2000 Volume to Capacity ratio 0.66Actuated Cycle Length (s) 140.0 Sum of lost time (s) 12.5Intersection Capacity Utilization 74.0% ICU Level of Service DAnalysis Period (min) 15c Critical Lane Group

HCM Signalized Intersection Capacity Analysis7: El Camino Real & Oak Grove Ave 6/2/2015
Menlo Parl El Camino Real Corridor Study Synchro 8 ReportExisting PM Peak Hour Conditions plus Alternative 1 W-Trans
Movement EBL EBT EBR WBL WBT WBR NBL NBT NBR SBL SBT SBRLane ConfigurationsVolume (vph) 138 218 127 129 184 111 96 1942 136 124 1377 91Ideal Flow (vphpl) 1900 1900 1900 1900 1900 1900 1900 1900 1900 1900 1900 1900Total Lost time (s) 3.0 3.5 3.5 3.0 3.5 3.5 3.5 4.5 3.5 4.5Lane Util. Factor 1.00 1.00 1.00 1.00 1.00 1.00 1.00 0.91 1.00 0.91Frpb, ped/bikes 1.00 1.00 0.96 1.00 1.00 0.96 1.00 1.00 1.00 1.00Flpb, ped/bikes 1.00 1.00 1.00 1.00 1.00 1.00 1.00 1.00 1.00 1.00Frt 1.00 1.00 0.85 1.00 1.00 0.85 1.00 0.99 1.00 0.99Flt Protected 0.95 1.00 1.00 0.95 1.00 1.00 0.95 1.00 0.95 1.00Satd. Flow (prot) 1770 1863 1522 1770 1863 1515 1770 5017 1770 5021Flt Permitted 0.95 1.00 1.00 0.95 1.00 1.00 0.95 1.00 0.95 1.00Satd. Flow (perm) 1770 1863 1522 1770 1863 1515 1770 5017 1770 5021Peak-hour factor, PHF 0.98 0.98 0.98 0.98 0.98 0.98 0.98 0.98 0.98 0.98 0.98 0.98Adj. Flow (vph) 141 222 130 132 188 113 98 1982 139 127 1405 93RTOR Reduction (vph) 0 0 89 0 0 91 0 5 0 0 5 0Lane Group Flow (vph) 141 222 41 132 188 22 98 2116 0 127 1493 0Confl. Peds. (#/hr) 19 22 10 10Turn Type Prot NA Perm Prot NA Perm Prot NA Prot NAProtected Phases 7 4 3 8 5 2 1 6Permitted Phases 4 8Actuated Green, G (s) 14.1 24.5 24.5 13.3 23.7 23.7 12.4 74.3 13.4 75.3Effective Green, g (s) 14.1 24.5 24.5 13.3 23.7 23.7 12.4 74.3 13.4 75.3Actuated g/C Ratio 0.10 0.18 0.18 0.10 0.17 0.17 0.09 0.53 0.10 0.54Clearance Time (s) 3.0 3.5 3.5 3.0 3.5 3.5 3.5 4.5 3.5 4.5Vehicle Extension (s) 3.0 3.0 3.0 3.0 3.0 3.0 3.0 3.0 3.0 3.0Lane Grp Cap (vph) 178 326 266 168 315 256 156 2662 169 2700v/s Ratio Prot c0.08 c0.12 0.07 0.10 0.06 c0.42 c0.07 0.30v/s Ratio Perm 0.03 0.01v/c Ratio 0.79 0.68 0.15 0.79 0.60 0.08 0.63 0.79 0.75 0.55Uniform Delay, d1 61.5 54.1 49.0 62.0 53.7 49.0 61.6 26.7 61.7 21.3Progression Factor 1.00 1.00 1.00 1.00 1.00 1.00 1.39 0.21 0.81 1.56Incremental Delay, d2 21.0 5.8 0.3 21.0 3.0 0.1 4.1 1.3 16.4 0.8Delay (s) 82.5 59.8 49.2 83.0 56.8 49.1 89.8 7.0 66.3 33.9Level of Service F E D F E D F A E CApproach Delay (s) 63.5 62.8 10.6 36.4Approach LOS E E B D
Intersection SummaryHCM 2000 Control Delay 29.6 HCM 2000 Level of Service CHCM 2000 Volume to Capacity ratio 0.77Actuated Cycle Length (s) 140.0 Sum of lost time (s) 14.5Intersection Capacity Utilization 86.1% ICU Level of Service EAnalysis Period (min) 15c Critical Lane Group

HCM Signalized Intersection Capacity Analysis8: El Camino Real & Valparaiso Ave/Glenwood Ave 6/2/2015
Menlo Parl El Camino Real Corridor Study Synchro 8 ReportExisting PM Peak Hour Conditions plus Alternative 1 W-Trans
Movement EBL EBT EBR WBL WBT WBR NBL NBT NBR SBL SBT SBRLane ConfigurationsVolume (vph) 282 142 124 50 182 24 133 1467 22 42 918 250Ideal Flow (vphpl) 1900 1900 1900 1900 1900 1900 1900 1900 1900 1900 1900 1900Total Lost time (s) 3.5 3.5 3.5 3.5 3.5 4.0 4.5 4.0 4.5Lane Util. Factor 0.95 0.95 1.00 1.00 1.00 1.00 0.91 1.00 0.91Frpb, ped/bikes 1.00 1.00 0.98 1.00 1.00 1.00 1.00 1.00 0.99Flpb, ped/bikes 1.00 1.00 1.00 1.00 1.00 1.00 1.00 1.00 1.00Frt 1.00 1.00 0.85 1.00 0.98 1.00 1.00 1.00 0.97Flt Protected 0.95 0.98 1.00 0.95 1.00 0.95 1.00 0.95 1.00Satd. Flow (prot) 1681 1740 1554 1770 1831 1770 5072 1770 4897Flt Permitted 0.95 0.98 1.00 0.95 1.00 0.95 1.00 0.95 1.00Satd. Flow (perm) 1681 1740 1554 1770 1831 1770 5072 1770 4897Peak-hour factor, PHF 0.98 0.98 0.98 0.98 0.98 0.98 0.98 0.98 0.98 0.98 0.98 0.98Adj. Flow (vph) 288 145 127 51 186 24 136 1497 22 43 937 255RTOR Reduction (vph) 0 0 99 0 3 0 0 1 0 0 27 0Lane Group Flow (vph) 213 220 28 51 207 0 136 1518 0 43 1165 0Confl. Peds. (#/hr) 5 3 1Turn Type Split NA Perm Split NA Prot NA Prot NAProtected Phases 4 4 8 8 5 2 1 6Permitted Phases 4Actuated Green, G (s) 23.7 23.7 23.7 21.0 21.0 16.0 72.1 7.7 63.8Effective Green, g (s) 23.7 23.7 23.7 21.0 21.0 16.0 72.1 7.7 63.8Actuated g/C Ratio 0.17 0.17 0.17 0.15 0.15 0.11 0.51 0.06 0.46Clearance Time (s) 3.5 3.5 3.5 3.5 3.5 4.0 4.5 4.0 4.5Vehicle Extension (s) 3.0 3.0 3.0 3.0 3.0 3.0 3.0 3.0 3.0Lane Grp Cap (vph) 284 294 263 265 274 202 2612 97 2231v/s Ratio Prot c0.13 0.13 0.03 c0.11 c0.08 c0.30 0.02 0.24v/s Ratio Perm 0.02v/c Ratio 0.75 0.75 0.11 0.19 0.75 0.67 0.58 0.44 0.52Uniform Delay, d1 55.3 55.3 49.2 52.1 57.0 59.5 23.5 64.1 27.2Progression Factor 1.00 1.00 1.00 1.00 1.00 1.15 0.35 1.04 0.80Incremental Delay, d2 10.6 10.0 0.2 0.4 11.2 5.4 0.6 3.1 0.8Delay (s) 65.9 65.3 49.4 52.4 68.2 73.9 8.8 70.0 22.5Level of Service E E D D E E A E CApproach Delay (s) 61.9 65.1 14.2 24.2Approach LOS E E B C
Intersection SummaryHCM 2000 Control Delay 28.3 HCM 2000 Level of Service CHCM 2000 Volume to Capacity ratio 0.67Actuated Cycle Length (s) 140.0 Sum of lost time (s) 15.5Intersection Capacity Utilization 70.7% ICU Level of Service CAnalysis Period (min) 15c Critical Lane Group

HCM Signalized Intersection Capacity Analysis9: El Camino Real & Encinal Ave 6/2/2015
Menlo Parl El Camino Real Corridor Study Synchro 8 ReportExisting PM Peak Hour Conditions plus Alternative 1 W-Trans
Movement EBL EBT EBR WBL WBT WBR NBL NBT NBR SBL SBT SBRLane ConfigurationsVolume (vph) 20 17 14 81 12 161 36 1676 96 67 1375 19Ideal Flow (vphpl) 1900 1900 1900 1900 1900 1900 1900 1900 1900 1900 1900 1900Total Lost time (s) 3.0 3.0 3.0 3.0 3.0 4.0 3.0 4.0Lane Util. Factor 1.00 1.00 1.00 1.00 1.00 0.91 1.00 0.91Frpb, ped/bikes 1.00 1.00 1.00 0.98 1.00 1.00 1.00 1.00Flpb, ped/bikes 1.00 1.00 1.00 1.00 1.00 1.00 1.00 1.00Frt 1.00 0.85 1.00 0.85 1.00 0.99 1.00 1.00Flt Protected 0.97 1.00 0.96 1.00 0.95 1.00 0.95 1.00Satd. Flow (prot) 1808 1583 1785 1554 1770 5037 1770 5075Flt Permitted 0.85 1.00 0.73 1.00 0.95 1.00 0.95 1.00Satd. Flow (perm) 1572 1583 1354 1554 1770 5037 1770 5075Peak-hour factor, PHF 0.99 0.99 0.99 0.99 0.99 0.99 0.99 0.99 0.99 0.99 0.99 0.99Adj. Flow (vph) 20 17 14 82 12 163 36 1693 97 68 1389 19RTOR Reduction (vph) 0 0 12 0 0 141 0 3 0 0 1 0Lane Group Flow (vph) 0 37 2 0 94 22 36 1787 0 68 1407 0Confl. Peds. (#/hr) 5 5 1Turn Type Perm NA Perm Perm NA Perm Prot NA Prot NAProtected Phases 4 8 5 2 1 6Permitted Phases 4 4 8 8Actuated Green, G (s) 16.8 16.8 16.8 16.8 7.2 103.8 9.4 106.0Effective Green, g (s) 16.8 16.8 16.8 16.8 7.2 103.8 9.4 106.0Actuated g/C Ratio 0.12 0.12 0.12 0.12 0.05 0.74 0.07 0.76Clearance Time (s) 3.0 3.0 3.0 3.0 3.0 4.0 3.0 4.0Vehicle Extension (s) 3.0 3.0 3.0 3.0 3.0 3.0 3.0 3.0Lane Grp Cap (vph) 188 189 162 186 91 3734 118 3842v/s Ratio Prot 0.02 c0.35 c0.04 0.28v/s Ratio Perm 0.02 0.00 c0.07 0.01v/c Ratio 0.20 0.01 0.58 0.12 0.40 0.48 0.58 0.37Uniform Delay, d1 55.5 54.3 58.3 55.0 64.3 7.3 63.4 5.7Progression Factor 1.00 1.00 1.00 1.00 1.25 0.18 1.00 1.00Incremental Delay, d2 0.5 0.0 5.2 0.3 2.3 0.4 6.7 0.3Delay (s) 56.0 54.3 63.5 55.3 83.0 1.7 70.0 6.0Level of Service E D E E F A E AApproach Delay (s) 55.6 58.3 3.3 8.9Approach LOS E E A A
Intersection SummaryHCM 2000 Control Delay 10.2 HCM 2000 Level of Service BHCM 2000 Volume to Capacity ratio 0.49Actuated Cycle Length (s) 140.0 Sum of lost time (s) 10.0Intersection Capacity Utilization 62.2% ICU Level of Service BAnalysis Period (min) 15c Critical Lane Group

HCM Signalized Intersection Capacity Analysis1: El Camino Real & Sand Hill Rd/Alma St 2/9/2015
Menlo Parl El Camino Real Corridor Study Synchro 8 ReportFuture AM Peak Hour Conditions - No Project W-Trans
Movement EBL EBT EBR WBL WBT WBR NBL NBT NBR SBL SBT SBRLane ConfigurationsVolume (vph) 164 0 331 0 0 715 426 1069 28 359 1724 233Ideal Flow (vphpl) 1900 1900 1900 1900 1900 1900 1900 1900 1900 1900 1900 1900Total Lost time (s) 5.0 5.0 5.0 5.0 4.5 4.5 5.0 4.5 5.0Lane Util. Factor 0.97 1.00 1.00 1.00 0.91 1.00 1.00 0.91 1.00Frpb, ped/bikes 1.00 1.00 0.99 1.00 1.00 0.98 1.00 1.00 0.98Flpb, ped/bikes 1.00 1.00 1.00 1.00 1.00 1.00 1.00 1.00 1.00Frt 1.00 0.85 0.85 1.00 1.00 0.85 1.00 1.00 0.85Flt Protected 0.95 1.00 1.00 0.95 1.00 1.00 0.95 1.00 1.00Satd. Flow (prot) 3433 1577 1563 1770 5085 1550 1770 5085 1550Flt Permitted 0.95 1.00 1.00 0.95 1.00 1.00 0.95 1.00 1.00Satd. Flow (perm) 3433 1577 1563 1770 5085 1550 1770 5085 1550Peak-hour factor, PHF 0.95 0.95 0.95 0.95 0.95 0.95 0.95 0.95 0.95 0.95 0.95 0.95Adj. Flow (vph) 173 0 348 0 0 753 448 1125 29 378 1815 245RTOR Reduction (vph) 0 0 199 0 0 6 0 0 0 0 0 0Lane Group Flow (vph) 173 0 149 0 0 747 448 1125 29 378 1815 245Confl. Peds. (#/hr) 2Confl. Bikes (#/hr) 4 1 8Turn Type Prot pm+ov custom Prot NA Perm Prot NA pm+ovProtected Phases 7 5 8 5 2 1 6 7Permitted Phases 7 1 7 8 2 6Actuated Green, G (s) 13.0 48.6 76.1 35.6 50.4 50.4 36.1 50.9 63.9Effective Green, g (s) 13.0 48.6 72.1 35.6 50.4 50.4 36.1 50.9 63.9Actuated g/C Ratio 0.10 0.36 0.53 0.26 0.37 0.37 0.27 0.37 0.47Clearance Time (s) 5.0 5.0 5.0 4.5 4.5 5.0 4.5 5.0Vehicle Extension (s) 3.0 3.0 3.0 3.0 3.0 3.0 3.0 3.0Lane Grp Cap (vph) 328 563 828 463 1884 574 469 1903 728v/s Ratio Prot 0.05 0.07 c0.25 0.22 0.21 c0.36 0.03v/s Ratio Perm 0.03 c0.48 0.02 0.13v/c Ratio 0.53 0.26 0.90 0.97 0.60 0.05 0.81 0.95 0.34Uniform Delay, d1 58.6 31.0 28.8 49.6 34.6 27.5 46.7 41.4 22.7Progression Factor 1.00 1.00 1.00 1.00 1.00 1.00 1.36 0.56 0.31Incremental Delay, d2 1.5 0.3 13.0 33.2 1.4 0.2 8.1 10.5 0.2Delay (s) 60.1 31.3 41.8 82.8 36.0 27.6 71.7 33.8 7.3Level of Service E C D F D C E C AApproach Delay (s) 40.8 41.8 48.9 37.0Approach LOS D D D D
Intersection SummaryHCM 2000 Control Delay 41.7 HCM 2000 Level of Service DHCM 2000 Volume to Capacity ratio 0.98Actuated Cycle Length (s) 136.0 Sum of lost time (s) 18.5Intersection Capacity Utilization 83.7% ICU Level of Service EAnalysis Period (min) 15c Critical Lane Group

HCM Signalized Intersection Capacity Analysis2: El Camino Real & Cambridge Avenue 2/9/2015
Menlo Parl El Camino Real Corridor Study Synchro 8 ReportFuture AM Peak Hour Conditions - No Project W-Trans
Movement EBL EBT EBR WBL WBT WBR NBL NBT NBR SBL SBT SBRLane ConfigurationsVolume (vph) 20 16 64 15 4 2 63 1899 47 59 2131 27Ideal Flow (vphpl) 1900 1900 1900 1900 1900 1900 1900 1900 1900 1900 1900 1900Total Lost time (s) 4.0 4.0 4.0 4.0 4.0 4.0 4.0Lane Util. Factor 1.00 1.00 1.00 1.00 0.91 1.00 0.91Frpb, ped/bikes 1.00 0.98 1.00 1.00 1.00 1.00 1.00Flpb, ped/bikes 1.00 1.00 1.00 1.00 1.00 1.00 1.00Frt 1.00 0.85 0.99 1.00 1.00 1.00 1.00Flt Protected 0.97 1.00 0.96 0.95 1.00 0.95 1.00Satd. Flow (prot) 1810 1557 1772 1770 5065 1770 5073Flt Permitted 0.84 1.00 0.81 0.95 1.00 0.95 1.00Satd. Flow (perm) 1569 1557 1491 1770 5065 1770 5073Peak-hour factor, PHF 0.91 0.91 0.91 0.91 0.91 0.91 0.91 0.91 0.91 0.91 0.91 0.91Adj. Flow (vph) 22 18 70 16 4 2 69 2087 52 65 2342 30RTOR Reduction (vph) 0 0 64 0 2 0 0 1 0 0 0 0Lane Group Flow (vph) 0 40 6 0 20 0 69 2138 0 65 2372 0Confl. Peds. (#/hr) 2 2 2 4Confl. Bikes (#/hr) 2 3 6Turn Type Perm NA Perm Perm NA Prot NA Prot NAProtected Phases 4 8 5 2 1 6Permitted Phases 4 4 8Actuated Green, G (s) 12.6 12.6 12.6 8.8 103.0 8.4 102.6Effective Green, g (s) 12.6 12.6 12.6 8.8 103.0 8.4 102.6Actuated g/C Ratio 0.09 0.09 0.09 0.06 0.76 0.06 0.75Clearance Time (s) 4.0 4.0 4.0 4.0 4.0 4.0 4.0Vehicle Extension (s) 3.0 3.0 3.0 3.0 3.0 3.0 3.0Lane Grp Cap (vph) 145 144 138 114 3835 109 3827v/s Ratio Prot c0.04 0.42 0.04 c0.47v/s Ratio Perm c0.03 0.00 0.01v/c Ratio 0.28 0.05 0.15 0.61 0.56 0.60 0.62Uniform Delay, d1 57.5 56.2 56.8 61.9 6.9 62.1 7.7Progression Factor 1.00 1.00 1.00 0.94 1.07 1.31 0.27Incremental Delay, d2 1.0 0.1 0.5 7.0 0.5 5.6 0.5Delay (s) 58.5 56.3 57.2 65.4 7.8 86.8 2.6Level of Service E E E E A F AApproach Delay (s) 57.1 57.2 9.6 4.8Approach LOS E E A A
Intersection SummaryHCM 2000 Control Delay 8.5 HCM 2000 Level of Service AHCM 2000 Volume to Capacity ratio 0.58Actuated Cycle Length (s) 136.0 Sum of lost time (s) 12.0Intersection Capacity Utilization 70.1% ICU Level of Service CAnalysis Period (min) 15c Critical Lane Group

HCM Signalized Intersection Capacity Analysis3: El Camino Real & Middle Avenue 2/9/2015
Menlo Parl El Camino Real Corridor Study Synchro 8 ReportFuture AM Peak Hour Conditions - No Project W-Trans
Movement EBL EBT EBR WBL WBT WBR NBL NBT NBR SBL SBT SBRLane ConfigurationsVolume (vph) 211 47 309 26 18 17 244 1658 1 64 1802 103Ideal Flow (vphpl) 1900 1900 1900 1900 1900 1900 1900 1900 1900 1900 1900 1900Total Lost time (s) 3.0 3.0 4.0 3.0 4.0 4.0 4.0Lane Util. Factor 1.00 1.00 1.00 1.00 0.91 1.00 0.91Frpb, ped/bikes 1.00 1.00 1.00 1.00 1.00 1.00 1.00Flpb, ped/bikes 0.99 1.00 1.00 1.00 1.00 1.00 1.00Frt 1.00 0.87 0.96 1.00 1.00 1.00 0.99Flt Protected 0.95 1.00 0.98 0.95 1.00 0.95 1.00Satd. Flow (prot) 1759 1620 1757 1770 5085 1770 5030Flt Permitted 0.71 1.00 0.26 0.95 1.00 0.95 1.00Satd. Flow (perm) 1306 1620 472 1770 5085 1770 5030Peak-hour factor, PHF 0.90 0.92 0.90 0.92 0.92 0.92 0.90 0.90 0.92 0.92 0.90 0.90Adj. Flow (vph) 234 51 343 28 20 18 271 1842 1 70 2002 114RTOR Reduction (vph) 0 185 0 0 10 0 0 0 0 0 4 0Lane Group Flow (vph) 234 209 0 0 56 0 271 1843 0 70 2112 0Confl. Peds. (#/hr) 3 8Confl. Bikes (#/hr) 8Turn Type Perm NA Perm NA Prot NA Prot NAProtected Phases 4 8 5 2 1 6Permitted Phases 4 8Actuated Green, G (s) 28.2 28.2 27.2 24.6 87.2 9.6 73.2Effective Green, g (s) 28.2 28.2 27.2 24.6 87.2 9.6 73.2Actuated g/C Ratio 0.21 0.21 0.20 0.18 0.64 0.07 0.54Clearance Time (s) 3.0 3.0 4.0 3.0 4.0 4.0 4.0Vehicle Extension (s) 3.0 3.0 3.0 3.0 3.0 3.0 3.0Lane Grp Cap (vph) 270 335 94 320 3260 124 2707v/s Ratio Prot 0.13 c0.15 0.36 0.04 c0.42v/s Ratio Perm c0.18 0.12v/c Ratio 0.87 0.62 0.59 0.85 0.57 0.56 0.78Uniform Delay, d1 52.1 49.1 49.4 53.9 13.7 61.2 25.0Progression Factor 1.00 1.00 1.00 0.72 1.25 0.68 0.39Incremental Delay, d2 24.0 3.6 9.6 16.0 0.6 5.1 2.0Delay (s) 76.1 52.7 59.0 54.9 17.8 46.7 11.7Level of Service E D E D B D BApproach Delay (s) 61.4 59.0 22.6 12.8Approach LOS E E C B
Intersection SummaryHCM 2000 Control Delay 23.7 HCM 2000 Level of Service CHCM 2000 Volume to Capacity ratio 0.82Actuated Cycle Length (s) 136.0 Sum of lost time (s) 12.0Intersection Capacity Utilization 86.8% ICU Level of Service EAnalysis Period (min) 15c Critical Lane Group

HCM Signalized Intersection Capacity Analysis4: El Camino Real & Roble Avenue 2/9/2015
Menlo Parl El Camino Real Corridor Study Synchro 8 ReportFuture AM Peak Hour Conditions - No Project W-Trans
Movement EBL EBT EBR WBL WBT WBR NBL NBT NBR SBL SBT SBRLane ConfigurationsVolume (vph) 60 5 50 4 4 8 41 1793 23 35 1856 32Ideal Flow (vphpl) 1900 1900 1900 1900 1900 1900 1900 1900 1900 1900 1900 1900Total Lost time (s) 4.0 4.0 4.0 4.0 4.5 4.0 4.5Lane Util. Factor 1.00 1.00 1.00 1.00 0.91 1.00 0.91Frpb, ped/bikes 1.00 1.00 0.98 1.00 1.00 1.00 1.00Flpb, ped/bikes 1.00 1.00 1.00 1.00 1.00 1.00 1.00Frt 0.94 1.00 0.85 1.00 1.00 1.00 1.00Flt Protected 0.97 0.98 1.00 0.95 1.00 0.95 1.00Satd. Flow (prot) 1708 1817 1545 1770 5074 1770 5072Flt Permitted 0.83 0.91 1.00 0.95 1.00 0.95 1.00Satd. Flow (perm) 1458 1690 1545 1770 5074 1770 5072Peak-hour factor, PHF 0.92 0.92 0.92 0.92 0.92 0.92 0.92 0.92 0.92 0.92 0.92 0.92Adj. Flow (vph) 65 5 54 4 4 9 45 1949 25 38 2017 35RTOR Reduction (vph) 0 24 0 0 0 8 0 1 0 0 1 0Lane Group Flow (vph) 0 100 0 0 8 1 45 1973 0 38 2051 0Confl. Bikes (#/hr) 6 6Turn Type Perm NA Perm NA Perm Prot NA Prot NAProtected Phases 4 8 5 2 1 6Permitted Phases 4 8 8Actuated Green, G (s) 14.5 14.5 14.5 7.7 101.7 7.3 101.3Effective Green, g (s) 14.5 14.5 14.5 7.7 101.7 7.3 101.3Actuated g/C Ratio 0.11 0.11 0.11 0.06 0.75 0.05 0.74Clearance Time (s) 4.0 4.0 4.0 4.0 4.5 4.0 4.5Vehicle Extension (s) 3.0 3.0 3.0 3.0 3.0 3.0 3.0Lane Grp Cap (vph) 155 180 164 100 3794 95 3777v/s Ratio Prot c0.03 0.39 0.02 c0.40v/s Ratio Perm c0.07 0.00 0.00v/c Ratio 0.64 0.04 0.01 0.45 0.52 0.40 0.54Uniform Delay, d1 58.3 54.5 54.3 62.1 7.1 62.2 7.4Progression Factor 1.00 1.00 1.00 1.26 0.13 0.93 0.77Incremental Delay, d2 8.9 0.1 0.0 2.6 0.4 1.4 0.3Delay (s) 67.1 54.6 54.3 80.9 1.3 59.0 6.0Level of Service E D D F A E AApproach Delay (s) 67.1 54.5 3.1 7.0Approach LOS E D A A
Intersection SummaryHCM 2000 Control Delay 7.1 HCM 2000 Level of Service AHCM 2000 Volume to Capacity ratio 0.55Actuated Cycle Length (s) 136.0 Sum of lost time (s) 12.5Intersection Capacity Utilization 58.9% ICU Level of Service BAnalysis Period (min) 15c Critical Lane Group

HCM Signalized Intersection Capacity Analysis5: El Camino Real & Menlo Avenue/Ravenswood Avenue 2/9/2015
Menlo Parl El Camino Real Corridor Study Synchro 8 ReportFuture AM Peak Hour Conditions - No Project W-Trans
Movement EBL EBT EBR WBL WBT WBR NBL NBT NBR SBL SBT SBRLane ConfigurationsVolume (vph) 18 334 53 532 243 46 118 860 772 170 1328 12Ideal Flow (vphpl) 1900 1900 1900 1900 1900 1900 1900 1900 1900 1900 1900 1900Lane Width 12 12 12 12 12 12 8 12 12 12 12 12Total Lost time (s) 4.0 4.0 4.0 4.0 4.5 5.0 5.0 4.5 5.0 5.0Lane Util. Factor 0.95 0.97 1.00 1.00 1.00 0.95 1.00 1.00 0.95 1.00Frpb, ped/bikes 1.00 1.00 1.00 0.97 1.00 1.00 0.98 1.00 1.00 0.93Flpb, ped/bikes 1.00 1.00 1.00 1.00 1.00 1.00 1.00 1.00 1.00 1.00Frt 0.98 1.00 1.00 0.85 1.00 1.00 0.85 1.00 1.00 0.85Flt Protected 1.00 0.95 1.00 1.00 0.95 1.00 1.00 0.95 1.00 1.00Satd. Flow (prot) 3445 3433 1863 1540 1534 3539 1554 1770 3539 1466Flt Permitted 1.00 0.95 1.00 1.00 0.95 1.00 1.00 0.95 1.00 1.00Satd. Flow (perm) 3445 3433 1863 1540 1534 3539 1554 1770 3539 1466Peak-hour factor, PHF 0.94 0.94 0.94 0.94 0.94 0.94 0.94 0.94 0.94 0.94 0.94 0.94Adj. Flow (vph) 19 355 56 566 259 49 126 915 821 181 1413 13RTOR Reduction (vph) 0 9 0 0 0 39 0 0 339 0 0 7Lane Group Flow (vph) 0 421 0 566 259 10 126 915 482 181 1413 6Confl. Peds. (#/hr) 5 3 14Confl. Bikes (#/hr) 15 8 5 6Turn Type Split NA Split NA Perm Prot NA Perm Prot NA PermProtected Phases 4 4 8 8 5 2 1 6Permitted Phases 8 2 6Actuated Green, G (s) 17.7 27.8 27.8 27.8 13.5 56.7 56.7 16.3 59.5 59.5Effective Green, g (s) 17.7 27.8 27.8 27.8 13.5 56.7 56.7 16.3 59.5 59.5Actuated g/C Ratio 0.13 0.20 0.20 0.20 0.10 0.42 0.42 0.12 0.44 0.44Clearance Time (s) 4.0 4.0 4.0 4.0 4.5 5.0 5.0 4.5 5.0 5.0Vehicle Extension (s) 3.0 3.0 3.0 3.0 3.0 3.0 3.0 3.0 3.0 3.0Lane Grp Cap (vph) 448 701 380 314 152 1475 647 212 1548 641v/s Ratio Prot c0.12 c0.16 0.14 0.08 0.26 c0.10 c0.40v/s Ratio Perm 0.01 0.31 0.00v/c Ratio 0.94 0.81 0.68 0.03 0.83 0.62 0.75 0.85 0.91 0.01Uniform Delay, d1 58.6 51.5 50.0 43.3 60.1 31.2 33.5 58.7 35.8 21.6Progression Factor 1.00 1.00 1.00 1.00 1.27 0.62 1.02 1.46 0.26 1.00Incremental Delay, d2 28.0 6.8 5.0 0.0 26.6 1.7 6.7 17.8 6.3 0.0Delay (s) 86.7 58.3 55.0 43.4 102.9 21.0 41.0 103.8 15.7 21.6Level of Service F E D D F C D F B CApproach Delay (s) 86.7 56.5 35.4 25.7Approach LOS F E D C
Intersection SummaryHCM 2000 Control Delay 40.6 HCM 2000 Level of Service DHCM 2000 Volume to Capacity ratio 0.90Actuated Cycle Length (s) 136.0 Sum of lost time (s) 17.5Intersection Capacity Utilization 86.0% ICU Level of Service EAnalysis Period (min) 15c Critical Lane Group

HCM Signalized Intersection Capacity Analysis6: El Camino Real & Santa Cruz Ave 2/9/2015
Menlo Parl El Camino Real Corridor Study Synchro 8 ReportFuture AM Peak Hour Conditions - No Project W-Trans
Movement EBL EBT EBR WBL WBT WBR NBL NBT NBR SBL SBT SBRLane ConfigurationsVolume (vph) 140 79 92 65 59 31 0 930 57 0 1433 62Ideal Flow (vphpl) 1900 1900 1900 1900 1900 1900 1900 1900 1900 1900 1900 1900Total Lost time (s) 4.0 4.0 4.0 4.0 4.0 4.5 4.5 4.5 4.5Lane Util. Factor 1.00 1.00 1.00 1.00 1.00 0.95 1.00 0.95 1.00Frpb, ped/bikes 1.00 1.00 0.91 1.00 0.97 1.00 0.93 1.00 0.97Flpb, ped/bikes 1.00 1.00 1.00 1.00 1.00 1.00 1.00 1.00 1.00Frt 1.00 1.00 0.85 1.00 0.95 1.00 0.85 1.00 0.85Flt Protected 0.95 1.00 1.00 0.95 1.00 1.00 1.00 1.00 1.00Satd. Flow (prot) 1770 1863 1442 1770 1707 3539 1477 3539 1535Flt Permitted 0.95 1.00 1.00 0.95 1.00 1.00 1.00 1.00 1.00Satd. Flow (perm) 1770 1863 1442 1770 1707 3539 1477 3539 1535Peak-hour factor, PHF 0.93 0.93 0.93 0.93 0.93 0.93 0.93 0.93 0.93 0.93 0.93 0.93Adj. Flow (vph) 151 85 99 70 63 33 0 1000 61 0 1541 67RTOR Reduction (vph) 0 0 82 0 14 0 0 0 29 0 0 19Lane Group Flow (vph) 151 85 17 70 82 0 0 1000 32 0 1541 48Confl. Peds. (#/hr) 50 58 14 3Confl. Bikes (#/hr) 9 11 4 1Turn Type Split NA Perm Split NA NA Perm NA PermProtected Phases 4 4 8 8 2 6Permitted Phases 4 2 6Actuated Green, G (s) 23.0 23.0 23.0 30.0 30.0 70.5 70.5 70.5 70.5Effective Green, g (s) 23.0 23.0 23.0 30.0 30.0 70.5 70.5 70.5 70.5Actuated g/C Ratio 0.17 0.17 0.17 0.22 0.22 0.52 0.52 0.52 0.52Clearance Time (s) 4.0 4.0 4.0 4.0 4.0 4.5 4.5 4.5 4.5Vehicle Extension (s) 3.0 3.0 3.0 3.0 3.0 3.0 3.0 3.0 3.0Lane Grp Cap (vph) 299 315 243 390 376 1834 765 1834 795v/s Ratio Prot c0.09 0.05 0.04 c0.05 0.28 c0.44v/s Ratio Perm 0.01 0.02 0.03v/c Ratio 0.51 0.27 0.07 0.18 0.22 0.55 0.04 0.84 0.06Uniform Delay, d1 51.3 49.2 47.5 43.0 43.4 22.0 16.1 27.9 16.3Progression Factor 1.00 1.00 1.00 1.00 1.00 0.37 0.38 0.24 0.07Incremental Delay, d2 1.3 0.5 0.1 0.2 0.3 1.0 0.1 3.6 0.1Delay (s) 52.7 49.7 47.6 43.2 43.7 9.1 6.2 10.3 1.3Level of Service D D D D D A A B AApproach Delay (s) 50.4 43.5 8.9 9.9Approach LOS D D A A
Intersection SummaryHCM 2000 Control Delay 15.6 HCM 2000 Level of Service BHCM 2000 Volume to Capacity ratio 0.63Actuated Cycle Length (s) 136.0 Sum of lost time (s) 12.5Intersection Capacity Utilization 75.7% ICU Level of Service DAnalysis Period (min) 15c Critical Lane Group
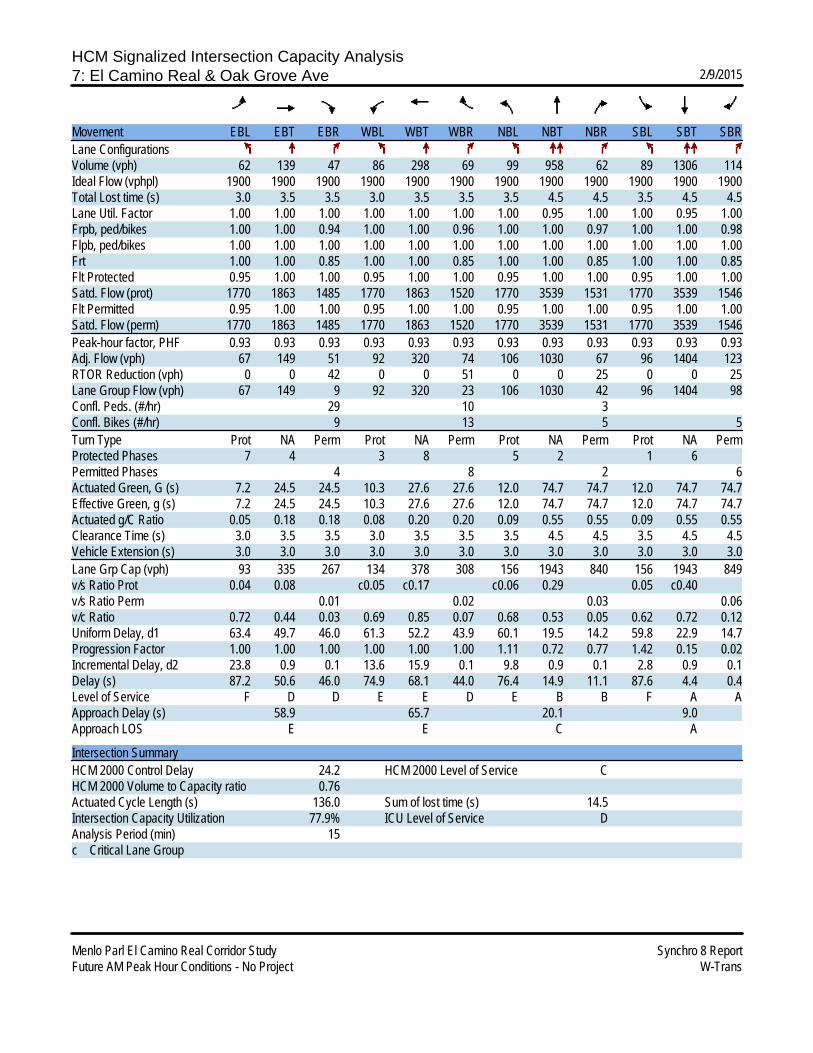
HCM Signalized Intersection Capacity Analysis7: El Camino Real & Oak Grove Ave 2/9/2015
Menlo Parl El Camino Real Corridor Study Synchro 8 ReportFuture AM Peak Hour Conditions - No Project W-Trans
Movement EBL EBT EBR WBL WBT WBR NBL NBT NBR SBL SBT SBRLane ConfigurationsVolume (vph) 62 139 47 86 298 69 99 958 62 89 1306 114Ideal Flow (vphpl) 1900 1900 1900 1900 1900 1900 1900 1900 1900 1900 1900 1900Total Lost time (s) 3.0 3.5 3.5 3.0 3.5 3.5 3.5 4.5 4.5 3.5 4.5 4.5Lane Util. Factor 1.00 1.00 1.00 1.00 1.00 1.00 1.00 0.95 1.00 1.00 0.95 1.00Frpb, ped/bikes 1.00 1.00 0.94 1.00 1.00 0.96 1.00 1.00 0.97 1.00 1.00 0.98Flpb, ped/bikes 1.00 1.00 1.00 1.00 1.00 1.00 1.00 1.00 1.00 1.00 1.00 1.00Frt 1.00 1.00 0.85 1.00 1.00 0.85 1.00 1.00 0.85 1.00 1.00 0.85Flt Protected 0.95 1.00 1.00 0.95 1.00 1.00 0.95 1.00 1.00 0.95 1.00 1.00Satd. Flow (prot) 1770 1863 1485 1770 1863 1520 1770 3539 1531 1770 3539 1546Flt Permitted 0.95 1.00 1.00 0.95 1.00 1.00 0.95 1.00 1.00 0.95 1.00 1.00Satd. Flow (perm) 1770 1863 1485 1770 1863 1520 1770 3539 1531 1770 3539 1546Peak-hour factor, PHF 0.93 0.93 0.93 0.93 0.93 0.93 0.93 0.93 0.93 0.93 0.93 0.93Adj. Flow (vph) 67 149 51 92 320 74 106 1030 67 96 1404 123RTOR Reduction (vph) 0 0 42 0 0 51 0 0 25 0 0 25Lane Group Flow (vph) 67 149 9 92 320 23 106 1030 42 96 1404 98Confl. Peds. (#/hr) 29 10 3Confl. Bikes (#/hr) 9 13 5 5Turn Type Prot NA Perm Prot NA Perm Prot NA Perm Prot NA PermProtected Phases 7 4 3 8 5 2 1 6Permitted Phases 4 8 2 6Actuated Green, G (s) 7.2 24.5 24.5 10.3 27.6 27.6 12.0 74.7 74.7 12.0 74.7 74.7Effective Green, g (s) 7.2 24.5 24.5 10.3 27.6 27.6 12.0 74.7 74.7 12.0 74.7 74.7Actuated g/C Ratio 0.05 0.18 0.18 0.08 0.20 0.20 0.09 0.55 0.55 0.09 0.55 0.55Clearance Time (s) 3.0 3.5 3.5 3.0 3.5 3.5 3.5 4.5 4.5 3.5 4.5 4.5Vehicle Extension (s) 3.0 3.0 3.0 3.0 3.0 3.0 3.0 3.0 3.0 3.0 3.0 3.0Lane Grp Cap (vph) 93 335 267 134 378 308 156 1943 840 156 1943 849v/s Ratio Prot 0.04 0.08 c0.05 c0.17 c0.06 0.29 0.05 c0.40v/s Ratio Perm 0.01 0.02 0.03 0.06v/c Ratio 0.72 0.44 0.03 0.69 0.85 0.07 0.68 0.53 0.05 0.62 0.72 0.12Uniform Delay, d1 63.4 49.7 46.0 61.3 52.2 43.9 60.1 19.5 14.2 59.8 22.9 14.7Progression Factor 1.00 1.00 1.00 1.00 1.00 1.00 1.11 0.72 0.77 1.42 0.15 0.02Incremental Delay, d2 23.8 0.9 0.1 13.6 15.9 0.1 9.8 0.9 0.1 2.8 0.9 0.1Delay (s) 87.2 50.6 46.0 74.9 68.1 44.0 76.4 14.9 11.1 87.6 4.4 0.4Level of Service F D D E E D E B B F A AApproach Delay (s) 58.9 65.7 20.1 9.0Approach LOS E E C A
Intersection SummaryHCM 2000 Control Delay 24.2 HCM 2000 Level of Service CHCM 2000 Volume to Capacity ratio 0.76Actuated Cycle Length (s) 136.0 Sum of lost time (s) 14.5Intersection Capacity Utilization 77.9% ICU Level of Service DAnalysis Period (min) 15c Critical Lane Group

HCM Signalized Intersection Capacity Analysis8: El Camino Real & Valparaiso Ave/Glenwood Ave 2/9/2015
Menlo Parl El Camino Real Corridor Study Synchro 8 ReportFuture AM Peak Hour Conditions - No Project W-Trans
Movement EBL EBT EBR WBL WBT WBR NBL NBT NBR SBL SBT SBRLane ConfigurationsVolume (vph) 294 210 85 59 348 132 110 1005 48 121 1369 447Ideal Flow (vphpl) 1900 1900 1900 1900 1900 1900 1900 1900 1900 1900 1900 1900Total Lost time (s) 3.5 3.5 3.5 3.5 3.5 4.0 4.5 4.5 4.0 4.5 4.5Lane Util. Factor 0.95 0.95 1.00 1.00 1.00 1.00 0.95 1.00 1.00 0.95 1.00Frpb, ped/bikes 1.00 1.00 0.98 1.00 0.99 1.00 1.00 0.96 1.00 1.00 0.96Flpb, ped/bikes 1.00 1.00 1.00 1.00 1.00 1.00 1.00 1.00 1.00 1.00 1.00Frt 1.00 1.00 0.85 1.00 0.96 1.00 1.00 0.85 1.00 1.00 0.85Flt Protected 0.95 0.99 1.00 0.95 1.00 0.95 1.00 1.00 0.95 1.00 1.00Satd. Flow (prot) 1681 1753 1548 1770 1777 1770 3539 1525 1770 3539 1522Flt Permitted 0.95 0.99 1.00 0.95 1.00 0.95 1.00 1.00 0.95 1.00 1.00Satd. Flow (perm) 1681 1753 1548 1770 1777 1770 3539 1525 1770 3539 1522Peak-hour factor, PHF 0.99 0.99 0.99 0.99 0.99 0.99 0.99 0.99 0.99 0.99 0.99 0.99Adj. Flow (vph) 297 212 86 60 352 133 111 1015 48 122 1383 452RTOR Reduction (vph) 0 0 70 0 9 0 0 0 32 0 0 181Lane Group Flow (vph) 249 260 16 60 476 0 111 1015 16 122 1383 271Confl. Peds. (#/hr) 8 1 3 2Confl. Bikes (#/hr) 7 4 12Turn Type Split NA Perm Split NA Prot NA Perm Prot NA PermProtected Phases 4 4 8 8 5 2 1 6Permitted Phases 4 2 6Actuated Green, G (s) 25.6 25.6 25.6 38.4 38.4 6.0 45.9 45.9 10.6 50.5 50.5Effective Green, g (s) 25.6 25.6 25.6 38.4 38.4 6.0 45.9 45.9 10.6 50.5 50.5Actuated g/C Ratio 0.19 0.19 0.19 0.28 0.28 0.04 0.34 0.34 0.08 0.37 0.37Clearance Time (s) 3.5 3.5 3.5 3.5 3.5 4.0 4.5 4.5 4.0 4.5 4.5Vehicle Extension (s) 3.0 3.0 3.0 3.0 3.0 3.0 3.0 3.0 3.0 3.0 3.0Lane Grp Cap (vph) 316 329 291 499 501 78 1194 514 137 1314 565v/s Ratio Prot 0.15 c0.15 0.03 c0.27 c0.06 0.29 c0.07 c0.39v/s Ratio Perm 0.01 0.01 0.18v/c Ratio 0.79 0.79 0.06 0.12 0.95 1.42 0.85 0.03 0.89 1.05 0.48Uniform Delay, d1 52.6 52.6 45.3 36.3 47.8 65.0 41.9 30.2 62.1 42.8 32.7Progression Factor 1.00 1.00 1.00 1.00 1.00 0.90 1.24 1.00 1.17 0.86 0.51Incremental Delay, d2 12.2 12.2 0.1 0.1 27.6 243.5 6.8 0.1 42.1 38.6 2.6Delay (s) 64.8 64.8 45.4 36.4 75.4 302.1 58.7 30.3 114.8 75.4 19.2Level of Service E E D D E F E C F E BApproach Delay (s) 62.0 71.1 80.6 64.9Approach LOS E E F E
Intersection SummaryHCM 2000 Control Delay 69.6 HCM 2000 Level of Service EHCM 2000 Volume to Capacity ratio 0.99Actuated Cycle Length (s) 136.0 Sum of lost time (s) 15.5Intersection Capacity Utilization 100.6% ICU Level of Service GAnalysis Period (min) 15c Critical Lane Group

HCM Signalized Intersection Capacity Analysis9: El Camino Real & Encinal Ave 2/9/2015
Menlo Parl El Camino Real Corridor Study Synchro 8 ReportFuture AM Peak Hour Conditions - No Project W-Trans
Movement EBL EBT EBR WBL WBT WBR NBL NBT NBR SBL SBT SBRLane ConfigurationsVolume (vph) 4 57 9 132 20 99 14 1320 111 284 1798 42Ideal Flow (vphpl) 1900 1900 1900 1900 1900 1900 1900 1900 1900 1900 1900 1900Total Lost time (s) 3.0 3.0 3.0 3.0 3.0 4.0 4.0 3.0 4.0Lane Util. Factor 1.00 1.00 1.00 1.00 1.00 0.95 1.00 1.00 0.91Frpb, ped/bikes 1.00 0.98 1.00 0.98 1.00 1.00 0.97 1.00 1.00Flpb, ped/bikes 1.00 1.00 1.00 1.00 1.00 1.00 1.00 1.00 1.00Frt 1.00 0.85 1.00 0.85 1.00 1.00 0.85 1.00 1.00Flt Protected 1.00 1.00 0.96 1.00 0.95 1.00 1.00 0.95 1.00Satd. Flow (prot) 1856 1556 1785 1547 1770 3539 1531 1770 5065Flt Permitted 0.99 1.00 0.67 1.00 0.95 1.00 1.00 0.95 1.00Satd. Flow (perm) 1836 1556 1257 1547 1770 3539 1531 1770 5065Peak-hour factor, PHF 0.98 0.98 0.98 0.98 0.98 0.98 0.98 0.98 0.98 0.98 0.98 0.98Adj. Flow (vph) 4 58 9 135 20 101 14 1347 113 290 1835 43RTOR Reduction (vph) 0 0 8 0 0 76 0 0 24 0 1 0Lane Group Flow (vph) 0 62 1 0 155 25 14 1347 89 290 1877 0Confl. Peds. (#/hr) 4 4 2Confl. Bikes (#/hr) 4 4 7 11Turn Type Perm NA Perm Perm NA Perm Prot NA Perm Prot NAProtected Phases 4 8 5 2 1 6Permitted Phases 4 4 8 8 2Actuated Green, G (s) 21.8 21.8 21.8 21.8 2.7 77.6 77.6 26.6 101.5Effective Green, g (s) 21.8 21.8 21.8 21.8 2.7 77.6 77.6 26.6 101.5Actuated g/C Ratio 0.16 0.16 0.16 0.16 0.02 0.57 0.57 0.20 0.75Clearance Time (s) 3.0 3.0 3.0 3.0 3.0 4.0 4.0 3.0 4.0Vehicle Extension (s) 3.0 3.0 3.0 3.0 3.0 3.0 3.0 3.0 3.0Lane Grp Cap (vph) 294 249 201 247 35 2019 873 346 3780v/s Ratio Prot 0.01 c0.38 c0.16 0.37v/s Ratio Perm 0.03 0.00 c0.12 0.02 0.06v/c Ratio 0.21 0.01 0.77 0.10 0.40 0.67 0.10 0.84 0.50Uniform Delay, d1 49.6 48.0 54.7 48.8 65.8 20.2 13.3 52.6 7.0Progression Factor 1.00 1.00 1.00 1.00 0.90 0.55 0.59 1.00 1.00Incremental Delay, d2 0.4 0.0 16.6 0.2 4.3 1.0 0.1 16.1 0.5Delay (s) 50.0 48.0 71.3 48.9 63.8 12.2 8.0 68.7 7.4Level of Service D D E D E B A E AApproach Delay (s) 49.7 62.5 12.4 15.6Approach LOS D E B B
Intersection SummaryHCM 2000 Control Delay 18.1 HCM 2000 Level of Service BHCM 2000 Volume to Capacity ratio 0.72Actuated Cycle Length (s) 136.0 Sum of lost time (s) 10.0Intersection Capacity Utilization 78.6% ICU Level of Service DAnalysis Period (min) 15c Critical Lane Group

HCM Signalized Intersection Capacity Analysis1: El Camino Real & Sand Hill Rd/Alma St 2/9/2015
Menlo Parl El Camino Real Corridor Study Synchro 8 ReportFuture PM Peak Hour Conditions - No Project W-Trans
Movement EBL EBT EBR WBL WBT WBR NBL NBT NBR SBL SBT SBRLane ConfigurationsVolume (vph) 536 0 373 0 0 744 269 1434 195 397 1517 373Ideal Flow (vphpl) 1900 1900 1900 1900 1900 1900 1900 1900 1900 1900 1900 1900Total Lost time (s) 5.0 5.0 5.0 5.0 4.5 4.5 5.0 4.5 5.0Lane Util. Factor 0.97 1.00 1.00 1.00 0.91 1.00 1.00 0.91 1.00Frpb, ped/bikes 1.00 0.99 1.00 1.00 1.00 1.00 1.00 1.00 0.97Flpb, ped/bikes 1.00 1.00 1.00 1.00 1.00 1.00 1.00 1.00 1.00Frt 1.00 0.85 0.85 1.00 1.00 0.85 1.00 1.00 0.85Flt Protected 0.95 1.00 1.00 0.95 1.00 1.00 0.95 1.00 1.00Satd. Flow (prot) 3433 1568 1583 1770 5085 1583 1770 5085 1537Flt Permitted 0.95 1.00 1.00 0.95 1.00 1.00 0.95 1.00 1.00Satd. Flow (perm) 3433 1568 1583 1770 5085 1583 1770 5085 1537Peak-hour factor, PHF 0.91 0.91 0.91 0.91 0.91 0.91 0.91 0.91 0.91 0.91 0.91 0.91Adj. Flow (vph) 589 0 410 0 0 818 296 1576 214 436 1667 410RTOR Reduction (vph) 0 0 285 0 0 4 0 0 0 0 0 0Lane Group Flow (vph) 589 0 125 0 0 814 296 1576 214 436 1667 410Confl. Peds. (#/hr) 9 8Turn Type Prot pm+ov custom Prot NA Perm Prot NA pm+ovProtected Phases 7 5 10 5 2 1 6 7Permitted Phases 7 1 7 10 2 6Actuated Green, G (s) 20.0 42.8 92.0 22.8 38.5 38.5 32.8 48.5 68.5Effective Green, g (s) 20.0 42.8 88.0 22.8 38.5 38.5 32.8 48.5 68.5Actuated g/C Ratio 0.14 0.31 0.63 0.16 0.28 0.28 0.23 0.35 0.49Clearance Time (s) 5.0 5.0 5.0 4.5 4.5 5.0 4.5 5.0Vehicle Extension (s) 3.0 3.0 3.0 3.0 3.0 3.0 3.0 3.0Lane Grp Cap (vph) 490 479 995 288 1398 435 414 1761 752v/s Ratio Prot c0.17 0.04 0.17 c0.31 c0.25 0.33 0.08v/s Ratio Perm 0.04 c0.51 0.14 0.19v/c Ratio 1.20 0.26 0.82 1.03 1.13 0.49 1.05 0.95 0.55Uniform Delay, d1 60.0 36.7 19.9 58.6 50.8 42.6 53.6 44.5 24.9Progression Factor 1.00 1.00 1.00 1.00 1.00 1.00 0.92 0.63 0.99Incremental Delay, d2 109.1 0.3 5.3 60.4 67.0 3.9 53.0 9.7 0.6Delay (s) 169.1 37.0 25.2 119.0 117.8 46.5 102.4 37.8 25.2Level of Service F D C F F D F D CApproach Delay (s) 114.9 25.2 110.6 47.0Approach LOS F C F D
Intersection SummaryHCM 2000 Control Delay 75.5 HCM 2000 Level of Service EHCM 2000 Volume to Capacity ratio 1.06Actuated Cycle Length (s) 140.0 Sum of lost time (s) 18.5Intersection Capacity Utilization 100.3% ICU Level of Service GAnalysis Period (min) 15c Critical Lane Group

HCM Signalized Intersection Capacity Analysis2: El Camino Real & Cambridge Avenue 2/9/2015
Menlo Parl El Camino Real Corridor Study Synchro 8 ReportFuture PM Peak Hour Conditions - No Project W-Trans
Movement EBL EBT EBR WBL WBT WBR NBL NBT NBR SBL SBT SBRLane ConfigurationsVolume (vph) 32 5 89 84 16 14 188 2260 11 16 2119 29Ideal Flow (vphpl) 1900 1900 1900 1900 1900 1900 1900 1900 1900 1900 1900 1900Total Lost time (s) 4.0 4.0 4.0 4.0 4.0 4.0 4.0Lane Util. Factor 1.00 1.00 1.00 1.00 0.91 1.00 0.91Frpb, ped/bikes 1.00 1.00 1.00 1.00 1.00 1.00 1.00Flpb, ped/bikes 1.00 1.00 1.00 1.00 1.00 1.00 1.00Frt 1.00 0.85 0.98 1.00 1.00 1.00 1.00Flt Protected 0.96 1.00 0.96 0.95 1.00 0.95 1.00Satd. Flow (prot) 1779 1583 1762 1770 5081 1770 5070Flt Permitted 0.76 1.00 0.76 0.95 1.00 0.95 1.00Satd. Flow (perm) 1402 1583 1385 1770 5081 1770 5070Peak-hour factor, PHF 0.94 0.94 0.94 0.94 0.94 0.94 0.94 0.94 0.94 0.94 0.94 0.94Adj. Flow (vph) 34 5 95 89 17 15 200 2404 12 17 2254 31RTOR Reduction (vph) 0 0 83 0 4 0 0 0 0 0 1 0Lane Group Flow (vph) 0 39 12 0 117 0 200 2416 0 17 2284 0Confl. Peds. (#/hr) 4 4 5 11Turn Type Perm NA Perm Perm NA Prot NA Prot NAProtected Phases 4 8 5 2 1 6Permitted Phases 4 4 8Actuated Green, G (s) 18.4 18.4 18.4 20.4 106.9 2.7 89.2Effective Green, g (s) 18.4 18.4 18.4 20.4 106.9 2.7 89.2Actuated g/C Ratio 0.13 0.13 0.13 0.15 0.76 0.02 0.64Clearance Time (s) 4.0 4.0 4.0 4.0 4.0 4.0 4.0Vehicle Extension (s) 3.0 3.0 3.0 3.0 3.0 3.0 3.0Lane Grp Cap (vph) 184 208 182 257 3879 34 3230v/s Ratio Prot c0.11 0.48 0.01 c0.45v/s Ratio Perm 0.03 0.01 c0.08v/c Ratio 0.21 0.06 0.64 0.78 0.62 0.50 0.71Uniform Delay, d1 54.3 53.2 57.7 57.6 7.5 68.0 16.8Progression Factor 1.00 1.00 1.00 1.06 1.05 0.97 0.25Incremental Delay, d2 0.6 0.1 7.5 1.4 0.1 7.2 0.9Delay (s) 54.9 53.4 65.2 62.6 7.9 73.2 5.0Level of Service D D E E A E AApproach Delay (s) 53.8 65.2 12.1 5.5Approach LOS D E B A
Intersection SummaryHCM 2000 Control Delay 11.5 HCM 2000 Level of Service BHCM 2000 Volume to Capacity ratio 0.71Actuated Cycle Length (s) 140.0 Sum of lost time (s) 12.0Intersection Capacity Utilization 75.1% ICU Level of Service DAnalysis Period (min) 15c Critical Lane Group

HCM Signalized Intersection Capacity Analysis3: El Camino Real & Middle Avenue 2/9/2015
Menlo Parl El Camino Real Corridor Study Synchro 8 ReportFuture PM Peak Hour Conditions - No Project W-Trans
Movement EBL EBT EBR WBL WBT WBR NBL NBT NBR SBL SBT SBRLane ConfigurationsVolume (vph) 261 21 276 33 46 28 348 2017 3 41 1829 85Ideal Flow (vphpl) 1900 1900 1900 1900 1900 1900 1900 1900 1900 1900 1900 1900Total Lost time (s) 3.0 3.0 4.0 3.0 4.0 4.0 4.0Lane Util. Factor 1.00 1.00 1.00 1.00 0.91 1.00 0.91Frpb, ped/bikes 1.00 1.00 1.00 1.00 1.00 1.00 1.00Flpb, ped/bikes 0.99 1.00 1.00 1.00 1.00 1.00 1.00Frt 1.00 0.86 0.97 1.00 1.00 1.00 0.99Flt Protected 0.95 1.00 0.98 0.95 1.00 0.95 1.00Satd. Flow (prot) 1761 1604 1770 1770 5084 1770 5040Flt Permitted 0.62 1.00 0.59 0.95 1.00 0.95 1.00Satd. Flow (perm) 1155 1604 1055 1770 5084 1770 5040Peak-hour factor, PHF 0.98 0.92 0.98 0.92 0.92 0.92 0.98 0.98 0.92 0.92 0.98 0.98Adj. Flow (vph) 266 23 282 36 50 30 355 2058 3 45 1866 87RTOR Reduction (vph) 0 212 0 0 9 0 0 0 0 0 3 0Lane Group Flow (vph) 266 94 0 0 107 0 355 2061 0 45 1950 0Confl. Peds. (#/hr) 3 9Turn Type Perm NA Perm NA Prot NA Prot NAProtected Phases 4 8 5 2 1 6Permitted Phases 4 8Actuated Green, G (s) 35.0 35.0 34.0 30.9 87.1 6.9 64.1Effective Green, g (s) 35.0 35.0 34.0 30.9 87.1 6.9 64.1Actuated g/C Ratio 0.25 0.25 0.24 0.22 0.62 0.05 0.46Clearance Time (s) 3.0 3.0 4.0 3.0 4.0 4.0 4.0Vehicle Extension (s) 3.0 3.0 3.0 3.0 3.0 3.0 3.0Lane Grp Cap (vph) 288 401 256 390 3162 87 2307v/s Ratio Prot 0.06 c0.20 0.41 0.03 c0.39v/s Ratio Perm c0.23 0.10v/c Ratio 0.92 0.23 0.42 0.91 0.65 0.52 0.85Uniform Delay, d1 51.2 41.8 44.7 53.2 16.8 64.9 33.6Progression Factor 1.00 1.00 1.00 1.41 0.51 1.05 0.56Incremental Delay, d2 33.4 0.3 1.1 21.1 0.9 4.1 3.2Delay (s) 84.6 42.1 45.8 96.3 9.5 72.3 22.1Level of Service F D D F A E CApproach Delay (s) 61.9 45.8 22.2 23.2Approach LOS E D C C
Intersection SummaryHCM 2000 Control Delay 27.6 HCM 2000 Level of Service CHCM 2000 Volume to Capacity ratio 0.89Actuated Cycle Length (s) 140.0 Sum of lost time (s) 12.0Intersection Capacity Utilization 94.0% ICU Level of Service FAnalysis Period (min) 15c Critical Lane Group

HCM Signalized Intersection Capacity Analysis4: El Camino Real & Roble Avenue 2/9/2015
Menlo Parl El Camino Real Corridor Study Synchro 8 ReportFuture PM Peak Hour Conditions - No Project W-Trans
Movement EBL EBT EBR WBL WBT WBR NBL NBT NBR SBL SBT SBRLane ConfigurationsVolume (vph) 49 3 35 53 10 41 83 2082 16 73 1897 33Ideal Flow (vphpl) 1900 1900 1900 1900 1900 1900 1900 1900 1900 1900 1900 1900Total Lost time (s) 4.0 4.0 4.0 4.0 4.5 4.0 4.5Lane Util. Factor 1.00 1.00 1.00 1.00 0.91 1.00 0.91Frpb, ped/bikes 0.99 1.00 1.00 1.00 1.00 1.00 1.00Flpb, ped/bikes 1.00 0.98 1.00 1.00 1.00 1.00 1.00Frt 0.95 1.00 0.85 1.00 1.00 1.00 1.00Flt Protected 0.97 0.96 1.00 0.95 1.00 0.95 1.00Satd. Flow (prot) 1689 1760 1583 1770 5078 1770 5066Flt Permitted 0.81 0.73 1.00 0.95 1.00 0.95 1.00Satd. Flow (perm) 1406 1333 1583 1770 5078 1770 5066Peak-hour factor, PHF 0.94 0.94 0.94 0.94 0.94 0.94 0.94 0.94 0.94 0.94 0.94 0.94Adj. Flow (vph) 52 3 37 56 11 44 88 2215 17 78 2018 35RTOR Reduction (vph) 0 18 0 0 0 36 0 0 0 0 1 0Lane Group Flow (vph) 0 74 0 0 67 8 88 2232 0 78 2052 0Confl. Peds. (#/hr) 18 18 7 12Turn Type Perm NA Perm NA Perm Prot NA Prot NAProtected Phases 4 8 5 2 1 6Permitted Phases 4 8 8Actuated Green, G (s) 25.2 25.2 25.2 11.2 91.2 11.1 91.1Effective Green, g (s) 25.2 25.2 25.2 11.2 91.2 11.1 91.1Actuated g/C Ratio 0.18 0.18 0.18 0.08 0.65 0.08 0.65Clearance Time (s) 4.0 4.0 4.0 4.0 4.5 4.0 4.5Vehicle Extension (s) 3.0 3.0 3.0 3.0 3.0 3.0 3.0Lane Grp Cap (vph) 253 239 284 141 3307 140 3296v/s Ratio Prot c0.05 c0.44 0.04 0.41v/s Ratio Perm c0.05 0.05 0.01v/c Ratio 0.29 0.28 0.03 0.62 0.67 0.56 0.62Uniform Delay, d1 49.7 49.6 47.3 62.4 15.2 62.1 14.4Progression Factor 1.00 1.00 1.00 1.11 0.43 0.95 0.76Incremental Delay, d2 0.6 0.6 0.0 6.2 0.8 1.5 0.3Delay (s) 50.3 50.2 47.3 75.6 7.4 60.4 11.2Level of Service D D D E A E BApproach Delay (s) 50.3 49.1 10.0 13.0Approach LOS D D A B
Intersection SummaryHCM 2000 Control Delay 13.1 HCM 2000 Level of Service BHCM 2000 Volume to Capacity ratio 0.59Actuated Cycle Length (s) 140.0 Sum of lost time (s) 12.5Intersection Capacity Utilization 82.4% ICU Level of Service EAnalysis Period (min) 15c Critical Lane Group

HCM Signalized Intersection Capacity Analysis5: El Camino Real & Menlo Avenue/Ravenswood Avenue 2/9/2015
Menlo Parl El Camino Real Corridor Study Synchro 8 ReportFuture PM Peak Hour Conditions - No Project W-Trans
Movement EBL EBT EBR WBL WBT WBR NBL NBT NBR SBL SBT SBRLane ConfigurationsVolume (vph) 41 300 134 678 269 80 162 1399 665 211 1290 51Ideal Flow (vphpl) 1900 1900 1900 1900 1900 1900 1900 1900 1900 1900 1900 1900Lane Width 12 12 12 12 12 12 8 12 12 12 12 12Total Lost time (s) 4.0 4.0 4.0 4.0 4.5 5.0 5.0 4.5 5.0 5.0Lane Util. Factor 0.95 0.97 1.00 1.00 1.00 0.95 1.00 1.00 0.95 1.00Frpb, ped/bikes 1.00 1.00 1.00 0.98 1.00 1.00 0.95 1.00 1.00 0.93Flpb, ped/bikes 1.00 1.00 1.00 1.00 1.00 1.00 1.00 1.00 1.00 1.00Frt 0.96 1.00 1.00 0.85 1.00 1.00 0.85 1.00 1.00 0.85Flt Protected 1.00 0.95 1.00 1.00 0.95 1.00 1.00 0.95 1.00 1.00Satd. Flow (prot) 3375 3433 1863 1551 1534 3539 1502 1770 3539 1477Flt Permitted 1.00 0.95 1.00 1.00 0.95 1.00 1.00 0.95 1.00 1.00Satd. Flow (perm) 3375 3433 1863 1551 1534 3539 1502 1770 3539 1477Peak-hour factor, PHF 0.95 0.95 0.95 0.95 0.95 0.95 0.95 0.95 0.95 0.95 0.95 0.95Adj. Flow (vph) 43 316 141 714 283 84 171 1473 700 222 1358 54RTOR Reduction (vph) 0 30 0 0 0 64 0 0 256 0 0 32Lane Group Flow (vph) 0 470 0 714 283 20 171 1473 444 222 1358 22Confl. Peds. (#/hr) 6 18 13Confl. Bikes (#/hr) 29Turn Type Split NA Split NA Perm Prot NA Perm Prot NA PermProtected Phases 4 4 8 8 5 2 1 6Permitted Phases 8 2 6Actuated Green, G (s) 18.0 30.0 30.0 30.0 16.6 57.0 57.0 17.5 57.9 57.9Effective Green, g (s) 18.0 30.0 30.0 30.0 16.6 57.0 57.0 17.5 57.9 57.9Actuated g/C Ratio 0.13 0.21 0.21 0.21 0.12 0.41 0.41 0.12 0.41 0.41Clearance Time (s) 4.0 4.0 4.0 4.0 4.5 5.0 5.0 4.5 5.0 5.0Vehicle Extension (s) 3.0 3.0 3.0 3.0 3.0 3.0 3.0 3.0 3.0 3.0Lane Grp Cap (vph) 433 735 399 332 181 1440 611 221 1463 610v/s Ratio Prot c0.14 c0.21 0.15 0.11 c0.42 c0.13 0.38v/s Ratio Perm 0.01 0.30 0.02v/c Ratio 1.09 0.97 0.71 0.06 0.94 1.02 0.73 1.00 0.93 0.04Uniform Delay, d1 61.0 54.6 51.0 43.8 61.2 41.5 35.0 61.2 39.1 24.4Progression Factor 1.00 1.00 1.00 1.00 1.19 0.89 0.85 1.34 0.44 0.64Incremental Delay, d2 68.5 26.1 5.7 0.1 42.9 26.7 5.7 54.2 9.5 0.1Delay (s) 129.5 80.7 56.7 43.8 115.9 63.5 35.5 136.0 26.7 15.7Level of Service F F E D F E D F C BApproach Delay (s) 129.5 71.5 58.9 41.2Approach LOS F E E D
Intersection SummaryHCM 2000 Control Delay 62.5 HCM 2000 Level of Service EHCM 2000 Volume to Capacity ratio 1.02Actuated Cycle Length (s) 140.0 Sum of lost time (s) 17.5Intersection Capacity Utilization 99.1% ICU Level of Service FAnalysis Period (min) 15c Critical Lane Group

HCM Signalized Intersection Capacity Analysis6: El Camino Real & Santa Cruz Ave 2/9/2015
Menlo Parl El Camino Real Corridor Study Synchro 8 ReportFuture PM Peak Hour Conditions - No Project W-Trans
Movement EBL EBT EBR WBL WBT WBR NBL NBT NBR SBL SBT SBRLane ConfigurationsVolume (vph) 176 233 153 107 120 66 1 1431 256 0 1251 96Ideal Flow (vphpl) 1900 1900 1900 1900 1900 1900 1900 1900 1900 1900 1900 1900Total Lost time (s) 4.0 4.0 4.0 4.0 4.0 4.5 4.5 4.5 4.5Lane Util. Factor 1.00 1.00 1.00 1.00 1.00 0.95 1.00 0.95 1.00Frpb, ped/bikes 1.00 1.00 0.87 1.00 0.98 1.00 0.94 1.00 0.95Flpb, ped/bikes 1.00 1.00 1.00 1.00 1.00 1.00 1.00 1.00 1.00Frt 1.00 1.00 0.85 1.00 0.95 1.00 0.85 1.00 0.85Flt Protected 0.95 1.00 1.00 0.95 1.00 1.00 1.00 1.00 1.00Satd. Flow (prot) 1770 1863 1375 1770 1733 3539 1490 3539 1505Flt Permitted 0.95 1.00 1.00 0.95 1.00 0.95 1.00 1.00 1.00Satd. Flow (perm) 1770 1863 1375 1770 1733 3378 1490 3539 1505Peak-hour factor, PHF 0.96 0.96 0.96 0.96 0.96 0.96 0.96 0.96 0.96 0.96 0.96 0.96Adj. Flow (vph) 183 243 159 111 125 69 1 1491 267 0 1303 100RTOR Reduction (vph) 0 0 111 0 15 0 0 0 92 0 0 19Lane Group Flow (vph) 183 243 48 111 179 0 0 1492 175 0 1303 81Confl. Peds. (#/hr) 87 26 12 9Turn Type Split NA Perm Split NA Perm NA Perm NA PermProtected Phases 4 4 8 8 2 6Permitted Phases 4 2 2 6Actuated Green, G (s) 30.0 30.0 30.0 26.5 26.5 71.0 71.0 71.0 71.0Effective Green, g (s) 30.0 30.0 30.0 26.5 26.5 71.0 71.0 71.0 71.0Actuated g/C Ratio 0.21 0.21 0.21 0.19 0.19 0.51 0.51 0.51 0.51Clearance Time (s) 4.0 4.0 4.0 4.0 4.0 4.5 4.5 4.5 4.5Vehicle Extension (s) 3.0 3.0 3.0 3.0 3.0 3.0 3.0 3.0 3.0Lane Grp Cap (vph) 379 399 294 335 328 1713 755 1794 763v/s Ratio Prot 0.10 c0.13 0.06 c0.10 0.37v/s Ratio Perm 0.04 c0.44 0.12 0.05v/c Ratio 0.48 0.61 0.16 0.33 0.55 0.87 0.23 0.73 0.11Uniform Delay, d1 48.2 49.7 44.8 49.1 51.3 30.5 19.3 26.9 18.0Progression Factor 1.00 1.00 1.00 1.00 1.00 0.18 0.00 0.31 0.19Incremental Delay, d2 1.0 2.6 0.3 0.6 1.9 2.9 0.3 2.1 0.2Delay (s) 49.2 52.3 45.1 49.7 53.2 8.5 0.3 10.5 3.6Level of Service D D D D D A A B AApproach Delay (s) 49.4 51.9 7.2 10.0Approach LOS D D A B
Intersection SummaryHCM 2000 Control Delay 17.7 HCM 2000 Level of Service BHCM 2000 Volume to Capacity ratio 0.74Actuated Cycle Length (s) 140.0 Sum of lost time (s) 12.5Intersection Capacity Utilization 87.1% ICU Level of Service EAnalysis Period (min) 15c Critical Lane Group

HCM Signalized Intersection Capacity Analysis7: El Camino Real & Oak Grove Ave 2/9/2015
Menlo Parl El Camino Real Corridor Study Synchro 8 ReportFuture PM Peak Hour Conditions - No Project W-Trans
Movement EBL EBT EBR WBL WBT WBR NBL NBT NBR SBL SBT SBRLane ConfigurationsVolume (vph) 161 303 124 107 256 100 92 1410 96 146 1142 155Ideal Flow (vphpl) 1900 1900 1900 1900 1900 1900 1900 1900 1900 1900 1900 1900Total Lost time (s) 3.0 3.5 3.5 3.0 3.5 3.5 3.5 4.5 4.5 3.5 4.5 4.5Lane Util. Factor 1.00 1.00 1.00 1.00 1.00 1.00 1.00 0.95 1.00 1.00 0.95 1.00Frpb, ped/bikes 1.00 1.00 0.96 1.00 1.00 0.96 1.00 1.00 0.95 1.00 1.00 0.95Flpb, ped/bikes 1.00 1.00 1.00 1.00 1.00 1.00 1.00 1.00 1.00 1.00 1.00 1.00Frt 1.00 1.00 0.85 1.00 1.00 0.85 1.00 1.00 0.85 1.00 1.00 0.85Flt Protected 0.95 1.00 1.00 0.95 1.00 1.00 0.95 1.00 1.00 0.95 1.00 1.00Satd. Flow (prot) 1770 1863 1522 1770 1863 1515 1770 3539 1497 1770 3539 1497Flt Permitted 0.95 1.00 1.00 0.95 1.00 1.00 0.95 1.00 1.00 0.95 1.00 1.00Satd. Flow (perm) 1770 1863 1522 1770 1863 1515 1770 3539 1497 1770 3539 1497Peak-hour factor, PHF 0.98 0.98 0.98 0.98 0.98 0.98 0.98 0.98 0.98 0.98 0.98 0.98Adj. Flow (vph) 164 309 127 109 261 102 94 1439 98 149 1165 158RTOR Reduction (vph) 0 0 62 0 0 71 0 0 39 0 0 38Lane Group Flow (vph) 164 309 65 109 261 31 94 1439 59 149 1165 120Confl. Peds. (#/hr) 19 22 10 10Turn Type Prot NA Perm Prot NA Perm Prot NA Perm Prot NA PermProtected Phases 7 4 3 8 5 2 1 6Permitted Phases 4 8 2 6Actuated Green, G (s) 15.4 28.4 28.4 11.4 24.4 24.4 12.1 70.5 70.5 15.2 73.6 73.6Effective Green, g (s) 15.4 28.4 28.4 11.4 24.4 24.4 12.1 70.5 70.5 15.2 73.6 73.6Actuated g/C Ratio 0.11 0.20 0.20 0.08 0.17 0.17 0.09 0.50 0.50 0.11 0.53 0.53Clearance Time (s) 3.0 3.5 3.5 3.0 3.5 3.5 3.5 4.5 4.5 3.5 4.5 4.5Vehicle Extension (s) 3.0 3.0 3.0 3.0 3.0 3.0 3.0 3.0 3.0 3.0 3.0 3.0Lane Grp Cap (vph) 194 377 308 144 324 264 152 1782 753 192 1860 786v/s Ratio Prot c0.09 c0.17 0.06 0.14 0.05 c0.41 c0.08 c0.33v/s Ratio Perm 0.04 0.02 0.04 0.08v/c Ratio 0.85 0.82 0.21 0.76 0.81 0.12 0.62 0.81 0.08 0.78 0.63 0.15Uniform Delay, d1 61.1 53.4 46.5 62.9 55.5 48.7 61.7 29.1 18.0 60.7 23.5 17.1Progression Factor 1.00 1.00 1.00 1.00 1.00 1.00 1.22 0.53 0.43 0.58 1.73 2.24Incremental Delay, d2 27.1 13.0 0.3 20.1 13.6 0.2 4.1 2.3 0.1 14.5 1.3 0.3Delay (s) 88.3 66.4 46.8 83.0 69.1 48.9 79.5 17.7 7.8 49.7 41.9 38.7Level of Service F E D F E D E B A D D DApproach Delay (s) 68.2 67.9 20.7 42.3Approach LOS E E C D
Intersection SummaryHCM 2000 Control Delay 40.5 HCM 2000 Level of Service DHCM 2000 Volume to Capacity ratio 0.82Actuated Cycle Length (s) 140.0 Sum of lost time (s) 14.5Intersection Capacity Utilization 88.8% ICU Level of Service EAnalysis Period (min) 15c Critical Lane Group

HCM Signalized Intersection Capacity Analysis8: El Camino Real & Valparaiso Ave/Glenwood Ave 2/9/2015
Menlo Parl El Camino Real Corridor Study Synchro 8 ReportFuture PM Peak Hour Conditions - No Project W-Trans
Movement EBL EBT EBR WBL WBT WBR NBL NBT NBR SBL SBT SBRLane ConfigurationsVolume (vph) 360 233 124 50 219 49 133 1470 26 142 1065 380Ideal Flow (vphpl) 1900 1900 1900 1900 1900 1900 1900 1900 1900 1900 1900 1900Total Lost time (s) 3.5 3.5 3.5 3.5 3.5 4.0 4.5 4.5 4.0 4.5 4.5Lane Util. Factor 0.95 0.95 1.00 1.00 1.00 1.00 0.95 1.00 1.00 0.95 1.00Frpb, ped/bikes 1.00 1.00 0.98 1.00 1.00 1.00 1.00 0.97 1.00 1.00 0.98Flpb, ped/bikes 1.00 1.00 1.00 1.00 1.00 1.00 1.00 1.00 1.00 1.00 1.00Frt 1.00 1.00 0.85 1.00 0.97 1.00 1.00 0.85 1.00 1.00 0.85Flt Protected 0.95 0.99 1.00 0.95 1.00 0.95 1.00 1.00 0.95 1.00 1.00Satd. Flow (prot) 1681 1750 1554 1770 1812 1770 3539 1531 1770 3539 1546Flt Permitted 0.95 0.99 1.00 0.95 1.00 0.95 1.00 1.00 0.95 1.00 1.00Satd. Flow (perm) 1681 1750 1554 1770 1812 1770 3539 1531 1770 3539 1546Peak-hour factor, PHF 0.98 0.98 0.98 0.98 0.98 0.98 0.98 0.98 0.98 0.98 0.98 0.98Adj. Flow (vph) 367 238 127 51 223 50 136 1500 27 145 1087 388RTOR Reduction (vph) 0 0 68 0 6 0 0 0 17 0 0 180Lane Group Flow (vph) 297 308 59 51 267 0 136 1500 10 145 1087 208Confl. Peds. (#/hr) 5 3 1Turn Type Split NA Perm Split NA Prot NA Perm Prot NA PermProtected Phases 4 4 8 8 5 2 1 6Permitted Phases 4 2 6Actuated Green, G (s) 28.7 28.7 28.7 25.3 25.3 14.7 53.7 53.7 16.8 55.8 55.8Effective Green, g (s) 28.7 28.7 28.7 25.3 25.3 14.7 53.7 53.7 16.8 55.8 55.8Actuated g/C Ratio 0.20 0.20 0.20 0.18 0.18 0.10 0.38 0.38 0.12 0.40 0.40Clearance Time (s) 3.5 3.5 3.5 3.5 3.5 4.0 4.5 4.5 4.0 4.5 4.5Vehicle Extension (s) 3.0 3.0 3.0 3.0 3.0 3.0 3.0 3.0 3.0 3.0 3.0Lane Grp Cap (vph) 344 358 318 319 327 185 1357 587 212 1410 616v/s Ratio Prot c0.18 0.18 0.03 c0.15 0.08 c0.42 c0.08 0.31v/s Ratio Perm 0.04 0.01 0.13v/c Ratio 0.86 0.86 0.19 0.16 0.82 0.74 1.11 0.02 0.68 0.77 0.34Uniform Delay, d1 53.8 53.7 46.0 48.4 55.1 60.8 43.1 26.8 59.1 36.6 29.2Progression Factor 1.00 1.00 1.00 1.00 1.00 0.99 0.74 1.00 1.22 0.84 0.46Incremental Delay, d2 19.5 18.6 0.3 0.2 14.6 8.9 54.8 0.0 8.0 3.8 1.3Delay (s) 73.2 72.3 46.3 48.6 69.7 68.8 86.9 26.8 79.9 34.3 14.8Level of Service E E D D E E F C E C BApproach Delay (s) 68.2 66.4 84.4 33.7Approach LOS E E F C
Intersection SummaryHCM 2000 Control Delay 61.4 HCM 2000 Level of Service EHCM 2000 Volume to Capacity ratio 0.93Actuated Cycle Length (s) 140.0 Sum of lost time (s) 15.5Intersection Capacity Utilization 94.3% ICU Level of Service FAnalysis Period (min) 15c Critical Lane Group

HCM Signalized Intersection Capacity Analysis9: El Camino Real & Encinal Ave 2/9/2015
Menlo Parl El Camino Real Corridor Study Synchro 8 ReportFuture PM Peak Hour Conditions - No Project W-Trans
Movement EBL EBT EBR WBL WBT WBR NBL NBT NBR SBL SBT SBRLane ConfigurationsVolume (vph) 20 17 14 81 12 226 36 1680 197 384 1760 19Ideal Flow (vphpl) 1900 1900 1900 1900 1900 1900 1900 1900 1900 1900 1900 1900Total Lost time (s) 3.0 3.0 3.0 3.0 3.0 4.0 4.0 3.0 4.0Lane Util. Factor 1.00 1.00 1.00 1.00 1.00 0.95 1.00 1.00 0.91Frpb, ped/bikes 1.00 1.00 1.00 0.98 1.00 1.00 0.98 1.00 1.00Flpb, ped/bikes 1.00 1.00 1.00 1.00 1.00 1.00 1.00 1.00 1.00Frt 1.00 0.85 1.00 0.85 1.00 1.00 0.85 1.00 1.00Flt Protected 0.97 1.00 0.96 1.00 0.95 1.00 1.00 0.95 1.00Satd. Flow (prot) 1808 1583 1785 1554 1770 3539 1545 1770 5077Flt Permitted 0.85 1.00 0.73 1.00 0.95 1.00 1.00 0.95 1.00Satd. Flow (perm) 1572 1583 1354 1554 1770 3539 1545 1770 5077Peak-hour factor, PHF 0.99 0.99 0.99 0.99 0.99 0.99 0.99 0.99 0.99 0.99 0.99 0.99Adj. Flow (vph) 20 17 14 82 12 228 36 1697 199 388 1778 19RTOR Reduction (vph) 0 0 12 0 0 201 0 0 36 0 0 0Lane Group Flow (vph) 0 37 2 0 94 27 36 1697 163 388 1797 0Confl. Peds. (#/hr) 5 5 1Turn Type Perm NA Perm Perm NA Perm Prot NA Perm Prot NAProtected Phases 4 8 5 2 1 6Permitted Phases 4 4 8 8 2Actuated Green, G (s) 16.8 16.8 16.8 16.8 6.5 75.4 75.4 37.8 106.7Effective Green, g (s) 16.8 16.8 16.8 16.8 6.5 75.4 75.4 37.8 106.7Actuated g/C Ratio 0.12 0.12 0.12 0.12 0.05 0.54 0.54 0.27 0.76Clearance Time (s) 3.0 3.0 3.0 3.0 3.0 4.0 4.0 3.0 4.0Vehicle Extension (s) 3.0 3.0 3.0 3.0 3.0 3.0 3.0 3.0 3.0Lane Grp Cap (vph) 188 189 162 186 82 1906 832 477 3869v/s Ratio Prot 0.02 c0.48 c0.22 0.35v/s Ratio Perm 0.02 0.00 c0.07 0.02 0.11v/c Ratio 0.20 0.01 0.58 0.15 0.44 0.89 0.20 0.81 0.46Uniform Delay, d1 55.5 54.3 58.3 55.2 65.0 28.6 16.7 47.8 6.1Progression Factor 1.00 1.00 1.00 1.00 0.81 0.43 0.43 1.00 1.00Incremental Delay, d2 0.5 0.0 5.2 0.4 0.3 0.7 0.0 10.2 0.4Delay (s) 56.0 54.3 63.5 55.5 53.0 13.0 7.3 58.0 6.5Level of Service E D E E D B A E AApproach Delay (s) 55.6 57.9 13.2 15.7Approach LOS E E B B
Intersection SummaryHCM 2000 Control Delay 18.1 HCM 2000 Level of Service BHCM 2000 Volume to Capacity ratio 0.83Actuated Cycle Length (s) 140.0 Sum of lost time (s) 10.0Intersection Capacity Utilization 91.7% ICU Level of Service FAnalysis Period (min) 15c Critical Lane Group

HCM Signalized Intersection Capacity Analysis1: El Camino Real & Sand Hill Rd/Alma St 4/23/2015
Menlo Parl El Camino Real Corridor Study Synchro 8 ReportFuture AM Peak Hour Conditions - Alternative 1 W-Trans
Movement EBL EBT EBR WBL WBT WBR NBL NBT NBR SBL SBT SBRLane ConfigurationsVolume (vph) 164 0 330 0 0 672 341 1295 72 359 1692 233Ideal Flow (vphpl) 1900 1900 1900 1900 1900 1900 1900 1900 1900 1900 1900 1900Total Lost time (s) 5.0 5.0 5.0 5.0 4.5 4.5 5.0 4.5 5.0Lane Util. Factor 0.97 1.00 1.00 1.00 0.91 1.00 1.00 0.91 1.00Frpb, ped/bikes 1.00 1.00 0.99 1.00 1.00 0.98 1.00 1.00 0.98Flpb, ped/bikes 1.00 1.00 1.00 1.00 1.00 1.00 1.00 1.00 1.00Frt 1.00 0.85 0.85 1.00 1.00 0.85 1.00 1.00 0.85Flt Protected 0.95 1.00 1.00 0.95 1.00 1.00 0.95 1.00 1.00Satd. Flow (prot) 3433 1577 1562 1770 5085 1550 1770 5085 1550Flt Permitted 0.95 1.00 1.00 0.95 1.00 1.00 0.95 1.00 1.00Satd. Flow (perm) 3433 1577 1562 1770 5085 1550 1770 5085 1550Peak-hour factor, PHF 0.95 0.95 0.95 0.95 0.95 0.95 0.95 0.95 0.95 0.95 0.95 0.95Adj. Flow (vph) 173 0 347 0 0 707 359 1363 76 378 1781 245RTOR Reduction (vph) 0 0 193 0 0 6 0 0 0 0 0 0Lane Group Flow (vph) 173 0 154 0 0 701 359 1363 76 378 1781 245Confl. Peds. (#/hr) 2Confl. Bikes (#/hr) 4 1 8Turn Type Prot pm+ov custom Prot NA Perm Prot NA pm+ovProtected Phases 7 5 8 5 2 1 6 7Permitted Phases 7 1 7 8 2 6Actuated Green, G (s) 13.0 44.9 74.6 31.9 55.9 55.9 34.6 58.6 71.6Effective Green, g (s) 13.0 44.9 70.6 31.9 55.9 55.9 34.6 58.6 71.6Actuated g/C Ratio 0.09 0.32 0.50 0.23 0.40 0.40 0.25 0.42 0.51Clearance Time (s) 5.0 5.0 5.0 4.5 4.5 5.0 4.5 5.0Vehicle Extension (s) 3.0 3.0 3.0 3.0 3.0 3.0 3.0 3.0Lane Grp Cap (vph) 318 505 787 403 2030 618 437 2128 792v/s Ratio Prot 0.05 0.07 0.20 0.27 0.21 c0.35 0.03v/s Ratio Perm 0.03 c0.45 0.05 0.13v/c Ratio 0.54 0.31 0.89 0.89 0.67 0.12 0.86 0.84 0.31Uniform Delay, d1 60.7 35.8 31.2 52.4 34.5 26.6 50.5 36.4 19.8Progression Factor 1.00 1.00 1.00 1.00 1.00 1.00 1.49 0.45 0.23Incremental Delay, d2 1.9 0.3 12.3 21.0 1.8 0.4 13.6 3.4 0.2Delay (s) 62.6 36.1 43.5 73.4 36.3 27.0 88.7 19.8 4.7Level of Service E D D E D C F B AApproach Delay (s) 44.9 43.5 43.3 29.1Approach LOS D D D C
Intersection SummaryHCM 2000 Control Delay 37.2 HCM 2000 Level of Service DHCM 2000 Volume to Capacity ratio 0.92Actuated Cycle Length (s) 140.0 Sum of lost time (s) 18.5Intersection Capacity Utilization 82.8% ICU Level of Service EAnalysis Period (min) 15c Critical Lane Group

HCM Signalized Intersection Capacity Analysis2: El Camino Real & Cambridge Avenue 4/23/2015
Menlo Parl El Camino Real Corridor Study Synchro 8 ReportFuture AM Peak Hour Conditions - Alternative 1 W-Trans
Movement EBL EBT EBR WBL WBT WBR NBL NBT NBR SBL SBT SBRLane ConfigurationsVolume (vph) 23 16 64 15 4 2 53 2107 47 59 2168 25Ideal Flow (vphpl) 1900 1900 1900 1900 1900 1900 1900 1900 1900 1900 1900 1900Total Lost time (s) 4.0 4.0 4.0 4.0 4.0 4.0 4.0Lane Util. Factor 1.00 1.00 1.00 1.00 0.91 1.00 0.91Frpb, ped/bikes 1.00 0.98 1.00 1.00 1.00 1.00 1.00Flpb, ped/bikes 1.00 1.00 1.00 1.00 1.00 1.00 1.00Frt 1.00 0.85 0.99 1.00 1.00 1.00 1.00Flt Protected 0.97 1.00 0.96 0.95 1.00 0.95 1.00Satd. Flow (prot) 1807 1557 1772 1770 5067 1770 5074Flt Permitted 0.83 1.00 0.81 0.95 1.00 0.95 1.00Satd. Flow (perm) 1543 1557 1485 1770 5067 1770 5074Peak-hour factor, PHF 0.91 0.91 0.91 0.91 0.91 0.91 0.91 0.91 0.91 0.91 0.91 0.91Adj. Flow (vph) 25 18 70 16 4 2 58 2315 52 65 2382 27RTOR Reduction (vph) 0 0 64 0 2 0 0 1 0 0 0 0Lane Group Flow (vph) 0 43 6 0 20 0 58 2366 0 65 2409 0Confl. Peds. (#/hr) 2 2 2 4Confl. Bikes (#/hr) 2 3 6Turn Type Perm NA Perm Perm NA Prot NA Prot NAProtected Phases 4 8 5 2 1 6Permitted Phases 4 4 8Actuated Green, G (s) 12.6 12.6 12.6 8.2 106.7 8.7 107.2Effective Green, g (s) 12.6 12.6 12.6 8.2 106.7 8.7 107.2Actuated g/C Ratio 0.09 0.09 0.09 0.06 0.76 0.06 0.77Clearance Time (s) 4.0 4.0 4.0 4.0 4.0 4.0 4.0Vehicle Extension (s) 3.0 3.0 3.0 3.0 3.0 3.0 3.0Lane Grp Cap (vph) 138 140 133 103 3861 109 3885v/s Ratio Prot 0.03 0.47 c0.04 c0.47v/s Ratio Perm c0.03 0.00 0.01v/c Ratio 0.31 0.04 0.15 0.56 0.61 0.60 0.62Uniform Delay, d1 59.6 58.2 58.8 64.2 7.4 63.9 7.3Progression Factor 1.00 1.00 1.00 0.90 0.85 1.34 0.30Incremental Delay, d2 1.3 0.1 0.5 5.2 0.6 4.7 0.4Delay (s) 60.9 58.3 59.3 62.9 6.9 90.1 2.6Level of Service E E E E A F AApproach Delay (s) 59.3 59.3 8.2 4.9Approach LOS E E A A
Intersection SummaryHCM 2000 Control Delay 7.9 HCM 2000 Level of Service AHCM 2000 Volume to Capacity ratio 0.59Actuated Cycle Length (s) 140.0 Sum of lost time (s) 12.0Intersection Capacity Utilization 70.8% ICU Level of Service CAnalysis Period (min) 15c Critical Lane Group

HCM Signalized Intersection Capacity Analysis3: El Camino Real & Middle Avenue 4/23/2015
Menlo Parl El Camino Real Corridor Study Synchro 8 ReportFuture AM Peak Hour Conditions - Alternative 1 W-Trans
Movement EBL EBT EBR WBL WBT WBR NBL NBT NBR SBL SBT SBRLane ConfigurationsVolume (vph) 230 47 309 26 18 17 316 1797 1 64 1835 128Ideal Flow (vphpl) 1900 1900 1900 1900 1900 1900 1900 1900 1900 1900 1900 1900Total Lost time (s) 3.0 3.0 4.0 3.0 4.0 4.0 4.0Lane Util. Factor 1.00 1.00 1.00 1.00 0.91 1.00 0.91Frpb, ped/bikes 1.00 1.00 1.00 1.00 1.00 1.00 1.00Flpb, ped/bikes 1.00 1.00 1.00 1.00 1.00 1.00 1.00Frt 1.00 0.87 0.96 1.00 1.00 1.00 0.99Flt Protected 0.95 1.00 0.98 0.95 1.00 0.95 1.00Satd. Flow (prot) 1763 1620 1757 1770 5085 1770 5018Flt Permitted 0.70 1.00 0.28 0.95 1.00 0.95 1.00Satd. Flow (perm) 1307 1620 508 1770 5085 1770 5018Peak-hour factor, PHF 0.90 0.92 0.90 0.92 0.92 0.92 0.90 0.90 0.92 0.92 0.90 0.90Adj. Flow (vph) 256 51 343 28 20 18 351 1997 1 70 2039 142RTOR Reduction (vph) 0 175 0 0 10 0 0 0 0 0 6 0Lane Group Flow (vph) 256 219 0 0 56 0 351 1998 0 70 2176 0Confl. Peds. (#/hr) 3 8Confl. Bikes (#/hr) 8Turn Type Perm NA Perm NA Prot NA Prot NAProtected Phases 4 8 5 2 1 6Permitted Phases 4 8Actuated Green, G (s) 29.7 29.7 28.7 30.3 89.7 9.6 70.0Effective Green, g (s) 29.7 29.7 28.7 30.3 89.7 9.6 70.0Actuated g/C Ratio 0.21 0.21 0.20 0.22 0.64 0.07 0.50Clearance Time (s) 3.0 3.0 4.0 3.0 4.0 4.0 4.0Vehicle Extension (s) 3.0 3.0 3.0 3.0 3.0 3.0 3.0Lane Grp Cap (vph) 277 343 104 383 3258 121 2509v/s Ratio Prot 0.14 c0.20 0.39 0.04 c0.43v/s Ratio Perm c0.20 0.11v/c Ratio 0.92 0.64 0.54 0.92 0.61 0.58 0.87Uniform Delay, d1 54.0 50.3 49.8 53.6 14.9 63.2 30.9Progression Factor 1.00 1.00 1.00 0.69 1.20 0.63 0.33Incremental Delay, d2 34.4 3.9 5.7 22.4 0.7 5.7 3.8Delay (s) 88.4 54.1 55.5 59.1 18.6 45.2 14.1Level of Service F D E E B D BApproach Delay (s) 67.7 55.5 24.7 15.1Approach LOS E E C B
Intersection SummaryHCM 2000 Control Delay 26.2 HCM 2000 Level of Service CHCM 2000 Volume to Capacity ratio 0.91Actuated Cycle Length (s) 140.0 Sum of lost time (s) 12.0Intersection Capacity Utilization 92.0% ICU Level of Service FAnalysis Period (min) 15c Critical Lane Group

HCM Signalized Intersection Capacity Analysis4: El Camino Real & Roble Avenue 4/23/2015
Menlo Parl El Camino Real Corridor Study Synchro 8 ReportFuture AM Peak Hour Conditions - Alternative 1 W-Trans
Movement EBL EBT EBR WBL WBT WBR NBL NBT NBR SBL SBT SBRLane ConfigurationsVolume (vph) 64 5 50 4 4 8 41 2014 23 35 1904 32Ideal Flow (vphpl) 1900 1900 1900 1900 1900 1900 1900 1900 1900 1900 1900 1900Total Lost time (s) 4.0 4.0 4.0 4.0 4.5 4.0 4.5Lane Util. Factor 1.00 1.00 1.00 1.00 0.91 1.00 0.91Frpb, ped/bikes 1.00 1.00 0.98 1.00 1.00 1.00 1.00Flpb, ped/bikes 1.00 1.00 1.00 1.00 1.00 1.00 1.00Frt 0.94 1.00 0.85 1.00 1.00 1.00 1.00Flt Protected 0.97 0.98 1.00 0.95 1.00 0.95 1.00Satd. Flow (prot) 1711 1817 1545 1770 5075 1770 5073Flt Permitted 0.83 0.91 1.00 0.95 1.00 0.95 1.00Satd. Flow (perm) 1453 1694 1545 1770 5075 1770 5073Peak-hour factor, PHF 0.92 0.92 0.92 0.92 0.92 0.92 0.92 0.92 0.92 0.92 0.92 0.92Adj. Flow (vph) 70 5 54 4 4 9 45 2189 25 38 2070 35RTOR Reduction (vph) 0 21 0 0 0 8 0 1 0 0 1 0Lane Group Flow (vph) 0 108 0 0 8 1 45 2213 0 38 2104 0Confl. Bikes (#/hr) 6 6Turn Type Perm NA Perm NA Perm Prot NA Prot NAProtected Phases 4 8 5 2 1 6Permitted Phases 4 8 8Actuated Green, G (s) 15.5 15.5 15.5 7.8 104.7 7.3 104.2Effective Green, g (s) 15.5 15.5 15.5 7.8 104.7 7.3 104.2Actuated g/C Ratio 0.11 0.11 0.11 0.06 0.75 0.05 0.74Clearance Time (s) 4.0 4.0 4.0 4.0 4.5 4.0 4.5Vehicle Extension (s) 3.0 3.0 3.0 3.0 3.0 3.0 3.0Lane Grp Cap (vph) 160 187 171 98 3795 92 3775v/s Ratio Prot c0.03 c0.44 0.02 0.41v/s Ratio Perm c0.07 0.00 0.00v/c Ratio 0.67 0.04 0.01 0.46 0.58 0.41 0.56Uniform Delay, d1 59.8 55.6 55.4 64.1 7.9 64.3 7.8Progression Factor 1.00 1.00 1.00 1.27 0.12 1.06 0.59Incremental Delay, d2 10.6 0.1 0.0 2.6 0.5 2.0 0.4Delay (s) 70.4 55.7 55.4 84.1 1.5 69.9 5.0Level of Service E E E F A E AApproach Delay (s) 70.4 55.6 3.1 6.2Approach LOS E E A A
Intersection SummaryHCM 2000 Control Delay 6.7 HCM 2000 Level of Service AHCM 2000 Volume to Capacity ratio 0.59Actuated Cycle Length (s) 140.0 Sum of lost time (s) 12.5Intersection Capacity Utilization 63.4% ICU Level of Service BAnalysis Period (min) 15c Critical Lane Group

HCM Signalized Intersection Capacity Analysis5: El Camino Real & Menlo Avenue/Ravenswood Avenue 4/23/2015
Menlo Parl El Camino Real Corridor Study Synchro 8 ReportFuture AM Peak Hour Conditions - Alternative 1 W-Trans
Movement EBL EBT EBR WBL WBT WBR NBL NBT NBR SBL SBT SBRLane ConfigurationsVolume (vph) 43 334 46 451 243 93 94 1671 385 536 1583 67Ideal Flow (vphpl) 1900 1900 1900 1900 1900 1900 1900 1900 1900 1900 1900 1900Lane Width 12 12 12 12 12 12 8 12 12 12 12 12Total Lost time (s) 4.0 4.0 4.0 4.0 4.5 5.0 5.0 4.5 5.0Lane Util. Factor 0.95 0.97 1.00 1.00 1.00 0.91 1.00 1.00 0.91Frpb, ped/bikes 1.00 1.00 1.00 0.97 1.00 1.00 0.98 1.00 1.00Flpb, ped/bikes 1.00 1.00 1.00 1.00 1.00 1.00 1.00 1.00 1.00Frt 0.98 1.00 1.00 0.85 1.00 1.00 0.85 1.00 0.99Flt Protected 0.99 0.95 1.00 1.00 0.95 1.00 1.00 0.95 1.00Satd. Flow (prot) 3450 3433 1863 1539 1534 5085 1552 1770 5039Flt Permitted 0.99 0.95 1.00 1.00 0.95 1.00 1.00 0.95 1.00Satd. Flow (perm) 3450 3433 1863 1539 1534 5085 1552 1770 5039Peak-hour factor, PHF 0.94 0.94 0.94 0.94 0.94 0.94 0.94 0.94 0.94 0.94 0.94 0.94Adj. Flow (vph) 46 355 49 480 259 99 100 1778 410 570 1684 71RTOR Reduction (vph) 0 7 0 0 0 80 0 0 146 0 3 0Lane Group Flow (vph) 0 443 0 480 259 19 100 1778 264 570 1752 0Confl. Peds. (#/hr) 5 3 14Confl. Bikes (#/hr) 15 8 5 6Turn Type Split NA Split NA Perm Prot NA Perm Prot NAProtected Phases 4 4 8 8 5 2 1 6Permitted Phases 8 2Actuated Green, G (s) 19.8 26.3 26.3 26.3 12.6 41.0 41.0 35.4 63.8Effective Green, g (s) 19.8 26.3 26.3 26.3 12.6 41.0 41.0 35.4 63.8Actuated g/C Ratio 0.14 0.19 0.19 0.19 0.09 0.29 0.29 0.25 0.46Clearance Time (s) 4.0 4.0 4.0 4.0 4.5 5.0 5.0 4.5 5.0Vehicle Extension (s) 3.0 3.0 3.0 3.0 3.0 3.0 3.0 3.0 3.0Lane Grp Cap (vph) 487 644 349 289 138 1489 454 447 2296v/s Ratio Prot c0.13 c0.14 0.14 0.07 c0.35 c0.32 0.35v/s Ratio Perm 0.01 0.17v/c Ratio 0.91 0.75 0.74 0.06 0.72 1.19 0.58 1.28 0.76Uniform Delay, d1 59.2 53.7 53.6 46.7 62.0 49.5 42.2 52.3 31.8Progression Factor 1.00 1.00 1.00 1.00 1.22 0.67 0.49 1.48 0.60Incremental Delay, d2 20.7 4.7 8.3 0.1 14.5 93.1 4.5 131.4 1.1Delay (s) 80.0 58.4 61.9 46.8 90.1 126.4 25.3 208.6 20.1Level of Service E E E D F F C F CApproach Delay (s) 80.0 58.1 106.7 66.3Approach LOS E E F E
Intersection SummaryHCM 2000 Control Delay 81.9 HCM 2000 Level of Service FHCM 2000 Volume to Capacity ratio 1.07Actuated Cycle Length (s) 140.0 Sum of lost time (s) 17.5Intersection Capacity Utilization 103.2% ICU Level of Service GAnalysis Period (min) 15c Critical Lane Group

HCM Signalized Intersection Capacity Analysis6: El Camino Real & Santa Cruz Ave 4/23/2015
Menlo Parl El Camino Real Corridor Study Synchro 8 ReportFuture AM Peak Hour Conditions - Alternative 1 W-Trans
Movement EBL EBT EBR WBL WBT WBR NBL NBT NBR SBL SBT SBRLane ConfigurationsVolume (vph) 158 67 105 65 59 31 0 1744 51 0 2262 70Ideal Flow (vphpl) 1900 1900 1900 1900 1900 1900 1900 1900 1900 1900 1900 1900Total Lost time (s) 4.0 4.0 4.0 4.0 4.0 4.5 4.5Lane Util. Factor 1.00 1.00 1.00 1.00 1.00 0.91 0.91Frpb, ped/bikes 1.00 1.00 0.91 1.00 0.97 1.00 1.00Flpb, ped/bikes 1.00 1.00 1.00 1.00 1.00 1.00 1.00Frt 1.00 1.00 0.85 1.00 0.95 1.00 1.00Flt Protected 0.95 1.00 1.00 0.95 1.00 1.00 1.00Satd. Flow (prot) 1770 1863 1439 1770 1705 5054 5058Flt Permitted 0.95 1.00 1.00 0.95 1.00 1.00 1.00Satd. Flow (perm) 1770 1863 1439 1770 1705 5054 5058Peak-hour factor, PHF 0.93 0.93 0.93 0.93 0.93 0.93 0.93 0.93 0.93 0.93 0.93 0.93Adj. Flow (vph) 170 72 113 70 63 33 0 1875 55 0 2432 75RTOR Reduction (vph) 0 0 94 0 13 0 0 2 0 0 2 0Lane Group Flow (vph) 170 72 19 70 83 0 0 1928 0 0 2505 0Confl. Peds. (#/hr) 50 58 14 3Confl. Bikes (#/hr) 9 11 4 1Turn Type Split NA Perm Split NA NA NAProtected Phases 4 4 8 8 2 6Permitted Phases 4Actuated Green, G (s) 23.6 23.6 23.6 30.0 30.0 73.9 73.9Effective Green, g (s) 23.6 23.6 23.6 30.0 30.0 73.9 73.9Actuated g/C Ratio 0.17 0.17 0.17 0.21 0.21 0.53 0.53Clearance Time (s) 4.0 4.0 4.0 4.0 4.0 4.5 4.5Vehicle Extension (s) 3.0 3.0 3.0 3.0 3.0 3.0 3.0Lane Grp Cap (vph) 298 314 242 379 365 2667 2669v/s Ratio Prot c0.10 0.04 0.04 c0.05 0.38 c0.50v/s Ratio Perm 0.01v/c Ratio 0.57 0.23 0.08 0.18 0.23 0.72 0.94Uniform Delay, d1 53.5 50.3 49.0 45.0 45.4 25.2 30.9Progression Factor 1.00 1.00 1.00 1.00 1.00 0.71 0.26Incremental Delay, d2 2.6 0.4 0.1 0.2 0.3 0.2 4.5Delay (s) 56.2 50.7 49.2 45.2 45.7 18.2 12.6Level of Service E D D D D B BApproach Delay (s) 52.8 45.5 18.2 12.6Approach LOS D D B B
Intersection SummaryHCM 2000 Control Delay 18.7 HCM 2000 Level of Service BHCM 2000 Volume to Capacity ratio 0.70Actuated Cycle Length (s) 140.0 Sum of lost time (s) 12.5Intersection Capacity Utilization 81.5% ICU Level of Service DAnalysis Period (min) 15c Critical Lane Group

HCM Signalized Intersection Capacity Analysis7: El Camino Real & Oak Grove Ave 4/23/2015
Menlo Parl El Camino Real Corridor Study Synchro 8 ReportFuture AM Peak Hour Conditions - Alternative 1 W-Trans
Movement EBL EBT EBR WBL WBT WBR NBL NBT NBR SBL SBT SBRLane ConfigurationsVolume (vph) 66 139 47 93 252 79 132 1734 62 88 2141 142Ideal Flow (vphpl) 1900 1900 1900 1900 1900 1900 1900 1900 1900 1900 1900 1900Total Lost time (s) 3.0 3.5 3.5 3.0 3.5 3.5 3.5 4.5 3.5 4.5Lane Util. Factor 1.00 1.00 1.00 1.00 1.00 1.00 1.00 0.91 1.00 0.91Frpb, ped/bikes 1.00 1.00 0.94 1.00 1.00 0.96 1.00 1.00 1.00 1.00Flpb, ped/bikes 1.00 1.00 1.00 1.00 1.00 1.00 1.00 1.00 1.00 1.00Frt 1.00 1.00 0.85 1.00 1.00 0.85 1.00 0.99 1.00 0.99Flt Protected 0.95 1.00 1.00 0.95 1.00 1.00 0.95 1.00 0.95 1.00Satd. Flow (prot) 1770 1863 1482 1770 1863 1517 1770 5053 1770 5030Flt Permitted 0.95 1.00 1.00 0.95 1.00 1.00 0.95 1.00 0.95 1.00Satd. Flow (perm) 1770 1863 1482 1770 1863 1517 1770 5053 1770 5030Peak-hour factor, PHF 0.93 0.93 0.93 0.93 0.93 0.93 0.93 0.93 0.93 0.93 0.93 0.93Adj. Flow (vph) 71 149 51 100 271 85 142 1865 67 95 2302 153RTOR Reduction (vph) 0 0 42 0 0 51 0 3 0 0 5 0Lane Group Flow (vph) 71 149 9 100 271 34 142 1929 0 95 2450 0Confl. Peds. (#/hr) 29 10 3Confl. Bikes (#/hr) 9 13 5 5Turn Type Prot NA Perm Prot NA Perm Prot NA Prot NAProtected Phases 7 4 3 8 5 2 1 6Permitted Phases 4 8Actuated Green, G (s) 7.8 24.0 24.0 9.0 25.2 25.2 14.5 80.3 12.2 78.0Effective Green, g (s) 7.8 24.0 24.0 9.0 25.2 25.2 14.5 80.3 12.2 78.0Actuated g/C Ratio 0.06 0.17 0.17 0.06 0.18 0.18 0.10 0.57 0.09 0.56Clearance Time (s) 3.0 3.5 3.5 3.0 3.5 3.5 3.5 4.5 3.5 4.5Vehicle Extension (s) 3.0 3.0 3.0 3.0 3.0 3.0 3.0 3.0 3.0 3.0Lane Grp Cap (vph) 98 319 254 113 335 273 183 2898 154 2802v/s Ratio Prot 0.04 0.08 c0.06 c0.15 c0.08 0.38 0.05 c0.49v/s Ratio Perm 0.01 0.02v/c Ratio 0.72 0.47 0.03 0.88 0.81 0.13 0.78 0.67 0.62 0.87Uniform Delay, d1 65.0 52.2 48.3 65.0 55.1 48.2 61.2 20.6 61.6 26.8Progression Factor 1.00 1.00 1.00 1.00 1.00 1.00 1.06 0.78 1.32 0.25Incremental Delay, d2 23.1 1.1 0.1 50.2 13.4 0.2 13.6 0.9 0.7 0.4Delay (s) 88.2 53.3 48.4 115.2 68.5 48.4 78.7 17.0 82.2 7.0Level of Service F D D F E D E B F AApproach Delay (s) 61.5 75.0 21.2 9.8Approach LOS E E C A
Intersection SummaryHCM 2000 Control Delay 22.4 HCM 2000 Level of Service CHCM 2000 Volume to Capacity ratio 0.85Actuated Cycle Length (s) 140.0 Sum of lost time (s) 14.5Intersection Capacity Utilization 88.5% ICU Level of Service EAnalysis Period (min) 15c Critical Lane Group

HCM Signalized Intersection Capacity Analysis8: El Camino Real & Valparaiso Ave/Glenwood Ave 4/23/2015
Menlo Parl El Camino Real Corridor Study Synchro 8 ReportFuture AM Peak Hour Conditions - Alternative 1 W-Trans
Movement EBL EBT EBR WBL WBT WBR NBL NBT NBR SBL SBT SBRLane ConfigurationsVolume (vph) 330 178 209 146 196 19 168 1711 62 64 2031 447Ideal Flow (vphpl) 1900 1900 1900 1900 1900 1900 1900 1900 1900 1900 1900 1900Total Lost time (s) 3.5 3.5 3.5 3.5 3.5 4.0 4.5 4.0 4.5Lane Util. Factor 0.95 0.95 1.00 1.00 1.00 1.00 0.91 1.00 0.91Frpb, ped/bikes 1.00 1.00 0.98 1.00 1.00 1.00 1.00 1.00 0.99Flpb, ped/bikes 1.00 1.00 1.00 1.00 1.00 1.00 1.00 1.00 1.00Frt 1.00 1.00 0.85 1.00 0.99 1.00 0.99 1.00 0.97Flt Protected 0.95 0.98 1.00 0.95 1.00 0.95 1.00 0.95 1.00Satd. Flow (prot) 1681 1743 1548 1770 1835 1770 5052 1770 4913Flt Permitted 0.95 0.98 1.00 0.95 1.00 0.95 1.00 0.95 1.00Satd. Flow (perm) 1681 1743 1548 1770 1835 1770 5052 1770 4913Peak-hour factor, PHF 0.99 0.99 0.99 0.99 0.99 0.99 0.99 0.99 0.99 0.99 0.99 0.99Adj. Flow (vph) 333 180 211 147 198 19 170 1728 63 65 2052 452RTOR Reduction (vph) 0 0 135 0 3 0 0 2 0 0 25 0Lane Group Flow (vph) 253 260 76 147 214 0 170 1789 0 65 2479 0Confl. Peds. (#/hr) 8 1 3 2Confl. Bikes (#/hr) 7 4 12Turn Type Split NA Perm Split NA Prot NA Prot NAProtected Phases 4 4 8 8 5 2 1 6Permitted Phases 4Actuated Green, G (s) 26.5 26.5 26.5 22.1 22.1 22.7 67.3 8.6 53.2Effective Green, g (s) 26.5 26.5 26.5 22.1 22.1 22.7 67.3 8.6 53.2Actuated g/C Ratio 0.19 0.19 0.19 0.16 0.16 0.16 0.48 0.06 0.38Clearance Time (s) 3.5 3.5 3.5 3.5 3.5 4.0 4.5 4.0 4.5Vehicle Extension (s) 3.0 3.0 3.0 3.0 3.0 3.0 3.0 3.0 3.0Lane Grp Cap (vph) 318 329 293 279 289 286 2428 108 1866v/s Ratio Prot c0.15 0.15 0.08 c0.12 c0.10 c0.35 0.04 c0.50v/s Ratio Perm 0.05v/c Ratio 0.80 0.79 0.26 0.53 0.74 0.59 0.74 0.60 1.33Uniform Delay, d1 54.2 54.1 48.4 54.1 56.2 54.4 29.2 64.0 43.4Progression Factor 1.00 1.00 1.00 1.00 1.00 0.93 1.19 1.04 0.95Incremental Delay, d2 12.9 12.2 0.5 1.8 9.8 2.5 1.6 6.8 150.7Delay (s) 67.0 66.3 48.8 55.9 66.1 52.9 36.2 73.3 192.1Level of Service E E D E E D D E FApproach Delay (s) 61.5 62.0 37.7 189.0Approach LOS E E D F
Intersection SummaryHCM 2000 Control Delay 111.5 HCM 2000 Level of Service FHCM 2000 Volume to Capacity ratio 0.98Actuated Cycle Length (s) 140.0 Sum of lost time (s) 15.5Intersection Capacity Utilization 100.9% ICU Level of Service GAnalysis Period (min) 15c Critical Lane Group

HCM Signalized Intersection Capacity Analysis9: El Camino Real & Encinal Ave 4/23/2015
Menlo Parl El Camino Real Corridor Study Synchro 8 ReportFuture AM Peak Hour Conditions - Alternative 1 W-Trans
Movement EBL EBT EBR WBL WBT WBR NBL NBT NBR SBL SBT SBRLane ConfigurationsVolume (vph) 4 57 13 203 20 92 14 2006 107 107 2322 42Ideal Flow (vphpl) 1900 1900 1900 1900 1900 1900 1900 1900 1900 1900 1900 1900Total Lost time (s) 3.0 3.0 3.0 3.0 3.0 4.0 3.0 4.0Lane Util. Factor 1.00 1.00 1.00 1.00 1.00 0.91 1.00 0.91Frpb, ped/bikes 1.00 0.98 1.00 0.98 1.00 1.00 1.00 1.00Flpb, ped/bikes 1.00 1.00 1.00 1.00 1.00 1.00 1.00 1.00Frt 1.00 0.85 1.00 0.85 1.00 0.99 1.00 1.00Flt Protected 1.00 1.00 0.96 1.00 0.95 1.00 0.95 1.00Satd. Flow (prot) 1856 1558 1782 1549 1770 5039 1770 5069Flt Permitted 0.98 1.00 0.68 1.00 0.95 1.00 0.95 1.00Satd. Flow (perm) 1834 1558 1263 1549 1770 5039 1770 5069Peak-hour factor, PHF 0.98 0.98 0.98 0.98 0.98 0.98 0.98 0.98 0.98 0.98 0.98 0.98Adj. Flow (vph) 4 58 13 207 20 94 14 2047 109 109 2369 43RTOR Reduction (vph) 0 0 10 0 0 46 0 3 0 0 1 0Lane Group Flow (vph) 0 62 3 0 227 48 14 2153 0 109 2411 0Confl. Peds. (#/hr) 4 4 2Confl. Bikes (#/hr) 4 4 7 11Turn Type Perm NA Perm Perm NA Perm Prot NA Prot NAProtected Phases 4 8 5 2 1 6Permitted Phases 4 4 8 8Actuated Green, G (s) 29.7 29.7 29.7 29.7 2.5 87.0 13.3 97.8Effective Green, g (s) 29.7 29.7 29.7 29.7 2.5 87.0 13.3 97.8Actuated g/C Ratio 0.21 0.21 0.21 0.21 0.02 0.62 0.10 0.70Clearance Time (s) 3.0 3.0 3.0 3.0 3.0 4.0 3.0 4.0Vehicle Extension (s) 3.0 3.0 3.0 3.0 3.0 3.0 3.0 3.0Lane Grp Cap (vph) 389 330 267 328 31 3131 168 3541v/s Ratio Prot 0.01 0.43 c0.06 c0.48v/s Ratio Perm 0.03 0.00 c0.18 0.03v/c Ratio 0.16 0.01 0.85 0.14 0.45 0.69 0.65 0.68Uniform Delay, d1 45.0 43.5 53.0 44.8 68.1 17.5 61.1 12.1Progression Factor 1.00 1.00 1.00 1.00 1.27 0.28 1.00 1.00Incremental Delay, d2 0.2 0.0 21.9 0.2 7.4 0.9 8.3 1.1Delay (s) 45.2 43.5 74.9 45.0 94.1 5.8 69.4 13.2Level of Service D D E D F A E BApproach Delay (s) 44.9 66.2 6.4 15.6Approach LOS D E A B
Intersection SummaryHCM 2000 Control Delay 15.3 HCM 2000 Level of Service BHCM 2000 Volume to Capacity ratio 0.73Actuated Cycle Length (s) 140.0 Sum of lost time (s) 10.0Intersection Capacity Utilization 79.0% ICU Level of Service DAnalysis Period (min) 15c Critical Lane Group

HCM Signalized Intersection Capacity Analysis1: El Camino Real & Sand Hill Rd/Alma St 4/23/2015
Menlo Parl El Camino Real Corridor Study Synchro 8 ReportFuture PM Peak Hour Conditions - Alternative 1 W-Trans
Movement EBL EBT EBR WBL WBT WBR NBL NBT NBR SBL SBT SBRLane ConfigurationsVolume (vph) 557 0 380 0 0 763 200 1543 179 437 1497 373Ideal Flow (vphpl) 1900 1900 1900 1900 1900 1900 1900 1900 1900 1900 1900 1900Total Lost time (s) 5.0 5.0 5.0 5.0 4.5 4.5 5.0 4.5 5.0Lane Util. Factor 0.97 1.00 1.00 1.00 0.91 1.00 1.00 0.91 1.00Frpb, ped/bikes 1.00 0.99 1.00 1.00 1.00 1.00 1.00 1.00 0.97Flpb, ped/bikes 1.00 1.00 1.00 1.00 1.00 1.00 1.00 1.00 1.00Frt 1.00 0.85 0.85 1.00 1.00 0.85 1.00 1.00 0.85Flt Protected 0.95 1.00 1.00 0.95 1.00 1.00 0.95 1.00 1.00Satd. Flow (prot) 3433 1566 1583 1770 5085 1583 1770 5085 1537Flt Permitted 0.95 1.00 1.00 0.95 1.00 1.00 0.95 1.00 1.00Satd. Flow (perm) 3433 1566 1583 1770 5085 1583 1770 5085 1537Peak-hour factor, PHF 0.91 0.91 0.91 0.91 0.91 0.91 0.91 0.91 0.91 0.91 0.91 0.91Adj. Flow (vph) 612 0 418 0 0 838 220 1696 197 480 1645 410RTOR Reduction (vph) 0 0 301 0 0 5 0 0 0 0 0 0Lane Group Flow (vph) 612 0 117 0 0 833 220 1696 197 480 1645 410Confl. Peds. (#/hr) 9 8Turn Type Prot pm+ov custom Prot NA Perm Prot NA pm+ovProtected Phases 7 5 10 5 2 1 6 7Permitted Phases 7 1 7 10 2 6Actuated Green, G (s) 20.0 39.1 91.0 19.1 39.5 39.5 30.7 51.1 71.1Effective Green, g (s) 20.0 39.1 87.0 19.1 39.5 39.5 30.7 51.1 71.1Actuated g/C Ratio 0.14 0.28 0.62 0.14 0.28 0.28 0.22 0.37 0.51Clearance Time (s) 5.0 5.0 5.0 4.5 4.5 5.0 4.5 5.0Vehicle Extension (s) 3.0 3.0 3.0 3.0 3.0 3.0 3.0 3.0Lane Grp Cap (vph) 490 437 983 241 1434 446 388 1856 780v/s Ratio Prot c0.18 0.04 0.12 c0.33 c0.27 0.32 0.08v/s Ratio Perm 0.04 c0.53 0.12 0.19v/c Ratio 1.25 0.27 0.85 0.91 1.18 0.44 1.24 0.89 0.53Uniform Delay, d1 60.0 39.3 21.2 59.6 50.2 41.2 54.6 41.7 23.1Progression Factor 1.00 1.00 1.00 1.00 1.00 1.00 0.98 0.55 0.85Incremental Delay, d2 128.2 0.3 6.9 35.3 89.7 3.2 122.3 5.1 0.5Delay (s) 188.2 39.6 28.1 94.9 139.9 44.4 175.7 27.9 20.2Level of Service F D C F F D F C CApproach Delay (s) 127.9 28.1 126.3 54.6Approach LOS F C F D
Intersection SummaryHCM 2000 Control Delay 86.0 HCM 2000 Level of Service FHCM 2000 Volume to Capacity ratio 1.14Actuated Cycle Length (s) 140.0 Sum of lost time (s) 18.5Intersection Capacity Utilization 104.2% ICU Level of Service GAnalysis Period (min) 15c Critical Lane Group

HCM Signalized Intersection Capacity Analysis2: El Camino Real & Cambridge Avenue 4/23/2015
Menlo Parl El Camino Real Corridor Study Synchro 8 ReportFuture PM Peak Hour Conditions - Alternative 1 W-Trans
Movement EBL EBT EBR WBL WBT WBR NBL NBT NBR SBL SBT SBRLane ConfigurationsVolume (vph) 33 5 73 84 16 14 182 2391 11 16 2156 29Ideal Flow (vphpl) 1900 1900 1900 1900 1900 1900 1900 1900 1900 1900 1900 1900Total Lost time (s) 4.0 4.0 4.0 4.0 4.0 4.0 4.0Lane Util. Factor 1.00 1.00 1.00 1.00 0.91 1.00 0.91Frpb, ped/bikes 1.00 1.00 1.00 1.00 1.00 1.00 1.00Flpb, ped/bikes 1.00 1.00 1.00 1.00 1.00 1.00 1.00Frt 1.00 0.85 0.98 1.00 1.00 1.00 1.00Flt Protected 0.96 1.00 0.96 0.95 1.00 0.95 1.00Satd. Flow (prot) 1778 1583 1762 1770 5081 1770 5071Flt Permitted 0.75 1.00 0.76 0.95 1.00 0.95 1.00Satd. Flow (perm) 1397 1583 1384 1770 5081 1770 5071Peak-hour factor, PHF 0.94 0.94 0.94 0.94 0.94 0.94 0.94 0.94 0.94 0.94 0.94 0.94Adj. Flow (vph) 35 5 78 89 17 15 194 2544 12 17 2294 31RTOR Reduction (vph) 0 0 68 0 4 0 0 0 0 0 1 0Lane Group Flow (vph) 0 40 10 0 117 0 194 2556 0 17 2324 0Confl. Peds. (#/hr) 4 4 5 11Turn Type Perm NA Perm Perm NA Prot NA Prot NAProtected Phases 4 8 5 2 1 6Permitted Phases 4 4 8Actuated Green, G (s) 18.4 18.4 18.4 19.8 106.9 2.7 89.8Effective Green, g (s) 18.4 18.4 18.4 19.8 106.9 2.7 89.8Actuated g/C Ratio 0.13 0.13 0.13 0.14 0.76 0.02 0.64Clearance Time (s) 4.0 4.0 4.0 4.0 4.0 4.0 4.0Vehicle Extension (s) 3.0 3.0 3.0 3.0 3.0 3.0 3.0Lane Grp Cap (vph) 183 208 181 250 3879 34 3252v/s Ratio Prot c0.11 0.50 0.01 c0.46v/s Ratio Perm 0.03 0.01 c0.08v/c Ratio 0.22 0.05 0.64 0.78 0.66 0.50 0.71Uniform Delay, d1 54.4 53.2 57.7 58.0 7.9 68.0 16.6Progression Factor 1.00 1.00 1.00 1.03 1.22 0.98 0.22Incremental Delay, d2 0.6 0.1 7.6 1.4 0.1 6.5 0.8Delay (s) 55.0 53.3 65.3 61.1 9.7 73.2 4.5Level of Service D D E E A E AApproach Delay (s) 53.8 65.3 13.3 5.0Approach LOS D E B A
Intersection SummaryHCM 2000 Control Delay 11.7 HCM 2000 Level of Service BHCM 2000 Volume to Capacity ratio 0.71Actuated Cycle Length (s) 140.0 Sum of lost time (s) 12.0Intersection Capacity Utilization 75.5% ICU Level of Service DAnalysis Period (min) 15c Critical Lane Group

HCM Signalized Intersection Capacity Analysis3: El Camino Real & Middle Avenue 4/23/2015
Menlo Parl El Camino Real Corridor Study Synchro 8 ReportFuture PM Peak Hour Conditions - Alternative 1 W-Trans
Movement EBL EBT EBR WBL WBT WBR NBL NBT NBR SBL SBT SBRLane ConfigurationsVolume (vph) 309 21 250 33 46 28 346 2152 3 41 1889 102Ideal Flow (vphpl) 1900 1900 1900 1900 1900 1900 1900 1900 1900 1900 1900 1900Total Lost time (s) 3.0 3.0 4.0 3.0 4.0 4.0 4.0Lane Util. Factor 1.00 1.00 1.00 1.00 0.91 1.00 0.91Frpb, ped/bikes 1.00 1.00 1.00 1.00 1.00 1.00 1.00Flpb, ped/bikes 0.99 1.00 1.00 1.00 1.00 1.00 1.00Frt 1.00 0.86 0.97 1.00 1.00 1.00 0.99Flt Protected 0.95 1.00 0.98 0.95 1.00 0.95 1.00Satd. Flow (prot) 1760 1606 1770 1770 5084 1770 5033Flt Permitted 0.63 1.00 0.71 0.95 1.00 0.95 1.00Satd. Flow (perm) 1176 1606 1275 1770 5084 1770 5033Peak-hour factor, PHF 0.98 0.92 0.98 0.92 0.92 0.92 0.98 0.98 0.92 0.92 0.98 0.98Adj. Flow (vph) 315 23 255 36 50 30 353 2196 3 45 1928 104RTOR Reduction (vph) 0 184 0 0 9 0 0 0 0 0 4 0Lane Group Flow (vph) 315 94 0 0 107 0 353 2199 0 45 2028 0Confl. Peds. (#/hr) 3 9Turn Type Perm NA Perm NA Prot NA Prot NAProtected Phases 4 8 5 2 1 6Permitted Phases 4 8Actuated Green, G (s) 38.9 38.9 37.9 29.0 83.2 6.9 62.1Effective Green, g (s) 38.9 38.9 37.9 29.0 83.2 6.9 62.1Actuated g/C Ratio 0.28 0.28 0.27 0.21 0.59 0.05 0.44Clearance Time (s) 3.0 3.0 4.0 3.0 4.0 4.0 4.0Vehicle Extension (s) 3.0 3.0 3.0 3.0 3.0 3.0 3.0Lane Grp Cap (vph) 326 446 345 366 3021 87 2232v/s Ratio Prot 0.06 c0.20 0.43 0.03 c0.40v/s Ratio Perm c0.27 0.08v/c Ratio 0.97 0.21 0.31 0.96 0.73 0.52 0.91Uniform Delay, d1 49.9 38.8 40.7 55.0 20.3 64.9 36.3Progression Factor 1.00 1.00 1.00 1.37 0.51 0.97 0.82Incremental Delay, d2 40.4 0.2 0.5 32.1 1.2 4.0 5.5Delay (s) 90.3 39.0 41.2 107.7 11.6 67.0 35.3Level of Service F D D F B E DApproach Delay (s) 66.3 41.2 24.9 36.0Approach LOS E D C D
Intersection SummaryHCM 2000 Control Delay 34.1 HCM 2000 Level of Service CHCM 2000 Volume to Capacity ratio 0.95Actuated Cycle Length (s) 140.0 Sum of lost time (s) 12.0Intersection Capacity Utilization 94.4% ICU Level of Service FAnalysis Period (min) 15c Critical Lane Group

HCM Signalized Intersection Capacity Analysis4: El Camino Real & Roble Avenue 4/23/2015
Menlo Parl El Camino Real Corridor Study Synchro 8 ReportFuture PM Peak Hour Conditions - Alternative 1 W-Trans
Movement EBL EBT EBR WBL WBT WBR NBL NBT NBR SBL SBT SBRLane ConfigurationsVolume (vph) 52 3 35 53 10 44 83 2359 16 73 1968 36Ideal Flow (vphpl) 1900 1900 1900 1900 1900 1900 1900 1900 1900 1900 1900 1900Total Lost time (s) 4.0 4.0 4.0 4.0 4.5 4.0 4.5Lane Util. Factor 1.00 1.00 1.00 1.00 0.91 1.00 0.91Frpb, ped/bikes 0.99 1.00 1.00 1.00 1.00 1.00 1.00Flpb, ped/bikes 1.00 0.98 1.00 1.00 1.00 1.00 1.00Frt 0.95 1.00 0.85 1.00 1.00 1.00 1.00Flt Protected 0.97 0.96 1.00 0.95 1.00 0.95 1.00Satd. Flow (prot) 1692 1760 1583 1770 5078 1770 5065Flt Permitted 0.80 0.72 1.00 0.95 1.00 0.95 1.00Satd. Flow (perm) 1398 1329 1583 1770 5078 1770 5065Peak-hour factor, PHF 0.94 0.94 0.94 0.94 0.94 0.94 0.94 0.94 0.94 0.94 0.94 0.94Adj. Flow (vph) 55 3 37 56 11 47 88 2510 17 78 2094 38RTOR Reduction (vph) 0 17 0 0 0 39 0 0 0 0 1 0Lane Group Flow (vph) 0 78 0 0 67 8 88 2527 0 78 2131 0Confl. Peds. (#/hr) 18 18 7 12Turn Type Perm NA Perm NA Perm Prot NA Prot NAProtected Phases 4 8 5 2 1 6Permitted Phases 4 8 8Actuated Green, G (s) 25.2 25.2 25.2 11.2 91.4 10.9 91.1Effective Green, g (s) 25.2 25.2 25.2 11.2 91.4 10.9 91.1Actuated g/C Ratio 0.18 0.18 0.18 0.08 0.65 0.08 0.65Clearance Time (s) 4.0 4.0 4.0 4.0 4.5 4.0 4.5Vehicle Extension (s) 3.0 3.0 3.0 3.0 3.0 3.0 3.0Lane Grp Cap (vph) 251 239 284 141 3315 137 3295v/s Ratio Prot c0.05 c0.50 0.04 0.42v/s Ratio Perm c0.06 0.05 0.01v/c Ratio 0.31 0.28 0.03 0.62 0.76 0.57 0.65Uniform Delay, d1 49.8 49.6 47.3 62.4 16.8 62.3 14.7Progression Factor 1.00 1.00 1.00 1.08 0.43 0.99 0.31Incremental Delay, d2 0.7 0.6 0.0 5.7 1.2 2.3 0.4Delay (s) 50.6 50.2 47.4 73.2 8.4 63.9 5.0Level of Service D D D E A E AApproach Delay (s) 50.6 49.0 10.6 7.1Approach LOS D D B A
Intersection SummaryHCM 2000 Control Delay 10.7 HCM 2000 Level of Service BHCM 2000 Volume to Capacity ratio 0.66Actuated Cycle Length (s) 140.0 Sum of lost time (s) 12.5Intersection Capacity Utilization 87.7% ICU Level of Service EAnalysis Period (min) 15c Critical Lane Group

HCM Signalized Intersection Capacity Analysis5: El Camino Real & Menlo Avenue/Ravenswood Avenue 4/23/2015
Menlo Parl El Camino Real Corridor Study Synchro 8 ReportFuture PM Peak Hour Conditions - Alternative 1 W-Trans
Movement EBL EBT EBR WBL WBT WBR NBL NBT NBR SBL SBT SBRLane ConfigurationsVolume (vph) 110 285 81 441 254 307 134 1890 623 249 1747 194Ideal Flow (vphpl) 1900 1900 1900 1900 1900 1900 1900 1900 1900 1900 1900 1900Lane Width 12 12 12 12 12 12 8 12 12 12 12 12Total Lost time (s) 4.0 4.0 4.0 4.0 4.5 5.0 5.0 4.5 5.0Lane Util. Factor 0.95 0.97 1.00 1.00 1.00 0.91 1.00 1.00 0.91Frpb, ped/bikes 1.00 1.00 1.00 0.98 1.00 1.00 0.95 1.00 0.99Flpb, ped/bikes 1.00 1.00 1.00 1.00 1.00 1.00 1.00 1.00 1.00Frt 0.97 1.00 1.00 0.85 1.00 1.00 0.85 1.00 0.99Flt Protected 0.99 0.95 1.00 1.00 0.95 1.00 1.00 0.95 1.00Satd. Flow (prot) 3410 3433 1863 1551 1534 5085 1501 1770 4976Flt Permitted 0.99 0.95 1.00 1.00 0.95 1.00 1.00 0.95 1.00Satd. Flow (perm) 3410 3433 1863 1551 1534 5085 1501 1770 4976Peak-hour factor, PHF 0.95 0.95 0.95 0.95 0.95 0.95 0.95 0.95 0.95 0.95 0.95 0.95Adj. Flow (vph) 116 300 85 464 267 323 141 1989 656 262 1839 204RTOR Reduction (vph) 0 12 0 0 0 204 0 0 301 0 9 0Lane Group Flow (vph) 0 489 0 464 267 119 141 1989 355 262 2034 0Confl. Peds. (#/hr) 6 18 13Confl. Bikes (#/hr) 29Turn Type Split NA Split NA Perm Prot NA Perm Prot NAProtected Phases 4 4 8 8 5 2 1 6Permitted Phases 8 2Actuated Green, G (s) 20.0 27.0 27.0 27.0 15.2 53.0 53.0 22.5 60.3Effective Green, g (s) 20.0 27.0 27.0 27.0 15.2 53.0 53.0 22.5 60.3Actuated g/C Ratio 0.14 0.19 0.19 0.19 0.11 0.38 0.38 0.16 0.43Clearance Time (s) 4.0 4.0 4.0 4.0 4.5 5.0 5.0 4.5 5.0Vehicle Extension (s) 3.0 3.0 3.0 3.0 3.0 3.0 3.0 3.0 3.0Lane Grp Cap (vph) 487 662 359 299 166 1925 568 284 2143v/s Ratio Prot c0.14 0.14 c0.14 0.09 c0.39 c0.15 0.41v/s Ratio Perm 0.08 0.24v/c Ratio 1.00 0.70 0.74 0.40 0.85 1.03 0.63 0.92 0.95Uniform Delay, d1 60.0 52.7 53.2 49.4 61.3 43.5 35.4 57.9 38.4Progression Factor 1.00 1.00 1.00 1.00 1.28 0.77 0.54 1.41 0.54Incremental Delay, d2 41.8 3.4 8.1 0.9 23.8 26.6 3.7 23.0 7.0Delay (s) 101.8 56.1 61.3 50.3 102.2 59.9 22.9 104.8 27.9Level of Service F E E D F E C F CApproach Delay (s) 101.8 55.6 53.3 36.6Approach LOS F E D D
Intersection SummaryHCM 2000 Control Delay 51.5 HCM 2000 Level of Service DHCM 2000 Volume to Capacity ratio 0.94Actuated Cycle Length (s) 140.0 Sum of lost time (s) 17.5Intersection Capacity Utilization 94.0% ICU Level of Service FAnalysis Period (min) 15c Critical Lane Group

HCM Signalized Intersection Capacity Analysis6: El Camino Real & Santa Cruz Ave 4/23/2015
Menlo Parl El Camino Real Corridor Study Synchro 8 ReportFuture PM Peak Hour Conditions - Alternative 1 W-Trans
Movement EBL EBT EBR WBL WBT WBR NBL NBT NBR SBL SBT SBRLane ConfigurationsVolume (vph) 253 85 213 59 72 59 1 2259 98 0 1977 125Ideal Flow (vphpl) 1900 1900 1900 1900 1900 1900 1900 1900 1900 1900 1900 1900Total Lost time (s) 4.0 4.0 4.0 4.0 4.0 4.5 4.5Lane Util. Factor 1.00 1.00 1.00 1.00 1.00 0.91 0.91Frpb, ped/bikes 1.00 1.00 0.87 1.00 0.98 1.00 1.00Flpb, ped/bikes 1.00 1.00 1.00 1.00 1.00 1.00 1.00Frt 1.00 1.00 0.85 1.00 0.93 0.99 0.99Flt Protected 0.95 1.00 1.00 0.95 1.00 1.00 1.00Satd. Flow (prot) 1770 1863 1375 1770 1700 5041 5025Flt Permitted 0.95 1.00 1.00 0.95 1.00 0.94 1.00Satd. Flow (perm) 1770 1863 1375 1770 1700 4735 5025Peak-hour factor, PHF 0.96 0.96 0.96 0.96 0.96 0.96 0.96 0.96 0.96 0.96 0.96 0.96Adj. Flow (vph) 264 89 222 61 75 61 1 2353 102 0 2059 130RTOR Reduction (vph) 0 0 174 0 22 0 0 3 0 0 5 0Lane Group Flow (vph) 264 89 48 61 114 0 0 2453 0 0 2184 0Confl. Peds. (#/hr) 87 26 12 9Turn Type Split NA Perm Split NA Perm NA NAProtected Phases 4 4 8 8 2 6Permitted Phases 4 2Actuated Green, G (s) 30.0 30.0 30.0 25.6 25.6 71.9 71.9Effective Green, g (s) 30.0 30.0 30.0 25.6 25.6 71.9 71.9Actuated g/C Ratio 0.21 0.21 0.21 0.18 0.18 0.51 0.51Clearance Time (s) 4.0 4.0 4.0 4.0 4.0 4.5 4.5Vehicle Extension (s) 3.0 3.0 3.0 3.0 3.0 3.0 3.0Lane Grp Cap (vph) 379 399 294 323 310 2431 2580v/s Ratio Prot c0.15 0.05 0.03 c0.07 0.43v/s Ratio Perm 0.03 c0.52v/c Ratio 0.70 0.22 0.16 0.19 0.37 1.01 0.85Uniform Delay, d1 50.8 45.4 44.8 48.4 50.1 34.0 29.3Progression Factor 1.00 1.00 1.00 1.00 1.00 0.43 0.25Incremental Delay, d2 5.5 0.3 0.3 0.3 0.7 12.2 2.4Delay (s) 56.3 45.7 45.0 48.7 50.8 26.8 9.8Level of Service E D D D D C AApproach Delay (s) 50.3 50.2 26.8 9.8Approach LOS D D C A
Intersection SummaryHCM 2000 Control Delay 23.3 HCM 2000 Level of Service CHCM 2000 Volume to Capacity ratio 0.81Actuated Cycle Length (s) 140.0 Sum of lost time (s) 12.5Intersection Capacity Utilization 89.0% ICU Level of Service EAnalysis Period (min) 15c Critical Lane Group

HCM Signalized Intersection Capacity Analysis7: El Camino Real & Oak Grove Ave 4/23/2015
Menlo Parl El Camino Real Corridor Study Synchro 8 ReportFuture PM Peak Hour Conditions - Alternative 1 W-Trans
Movement EBL EBT EBR WBL WBT WBR NBL NBT NBR SBL SBT SBRLane ConfigurationsVolume (vph) 179 273 152 122 198 114 114 2230 151 180 1917 143Ideal Flow (vphpl) 1900 1900 1900 1900 1900 1900 1900 1900 1900 1900 1900 1900Total Lost time (s) 3.0 3.5 3.5 3.0 3.5 3.5 3.5 4.5 3.5 4.5Lane Util. Factor 1.00 1.00 1.00 1.00 1.00 1.00 1.00 0.91 1.00 0.91Frpb, ped/bikes 1.00 1.00 0.96 1.00 1.00 0.96 1.00 1.00 1.00 1.00Flpb, ped/bikes 1.00 1.00 1.00 1.00 1.00 1.00 1.00 1.00 1.00 1.00Frt 1.00 1.00 0.85 1.00 1.00 0.85 1.00 0.99 1.00 0.99Flt Protected 0.95 1.00 1.00 0.95 1.00 1.00 0.95 1.00 0.95 1.00Satd. Flow (prot) 1770 1863 1522 1770 1863 1515 1770 5020 1770 5013Flt Permitted 0.95 1.00 1.00 0.95 1.00 1.00 0.95 1.00 0.95 1.00Satd. Flow (perm) 1770 1863 1522 1770 1863 1515 1770 5020 1770 5013Peak-hour factor, PHF 0.98 0.98 0.98 0.98 0.98 0.98 0.98 0.98 0.98 0.98 0.98 0.98Adj. Flow (vph) 183 279 155 124 202 116 116 2276 154 184 1956 146RTOR Reduction (vph) 0 0 83 0 0 87 0 5 0 0 6 0Lane Group Flow (vph) 183 279 72 124 202 29 116 2425 0 184 2096 0Confl. Peds. (#/hr) 19 22 10 10Turn Type Prot NA Perm Prot NA Perm Prot NA Prot NAProtected Phases 7 4 3 8 5 2 1 6Permitted Phases 4 8Actuated Green, G (s) 14.0 26.1 26.1 12.4 24.5 24.5 12.4 69.5 17.5 74.6Effective Green, g (s) 14.0 26.1 26.1 12.4 24.5 24.5 12.4 69.5 17.5 74.6Actuated g/C Ratio 0.10 0.19 0.19 0.09 0.18 0.18 0.09 0.50 0.12 0.53Clearance Time (s) 3.0 3.5 3.5 3.0 3.5 3.5 3.5 4.5 3.5 4.5Vehicle Extension (s) 3.0 3.0 3.0 3.0 3.0 3.0 3.0 3.0 3.0 3.0Lane Grp Cap (vph) 177 347 283 156 326 265 156 2492 221 2671v/s Ratio Prot c0.10 c0.15 0.07 0.11 0.07 c0.48 c0.10 0.42v/s Ratio Perm 0.05 0.02v/c Ratio 1.03 0.80 0.25 0.79 0.62 0.11 0.74 0.97 0.83 0.78Uniform Delay, d1 63.0 54.5 48.6 62.6 53.4 48.6 62.2 34.3 59.8 26.3Progression Factor 1.00 1.00 1.00 1.00 1.00 1.00 1.09 0.69 1.36 0.21Incremental Delay, d2 76.8 12.7 0.5 23.7 3.5 0.2 5.6 5.4 10.4 1.0Delay (s) 139.8 67.2 49.1 86.2 56.9 48.8 73.7 29.1 92.0 6.5Level of Service F E D F E D E C F AApproach Delay (s) 84.2 63.0 31.2 13.4Approach LOS F E C B
Intersection SummaryHCM 2000 Control Delay 32.2 HCM 2000 Level of Service CHCM 2000 Volume to Capacity ratio 0.93Actuated Cycle Length (s) 140.0 Sum of lost time (s) 14.5Intersection Capacity Utilization 97.7% ICU Level of Service FAnalysis Period (min) 15c Critical Lane Group

HCM Signalized Intersection Capacity Analysis8: El Camino Real & Valparaiso Ave/Glenwood Ave 4/23/2015
Menlo Parl El Camino Real Corridor Study Synchro 8 ReportFuture PM Peak Hour Conditions - Alternative 1 W-Trans
Movement EBL EBT EBR WBL WBT WBR NBL NBT NBR SBL SBT SBRLane ConfigurationsVolume (vph) 343 292 166 105 234 45 141 2295 58 123 1758 294Ideal Flow (vphpl) 1900 1900 1900 1900 1900 1900 1900 1900 1900 1900 1900 1900Total Lost time (s) 3.5 3.5 3.5 3.5 3.5 4.0 4.5 4.0 4.5Lane Util. Factor 0.95 0.95 1.00 1.00 1.00 1.00 0.91 1.00 0.91Frpb, ped/bikes 1.00 1.00 0.98 1.00 1.00 1.00 1.00 1.00 1.00Flpb, ped/bikes 1.00 1.00 1.00 1.00 1.00 1.00 1.00 1.00 1.00Frt 1.00 1.00 0.85 1.00 0.98 1.00 1.00 1.00 0.98Flt Protected 0.95 0.99 1.00 0.95 1.00 0.95 1.00 0.95 1.00Satd. Flow (prot) 1681 1760 1554 1770 1818 1770 5062 1770 4959Flt Permitted 0.95 0.99 1.00 0.95 1.00 0.95 1.00 0.95 1.00Satd. Flow (perm) 1681 1760 1554 1770 1818 1770 5062 1770 4959Peak-hour factor, PHF 0.98 0.98 0.98 0.98 0.98 0.98 0.98 0.98 0.98 0.98 0.98 0.98Adj. Flow (vph) 350 298 169 107 239 46 144 2342 59 126 1794 300RTOR Reduction (vph) 0 0 82 0 5 0 0 2 0 0 16 0Lane Group Flow (vph) 315 333 87 107 280 0 144 2399 0 126 2078 0Confl. Peds. (#/hr) 5 3 1Turn Type Split NA Perm Split NA Prot NA Prot NAProtected Phases 4 4 8 8 5 2 1 6Permitted Phases 4Actuated Green, G (s) 29.8 29.8 29.8 26.0 26.0 15.6 54.5 14.2 53.1Effective Green, g (s) 29.8 29.8 29.8 26.0 26.0 15.6 54.5 14.2 53.1Actuated g/C Ratio 0.21 0.21 0.21 0.19 0.19 0.11 0.39 0.10 0.38Clearance Time (s) 3.5 3.5 3.5 3.5 3.5 4.0 4.5 4.0 4.5Vehicle Extension (s) 3.0 3.0 3.0 3.0 3.0 3.0 3.0 3.0 3.0Lane Grp Cap (vph) 357 374 330 328 337 197 1970 179 1880v/s Ratio Prot 0.19 c0.19 0.06 c0.15 c0.08 c0.47 0.07 0.42v/s Ratio Perm 0.06v/c Ratio 0.88 0.89 0.26 0.33 0.83 0.73 1.22 0.70 1.11Uniform Delay, d1 53.4 53.5 46.0 49.4 54.9 60.2 42.8 60.9 43.4Progression Factor 1.00 1.00 1.00 1.00 1.00 0.94 1.23 1.06 0.91Incremental Delay, d2 21.7 22.2 0.4 0.6 15.8 4.6 99.7 9.4 54.2Delay (s) 75.1 75.7 46.4 50.0 70.7 61.3 152.4 74.2 93.8Level of Service E E D D E E F E FApproach Delay (s) 69.4 65.1 147.3 92.7Approach LOS E E F F
Intersection SummaryHCM 2000 Control Delay 110.9 HCM 2000 Level of Service FHCM 2000 Volume to Capacity ratio 1.01Actuated Cycle Length (s) 140.0 Sum of lost time (s) 15.5Intersection Capacity Utilization 99.8% ICU Level of Service FAnalysis Period (min) 15c Critical Lane Group

HCM Signalized Intersection Capacity Analysis9: El Camino Real & Encinal Ave 4/23/2015
Menlo Parl El Camino Real Corridor Study Synchro 8 ReportFuture PM Peak Hour Conditions - Alternative 1 W-Trans
Movement EBL EBT EBR WBL WBT WBR NBL NBT NBR SBL SBT SBRLane ConfigurationsVolume (vph) 20 17 14 160 12 202 36 2529 143 69 2257 19Ideal Flow (vphpl) 1900 1900 1900 1900 1900 1900 1900 1900 1900 1900 1900 1900Total Lost time (s) 3.0 3.0 3.0 3.0 3.0 4.0 3.0 4.0Lane Util. Factor 1.00 1.00 1.00 1.00 1.00 0.91 1.00 0.91Frpb, ped/bikes 1.00 1.00 1.00 0.98 1.00 1.00 1.00 1.00Flpb, ped/bikes 1.00 1.00 1.00 1.00 1.00 1.00 1.00 1.00Frt 1.00 0.85 1.00 0.85 1.00 0.99 1.00 1.00Flt Protected 0.97 1.00 0.96 1.00 0.95 1.00 0.95 1.00Satd. Flow (prot) 1809 1583 1780 1554 1770 5038 1770 5079Flt Permitted 0.79 1.00 0.71 1.00 0.95 1.00 0.95 1.00Satd. Flow (perm) 1475 1583 1330 1554 1770 5038 1770 5079Peak-hour factor, PHF 0.99 0.99 0.99 0.99 0.99 0.99 0.99 0.99 0.99 0.99 0.99 0.99Adj. Flow (vph) 20 17 14 162 12 204 36 2555 144 70 2280 19RTOR Reduction (vph) 0 0 12 0 0 79 0 4 0 0 1 0Lane Group Flow (vph) 0 37 2 0 174 125 36 2695 0 70 2298 0Confl. Peds. (#/hr) 5 5 1Turn Type Perm NA Perm Perm NA Perm Prot NA Prot NAProtected Phases 4 8 5 2 1 6Permitted Phases 4 4 8 8Actuated Green, G (s) 23.5 23.5 23.5 23.5 6.3 97.8 8.7 100.2Effective Green, g (s) 23.5 23.5 23.5 23.5 6.3 97.8 8.7 100.2Actuated g/C Ratio 0.17 0.17 0.17 0.17 0.04 0.70 0.06 0.72Clearance Time (s) 3.0 3.0 3.0 3.0 3.0 4.0 3.0 4.0Vehicle Extension (s) 3.0 3.0 3.0 3.0 3.0 3.0 3.0 3.0Lane Grp Cap (vph) 247 265 223 260 79 3519 109 3635v/s Ratio Prot 0.02 c0.54 c0.04 0.45v/s Ratio Perm 0.03 0.00 c0.13 0.08v/c Ratio 0.15 0.01 0.78 0.48 0.46 0.77 0.64 0.63Uniform Delay, d1 49.7 48.5 55.8 52.7 65.2 13.7 64.1 10.3Progression Factor 1.00 1.00 1.00 1.00 1.21 0.49 1.00 1.00Incremental Delay, d2 0.3 0.0 16.1 1.4 0.4 0.2 12.2 0.8Delay (s) 50.0 48.6 71.9 54.1 79.4 6.8 76.4 11.2Level of Service D D E D E A E BApproach Delay (s) 49.6 62.3 7.8 13.1Approach LOS D E A B
Intersection SummaryHCM 2000 Control Delay 14.2 HCM 2000 Level of Service BHCM 2000 Volume to Capacity ratio 0.75Actuated Cycle Length (s) 140.0 Sum of lost time (s) 10.0Intersection Capacity Utilization 81.7% ICU Level of Service DAnalysis Period (min) 15c Critical Lane Group

HCM Signalized Intersection Capacity Analysis1: El Camino Real & Sand Hill Rd/Alma St 4/23/2015
Menlo Parl El Camino Real Corridor Study Synchro 8 ReportFuture AM Peak Hour Conditions - Alternative 2 W-Trans
Movement EBL EBT EBR WBL WBT WBR NBL NBT NBR SBL SBT SBRLane ConfigurationsVolume (vph) 164 0 331 0 0 715 426 1069 28 359 1724 233Ideal Flow (vphpl) 1900 1900 1900 1900 1900 1900 1900 1900 1900 1900 1900 1900Total Lost time (s) 5.0 5.0 5.0 5.0 4.5 4.5 5.0 4.5 5.0Lane Util. Factor 0.97 1.00 1.00 1.00 0.91 1.00 1.00 0.91 1.00Frpb, ped/bikes 1.00 1.00 0.99 1.00 1.00 0.95 1.00 1.00 0.97Flpb, ped/bikes 1.00 1.00 1.00 1.00 1.00 1.00 1.00 1.00 1.00Frt 1.00 0.85 0.85 1.00 1.00 0.85 1.00 1.00 0.85Flt Protected 0.95 1.00 1.00 0.95 1.00 1.00 0.95 1.00 1.00Satd. Flow (prot) 3433 1577 1563 1770 5085 1503 1770 5085 1528Flt Permitted 0.95 1.00 1.00 0.95 1.00 1.00 0.95 1.00 1.00Satd. Flow (perm) 3433 1577 1563 1770 5085 1503 1770 5085 1528Peak-hour factor, PHF 0.95 0.95 0.95 0.95 0.95 0.95 0.95 0.95 0.95 0.95 0.95 0.95Adj. Flow (vph) 173 0 348 0 0 753 448 1125 29 378 1815 245RTOR Reduction (vph) 0 0 193 0 0 6 0 0 0 0 0 0Lane Group Flow (vph) 173 0 155 0 0 747 448 1125 29 378 1815 245Confl. Peds. (#/hr) 2Confl. Bikes (#/hr) 4 30 30Turn Type Prot pm+ov custom Prot NA Perm Prot NA pm+ovProtected Phases 7 5 8 5 2 1 6 7Permitted Phases 7 1 7 8 2 6Actuated Green, G (s) 13.0 50.1 79.7 37.1 50.8 50.8 39.7 53.4 66.4Effective Green, g (s) 13.0 50.1 75.7 37.1 50.8 50.8 39.7 53.4 66.4Actuated g/C Ratio 0.09 0.36 0.54 0.27 0.36 0.36 0.28 0.38 0.47Clearance Time (s) 5.0 5.0 5.0 4.5 4.5 5.0 4.5 5.0Vehicle Extension (s) 3.0 3.0 3.0 3.0 3.0 3.0 3.0 3.0Lane Grp Cap (vph) 318 564 845 469 1845 545 501 1939 724v/s Ratio Prot 0.05 0.07 c0.25 0.22 0.21 c0.36 0.03v/s Ratio Perm 0.03 c0.48 0.02 0.13v/c Ratio 0.54 0.27 0.88 0.96 0.61 0.05 0.75 0.94 0.34Uniform Delay, d1 60.7 32.0 28.3 50.6 36.5 29.0 45.7 41.7 23.0Progression Factor 1.00 1.00 1.00 1.00 1.00 1.00 1.35 0.56 0.32Incremental Delay, d2 1.9 0.3 10.9 30.2 1.5 0.2 5.3 8.6 0.2Delay (s) 62.6 32.3 39.2 80.8 38.0 29.2 67.0 31.9 7.6Level of Service E C D F D C E C AApproach Delay (s) 42.3 39.2 49.8 34.9Approach LOS D D D C
Intersection SummaryHCM 2000 Control Delay 40.7 HCM 2000 Level of Service DHCM 2000 Volume to Capacity ratio 0.96Actuated Cycle Length (s) 140.0 Sum of lost time (s) 18.5Intersection Capacity Utilization 83.7% ICU Level of Service EAnalysis Period (min) 15c Critical Lane Group

HCM Signalized Intersection Capacity Analysis2: El Camino Real & Cambridge Avenue 4/23/2015
Menlo Parl El Camino Real Corridor Study Synchro 8 ReportFuture AM Peak Hour Conditions - Alternative 2 W-Trans
Movement EBL EBT EBR WBL WBT WBR NBL NBT NBR SBL SBT SBRLane ConfigurationsVolume (vph) 20 16 64 15 4 2 63 1899 47 59 2131 27Ideal Flow (vphpl) 1900 1900 1900 1900 1900 1900 1900 1900 1900 1900 1900 1900Total Lost time (s) 4.0 4.0 4.0 4.0 4.0 4.0 4.0Lane Util. Factor 1.00 1.00 1.00 1.00 0.91 1.00 0.91Frpb, ped/bikes 1.00 0.98 1.00 1.00 1.00 1.00 1.00Flpb, ped/bikes 1.00 1.00 1.00 1.00 1.00 1.00 1.00Frt 1.00 0.85 0.99 1.00 1.00 1.00 1.00Flt Protected 0.97 1.00 0.96 0.95 1.00 0.95 1.00Satd. Flow (prot) 1810 1557 1772 1770 5064 1770 5072Flt Permitted 0.84 1.00 0.81 0.95 1.00 0.95 1.00Satd. Flow (perm) 1567 1557 1488 1770 5064 1770 5072Peak-hour factor, PHF 0.91 0.91 0.91 0.91 0.91 0.91 0.91 0.91 0.91 0.91 0.91 0.91Adj. Flow (vph) 22 18 70 16 4 2 69 2087 52 65 2342 30RTOR Reduction (vph) 0 0 64 0 2 0 0 1 0 0 0 0Lane Group Flow (vph) 0 40 6 0 20 0 69 2138 0 65 2372 0Confl. Peds. (#/hr) 2 2 2 4Confl. Bikes (#/hr) 2 30 30Turn Type Perm NA Perm Perm NA Prot NA Prot NAProtected Phases 4 8 5 2 1 6Permitted Phases 4 4 8Actuated Green, G (s) 12.6 12.6 12.6 9.1 106.7 8.7 106.3Effective Green, g (s) 12.6 12.6 12.6 9.1 106.7 8.7 106.3Actuated g/C Ratio 0.09 0.09 0.09 0.06 0.76 0.06 0.76Clearance Time (s) 4.0 4.0 4.0 4.0 4.0 4.0 4.0Vehicle Extension (s) 3.0 3.0 3.0 3.0 3.0 3.0 3.0Lane Grp Cap (vph) 141 140 133 115 3859 109 3851v/s Ratio Prot c0.04 0.42 0.04 c0.47v/s Ratio Perm c0.03 0.00 0.01v/c Ratio 0.28 0.04 0.15 0.60 0.55 0.60 0.62Uniform Delay, d1 59.5 58.2 58.8 63.7 6.9 63.9 7.6Progression Factor 1.00 1.00 1.00 0.92 1.19 1.30 0.25Incremental Delay, d2 1.1 0.1 0.5 6.5 0.5 5.6 0.5Delay (s) 60.6 58.3 59.3 64.9 8.6 88.8 2.4Level of Service E E E E A F AApproach Delay (s) 59.2 59.3 10.4 4.7Approach LOS E E B A
Intersection SummaryHCM 2000 Control Delay 8.8 HCM 2000 Level of Service AHCM 2000 Volume to Capacity ratio 0.58Actuated Cycle Length (s) 140.0 Sum of lost time (s) 12.0Intersection Capacity Utilization 70.1% ICU Level of Service CAnalysis Period (min) 15c Critical Lane Group

HCM Signalized Intersection Capacity Analysis3: El Camino Real & Middle Avenue 4/23/2015
Menlo Parl El Camino Real Corridor Study Synchro 8 ReportFuture AM Peak Hour Conditions - Alternative 2 W-Trans
Movement EBL EBT EBR WBL WBT WBR NBL NBT NBR SBL SBT SBRLane ConfigurationsVolume (vph) 211 47 309 26 18 17 244 1658 1 64 1802 103Ideal Flow (vphpl) 1900 1900 1900 1900 1900 1900 1900 1900 1900 1900 1900 1900Total Lost time (s) 3.0 3.0 4.0 3.0 4.0 4.0 4.0Lane Util. Factor 1.00 1.00 1.00 1.00 0.91 1.00 0.91Frpb, ped/bikes 1.00 1.00 1.00 1.00 1.00 1.00 1.00Flpb, ped/bikes 0.99 1.00 1.00 1.00 1.00 1.00 1.00Frt 1.00 0.87 0.96 1.00 1.00 1.00 0.99Flt Protected 0.95 1.00 0.98 0.95 1.00 0.95 1.00Satd. Flow (prot) 1758 1620 1757 1770 5085 1770 5025Flt Permitted 0.70 1.00 0.27 0.95 1.00 0.95 1.00Satd. Flow (perm) 1302 1620 483 1770 5085 1770 5025Peak-hour factor, PHF 0.90 0.92 0.90 0.92 0.92 0.92 0.90 0.90 0.92 0.92 0.90 0.90Adj. Flow (vph) 234 51 343 28 20 18 271 1842 1 70 2002 114RTOR Reduction (vph) 0 180 0 0 10 0 0 0 0 0 4 0Lane Group Flow (vph) 234 214 0 0 56 0 271 1843 0 70 2112 0Confl. Peds. (#/hr) 3 8Confl. Bikes (#/hr) 30 30Turn Type Perm NA Perm NA Prot NA Prot NAProtected Phases 4 8 5 2 1 6Permitted Phases 4 8Actuated Green, G (s) 29.3 29.3 28.3 25.3 90.1 9.6 75.4Effective Green, g (s) 29.3 29.3 28.3 25.3 90.1 9.6 75.4Actuated g/C Ratio 0.21 0.21 0.20 0.18 0.64 0.07 0.54Clearance Time (s) 3.0 3.0 4.0 3.0 4.0 4.0 4.0Vehicle Extension (s) 3.0 3.0 3.0 3.0 3.0 3.0 3.0Lane Grp Cap (vph) 272 339 97 319 3272 121 2706v/s Ratio Prot 0.13 c0.15 0.36 0.04 c0.42v/s Ratio Perm c0.18 0.12v/c Ratio 0.86 0.63 0.57 0.85 0.56 0.58 0.78Uniform Delay, d1 53.4 50.4 50.4 55.5 13.9 63.2 25.7Progression Factor 1.00 1.00 1.00 0.75 1.24 0.65 0.34Incremental Delay, d2 23.1 3.8 8.0 16.3 0.6 5.8 2.0Delay (s) 76.5 54.2 58.4 58.1 18.0 47.1 10.8Level of Service E D E E B D BApproach Delay (s) 62.5 58.4 23.1 11.9Approach LOS E E C B
Intersection SummaryHCM 2000 Control Delay 23.6 HCM 2000 Level of Service CHCM 2000 Volume to Capacity ratio 0.82Actuated Cycle Length (s) 140.0 Sum of lost time (s) 12.0Intersection Capacity Utilization 86.8% ICU Level of Service EAnalysis Period (min) 15c Critical Lane Group

HCM Signalized Intersection Capacity Analysis4: El Camino Real & Roble Avenue 4/23/2015
Menlo Parl El Camino Real Corridor Study Synchro 8 ReportFuture AM Peak Hour Conditions - Alternative 2 W-Trans
Movement EBL EBT EBR WBL WBT WBR NBL NBT NBR SBL SBT SBRLane ConfigurationsVolume (vph) 60 5 50 4 4 8 41 1793 23 35 1856 32Ideal Flow (vphpl) 1900 1900 1900 1900 1900 1900 1900 1900 1900 1900 1900 1900Total Lost time (s) 4.0 4.0 4.0 4.0 4.5 4.0 4.5Lane Util. Factor 1.00 1.00 1.00 1.00 0.91 1.00 0.91Frpb, ped/bikes 1.00 1.00 0.98 1.00 1.00 1.00 1.00Flpb, ped/bikes 1.00 1.00 1.00 1.00 1.00 1.00 1.00Frt 0.94 1.00 0.85 1.00 1.00 1.00 1.00Flt Protected 0.97 0.98 1.00 0.95 1.00 0.95 1.00Satd. Flow (prot) 1708 1817 1544 1770 5073 1770 5069Flt Permitted 0.83 0.91 1.00 0.95 1.00 0.95 1.00Satd. Flow (perm) 1458 1687 1544 1770 5073 1770 5069Peak-hour factor, PHF 0.92 0.92 0.92 0.92 0.92 0.92 0.92 0.92 0.92 0.92 0.92 0.92Adj. Flow (vph) 65 5 54 4 4 9 45 1949 25 38 2017 35RTOR Reduction (vph) 0 23 0 0 0 8 0 0 0 0 1 0Lane Group Flow (vph) 0 101 0 0 8 1 45 1974 0 38 2051 0Confl. Bikes (#/hr) 6 30 30Turn Type Perm NA Perm NA Perm Prot NA Prot NAProtected Phases 4 8 5 2 1 6Permitted Phases 4 8 8Actuated Green, G (s) 14.8 14.8 14.8 7.8 105.4 7.3 104.9Effective Green, g (s) 14.8 14.8 14.8 7.8 105.4 7.3 104.9Actuated g/C Ratio 0.11 0.11 0.11 0.06 0.75 0.05 0.75Clearance Time (s) 4.0 4.0 4.0 4.0 4.5 4.0 4.5Vehicle Extension (s) 3.0 3.0 3.0 3.0 3.0 3.0 3.0Lane Grp Cap (vph) 154 178 163 98 3819 92 3798v/s Ratio Prot c0.03 0.39 0.02 c0.40v/s Ratio Perm c0.07 0.00 0.00v/c Ratio 0.65 0.04 0.01 0.46 0.52 0.41 0.54Uniform Delay, d1 60.1 56.2 56.0 64.1 7.0 64.3 7.4Progression Factor 1.00 1.00 1.00 1.25 0.14 0.95 0.81Incremental Delay, d2 9.6 0.1 0.0 2.8 0.4 1.5 0.3Delay (s) 69.7 56.4 56.0 83.1 1.4 62.7 6.3Level of Service E E E F A E AApproach Delay (s) 69.7 56.2 3.2 7.3Approach LOS E E A A
Intersection SummaryHCM 2000 Control Delay 7.4 HCM 2000 Level of Service AHCM 2000 Volume to Capacity ratio 0.55Actuated Cycle Length (s) 140.0 Sum of lost time (s) 12.5Intersection Capacity Utilization 58.9% ICU Level of Service BAnalysis Period (min) 15c Critical Lane Group

HCM Signalized Intersection Capacity Analysis5: El Camino Real & Menlo Avenue/Ravenswood Avenue 4/23/2015
Menlo Parl El Camino Real Corridor Study Synchro 8 ReportFuture AM Peak Hour Conditions - Alternative 2 W-Trans
Movement EBL EBT EBR WBL WBT WBR NBL NBT NBR SBL SBT SBRLane ConfigurationsVolume (vph) 18 334 53 532 243 46 118 860 772 170 1328 12Ideal Flow (vphpl) 1900 1900 1900 1900 1900 1900 1900 1900 1900 1900 1900 1900Lane Width 12 12 12 12 12 12 8 12 12 12 12 12Total Lost time (s) 4.0 4.0 4.0 4.0 4.5 5.0 5.0 4.5 5.0 5.0Lane Util. Factor 0.95 0.97 1.00 1.00 1.00 0.91 1.00 1.00 0.95 1.00Frpb, ped/bikes 1.00 1.00 1.00 0.97 1.00 1.00 0.97 1.00 1.00 0.91Flpb, ped/bikes 1.00 1.00 1.00 1.00 1.00 1.00 1.00 1.00 1.00 1.00Frt 0.98 1.00 1.00 0.85 1.00 1.00 0.85 1.00 1.00 0.85Flt Protected 1.00 0.95 1.00 1.00 0.95 1.00 1.00 0.95 1.00 1.00Satd. Flow (prot) 3446 3433 1863 1540 1534 5085 1533 1770 3539 1434Flt Permitted 1.00 0.95 1.00 1.00 0.95 1.00 1.00 0.95 1.00 1.00Satd. Flow (perm) 3446 3433 1863 1540 1534 5085 1533 1770 3539 1434Peak-hour factor, PHF 0.94 0.94 0.94 0.94 0.94 0.94 0.94 0.94 0.94 0.94 0.94 0.94Adj. Flow (vph) 19 355 56 566 259 49 126 915 821 181 1413 13RTOR Reduction (vph) 0 9 0 0 0 39 0 0 325 0 0 7Lane Group Flow (vph) 0 421 0 566 259 10 126 915 496 181 1413 6Confl. Peds. (#/hr) 5 3 14Confl. Bikes (#/hr) 15 8 30 30Turn Type Split NA Split NA Perm Prot NA Perm Prot NA PermProtected Phases 4 4 8 8 5 2 1 6Permitted Phases 8 2 6Actuated Green, G (s) 19.5 28.0 28.0 28.0 13.7 58.5 58.5 16.5 61.3 61.3Effective Green, g (s) 19.5 28.0 28.0 28.0 13.7 58.5 58.5 16.5 61.3 61.3Actuated g/C Ratio 0.14 0.20 0.20 0.20 0.10 0.42 0.42 0.12 0.44 0.44Clearance Time (s) 4.0 4.0 4.0 4.0 4.5 5.0 5.0 4.5 5.0 5.0Vehicle Extension (s) 3.0 3.0 3.0 3.0 3.0 3.0 3.0 3.0 3.0 3.0Lane Grp Cap (vph) 479 686 372 308 150 2124 640 208 1549 627v/s Ratio Prot c0.12 c0.16 0.14 0.08 0.18 c0.10 c0.40v/s Ratio Perm 0.01 0.32 0.00v/c Ratio 0.88 0.83 0.70 0.03 0.84 0.43 0.78 0.87 0.91 0.01Uniform Delay, d1 59.1 53.7 52.0 45.1 62.1 28.9 35.1 60.7 36.8 22.2Progression Factor 1.00 1.00 1.00 1.00 1.24 0.67 0.98 1.36 0.26 1.00Incremental Delay, d2 16.6 8.0 5.6 0.0 28.7 0.6 7.9 21.1 6.5 0.0Delay (s) 75.7 61.7 57.6 45.1 105.9 20.1 42.4 103.5 15.9 22.2Level of Service E E E D F C D F B CApproach Delay (s) 75.7 59.5 35.7 25.8Approach LOS E E D C
Intersection SummaryHCM 2000 Control Delay 40.4 HCM 2000 Level of Service DHCM 2000 Volume to Capacity ratio 0.90Actuated Cycle Length (s) 140.0 Sum of lost time (s) 17.5Intersection Capacity Utilization 86.0% ICU Level of Service EAnalysis Period (min) 15c Critical Lane Group

HCM Signalized Intersection Capacity Analysis6: El Camino Real & Santa Cruz Ave 4/23/2015
Menlo Parl El Camino Real Corridor Study Synchro 8 ReportFuture AM Peak Hour Conditions - Alternative 2 W-Trans
Movement EBL EBT EBR WBL WBT WBR NBL NBT NBR SBL SBT SBRLane ConfigurationsVolume (vph) 140 79 92 65 59 31 0 930 57 0 1433 62Ideal Flow (vphpl) 1900 1900 1900 1900 1900 1900 1900 1900 1900 1900 1900 1900Total Lost time (s) 4.0 4.0 4.0 4.0 4.0 4.5 4.5 4.5 4.5Lane Util. Factor 1.00 1.00 1.00 1.00 1.00 0.95 1.00 0.95 1.00Frpb, ped/bikes 1.00 1.00 0.91 1.00 0.97 1.00 0.91 1.00 0.95Flpb, ped/bikes 1.00 1.00 1.00 1.00 1.00 1.00 1.00 1.00 1.00Frt 1.00 1.00 0.85 1.00 0.95 1.00 0.85 1.00 0.85Flt Protected 0.95 1.00 1.00 0.95 1.00 1.00 1.00 1.00 1.00Satd. Flow (prot) 1770 1863 1439 1770 1705 3539 1448 3539 1503Flt Permitted 0.95 1.00 1.00 0.95 1.00 1.00 1.00 1.00 1.00Satd. Flow (perm) 1770 1863 1439 1770 1705 3539 1448 3539 1503Peak-hour factor, PHF 0.93 0.93 0.93 0.93 0.93 0.93 0.93 0.93 0.93 0.93 0.93 0.93Adj. Flow (vph) 151 85 99 70 63 33 0 1000 61 0 1541 67RTOR Reduction (vph) 0 0 83 0 13 0 0 0 29 0 0 18Lane Group Flow (vph) 151 85 16 70 83 0 0 1000 32 0 1541 49Confl. Peds. (#/hr) 50 58 14 3Confl. Bikes (#/hr) 9 11 30 30Turn Type Split NA Perm Split NA NA Perm NA PermProtected Phases 4 4 8 8 2 6Permitted Phases 4 2 6Actuated Green, G (s) 23.1 23.1 23.1 30.0 30.0 74.4 74.4 74.4 74.4Effective Green, g (s) 23.1 23.1 23.1 30.0 30.0 74.4 74.4 74.4 74.4Actuated g/C Ratio 0.17 0.17 0.17 0.21 0.21 0.53 0.53 0.53 0.53Clearance Time (s) 4.0 4.0 4.0 4.0 4.0 4.5 4.5 4.5 4.5Vehicle Extension (s) 3.0 3.0 3.0 3.0 3.0 3.0 3.0 3.0 3.0Lane Grp Cap (vph) 292 307 237 379 365 1880 769 1880 798v/s Ratio Prot c0.09 0.05 0.04 c0.05 0.28 c0.44v/s Ratio Perm 0.01 0.02 0.03v/c Ratio 0.52 0.28 0.07 0.18 0.23 0.53 0.04 0.82 0.06Uniform Delay, d1 53.4 51.1 49.4 45.0 45.4 21.4 15.7 27.2 15.9Progression Factor 1.00 1.00 1.00 1.00 1.00 0.52 0.67 0.26 0.25Incremental Delay, d2 1.5 0.5 0.1 0.2 0.3 1.0 0.1 3.1 0.1Delay (s) 54.9 51.6 49.5 45.2 45.7 12.2 10.6 10.3 4.0Level of Service D D D D D B B B AApproach Delay (s) 52.5 45.5 12.2 10.0Approach LOS D D B A
Intersection SummaryHCM 2000 Control Delay 17.1 HCM 2000 Level of Service BHCM 2000 Volume to Capacity ratio 0.63Actuated Cycle Length (s) 140.0 Sum of lost time (s) 12.5Intersection Capacity Utilization 75.7% ICU Level of Service DAnalysis Period (min) 15c Critical Lane Group

HCM Signalized Intersection Capacity Analysis7: El Camino Real & Oak Grove Ave 4/23/2015
Menlo Parl El Camino Real Corridor Study Synchro 8 ReportFuture AM Peak Hour Conditions - Alternative 2 W-Trans
Movement EBL EBT EBR WBL WBT WBR NBL NBT NBR SBL SBT SBRLane ConfigurationsVolume (vph) 62 139 47 86 298 69 99 958 62 89 1306 114Ideal Flow (vphpl) 1900 1900 1900 1900 1900 1900 1900 1900 1900 1900 1900 1900Total Lost time (s) 3.0 3.5 3.5 3.0 3.5 3.5 3.5 4.5 4.5 3.5 4.5 4.5Lane Util. Factor 1.00 1.00 1.00 1.00 1.00 1.00 1.00 0.95 1.00 1.00 0.95 1.00Frpb, ped/bikes 1.00 1.00 0.94 1.00 1.00 0.96 1.00 1.00 0.95 1.00 1.00 0.96Flpb, ped/bikes 1.00 1.00 1.00 1.00 1.00 1.00 1.00 1.00 1.00 1.00 1.00 1.00Frt 1.00 1.00 0.85 1.00 1.00 0.85 1.00 1.00 0.85 1.00 1.00 0.85Flt Protected 0.95 1.00 1.00 0.95 1.00 1.00 0.95 1.00 1.00 0.95 1.00 1.00Satd. Flow (prot) 1770 1863 1482 1770 1863 1520 1770 3539 1504 1770 3539 1520Flt Permitted 0.95 1.00 1.00 0.95 1.00 1.00 0.95 1.00 1.00 0.95 1.00 1.00Satd. Flow (perm) 1770 1863 1482 1770 1863 1520 1770 3539 1504 1770 3539 1520Peak-hour factor, PHF 0.93 0.93 0.93 0.93 0.93 0.93 0.93 0.93 0.93 0.93 0.93 0.93Adj. Flow (vph) 67 149 51 92 320 74 106 1030 67 96 1404 123RTOR Reduction (vph) 0 0 42 0 0 49 0 0 30 0 0 35Lane Group Flow (vph) 67 149 9 92 320 25 106 1030 37 96 1404 88Confl. Peds. (#/hr) 29 10 3Confl. Bikes (#/hr) 9 13 30 30Turn Type Prot NA Perm Prot NA Perm Prot NA Perm Prot NA PermProtected Phases 7 4 3 8 5 2 1 6Permitted Phases 4 8 2 6Actuated Green, G (s) 7.2 24.4 24.4 11.4 28.6 28.6 12.3 77.5 77.5 12.2 77.4 77.4Effective Green, g (s) 7.2 24.4 24.4 11.4 28.6 28.6 12.3 77.5 77.5 12.2 77.4 77.4Actuated g/C Ratio 0.05 0.17 0.17 0.08 0.20 0.20 0.09 0.55 0.55 0.09 0.55 0.55Clearance Time (s) 3.0 3.5 3.5 3.0 3.5 3.5 3.5 4.5 4.5 3.5 4.5 4.5Vehicle Extension (s) 3.0 3.0 3.0 3.0 3.0 3.0 3.0 3.0 3.0 3.0 3.0 3.0Lane Grp Cap (vph) 91 324 258 144 380 310 155 1959 832 154 1956 840v/s Ratio Prot c0.04 0.08 c0.05 c0.17 c0.06 0.29 0.05 c0.40v/s Ratio Perm 0.01 0.02 0.02 0.06v/c Ratio 0.74 0.46 0.03 0.64 0.84 0.08 0.68 0.53 0.04 0.62 0.72 0.10Uniform Delay, d1 65.5 51.9 48.0 62.3 53.5 45.1 62.0 19.7 14.3 61.7 23.2 14.9Progression Factor 1.00 1.00 1.00 1.00 1.00 1.00 1.16 0.66 0.49 1.38 0.16 0.01Incremental Delay, d2 26.3 1.0 0.1 9.0 15.4 0.1 10.5 0.9 0.1 2.7 0.8 0.1Delay (s) 91.8 52.9 48.1 71.3 69.0 45.2 82.3 13.8 7.1 87.9 4.5 0.2Level of Service F D D E E D F B A F A AApproach Delay (s) 61.7 65.8 19.5 9.1Approach LOS E E B A
Intersection SummaryHCM 2000 Control Delay 24.2 HCM 2000 Level of Service CHCM 2000 Volume to Capacity ratio 0.75Actuated Cycle Length (s) 140.0 Sum of lost time (s) 14.5Intersection Capacity Utilization 77.9% ICU Level of Service DAnalysis Period (min) 15c Critical Lane Group

HCM Signalized Intersection Capacity Analysis8: El Camino Real & Valparaiso Ave/Glenwood Ave 4/23/2015
Menlo Parl El Camino Real Corridor Study Synchro 8 ReportFuture AM Peak Hour Conditions - Alternative 2 W-Trans
Movement EBL EBT EBR WBL WBT WBR NBL NBT NBR SBL SBT SBRLane ConfigurationsVolume (vph) 294 210 85 59 348 132 110 1005 48 121 1369 447Ideal Flow (vphpl) 1900 1900 1900 1900 1900 1900 1900 1900 1900 1900 1900 1900Total Lost time (s) 3.5 3.5 3.5 3.5 3.5 4.0 4.5 4.5 4.0 4.5 4.5Lane Util. Factor 0.95 0.95 1.00 1.00 1.00 1.00 0.95 1.00 1.00 0.95 1.00Frpb, ped/bikes 1.00 1.00 0.98 1.00 0.99 1.00 1.00 0.93 1.00 1.00 0.94Flpb, ped/bikes 1.00 1.00 1.00 1.00 1.00 1.00 1.00 1.00 1.00 1.00 1.00Frt 1.00 1.00 0.85 1.00 0.96 1.00 1.00 0.85 1.00 1.00 0.85Flt Protected 0.95 0.99 1.00 0.95 1.00 0.95 1.00 1.00 0.95 1.00 1.00Satd. Flow (prot) 1681 1753 1548 1770 1777 1770 3539 1478 1770 3539 1492Flt Permitted 0.95 0.99 1.00 0.95 1.00 0.95 1.00 1.00 0.95 1.00 1.00Satd. Flow (perm) 1681 1753 1548 1770 1777 1770 3539 1478 1770 3539 1492Peak-hour factor, PHF 0.99 0.99 0.99 0.99 0.99 0.99 0.99 0.99 0.99 0.99 0.99 0.99Adj. Flow (vph) 297 212 86 60 352 133 111 1015 48 122 1383 452RTOR Reduction (vph) 0 0 70 0 9 0 0 0 32 0 0 80Lane Group Flow (vph) 249 260 16 60 476 0 111 1015 16 122 1383 372Confl. Peds. (#/hr) 8 1 3 2Confl. Bikes (#/hr) 7 30 30Turn Type Split NA Perm Split NA Prot NA Perm Prot NA PermProtected Phases 4 4 8 8 5 2 1 6Permitted Phases 4 2 6Actuated Green, G (s) 26.1 26.1 26.1 39.9 39.9 8.0 45.9 45.9 12.6 50.5 50.5Effective Green, g (s) 26.1 26.1 26.1 39.9 39.9 8.0 45.9 45.9 12.6 50.5 50.5Actuated g/C Ratio 0.19 0.19 0.19 0.28 0.28 0.06 0.33 0.33 0.09 0.36 0.36Clearance Time (s) 3.5 3.5 3.5 3.5 3.5 4.0 4.5 4.5 4.0 4.5 4.5Vehicle Extension (s) 3.0 3.0 3.0 3.0 3.0 3.0 3.0 3.0 3.0 3.0 3.0Lane Grp Cap (vph) 313 326 288 504 506 101 1160 484 159 1276 538v/s Ratio Prot 0.15 c0.15 0.03 c0.27 c0.06 0.29 c0.07 c0.39v/s Ratio Perm 0.01 0.01 0.25v/c Ratio 0.80 0.80 0.06 0.12 0.94 1.10 0.88 0.03 0.77 1.08 0.69Uniform Delay, d1 54.4 54.4 46.8 37.0 48.9 66.0 44.3 32.0 62.3 44.8 38.1Progression Factor 1.00 1.00 1.00 1.00 1.00 0.96 1.15 1.00 1.12 0.99 1.02Incremental Delay, d2 13.1 12.7 0.1 0.1 25.8 113.0 8.3 0.1 15.0 48.3 5.3Delay (s) 67.5 67.1 46.9 37.1 74.7 176.2 59.2 32.1 84.8 92.6 44.3Level of Service E E D D E F E C F F DApproach Delay (s) 64.3 70.5 69.1 81.0Approach LOS E E E F
Intersection SummaryHCM 2000 Control Delay 74.1 HCM 2000 Level of Service EHCM 2000 Volume to Capacity ratio 0.98Actuated Cycle Length (s) 140.0 Sum of lost time (s) 15.5Intersection Capacity Utilization 100.6% ICU Level of Service GAnalysis Period (min) 15c Critical Lane Group

HCM Signalized Intersection Capacity Analysis9: El Camino Real & Encinal Ave 4/23/2015
Menlo Parl El Camino Real Corridor Study Synchro 8 ReportFuture AM Peak Hour Conditions - Alternative 2 W-Trans
Movement EBL EBT EBR WBL WBT WBR NBL NBT NBR SBL SBT SBRLane ConfigurationsVolume (vph) 4 57 9 132 20 99 14 1320 111 284 1798 42Ideal Flow (vphpl) 1900 1900 1900 1900 1900 1900 1900 1900 1900 1900 1900 1900Total Lost time (s) 3.0 3.0 3.0 3.0 3.0 4.0 4.0 3.0 4.0 4.0Lane Util. Factor 1.00 1.00 1.00 1.00 1.00 0.95 1.00 1.00 0.95 1.00Frpb, ped/bikes 1.00 0.98 1.00 0.98 1.00 1.00 0.95 1.00 1.00 0.97Flpb, ped/bikes 1.00 1.00 1.00 1.00 1.00 1.00 1.00 1.00 1.00 1.00Frt 1.00 0.85 1.00 0.85 1.00 1.00 0.85 1.00 1.00 0.85Flt Protected 1.00 1.00 0.96 1.00 0.95 1.00 1.00 0.95 1.00 1.00Satd. Flow (prot) 1856 1555 1785 1547 1770 3539 1508 1770 3539 1528Flt Permitted 0.99 1.00 0.67 1.00 0.95 1.00 1.00 0.95 1.00 1.00Satd. Flow (perm) 1836 1555 1251 1547 1770 3539 1508 1770 3539 1528Peak-hour factor, PHF 0.98 0.98 0.98 0.98 0.98 0.98 0.98 0.98 0.98 0.98 0.98 0.98Adj. Flow (vph) 4 58 9 135 20 101 14 1347 113 290 1835 43RTOR Reduction (vph) 0 0 8 0 0 73 0 0 23 0 0 9Lane Group Flow (vph) 0 62 1 0 155 28 14 1347 90 290 1835 34Confl. Peds. (#/hr) 4 4 2Confl. Bikes (#/hr) 4 4 30 30Turn Type Perm NA Perm Perm NA Perm Prot NA Perm Prot NA PermProtected Phases 4 8 5 2 1 6Permitted Phases 4 4 8 8 2 6Actuated Green, G (s) 22.2 22.2 22.2 22.2 2.7 80.5 80.5 27.3 105.1 105.1Effective Green, g (s) 22.2 22.2 22.2 22.2 2.7 80.5 80.5 27.3 105.1 105.1Actuated g/C Ratio 0.16 0.16 0.16 0.16 0.02 0.58 0.58 0.20 0.75 0.75Clearance Time (s) 3.0 3.0 3.0 3.0 3.0 4.0 4.0 3.0 4.0 4.0Vehicle Extension (s) 3.0 3.0 3.0 3.0 3.0 3.0 3.0 3.0 3.0 3.0Lane Grp Cap (vph) 291 246 198 245 34 2034 867 345 2656 1147v/s Ratio Prot 0.01 0.38 c0.16 c0.52v/s Ratio Perm 0.03 0.00 c0.12 0.02 0.06 0.02v/c Ratio 0.21 0.01 0.78 0.11 0.41 0.66 0.10 0.84 0.69 0.03Uniform Delay, d1 51.3 49.6 56.6 50.5 67.9 20.4 13.4 54.3 9.0 4.4Progression Factor 1.00 1.00 1.00 1.00 1.12 0.35 0.10 1.00 1.00 1.00Incremental Delay, d2 0.4 0.0 18.0 0.2 4.4 0.9 0.1 16.6 1.5 0.0Delay (s) 51.7 49.6 74.6 50.7 80.5 8.1 1.5 70.9 10.5 4.5Level of Service D D E D F A A E B AApproach Delay (s) 51.4 65.2 8.3 18.5Approach LOS D E A B
Intersection SummaryHCM 2000 Control Delay 18.3 HCM 2000 Level of Service BHCM 2000 Volume to Capacity ratio 0.75Actuated Cycle Length (s) 140.0 Sum of lost time (s) 10.0Intersection Capacity Utilization 79.4% ICU Level of Service DAnalysis Period (min) 15c Critical Lane Group

HCM Signalized Intersection Capacity Analysis1: El Camino Real & Sand Hill Rd/Alma St 4/23/2015
Menlo Parl El Camino Real Corridor Study Synchro 8 ReportFuture PM Peak Hour Conditions - Alternative 2 W-Trans
Movement EBL EBT EBR WBL WBT WBR NBL NBT NBR SBL SBT SBRLane ConfigurationsVolume (vph) 536 0 373 0 0 744 269 1433 195 397 1516 373Ideal Flow (vphpl) 1900 1900 1900 1900 1900 1900 1900 1900 1900 1900 1900 1900Total Lost time (s) 5.0 5.0 5.0 5.0 4.5 4.5 5.0 4.5 5.0Lane Util. Factor 0.97 1.00 1.00 1.00 0.91 1.00 1.00 0.91 1.00Frpb, ped/bikes 1.00 0.99 1.00 1.00 1.00 0.94 1.00 1.00 0.96Flpb, ped/bikes 1.00 1.00 1.00 1.00 1.00 1.00 1.00 1.00 1.00Frt 1.00 0.85 0.85 1.00 1.00 0.85 1.00 1.00 0.85Flt Protected 0.95 1.00 1.00 0.95 1.00 1.00 0.95 1.00 1.00Satd. Flow (prot) 3433 1568 1583 1770 5085 1488 1770 5085 1512Flt Permitted 0.95 1.00 1.00 0.95 1.00 1.00 0.95 1.00 1.00Satd. Flow (perm) 3433 1568 1583 1770 5085 1488 1770 5085 1512Peak-hour factor, PHF 0.91 0.91 0.91 0.91 0.91 0.91 0.91 0.91 0.91 0.91 0.91 0.91Adj. Flow (vph) 589 0 410 0 0 818 296 1575 214 436 1666 410RTOR Reduction (vph) 0 0 285 0 0 4 0 0 0 0 0 0Lane Group Flow (vph) 589 0 125 0 0 814 296 1575 214 436 1666 410Confl. Peds. (#/hr) 9 8Confl. Bikes (#/hr) 30 30Turn Type Prot pm+ov custom Prot NA Perm Prot NA pm+ovProtected Phases 7 5 10 5 2 1 6 7Permitted Phases 7 1 7 10 2 6Actuated Green, G (s) 20.0 42.8 92.0 22.8 38.5 38.5 32.8 48.5 68.5Effective Green, g (s) 20.0 42.8 88.0 22.8 38.5 38.5 32.8 48.5 68.5Actuated g/C Ratio 0.14 0.31 0.63 0.16 0.28 0.28 0.23 0.35 0.49Clearance Time (s) 5.0 5.0 5.0 4.5 4.5 5.0 4.5 5.0Vehicle Extension (s) 3.0 3.0 3.0 3.0 3.0 3.0 3.0 3.0Lane Grp Cap (vph) 490 479 995 288 1398 409 414 1761 739v/s Ratio Prot c0.17 0.04 0.17 c0.31 c0.25 0.33 0.08v/s Ratio Perm 0.04 c0.51 0.14 0.19v/c Ratio 1.20 0.26 0.82 1.03 1.13 0.52 1.05 0.95 0.55Uniform Delay, d1 60.0 36.7 19.9 58.6 50.8 43.0 53.6 44.5 25.1Progression Factor 1.00 1.00 1.00 1.00 1.00 1.00 0.92 0.63 1.00Incremental Delay, d2 109.1 0.3 5.3 60.4 66.8 4.7 53.0 9.6 0.7Delay (s) 169.1 37.0 25.2 119.0 117.5 47.7 102.4 37.8 25.8Level of Service F D C F F D F D CApproach Delay (s) 114.9 25.2 110.5 47.1Approach LOS F C F D
Intersection SummaryHCM 2000 Control Delay 75.5 HCM 2000 Level of Service EHCM 2000 Volume to Capacity ratio 1.06Actuated Cycle Length (s) 140.0 Sum of lost time (s) 18.5Intersection Capacity Utilization 100.3% ICU Level of Service GAnalysis Period (min) 15c Critical Lane Group

HCM Signalized Intersection Capacity Analysis2: El Camino Real & Cambridge Avenue 4/23/2015
Menlo Parl El Camino Real Corridor Study Synchro 8 ReportFuture PM Peak Hour Conditions - Alternative 2 W-Trans
Movement EBL EBT EBR WBL WBT WBR NBL NBT NBR SBL SBT SBRLane ConfigurationsVolume (vph) 32 5 89 84 16 14 188 2259 11 16 2118 29Ideal Flow (vphpl) 1900 1900 1900 1900 1900 1900 1900 1900 1900 1900 1900 1900Total Lost time (s) 4.0 4.0 4.0 4.0 4.0 4.0 4.0Lane Util. Factor 1.00 1.00 1.00 1.00 0.91 1.00 0.91Frpb, ped/bikes 1.00 1.00 1.00 1.00 1.00 1.00 1.00Flpb, ped/bikes 1.00 1.00 1.00 1.00 1.00 1.00 1.00Frt 1.00 0.85 0.98 1.00 1.00 1.00 1.00Flt Protected 0.96 1.00 0.96 0.95 1.00 0.95 1.00Satd. Flow (prot) 1779 1583 1762 1770 5081 1770 5069Flt Permitted 0.76 1.00 0.76 0.95 1.00 0.95 1.00Satd. Flow (perm) 1402 1583 1385 1770 5081 1770 5069Peak-hour factor, PHF 0.94 0.94 0.94 0.94 0.94 0.94 0.94 0.94 0.94 0.94 0.94 0.94Adj. Flow (vph) 34 5 95 89 17 15 200 2403 12 17 2253 31RTOR Reduction (vph) 0 0 83 0 4 0 0 0 0 0 1 0Lane Group Flow (vph) 0 39 12 0 117 0 200 2415 0 17 2283 0Confl. Peds. (#/hr) 4 4 5 11Confl. Bikes (#/hr) 30 30Turn Type Perm NA Perm Perm NA Prot NA Prot NAProtected Phases 4 8 5 2 1 6Permitted Phases 4 4 8Actuated Green, G (s) 18.4 18.4 18.4 20.4 106.9 2.7 89.2Effective Green, g (s) 18.4 18.4 18.4 20.4 106.9 2.7 89.2Actuated g/C Ratio 0.13 0.13 0.13 0.15 0.76 0.02 0.64Clearance Time (s) 4.0 4.0 4.0 4.0 4.0 4.0 4.0Vehicle Extension (s) 3.0 3.0 3.0 3.0 3.0 3.0 3.0Lane Grp Cap (vph) 184 208 182 257 3879 34 3229v/s Ratio Prot c0.11 0.48 0.01 c0.45v/s Ratio Perm 0.03 0.01 c0.08v/c Ratio 0.21 0.06 0.64 0.78 0.62 0.50 0.71Uniform Delay, d1 54.3 53.2 57.7 57.6 7.5 68.0 16.8Progression Factor 1.00 1.00 1.00 1.06 1.04 0.98 0.25Incremental Delay, d2 0.6 0.1 7.5 1.4 0.1 7.2 0.9Delay (s) 54.9 53.4 65.2 62.6 7.9 73.6 5.0Level of Service D D E E A E AApproach Delay (s) 53.8 65.2 12.1 5.5Approach LOS D E B A
Intersection SummaryHCM 2000 Control Delay 11.5 HCM 2000 Level of Service BHCM 2000 Volume to Capacity ratio 0.71Actuated Cycle Length (s) 140.0 Sum of lost time (s) 12.0Intersection Capacity Utilization 75.1% ICU Level of Service DAnalysis Period (min) 15c Critical Lane Group

HCM Signalized Intersection Capacity Analysis3: El Camino Real & Middle Avenue 4/23/2015
Menlo Parl El Camino Real Corridor Study Synchro 8 ReportFuture PM Peak Hour Conditions - Alternative 2 W-Trans
Movement EBL EBT EBR WBL WBT WBR NBL NBT NBR SBL SBT SBRLane ConfigurationsVolume (vph) 261 21 276 33 46 28 348 2016 3 41 1828 85Ideal Flow (vphpl) 1900 1900 1900 1900 1900 1900 1900 1900 1900 1900 1900 1900Total Lost time (s) 3.0 3.0 4.0 3.0 4.0 4.0 4.0Lane Util. Factor 1.00 1.00 1.00 1.00 0.91 1.00 0.91Frpb, ped/bikes 1.00 1.00 1.00 1.00 1.00 1.00 1.00Flpb, ped/bikes 0.99 1.00 1.00 1.00 1.00 1.00 1.00Frt 1.00 0.86 0.97 1.00 1.00 1.00 0.99Flt Protected 0.95 1.00 0.98 0.95 1.00 0.95 1.00Satd. Flow (prot) 1761 1604 1770 1770 5084 1770 5034Flt Permitted 0.62 1.00 0.59 0.95 1.00 0.95 1.00Satd. Flow (perm) 1155 1604 1055 1770 5084 1770 5034Peak-hour factor, PHF 0.98 0.92 0.98 0.92 0.92 0.92 0.98 0.98 0.92 0.92 0.98 0.98Adj. Flow (vph) 266 23 282 36 50 30 355 2057 3 45 1865 87RTOR Reduction (vph) 0 212 0 0 9 0 0 0 0 0 3 0Lane Group Flow (vph) 266 94 0 0 107 0 355 2060 0 45 1949 0Confl. Peds. (#/hr) 3 9Confl. Bikes (#/hr) 30 30Turn Type Perm NA Perm NA Prot NA Prot NAProtected Phases 4 8 5 2 1 6Permitted Phases 4 8Actuated Green, G (s) 35.0 35.0 34.0 30.9 87.1 6.9 64.1Effective Green, g (s) 35.0 35.0 34.0 30.9 87.1 6.9 64.1Actuated g/C Ratio 0.25 0.25 0.24 0.22 0.62 0.05 0.46Clearance Time (s) 3.0 3.0 4.0 3.0 4.0 4.0 4.0Vehicle Extension (s) 3.0 3.0 3.0 3.0 3.0 3.0 3.0Lane Grp Cap (vph) 288 401 256 390 3162 87 2304v/s Ratio Prot 0.06 c0.20 0.41 0.03 c0.39v/s Ratio Perm c0.23 0.10v/c Ratio 0.92 0.23 0.42 0.91 0.65 0.52 0.85Uniform Delay, d1 51.2 41.8 44.7 53.2 16.8 64.9 33.6Progression Factor 1.00 1.00 1.00 1.41 0.51 1.03 0.60Incremental Delay, d2 33.4 0.3 1.1 21.1 0.9 4.1 3.3Delay (s) 84.6 42.1 45.8 96.4 9.5 71.2 23.4Level of Service F D D F A E CApproach Delay (s) 61.9 45.8 22.2 24.4Approach LOS E D C C
Intersection SummaryHCM 2000 Control Delay 28.1 HCM 2000 Level of Service CHCM 2000 Volume to Capacity ratio 0.89Actuated Cycle Length (s) 140.0 Sum of lost time (s) 12.0Intersection Capacity Utilization 94.0% ICU Level of Service FAnalysis Period (min) 15c Critical Lane Group

HCM Signalized Intersection Capacity Analysis4: El Camino Real & Roble Avenue 4/23/2015
Menlo Parl El Camino Real Corridor Study Synchro 8 ReportFuture PM Peak Hour Conditions - Alternative 2 W-Trans
Movement EBL EBT EBR WBL WBT WBR NBL NBT NBR SBL SBT SBRLane ConfigurationsVolume (vph) 49 3 35 53 10 41 83 2081 16 73 1896 33Ideal Flow (vphpl) 1900 1900 1900 1900 1900 1900 1900 1900 1900 1900 1900 1900Total Lost time (s) 4.0 4.0 4.0 4.0 4.5 4.0 4.5Lane Util. Factor 1.00 1.00 1.00 1.00 0.91 1.00 0.91Frpb, ped/bikes 0.99 1.00 1.00 1.00 1.00 1.00 1.00Flpb, ped/bikes 1.00 0.98 1.00 1.00 1.00 1.00 1.00Frt 0.95 1.00 0.85 1.00 1.00 1.00 1.00Flt Protected 0.97 0.96 1.00 0.95 1.00 0.95 1.00Satd. Flow (prot) 1689 1760 1583 1770 5077 1770 5065Flt Permitted 0.81 0.73 1.00 0.95 1.00 0.95 1.00Satd. Flow (perm) 1406 1333 1583 1770 5077 1770 5065Peak-hour factor, PHF 0.94 0.94 0.94 0.94 0.94 0.94 0.94 0.94 0.94 0.94 0.94 0.94Adj. Flow (vph) 52 3 37 56 11 44 88 2214 17 78 2017 35RTOR Reduction (vph) 0 18 0 0 0 36 0 0 0 0 1 0Lane Group Flow (vph) 0 74 0 0 67 8 88 2231 0 78 2051 0Confl. Peds. (#/hr) 18 18 7 12Confl. Bikes (#/hr) 30 30Turn Type Perm NA Perm NA Perm Prot NA Prot NAProtected Phases 4 8 5 2 1 6Permitted Phases 4 8 8Actuated Green, G (s) 25.2 25.2 25.2 11.2 91.2 11.1 91.1Effective Green, g (s) 25.2 25.2 25.2 11.2 91.2 11.1 91.1Actuated g/C Ratio 0.18 0.18 0.18 0.08 0.65 0.08 0.65Clearance Time (s) 4.0 4.0 4.0 4.0 4.5 4.0 4.5Vehicle Extension (s) 3.0 3.0 3.0 3.0 3.0 3.0 3.0Lane Grp Cap (vph) 253 239 284 141 3307 140 3295v/s Ratio Prot c0.05 c0.44 0.04 0.40v/s Ratio Perm c0.05 0.05 0.01v/c Ratio 0.29 0.28 0.03 0.62 0.67 0.56 0.62Uniform Delay, d1 49.7 49.6 47.3 62.4 15.2 62.1 14.4Progression Factor 1.00 1.00 1.00 1.13 0.42 0.95 0.72Incremental Delay, d2 0.6 0.6 0.0 6.2 0.8 1.4 0.3Delay (s) 50.3 50.2 47.3 76.6 7.2 60.2 10.6Level of Service D D D E A E BApproach Delay (s) 50.3 49.1 9.8 12.5Approach LOS D D A B
Intersection SummaryHCM 2000 Control Delay 12.8 HCM 2000 Level of Service BHCM 2000 Volume to Capacity ratio 0.59Actuated Cycle Length (s) 140.0 Sum of lost time (s) 12.5Intersection Capacity Utilization 82.4% ICU Level of Service EAnalysis Period (min) 15c Critical Lane Group

HCM Signalized Intersection Capacity Analysis5: El Camino Real & Menlo Avenue/Ravenswood Avenue 4/23/2015
Menlo Parl El Camino Real Corridor Study Synchro 8 ReportFuture PM Peak Hour Conditions - Alternative 2 W-Trans
Movement EBL EBT EBR WBL WBT WBR NBL NBT NBR SBL SBT SBRLane ConfigurationsVolume (vph) 41 300 134 678 269 80 162 1398 665 211 1289 51Ideal Flow (vphpl) 1900 1900 1900 1900 1900 1900 1900 1900 1900 1900 1900 1900Lane Width 12 12 12 12 12 12 8 12 12 12 12 12Total Lost time (s) 4.0 4.0 4.0 4.0 4.5 5.0 5.0 4.5 5.0 5.0Lane Util. Factor 0.95 0.97 1.00 1.00 1.00 0.91 1.00 1.00 0.95 1.00Frpb, ped/bikes 1.00 1.00 1.00 0.98 1.00 1.00 0.95 1.00 1.00 0.91Flpb, ped/bikes 1.00 1.00 1.00 1.00 1.00 1.00 1.00 1.00 1.00 1.00Frt 0.96 1.00 1.00 0.85 1.00 1.00 0.85 1.00 1.00 0.85Flt Protected 1.00 0.95 1.00 1.00 0.95 1.00 1.00 0.95 1.00 1.00Satd. Flow (prot) 3375 3433 1863 1551 1534 5085 1499 1770 3539 1435Flt Permitted 1.00 0.95 1.00 1.00 0.95 1.00 1.00 0.95 1.00 1.00Satd. Flow (perm) 3375 3433 1863 1551 1534 5085 1499 1770 3539 1435Peak-hour factor, PHF 0.95 0.95 0.95 0.95 0.95 0.95 0.95 0.95 0.95 0.95 0.95 0.95Adj. Flow (vph) 43 316 141 714 283 84 171 1472 700 222 1357 54RTOR Reduction (vph) 0 30 0 0 0 66 0 0 343 0 0 32Lane Group Flow (vph) 0 470 0 714 283 18 171 1472 357 222 1357 22Confl. Peds. (#/hr) 6 18 13Confl. Bikes (#/hr) 30 30Turn Type Split NA Split NA Perm Prot NA Perm Prot NA PermProtected Phases 4 4 8 8 5 2 1 6Permitted Phases 8 2 6Actuated Green, G (s) 20.1 30.0 30.0 30.0 16.6 52.1 52.1 20.3 55.8 55.8Effective Green, g (s) 20.1 30.0 30.0 30.0 16.6 52.1 52.1 20.3 55.8 55.8Actuated g/C Ratio 0.14 0.21 0.21 0.21 0.12 0.37 0.37 0.15 0.40 0.40Clearance Time (s) 4.0 4.0 4.0 4.0 4.5 5.0 5.0 4.5 5.0 5.0Vehicle Extension (s) 3.0 3.0 3.0 3.0 3.0 3.0 3.0 3.0 3.0 3.0Lane Grp Cap (vph) 484 735 399 332 181 1892 557 256 1410 571v/s Ratio Prot c0.14 c0.21 0.15 0.11 0.29 c0.13 c0.38v/s Ratio Perm 0.01 0.24 0.01v/c Ratio 0.97 0.97 0.71 0.05 0.94 0.78 0.64 0.87 0.96 0.04Uniform Delay, d1 59.7 54.6 51.0 43.7 61.2 38.8 36.2 58.5 41.1 25.7Progression Factor 1.00 1.00 1.00 1.00 1.20 0.91 1.00 1.42 0.45 0.60Incremental Delay, d2 33.4 26.1 5.7 0.1 42.9 2.5 4.3 20.4 13.8 0.1Delay (s) 93.0 80.7 56.7 43.8 116.4 37.8 40.5 103.3 32.3 15.5Level of Service F F E D F D D F C BApproach Delay (s) 93.0 71.5 44.3 41.4Approach LOS F E D D
Intersection SummaryHCM 2000 Control Delay 53.2 HCM 2000 Level of Service DHCM 2000 Volume to Capacity ratio 0.97Actuated Cycle Length (s) 140.0 Sum of lost time (s) 17.5Intersection Capacity Utilization 93.3% ICU Level of Service FAnalysis Period (min) 15c Critical Lane Group

HCM Signalized Intersection Capacity Analysis6: El Camino Real & Santa Cruz Ave 4/23/2015
Menlo Parl El Camino Real Corridor Study Synchro 8 ReportFuture PM Peak Hour Conditions - Alternative 2 W-Trans
Movement EBL EBT EBR WBL WBT WBR NBL NBT NBR SBL SBT SBRLane ConfigurationsVolume (vph) 176 233 153 107 120 66 1 1430 256 0 1250 96Ideal Flow (vphpl) 1900 1900 1900 1900 1900 1900 1900 1900 1900 1900 1900 1900Total Lost time (s) 4.0 4.0 4.0 4.0 4.0 4.5 4.5 4.5 4.5Lane Util. Factor 1.00 1.00 1.00 1.00 1.00 0.95 1.00 0.95 1.00Frpb, ped/bikes 1.00 1.00 0.87 1.00 0.98 1.00 0.92 1.00 0.93Flpb, ped/bikes 1.00 1.00 1.00 1.00 1.00 1.00 1.00 1.00 1.00Frt 1.00 1.00 0.85 1.00 0.95 1.00 0.85 1.00 0.85Flt Protected 0.95 1.00 1.00 0.95 1.00 1.00 1.00 1.00 1.00Satd. Flow (prot) 1770 1863 1375 1770 1733 3539 1456 3539 1471Flt Permitted 0.95 1.00 1.00 0.95 1.00 0.95 1.00 1.00 1.00Satd. Flow (perm) 1770 1863 1375 1770 1733 3378 1456 3539 1471Peak-hour factor, PHF 0.96 0.96 0.96 0.96 0.96 0.96 0.96 0.96 0.96 0.96 0.96 0.96Adj. Flow (vph) 183 243 159 111 125 69 1 1490 267 0 1302 100RTOR Reduction (vph) 0 0 111 0 15 0 0 0 92 0 0 19Lane Group Flow (vph) 183 243 48 111 179 0 0 1491 175 0 1302 81Confl. Peds. (#/hr) 87 26 12 9Confl. Bikes (#/hr) 30 30Turn Type Split NA Perm Split NA Perm NA Perm NA PermProtected Phases 4 4 8 8 2 6Permitted Phases 4 2 2 6Actuated Green, G (s) 30.0 30.0 30.0 26.5 26.5 71.0 71.0 71.0 71.0Effective Green, g (s) 30.0 30.0 30.0 26.5 26.5 71.0 71.0 71.0 71.0Actuated g/C Ratio 0.21 0.21 0.21 0.19 0.19 0.51 0.51 0.51 0.51Clearance Time (s) 4.0 4.0 4.0 4.0 4.0 4.5 4.5 4.5 4.5Vehicle Extension (s) 3.0 3.0 3.0 3.0 3.0 3.0 3.0 3.0 3.0Lane Grp Cap (vph) 379 399 294 335 328 1713 738 1794 746v/s Ratio Prot 0.10 c0.13 0.06 c0.10 0.37v/s Ratio Perm 0.04 c0.44 0.12 0.05v/c Ratio 0.48 0.61 0.16 0.33 0.55 0.87 0.24 0.73 0.11Uniform Delay, d1 48.2 49.7 44.8 49.1 51.3 30.4 19.3 26.9 18.0Progression Factor 1.00 1.00 1.00 1.00 1.00 0.45 0.00 0.31 0.19Incremental Delay, d2 1.0 2.6 0.3 0.6 1.9 4.7 0.5 2.1 0.2Delay (s) 49.2 52.3 45.1 49.7 53.2 18.3 0.5 10.5 3.6Level of Service D D D D D B A B AApproach Delay (s) 49.4 51.9 15.6 10.0Approach LOS D D B B
Intersection SummaryHCM 2000 Control Delay 21.3 HCM 2000 Level of Service CHCM 2000 Volume to Capacity ratio 0.74Actuated Cycle Length (s) 140.0 Sum of lost time (s) 12.5Intersection Capacity Utilization 87.1% ICU Level of Service EAnalysis Period (min) 15c Critical Lane Group

HCM Signalized Intersection Capacity Analysis7: El Camino Real & Oak Grove Ave 4/23/2015
Menlo Parl El Camino Real Corridor Study Synchro 8 ReportFuture PM Peak Hour Conditions - Alternative 2 W-Trans
Movement EBL EBT EBR WBL WBT WBR NBL NBT NBR SBL SBT SBRLane ConfigurationsVolume (vph) 161 303 124 107 256 100 92 1409 96 146 1141 155Ideal Flow (vphpl) 1900 1900 1900 1900 1900 1900 1900 1900 1900 1900 1900 1900Total Lost time (s) 3.0 3.5 3.5 3.0 3.5 3.5 3.5 4.5 4.5 3.5 4.5 4.5Lane Util. Factor 1.00 1.00 1.00 1.00 1.00 1.00 1.00 0.95 1.00 1.00 0.95 1.00Frpb, ped/bikes 1.00 1.00 0.96 1.00 1.00 0.96 1.00 1.00 0.92 1.00 1.00 0.93Flpb, ped/bikes 1.00 1.00 1.00 1.00 1.00 1.00 1.00 1.00 1.00 1.00 1.00 1.00Frt 1.00 1.00 0.85 1.00 1.00 0.85 1.00 1.00 0.85 1.00 1.00 0.85Flt Protected 0.95 1.00 1.00 0.95 1.00 1.00 0.95 1.00 1.00 0.95 1.00 1.00Satd. Flow (prot) 1770 1863 1522 1770 1863 1515 1770 3539 1464 1770 3539 1465Flt Permitted 0.95 1.00 1.00 0.95 1.00 1.00 0.95 1.00 1.00 0.95 1.00 1.00Satd. Flow (perm) 1770 1863 1522 1770 1863 1515 1770 3539 1464 1770 3539 1465Peak-hour factor, PHF 0.98 0.98 0.98 0.98 0.98 0.98 0.98 0.98 0.98 0.98 0.98 0.98Adj. Flow (vph) 164 309 127 109 261 102 94 1438 98 149 1164 158RTOR Reduction (vph) 0 0 62 0 0 71 0 0 39 0 0 38Lane Group Flow (vph) 164 309 65 109 261 31 94 1438 59 149 1164 120Confl. Peds. (#/hr) 19 22 10 10Confl. Bikes (#/hr) 30 30Turn Type Prot NA Perm Prot NA Perm Prot NA Perm Prot NA PermProtected Phases 7 4 3 8 5 2 1 6Permitted Phases 4 8 2 6Actuated Green, G (s) 15.4 28.4 28.4 11.4 24.4 24.4 12.1 70.5 70.5 15.2 73.6 73.6Effective Green, g (s) 15.4 28.4 28.4 11.4 24.4 24.4 12.1 70.5 70.5 15.2 73.6 73.6Actuated g/C Ratio 0.11 0.20 0.20 0.08 0.17 0.17 0.09 0.50 0.50 0.11 0.53 0.53Clearance Time (s) 3.0 3.5 3.5 3.0 3.5 3.5 3.5 4.5 4.5 3.5 4.5 4.5Vehicle Extension (s) 3.0 3.0 3.0 3.0 3.0 3.0 3.0 3.0 3.0 3.0 3.0 3.0Lane Grp Cap (vph) 194 377 308 144 324 264 152 1782 737 192 1860 770v/s Ratio Prot c0.09 c0.17 0.06 0.14 0.05 c0.41 c0.08 c0.33v/s Ratio Perm 0.04 0.02 0.04 0.08v/c Ratio 0.85 0.82 0.21 0.76 0.81 0.12 0.62 0.81 0.08 0.78 0.63 0.16Uniform Delay, d1 61.1 53.4 46.5 62.9 55.5 48.7 61.7 29.1 18.0 60.7 23.5 17.2Progression Factor 1.00 1.00 1.00 1.00 1.00 1.00 1.21 0.55 0.45 0.58 1.73 2.24Incremental Delay, d2 27.1 13.0 0.3 20.1 13.6 0.2 4.1 2.3 0.1 14.5 1.3 0.3Delay (s) 88.3 66.4 46.8 83.0 69.1 48.9 79.1 18.3 8.1 49.7 41.9 38.8Level of Service F E D F E D E B A D D DApproach Delay (s) 68.2 67.9 21.2 42.3Approach LOS E E C D
Intersection SummaryHCM 2000 Control Delay 40.7 HCM 2000 Level of Service DHCM 2000 Volume to Capacity ratio 0.82Actuated Cycle Length (s) 140.0 Sum of lost time (s) 14.5Intersection Capacity Utilization 88.7% ICU Level of Service EAnalysis Period (min) 15c Critical Lane Group

HCM Signalized Intersection Capacity Analysis8: El Camino Real & Valparaiso Ave/Glenwood Ave 4/23/2015
Menlo Parl El Camino Real Corridor Study Synchro 8 ReportFuture PM Peak Hour Conditions - Alternative 2 W-Trans
Movement EBL EBT EBR WBL WBT WBR NBL NBT NBR SBL SBT SBRLane ConfigurationsVolume (vph) 360 233 124 50 219 49 133 1469 26 142 1064 380Ideal Flow (vphpl) 1900 1900 1900 1900 1900 1900 1900 1900 1900 1900 1900 1900Total Lost time (s) 3.5 3.5 3.5 3.5 3.5 4.0 4.5 4.5 4.0 4.5 4.5Lane Util. Factor 0.95 0.95 1.00 1.00 1.00 1.00 0.95 1.00 1.00 0.95 1.00Frpb, ped/bikes 1.00 1.00 0.98 1.00 1.00 1.00 1.00 0.94 1.00 1.00 0.95Flpb, ped/bikes 1.00 1.00 1.00 1.00 1.00 1.00 1.00 1.00 1.00 1.00 1.00Frt 1.00 1.00 0.85 1.00 0.97 1.00 1.00 0.85 1.00 1.00 0.85Flt Protected 0.95 0.99 1.00 0.95 1.00 0.95 1.00 1.00 0.95 1.00 1.00Satd. Flow (prot) 1681 1750 1554 1770 1812 1770 3539 1486 1770 3539 1502Flt Permitted 0.95 0.99 1.00 0.95 1.00 0.95 1.00 1.00 0.95 1.00 1.00Satd. Flow (perm) 1681 1750 1554 1770 1812 1770 3539 1486 1770 3539 1502Peak-hour factor, PHF 0.98 0.98 0.98 0.98 0.98 0.98 0.98 0.98 0.98 0.98 0.98 0.98Adj. Flow (vph) 367 238 127 51 223 50 136 1499 27 145 1086 388RTOR Reduction (vph) 0 0 68 0 6 0 0 0 17 0 0 82Lane Group Flow (vph) 297 308 59 51 267 0 136 1499 10 145 1086 306Confl. Peds. (#/hr) 5 3 1Confl. Bikes (#/hr) 30 30Turn Type Split NA Perm Split NA Prot NA Perm Prot NA PermProtected Phases 4 4 8 8 5 2 1 6Permitted Phases 4 2 6Actuated Green, G (s) 28.7 28.7 28.7 25.3 25.3 14.7 53.7 53.7 16.8 55.8 55.8Effective Green, g (s) 28.7 28.7 28.7 25.3 25.3 14.7 53.7 53.7 16.8 55.8 55.8Actuated g/C Ratio 0.20 0.20 0.20 0.18 0.18 0.10 0.38 0.38 0.12 0.40 0.40Clearance Time (s) 3.5 3.5 3.5 3.5 3.5 4.0 4.5 4.5 4.0 4.5 4.5Vehicle Extension (s) 3.0 3.0 3.0 3.0 3.0 3.0 3.0 3.0 3.0 3.0 3.0Lane Grp Cap (vph) 344 358 318 319 327 185 1357 569 212 1410 598v/s Ratio Prot c0.18 0.18 0.03 c0.15 0.08 c0.42 c0.08 0.31v/s Ratio Perm 0.04 0.01 0.20v/c Ratio 0.86 0.86 0.19 0.16 0.82 0.74 1.10 0.02 0.68 0.77 0.51Uniform Delay, d1 53.8 53.7 46.0 48.4 55.1 60.8 43.1 26.8 59.1 36.5 31.8Progression Factor 1.00 1.00 1.00 1.00 1.00 1.00 0.74 1.00 1.24 0.86 0.76Incremental Delay, d2 19.5 18.6 0.3 0.2 14.6 8.9 54.5 0.0 6.9 3.2 2.4Delay (s) 73.2 72.3 46.3 48.6 69.7 69.6 86.5 26.8 79.9 34.5 26.5Level of Service E E D D E E F C E C CApproach Delay (s) 68.2 66.4 84.2 36.6Approach LOS E E F D
Intersection SummaryHCM 2000 Control Delay 62.4 HCM 2000 Level of Service EHCM 2000 Volume to Capacity ratio 0.93Actuated Cycle Length (s) 140.0 Sum of lost time (s) 15.5Intersection Capacity Utilization 94.3% ICU Level of Service FAnalysis Period (min) 15c Critical Lane Group

HCM Signalized Intersection Capacity Analysis9: El Camino Real & Encinal Ave 4/23/2015
Menlo Parl El Camino Real Corridor Study Synchro 8 ReportFuture PM Peak Hour Conditions - Alternative 2 W-Trans
Movement EBL EBT EBR WBL WBT WBR NBL NBT NBR SBL SBT SBRLane ConfigurationsVolume (vph) 20 17 14 81 12 226 36 1679 197 384 1759 19Ideal Flow (vphpl) 1900 1900 1900 1900 1900 1900 1900 1900 1900 1900 1900 1900Total Lost time (s) 3.0 3.0 3.0 3.0 3.0 4.0 4.0 3.0 4.0 4.0Lane Util. Factor 1.00 1.00 1.00 1.00 1.00 0.95 1.00 1.00 0.95 1.00Frpb, ped/bikes 1.00 1.00 1.00 0.98 1.00 1.00 0.96 1.00 1.00 0.97Flpb, ped/bikes 1.00 1.00 1.00 1.00 1.00 1.00 1.00 1.00 1.00 1.00Frt 1.00 0.85 1.00 0.85 1.00 1.00 0.85 1.00 1.00 0.85Flt Protected 0.97 1.00 0.96 1.00 0.95 1.00 1.00 0.95 1.00 1.00Satd. Flow (prot) 1808 1583 1785 1554 1770 3539 1512 1770 3539 1529Flt Permitted 0.85 1.00 0.73 1.00 0.95 1.00 1.00 0.95 1.00 1.00Satd. Flow (perm) 1572 1583 1354 1554 1770 3539 1512 1770 3539 1529Peak-hour factor, PHF 0.99 0.99 0.99 0.99 0.99 0.99 0.99 0.99 0.99 0.99 0.99 0.99Adj. Flow (vph) 20 17 14 82 12 228 36 1696 199 388 1777 19RTOR Reduction (vph) 0 0 12 0 0 201 0 0 36 0 0 5Lane Group Flow (vph) 0 37 2 0 94 27 36 1696 163 388 1777 14Confl. Peds. (#/hr) 5 5 1Confl. Bikes (#/hr) 30 30Turn Type Perm NA Perm Perm NA Perm Prot NA Perm Prot NA PermProtected Phases 4 8 5 2 1 6Permitted Phases 4 4 8 8 2 6Actuated Green, G (s) 16.8 16.8 16.8 16.8 6.5 75.4 75.4 37.8 106.7 106.7Effective Green, g (s) 16.8 16.8 16.8 16.8 6.5 75.4 75.4 37.8 106.7 106.7Actuated g/C Ratio 0.12 0.12 0.12 0.12 0.05 0.54 0.54 0.27 0.76 0.76Clearance Time (s) 3.0 3.0 3.0 3.0 3.0 4.0 4.0 3.0 4.0 4.0Vehicle Extension (s) 3.0 3.0 3.0 3.0 3.0 3.0 3.0 3.0 3.0 3.0Lane Grp Cap (vph) 188 189 162 186 82 1906 814 477 2697 1165v/s Ratio Prot 0.02 c0.48 c0.22 0.50v/s Ratio Perm 0.02 0.00 c0.07 0.02 0.11 0.01v/c Ratio 0.20 0.01 0.58 0.15 0.44 0.89 0.20 0.81 0.66 0.01Uniform Delay, d1 55.5 54.3 58.3 55.2 65.0 28.6 16.7 47.8 8.0 4.0Progression Factor 1.00 1.00 1.00 1.00 0.81 0.43 0.43 1.00 1.00 1.00Incremental Delay, d2 0.5 0.0 5.2 0.4 0.3 0.7 0.0 10.2 1.3 0.0Delay (s) 56.0 54.3 63.5 55.5 53.0 13.0 7.3 58.0 9.2 4.0Level of Service E D E E D B A E A AApproach Delay (s) 55.6 57.9 13.2 17.9Approach LOS E E B B
Intersection SummaryHCM 2000 Control Delay 19.1 HCM 2000 Level of Service BHCM 2000 Volume to Capacity ratio 0.83Actuated Cycle Length (s) 140.0 Sum of lost time (s) 10.0Intersection Capacity Utilization 91.6% ICU Level of Service FAnalysis Period (min) 15c Critical Lane Group

HCM Signalized Intersection Capacity Analysis1: El Camino Real & Sand Hill Rd/Alma St 4/23/2015
Menlo Parl El Camino Real Corridor Study Synchro 8 ReportFuture AM Peak Hour Conditions - Alternative 3 W-Trans
Movement EBL EBT EBR WBL WBT WBR NBL NBT NBR SBL SBT SBRLane ConfigurationsVolume (vph) 164 0 331 0 0 715 426 1028 28 359 1671 233Ideal Flow (vphpl) 1900 1900 1900 1900 1900 1900 1900 1900 1900 1900 1900 1900Total Lost time (s) 5.0 5.0 5.0 5.0 4.5 4.5 5.0 4.5 5.0Lane Util. Factor 0.97 1.00 1.00 1.00 0.91 1.00 1.00 0.91 1.00Frpb, ped/bikes 1.00 1.00 0.99 1.00 1.00 0.93 1.00 1.00 0.95Flpb, ped/bikes 1.00 1.00 1.00 1.00 1.00 1.00 1.00 1.00 1.00Frt 1.00 0.85 0.85 1.00 1.00 0.85 1.00 1.00 0.85Flt Protected 0.95 1.00 1.00 0.95 1.00 1.00 0.95 1.00 1.00Satd. Flow (prot) 3433 1577 1563 1770 5085 1471 1770 5085 1508Flt Permitted 0.95 1.00 1.00 0.95 1.00 1.00 0.95 1.00 1.00Satd. Flow (perm) 3433 1577 1563 1770 5085 1471 1770 5085 1508Peak-hour factor, PHF 0.95 0.95 0.95 0.95 0.95 0.95 0.95 0.95 0.95 0.95 0.95 0.95Adj. Flow (vph) 173 0 348 0 0 753 448 1082 29 378 1759 245RTOR Reduction (vph) 0 0 195 0 0 6 0 0 0 0 0 0Lane Group Flow (vph) 173 0 153 0 0 747 448 1082 29 378 1759 245Confl. Peds. (#/hr) 2Confl. Bikes (#/hr) 4 50 50Turn Type Prot pm+ov custom Prot NA Perm Prot NA pm+ovProtected Phases 7 5 8 5 2 1 6 7Permitted Phases 7 1 7 8 2 6Actuated Green, G (s) 13.0 50.6 79.7 37.6 50.8 50.8 39.7 52.9 65.9Effective Green, g (s) 13.0 50.6 75.7 37.6 50.8 50.8 39.7 52.9 65.9Actuated g/C Ratio 0.09 0.36 0.54 0.27 0.36 0.36 0.28 0.38 0.47Clearance Time (s) 5.0 5.0 5.0 4.5 4.5 5.0 4.5 5.0Vehicle Extension (s) 3.0 3.0 3.0 3.0 3.0 3.0 3.0 3.0Lane Grp Cap (vph) 318 569 845 475 1845 533 501 1921 709v/s Ratio Prot 0.05 0.07 c0.25 0.21 0.21 c0.35 0.03v/s Ratio Perm 0.02 c0.48 0.02 0.13v/c Ratio 0.54 0.27 0.88 0.94 0.59 0.05 0.75 0.92 0.35Uniform Delay, d1 60.7 31.6 28.3 50.2 36.1 29.0 45.7 41.4 23.4Progression Factor 1.00 1.00 1.00 1.00 1.00 1.00 1.59 0.68 0.36Incremental Delay, d2 1.9 0.3 10.9 27.4 1.4 0.2 5.3 7.1 0.2Delay (s) 62.6 31.9 39.2 77.6 37.5 29.2 77.9 35.3 8.7Level of Service E C D E D C E D AApproach Delay (s) 42.1 39.2 48.8 39.3Approach LOS D D D D
Intersection SummaryHCM 2000 Control Delay 42.4 HCM 2000 Level of Service DHCM 2000 Volume to Capacity ratio 0.95Actuated Cycle Length (s) 140.0 Sum of lost time (s) 18.5Intersection Capacity Utilization 82.6% ICU Level of Service EAnalysis Period (min) 15c Critical Lane Group

HCM Signalized Intersection Capacity Analysis2: El Camino Real & Cambridge Avenue 4/23/2015
Menlo Parl El Camino Real Corridor Study Synchro 8 ReportFuture AM Peak Hour Conditions - Alternative 3 W-Trans
Movement EBL EBT EBR WBL WBT WBR NBL NBT NBR SBL SBT SBRLane ConfigurationsVolume (vph) 20 16 64 15 4 2 63 1858 47 59 2078 27Ideal Flow (vphpl) 1900 1900 1900 1900 1900 1900 1900 1900 1900 1900 1900 1900Total Lost time (s) 4.0 4.0 4.0 4.0 4.0 4.0 4.0Lane Util. Factor 1.00 1.00 1.00 1.00 0.91 1.00 0.91Frpb, ped/bikes 1.00 0.98 1.00 1.00 1.00 1.00 1.00Flpb, ped/bikes 1.00 1.00 1.00 1.00 1.00 1.00 1.00Frt 1.00 0.85 0.99 1.00 1.00 1.00 1.00Flt Protected 0.97 1.00 0.96 0.95 1.00 0.95 1.00Satd. Flow (prot) 1810 1557 1772 1770 5062 1770 5071Flt Permitted 0.84 1.00 0.81 0.95 1.00 0.95 1.00Satd. Flow (perm) 1567 1557 1488 1770 5062 1770 5071Peak-hour factor, PHF 0.91 0.91 0.91 0.91 0.91 0.91 0.91 0.91 0.91 0.91 0.91 0.91Adj. Flow (vph) 22 18 70 16 4 2 69 2042 52 65 2284 30RTOR Reduction (vph) 0 0 64 0 2 0 0 1 0 0 0 0Lane Group Flow (vph) 0 40 6 0 20 0 69 2093 0 65 2314 0Confl. Peds. (#/hr) 2 2 2 4Confl. Bikes (#/hr) 2 50 50Turn Type Perm NA Perm Perm NA Prot NA Prot NAProtected Phases 4 8 5 2 1 6Permitted Phases 4 4 8Actuated Green, G (s) 12.6 12.6 12.6 9.1 106.7 8.7 106.3Effective Green, g (s) 12.6 12.6 12.6 9.1 106.7 8.7 106.3Actuated g/C Ratio 0.09 0.09 0.09 0.06 0.76 0.06 0.76Clearance Time (s) 4.0 4.0 4.0 4.0 4.0 4.0 4.0Vehicle Extension (s) 3.0 3.0 3.0 3.0 3.0 3.0 3.0Lane Grp Cap (vph) 141 140 133 115 3857 109 3850v/s Ratio Prot c0.04 0.41 0.04 c0.46v/s Ratio Perm c0.03 0.00 0.01v/c Ratio 0.28 0.04 0.15 0.60 0.54 0.60 0.60Uniform Delay, d1 59.5 58.2 58.8 63.7 6.8 63.9 7.5Progression Factor 1.00 1.00 1.00 0.90 0.82 1.22 0.22Incremental Delay, d2 1.1 0.1 0.5 6.6 0.4 5.8 0.5Delay (s) 60.6 58.3 59.3 64.1 6.0 84.0 2.1Level of Service E E E E A F AApproach Delay (s) 59.2 59.3 7.9 4.3Approach LOS E E A A
Intersection SummaryHCM 2000 Control Delay 7.5 HCM 2000 Level of Service AHCM 2000 Volume to Capacity ratio 0.57Actuated Cycle Length (s) 140.0 Sum of lost time (s) 12.0Intersection Capacity Utilization 69.1% ICU Level of Service CAnalysis Period (min) 15c Critical Lane Group

HCM Signalized Intersection Capacity Analysis3: El Camino Real & Middle Avenue 4/23/2015
Menlo Parl El Camino Real Corridor Study Synchro 8 ReportFuture AM Peak Hour Conditions - Alternative 3 W-Trans
Movement EBL EBT EBR WBL WBT WBR NBL NBT NBR SBL SBT SBRLane ConfigurationsVolume (vph) 211 47 309 26 18 17 244 1617 1 64 1749 103Ideal Flow (vphpl) 1900 1900 1900 1900 1900 1900 1900 1900 1900 1900 1900 1900Total Lost time (s) 3.0 3.0 4.0 3.0 4.0 4.0 4.0Lane Util. Factor 1.00 1.00 1.00 1.00 0.91 1.00 0.91Frpb, ped/bikes 1.00 1.00 1.00 1.00 1.00 1.00 1.00Flpb, ped/bikes 0.99 1.00 1.00 1.00 1.00 1.00 1.00Frt 1.00 0.87 0.96 1.00 1.00 1.00 0.99Flt Protected 0.95 1.00 0.98 0.95 1.00 0.95 1.00Satd. Flow (prot) 1758 1620 1757 1770 5085 1770 5020Flt Permitted 0.70 1.00 0.27 0.95 1.00 0.95 1.00Satd. Flow (perm) 1302 1620 483 1770 5085 1770 5020Peak-hour factor, PHF 0.90 0.92 0.90 0.92 0.92 0.92 0.90 0.90 0.92 0.92 0.90 0.90Adj. Flow (vph) 234 51 343 28 20 18 271 1797 1 70 1943 114RTOR Reduction (vph) 0 180 0 0 10 0 0 0 0 0 4 0Lane Group Flow (vph) 234 214 0 0 56 0 271 1798 0 70 2053 0Confl. Peds. (#/hr) 3 8Confl. Bikes (#/hr) 50 50Turn Type Perm NA Perm NA Prot NA Prot NAProtected Phases 4 8 5 2 1 6Permitted Phases 4 8Actuated Green, G (s) 29.3 29.3 28.3 25.3 90.1 9.6 75.4Effective Green, g (s) 29.3 29.3 28.3 25.3 90.1 9.6 75.4Actuated g/C Ratio 0.21 0.21 0.20 0.18 0.64 0.07 0.54Clearance Time (s) 3.0 3.0 4.0 3.0 4.0 4.0 4.0Vehicle Extension (s) 3.0 3.0 3.0 3.0 3.0 3.0 3.0Lane Grp Cap (vph) 272 339 97 319 3272 121 2703v/s Ratio Prot 0.13 c0.15 0.35 0.04 c0.41v/s Ratio Perm c0.18 0.12v/c Ratio 0.86 0.63 0.57 0.85 0.55 0.58 0.76Uniform Delay, d1 53.4 50.4 50.4 55.5 13.8 63.2 25.2Progression Factor 1.00 1.00 1.00 0.82 1.19 0.64 0.30Incremental Delay, d2 23.1 3.8 8.0 16.4 0.6 5.8 1.8Delay (s) 76.5 54.2 58.4 61.9 16.9 46.0 9.3Level of Service E D E E B D AApproach Delay (s) 62.5 58.4 22.8 10.5Approach LOS E E C B
Intersection SummaryHCM 2000 Control Delay 23.0 HCM 2000 Level of Service CHCM 2000 Volume to Capacity ratio 0.81Actuated Cycle Length (s) 140.0 Sum of lost time (s) 12.0Intersection Capacity Utilization 85.8% ICU Level of Service EAnalysis Period (min) 15c Critical Lane Group

HCM Signalized Intersection Capacity Analysis4: El Camino Real & Roble Avenue 4/23/2015
Menlo Parl El Camino Real Corridor Study Synchro 8 ReportFuture AM Peak Hour Conditions - Alternative 3 W-Trans
Movement EBL EBT EBR WBL WBT WBR NBL NBT NBR SBL SBT SBRLane ConfigurationsVolume (vph) 60 5 50 4 4 8 41 1752 23 35 1803 32Ideal Flow (vphpl) 1900 1900 1900 1900 1900 1900 1900 1900 1900 1900 1900 1900Total Lost time (s) 4.0 4.0 4.0 4.0 4.5 4.0 4.5Lane Util. Factor 1.00 1.00 1.00 1.00 0.91 1.00 0.91Frpb, ped/bikes 1.00 1.00 0.98 1.00 1.00 1.00 1.00Flpb, ped/bikes 1.00 1.00 1.00 1.00 1.00 1.00 1.00Frt 0.94 1.00 0.85 1.00 1.00 1.00 1.00Flt Protected 0.97 0.98 1.00 0.95 1.00 0.95 1.00Satd. Flow (prot) 1708 1817 1544 1770 5072 1770 5068Flt Permitted 0.83 0.90 1.00 0.95 1.00 0.95 1.00Satd. Flow (perm) 1458 1684 1544 1770 5072 1770 5068Peak-hour factor, PHF 0.92 0.92 0.92 0.92 0.92 0.92 0.92 0.92 0.92 0.92 0.92 0.92Adj. Flow (vph) 65 5 54 4 4 9 45 1904 25 38 1960 35RTOR Reduction (vph) 0 24 0 0 0 8 0 0 0 0 1 0Lane Group Flow (vph) 0 100 0 0 8 1 45 1929 0 38 1994 0Confl. Bikes (#/hr) 6 50 50Turn Type Perm NA Perm NA Perm Prot NA Prot NAProtected Phases 4 8 5 2 1 6Permitted Phases 4 8 8Actuated Green, G (s) 14.7 14.7 14.7 7.8 105.5 7.3 105.0Effective Green, g (s) 14.7 14.7 14.7 7.8 105.5 7.3 105.0Actuated g/C Ratio 0.10 0.10 0.10 0.06 0.75 0.05 0.75Clearance Time (s) 4.0 4.0 4.0 4.0 4.5 4.0 4.5Vehicle Extension (s) 3.0 3.0 3.0 3.0 3.0 3.0 3.0Lane Grp Cap (vph) 153 176 162 98 3822 92 3801v/s Ratio Prot c0.03 0.38 0.02 c0.39v/s Ratio Perm c0.07 0.00 0.00v/c Ratio 0.65 0.05 0.01 0.46 0.50 0.41 0.52Uniform Delay, d1 60.2 56.3 56.1 64.1 6.9 64.3 7.2Progression Factor 1.00 1.00 1.00 1.27 0.17 1.00 0.96Incremental Delay, d2 9.6 0.1 0.0 2.8 0.4 1.6 0.3Delay (s) 69.8 56.4 56.1 84.3 1.6 65.7 7.2Level of Service E E E F A E AApproach Delay (s) 69.8 56.3 3.4 8.3Approach LOS E E A A
Intersection SummaryHCM 2000 Control Delay 8.0 HCM 2000 Level of Service AHCM 2000 Volume to Capacity ratio 0.54Actuated Cycle Length (s) 140.0 Sum of lost time (s) 12.5Intersection Capacity Utilization 58.1% ICU Level of Service BAnalysis Period (min) 15c Critical Lane Group

HCM Signalized Intersection Capacity Analysis5: El Camino Real & Menlo Avenue/Ravenswood Avenue 4/23/2015
Menlo Parl El Camino Real Corridor Study Synchro 8 ReportFuture AM Peak Hour Conditions - Alternative 3 W-Trans
Movement EBL EBT EBR WBL WBT WBR NBL NBT NBR SBL SBT SBRLane ConfigurationsVolume (vph) 18 334 53 532 243 46 118 819 772 170 1275 12Ideal Flow (vphpl) 1900 1900 1900 1900 1900 1900 1900 1900 1900 1900 1900 1900Lane Width 12 12 12 12 12 12 8 12 12 12 12 12Total Lost time (s) 4.0 4.0 4.0 4.0 4.5 5.0 5.0 4.5 5.0Lane Util. Factor 0.95 0.97 1.00 1.00 1.00 0.95 1.00 1.00 0.95Frpb, ped/bikes 1.00 1.00 1.00 0.97 1.00 1.00 0.96 1.00 1.00Flpb, ped/bikes 1.00 1.00 1.00 1.00 1.00 1.00 1.00 1.00 1.00Frt 0.98 1.00 1.00 0.85 1.00 1.00 0.85 1.00 1.00Flt Protected 1.00 0.95 1.00 1.00 0.95 1.00 1.00 0.95 1.00Satd. Flow (prot) 3446 3433 1863 1540 1534 3539 1516 1770 3530Flt Permitted 1.00 0.95 1.00 1.00 0.95 1.00 1.00 0.95 1.00Satd. Flow (perm) 3446 3433 1863 1540 1534 3539 1516 1770 3530Peak-hour factor, PHF 0.94 0.94 0.94 0.94 0.94 0.94 0.94 0.94 0.94 0.94 0.94 0.94Adj. Flow (vph) 19 355 56 566 259 49 126 871 821 181 1356 13RTOR Reduction (vph) 0 9 0 0 0 39 0 0 325 0 1 0Lane Group Flow (vph) 0 421 0 566 259 10 126 871 496 181 1368 0Confl. Peds. (#/hr) 5 3 14Confl. Bikes (#/hr) 15 8 50 50Turn Type Split NA Split NA Perm Prot NA Perm Prot NAProtected Phases 4 4 8 8 5 2 1 6Permitted Phases 8 2Actuated Green, G (s) 19.5 28.0 28.0 28.0 14.0 58.2 58.2 16.8 61.0Effective Green, g (s) 19.5 28.0 28.0 28.0 14.0 58.2 58.2 16.8 61.0Actuated g/C Ratio 0.14 0.20 0.20 0.20 0.10 0.42 0.42 0.12 0.44Clearance Time (s) 4.0 4.0 4.0 4.0 4.5 5.0 5.0 4.5 5.0Vehicle Extension (s) 3.0 3.0 3.0 3.0 3.0 3.0 3.0 3.0 3.0Lane Grp Cap (vph) 479 686 372 308 153 1471 630 212 1538v/s Ratio Prot c0.12 c0.16 0.14 0.08 0.25 c0.10 c0.39v/s Ratio Perm 0.01 0.33v/c Ratio 0.88 0.83 0.70 0.03 0.82 0.59 0.79 0.85 0.89Uniform Delay, d1 59.1 53.7 52.0 45.1 61.8 31.7 35.5 60.4 36.4Progression Factor 1.00 1.00 1.00 1.00 1.21 0.70 1.14 1.43 0.39Incremental Delay, d2 16.6 8.0 5.6 0.0 26.0 1.6 8.6 18.2 5.3Delay (s) 75.7 61.7 57.6 45.1 101.0 23.6 49.2 104.8 19.6Level of Service E E E D F C D F BApproach Delay (s) 75.7 59.5 40.5 29.5Approach LOS E E D C
Intersection SummaryHCM 2000 Control Delay 43.7 HCM 2000 Level of Service DHCM 2000 Volume to Capacity ratio 0.88Actuated Cycle Length (s) 140.0 Sum of lost time (s) 17.5Intersection Capacity Utilization 84.9% ICU Level of Service EAnalysis Period (min) 15c Critical Lane Group

HCM Signalized Intersection Capacity Analysis6: El Camino Real & Santa Cruz Ave 4/23/2015
Menlo Parl El Camino Real Corridor Study Synchro 8 ReportFuture AM Peak Hour Conditions - Alternative 3 W-Trans
Movement EBL EBT EBR WBL WBT WBR NBL NBT NBR SBL SBT SBRLane ConfigurationsVolume (vph) 140 79 92 65 59 31 0 889 57 0 1380 62Ideal Flow (vphpl) 1900 1900 1900 1900 1900 1900 1900 1900 1900 1900 1900 1900Total Lost time (s) 4.0 4.0 4.0 4.0 4.0 4.5 4.5Lane Util. Factor 1.00 1.00 1.00 1.00 1.00 0.95 0.95Frpb, ped/bikes 1.00 1.00 0.91 1.00 0.97 0.99 1.00Flpb, ped/bikes 1.00 1.00 1.00 1.00 1.00 1.00 1.00Frt 1.00 1.00 0.85 1.00 0.95 0.99 0.99Flt Protected 0.95 1.00 1.00 0.95 1.00 1.00 1.00Satd. Flow (prot) 1770 1863 1439 1770 1705 3487 3507Flt Permitted 0.95 1.00 1.00 0.95 1.00 1.00 1.00Satd. Flow (perm) 1770 1863 1439 1770 1705 3487 3507Peak-hour factor, PHF 0.93 0.93 0.93 0.93 0.93 0.93 0.93 0.93 0.93 0.93 0.93 0.93Adj. Flow (vph) 151 85 99 70 63 33 0 956 61 0 1484 67RTOR Reduction (vph) 0 0 83 0 13 0 0 3 0 0 2 0Lane Group Flow (vph) 151 85 16 70 83 0 0 1014 0 0 1549 0Confl. Peds. (#/hr) 50 58 14 3Confl. Bikes (#/hr) 9 11 50 50Turn Type Split NA Perm Split NA NA NAProtected Phases 4 4 8 8 2 6Permitted Phases 4Actuated Green, G (s) 23.1 23.1 23.1 30.0 30.0 74.4 74.4Effective Green, g (s) 23.1 23.1 23.1 30.0 30.0 74.4 74.4Actuated g/C Ratio 0.17 0.17 0.17 0.21 0.21 0.53 0.53Clearance Time (s) 4.0 4.0 4.0 4.0 4.0 4.5 4.5Vehicle Extension (s) 3.0 3.0 3.0 3.0 3.0 3.0 3.0Lane Grp Cap (vph) 292 307 237 379 365 1853 1863v/s Ratio Prot c0.09 0.05 0.04 c0.05 0.29 c0.44v/s Ratio Perm 0.01v/c Ratio 0.52 0.28 0.07 0.18 0.23 0.55 0.83Uniform Delay, d1 53.4 51.1 49.4 45.0 45.4 21.7 27.5Progression Factor 1.00 1.00 1.00 1.00 1.00 0.24 0.27Incremental Delay, d2 1.5 0.5 0.1 0.2 0.3 1.0 3.2Delay (s) 54.9 51.6 49.5 45.2 45.7 6.2 10.7Level of Service D D D D D A BApproach Delay (s) 52.5 45.5 6.2 10.7Approach LOS D D A B
Intersection SummaryHCM 2000 Control Delay 15.7 HCM 2000 Level of Service BHCM 2000 Volume to Capacity ratio 0.63Actuated Cycle Length (s) 140.0 Sum of lost time (s) 12.5Intersection Capacity Utilization 76.3% ICU Level of Service DAnalysis Period (min) 15c Critical Lane Group

HCM Signalized Intersection Capacity Analysis7: El Camino Real & Oak Grove Ave 4/23/2015
Menlo Parl El Camino Real Corridor Study Synchro 8 ReportFuture AM Peak Hour Conditions - Alternative 3 W-Trans
Movement EBL EBT EBR WBL WBT WBR NBL NBT NBR SBL SBT SBRLane ConfigurationsVolume (vph) 62 139 47 86 298 69 99 917 62 89 1253 114Ideal Flow (vphpl) 1900 1900 1900 1900 1900 1900 1900 1900 1900 1900 1900 1900Total Lost time (s) 3.0 3.5 3.5 3.0 3.5 3.5 3.5 4.5 3.5 4.5Lane Util. Factor 1.00 1.00 1.00 1.00 1.00 1.00 1.00 0.95 1.00 0.95Frpb, ped/bikes 1.00 1.00 0.94 1.00 1.00 0.96 1.00 1.00 1.00 1.00Flpb, ped/bikes 1.00 1.00 1.00 1.00 1.00 1.00 1.00 1.00 1.00 1.00Frt 1.00 1.00 0.85 1.00 1.00 0.85 1.00 0.99 1.00 0.99Flt Protected 0.95 1.00 1.00 0.95 1.00 1.00 0.95 1.00 0.95 1.00Satd. Flow (prot) 1770 1863 1482 1770 1863 1520 1770 3491 1770 3479Flt Permitted 0.95 1.00 1.00 0.95 1.00 1.00 0.95 1.00 0.95 1.00Satd. Flow (perm) 1770 1863 1482 1770 1863 1520 1770 3491 1770 3479Peak-hour factor, PHF 0.93 0.93 0.93 0.93 0.93 0.93 0.93 0.93 0.93 0.93 0.93 0.93Adj. Flow (vph) 67 149 51 92 320 74 106 986 67 96 1347 123RTOR Reduction (vph) 0 0 42 0 0 49 0 3 0 0 4 0Lane Group Flow (vph) 67 149 9 92 320 25 106 1050 0 96 1466 0Confl. Peds. (#/hr) 29 10 3Confl. Bikes (#/hr) 9 13 50 50Turn Type Prot NA Perm Prot NA Perm Prot NA Prot NAProtected Phases 7 4 3 8 5 2 1 6Permitted Phases 4 8Actuated Green, G (s) 7.2 24.6 24.6 10.9 28.3 28.3 12.2 77.9 12.1 77.8Effective Green, g (s) 7.2 24.6 24.6 10.9 28.3 28.3 12.2 77.9 12.1 77.8Actuated g/C Ratio 0.05 0.18 0.18 0.08 0.20 0.20 0.09 0.56 0.09 0.56Clearance Time (s) 3.0 3.5 3.5 3.0 3.5 3.5 3.5 4.5 3.5 4.5Vehicle Extension (s) 3.0 3.0 3.0 3.0 3.0 3.0 3.0 3.0 3.0 3.0Lane Grp Cap (vph) 91 327 260 137 376 307 154 1942 152 1933v/s Ratio Prot c0.04 0.08 c0.05 c0.17 c0.06 0.30 0.05 c0.42v/s Ratio Perm 0.01 0.02v/c Ratio 0.74 0.46 0.03 0.67 0.85 0.08 0.69 0.54 0.63 0.76Uniform Delay, d1 65.5 51.7 47.9 62.8 53.8 45.3 62.1 19.7 61.8 23.9Progression Factor 1.00 1.00 1.00 1.00 1.00 1.00 1.04 0.82 1.36 0.16Incremental Delay, d2 26.3 1.0 0.1 12.2 16.7 0.1 10.6 0.9 0.8 0.3Delay (s) 91.8 52.7 47.9 75.0 70.5 45.4 75.1 17.0 85.0 4.1Level of Service F D D E E D E B F AApproach Delay (s) 61.6 67.5 22.4 9.1Approach LOS E E C A
Intersection SummaryHCM 2000 Control Delay 25.7 HCM 2000 Level of Service CHCM 2000 Volume to Capacity ratio 0.78Actuated Cycle Length (s) 140.0 Sum of lost time (s) 14.5Intersection Capacity Utilization 80.0% ICU Level of Service DAnalysis Period (min) 15c Critical Lane Group

HCM Signalized Intersection Capacity Analysis8: El Camino Real & Valparaiso Ave/Glenwood Ave 4/23/2015
Menlo Parl El Camino Real Corridor Study Synchro 8 ReportFuture AM Peak Hour Conditions - Alternative 3 W-Trans
Movement EBL EBT EBR WBL WBT WBR NBL NBT NBR SBL SBT SBRLane ConfigurationsVolume (vph) 294 210 85 59 348 132 110 964 48 121 1316 447Ideal Flow (vphpl) 1900 1900 1900 1900 1900 1900 1900 1900 1900 1900 1900 1900Total Lost time (s) 3.5 3.5 3.5 3.5 3.5 4.0 4.5 4.0 4.5Lane Util. Factor 0.95 0.95 1.00 1.00 1.00 1.00 0.95 1.00 0.95Frpb, ped/bikes 1.00 1.00 0.98 1.00 0.99 1.00 1.00 1.00 0.98Flpb, ped/bikes 1.00 1.00 1.00 1.00 1.00 1.00 1.00 1.00 1.00Frt 1.00 1.00 0.85 1.00 0.96 1.00 0.99 1.00 0.96Flt Protected 0.95 0.99 1.00 0.95 1.00 0.95 1.00 0.95 1.00Satd. Flow (prot) 1681 1753 1548 1770 1777 1770 3500 1770 3339Flt Permitted 0.95 0.99 1.00 0.95 1.00 0.95 1.00 0.95 1.00Satd. Flow (perm) 1681 1753 1548 1770 1777 1770 3500 1770 3339Peak-hour factor, PHF 0.99 0.99 0.99 0.99 0.99 0.99 0.99 0.99 0.99 0.99 0.99 0.99Adj. Flow (vph) 297 212 86 60 352 133 111 974 48 122 1329 452RTOR Reduction (vph) 0 0 57 0 9 0 0 3 0 0 24 0Lane Group Flow (vph) 249 260 29 60 476 0 111 1019 0 122 1757 0Confl. Peds. (#/hr) 8 1 3 2Confl. Bikes (#/hr) 7 50 50Turn Type Split NA Perm Split NA Prot NA Prot NAProtected Phases 4 4 8 8 5 2 1 6Permitted Phases 4Actuated Green, G (s) 26.1 26.1 26.1 37.9 37.9 7.0 49.5 11.0 53.5Effective Green, g (s) 26.1 26.1 26.1 37.9 37.9 7.0 49.5 11.0 53.5Actuated g/C Ratio 0.19 0.19 0.19 0.27 0.27 0.05 0.35 0.08 0.38Clearance Time (s) 3.5 3.5 3.5 3.5 3.5 4.0 4.5 4.0 4.5Vehicle Extension (s) 3.0 3.0 3.0 3.0 3.0 3.0 3.0 3.0 3.0Lane Grp Cap (vph) 313 326 288 479 481 88 1237 139 1275v/s Ratio Prot 0.15 c0.15 0.03 c0.27 c0.06 0.29 0.07 c0.53v/s Ratio Perm 0.02v/c Ratio 0.80 0.80 0.10 0.13 0.99 1.26 0.82 0.88 1.38Uniform Delay, d1 54.4 54.4 47.2 38.5 50.8 66.5 41.3 63.8 43.2Progression Factor 1.00 1.00 1.00 1.00 1.00 0.94 1.21 1.09 0.98Incremental Delay, d2 13.1 12.7 0.2 0.1 37.7 175.2 5.5 34.3 173.9Delay (s) 67.5 67.1 47.4 38.7 88.5 237.6 55.4 103.6 216.4Level of Service E E D D F F E F FApproach Delay (s) 64.4 83.0 73.2 209.2Approach LOS E F E F
Intersection SummaryHCM 2000 Control Delay 135.2 HCM 2000 Level of Service FHCM 2000 Volume to Capacity ratio 1.13Actuated Cycle Length (s) 140.0 Sum of lost time (s) 15.5Intersection Capacity Utilization 113.5% ICU Level of Service HAnalysis Period (min) 15c Critical Lane Group

HCM Signalized Intersection Capacity Analysis9: El Camino Real & Encinal Ave 4/23/2015
Menlo Parl El Camino Real Corridor Study Synchro 8 ReportFuture AM Peak Hour Conditions - Alternative 3 W-Trans
Movement EBL EBT EBR WBL WBT WBR NBL NBT NBR SBL SBT SBRLane ConfigurationsVolume (vph) 4 57 9 132 20 99 14 1279 111 284 1745 42Ideal Flow (vphpl) 1900 1900 1900 1900 1900 1900 1900 1900 1900 1900 1900 1900Total Lost time (s) 3.0 3.0 3.0 3.0 3.0 4.0 3.0 4.0 4.0Lane Util. Factor 1.00 1.00 1.00 1.00 1.00 0.95 1.00 0.95 1.00Frpb, ped/bikes 1.00 0.98 1.00 0.98 1.00 1.00 1.00 1.00 0.96Flpb, ped/bikes 1.00 1.00 1.00 1.00 1.00 1.00 1.00 1.00 1.00Frt 1.00 0.85 1.00 0.85 1.00 0.99 1.00 1.00 0.85Flt Protected 1.00 1.00 0.96 1.00 0.95 1.00 0.95 1.00 1.00Satd. Flow (prot) 1856 1555 1785 1547 1770 3480 1770 3539 1513Flt Permitted 0.99 1.00 0.67 1.00 0.95 1.00 0.95 1.00 1.00Satd. Flow (perm) 1836 1555 1251 1547 1770 3480 1770 3539 1513Peak-hour factor, PHF 0.98 0.98 0.98 0.98 0.98 0.98 0.98 0.98 0.98 0.98 0.98 0.98Adj. Flow (vph) 4 58 9 135 20 101 14 1305 113 290 1781 43RTOR Reduction (vph) 0 0 8 0 0 73 0 4 0 0 0 10Lane Group Flow (vph) 0 62 1 0 155 28 14 1414 0 290 1781 33Confl. Peds. (#/hr) 4 4 2Confl. Bikes (#/hr) 4 4 50 50Turn Type Perm NA Perm Perm NA Perm Prot NA Prot NA PermProtected Phases 4 8 5 2 1 6Permitted Phases 4 4 8 8 6Actuated Green, G (s) 22.2 22.2 22.2 22.2 2.7 80.6 27.2 105.1 105.1Effective Green, g (s) 22.2 22.2 22.2 22.2 2.7 80.6 27.2 105.1 105.1Actuated g/C Ratio 0.16 0.16 0.16 0.16 0.02 0.58 0.19 0.75 0.75Clearance Time (s) 3.0 3.0 3.0 3.0 3.0 4.0 3.0 4.0 4.0Vehicle Extension (s) 3.0 3.0 3.0 3.0 3.0 3.0 3.0 3.0 3.0Lane Grp Cap (vph) 291 246 198 245 34 2003 343 2656 1135v/s Ratio Prot 0.01 c0.41 c0.16 0.50v/s Ratio Perm 0.03 0.00 c0.12 0.02 0.02v/c Ratio 0.21 0.01 0.78 0.11 0.41 0.71 0.85 0.67 0.03Uniform Delay, d1 51.3 49.6 56.6 50.5 67.9 21.2 54.4 8.8 4.4Progression Factor 1.00 1.00 1.00 1.00 1.14 0.40 1.00 1.00 1.00Incremental Delay, d2 0.4 0.0 18.0 0.2 4.7 1.3 17.1 1.4 0.0Delay (s) 51.7 49.6 74.6 50.7 82.4 9.8 71.5 10.1 4.5Level of Service D D E D F A E B AApproach Delay (s) 51.4 65.2 10.5 18.4Approach LOS D E B B
Intersection SummaryHCM 2000 Control Delay 19.2 HCM 2000 Level of Service BHCM 2000 Volume to Capacity ratio 0.75Actuated Cycle Length (s) 140.0 Sum of lost time (s) 10.0Intersection Capacity Utilization 81.0% ICU Level of Service DAnalysis Period (min) 15c Critical Lane Group

HCM Signalized Intersection Capacity Analysis1: El Camino Real & Sand Hill Rd/Alma St 4/23/2015
Menlo Parl El Camino Real Corridor Study Synchro 8 ReportFuture PM Peak Hour Conditions - Alternative 3 W-Trans
Movement EBL EBT EBR WBL WBT WBR NBL NBT NBR SBL SBT SBRLane ConfigurationsVolume (vph) 536 0 373 0 0 744 269 1402 195 397 1487 373Ideal Flow (vphpl) 1900 1900 1900 1900 1900 1900 1900 1900 1900 1900 1900 1900Total Lost time (s) 5.0 5.0 5.0 5.0 4.5 4.5 5.0 4.5 5.0Lane Util. Factor 0.97 1.00 1.00 1.00 0.91 1.00 1.00 0.91 1.00Frpb, ped/bikes 1.00 0.99 1.00 1.00 1.00 0.91 1.00 1.00 0.94Flpb, ped/bikes 1.00 1.00 1.00 1.00 1.00 1.00 1.00 1.00 1.00Frt 1.00 0.85 0.85 1.00 1.00 0.85 1.00 1.00 0.85Flt Protected 0.95 1.00 1.00 0.95 1.00 1.00 0.95 1.00 1.00Satd. Flow (prot) 3433 1569 1583 1770 5085 1445 1770 5085 1496Flt Permitted 0.95 1.00 1.00 0.95 1.00 1.00 0.95 1.00 1.00Satd. Flow (perm) 3433 1569 1583 1770 5085 1445 1770 5085 1496Peak-hour factor, PHF 0.91 0.91 0.91 0.91 0.91 0.91 0.91 0.91 0.91 0.91 0.91 0.91Adj. Flow (vph) 589 0 410 0 0 818 296 1541 214 436 1634 410RTOR Reduction (vph) 0 0 279 0 0 4 0 0 0 0 0 0Lane Group Flow (vph) 589 0 131 0 0 814 296 1541 214 436 1634 410Confl. Peds. (#/hr) 9 8Confl. Bikes (#/hr) 50 50Turn Type Prot pm+ov custom Prot NA Perm Prot NA pm+ovProtected Phases 7 5 10 5 2 1 6 7Permitted Phases 7 1 7 10 2 6Actuated Green, G (s) 20.0 44.8 92.0 24.8 38.5 38.5 32.8 46.5 66.5Effective Green, g (s) 20.0 44.8 88.0 24.8 38.5 38.5 32.8 46.5 66.5Actuated g/C Ratio 0.14 0.32 0.63 0.18 0.28 0.28 0.23 0.33 0.48Clearance Time (s) 5.0 5.0 5.0 4.5 4.5 5.0 4.5 5.0Vehicle Extension (s) 3.0 3.0 3.0 3.0 3.0 3.0 3.0 3.0Lane Grp Cap (vph) 490 502 995 313 1398 397 414 1688 710v/s Ratio Prot c0.17 0.05 0.17 c0.30 c0.25 0.32 0.08v/s Ratio Perm 0.04 c0.51 0.15 0.19v/c Ratio 1.20 0.26 0.82 0.95 1.10 0.54 1.05 0.97 0.58Uniform Delay, d1 60.0 35.3 19.9 56.9 50.8 43.2 53.6 46.0 26.6Progression Factor 1.00 1.00 1.00 1.00 1.00 1.00 0.93 0.63 1.01Incremental Delay, d2 109.1 0.3 5.3 36.4 57.2 5.2 53.2 12.9 0.9Delay (s) 169.1 35.6 25.2 93.3 107.9 48.4 102.8 42.1 27.7Level of Service F D C F F D F D CApproach Delay (s) 114.3 25.2 99.6 50.4Approach LOS F C F D
Intersection SummaryHCM 2000 Control Delay 73.1 HCM 2000 Level of Service EHCM 2000 Volume to Capacity ratio 1.05Actuated Cycle Length (s) 140.0 Sum of lost time (s) 18.5Intersection Capacity Utilization 99.7% ICU Level of Service FAnalysis Period (min) 15c Critical Lane Group

HCM Signalized Intersection Capacity Analysis2: El Camino Real & Cambridge Avenue 4/23/2015
Menlo Parl El Camino Real Corridor Study Synchro 8 ReportFuture PM Peak Hour Conditions - Alternative 3 W-Trans
Movement EBL EBT EBR WBL WBT WBR NBL NBT NBR SBL SBT SBRLane ConfigurationsVolume (vph) 32 5 89 84 16 14 188 2228 11 16 2089 29Ideal Flow (vphpl) 1900 1900 1900 1900 1900 1900 1900 1900 1900 1900 1900 1900Total Lost time (s) 4.0 4.0 4.0 4.0 4.0 4.0 4.0Lane Util. Factor 1.00 1.00 1.00 1.00 0.91 1.00 0.91Frpb, ped/bikes 1.00 1.00 1.00 1.00 1.00 1.00 1.00Flpb, ped/bikes 1.00 1.00 1.00 1.00 1.00 1.00 1.00Frt 1.00 0.85 0.98 1.00 1.00 1.00 1.00Flt Protected 0.96 1.00 0.96 0.95 1.00 0.95 1.00Satd. Flow (prot) 1779 1583 1762 1770 5080 1770 5068Flt Permitted 0.76 1.00 0.76 0.95 1.00 0.95 1.00Satd. Flow (perm) 1402 1583 1385 1770 5080 1770 5068Peak-hour factor, PHF 0.94 0.94 0.94 0.94 0.94 0.94 0.94 0.94 0.94 0.94 0.94 0.94Adj. Flow (vph) 34 5 95 89 17 15 200 2370 12 17 2222 31RTOR Reduction (vph) 0 0 83 0 4 0 0 0 0 0 1 0Lane Group Flow (vph) 0 39 12 0 117 0 200 2382 0 17 2252 0Confl. Peds. (#/hr) 4 4 5 11Confl. Bikes (#/hr) 50 50Turn Type Perm NA Perm Perm NA Prot NA Prot NAProtected Phases 4 8 5 2 1 6Permitted Phases 4 4 8Actuated Green, G (s) 18.4 18.4 18.4 20.4 106.9 2.7 89.2Effective Green, g (s) 18.4 18.4 18.4 20.4 106.9 2.7 89.2Actuated g/C Ratio 0.13 0.13 0.13 0.15 0.76 0.02 0.64Clearance Time (s) 4.0 4.0 4.0 4.0 4.0 4.0 4.0Vehicle Extension (s) 3.0 3.0 3.0 3.0 3.0 3.0 3.0Lane Grp Cap (vph) 184 208 182 257 3878 34 3229v/s Ratio Prot c0.11 0.47 0.01 c0.44v/s Ratio Perm 0.03 0.01 c0.08v/c Ratio 0.21 0.06 0.64 0.78 0.61 0.50 0.70Uniform Delay, d1 54.3 53.2 57.7 57.6 7.4 68.0 16.6Progression Factor 1.00 1.00 1.00 1.06 1.07 0.98 0.24Incremental Delay, d2 0.6 0.1 7.5 1.4 0.1 7.4 0.8Delay (s) 54.9 53.4 65.2 62.2 7.9 74.0 4.7Level of Service D D E E A E AApproach Delay (s) 53.8 65.2 12.1 5.3Approach LOS D E B A
Intersection SummaryHCM 2000 Control Delay 11.4 HCM 2000 Level of Service BHCM 2000 Volume to Capacity ratio 0.70Actuated Cycle Length (s) 140.0 Sum of lost time (s) 12.0Intersection Capacity Utilization 74.5% ICU Level of Service DAnalysis Period (min) 15c Critical Lane Group

HCM Signalized Intersection Capacity Analysis3: El Camino Real & Middle Avenue 4/23/2015
Menlo Parl El Camino Real Corridor Study Synchro 8 ReportFuture PM Peak Hour Conditions - Alternative 3 W-Trans
Movement EBL EBT EBR WBL WBT WBR NBL NBT NBR SBL SBT SBRLane ConfigurationsVolume (vph) 261 21 276 33 46 28 348 1985 3 41 1799 85Ideal Flow (vphpl) 1900 1900 1900 1900 1900 1900 1900 1900 1900 1900 1900 1900Total Lost time (s) 3.0 3.0 4.0 3.0 4.0 4.0 4.0Lane Util. Factor 1.00 1.00 1.00 1.00 0.91 1.00 0.91Frpb, ped/bikes 1.00 1.00 1.00 1.00 1.00 1.00 1.00Flpb, ped/bikes 0.99 1.00 1.00 1.00 1.00 1.00 1.00Frt 1.00 0.86 0.97 1.00 1.00 1.00 0.99Flt Protected 0.95 1.00 0.98 0.95 1.00 0.95 1.00Satd. Flow (prot) 1761 1604 1770 1770 5084 1770 5030Flt Permitted 0.62 1.00 0.59 0.95 1.00 0.95 1.00Satd. Flow (perm) 1155 1604 1055 1770 5084 1770 5030Peak-hour factor, PHF 0.98 0.92 0.98 0.92 0.92 0.92 0.98 0.98 0.92 0.92 0.98 0.98Adj. Flow (vph) 266 23 282 36 50 30 355 2026 3 45 1836 87RTOR Reduction (vph) 0 212 0 0 9 0 0 0 0 0 3 0Lane Group Flow (vph) 266 94 0 0 107 0 355 2029 0 45 1920 0Confl. Peds. (#/hr) 3 9Confl. Bikes (#/hr) 50 50Turn Type Perm NA Perm NA Prot NA Prot NAProtected Phases 4 8 5 2 1 6Permitted Phases 4 8Actuated Green, G (s) 35.0 35.0 34.0 30.9 87.1 6.9 64.1Effective Green, g (s) 35.0 35.0 34.0 30.9 87.1 6.9 64.1Actuated g/C Ratio 0.25 0.25 0.24 0.22 0.62 0.05 0.46Clearance Time (s) 3.0 3.0 4.0 3.0 4.0 4.0 4.0Vehicle Extension (s) 3.0 3.0 3.0 3.0 3.0 3.0 3.0Lane Grp Cap (vph) 288 401 256 390 3162 87 2303v/s Ratio Prot 0.06 c0.20 0.40 0.03 c0.38v/s Ratio Perm c0.23 0.10v/c Ratio 0.92 0.23 0.42 0.91 0.64 0.52 0.83Uniform Delay, d1 51.2 41.8 44.7 53.2 16.6 64.9 33.3Progression Factor 1.00 1.00 1.00 1.41 0.50 1.06 0.61Incremental Delay, d2 33.4 0.3 1.1 21.3 0.8 4.1 3.0Delay (s) 84.6 42.1 45.8 96.5 9.2 72.7 23.4Level of Service F D D F A E CApproach Delay (s) 61.9 45.8 22.2 24.6Approach LOS E D C C
Intersection SummaryHCM 2000 Control Delay 28.2 HCM 2000 Level of Service CHCM 2000 Volume to Capacity ratio 0.89Actuated Cycle Length (s) 140.0 Sum of lost time (s) 12.0Intersection Capacity Utilization 93.4% ICU Level of Service FAnalysis Period (min) 15c Critical Lane Group

HCM Signalized Intersection Capacity Analysis4: El Camino Real & Roble Avenue 4/23/2015
Menlo Parl El Camino Real Corridor Study Synchro 8 ReportFuture PM Peak Hour Conditions - Alternative 3 W-Trans
Movement EBL EBT EBR WBL WBT WBR NBL NBT NBR SBL SBT SBRLane ConfigurationsVolume (vph) 49 3 35 53 10 41 83 2050 16 73 1867 33Ideal Flow (vphpl) 1900 1900 1900 1900 1900 1900 1900 1900 1900 1900 1900 1900Total Lost time (s) 4.0 4.0 4.0 4.0 4.5 4.0 4.5Lane Util. Factor 1.00 1.00 1.00 1.00 0.91 1.00 0.91Frpb, ped/bikes 0.99 1.00 1.00 1.00 1.00 1.00 1.00Flpb, ped/bikes 1.00 0.98 1.00 1.00 1.00 1.00 1.00Frt 0.95 1.00 0.85 1.00 1.00 1.00 1.00Flt Protected 0.97 0.96 1.00 0.95 1.00 0.95 1.00Satd. Flow (prot) 1689 1760 1583 1770 5076 1770 5063Flt Permitted 0.81 0.73 1.00 0.95 1.00 0.95 1.00Satd. Flow (perm) 1406 1333 1583 1770 5076 1770 5063Peak-hour factor, PHF 0.94 0.94 0.94 0.94 0.94 0.94 0.94 0.94 0.94 0.94 0.94 0.94Adj. Flow (vph) 52 3 37 56 11 44 88 2181 17 78 1986 35RTOR Reduction (vph) 0 18 0 0 0 36 0 0 0 0 1 0Lane Group Flow (vph) 0 74 0 0 67 8 88 2198 0 78 2020 0Confl. Peds. (#/hr) 18 18 7 12Confl. Bikes (#/hr) 50 50Turn Type Perm NA Perm NA Perm Prot NA Prot NAProtected Phases 4 8 5 2 1 6Permitted Phases 4 8 8Actuated Green, G (s) 25.2 25.2 25.2 11.2 91.2 11.1 91.1Effective Green, g (s) 25.2 25.2 25.2 11.2 91.2 11.1 91.1Actuated g/C Ratio 0.18 0.18 0.18 0.08 0.65 0.08 0.65Clearance Time (s) 4.0 4.0 4.0 4.0 4.5 4.0 4.5Vehicle Extension (s) 3.0 3.0 3.0 3.0 3.0 3.0 3.0Lane Grp Cap (vph) 253 239 284 141 3306 140 3294v/s Ratio Prot c0.05 c0.43 0.04 0.40v/s Ratio Perm c0.05 0.05 0.01v/c Ratio 0.29 0.28 0.03 0.62 0.66 0.56 0.61Uniform Delay, d1 49.7 49.6 47.3 62.4 15.0 62.1 14.2Progression Factor 1.00 1.00 1.00 1.10 0.46 0.92 0.72Incremental Delay, d2 0.6 0.6 0.0 6.3 0.8 1.2 0.2Delay (s) 50.3 50.2 47.3 74.7 7.7 58.6 10.5Level of Service D D D E A E BApproach Delay (s) 50.3 49.1 10.3 12.3Approach LOS D D B B
Intersection SummaryHCM 2000 Control Delay 12.9 HCM 2000 Level of Service BHCM 2000 Volume to Capacity ratio 0.59Actuated Cycle Length (s) 140.0 Sum of lost time (s) 12.5Intersection Capacity Utilization 81.8% ICU Level of Service DAnalysis Period (min) 15c Critical Lane Group

HCM Signalized Intersection Capacity Analysis5: El Camino Real & Menlo Avenue/Ravenswood Avenue 4/23/2015
Menlo Parl El Camino Real Corridor Study Synchro 8 ReportFuture PM Peak Hour Conditions - Alternative 3 W-Trans
Movement EBL EBT EBR WBL WBT WBR NBL NBT NBR SBL SBT SBRLane ConfigurationsVolume (vph) 41 300 134 678 269 80 162 1367 665 211 1260 51Ideal Flow (vphpl) 1900 1900 1900 1900 1900 1900 1900 1900 1900 1900 1900 1900Lane Width 12 12 12 12 12 12 8 12 12 12 12 12Total Lost time (s) 4.0 4.0 4.0 4.0 4.5 5.0 5.0 4.5 5.0Lane Util. Factor 0.95 0.97 1.00 1.00 1.00 0.95 1.00 1.00 0.95Frpb, ped/bikes 1.00 1.00 1.00 0.98 1.00 1.00 0.94 1.00 1.00Flpb, ped/bikes 1.00 1.00 1.00 1.00 1.00 1.00 1.00 1.00 1.00Frt 0.96 1.00 1.00 0.85 1.00 1.00 0.85 1.00 0.99Flt Protected 1.00 0.95 1.00 1.00 0.95 1.00 1.00 0.95 1.00Satd. Flow (prot) 3375 3433 1863 1551 1534 3539 1484 1770 3503Flt Permitted 1.00 0.95 1.00 1.00 0.95 1.00 1.00 0.95 1.00Satd. Flow (perm) 3375 3433 1863 1551 1534 3539 1484 1770 3503Peak-hour factor, PHF 0.95 0.95 0.95 0.95 0.95 0.95 0.95 0.95 0.95 0.95 0.95 0.95Adj. Flow (vph) 43 316 141 714 283 84 171 1439 700 222 1326 54RTOR Reduction (vph) 0 30 0 0 0 64 0 0 262 0 2 0Lane Group Flow (vph) 0 470 0 714 283 20 171 1439 438 222 1378 0Confl. Peds. (#/hr) 6 18 13Confl. Bikes (#/hr) 50 50Turn Type Split NA Split NA Perm Prot NA Perm Prot NAProtected Phases 4 4 8 8 5 2 1 6Permitted Phases 8 2Actuated Green, G (s) 20.0 30.0 30.0 30.0 17.1 55.0 55.0 17.5 55.4Effective Green, g (s) 20.0 30.0 30.0 30.0 17.1 55.0 55.0 17.5 55.4Actuated g/C Ratio 0.14 0.21 0.21 0.21 0.12 0.39 0.39 0.12 0.40Clearance Time (s) 4.0 4.0 4.0 4.0 4.5 5.0 5.0 4.5 5.0Vehicle Extension (s) 3.0 3.0 3.0 3.0 3.0 3.0 3.0 3.0 3.0Lane Grp Cap (vph) 482 735 399 332 187 1390 583 221 1386v/s Ratio Prot c0.14 c0.21 0.15 0.11 c0.41 c0.13 0.39v/s Ratio Perm 0.01 0.30v/c Ratio 0.98 0.97 0.71 0.06 0.91 1.04 0.75 1.00 0.99Uniform Delay, d1 59.8 54.6 51.0 43.8 60.7 42.5 36.6 61.2 42.1Progression Factor 1.00 1.00 1.00 1.00 1.21 0.89 0.85 1.35 0.47Incremental Delay, d2 34.3 26.1 5.7 0.1 35.3 30.9 6.8 52.8 19.4Delay (s) 94.0 80.7 56.7 43.8 108.8 68.9 37.9 135.8 39.2Level of Service F F E D F E D F DApproach Delay (s) 94.0 71.5 62.5 52.6Approach LOS F E E D
Intersection SummaryHCM 2000 Control Delay 64.2 HCM 2000 Level of Service EHCM 2000 Volume to Capacity ratio 1.00Actuated Cycle Length (s) 140.0 Sum of lost time (s) 17.5Intersection Capacity Utilization 98.2% ICU Level of Service FAnalysis Period (min) 15c Critical Lane Group

HCM Signalized Intersection Capacity Analysis6: El Camino Real & Santa Cruz Ave 4/23/2015
Menlo Parl El Camino Real Corridor Study Synchro 8 ReportFuture PM Peak Hour Conditions - Alternative 3 W-Trans
Movement EBL EBT EBR WBL WBT WBR NBL NBT NBR SBL SBT SBRLane ConfigurationsVolume (vph) 176 233 153 107 120 66 0 1399 256 0 1221 96Ideal Flow (vphpl) 1900 1900 1900 1900 1900 1900 1900 1900 1900 1900 1900 1900Total Lost time (s) 4.0 4.0 4.0 4.0 4.0 4.5 4.5Lane Util. Factor 1.00 1.00 1.00 1.00 1.00 0.95 0.95Frpb, ped/bikes 1.00 1.00 0.87 1.00 0.98 0.99 0.99Flpb, ped/bikes 1.00 1.00 1.00 1.00 1.00 1.00 1.00Frt 1.00 1.00 0.85 1.00 0.95 0.98 0.99Flt Protected 0.95 1.00 1.00 0.95 1.00 1.00 1.00Satd. Flow (prot) 1770 1863 1375 1770 1733 3407 3479Flt Permitted 0.95 1.00 1.00 0.95 1.00 1.00 1.00Satd. Flow (perm) 1770 1863 1375 1770 1733 3407 3479Peak-hour factor, PHF 0.96 0.96 0.96 0.96 0.96 0.96 0.96 0.96 0.96 0.96 0.96 0.96Adj. Flow (vph) 183 243 159 111 125 69 0 1457 267 0 1272 100RTOR Reduction (vph) 0 0 111 0 15 0 0 10 0 0 4 0Lane Group Flow (vph) 183 243 48 111 179 0 0 1714 0 0 1368 0Confl. Peds. (#/hr) 87 26 12 9Confl. Bikes (#/hr) 50 50Turn Type Split NA Perm Split NA NA NAProtected Phases 4 4 8 8 2 6Permitted Phases 4Actuated Green, G (s) 30.0 30.0 30.0 26.5 26.5 71.0 71.0Effective Green, g (s) 30.0 30.0 30.0 26.5 26.5 71.0 71.0Actuated g/C Ratio 0.21 0.21 0.21 0.19 0.19 0.51 0.51Clearance Time (s) 4.0 4.0 4.0 4.0 4.0 4.5 4.5Vehicle Extension (s) 3.0 3.0 3.0 3.0 3.0 3.0 3.0Lane Grp Cap (vph) 379 399 294 335 328 1727 1764v/s Ratio Prot 0.10 c0.13 0.06 c0.10 c0.50 0.39v/s Ratio Perm 0.04v/c Ratio 0.48 0.61 0.16 0.33 0.55 0.99 0.78Uniform Delay, d1 48.2 49.7 44.8 49.1 51.3 34.2 28.0Progression Factor 1.00 1.00 1.00 1.00 1.00 0.37 0.34Incremental Delay, d2 1.0 2.6 0.3 0.6 1.9 12.3 2.6Delay (s) 49.2 52.3 45.1 49.7 53.2 24.9 12.1Level of Service D D D D D C BApproach Delay (s) 49.4 51.9 24.9 12.1Approach LOS D D C B
Intersection SummaryHCM 2000 Control Delay 26.1 HCM 2000 Level of Service CHCM 2000 Volume to Capacity ratio 0.81Actuated Cycle Length (s) 140.0 Sum of lost time (s) 12.5Intersection Capacity Utilization 87.7% ICU Level of Service EAnalysis Period (min) 15c Critical Lane Group

HCM Signalized Intersection Capacity Analysis7: El Camino Real & Oak Grove Ave 4/23/2015
Menlo Parl El Camino Real Corridor Study Synchro 8 ReportFuture PM Peak Hour Conditions - Alternative 3 W-Trans
Movement EBL EBT EBR WBL WBT WBR NBL NBT NBR SBL SBT SBRLane ConfigurationsVolume (vph) 161 303 124 107 256 100 92 1378 96 146 1112 155Ideal Flow (vphpl) 1900 1900 1900 1900 1900 1900 1900 1900 1900 1900 1900 1900Total Lost time (s) 3.0 3.5 3.5 3.0 3.5 3.5 3.5 4.5 3.5 4.5Lane Util. Factor 1.00 1.00 1.00 1.00 1.00 1.00 1.00 0.95 1.00 0.95Frpb, ped/bikes 1.00 1.00 0.96 1.00 1.00 0.96 1.00 0.99 1.00 0.99Flpb, ped/bikes 1.00 1.00 1.00 1.00 1.00 1.00 1.00 1.00 1.00 1.00Frt 1.00 1.00 0.85 1.00 1.00 0.85 1.00 0.99 1.00 0.98Flt Protected 0.95 1.00 1.00 0.95 1.00 1.00 0.95 1.00 0.95 1.00Satd. Flow (prot) 1770 1863 1522 1770 1863 1515 1770 3484 1770 3437Flt Permitted 0.95 1.00 1.00 0.95 1.00 1.00 0.95 1.00 0.95 1.00Satd. Flow (perm) 1770 1863 1522 1770 1863 1515 1770 3484 1770 3437Peak-hour factor, PHF 0.98 0.98 0.98 0.98 0.98 0.98 0.98 0.98 0.98 0.98 0.98 0.98Adj. Flow (vph) 164 309 127 109 261 102 94 1406 98 149 1135 158RTOR Reduction (vph) 0 0 62 0 0 58 0 3 0 0 7 0Lane Group Flow (vph) 164 309 65 109 261 44 94 1501 0 149 1286 0Confl. Peds. (#/hr) 19 22 10 10Confl. Bikes (#/hr) 50 50Turn Type Prot NA Perm Prot NA Perm Prot NA Prot NAProtected Phases 7 4 3 8 5 2 1 6Permitted Phases 4 8Actuated Green, G (s) 14.7 28.1 28.1 11.4 24.8 24.8 10.7 71.4 14.6 75.3Effective Green, g (s) 14.7 28.1 28.1 11.4 24.8 24.8 10.7 71.4 14.6 75.3Actuated g/C Ratio 0.10 0.20 0.20 0.08 0.18 0.18 0.08 0.51 0.10 0.54Clearance Time (s) 3.0 3.5 3.5 3.0 3.5 3.5 3.5 4.5 3.5 4.5Vehicle Extension (s) 3.0 3.0 3.0 3.0 3.0 3.0 3.0 3.0 3.0 3.0Lane Grp Cap (vph) 185 373 305 144 330 268 135 1776 184 1848v/s Ratio Prot c0.09 c0.17 0.06 0.14 0.05 c0.43 c0.08 0.37v/s Ratio Perm 0.04 0.03v/c Ratio 0.89 0.83 0.21 0.76 0.79 0.16 0.70 0.84 0.81 0.70Uniform Delay, d1 61.8 53.6 46.7 62.9 55.1 48.8 63.1 29.5 61.3 23.9Progression Factor 1.00 1.00 1.00 1.00 1.00 1.00 1.16 0.59 0.59 1.62Incremental Delay, d2 36.0 14.0 0.4 20.1 12.2 0.3 5.9 2.1 12.9 1.2Delay (s) 97.8 67.7 47.1 83.0 67.3 49.1 78.9 19.4 49.1 39.8Level of Service F E D F E D E B D DApproach Delay (s) 71.6 67.0 22.9 40.8Approach LOS E E C D
Intersection SummaryHCM 2000 Control Delay 41.3 HCM 2000 Level of Service DHCM 2000 Volume to Capacity ratio 0.86Actuated Cycle Length (s) 140.0 Sum of lost time (s) 14.5Intersection Capacity Utilization 91.0% ICU Level of Service FAnalysis Period (min) 15c Critical Lane Group

HCM Signalized Intersection Capacity Analysis8: El Camino Real & Valparaiso Ave/Glenwood Ave 4/23/2015
Menlo Parl El Camino Real Corridor Study Synchro 8 ReportFuture PM Peak Hour Conditions - Alternative 3 W-Trans
Movement EBL EBT EBR WBL WBT WBR NBL NBT NBR SBL SBT SBRLane ConfigurationsVolume (vph) 360 233 124 50 219 49 133 1438 26 142 1035 380Ideal Flow (vphpl) 1900 1900 1900 1900 1900 1900 1900 1900 1900 1900 1900 1900Total Lost time (s) 3.5 3.5 3.5 3.5 3.5 4.0 4.5 4.0 4.5Lane Util. Factor 0.95 0.95 1.00 1.00 1.00 1.00 0.95 1.00 0.95Frpb, ped/bikes 1.00 1.00 0.98 1.00 1.00 1.00 1.00 1.00 0.98Flpb, ped/bikes 1.00 1.00 1.00 1.00 1.00 1.00 1.00 1.00 1.00Frt 1.00 1.00 0.85 1.00 0.97 1.00 1.00 1.00 0.96Flt Protected 0.95 0.99 1.00 0.95 1.00 0.95 1.00 0.95 1.00Satd. Flow (prot) 1681 1750 1554 1770 1812 1770 3524 1770 3332Flt Permitted 0.95 0.99 1.00 0.95 1.00 0.95 1.00 0.95 1.00Satd. Flow (perm) 1681 1750 1554 1770 1812 1770 3524 1770 3332Peak-hour factor, PHF 0.98 0.98 0.98 0.98 0.98 0.98 0.98 0.98 0.98 0.98 0.98 0.98Adj. Flow (vph) 367 238 127 51 223 50 136 1467 27 145 1056 388RTOR Reduction (vph) 0 0 68 0 6 0 0 1 0 0 26 0Lane Group Flow (vph) 297 308 59 51 267 0 136 1493 0 145 1418 0Confl. Peds. (#/hr) 5 3 1Confl. Bikes (#/hr) 50 50Turn Type Split NA Perm Split NA Prot NA Prot NAProtected Phases 4 4 8 8 5 2 1 6Permitted Phases 4Actuated Green, G (s) 28.7 28.7 28.7 25.3 25.3 16.1 53.7 16.8 54.4Effective Green, g (s) 28.7 28.7 28.7 25.3 25.3 16.1 53.7 16.8 54.4Actuated g/C Ratio 0.20 0.20 0.20 0.18 0.18 0.12 0.38 0.12 0.39Clearance Time (s) 3.5 3.5 3.5 3.5 3.5 4.0 4.5 4.0 4.5Vehicle Extension (s) 3.0 3.0 3.0 3.0 3.0 3.0 3.0 3.0 3.0Lane Grp Cap (vph) 344 358 318 319 327 203 1351 212 1294v/s Ratio Prot c0.18 0.18 0.03 c0.15 0.08 0.42 c0.08 c0.43v/s Ratio Perm 0.04v/c Ratio 0.86 0.86 0.19 0.16 0.82 0.67 1.11 0.68 1.10Uniform Delay, d1 53.8 53.7 46.0 48.4 55.1 59.4 43.1 59.1 42.8Progression Factor 1.00 1.00 1.00 1.00 1.00 0.97 0.76 1.26 0.89Incremental Delay, d2 19.5 18.6 0.3 0.2 14.6 4.6 54.2 6.9 53.1Delay (s) 73.2 72.3 46.3 48.6 69.7 62.1 87.1 81.3 91.1Level of Service E E D D E E F F FApproach Delay (s) 68.2 66.4 85.0 90.2Approach LOS E E F F
Intersection SummaryHCM 2000 Control Delay 82.6 HCM 2000 Level of Service FHCM 2000 Volume to Capacity ratio 0.94Actuated Cycle Length (s) 140.0 Sum of lost time (s) 15.5Intersection Capacity Utilization 94.3% ICU Level of Service FAnalysis Period (min) 15c Critical Lane Group

HCM Signalized Intersection Capacity Analysis9: El Camino Real & Encinal Ave 4/23/2015
Menlo Parl El Camino Real Corridor Study Synchro 8 ReportFuture PM Peak Hour Conditions - Alternative 3 W-Trans
Movement EBL EBT EBR WBL WBT WBR NBL NBT NBR SBL SBT SBRLane ConfigurationsVolume (vph) 20 17 14 81 12 226 36 1648 197 384 1730 19Ideal Flow (vphpl) 1900 1900 1900 1900 1900 1900 1900 1900 1900 1900 1900 1900Total Lost time (s) 3.0 3.0 3.0 3.0 3.0 4.0 3.0 4.0 4.0Lane Util. Factor 1.00 1.00 1.00 1.00 1.00 0.95 1.00 0.95 1.00Frpb, ped/bikes 1.00 1.00 1.00 0.98 1.00 0.99 1.00 1.00 0.96Flpb, ped/bikes 1.00 1.00 1.00 1.00 1.00 1.00 1.00 1.00 1.00Frt 1.00 0.85 1.00 0.85 1.00 0.98 1.00 1.00 0.85Flt Protected 0.97 1.00 0.96 1.00 0.95 1.00 0.95 1.00 1.00Satd. Flow (prot) 1808 1583 1785 1554 1770 3461 1770 3539 1513Flt Permitted 0.85 1.00 0.73 1.00 0.95 1.00 0.95 1.00 1.00Satd. Flow (perm) 1572 1583 1354 1554 1770 3461 1770 3539 1513Peak-hour factor, PHF 0.99 0.99 0.99 0.99 0.99 0.99 0.99 0.99 0.99 0.99 0.99 0.99Adj. Flow (vph) 20 17 14 82 12 228 36 1665 199 388 1747 19RTOR Reduction (vph) 0 0 12 0 0 201 0 6 0 0 0 5Lane Group Flow (vph) 0 37 2 0 94 27 36 1858 0 388 1747 14Confl. Peds. (#/hr) 5 5 1Confl. Bikes (#/hr) 50 50Turn Type Perm NA Perm Perm NA Perm Prot NA Prot NA PermProtected Phases 4 8 5 2 1 6Permitted Phases 4 4 8 8 6Actuated Green, G (s) 16.8 16.8 16.8 16.8 6.5 74.2 39.0 106.7 106.7Effective Green, g (s) 16.8 16.8 16.8 16.8 6.5 74.2 39.0 106.7 106.7Actuated g/C Ratio 0.12 0.12 0.12 0.12 0.05 0.53 0.28 0.76 0.76Clearance Time (s) 3.0 3.0 3.0 3.0 3.0 4.0 3.0 4.0 4.0Vehicle Extension (s) 3.0 3.0 3.0 3.0 3.0 3.0 3.0 3.0 3.0Lane Grp Cap (vph) 188 189 162 186 82 1834 493 2697 1153v/s Ratio Prot 0.02 c0.54 c0.22 0.49v/s Ratio Perm 0.02 0.00 c0.07 0.02 0.01v/c Ratio 0.20 0.01 0.58 0.15 0.44 1.01 0.79 0.65 0.01Uniform Delay, d1 55.5 54.3 58.3 55.2 65.0 32.9 46.7 7.8 4.0Progression Factor 1.00 1.00 1.00 1.00 0.91 0.44 1.00 1.00 1.00Incremental Delay, d2 0.5 0.0 5.2 0.4 0.3 9.9 8.1 1.2 0.0Delay (s) 56.0 54.3 63.5 55.5 59.1 24.4 54.8 9.0 4.0Level of Service E D E E E C D A AApproach Delay (s) 55.6 57.9 25.0 17.2Approach LOS E E C B
Intersection SummaryHCM 2000 Control Delay 24.0 HCM 2000 Level of Service CHCM 2000 Volume to Capacity ratio 0.89Actuated Cycle Length (s) 140.0 Sum of lost time (s) 10.0Intersection Capacity Utilization 97.1% ICU Level of Service FAnalysis Period (min) 15c Critical Lane Group

Queuing and Blocking ReportExisting AM Peak Hour Conditions - No Project 7/22/2014
Menlo Parl El Camino Real Corridor Study SimTraffic ReportW-Trans Page 1
Intersection: 1: El Camino Real & Sand Hill Rd/Alma St
Movement EB EB EB WB NB NB NB NB SB SB SB SBDirections Served L L R R L T T T L T T TMaximum Queue (ft) 87 134 118 86 200 236 192 88 326 286 291 344Average Queue (ft) 34 79 66 27 124 150 112 28 236 134 160 18195th Queue (ft) 88 141 122 89 202 253 206 93 351 322 342 381Link Distance (ft) 349 329 525 525 525 746 746 746Upstream Blk Time (%)Queuing Penalty (veh)Storage Bay Dist (ft) 235 235 190 535Storage Blk Time (%) 2 5 0 5Queuing Penalty (veh) 3 7 0 12
Intersection: 1: El Camino Real & Sand Hill Rd/Alma St
Movement SBDirections Served RMaximum Queue (ft) 236Average Queue (ft) 8095th Queue (ft) 230Link Distance (ft)Upstream Blk Time (%)Queuing Penalty (veh)Storage Bay Dist (ft) 240Storage Blk Time (%) 0Queuing Penalty (veh) 0
Intersection: 2: El Camino Real & Cambridge Avenue
Movement EB EB NB NB NB NB SB SB SB SBDirections Served LT R L T T TR L T T TRMaximum Queue (ft) 58 48 78 112 107 110 40 109 154 170Average Queue (ft) 17 23 36 40 38 42 13 40 49 7695th Queue (ft) 54 49 82 116 117 121 41 110 139 167Link Distance (ft) 284 269 269 269 284 284 284Upstream Blk Time (%)Queuing Penalty (veh)Storage Bay Dist (ft) 100 200 100Storage Blk Time (%) 0 2Queuing Penalty (veh) 0 0

Queuing and Blocking ReportExisting AM Peak Hour Conditions - No Project 7/22/2014
Menlo Parl El Camino Real Corridor Study SimTraffic ReportW-Trans Page 2
Intersection: 3: El Camino Real & Middle Avenue
Movement EB EB NB NB NB NB SB SB SBDirections Served L R L T T T T T TRMaximum Queue (ft) 222 196 164 105 94 78 203 184 232Average Queue (ft) 151 127 112 38 47 34 105 103 12895th Queue (ft) 239 212 172 102 101 76 211 198 240Link Distance (ft) 251 310 310 310 382 382 382Upstream Blk Time (%) 1Queuing Penalty (veh) 0Storage Bay Dist (ft) 100 270Storage Blk Time (%) 27 15Queuing Penalty (veh) 83 31
Intersection: 4: El Camino Real & Roble Avenue
Movement EB WB WB NB NB NB NB SB SB SBDirections Served LTR LT R L T T TR L T TRMaximum Queue (ft) 151 31 24 86 137 166 214 97 208 248Average Queue (ft) 88 10 7 44 73 78 91 40 102 12295th Queue (ft) 156 31 28 89 150 167 198 103 219 244Link Distance (ft) 238 182 182 432 432 432 196 196Upstream Blk Time (%) 0 1 2Queuing Penalty (veh) 0 8 20Storage Bay Dist (ft) 200 119Storage Blk Time (%) 0 4Queuing Penalty (veh) 0 1

Queuing and Blocking ReportExisting AM Peak Hour Conditions - No Project 7/22/2014
Menlo Parl El Camino Real Corridor Study SimTraffic ReportW-Trans Page 3
Intersection: 5: El Camino Real & Menlo Avenue/Ravenswood Avenue
Movement EB EB WB WB WB WB NB NB NB NB SB SBDirections Served LT TR L L T R L T T R L TMaximum Queue (ft) 298 235 281 333 229 118 159 210 232 156 194 281Average Queue (ft) 227 161 182 235 156 44 88 140 155 82 122 13395th Queue (ft) 312 244 282 332 234 121 158 224 245 155 225 281Link Distance (ft) 315 397 397 332 332 332 359Upstream Blk Time (%) 1 1 0Queuing Penalty (veh) 0 0 0Storage Bay Dist (ft) 225 275 135 319 240Storage Blk Time (%) 6 0 0 2 17 2Queuing Penalty (veh) 12 0 0 6 8 3
Intersection: 5: El Camino Real & Menlo Avenue/Ravenswood Avenue
Movement SB SBDirections Served T RMaximum Queue (ft) 292 2Average Queue (ft) 134 095th Queue (ft) 285 3Link Distance (ft) 359Upstream Blk Time (%) 0Queuing Penalty (veh) 2Storage Bay Dist (ft) 75Storage Blk Time (%) 34Queuing Penalty (veh) 4
Intersection: 6: El Camino Real & Santa Cruz Ave
Movement EB EB EB WB WB NB NB NB SB SB SBDirections Served L T R L TR T T R T T RMaximum Queue (ft) 110 73 85 74 106 166 146 49 398 392 124Average Queue (ft) 60 34 41 36 51 91 79 17 334 338 5195th Queue (ft) 119 80 91 69 113 166 144 47 490 484 155Link Distance (ft) 292 220 359 359 359 416 416Upstream Blk Time (%) 4 3Queuing Penalty (veh) 31 24Storage Bay Dist (ft) 140 140 150 100Storage Blk Time (%) 1 0 59Queuing Penalty (veh) 1 0 36

Queuing and Blocking ReportExisting AM Peak Hour Conditions - No Project 7/22/2014
Menlo Parl El Camino Real Corridor Study SimTraffic ReportW-Trans Page 4
Intersection: 7: El Camino Real & Oak Grove Ave
Movement EB EB EB WB WB WB NB NB NB NB SB SBDirections Served L T R L T R L T T R L TMaximum Queue (ft) 98 129 48 162 226 139 101 104 97 26 173 320Average Queue (ft) 55 88 24 91 143 35 73 53 57 10 116 13695th Queue (ft) 102 138 52 169 239 124 123 103 110 30 222 358Link Distance (ft) 248 245 416 416 988Upstream Blk Time (%) 1Queuing Penalty (veh) 0Storage Bay Dist (ft) 90 115 115 115 280 115 195Storage Blk Time (%) 3 12 5 13 0 7Queuing Penalty (veh) 5 13 15 16 0 6
Intersection: 7: El Camino Real & Oak Grove Ave
Movement SB SBDirections Served T RMaximum Queue (ft) 325 103Average Queue (ft) 143 3895th Queue (ft) 351 140Link Distance (ft) 988Upstream Blk Time (%)Queuing Penalty (veh)Storage Bay Dist (ft) 135Storage Blk Time (%) 16Queuing Penalty (veh) 14

Queuing and Blocking ReportExisting AM Peak Hour Conditions - No Project 7/22/2014
Menlo Parl El Camino Real Corridor Study SimTraffic ReportW-Trans Page 5
Intersection: 8: El Camino Real & Valparaiso Ave/Glenwood Ave
Movement EB EB EB WB WB NB NB NB NB SB SB SBDirections Served L LT R L TR L T T R L T TMaximum Queue (ft) 179 328 180 149 202 234 339 353 155 230 727 742Average Queue (ft) 120 237 88 59 131 141 237 261 45 115 557 55995th Queue (ft) 237 353 212 140 236 272 357 373 152 239 979 982Link Distance (ft) 374 226 988 988 1026 1026Upstream Blk Time (%) 3 2 1 1Queuing Penalty (veh) 0 0 6 5Storage Bay Dist (ft) 130 130 115 190 105 180Storage Blk Time (%) 1 40 11 1 19 36 53Queuing Penalty (veh) 4 77 5 4 21 13 34
Intersection: 8: El Camino Real & Valparaiso Ave/Glenwood Ave
Movement SBDirections Served RMaximum Queue (ft) 398Average Queue (ft) 13895th Queue (ft) 397Link Distance (ft) 1026Upstream Blk Time (%)Queuing Penalty (veh)Storage Bay Dist (ft)Storage Blk Time (%)Queuing Penalty (veh)
Intersection: 9: El Camino Real & Encinal Ave
Movement EB EB WB WB NB NB NB NB SB SB SB SBDirections Served LT R LT R L T T R L T T TRMaximum Queue (ft) 77 32 173 100 40 130 148 64 150 280 218 168Average Queue (ft) 32 5 102 53 21 81 91 20 99 164 106 9995th Queue (ft) 73 29 189 115 46 154 162 76 168 275 216 181Link Distance (ft) 235 193 1026 1026 638 638 638Upstream Blk Time (%) 1Queuing Penalty (veh) 0Storage Bay Dist (ft) 30 75 150 150 130Storage Blk Time (%) 32 1 19 1 2 1 5 10Queuing Penalty (veh) 3 1 17 1 0 1 27 11

Queuing and Blocking ReportExisting AM Peak Hour Conditions - No Project 7/22/2014
Menlo Parl El Camino Real Corridor Study SimTraffic ReportW-Trans Page 6
Intersection: 10: El Camino Real & College Avenue
Movement EB NB NB NB SB SB SBDirections Served R T T T T T TRMaximum Queue (ft) 43 19 25 18 56 53 70Average Queue (ft) 30 6 8 3 8 5 995th Queue (ft) 53 36 36 19 40 34 47Link Distance (ft) 306 377 377 377 310 310 310Upstream Blk Time (%)Queuing Penalty (veh)Storage Bay Dist (ft)Storage Blk Time (%)Queuing Penalty (veh)
Intersection: 24: El Camino Real & Safeway Driveway
Movement EB NBDirections Served R LMaximum Queue (ft) 30 35Average Queue (ft) 5 1295th Queue (ft) 24 38Link Distance (ft) 145Upstream Blk Time (%)Queuing Penalty (veh)Storage Bay Dist (ft) 225Storage Blk Time (%)Queuing Penalty (veh)
Intersection: 25: El Camino Real & Partridge Avenue
Movement EB NB NB NB SB SB SBDirections Served R T T T T T TMaximum Queue (ft) 34 18 25 46 50 23 37Average Queue (ft) 20 3 4 7 9 3 695th Queue (ft) 41 16 22 41 45 22 33Link Distance (ft) 258 284 284 284 377 377 377Upstream Blk Time (%)Queuing Penalty (veh)Storage Bay Dist (ft)Storage Blk Time (%) 0Queuing Penalty (veh) 0

Queuing and Blocking ReportExisting AM Peak Hour Conditions - No Project 7/22/2014
Menlo Parl El Camino Real Corridor Study SimTraffic ReportW-Trans Page 7
Intersection: 28: El Camino Real & Live Oak Avenue
Movement EB NB NB NB SB SBDirections Served R T T T T TRMaximum Queue (ft) 77 24 23 10 147 120Average Queue (ft) 31 3 3 2 27 2495th Queue (ft) 81 17 22 16 127 102Link Distance (ft) 249 196 196 196 332 332Upstream Blk Time (%)Queuing Penalty (veh)Storage Bay Dist (ft)Storage Blk Time (%)Queuing Penalty (veh)
Intersection: 31: El Camino Real & Harvard Ave
Movement EB NB NB NB SB SB SBDirections Served R T T T T T TRMaximum Queue (ft) 56 23 23 18 66 42 47Average Queue (ft) 24 7 5 3 12 8 995th Queue (ft) 62 32 26 19 54 44 46Link Distance (ft) 250 746 746 746 269 269 269Upstream Blk Time (%)Queuing Penalty (veh)Storage Bay Dist (ft)Storage Blk Time (%)Queuing Penalty (veh)
Network SummaryNetwork wide Queuing Penalty: 591

Queuing and Blocking ReportExisting PM Peak Hour Conditions - No Project 7/22/2014
Menlo Parl El Camino Real Corridor Study SimTraffic ReportW-Trans Page 1
Intersection: 1: El Camino Real & Sand Hill Rd/Alma St
Movement EB EB EB WB WB NB NB NB NB NB SB SBDirections Served L L R T R L T T T R L TMaximum Queue (ft) 260 381 260 129 312 250 522 451 329 149 352 154Average Queue (ft) 246 348 202 9 209 209 384 315 212 39 245 6395th Queue (ft) 292 432 362 97 374 297 584 508 369 160 403 146Link Distance (ft) 349 329 329 525 525 525 746Upstream Blk Time (%) 46 1 5 5 1Queuing Penalty (veh) 0 0 0 0 0Storage Bay Dist (ft) 235 235 190 100 535Storage Blk Time (%) 15 53 0 5 39 17 3 0Queuing Penalty (veh) 75 265 2 23 71 23 14 0
Intersection: 1: El Camino Real & Sand Hill Rd/Alma St
Movement SB SB SBDirections Served T T RMaximum Queue (ft) 174 182 218Average Queue (ft) 81 86 9495th Queue (ft) 182 193 212Link Distance (ft) 746 746Upstream Blk Time (%)Queuing Penalty (veh)Storage Bay Dist (ft) 240Storage Blk Time (%) 1Queuing Penalty (veh) 2
Intersection: 2: El Camino Real & Cambridge Avenue
Movement EB EB WB NB NB NB NB SB SB SB SBDirections Served LT R LTR L T T TR L T T TRMaximum Queue (ft) 58 55 35 227 297 279 250 34 199 209 245Average Queue (ft) 23 31 7 138 156 147 142 12 140 149 20095th Queue (ft) 63 55 31 238 325 299 285 35 203 229 270Link Distance (ft) 284 139 269 269 269 284 284 284Upstream Blk Time (%) 0 1 1 1 0Queuing Penalty (veh) 0 11 8 4 1Storage Bay Dist (ft) 100 200 100Storage Blk Time (%) 0 1 3 17Queuing Penalty (veh) 0 8 5 2

Queuing and Blocking ReportExisting PM Peak Hour Conditions - No Project 7/22/2014
Menlo Parl El Camino Real Corridor Study SimTraffic ReportW-Trans Page 2
Intersection: 3: El Camino Real & Middle Avenue
Movement EB EB NB NB NB NB SB SB SBDirections Served L R L T T T T T TRMaximum Queue (ft) 266 192 299 352 241 179 230 242 278Average Queue (ft) 181 116 241 170 110 74 124 137 17695th Queue (ft) 292 223 321 353 226 158 233 239 288Link Distance (ft) 251 310 310 310 382 382 382Upstream Blk Time (%) 5 2 3 0 0Queuing Penalty (veh) 0 0 25 0 0Storage Bay Dist (ft) 100 270Storage Blk Time (%) 34 6 10 5Queuing Penalty (veh) 67 14 68 16
Intersection: 4: El Camino Real & Roble Avenue
Movement EB WB WB NB NB NB NB SB SB SB SBDirections Served LTR LT R L T T TR L T T TRMaximum Queue (ft) 115 103 47 188 379 388 378 128 165 181 188Average Queue (ft) 65 50 30 92 265 288 247 71 101 111 12295th Queue (ft) 121 102 58 220 494 499 461 131 178 198 210Link Distance (ft) 241 182 182 432 432 432 197 197 197Upstream Blk Time (%) 14 16 8 0 1 1Queuing Penalty (veh) 95 113 55 1 3 5Storage Bay Dist (ft) 200 119Storage Blk Time (%) 25 2 3Queuing Penalty (veh) 20 10 2

Queuing and Blocking ReportExisting PM Peak Hour Conditions - No Project 7/22/2014
Menlo Parl El Camino Real Corridor Study SimTraffic ReportW-Trans Page 3
Intersection: 5: El Camino Real & Menlo Avenue/Ravenswood Avenue
Movement EB EB WB WB WB WB NB NB NB NB SB SBDirections Served LT TR L L T R L T T R L TMaximum Queue (ft) 267 216 224 284 311 170 296 420 415 332 239 266Average Queue (ft) 217 162 147 206 186 69 146 352 360 206 163 19095th Queue (ft) 318 266 263 298 330 171 348 479 482 364 258 274Link Distance (ft) 315 397 397 332 332 332 359Upstream Blk Time (%) 3 0 1 0 37 41 3Queuing Penalty (veh) 0 0 0 0 252 283 17Storage Bay Dist (ft) 225 275 135 319 240Storage Blk Time (%) 11 3 1 22 0 38 4 0Queuing Penalty (veh) 24 6 2 17 1 51 22 1
Intersection: 5: El Camino Real & Menlo Avenue/Ravenswood Avenue
Movement SB SBDirections Served T RMaximum Queue (ft) 268 82Average Queue (ft) 211 2595th Queue (ft) 299 92Link Distance (ft) 359Upstream Blk Time (%)Queuing Penalty (veh)Storage Bay Dist (ft) 75Storage Blk Time (%) 49 0Queuing Penalty (veh) 25 0
Intersection: 6: El Camino Real & Santa Cruz Ave
Movement EB EB EB WB WB NB NB NB SB SB SBDirections Served L T R L TR T T R T T RMaximum Queue (ft) 177 171 123 80 135 215 177 39 229 257 133Average Queue (ft) 114 59 52 34 76 124 121 16 136 151 3995th Queue (ft) 188 160 121 93 172 220 187 41 244 266 117Link Distance (ft) 292 220 359 359 359 416 416Upstream Blk Time (%) 0 0Queuing Penalty (veh) 0 0Storage Bay Dist (ft) 140 140 150 100Storage Blk Time (%) 7 0 4 21Queuing Penalty (veh) 15 1 2 20

Queuing and Blocking ReportExisting PM Peak Hour Conditions - No Project 7/22/2014
Menlo Parl El Camino Real Corridor Study SimTraffic ReportW-Trans Page 4
Intersection: 7: El Camino Real & Oak Grove Ave
Movement EB EB EB WB WB WB NB NB NB NB SB SBDirections Served L T R L T R L T T R L TMaximum Queue (ft) 139 264 165 149 219 149 118 163 167 110 219 537Average Queue (ft) 110 181 90 110 137 66 63 112 119 35 157 38895th Queue (ft) 161 304 197 177 267 157 127 173 179 112 287 533Link Distance (ft) 248 245 416 416 988Upstream Blk Time (%) 10 5Queuing Penalty (veh) 0 0Storage Bay Dist (ft) 90 115 115 115 280 115 195Storage Blk Time (%) 37 32 0 25 9 1 13 25Queuing Penalty (veh) 123 83 0 75 19 2 12 27
Intersection: 7: El Camino Real & Oak Grove Ave
Movement SB SBDirections Served T RMaximum Queue (ft) 546 185Average Queue (ft) 408 9995th Queue (ft) 537 235Link Distance (ft) 988Upstream Blk Time (%)Queuing Penalty (veh)Storage Bay Dist (ft) 135Storage Blk Time (%) 29Queuing Penalty (veh) 27

Queuing and Blocking ReportExisting PM Peak Hour Conditions - No Project 7/22/2014
Menlo Parl El Camino Real Corridor Study SimTraffic ReportW-Trans Page 5
Intersection: 8: El Camino Real & Valparaiso Ave/Glenwood Ave
Movement EB EB EB WB WB NB NB NB NB SB SB SBDirections Served L LT R L TR L T T R L T TMaximum Queue (ft) 180 354 179 145 234 239 462 472 96 129 323 319Average Queue (ft) 133 277 105 59 158 158 316 318 18 48 227 21795th Queue (ft) 238 393 224 154 240 275 580 594 87 134 332 321Link Distance (ft) 374 226 988 988 1026 1026Upstream Blk Time (%) 2 2Queuing Penalty (veh) 0 0Storage Bay Dist (ft) 130 130 115 190 105 180Storage Blk Time (%) 1 41 1 20 5 14 31 26Queuing Penalty (veh) 5 108 3 10 34 19 7 11
Intersection: 8: El Camino Real & Valparaiso Ave/Glenwood Ave
Movement SBDirections Served RMaximum Queue (ft) 105Average Queue (ft) 5595th Queue (ft) 105Link Distance (ft) 1026Upstream Blk Time (%)Queuing Penalty (veh)Storage Bay Dist (ft)Storage Blk Time (%)Queuing Penalty (veh)
Intersection: 9: El Camino Real & Encinal Ave
Movement EB EB WB WB NB NB NB NB SB SB SB SBDirections Served LT R LT R L T T R L T T TRMaximum Queue (ft) 60 43 186 100 64 115 130 32 158 234 216 110Average Queue (ft) 30 13 93 75 31 56 66 10 68 132 102 4595th Queue (ft) 69 47 181 116 77 113 130 33 148 231 222 124Link Distance (ft) 235 193 1026 1026 638 638 638Upstream Blk Time (%) 2Queuing Penalty (veh) 0Storage Bay Dist (ft) 30 75 150 150 130Storage Blk Time (%) 28 1 6 12 0 0 1 7Queuing Penalty (veh) 4 1 9 11 0 0 6 5

Queuing and Blocking ReportExisting PM Peak Hour Conditions - No Project 7/22/2014
Menlo Parl El Camino Real Corridor Study SimTraffic ReportW-Trans Page 6
Intersection: 10: El Camino Real & College Avenue
Movement EB NB NB NB SB SB SBDirections Served R T T T T T TRMaximum Queue (ft) 46 98 93 38 60 72 63Average Queue (ft) 20 17 12 8 9 10 1095th Queue (ft) 51 97 65 37 53 63 54Link Distance (ft) 306 377 377 377 310 310 310Upstream Blk Time (%)Queuing Penalty (veh)Storage Bay Dist (ft)Storage Blk Time (%)Queuing Penalty (veh)
Intersection: 24: El Camino Real & Safeway Driveway
Movement EB NB NB NB NB SBDirections Served R L T T T TRMaximum Queue (ft) 23 43 91 104 76 11Average Queue (ft) 8 16 30 28 21 295th Queue (ft) 32 46 154 150 124 16Link Distance (ft) 145 382 382 382 432Upstream Blk Time (%)Queuing Penalty (veh)Storage Bay Dist (ft) 225Storage Blk Time (%) 1Queuing Penalty (veh) 0
Intersection: 25: El Camino Real & Partridge Avenue
Movement EB NB NB NB SB SB SBDirections Served R T T T T T TMaximum Queue (ft) 34 103 83 43 59 35 25Average Queue (ft) 15 21 15 9 10 6 795th Queue (ft) 40 82 76 41 52 34 46Link Distance (ft) 258 284 284 284 377 377 377Upstream Blk Time (%)Queuing Penalty (veh)Storage Bay Dist (ft)Storage Blk Time (%) 0Queuing Penalty (veh) 0

Queuing and Blocking ReportExisting PM Peak Hour Conditions - No Project 7/22/2014
Menlo Parl El Camino Real Corridor Study SimTraffic ReportW-Trans Page 7
Intersection: 28: El Camino Real & Live Oak Avenue
Movement EB NB NB NB SB SBDirections Served R T T T T TRMaximum Queue (ft) 60 240 262 153 78 89Average Queue (ft) 29 139 143 55 18 2495th Queue (ft) 63 341 338 218 84 99Link Distance (ft) 237 197 197 197 332 332Upstream Blk Time (%) 17 18 3Queuing Penalty (veh) 117 119 21Storage Bay Dist (ft)Storage Blk Time (%)Queuing Penalty (veh)
Intersection: 31: El Camino Real & Harvard
Movement EB NB NB NB SB SB SBDirections Served R T T T T T TRMaximum Queue (ft) 33 76 59 54 39 33 55Average Queue (ft) 19 15 6 7 6 5 895th Queue (ft) 40 65 38 49 36 27 47Link Distance (ft) 250 746 746 746 269 269 269Upstream Blk Time (%)Queuing Penalty (veh)Storage Bay Dist (ft)Storage Blk Time (%)Queuing Penalty (veh)
Network SummaryNetwork wide Queuing Penalty: 2609

Queuing and Blocking ReportFuture AM Peak Hour Conditions - No Project 2/9/2015
Menlo Parl El Camino Real Corridor Study SimTraffic ReportW-Trans Page 1
Intersection: 1: El Camino Real & Sand Hill Rd/Alma St
Movement EB EB EB WB NB NB NB NB NB SB SB SBDirections Served L L R R L T T T R L T TMaximum Queue (ft) 176 311 257 299 250 557 533 315 80 547 595 555Average Queue (ft) 90 170 172 155 246 533 370 129 11 396 303 30395th Queue (ft) 196 336 299 304 254 577 679 324 88 645 673 606Link Distance (ft) 348 329 525 525 525 1071 1071Upstream Blk Time (%) 4 4 68 2Queuing Penalty (veh) 0 0 0 0Storage Bay Dist (ft) 235 235 190 100 535Storage Blk Time (%) 0 2 8 74 4 10 10 1Queuing Penalty (veh) 0 10 14 263 15 3 60 4
Intersection: 1: El Camino Real & Sand Hill Rd/Alma St
Movement SB SBDirections Served T RMaximum Queue (ft) 487 265Average Queue (ft) 262 11695th Queue (ft) 548 303Link Distance (ft) 1071Upstream Blk Time (%)Queuing Penalty (veh)Storage Bay Dist (ft) 240Storage Blk Time (%) 11 0Queuing Penalty (veh) 26 1
Intersection: 2: El Camino Real & Cambridge Avenue
Movement EB EB WB NB NB NB NB SB SB SB SBDirections Served LT R LTR L T T TR L T T TRMaximum Queue (ft) 61 84 56 96 284 301 312 114 158 131 176Average Queue (ft) 27 46 28 48 168 184 194 60 60 63 9395th Queue (ft) 67 88 63 99 321 356 358 120 155 151 193Link Distance (ft) 284 139 1071 1071 1071 1085 1085 1085Upstream Blk Time (%)Queuing Penalty (veh)Storage Bay Dist (ft) 100 200 100Storage Blk Time (%) 0 0 5 7 1Queuing Penalty (veh) 0 0 3 48 1

Queuing and Blocking ReportFuture AM Peak Hour Conditions - No Project 2/9/2015
Menlo Parl El Camino Real Corridor Study SimTraffic ReportW-Trans Page 2
Intersection: 3: El Camino Real & Middle Avenue
Movement EB EB WB NB NB NB NB SB SB SB SBDirections Served L TR LTR L T T TR L T T TRMaximum Queue (ft) 222 260 77 301 332 341 362 99 199 234 263Average Queue (ft) 153 183 43 158 177 201 215 56 114 121 14995th Queue (ft) 244 279 82 282 335 366 389 105 221 229 262Link Distance (ft) 250 250 124 1085 1085 1085 871 871 871Upstream Blk Time (%) 0 5Queuing Penalty (veh) 0 0Storage Bay Dist (ft) 270 75Storage Blk Time (%) 2 3 7 17Queuing Penalty (veh) 11 7 44 11
Intersection: 4: El Camino Real & Roble Avenue
Movement EB WB WB NB NB NB NB SB SB SB SBDirections Served LTR LT R L T T TR L T T TRMaximum Queue (ft) 165 33 24 64 65 97 121 75 142 141 172Average Queue (ft) 89 11 6 33 25 34 52 40 72 69 8395th Queue (ft) 166 40 25 76 66 93 136 80 149 151 176Link Distance (ft) 241 182 182 871 871 871 586 586 586Upstream Blk Time (%)Queuing Penalty (veh)Storage Bay Dist (ft) 200 119Storage Blk Time (%) 0 2Queuing Penalty (veh) 1 1

Queuing and Blocking ReportFuture AM Peak Hour Conditions - No Project 2/9/2015
Menlo Parl El Camino Real Corridor Study SimTraffic ReportW-Trans Page 3
Intersection: 5: El Camino Real & Menlo Avenue/Ravenswood Avenue
Movement EB EB WB WB WB WB NB NB NB NB SB SBDirections Served LT TR L L T R L T T R L TMaximum Queue (ft) 314 252 284 365 329 145 145 204 266 400 194 175Average Queue (ft) 265 201 220 274 206 54 100 117 131 207 129 9195th Queue (ft) 357 307 310 388 332 151 163 206 223 435 220 170Link Distance (ft) 316 397 397 586 586 586 359Upstream Blk Time (%) 11 1 0Queuing Penalty (veh) 0 0 0Storage Bay Dist (ft) 225 275 135 319 240Storage Blk Time (%) 30 11 0 8 27 0 3Queuing Penalty (veh) 66 21 0 20 12 0 20
Intersection: 5: El Camino Real & Menlo Avenue/Ravenswood Avenue
Movement SB SBDirections Served T RMaximum Queue (ft) 197 22Average Queue (ft) 109 995th Queue (ft) 190 55Link Distance (ft) 359Upstream Blk Time (%)Queuing Penalty (veh)Storage Bay Dist (ft) 75Storage Blk Time (%) 26Queuing Penalty (veh) 3
Intersection: 6: El Camino Real & Santa Cruz Ave
Movement EB EB EB WB WB NB NB NB SB SB SBDirections Served L T R L TR T T R T T RMaximum Queue (ft) 155 120 83 99 104 146 139 26 195 199 54Average Queue (ft) 107 45 39 40 52 73 74 8 137 132 1395th Queue (ft) 165 128 82 97 104 142 143 30 205 206 58Link Distance (ft) 292 220 359 359 359 416 416Upstream Blk Time (%)Queuing Penalty (veh)Storage Bay Dist (ft) 140 140 150 100Storage Blk Time (%) 4 0 29Queuing Penalty (veh) 7 1 18

Queuing and Blocking ReportFuture AM Peak Hour Conditions - No Project 2/9/2015
Menlo Parl El Camino Real Corridor Study SimTraffic ReportW-Trans Page 4
Intersection: 7: El Camino Real & Oak Grove Ave
Movement EB EB EB WB WB WB NB NB NB NB SB SBDirections Served L T R L T R L T T R L TMaximum Queue (ft) 122 198 90 164 265 135 135 163 169 96 133 84Average Queue (ft) 62 118 32 101 226 41 83 125 127 26 75 4895th Queue (ft) 120 207 89 184 317 137 143 172 172 100 133 92Link Distance (ft) 248 245 416 416 988Upstream Blk Time (%) 0 21Queuing Penalty (veh) 0 0Storage Bay Dist (ft) 90 115 115 115 280 115 195Storage Blk Time (%) 7 18 0 5 40 21Queuing Penalty (veh) 13 20 0 17 63 13
Intersection: 7: El Camino Real & Oak Grove Ave
Movement SB SBDirections Served T RMaximum Queue (ft) 91 27Average Queue (ft) 55 695th Queue (ft) 100 30Link Distance (ft) 988Upstream Blk Time (%)Queuing Penalty (veh)Storage Bay Dist (ft) 135Storage Blk Time (%) 0Queuing Penalty (veh) 0

Queuing and Blocking ReportFuture AM Peak Hour Conditions - No Project 2/9/2015
Menlo Parl El Camino Real Corridor Study SimTraffic ReportW-Trans Page 5
Intersection: 8: El Camino Real & Valparaiso Ave/Glenwood Ave
Movement EB EB EB WB WB NB NB NB NB SB SB SBDirections Served L LT R L TR L T T R L T TMaximum Queue (ft) 180 390 180 163 249 240 579 593 155 230 993 1004Average Queue (ft) 158 334 99 86 243 224 460 457 63 173 879 86595th Queue (ft) 230 447 224 205 253 279 690 693 175 289 1116 1117Link Distance (ft) 374 226 988 988 1026 1026Upstream Blk Time (%) 15 78 3 4Queuing Penalty (veh) 0 0 22 28Storage Bay Dist (ft) 130 130 115 190 105 180Storage Blk Time (%) 6 61 78 72 29 51 16 60Queuing Penalty (veh) 28 142 46 364 31 24 113 72
Intersection: 8: El Camino Real & Valparaiso Ave/Glenwood Ave
Movement SBDirections Served RMaximum Queue (ft) 672Average Queue (ft) 37295th Queue (ft) 911Link Distance (ft) 1026Upstream Blk Time (%) 1Queuing Penalty (veh) 7Storage Bay Dist (ft)Storage Blk Time (%)Queuing Penalty (veh)
Intersection: 9: El Camino Real & Encinal Ave
Movement EB EB WB WB NB NB NB NB SB SB SB SBDirections Served LT R LT R L T T R L T T TRMaximum Queue (ft) 78 43 213 100 65 235 259 138 179 625 564 326Average Queue (ft) 43 11 146 65 17 149 166 30 167 442 360 16395th Queue (ft) 79 44 238 131 73 232 254 121 220 711 665 377Link Distance (ft) 235 193 1026 1026 638 638 638Upstream Blk Time (%) 6 5 0Queuing Penalty (veh) 0 0 0Storage Bay Dist (ft) 30 75 150 150 130Storage Blk Time (%) 43 1 33 1 11 14 46 9Queuing Penalty (veh) 4 1 33 1 2 16 278 26
Network SummaryNetwork wide Queuing Penalty: 2051

Queuing and Blocking ReportFuture PM Peak Hour Conditions - No Project 2/9/2015
Menlo Parl El Camino Real Corridor Study SimTraffic ReportW-Trans Page 1
Intersection: 1: El Camino Real & Sand Hill Rd/Alma St
Movement EB EB EB WB NB NB NB NB NB SB SB SBDirections Served L L R R L T T T R L T TMaximum Queue (ft) 260 374 260 352 250 544 541 520 200 362 269 306Average Queue (ft) 253 365 249 294 242 526 480 400 134 262 145 16595th Queue (ft) 269 375 322 421 275 602 612 577 277 428 310 335Link Distance (ft) 348 329 525 525 525 1071 1071Upstream Blk Time (%) 54 21 38 10 4Queuing Penalty (veh) 0 0 0 0 0Storage Bay Dist (ft) 235 235 190 100 535Storage Blk Time (%) 13 59 2 18 50 45 9Queuing Penalty (veh) 85 381 9 87 135 87 44
Intersection: 1: El Camino Real & Sand Hill Rd/Alma St
Movement SB SBDirections Served T RMaximum Queue (ft) 320 215Average Queue (ft) 174 12295th Queue (ft) 376 257Link Distance (ft) 1071Upstream Blk Time (%)Queuing Penalty (veh)Storage Bay Dist (ft) 240Storage Blk Time (%) 4 0Queuing Penalty (veh) 13 0
Intersection: 2: El Camino Real & Cambridge Avenue
Movement EB EB WB NB NB NB NB SB SB SB SBDirections Served LT R LTR L T T TR L T T TRMaximum Queue (ft) 66 107 151 240 518 642 620 66 170 199 218Average Queue (ft) 29 50 103 170 191 242 183 25 94 122 15995th Queue (ft) 69 96 159 271 605 770 569 65 177 211 246Link Distance (ft) 284 139 1071 1071 1071 1085 1085 1085Upstream Blk Time (%) 6 0 0 0Queuing Penalty (veh) 0 0 4 0Storage Bay Dist (ft) 100 200 100Storage Blk Time (%) 0 2 14 2 0 9Queuing Penalty (veh) 0 1 106 4 0 1

Queuing and Blocking ReportFuture PM Peak Hour Conditions - No Project 2/9/2015
Menlo Parl El Camino Real Corridor Study SimTraffic ReportW-Trans Page 2
Intersection: 3: El Camino Real & Middle Avenue
Movement EB EB WB NB NB NB NB SB SB SB SBDirections Served L TR LTR L T T TR L T T TRMaximum Queue (ft) 247 222 148 344 406 309 241 87 342 384 406Average Queue (ft) 205 133 82 285 181 166 142 53 219 249 25995th Queue (ft) 304 232 154 357 365 284 219 100 379 412 426Link Distance (ft) 250 250 210 1085 1085 1085 871 871 871Upstream Blk Time (%) 12 0 0Queuing Penalty (veh) 0 0 0Storage Bay Dist (ft) 270 75Storage Blk Time (%) 24 0 9 50Queuing Penalty (veh) 164 0 58 21
Intersection: 4: El Camino Real & Roble Avenue
Movement EB WB WB NB NB NB NB SB SB SB SBDirections Served LTR LT R L T T TR L T T TRMaximum Queue (ft) 123 112 67 151 229 238 222 139 224 240 259Average Queue (ft) 74 43 33 82 142 162 119 79 161 178 20595th Queue (ft) 140 108 71 150 269 284 247 150 252 259 292Link Distance (ft) 241 182 182 871 871 871 586 586 586Upstream Blk Time (%) 0Queuing Penalty (veh) 0Storage Bay Dist (ft) 200 119Storage Blk Time (%) 3 5 10Queuing Penalty (veh) 3 31 7

Queuing and Blocking ReportFuture PM Peak Hour Conditions - No Project 2/9/2015
Menlo Parl El Camino Real Corridor Study SimTraffic ReportW-Trans Page 3
Intersection: 5: El Camino Real & Menlo Avenue/Ravenswood Avenue
Movement EB EB WB WB WB WB NB NB NB NB SB SBDirections Served LT TR L L T R L T T R L TMaximum Queue (ft) 328 262 325 422 416 170 327 539 550 353 257 318Average Queue (ft) 270 217 321 406 304 101 194 374 394 200 170 23395th Queue (ft) 374 316 339 442 495 209 354 588 593 325 277 365Link Distance (ft) 316 397 397 586 586 586 359Upstream Blk Time (%) 21 36 11 2 3 0 2Queuing Penalty (veh) 0 0 0 11 22 0 12Storage Bay Dist (ft) 225 275 135 319 240Storage Blk Time (%) 33 9 19 56 40 1 20 3 12Queuing Penalty (veh) 94 18 64 191 32 5 32 19 25
Intersection: 5: El Camino Real & Menlo Avenue/Ravenswood Avenue
Movement SB SBDirections Served T RMaximum Queue (ft) 324 98Average Queue (ft) 243 2195th Queue (ft) 382 84Link Distance (ft) 359Upstream Blk Time (%) 2Queuing Penalty (veh) 18Storage Bay Dist (ft) 75Storage Blk Time (%) 51 0Queuing Penalty (veh) 26 0
Intersection: 6: El Camino Real & Santa Cruz Ave
Movement EB EB EB WB WB NB NB NB SB SB SBDirections Served L T R L TR LT T R T T RMaximum Queue (ft) 188 290 168 146 174 203 210 78 155 165 86Average Queue (ft) 135 187 95 88 102 108 109 33 98 108 3195th Queue (ft) 214 331 209 148 180 186 183 81 173 192 112Link Distance (ft) 292 220 359 359 359 416 416Upstream Blk Time (%) 5 1Queuing Penalty (veh) 0 0Storage Bay Dist (ft) 140 140 150 100Storage Blk Time (%) 9 15 7 0 5 16Queuing Penalty (veh) 34 48 28 0 5 15

Queuing and Blocking ReportFuture PM Peak Hour Conditions - No Project 2/9/2015
Menlo Parl El Camino Real Corridor Study SimTraffic ReportW-Trans Page 4
Intersection: 7: El Camino Real & Oak Grove Ave
Movement EB EB EB WB WB WB NB NB NB NB SB SBDirections Served L T R L T R L T T R L TMaximum Queue (ft) 140 266 165 164 258 165 174 339 332 164 244 550Average Queue (ft) 126 261 96 105 194 103 97 210 226 63 194 48895th Queue (ft) 164 285 217 186 284 212 208 354 375 177 311 589Link Distance (ft) 248 245 416 416 988Upstream Blk Time (%) 59 6 0 1Queuing Penalty (veh) 0 0 2 11Storage Bay Dist (ft) 90 115 115 115 280 115 195Storage Blk Time (%) 62 42 1 15 26 1 7 45 4 28Queuing Penalty (veh) 264 119 6 54 54 4 6 44 24 41
Intersection: 7: El Camino Real & Oak Grove Ave
Movement SB SBDirections Served T RMaximum Queue (ft) 579 185Average Queue (ft) 504 14495th Queue (ft) 607 253Link Distance (ft) 988Upstream Blk Time (%)Queuing Penalty (veh)Storage Bay Dist (ft) 135Storage Blk Time (%) 34 0Queuing Penalty (veh) 53 0

Queuing and Blocking ReportFuture PM Peak Hour Conditions - No Project 2/9/2015
Menlo Parl El Camino Real Corridor Study SimTraffic ReportW-Trans Page 5
Intersection: 8: El Camino Real & Valparaiso Ave/Glenwood Ave
Movement EB EB EB WB WB NB NB NB NB SB SB SBDirections Served L LT R L TR L T T R L T TMaximum Queue (ft) 180 406 180 144 238 239 917 922 103 215 404 408Average Queue (ft) 161 391 119 60 176 163 697 719 23 162 272 27495th Queue (ft) 237 411 242 156 265 279 1103 1102 111 269 459 443Link Distance (ft) 374 226 988 988 1026 1026Upstream Blk Time (%) 64 4 1 2Queuing Penalty (veh) 0 0 12 14Storage Bay Dist (ft) 130 130 115 190 105 180Storage Blk Time (%) 3 74 0 27 4 40 49 21 20Queuing Penalty (veh) 18 225 1 14 31 53 13 113 28
Intersection: 8: El Camino Real & Valparaiso Ave/Glenwood Ave
Movement SBDirections Served RMaximum Queue (ft) 134Average Queue (ft) 8195th Queue (ft) 136Link Distance (ft) 1026Upstream Blk Time (%)Queuing Penalty (veh)Storage Bay Dist (ft)Storage Blk Time (%)Queuing Penalty (veh)
Intersection: 9: El Camino Real & Encinal Ave
Movement EB EB WB WB NB NB NB NB SB SB SB SBDirections Served LT R LT R L T T R L T T TRMaximum Queue (ft) 68 41 200 100 56 269 272 199 180 674 653 648Average Queue (ft) 33 9 107 83 28 201 207 85 177 653 619 36695th Queue (ft) 72 37 212 117 70 296 304 213 184 701 699 777Link Distance (ft) 235 193 1026 1026 638 638 638Upstream Blk Time (%) 2 50 7 1Queuing Penalty (veh) 0 0 0 0Storage Bay Dist (ft) 30 75 150 150 130Storage Blk Time (%) 38 3 10 17 26 26 69 1Queuing Penalty (veh) 5 1 22 16 9 51 406 4
Network SummaryNetwork wide Queuing Penalty: 3663

Queuing and Blocking ReportFuture AM Peak Hour Conditions - Alternative 1 4/23/2015
Menlo Parl El Camino Real Corridor Study SimTraffic ReportW-Trans Page 1
Intersection: 1: El Camino Real & Sand Hill Rd/Alma St
Movement EB EB EB WB WB NB NB NB NB NB SB SBDirections Served L L R T R L T T T R L TMaximum Queue (ft) 185 343 259 64 344 250 552 538 515 80 595 776Average Queue (ft) 111 171 178 9 228 246 541 436 272 11 476 46795th Queue (ft) 227 295 285 98 390 255 559 700 591 86 727 1122Link Distance (ft) 348 329 329 525 525 525 1071Upstream Blk Time (%) 1 0 12 64 8 1 9Queuing Penalty (veh) 0 0 0 0 0 0 68Storage Bay Dist (ft) 235 235 190 100 535Storage Blk Time (%) 0 3 6 68 9 19 31 0Queuing Penalty (veh) 0 13 9 293 32 14 175 0
Intersection: 1: El Camino Real & Sand Hill Rd/Alma St
Movement SB SB SBDirections Served T T RMaximum Queue (ft) 613 556 226Average Queue (ft) 293 237 8495th Queue (ft) 813 580 253Link Distance (ft) 1071 1071Upstream Blk Time (%) 0Queuing Penalty (veh) 0Storage Bay Dist (ft) 240Storage Blk Time (%) 6 0Queuing Penalty (veh) 14 0
Intersection: 2: El Camino Real & Cambridge Avenue
Movement EB EB WB NB NB NB NB SB SB SB SBDirections Served LT R LTR L T T TR L T T TRMaximum Queue (ft) 110 98 57 236 328 344 366 86 194 172 178Average Queue (ft) 46 53 17 74 179 166 201 46 77 65 6995th Queue (ft) 138 113 50 205 341 352 385 111 268 221 160Link Distance (ft) 284 139 1071 1071 1071 1085 1085 1085Upstream Blk Time (%) 1Queuing Penalty (veh) 0Storage Bay Dist (ft) 100 200 100Storage Blk Time (%) 12 5 0 9Queuing Penalty (veh) 5 3 0 5

Queuing and Blocking ReportFuture AM Peak Hour Conditions - Alternative 1 4/23/2015
Menlo Parl El Camino Real Corridor Study SimTraffic ReportW-Trans Page 2
Intersection: 3: El Camino Real & Middle Avenue
Movement EB EB WB NB NB NB NB SB SB SB SBDirections Served L TR LTR L T T TR L T T TRMaximum Queue (ft) 248 269 116 344 598 564 575 95 222 211 230Average Queue (ft) 174 215 57 263 276 271 291 63 127 132 15795th Queue (ft) 283 325 120 380 585 546 561 107 229 223 242Link Distance (ft) 250 250 124 1085 1085 1085 871 871 871Upstream Blk Time (%) 3 26 1Queuing Penalty (veh) 0 0 0Storage Bay Dist (ft) 270 75Storage Blk Time (%) 16 4 6 12Queuing Penalty (veh) 94 11 39 7
Intersection: 4: El Camino Real & Roble Avenue
Movement EB WB WB NB NB NB NB SB SB SB SBDirections Served LTR LT R L T T TR L T T TRMaximum Queue (ft) 170 28 30 215 564 580 607 71 131 141 145Average Queue (ft) 104 5 9 63 294 317 364 36 73 74 7995th Queue (ft) 196 26 30 199 614 618 687 76 152 162 170Link Distance (ft) 241 182 182 871 871 871 586 586 586Upstream Blk Time (%) 2 0Queuing Penalty (veh) 0 0Storage Bay Dist (ft) 200 119Storage Blk Time (%) 21 1Queuing Penalty (veh) 9 0

Queuing and Blocking ReportFuture AM Peak Hour Conditions - Alternative 1 4/23/2015
Menlo Parl El Camino Real Corridor Study SimTraffic ReportW-Trans Page 3
Intersection: 5: El Camino Real & Menlo Avenue/Ravenswood Avenue
Movement EB EB WB WB WB WB NB NB NB NB NB SBDirections Served LT TR L L T R L T T T R LMaximum Queue (ft) 317 257 261 307 264 170 368 613 608 610 225 315Average Queue (ft) 235 174 169 203 162 67 183 563 565 579 214 31495th Queue (ft) 325 289 259 305 268 163 422 700 692 666 270 316Link Distance (ft) 316 385 385 586 586 586Upstream Blk Time (%) 1 0 22 20 24Queuing Penalty (veh) 0 0 154 137 169Storage Bay Dist (ft) 225 275 135 319 200 240Storage Blk Time (%) 13 0 0 2 17 58 64 4 75Queuing Penalty (veh) 28 1 1 3 16 54 245 20 393
Intersection: 5: El Camino Real & Menlo Avenue/Ravenswood Avenue
Movement SB SB SBDirections Served T T TRMaximum Queue (ft) 413 192 171Average Queue (ft) 394 111 12195th Queue (ft) 417 208 181Link Distance (ft) 360 360 360Upstream Blk Time (%) 65 0Queuing Penalty (veh) 530 0Storage Bay Dist (ft)Storage Blk Time (%)Queuing Penalty (veh)
Intersection: 6: El Camino Real & Santa Cruz Ave
Movement EB EB EB WB WB NB NB NB SB SB SBDirections Served L T R L TR T T TR T T TRMaximum Queue (ft) 165 308 190 184 214 121 138 160 427 420 356Average Queue (ft) 113 291 170 144 108 85 100 121 400 344 24095th Queue (ft) 242 366 229 233 246 129 144 162 466 468 401Link Distance (ft) 293 222 360 360 360 417 417 417Upstream Blk Time (%) 80 15 19 0 0Queuing Penalty (veh) 0 0 148 4 1Storage Bay Dist (ft) 140 140 150Storage Blk Time (%) 28 4 76 50 0Queuing Penalty (veh) 49 9 170 45 0

Queuing and Blocking ReportFuture AM Peak Hour Conditions - Alternative 1 4/23/2015
Menlo Parl El Camino Real Corridor Study SimTraffic ReportW-Trans Page 4
Intersection: 7: El Camino Real & Oak Grove Ave
Movement EB EB EB WB WB WB NB NB NB NB SB SBDirections Served L T R L T R L T T TR L TMaximum Queue (ft) 104 211 151 164 269 137 180 229 212 232 123 208Average Queue (ft) 57 101 52 121 221 51 106 165 165 180 73 12095th Queue (ft) 106 192 134 191 324 147 206 245 230 252 128 236Link Distance (ft) 248 246 417 417 417 989Upstream Blk Time (%) 0 29Queuing Penalty (veh) 0 0Storage Bay Dist (ft) 90 115 115 115 280 195Storage Blk Time (%) 6 16 0 49 29 1 1 3Queuing Penalty (veh) 11 19 0 161 51 5 1 2
Intersection: 7: El Camino Real & Oak Grove Ave
Movement SB SBDirections Served T TRMaximum Queue (ft) 337 170Average Queue (ft) 131 12495th Queue (ft) 393 182Link Distance (ft) 989 989Upstream Blk Time (%)Queuing Penalty (veh)Storage Bay Dist (ft)Storage Blk Time (%)Queuing Penalty (veh)

Queuing and Blocking ReportFuture AM Peak Hour Conditions - Alternative 1 4/23/2015
Menlo Parl El Camino Real Corridor Study SimTraffic ReportW-Trans Page 5
Intersection: 8: El Camino Real & Valparaiso Ave/Glenwood Ave
Movement EB EB EB WB WB NB NB NB NB SB SB SBDirections Served L LT R L TR L T T TR L T TMaximum Queue (ft) 180 407 180 165 239 240 386 399 397 197 1051 1066Average Queue (ft) 166 375 158 121 190 163 278 305 321 66 1037 104295th Queue (ft) 221 460 228 209 279 260 390 406 411 182 1056 1065Link Distance (ft) 374 227 989 989 989 1026 1026Upstream Blk Time (%) 47 9 17 17Queuing Penalty (veh) 0 0 142 141Storage Bay Dist (ft) 130 130 115 190 180Storage Blk Time (%) 6 65 1 13 31 8 24 65Queuing Penalty (veh) 35 242 3 29 45 44 40 42
Intersection: 8: El Camino Real & Valparaiso Ave/Glenwood Ave
Movement SBDirections Served TRMaximum Queue (ft) 1054Average Queue (ft) 103795th Queue (ft) 1058Link Distance (ft) 1026Upstream Blk Time (%) 20Queuing Penalty (veh) 171Storage Bay Dist (ft)Storage Blk Time (%)Queuing Penalty (veh)
Intersection: 9: El Camino Real & Encinal Ave
Movement EB EB WB WB NB NB NB NB SB SB SB SBDirections Served LT R LT R L T T TR L T T TRMaximum Queue (ft) 93 38 233 100 34 107 107 133 180 665 678 677Average Queue (ft) 43 9 190 62 16 61 60 79 137 611 599 59095th Queue (ft) 97 39 267 130 45 120 110 142 237 764 786 822Link Distance (ft) 235 194 1026 1026 1026 638 638 638Upstream Blk Time (%) 41 50 49 53Queuing Penalty (veh) 0 0 0 0Storage Bay Dist (ft) 30 75 150 130Storage Blk Time (%) 41 7 68 1 0 5 72Queuing Penalty (veh) 5 4 63 1 0 38 77
Network SummaryNetwork wide Queuing Penalty: 4343

Queuing and Blocking ReportFuture PM Peak Hour Conditions - Alternative 1 4/23/2015
Menlo Parl El Camino Real Corridor Study SimTraffic ReportW-Trans Page 1
Intersection: 1: El Camino Real & Sand Hill Rd/Alma St
Movement EB EB EB WB NB NB NB NB NB SB SB SBDirections Served L L R R L T T T R L T TMaximum Queue (ft) 260 384 260 355 250 573 548 552 200 438 325 240Average Queue (ft) 253 367 242 307 234 546 527 509 143 289 133 13995th Queue (ft) 272 381 337 418 309 567 583 605 286 528 350 263Link Distance (ft) 348 329 525 525 525 1071 1071Upstream Blk Time (%) 63 29 57 29 24Queuing Penalty (veh) 0 0 0 0 0Storage Bay Dist (ft) 235 235 190 100 535Storage Blk Time (%) 9 61 0 7 62 62 8 3Queuing Penalty (veh) 57 403 3 36 125 111 43 14
Intersection: 1: El Camino Real & Sand Hill Rd/Alma St
Movement SB SBDirections Served T RMaximum Queue (ft) 262 246Average Queue (ft) 144 11395th Queue (ft) 266 254Link Distance (ft) 1071Upstream Blk Time (%)Queuing Penalty (veh)Storage Bay Dist (ft) 240Storage Blk Time (%) 1 0Queuing Penalty (veh) 3 1
Intersection: 2: El Camino Real & Cambridge Avenue
Movement EB EB WB NB NB NB NB SB SB SB SBDirections Served LT R LTR L T T TR L T T TRMaximum Queue (ft) 64 89 147 229 438 420 271 43 125 156 189Average Queue (ft) 32 46 95 151 147 133 137 15 85 108 13095th Queue (ft) 90 94 165 243 445 432 276 47 139 168 205Link Distance (ft) 284 139 1071 1071 1071 1085 1085 1085Upstream Blk Time (%) 7 0 0Queuing Penalty (veh) 0 0 0Storage Bay Dist (ft) 100 200 100Storage Blk Time (%) 1 2 6 2 5Queuing Penalty (veh) 1 1 47 3 1

Queuing and Blocking ReportFuture PM Peak Hour Conditions - Alternative 1 4/23/2015
Menlo Parl El Camino Real Corridor Study SimTraffic ReportW-Trans Page 2
Intersection: 3: El Camino Real & Middle Avenue
Movement EB EB WB NB NB NB NB SB SB SB SBDirections Served L TR LTR L T T TR L T T TRMaximum Queue (ft) 270 231 135 330 500 429 375 82 373 364 403Average Queue (ft) 217 141 72 292 290 224 187 44 253 260 29995th Queue (ft) 306 250 136 382 649 521 362 91 388 391 431Link Distance (ft) 250 250 210 1085 1085 1085 871 871 871Upstream Blk Time (%) 17 1Queuing Penalty (veh) 0 0Storage Bay Dist (ft) 270 75Storage Blk Time (%) 37 0 7 49Queuing Penalty (veh) 265 1 43 20
Intersection: 4: El Camino Real & Roble Avenue
Movement EB WB WB NB NB NB NB SB SB SB SBDirections Served LTR LT R L T T TR L T T TRMaximum Queue (ft) 126 100 77 136 300 320 354 115 146 166 190Average Queue (ft) 62 51 34 81 141 193 249 51 82 84 10395th Queue (ft) 123 104 81 155 251 344 410 105 158 160 186Link Distance (ft) 241 182 182 871 871 871 586 586 586Upstream Blk Time (%)Queuing Penalty (veh)Storage Bay Dist (ft) 200 119Storage Blk Time (%) 1 5 3 2Queuing Penalty (veh) 10 4 17 1

Queuing and Blocking ReportFuture PM Peak Hour Conditions - Alternative 1 4/23/2015
Menlo Parl El Camino Real Corridor Study SimTraffic ReportW-Trans Page 3
Intersection: 5: El Camino Real & Menlo Avenue/Ravenswood Avenue
Movement EB EB WB WB WB WB NB NB NB NB NB SBDirections Served LT TR L L T R L T T T R LMaximum Queue (ft) 340 260 245 346 376 170 368 514 509 570 325 287Average Queue (ft) 298 232 151 213 253 158 194 406 438 468 311 23695th Queue (ft) 373 301 238 333 428 203 374 573 594 653 384 337Link Distance (ft) 316 385 385 586 586 586Upstream Blk Time (%) 31 0 5 1 2 5Queuing Penalty (veh) 0 0 0 11 15 38Storage Bay Dist (ft) 225 275 135 319 300 240Storage Blk Time (%) 47 17 0 2 22 23 25 34 3 33Queuing Penalty (veh) 105 42 0 5 69 57 34 209 21 192
Intersection: 5: El Camino Real & Menlo Avenue/Ravenswood Avenue
Movement SB SB SBDirections Served T T TRMaximum Queue (ft) 316 274 275Average Queue (ft) 216 184 21195th Queue (ft) 383 284 301Link Distance (ft) 360 360 360Upstream Blk Time (%) 12 0Queuing Penalty (veh) 91 1Storage Bay Dist (ft)Storage Blk Time (%) 0Queuing Penalty (veh) 1
Intersection: 6: El Camino Real & Santa Cruz Ave
Movement EB EB EB WB WB NB NB NB SB SB SBDirections Served L T R L TR LT T TR T T TRMaximum Queue (ft) 188 310 188 102 168 333 348 383 188 210 250Average Queue (ft) 164 223 111 43 104 235 267 291 112 128 15595th Queue (ft) 235 404 203 112 194 334 364 394 217 213 259Link Distance (ft) 293 222 360 360 360 417 417 417Upstream Blk Time (%) 24 3 0 0 5Queuing Penalty (veh) 0 0 1 3 37Storage Bay Dist (ft) 140 140 150Storage Blk Time (%) 41 0 17 2 10Queuing Penalty (veh) 121 0 58 3 6

Queuing and Blocking ReportFuture PM Peak Hour Conditions - Alternative 1 4/23/2015
Menlo Parl El Camino Real Corridor Study SimTraffic ReportW-Trans Page 4
Intersection: 7: El Camino Real & Oak Grove Ave
Movement EB EB EB WB WB WB NB NB NB NB SB SBDirections Served L T R L T R L T T TR L TMaximum Queue (ft) 140 272 165 164 261 163 294 412 439 421 216 231Average Queue (ft) 130 265 107 110 161 104 139 346 355 369 167 12995th Queue (ft) 162 273 216 174 287 191 306 450 453 463 241 252Link Distance (ft) 248 246 417 417 417 989Upstream Blk Time (%) 71 5 6 5 10Queuing Penalty (veh) 0 0 54 40 88Storage Bay Dist (ft) 90 115 115 115 280 195Storage Blk Time (%) 63 45 12 20 5 41 13 0Queuing Penalty (veh) 269 150 38 47 16 46 86 1
Intersection: 7: El Camino Real & Oak Grove Ave
Movement SB SBDirections Served T TRMaximum Queue (ft) 213 199Average Queue (ft) 129 15895th Queue (ft) 213 229Link Distance (ft) 989 989Upstream Blk Time (%)Queuing Penalty (veh)Storage Bay Dist (ft)Storage Blk Time (%)Queuing Penalty (veh)

Queuing and Blocking ReportFuture PM Peak Hour Conditions - Alternative 1 4/23/2015
Menlo Parl El Camino Real Corridor Study SimTraffic ReportW-Trans Page 5
Intersection: 8: El Camino Real & Valparaiso Ave/Glenwood Ave
Movement EB EB EB WB WB NB NB NB NB SB SB SBDirections Served L LT R L TR L T T TR L T TMaximum Queue (ft) 180 408 180 164 246 224 944 968 974 230 1044 1033Average Queue (ft) 162 394 124 92 204 156 794 821 839 191 857 83895th Queue (ft) 239 409 249 179 301 281 1023 1050 1063 282 1164 1158Link Distance (ft) 374 227 989 989 989 1026 1026Upstream Blk Time (%) 74 17 0 0 1 4 3Queuing Penalty (veh) 0 0 2 2 12 29 22Storage Bay Dist (ft) 130 130 115 190 180Storage Blk Time (%) 3 75 0 3 38 7 58 36 57Queuing Penalty (veh) 16 253 0 10 40 54 82 213 70
Intersection: 8: El Camino Real & Valparaiso Ave/Glenwood Ave
Movement SBDirections Served TRMaximum Queue (ft) 995Average Queue (ft) 85595th Queue (ft) 1165Link Distance (ft) 1026Upstream Blk Time (%) 4Queuing Penalty (veh) 29Storage Bay Dist (ft)Storage Blk Time (%)Queuing Penalty (veh)
Intersection: 9: El Camino Real & Encinal Ave
Movement EB EB WB WB NB NB NB NB SB SB SB SBDirections Served LT R LT R L T T TR L T T TRMaximum Queue (ft) 53 42 213 100 47 75 80 100 166 466 405 323Average Queue (ft) 28 21 169 87 18 35 40 54 92 308 265 22095th Queue (ft) 69 53 250 125 48 75 75 96 187 486 433 346Link Distance (ft) 235 194 1026 1026 1026 638 638 638Upstream Blk Time (%) 14 0Queuing Penalty (veh) 0 0Storage Bay Dist (ft) 30 75 150 130Storage Blk Time (%) 28 9 40 7 2 30Queuing Penalty (veh) 4 3 82 12 15 20
Network SummaryNetwork wide Queuing Penalty: 4134

Queuing and Blocking ReportFuture AM Peak Hour Conditions - Alternative 2 4/23/2015
Menlo Parl El Camino Real Corridor Study SimTraffic ReportW-Trans Page 1
Intersection: 1: El Camino Real & Sand Hill Rd/Alma St
Movement EB EB EB WB WB NB NB NB NB NB SB SBDirections Served L L R T R L T T T R L TMaximum Queue (ft) 219 310 258 64 308 250 557 517 419 40 564 537Average Queue (ft) 119 207 180 9 210 247 542 301 139 6 377 26895th Queue (ft) 239 349 300 97 381 251 567 648 392 61 618 627Link Distance (ft) 348 329 329 525 525 525 1071Upstream Blk Time (%) 2 0 6 81 1Queuing Penalty (veh) 0 0 0 0 0Storage Bay Dist (ft) 235 235 190 100 535Storage Blk Time (%) 0 4 8 77 3 7 12 0Queuing Penalty (veh) 0 16 13 272 15 2 68 2
Intersection: 1: El Camino Real & Sand Hill Rd/Alma St
Movement SB SB SBDirections Served T T RMaximum Queue (ft) 527 488 265Average Queue (ft) 226 244 10395th Queue (ft) 479 528 278Link Distance (ft) 1071 1071Upstream Blk Time (%)Queuing Penalty (veh)Storage Bay Dist (ft) 240Storage Blk Time (%) 9 0Queuing Penalty (veh) 22 1
Intersection: 2: El Camino Real & Cambridge Avenue
Movement EB EB WB NB NB NB NB SB SB SB SBDirections Served LT R LTR L T T TR L T T TRMaximum Queue (ft) 53 77 43 164 289 320 330 86 137 114 124Average Queue (ft) 34 42 16 56 129 123 156 56 51 39 5695th Queue (ft) 61 87 46 157 293 295 331 102 139 111 135Link Distance (ft) 284 139 1071 1071 1071 1085 1085 1085Upstream Blk Time (%)Queuing Penalty (veh)Storage Bay Dist (ft) 100 200 100Storage Blk Time (%) 2 3 4 1Queuing Penalty (veh) 1 2 26 1

Queuing and Blocking ReportFuture AM Peak Hour Conditions - Alternative 2 4/23/2015
Menlo Parl El Camino Real Corridor Study SimTraffic ReportW-Trans Page 2
Intersection: 3: El Camino Real & Middle Avenue
Movement EB EB WB NB NB NB NB SB SB SB SBDirections Served L TR LTR L T T TR L T T TRMaximum Queue (ft) 221 252 90 264 277 306 359 83 227 229 274Average Queue (ft) 156 194 47 184 132 180 229 53 132 134 15595th Queue (ft) 246 300 91 289 281 330 374 95 238 235 281Link Distance (ft) 250 250 124 1085 1085 1085 871 871 871Upstream Blk Time (%) 3 5 0Queuing Penalty (veh) 0 0 0Storage Bay Dist (ft) 270 75Storage Blk Time (%) 4 2 8 13Queuing Penalty (veh) 23 4 47 8
Intersection: 4: El Camino Real & Roble Avenue
Movement EB WB WB NB NB NB NB SB SB SB SBDirections Served LTR LT R L T T TR L T T TRMaximum Queue (ft) 150 22 26 95 56 48 105 47 143 162 179Average Queue (ft) 83 6 6 35 18 13 32 18 79 73 8595th Queue (ft) 164 26 26 85 64 65 112 48 151 168 200Link Distance (ft) 241 170 170 871 871 871 586 586 586Upstream Blk Time (%)Queuing Penalty (veh)Storage Bay Dist (ft) 200 119Storage Blk Time (%) 1Queuing Penalty (veh) 1

Queuing and Blocking ReportFuture AM Peak Hour Conditions - Alternative 2 4/23/2015
Menlo Parl El Camino Real Corridor Study SimTraffic ReportW-Trans Page 3
Intersection: 5: El Camino Real & Menlo Avenue/Ravenswood Avenue
Movement EB EB WB WB WB WB NB NB NB NB NB SBDirections Served LT TR L L T R L T T T R LMaximum Queue (ft) 309 237 300 370 320 118 155 240 267 39 319 191Average Queue (ft) 224 171 202 255 178 26 82 125 149 19 187 10695th Queue (ft) 316 253 294 377 319 89 137 241 280 51 341 201Link Distance (ft) 316 385 385 586 586 586 586Upstream Blk Time (%) 1 2 0Queuing Penalty (veh) 0 0 0Storage Bay Dist (ft) 225 275 135 319 240Storage Blk Time (%) 8 0 0 7 20 0Queuing Penalty (veh) 19 1 1 18 9 0
Intersection: 5: El Camino Real & Menlo Avenue/Ravenswood Avenue
Movement SB SB SBDirections Served T T RMaximum Queue (ft) 231 246 41Average Queue (ft) 108 131 695th Queue (ft) 250 276 44Link Distance (ft) 359 359Upstream Blk Time (%) 0 0Queuing Penalty (veh) 0 2Storage Bay Dist (ft) 75Storage Blk Time (%) 2 20Queuing Penalty (veh) 3 2
Intersection: 6: El Camino Real & Santa Cruz Ave
Movement EB EB EB WB WB NB NB NB SB SB SBDirections Served L T R L TR T T R T T RMaximum Queue (ft) 156 140 98 79 104 130 139 31 186 185 100Average Queue (ft) 93 66 41 39 50 67 68 9 123 121 2295th Queue (ft) 159 141 100 84 103 139 145 31 186 187 88Link Distance (ft) 292 220 359 359 359 416 416Upstream Blk Time (%)Queuing Penalty (veh)Storage Bay Dist (ft) 140 140 150 100Storage Blk Time (%) 4 1 22Queuing Penalty (veh) 7 3 13

Queuing and Blocking ReportFuture AM Peak Hour Conditions - Alternative 2 4/23/2015
Menlo Parl El Camino Real Corridor Study SimTraffic ReportW-Trans Page 4
Intersection: 7: El Camino Real & Oak Grove Ave
Movement EB EB EB WB WB WB NB NB NB NB SB SBDirections Served L T R L T R L T T R L TMaximum Queue (ft) 98 201 99 164 264 165 137 155 168 67 98 74Average Queue (ft) 59 101 35 109 226 54 76 98 100 24 61 3995th Queue (ft) 106 193 103 198 306 163 146 161 169 71 107 75Link Distance (ft) 248 245 416 416 988Upstream Blk Time (%) 25Queuing Penalty (veh) 0Storage Bay Dist (ft) 90 115 115 115 280 115 195Storage Blk Time (%) 5 17 10 42 11Queuing Penalty (veh) 9 19 37 65 7
Intersection: 7: El Camino Real & Oak Grove Ave
Movement SB SBDirections Served T RMaximum Queue (ft) 86 18Average Queue (ft) 47 595th Queue (ft) 93 23Link Distance (ft) 988Upstream Blk Time (%)Queuing Penalty (veh)Storage Bay Dist (ft) 135Storage Blk Time (%) 0Queuing Penalty (veh) 0

Queuing and Blocking ReportFuture AM Peak Hour Conditions - Alternative 2 4/23/2015
Menlo Parl El Camino Real Corridor Study SimTraffic ReportW-Trans Page 5
Intersection: 8: El Camino Real & Valparaiso Ave/Glenwood Ave
Movement EB EB EB WB WB NB NB NB NB SB SB SBDirections Served L LT R L TR L T T R L T TMaximum Queue (ft) 180 412 180 164 256 223 407 416 155 229 1043 1046Average Queue (ft) 170 385 95 80 243 160 288 295 47 136 1032 103795th Queue (ft) 198 442 229 196 254 270 427 438 153 270 1045 1050Link Distance (ft) 374 226 988 988 1025 1025Upstream Blk Time (%) 47 74 14 19Queuing Penalty (veh) 0 0 139 182Storage Bay Dist (ft) 130 130 115 190 105 180Storage Blk Time (%) 5 72 0 73 11 34 52 4 61 60Queuing Penalty (veh) 22 166 0 43 57 38 25 26 74 267
Intersection: 8: El Camino Real & Valparaiso Ave/Glenwood Ave
Movement SBDirections Served RMaximum Queue (ft) 125Average Queue (ft) 11895th Queue (ft) 151Link Distance (ft)Upstream Blk Time (%)Queuing Penalty (veh)Storage Bay Dist (ft) 100Storage Blk Time (%) 9Queuing Penalty (veh) 64
Intersection: 9: El Camino Real & Encinal Ave
Movement EB EB WB WB NB NB NB NB SB SB SB SBDirections Served LT R LT R L T T R L T T RMaximum Queue (ft) 108 35 210 100 43 114 148 36 180 678 669 653Average Queue (ft) 45 8 136 54 18 78 94 14 176 658 658 64395th Queue (ft) 105 35 237 122 50 133 154 37 200 675 672 692Link Distance (ft) 234 193 1025 1025 638 638 638Upstream Blk Time (%) 15 57 74 28Queuing Penalty (veh) 0 0 0 0Storage Bay Dist (ft) 30 75 150 150 130Storage Blk Time (%) 21 0 36 2 0 1 38 47Queuing Penalty (veh) 2 0 35 3 0 1 344 135
Network SummaryNetwork wide Queuing Penalty: 2363

Queuing and Blocking ReportFuture PM Peak Hour Conditions - Alternative 2 4/23/2015
Menlo Parl El Camino Real Corridor Study SimTraffic ReportW-Trans Page 1
Intersection: 1: El Camino Real & Sand Hill Rd/Alma St
Movement EB EB EB WB WB NB NB NB NB NB SB SBDirections Served L L R T R L T T T R L TMaximum Queue (ft) 260 389 260 65 357 250 548 530 480 200 433 222Average Queue (ft) 253 363 244 9 301 230 489 414 340 103 264 10595th Queue (ft) 276 408 325 99 436 291 657 588 547 260 473 204Link Distance (ft) 348 329 329 525 525 525 1071Upstream Blk Time (%) 55 0 32 20 2 3Queuing Penalty (veh) 0 0 0 0 0 0Storage Bay Dist (ft) 235 235 190 100 535Storage Blk Time (%) 20 56 1 20 47 41 6 1Queuing Penalty (veh) 128 360 3 95 127 79 30 3
Intersection: 1: El Camino Real & Sand Hill Rd/Alma St
Movement SB SB SBDirections Served T T RMaximum Queue (ft) 262 301 260Average Queue (ft) 137 144 12995th Queue (ft) 250 265 253Link Distance (ft) 1071 1071Upstream Blk Time (%)Queuing Penalty (veh)Storage Bay Dist (ft) 240Storage Blk Time (%) 2 0Queuing Penalty (veh) 8 2
Intersection: 2: El Camino Real & Cambridge Avenue
Movement EB EB WB NB NB NB NB SB SB SB SBDirections Served LT R LTR L T T TR L T T TRMaximum Queue (ft) 48 82 151 238 515 510 482 45 124 157 203Average Queue (ft) 25 50 93 149 178 200 188 19 81 109 14895th Queue (ft) 58 93 162 234 510 629 492 48 146 178 216Link Distance (ft) 284 139 1071 1071 1071 1085 1085 1085Upstream Blk Time (%) 7 0 0 0Queuing Penalty (veh) 0 0 1 0Storage Bay Dist (ft) 100 200 100Storage Blk Time (%) 0 1 7 4 4Queuing Penalty (veh) 0 1 56 8 1

Queuing and Blocking ReportFuture PM Peak Hour Conditions - Alternative 2 4/23/2015
Menlo Parl El Camino Real Corridor Study SimTraffic ReportW-Trans Page 2
Intersection: 3: El Camino Real & Middle Avenue
Movement EB EB WB NB NB NB NB SB SB SB SBDirections Served L TR LTR L T T TR L T T TRMaximum Queue (ft) 265 223 122 336 340 295 268 75 241 275 286Average Queue (ft) 199 136 73 284 222 200 183 43 176 198 21795th Queue (ft) 301 239 130 380 504 408 277 82 281 302 341Link Distance (ft) 250 250 210 1085 1085 1085 871 871 871Upstream Blk Time (%) 11 0Queuing Penalty (veh) 0 0Storage Bay Dist (ft) 270 75Storage Blk Time (%) 28 6 42Queuing Penalty (veh) 187 36 17
Intersection: 4: El Camino Real & Roble Avenue
Movement EB WB WB NB NB NB NB SB SB SB SBDirections Served LTR LT R L T T TR L T T TRMaximum Queue (ft) 108 98 67 144 157 168 251 117 215 220 250Average Queue (ft) 56 47 31 77 109 116 154 67 137 145 17495th Queue (ft) 115 97 69 149 171 180 249 128 238 258 298Link Distance (ft) 241 182 182 871 871 871 586 586 586Upstream Blk Time (%)Queuing Penalty (veh)Storage Bay Dist (ft) 200 119Storage Blk Time (%) 0 4 9Queuing Penalty (veh) 0 27 6

Queuing and Blocking ReportFuture PM Peak Hour Conditions - Alternative 2 4/23/2015
Menlo Parl El Camino Real Corridor Study SimTraffic ReportW-Trans Page 3
Intersection: 5: El Camino Real & Menlo Avenue/Ravenswood Avenue
Movement EB EB WB WB WB WB NB NB NB NB NB SBDirections Served LT TR L L T R L T T T R LMaximum Queue (ft) 290 242 324 412 359 145 330 432 467 378 315 256Average Queue (ft) 225 173 292 367 233 53 177 289 312 180 221 18695th Queue (ft) 319 280 352 451 397 152 311 459 478 404 342 307Link Distance (ft) 316 385 385 586 586 586Upstream Blk Time (%) 2 14 2Queuing Penalty (veh) 0 0 0Storage Bay Dist (ft) 225 275 135 319 300 240Storage Blk Time (%) 8 2 2 33 25 11 0 4 15Queuing Penalty (veh) 22 3 7 112 20 19 1 18 98
Intersection: 5: El Camino Real & Menlo Avenue/Ravenswood Avenue
Movement SB SB SBDirections Served T T RMaximum Queue (ft) 301 306 64Average Queue (ft) 224 211 2295th Queue (ft) 358 323 85Link Distance (ft) 359 359Upstream Blk Time (%) 2 0Queuing Penalty (veh) 11 1Storage Bay Dist (ft) 75Storage Blk Time (%) 5 51 0Queuing Penalty (veh) 10 26 0
Intersection: 6: El Camino Real & Santa Cruz Ave
Movement EB EB EB WB WB NB NB NB SB SB SBDirections Served L T R L TR LT T R T T RMaximum Queue (ft) 178 278 176 162 209 217 209 59 155 157 76Average Queue (ft) 112 179 82 90 130 133 124 22 99 101 2295th Queue (ft) 199 312 172 183 218 231 217 61 165 171 77Link Distance (ft) 292 220 359 359 359 416 416Upstream Blk Time (%) 3 1 0Queuing Penalty (veh) 0 0 0Storage Bay Dist (ft) 140 140 150 100Storage Blk Time (%) 5 16 1 3 10 13Queuing Penalty (veh) 21 51 6 6 11 13

Queuing and Blocking ReportFuture PM Peak Hour Conditions - Alternative 2 4/23/2015
Menlo Parl El Camino Real Corridor Study SimTraffic ReportW-Trans Page 4
Intersection: 7: El Camino Real & Oak Grove Ave
Movement EB EB EB WB WB WB NB NB NB NB SB SBDirections Served L T R L T R L T T R L TMaximum Queue (ft) 140 282 165 145 264 165 222 327 355 165 244 526Average Queue (ft) 126 258 86 94 196 92 118 241 260 61 162 42695th Queue (ft) 171 310 209 170 299 190 249 370 389 177 273 566Link Distance (ft) 248 245 416 416 988Upstream Blk Time (%) 53 9 0 0Queuing Penalty (veh) 0 0 1 0Storage Bay Dist (ft) 90 115 115 115 280 115 195Storage Blk Time (%) 61 40 0 8 27 2 9 50 1 25Queuing Penalty (veh) 262 115 1 29 56 7 8 48 5 37
Intersection: 7: El Camino Real & Oak Grove Ave
Movement SB SBDirections Served T RMaximum Queue (ft) 514 185Average Queue (ft) 436 11095th Queue (ft) 564 245Link Distance (ft) 988Upstream Blk Time (%)Queuing Penalty (veh)Storage Bay Dist (ft) 135Storage Blk Time (%) 32Queuing Penalty (veh) 49

Queuing and Blocking ReportFuture PM Peak Hour Conditions - Alternative 2 4/23/2015
Menlo Parl El Camino Real Corridor Study SimTraffic ReportW-Trans Page 5
Intersection: 8: El Camino Real & Valparaiso Ave/Glenwood Ave
Movement EB EB EB WB WB NB NB NB NB SB SB SBDirections Served L LT R L TR L T T R L T TMaximum Queue (ft) 180 402 180 164 238 239 973 971 127 218 603 659Average Queue (ft) 159 391 117 56 179 162 785 801 15 135 316 38095th Queue (ft) 231 401 244 153 282 283 1186 1190 87 221 688 765Link Distance (ft) 374 226 988 988 1025 1025Upstream Blk Time (%) 75 11 3 3 0Queuing Penalty (veh) 0 0 22 25 1Storage Bay Dist (ft) 130 130 115 190 105 180Storage Blk Time (%) 5 75 30 4 46 53 8 22 44Queuing Penalty (veh) 29 228 15 26 61 14 42 31 168
Intersection: 8: El Camino Real & Valparaiso Ave/Glenwood Ave
Movement SBDirections Served RMaximum Queue (ft) 125Average Queue (ft) 10195th Queue (ft) 167Link Distance (ft)Upstream Blk Time (%)Queuing Penalty (veh)Storage Bay Dist (ft) 100Storage Blk Time (%) 1Queuing Penalty (veh) 3
Intersection: 9: El Camino Real & Encinal Ave
Movement EB EB WB WB NB NB NB NB SB SB SB SBDirections Served LT R LT R L T T R L T T RMaximum Queue (ft) 82 51 205 100 120 380 410 199 180 672 661 14Average Queue (ft) 36 16 122 77 40 242 252 85 178 658 653 295th Queue (ft) 84 50 236 121 116 394 424 223 183 676 664 16Link Distance (ft) 234 193 1025 1025 638 638Upstream Blk Time (%) 7 59 20Queuing Penalty (veh) 0 0 0Storage Bay Dist (ft) 30 75 150 150 130 100Storage Blk Time (%) 17 1 14 18 30 29 69 2 16Queuing Penalty (veh) 2 0 31 17 11 57 605 7 3
Network SummaryNetwork wide Queuing Penalty: 3655

Queuing and Blocking ReportFuture AM Peak Hour Conditions - Alternative 3 4/23/2015
Menlo Parl El Camino Real Corridor Study SimTraffic ReportW-Trans Page 1
Intersection: 1: El Camino Real & Sand Hill Rd/Alma St
Movement EB EB EB WB NB NB NB NB NB SB SB SBDirections Served L L R R L T T T R L T TMaximum Queue (ft) 188 324 247 348 250 544 526 430 80 601 608 534Average Queue (ft) 124 190 161 193 247 535 398 181 17 453 234 23695th Queue (ft) 227 349 290 388 254 562 698 471 109 692 589 510Link Distance (ft) 348 329 525 525 525 1071 1071Upstream Blk Time (%) 4 8 75 10 0Queuing Penalty (veh) 0 0 0 0 0Storage Bay Dist (ft) 235 235 190 100 535Storage Blk Time (%) 0 4 9 77 3 11 17Queuing Penalty (veh) 0 17 15 263 14 3 94
Intersection: 1: El Camino Real & Sand Hill Rd/Alma St
Movement SB SBDirections Served T RMaximum Queue (ft) 425 265Average Queue (ft) 222 9695th Queue (ft) 447 263Link Distance (ft) 1071Upstream Blk Time (%)Queuing Penalty (veh)Storage Bay Dist (ft) 240Storage Blk Time (%) 6 0Queuing Penalty (veh) 15 0
Intersection: 2: El Camino Real & Cambridge Avenue
Movement EB EB WB NB NB NB NB SB SB SB SBDirections Served LT R LTR L T T TR L T T TRMaximum Queue (ft) 84 91 44 91 449 329 372 104 92 101 122Average Queue (ft) 40 39 20 50 195 188 209 62 48 55 7995th Queue (ft) 89 91 51 98 463 346 380 112 95 112 142Link Distance (ft) 284 139 1071 1071 1071 1085 1085 1085Upstream Blk Time (%)Queuing Penalty (veh)Storage Bay Dist (ft) 100 200 100Storage Blk Time (%) 0 1 6 6 0Queuing Penalty (veh) 0 0 4 39 0

Queuing and Blocking ReportFuture AM Peak Hour Conditions - Alternative 3 4/23/2015
Menlo Parl El Camino Real Corridor Study SimTraffic ReportW-Trans Page 2
Intersection: 3: El Camino Real & Middle Avenue
Movement EB EB WB NB NB NB NB SB SB SB SBDirections Served L TR LTR L T T TR L T T TRMaximum Queue (ft) 232 269 93 268 365 344 359 77 166 153 179Average Queue (ft) 149 206 48 176 201 202 213 49 72 69 9195th Queue (ft) 256 314 97 298 385 373 378 86 180 160 202Link Distance (ft) 250 250 124 1085 1085 1085 871 871 871Upstream Blk Time (%) 3 16 0Queuing Penalty (veh) 0 0 0Storage Bay Dist (ft) 270 75Storage Blk Time (%) 4 3 5 8Queuing Penalty (veh) 20 7 31 5
Intersection: 4: El Camino Real & Roble Avenue
Movement EB WB WB NB NB NB NB SB SB SB SBDirections Served LTR LT R L T T TR L T T TRMaximum Queue (ft) 138 39 31 77 66 61 116 67 156 176 206Average Queue (ft) 84 12 8 38 26 21 38 31 118 114 14395th Queue (ft) 160 39 30 75 87 80 138 72 188 192 241Link Distance (ft) 241 182 182 871 871 871 586 586 586Upstream Blk Time (%) 0Queuing Penalty (veh) 0Storage Bay Dist (ft) 200 119Storage Blk Time (%) 5Queuing Penalty (veh) 2

Queuing and Blocking ReportFuture AM Peak Hour Conditions - Alternative 3 4/23/2015
Menlo Parl El Camino Real Corridor Study SimTraffic ReportW-Trans Page 3
Intersection: 5: El Camino Real & Menlo Avenue/Ravenswood Avenue
Movement EB EB WB WB WB WB NB NB NB NB SB SBDirections Served LT TR L L T R L T T R L TMaximum Queue (ft) 278 217 295 362 303 108 167 279 279 409 159 224Average Queue (ft) 219 165 218 276 174 19 112 159 163 236 124 11495th Queue (ft) 311 248 306 369 292 66 196 281 286 448 189 220Link Distance (ft) 316 397 397 586 586 586 358Upstream Blk Time (%) 1 0Queuing Penalty (veh) 0 0Storage Bay Dist (ft) 225 275 135 319 240Storage Blk Time (%) 11 1 0 7 25 1 0Queuing Penalty (veh) 23 2 1 19 12 1 1
Intersection: 5: El Camino Real & Menlo Avenue/Ravenswood Avenue
Movement SBDirections Served TRMaximum Queue (ft) 222Average Queue (ft) 12495th Queue (ft) 232Link Distance (ft) 358Upstream Blk Time (%)Queuing Penalty (veh)Storage Bay Dist (ft)Storage Blk Time (%)Queuing Penalty (veh)
Intersection: 6: El Camino Real & Santa Cruz Ave
Movement EB EB EB WB WB NB NB SB SBDirections Served L T R L TR T TR T TRMaximum Queue (ft) 154 123 75 84 108 121 142 148 160Average Queue (ft) 89 60 40 42 57 69 72 90 9595th Queue (ft) 158 128 81 92 112 144 155 165 172Link Distance (ft) 305 234 358 358 416 416Upstream Blk Time (%)Queuing Penalty (veh)Storage Bay Dist (ft) 140 140 150Storage Blk Time (%) 3 0 0Queuing Penalty (veh) 6 0 0

Queuing and Blocking ReportFuture AM Peak Hour Conditions - Alternative 3 4/23/2015
Menlo Parl El Camino Real Corridor Study SimTraffic ReportW-Trans Page 4
Intersection: 7: El Camino Real & Oak Grove Ave
Movement EB EB EB WB WB WB NB NB NB SB SB SBDirections Served L T R L T R L T TR L T TRMaximum Queue (ft) 114 174 98 165 285 165 123 191 208 113 84 96Average Queue (ft) 59 97 35 112 233 83 80 122 127 70 40 5495th Queue (ft) 117 192 98 200 312 204 129 202 207 127 97 110Link Distance (ft) 261 258 416 416 988 988Upstream Blk Time (%) 0 16Queuing Penalty (veh) 0 0Storage Bay Dist (ft) 90 115 115 115 280 195Storage Blk Time (%) 6 16 14 47 0Queuing Penalty (veh) 11 18 51 72 0
Intersection: 8: El Camino Real & Valparaiso Ave/Glenwood Ave
Movement EB EB EB WB WB NB NB NB SB SB SBDirections Served L LT R L TR L T TR L T TRMaximum Queue (ft) 180 417 180 164 267 232 428 426 230 1053 1052Average Queue (ft) 169 388 86 69 257 188 306 302 150 1039 103995th Queue (ft) 221 462 222 183 269 276 470 465 275 1055 1053Link Distance (ft) 386 239 988 988 1026 1026Upstream Blk Time (%) 37 77 27 34Queuing Penalty (veh) 0 0 259 318Storage Bay Dist (ft) 130 130 115 190 180Storage Blk Time (%) 3 67 76 38 28 6 63Queuing Penalty (veh) 13 156 45 185 31 43 77
Intersection: 9: El Camino Real & Encinal Ave
Movement EB EB WB WB NB NB NB SB SB SB SBDirections Served LT R LT R L T TR L T T RMaximum Queue (ft) 78 40 221 100 20 148 184 180 675 673 665Average Queue (ft) 40 9 210 67 6 88 115 177 658 656 63295th Queue (ft) 80 38 249 143 23 149 184 192 677 668 806Link Distance (ft) 234 206 1026 1026 638 638 638Upstream Blk Time (%) 74 72 79 29Queuing Penalty (veh) 0 0 0 0Storage Bay Dist (ft) 30 75 150 130Storage Blk Time (%) 19 2 87 1 0 40 55Queuing Penalty (veh) 2 1 86 1 0 345 157
Network SummaryNetwork wide Queuing Penalty: 2465

Queuing and Blocking ReportFuture PM Peak Hour Conditions - Alternative 3 4/23/2015
Menlo Parl El Camino Real Corridor Study SimTraffic ReportW-Trans Page 1
Intersection: 1: El Camino Real & Sand Hill Rd/Alma St
Movement EB EB EB WB WB NB NB NB NB NB SB SBDirections Served L L R T R L T T T R L TMaximum Queue (ft) 260 372 260 64 355 250 544 531 459 200 402 224Average Queue (ft) 248 350 232 9 286 238 499 461 350 101 253 9995th Queue (ft) 287 412 339 97 421 288 623 620 549 259 429 238Link Distance (ft) 348 329 329 525 525 525 1071Upstream Blk Time (%) 53 0 17 31 6 3Queuing Penalty (veh) 0 0 0 0 0 0Storage Bay Dist (ft) 235 235 190 100 535Storage Blk Time (%) 20 56 1 23 48 38 3Queuing Penalty (veh) 131 360 3 108 128 73 16
Intersection: 1: El Camino Real & Sand Hill Rd/Alma St
Movement SB SB SBDirections Served T T RMaximum Queue (ft) 236 266 251Average Queue (ft) 126 155 11895th Queue (ft) 258 307 269Link Distance (ft) 1071 1071Upstream Blk Time (%)Queuing Penalty (veh)Storage Bay Dist (ft) 240Storage Blk Time (%) 2 1Queuing Penalty (veh) 6 3
Intersection: 2: El Camino Real & Cambridge Avenue
Movement EB EB WB NB NB NB NB SB SB SB SBDirections Served LT R LTR L T T TR L T T TRMaximum Queue (ft) 66 78 146 238 443 481 459 51 145 181 212Average Queue (ft) 32 41 92 162 181 169 184 19 90 113 14095th Queue (ft) 69 77 165 253 458 486 474 53 154 194 231Link Distance (ft) 284 139 1071 1071 1071 1085 1085 1085Upstream Blk Time (%) 8 0 0Queuing Penalty (veh) 0 1 0Storage Bay Dist (ft) 100 200 100Storage Blk Time (%) 1 0 5 3 5Queuing Penalty (veh) 0 0 34 5 1

Queuing and Blocking ReportFuture PM Peak Hour Conditions - Alternative 3 4/23/2015
Menlo Parl El Camino Real Corridor Study SimTraffic ReportW-Trans Page 2
Intersection: 3: El Camino Real & Middle Avenue
Movement EB EB WB NB NB NB NB SB SB SB SBDirections Served L TR LTR L T T TR L T T TRMaximum Queue (ft) 268 257 150 344 458 317 256 63 279 276 323Average Queue (ft) 202 157 80 286 230 161 137 33 170 177 19395th Queue (ft) 292 276 143 383 468 306 246 71 279 288 318Link Distance (ft) 250 250 210 1085 1085 1085 871 871 871Upstream Blk Time (%) 11 5 0Queuing Penalty (veh) 0 0 0Storage Bay Dist (ft) 270 75Storage Blk Time (%) 29 0 2 47Queuing Penalty (veh) 194 1 10 19
Intersection: 4: El Camino Real & Roble Avenue
Movement EB WB WB NB NB NB NB SB SB SB SBDirections Served LTR LT R L T T TR L T T TRMaximum Queue (ft) 101 97 79 152 318 325 334 149 202 228 262Average Queue (ft) 59 54 38 99 222 238 217 69 131 150 17695th Queue (ft) 106 101 88 209 422 419 408 147 217 248 297Link Distance (ft) 241 182 182 871 871 871 586 586 586Upstream Blk Time (%)Queuing Penalty (veh)Storage Bay Dist (ft) 200 119Storage Blk Time (%) 20 5 9Queuing Penalty (veh) 16 29 6

Queuing and Blocking ReportFuture PM Peak Hour Conditions - Alternative 3 4/23/2015
Menlo Parl El Camino Real Corridor Study SimTraffic ReportW-Trans Page 3
Intersection: 5: El Camino Real & Menlo Avenue/Ravenswood Avenue
Movement EB EB WB WB WB WB NB NB NB NB SB SBDirections Served LT TR L L T R L T T R L TMaximum Queue (ft) 329 275 318 410 380 132 368 601 604 491 219 273Average Queue (ft) 249 206 266 339 234 54 264 523 533 334 158 17995th Queue (ft) 362 310 369 462 427 154 437 709 695 628 259 291Link Distance (ft) 316 397 397 586 586 586 358Upstream Blk Time (%) 4 11 2 7 10 3 0Queuing Penalty (veh) 0 0 0 53 72 22 1Storage Bay Dist (ft) 225 275 135 319 240Storage Blk Time (%) 20 6 3 31 23 47 7 1Queuing Penalty (veh) 57 11 10 104 19 76 43 2
Intersection: 5: El Camino Real & Menlo Avenue/Ravenswood Avenue
Movement SBDirections Served TRMaximum Queue (ft) 282Average Queue (ft) 18795th Queue (ft) 279Link Distance (ft) 358Upstream Blk Time (%)Queuing Penalty (veh)Storage Bay Dist (ft)Storage Blk Time (%)Queuing Penalty (veh)
Intersection: 6: El Camino Real & Santa Cruz Ave
Movement EB EB EB WB WB NB NB SB SBDirections Served L T R L TR T TR T TRMaximum Queue (ft) 178 280 170 162 201 223 244 132 150Average Queue (ft) 127 181 92 95 146 186 198 98 10295th Queue (ft) 204 301 197 170 234 228 250 142 153Link Distance (ft) 305 234 358 358 416 416Upstream Blk Time (%) 1 3Queuing Penalty (veh) 0 0Storage Bay Dist (ft) 140 140 150Storage Blk Time (%) 11 16 1 0 15Queuing Penalty (veh) 44 54 3 1 16

Queuing and Blocking ReportFuture PM Peak Hour Conditions - Alternative 3 4/23/2015
Menlo Parl El Camino Real Corridor Study SimTraffic ReportW-Trans Page 4
Intersection: 7: El Camino Real & Oak Grove Ave
Movement EB EB EB WB WB WB NB NB NB SB SB SBDirections Served L T R L T R L T TR L T TRMaximum Queue (ft) 140 276 165 163 274 165 122 296 294 244 504 515Average Queue (ft) 126 266 95 115 215 100 82 203 217 149 412 42595th Queue (ft) 164 318 206 187 313 210 138 295 303 285 547 556Link Distance (ft) 261 258 416 416 988 988Upstream Blk Time (%) 51 12 0 0Queuing Penalty (veh) 0 0 0 3Storage Bay Dist (ft) 90 115 115 115 280 195Storage Blk Time (%) 58 43 14 40 3 3 24Queuing Penalty (veh) 248 123 49 82 2 16 35
Intersection: 8: El Camino Real & Valparaiso Ave/Glenwood Ave
Movement EB EB EB WB WB NB NB NB SB SB SBDirections Served L LT R L TR L T TR L T TRMaximum Queue (ft) 180 405 180 146 258 240 903 905 220 756 776Average Queue (ft) 164 392 134 73 226 168 727 739 174 463 50395th Queue (ft) 230 442 249 172 293 273 977 988 264 812 851Link Distance (ft) 386 239 988 988 1026 1026Upstream Blk Time (%) 63 19 1 0 0 0Queuing Penalty (veh) 0 0 4 3 2 2Storage Bay Dist (ft) 130 130 115 190 180Storage Blk Time (%) 10 72 0 47 9 46 12 44Queuing Penalty (veh) 51 218 1 24 63 62 62 62
Intersection: 9: El Camino Real & Encinal Ave
Movement EB EB WB WB NB NB NB SB SB SB SBDirections Served LT R LT R L T TR L T T RMaximum Queue (ft) 57 42 216 100 65 339 360 180 686 666 664Average Queue (ft) 29 15 122 87 28 249 272 178 658 653 44895th Queue (ft) 60 48 243 120 64 364 393 183 678 674 944Link Distance (ft) 234 206 1026 1026 638 638 638Upstream Blk Time (%) 4 60 41 10Queuing Penalty (veh) 0 0 0 0Storage Bay Dist (ft) 30 75 150 130Storage Blk Time (%) 11 4 12 25 35 68 3Queuing Penalty (veh) 2 2 27 23 13 592 10
Network SummaryNetwork wide Queuing Penalty: 3510

GEl Camino Real Corridor Study
A p p E n d i x G
Input Received at Third Workshop


Additional Public Comment Received at February 2015 Workshop
The alternative that the participants responded most favorably to was Alternative 3 (Separated Bike Lanes). The respondents highly agreed that the widening on El Camino Real approaching Ravenswood is acceptable. They also felt strongly about parking, as a large number of participants responded that the amount of on-street parking along El Camino Real is acceptable and the loss of parking to accommodate a bike lane is acceptable. For bicycle facilities, 22 out of 33 participants felt that a separated bicycle facility on El Camino Real is acceptable.
For the four different alternatives, almost all of the respondents agreed that existing transit access is acceptable. Respondents also felt that the opportunity for aesthetic improvements is acceptable for each alternative.
For the “Do Nothing” Alternative, the existing pedestrian experience on the El Camino Real Corridor is unacceptable with 15 out of the 24 respondents disagreeing that the existing crossing opportunities and delay for pedestrians are acceptable.
For Alternative 1 (Continuous 6 Lanes) on El Camino Real, the survey participants disagreed that the bicycle facilities and pedestrian experience is acceptable, but they agreed that the vehicle travel experience is acceptable.
For Alternative 2 (Buffered Bike Lanes), 19 out of 29 participants agreed that the addition of bike lanes (with a striped buffer) on El Camino Real is acceptable. For pedestrian experience, 21 out of 22 people agreed that the sidewalk location adjacent to the bike lanes and added crossings opportunities are acceptable. Also, all 20 respondents on parking agreed that the loss of parking to accommodate a bike lane is acceptable.
For Alternative 3 (Separated Bike Lanes), 23 out of 28 participants agreed that the widening of ECR approaching Ravenswood is acceptable. For pedestrian experience, 22 out of 24 participants agreed that the sidewalk location adjacent to the bike lanes and added crossings opportunities are acceptable. For parking, 25 out of 31 participants agreed that the loss of parking to accommodate a separated bike facility is acceptable. 18 out of 20 participants agreed that the opportunity for aesthetic improvements is acceptable.

Table 1
El Camino Real Corridor – Do Nothing
Agree Disagree
1. Vehicle Travel Experience – The existing vehicle lane alignment and vehicle delay are acceptable. 8 9
2. Bicycle Facilities – The absence of bicycle lanes on El Camino Real is acceptable. 10 11
3. Pedestrian Experience – The existing crossing opportunities and delay for pedestrians are acceptable. 9 15
4. Transit Access – Existing transit access is acceptable. 13 1
5. Parking – The amount of on-street parking along El Camino Real is acceptable. 8 4
6. Aesthetics – The opportunity for aesthetic improvements is acceptable. 8 3
Table 2 El Camino Real Corridor –
Alternative 1 Continuous 6 Lanes
Agree Disagree
1. Vehicle Travel Experience – The continuous six lane alignment and resulting vehicle delay is acceptable. 9 8
2. Widening on El Camino Real at Ravenswood – The widening of ECR approaching Ravenswood is acceptable. 15 8
3. Bicycle Facilities – The absence of bicycle lanes on El Camino Real and designation of a parallel route is acceptable. 14 15
4. Pedestrian Experience – The sidewalk location adjacent to the travel lane and added crossings opportunities are acceptable. 13 14
5. Transit Access – Transit access is acceptable. 15 2
6. Parking – The loss of parking to accommodate travel lane north of Roble Avenue is acceptable. 21 4
7. Aesthetics – The opportunity for aesthetic improvements is acceptable. 12 8

Table 3 El Camino Real Corridor –
Alternative 2 Buffered Bike Lanes
Agree Disagree
1. Vehicle Travel Experience – The vehicle lane alignment and resulting vehicle delay is acceptable. 20 8
2. Widening on El Camino Real at Ravenswood – The widening of ECR approaching Ravenswood is acceptable. 14 3
3. Bicycle Facilities – The addition of bike lanes (with a striped buffer) on El Camino Real is acceptable. 19 10
4. Right-turn Lane Mixing Zones – The short right-turn pockets mixing with the bike lane at intersections are acceptable. 13 9
5. Pedestrian Experience – The sidewalk location adjacent to the bike lanes and added crossings opportunities are acceptable. 21 1
6. Transit Access – Transit access is acceptable. 14 0
7. Parking – The loss of parking to accommodate a bike lane is acceptable. 20 0
8. Aesthetics – The opportunity for aesthetic improvements is acceptable. 15 1
Table 4 El Camino Real Corridor –
Alternative 3 Separated Bicycle Facility
Agree Disagree
1. Vehicle Travel Experience – The vehicle lane alignment and resulting vehicle delay is acceptable. 22 13
2. Widening on El Camino Real at Ravenswood – The widening of ECR approaching Ravenswood is acceptable. 23 5
3. Bicycle Facilities – The separated bicycle facility on El Camino Real is acceptable. 22 11
4. Protected Intersection Design – The bicycle and pedestrian crossings at intersections are acceptable. 16 14
5. Pedestrian Experience – The sidewalk location adjacent to the bike lanes and added crossings opportunities are acceptable. 22 2
6. Transit Access – Transit access is acceptable. 14 0
7. Parking – The loss of parking to accommodate a separated bike facility is acceptable. 25 6
8. Aesthetics – The opportunity for aesthetic improvements is acceptable. 18 2