EG Group 2020 Annual Report and Financial Statements
173
2020 ANNUAL REPORT AND FINANCIAL STATEMENTS
-
Upload
khangminh22 -
Category
Documents
-
view
0 -
download
0
Transcript of EG Group 2020 Annual Report and Financial Statements
2020 ANNUAL REPORT AND
FINANCIAL STATEMENTS

OUR PURPOSE
To deliver a modern and compelling retail experience that allows customers to achieve multiple missions in one convenient location.
We are a leading global independent convenience retailer with a diversified portfolio of over 6,000 sites(1) across three continents.
OUR VALUES
Awareness and commercial
responsiveness to consumer trends and
demands
Committed to infrastructure, people and
system investment to build a sustainable
business model
Support local communities with a view
to empowering individuals to grow,
contribute and succeed
Delivering value and results consistently
to stakeholders
(1) Sites refers to the total standalone forecourts, foodservice outlets and convenience stores owned and operated by EG (‘COCO’ sites), those operated by a third party (‘CONCO’ sites) and those owned and operated by a third party (‘OTHER’ sites)
EG Group | 2020 Annual Report and Financial Statements
STRATEGIC REPORT GOVERNANCE FINANCIALS
1
CONTENTS
STRATEGIC REPORT
Who we are 2
Highlights and KPIs 3
Chairman’s statement 4
Co-Chief Executive Officers’ statement 5
At a glance 6
Our response to COVID-19 8
Our journey so far 12
Our business model 14
Our business model in action 16
Our stakeholders and Section 172 20
Our strategy 22
Operating review 32
Environmental, social and governance 47
Principal risks and uncertainties 58
Financial review 66
GOVERNANCE
Board of Directors 72
Governance 74
Audit & Risk Committee 82
Remuneration Committee 84
Nomination Committee 85
Directors’ report 86
Directors’ responsibilities statement 88
FINANCIALS
Independent auditor’s report 89
Consolidated income statement 92
Consolidated statement of comprehensive income 92
Consolidated balance sheet 93
Consolidated statement of changes in equity 94
Consolidated cash flow statement 95
Notes to the consolidated financial statements 96
Company balance sheet 160
Company statement of changes in equity 161
Notes to the Company financial statements 162
OTHER INFORMATION
Alternative Performance Measures 164Find out more atwww.eurogarages.com
2 EG Group | 2020 Annual Report and Financial Statements
WHO WE ARE
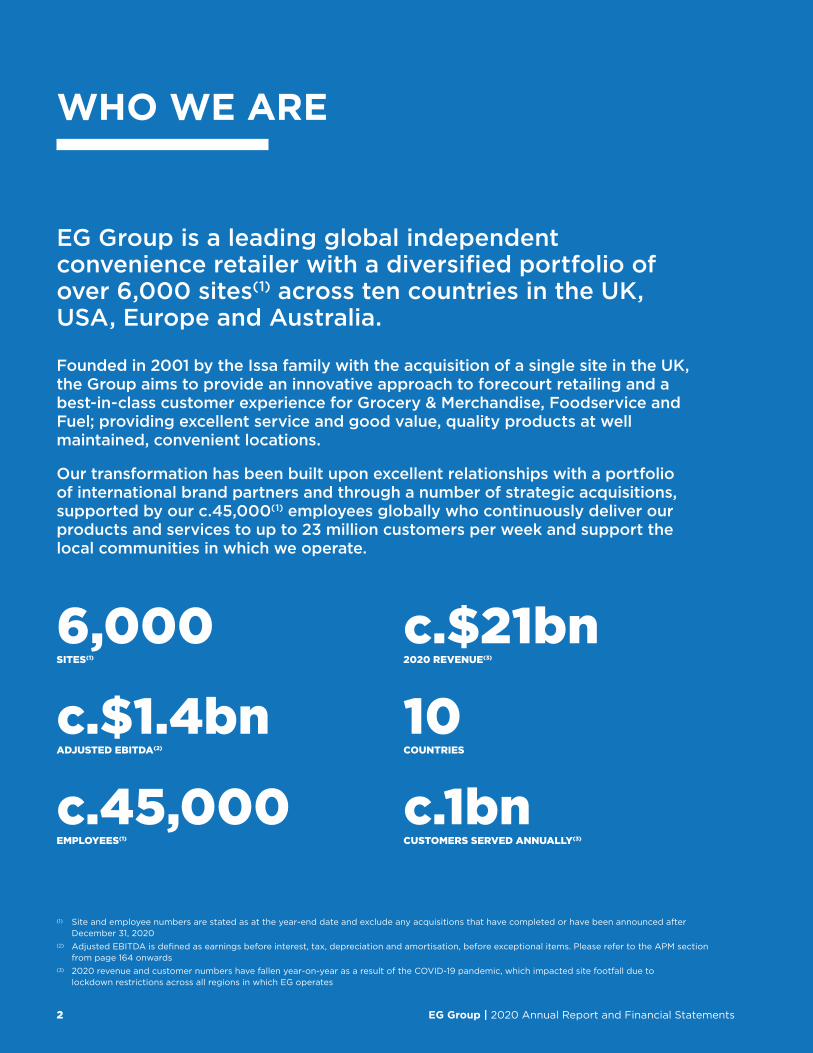
6,000SITES(1)
c.$21bn2020 REVENUE(3)
c.$1.4bn ADJUSTED EBITDA(2)
10COUNTRIES
c.45,000 EMPLOYEES(1)
c.1bnCUSTOMERS SERVED ANNUALLY(3)
EG Group is a leading global independent convenience retailer with a diversified portfolio of over 6,000 sites(1) across ten countries in the UK, USA, Europe and Australia.
Founded in 2001 by the Issa family with the acquisition of a single site in the UK, the Group aims to provide an innovative approach to forecourt retailing and a best-in-class customer experience for Grocery & Merchandise, Foodservice and Fuel; providing excellent service and good value, quality products at well maintained, convenient locations.
Our transformation has been built upon excellent relationships with a portfolio of international brand partners and through a number of strategic acquisitions, supported by our c.45,000(1) employees globally who continuously deliver our products and services to up to 23 million customers per week and support the local communities in which we operate.
(1) Site and employee numbers are stated as at the year-end date and exclude any acquisitions that have completed or have been announced after December 31, 2020
(2) Adjusted EBITDA is defined as earnings before interest, tax, depreciation and amortisation, before exceptional items. Please refer to the APM section from page 164 onwards
(3) 2020 revenue and customer numbers have fallen year-on-year as a result of the COVID-19 pandemic, which impacted site footfall due to lockdown restrictions across all regions in which EG operates
STRATEGIC REPORT GOVERNANCE FINANCIALS
3EG Group | 2020 Annual Report and Financial Statements
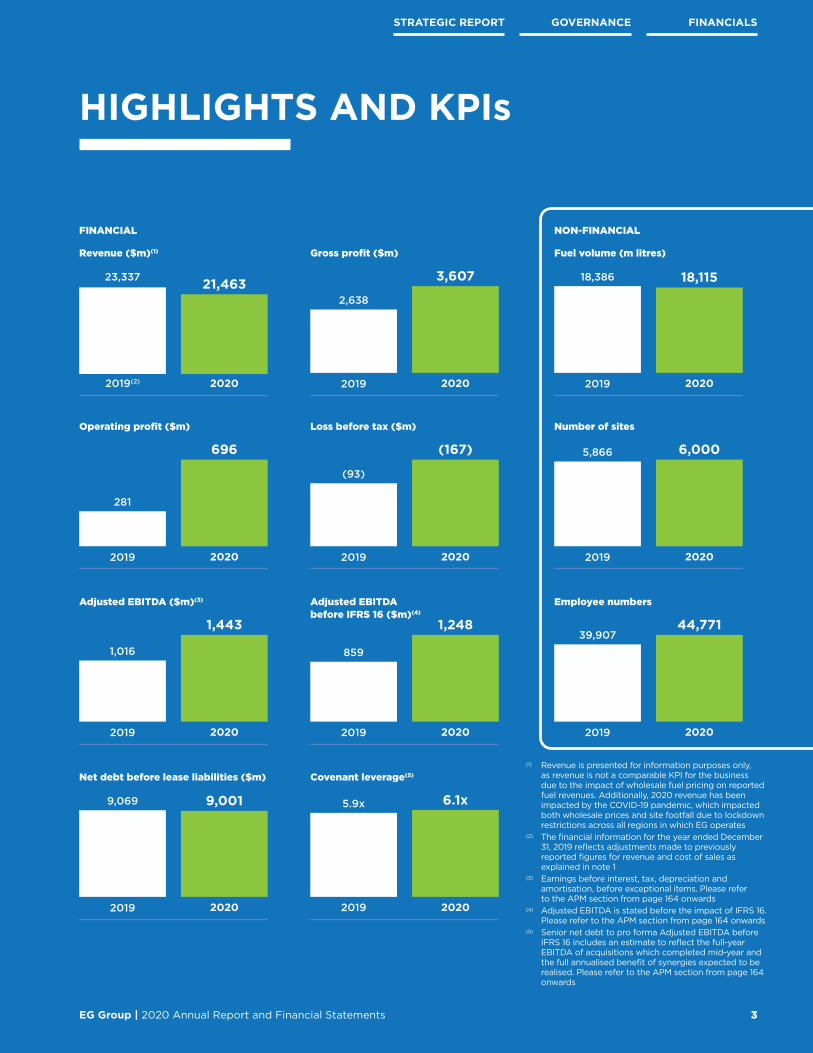
HIGHLIGHTS AND KPIs
(1) Revenue is presented for information purposes only, as revenue is not a comparable KPI for the business due to the impact of wholesale fuel pricing on reported fuel revenues. Additionally, 2020 revenue has been impacted by the COVID-19 pandemic, which impacted both wholesale prices and site footfall due to lockdown restrictions across all regions in which EG operates
(2) The financial information for the year ended December 31, 2019 reflects adjustments made to previously reported figures for revenue and cost of sales as explained in note 1
(3) Earnings before interest, tax, depreciation and amortisation, before exceptional items. Please refer to the APM section from page 164 onwards
(4) Adjusted EBITDA is stated before the impact of IFRS 16. Please refer to the APM section from page 164 onwards
(5) Senior net debt to pro forma Adjusted EBITDA before IFRS 16 includes an estimate to reflect the full-year EBITDA of acquisitions which completed mid-year and the full annualised benefit of synergies expected to be realised. Please refer to the APM section from page 164 onwards
FINANCIAL NON-FINANCIAL
Revenue ($m)(1)
Operating profit ($m) Loss before tax ($m)
Adjusted EBITDA ($m)(3)
Net debt before lease liabilities ($m) Covenant leverage(5)
Adjusted EBITDA before IFRS 16 ($m)(4)
Gross profit ($m) Fuel volume (m litres)
Number of sites
Employee numbers
2019(2)
2019 2019
2019
2019 2019
2019
2019 2019
2019
2019
23,337
281
(93)
1,016
9,069 5.9x
859
2,638
18,386
5,866
39,907
2020
2020 2020
2020
2020 2020
2020
2020 2020
2020
2020
21,463
696 (167)
1,443
9,001 6.1x
1,248
3,607 18,115
6,000
44,771
4 EG Group | 2020 Annual Report and Financial Statements
I was appointed EG Group Chairman in January 2021 following the Board appointments of John Carey in November 2020 and later Dame Alison Carnwath in March 2021. In addition to their Non‑Executive Director roles, Alison and John also chair the Audit & Risk and Remuneration Committees respectively. I chair the Nomination Committee.
I would like to express my thanks to Mohsin and Zuber, the Executive Management Team and all of our colleagues at EG Group for the warm welcome and support they have shown us all following our recent appointments.
BOARD AND GOVERNANCEWe have met a wide number of the EG management team as part of our induction. Additionally, a number of Strategy and ‘Teach-in’ sessions were arranged to bring the whole Board up to speed with all aspects of our business, the markets in which we operate, and a review of future opportunities and risks. During 2020 and throughout 2021, the Group has committed to enhancing its governance processes. In line with governance best practice, the Board has established an Audit & Risk, Remuneration and Nomination Committee, each chaired by a Non-Executive Director. The Directors maintain open, constructive and regular dialogue to ensure decisions are appropriately challenged and avoid group thinking or dominance. Further details regarding the Board and its Committees can be found on pages 72 to 85.
Risk management and internal controls remains a key area of focus for the Board. Further information relating to our principal risks and mitigations can be found on pages 60 to 65.
REVIEW OF 2020 AND COVID‑19Despite the global challenge of COVID-19, 2020 was a successful year for the Group.
Whilst our main priority has been to ensure the safety and wellbeing of our colleagues, their families and our customers, we have remained true to our purpose to make our customers’ lives easier by offering convenience in their Grocery & Merchandise, Foodservice and Fuel choices.
The Group has continued to deliver on its commitment to being a responsible business. Our support for communities has continued to grow across the countries we operate in, and is helping to make a positive difference in society. The dedication from all our colleagues to go above and beyond for our customers and local communities, in difficult circumstances, is to be applauded.
COVID-19 had a significant impact on our business operations throughout 2020, most notably in our Fuel business stream, where fuel sales volumes were reduced by up to 80% in some countries at the outset of the pandemic, and our Foodservice division, where in-store dining was not allowed for an extended period. Despite these challenges, EG has performed resiliently in terms of its profitability and liquidity.
With the global vaccination programme now being implemented, albeit with some continuing uncertainty, we are confident that with the support of our talented and passionate global workforce we will continue to be successful, growing the business both organically and through acquisition.
During FY20, we invested $386m in capital projects and opened 34 new-to-industry sites. Our acquisition strategy, both during the year and announced after the year end, has proven to be successful and by adding further diversification and resilience puts us in good standing for the future. We now have a diversified business portfolio spanning ten countries with over 6,000 sites.
THE FUTURE/OUTLOOK2021 will see continued focus on sustainability. We are ever-conscious of the need to continue to develop our capabilities, processes and systems and make them relevant for the world of tomorrow to ensure we continue to make a positive impact on our stakeholders, including our customers, colleagues and wider society.
Technology, trends and behaviours are continually changing and we are committed to meeting both the current and future needs of our business, customers and communities. ESG continues to be a growing focus for the Group and you can read more about our ESG strategy and ongoing activities on pages 47 to 57.
Lord Stuart RoseChairman
October 31, 2021
Lord Stuart Rose
CHAIRMAN’S STATEMENT
DESPITE THE GLOBAL CHALLENGE OF COVID-19,EG HAS PERFORMED RESILIENTLY. WE HAVE ENSURED THE SAFETY OF OUR COLLEAGUESAND CUSTOMERS WHILST REMAININGTRUE TO OUR PURPOSE.

STRATEGIC REPORT GOVERNANCE FINANCIALS
5EG Group | 2020 Annual Report and Financial Statements
OUR GRATITUDE EXTENDS TO EACH AND EVERY ONE OF OUR 45,000 COLLEAGUES,WHOSE CONTINUED COMMITMENT TO EACH OTHER AND TO THE BUSINESS HAS ENABLED US TO CONTINUE TO SERVE OUR CUSTOMERSGLOBALLY DURING THE PANDEMIC.
2020 was a year unlike any other and one for which there was no roadmap. That we did successfully navigate and finish the year in a strong position, is a testament to the diligence, fortitude and compassion of the thousands of our colleagues who form the EG family. The Group’s performance in the year validated our successful global diversification strategy and re‑affirmed the resilience of our business model.
With lockdown measures, travel restrictions and home working guidance in place, our role in providing customers with a convenient location to serve multiple shopping missions had never been so relevant. Wherever possible, our sites remained open to provide essential products and services to our customers, and in doing so, taking measures to keep our colleagues and customers safe has been a high priority for us, with the measures that we actioned detailed on pages 8 to 11 of this report. Our gratitude extends to each and every one of our 45,000 colleagues, whose continued commitment to each other and to the business has enabled us to continue to serve our customers globally.
As a business, we are proud of the positive impact we can have on people’s lives, and during these challenging times we fully recognise our role in supporting and serving local communities across all the countries in which we operate. In particular, we’ve been supporting the healthcare workers and first line responders to whom we are indebted for the many selfless sacrifices they have made to protect us, the wider public. Through our work at EG we understand the importance of giving back to society, whether through personal donations, or colleague volunteering and fundraising, we are proud of the support our business has given to others at a time when it was most needed.
The year brought significant challenges which, in turn, brought difficult decisions – particularly when our UK Foodservice operations were temporarily closed from March 23, 2020.
At the outset of the pandemic we undertook a number of financial actions to safeguard our liquidity and profitability – increasing working capital lines, temporarily suspending our growth capital spend plans, exercising strong cost management and engaging with national governments to secure available support. The timely execution of these actions meant that we were able to weather the early shocks of the pandemic and over the course of the year we began to relax them as lockdowns eased and activity levels partially resumed.
These actions undertaken last year, coupled with the excellence of our colleagues, enabled us to continue to focus on our future growth strategy and to look to the future with optimism.
During 2020 we completed the bolt-on acquisitions of 146 Foodservice outlets in the UK & Ireland, which made EG the largest KFC franchisee in the UK & Ireland and complemented our non-fuel growth strategy, followed by an acquisition of 18 convenience stores in our USA business at the end of the year.
On the back of the strong foundations laid and the resilient performance through the pandemic, 2021 is expected to be a year of continued growth for the Group, with the acquisition of the Group’s first proprietary Foodservice brand, LEON restaurants, which completed in May 2021, the acquisition of 52 UK KFC restaurants in September 2021, the acquisition of Cooplands, a UK bakery business, in October 2021 and the expected completion of the OMV Germany business in the final quarter of this year.
In February 2021, it was agreed that EG would purchase the Asda Forecourt Business. However, new facts came to light after the Competition and Markets Authority (“CMA”) restrictions were lifted in June 2021 which changed the economic evaluation of the transaction and as such, in October 2021, it was agreed not to proceed with the forecourts acquisition. EG will continue to progress key commercial initiatives through a strategic relationship with Asda.
We fully recognise that the path to longer-term normal trading conditions has not been, and will not be, without challenge. We are encouraged by the vaccination rates across the communities in which we operate, and are optimistic that we are on a path to normality, although we do anticipate there may be times when protective measures are re-introduced to safeguard communities. We will continue to be agile and responsive if, and when, those circumstances do arise.
We are grateful that as we look to that future we have the support and direction of our recently appointed Non-Executive Directors and the wider Board. The counsel of Lord Stuart Rose, Dame Alison Carnwath and John Carey and the strengthened governance policies they have put in place have already proven to be invaluable and we look forward to working with them and all of our colleagues as we continue to grow our business in the coming years.
Zuber Issa cbe & Mohsin Issa cbe
Co-Founders and Co-Chief Executive Officers
October 31, 2021
Zuber Issa cbe & Mohsin Issa cbe
CO‑CHIEF EXECUTIVE OFFICERS’ STATEMENT

6 EG Group | 2020 Annual Report and Financial Statements
AT A GLANCE
We provide an innovative approach to forecourt trading and a best-in-class customer experience for Grocery & Merchandise, Foodservice and Fuel; providing excellent service and good value, quality products at well maintained, convenient locations.
UK & Ireland(1) Continental Europe(1)
NUMBER OF SITES
666NUMBER OF EMPLOYEES
12,974NUMBER OF SITES
3,091NUMBER OF EMPLOYEES
7,2482020 gross profit by business stream 2020 gross profit by business stream
GROCERY & MERCHANDISE(2)
FOODSERVICE FUEL
24% 46% 30%
GROCERY & MERCHANDISE(2)
FOODSERVICE FUEL
35% 5% 60%
Find out more on pages 32 to 35 Find out more on pages 36 to 39
(1) Regional operations are supported by corporate headquarters and a shared service centre in Blackburn (2) Also includes other gross profit
Europe

STRATEGIC REPORT GOVERNANCE FINANCIALS
7EG Group | 2020 Annual Report and Financial Statements
USA(1) Australia(1)
NUMBER OF SITES
1,703NUMBER OF EMPLOYEES
20,064NUMBER OF SITES
540NUMBER OF EMPLOYEES
4,4852020 gross profit by business stream 2020 gross profit by business stream
GROCERY & MERCHANDISE(2)
FOODSERVICE FUEL
51% 1% 48%
GROCERY & MERCHANDISE(2)
FOODSERVICE FUEL
22% 0% 78%
Find out more on pages 40 to 43 Find out more on pages 44 to 46
GROCERY & MERCHANDISE FOODSERVICE FUEL
Sales of grocery and household essentials, beverages, confectionery, tobacco and tobacco alternatives
Sales generated by our quick service restaurants (“QSR”) outlets and in-store fresh food through partnerships with leading brands and proprietary offerings
Sales of road transportation fuels across our global petrol filling station network
Find out more on page 17 Find out more on page 18 Find out more on page 19
8 EG Group | 2020 Annual Report and Financial Statements
OUR RESPONSE TO COVID‑19
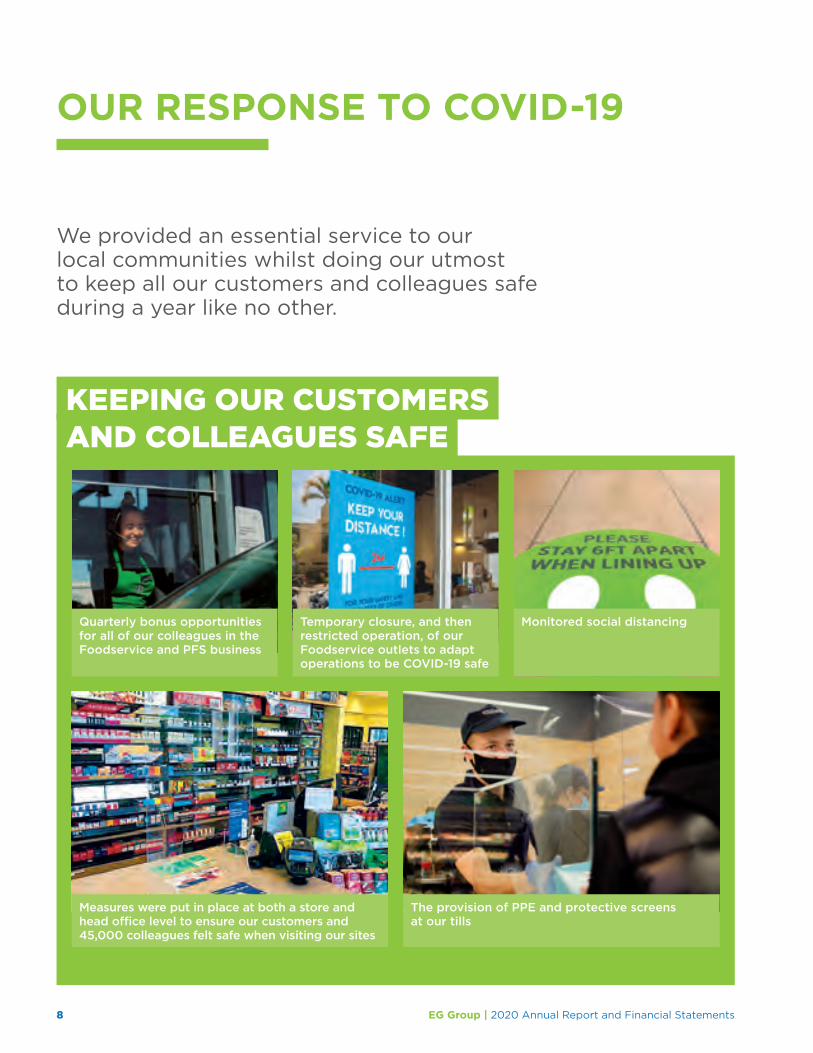
We provided an essential service to our local communities whilst doing our utmost to keep all our customers and colleagues safe during a year like no other.
KEEPING OUR CUSTOMERS AND COLLEAGUES SAFE
Monitored social distancingQuarterly bonus opportunities for all of our colleagues in the Foodservice and PFS business
The provision of PPE and protective screens at our tills
Temporary closure, and then restricted operation, of our Foodservice outlets to adapt operations to be COVID-19 safe
Measures were put in place at both a store and head office level to ensure our customers and 45,000 colleagues felt safe when visiting our sites
STRATEGIC REPORT GOVERNANCE FINANCIALS
9EG Group | 2020 Annual Report and Financial Statements
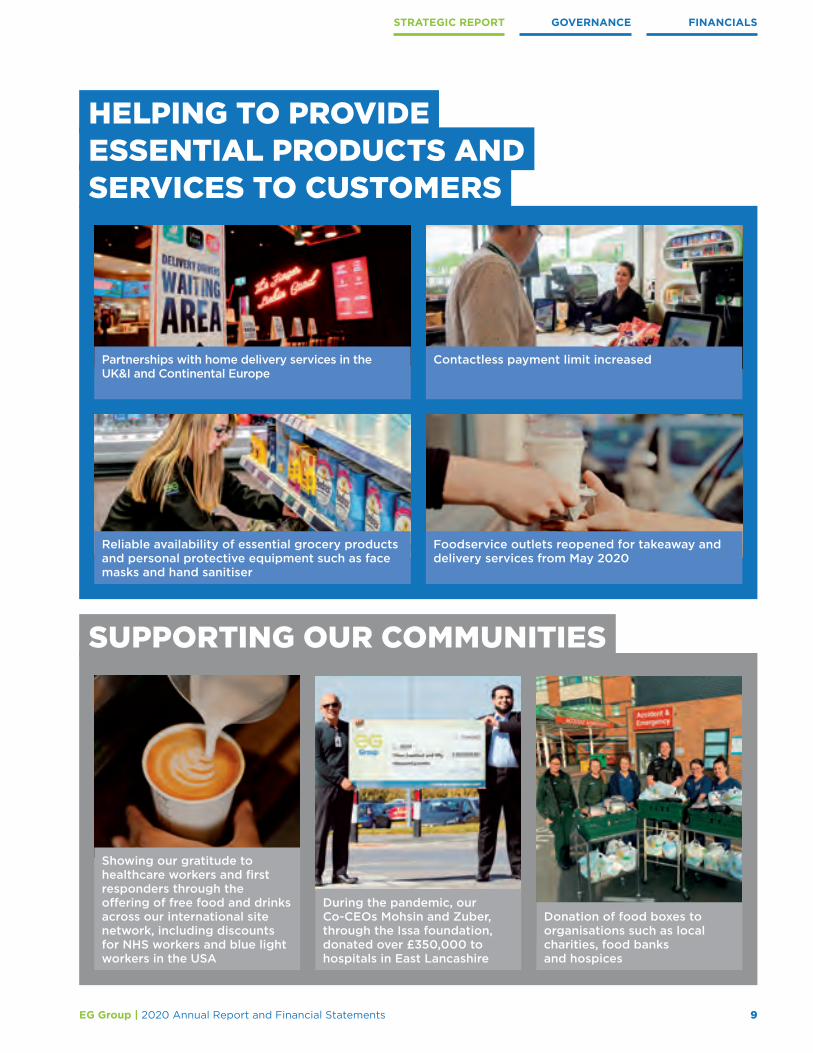
HELPING TO PROVIDE ESSENTIAL PRODUCTS ANDSERVICES TO CUSTOMERS
SUPPORTING OUR COMMUNITIES
Donation of food boxes to organisations such as local charities, food banks and hospices
During the pandemic, our Co-CEOs Mohsin and Zuber, through the Issa foundation, donated over £350,000 to hospitals in East Lancashire
Showing our gratitude to healthcare workers and first responders through the offering of free food and drinks across our international site network, including discounts for NHS workers and blue light workers in the USA
Partnerships with home delivery services in the UK&I and Continental Europe
Foodservice outlets reopened for takeaway and delivery services from May 2020
Reliable availability of essential grocery products and personal protective equipment such as face masks and hand sanitiser
Contactless payment limit increased

10 EG Group | 2020 Annual Report and Financial Statements
OUR RESPONSE TO COVID‑19 CONTINUED
The COVID-19 pandemic has been without precedent in living memory and continues to impact our operations, as it has since early March 2020. The pandemic has seen repercussions for our customers, colleagues and business partners in all countries of operations across all business streams. The most notable impact has been the fuel volumes sold through our petrol filling station (“PFS”) network as governments introduced lockdown measures to contain the spread of the virus. We have also seen restrictions and adaptations to our Foodservice operations – limitations on in-store dining, which has been offset through the growth in demand for take-out and home delivery.
We have a business model that is both diversified and resilient, providing essential products and services to the communities in which we operate, with the vast majority of our sites remaining open during 2020 and thereafter. We are proud to have continued to serve our communities during these difficult times, made possible through the dedication and agility of our colleagues globally.
For the impact of COVID-19 on the Group’s principal risks and uncertainties, please see page 58.
For the impact of COVID-19 on our going concern assessment, please see note 1.
TRADING IMPACT ON THE YEAROur sites provide an essential service to customers and communities and have remained open throughout the pandemic. We have been able to provide customers with a local and convenient option to purchase a wide range of essential products, with there having been no material disruption to our supply chain.
From mid-March 2020, we experienced the impact of COVID-19 on fuel volumes across the Group as governments introduced lockdown and social distancing measures to contain the spread of the virus. This impacted customer behaviour as people transitioned to working from home, home schooling and reduced travel with all non-essential retail and hospitality venues being closed.
A gradual recovery in volumes was experienced in the summer months as lockdown restrictions were eased. Fuel volumes dipped again in the last quarter of the year as restrictions were reintroduced, albeit there was less impact on customer behaviour than during the first wave of the pandemic as the lockdown restrictions were less severe and, in some regions, more localised.
Our UK Foodservice outlets, which account for over three quarters of our Foodservice revenue, were temporarily closed from the end of March 2020, substantially reopening in May 2020 albeit with some restrictions on operations. The continued demand for essential household and grocery products and strong growth in demand for delivery and drive-thru food service has meant that our non-fuel business streams have largely traded at or slightly above expected levels in most regions during 2020.
The Group has operations across ten countries in Europe, the USA and Australia. These countries have entered, and exited, lockdowns at different times during the year, and our trading has been impacted to different extents dependent on the severity and length of the lockdown measures introduced and other regional macroeconomic factors. This reinforces the geographical diversification benefit of our international acquisition strategy.
At the outset of the crisis, we took extensive action to reduce costs, protect profitability and conserve cash. In particular, we took a number of actions to manage our working capital and cost base, including tax deferrals and access to government employment support schemes.
An extensive range of operational and financial actions were implemented across the countries in which we operate, as described on the following page
STRATEGIC REPORT GOVERNANCE FINANCIALS
11EG Group | 2020 Annual Report and Financial Statements
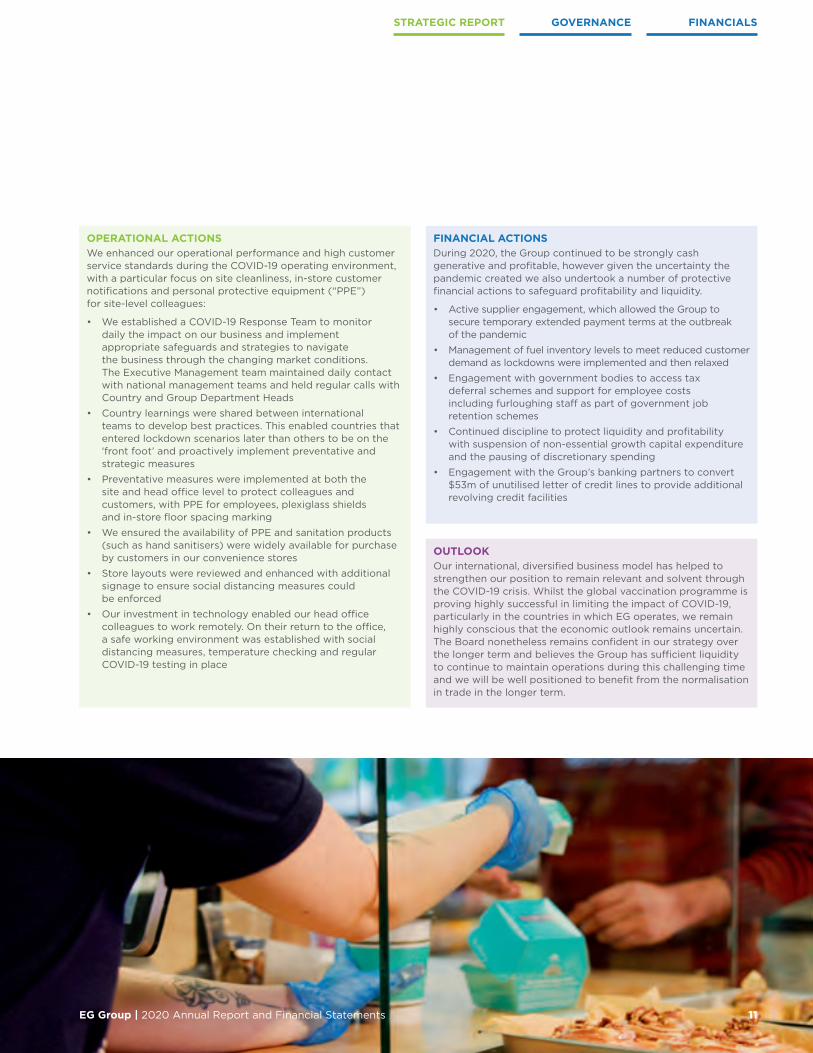
OPERATIONAL ACTIONSWe enhanced our operational performance and high customer service standards during the COVID-19 operating environment, with a particular focus on site cleanliness, in-store customer notifications and personal protective equipment (“PPE”) for site-level colleagues:
• We established a COVID-19 Response Team to monitor daily the impact on our business and implement appropriate safeguards and strategies to navigate the business through the changing market conditions. The Executive Management team maintained daily contact with national management teams and held regular calls with Country and Group Department Heads
• Country learnings were shared between international teams to develop best practices. This enabled countries that entered lockdown scenarios later than others to be on the ‘front foot’ and proactively implement preventative and strategic measures
• Preventative measures were implemented at both the site and head office level to protect colleagues and customers, with PPE for employees, plexiglass shields and in-store floor spacing marking
• We ensured the availability of PPE and sanitation products (such as hand sanitisers) were widely available for purchase by customers in our convenience stores
• Store layouts were reviewed and enhanced with additional signage to ensure social distancing measures could be enforced
• Our investment in technology enabled our head office colleagues to work remotely. On their return to the office, a safe working environment was established with social distancing measures, temperature checking and regular COVID-19 testing in place
FINANCIAL ACTIONSDuring 2020, the Group continued to be strongly cash generative and profitable, however given the uncertainty the pandemic created we also undertook a number of protective financial actions to safeguard profitability and liquidity.
• Active supplier engagement, which allowed the Group to secure temporary extended payment terms at the outbreak of the pandemic
• Management of fuel inventory levels to meet reduced customer demand as lockdowns were implemented and then relaxed
• Engagement with government bodies to access tax deferral schemes and support for employee costs including furloughing staff as part of government job retention schemes
• Continued discipline to protect liquidity and profitability with suspension of non-essential growth capital expenditure and the pausing of discretionary spending
• Engagement with the Group’s banking partners to convert $53m of unutilised letter of credit lines to provide additional revolving credit facilities
OUTLOOKOur international, diversified business model has helped to strengthen our position to remain relevant and solvent through the COVID-19 crisis. Whilst the global vaccination programme is proving highly successful in limiting the impact of COVID-19, particularly in the countries in which EG operates, we remain highly conscious that the economic outlook remains uncertain. The Board nonetheless remains confident in our strategy over the longer term and believes the Group has sufficient liquidity to continue to maintain operations during this challenging time and we will be well positioned to benefit from the normalisation in trade in the longer term.

12 EG Group | 2020 Annual Report and Financial Statements
20152014
OUR JOURNEY SO FAR
1 7670 137 193 372
2001
The Issa family acquire single
forecourt in Bury, North West England
UK & Ireland Continental Europe USA Australia
Acquisition of 43 Esso sites in
the UK
Acquisition of 48 Esso sites in
the UK
Acquisition of 103 Esso and
66 Shell sites in the UK
20122011 2013
Number of sitesFrom one UK site in 2001 to over 6,000 sites across three continents today, we have been on an incredible growth journey.
Based in Blackburn, UK, EG was founded in 2001 by the Issa family with the acquisition of a single petrol filling station in Bury, Greater Manchester. Together, Zuber and Mohsin continue to lead the growth and development of the business.
Inspired by working at their father’s rented petrol station as children, the Issa family achieved their ambition to buy their first petrol station in 2001, a derelict freehold site in Bury, about 15 miles north of Manchester, and Euro Garages was formed.
The early years saw steady growth, and from the outset, the focus was on differentiation through the development of a best-in-class retail proposition and a quality foodservice offering. Over many years, EG developed relationships with leading foodservice brands like Starbucks, Burger King, Greggs, Subway and KFC to run concessions at our larger forecourt formats.
This innovative retail model enabled steady growth in the business to 76 sites by 2012.
Since 2001, Zuber and Mohsin have been on an incredible growth journey, expanding Euro Garages from one UK site to more than 6,000 sites across ten countries and three continents.
By 2015, following a series of significant acquisitions from ExxonMobil and Shell, Euro Garages became established as a major UK independent forecourt retailer. These acquisitions increased the size of the UK estate to 372 sites by the end of 2015, giving the business a nationwide site footprint.
First EG Subway, Starbucks and
Burger King openedFirst EG Greggs
opened

13EG Group | 2020 Annual Report and Financial Statements
2016 was a transformational year which saw the Company take its first steps internationally. Following investment from TDR Capital and an acquisition of one of their portfolio companies, European Forecourt Retail (“EFR”), with more than 1,100 Continental European sites, EG Group was established. Entrance into the European market provided a platform for future growth with the Group subsequently expanding its presence in Europe during 2018, with further acquisitions undertaken in Italy, the Netherlands and Germany. The Group also expanded into the USA in that year, with the acquisition of the convenience store network from the USA grocer, Kroger Inc, and the smaller business of Minit Mart. Certified Oil, Fastrac and Cumberland Farms were then acquired during 2019, expanding our USA site network across 31 states. The Group also entered the Australian market in April 2019 through the acquisition of Woolworths’ network of 537 Fuelco forecourts.
During 2020, acquisitive growth in the business was purposely slowed amid heightened uncertainty arising out of the COVID-19 pandemic, however a number of smaller bolt-on acquisitions were completed during the year.
In March 2020, the Group became KFC’s largest franchisee in the UK & Ireland through the acquisition of 145 KFC Foodservice outlets across the UK & Ireland, complementing our established Foodservice business. We also expanded our presence in the USA through the acquisition of 18 Schrader Oil sites in Colorado in December 2020.
On the back of a resilient performance through the pandemic, 2021 is expected to be a year of further growth for the Group, with the acquisition of ten German truck stops and six Burger King restaurants from KMS Autohof in January 2021, the acquisition of the Group’s first proprietary Foodservice brand, LEON restaurants, which completed in May 2021, the acquisition of 52 UK KFC restaurants in September 2021, the acquisition of Cooplands, a UK bakery business, in October 2021 and the expected completion of the OMV Germany business in the final quarter of 2021.
These targeted strategic acquisitions complement our investment in organic growth and have underpinned the growth of the business and our increased market share, which, combined with continued focus on our customer proposition and operational excellence, significantly strengthens our scale, resilience, diversification and risk profile.
STRATEGIC REPORT GOVERNANCE FINANCIALS
1,473 1,448
4,6885,866 6,000
Merger of EFR and Euro Garages to
form EG Group
Acquisitions: 1,158 Esso sites in Italy
97 NRGValue sites in the Netherlands
762 sites from Kroger in the USA
233 Minit Mart sites in the USA
1,029 Esso sites in Germany
Acquisitions: 537 Woolworths sites
in Australia
140 Certified Oil and Fastrac sites
in the USA
567 Cumberland Farms sites in the USA
2016 2017 2018 2019 2020
Acquisition of 77 Little Chef sites in the UK
(which have since been converted to EG
standalone Foodservice sites)
First EG KFC opened
Acquisition of 145 standalone KFC sites in the UK & Ireland from
The Herbert Group
First Sbarro Pizza and Cinnabon opened
Acquisitions: 18 Schrader Oil sites
in the USA

14 EG Group | 2020 Annual Report and Financial Statements
OUR BUSINESS MODEL
DELIVERING A BEST-IN–CLASSCUSTOMER EXPERIENCE
Our business Our key business streams
Our competitive advantage
We strive to deliver a modern and compelling retail experience that allows customers to achieve multiple missions in one convenient location.
Strategically, we are well placed to benefit from the significant opportunity to serve the convenience needs of today’s busy consumer. We will achieve this through the continued rollout of leading national and internationally recognised Grocery & Merchandise, Foodservice and Fuel brands and the increasing development of our ‘own brand’ products.
Our business model leverages non-fuel operations, which has proven to enhance the stability of earnings and resilience to adverse pricing and market conditions, as well as helping to grow consumer footfall via the destination effect provided by recognised non-fuel brands. This resilience and diversification of our business model has been demonstrated through the recent COVID-19 pandemic.
Well-invested sites at prime locations delivering local services, globally
• Our extensive geographic footprint in three continents and across ten countries provides the benefits of geographical diversification, with balanced exposure to multiple national economies with different economic cycles and macroeconomic fundamentals
• Our high-quality site portfolio delivers a superior customer experience and amenities compared to our competition
• Our best-in-class offering allows us to be well positioned against our competitors for site profitability and future industry trends
Best-in-class owned and operated model
• Our directly managed model gives control over quality, consistency, cost structures and pricing and allows us to execute our site optimisation and rollout strategy
• We develop strong brand partnerships and are viewed as a brand ambassador by our partners
Strong brand offer and innovative approach across Grocery & Merchandise, Foodservice and Fuel
• Our complementary Grocery & Merchandise, Foodservice and Fuel offer creates a site halo impact
• Our larger sites with greater amenities drive customer footfall and spend
• We target a balanced offering across regions to further diversify and improve resilience of profitability
• We are constantly innovating and developing to adapt for the forecourt of the future, with ample space for electric vehicle charging stations, roadside positioning for fulfilment of last mile customer needs and an IT platform ready for evolving payment methods
GROCERY &MERCHANDISE
See page 17
FOODSERVICE
See page 18
FUEL
See page 19
STRATEGIC REPORT GOVERNANCE FINANCIALS
15EG Group | 2020 Annual Report and Financial Statements
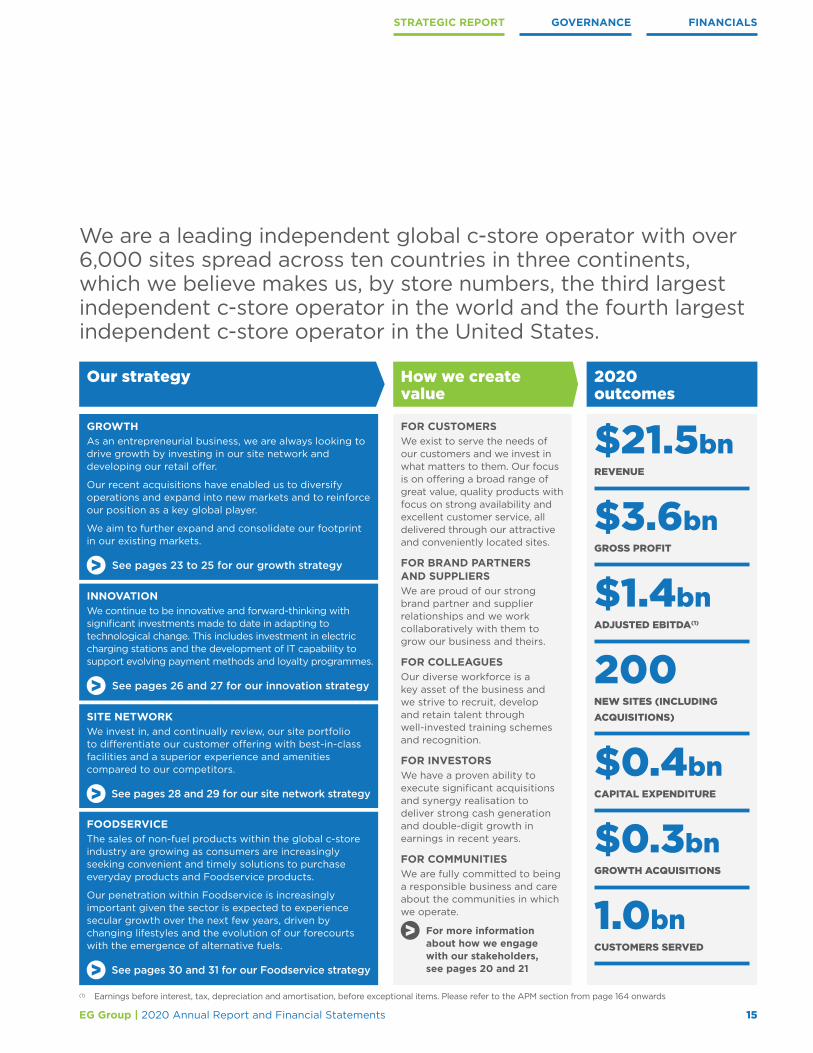
We are a leading independent global c-store operator with over 6,000 sites spread across ten countries in three continents, which we believe makes us, by store numbers, the third largest independent c-store operator in the world and the fourth largest independent c-store operator in the United States.
How we create value
Our strategy 2020 outcomes
GROWTHAs an entrepreneurial business, we are always looking to drive growth by investing in our site network and developing our retail offer.
Our recent acquisitions have enabled us to diversify operations and expand into new markets and to reinforce our position as a key global player.
We aim to further expand and consolidate our footprint in our existing markets.
See pages 23 to 25 for our growth strategy
SITE NETWORKWe invest in, and continually review, our site portfolio to differentiate our customer offering with best-in-class facilities and a superior experience and amenities compared to our competitors.
See pages 28 and 29 for our site network strategy
INNOVATIONWe continue to be innovative and forward-thinking with significant investments made to date in adapting to technological change. This includes investment in electric charging stations and the development of IT capability to support evolving payment methods and loyalty programmes.
See pages 26 and 27 for our innovation strategy
FOODSERVICEThe sales of non-fuel products within the global c-store industry are growing as consumers are increasingly seeking convenient and timely solutions to purchase everyday products and Foodservice products.
Our penetration within Foodservice is increasingly important given the sector is expected to experience secular growth over the next few years, driven by changing lifestyles and the evolution of our forecourts with the emergence of alternative fuels.
See pages 30 and 31 for our Foodservice strategy
FOR CUSTOMERS We exist to serve the needs of our customers and we invest in what matters to them. Our focus is on offering a broad range of great value, quality products with focus on strong availability and excellent customer service, all delivered through our attractive and conveniently located sites.
FOR BRAND PARTNERS AND SUPPLIERSWe are proud of our strong brand partner and supplier relationships and we work collaboratively with them to grow our business and theirs.
FOR COLLEAGUESOur diverse workforce is a key asset of the business and we strive to recruit, develop and retain talent through well-invested training schemes and recognition.
FOR INVESTORSWe have a proven ability to execute significant acquisitions and synergy realisation to deliver strong cash generation and double-digit growth in earnings in recent years.
FOR COMMUNITIES We are fully committed to being a responsible business and care about the communities in which we operate.
For more information about how we engage with our stakeholders, see pages 20 and 21
$21.5bnREVENUE
$3.6bnGROSS PROFIT
$1.4bnADJUSTED EBITDA(1)
200NEW SITES (INCLUDING ACQUISITIONS)
$0.4bnCAPITAL EXPENDITURE
$0.3bnGROWTH ACQUISITIONS
1.0bnCUSTOMERS SERVED
(1) Earnings before interest, tax, depreciation and amortisation, before exceptional items. Please refer to the APM section from page 164 onwards

16 EG Group | 2020 Annual Report and Financial Statements
(1) "add advisors page to fill blank page?
OUR BUSINESS MODEL IN ACTION
FUEL
FOODSERVICE
p19
EV CHARGING POINTS
p19
p18
GROCERY & MERCHANDISE
p17

17EG Group | 2020 Annual Report and Financial Statements
Grocery & Merchandise(1) represents over a third of gross profit, driving diversification to enhance earnings resilience.We have long-standing partnerships with globally recognised European and Australian brands in Grocery & Merchandise and have wholesale supply agreements with brands such as SPAR, Asda, Carrefour and Louis Delhaize to supply our site network. We also operate proprietary brands in the USA, to offer consumers a premium convenience retail offering. We continue to explore new opportunities and to focus on further enhancement to our Grocery & Merchandise offering, particularly in Continental Europe where our lower penetration of this market presents an opportunity for future growth and development. During 2020, we opened our first ‘Asda On the Move’ trial sites in our UK business and expect to roll out this offering across our UK estate by the end of 2023 as part of our strategic relationship with Asda.
The ‘convenience’ grocery market as a whole has seen a strong expansion over the last 15 years in those territories in which we operate and continues to benefit from the ongoing trend of consumers migrating towards convenience shopping missions.
During 2020 and throughout the pandemic this trend continued and we observed customers use convenience stores as an alternative to supermarkets.
The majority of the Group’s convenience stores remained open during the pandemic and sales have remained resilient as we played a key role in providing essential household products and groceries during the pandemic. We observed a change in sales mix in most territories; typically, sales in beverages and confectionery fell while sales in grocery, chilled food and household items increased.
Grocery & Merchandise revenue of $4,919m (2019: $3,688m) was an increase of $1,231m or 33% on 2019, which is largely attributable to the full-year impact of acquisitions, primarily in Australia and our Cumberland Farms business in the USA, which together contributed an additional $1,165m of sales revenue reported in 2020.
Gross profit for Grocery & Merchandise for the full year increased by 32% to $1,428m in 2020 (2019: $1,085m), with this increase attributable to the full-year impact of 2019 acquisitions. (1) All number references include other gross profit
40%
AS A % OF GROUP GROSS PROFIT FOR 2020
GROCERY &MERCHANDISE
GROSS PROFIT (IN $M)
2018 2019 2020
685
1,085
1,428
FINANCIALSGOVERNANCESTRATEGIC REPORT

18 EG Group | 2020 Annual Report and Financial Statements
OUR BUSINESS MODEL IN ACTION CONTINUED
8%
FOODSERVICE We have a breadth of attractive Foodservice offerings with recognised, global brands transforming our sites into destinations serving multiple customer needs, which supports an increase in customer footfall and enhances the premium fuel pricing strategy of the Group. We are a significant operator of scale of Foodservice sites and have established a position as a leading franchisee for our brand partners. In recent years, the Foodservice market has grown across the countries we operate in, underpinned by long-term trends such as customers seeking convenience, people having more hectic and ‘time poor’ lifestyles and urbanisation. Growth is expected to continue over the near term, presenting a clear opportunity for EG across the markets in which we currently operate.
Building on our proven ability to own and operate Foodservice restaurants, in March 2020, we acquired the UK & Ireland’s largest KFC franchise from The Herbert Group (‘Scotco Restaurants’), which included a network of 145 KFC restaurants in the UK & Ireland and further expansion opportunities. Subsequently, in May 2021, the Group acquired LEON Restaurants, a fast food chain which operates 43(1) Foodservice sites in the UK, and the Group’s first proprietary Foodservice brand acquisition.
Foodservice revenue for 2020 of $466m (2019: $410m) is an increase of 14%, but excluding the additional $173m of sales generated by the Scotco Restaurants revenue decreased by 28%. This decrease resulted from the temporary closure of Foodservice outlets at the outbreak of the pandemic, where the Group’s UK & Ireland (“UK&I”) Foodservice operations, which accounted for 63% of the Group’s Foodservice revenue in 2019, were temporarily closed on March 23, 2020 to allow the business to adapt its operations for the new social distancing requirements. Following a re-opening programme which commenced in April 2020, many outlets outperformed their sales in the same period in 2019. Foodservice operations in Continental Europe largely remained open throughout the pandemic with ‘to-go’ offerings only. The UK government’s ‘Eat Out to Help Out’ scheme, which ran during August 2020, supported sales levels recovery, and the temporary reduction in VAT for the hospitality sector has had an accretive impact on revenue and margin in the second half of the year.
Full-year Foodservice gross profit of $305m (2019: $235m) is a year-on-year increase of 30%, largely due to the impact of profit reported from the acquired Scotco Restaurants, which totalled $99m, and a decrease of 13% excluding acquisitions, due to the period of closure discussed above.
We have identified considerable scope for expansion in Foodservice, due to the overall popularity and expected growth in the category, the specific characteristics of our estate (e.g. larger-than-average sites in many countries, in high-traffic locations), and our proven ability in executing a Foodservice proposition. The development of our proprietary brand offers is expected to contribute to margin expansion as rollout programmes continue in 2021 onwards.(1) Excludes 28 franchise sites
AS A % OF GROUP GROSS PROFIT FOR 2020
GROSS PROFIT (IN $M)
2018 2019 2020
207235
305

19EG Group | 2020 Annual Report and Financial Statements
EMERGING TREND: ALTERNATIVE FUELSWe recognise the rapidly changing environment, as the world increasingly moves to accelerate de-carbonisation.
During 2020, there has been considerable discussions at all levels of society regarding climate change and how we all will respond to this challenge. This includes government announcements regarding future carbon targets and measures designed to reduce the level of carbon emissions. Transport fuels will have a key role in reducing carbon emissions, with the principal focus on the acceleration of electric vehicles (“EVs”) to replace traditional internal combustion engines through both hybrid and electric car models.
We continuously seek to adapt for the future through new partnerships and innovations, with an evolution towards a ‘forecourt of the future’, focused on broadening our product range and driving quality to meet changing demands.
A limited number of alternative fuel and electric charging points have been operated across our forecourt estate for nearly a decade and a significant number of our sites are highly adaptable for the addition of charging points, with ample space for customers to charge their vehicles whilst taking advantage of our strong non-fuel offering. Our large multi-use retail sites will be at the forefront of the emerging market trends including rapid EV charging and other alternative fuels such as hydrogen. Also see our Mobility strategy on page 26.
We have Fuel retail operations in nine countries(1), including six of the ten largest fuel markets in Europe. We continue to focus on the growth and quality of our network through the development of new-to-industry sites (“NTIs”), knock-down-rebuilds, upgrades and conversions to our COCO model. Additionally, our wholesale supply agreements with premium fuel brands, coupled with a leading non-fuel offering, support our premium positioning on Fuel. We also operate a wholesale supply business, EG Fuel, that focuses on the strategic and operational fuel supply and distribution in mainland Europe.
Demand has been significantly impacted by the lockdown measures imposed by national and state governments in response to COVID-19 with travel restrictions in place in all countries of operation at certain points of the year, with remote working and home schooling measures in place for a large part of the year. At the height of the first wave of the pandemic, country decreases in Fuel volumes sold were reported between 30% and 85% against pre-pandemic levels.
A recovery has been observed in the second half of the year, with volumes near to pre-pandemic levels recorded in the summer months followed by reduced volumes reported in the final few months of 2020 as lockdowns were reintroduced in Europe and the USA.
Fuel volumes sold of 18.1bn litres (2019: 18.4bn litres) decreased by 1% for the full year, albeit this was partly attributable to the full-year impact of 2019 acquisitions. Excluding the impact of acquisitions, volumes decreased by 20% or 3.6bn litres. A reduction in wholesale fuel cost prices led to a supportive environment for retail fuel margins, which have largely offset decreases in volumes sold.
As a result of the factors described above, Fuel gross profit for the full year was $1,874m (2019: $1,318m), being an increase of 42% on a reported basis, or 9% excluding the impact of acquisitions. (1) Excludes Ireland where we only operate Foodservice operations
FUEL
52%
AS A % OF GROUP GROSS PROFIT FOR 2020
GROSS PROFIT (IN $M)
2018 2019 2020
866
1,318
1,874
FINANCIALSGOVERNANCESTRATEGIC REPORT

20 EG Group | 2020 Annual Report and Financial Statements
OUR STAKEHOLDERS AND SECTION 172
We believe that a real understanding of the priorities of our Group’s stakeholders is key to securing long-term success and maximising value in the business.Board Directors are bound by their duties under the Companies Act 2006 (the ‘Act’) to promote the success of the Company for the benefit of our members as a whole. In doing so, however, they must have regard for the interests of all of our stakeholders, to ensure the long-term sustainability of the Company. The Board is therefore responsible for ensuring that it fulfils its obligations to those impacted by our business, in its stakeholder consideration and engagement.
The following pages comprise our Section 172(1) statement, setting out how the Board has, in performing its duties over the course of the year, had regard to the matters set out in Section 172(1) (a) to (f) of the Act, alongside examples of how each of our key stakeholders have been considered and engaged. Further information can also be found throughout the strategic report and in our discussion of key strategic decisions made in the governance report.
Through Director and senior management discussions we have identified the Group’s key stakeholders to be:
• Customers
• Brand partners and suppliers
• Colleagues
• Investors
• Communities
These principal stakeholder groups are set out in the table opposite, along with why they matter and how we engage with them. Also set out is our approach to engagement in 2020, particularly in the midst of the global pandemic.
Description Why they matter How we engage 2020 engagement
CUSTOMERSThe Group exists to serve the needs of our customers, of which we serve up to 23 million every week across the world.
• We strive to provide excellent service, quality and choice to each of our customers to help them achieve multiple missions at convenient local destinations
• An understanding of our customers will allow us to increase market awareness and enable quick response to customer trends
• Maintaining and increasing their loyalty and regard for the EG brand ensures the long-term success of our business
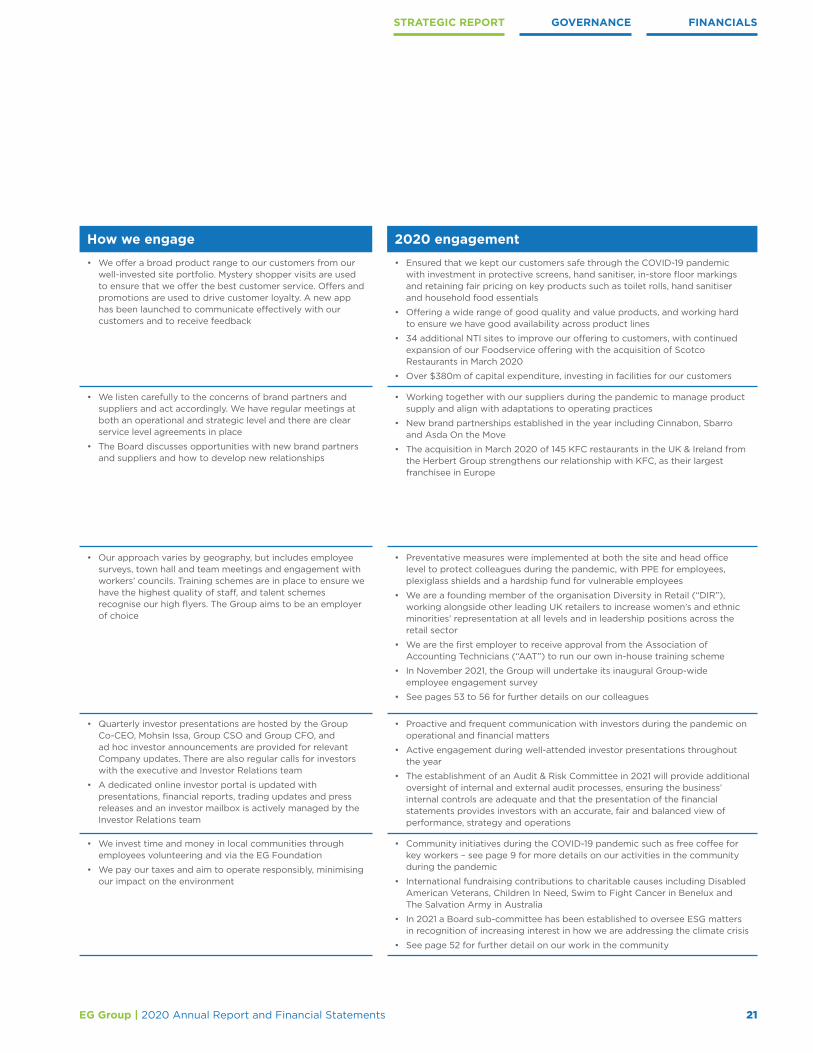
• We offer a broad product range to our customers from our well-invested site portfolio. Mystery shopper visits are used to ensure that we offer the best customer service. Offers and promotions are used to drive customer loyalty. A new app has been launched to communicate effectively with our customers and to receive feedback
• Ensured that we kept our customers safe through the COVID-19 pandemic with investment in protective screens, hand sanitiser, in-store floor markings and retaining fair pricing on key products such as toilet rolls, hand sanitiser and household food essentials
• Offering a wide range of good quality and value products, and working hard to ensure we have good availability across product lines
• 34 additional NTI sites to improve our offering to customers, with continued expansion of our Foodservice offering with the acquisition of Scotco Restaurants in March 2020
• Over $380m of capital expenditure, investing in facilities for our customers
BRAND PARTNERS AND SUPPLIERSWe partner with prominent fuel brands such as ExxonMobil, BP, Shell and Texaco, well-known grocery and merchandise brands such as SPAR, Asda On the Move, Woolworths, Carrefour and Louis Delhaize, and globally recognised Foodservice brands such as Starbucks, Burger King, Subway and KFC, as well as strong local Foodservice brands such as Greggs and Pomme de Pain.
• To maintain strong long-term relationships
• To ensure continuity of supply
• To provide a relevant and competitive offer for our customers and react to changing trends
• We listen carefully to the concerns of brand partners and suppliers and act accordingly. We have regular meetings at both an operational and strategic level and there are clear service level agreements in place
• The Board discusses opportunities with new brand partners and suppliers and how to develop new relationships
• Working together with our suppliers during the pandemic to manage product supply and align with adaptations to operating practices
• New brand partnerships established in the year including Cinnabon, Sbarro and Asda On the Move
• The acquisition in March 2020 of 145 KFC restaurants in the UK & Ireland from the Herbert Group strengthens our relationship with KFC, as their largest franchisee in Europe
COLLEAGUESWe have an experienced, diverse and dedicated workforce of 45,000 colleagues which we recognise as a key asset of our business.
• We have a diverse workforce, which we consider to be a key asset, and we therefore want to develop and retain talent for the long-term success of the Group
• We need to comply with different regulations in each of our territories and maintain an open dialogue with all of our colleagues
• The work of our global colleagues, particularly during the challenging conditions presented by the pandemic, is critical for the business to release its operational and strategical goals
• Our approach varies by geography, but includes employee surveys, town hall and team meetings and engagement with workers’ councils. Training schemes are in place to ensure we have the highest quality of staff, and talent schemes recognise our high flyers. The Group aims to be an employer of choice
• Preventative measures were implemented at both the site and head office level to protect colleagues during the pandemic, with PPE for employees, plexiglass shields and a hardship fund for vulnerable employees
• We are a founding member of the organisation Diversity in Retail (“DIR”), working alongside other leading UK retailers to increase women’s and ethnic minorities’ representation at all levels and in leadership positions across the retail sector
• We are the first employer to receive approval from the Association of Accounting Technicians (“AAT”) to run our own in-house training scheme
• In November 2021, the Group will undertake its inaugural Group-wide employee engagement survey
• See pages 53 to 56 for further details on our colleagues
INVESTORSOur investors and lenders play an important role in our business and growth strategy. We maintain close and supportive relationships with this group of long-term stakeholders, characterised by openness, transparency and mutual understanding.
• Our investors are concerned with a broad range of issues, including the Group’s financial and operational performance, strategic execution, investment plans, capital allocation and sustainability
• Quarterly investor presentations are hosted by the Group Co-CEO, Mohsin Issa, Group CSO and Group CFO, and ad hoc investor announcements are provided for relevant Company updates. There are also regular calls for investors with the executive and Investor Relations team
• A dedicated online investor portal is updated with presentations, financial reports, trading updates and press releases and an investor mailbox is actively managed by the Investor Relations team
• Proactive and frequent communication with investors during the pandemic on operational and financial matters
• Active engagement during well-attended investor presentations throughout the year
• The establishment of an Audit & Risk Committee in 2021 will provide additional oversight of internal and external audit processes, ensuring the business’ internal controls are adequate and that the presentation of the financial statements provides investors with an accurate, fair and balanced view of performance, strategy and operations
COMMUNITIESWe are committed to supporting the communities in which we operate, including local businesses, residents and the wider public.
• The Group is committed to operating responsibly and to make a significant positive impact and provide opportunities to the communities in which we operate
• We invest time and money in local communities through employees volunteering and via the EG Foundation
• We pay our taxes and aim to operate responsibly, minimising our impact on the environment
• Community initiatives during the COVID-19 pandemic such as free coffee for key workers – see page 9 for more details on our activities in the community during the pandemic
• International fundraising contributions to charitable causes including Disabled American Veterans, Children In Need, Swim to Fight Cancer in Benelux and The Salvation Army in Australia
• In 2021 a Board sub-committee has been established to oversee ESG matters in recognition of increasing interest in how we are addressing the climate crisis
• See page 52 for further detail on our work in the community
STRATEGIC REPORT GOVERNANCE FINANCIALS
21EG Group | 2020 Annual Report and Financial Statements
Description Why they matter How we engage 2020 engagement
CUSTOMERSThe Group exists to serve the needs of our customers, of which we serve up to 23 million every week across the world.
• We strive to provide excellent service, quality and choice to each of our customers to help them achieve multiple missions at convenient local destinations
• An understanding of our customers will allow us to increase market awareness and enable quick response to customer trends
• Maintaining and increasing their loyalty and regard for the EG brand ensures the long-term success of our business
• We offer a broad product range to our customers from our well-invested site portfolio. Mystery shopper visits are used to ensure that we offer the best customer service. Offers and promotions are used to drive customer loyalty. A new app has been launched to communicate effectively with our customers and to receive feedback
• Ensured that we kept our customers safe through the COVID-19 pandemic with investment in protective screens, hand sanitiser, in-store floor markings and retaining fair pricing on key products such as toilet rolls, hand sanitiser and household food essentials
• Offering a wide range of good quality and value products, and working hard to ensure we have good availability across product lines
• 34 additional NTI sites to improve our offering to customers, with continued expansion of our Foodservice offering with the acquisition of Scotco Restaurants in March 2020
• Over $380m of capital expenditure, investing in facilities for our customers
BRAND PARTNERS AND SUPPLIERSWe partner with prominent fuel brands such as ExxonMobil, BP, Shell and Texaco, well-known grocery and merchandise brands such as SPAR, Asda On the Move, Woolworths, Carrefour and Louis Delhaize, and globally recognised Foodservice brands such as Starbucks, Burger King, Subway and KFC, as well as strong local Foodservice brands such as Greggs and Pomme de Pain.
• To maintain strong long-term relationships
• To ensure continuity of supply
• To provide a relevant and competitive offer for our customers and react to changing trends
• We listen carefully to the concerns of brand partners and suppliers and act accordingly. We have regular meetings at both an operational and strategic level and there are clear service level agreements in place
• The Board discusses opportunities with new brand partners and suppliers and how to develop new relationships
• Working together with our suppliers during the pandemic to manage product supply and align with adaptations to operating practices
• New brand partnerships established in the year including Cinnabon, Sbarro and Asda On the Move
• The acquisition in March 2020 of 145 KFC restaurants in the UK & Ireland from the Herbert Group strengthens our relationship with KFC, as their largest franchisee in Europe
COLLEAGUESWe have an experienced, diverse and dedicated workforce of 45,000 colleagues which we recognise as a key asset of our business.
• We have a diverse workforce, which we consider to be a key asset, and we therefore want to develop and retain talent for the long-term success of the Group
• We need to comply with different regulations in each of our territories and maintain an open dialogue with all of our colleagues
• The work of our global colleagues, particularly during the challenging conditions presented by the pandemic, is critical for the business to release its operational and strategical goals
• Our approach varies by geography, but includes employee surveys, town hall and team meetings and engagement with workers’ councils. Training schemes are in place to ensure we have the highest quality of staff, and talent schemes recognise our high flyers. The Group aims to be an employer of choice
• Preventative measures were implemented at both the site and head office level to protect colleagues during the pandemic, with PPE for employees, plexiglass shields and a hardship fund for vulnerable employees
• We are a founding member of the organisation Diversity in Retail (“DIR”), working alongside other leading UK retailers to increase women’s and ethnic minorities’ representation at all levels and in leadership positions across the retail sector
• We are the first employer to receive approval from the Association of Accounting Technicians (“AAT”) to run our own in-house training scheme
• In November 2021, the Group will undertake its inaugural Group-wide employee engagement survey
• See pages 53 to 56 for further details on our colleagues
INVESTORSOur investors and lenders play an important role in our business and growth strategy. We maintain close and supportive relationships with this group of long-term stakeholders, characterised by openness, transparency and mutual understanding.
• Our investors are concerned with a broad range of issues, including the Group’s financial and operational performance, strategic execution, investment plans, capital allocation and sustainability
• Quarterly investor presentations are hosted by the Group Co-CEO, Mohsin Issa, Group CSO and Group CFO, and ad hoc investor announcements are provided for relevant Company updates. There are also regular calls for investors with the executive and Investor Relations team
• A dedicated online investor portal is updated with presentations, financial reports, trading updates and press releases and an investor mailbox is actively managed by the Investor Relations team
• Proactive and frequent communication with investors during the pandemic on operational and financial matters
• Active engagement during well-attended investor presentations throughout the year
• The establishment of an Audit & Risk Committee in 2021 will provide additional oversight of internal and external audit processes, ensuring the business’ internal controls are adequate and that the presentation of the financial statements provides investors with an accurate, fair and balanced view of performance, strategy and operations
COMMUNITIESWe are committed to supporting the communities in which we operate, including local businesses, residents and the wider public.
• The Group is committed to operating responsibly and to make a significant positive impact and provide opportunities to the communities in which we operate
• We invest time and money in local communities through employees volunteering and via the EG Foundation
• We pay our taxes and aim to operate responsibly, minimising our impact on the environment
• Community initiatives during the COVID-19 pandemic such as free coffee for key workers – see page 9 for more details on our activities in the community during the pandemic
• International fundraising contributions to charitable causes including Disabled American Veterans, Children In Need, Swim to Fight Cancer in Benelux and The Salvation Army in Australia
• In 2021 a Board sub-committee has been established to oversee ESG matters in recognition of increasing interest in how we are addressing the climate crisis
• See page 52 for further detail on our work in the community

22 EG Group | 2020 Annual Report and Financial Statements
GROWTH Find out more on pages 23 to 25
INNOVATION Find out more on pages 26 and 27
SITE NETWORK Find out more on pages 28 and 29
FOODSERVICE Find out more on pages 30 and 31
OUR STRATEGY
Our core strategy is to develop a leading global retail business, with scale and diversification to enable our customers to achieve multiple missions in one convenient location.
During the turbulent market conditions experienced globally throughout the COVID-19 pandemic, the resilience of our international, diversified business model, underpinned by our strategy, was reinforced and we remain confident that we can continue to deliver long-term shareholder growth.
What has been clearer than ever over the last year, is that our talented, passionate and innovative people are essential to the successful delivery of our strategy and to driving the business performance over the long term.
We seek to accelerate the development of our people; grow and strengthen our leadership capabilities; and enhance employee performance through continued engagement in our strategy.
Our strategy reflects our desire to build a sustainable business that is relevant to our customers and partners in future decades as it is today. We recognise the sectors that we operate within are evolving, notably with an increased focus on sustainability and alternative fuel, and as a result we must similarly evolve. It is a source of pride for the business that often, in areas such as the provision of foodservice on forecourts, EG has been an innovator and disruptor to established forecourt business models.
We continue to strive towards being a partner of choice for leading foodservice, retail and fuel brands across the markets that we operate in, and to evaluate growth opportunities that complement and strengthen our expanding business portfolio.
We aim to be able to meet and exceed the needs of consumers as they seek additional convenience and quality in their daily life. Our sites will help consumers as they seek to undertake multiple retail missions at a location close to them.
Our strategic pillars
STRATEGIC REPORT GOVERNANCE FINANCIALS
23EG Group | 2020 Annual Report and Financial Statements
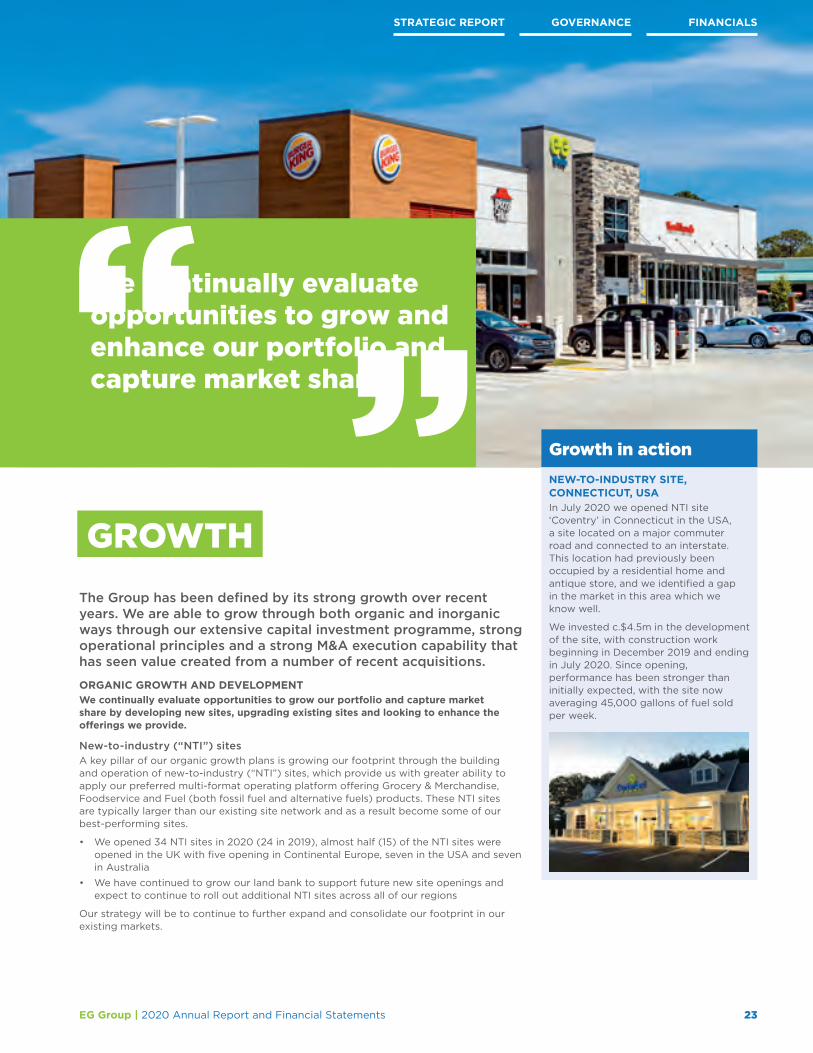
The Group has been defined by its strong growth over recent years. We are able to grow through both organic and inorganic ways through our extensive capital investment programme, strong operational principles and a strong M&A execution capability that has seen value created from a number of recent acquisitions.
ORGANIC GROWTH AND DEVELOPMENTWe continually evaluate opportunities to grow our portfolio and capture market share by developing new sites, upgrading existing sites and looking to enhance the offerings we provide.
New-to-industry (“NTI”) sitesA key pillar of our organic growth plans is growing our footprint through the building and operation of new-to-industry (“NTI”) sites, which provide us with greater ability to apply our preferred multi-format operating platform offering Grocery & Merchandise, Foodservice and Fuel (both fossil fuel and alternative fuels) products. These NTI sites are typically larger than our existing site network and as a result become some of our best-performing sites.
• We opened 34 NTI sites in 2020 (24 in 2019), almost half (15) of the NTI sites were opened in the UK with five opening in Continental Europe, seven in the USA and seven in Australia
• We have continued to grow our land bank to support future new site openings and expect to continue to roll out additional NTI sites across all of our regions
Our strategy will be to continue to further expand and consolidate our footprint in our existing markets.
NEW‑TO‑INDUSTRY SITE, CONNECTICUT, USAIn July 2020 we opened NTI site ‘Coventry’ in Connecticut in the USA, a site located on a major commuter road and connected to an interstate. This location had previously been occupied by a residential home and antique store, and we identified a gap in the market in this area which we know well.
We invested c.$4.5m in the development of the site, with construction work beginning in December 2019 and ending in July 2020. Since opening, performance has been stronger than initially expected, with the site now averaging 45,000 gallons of fuel sold per week.
Growth in action
GROWTH
We continually evaluate opportunities to grow and enhance our portfolio and capture market share

24 EG Group | 2020 Annual Report and Financial Statements
OUR STRATEGY CONTINUED
ORGANIC GROWTH AND DEVELOPMENT CONTINUEDExisting site enhancementSITE EXPANSION AND REPLACEMENTWe continually examine our site network, looking for opportunities to re-invigorate sites through knock-down-rebuilds (“KDR”, known as ‘raze-and-rebuilds’ in the USA) and through expansion of our facilities through either extension to existing buildings or through the purchase of adjacent land and building of new facilities.
We would typically undertake a KDR if the presentation and layout of a site is looking dated and not reflective of the high standard of customer offering we are looking to provide.
During 2020 we undertook five KDRs (2019: eleven).
CONVERSION OF SUITABLE SITES TO THE DIRECTLY MANAGED COCO MODEL A description of our operating models is on page 29. We have a proven track record of performance improvement through the conversion of sites historically operated by third parties to then being operated by EG and we are focused on identifying and executing conversion opportunities to increase site profitability.
Sites with the potential to materially increase Grocery & Merchandise and Foodservice offerings will typically sell more than two million litres of fuel or will be strategically located such that additional footfall can be achieved (e.g. sites located in a heavy urbanised area or adjacent to facilities such as a university).
Sites are converted to company-owned, company-operated (“COCO”) to benefit from greater control of operations, with EG assuming responsibility for all employees on site. As well as incurring the full cost base of the site, the Company benefits from capturing the full margin potential with little to no conversion costs typically incurred.
Other smaller and less profitable company-operated sites can be converted to unmanned sites, offering a no-frills fuel only service with a focus on lower-priced fuel sales.
Many of our acquired businesses (for example, Kroger and Cumberland Farms in the USA and Fuelco in Australia) have estates that mainly consist of COCO sites, presenting the opportunity to develop a full Grocery & Merchandise and Foodservice offering. Our Italian and German site networks, with a substantial number of company-owned but third-party operated sites, provide a large store conversion pipeline offering significant earnings upside potential.
During 2020 we converted 61 sites to the COCO model (2019: 27), largely in Italy and Germany.
ACQUISITION‑DRIVEN GROWTHAcquisition‑driven growth is an important component of our strategy and our global footprint provides us the opportunity to consider and pursue strategically attractive transactions, including more opportunistic acquisitions within the fragmented global c‑store industry.
We have also recently undertaken a number of mid-size Foodservice acquisitions which can sit independent of, or complementary to, our wider c-store operation, with these discussed within the Foodservice section of our Strategy overview.
In the long term, we intend to continue to further extend our footprint within our existing markets as well as to potentially use our M&A expertise and know-how to expand into new countries. Our management team, working with advisers, performs extensive due diligence to identify attractive and suitable acquisition targets which we believe can be enhanced through the achievement of operational synergies and the ability to share best practices across our estate.
GROWTHCONTINUED

25EG Group | 2020 Annual Report and Financial Statements
A specialised internal integration team assists in the post-acquisition integration process and the realisation of financial and operational synergies. We only seek acquisition targets that meet our strict investment criteria as part of our disciplined acquisition strategy.
During 2020, we purposely slowed down our acquisition programme in light of the more heightened uncertainty for businesses arising out of the COVID-19 pandemic. During 2020, we completed on the following acquisitions with an aggregate consideration of $214m (2019: $3,941m):
• On March 10, 2020 we acquired the largest KFC franchise in the UK & Ireland from the Belfast-headquartered Herbert Group. The acquisition consisted of 145 KFC restaurants and one Pizza Hut for consideration of $160m, and complemented our Foodservice offering in our European market (see Foodservice strategy on page 30)
• We also acquired two smaller bolt-on c-store businesses, one in the USA and another in Continental Europe. Total consideration was $54m and 20 sites were added to our network
During late 2020 and 2021 to date we announced a number of acquisitions which broaden the c-store footprint of our UK and German business and increase our Foodservice capability in the UK:
• On December 14, 2020 we announced the acquisition of the German forecourt business of OMV, increasing our German portfolio by 285 sites. This acquisition is expected to complete in the final quarter of 2021
• On May 9, 2021, we completed the acquisition of LEON Restaurants, increasing our Foodservice offering within the UK and Continental Europe. This is our first acquisition of a proprietary Foodservice brand, and further emphasises the Group’s focus on non-fuel operations. We look forward to growing the brand across our c-store network, including the development of drive-thru offerings
• On September 26, 2021 the Group completed the acquisition of Amsric Foods. The acquired network consists of 52 KFC restaurants across the south and south-west of the UK, and a mix of drive-thru and traditional restaurant formats
• On October 2, 2021, the Group acquired Cooplands, a business which owns and operates bakery assets in the United Kingdom, including three bakeries that process ingredients and manufacture fresh food distributed through its supply and logistics network to c.180 sites and cafes, predominantly across the north-east and Yorkshire regions. Following the acquisition of LEON in May, Cooplands is another proprietary Foodservice brand to complement our existing portfolio of third-party Foodservice brands
• On October 23, 2021, the Group concluded negotiations to acquire 34 convenience stores and two development sites in the USA for gross consideration of $278m. The transaction was effective from October 30, 2021, is subject to regulatory approvals, and is expected to complete by the end of 2021. This acquisition expands EG’s presence in the USA to two additional states, and post-completion EG will operate over 1,750 sites across 33 states
These acquisitions have enabled the Company to diversify operations and expand into new markets, with our pro forma site portfolio, allowing for those acquisitions which are currently committed, growing to c.6,600 sites, reinforcing EG Group’s position as a key global player.
We continue to be a consolidator of choice in the sector and are able to demonstrate the ability to over-perform in completed acquisitions with EBITDA at or above management’s expected levels.
We have a structured approach to achieving synergies from acquisitions, with realised synergies ahead of targets for most of our recent acquisitions, despite the impact of the pandemic.
FINANCIALSGOVERNANCESTRATEGIC REPORT

26
Infrastructure in action
EG Group | 2020 Annual Report and Financial Statements
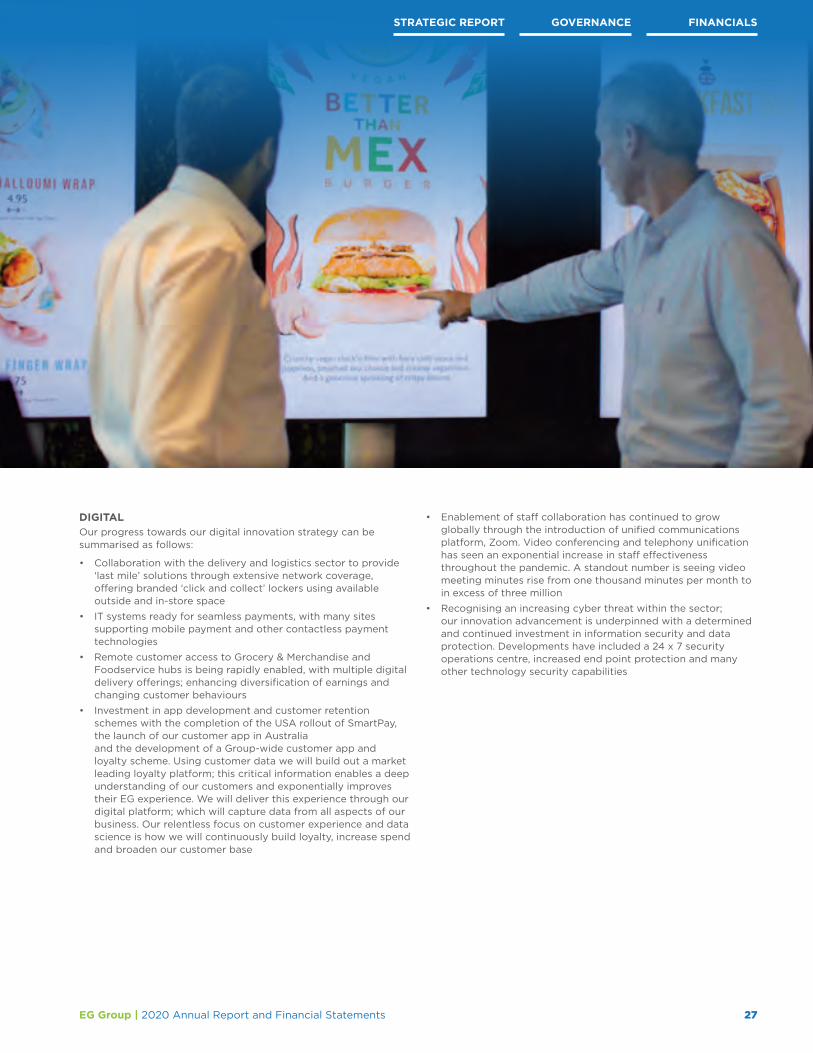
Customers increasingly select EG Group to fulfil their purchases from offsite locations. Enablement of order ahead, loyalty rewards and frictionless purchasing through our digital application is seeing an increase in customer acquisition, average transaction value and repeat visits to our sites.
The suite of application features is being incrementally advanced to enable unified digital purchasing of all services via mobile devices. Alongside the transactional, but innovative, application delivery is a loyalty programme designed to personalise the digital experience.
Currently EG Group delivers a full digital experience in the USA, an informational fuel application in Australia and 2021 sees the launch of new Foodservice features in the UK.
Our commitment is to build for consumer needs and transform the way EG Group interacts digitally with each and every shopper.
We continue to evolve our technology platform to develop a ‘forecourt of the future’
INNOVATIONConsumer demands are continually evolving, with more emphasis than ever being placed on time constraints and food choice. We continue to evolve our technology platform to develop a ‘forecourt of the future’, focused on broadening the product range and driving quality to meet changing demands.
MOBILITYThe Board believes the long-term trend toward electrification of vehicles presents a significant opportunity for the Group.
We currently operate 75 electric charging points across the UK, Germany and France and have identified over 500 additional sites that, due to their locations and nature, are suitable for additional electric charge points as part of a first wave of site developments.
We are in discussions with leading players for the deployment of infrastructure and services to support electric charging demand across our network.
We are conscious that alternative forms of power, other than electric, are being explored as a means to fuel cars, light vehicles and trucks. We are exploring a number of these, with a particular focus on the potential for hydrogen to power light and heavy-duty vehicles.
Innovation in action
OUR STRATEGY CONTINUED
STRATEGIC REPORT GOVERNANCE FINANCIALS
27EG Group | 2020 Annual Report and Financial Statements
DIGITALOur progress towards our digital innovation strategy can be summarised as follows:
• Collaboration with the delivery and logistics sector to provide ‘last mile’ solutions through extensive network coverage, offering branded ‘click and collect’ lockers using available outside and in-store space
• IT systems ready for seamless payments, with many sites supporting mobile payment and other contactless payment technologies
• Remote customer access to Grocery & Merchandise and Foodservice hubs is being rapidly enabled, with multiple digital delivery offerings; enhancing diversification of earnings and changing customer behaviours
• Investment in app development and customer retention schemes with the completion of the USA rollout of SmartPay, the launch of our customer app in Australia and the development of a Group-wide customer app and loyalty scheme. Using customer data we will build out a market leading loyalty platform; this critical information enables a deep understanding of our customers and exponentially improves their EG experience. We will deliver this experience through our digital platform; which will capture data from all aspects of our business. Our relentless focus on customer experience and data science is how we will continuously build loyalty, increase spend and broaden our customer base
• Enablement of staff collaboration has continued to grow globally through the introduction of unified communications platform, Zoom. Video conferencing and telephony unification has seen an exponential increase in staff effectiveness throughout the pandemic. A standout number is seeing video meeting minutes rise from one thousand minutes per month to in excess of three million
• Recognising an increasing cyber threat within the sector; our innovation advancement is underpinned with a determined and continued investment in information security and data protection. Developments have included a 24 x 7 security operations centre, increased end point protection and many other technology security capabilities

28 EG Group | 2020 Annual Report and Financial Statements
OUR STRATEGY CONTINUED
SITE NETWORKThrough our extensive recent acquisition and NTI site programmes, the Group now operates an unrivalled site network of approximately 6,000 sites across ten countries.A significant proportion of our sites are company owned and company operated and, in all countries other than Belgium, sites are typically larger than the average site size in that geography.
Notwithstanding this, our site network is quite diverse, incorporating: 319 highway and highway-like sites that operate on highways/motorways/inter-state roads; unmanned sites, which typically operate from smaller footprints; and sites operated by third-party operators such as dealers and agents.
A number of our sites are located on highways, on main commuter traffic routes and in urban conurbations. They are typically strategically located, generating strong footfall.
We have a dynamic approach to managing our site estate, where we look to add to the number of sites we operate through acquisitions or the development of new-to-industry sites. We will also, and have, exited sites that are believed to be non-core to the Group’s wider strategy, such as the disposal of our Corsica estate in 2017.
In addition to growing our site numbers, we continually look to upgrade the quality of our estate through knock down rebuilds and site conversions as described in our organic growth strategy on page 24.
The strength of our site network offers a number of distinct strategic advantages over our competitors:
• We are more attractive to third-party brand partners, who are looking for new routes to market with trusted partners, often across multiple geographies. We have a strong pipeline of sites that are suitable for roll out of new Foodservice and Grocery & Merchandise propositions, whilst having established a strong track record as a responsible brand ambassador
• By being so diversified, the Group is able to exert a strong resilience if a natural event, such as a hurricane, adversely impacts certain regions of our operations. This geographic diversification was demonstrated during the pandemic, where our operating countries experienced lockdown restrictions at different times, enabling the sharing of best practice across the Group whilst the adverse financial impact from individual countries were able to be offset from the recovery of others
• It is very attractive as a platform to build an extensive electric vehicle, and other alternative fuels, network. A vast number of sites are large enough to operate both fossil and alternative fuel offerings and already host a number of attractive non-fuel propositions for customers, and our high-quality sites are able to provide a strong Foodservice and Grocery & Merchandise offering for consumers to take advantage of whilst using our charging facilities on site
We operate a diverse and extensive international site network at convenient roadside locations
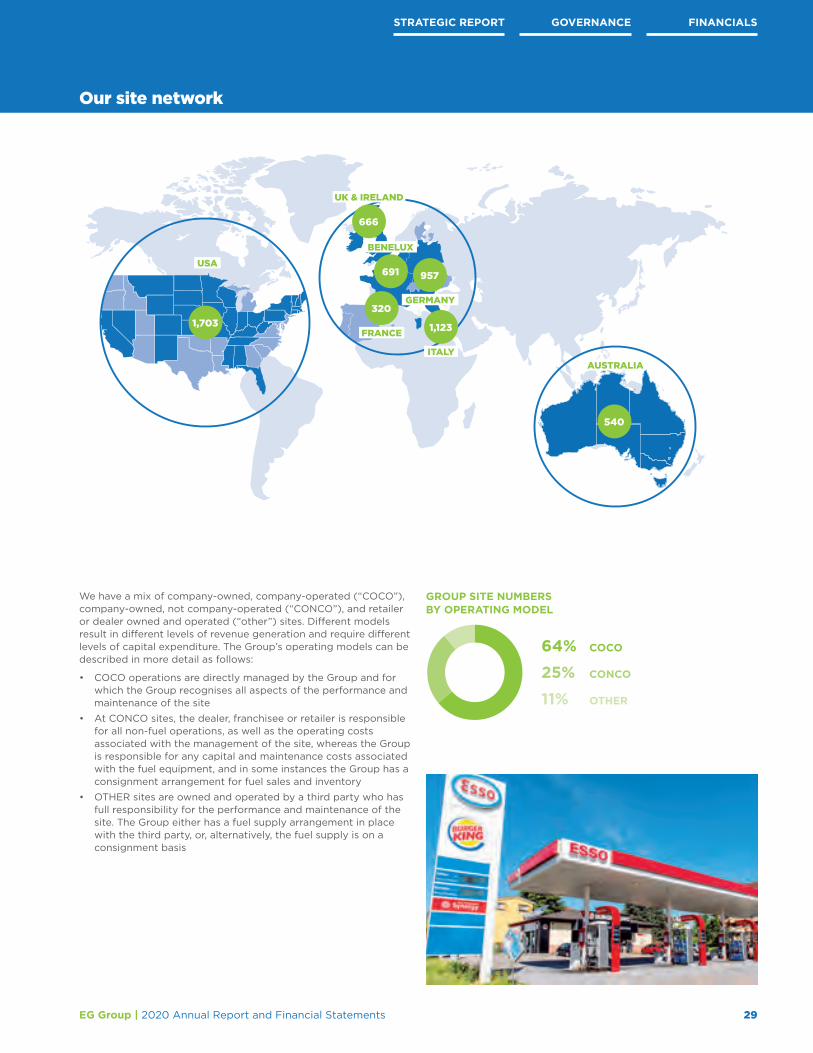
Our site network
1,703
USA
320
1,123
957691
666
ITALY
FRANCE
BENELUX
GERMANY
UK & IRELAND
540
AUSTRALIA
STRATEGIC REPORT GOVERNANCE FINANCIALS
29EG Group | 2020 Annual Report and Financial Statements
We have a mix of company-owned, company-operated (“COCO”), company-owned, not company-operated (“CONCO”), and retailer or dealer owned and operated (“other”) sites. Different models result in different levels of revenue generation and require different levels of capital expenditure. The Group’s operating models can be described in more detail as follows:
• COCO operations are directly managed by the Group and for which the Group recognises all aspects of the performance and maintenance of the site
• At CONCO sites, the dealer, franchisee or retailer is responsible for all non-fuel operations, as well as the operating costs associated with the management of the site, whereas the Group is responsible for any capital and maintenance costs associated with the fuel equipment, and in some instances the Group has a consignment arrangement for fuel sales and inventory
• OTHER sites are owned and operated by a third party who has full responsibility for the performance and maintenance of the site. The Group either has a fuel supply arrangement in place with the third party, or, alternatively, the fuel supply is on a consignment basis
GROUP SITE NUMBERS BY OPERATING MODEL
64% COCO
25% CONCO
11% OTHER

We are committed to expanding and enhancing our presence in the Foodservice market
30 EG Group | 2020 Annual Report and Financial Statements
OUR STRATEGY CONTINUED
The Group has been successfully operating third-party Foodservice propositions for over a decade. Across the Group we now operate over 1,400 Foodservice outlets, of which 316 are located at standalone Foodservice locations.
We are a significant operator of scale of Foodservice sites and have established a position as a leading franchisee for our brand partners. In March 2020, we completed the acquisition of 145 KFC restaurants in the UK & Ireland from the Herbert Group, making us the largest KFC franchisee in the UK & Ireland. This acquisition is well aligned to our long-term strategic growth plans and builds on our commitment to grow the EG Group’s presence in the Foodservice market. The Herbert Group portfolio is a great strategic addition and complements our expanding operations in the United Kingdom and, furthermore, allowed us entry into the Irish market.
Whilst at the outset of the pandemic these sites were closed for a short period as we adapted our operations, since their reopening in April and May 2020 performance has exceeded our expectations, with growing demand from consumers for accessible Foodservice solutions including the expansion of home delivery.
We expanded our KFC network further in September 2021, with the acquisition of 52 KFC Restaurants from Amsric Foods.
During 2021 we opened our 200th Greggs store, meaning we account for approximately 10% of the total Greggs estate. We are also the largest Starbucks franchisee in Europe.
FOODSERVICE
OUR FOODSERVICE OFFERING IS VERY DIVERSIFIED, AND AT THE YEAR END INCLUDED THE FOLLOWING BRANDS:
Starbucks has cemented its presence as a leading coffee brand in over 80 countries. EG Group’s partnership with Starbucks began in 2010 and we now operate over 152 outlets across the UK, Belgium and France.
Subway has become the world’s largest submarine sandwich chain with more than 44,000 locations across the globe. EG Group started to operate its own Subway outlets in 2011 and currently operates more than 212 outlets across the UK, Belgium, France, the Netherlands and the USA.
KFC is a global chicken restaurant with a history of success and innovation. EG Group’s partnership with KFC in the United Kingdom started in 2016, with the first restaurant opening in the North of England in 2017. EG Group is now the largest KFC operator in the UK & Ireland, operating 164 outlets across the UK & Ireland, Belgium, France and the Netherlands.
Founded in 1954, Burger King is the second largest fast food hamburger chain in the world. EG Group’s partnership with Burger King began in 2011 with five Burger King restaurants, growing to c.50 restaurants following an acquisition from the Kout Food Group in 2017.
With over 75 years of history, Greggs now has over 1,700 shops in the UK. EG Group’s partnership with Greggs started back in 2013 and the Group has since become Greggs’ largest franchisee, with over 200 outlets across the UK.
Foodservice brand partners in action

31EG Group | 2020 Annual Report and Financial Statements
Subsequent to the year end was the LEON Restaurants acquisition, which we completed on May 9, 2021. LEON was established in the UK in 2004 and serves healthy, fresh and naturally fast food – from a largely London-centric site network but also from an increasing number of airport, train station and travel hubs.
We see the LEON brand as being a highly complementary addition to our Foodservice brands portfolio, which already includes the strong third-party brands noted above. It is, however, the first acquisition that EG has made of a proprietary brand and we are excited by the growth flexibility that is available from operating our own brand – particularly given LEON is on trend for the evolving themes of healthy eating and having an ethical and sustainable heritage, currently being played out in foodservice.
We intend to invest in the LEON brand and broaden the current Foodservice offer across our extensive global site network, with plans to open around 20 LEONs per year from 2022. We also see significant potential for LEON’s FMCG products across our convenience retail network and the broader supermarket ecosystem.
Following the acquisition of LEON Restaurants in October 2021, we acquired our second proprietary brand in Cooplands bakery. Cooplands owns and operates high-quality bakery assets in the UK, including three bakeries that process ingredients and manufacture fresh food distributed through its supply and logistics network to about 180 stores and cafes, predominantly across the north-east and Yorkshire regions.
Our penetration within the Foodservice market is increasingly important given the sector is expected to experience secular growth over the next few years, driven by changing lifestyles:
• Increasing number of single households and households with multiple incomes
• Changing eating habits and less predictable working routines mean convenience is increasingly important
• Increasing urbanisation, mobility and travel by car
Foodservice offerings on a forecourt platform remains underdeveloped across most countries, in terms of penetration and rollout of more sophisticated propositions. Unlocking the opportunity requires high traffic sites and the operating know-how to provide compelling customer propositions.
We are continually reviewing our brand portfolio and evaluating opportunities to partner with leading Foodservice brands and to develop high-quality proprietary offerings.
In March 2020, we acquired 145 KFC restaurants in the UK & Ireland from the Herbert Group, making us the largest KFC franchisee in Europe. This acquisition has proven successful to date, with the business recording earnings in excess of those targeted, despite the sites being closed for a short period at the outset of the pandemic. The strong performance has been supported by a growth in take-out and a significant surge in home delivery, an emerging trend which we will continue to focus on as we execute our Foodservice strategy.
Foodservice in action
FINANCIALSGOVERNANCESTRATEGIC REPORT

32 EG Group | 2020 Annual Report and Financial Statements
OPERATING REVIEW
EUROPE:UK & IRELAND
TOTAL SITES(1)
666
(2019: 498)
NUMBER OF EMPLOYEES(1)
12,974
(2019: 9,112)
CUSTOMERS SERVED DURING 2020(1)
131m
(2019: 166m)
IMPACT OF COVID‑19On March 23, 2020 the UK government announced a nationwide lockdown, requiring people to stay at home except for limited circumstances. All of our UK&I forecourts remained open after they were deemed to be an essential service, however the lockdown restrictions severely impacted the fuel volumes sold across our UK site portfolio. At the same time, we observed strong Grocery & Merchandise sales as customers switched to smaller convenience stores for essential purchases. Our Foodservice business performance was adversely impacted during a period of temporary closure for approximately six weeks from March 22, 2020 following which we undertook a cautious, phased reopening of our sites. During this period, operations were adapted to adhere to updated health and safety requirements.
Lockdown measures were eased over the summer months and the UK government’s ‘Eat Out to Help Out’ scheme during August supported a recovery in Foodservice business activity.
The final quarter of 2020 saw a re-emergence of COVID-19 infections resulting in renewed lockdowns and a regional tier system, whereby restaurants became restricted to operate on a ‘takeout’ or ‘delivery’ basis. Our Foodservice outlets continued to operate on this basis, and we observed a significant increase in demand for takeout and home delivery services; a trend which has continued into 2021.
Management worked proactively to manage cash and liquidity during the pandemic, including cost control measures at an operational level and engagement with the government to access support schemes totalling $40m, including the Coronavirus Job Retention Scheme for our Foodservice colleagues and business rates relief.
(1) As at December 31, 2020 (and at December 31, 2019 for the comparative period)

FINANCIALSGOVERNANCESTRATEGIC REPORT
33EG Group | 2020 Annual Report and Financial Statements
GROCERY & MERCHANDISE FOODSERVICE FUEL
24% 30%46%
FOODSERVICEGROCERY & MERCHANDISE(1)
FUEL
2020 GROSS PROFIT BY BUSINESS STREAM
(1) Also includes other gross profit

34 EG Group | 2020 Annual Report and Financial Statements
OPERATIONAL REVIEWHaving grown over a period of 20 years, our UK&I business represents the Group’s most mature business with regard to our forecourt strategy and customer proposition. We operate with strong third-party branded Grocery & Merchandise and Foodservice propositions, which were further enhanced during 2020 with the acquisition of 146 standalone Foodservice outlets from the Herbert Group. This acquisition extended our Foodservice platform to Ireland, a new region of operation for the Group, and also established our position as the largest franchisee of KFC in the UK & Ireland. For Greggs, Subway and Starbucks, we are the largest franchisee in Europe.
We made progress during the year to expand and enhance our UK&I estate through the opening of 15 new-to-industry sites, bringing our total number of forecourts in UK&I to 397 at the end of the year. Additionally, we have continued to improve our Foodservice and Grocery & Merchandise offering through the opening of 42 new Foodservice outlets, including two Sbarro Pizza and one Cinnabon store (the first of these brands to open in the UK), and through our ‘Asda On the Move’ convenience store trial of which there were three sites at the year end, with additional sites converting to this concept throughout 2021.
At the end of December 2020, the UK government finalised its exit from the European Union (‘Brexit’), with this having no material impact on our business nor interruption to trading during the reporting period and into 2021.
2021 is set to be another transformational year for the UK&I business with the acquisitions of LEON Restaurants, Amsric Foods and Cooplands during the year.
LEON Restaurants Limited offers healthy, fresh and natural fast food under its proprietary brand LEON at its 43 company-operated sites across the UK. This acquisition, which completed on May 9, 2021, is complementary to our existing Foodservice brands portfolio and provides further diversification for the Group given the growth flexibility of owning a proprietary Foodservice brand.
On September 27, 2021 we acquired 52 KFC restaurants from Amsric Foods, expanding our network in the south and south-west of the UK and establishing our position as the largest franchisee in Western Europe for the KFC brand, which has positioned itself as a high-growth, quick service restaurant brand and is the undisputed market leader in the chicken segment.
The acquisition of Cooplands, a UK bakery business, which completed on October 2, 2021, will accelerate EG Group’s growing and successful diversification into Foodservice and adds highly complementary assets that will drive development and expansion opportunities for the brand to our UK forecourt network.
On February 3, 2021, EG Group (‘EG’ or the ‘Company’), announced that it had agreed to acquire certain assets of Asda (the ‘Asda Forecourt Business’ or ‘Transaction’).
On June 16, 2021, both the ongoing restrictions imposed under UK Competition Law and the subsequent Competition and Markets Authority ‘Hold Separate Order’ on the acquisition of Asda by TDR Capital and the Issa brothers were lifted.
This allowed Asda and EG Group’s teams to start sharing commercial information relating to EG’s proposed acquisition of the Asda Forecourt Business which had not been previously possible and has resulted in several changes to the financial evaluation of the proposed Transaction. As a result, EG and Asda have decided they will no longer proceed with the Transaction, and it was terminated as of October 18, 2021.
Key commercial initiatives between EG and Asda are already well underway including the development of plans to introduce Foodservice at Asda locations and the expansion of Asda’s convenience offering, where both companies have confirmed their intention to roll out the Asda On the Move proposition across EG’s UK forecourts. These plans remain unchanged, and the Company continues to anticipate synergies as a result of its growing relationship with Asda.
OPERATING REVIEW CONTINUED
EUROPE:UK & IRELANDCONTINUED
SITE NUMBERS BY OPERATING MODEL
100% COCO
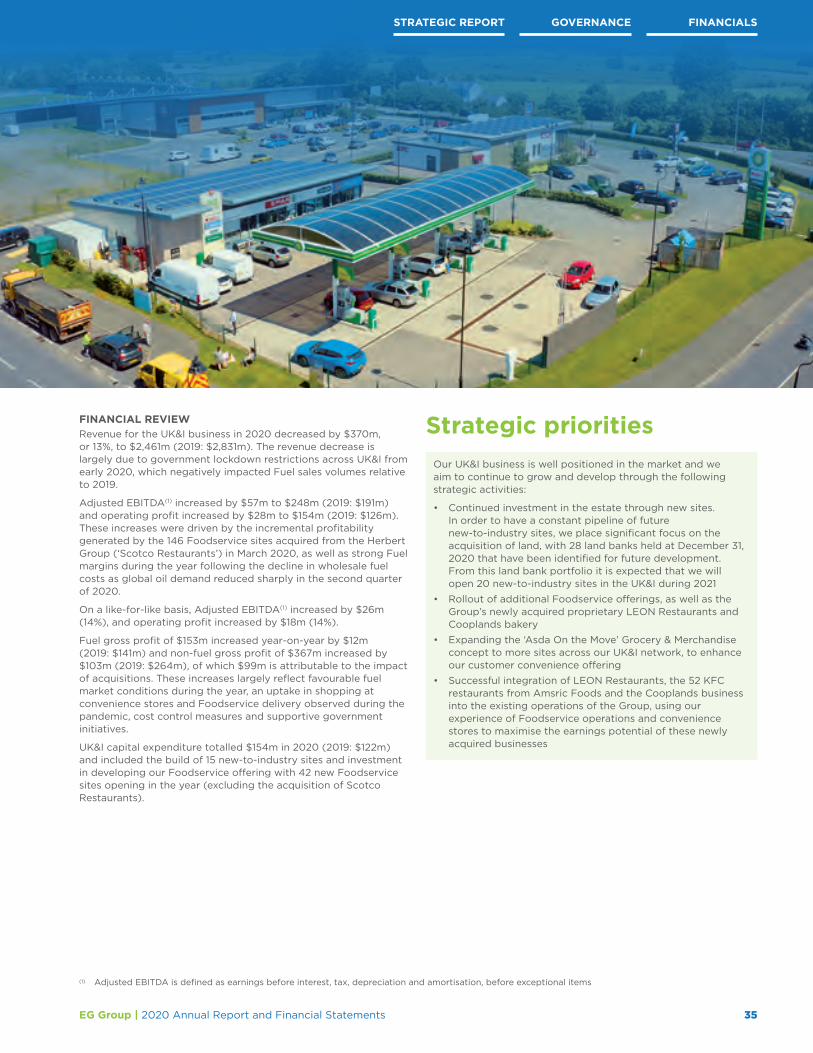
FINANCIALSGOVERNANCESTRATEGIC REPORT
35EG Group | 2020 Annual Report and Financial Statements
FINANCIAL REVIEWRevenue for the UK&I business in 2020 decreased by $370m, or 13%, to $2,461m (2019: $2,831m). The revenue decrease is largely due to government lockdown restrictions across UK&I from early 2020, which negatively impacted Fuel sales volumes relative to 2019.
Adjusted EBITDA(1) increased by $57m to $248m (2019: $191m) and operating profit increased by $28m to $154m (2019: $126m). These increases were driven by the incremental profitability generated by the 146 Foodservice sites acquired from the Herbert Group (‘Scotco Restaurants’) in March 2020, as well as strong Fuel margins during the year following the decline in wholesale fuel costs as global oil demand reduced sharply in the second quarter of 2020.
On a like-for-like basis, Adjusted EBITDA(1) increased by $26m (14%), and operating profit increased by $18m (14%).
Fuel gross profit of $153m increased year-on-year by $12m (2019: $141m) and non-fuel gross profit of $367m increased by $103m (2019: $264m), of which $99m is attributable to the impact of acquisitions. These increases largely reflect favourable fuel market conditions during the year, an uptake in shopping at convenience stores and Foodservice delivery observed during the pandemic, cost control measures and supportive government initiatives.
UK&I capital expenditure totalled $154m in 2020 (2019: $122m) and included the build of 15 new-to-industry sites and investment in developing our Foodservice offering with 42 new Foodservice sites opening in the year (excluding the acquisition of Scotco Restaurants).
(1) Adjusted EBITDA is defined as earnings before interest, tax, depreciation and amortisation, before exceptional items
Our UK&I business is well positioned in the market and we aim to continue to grow and develop through the following strategic activities:
• Continued investment in the estate through new sites. In order to have a constant pipeline of future new-to-industry sites, we place significant focus on the acquisition of land, with 28 land banks held at December 31, 2020 that have been identified for future development. From this land bank portfolio it is expected that we will open 20 new-to-industry sites in the UK&I during 2021
• Rollout of additional Foodservice offerings, as well as the Group’s newly acquired proprietary LEON Restaurants and Cooplands bakery
• Expanding the ‘Asda On the Move’ Grocery & Merchandise concept to more sites across our UK&I network, to enhance our customer convenience offering
• Successful integration of LEON Restaurants, the 52 KFC restaurants from Amsric Foods and the Cooplands business into the existing operations of the Group, using our experience of Foodservice operations and convenience stores to maximise the earnings potential of these newly acquired businesses
Strategic priorities

36 EG Group | 2020 Annual Report and Financial Statements
OPERATING REVIEW CONTINUED
EUROPE:CONTINENTALEUROPE
IMPACT OF COVID‑19Our Continental European business was the first region of the Group impacted by COVID-19 restrictions, with a localised lockdown implemented on February 21, 2020 in Italy, followed by a nationwide Italian lockdown on March 9, 2020. Following Italy, lockdowns and restrictions were put in place in each country in which we operate, with France, Benelux and finally Germany going into lockdown on April 3, 2020.
These lockdowns resulted in a significant decrease in road travel and hence our fuel sales volumes. Our sites remained open during the lockdowns as they were deemed an essential service. In addition to the impact on fuel volumes, most of our European Foodservice outlets were temporarily closed or transitioned to operating on a ‘to-go’ basis only. Despite this, our Grocery & Merchandise sales outperformed pre-pandemic levels in most countries, as customers switched to shopping at convenience stores as opposed to big box retailers during the pandemic.
A notable consequence of the travel restrictions imposed was on the trading activities of our highway sites in France, where activity levels rely on long distance travel and tourism, which were specifically restricted by the French government during the national lockdown.
A temporary increase in activity levels was observed during our third quarter, where travel restrictions and lockdown measures were relaxed during the summer months; however, the final quarter of 2020 saw each country within our Continental European estate negatively impacted by further outbreaks of COVID-19 and renewed lockdown measures, with an impact on trading and performance to a similar extent to that observed at the outbreak of the pandemic.
Management worked proactively to manage cash throughout the pandemic, including the implementation of cost control measures across our business operations and engagement with the government to access employment support schemes. Notably, the Group agreed with the European tax authorities to defer payment of $539m of indirect taxes which fell due for payment at the height of the pandemic.
TOTAL SITES(1)
3,091
(2019: 3,134)
NUMBER OF EMPLOYEES(1)
7,248
(2019: 7,857)
CUSTOMERS SERVED DURING 2020(1)
220m
(2019: 205m)
(1) As at December 31, 2020 (and at December 31, 2019 for the comparative period)

37EG Group | 2020 Annual Report and Financial Statements
35% 60%5%
FOODSERVICEGROCERY & MERCHANDISE(1)
FUEL
2020 GROSS PROFIT BY BUSINESS STREAM
FINANCIALSGOVERNANCESTRATEGIC REPORT
GROCERY & MERCHANDISE FOODSERVICE FUEL
(1) Also includes other gross profit

38 EG Group | 2020 Annual Report and Financial Statements
OPERATING REVIEW CONTINUED
EUROPE:CONTINENTAL EUROPECONTINUED
OPERATIONAL REVIEWOur Continental European business primarily consists of the French and Benelux operations of EFR acquired in 2016, and the 2018 acquisitions of Esso Italy, NRGValue (the Netherlands) and Esso Germany. Within the Continental European region we operate a highway site network of 235 sites, whilst a further 309 of our sites are unmanned and retail fuel only (in France and Benelux).
Our European estate also represents the highest proportion of company-owned, not company-operated (“CONCO”) sites, with 2,072 dealer-operated sites at the end of 2020, largely across Italy and Germany. We continued to review and identify dealer-operated sites suitable for conversion to our preferred COCO model, with 61 conversions taking place during the year.
Throughout 2020 there has been continued focus on Foodservice investment across Continental Europe with the rollout of several local speciality third-party branded outlets including La Croissanterie and Stratto in France. Whilst the controlled reduction in discretionary capital expenditure as a result of the pandemic impacted the number of outlets opened during 2020, this continues to be a priority for our business in Continental Europe, following in the footsteps of our successful UK&I Foodservice business.
On December 14, 2020, EG Group announced its agreement to acquire OMV’s forecourt business in Germany for a total purchase consideration of $582m. The OMV Retail business is a very well respected operation with an excellent portfolio of 285 sites in Southern Germany, complementing EG’s existing German site portfolio. This transaction demonstrates our confidence in the market and that we believe there is significant opportunity to build upon our scale and market share. We expect this transaction to complete in the final quarter of 2021, subject to regulatory clearances.
On March 18, 2021, EG Group also completed the acquisition of ten German truck stops and six Burger King restaurants from KMS Autohof, an acquisition which provides increased network presence in the German truck stop and Foodservice offering.
SITE NUMBERS BY OPERATING MODEL
33% COCO
46% CONCO
21% OTHER

39EG Group | 2020 Annual Report and Financial Statements
FINANCIALSGOVERNANCESTRATEGIC REPORT
FINANCIAL REVIEWRevenue for Continental Europe in 2020 decreased by $2,734m, or 23%, to $9,352m (2019 restated: $12,085m). The revenue decrease was largely due to lockdown restrictions across Continental Europe which saw Fuel volumes and Foodservice sales decrease by 18% and 73% respectively year-on-year, albeit this was partly offset by a 14% increase in Grocery & Merchandise sales and higher than average fuel margins.
Adjusted EBITDA(1) increased by $11m to $432m (2019: $421m) and operating profit increased by $72m to $172m (2019: $100m). Notwithstanding the decline in revenue, the growth in EBITDA was primarily due to a decrease in operational expenditure with cost saving initiatives in response to the pandemic being implemented in the year.
Fuel gross profit of $575m increased by $18m (2019: $557m) and non-fuel gross profit of $378m decreased by $7m (2019: $385m). These decreases are attributable to the reduction in store footfall due to lockdown restrictions imposed across Continental Europe at the outset of the pandemic, with Italy and France most significantly impacted. An additional factor impacting fuel margin in our Continental European business is our fuel supply and distribution business, EG Fuel, which, in addition to its third-party customer base, supports our Benelux and France businesses. The profitability of EG Fuel is driven by fuel wholesale market conditions and during 2020 fuel revaluation losses due to falling wholesale fuel prices impacted reported earnings.
European capital expenditure totalled $56m in 2020 (2019: $106m). Management initiated expenditure reductions at the outset of the pandemic to preserve liquidity, resulting in also half of the year’s expenditure being only maintenance expenditure, and a material reduction in discretionary growth capital projects. As lockdown restrictions lifted, expenditure on growth projects resumed in the second half of the year, and investments were made into new Foodservice rollouts and store refits.
The unprecedented market conditions faced during 2020 in light of the COVID-19 pandemic has deferred the execution of our strategic objectives in Continental Europe, but we remain focused on developing our Continental European business through the following initiatives:
• In France, a key focus area is the success in our strategy on motorway site tenders, with subsequent Grocery & Merchandise and Foodservice rollouts at these lucrative high-throughput sites. We also aim to expand our relationship with Carrefour, a leading grocery retail brand, to enhance our Grocery & Merchandise offering
• Our Benelux strategy is focused on further rollout of Foodservice outlets and the continued enhancement of our Grocery & Merchandise offering through branded offerings
• A large number of our dealer-operated sites in Italy and Germany have been identified for conversion to our preferred COCO business model. Whilst these conversions are already underway, with 56 taking place during 2020, we will seek to undertake additional conversions when our current dealer agreements expire. Furthermore, there is an opportunity to establish and develop the Grocery & Merchandise and Foodservice offerings at our forecourts which are currently under-developed in the Italian and German markets
Strategic priorities
(1) Adjusted EBITDA is defined as earnings before interest, tax, depreciation and amortisation, before exceptional items
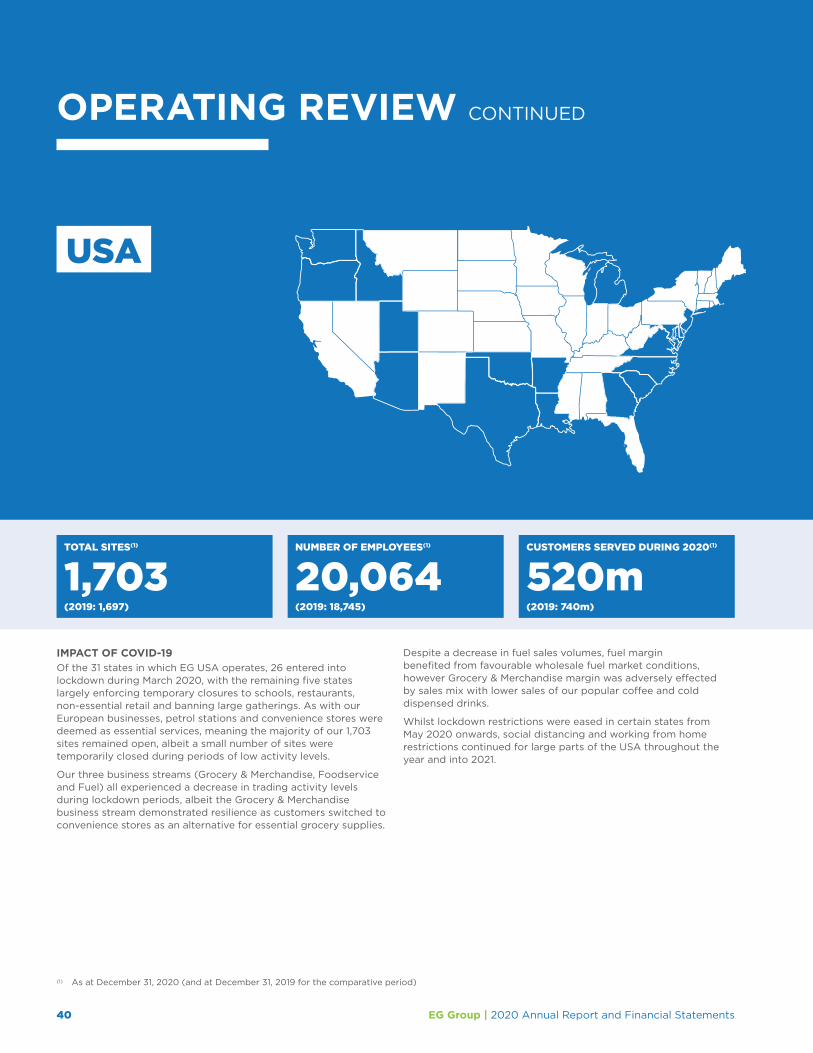
40 EG Group | 2020 Annual Report and Financial Statements
OPERATING REVIEW CONTINUED
USA
IMPACT OF COVID‑19Of the 31 states in which EG USA operates, 26 entered into lockdown during March 2020, with the remaining five states largely enforcing temporary closures to schools, restaurants, non-essential retail and banning large gatherings. As with our European businesses, petrol stations and convenience stores were deemed as essential services, meaning the majority of our 1,703 sites remained open, albeit a small number of sites were temporarily closed during periods of low activity levels.
Our three business streams (Grocery & Merchandise, Foodservice and Fuel) all experienced a decrease in trading activity levels during lockdown periods, albeit the Grocery & Merchandise business stream demonstrated resilience as customers switched to convenience stores as an alternative for essential grocery supplies.
Despite a decrease in fuel sales volumes, fuel margin benefited from favourable wholesale fuel market conditions, however Grocery & Merchandise margin was adversely effected by sales mix with lower sales of our popular coffee and cold dispensed drinks.
Whilst lockdown restrictions were eased in certain states from May 2020 onwards, social distancing and working from home restrictions continued for large parts of the USA throughout the year and into 2021.
TOTAL SITES(1)
1,703(2019: 1,697)
NUMBER OF EMPLOYEES(1)
20,064(2019: 18,745)
CUSTOMERS SERVED DURING 2020(1)
520m
(2019: 740m)
(1) As at December 31, 2020 (and at December 31, 2019 for the comparative period)

41EG Group | 2020 Annual Report and Financial Statements
GROCERY & MERCHANDISE FOODSERVICE FUEL
51% 48%1%
FOODSERVICEGROCERY & MERCHANDISE(1)
FUEL
2020 GROSS PROFIT BY BUSINESS STREAM
®
®
(1) Also includes other gross profit
FINANCIALSGOVERNANCESTRATEGIC REPORT

42 EG Group | 2020 Annual Report and Financial Statements
OPERATING REVIEW CONTINUED
USACONTINUED
SITE NUMBERS BY OPERATING MODEL
96% COCO
4% CONCO
OPERATIONAL REVIEWFollowing the 2019 acquisitions of Fastrac, Certified Oil and Cumberland Farms, a major focus in 2020 was the integration of these businesses into our existing USA business under the leadership of our high-quality management team in Westborough, Massachusetts.
EG USA now operates in 31 states and is the fourth(1) largest independent c-store estate in the country by store number, with 1,703 sites (2019: 1,697 sites). We expect our store numbers to continue increasing year-on-year as a result of our investment in new-to-industry sites, of which there were seven in 2020.
Despite our controlled reduction in discretionary capital expenditure projects in response to the pandemic, we have continued to make good progress in the rollout of new Foodservice offerings, particularly in the second half of the year, with the introduction of Taco John’s, Sbarro and Cinnabon into our USA estate, with further rollouts of these brands planned for 2021 and beyond.
Additionally, during 2020 we began trialling our new proprietary Foodservice concept ‘Fresh and Go’ within our Cumberland Farms estate with five trial sites operating at the year end.
On December 31, 2020 we completed the acquisition of 18 COCO convenience stores in Northern Colorado from Schrader Oil for consideration of $51m. This bolt-on acquisition strengthens and complements our existing store operations in Colorado operated through our Loaf ‘n’ Jug subsidiary, increasing the number of sites in the state to 105 and increasing our competitive position in the north of that state.
On October 23, 2021, the Group concluded negotiations to acquire 34 convenience stores and two development sites in Georgia and South Carolina, USA, and a Foodservice brand, for gross consideration of $278m. The transaction was effective from October 30, 2021, is subject to regulatory approvals, and is expected to complete by the end of 2021. This acquisition expands EG’s presence in the USA to two additional states, and post-completion EG will operate over 1,750 sites across 33 states.
(1) After the 7&I acquisition of Speedway in 2021
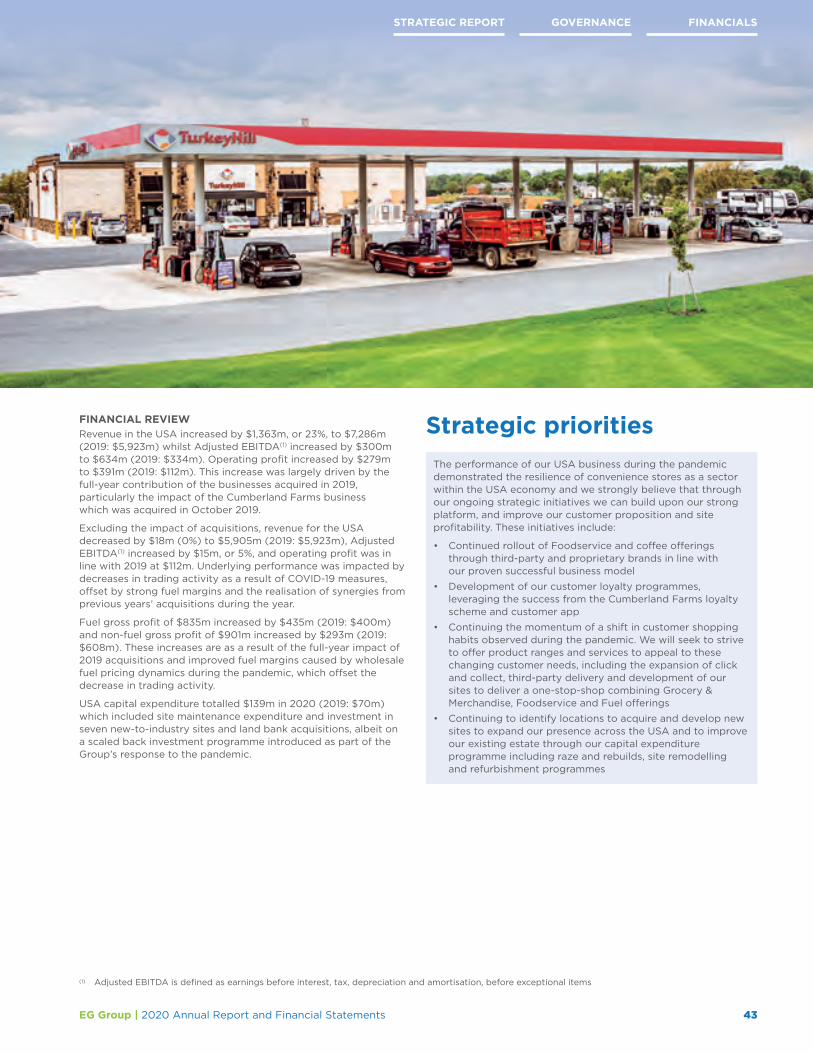
43EG Group | 2020 Annual Report and Financial Statements
FINANCIAL REVIEWRevenue in the USA increased by $1,363m, or 23%, to $7,286m (2019: $5,923m) whilst Adjusted EBITDA(1) increased by $300m to $634m (2019: $334m). Operating profit increased by $279m to $391m (2019: $112m). This increase was largely driven by the full-year contribution of the businesses acquired in 2019, particularly the impact of the Cumberland Farms business which was acquired in October 2019.
Excluding the impact of acquisitions, revenue for the USA decreased by $18m (0%) to $5,905m (2019: $5,923m), Adjusted EBITDA(1) increased by $15m, or 5%, and operating profit was in line with 2019 at $112m. Underlying performance was impacted by decreases in trading activity as a result of COVID-19 measures, offset by strong fuel margins and the realisation of synergies from previous years’ acquisitions during the year.
Fuel gross profit of $835m increased by $435m (2019: $400m) and non-fuel gross profit of $901m increased by $293m (2019: $608m). These increases are as a result of the full-year impact of 2019 acquisitions and improved fuel margins caused by wholesale fuel pricing dynamics during the pandemic, which offset the decrease in trading activity.
USA capital expenditure totalled $139m in 2020 (2019: $70m) which included site maintenance expenditure and investment in seven new-to-industry sites and land bank acquisitions, albeit on a scaled back investment programme introduced as part of the Group’s response to the pandemic.
(1) Adjusted EBITDA is defined as earnings before interest, tax, depreciation and amortisation, before exceptional items
The performance of our USA business during the pandemic demonstrated the resilience of convenience stores as a sector within the USA economy and we strongly believe that through our ongoing strategic initiatives we can build upon our strong platform, and improve our customer proposition and site profitability. These initiatives include:
• Continued rollout of Foodservice and coffee offerings through third-party and proprietary brands in line with our proven successful business model
• Development of our customer loyalty programmes, leveraging the success from the Cumberland Farms loyalty scheme and customer app
• Continuing the momentum of a shift in customer shopping habits observed during the pandemic. We will seek to strive to offer product ranges and services to appeal to these changing customer needs, including the expansion of click and collect, third-party delivery and development of our sites to deliver a one-stop-shop combining Grocery & Merchandise, Foodservice and Fuel offerings
• Continuing to identify locations to acquire and develop new sites to expand our presence across the USA and to improve our existing estate through our capital expenditure programme including raze and rebuilds, site remodelling and refurbishment programmes
Strategic priorities
FINANCIALSGOVERNANCESTRATEGIC REPORT

44 EG Group | 2020 Annual Report and Financial Statements
OPERATING REVIEW CONTINUED
AUSTRALIA
IMPACT OF COVID‑19Our Australian business remained fully open during the pandemic, providing an essential service to our customers. Similar to our other regions within the Group, fuel sales volumes declined year-on-year as the Australian state governments introduced lockdowns and social restrictions across the country. However, fuel margins benefited from favourable market conditions as the decline in global oil prices reduced wholesale fuel costs.
A strong performance in the Grocery & Merchandise business was observed in Australia during 2020 as customers turned to the convenience channel to avoid the more frequented supermarkets that were experiencing supply shortages.
Management worked proactively to manage cash throughout the year, including the agreement of short-term deferrals and credit term extensions at the height of the COVID-19 pandemic, the implementation of tight cost control across our business operations and engagement with the government to access wage support schemes totalling $28m.
Social restrictions eased much quicker in Australia than in other regions and became more focused on having short intense lockdowns at a state level due to localised outbreaks rather than nationwide. Despite the recovery observed, volumes continued to be down on prior year at the end of 2020 and early 2021 as working from home/hybrid working continued for many industries.
OPERATIONAL REVIEWOur Australian site network is the second largest independent c-store retailer by fuel volume in the country, and third largest by site number. It consists of 540 COCO sites, of which over 99% are leasehold (following a sale and leaseback transaction of six sites in late 2020 and nine sites in early 2021), with nearly 40% of these sites having a remaining lease life of over 20 years. Throughout 2020, we expanded our presence in Australia through the opening of seven new-to-industry sites, albeit this increase was offset by the closure of four sites in the existing network.
During 2020, significant progress was made towards the transition of operations and systems from Woolworths to EG, with the Group successfully rolling off its transition services agreement in early 2021, following a significant investment in both systems and people during 2020.
Whilst management remained focused on navigating the challenges of the pandemic and the safety of its customers and colleagues, the year saw us open seven new-to-industry sites which are currently being piloted under the EG brand and investment into store refreshes/refurbishment, with 79 refits undertaken in the year providing a platform to enhance our Grocery & Merchandise offering.
TOTAL SITES(1)
540(2019: 537)
NUMBER OF EMPLOYEES(1)
4,485(2019: 4,193)
CUSTOMERS SERVED DURING 2020(1)
94m(2019: 120m)
(1) As at December 31, 2020 (and at December 31, 2019 for the comparative period)
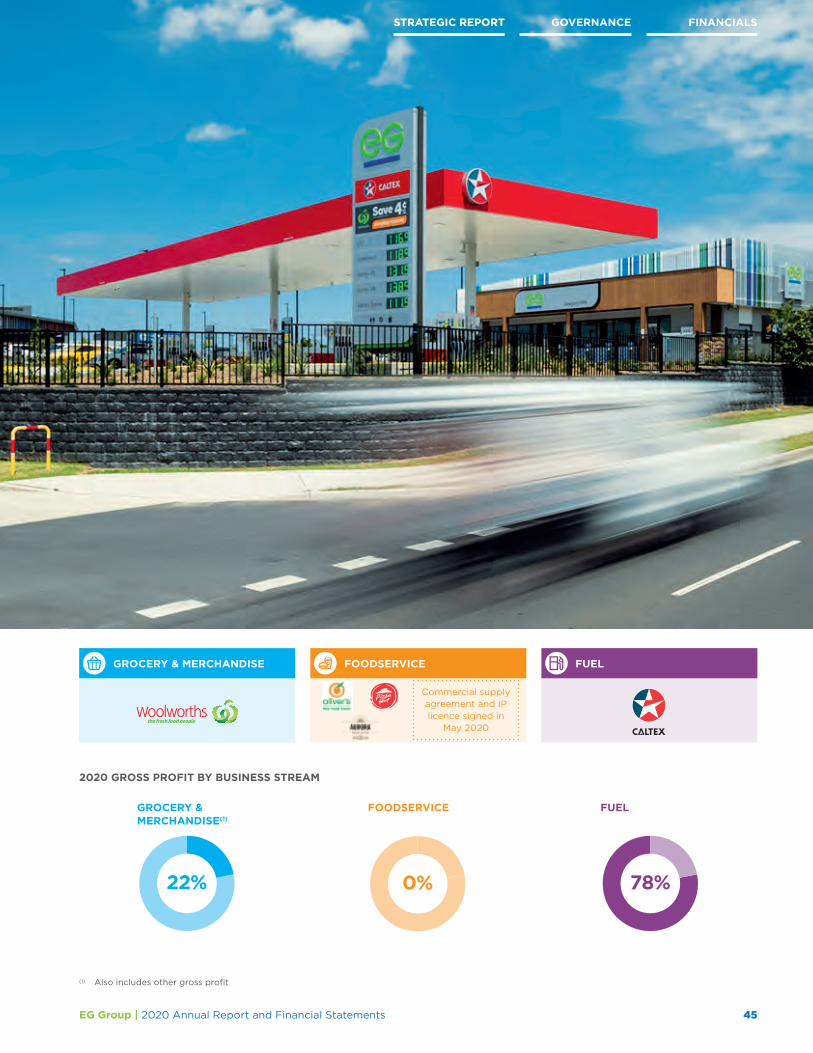
STRATEGIC REPORT
45EG Group | 2020 Annual Report and Financial Statements
GROCERY & MERCHANDISE FOODSERVICE FUEL
22% 78%0%
FOODSERVICEGROCERY & MERCHANDISE(1)
FUEL
2020 GROSS PROFIT BY BUSINESS STREAM
FINANCIALSGOVERNANCESTRATEGIC REPORT
Commercial supply agreement and IP licence signed in
May 2020
(1) Also includes other gross profit

46 EG Group | 2020 Annual Report and Financial Statements
OPERATING REVIEW CONTINUED
AUSTRALIACONTINUED
OPERATIONAL REVIEW CONTINUEDWe developed a number of Foodservice partnerships during the year, starting in May 2020 where we signed a long-term commercial supply agreement and intellectual property (“IP”) licence with Olivers Real Food, giving us an exclusive licence to use the ‘Olivers Food to Go’ (“OFTG”) trademark and to sell OFTG products in our Australian site network for an initial term of ten years. Building on this success, we also opened Pizza Hut and Café Aurora Foodservice offerings in the final quarter of the year, as well as installing a new branded coffee offering at our refurbished sites.
FINANCIAL REVIEWThe acquisition of our Australian business, Fuelco, completed on April 1, 2019 and therefore the comparative period referenced for the prior year was a nine-month period.
Revenue for Australia during 2020 decreased by $133m, or 5%, to $2,364m (2019: $2,497m). The revenue decrease was primarily related to the impact of reduced Fuel sales volumes.
Adjusted EBITDA(1) increased by $94m to $219m (2019: $125m), and operating profit increased by $84m to $100m (2019: $16m), with the increase being primarily attributable to the additional three months of trading for 2020 as well as a benefit of increased fuel margin due to market conditions and stringent cost control measures.
Fuel gross profit of $311m increased by $92m (2019: $219m) and non-fuel gross profit of $87m increased by $23m (2019: $64m).
Capital expenditure for Australia totalled $37m in 2020 and includes investment in IT systems, as the EG Australia business came off its transitional services agreement with Woolworths, the build of seven new-to-industry sites and a store refresh programme.
SITE NUMBERS BY OPERATING MODEL
100% COCO
Despite the trading and operational challenges experienced during the pandemic, the Australian business continues to present a number of opportunities for EG Group to grow and develop through the following strategic activities:
• To further develop our Grocery & Merchandise offering with the development of our site network through the continued execution of our store refresh programme
• Whilst our Foodservice offering has been developed since our ownership with the introduction of in-store Foodservice brands across eight sites, there remains a significant opportunity to develop Foodservice through the continued rollout across our Australian estate to drive growth in this business stream across our Australian network
• To develop our Fuel capabilities through our product offering and extended forecourt offering
Strategic priorities
(1) Adjusted EBITDA is defined as earnings before interest, tax, depreciation and amortisation, before exceptional items

EG Group | 2020 Annual Report and Financial Statements 47
ENVIRONMENTAL, SOCIAL AND GOVERNANCE
STRATEGIC REPORT GOVERNANCE FINANCIALS
Alongside COVID-19, the past year has seen an unprecedented rise in concerns over climate change, and our resilience to a rising global temperature, on top of widespread concerns around inequality, racial and social justice. As a business, we are fully committed to being a responsible business, for our people, our planet and for wider society
We continue to invest in our people, infrastructure, systems and local communities to deliver long-term value to our shareholders and wider stakeholders. By incorporating these elements into our daily operations and investment considerations, we believe that we can continue to drive sustainable value in the business.
2020 was a year of continued growth for the Group, which presented challenges and change across our global operations. Our priority during the pandemic was to keep our colleagues and customers safe whilst helping to provide essential products and services to our customers and supporting our communities. Our culture and values encourage entrepreneurial and transformative thinking and during the pandemic, our 45,000 colleagues have worked together to adapt our operations, share best practices and develop new capabilities and ways of working.
We strive to be an environmentally responsible group and we have robust procedures, systems and controls in place to manage and monitor compliance with relevant legislation. As we operate our existing site network and continue to invest in building new-to-industry sites, environmental factors remain a key consideration.
Our mobility strategy is evolving at pace as part of the transition to alternative fuels and our own objective to reduce our carbon footprint.
Towards the end of 2020 and in the first quarter of 2021 we welcomed three leading independent, Non-Executive Directors onto the Board and established a more robust Board governance structure. Our Investor Relations function has helped the Group to understand the landscape from an external stakeholder’s point of view and the introduction of Group Internal Audit is helping to develop Group-wide governance.
The recent charity work undertaken through the EG Foundation, combined with the measures to assist communities through the pandemic, demonstrates the contribution the Group makes to society.
Over the next few pages we highlight a range of responsible business practices from across the Group. This will cover the environmental, social and governance aspects of our performance.

48 EG Group | 2020 Annual Report and Financial Statements
ENVIRONMENTAL, SOCIAL AND GOVERNANCE CONTINUED
ENVIRONMENTAL
We are committed to being an environmentally responsible group and aim to manage our impact on the environment. At a site level we actively work to reduce electricity and water consumption and the volume and disposal of waste materials. Strong controls and monitoring procedures are also in place to avoid serious environmental incidents.
Whilst alternative fuels are not yet materially impacting our forecourt operations, we are highly conscious of their importance as the world transitions to a low carbon future. We operate a number of electric chargers across our sites and we are developing a mobility strategy to significantly increase their number in the coming years.
We continue to support the delivery of our vision to operate as a sustainable business, undertaking a range of environmental initiatives to help promote and embed sustainable business practices.
ENERGY CONSERVATIONAutomated Meter Reading (“AMR”) contracts are in place for the UK estate to monitor live energy consumption and this will be rolled out to the rest of the site portfolio to help provide a Group-wide monitoring programme. The rollout of LED lighting (which uses up to 80% less energy) across the estate is continuing and we are also progressing the rollout of solar panel installations. Additionally, we are trialling solar thermal systems to heat hot water tanks naturally through sunlight.
We provide training to site managers on energy conservation and related matters as part of our ‘Energy Efficiency Campaign’. ‘Smart Cool’ systems are currently being trialled which help to increase the efficiency and performance of air conditioning systems, helping to reduce energy consumption through achieving optimal performance of the units.
Separately, we are evaluating battery storage with the aim of securing self-generated electricity supply for the estate at all times; and generating revenue by supplying national grid infrastructure during peak demand times. We have also worked to ensure compliance with the European Energy Efficiency Directive has been met across our European estate. Behavioural changes and staff awareness are also a key part of the strategy to bring down energy consumption; the Group provides training to educate our colleagues on how efficiencies can be achieved.
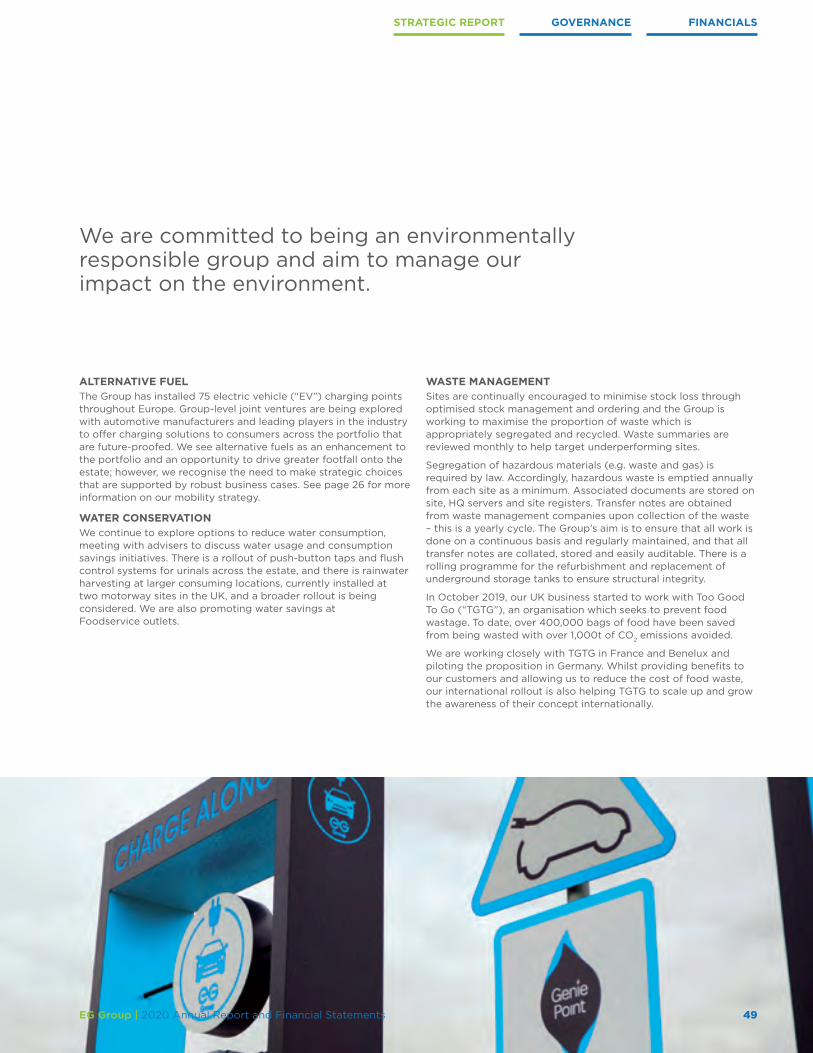
STRATEGIC REPORT GOVERNANCE FINANCIALS
49EG Group | 2020 Annual Report and Financial Statements
ALTERNATIVE FUELThe Group has installed 75 electric vehicle (“EV”) charging points throughout Europe. Group-level joint ventures are being explored with automotive manufacturers and leading players in the industry to offer charging solutions to consumers across the portfolio that are future-proofed. We see alternative fuels as an enhancement to the portfolio and an opportunity to drive greater footfall onto the estate; however, we recognise the need to make strategic choices that are supported by robust business cases. See page 26 for more information on our mobility strategy.
WATER CONSERVATIONWe continue to explore options to reduce water consumption, meeting with advisers to discuss water usage and consumption savings initiatives. There is a rollout of push-button taps and flush control systems for urinals across the estate, and there is rainwater harvesting at larger consuming locations, currently installed at two motorway sites in the UK, and a broader rollout is being considered. We are also promoting water savings at Foodservice outlets.
WASTE MANAGEMENT Sites are continually encouraged to minimise stock loss through optimised stock management and ordering and the Group is working to maximise the proportion of waste which is appropriately segregated and recycled. Waste summaries are reviewed monthly to help target underperforming sites.
Segregation of hazardous materials (e.g. waste and gas) is required by law. Accordingly, hazardous waste is emptied annually from each site as a minimum. Associated documents are stored on site, HQ servers and site registers. Transfer notes are obtained from waste management companies upon collection of the waste – this is a yearly cycle. The Group’s aim is to ensure that all work is done on a continuous basis and regularly maintained, and that all transfer notes are collated, stored and easily auditable. There is a rolling programme for the refurbishment and replacement of underground storage tanks to ensure structural integrity.
In October 2019, our UK business started to work with Too Good To Go (“TGTG”), an organisation which seeks to prevent food wastage. To date, over 400,000 bags of food have been saved from being wasted with over 1,000t of CO2 emissions avoided.
We are working closely with TGTG in France and Benelux and piloting the proposition in Germany. Whilst providing benefits to our customers and allowing us to reduce the cost of food waste, our international rollout is also helping TGTG to scale up and grow the awareness of their concept internationally.
We are committed to being an environmentally responsible group and aim to manage our impact on the environment.
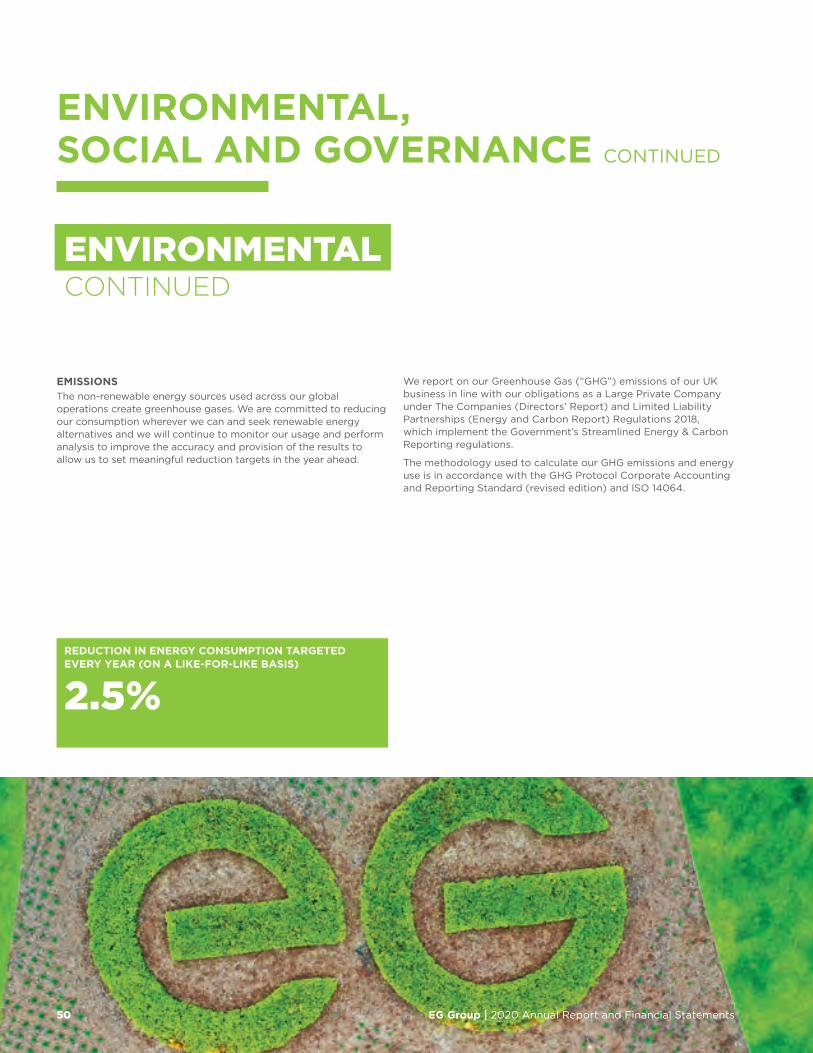
EG Group | 2020 Annual Report and Financial Statements50
ENVIRONMENTAL, SOCIAL AND GOVERNANCE CONTINUED
EMISSIONSThe non-renewable energy sources used across our global operations create greenhouse gases. We are committed to reducing our consumption wherever we can and seek renewable energy alternatives and we will continue to monitor our usage and perform analysis to improve the accuracy and provision of the results to allow us to set meaningful reduction targets in the year ahead.
We report on our Greenhouse Gas (“GHG”) emissions of our UK business in line with our obligations as a Large Private Company under The Companies (Directors’ Report) and Limited Liability Partnerships (Energy and Carbon Report) Regulations 2018, which implement the Government’s Streamlined Energy & Carbon Reporting regulations.
The methodology used to calculate our GHG emissions and energy use is in accordance with the GHG Protocol Corporate Accounting and Reporting Standard (revised edition) and ISO 14064.
ENVIRONMENTALCONTINUED
REDUCTION IN ENERGY CONSUMPTION TARGETED EVERY YEAR (ON A LIKE‑FOR‑LIKE BASIS)
2.5%

EG Group | 2020 Annual Report and Financial Statements 51
OUR UK EMISSIONSThe reporting year for GHG emissions in the Group ran from January 1, 2020 to December 31, 2020 and reports on the emissions of our UK business only.
In order to express our annual emissions in relation to a quantifiable factor associated with our activities, we have used Adjusted EBITDA(1) as our intensity ratio as this is a relevant indication of our growth and is aligned with our business strategy.
The total calculated Scope 1 and 2 emissions for the reporting year are shown in the table below.
Tonnes of CO2 emissions 2020 2019 Variance
Scope 1 emissions 3,349 3,511 -5%
Scope 2 emissions (Location based) 17,520 19,895 -12%
Scope 2 emissions (Market based) 14,880 17,513 -15%
Total carbon – Location based (tCO₂) 20,870 23,460 -11%
Total carbon – Market based (tCO₂) 18,229 21,024 -13%
2020 2019 Variance
Intensity ratio (tCO₂/EBITDA £m) 152.56 169.49 -10%
The above GHG emissions are measured in tonnes of carbon dioxide equivalent (tCO2e), using the location based method using the UK-specific emissions factors published annually by the International Energy Agency (“IEA”). Material carbon emissions sources to the business within the disclosed UK footprint are from natural gas and electricity used across our operational site network, head office and company vehicles.
Total emissions have decreased year-on-year primarily due to the impact of COVID-19 and the consequent reduction in activity at our sites due to lower customer footfall in response to lockdown measures and the temporary closures of our Foodservice outlets in the first half of 2020.
Notwithstanding this, we have seen an increase in renewable solar energy generation as a result of our strategy to install solar panels at our site network to generate sustainable power for our site operations.
OUR ENERGY USEEnergy use (kWh) 2020 2019 Variance
Natural gas 942,102 995,199 -5%
Electricity 75,149,563 77,837,638 -3%
Diesel fuel from company vehicles 3,010,104 3,311,544 -9%
Total 79,101,769 82,144,381 -4%
ON‑SITE RENEWABLE GENERATIONEnergy produced (kWh) 2020 2019 Variance
Solar 5,024,423 4,026,708 +25%
FINANCIALSGOVERNANCESTRATEGIC REPORT
(1) Adjusted EBITDA for all UK entities including SSC

52 EG Group | 2020 Annual Report and Financial Statements
ENVIRONMENTAL, SOCIAL AND GOVERNANCE CONTINUED
SOCIAL
GLOBAL COMMUNITIESWe value the communities across the ten countries in which we operate. Over the last year, we have continued to enable colleagues to have a positive impact within their local communities, with some notable successes being our support of the following charities:
EuropeAcross the UK and Continental Europe, our colleagues are engaged in work to volunteer or collect donations for local charities and causes. For example, in 2020 in Benelux, we continued our main sponsorship of the Ronald McDonald rally, an event to raise money for the Ronald McDonald House Zwolle which offers a second home for parents whose sick or disabled child has been admitted. Additionally, we sponsor and participate in Swim to Fight Cancer Amersfoort, raising money for cancer research and prevention.
Also during 2020, our UK business and colleagues have supported merchandise sales, fundraising and donations, raising thousands of pounds for several good causes including Marie Curie, BBC Children in Need and Royal Manchester Hospital.
USAOur USA business has supported a number of good causes during 2020, including over $450,000 for Disabled American Veterans, almost $250,000 for the American Cancer Society and c.$150,000 for The United Way, across both their COVID-19 relief and educational investment programmes.
In the USA, we also supported ‘Feeding America’ in which we donated 506,380 pounds of food, which was delivered to regional food banks and supplied to local pantries.
Additionally, many store and store support departments have participated in their own volunteer initiatives, including volunteering to stock shelves at a local food bank, building playhouses for local families in need, and delivering Christmas gifts through a local charity around the holidays.
AustraliaWe supported the collection of Salvation Army cash donations during the Australian bushfires at the end of 2019 and early 2020.
STRATEGIC REPORT GOVERNANCE FINANCIALS
53EG Group | 2020 Annual Report and Financial Statements
The EG FoundationThe EG Foundation was established in July 2019 and is complementary to the very active Issa Foundation, established and operated by our Co-CEOs.
The EG Foundation has a vision to operate and enter into and partner with other like-minded organisations that can deliver on its goals to support education, children and young people, health and wellbeing and the environment, which would enable us to create ‘a brighter tomorrow’. This engagement allows us to help and support individuals in becoming thriving members of society as well as giving them the self-belief and understanding they need to live their lives to the full. We believe that access to education, access to knowledge, but above all understanding of how everyone might function together in today’s world, is critical to the EG Foundation’s strategy.
We are rolling out our charity volunteering scheme which will see the Group match five paid days (per annum) to any employee who volunteers their time to assist with a registered charity.
PEOPLE AND CULTUREOur diverse workforce is a key asset of the business and we strive to recruit, develop and retain talent through well-invested training schemes and recognition.
The culture of the Group is underpinned by the values set out on the inside front cover but each of our regions have unique elements, tailored to deliver the best customer experience.
EmployeesWe are fortunate to have a committed workforce whose skills, expertise and passion make a significant contribution to the success of our business. The activities that impact on colleagues are closely monitored to ensure that both strategy and colleague engagement are aligned to keep the Group at the forefront of a competitive marketplace. During the year, we took further steps to add strength and depth to the management team to support the further growth of the business.
We place considerable value on the involvement of our employees and continue to keep them informed on matters that affect them as employees and on the various factors affecting the performance of the Group. We achieve this through regular meetings and employee representatives are consulted on a wide range of matters affecting their current and future interests.
Whilst a number of our businesses have conducted their own employee engagement surveys, to date, we have not undertaken a Group-wide survey. In November 2021, the Group will undertake its inaugural Group-wide employee engagement survey, and we expect that management incentives will have a component linked to this going forward, which accounts for this as well as wider ESG measures.
The Group has the opportunity to make a positive impact on society, including the communities in which we operate and the safety and wellbeing of our colleagues.

54 EG Group | 2020 Annual Report and Financial Statements
ENVIRONMENTAL, SOCIAL AND GOVERNANCE CONTINUED
SOCIALCONTINUED
PEOPLE AND CULTURE CONTINUEDDiversity and inclusionDiversity and inclusion are key to our business and we strive to treat all our employees fairly. Accordingly, we seek to employ people with different ideas, styles and skill sets, all of whom contribute in unique ways. Our willingness and ability to think differently and work in innovative ways is critical to our success. With a formal Equal Opportunities Policy, we are committed to recruiting, promoting and remunerating our people solely on the basis of their ability to contribute to the Group’s objectives.
We are proud to be a founding member of the organisation Diversity in Retail (“DIR”), working alongside other leading UK retailers. DIR is devoted to increasing women’s and ethnic minorities’ representation at all levels and in leadership positions across the retail sector.
Gender Pay StatementWe are committed to treating all our staff equally and to reward them fairly for the work they carry out. We encourage a culture where people can be themselves at work, regardless of their gender or any other characteristic. We are actively working on ways to ensure we close the gender pay gap; to read more, see our Gender Pay Statement which is published on the EG Group website.
We monitor the gender impact of our reward processes – a practice that plays a fundamental role in helping us identify and improve our gender pay gap. This includes conducting a review throughout the organisation to ensure that decisions about pay are made fairly and in keeping with our commitment to diversity. As part of our ongoing work to foster gender balance, we will continue to ensure that we attract a diverse pool of candidates to all job roles.
Training and developmentThere is a robust training programme for store managers including activity to develop their existing skills and to also progress them into leaders of tomorrow. The comprehensive Senior Management programme covers subject areas ranging from financial analysis to people and performance management. This also includes continuing professional development opportunities delivered in an inclusive and accessible medium, using the latest technology via online learning systems, and certified training pathways offered as either apprenticeships or through internal training agreements. The strength of this programme and the robust pool of talent it helps to generate provides the Group with great durability.
We also operate an annual talent review process, which assists with the retention of colleagues and succession planning.
There is an electronic EG induction programme for colleagues across all roles, functions and brands. Once completed, our colleagues then complete operational training, including specific brand training if they are to work within one of our third-party branded outlets. Each of our third-party brand partners has set job roles which have a clearly defined career pathway.

STRATEGIC REPORT GOVERNANCE FINANCIALS
55EG Group | 2020 Annual Report and Financial Statements
The UK business has achieved employer provided status, allowing the Group to deliver apprenticeship training directly, within the values and boundaries of the corporate brand and reputation. It enables us to do things the EG way and allows control over the content to ensure it meets the business needs.
Over 2021 and 2022, EG will be offering 200+ apprenticeships from level 3 to level 7, an increase of over 600%, strategically aligned to support personal, professional, departmental and organisational growth in designated areas of specific need in all business functions.
Training was inaugurated within our finance department in April 2021, with a cohort of level 3 AAT apprentices and plan to extend this further across 2022, introducing AAT apprenticeships from foundation level 2 up to AAT level 4, after which senior colleagues will have an opportunity to undertake level 7 ACCA/CIMA certified training to further develop their career.
Alongside apprenticeships, EG Group is investing in colleagues’ professional development and has embarked on an ambitious learning programme supported by a significant investment in the development of their leadership and management skills through programmes such as coaching and mentoring. Colleagues can also participate in a continuous learning journey, with access to a range of digital learning through EG Group’s in-house Learning Management System, including audio books, podcasts, webinars, and online training seminars.
Employment of disabled personsApplications for employment by disabled persons are always fully considered, bearing in mind the aptitudes of the applicant concerned. In the event of members of staff becoming disabled, every effort is made to ensure that their employment with the Group continues and that appropriate training is arranged. It is the policy of the Group that training, career development and promotion of disabled persons should, as far as possible, be identical to that of other employees.
WellbeingThe Group cares about the wellbeing of our colleagues, and we know that our business relies on having a healthy and safe workforce.
The Group aims to be an employer of choice and we are committed to ensuring colleagues are respected and their views are valued. We have an anti-bullying and harassment policy, which is part of the employee handbook. We deliver training on wellbeing-related issues throughout the year, and communicate widely to colleagues on our policies and programmes. Employee activities are closely monitored to ensure that both strategy and colleague engagement are aligned to keep the Group at the forefront of a competitive marketplace.

EG Group | 2020 Annual Report and Financial Statements56
ENVIRONMENTAL, SOCIAL AND GOVERNANCE CONTINUED
HEALTH AND SAFETYKeeping our colleagues and customers safe is critical to our business and the adaptations of our operations to keep our colleagues safe during the pandemic has amplified the importance of our role in ensuring we have appropriate health and safety policies and procedures.
We are committed to not only meeting our legal obligations but ensuring the business continually improves in order to achieve the highest standards of health and safety practice. We strive to maintain these high standards for our colleagues, customers, visitors, contractors and anyone affected by our business activities.
We have invested heavily in a variety of training courses, externally hosted, in-house and online, to ensure that our staff are trained and competent to complete their assigned tasks in an efficient and compliant manner.
Good health, environment and safety management are considered to be an essential part of the business performance and culture and these areas are on the Board’s agenda. Our health and safety policies and procedures include, but are not limited to:
• Appropriate training and education of all staff to adhere to legal compliance and best practice
• Proactively conducting regular risk assessments and root cause analyses to provide and maintain safe and healthy working environments to significantly reduce occupational injuries or illnesses
• Quarterly audits of health and safety performance
The Group formally monitors health and safety incident rates. All health and safety incidents are recorded on a new software system (iMEGS) and the Group has a commitment to zero accidents and incidents.
BUSINESS ETHICS The Group purchases from a relatively small number of large suppliers. We engage with these companies to ensure their goods, materials and labour-related supply chain are transparent, accountable and auditable, as well as free from ethical ambiguities. We insist on high standards, and we have a formal anti-bribery policy and whistleblowing procedures in place.
The Group is committed to acting ethically and with integrity in all our business dealings and relationships. We work to implement and enforce effective systems and controls to ensure modern slavery is not taking place anywhere in the business or in any of our supply chains.
The Modern Slavery Act 2015 statement, as found on the Group’s website, reflects our commitment to acting ethically and with integrity in all our business relationships and to implementing and enforcing effective systems and controls to ensure slavery and human trafficking is not taking place in the Group’s supply chains. Our commitment applies to all persons working for the Group or on its behalf in any capacity, including employees at all levels, Directors, officers, agency workers, contractors, external consultants, third-party representatives and business partners.
SOCIALCONTINUED

STRATEGIC REPORT GOVERNANCE FINANCIALS
57EG Group | 2020 Annual Report and Financial Statements
GOVERNANCE
As set out in the Wates disclosure section of the Annual Report on pages 78 to 81, the Group has applied the Wates Corporate Governance Principles in the current year.
STRUCTURE AND OVERSIGHTThere are currently seven members of the Board, who speak regularly to discuss the key matters of the Group. Historically, the Board consisted of four Directors – our Co-Founders and Co-CEOs Mohsin Issa and Zuber Issa alongside TDR Capital (“TDR”) representatives Manjit Dale, Founding Partner of TDR, and Gary Lindsay, Partner of TDR.
Between November 2020 and March 2021 we appointed three independent, Non-Executive Directors, being Lord Stuart Rose, Dame Alison Carnwath and John Carey. The biographies of all our Directors can be seen on pages 72 and 73.
TDR is a leading international private equity firm, managing capital on behalf of institutional, governmental and private investors worldwide. TDR was founded in 2002 by Manjit Dale and Stephen Robertson and invests in medium to large-sized businesses, and partners with them to develop and grow their operations.
The Board has overall responsibility for ensuring that the Group maintains a system of internal control, to provide it with reasonable assurance regarding the reliability of financial information that is used within the business. See pages 74 and 75 for further detail on the Board and Group governance structure.
DATA PROTECTION AND CYBER SECURITYWe are subject to regulations and data protection and privacy laws in all the jurisdictions in which we operate regarding the use of personal data and debit and credit card data. We maintain our own databases and ensure that procedures are in place to ensure compliance with data protection laws and regulations. We also have policies and procedures in place to seek to prevent cyber breaches and carry out detailed root cause analysis on any breach that does occur in order to ensure that similar occurrences do not arise.
CODE AND VALUESThe values of the Group can be found on the inside front cover.
STAKEHOLDERSThe Board’s approach to business decisions and the long-term impact on stakeholders is presented in the Group’s Section 172 disclosure on pages 20 and 21.

58 EG Group | 2020 Annual Report and Financial Statements
PRINCIPAL RISKS AND UNCERTAINTIES
RISK MANAGEMENT AND FRAMEWORKEffective risk management aids decision-making, underpins the delivery of our strategy and objectives, and helps to ensure that the risks the Group takes are adequately assessed and actively managed.
As with all businesses, we are affected by a number of risks and uncertainties, some of which are beyond our control. Our risk framework is designed not to eliminate risk, but to identify, assess and mitigate both existing and emerging risks to ensure the business continues to meet its strategic objectives.
The impact of COVID-19 has been felt globally across the Group. As a result, we focused on the immediate and dynamic nature of our significant risks and implementing and monitoring the mitigating actions to ensure we were able to deliver essential services and products, such as fuel and groceries, to our customers whilst maintaining the safety of both our customers and colleagues. Weekly leadership calls were held throughout the year with Country Management Teams to update the Directors with regard to trading and financial performance, local lockdown restrictions and outbreaks as well as other pertinent matters.
The Group’s Executive Management and Country Management Teams are responsible for identification and management of risks within their area. They provide a pivotal link, escalating information to the Group’s Directors regarding changes to the risk environment and identifying emerging risks as well as cascading information to their teams around business strategy.
During 2020 the Group established a Group Internal Audit function to work alongside the Finance and Technology teams to enhance the internal controls relating to these areas. As a result of the pandemic, work was delayed until the second half of 2020 and continued into 2021. Following changes to the Board’s composition (please refer to pages 72 and 73) a detailed review of EG’s risk management processes has taken place and an enhanced risk framework is being implemented throughout 2021.
The Group has reviewed and documented in a Group risk register its principal risks i.e. the significant risks facing the business that would threaten the business model, future performance, solvency and/or liquidity. The risk register details the level of inherent and residual risk based on an assessment of the controls in place. The list does not compromise all the risks that the Group may face and they are not listed in any order of priority. An assessment has been carried out and our current view is that these risks remain stable, but we continue to monitor any changes, via the Audit & Risk Committee as part of our risk management process.
COVID‑19COVID-19 continues to impact our colleagues, customers, suppliers and operations to varying degrees across different territories and different parts of our business. This includes, but is not limited to: risks to the wellbeing of our people, their families and communities; our customers; our suppliers, whose businesses have had challenges maintaining continuity of supply; and our own operations which have had to deal with all the combined challenges of the pandemic.
Details regarding the impact of COVID-19 on our financial and trading performance can be found on pages 71.
Actively managing and monitoring risks will ensure that the business continues to meet its strategic objectives.

STRATEGIC REPORT GOVERNANCE FINANCIALS
59EG Group | 2020 Annual Report and Financial Statements
BREXITThe new UK-EU Trade and Cooperation Agreement (“TCA”) came into effect from January 1, 2021, setting out the conditions for tariff-free trading with the EU and removing the uncertainty of a no-deal Brexit. The business is now impacted by border controls, goods inspection and customs documentation, with the most trade friction being between Great Britain and Northern Ireland and Ireland. In addition, the availability of HGV drivers is already having a significant impact on the supply chain and UK economy. The full effect of Brexit on the business will emerge as new trade patterns are established and the new regulatory framework is better understood.
Going forward, we are not immune from the uncertainties that affect our economy as a result of both COVID-19 and Brexit and the outlook remains unclear. These areas remain a key focus for the Board and regular updates on developments are provided.
OUR NEW RISK FRAMEWORKDuring 2020 and 2021, key aspects of the risk framework have been reviewed and the Group has focused on formalising and documenting the Group’s principal risks and its approach to risk management. A Group risk management policy is being adopted, setting out the key roles and responsibilities as well as a consistent Group-wide framework for the identification, assessment and management of risks, based on the three lines of defence model. Our framework, whilst being simple and pragmatic, seeks to strike the right balance of achieving the Group’s strategy and delivering on its mission, but within the accepted levels determined by the Board.
The Board will maintain overall responsibility of risk management and the effectiveness of the policy with an increased focus on scenario planning and horizon scanning during Board meetings. Via delegated authority, the Audit & Risk Committee will oversee the implementation of the risk process as well as the effectiveness of the controls and mitigation.
Key risk categories have been identified, these include: Strategic, Operational, Compliance, Regulation and Data, People, Technology, Financial and Fraud. Key members of Executive Management have been assigned responsibility for their respective areas and an executive-level Risk & Disclosure Committee was established in 2021. The first meeting was held on August 13, 2021 and the Committee will continue to meet on a quarterly basis and on an ad hoc basis where required.
Further details regarding the Group’s risk framework will be provided in the Group’s 2021 Annual Report and Financial Statements.
Current risks:Risks that could affect our business, customers, supply chain, employees and stakeholders and impact the achievement of strategic goals
Emerging risks:‘New’ risks with a future impact, identified through the internal risk assessment process
STRATEGIC
OPERATIONAL
COMPLIANCE, REGULATION & DATA
FINANCIAL
FRAUD
PEOPLE
TECHNOLOGY
Risk ownership:Each risk has a named owner
Risk scoring:Each risk is assessed in terms of impact and likelihood, using a standard scoring scale
Inherent risk: Before mitigating controls
Residual risk:After mitigating controls are applied
Target risk:Desired or acceptable level of risk
Actions: Including target dates to address current risks scoring higher than target risks
WHAT WE WILL MONITOR
Risk categoriesRisk landscape What we assess

60 EG Group | 2020 Annual Report and Financial Statements
PRINCIPAL RISKS AND UNCERTAINTIES CONTINUED
Risk Impact Mitigation
Strategic risk
ACQUISITION RISKA core element of the Group’s growth strategy is through selective acquisitions.
Acquired businesses may fail to realise expected synergies, growth targets and performance, impacting Group profitability and cash flows.
The Group has detailed targeted appraisal procedures in place, including appropriate due diligence, and has a dedicated M&A function and transition teams who focus on the acquisition and integration of new businesses. We have robust Board approval procedures to ensure the thorough and detailed review of acquisition proposals.
Integration plans are finalised prior to acquisitions completing to ensure newly acquired businesses are integrated efficiently and swiftly, we regularly assess the business strategy and performance of each entity within the portfolio against strategic KPIs, and Executive Management and the Board review performance of the acquisitions on a monthly basis.
CLIMATE CHANGE AND THE TRANSITION TO A LOWER CARBON ECONOMYDevelopments in policy, law, regulation, technology and markets. Changing societal and investor sentiment, related to the issue of climate change and increased preferences for alternatives to fossil fuels including hybrid and electric vehicles.
Significant changes to the forecourt industry, which would adversely affect our business plans and financial performance.
The Group remains aware of changing industry and consumer trends and operates an agile business model which is committed to being environmentally responsible, positively managing our impact on the environment.
Significant investment in our non-fuel offering is a cornerstone of the Group’s long-term diversification strategy. A significant, and increasing proportion of the Group’s gross profit is non-fuel.
In developing a well-invested network of sites, the Group’s focus is on developing multi-use retail sites that are well placed to adapt and evolve beyond a traditional fuel offering to cater for changing customer demands for convenience retail as well as new motor vehicle fuel sources, such as electric vehicle charging. Whilst not yet materially impacting site operations, the Group remains highly conscious of the importance of alternative, low-carbon fuels. We have invested in the provision of facilities for electric vehicles and have a strategy to significantly increase their number in the coming years.
Further details of our response to environmental issues and challenges can be found in our ESG report on pages 47 to 57.
KEY
New risk Increased risk Remains a principal risk Decreased risk

STRATEGIC REPORT GOVERNANCE FINANCIALS
61EG Group | 2020 Annual Report and Financial Statements
Risk Impact Mitigation
Strategic risk continued
MACROECONOMIC CONDITIONSThe Group’s financial performance is dependent on national and regional economic conditions and consumer confidence in the territories in which we operate.
The systemic impact of a potential long-term and widespread recession, reduced gross domestic product growth or production, higher energy costs, fluctuation in commodity prices (including changes in fuel prices), strong currency fluctuations, inflationary pressures, the availability and cost of credit, diminished business and consumer spending and increased or persistent unemployment in its countries of operation, could have a material adverse effect on our business, financial condition, liquidity, results of operations and prospects.
Several factors limit the impact on the Group, including the geographical spread of our businesses, a flexible cost base and supply chain.
The Group’s offering is constantly reviewed to ensure it continues to meet customer requirements in terms of price, relevance and quality in a changing macroeconomic landscape. As demonstrated in our response to COVID-19, the Group has continued to demonstrate its ability to react to unexpected changes and proactively respond to such events, and we continue to have measures available to minimise the effects on profitability and cash generation should the need arise.
COMPETITIONThe Group faces significant competition within each of our operating regions from other existing forecourt retailers, c-stores, food retailers, grocery stores, supermarkets and fast-food concessions drawn from local and large-scale multinational corporations, as well as from new competitors entering the markets that we serve.
We may face difficulties competing in the highway concession market. These operations, which are among our most profitable, depend on authorisations from governmental regulatory agencies in the countries in which we operate, which are subject to bid, expiration, limitation on renewal and various other risks and uncertainties. There can be no guarantee we will obtain or be able to renew highway concessions on favourable terms or at all in both the public and private sectors. This is in turn influenced by macroeconomic factors, consumer confidence and government spending policy in our key markets.
Competitive pressures could result in a loss of market share and may require us to lower prices, increase capital, marketing and advertising expenditures or increase the use of discounting or promotional campaigns. This may also restrict our ability to increase prices, including in response to commodities or other cost increases.
Management continually assess the Group’s competitive position in relation to price, customer service, choice and quality of product to ensure the Group continues to meet changing customer demands.
We continue to evolve our proposition through investment in our site infrastructure, the rollout of non-fuel brand partnerships and training of colleagues to deliver the highest possible standard of service.

62 EG Group | 2020 Annual Report and Financial Statements
PRINCIPAL RISKS AND UNCERTAINTIES CONTINUED
Risk Impact Mitigation
Strategic risk continued
GROWTH STRATEGYThe Group’s strategy for expansion is based on a mix of organic growth and selective acquisitions. The strategy is subject to a number of risks, including:
• Failure to identify, acquire and develop new sites or upgrade existing sites
• Failure to convert sites to our preferred COCO model
• Inadequate acquisition due diligence
• Inability to meet capital expenditure requirements for development or refurbishment
Failure to successfully implement our growth strategy could adversely affect Group profitability, leading to an inability to attract further investment and stalled growth.
All material acquisitions require Board approval and to date all acquisitions have been in sectors (PFS, Foodservice) that the Group knows well. For large acquisitions, and those where the Group enters new territories, the Group engages with investment banks to increase its chance of success. Organic growth is achieved both through operational improvements and through growth capex. Operational performance of the Group is monitored in weekly calls with the management of all countries of operation, chaired by Zuber Issa (Co-CEO) and attended by Paul Altschwager (Group CFO). Capital spend decisions are approved by Zuber Issa in the monthly property meeting with the criteria and thresholds for investment well established.
Operational risk
FUEL PRICINGThe Group’s margin on fuel can be impacted by fluctuations in wholesale fuel pricing. These fluctuations can be influenced by global supply, weather events, political decisions or changes in regulations.
An inability to pass on cost increases to customers could impact the Group’s margins.
The Group’s fuel inventory holdings average between five and eight days and turns more than 70 times per year. Therefore, changes in wholesale fuel costs are normally able to be passed onto customers within a short period, reducing the Group’s exposure to reductions in fuel margins. In addition, experienced commercial teams develop and monitor fuel pricing strategies and maintain a strong commercial focus on fuel procurement to further manage and mitigate this risk.
Also, a significant, and increasing proportion of the Group’s gross profit is non-fuel, reducing the relative importance of fuel gross profit to overall Group profit.
RELIANCE ON THIRD PARTIES AND PARTNERSKey aspects of our business rely on third parties and partners. These include:
• Fuel suppliers
• Brand partners
• IT support
As we have no direct operational or financial control over third parties, any significant disruption, adverse event, change in commercial relationship or change to their operations could adversely impact our business.
Material adverse effect on business, financial condition, liquidity, result of operations and prospects.
‘Knock on’ reputational damage.
Inability to attract customers.
The Group procures fuel from a range of third-party suppliers, minimising, as far as possible, reliance on any single supplier. The Group also operates a number of supply depots in certain European locations where fuel is stored prior to its distribution to European forecourts.
The Board has developed and maintained strong relationships with brand partners.
During 2020 an extensive programme has been undertaken to engage with third-party providers key to our IT operations and ensure the Group has visibility of, and confidence in, their internal controls.

STRATEGIC REPORT GOVERNANCE FINANCIALS
63EG Group | 2020 Annual Report and Financial Statements
Risk Impact Mitigation
Operational risk continued
BUSINESS SYSTEMSThe Group relies heavily on the timely development, implementation, and continuous and uninterrupted performance of an extensive network of automated systems to manage data and conduct its business. The continuing prevalence and increasing sophistication of cyber-crime and data loss incidents, along with more stringent data protection legislation compliance requirements, present risks to all businesses and organisations across the globe.
If investment in both systems and infrastructure does not keep pace with the growth of the business there may be a limitation to the Group’s ability to trade and expand.
A major failure of systems or a cyber-attack could result in a temporary inability to conduct operations or a loss of commercial and/or customer data. Such an incident may result in regulatory breaches, financial loss, disruption or damage to the reputation of the Group.
The Group continually monitors the effectiveness of business systems and has a programme of investment to ensure they are fit for purpose and support the Group’s strategy. The Group is currently upgrading the Continental Europe ERP platform to SAP and considering strategies for the full alignment of ERP systems across the Group.
During 2020 a programme has been undertaken to review and, where necessary, enhance the effectiveness of IT General Controls across key systems and applications.In addition, key initiatives have been agreed and rolled out during 2021 such as a Security Operations Centre, simulated cyber incident testing and additional eLearning modules for all colleagues.
Following the programme to ensure Group compliance with the requirements of the General Data Protection Regulation (“GDPR”), ongoing reviews have been undertaken during 2020 to confirm the effectiveness of the relevant processes and controls.
Staff are regularly briefed on cyber risks and controls.
LEGISLATIVE AND REGULATORY REQUIREMENTSThe Group’s operations are affected by various statutes, regulations and standards in the countries and markets in which it operates. The amount of such regulation and the penalties can vary. The Group is subject to the laws governing businesses generally, including laws relating to competition, product safety, data protection, labour and employment practices, accounting and tax standards, international trade, fraud, bribery and corruption, anti-money laundering, terrorist financing, land usage, the environment, health and safety, transportation and other matters.
Failure to comply with such regulations could result in civil or criminal penalties and/or disruption to operations from the temporary or permanent shutdown of operations.
The safety of our operations, staff and customers and compliance with all relevant regulatory requirements is given highest priority and Health, Environment, Safety & Security reports are regularly provided to the Board for all our global sites. Updates are also provided via the Group’s General Counsel and Company Secretary regarding laws and regulations and any incidents of non-compliance and remedies are also provided.
The Group has robust procedures, systems and controls in place to manage and monitor compliance with relevant legislation and ensure operations are conducted safely and to the highest possible standard.
Following the establishment of the Audit & Risk Committee in May 2021, the Group continues to enhance and streamline reporting with regard to compliance reporting.
KEY
New risk Increased risk Remains a principal risk Decreased risk
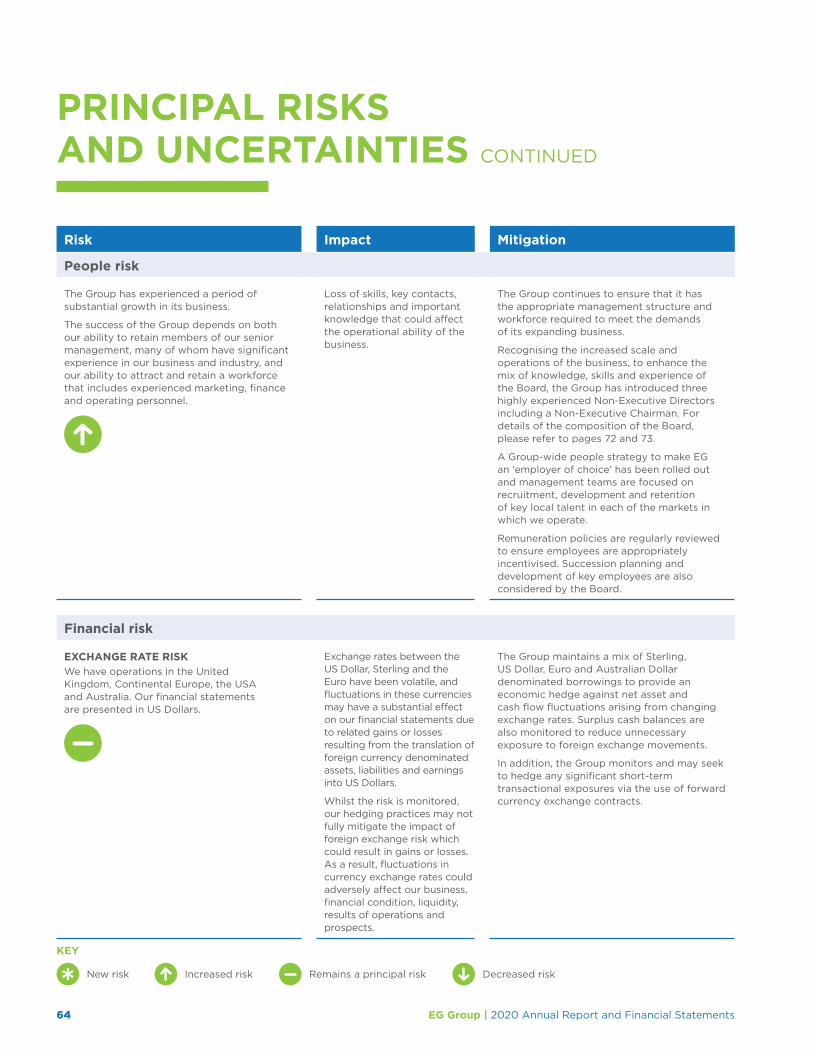
64 EG Group | 2020 Annual Report and Financial Statements
Risk Impact Mitigation
People risk
The Group has experienced a period of substantial growth in its business.
The success of the Group depends on both our ability to retain members of our senior management, many of whom have significant experience in our business and industry, and our ability to attract and retain a workforce that includes experienced marketing, finance and operating personnel.
Loss of skills, key contacts, relationships and important knowledge that could affect the operational ability of the business.
The Group continues to ensure that it has the appropriate management structure and workforce required to meet the demands of its expanding business.
Recognising the increased scale and operations of the business, to enhance the mix of knowledge, skills and experience of the Board, the Group has introduced three highly experienced Non-Executive Directors including a Non-Executive Chairman. For details of the composition of the Board, please refer to pages 72 and 73.
A Group-wide people strategy to make EG an ‘employer of choice’ has been rolled out and management teams are focused on recruitment, development and retention of key local talent in each of the markets in which we operate.
Remuneration policies are regularly reviewed to ensure employees are appropriately incentivised. Succession planning and development of key employees are also considered by the Board.
Financial risk
EXCHANGE RATE RISKWe have operations in the United Kingdom, Continental Europe, the USA and Australia. Our financial statements are presented in US Dollars.
Exchange rates between the US Dollar, Sterling and the Euro have been volatile, and fluctuations in these currencies may have a substantial effect on our financial statements due to related gains or losses resulting from the translation of foreign currency denominated assets, liabilities and earnings into US Dollars.
Whilst the risk is monitored, our hedging practices may not fully mitigate the impact of foreign exchange risk which could result in gains or losses. As a result, fluctuations in currency exchange rates could adversely affect our business, financial condition, liquidity, results of operations and prospects.
The Group maintains a mix of Sterling, US Dollar, Euro and Australian Dollar denominated borrowings to provide an economic hedge against net asset and cash flow fluctuations arising from changing exchange rates. Surplus cash balances are also monitored to reduce unnecessary exposure to foreign exchange movements.
In addition, the Group monitors and may seek to hedge any significant short-term transactional exposures via the use of forward currency exchange contracts.
PRINCIPAL RISKS AND UNCERTAINTIES CONTINUED
KEY
New risk Increased risk Remains a principal risk Decreased risk
STRATEGIC REPORT GOVERNANCE FINANCIALS
65EG Group | 2020 Annual Report and Financial Statements
Risk Impact Mitigation
Financial risk continued
INTEREST RATE RISKThe Group has exposure to interest rate risk, principally in relation to cash and cash equivalents and fixed and floating rate debt facilities.
If the correct balance between fixed and floating rate instruments is not maintained this could impact the Group’s profitability and cash flow.
The risk is managed by regularly reviewing the Group’s fixed to floating ratio, maintaining an appropriate mix between fixed and floating rate borrowings.
Risk management strategies reflect the defined risk appetite ensuring risk mitigation using cost-effective strategies. Where appropriate, the risk is managed by the Group through the use of interest rate hedging instruments and fixed rate borrowings.
LIQUIDITYLiquidity risk is the risk of the Group being unable to meet financial obligations as they fall due.
The Group requires high levels of capital investment for the refurbishment and conversions of the existing estate.
The inability to meet financial obligations could significantly impact both the reputation and financial position of the Group and potentially its ability to continue as a going concern.
If the capital expenditure plans cannot be met, the Group may not be able to support its operations or development strategies.
The Group has established an appropriate liquidity risk management framework for the management of the Group’s short, medium and long-term funding and liquidity management requirements.
Liquidity risk is mitigated by maintaining adequate reserves, banking facilities and reserve borrowing facilities, by continuously monitoring rolling cash flow forecasts and actual cash flows and by matching the maturity profiles of financial assets and liabilities.
The Group also benefits from a structurally negative working capital cycle which is continually monitored by management.
TAXWe operate in an increasingly complex international tax environment.
Failure to address such matters as changes in tax laws, tax audits and transfer pricing judgements may impact the Group’s tax liability or reporting requirements.
The Group’s tax department ensures compliance with all taxation matters globally. The Group also engages external taxation advisers for support and guidance on matters of compliance where appropriate.
INSURANCEEach of our insurance policies is subject to certain limitations. We are not fully insured against all risks inherent to our business and we may face liabilities or losses that are not adequately covered by our insurance. Further, our insurance policies might provide for high deductibles (or excess payments), which could impose a significant strain on our capital before we are able to recover under our insurance policies.
Additionally, if we suffer from one or more events that result in us making a claim under our insurance policies, we could face higher premiums or be unable to renew or purchase new insurance in the future.
Any inadequacy in our insurance coverage, including those mentioned here, could have a material adverse effect on our business, financial condition, liquidity, results of operations and prospects.
The Group continuously monitors its potential risks to ensure that insurance cover is appropriate. Insurance cover is regularly reviewed throughout the year as and when acquisitions occur or there are other meaningful events. The CFO is consulted as to the levels of insurance excess it is believed the business can support.
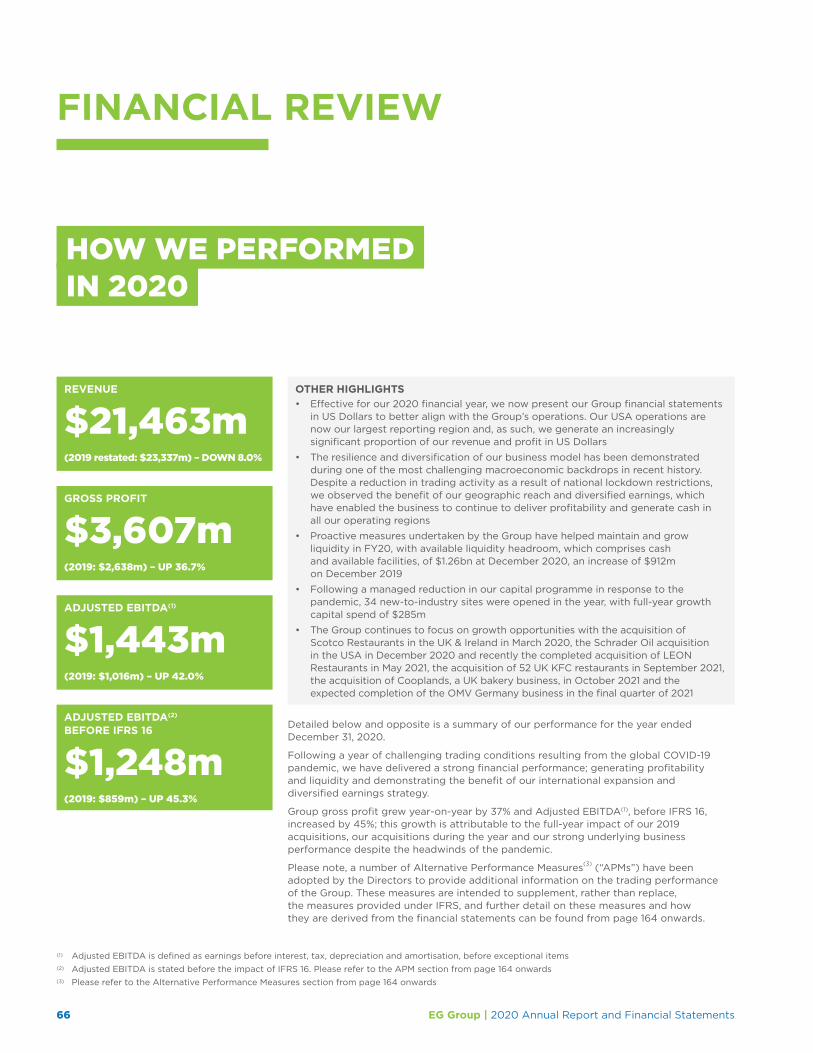
66 EG Group | 2020 Annual Report and Financial Statements
FINANCIAL REVIEW
HOW WE PERFORMED IN 2020
Detailed below and opposite is a summary of our performance for the year ended December 31, 2020.
Following a year of challenging trading conditions resulting from the global COVID-19 pandemic, we have delivered a strong financial performance; generating profitability and liquidity and demonstrating the benefit of our international expansion and diversified earnings strategy.
Group gross profit grew year-on-year by 37% and Adjusted EBITDA(1), before IFRS 16, increased by 45%; this growth is attributable to the full-year impact of our 2019 acquisitions, our acquisitions during the year and our strong underlying business performance despite the headwinds of the pandemic.
Please note, a number of Alternative Performance Measures(3) (“APMs”) have been adopted by the Directors to provide additional information on the trading performance of the Group. These measures are intended to supplement, rather than replace, the measures provided under IFRS, and further detail on these measures and how they are derived from the financial statements can be found from page 164 onwards.
REVENUE
$21,463m(2019 restated: $23,337m) – DOWN 8.0%
GROSS PROFIT
$3,607m(2019: $2,638m) – UP 36.7%
ADJUSTED EBITDA(2) BEFORE IFRS 16
$1,248m(2019: $859m) – UP 45.3%
OTHER HIGHLIGHTS• Effective for our 2020 financial year, we now present our Group financial statements
in US Dollars to better align with the Group’s operations. Our USA operations are now our largest reporting region and, as such, we generate an increasingly significant proportion of our revenue and profit in US Dollars
• The resilience and diversification of our business model has been demonstrated during one of the most challenging macroeconomic backdrops in recent history. Despite a reduction in trading activity as a result of national lockdown restrictions, we observed the benefit of our geographic reach and diversified earnings, which have enabled the business to continue to deliver profitability and generate cash in all our operating regions
• Proactive measures undertaken by the Group have helped maintain and grow liquidity in FY20, with available liquidity headroom, which comprises cash and available facilities, of $1.26bn at December 2020, an increase of $912m on December 2019
• Following a managed reduction in our capital programme in response to the pandemic, 34 new-to-industry sites were opened in the year, with full-year growth capital spend of $285m
• The Group continues to focus on growth opportunities with the acquisition of Scotco Restaurants in the UK & Ireland in March 2020, the Schrader Oil acquisition in the USA in December 2020 and recently the completed acquisition of LEON Restaurants in May 2021, the acquisition of 52 UK KFC restaurants in September 2021, the acquisition of Cooplands, a UK bakery business, in October 2021 and the expected completion of the OMV Germany business in the final quarter of 2021
(1) Adjusted EBITDA is defined as earnings before interest, tax, depreciation and amortisation, before exceptional items(2) Adjusted EBITDA is stated before the impact of IFRS 16. Please refer to the APM section from page 164 onwards(3) Please refer to the Alternative Performance Measures section from page 164 onwards
ADJUSTED EBITDA(1)
$1,443m(2019: $1,016m) – UP 42.0%

STRATEGIC REPORT GOVERNANCE FINANCIALS
67EG Group | 2020 Annual Report and Financial Statements
SUMMARY GROUP INCOME STATEMENT
2020 2019 restated(1)
Beforeexceptional
items$m
Exceptionalitems
$m
Afterexceptional
items$m
Beforeexceptional
items$m
Exceptionalitems
$m
Afterexceptional
items$m
Revenue 21,463 — 21,463 23,337 — 23,337
Cost of sales (17,856) — (17,856) (20,699) — (20,699)
Gross profit 3,607 — 3,607 2,638 — 2,638
Operating profit 724 (28) 696 465 (184) 281
Profit on disposal — — — — 173 173
Net finance costs (857) (6) (863) (528) (19) (547)
(Loss)/profit before tax (133) (34) (167) (63) (30) (93)
Tax (72) 7 (65) (10) (41) (51)
(Loss)/profit for the year (205) (27) (232) (73) (71) (144)
(1) The financial information for the year ended December 31, 2019 reflects a change in presentation to previously reported figures for revenue and cost of sales as explained in note 6
ADJUSTED OPERATING PROFIT AND ADJUSTED EBITDA(1),(2)
2020$m
2019$m
Loss after tax (232) (144)
Add tax 65 51
Add net finance costs 863 547
Profit on disposal — (173)
Operating profit 696 281
Operating exceptional items (note 5)(3) 28 184
Adjusted operating profit 724 465
Add depreciation 414 341
Add impairment 65 —
Add IFRS 16 depreciation 151 126
Add amortisation 89 84
Adjusted EBITDA(1) 1,443 1,016
Impact of IFRS 16 on EBITDA (195) (157)
Adjusted EBITDA(1) before IFRS 16 1,248 859
(1) Adjusted EBITDA is defined as earnings before interest, tax, depreciation and amortisation, before exceptional items(2) Please refer to the Alternative Performance Measures section from page 164 onwards(3) Exceptional items presented reflect those impacting EBITDA, and therefore exclude exceptional finance costs and tax on exceptionals

68 EG Group | 2020 Annual Report and Financial Statements
FINANCIAL REVIEW CONTINUED
ADJUSTED OPERATING PROFIT AND ADJUSTED EBITDA(1),(2)
CONTINUEDGroup revenue decreased by 8% to $21,463m (2019 restated: $23,337m) reflecting the negative impact of the pandemic on demand for fuel and the temporary closure of our UK & Ireland Foodservice outlets as a result of the lockdown measures imposed by national and state governments in response to COVID-19, with travel restrictions in place in all countries of operation at certain points of the year, and with remote working and home schooling measures in place for a large part of the year.
Notwithstanding the decline in revenue, our EBITDA performance remained resilient with Group Adjusted EBITDA(1),(2) for 2020 of $1,443m, an increase of $427m, or 42%, (2019: $1,016m). This increase is attributed to the full-year impact of 2019 acquisitions, being Fuelco, Australia (completed April 1, 2019), Cumberland Farms, USA (completed October 22, 2019) and the 2020 acquisition of Scotco Restaurants, UK&I which completed on March 10, 2020. Collectively these businesses contributed an additional $367m of EBITDA in 2020. Excluding the impact of acquisitions, like-for-like (“LFL”) growth of 9% was reported in full year 2020 Adjusted EBITDA(1) despite the challenging conditions during the COVID-19 pandemic.
Additional cost savings were achieved in the year through the Group’s synergy programme and cost saving measures implemented in response to the pandemic, including wage subsidies from governments which totalled $59m (see note 38 to the financial statements).
Supporting the performance of the Group for 2020 was the growth of our site network to 6,000 sites globally (2019: 5,866), largely attributable the acquisition of the 146 Scotco Foodservice restaurants from the Herbert Group and two smaller bolt-on businesses, one in the USA and another in Continental Europe, which added 20 sites to our network.
Group loss before tax was $167m, an increase of $74m from the loss before tax of $93m in 2019.
Our 2020 financial performance by region and by each of our three income streams is summarised on pages 17 to 19 and 32 to 46 respectively.
FINANCE COSTSExcluding exceptional items, net finance costs increased by $329m to $857m (2019: $528m), of which over $200m relates to the foreign exchange loss on translation of financing activities due to the weakening of the US Dollar, with the remainder largely attributable to the full-year impact of costs to service the Group’s Senior Secured Notes issued to fund the acquisitions of Fuelco Australia and Cumberland Farms, which were drawn in May 2019 and October 2019. Other items recorded in finance costs relate to interest accruing on term loans and short-term borrowing facilities, interest of lease liabilities, the amortisation of debt arrangement fees and non-utilisation fees.
EXCEPTIONAL ITEMSIn order to provide users of our accounts with insight into the trading performance of the business, items recognised in reported profit or loss before tax which, by virtue of their size and/or nature, do not reflect the Group’s underlying performance are excluded from the Group’s underlying results. These are detailed in note 5 to the financial statements.
The Group adopts a minimum threshold of $1m for the separate identification of exceptional items.
Net exceptional costs before tax for the year of $34m primarily related to acquisitions and restructuring costs.
Acquisition and transaction-related costs within operating profit of $38m and within finance costs of $6m relate to directly attributable incremental costs incurred as a result of the Group’s growth acquisitions and largely relate to professional and legal fees. Within acquisition and transaction-related costs is $2m of exceptional income reflecting a remeasurement of the fair value of contingent consideration relating to the acquisition of Certified Oil, an acquisition in the USA which completed in 2019.
Exceptional restructuring costs of $18m relate to the 2020 costs incurred during the year in restructuring the management and support teams in the USA and associated system transition costs, following the significant restructure and relocation of the EG America central business during 2020. There were $19m of restructuring costs in 2019 related to the USA and Australia following the completion of the Fuelco and other USA acquisitions.
The impairment reversals of $40m recognised in the year relates to the reversal of a previously recognised exceptional impairment charge, where operational performance development plans have been implemented and the site level performance was sufficient to support the increased carrying value.
TAXThe tax charge in the year was $65m (2019: $51m) which represents an effective tax rate (“ETR”) of -39% (2019: -55%). Whilst the tax charge did not deviate significantly from the prior year, the significant increase in the loss before tax results in an increased ETR in 2020.
(1) Adjusted EBITDA is defined as earnings before interest, tax, depreciation and amortisation, before exceptional items(2) Please refer to the Alternative Performance Measures section from page 164 onwards

STRATEGIC REPORT GOVERNANCE FINANCIALS
69EG Group | 2020 Annual Report and Financial Statements
SUMMARY GROUP BALANCE SHEET2020
$m2019
$m
Goodwill 5,727 5,403
Tangible and intangible fixed assets excluding goodwill
5,980 5,815
Right of use assets 1,992 1,489
Net working capital (490) (361)
Net debt before lease liabilities (9,001) (9,069)
Lease liabilities (1,777) (1,414)
Current tax liabilities (net) (42) (22)
Deferred tax liabilities (net) (395) (361)
Provisions (983) (770)
Retirement benefit obligations (67) (62)
Other non-current assets/liabilities (374) 66
Net assets classified as held for sale 14 13
Net assets 584 727
Leverage
Net debt(1)/Adjusted EBITDA(2),(3) 7.5x 10.3x
Net debt before lease liabilities(4)/Adjusted EBITDA(2),(3) before IFRS 16
7.3x 10.5x
Net debt before lease liabilities(4)/Pro forma Adjusted EBITDA before IFRS 16(3),(5)
6.1x 5.9x
(1) Net debt includes lease liabilities, current and non-current borrowings net of cash and cash equivalents
(2) Adjusted EBITDA is defined as earnings before interest, tax, depreciation and amortisation, before exceptional items
(3) Please refer to the Alternative Performance Measures section from page 164 onwards
(4) Net debt before lease liabilities includes current and non-current borrowings net of cash and cash equivalents
(5) Pro forma Adjusted EBITDA includes an estimate to reflect the full-year EBITDA of acquisitions which completed mid-year and the full annualised benefit of synergies expected to be realised
GOODWILLThe goodwill recognised in the year of $142m relates to the amounts arising on acquisition of Scotco Restaurants, a Foodservice business in the UK&I, which completed in March 2020 and generated goodwill of $118m; and $22m arising on the acquisition of Schrader Oil, a chain of fuel and convenience retail stores in the USA. Hindsight adjustments totalling $1m (as an increase to goodwill) were identified in respect of acquisitions in the prior year.
FIXED ASSETSTangible and intangible fixed assets (excluding goodwill) increased by $165m to $5,980m (2019: $5,815m) largely as a result of the capital expenditure projects totalling $386m in 2020 (2019: $312m), which funded the investment in 193 new branded Foodservice outlets, 34 new-to-industry sites and the continued development and maintenance of the site portfolio.
The Group also continues to develop its land bank to further facilitate expansion in its chosen geographies.
Other intangibles consist of acquired brand names in the USA, dealer relationships acquired in Europe and other intangible assets such as software, with the decrease from December 2019 of $29m largely relating to the amortisation charge for the year.
Total depreciation and amortisation of tangible and intangible fixed assets (excluding leases) for 2020 totalled $503m (2019: $425m), assets disposed of during the year totalled $31m and impairment losses of $47m were recognised for loss-making sites (see page 117).
LEASESRight of use (“RoU”) assets represent the present value of leased assets recognised under IFRS 16, which is largely the Group’s portfolio of 2,606 leased sites, which are systematically depreciated over the remaining life of the lease. Lease liabilities represent the present value of future payments for leasehold sites, in which lease payments are discounted at the Group’s incremental borrowing rate, with the unwinding of the discount recognised as an interest cost in the period.
The increase in right of use assets of $503m in the year to $1,992m (2019: $1,489m) and the increase in lease liabilities by $363m to $1,777m (2019: $1,414m) is driven by leases acquired by the Group in the Scotco Restaurants and Schrader Oil acquisitions and other lease additions, including the lease of the Group’s new UK and shared service centre headquarters in Blackburn.
WORKING CAPITALThe Group generally benefits from a negative working capital profile, reflecting accounts payable payment terms exceeding stock holding and accounts receivable cash collections. Decreases in transactional activity caused by the pandemic in 2020, particularly as lockdown measures were reintroduced at the end of the year, led to decreased inventory and payables balances.
Inventories decreased to $654m (2019: $659m) with trade and other receivables decreasing to $545m (2019: $622m) and an increase in trade and other payables to $1,689m (2019: $1,642m).
INDIRECT TAX DEFERRALS Indirect tax deferrals of $626m were agreed with various tax authorities during 2020, as part of the government support packages to support businesses during the pandemic. $539m of this amount has been agreed to be repaid in 60 equal monthly instalments starting from October 2022.
DEBT AND LIQUIDITYAt December 31, 2020, net debt before lease liabilities was $9,001m, compared to $9,069m at December 31, 2019. This decrease of $68m reflects the drawdown of an additional term loan of $188m in March 2020, which was used to fund the Scotco Restaurants acquisition, and an unfavourable foreign exchange movement on the translation of Euro, Sterling and Australian Dollar debt at December 31, 2020 of $290m, which were offset by the repayment of the Group’s RCF totalling $405m and increased cash balance following management’s proactive liquidity measures during the pandemic.
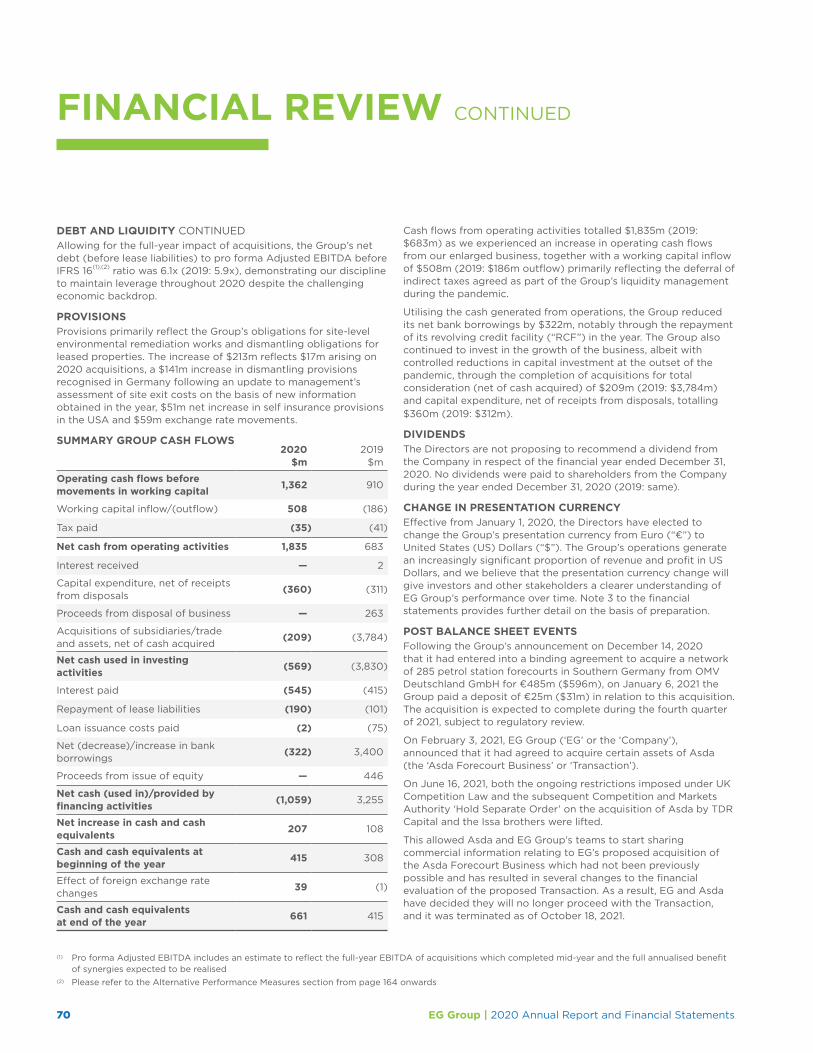
70 EG Group | 2020 Annual Report and Financial Statements
FINANCIAL REVIEW CONTINUED
DEBT AND LIQUIDITY CONTINUEDAllowing for the full-year impact of acquisitions, the Group’s net debt (before lease liabilities) to pro forma Adjusted EBITDA before IFRS 16(1),(2) ratio was 6.1x (2019: 5.9x), demonstrating our discipline to maintain leverage throughout 2020 despite the challenging economic backdrop.
PROVISIONSProvisions primarily reflect the Group’s obligations for site-level environmental remediation works and dismantling obligations for leased properties. The increase of $213m reflects $17m arising on 2020 acquisitions, a $141m increase in dismantling provisions recognised in Germany following an update to management’s assessment of site exit costs on the basis of new information obtained in the year, $51m net increase in self insurance provisions in the USA and $59m exchange rate movements.
SUMMARY GROUP CASH FLOWS2020
$m2019
$m
Operating cash flows before movements in working capital 1,362 910
Working capital inflow/(outflow) 508 (186)
Tax paid (35) (41)
Net cash from operating activities 1,835 683
Interest received — 2
Capital expenditure, net of receipts from disposals
(360) (311)
Proceeds from disposal of business — 263
Acquisitions of subsidiaries/trade and assets, net of cash acquired
(209) (3,784)
Net cash used in investing activities (569) (3,830)
Interest paid (545) (415)
Repayment of lease liabilities (190) (101)
Loan issuance costs paid (2) (75)
Net (decrease)/increase in bank borrowings
(322) 3,400
Proceeds from issue of equity — 446
Net cash (used in)/provided by financing activities (1,059) 3,255
Net increase in cash and cash equivalents 207 108
Cash and cash equivalents at beginning of the year 415 308
Effect of foreign exchange rate changes
39 (1)
Cash and cash equivalents at end of the year 661 415
Cash flows from operating activities totalled $1,835m (2019: $683m) as we experienced an increase in operating cash flows from our enlarged business, together with a working capital inflow of $508m (2019: $186m outflow) primarily reflecting the deferral of indirect taxes agreed as part of the Group’s liquidity management during the pandemic.
Utilising the cash generated from operations, the Group reduced its net bank borrowings by $322m, notably through the repayment of its revolving credit facility (“RCF”) in the year. The Group also continued to invest in the growth of the business, albeit with controlled reductions in capital investment at the outset of the pandemic, through the completion of acquisitions for total consideration (net of cash acquired) of $209m (2019: $3,784m) and capital expenditure, net of receipts from disposals, totalling $360m (2019: $312m).
DIVIDENDSThe Directors are not proposing to recommend a dividend from the Company in respect of the financial year ended December 31, 2020. No dividends were paid to shareholders from the Company during the year ended December 31, 2020 (2019: same).
CHANGE IN PRESENTATION CURRENCYEffective from January 1, 2020, the Directors have elected to change the Group’s presentation currency from Euro (“€”) to United States (US) Dollars (“$”). The Group’s operations generate an increasingly significant proportion of revenue and profit in US Dollars, and we believe that the presentation currency change will give investors and other stakeholders a clearer understanding of EG Group’s performance over time. Note 3 to the financial statements provides further detail on the basis of preparation.
POST BALANCE SHEET EVENTSFollowing the Group’s announcement on December 14, 2020 that it had entered into a binding agreement to acquire a network of 285 petrol station forecourts in Southern Germany from OMV Deutschland GmbH for €485m ($596m), on January 6, 2021 the Group paid a deposit of €25m ($31m) in relation to this acquisition. The acquisition is expected to complete during the fourth quarter of 2021, subject to regulatory review.
On February 3, 2021, EG Group (‘EG’ or the ‘Company’), announced that it had agreed to acquire certain assets of Asda (the ‘Asda Forecourt Business’ or ‘Transaction’).
On June 16, 2021, both the ongoing restrictions imposed under UK Competition Law and the subsequent Competition and Markets Authority ‘Hold Separate Order’ on the acquisition of Asda by TDR Capital and the Issa brothers were lifted.
This allowed Asda and EG Group’s teams to start sharing commercial information relating to EG’s proposed acquisition of the Asda Forecourt Business which had not been previously possible and has resulted in several changes to the financial evaluation of the proposed Transaction. As a result, EG and Asda have decided they will no longer proceed with the Transaction, and it was terminated as of October 18, 2021.
(1) Pro forma Adjusted EBITDA includes an estimate to reflect the full-year EBITDA of acquisitions which completed mid-year and the full annualised benefit of synergies expected to be realised
(2) Please refer to the Alternative Performance Measures section from page 164 onwards

STRATEGIC REPORT GOVERNANCE FINANCIALS
71EG Group | 2020 Annual Report and Financial Statements
On February 8, 2021 the Group purchased interest bearing debt instruments for £160m ($220m). The asset is recognised at amortised cost.
On February 26, 2021, the Group negotiated the private placement at par of £675m ($953m) in aggregate principal amount of 6.25% Senior Secured Notes due 2026. The proceeds were intended to fund the Group’s acquisitions of the Asda Forecourt Business. As a consequence of the termination of the agreement to acquire the Asda Forecourt Business on October 18, 2021, the Group initiated a process, also on October 18, 2021, to redeem the £675m ($953m) in aggregate principal amount of 6.25% Senior Secured Notes due 2026 issued on February 26, 2021 and unwind the related escrow arrangement. This redemption process completed on October 26, 2021.
On March 11, 2021, the Group allocated $510m in aggregate principal amount of additional loans due 2026 under a new Term B Facility (issue price 99%, spread L+425 bps, LIBOR floor 0.5%) and €610m ($726m) in aggregate principal amount of additional loans due 2027 under a new Second Lien Facility (issue price 99%, spread E+700 bps, EURIBOR floor 0%). The proceeds were used to pay related fees and expenses and to refinance an existing bilateral bridge facility and the existing second lien facilities in full. The remaining funds will be used to fund the acquisition of OMV’s German forecourts. As part of the financing process, the Group also secured an increase in its committed letter of credit (“LC”) facilities by $240m and an extension to the maturity of RCF and LC facilities to 2024.
On March 18, 2021 the Group acquired KMS Autohof-Betriebsgesellschaft GmbH in Germany. The acquisition consisted of ten petrol filling stations, six Burger King restaurants and ten gaming halls. As part of the acquisition of 100% of the share capital of KMS Autohof-Betriebsgesellschaft GmbH and its two subsidiaries, provisional net assets of €4m ($5m) were acquired for consideration of €9m ($11m).
On May 9, 2021 the Group acquired LEON Restaurants. The fast food chain has a network of over 70 restaurants in the UK, with a limited number located in Europe. As part of the acquisition of 100% of the share capital of LEON Restaurants Ltd and its subsidiaries, provisional net liabilities of £6m ($9m) were acquired for consideration of £84m ($118m).
In June 2021, the Group advanced $71m as a related party loan to Optima Bidco (Jersey) Limited, the ultimate parent Company of the Group in order for them to meet their obligations to preference shareholders. The loan has been provided at rates comparable with commercial rates of interest.
On June 1, 2021 the Group completed the acquisition of assets from Mercury Fuel Service, Inc at eight leased locations in Connecticut. Provisional net assets of $13m were acquired for consideration of $34m.
On September 26, 2021 the Group completed the acquisition of 100% of the shares in Amsric Foods Limited (now renamed Pollo Limited), together with its wholly owned subsidiary, Harland South Limited, and associated freehold property for total consideration of £120m ($164m), of which £15m ($21m) related to the acquisition of eleven freehold and three long leasehold properties from which the acquired KFC restaurants trade, from ADR Properties Limited. The acquired network consists of 52 KFC restaurants across the south and south-west of the UK, and a mix of drive-thru and traditional restaurant formats.
On October 2, 2021, the Group acquired CS Food Group Holdings Limited (‘Cooplands’) for a total consideration of £72m ($97m). Cooplands own and operates bakery assets in the United Kingdom (“UK”), including three bakeries that process ingredients and manufacture fresh food distributed through its supply and logistics network to c.180 stores and cafes, predominantly across the north-east and Yorkshire regions.
On October 5, 2021, the Group announced it had entered into a binding agreement to divest 27 petrol filling stations (“PFS”), located throughout the UK, to Park Garage Group for proceeds of £90m ($122m). This follows the CMA’s announcement in June 2021 that it had agreed formal undertakings offered by Mohsin Issa, Zuber Issa and TDR Capital LLP to divest some of EG Group’s PFS sites to address the competition concerns relating to their separate acquisition of Asda Group Limited (‘Asda’). The 27 sites include 26 sites required by the CMA to be divested, plus one other non-core location.
On October 23, 2021, the Group concluded negotiations to acquire 34 convenience stores and two development sites in the USA for gross consideration of $278m. The transaction was effective from October 30, 2021, is subject to regulatory approvals, and is expected to complete by the end of 2021.
COVID‑19, CURRENT TRADING AND OUTLOOK The impact we have observed and the operational and financial actions taken by the business in response to COVID-19 are detailed on pages 8 to 11. Whilst footfall and volumes have been impacted during the pandemic as governments and customers implemented measures to contain the spread of the virus, our international and earnings diversification has resulted in a strong, resilient performance of the Group. The continued success of the vaccination programme in our countries of operation and the resulting relaxation of lockdown restriction has supported the ongoing recovery of the Group’s trading activities.
Whilst we are mindful of the uncertainty that continues to exist for the outlook for 2021, the resilience and diversification shown in the business model to date provides confidence in the long-term strategy of the Group. We continue to adopt a disciplined approach to managing liquidity and profitability through various cost management initiatives and the Board remains positive that the Group has sufficient liquidity to navigate through the crisis.

72 EG Group | 2020 Annual Report and Financial Statements
BOARD OF DIRECTORS
Dame Alison CarnwathNon-Executive Director
Appointed 2021
I A R N
Appointed:EG Group Holdings Limited March 1, 2021
Biography:Dame Alison has served as Chairwoman of Land Securities and Director at BP, Friends Provident, Gallaher, Barclays and Man Group. She is currently Chair of the Audit Committee at Zurich Insurance and BASF, Chair of the Strategic Advisory Board at Livingbridge Private Equity, a Director of Coller Capital and a Non-Executive at Paccar. She is a trustee of the Economist Group and a former member of the United Kingdom Takeover Panel. Dame Alison is a Chartered Accountant and has two honorary doctorates. She was made a Dame Commander of the British Empire in 2014 for services to business and received a Lifetime Achievement award at the 2020 Non-Executive Director of the Year Awards.
Zuber Issa CBECo-Founder and Co-CEO
E S
Appointed:Appointed: EG Group Holdings Limited November 2, 2020 and EG Group Limited January 29, 2016
Biography:Zuber is Co-Founder and Co-CEO of EG Group and entered into the business world at an early age. He is a natural leader and a versatile strategist and tactician and actively leads on extending the new-to-industry land bank, site investment and development, and Group operations. Prior to founding EG Group in 2001, Zuber established a number of enterprises including a chain of newsagents in busy mall locations in the North West of England. Zuber was jointly named the 2018 EY Entrepreneur of the Year in the UK alongside his brother Mohsin, and more recently, honoured in the Queen’s Birthday Honours List 2020 for his contribution to business and charity.
Mohsin Issa CBE Co-Founder and Co-CEO
E S
Appointed:EG Group Holdings Limited May 23, 2017 and EG Group Limited January 29, 2016
Biography:Mohsin is Co-Founder and Co-CEO of EG Group and has been active in the fuel forecourt and retail convenience industry since 2001. He is a resourceful business leader and has been a major driving force behind the growth and development of EG Group, including being actively involved in negotiations with major brand partners, capital raising and financing transactions. Prior to founding EG Group, he held senior leadership roles at various Issa family businesses. He was jointly named the 2018 EY Entrepreneur of the Year in the UK alongside his brother Zuber, and more recently, honoured in the Queen’s Birthday Honours List 2020 for his contribution to business and charity.
Lord Stuart Rose Chairman and Non-Executive Director
Appointed 2021
I R N
Appointed: EG Group Holdings Limited January 21, 2021
Biography:Lord Stuart Rose was appointed to the Board in January 2021. He has worked in retail for over 40 years and has held CEO positions at Argos, Booker, Iceland, Arcadia Group and Marks & Spencer and Chair positions at Marks & Spencer and Ocado Group. Stuart has extensive experience of UK Corporate Governance requirements and best practice having served on boards and committees of some of the UK’s largest businesses. Stuart was knighted in 2008 for services to the retail industry and corporate social responsibility, and granted a life peerage in August 2014.
EG Group Limited is governed by the Board of EG Group Holdings Limited (the ‘Board’) as set out below.

STRATEGIC REPORT GOVERNANCE FINANCIALS
73EG Group | 2020 Annual Report and Financial Statements
Imraan PatelGeneral Counsel and Company Secretary
E
Appointed:EG Group Holdings Limited May 23, 2017 and EG Group Limited July 19, 2016
Biography:Imraan joined EG Group in 2016. He qualified as a Solicitor in the City of London in 2003 and has been involved in negotiating and delivering legal and commercial advice on complex, frequently high-profile transactions around the world ever since. At EG Group, he plays a central role in all M&A activity and has broader responsibility for all Legal, Compliance and HESS functions. Prior to joining EG Group, he held roles at businesses of Orange SA and BT Group plc, and law firm, Ashurst LLP. Imraan is highlighted in the GC Powerlist 2021 as one of the UK’s most influential in-house lawyers, and holds an LLB (Hons) in Law from the University of Lancaster and a Postgraduate Diploma in Legal Practice (PGDipL) from the College of Law.
Gary Lindsay TDR Representative and Non-Executive Director
Appointed:EG Group Holdings Limited October 21, 2016
Biography:Gary joined TDR Capital in June 2008. He is involved in the day-to-day management of TDR’s investments in EG Group, Modulaire Group, William Scotsman-Mobile Mini and Target Hospitality and responsible for originating new transactions. Gary is a board member at EG Group, Modulaire Group, William Scotsman-Mobile Mini and Target Hospitality and has 18 years’ private equity and investment banking experience. Prior to joining TDR, he worked at both Citi and Bear Stearns in London and New York. Gary received a Master’s degree in Finance with distinction from the University of Strathclyde and a Master’s degree in Chemistry, with first class honours, from the University of Edinburgh.
Manjit DaleTDR Representative and Non-Executive Director
Appointed:EG Group Holdings Limited November 2, 2020
Biography:Manjit founded TDR Capital with Stephen Robertson in 2002, with whom he had previously worked at DB Capital Partners. He has over 25 years of experience in private equity, leveraged finance and consulting. Previously, Manjit was Managing Director and Head of DB Capital Partners Europe and its predecessor firm BT Capital Partners, which he joined in 1994. He started his career in the Management Consultancy division of Arthur Andersen and moved into private equity in 1989 with 3i plc, and later with NM Rothschild. Manjit holds a Master’s degree in Economics from Cambridge University.
John CareyNon-Executive Director
I A R N
Appointed: EG Group Holdings Limited November 11, 2020
Biography:John was appointed as a Non-Executive Director in November 2020 and is a highly respected business leader with diverse international experience, most recently holding executive positions at BP and ADNOC Distribution. He led ADNOC’s IPO in 2018, the largest recent IPO of an entity that includes c-store operations, and has extensive experience in a number of areas that are highly relevant to EG Group’s global business.
KeyE Executive
S Shareholder
I Independent
A Audit & Risk Committee
R Remuneration Committee
N Nomination Committee
Chair
Throughout 2020 and 2021 we have strengthened the composition of the Board and developed appropriate governance structures.

74 EG Group | 2020 Annual Report and Financial Statements
GOVERNANCE
STRUCTURE AND OVERSIGHTEG Group Limited is governed by the Board of EG Group Holdings Limited. The Group’s ultimate parent, Optima Bidco (Jersey) Limited, is owned by Mohsin Issa and Zuber Issa representing 25% of the shares each alongside funds managed by TDR Capital LLP, a leading international private equity firm, holding the remaining 50%.
As at December 31, 2020, the Board comprised of five Directors: Mohsin Issa, Zuber Issa, Manjit Dale and Gary Lindsay representing the interests of TDR Capital, alongside John Carey who was appointed as a Non-Executive Director in November 2020. Recruitment for a Chairman and additional Non-Executive Director continued over the year end and Lord Stuart Rose and Dame Alison Carnwath were appointed early in 2021.
A biography for each Director is set out on pages 72 and 73.
The Board provides direction to the Group and ensures that our senior executives are strategically supported and are able to effectively fulfil their roles.
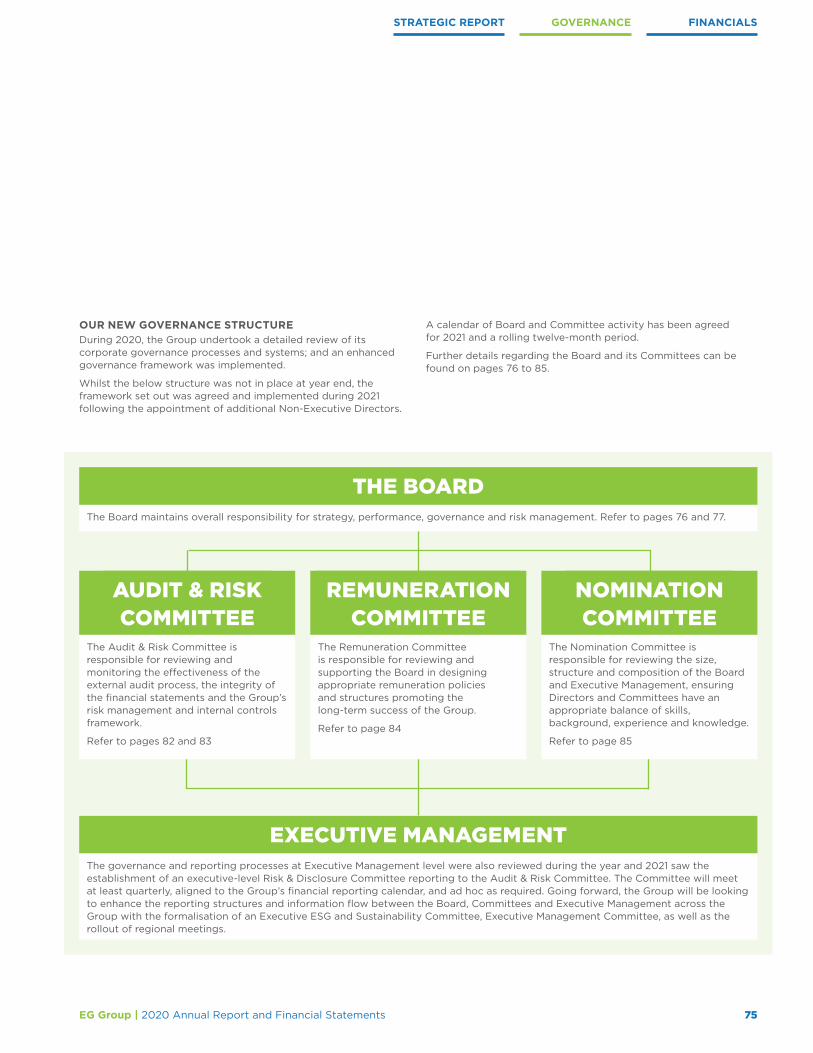
STRATEGIC REPORT GOVERNANCE FINANCIALS
75EG Group | 2020 Annual Report and Financial Statements
OUR NEW GOVERNANCE STRUCTUREDuring 2020, the Group undertook a detailed review of its corporate governance processes and systems; and an enhanced governance framework was implemented.
Whilst the below structure was not in place at year end, the framework set out was agreed and implemented during 2021 following the appointment of additional Non-Executive Directors.
A calendar of Board and Committee activity has been agreed for 2021 and a rolling twelve-month period.
Further details regarding the Board and its Committees can be found on pages 76 to 85.
THE BOARDThe Board maintains overall responsibility for strategy, performance, governance and risk management. Refer to pages 76 and 77.
AUDIT & RISK COMMITTEE
EXECUTIVE MANAGEMENTThe governance and reporting processes at Executive Management level were also reviewed during the year and 2021 saw the establishment of an executive-level Risk & Disclosure Committee reporting to the Audit & Risk Committee. The Committee will meet at least quarterly, aligned to the Group’s financial reporting calendar, and ad hoc as required. Going forward, the Group will be looking to enhance the reporting structures and information flow between the Board, Committees and Executive Management across the Group with the formalisation of an Executive ESG and Sustainability Committee, Executive Management Committee, as well as the rollout of regional meetings.
REMUNERATIONCOMMITTEE
NOMINATIONCOMMITTEE
The Audit & Risk Committee is responsible for reviewing and monitoring the effectiveness of the external audit process, the integrity of the financial statements and the Group’s risk management and internal controls framework.
Refer to pages 82 and 83
The Remuneration Committee is responsible for reviewing and supporting the Board in designing appropriate remuneration policies and structures promoting the long-term success of the Group.
Refer to page 84
The Nomination Committee is responsible for reviewing the size, structure and composition of the Board and Executive Management, ensuring Directors and Committees have an appropriate balance of skills, background, experience and knowledge.
Refer to page 85
76 EG Group | 2020 Annual Report and Financial Statements
GOVERNANCE CONTINUED
The Group has applied the Wates Principles of Corporate Governance during the year. Details of how we have applied the principles can be found on pages 78 to 81 of this Annual Report. The roles, responsibilities and key priorities of the Board can be found on pages 72 and 73 and its Committees on pages 82 to 85.
THE BOARDPurpose The role of the Board is to promote the long-term sustainable success of the Company, generating value for our shareholders whilst having regard to all stakeholders, the impact of the business on the community and the environment.
The Board provides leadership to the Group and is collectively responsible for overseeing strategy, performance, governance and risk. The role and responsibilities of the Board include:
• Advising and agreeing the overall strategy, objectives and direction of the Company
• Ensuring appropriate financial structures and controls are in place and that the Company complies with its financial obligations
• Overseeing performance of the Group in relation to financial performance and against the Group’s strategic objectives
• Overseeing the Group’s corporate governance arrangements
Whilst the implementation of strategy and day-to-day operations is delegated to the Co-CEOs and their Executive Management, a scheduled of matters reserved ensures the Board retains authority for a number of key areas, including approval of:
• The Group’s annual business plan, strategy and budget
• Financial indebtedness
• Material transactions and agreements including acquisitions disposals, restructures or similar
• Material litigation incurred or initiated by the Group
• Material changes to the Group’s corporate structure or constitution
• Publication of quarterly financial results and the Group’s Audited Annual Report and Accounts
• Board appointments and remuneration
Governance structure and meetingsThroughout 2020 and given the impact of COVID-19 on the business and its operations, our ways of working changed in order to efficiently respond to the rapidly changing situation across all our global regions and to allow for effective decision making. Informal meetings alongside regular and ongoing dialogue took place between Board members, which until November 2020 comprised of Mohsin Issa and Zuber Issa alongside Gary Lindsay and Manjit Dale, with two formal meetings being held in this period.
During the formal and ad hoc meetings, the Board reviewed and approved the FY19 Annual Report and Financial Statements, the remuneration of the Group’s FY19 auditors, the appointment of KPMG as the Group auditor from the FY20 year end, the appointment of John Carey as a Non-Executive Director as well as the review of material acquisitions and transactions.
The Directors were supported by Executive Management, which included the Group’s Chief Financial Officer, Chief Information Officer, Chief Operations Officer, Group Commercial Director, the Group General Counsel and Company Secretary and the Chief Strategy Officer with effect from March 1, 2021, who have extensive experience in their areas of expertise, retail, innovation and best practice in order to support the Co-CEOs in delivering the strategic objectives of the business. In addition, the Group has Country Managers in place across all regions who have a wealth of operational retail and forecourt network management experience. Country Leadership Teams have operational accountability of the local network and are responsible for managing site resources and ensure necessary site and brand partner investments are realised. Throughout 2020, weekly leadership calls have taken place, ensuring the Co-CEOs and wider Group Management Teams are kept updated of each region’s financial and trading position, the impact of COVID-19 alongside any other matters that need to be brought to the attention of the Group.
Following an internal re-organisation throughout late 2020, the Executive Management was enhanced: the Group Chief Financial Officer was appointed to a newly created role of Group Chief Strategy Officer and the Chief Financial Officer from the EG Australia business was promoted to Group Chief Financial Officer. The changes took effect from March 1, 2021.
Acquisitions During the year the Board approved the acquisitions of Scotco Restaurants in March 2020 and Schrader Oil in December 2020. During 2021, the Board approved the acquisitions of LEON Restaurants in May 2021, Amsric Foods in September 2021 and Cooplands in October 2021. In addition, the acquisition of OMV was also approved and is expected to complete during Q4 2021.
The Group maintains a highly disciplined approach to M&A with regard to decisions as to whether to progress deals or not (with many more deals rejected than pursued in the year), determining valuations, due diligence and post-acquisition integration. The Group has extensive recent experience of executing, transitioning and creating value from significant acquisitions and we have a dedicated M&A team who work with the Directors and Executive Management to undertake a robust appraisal of potential opportunities, and advisers are engaged to undertake rigorous legal, financial, environmental and commercial due diligence as required. Integration and synergy plans are established as part of the deal review process and performance is regularly reviewed against pre-agreed KPIs. The Board is kept up to date regularly on all matters, from exploring and assessing opportunities to performance post acquisition, and all material transactions with a consideration of greater than £5m require Board approval. Following an extensive discussion with the Board, Executive Management and external advisers, where a potential opportunity does not meet the agreed requirements, a collective decision is taken not to proceed.
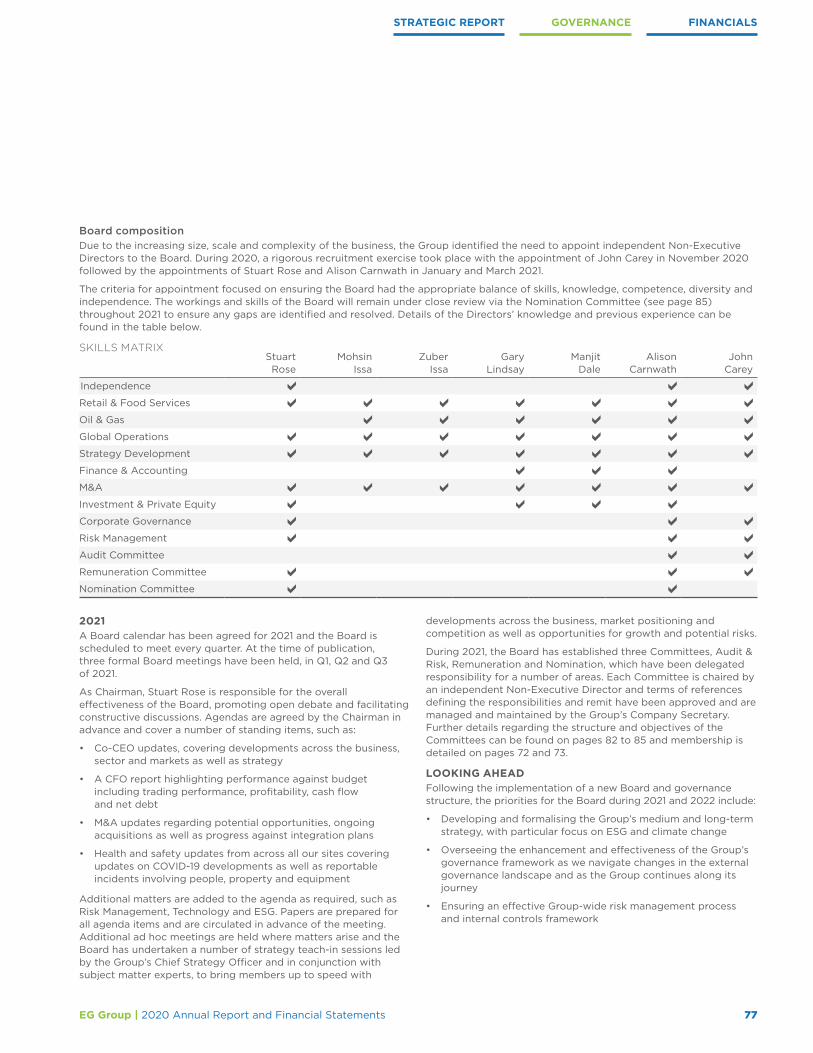
STRATEGIC REPORT GOVERNANCE FINANCIALS
77EG Group | 2020 Annual Report and Financial Statements
Board compositionDue to the increasing size, scale and complexity of the business, the Group identified the need to appoint independent Non-Executive Directors to the Board. During 2020, a rigorous recruitment exercise took place with the appointment of John Carey in November 2020 followed by the appointments of Stuart Rose and Alison Carnwath in January and March 2021.
The criteria for appointment focused on ensuring the Board had the appropriate balance of skills, knowledge, competence, diversity and independence. The workings and skills of the Board will remain under close review via the Nomination Committee (see page 85) throughout 2021 to ensure any gaps are identified and resolved. Details of the Directors’ knowledge and previous experience can be found in the table below.
SKILLS MATRIX Stuart Rose
Mohsin Issa
Zuber Issa
Gary Lindsay
Manjit Dale
Alison Carnwath
John Carey
Independence
Retail & Food Services
Oil & Gas
Global Operations
Strategy Development
Finance & Accounting
M&A
Investment & Private Equity
Corporate Governance
Risk Management
Audit Committee
Remuneration Committee
Nomination Committee
2021A Board calendar has been agreed for 2021 and the Board is scheduled to meet every quarter. At the time of publication, three formal Board meetings have been held, in Q1, Q2 and Q3 of 2021.
As Chairman, Stuart Rose is responsible for the overall effectiveness of the Board, promoting open debate and facilitating constructive discussions. Agendas are agreed by the Chairman in advance and cover a number of standing items, such as:
• Co-CEO updates, covering developments across the business, sector and markets as well as strategy
• A CFO report highlighting performance against budget including trading performance, profitability, cash flow and net debt
• M&A updates regarding potential opportunities, ongoing acquisitions as well as progress against integration plans
• Health and safety updates from across all our sites covering updates on COVID-19 developments as well as reportable incidents involving people, property and equipment
Additional matters are added to the agenda as required, such as Risk Management, Technology and ESG. Papers are prepared for all agenda items and are circulated in advance of the meeting. Additional ad hoc meetings are held where matters arise and the Board has undertaken a number of strategy teach-in sessions led by the Group’s Chief Strategy Officer and in conjunction with subject matter experts, to bring members up to speed with
developments across the business, market positioning and competition as well as opportunities for growth and potential risks.
During 2021, the Board has established three Committees, Audit & Risk, Remuneration and Nomination, which have been delegated responsibility for a number of areas. Each Committee is chaired by an independent Non-Executive Director and terms of references defining the responsibilities and remit have been approved and are managed and maintained by the Group’s Company Secretary. Further details regarding the structure and objectives of the Committees can be found on pages 82 to 85 and membership is detailed on pages 72 and 73.
LOOKING AHEADFollowing the implementation of a new Board and governance structure, the priorities for the Board during 2021 and 2022 include:
• Developing and formalising the Group’s medium and long-term strategy, with particular focus on ESG and climate change
• Overseeing the enhancement and effectiveness of the Group’s governance framework as we navigate changes in the external governance landscape and as the Group continues along its journey
• Ensuring an effective Group-wide risk management process and internal controls framework

78 EG Group | 2020 Annual Report and Financial Statements
GOVERNANCE CONTINUED
WATES PRINCIPLE STATEMENTSFor the year ended December 31, 2020, under The Companies (Miscellaneous Reporting) Regulations 2018, the Group has applied the Wates Corporate Governance Principles for Large Private Companies (published by the Financial Reporting Council (“FRC”) in December 2018 and available on the FRC website).
These corporate governance reporting requirements apply to reporting for financial years starting on or after January 1, 2019 and companies are able to adopt any suitable framework.
As the business grows it continues to evolve and whilst on this journey has committed to further develop the governance of the Group in light of the change in its breadth and scope of operations. As part of a reassessment of its governance principles, the Group and its stakeholders believe that Wates is an appropriate framework when making disclosures regarding corporate governance arrangements.
Principle 1Purpose and leadership
An effective Board develops and promotes the purpose of the company and ensure that its values, strategy and culture align.
EG Group is a leading global independent fuel station and convenience retail operator with a diversified presence across ten countries in Europe, the USA and Australia. The Group has evolved from a single site in 2001 to around 6,000 high-quality sites at December 31, 2020.
Whilst a key focus of the Board during 2020 was managing the impact of COVID-19 on the business and ensuring the safety and wellbeing of our colleagues and their families, we have remained committed to our purpose of making our customers’ lives easier, by offering them convenience in their travel, retail and foodservice choices.
Our core strategy is to develop a convenience store business that demonstrates the key strengths of resilience and diversification across a range of international markets and product offerings and we believe convenience can be achieved without compromising on quality, price or time.
We continue to strive towards being a partner of choice for leading foodservice and retail brands across the markets we operate in, and to evaluate growth opportunities that complement and strengthen our portfolio which may include the acquisitions of foodservice brands.
The Board remains committed via ongoing communication and dialogue to articulating the business model, which is then delivered by senior management under its leadership.
VALUES AND CULTUREAchievement of our strategy is underpinned by our talented, passionate and innovative people across the world. We accelerate development of our people; grow and strengthen our leadership depth and capabilities; and enhance employee performance through continued engagement in our strategy. In addition, the Group is committed to investing in infrastructure, systems and local communities to deliver value to shareholders and stakeholders. This can be seen in the EG values and business ethos. These values are explained by the Board, integrated into the workforce and used to inform expected behaviours and practice.
As a result of rapid growth across a variety of geographical areas through acquisition of existing businesses as well as organic growth, the Board took the opportunity to review the Group’s global mission, vision and values during the year. A rollout plan will be agreed during 2021 in order to communicate and embed amongst the teams.
Further information:
Our purpose, vision and values can be found on the inside front cover and pages 22 to 31 detail our strategy.
Section 172 on pages 20 and 21 demonstrates how the Board understands the views of stakeholders and builds relationships with them.
Principles1. Purpose and leadership2. Board composition3. Director responsibilities4. Opportunity and risk5. Remuneration6. Stakeholders

STRATEGIC REPORT GOVERNANCE FINANCIALS
79EG Group | 2020 Annual Report and Financial Statements
Principle 2Board composition
Effective Board composition requires an effective chair and a balance of skills, background and knowledge with individual Directors having sufficient capacity to make a valuable contribution. The size of the Board should be guided by the scale and complexity of the business.
The Company is governed by the Board of EG Group Holdings Limited; details of the ownership structure can be found on page 74. The Directors have maintained regular dialogue throughout 2020 to discuss key matters of the Group.
As stated in 2019, the Group was committed to enhancing Board composition to complement the experience of the existing Directors and support the business through its continued period of growth and development. Following a detailed review during 2020, John Carey was appointed as an Independent Non-Executive Director on November 11, 2020. John’s appointment was followed by two additional appointments in 2021, Stuart Rose as Chairman of the Board on January 21 and Alison Carnwath as an independent Non-Executive Director on March 1. Stuart, John and Alison bring with them a wealth of experience in relation to retail and fuel sectors and will sit alongside the existing Executive Directors and Co-CEOs, Mohsin Issa and Zuber Issa, and Non-Executive Directors Gary Lindsay and Manjit Dale from TDR, all representing the Group’s ultimate shareholders.
The Group believes the size and composition of the Board is appropriate for the scale and complexity of the business and the skills and knowledge of the Directors aligns with the growing diversity of the Group’s portfolio and future strategic objectives. In addition, there is an appropriate level of representation from the Group’s ultimate shareholder whilst the appointment of independent Non-Executive Directors provides independent thinking and constructive challenge to boardroom discussions.
A matrix detailing the Directors’ skills and areas of expertise can be found on page 77.
The Board is committed to achieving high standards of corporate governance and to ensure the effectiveness of the Board, its Committees and the Directors, an evaluation exercise will be undertaken towards the end of 2021 and into 2022.
As part of the Directors’ induction, a number of teach-in sessions have been held throughout 2021 to bring the Board up to speed in relation to EG’s business and the markets in which it operates.
Further information:
The Directors’ biographies and experience can be found on pages 72 and 73 of this Annual Report.
Principle 3Director responsibilities
The Board and individual Directors should have clear understanding of their accountability and responsibilities. The Board’s policies and procedures should support effective decision making and independent challenge.
The Group Board has agreed a cadence of quarterly meetings throughout 2021 with additional Board meetings/teleconferences held as required. During 2020, the Board received information on all key aspects of the business including health and safety, risks and opportunities, financial performance, strategy, operational matters, market conditions and sustainability, supported by Key Performance Indicators (“KPIs”). Key decisions reserved for the shareholders are set out in a matters reserved list, detailed in the Shareholders’ Agreement.
The Co-CEOs are accountable for management of the business and are supported by a strong and experienced Executive Management Team, who with a detailed understanding of the Group’s business needs and stakeholder interests assist the Co-CEOs in the rollout and implementation of strategy. The Co-CEOs are directors of many of the wider Group’s trading entities who meet behind closed doors with each Country Leadership Team. These sessions run as information forums covering financial and trading performance, risks and opportunities as well as health and safety matters, with information being prepared and circulated in advance. In addition, weekly country leadership calls are held with each region to bring any pertinent issues to the attention of the Co-CEOs.
In order to develop the Group’s corporate governance processes and systems the Group established the following Committees: Audit & Risk, Nomination and Remuneration. Each Committee has separate terms of reference, detailing the roles and responsibilities, alongside a list of matters reserved for the Board. Following the appointment of Stuart Rose, there is a clear division of roles between the Chairman and Co-CEOs which was formalised during 2021.
2021 will see a continued focus by the Group to develop and enhance executive-level Committees covering risk and disclosure, sustainability as well as more formalised regional meetings. These Committees will feed into the Board via the Executive Management or relevant Board Committee as detailed by their terms of reference.
80 EG Group | 2020 Annual Report and Financial Statements
GOVERNANCE CONTINUED
Principle 4Opportunity and risk
A Board should promote the long-term sustainable success of the company by identifying opportunities to create and preserve value, and establishing oversight for the identification and mitigation of risk.
The Board seeks out opportunities to create value whilst mitigating risks to the Group. Senior management across the business are responsible for maintaining the Group’s internal controls.
OPPORTUNITIESThe Board has articulated the Group’s purpose, with long-term strategic opportunities to deliver this discussed regularly between the Board and Executive Management. Acquisition opportunities arise from external relationships and internal research. The Group has an experienced cross-functional team that, working alongside external advisers, reviews potential opportunities and undertakes a robust process of due diligence. Mergers and acquisitions are analysed and discussed in detail before indicative or binding offers are made. Short-term trading opportunities to improve performance, resilience and liquidity are discussed in monthly meetings.
In addition, the Group regularly reviews its strategic objectives and market positioning to ensure the business continues to meet our customers’ changing behaviours and trends. In March 2021 the Group appointed a Chief Strategy Officer to further develop and refine our strategy, including in relation to alternative fuels and EG’s digital offerings.
Further information on strategy can be found on pages 22 to 31.
RISKDuring 2020 and continuing into 2021, the Group undertook a review of the Group’s risk management processes and internal controls, following which the Group documented its principal risks. The principal risks and uncertainties statement can be found on pages 58 to 65.
A Group Internal Audit function was established in 2020 and, supported by external advisers, work commenced with the Finance, Technology and Legal teams to enhance the Group’s risk management processes and internal controls. As a result of the COVID-19 pandemic, work in this area was delayed until the second half of 2020 and therefore continued into 2021. The Group has formalised its principal risks and a consistent framework for the identification, assessment and management of risks has been agreed, which continues to be rolled out throughout 2021.
As a result of our growth strategy, the Group inherited a number of legacy systems, and as a result, during 2021 and 2022, will implement SAP S/4HANA to provide the Group with consistency around reporting and automating controls. In addition, the Group has implemented a number of investments in IT security to protect its system-based information assets.
The Group has established a finance shared service centre in Massachusetts to support the USA business, whilst in Australia it has successfully transitioned off the Woolworths Transition Services Agreement.
Risk management will be a continued focus of the Board, Audit & Risk Committee and executive-level Risk & Disclosure Committee throughout 2021 and into 2022.
Principle 5Remuneration
A Board should promote executive remuneration structures aligned to the long-term sustainable success of a company, taking into account pay and conditions elsewhere in the Company.
The Board is responsible for ensuring that remuneration across the Group is appropriate to support the Group’s strategy and objectives and to attract and retain high-quality Directors, senior management and their workforce. We are committed to remunerating our people on the basis of their ability to contribute to the Group’s objectives.
The impact of COVID-19 has been felt across a number of our colleagues across the Group and during 2020 a pay review took place. The Directors took the decision to ensure all employees were paid above national minimal wage, which was subsequently rolled out during 2021.
The Group believes strongly in equal opportunities and takes a zero tolerance approach to discrimination/victimisation and promotes equal treatment.
The UK’s 2020 Gender Pay Statement has been externally validated and has been published on our website. We are committed to implementing any action required.
Although not in place at year end, the Group established a Remuneration Committee chaired by John Carey alongside Stuart Rose and Alison Carnwath as fellow members. The remaining Directors, as well as members of Executive Management, are invited to attend as required.
Further information:
For further information regarding the role of the Remuneration Committee please refer to page 84.
STRATEGIC REPORT GOVERNANCE FINANCIALS
81EG Group | 2020 Annual Report and Financial Statements
Principle 6Stakeholders
Directors should foster effective stakeholder relationships aligned to the Company’s purpose. The Board is responsible for overseeing meaningful engagement with stakeholders, including the workforce, and having regard to their views when taking decisions.
The Board is clear that good governance and effective communication are essential to deliver our purpose and to protect the Group’s brand, reputation and relationships with all stakeholders, including shareholders, employees, suppliers and the local communities in which the Group operates.
The Board aligns the Group’s strategic direction with its purpose and to the stakeholders’ long-term aspirations for the Group. The quarterly investor presentations led by Co-CEO Mohsin Issa, CSO Michael Hughes and the CFO represent the primary communications route between the Board and our investors.
STAKEHOLDERSIn addition to the quarterly investor presentations, members of the Board and Executive Management engage frequently with a variety of stakeholders and are available for questions at all times. The Group’s website (www.eurogarages.com) and social media channels provide regular updates on the development of the Group. During 2020 the Group successfully rolled out Success Factors, an internal platform where information regarding the business, policies and procedures can be stored and accessed.
Our workforce (including colleagues and contractors) is our biggest stakeholder and we believe our regular dialogue, directly with our employees through town hall sessions, or via works councils, is an essential two-way dialogue to receive feedback and to support our desired culture.
During 2020 the Group has focused on streamlining our employment engagement activities and a global survey will be undertaken during Q4 2021.
EXTERNAL IMPACTSThe Board is committed to social responsibility, community engagement and environmental sustainability. It achieves this in part through its commitment to ‘Zero accidents and incidents’ (ensuring the safety of everyone who works with us), being an employer of choice where individuals grow, contribute and succeed, and through the Group’s contribution to local and wider charities.
The Group has supported the establishment of EG Foundation in the UK to drive support for the communities in which EG Group operates, with a particular focus on nutrition amongst children and young people, and throughout the year the Group has worked alongside Too Good To Go in an effort to reduce surplus food from being wasted. Throughout 2021, we will continue to work with the organisation to roll out initiatives internationally across the Group.
Further information:
Further information in relation to our Section 172 statement can be found on pages 20 and 21 which includes details on how the Board seeks to understand the priorities of the key stakeholders through engagement with them and the Group’s ESG statement can be found on pages 47 to 57 which includes reference to the Group’s commitment to reducing energy usage and carbon emissions.

82 EG Group | 2020 Annual Report and Financial Statements
Established by the Board in May 2021, the Audit & Risk Committee is chaired by Alison Carnwath. As a Chartered Accountant, Alison has extensive and relevant financial experience and currently serves as Audit Chair for Zurich Insurance and BASF and therefore is able to provide the appropriate level of challenge to management. John Carey is a fellow member of the Committee and whilst Stuart Rose is not a member, he attends meetings and provides support as required. The Committee as a whole has competence relevant to the sector in which the Group operates and is in line with corporate governance best practice. The remaining Directors, members of Executive Management as well as the external and internal auditors are invited to attend where appropriate, but are not members.
The purpose of the Committee is to monitor the effectiveness of the Group’s financial reporting and systems of internal control and risk management. The Committee’s responsibilities include:
• Critically assessing the financial reporting process, quarterly financial results and annual results ahead of publication to ensure the integrity of the information
• Recommending to the Board that the Annual Report and Financial Statements present a fair, balanced and understandable position of the business and its performance over the period
• On behalf of the Board, review, challenge and monitor the effectiveness of the Group’s risk management and internal controls processes
MEETINGS The Committee is required to meet at least five times a year and meetings are aligned around the Group’s financial reporting obligations. The Committee will meet at least quarterly to approve the release of the quarterly financial report and investor presentation, and a fifth meeting will be arranged as part of the end of year audit. Since the Committee was established in May 2021 and at the time of publication, the Committee has met on six occasions. Quarterly meetings were held in May and August 2021, a policy and judgements session was held with EG’s management and finance team and three additional meetings have been held to review and recommend for approval the FY20 Annual Report and Financial Statements.
A calendar of activity has been agreed detailing the workings of the Committee for both 2021 and 2022 which has been aligned to the Committee’s terms of reference.
Agendas are structured and prepared in accordance with the calendar of activity and approved by the Chair prior to the meeting to ensure the Committee meets its objectives. Standing items include a quarterly update on financial and trading performance to approve the quarter’s result and investor presentation, update on compliance matters including risk management and whistleblowing as well as progress against internal controls against financial reporting.
The Committee meets with the External Auditor and the Group’s management team privately where appropriate.
FY20 AUDIT AND FINANCIAL REPORTINGThe Audit & Risk Committee is responsible for reviewing the appropriateness of, and monitoring, the financial reporting processes for the Group. This includes reviewing reports from the External Auditor, reports on internal controls, accounting and report matters, and management representation letters concerning accounting and reporting matters. The Committee reviews management’s report on areas of significant amounts of judgement and estimation and considers if these correlate with the key audit risks identified by the External Auditor and the comments of the External Auditor on management’s chosen approach. The Committee also considers the accounting policies and practices adopted by the Group, the application of the applicable reporting standards, compliance with governance frameworks and the presentation and disclosure of financial information.
Whilst not in place as at December 31, 2020, the Committee has been heavily involved in the FY20 audit, working closely with the External Auditor, the Group CFO and the Finance team. Regular calls have been held with all relevant parties to assess progress against the audit timetable and objectives. In addition, the External Auditor has attended all scheduled meetings of the Committee during 2021 to present their audit plan, strategy and detailed progress.
THE COMMITTEE CRITICALLY ASSESSES THE GROUP’S FINANCIAL REPORTING PROCESS AND SYSTEMS OF RISK MANAGEMENT AND INTERNAL CONTROL.
Dame Alison CarnwathChair of the Audit & Risk Committee
AUDIT & RISK COMMITTEE

STRATEGIC REPORT GOVERNANCE FINANCIALS
83EG Group | 2020 Annual Report and Financial Statements
For FY20, being the first year and a transition audit for KPMG, we worked to an extended timeline for the completion of the audited financial statements. However, going forward, and for the FY21 audit, we expect to deliver our audited financial statements in a shorter timeframe.
In addition to the scheduled quarterly meetings, two additional meetings have been held in September and October 2021 as part of the audit sign-off requirements and approval of the Annual Report and Financial Statements. Following an extensive review, the Committee recommended to the Board that the accounts presented a fair, balanced and understandable assessment of the business and its performance during the year.
With effect from March 1, 2021 and following an internal restructure of the Executive Management, Paul Altschwager was appointed as Group Chief Financial Officer. Regular discussions are held to ensure the Audit & Risk Committee is kept up to date on all matters regarding financial reporting and any potential issues are highlighted and discussed at an early stage.
EXTERNAL AUDITOROn September 25, 2020, the Group’s previous auditor, Deloitte LLP (‘Deloitte’) advised the Board of their intention to resign. The Board has reviewed and considered Deloitte’s findings and appropriate measures have been taken.
Following the resignation of Deloitte in September 2020, KPMG LLP were appointed as External Auditor in October 2020. The transition and FY20 audit plan were reviewed and approved by the Board during 2020 and 2021. Following its establishment, the Committee managed the relationship with the External Auditor and going forward will report and recommend to the Board on audit matters such as the re-appointment and the FY21 and FY22 audit plan. The Committee will also be responsible for negotiating fees and terms of engagement.
The Committee Chair and the External Auditor work closely on all audit matters with regular discussions taking place outside of the scheduled Committee meetings, with communications based on open and honest dialogue.
The Financial Reporting Council’s Audit Quality Review (“AQR”) team monitors the quality of audit work of certain UK audit firms through annual inspections of a sample of audits and related procedures at individual audit firms. During the year, the 2019 audit of the Group by the Group’s previous auditor, Deloitte, was reviewed by the AQR and their report was issued in May 2021. The review identified a number of areas for improvement and areas of good practice.
The Committee has discussed the key findings of the review with the Group’s current auditor, KPMG, and is satisfied that KPMG has taken appropriate steps to address them in the 2020 audit.
INTERNAL AUDITORThe Group’s Internal Audit function was established during the first quarter of 2020 with the purpose of providing independent assurance to the Committee and the Board around the effectiveness of the internal controls framework. As a result of the pandemic and following a re-prioritisation of work, developments in this area were paused.
Work recommenced towards the end of 2020 and currently the Internal Audit function are supporting the Finance and Technology team with the Internal Controls for Financial Reporting programme which will continue throughout 2021 and 2022.
An internal audit charter and work plan detailing key areas of focus and objectives will be submitted to the Audit & Risk Committee for approval in preparation for FY22.
RISK MANAGEMENT During 2021 and in accordance with its terms of reference, the Committee has and continues to assist and support the Board and the Group with its risk management processes. A principal risk register has been approved by the Committee with the risks being categorised based on six main areas: Strategic, Operational, Financial, People, Technology, Regulatory, Compliance and Data.
A member of the Executive Management has been assigned to each category and a detailed review of the controls in place has been undertaken in order to agree to inherent and residual risk scores. An executive-level Risk & Disclosure Committee has been established with meetings being held at least quarterly to assess the risk environment and challenge assumptions prior to presenting to the Audit & Risk Committee in relation to any changes in the key risks or controls.
Work will continue throughout 2021 and 2022 to develop the controls environment, however in order to support the Audit & Risk Committee, the Co-CEOs and Executive Management will provide a form of attestation around the risk policy and controls in place.
Further information around the risk management processes and principal risks can be found on pages 58 to 65.
LOOKING AHEADAudit reformThroughout 2021 and 2022, the Committee will keep a close review of developments and changes in the regulatory landscape in light of the BEIS consultation paper regarding audit reform and the impact of this on EG, given the widening definition of a public interest entity.
In addition to the above, priorities for the year ahead include:
• Providing support to the Group’s management team to ensure effective processes are in place regarding financial reporting, internal controls and risk management
• Developing relationships with the External Auditor and agreeing terms of engagement and scope of subsequent audits
Dame Alison CarnwathChair of the Audit & Risk Committee
October 31, 2021

84 EG Group | 2020 Annual Report and Financial Statements
The Remuneration Committee (the ‘Committee’) was established by the Board in May 2021 and led by John Carey alongside the Chairman of the Board Stuart Rose and independent Non-Executive Director Alison Carnwath as fellow members. Whilst the remaining Directors are invited to attend, they are not members of the Committee and do not form quorum for the meeting. Members of Executive Management or appropriate individuals such as representation from HR will be invited to attend and present updates and proposals to the Committee as required.
The purpose of the Committee is to work with the Group’s Co-CEOs and Executive Management to harmonise and develop a Group-wide, sustainable approach to remuneration that attracts, retains and rewards key talent and is aligned with the Group’s overall strategy.
The specific roles and responsibilities as detailed in the Committee’s terms of reference include:
• Recommending, for Board approval, the Group’s Remuneration Policy for the Directors and key members of Executive Management
• Proposing appropriate remuneration structures, ensuring the performance criteria are fair and rewarding of successful performance and are sufficiently balanced to include financial and non-financial KPIs
• Ensuring there is consideration of the need for clarity, simplicity, risk, mitigation, proportionality and cultures in all proposed structures
• Keeping sufficiently aware and up to date regarding remuneration in other companies of similar size and scale as well as changes in laws and regulations
• Ensuring appropriate reviews and that consideration is given to workforce pay and policies and is in line with best practice
MEETINGSThe Committee meetings have been scheduled every quarter and will be held prior to the Board meetings. The agenda is agreed in conjunction with the Chair and circulated alongside relevant papers in advance of the meetings. At the next Board meeting, the Remuneration Chair will provide an update to all Board members on matters discussed and agreed, next steps and actions.
At the time of publication, the Committee has held two meetings, in May and September of 2021. As a result of the Group’s acquisitive strategy and exponential growth, the focus of these meetings has been to identify our current position compared to the broader market in relation to remuneration packages, retention programmes and policies across the Group and to undertake a gap analysis identifying and prioritising any risks and next steps.
LOOKING AHEADThe Committee’s priorities for 2021 and beyond include:
• Identifying and prioritising remediation of gaps in workforce policies and practices
• Alignment of a Group-wide approach and strategy to remuneration
• Ensuring sufficient reward/retention schemes are in place, rewarding performance, and comprise of both financial and non-financial KPIs that are consistent across the Group
John CareyChair of the Remuneration Committee
October 31, 2021
THE GROUP IS COMMITTED TO ENSURING A SUSTAINABLE APPROACH TO REMUNERATION THAT IS FAIR AND REWARDS PERFORMANCE.
John CareyChair of the Remuneration Committee
REMUNERATION COMMITTEE

STRATEGIC REPORT GOVERNANCE FINANCIALS
85EG Group | 2020 Annual Report and Financial Statements
The Nomination Committee (the ‘Committee’) was established by the Board in May 2021 and is led by the Group Chairman Stuart Rose alongside independent Non-Executive Directors Alison Carnwath and John Carey. Whilst the remaining Directors are invited to attend, they are not members of the Committee and do not form quorum for the meeting. Members of Executive Management or appropriate individuals may attend at the request of the Committee where appropriate.
The purpose of the Nomination Committee is to ensure the effective workings of the Directors, the Board as a whole and its Committees by reviewing the composition and structure as well as the skills and competence of the Directors both individually and collectively.
Within the agreed terms of reference, the Committee will assist the Group in:
• Ensuring a pipeline of talent and that effective succession plans are in place for key roles
• Recommending for Board approval the appointment of Directors and members of Executive Management where appropriate
• Ensuring Directors remain fit for purpose and up to date with relevant training and professional development
• Assisting and supporting with Board and Committee evaluations and implementing action plans to support the continuous development and training of the Directors
• Monitoring and reviewing the Group’s corporate governance framework
MEETINGS Under the terms of reference the Committee is required to meet at least twice during the year. As a result of timings and at the date of publication, the Committee has held one meeting, during September 2021.
Agendas are agreed with the Chair and circuited alongside supporting papers in advance of the meeting.
LOOKING AHEADThe key priorities of the Nomination Committee during 2021 and continuing into 2022 will be to:
• Undertake an analysis to identify gaps in relation to skills and competence and identify potential roles and candidates
• Undertake an internally facilitated evaluation of the workings of the Directors, the Board and Committees, reporting the outcome of the evaluation and making appropriate recommendations to the Board
• Support with the rollout of action plans as a result of the evaluation exercise
Lord Stuart RoseChair of the Nomination Committee
October 31, 2021
THE NOMINATION COMMITTEE IS RESPONSIBLE FOR ENSURING THE APPROPRIATE MIX OF SKILL, COMPETENCE AND DIVERSITY OF THE GROUP’S BOARD AND COMMITTEES TO DELIVER ON THE GROUP’S STRATEGIC GOALS WHILST PROVIDING VALUE TO OUR SHAREHOLDERS AND STAKEHOLDERS
Lord Stuart RoseChair of the Nomination Committee
NOMINATION COMMITTEE

86 EG Group | 2020 Annual Report and Financial Statements
DIRECTORS’ REPORT
The Directors present their Annual Report on the affairs of the Group, together with the financial statements and auditor’s report, for the year ended December 31, 2020.
RESEARCH AND DEVELOPMENTThe Group is committed to undertaking research and development activities with regard to the markets and sectors in which the business operates, particularly in relation to alternative fuels as well as our digital offerings to continue to provide best-in-class services to our customers.
BUSINESS REVIEW, POST-BALANCE SHEET EVENTS AND FUTURE DEVELOPMENTSA review of the financial performance of the Group during the year is included in the strategic report. Details of significant events since the balance sheet date are contained in note 36 to the financial statements. An indication of likely future developments in the business of the Company is included in the strategic report.
FINANCIAL RISK MANAGEMENTInformation relating to the principal risks and uncertainties of the Group has been included within the strategic report. Further information relating to the financial risks of the Group has been included in note 33.
OWNERSHIPThe ultimate parent Company of EG Group Limited is Optima Bidco (Jersey) Limited, a company incorporated in Jersey, that is 25% owned by Mohsin Issa, 25% owned by Zuber Issa and 50% owned by funds managed by TDR Capital LLP.
DIRECTORS The Directors who held office during the year were as follows:
• Zuber Vali Issa
• Mohsin Issa
The Company’s Articles of Association provide for the indemnification of its Directors to the extent permitted by the Companies Act 2006 and other applicable legislation, out of the assets of the Company, in the event that they incur certain expenses in connection with the execution of their duties. In addition, and in common with many other companies, the Company has directors’ and officers’ liability insurance, in respect of certain losses or liabilities to which officers of the Company may be exposed in the discharge of their duties.
PROPOSED DIVIDENDThe Directors are not proposing to recommend a dividend from the Company in respect of the financial year ended December 31, 2020 (2019: $nil). No dividends were paid to shareholders from the Company during the year ended December 31, 2020 (2019: $nil).
CAPITAL STRUCTUREDetails of the issued share capital, together with details of the movements in the Company’s issued shares during the year are shown in note 27. The Company has one class of ordinary shares which carry no right to fixed income. Each share carries the right to one vote at a general meeting of the Company. The percentage of the issued nominal value of the ordinary shares is 100% of the total issued nominal value of all share capital.
No person has any special rights of control over the Company’s share capital and all issued shares are fully paid.
GOING CONCERNThe Directors have a reasonable expectation that the Company and the Group have adequate resources to continue in operational existence for the foreseeable future. In their consideration of going concern, the Directors have reviewed the Group’s future cash flow forecasts and profit projections, on both a base case and sensitised basis, considering the principal risks and uncertainties of the Group.
These forecasts have been prepared based on market data, past experience, expected trading on newly acquired businesses and reflect the impact from COVID-19 on trading activity and liquidity. The Directors have reviewed these forecasts and have also considered sensitivities in respect of potential downside scenarios and the mitigating actions available to the Group.
Under all scenarios, there was sufficient headroom on covenants and cash headroom. Accordingly, the Directors continue to adopt the going concern basis of accounting in preparing the financial statements.
Further details regarding the adoption of the going concern basis can be found in note 3 in the financial statements.
EMPLOYEE ENGAGEMENTWe are committed to the investment of our employees at all levels. Further information on our workforce policies, including disability and diversity and inclusion as well as how we engage with our employees, is detailed in our ESG statement on pages 47 to 57 and our Section 172 statement on pages 20 and 21.
ENGAGEMENT WITH SUPPLIERS, CUSTOMERS AND OTHERS IN A BUSINESS RELATIONSHIP WITH THE COMPANYSuppliers and customers are key stakeholders of the Group; details of our arrangements as well as other business relationships can be found in the strategic report. Details of how we engage with our key stakeholders, decisions taken during 2020 and the impact of these decisions on our key stakeholder groups can be found in our Section 172 statement on pages 20 and 21.

STRATEGIC REPORT GOVERNANCE FINANCIALS
87EG Group | 2020 Annual Report and Financial Statements
STATEMENT OF CORPORATE GOVERNANCE ARRANGEMENTSThroughout the year the Group has applied the Wates Principles of Corporate Governance. A statement of the Group’s compliance with the principles can be found on pages 78 to 81.
GREENHOUSE GAS EMISSIONS AND ENERGY CONSUMPTIONWe comply with all relevant environmental legislation and have clear objectives to reduce energy consumption and waste production. Details of our carbon reporting are set out in the ESG report on pages 50 and 51.
POLITICAL CONTRIBUTIONSNeither the Company nor any of its subsidiaries made any political donations or incurred any political expenditure during the current and prior year.
GUIDELINES FOR DISCLOSURE AND TRANSPARENCY IN PRIVATE EQUITYThe Directors consider that the Annual Report and Financial Statements comply with all aspects of the Guidelines for Disclosure and Transparency in Private Equity.
STRATEGIC REPORTThe Directors confirm that, to the best of their knowledge, the strategic report includes a fair review of the development and performance of the business and the position of the Group and Company, together with a description of the principal risks and uncertainties that they face.
DISCLOSURE OF INFORMATION TO AUDITOREach of the persons who is a Director at the date of approval of this Annual Report confirms that:
• So far as the Director is aware, there is no relevant audit information of which the Company’s auditor is unaware
• The Director has taken all steps that he ought to have taken as a Director in order to make himself aware of any relevant audit information and to establish that the Company’s auditor is aware of that information
This confirmation is given and should be interpreted in accordance with the provisions of Section 418 of the Companies Act 2006.
By order of the Board
Imraan PatelGeneral Counsel and Company Secretary
October 31, 2021

88 EG Group | 2020 Annual Report and Financial Statements
DIRECTORS’ RESPONSIBILITIES STATEMENT
The Directors are responsible for preparing the Annual Report, strategic report, the Directors’ report and financial statements in accordance with applicable law and regulations.
Company law requires the Directors to prepare financial statements for each financial year. Under that law the Directors have elected to prepare the Group financial statements in accordance with International Financial Reporting Standards (“IFRSs”) as adopted by the European Union and the parent Company financial statements in accordance with United Kingdom Generally Accepted Accounting Practice (United Kingdom Accounting Standards and applicable law), including FRS 101 ‘Reduced Disclosure Framework’.
Under company law the Directors must not approve the financial statements unless they are satisfied that they give a true and fair view of the state of affairs of the Company and of the profit or loss of the Company for that period.
In preparing the Group and parent Company financial statements, the Directors are required to:
• Select suitable accounting policies and then apply them consistently
• Make judgements and estimates that are reasonable, relevant, reliable and prudent
• For the Group financial statements, state whether they have been prepared in accordance with international accounting standards in conformity with the requirements of the Companies Act 2006
• For the parent Company financial statements, state whether applicable UK accounting standards have been followed, subject to any material departures disclosed and explained in the financial statements
• Assess the Group and parent Company’s ability to continue as a going concern, disclosing, as applicable, matters related to going concern
• Use the going concern basis of accounting unless they either intend to liquidate the Group or the parent Company or to cease operations, or have no realistic alternative but to do so
The Directors are responsible for keeping adequate accounting records that are sufficient to show and explain the Company’s transactions and disclose with reasonable accuracy at any time the financial position of the Company and enable them to ensure that its financial statements comply with the Companies Act 2006. They are responsible for such internal control as they determine is necessary to enable the preparation of financial statements that are free from material misstatement, whether due to fraud or error, and have general responsibility for taking such steps as are reasonably open to them to safeguard the assets of the Group and to prevent and detect fraud and other irregularities.
The Directors are responsible for the maintenance and integrity of the corporate and financial information included on the Company’s website. Legislation in the UK governing the preparation and dissemination of financial statements may differ from legislation in other jurisdictions.
Zuber Issa cbe & Mohsin Issa cbe
Co-Founders and Co-Chief Executive Officers
October 31, 2021
STRATEGIC REPORT GOVERNANCE FINANCIALS
89EG Group | 2020 Annual Report and Financial Statements
INDEPENDENT AUDITOR’S REPORTto the members of EG Group Limited
OPINIONWe have audited the financial statements of EG Group Limited (the ‘Company’) for the year ended December 31, 2020 which comprise the consolidated income statement, the consolidated statement of comprehensive income, the consolidated and parent Company balance sheets, the consolidated and parent Company statements of changes in equity, the consolidated cash flow statements and related notes, including the accounting policies in note 3.
In our opinion:
• the financial statements give a true and fair view of the state of the Group’s and of the parent Company’s affairs as at December 31, 2020 and of the Group’s loss for the year then ended;
• the Group financial statements have been properly prepared in accordance with international accounting standards in conformity with the requirements of the Companies Act 2006;
• the parent Company financial statements have been properly prepared in accordance with UK accounting standards, including FRS 101 Reduced Disclosure Framework; and
• the financial statements have been prepared in accordance with the requirements of the Companies Act 2006.
BASIS FOR OPINIONWe conducted our audit in accordance with International Standards on Auditing (UK) (“ISAs (UK)”) and applicable law. Our responsibilities are described below. We have fulfilled our ethical responsibilities under, and are independent of, the Group in accordance with UK ethical requirements including the FRC Ethical Standard. We believe that the audit evidence we have obtained is a sufficient and appropriate basis for our opinion.
GOING CONCERNThe Directors have prepared the financial statements on the going concern basis as they do not intend to liquidate the Group or the Company or to cease their operations, and as they have concluded that the Group and the Company’s financial position means that this is realistic. They have also concluded that there are no material uncertainties that could have cast significant doubt over their ability to continue as a going concern for at least a year from the date of approval of the financial statements (the ‘going concern period’).
We used our knowledge of the Group, its industry, and the general economic environment to identify the inherent risks to its business model and analysed how those risks might affect the Group’s and Company’s financial resources or ability to continue operations over the going concern period. The risks that we considered most likely to adversely affect the Group’s and Company’s available financial resources and metrics relevant to debt covenants over this period were:
• the impact of COVID-19 infection waves, government lockdowns and subsequent easing of restrictions; and
• the impact of committed business acquisitions on the Group’s cash flow post year end.
We considered whether these risks could plausibly affect the liquidity or covenant compliance in the going concern period by comparing severe, but plausible, downside scenarios that could arise from these risks individually and collectively against the level of available financial resources and covenants indicated by the Group’s financial forecasts.
Our procedures also included an assessment of whether the going concern disclosure in note 1 to the financial statements gives a complete and accurate description of the Directors’ assessment of going concern.
Our conclusions based on this work:
• we consider that the Directors’ use of the going concern basis of accounting in the preparation of the financial statements is appropriate;
• we have not identified, and concur with the Directors’ assessment that there is not, a material uncertainty related to events or conditions that, individually or collectively, may cast significant doubt on the Group or the Company’s ability to continue as a going concern for the going concern period; and
• we found the going concern disclosure in note 1 to be acceptable.
However, as we cannot predict all future events or conditions and as subsequent events may result in outcomes that are inconsistent with judgements that were reasonable at the time they were made, the above conclusions are not a guarantee that the Group or the Company will continue in operation.

90 EG Group | 2020 Annual Report and Financial Statements
INDEPENDENT AUDITOR’S REPORT CONTINUEDto the members of EG Group Limited
FRAUD AND BREACHES OF LAWS AND REGULATIONS – ABILITY TO DETECTIdentifying and responding to risks of material misstatement due to fraudTo identify risks of material misstatement due to fraud (‘fraud risks’) we assessed events or conditions that could indicate an incentive or pressure to commit fraud or provide an opportunity to commit fraud. Our risk assessment procedures included:
• enquiring of Directors, the Audit & Risk Committee, internal audit, Group General Counsel and inspection of policy documentation as to the Group’s channel for ‘whistleblowing’, as well as whether they have knowledge of any actual, suspected or alleged fraud;
• inspection of Board of Directors and Audit & Risk Committee meeting minutes; and
• consideration of the Group’s results against performance targets and the Group’s remuneration policies.
We communicated identified fraud risks throughout the audit team and remained alert to any indications of fraud throughout the audit. This included communication from the Group to component audit teams of relevant fraud risks identified at the Group level and request to component audit teams to report to the Group audit team any instances of fraud that could give rise to a material misstatement at Group level.
As required by auditing standards, and taking into account possible pressures to meet profit targets and our overall knowledge of the control environment, we perform procedures to address the risk of management override of controls, in particular the risk that Group management may be in a position to make inappropriate accounting entries and the risk of bias in accounting estimates and judgements. On this audit, we do not believe there is a fraud risk related to revenue recognition because the incentive/pressure and opportunity for management for fraudulent revenue recognition using the revenue account at a transactional level is limited. Performance targets and other pressures on management are focused on EBITDA metrics rather than revenue metrics and the nature of the operations provide limited opportunities to engage in fraudulent revenue recognition.
We did not identify any additional fraud risks.
We also performed procedures including:
• identifying journal entries and other adjustments to test based on risk criteria and comparing the identified entries to supporting documentation. These included those posted by users who typically do not create or post journals; and
• assessing significant accounting estimates for bias.
Identifying and responding to risks of material misstatement due to non-compliance with laws and regulationsWe identified areas of laws and regulations that could reasonably be expected to have a material effect on the financial statements from our general commercial and sector experience through discussion with the Directors and other management (as required by auditing standards), and from inspection of the Group’s regulatory and legal correspondence and discussed with the Directors and other management the policies and procedures regarding compliance with laws and regulations.
We communicated identified laws and regulations throughout our team and remained alert to any indications of non-compliance throughout the audit. This included communication from the Group to component audit teams of relevant laws and regulations identified at the Group level, and a request for component auditors to report to the Group audit team any instances of non-compliance with laws and regulations that could give rise to a material misstatement at Group.
The potential effect of these laws and regulations on the financial statements varies considerably.
Firstly, the Group is subject to laws and regulations that directly affect the financial statements, including financial reporting legislation (including related companies legislation), distributable profits legislation and taxation legislation (direct and indirect). We assessed the extent of compliance with these laws and regulations as part of our procedures on the related financial statement items.
Secondly, the Group is subject to many other laws and regulations where the consequences of non-compliance could have a material effect on amounts or disclosures in the financial statements, for instance through the imposition of fines or litigation or the loss of the Group’s licence to operate. We identified the following areas as those most likely to have such an effect:
• relevant regional fuel storage and related environmental regulations which control spillages arising from delivery, storage, and sale of fuel products;,employee health and safety and Consumer Rights Legislation, reflecting the Group’s business model; and
• data privacy laws, reflecting the Group’s growing amounts of personal data held.
Auditing standards limit the required audit procedures to identify non-compliance with these laws and regulations to enquiry of the Directors and other management and inspection of regulatory and legal correspondence, if any. Therefore, if a breach of operational regulations is not disclosed to us or evident from relevant correspondence, an audit will not detect that breach.

STRATEGIC REPORT GOVERNANCE FINANCIALS
91EG Group | 2020 Annual Report and Financial Statements
Context of the ability of the audit to detect fraud or breaches of law or regulationOwing to the inherent limitations of an audit, there is an unavoidable risk that we may not have detected some material misstatements in the financial statements, even though we have properly planned and performed our audit in accordance with auditing standards. For example, the further removed non-compliance with laws and regulations is from the events and transactions reflected in the financial statements, the less likely the inherently limited procedures required by auditing standards would identify it.
In addition, as with any audit, there remained a higher risk of non-detection of fraud, as these may involve collusion, forgery, intentional omissions, misrepresentations, or the override of internal controls. Our audit procedures are designed to detect material misstatement. We are not responsible for preventing non-compliance or fraud and cannot be expected to detect non-compliance with all laws and regulations.
OTHER INFORMATIONThe Directors are responsible for the other information, which comprises the strategic report, the Directors’ report and the governance report. Our opinion on the financial statements does not cover the other information and, accordingly, we do not express an audit opinion or, except as explicitly stated below, any form of assurance conclusion thereon.
Our responsibility is to read the other information and, in doing so, consider whether, based on our financial statements audit work, the information therein is materially misstated or inconsistent with the financial statements or our audit knowledge. Based solely on that work:
• we have not identified material misstatements in the other information;
• in our opinion the information given in the strategic report and the Directors’ report for the financial year is consistent with the financial statements; and
• in our opinion those reports have been prepared in accordance with the Companies Act 2006.
MATTERS ON WHICH WE ARE REQUIRED TO REPORT BY EXCEPTIONUnder the Companies Act 2006, we are required to report to you if, in our opinion:
• adequate accounting records have not been kept by the parent Company, or returns adequate for our audit have not been received from branches not visited by us; or
• the parent Company financial statements are not in agreement with the accounting records and returns; or
• certain disclosures of Directors’ remuneration specified by law are not made; or
• we have not received all the information and explanations we require for our audit.
We have nothing to report in these respects.
DIRECTORS’ RESPONSIBILITIESAs explained more fully in their statement set out on page 88, the Directors are responsible for: the preparation of the financial statements and for being satisfied that they give a true and fair view; such internal control as they determine is necessary to enable the preparation of financial statements that are free from material misstatement, whether due to fraud or error; assessing the Group and parent Company’s ability to continue as a going concern, disclosing, as applicable, matters related to going concern; and using the going concern basis of accounting unless they either intend to liquidate the Group or the parent Company or to cease operations, or have no realistic alternative but to do so.
AUDITOR’S RESPONSIBILITIESOur objectives are to obtain reasonable assurance about whether the financial statements as a whole are free from material misstatement, whether due to fraud or error, and to issue our opinion in an auditor’s report. Reasonable assurance is a high level of assurance, but does not guarantee that an audit conducted in accordance with ISAs (UK) will always detect a material misstatement when it exists. Misstatements can arise from fraud or error and are considered material if, individually or in aggregate, they could reasonably be expected to influence the economic decisions of users taken on the basis of the financial statements.
A fuller description of our responsibilities is provided on the FRC’s website at www.frc.org.uk/auditorsresponsibilities.
THE PURPOSE OF OUR AUDIT WORK AND TO WHOM WE OWE OUR RESPONSIBILITIESThis report is made solely to the Company’s members, as a body, in accordance with Chapter 3 of Part 16 of the Companies Act 2006. Our audit work has been undertaken so that we might state to the Company’s members those matters we are required to state to them in an auditor’s report and for no other purpose. To the fullest extent permitted by law, we do not accept or assume responsibility to anyone other than the Company and the Company’s members, as a body, for our audit work, for this report, or for the opinions we have formed.
Paul Sawdon (Senior Statutory Auditor)for and on behalf of KPMG LLP, Statutory Auditor
Chartered Accountants 15 Canada Square London E14 5GL
November 1, 2021

92 EG Group | 2020 Annual Report and Financial Statements
CONSOLIDATED INCOME STATEMENTFor the year ended December 31, 2020
2020 2019 restated(1)
Note
Beforeexceptional
items$m
Exceptionalitems
(note 5)$m
Afterexceptional
items$m
Beforeexceptional
items$m
Exceptionalitems
(note 5)$m
Afterexceptional
items$m
Continuing operations
Revenue 6 21,463 — 21,463 23,337 — 23,337
Cost of sales (17,856) — (17,856) (20,699) — (20,699)
Gross profit 3,607 — 3,607 2,638 — 2,638
Distribution costs (2,410) — (2,410) (1,905) — (1,905)
Administrative expenses (486) (28) (514) (277) (184) (461)
Other operating income 13 — 13 8 — 8
Share of profit of equity accounted investments 19 — — — 1 — 1
Operating profit/(loss) 724 (28) 696 465 (184) 281
Profit on disposal — — — — 173 173
Finance income 12 7 — 7 8 — 8
Finance costs 13 (864) (6) (870) (536) (19) (555)
(Loss)/profit before tax (133) (34) (167) (63) (30) (93)
Tax 14 (72) 7 (65) (10) (41) (51)
(Loss)/profit for the year (205) (27) (232) (73) (71) (144)(1) The financial information for the year ended December 31, 2019 reflects a change in presentation to previously reported figures for revenue and cost of
sales as explained in note 6
CONSOLIDATED STATEMENT OF COMPREHENSIVE INCOMEFor the year ended December 31, 2020
2020$m
2019(1)
$m
Loss for the year (232) (144)
Other comprehensive income/(expense)
Items that may be reclassified subsequently to income statement:
Exchange differences on translation of foreign operations 93 22
Items that will not be reclassified subsequently to income statement:
Remeasurement on defined benefit pension plan (4) (5)
Other comprehensive income/(expense) for the year 89 17
Total comprehensive loss for the year (143) (127)(1) The financial information at December 31, 2019 reflects retrospective adjustments made to the provisional value on finalisation of the purchase price
allocation in accordance with IFRS 3 Business Combinations within the measurement period. See note 35 for more information

STRATEGIC REPORT GOVERNANCE FINANCIALS
93EG Group | 2020 Annual Report and Financial Statements
CONSOLIDATED BALANCE SHEETAs at December 31, 2020
Note2020
$m2019(1),(2)
$m2018(2)
$mNon-current assetsGoodwill 15 5,727 5,403 3,000Other intangible assets 16 1,043 1,072 629Property, plant and equipment 17 4,937 4,743 3,271Right of use assets 24 1,992 1,489 —Interests in joint ventures 19 8 7 —Deferred tax asset 23 138 106 52Financial assets 33 2 2 1Trade and other receivables 21 121 102 79
13,968 12,924 7,032Current assetsInventories 20 654 659 335Trade and other receivables 21 545 622 385Current income tax assets 16 13 18Derivative financial instruments 33 1 2 —Assets classified as held for sale 8 14 13 418Cash and cash equivalents 30 661 415 308
1,891 1,724 1,464Total assets 15,859 14,648 8,496Current liabilitiesTrade and other payables 25 (1,689) (1,642) (910)Current income tax liabilities (58) (35) (24)Borrowings 22 (64) (489) (406)Lease liabilities 24 (177) (158) (30)Provisions for other liabilities and charges 26 (154) (83) (355)Liabilities classified as held for sale 8 — — (5)Employee benefit obligations 32 (19) (22) —
(2,161) (2,429) (1,730)Net current liabilities (270) (705) (266)Non-current liabilitiesTrade and other payables 25 (504) (45) (52)Borrowings 22 (9,598) (8,995) (5,759)Lease liabilities 24 (1,600) (1,256) —Derivative financial instruments 33 (2) (2) —Provisions for other liabilities and charges 26 (829) (687) (309)Deferred tax liabilities 23 (533) (467) (208)Employee benefit obligations 32 (48) (40) (30)
(13,114) (11,492) (6,358)Total liabilities (15,275) (13,921) (8,088)Net assets 584 727 408Equity Share capital 27 — — —Share premium account 28 2,159 2,159 1,713Merger reserve 29 (1,297) (1,297) (1,297)Currency translation reserve 29 58 (35) (57)Retained (losses)/earnings (336) (100) 49Total equity 584 727 408(1) The financial information at December 31, 2019 reflects retrospective adjustments made to the provisional value on finalisation of the purchase price
allocation in accordance with IFRS 3 Business Combinations within the measurement period. See note 35 for more information(2) The financial information at December 31, 2019 and at December 31, 2018 reflect a change in presentation to previously reported figures for deferred tax
assets and deferred tax liabilities as explained in note 23
The financial statements on pages 92 to 159 of EG Group Limited, registered number 09826582, were approved by the Board of Directors and authorised for issue on October 31, 2021. They were signed on its behalf by:
Zuber Issa cbe & Mohsin Issa cbe
Co-Founders and Co-Chief Executive Officers
October 31, 2021

94 EG Group | 2020 Annual Report and Financial Statements
CONSOLIDATED STATEMENT OF CHANGES IN EQUITYFor the year ended December 31, 2020
Equity attributable to equity holders of the Company
Note
Share capital
$m
Share premiumaccount
$m
Merger reserve
$m
Currencytranslation
reserve$m
Retained earnings/(losses)
$m
Total equity
$m
Balance at January 1, 2019 — 1,713 (1,297) (57) 49 408
Loss for the year — — — — (144) (144)
Other comprehensive income/(loss) for the year — — — 22 (5) 17
Total comprehensive income/(loss) — — — 22 (149) (127)
Issue of shares 27, 28 — 446 — — — 446
Balance at December 31, 2019(1) — 2,159 (1,297) (35) (100) 727
Loss for the year — — — — (232) (232)
Other comprehensive income/(loss) for the year — — — 93 (4) 89
Total comprehensive income/(loss) — — — 93 (236) (143)
Balance at December 31, 2020 — 2,159 (1,297) 58 (336) 584
(1) The financial information at December 31, 2019 reflects retrospective adjustments made to the provisional value on finalisation of the purchase price allocation in accordance with IFRS 3 Business Combinations within the measurement period. See note 35 for more information

STRATEGIC REPORT GOVERNANCE FINANCIALS
95EG Group | 2020 Annual Report and Financial Statements
CONSOLIDATED CASH FLOW STATEMENTFor the year ended December 31, 2020
Note2020
$m2019
$m
Net cash from operating activities 30 1,835 683
Investing activities
Interest received — 2
Proceeds on disposal of property, plant and equipment 8 26 4
Purchases of property, plant and equipment 17 (364) (308)
Purchases of other intangibles 16 (22) (7)
Proceeds from disposal of businesses 8 — 263
Acquisition of businesses 34 (209) (3,784)
Net cash used in investing activities (569) (3,830)
Financing activities
Interest paid (545) (415)
Repayment of lease liabilities 24 (190) (101)
Loan issuance costs paid 30 (2) (75)
Repayments of borrowings 30 (498) (1,205)
Proceeds from new borrowings 30 176 4,605
Proceeds from issue of equity — 446
Net cash (outflow)/inflow from financing activities (1,059) 3,255
Net increase in cash and cash equivalents 207 108
Cash and cash equivalents at beginning of the year 30 415 308
Effect of foreign exchange rate changes 39 (1)
Cash and cash equivalents at end of the year 30 661 415

96 EG Group | 2020 Annual Report and Financial Statements
NOTES TO THE CONSOLIDATED FINANCIAL STATEMENTSFor the year ended December 31, 2020
1. GENERAL INFORMATION AND BASIS OF PREPARATIONEG Group Limited is a company incorporated and domiciled in the United Kingdom under the Companies Act 2006. The Company is a private company limited by shares and is registered in England and Wales (registration number 09826582), and the address of the registered office is Waterside Head Office, Haslingden Road, Guide, Blackburn, Lancashire, United Kingdom, BB1 2FA.
The principal activities of the Company and its subsidiaries (the ‘Group’) are to operate as a forecourt retailer providing three primary categories of products: retailing of Grocery & Merchandise, Foodservice and Fuel (previously reported as Convenience Retail, Food-to-Go and Fuel) and an additional category of other services.
Basis of preparation The consolidated financial statements have been prepared for the year ended December 31, 2020 (2019: year ended December 31, 2019) in accordance with international financial reporting standards in conformity with the requirements of the Companies Act 2006 and International Financial Reporting Standards adopted pursuant to Regulation (EC) No 1606/2002 as it applies in the European Union.
The consolidated financial statements are presented in US Dollars, generally rounded to the nearest million.
They are prepared on the historical cost basis, except for financial amounts that are measured at fair value at the end of each reporting period, as explained in the accounting policies in note 3.
Effective January 1, 2020 the Directors elected to change the presentation currency of the Group from Euro (“€”) to United States (“US”) Dollars (“$”).
Given an increasing proportion of the Group’s earnings are denominated in US Dollars, we believe that the presentation currency change will give investors and other stakeholders a clearer understanding of EG Group’s performance over time by reducing the volatility of the Group’s earnings due to foreign exchange movements.
In accordance with the guidance defined in IAS 21 The Effects of Changes in Foreign Exchange Rates, the comparative financial statements have been re-translated to US Dollars as follows:
• Income statement and statement of cash flows have been translated into US Dollars using average foreign currency rates prevailing for the relevant period
• Assets and liabilities in the statement of financial position have been translated into US Dollars at the closing foreign currency rates on the relevant balance sheet dates
• Share capital, share premium and the other reserves have been translated at the historical rates of exchange prevailing on the date of each transaction. The cumulative currency translation reserve was set to nil at August 1, 2001 and has been restated on the basis that the Group has reported in US Dollars since that date
• All exchange rates used were extracted from the Group’s underlying financial records
Going concern The financial statements have been prepared on the going concern basis as the Directors have a reasonable expectation that the Group has adequate resources for a period of at least twelve months from the date of approval, having assessed the principal and emerging risks facing the Group and determined that there are no material uncertainties to disclose.
In determining whether the Group’s financial statements can be prepared on a going concern basis, the Directors considered the Group’s business activities together with factors likely to affect its financial performance and liquidity position. These factors included actual trading performance during the pandemic, the trading performance since lockdown restrictions have begun to be lifted and expectations of the future macroeconomic environment. See pages 10 and 11 for the impact of COVID-19 on trading and actions taken during the pandemic.
The Directors have also considered a number of key factors, including the Group’s business model, strategy, principal risks and uncertainties and the financial position of the Group, including the current cash position and available working capital facilities, financial forecasts for a period until December 31, 2022 (the ‘going concern assessment period’), and the ability to adhere to the covenants contained within the Group’s financing agreements.
Furthermore, this review considered the implications of the changes to the Group’s financing facilities as detailed in note 22 of the financial statements and the impact of the integration of the Group’s acquisition activity.
The Group’s senior debt facilities, as set out in note 22, are subject to a financial covenant measuring net debt to pre-IFRS 16 EBITDA (leverage), which is tested at the end of each calendar quarter based on the utilisation levels of the revolving credit facility (“RCF”).
At October 24, 2021, the Group’s net debt position was $8,189m comprising $805m in cash at bank, $170m cash in transit and on site, and $9,164m of borrowings. In addition, the Group had access to undrawn committed facilities of $587m giving total available liquidity at that time of $1,562m. The Group’s net debt benefited from $593m relating to the deferral of tax and duties payable.
FORECASTSThe COVID-19 pandemic has had a significant impact on customer behaviour during the year ended December 31, 2020, particularly due to the effects of lockdown measures across the Group, a notable consequence being that fuel sales were affected by reduced demand during periods of lockdown, with some recovery in between those periods. Given the designation of fuel stations and/or c-stores as an ‘essential retailer’ in all of the countries in which the Group operates, combined with the successful site operation while adhering to social distancing guidelines, the Group’s earnings have demonstrated resilience during the pandemic to date.
The Directors have prepared base and sensitised cash flow forecasts for a period until December 31, 2022, which indicate that the Group and Company will remain compliant with its covenants and will have sufficient funds through its existing cash balances and available facilities to meet its liabilities as they fall due for that period, without any structural changes to the business needed. In developing the forecasts, the Directors considered the estimated ongoing impact of the pandemic and the outlook for the business. This includes the modelling of a number of severe but plausible scenarios based on the experiences during the year ended December 31, 2020, recognising the degree of uncertainty that continues to exist.
STRATEGIC REPORT GOVERNANCE FINANCIALS
97EG Group | 2020 Annual Report and Financial Statements
The scenarios considered include (a) a reasonable worst case, including a resurgence of the COVID-19 lockdown measures across the Group and (b) a ‘reverse stress test’ scenario. These are described in further detail below.
The Group’s severe but plausible downside scenarios reflect the impact of potential resurgence of the COVID-19 pandemic and a return of lockdown measures in the fourth quarter of 2021 and first quarter of 2022 to a similar extent and time as observed in the corresponding periods in 2020 and 2021, with a recovery from the second quarter of 2022. The principal trading and recovery assumptions are broadly aligned to those observed in the Group’s historical performance as described above.
Whilst not a key factor in the Directors’ going concern conclusion, the Group does also have other significant potential mitigations at its disposal to improve its short-term liquidity position and to comply with financial covenants should the need arise, including scaling back its capital investment programme.
As a result of the uncertainties surrounding the forecasts due to the COVID-19 pandemic, the Group has also modelled a reverse stress test scenario. The reverse stress test models the decline in sales and gross margin that the Group would be able to absorb before requiring additional sources of financing in excess of those that are available and committed. On the basis of the Group’s resilient trading performance during COVID-19 and the observed inverse correlation between fuel margins and volumes, the Directors have considered that the sequence of events leading to this scenario would be considered remote.
CONCLUSIONThe Directors are confident that the Group is well positioned to manage its business risks and have considered a number of factors including current trading performance, the outcomes of a range of possible future trading impacts, current liquidity and the available mitigating actions. Under the Group’s severe but plausible downside scenario there was sufficient headroom on covenants and cash headroom.
The Directors continue to consider and assess acquisition opportunities as they arise, however the forecast scenarios considered for going concern only include such acquisitions which are committed to at the date of approval of the financial statements. The Directors would only approve acquisitions if they are accretive to the value and position of the Group and sufficient funding is available.
Consequently, the Directors are confident that the Group and the Company will have sufficient funds to continue to meet their liabilities as they fall due in the going concern assessment period to December 31, 2022 and therefore have prepared the financial statements on a going concern basis.
The Group’s accounting policies have, unless otherwise stated, been applied consistently to all periods presented in these financial statements.
Finalisation of acquisition accounting and retrospective adjustment to provisional amounts within the measurement period As disclosed in the 2019 financial statements, the exercise to determine the fair value of the acquired assets and liabilities was incomplete at the reporting date in respect of the acquisition of Cumberland Farms, Inc, which completed in October 2019, and accordingly the fair values reported were provisional as at December 31, 2019.
The Group finalised the accounting for the Cumberland Farms business combinations during 2020, within the twelve-month measurement period permitted by IFRS 3 Business Combinations. Accordingly, the Group has revised the comparative information for prior periods presented in the financial statements to reflect the adjustments to the provisional valuation of acquired assets and liabilities, as if the accounting had been completed at the acquisition date.
Details of the impact of the revisions to the comparative period are provided in note 35.
2. ADOPTION OF NEW AND REVISED STANDARDS, AMENDMENTS AND INTERPRETATIONSThe following new standards were adopted in the current financial year:
• Amendments to References to Conceptual Framework in IFRS Standards
• Amendments to IFRS 3 Business Combinations on the definition of a business
• Amendments to IAS 1 Presentation of Financial Statements and IAS 8 Accounting Policies, Changes in Accounting Estimates and Errors on the definition of material
• Amendments to IFRS 9 Financial Instruments, IAS 39 Financial Instruments: Presentation and IFRS 7 Financial Instruments: Disclosures on interest rate benchmark reform
• Amendments to IFRS 16 Leases COVID-19 Related Rent Concessions has been early adopted. The amendment introduces an optional practical expedient for leases in which the Group is a lessee whereby the Group is not required to assess whether eligible rent concessions that are a direct consequence of the COVID-19 pandemic are lease modifications. The impact of the Group adopting the amendment was not material
The Group has considered the above new standards, and amendments to published standards, and has concluded that, except for IFRS 3, they are either not relevant to the Group or they do not have a significant impact on the Group’s consolidated financial statements.
98 EG Group | 2020 Annual Report and Financial Statements
NOTES TO THE CONSOLIDATED FINANCIAL STATEMENTS CONTINUEDFor the year ended December 31, 2020
2. ADOPTION OF NEW AND REVISED STANDARDS, AMENDMENTS AND INTERPRETATIONS CONTINUED
New and revised IFRS in issue but not yet effectiveAt the date of authorisation of these financial statements, the following standards and interpretations which have not been applied in these financial statements were in issue but not yet effective:
• Amendments to IFRS 3 Business Combinations (amendments) – references to the Conceptual Framework
• Amendments to IAS 16 Property, Plant and Equipment (amendments) – proceeds before intended use
• Amendments to IAS 37 Provisions, Contingent Liabilities and Contingent Assets (amendments) – cost of fulfilling a contract
• Amendments to IFRS 9, IAS 39, IFRS 7, IFRS 4 and IFRS 16 (amendments) – interest rate benchmark reform – phase 2
• Amendments to IAS 1 Presentation of Financial Statements (amendments) – classification of liabilities as current or non-current
• Annual improvements – cycle 2018-2020 – Amendments to IFRS 1, IFRS 9, IFRS 16 and IAS 41
• Amendments to IAS 8 Accounting Policies, Changes in Accounting Estimates and Errors
• Amendments to IAS 1 Presentation of Financial Statements and IFRS Practice Statement 2 Making Materiality Judgements
• Amendments to IAS 12 Income Taxes – Deferred Tax Related to Assets and Liabilities Arising from a Single Transaction
The Directors do not expect that the adoption of the standards listed above will have a material impact on the financial statements of the Group in future periods.
3. SIGNIFICANT ACCOUNTING POLICIESPresentational currencyThe presentational currency for the Group is US Dollars. Exchange rate differences arising on translation of subsidiaries with different functional currencies to US Dollars for presentation purposes in the Group’s financial statements, are recognised in the foreign currency translation reserve in shareholders’ equity.
The exchange rates prevailing were as follows:
£/US$ exchange Year ended December 31, 2020 Year ended December 31, 2019 Year ended December 31, 2018
Opening rate 1.32040 1.28001 1.41702
Closing rate 1.36492 1.32040 1.28001
Average rate 1.28232 1.27642 1.33411
€/US$ exchange Year ended December 31, 2020 Year ended December 31, 2019 Year ended December 31, 2018
Opening rate 1.12340 1.14500 1.24570
Closing rate 1.22710 1.12340 1.14500
Average rate 1.13953 1.11929 1.18048
A$/US$ exchange Year ended December 31, 2020 Year ended December 31, 2019 Year ended December 31, 2018
Opening rate 0.70234 — —
Closing rate 0.77196 0.70234 —
Average rate 0.69026 0.68945 —
The principal accounting policies adopted are set out below.
Foreign currencies and functional currencyThe individual financial statements of each Group subsidiary are prepared in the currency of the primary economic environment in which it operates (its functional currency). For the purpose of the consolidated financial statements, the results and financial position of the Group are expressed in US Dollars, the presentational currency for the Group and its consolidated financial statements.
The assets and liabilities of the Group’s foreign operations are translated into the Group’s presentational currency at exchange rates prevailing at the balance sheet date. Profits and losses are translated at average exchange rates for the relevant accounting periods. Exchange differences arising are recognised in the Group statement of comprehensive income/(loss) and are included in the Group’s translation reserve.
Transactions denominated in foreign currencies are translated into the functional currency at the exchange rates prevailing on the date of the transaction. Monetary assets and liabilities denominated in foreign currencies are retranslated into the functional currency at the rates of exchange at the reporting date. Exchange differences on monetary items are recognised in the income statement.
Intragroup loans are translated at the year-end exchange rate with the resulting exchange differences recognised within finance costs.
Goodwill and fair value adjustments arising on the acquisition of a foreign entity are treated as assets and liabilities of the foreign entity and translated at the closing rate. Exchange differences arising are recognised in other comprehensive income.

STRATEGIC REPORT GOVERNANCE FINANCIALS
99EG Group | 2020 Annual Report and Financial Statements
Basis of consolidationThe consolidated financial statements incorporate the financial statements of the parent Company, EG Group Limited, all entities controlled by the Company (its subsidiaries) and the Group’s share of its interests in joint ventures made up to December 31 each year. Control is achieved when the Company has the power over the investee, is exposed, or has rights, to variable return from its involvement with the investee, and has the ability to use its power to affects its returns.
SUBSIDIARIESSubsidiaries are consolidated in the Group’s financial statements from the date that control commences until the date that control ceases. Intragroup balances and any unrealised gains and losses or income and expenses arising from intragroup transactions are eliminated in preparing the consolidated financial statements. A list of all the subsidiaries of the Group is included in note 18 of the Group financial statements. All apply accounting policies which are consistent with those of the rest of the Group.
JOINT VENTURES The Group’s share of the results of joint ventures is included in the Group income statement and Group statement of other comprehensive income/(loss) using the equity method of accounting.
Investments in joint ventures are carried in the Group balance sheet at cost plus post-acquisition changes in the Group’s share of the net assets of the entity, less any impairment in value. The carrying values of investments in joint ventures include acquired goodwill. If the Group’s share of losses in a joint venture equals or exceeds its investment in the joint venture, the Group does not recognise further losses, unless it has incurred obligations to do so or made payments on behalf of the joint venture. Dividends received from joint ventures with nil carrying value are recognised in the income statement as part of the Group’s share of post-tax profits/(losses) of joint ventures. Unrealised gains arising from transactions with joint ventures are eliminated to the extent of the Group’s interest in the entity. The Group’s interests in joint ventures are detailed in note 19.
Exceptional itemsIn addition to presenting information on an IFRS basis, the Group also presents an income statement that separately identifies exceptional items, including the impact of related tax, as shown in a separate column. This adjusted information is disclosed to allow a better understanding of the underlying trading performance of the Group and is consistent with the Group’s internal management reporting. These measures are used for performance analysis.
Exceptional items are those which are separately identified by virtue of their size or incidence and include, but are not limited to, acquisition costs, impairment charges, reorganisation costs, profits and losses on disposal of subsidiaries and other one-off items which meet this definition. The Group adopts a minimum threshold of $1m for the separate identification of exceptional items, which is applied to the aggregate value over the relevant accounting periods. The Group exercises judgement in assessing whether items should be classified as exceptional. This assessment covers both the nature of the item, cause of occurrence and the scale of impact of that item on reported performance. Reversals of previous exceptional items are also classified as exceptional.
Revenue recognitionThe Group provides three primary categories of products and services to its customers: Grocery & Merchandise, Foodservice and Fuel. The Group also provides ancillary services such as car washes, lotteries, payzones, ATMs etc. through its forecourt operations which are recognised within other revenue.
Revenue is recognised when the Group has a contract with a customer and a performance obligation has been satisfied, at the transaction price allocated to that performance obligation. The Group does not adjust any of the transaction prices for the time value of money due to the nature of the Group’s transactions being completed shortly after the transaction is entered into with the customer.
SALE OF GOODSRevenue from the sale of fuel and goods in store is recognised when the transaction is completed in store or at the filling station. Revenue from fuel sales to authorised dealers is recognised when the goods are delivered to the specific site location and control passes.
The transaction price is the value of the goods net of VAT. Fuel and each good sold in store is considered distinct as it is sold to customers on a standalone basis. The standalone selling price of fuel and goods is estimated on the basis of the retail price, except for sales to authorised dealers which is determined on the basis of the wholesale price. Discounts are not considered as they are only given in rare circumstances and are not material.
Payment of the transaction price is due immediately when the customer purchases the fuel at the filling station or takes delivery of the goods in store. A receivable is recognised by the Group when the goods are delivered to the authorised dealers as this represents the point in time at which the right to consideration becomes unconditional, as only the passage of time is required before payment is due.
Given the nature of the business and products sold, expected returns are not considered as they are infrequent and are not material.
GROSS VERSUS NET PRESENTATION – FUEL DUTYThe treatment of fuel duty is determined by local laws and regulations as to when the duty becomes legally payable and who carries the risks and obligations to the tax authorities.
In all markets where fuel duty is applicable to fuel purchases and sales, the cost of sales and revenues are reported including these duties, as the Group’s role in the transaction is that of principal.
LOYALTY PROGRAMMESThe Group operates certain customer loyalty programmes where customers accumulate points for all purchases made, which entitles them to discounts on future purchases. These loyalty programmes are accounted for in accordance with IFRS 15.
AGENT V PRINCIPAL – DEALER SITESWithin the Group, there are a number of ‘dealer’ or ‘retailer’ arrangements in place, whereby a third party will be responsible for some part of the operation of a site.
In line with IFRS 15, when another party is involved in providing goods or services to a customer, the Group determines whether the nature of its promise is a performance obligation to provide the specified goods or services itself (i.e. the Group is acting as principal) or to arrange for those goods or services to be provided by the other party (i.e. the Group is an agent).
100 EG Group | 2020 Annual Report and Financial Statements
NOTES TO THE CONSOLIDATED FINANCIAL STATEMENTS CONTINUEDFor the year ended December 31, 2020
3. SIGNIFICANT ACCOUNTING POLICIES CONTINUEDRevenue recognition continuedAGENT V PRINCIPAL – DEALER SITES CONTINUEDIn making this assessment, a principal is identified as being the party that obtains control of the assets, which are then transferred to the customer. When the Group acts as principal, revenue is recognised in respect of the gross amount of consideration paid by the customer.
When the Group does not control the goods which are transferred, it acts as an agent and recognises revenue only in the amount of any fee or commission to which it expects to be entitled in exchange for arranging for the specified goods or services to be provided by the other party.
Generally, the Group’s revenue streams from dealer sites fall into following broad categories:
• Supply of goods to dealers – the Group acts as a principal in supplying goods to dealers, transferring control and recognising revenue at the point of sale to the dealer
• Goods sold on consignment from dealer sites – the Group retains ownership of goods on consignment until they are sold to an end consumer. The Group recognises revenue in respect of the full sales value to the end consumer at the point the goods are sold, with commissions paid to the dealer in respect of the transaction recognised within cost of sales
• Site rental fees – rental fees earned from dealers on sites are recognised in other income over the life of the lease in accordance with IFRS 16
The redemption of points is treated as a separate performance obligation under IFRS 15, with the transaction price allocated to issued points with reference to the likelihood of redemption and the discounts to be given to the customer on redemption of the points. Revenue from loyalty points is recognised when the customer redeems the points. Revenue for points that are not expected to be redeemed is recognised in proportion to the pattern of rights exercised by customers. A contract liability is recognised in respect of the price allocated to points which remain unredeemed and are expected to be exercised by the customer at year end.
PROVISION OF SERVICES Revenue from the provision of services such as car washes, lotteries, payzones, ATMs etc, is recognised when the service is provided as that is the point in time at which the customer benefits from the service. Where the Group acts as an agent selling goods or services, only the commission income is included within revenue.
COMMERCIAL INCOMESupplier incentives, rebates and discounts are collectively referred to as commercial income. Commercial income is recognised as a deduction from cost of sales on an accruals basis based on the expected entitlement which has been earned up to the balance sheet date for each relevant supplier contract.
Amounts due relating to commercial income are recognised within trade and other receivables, except in cases where the Group currently has a legally enforceable right of set-off and intends to offset amounts due from suppliers against amounts owed to those suppliers, in which case only the net amount receivable or payable is recognised. Accrued commercial income is recognised within accrued income when commercial income earned has not been invoiced at the balance sheet date.
FRANCHISE COSTSThe Group operates a number of brands under franchise agreements across its jurisdictions. Costs paid to franchise owners are presented within cost of sales.
FINANCE INCOME AND COSTSFinance income and costs are recognised in the consolidated income statement in the year to which it relates using the effective interest rate method.
Finance income comprises of:
• Interest receivable which is recognised in the consolidated income statement as it accrues using the effective interest method
• Foreign exchange gains arising on financing
• Finance income is recognised in the consolidated income statement in the year in which it occurs
Finance costs comprise of:
• Foreign exchange losses arising on financing
• Finance costs incurred on finance leases which are recognised in profit or loss using the effective interest method
• Financing costs of raising debt
Business combinations and goodwill The Group accounts for all business combinations by applying the acquisition method. All acquisition-related costs are expensed as incurred. On acquisition, the assets (including intangible assets), liabilities and contingent liabilities of an acquired entity are measured at their fair value. Non-controlling interest is stated at the non-controlling interest’s proportion of the fair values of the assets and liabilities recognised. Where an acquisition of trade and assets takes place, an assessment is initially made as to whether it should be accounted under IFRS 3 or not.
Goodwill arising on consolidation represents the excess of the consideration transferred over the net fair value of the Group’s share of the net assets, liabilities and contingent liabilities of the acquired subsidiary, joint venture and the fair value of the non-controlling interest in the acquiree.
If the consideration is less than the fair value of the Group’s share of the net assets, liabilities and contingent liabilities of the acquired entity (i.e. a discount on acquisition), the difference is credited to the Group income statement in the period of acquisition.
At the acquisition date of a subsidiary, goodwill acquired is recognised as an asset and is allocated to each of the cash-generating units expected to benefit from the business combination’s synergies and to the lowest level at which management monitors the goodwill. Goodwill arising on the acquisition of joint ventures is included within the carrying value of the investment.
On disposal of a subsidiary or joint venture, the attributable amount of goodwill is included in the determination of the profit or loss on disposal. On disposal of a cash-generating unit, the attributable amount of goodwill is included in the determination of the profit or loss on disposal.
Where the Group obtains control of a joint venture, the Group’s previously held interests in the acquired entity is remeasured to its acquisition date fair value and the resulting gain or loss, if any, is recognised in the Group income statement.
STRATEGIC REPORT GOVERNANCE FINANCIALS
101EG Group | 2020 Annual Report and Financial Statements
If the initial accounting for a business combination is incomplete by the end of the reporting period in which the combination occurs, the Group reports provisional amounts for the items for which the accounting is incomplete. Those provisional amounts are adjusted during the twelve-month measurement period, or additional assets or liabilities are recognised, to reflect new information obtained about facts and circumstances that existed as of the acquisition date that, if known, would have affected the amounts recognised as of that date.
Non-current assets held for sale and discontinued operations Non-current assets (or disposal groups) are classified as assets held for sale when their carrying amount is to be recovered principally through a sale transaction and a sale is considered highly probable. They are stated at the lower of carrying amount and fair value less costs to sell.
In accordance with IFRS 5 Non-current Assets Held for Sale and Discontinued Operations, the net results of discontinued operations are presented separately in the consolidated income statement (and the comparatives restated) and the assets and liabilities of these operations are presented separately in the consolidated balance sheet. Refer to note 8 for further details.
Property, plant and equipmentProperty, plant and equipment are stated at historical cost less subsequent depreciation and impairment. Historical cost includes expenditure that is directly attributable to the acquisition of the assets. Properties in the course of construction are carried at cost, less any recognised impairment loss.
Cost includes professional fees and, for qualifying assets, borrowing costs capitalised in accordance with the Group’s accounting policy.
Depreciation of these assets commences when the assets are ready for their intended use. Freehold land is not depreciated.
Assets under construction are not depreciated until they are ready for use and transferred to the appropriate group of assets.
Depreciation is recognised so as to write off the cost or valuation of assets (other than freehold land and properties under construction) less their residual values over their useful lives, using the straight-line method, on the following bases:
Freehold land not depreciated
Buildings 20 to 30 years
Fixtures and fittings 3 to 30 years according to the estimated economic life of the asset
The estimated useful lives, residual values and depreciation method are reviewed at the end of each reporting year, with the effect of any changes in estimate accounted for on a prospective basis.
For periods ended December 31, 2018 and prior, assets held under finance leases were depreciated over their expected useful lives on the same basis as owned assets. However, when there is no reasonable certainty that ownership would be obtained by the end of the lease term, assets were depreciated over the shorter of the lease term and their useful lives.
An item of property, plant and equipment is derecognised upon disposal or when no future economic benefits are expected to arise from the continued use of the asset. When a decision has been made to dispose of or scrap an asset in the future, the remaining useful life is re-evaluated to reflect the period over which the Group will derive economic benefits from its use. The gain or loss arising on the disposal or scrappage of an asset is determined as the difference between the sales proceeds and the carrying amount of the asset and is recognised in the income statement.
Impairment of property, plant and equipment The Group reviews the carrying amounts of its property, plant and equipment if there are indications that assets might be impaired. In performing the review, assets are grouped together into the smallest group of assets that is largely independent of the Group’s other cash-generating streams. If events or changes in circumstances indicate that the carrying value of property, plant and equipment may not be recoverable, the Group determines the recoverable amount. The recoverable amount of the asset is estimated in order to determine the extent of the impairment loss (if any). The recoverable amount is the higher of fair value less costs to sell and value-in-use. In assessing the value-in-use, the Group considers site performance and development plans that have been established at the balance sheet date.
Fair value is determined as the price that would be received to sell the cash-generating unit (“CGU”) in an orderly transaction between market participants at the measurement date. To the extent that the carrying amount exceeds the recoverable amount, the asset is impaired and is written down. Any impairment loss arising is recognised in the consolidated income statement. Prior impairments of non-financial assets are reviewed for possible reversal at each reporting date. A previously recognised impairment loss is reversed only if there has been a change in the assumptions used to determine the asset’s recoverable amount since the last impairment loss was recognised. The reversal is limited so that the carrying amount of the asset does not exceed its recoverable amount, nor exceed the carrying amount that would have been determined, net of depreciation, had no impairment loss been recognised for the asset in prior years. Such reversals are recognised in the consolidated income statement.
Intangible assetsIntangible assets, such as trade names, customer relationships and software, are measured initially at acquisition cost or costs incurred to develop the asset.
Development expenditure incurred on an individual project is capitalised only if specific criteria are met, including that the asset created will generate future economic benefits. Intangible assets acquired in a business combination are recognised at fair value at the acquisition date.
Following initial recognition, intangible assets with finite useful lives are carried at cost less accumulated amortisation and accumulated impairment losses. Amortisation is charged to the consolidated income statement in administrative expenses on a straight-line basis over the estimated useful lives of each asset as show below.
Trade names 20 years or indefinite in specific instances
Customer/dealer relationships
10 to 15 years
Other intangible assets
3 to 16 years according to the estimated life of the asset

102 EG Group | 2020 Annual Report and Financial Statements
3. SIGNIFICANT ACCOUNTING POLICIES CONTINUED Intangible assets continuedIn accordance with IAS 38, amortisation methods, useful lives and residual values are reviewed at each balance sheet date with the effect of any changes in estimate accounted for on a prospective basis.
Impairment of non-financial assets Goodwill is not amortised but is reviewed for impairment at least annually by assessing the recoverable amount of each cash-generating unit to which the goodwill relates.
The recoverable amount is the higher of fair value less costs of disposal and value-in-use. When the recoverable amount of the cash-generating unit is less than the carrying amount, an impairment loss is recognised immediately in the Group income statement, and is not subsequently reversed.
For all other non-financial assets (including intangible assets, property, plant and equipment and right of use assets) the Group performs impairment testing where there are indicators of impairment. If such an indicator exists, the recoverable amount of the asset is estimated in order to determine the extent of the impairment loss (if any). Where the asset does not generate cash flows that are independent from other assets, the Group estimates the recoverable amount of the cash-generating unit to which the asset belongs.
If the recoverable amount of the asset (or cash-generating unit) is less than the carrying amount of the unit, the carrying amount of the asset (or cash-generating unit) is reduced to its recoverable amount. The impairment loss is allocated first to reduce the carrying amount of any goodwill allocated to the unit and then to the other assets of the unit pro-rata on the basis of the carrying amount of each asset in the unit.
Where an impairment loss subsequently reverses, the carrying amount of the asset (or cash-generating unit) is increased to the revised estimate of the recoverable amount, but so that the increased carrying amount does not exceed the carrying amount that would have been determined if no impairment loss had been recognised for the asset (or cash-generating unit) in prior years. A reversal of an impairment loss is recognised immediately as a credit to the consolidated income statement.
Leases The Group assesses whether a contract is or contains a lease at inception of the contract. The Group recognises a right of use asset and a corresponding lease liability with respect to all lease arrangements in which it is the lessee, except for short-term leases (defined as leases with a lease term of twelve months or less) and leases of low-value assets (such as tablets and personal computers, small items of office furniture and telephones). For these leases, the Group recognises the lease payments as an operating expense within distribution costs on a straight-line basis over the term of the lease unless another systematic basis is more representative of the time pattern in which economic benefits from the leased assets are consumed.
LEASE LIABILITIES Lease payments included in the measurement of the lease liability comprise:
• Fixed lease payments (including in-substance fixed payments), less any lease incentives receivable
• Variable lease payments that depend on an index or rate, initially measured using the index or rate at the commencement date
• The amount expected to be payable by the lessee under residual value guarantees
• The exercise price of purchase options, if the lessee is reasonably certain to exercise the options
• Payments of penalties for terminating the lease, if the lease term reflects the exercise of an option to terminate the lease
The lease liability is presented as a separate line in the consolidated balance sheet.
The Group remeasures the lease liability (and makes a corresponding adjustment to the related right of use asset) whenever:
• The lease term has changed or there is a change in the assessment of exercise of a purchase option, in which case the lease liability is remeasured by discounting the revised lease payments using a revised discount rate
• The lease payments change due to changes in an index or rate or a change in expected payment under a guaranteed residual value, in which cases the lease liability is remeasured by discounting the revised lease payments using the initial discount rate (unless the lease payment’s change is due to a change in a floating interest rate, in which case a revised discount rate is used)
• A lease contract is modified and the lease modification is not accounted for as a separate lease, in which case the lease liability is remeasured by discounting the revised lease payments using a revised discount rate. The Group did not make any such adjustments during the periods presented
The variable lease payments that do not depend on an index or a rate are recognised as an expense within distribution costs in the period in which the event or condition that triggers the payment occurs. In calculating the present value of lease payments, the Group uses the incremental borrowing rate (“IBR”) at the lease commencement date if the interest rate implicit in the lease is not readily determinable. As the rate implicit in the lease generally cannot be readily determined for property leases, the Group uses incremental borrowing rates, being the rate that the individual lessee would have to pay to borrow the funds necessary to obtain an asset of similar value to the right of use asset in a similar economic environment with similar terms, security and conditions.
In order to calculate the IBR for the Group in each territory, a risk-free rate is obtained, linked to the length of the lease in the jurisdiction in which the lease is taken, and an adjustment is then made to reflect credit risk based on the Group’s credit rating.
After the commencement date, the amount of lease liabilities is increased to reflect the accrual of interest and reduced for the lease payments made.
NOTES TO THE CONSOLIDATED FINANCIAL STATEMENTS CONTINUEDFor the year ended December 31, 2020

STRATEGIC REPORT GOVERNANCE FINANCIALS
103EG Group | 2020 Annual Report and Financial Statements
RIGHT OF USE ASSETS The Group recognises right of use assets at the commencement date of the lease (i.e. the date the underlying asset is available for use). Right of use assets are measured at cost, less any accumulated depreciation and impairment losses, and adjusted for any remeasurement of lease liabilities. The cost of right of use assets includes the amount of lease liabilities recognised, initial direct costs incurred, restoration costs, and lease payments made at or before the commencement date less any lease incentives received.
Whenever the Group incurs an obligation for costs to dismantle and remove a leased asset, restore the site on which it is located or restore the underlying asset to the condition required by the terms and conditions of the lease, a provision is recognised and measured under IAS 37. To the extent that the costs relate to a right of use asset, the costs are included in the related right of use asset.
Unless the Group is reasonably certain to obtain ownership of the leased asset at the end of the lease term, the recognised right of use assets are depreciated on a straight-line basis over the shorter of their estimated useful life and the lease term. Right of use assets are presented as a separate line in the consolidated balance sheet and are subject to impairment under IAS 36.
For contracts that contain a lease component and one or more additional lease or non-lease components, the Group allocates the consideration in the contract to each lease component on the basis of the relative standalone price of the lease component and the aggregate standalone price of the non-lease components.
CRITICAL JUDGEMENTS IN DETERMINING THE LEASE TERM Extension and termination options are included in a number of property and equipment leases across the Group.
In determining the lease term, management considers all facts and circumstances that create an economic incentive to exercise an extension option, or not exercise a termination option. Extension options (or periods after termination options) are only included in the lease term if the lease is reasonably certain to be extended (or not terminated). This is a subjective assessment made at an individual lease level, reflecting the facts and circumstances applicable to each arrangement. Generally, at the commencement date of property leases, the Group determines the lease term to be the full term of the lease and the first two periods covered by extension options (to the extent that these are within the Group’s control) as the Group is reasonably certain that it will continue in occupation for the periods covered by these extension options. In determining whether termination options will be exercised, the Group make reference to the economic incentives to not exercise a termination option for both the Group and the lessor along with the anticipated costs of termination for both parties.
This assessment is judgemental and reflects the Group’s expectations at the time of lease inception. Should facts and circumstances change, the Group may reassess lease terms, resulting in a remeasurement of lease liabilities and right of use assets.
The assessment is reviewed if a significant event or a significant change in circumstances occurs which affects this assessment and that is within the control of the lessee.
SALE AND LEASEBACK TRANSACTIONSIn a sale and leaseback transaction, the Group transfers control of an asset to another entity for consideration, and leases that asset back from the buyer. The Group immediately recognises a lease liability in respect of the present value of the expected lease payments. The carrying value of the asset is divided between the value of the rights retained by the Group (recognised as a lease asset under IFRS 16) and the rights transferred to the purchaser on a pro-rata basis based on the respective fair values of the property and lease payments at the time of sale. Any profit or loss on disposal is similarly allocated between the retained and transferred rights, with the portion relating to the buyer’s rights in the asset being recognised immediately.
TaxationThe tax expense for the year represents the sum of the tax currently payable and deferred tax. Current and deferred tax are recognised in profit or loss, except when they relate to items that are recognised in other comprehensive income or directly in equity, in which case the current and deferred tax are also recognised in other comprehensive income or directly in equity respectively.
Where current tax or deferred tax arises from the initial accounting for a business combination, the tax effect is included in the accounting for the business combination.
CURRENT TAXCurrent tax is the expected tax payable or receivable on taxable profit or loss for the year. Taxable profit differs from net profit as reported in the income statement because it excludes items of income or expense that are taxable or deductible in other periods or items that are never taxable or deductible. The Group’s liability for current tax is calculated using tax rates that have been enacted or substantively enacted by the balance sheet date.
Tax provisions are recognised for uncertain tax positions where a risk of an additional tax liability has been identified and it is probable that the Group will be required to settle that tax. A provision is made for uncertain tax positions when it is considered probable that there will be a future outflow of funds to a tax authority. The provision is calculated using the single best estimate where that outcome is more likely than not and a weighted average probability in other circumstances. The position is reviewed on an ongoing basis, to ensure appropriate provision is made for each tax jurisdiction. This is assessed on a case-by-case basis using in-house tax experts, professional firms and previous experience. See note 23.
DEFERRED TAXDeferred tax is provided using the balance sheet liability method, providing for temporary differences between the carrying amounts of assets and liabilities for financial reporting purposes and the amounts used for taxation purposes.
Deferred tax is calculated at the tax rates that are expected to apply in the year when the liability is settled or the asset is realised based on tax laws and rates that have been enacted or substantively enacted at the balance sheet date. Deferred tax is charged or credited in the income statement, except when it relates to items charged or credited in other comprehensive income, in which case the deferred tax is also dealt with in other comprehensive income.

104 EG Group | 2020 Annual Report and Financial Statements
NOTES TO THE CONSOLIDATED FINANCIAL STATEMENTS CONTINUEDFor the year ended December 31, 2020
3. SIGNIFICANT ACCOUNTING POLICIES CONTINUEDTaxation continued DEFERRED TAX CONTINUEDDeferred tax assets are recognised to the extent that it is probable that taxable profits will be available against which deductible temporary differences can be utilised. The carrying amount of deferred tax assets is reviewed at each balance sheet date and reduced to the extent that it is no longer probable that sufficient taxable profits will be available to allow all or part of the asset to be recovered. Deferred tax liabilities are recognised for taxable temporary differences arising on investments in subsidiaries, and interests in joint ventures, except where the Group is able to control the reversal of the temporary difference and it is probable that the temporary difference will not reverse in the foreseeable future.
Deferred tax assets and liabilities are offset when there is a legally enforceable right to set off current tax assets against current tax liabilities and when they relate to income taxes levied by the same taxation authority and the Group intends to settle its current tax assets and liabilities on a net basis.
No deferred tax liabilities are recognised for temporary differences that arise on the initial recognition of goodwill or from the initial recognition (other than in a business combination) of other assets and liabilities in a transaction, that affects neither the taxable profit nor the accounting profit.
Employee benefitsI) POST-EMPLOYMENT SCHEMESThe Group operates various post-employment schemes, including both defined benefit and defined contribution plans. For defined benefit plans, obligations are measured at discounted present value (using the projected unit credit method) whilst plan assets are recorded at fair value. The operating and financing costs of such plans are recognised separately in the Group income statement; service costs are spread systematically over the expected service lives of employees and financing costs are recognised in the periods in which they arise. Actuarial gains and losses are recognised immediately in the Group consolidated statement of comprehensive income. Payments to defined contribution schemes are recognised as an expense as they fall due.
II) OTHER EMPLOYEE BENEFITSSome Group companies provide jubilee benefits, rewarding employees for long years of service. The liability recognised in the balance sheet is the present value of the obligation at the reporting date. The jubilee benefits are calculated annually by independent actuaries.
III) TERMINATION BENEFITS/RESTRUCTURING PROVISIONTermination benefits are payable when employment is terminated by the Group before the normal retirement date, or whenever an employee accepts voluntary redundancy in exchange for these benefits. Benefits falling due more than twelve months after the reporting date are discounted to present value. The Group recognises termination benefits at the earlier of the following dates:
• When the Group can no longer withdraw the offer of those benefits
• When the Group recognises costs for a restructuring that is within the scope of IAS 37 and involves the payment of termination benefits
Long-term employee benefits are accounted for in the same way as defined benefit pension benefits with the exception that remeasurements are recognised immediately through profit or loss.
A provision for restructuring is recognised when the Group has approved a detailed and formal restructuring plan, and the restructuring either has commenced or has been announced publicly before the reporting date. Future operating costs are not provided for.
IV) BONUS PLANSThe Group recognises a liability and an expense for bonuses. The Group recognises an accrual where contractually obliged or where there is a past practice that has created a constructive obligation.
InventoriesInventories comprise goods held for resale and are valued at the lower of cost or net realisable value. The Group applies the weighted average cost method to value inventories. The cost of fuel and oil purchased for resale includes all costs incurred in transporting the goods to their present location. Net realisable value is the estimated selling price in the ordinary course of business, less the cost of selling expenses.
Financial instrumentsFinancial assets and financial liabilities are recognised in the Group’s balance sheet when the Group becomes a party to the contractual provisions of the instrument.
FINANCIAL ASSETS AND LIABILITIES Financial assets and liabilities principally consist of trade and other receivables, accrued income, cash and cash equivalents, trade and other payables, borrowings and derivative financial assets/liabilities held at fair value through profit and loss.
CASH AND CASH EQUIVALENTSCash and cash equivalents include cash at bank, in hand, short-term deposits with banks and other financial institutions with an initial maturity of three months or less, and credit/debit card receivables, which are settled within 72 hours.
Bank overdrafts are presented as short-term borrowings, and are reflected as a financing activity in the statement of cash flows.
TRADE AND OTHER RECEIVABLES Trade receivables are recognised initially at the amount of consideration that is unconditionally due from customers for goods sold or services performed in the ordinary course of business.
The Group holds trade and other receivables with the objective to collect the contractual cash flows and therefore measures them subsequently at amortised cost. Loss allowances are recognised based on expected irrecoverable amounts determined by reference to past default experience and are adjusted to reflect current and forward-looking information based on macroeconomic factors and other factors which affect the ability of the customers to settle the receivables.
TRADE AND OTHER PAYABLES Trade and other payables (excluding derivative financial liabilities) are recorded at cost.

STRATEGIC REPORT GOVERNANCE FINANCIALS
105EG Group | 2020 Annual Report and Financial Statements
FINANCIAL LIABILITIES AND EQUITY COMPONENTSDebt and equity instruments are classified as either financial liabilities or as equity in accordance with the substance of the contractual arrangement.
An equity instrument is any contract that evidences a residual interest in the assets of an entity after deducting all of its liabilities. Equity instruments issued by the Group are recognised at the proceeds received, net of direct issue costs.
FINANCIAL ASSETSAll financial assets are recognised and derecognised on a trade date where the purchase or sale of a financial asset is under a contract whose terms require delivery of the financial asset within the timeframe established by the market concerned, and are initially measured at fair value, plus directly attributable transaction costs, except for those financial assets classified as at fair value through profit or loss, which are initially measured at fair value. Subsequently, financial assets will be measured at amortised cost, fair value through other comprehensive income (“FVTOCI”), or fair value through profit and loss (“FVTPL”), on the basis of both the Company’s model for managing the assets and the contractual cash flows associated with them. Where a trade receivable does not contain a significant financing component under IFRS 15, it will be measured at its transaction price.
EQUITY INSTRUMENTSThe Group holds investments in unlisted shares that are not traded in an active market but that are stated at fair value. Fair value is determined in the manner described in note 33. Where an equity instrument is not held for trading and does not involve contingent consideration to which IFRS 3 applies, a determination may be made on an asset-by-asset basis to recognise gains and losses arising from changes in fair value in other comprehensive income or through profit or loss.
Where an election is made to recognise gains and losses arising from changes in fair value in other comprehensive income, the cumulative gain or loss previously recognised in the investments revaluation reserve will remain in this reserve on disposal. Where this election is not made for an equity instrument, all gains and losses arising from changes in fair value will be recognised in the income statement as they arise. Dividends on all equity instruments are recognised in profit or loss when the Group’s right to receive the dividends is established.
AMORTISED COSTFinancial assets are measured at amortised cost where the asset is held for the objective of collecting contractual cash flows and the terms of the asset give rises to cash flows on specific dates that are solely payments of principal and interest on the amount outstanding.
The effective interest method is utilised in the calculation of amortised cost of a debt instrument and for allocating interest income over the relevant period.
The effective interest rate is the rate that exactly discounts estimated future cash receipts (including all fees and points paid or received that form an integral part of the effective interest rate, transaction costs and other premiums or discounts) through the expected life of the debt instrument, or, where appropriate, a shorter period, to the net carrying amount on initial recognition.
Income is recognised on an effective interest basis for debt instruments other than those financial assets classified as at fair value through profit or loss (“FVTPL”).
FINANCIAL ASSETS AT FVTOCIFinancial assets are measured at FVTOCI if the asset is held within a business model for the dual objectives of collecting contractual cash flows and selling financial assets, and the contractual terms give rise on specified dates to cash flows that are solely payments of principal and interest on the principal amount.
FINANCIAL ASSETS AT FVTPLAll financial assets which do not meet the criteria for measurement at amortised cost or FVTOCI are measured at FVTPL. Financial assets at FVTPL are stated at fair value, with any gains or losses arising on remeasurement recognised in profit or loss. The net gain or loss recognised in profit or loss incorporates any dividend or interest earned on the financial asset. Fair value is determined in the manner described in note 33.
IMPAIRMENT OF FINANCIAL ASSETS• At each balance sheet date, financial assets are assessed for
indicators of impairment, considering all reasonable and supportable information available, including that which is forward-looking where this is available without undue cost and effort. If the credit risk on a financial asset has increased significantly since initial recognition, an impairment equivalent to the lifetime expected credit losses on the instrument will be recognised immediately. If the credit risk has not significantly increased since initial recognition, a loss allowance shall be measured equivalent to twelve-month expected credit losses
• Loss allowances for trade receivables resulting from transactions under IFRS 15 will always be measured at an amount equal to the lifetime expected credit loss (“ECL”)
Lifetime ECLs are the ECLs that result from all possible default events over the expected life of a financial instrument. Twelve-month ECLs are the portion of ECLs that result from default events that are possible within the twelve months after the reporting date. ECLs are a probability weighted estimate of credit losses.
For certain categories of financial asset, such as trade receivables, assets that are assessed not to be impaired individually are, in addition, assessed for impairment on a collective basis. Objective evidence of impairment for a portfolio of receivables could include the Group’s past experience of collecting payments, an increase in the number of delayed payments in the portfolio past the average credit period, as well as observable changes in national or local economic conditions that correlate with default on receivables.
The carrying amount of the financial asset is reduced by the impairment loss directly for all financial assets with the exception of trade receivables, where the carrying amount is reduced through the use of an allowance account. When a trade receivable is considered uncollectible, it is written off against the allowance account.
Subsequent recoveries of amounts previously written off are credited against the allowance account. Changes in the carrying amount of the allowance account are recognised in profit or loss.
The gross carrying amount of a financial asset is written off when the Group has no reasonable expectations of recovering a financial asset in its entirety or a portion thereof. However, financial assets that are written off could still be subject to enforcement activities in order to comply with the Group’s procedures for recovery of amounts due.

106 EG Group | 2020 Annual Report and Financial Statements
NOTES TO THE CONSOLIDATED FINANCIAL STATEMENTS CONTINUEDFor the year ended December 31, 2020
3. SIGNIFICANT ACCOUNTING POLICIES CONTINUEDFinancial instruments continued
DERECOGNITION OF FINANCIAL ASSETSThe Group derecognises a financial asset only when the contractual rights to the cash flows from the asset expire, or when it transfers the financial asset and substantially all the risks and rewards of ownership of the asset to another entity, or when there is no reasonable expectation of recovering the asset.
On derecognition of a financial asset in its entirety, the difference between the asset’s carrying amount and the sum of the consideration received and receivable and the cumulative gain or loss that had been recognised in other comprehensive income and accumulated in equity is recognised in profit or loss.
FINANCIAL GUARANTEE CONTRACT LIABILITIES Financial guarantee contract liabilities are measured initially at their fair values and are subsequently measured at the higher of:
• The amount of the loss allowance determined in accordance with IFRS 9
• The amount initially recognised less, where appropriate, the cumulative amount of income recognised in accordance with the Group’s revenue recognition policies
FINANCIAL LIABILITIES Financial liabilities are classified as either financial liabilities ‘at fair value through profit or loss’ (“FVTPL”) or ‘other financial liabilities’ carried at amortised cost. Financial liabilities are initially measured at fair value less directly attributable transaction costs (except those measured at FVTPL which are initially measured at fair value).
FINANCIAL LIABILITIES AT FVTPL Financial liabilities are classified as at FVTPL when the financial liability is contingent consideration that may be paid by an acquirer as part of a business combination to which IFRS 3 applies, or it is designated as at FVTPL. A financial liability will be designated as FVTPL where this significantly reduces a measurement inconsistency which would otherwise arise, or where the group of liabilities (or assets and liabilities as a combined group) is managed and evaluated on a fair value basis, and information about the Group is provided on that basis to key management personnel.
Financial liabilities at FVTPL are stated at fair value, with any gains or losses arising on remeasurement recognised in profit or loss. The net gain or loss recognised in profit or loss incorporates any interest paid on the financial liability. Fair value is determined in the manner described in note 33.
OTHER FINANCIAL LIABILITIES Other financial liabilities, including interest-bearing bank loans and credit facilities, are initially measured at fair value, net of transaction costs. Other financial liabilities are subsequently measured at amortised cost using the effective interest method, with interest expense recognised on an effective yield basis.
The effective interest method is a method of calculating the amortised cost of a financial liability and of allocating interest expense over the relevant period. The effective interest rate is the rate that exactly discounts estimated future cash payments through the expected life of the financial liability, or, where appropriate, a shorter period, to the net carrying amount on initial recognition.
DERECOGNITION OF FINANCIAL LIABILITIESThe Group derecognises financial liabilities when, and only when, the Group’s obligations are discharged, cancelled or have expired. The difference between the carrying amount of the financial liability derecognised and the consideration paid and payable is recognised in profit or loss.
When the Group exchanges with the existing lender one debt instrument for another one with substantially different terms, such exchange is accounted for as an extinguishment of the original financial liability and the recognition of a new financial liability. Similarly, the Group accounts for substantial modification of terms of an existing liability or part of it as an extinguishment of the original financial liability and the recognition of a new liability.
It is assumed that the terms are substantially different if the discounted present value of the cash flows under the new terms, including any fees paid net of any fees received and discounted using the original effective rate, is at least 10% different from the discounted present value of the remaining cash flows of the original financial liability.
Where the change in terms reflects only a non-substantial modification, a gain or loss equal to the difference between the present value of cash flows under the new and the old terms will be immediately recognised in profit or loss.
DERIVATIVE FINANCIAL INSTRUMENTSThe Group enters into a variety of derivative financial instruments to manage its exposure to interest rate and foreign exchange rate risk, including foreign exchange forward contracts and interest rate swaps. Further details of derivative financial instruments are disclosed in note 33.
Derivatives are initially recognised at fair value at the date a derivative contract is entered into and are subsequently remeasured to their fair value at each balance sheet date. The resulting gain or loss is recognised in profit or loss immediately.
A derivative with a positive fair value is recognised as a financial asset whereas a derivative with a negative fair value is recognised as a financial liability. A derivative is presented as a non-current asset or a non-current liability if the remaining maturity of the instrument is more than twelve months and it is not expected to be realised or settled within twelve months. Other derivatives are presented as current assets or current liabilities.
ProvisionsProvisions are recognised when the Group has a present obligation (legal or constructive) as a result of a past event, it is probable that the Group will be required to settle that obligation and a reliable estimate can be made of the amount of the obligation.
The amount recognised as a provision is the best estimate of the consideration required to settle the present obligation at the balance sheet date, taking into account the risks and uncertainties surrounding the obligation. Where a provision is measured using the cash flows estimated to settle the present obligation, its carrying amount is the present value of those cash flows (when the effect of the time value of money is material) using a pre-tax discount rate that reflects current market assessments of the time value of money. The increase in the provision due to passage of time is recognised as a finance cost.
STRATEGIC REPORT GOVERNANCE FINANCIALS
107EG Group | 2020 Annual Report and Financial Statements
When some or all of the economic benefits required to settle a provision are expected to be recovered from a third party, a receivable is recognised as an asset if it is virtually certain that reimbursement will be received and the amount of the receivable can be measured reliably.
Where asset retirement obligations (‘dismantling’) and other asset-related provisions are recorded, a corresponding asset is recognised which is depreciated over the period for which the provision relates.
CONTINGENT LIABILITIES ACQUIRED IN A BUSINESS COMBINATION Contingent liabilities acquired in a business combination are initially measured at fair value at the acquisition date, and recognised as a provision in accordance with IFRS 3 Business Combinations.
Government grantsGovernment grants are recognised where there is reasonable assurance that the grant will be received. Grants that compensate the Group for expenses incurred are recognised in the income statement in the relevant financial statement line on a systematic basis in the periods in which the expenses are recognised, to present the net expense to the Group.
4. SIGNIFICANT ACCOUNTING JUDGEMENTS AND KEY SOURCES OF ESTIMATION UNCERTAINTYIn the application of the Group’s accounting policies, which are described in note 3, the Directors are required to make judgements, estimates and assumptions about the carrying amounts of assets and liabilities that are not readily apparent from other sources. The estimates and associated assumptions are based on historical experience and other factors that are considered to be relevant. Actual results may differ from these estimates.
The estimates and underlying assumptions are reviewed on an ongoing basis. Revisions to accounting estimates are recognised in the period in which the estimate is revised if the revision affects only that period, or in the period of the revision and future periods if the revision affects both current and future periods.
Significant judgements in applying the Group’s accounting policiesIn the process of applying the Group’s accounting policies, which are described above, the Directors have made the following judgements that have the most significant effect on the amounts recognised in the financial statements (apart from those involving estimations, which are dealt with below) and have been identified as being particularly complex or involve subjective assessments.
CARRYING VALUE OF GOODWILLFor the year ended December 31, 2020 impairment reviews were performed by comparing the carrying value of the cash-generating units with their recoverable amount. The recoverable amounts for cash-generating units have been determined based on their fair value less costs to sell. Management determined that due to the potential for increased use of alternative fuel vehicles in the long term, it was more appropriate to use fair value to assess impairment because accounting standards do not permit in a value-in-use calculation the inclusion of earnings generated from future expansionary capital expenditure on the Group’s existing multi-use retail sites.
EXCEPTIONAL ITEMSThe Directors consider that an adjusted profit measure provides useful information for the underlying trends, performance and position of the Group. These measures are consistent with how business performance is measured internally by the Board. Profit before exceptionals is not a recognised measure under IFRS and may not be directly comparable with adjusted measures used by other companies.
The Directors exercise judgement in determining the items to classify as exceptional items. This assessment considers the nature of the item, cause of occurrence and the scale of impact of that item on reported performance. Reversals of previous exceptional items are assessed based on the same criteria. Directors exercise judgement in ensuring there is an equal focus by management in classifying both expenses and revenue items as exceptional.
The Group’s definition of exceptional items, together with further details of adjustments made during the period, is provided in note 3 and note 5.
INDEFINITE LIFE BRANDSThe brand of Cumberland Farms is a well-known long-standing brand in the USA and as a result of the reputation and association with quality there is no foreseeable limit to the period over which the asset is expected to generate net cash inflows. The brand is therefore deemed to have an indefinite useful economic life and the value of $337m will not be amortised. Details of intangible assets are set out in note 16.
Key sources of estimation uncertaintyThe key assumptions concerning the future, and other key sources of estimation uncertainty at the balance sheet date, that have a significant risk of causing a material adjustment to the carrying amounts of assets and liabilities within the next financial year, are discussed below.
IMPAIRMENT OF NON-FINANCIAL ASSETS The Group allocates goodwill to groups of cash-generating units, where each country represents a group of cash-generating units. Recoverable amounts for cash-generating units are the higher of fair value less cost of disposal, and value-in-use.
In assessing value-in-use, the estimated future cash flows are discounted to their present value using a pre-tax discount rate that reflects current market assessments of the time value of money and the risks specific to the asset for which the estimates of future cash flows have not been adjusted.
Fair value is determined based on forecast earnings before interest, taxes, depreciation and amortisation (“EBITDA”, which is a non-IFRS measure) and EBITDA valuation multiples of comparable corporations and market transactions. For the purpose of the impairment test, management uses estimates and assumptions to establish the fair value of the Group’s cash-generating units. If these assumptions and estimates prove to be incorrect, the carrying value of the goodwill may be overstated.
Other sources of estimation uncertainty
FAIR VALUES IN BUSINESS COMBINATIONS In assessing the fair value of assets and liabilities acquired in business combinations, estimation is used in a number of areas. To assist in this work, the Group engages external valuation experts to assess the fair value. Management then review the work and assess the results. Details of the fair value of the acquired assets and liabilities are detailed in note 34.

108 EG Group | 2020 Annual Report and Financial Statements
NOTES TO THE CONSOLIDATED FINANCIAL STATEMENTS CONTINUEDFor the year ended December 31, 2020
4. SIGNIFICANT ACCOUNTING JUDGEMENTS AND KEY SOURCES OF ESTIMATION UNCERTAINTY CONTINUED
Other sources of estimation uncertainty continued
MEASUREMENT OF PROVISIONSThe Group has recognised provisions totalling $983m (2019: $770m) for environmental costs, dilapidations and onerous contracts. The provision for environmental costs and dilapidations is based on the current cost escalated at an inflation rate and discounted at a risk-free rate. The provision for onerous contracts is based on the lower of our current estimates of cost of fulfilling the contracts and any compensation or penalties and discounted to present value when the effect of time value of money is material. These provisions are estimates and the actual costs and timing of future cash flows are dependent on future events and market conditions.
Because actual outflows can differ from estimates due to changes in laws, regulations, prices and conditions, the carrying amounts of provisions are regularly reviewed and adjusted to take account of such changes.
Any difference between expectations and the actual future liability will be accounted for in the period when such determination is made. The carrying amount of provisions will be impacted by changes in the discount rate. Details of provisions are set out in note 26.
5. EXCEPTIONAL ITEMSIn order to allow a better understanding of the underlying trading performance of the Group, items recognised in reported profit or loss before tax which, by virtue of their size and/or nature, do not reflect the Group’s underlying performance, are shown as exceptional items (in accordance with the Group’s accounting policies in note 3). These items are as follows:
2020$m
2019$m
Included within operating profit:
Acquisition and transaction-related costs (38) (48)
Restructuring costs (18) (19)
Impairment charge — (100)
Impairment reversal of 2019 charge 40 —
Goodwill adjustment (12) (17)
(28) (184)
Included below operating profit:
Disposal of EG Business — 173
— 173
Included within finance costs:
Transaction-related finance costs (6) (4)
Loss on extinguishment of debt on refinancing — (15)
(6) (19)
Tax on exceptional items 7 (41)
Total exceptional items (27) (71)
All items are shown gross, unless IFRS permits netting of such expenditure.
Tax on exceptional items has been calculated using the applicable statutory tax rate for taxable items.
For the year ended December 31, 2020Exceptional costs for the year of $35m primarily related to acquisitions and restructuring costs, before income tax.
Acquisition and transaction-related costs within operating profit of $38m and within finance costs of $6m predominantly relate to directly attributable incremental costs incurred as a result of the Group’s growth acquisitions, and largely relate to professional and legal fees. Included in acquisition and transaction-related costs within operating profit is $2m of exceptional income reflecting a remeasurement of the fair value of contingent consideration relating to the acquisition of Certified Oil, an acquisition in the USA which completed in 2019.
Exceptional restructuring costs of $18m relates to the 2020 costs incurred during the year in restructuring the management and support teams in the USA and associated system transition costs, following the significant restructure and relocation of the EG America central business during 2020.
The impairment reversal of $40m recognised in the year relates to the reversal of a previously recognised exceptional impairment charge, where operational performance development plans have been implemented and the site level performance was sufficient to support the increased carrying value.
As part of finalising the purchase price accounting of acquisitions made in Europe, adjustments were identified. These adjustments resulted in a reduction in the goodwill balance and an increase in the pre-acquisition reserves totalling $13m. These adjustments were identified outside of the measurement period and therefore could not be adjusted through the opening balance sheet as measurement period adjustments. Since the adjustments are not material, the 2020 financial statements reflect an adjustment to decrease goodwill by $13m.
STRATEGIC REPORT GOVERNANCE FINANCIALS
109EG Group | 2020 Annual Report and Financial Statements
For the year ended December 31, 2019Exceptional income for the year of $173m relates to the profit on the sale of the proprietary fuel business (‘EG Business’). Professional fees of $2m were incurred in the completion of this sale, included within acquisition and transaction-related costs. The Group has classified the amount as exceptional considering the nature of this one-off event and the financial materiality involved.
Exceptional costs for the year primarily relate to acquisition and transaction costs ($48m), comprising directly attributable incremental costs incurred as a result of the acquisitions in Australia ($41m), Cumberland Farms ($5m), Fastrac Market, LLC ($1m) and Certified Oil ($1m).
Restructuring costs of $19m relate to the restructuring of management and support teams in the USA and Australia incurred by the Group as a result of the review of organisational structures, operational activities and relevant roles and responsibilities to ensure the Group is able to operate more efficiently post the acquisitions in Australia and the USA.
During the year, the Group recognised an exceptional impairment charge of $100m, being $60m as an impairment to property, plant and equipment and $40m as an impairment to right of use assets which were recognised following the implementation of IFRS 16 in the year. Impairment indicators were identified where the recent trading conditions and performance of the sites were unable to support the carrying value of the property, plant and equipment and right of use assets as at the balance sheet date.
The impairment largely related to specific sites acquired as part of business combinations which completed in the final quarter of 2018, for which the Group had at least one year of trading performance at the balance sheet date. For a number of those sites, identified performance development plans have been established to develop profitability, however these had not yet been fully enacted as at December 31, 2019.
The carrying values have been written down to the expected recoverable value of the site through sale where this exceeds the expected value-in-use. A reversal of this impairment will be considered in future years following the implementation of management’s turnaround plans and the resulting expected improvement in these sites’ trading performance.
As part of finalising the purchase price accounting of Kroger c-stores, acquired on April 20, 2018, an adjustment was identified. This adjustment is a reduction in the goodwill balance and an increase in the pre-acquisition reserves totalling $17m. This adjustment was identified outside of the measurement period and therefore could not be adjusted through the opening balance sheet as a measurement period adjustment. Since the adjustment is not material, the 2019 financial statements reflect an adjustment to decrease goodwill by $17m.
Following the Group’s financing exercise to secure the necessary additional term loan funding for the 2019 acquisition in Australia, the arrangement fees and exit fees for the bridging loans totalling $15m were expensed in the year. The Group classified the amount as exceptional considering that it related to the acquisition in Australia and the financial materiality involved. An additional $4m of exceptional finance costs relating to professional fees were incurred on the issue of the Group’s bonds during the year. For further details see note 22.
ThresholdA threshold of $1m is applied in determining the items to classify as exceptional items.
6. REVENUEAn analysis of the Group’s revenue is as follows:
2020$m
2019 restated
$m
Continuing operations
Sale of goods
Grocery & Merchandise sales 4,417 3,218
Foodservice sales 466 410
Fuel sales 16,078 19,239
Other 502 470
Revenue per income statement 21,463 23,337
The Group has reassessed and changed its presentation of fuel excise duties, such that all fuel excise duties are now recognised in revenue in accordance with the fuel duty accounting policy described in note 3 to the financial statements. The 2020 impact of this change in presentation increased revenue by $774m, with a corresponding increase in cost of sales. Given the impact of this change in presentation is material and to aid comparability of the financial statements, the Group has restated the prior year comparatives, increasing 2019 revenue by $951m, with a corresponding increase in cost of sales. There is no impact of this presentation change on the gross profit, operating profit or profit after tax.
Revenue from the provision of services includes dealer and franchise revenues, commissions received for ancillary services and car wash revenues, and is presented within other. Also included within other are $318m (2019: $308m) of Grocery & Merchandise stock sales to dealers in Europe. EG facilitate the sale and purchase of dry stock between our supplier Lekkerland and EG’s portfolio of dealers.

110 EG Group | 2020 Annual Report and Financial Statements
NOTES TO THE CONSOLIDATED FINANCIAL STATEMENTS CONTINUEDFor the year ended December 31, 2020
7. OTHER INFORMATIONThe Group has chosen to voluntarily disclose certain disaggregated income statement information about its operations as set out in the table below. This information is not intended to meet the requirements of IFRS 8 Operating Segments.
Adjusted EBITDA is the measure reported to the Group’s Executive Directors and Board.
The reconciliations to the respective statutory items included in the Group income statement are as follows:
2020 2019 restated
$m USA(1) Europe(2) Australia(1)Group Total USA(1),(3) Europe(4) Australia(1),(5)
GroupTotal
Revenue
Grocery & Merchandise 2,856 1,270 291 4,417 1,880 1,128 210 3,218
Foodservice 37 429 — 466 61 349 — 410
Fuel 4,292 9,716 2,070 16,078 3,906 13,048 2,285 19,239
Other 101 398 3 502 76 392 2 470
Total revenue 7,286 11,813 2,364 21,463 5,923 14,917 2,497 23,337
Gross profit 1,736 1,473 398 3,607 1,008 1,347 283 2,638
Adjusted EBITDA 634 590 219 1,443 334 558 125 1,017
Operating exceptional costs(6) (28) (184)
Right of use asset depreciation (151) (126)
Depreciation (414) (342)
Amortisation (89) (84)
Impairment(7) (65) —
Profit on disposal — 173
Finance income 7 8
Finance costs (870) (555)
Loss before tax (167) (93)
Tax (charge)/credit (65) (51)
Loss after tax (232) (144)(1) USA and Australia were previously presented as ‘North America’ and ‘Rest of World’ respectively, and have been renamed to reflect the countries the
business operates in
(2) The results of the UK & Ireland Foodservice acquisitions from The Herbert Group are included within the Europe results from the acquisition date of March 10, 2020
(3) The USA comparatives incorporate the results of the Fastrac, Certified Oil and Cumberland Farms businesses from their acquisition dates of July 1, 2019, August 1, 2019 and October 22, 2019 respectively
(4) The financial information for the year ended December 31, 2019 reflects adjustments made to previously reported figures for revenue and cost of sales as explained in note 1
(5) The Australia comparatives incorporate the results of EG Australia from its acquisition date of April 1, 2019(6) Exceptional items presented reflect those impacting EBITDA, and therefore exclude exceptional finance costs and tax on exceptionals(7) Excludes the impairment reversal of $40m recognised in the year relates to the reversal of a previously recognised exceptional impairment charge

STRATEGIC REPORT GOVERNANCE FINANCIALS
111EG Group | 2020 Annual Report and Financial Statements
8. DISPOSAL GROUPS AND NON-CURRENT ASSETS CLASSIFIED AS HELD FOR SALECumberland FarmsAt December 31, 2020, $14m (2019: $13m) of real estate assets are presented as held for sale. This reflects six sites in the United States for which a signed agreement to sell was in place at both year ends. The sales were completed in Q1 2021.
European proprietary cards businessIn October 2018, the Group committed to a plan to sell its European proprietary fuel cards business. In accordance with IFRS 5 Non-current Assets Held for Sale and Discontinued Operations, the assets and liabilities of the proprietary cards business were classified as a disposal group held for sale on the Group balance sheet at December 31, 2018. No impairment loss was recognised, as at the year end it was expected that the fair value less costs to sell was in excess of the carrying value of the assets and liabilities.
On July 1, 2019 the Group completed the sale of its European proprietary fuel cards business for proceeds of $263m, generating a profit on disposal of $173m, which has been presented in the income statement as exceptional within profit on disposal in the period.
9. LOSS BEFORE TAX FOR THE YEAR Loss before tax for the year has been arrived at after (crediting)/charging:
2020$m
2019$m
Net foreign exchange (gains)/losses 201 (35)
Acquisition-related transaction costs (net) 38 48
Depreciation of property, plant and equipment 414 342
Depreciation of right of use assets 151 126
Impairment of property, plant and equipment 47 61
Impairment of right of use assets (22) 39
Loss on disposal of property, plant and equipment 2 2
Amortisation of intangible assets 89 84
Profit on disposal of business — (173)
Recognition of 2019 net expenses in 2020(1) 33 —
Impairment of goodwill 12 17
Cost of inventories recognised as an expense 16,975 19,236
Staff costs (see note 11) 1,249 886(1) $29m relates to Adjusted EBITDA as defined on page 165
10. AUDITOR’S REMUNERATIONThe analysis of the auditor’s remuneration is as follows:
2020$m
2019$m
Fees payable to the Company’s auditor and their associates for the audit of the Company financial statements 0.1 0.1
Fees payable to the Company’s auditor and their associates for other services to the Group:
– The audit of the financial statements of the Company’s subsidiaries 22.3 5.8
Fees payable to other auditors for other services to the Group:
– The audit of the financial statements of the Company’s subsidiaries 0.8 0.1
Total audit fees 23.2 6.0
2020$m
2019$m
Audit-related assurance services — 0.1
Other assurance services — 1.2
Other taxation advisory services — 0.1
Other services — —
Total non-audit fees — 1.4
2020 fees were payable to KPMG LLP and 2019 fees were payable to Deloitte LLP.

112 EG Group | 2020 Annual Report and Financial Statements
NOTES TO THE CONSOLIDATED FINANCIAL STATEMENTS CONTINUEDFor the year ended December 31, 2020
11. STAFF COSTSThe average number of employees (including Executive Directors) was:
2020Number
2019Number
Sales 43,131 37,330
Administration 1,640 2,577
44,771 39,907
Their aggregate remuneration comprised:2020
$m2019
$m
Wages and salaries 1,100 782
Social security costs 113 84
Other pension costs (see note 32) 36 20
1,249 886
The highest paid Director information is included within note 37.
12. FINANCE INCOME2020
$m2019
$m
Fair value gains on derivatives not designated in a fair hedge accounting relationship 1 2
Other foreign exchange gains 4 2
Interest receivable 2 4
7 8
13. FINANCE COSTS2020
$m2019
$m
Interest on bank overdrafts and loans (551) (469)
Total interest expense (551) (469)
Debt extinguishment loss (see note 5) — (15)
Other finance charges (20) (13)
Unwinding of discount on provisions (15) (1)
Finance charges on leases (81) (59)
Foreign exchange gain/(losses) on financing activities (203) 2
(870) (555)
Debt extinguishment losses in 2019 of $15m were recognised in the income statement on completion of the issue of Secured Loan Notes in May 2019. This item was presented as exceptional costs (see note 5). The total finance cost for financial liabilities measured at amortised cost is $551m (2019: $469m).

STRATEGIC REPORT GOVERNANCE FINANCIALS
113EG Group | 2020 Annual Report and Financial Statements
14. TAXThe charge/(credit) for the year is as follows:
2020$m
2019$m
Corporation tax:
Current year (50) (45)
Adjustments in respect of prior period 2 (7)
(48) (52)
Deferred tax:
Origination and reversal of temporary differences (42) (8)
Adjustments in respect of prior period 38 20
Effect of changes in tax rates (13) (11)
Total tax (charge)/credit (65) (51)
2020$m
2019$m
Loss before tax (167) (93)
Tax (charge)/credit at the UK corporation tax rate of 19% (2019: 19%) 32 18
Tax effect of non-deductible expenses (11) (3)
Tax effect of non-deductible expenses on exceptional items (6) (39)
Effect of interest restriction (94) (28)
Effect of differences in overseas tax rates (8) 3
Effect of changes in tax rates (13) (11)
Adjustments in respect of prior years 40 14
Movement in deferred tax not recognised (17) 2
Other 12 (7)
Tax (charge)/credit for the year (65) (51)
The current tax rate used for the year is 19%, based on rates already enacted in previous periods.
For the United Kingdom operations, the Finance Act 2020 included legislation to maintain the main rate of UK corporation tax at 19%, rather than reducing it to 17% from April 1, 2020. The change to the main rate of corporation tax was substantively enacted by the balance sheet date and therefore included in these financial statements. Deferred tax has been calculated using these rates based on the timing of when each individual deferred tax balance is expected to reverse in the future. The UK Budget announcement on March 3, 2021 included an increase to the UK’s main corporation tax rate to 25%, which is due to be effective from April 1, 2023. These changes were not substantively enacted at the balance sheet date and hence have not been reflected in the measurement of deferred tax balances. The amended tax rate would cause a 30% increase in the UK deferred tax liability.
For the Netherlands, on December 15, 2020 the Dutch Senate accepted the Dutch Tax Plan 2020. This means that the measures as included in the Dutch Tax Plan 2021 are considered to be substantively enacted under IFRS. Included in the Dutch Tax Plan was the removal of previously enacted provisions to reduce the corporate income tax rate to 21.7% such that the rate will now remain at 25%. These rate reductions were substantively enacted by the balance sheet date and therefore included in these consolidated financial statements.
For Belgium, on July 26, 2017 the Belgian Federal government reached an agreement on an important corporate tax reform to gradually reduce the corporate income tax rate. The standard rate has been reduced in steps from 29% to 25% in 2020. These rate reductions were substantively enacted by the balance sheet date and therefore included in these consolidated financial statements.
On September 27, 2017 the French government released the French finance bill for 2018 in which they announced a gradual reduction in the headline rate of corporate income tax from 31%, to 28% in 2020, 26.5% in 2021 and finally 25% in 2022. The 3.3% social surcharge will continue to apply, bringing the 25% standard rate in 2022 to an effective rate of 25.8%. These rate reductions were substantively enacted by the balance sheet date and therefore included in these consolidated financial statements.
Deferred tax has been calculated using these rates based on the timing of when each individual deferred tax balance is expected to reverse in the future.
The effect of interest restriction represents the impact of the UK Corporate Interest Restriction rules (effective from April 1, 2017), the Dutch ATAD 1 interest restriction rules (effective from January 1, 2019), and the USA s163j interest limitation rules (effective from January 1, 2018), which restrict the amount of interest that can be deducted for tax purposes with reference to a proportion of the profits of an entity or group.
No material amounts relating to tax have been recognised in other comprehensive income during the year (2019: no material amounts).

114 EG Group | 2020 Annual Report and Financial Statements
NOTES TO THE CONSOLIDATED FINANCIAL STATEMENTS CONTINUEDFor the year ended December 31, 2020
15. GOODWILL$m
Cost
At January 1, 2019 3,000
Recognised on acquisition of subsidiaries 2,327
Transfer from disposal group no longer classified as held for sale 159
Disposals (67)
Adjustments (17)
Exchange differences 1
At December 31, 2019 5,403
Recognised on acquisition of subsidiaries 142
Impairment of goodwill (12)
Exchange differences 194
At December 31, 2020 5,727
Carrying amount
At December 31, 2020 5,727
At December 31, 2019 5,403
Goodwill deductible for tax purposes amounts to $518m (2019: $485m).
Goodwill acquired in a business combination is allocated, at acquisition, to the groups of cash-generating units (“CGUs”) that are expected to benefit from that business combination according to the level at which management monitor that goodwill.
The Group has determined that for the purposes of goodwill impairment testing, each country is a group of cash-generating units and represents the lowest level within the entity at which the goodwill is monitored for internal management purposes, with the exception of Benelux, where this is the lowest level at which results and forecasts are prepared for the combined Belgium, Netherlands and Luxembourg operations. Groups of cash-generating units are tested for impairment annually at the balance sheet date.
The Group’s CGUs for goodwill impairment testing purposes have been allocated to the individual countries. The carrying amounts of goodwill have been allocated as follows:
2020$m
2019$m
UK 178 51
France 461 440
Italy 39 39
Germany 479 446
USA 2,900 2,872
Benelux 649 625
Australia 1,021 930
5,727 5,403
Goodwill of $142m arose on acquisitions that completed in 2020, comprising $118m on the acquisition of the Scotco Group in the UK & Ireland and from the Herbert Group in the UK, $22m on the acquisition of Schrader Oil in the USA, and $2m on additions in Benelux.
As part of finalising the purchase price accounting of acquisitions made in Europe, adjustments were identified. These adjustments resulted in a reduction in the goodwill balance and an increase in the pre-acquisition reserves totalling $12m. These adjustments were identified outside of the measurement period and therefore could not be adjusted through the opening balance sheet as measurement period adjustments. Since the adjustments are not material, the 2020 financial statements reflect an adjustment to decrease goodwill by $12m.
Included in the carrying amounts presented above are a foreign exchange gain of $9m on the Sterling-denominated goodwill, a foreign exchange gain of $93m on the Euro-denominated goodwill, and a foreign exchange gain of $92m on the Australian goodwill, which have been recognised on translation to US Dollars at the year-end closing rate.
Acquisitions made during 2019 generated goodwill of $2,327m. This comprised of additions of Fuelco in Australia of $953m, additions in the USA (for the Fastrac, Certified Oil and Cumberland Farms businesses, and the East Earl site) totalling $1,370m, additions in the UK for the Urban Origin Business of $1m, and $3m in Belgium for the Paul Mahieu business.
During 2019, the proprietary cards operations (‘EG Business’) was sold, resulting in the disposal of $67m of goodwill allocated from the Benelux CGU measured on the basis of the relative values of the operation disposed of and the portion of the Benelux CGU retained.

STRATEGIC REPORT GOVERNANCE FINANCIALS
115EG Group | 2020 Annual Report and Financial Statements
As part of finalising the purchase price accounting of Kroger c-stores, previously acquired on April 20, 2018, an adjustment was identified. This adjustment is a reduction in the goodwill balance and an increase in the pre-acquisition reserves totalling $17m. This adjustment was identified outside of the measurement period and therefore cannot be adjusted through the opening balance sheet as a measurement period adjustment. Since the adjustment is not material, the current year financial statements reflect an adjustment to decrease goodwill by $17m. This has also been included as an exceptional item within note 5.
For the year ended December 31, 2020 impairment reviews were performed by comparing the carrying value of the cash-generating units with their recoverable amount. The recoverable amounts for cash-generating units have been determined based on their fair value less costs to sell. Management determined that due to the potential for increased use of alternative fuel vehicles in the long term, it was more appropriate to use fair value to assess impairment because accounting standards do not permit in a value-in-use calculation in the inclusion of earnings generated from future expansionary capital expenditure on the Group’s existing multi-use retail sites.
To determine these values, the Group used an approach based on forecast earnings before interest, taxes, depreciation and amortisation (“EBITDA”, which is a non-IFRS measure) and EBITDA valuation multiples of comparable corporations and market transactions ranging from 6.9 times to 15 times.
The assessment of the Board determined that the recoverable amount of all of the CGUs of the Group exceeded their carrying value with no impairment required.
The key assumptions in determining fair value relate to forecast EBITDA and the EBITDA valuation multiples used. For the USA, UK, France, Germany and Italy groups of CGUs, no reasonably possible change in the key valuation assumptions would lead to an impairment.
For the Australia and Benelux groups of CGUs, management reviewed the market multiples of comparable corporations and market transactions, which ranged from 6.9 to 11.0 times for Australia and 8.0 to 11.0 times for Benelux. An EBITDA multiple at the lower end of the range, being less than 8.6 times for Benelux and 8.6 times for Australia may lead to an impairment of the carrying value of the CGU. Forecast EBITDA has been determined taking into account past experience and includes our expectations of post-pandemic performance of the business, and assumes a return of trading performance and profitability relating to sales volumes and margins over time to pre-pandemic levels. Due to the interrelated nature of the trading performance and profitability assumptions, forecast EBITDA sensitivities are provided, where an overall reduction in forecast EBITDA of 10% in Benelux and 4% in Australia may lead to an impairment of the carrying value of the CGU.
16. OTHER INTANGIBLE ASSETS
Note
Customer/dealer
relationships$m
Tradenames
$m
Otherintangible
assets $m
Total$m
Cost
At December 31, 2019 527 611 78 1,216
Additions 1 1 20 22
Additions from acquisition of subsidiaries 34 — — 5 5
Transfers — — 2 2
Disposals — — (18) (18)
Exchange differences 47 2 7 56
At December 31, 2020 575 614 94 1,283
Accumulated amortisation and impairment
At December 31, 2019 (81) (28) (35) (144)
Charge for the year (51) (22) (16) (89)
Transfers — — (2) (2)
Eliminated on disposals — — 18 18
Exchange differences (17) (2) (4) (23)
At December 31, 2020 (149) (52) (39) (240)
Carrying amount
At December 31, 2020 426 562 55 1,043
At December 31, 2019 446 583 43 1,072

116 EG Group | 2020 Annual Report and Financial Statements
NOTES TO THE CONSOLIDATED FINANCIAL STATEMENTS CONTINUEDFor the year ended December 31, 2020
16. OTHER INTANGIBLE ASSETS CONTINUED
Note
Concessionrights
$m
Customer/dealer
relationships$m
Tradenames
$m
Otherintangible
assets$m
Total$m
Cost
At December 31, 2018 116 266 251 87 720
Reclassification to right of use assets 24 (116) — — (30) (146)
At January 1, 2019 — 266 251 57 574
Additions — — — 7 7
Additions from acquisition of subsidiaries 34 — 276 364 12 652
Disposals — (41) — — (41)
Exchange differences — (8) (4) 2 (10)
Transfer from disposal group classified as held for sale 8 — 34 — — 34
At December 31, 2019 — 527 611 78 1,216
Accumulated amortisation and impairment
At December 31, 2018 (14) (44) (9) (24) (91)
Reclassification to right of use assets 24 14 — — 1 15
At January 1, 2019 — (44) (9) (23) (76)
Charge for the year — (52) (19) (13) (84)
Eliminated on disposals — 19 — — 19
Exchange differences — 3 — 1 4
Transfer from disposal group classified as held for sale 8 — (7) — — (7)
At December 31, 2019 — (81) (28) (35) (144)
Carrying amount
At December 31, 2019 — 446 583 43 1,072
At December 31, 2018 102 222 242 63 629
Of the total amortisation expense for the year ended December 31, 2020 of $89m (2019: $83m), $57m (2019: $61m) has been charged to administrative expenses and $32m (2019: $22m) to distribution costs.
The trade name additions of $364m in 2019 reflect the fair value attributed to trade names acquired in the USA as part of the Fastrac ($2m), Certified Oil ($2m) and Cumberland Farms ($333m) acquisitions, and in Australia ($27m) from the Fuelco acquisition.
The remaining useful life of the following trade names at December 31, 2020 is 17 years and the carrying amounts are as follows: ‘Turkey Hill’ $86m, ‘Kwik Shop’ $26m, ‘Tom Thumb’ $27m, ‘Loaf ‘n’ Jug’ $46m and ‘Quik Stop’ $24m. The ‘Minit Mart’ trade name had a carrying value of $4m at December 31, 2020 with a remaining useful life of 18 years. The ‘Woolworths’ trade name (acquired on April 1, 2019) had a carrying value of $8m and a remaining useful life of two years. The remaining useful life of the following trade names as at December 31, 2020 is four years and the carrying amounts are as follows: ‘Fastrac’ $2m and ‘Certified Oil’ $2m.
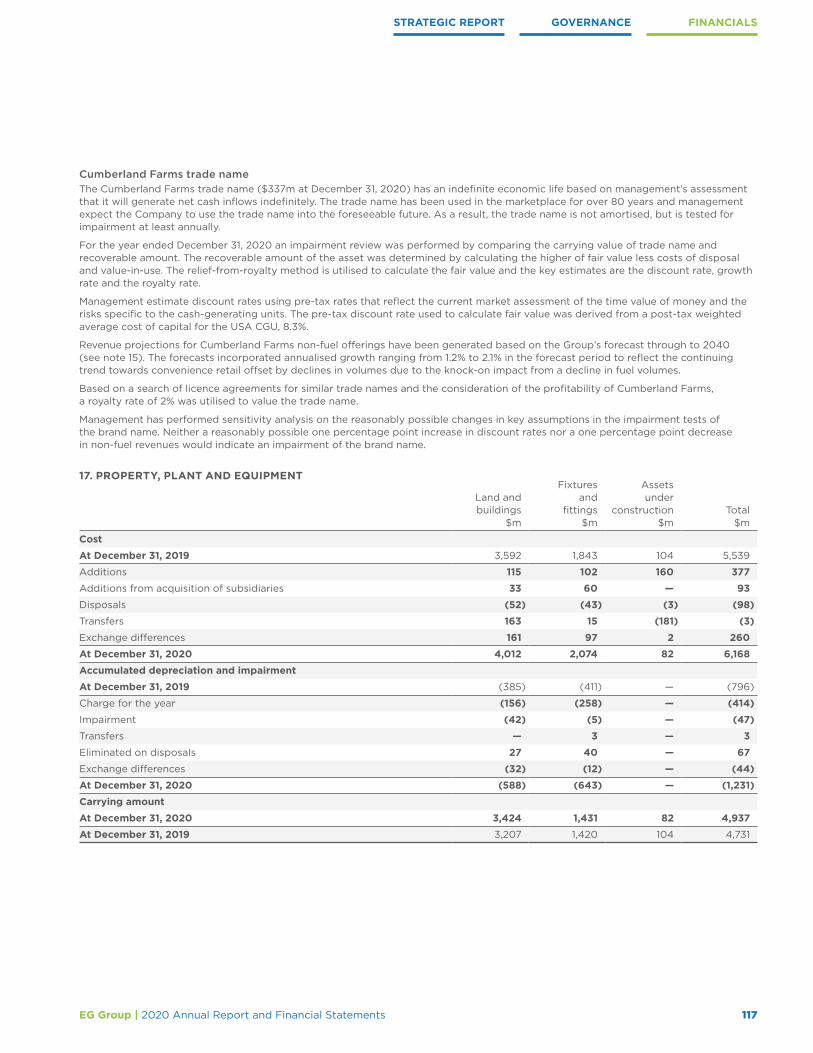
STRATEGIC REPORT GOVERNANCE FINANCIALS
117EG Group | 2020 Annual Report and Financial Statements
Cumberland Farms trade nameThe Cumberland Farms trade name ($337m at December 31, 2020) has an indefinite economic life based on management’s assessment that it will generate net cash inflows indefinitely. The trade name has been used in the marketplace for over 80 years and management expect the Company to use the trade name into the foreseeable future. As a result, the trade name is not amortised, but is tested for impairment at least annually.
For the year ended December 31, 2020 an impairment review was performed by comparing the carrying value of trade name and recoverable amount. The recoverable amount of the asset was determined by calculating the higher of fair value less costs of disposal and value-in-use. The relief-from-royalty method is utilised to calculate the fair value and the key estimates are the discount rate, growth rate and the royalty rate.
Management estimate discount rates using pre-tax rates that reflect the current market assessment of the time value of money and the risks specific to the cash-generating units. The pre-tax discount rate used to calculate fair value was derived from a post-tax weighted average cost of capital for the USA CGU, 8.3%.
Revenue projections for Cumberland Farms non-fuel offerings have been generated based on the Group’s forecast through to 2040 (see note 15). The forecasts incorporated annualised growth ranging from 1.2% to 2.1% in the forecast period to reflect the continuing trend towards convenience retail offset by declines in volumes due to the knock-on impact from a decline in fuel volumes.
Based on a search of licence agreements for similar trade names and the consideration of the profitability of Cumberland Farms, a royalty rate of 2% was utilised to value the trade name.
Management has performed sensitivity analysis on the reasonably possible changes in key assumptions in the impairment tests of the brand name. Neither a reasonably possible one percentage point increase in discount rates nor a one percentage point decrease in non-fuel revenues would indicate an impairment of the brand name.
17. PROPERTY, PLANT AND EQUIPMENT
Land andbuildings
$m
Fixturesand
fittings$m
Assetsunder
construction$m
Total$m
Cost
At December 31, 2019 3,592 1,843 104 5,539
Additions 115 102 160 377
Additions from acquisition of subsidiaries 33 60 — 93
Disposals (52) (43) (3) (98)
Transfers 163 15 (181) (3)
Exchange differences 161 97 2 260
At December 31, 2020 4,012 2,074 82 6,168
Accumulated depreciation and impairment
At December 31, 2019 (385) (411) — (796)
Charge for the year (156) (258) — (414)
Impairment (42) (5) — (47)
Transfers — 3 — 3
Eliminated on disposals 27 40 — 67
Exchange differences (32) (12) — (44)
At December 31, 2020 (588) (643) — (1,231)
Carrying amount
At December 31, 2020 3,424 1,431 82 4,937
At December 31, 2019 3,207 1,420 104 4,731
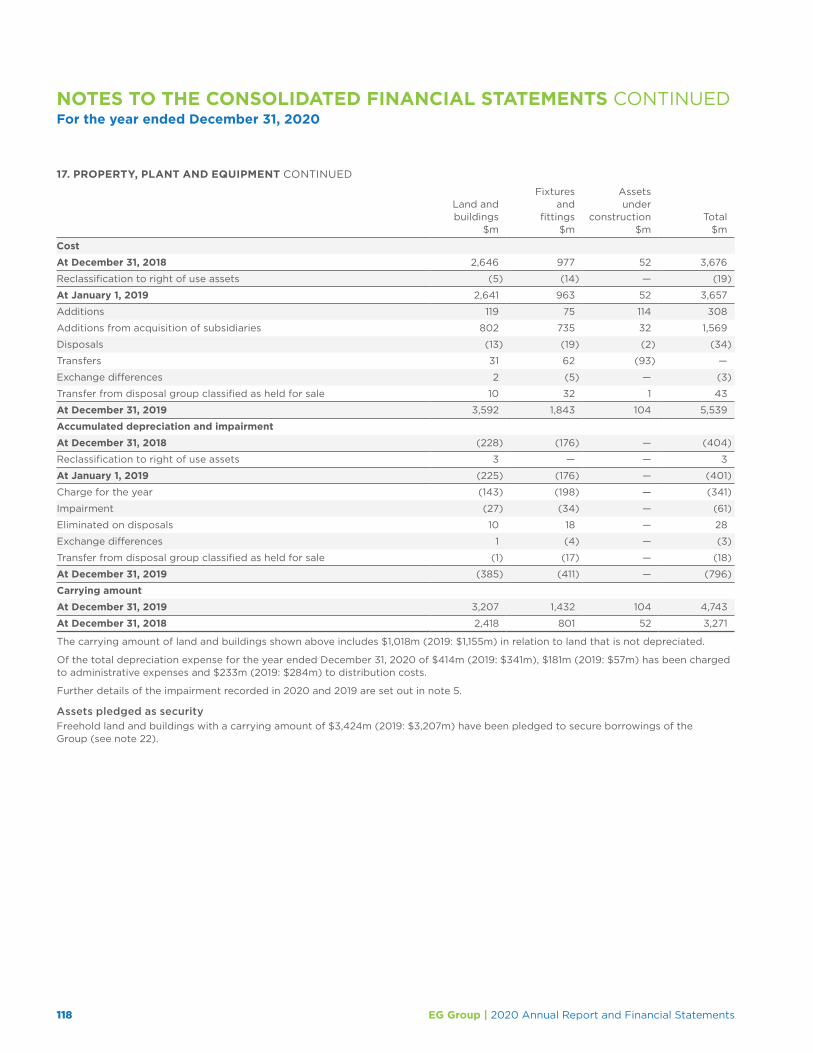
118 EG Group | 2020 Annual Report and Financial Statements
NOTES TO THE CONSOLIDATED FINANCIAL STATEMENTS CONTINUEDFor the year ended December 31, 2020
17. PROPERTY, PLANT AND EQUIPMENT CONTINUED
Land andbuildings
$m
Fixturesand
fittings$m
Assetsunder
construction$m
Total$m
Cost
At December 31, 2018 2,646 977 52 3,676
Reclassification to right of use assets (5) (14) — (19)
At January 1, 2019 2,641 963 52 3,657
Additions 119 75 114 308
Additions from acquisition of subsidiaries 802 735 32 1,569
Disposals (13) (19) (2) (34)
Transfers 31 62 (93) —
Exchange differences 2 (5) — (3)
Transfer from disposal group classified as held for sale 10 32 1 43
At December 31, 2019 3,592 1,843 104 5,539
Accumulated depreciation and impairment
At December 31, 2018 (228) (176) — (404)
Reclassification to right of use assets 3 — — 3
At January 1, 2019 (225) (176) — (401)
Charge for the year (143) (198) — (341)
Impairment (27) (34) — (61)
Eliminated on disposals 10 18 — 28
Exchange differences 1 (4) — (3)
Transfer from disposal group classified as held for sale (1) (17) — (18)
At December 31, 2019 (385) (411) — (796)
Carrying amount
At December 31, 2019 3,207 1,432 104 4,743
At December 31, 2018 2,418 801 52 3,271
The carrying amount of land and buildings shown above includes $1,018m (2019: $1,155m) in relation to land that is not depreciated.
Of the total depreciation expense for the year ended December 31, 2020 of $414m (2019: $341m), $181m (2019: $57m) has been charged to administrative expenses and $233m (2019: $284m) to distribution costs.
Further details of the impairment recorded in 2020 and 2019 are set out in note 5.
Assets pledged as securityFreehold land and buildings with a carrying amount of $3,424m (2019: $3,207m) have been pledged to secure borrowings of the Group (see note 22).

STRATEGIC REPORT GOVERNANCE FINANCIALS
119EG Group | 2020 Annual Report and Financial Statements
18. SUBSIDIARIESThe Group consists of a parent Company, EG Group Limited, incorporated in the UK, and a number of subsidiaries held directly and indirectly by EG Group Limited, which operate and are registered in either the UK, Jersey, Continental Europe, USA or Australia. All undertakings are indirectly owned by EG Group Limited unless otherwise stated. A full list of the Group’s related undertakings, registered office addresses and the percentage of share class owned as at December 31, 2020 are disclosed below:
Subsidiary undertakings incorporated and operating in the United Kingdom
Name of undertaking Principal activity
Principalplace ofbusiness
Proportionof ordinary shares and
voting power held
%
EG Finco Limited(1),(2) Holding company UK 100
Euro Garages Limited(1) Trading of fuel/other products UK 100
EG (Shared Services) Limited(1) Dormant UK 100
Wolfson Trago Limited(1) Restaurant operator UK 100
Wycliffe Moore Limited(1) Restaurant operator UK 100
EG AsiaPac Ltd(1),(2) Holding company UK 100
EG Global Finance Plc(1) Holding company UK 100
Urban Origin Limited(1) Holding company UK 100
GB3 Limited(1) IT consultancy UK 100
Scotco Central Ltd(1) Holding company UK 100
Scotco Midlands Ltd(1) Restaurant operator UK 100
Scotco NI Ltd(1) Restaurant operator UK 100
Scotco One Four Five Ltd(1) Restaurant operator UK 100
Scotco Trowbridge Ltd(1) Restaurant operator UK 100
JRC Holdings Ltd(1) Holding company UK 100
Kram Management Ltd(1) Holding company UK 100
Kram Restaurants Limited(1) Restaurant operator UK 100
Scotco Restaurants Limited(1) Restaurant operator UK 100
Scotco Restaurants Southern Limited(1) Restaurant operator UK 100
Scotco (Northern) Ltd(1) Restaurant operator UK 100
Scotco One Five Five Limited(1) Restaurant operator UK 100
Herbel (Western) Ltd(3) Restaurant operator UK 100
Herbel (Northern) Ltd(3) Restaurant operator UK 100(1) Registered address: Waterside Head Office, Haslingden Road, Guide, Blackburn, Lancashire, United Kingdom, BB1 2FA(2) Interest held by EG Group Limited(3) Registered address: Lindsay’s Caledonian Exchange, 19a Canning Street, Edinburgh, Scotland, EH3 8HE

120 EG Group | 2020 Annual Report and Financial Statements
NOTES TO THE CONSOLIDATED FINANCIAL STATEMENTS CONTINUEDFor the year ended December 31, 2020
18. SUBSIDIARIES CONTINUEDInternational subsidiary undertakings
Subsidiaries Principal activity
Place ofincorporation/
registrationand operation
Proportion of ordinary shares and
voting power held
%
Euro Garages Jersey Limited(1) Holding company Jersey 100
Scotco Restaurants (Jersey) Ltd(1) Restaurant operator Jersey 100
EG Dutch Finco B.V.(2) Holding company Netherlands 100
EG Holdings B.V.(2) Holding company Netherlands 100
EG Europe B.V.(2) Holding company Netherlands 100
EG Retail B.V.(2) Holding company Netherlands 100
EG (Benelux) B.V.(2) Holding company Netherlands 100
EG Retail (Netherlands) B.V.(2) Trading of fuel/other products Netherlands 100
EG Services (Netherlands) B.V.(2) Operator of service stations Netherlands 100
NRGValue Branding Nederland B.V.(2) Trading of fuel/other products Netherlands 100
NRGValue Retail Nederland B.V.(2) Trading of fuel/other products Netherlands 100
NRGValue Tankstations Nederland B.V.(2) Trading of fuel/other products Netherlands 100
EG Fuels (Kampen Terminal)(3) Fuels depot operations Netherlands 100
EG Fuels (Logistics) B.V.(3) Fuels transportation Netherlands 100
EG (France) B.V.(2) Holding company Netherlands 100
AJJ Hermes B.V.(2) Real estate development Netherlands 100
EG (Germany) B.V.(2) Holding company Netherlands 100
EG Food Services (Netherlands) BV(2) Restaurant operator Netherlands 100
EG (Italy) B.V.(2) Holding company Netherlands 100
The Tasty Company BV(4) Restaurant operator Netherlands 100
The Spicy Company BV(5) Restaurant operator Netherlands 100
Paul Mahieu NV(6) Trading of fuel/other products Netherlands 99
EG Retail (Belgium) B.V.B.A.(6) Trading of fuel/other products Belgium 100
Station Services B.V.B.A.(6) Dormant Belgium 100
EG Retail (Station Support) B.V.B.A.(6) Employer of service station colleagues Belgium 100
Stars Loyalty Belgium C.V.B.A.(6) Loyalty card business Belgium 100
EG Services (Belgium) B.V.B.A.(6) Employer of service station colleagues Belgium 100
EG Services (Belgium Property) B.V.B.A.(6) Real estate development Belgium 100
Raga NV(6) Real estate development Belgium 100
EG Retail (Luxembourg) S.à.r.l.(7) Trading of fuel/other products Luxembourg 100
EG Services (Luxembourg) S.à.r.l.(7) Trading of fuel/other products Luxembourg 100
EG (Luxembourg) Holdings S.à.r.l.(7) Holding company Luxembourg 100
EG Business GmbH(8) Trading of fuel/other products Germany 100
EG Deutschland GmbH(9) Holding company Germany 100
Echo Tankstellen GmbH(9) Trading of fuel/other products Germany 100
Retail Operating Company GmbH(9) Trading of fuel/other products Germany 100
EG Deutschland Food Services GmbH(9) Trading of fuel/other products Germany 100
EG Deutschland K-Holding GmbH(9) Holding company Germany 100
EG Retail (Food Services France) SAS(10) Trading of fuel/other products France 100
EG Holdings (France) SAS(10) Holding company France 100
EG Retail (France) SAS(10) Trading of fuel/other products France 100
EG Services (France) SNC(10) Operator of service stations France 100
EG Italia S.p.A(11) Trading of fuel/other products Italy 100

STRATEGIC REPORT GOVERNANCE FINANCIALS
121EG Group | 2020 Annual Report and Financial Statements
Subsidiaries Principal activity
Place ofincorporation/
registrationand operation
Proportion of ordinary shares and
voting power held
%
EGI-2 GO S.R.L(11) Trading of fuel/other products Italy 100
EG America, LLC(12),(13) Holding company USA 100
EG Retail (America), LLC(12) Holding company USA 100
EG Shared Services (America), LLC(12) Holding company USA 100
EG America Treasury Co, LLC(12) Holding company USA 100
TH Midwest, Inc(12) Trading of fuel/other products USA 100
Junior Food Stores of West Florida Inc.(12) Trading of fuel/other products USA 100
Kwik Shop, Inc.(12) Trading of fuel/other products USA 100
Mini Mart, Inc.(12) Trading of fuel/other products USA 100
Quik Stop Markets, Inc(12) Trading of fuel/other products USA 100
Minit Mart, LLC(12) Trading of fuel/other products USA 100
TH Minit Markets LLC(12) Trading of fuel/other products USA 100
Fastrac EG, LLC(12) Trading of fuel/other products USA 100
Certified Oil Company, Inc(12) Holding company USA 100
Certified Oil Corporation(12) Trading of fuel/other products USA 100
EG America Treasury Co, LLC(12) Holding company USA 100
Fastrac Transportation EG LLC(12) Trading of fuel/other products USA 100
PLK-Rest LLC(12) Trading of fuel/other products USA 100
INS-Rest LLC(12) Trading of fuel/other products USA 100
PH-Rest LLC(12) Trading of fuel/other products USA 100
TJ Rest LLC(12) Trading of fuel/other products USA 100
Spizza-Rest LLC(12) Trading of fuel/other products USA 100
Crave-Rest LLC(12) Trading of fuel/other products USA 100
B Rest LLC(12) Trading of fuel/other products USA 100
Serve-Rest, LLC(12) Trading of fuel/other products USA 100
Tmex-Rest, LLC(12) Trading of fuel/other products USA 100
CFI Propco 1, LLC(12) Trading of fuel/other products USA 100
CFI Propco 2, LLC(12) Trading of fuel/other products USA 100
Cumberland Farms, Inc(12) Trading of fuel/other products USA 100
CFI GC LLC(12) Holding company USA 100
Cumberland Farms Vermont, Inc(12) Holding company USA 100
Cumberland Farms Massachusetts, Inc(12) Holding company USA 100
Conven-Petro Insurance Company(12) Holding company USA 100
EG Group Australia Pty Ltd(14) Holding company Australia 100
EG (Retail) Australia Pty Ltd(14) Trading of fuel/other products Australia 100
EG (FuelCo) Australia Pty Ltd(14) Trading of fuel/other products Australia 100
EG AsiaPac Holdings Pty Ltd(14) Holding company Australia 100
EG AsiaPac Services Pty Ltd(14) Services entity Australia 100
EG AsiaPac Ventures Pty Ltd(14) Holding company Australia 100
EG AsiaPac Ventures No. 1 Pty Ltd(14) Trading of fuel/other products Australia 100
Scotco ROI Limited(15) Restaurant operator ROI 100

122 EG Group | 2020 Annual Report and Financial Statements
NOTES TO THE CONSOLIDATED FINANCIAL STATEMENTS CONTINUEDFor the year ended December 31, 2020
18. SUBSIDIARIES CONTINUEDInternational subsidiary undertakings continued(1) Registered address: 47 Esplanade, St Helier, Jersey JE1 0BD (2) Registered address: Princenhagelaan 9, 4813 DA, Breda, The Netherlands(3) Registered address: Genuakade 4, 8263 CG, Kampen, The Netherlands(4) Registered address: Jadestraat 11, 2665 NS, Bleiswijk, The Netherlands(5) Registered address: Harderwijkweg 1, 2803 PW, Gouda(6) Registered address: Kapelsesteenweg 71, 2180 Ekeren, Belgium(7) Registered address: Bei der Härewiss 103, 1141 Luxembourg(8) Registered address: Bentheimer Straße 120, 48529, Nordhorn, Germany(9) Registered address: Ludwig-Erhard-Straße 22, Hamburg, Germany(10) Registered address: Immeuble Le Cervier B, 12, avenue des Béguines, Cergy Saint Christophe, 95800 Cergy Pontoise, France(11) Registered address: Via Giovanni Marradi 4, Livorno, Livorno, 57126 Italy(12) Registered address: 165 Flanders Rd, Westborough, MA 01581, USA(13) Interest held by EG Group Limited(14) Registered address: Unit 3, Ivory, 25-31, Darley Street East, Mona Vale, NSW, 2103, Australia(15) Registered address: Unit 1, Gregg Court, Parnell Street, Dublin 1, 662880, Republic of Ireland
19. JOINT VENTURES Details of joint venturesDetails of each of the Group’s joint ventures at the end of the reporting year are as follows:
Name Principal activity
Place ofincorporationand principalplace of business
Proportion of ownership interest/voting rights
held by the Group
2020 2019
Joint ventures
Petroleum Products Storage & Transport Company S.A./N.V.(1) Owns and manages fuel depots Belgium 50% 50%
De Pooter Olie B.V.(2) Owns and operates fuel forecourts Netherlands 50% 50%
De Pooter Olie B.V.B.A(3) Owns and operates fuel forecourts Belgium 50% 50%
Dépôt Pétrolier de Lyon S.A.S.(4) Owns and manages fuel depots France 50% 50%(1) Registered address: Avenue de l’Independence 93, 4020 Luik (Wandre), Belgium(2) Registered address: Polenweg 16, 4538AP Terneuzen, The Netherlands(3) Registered address: Gebroeders Naudstlaan 14, 9185, Wachtebeke, Belgium(4) Registered address: 1, Rue d’Arles, Port Hérriot, 69.007 Lyon, France
All of the above investments are accounted for using the equity method in these consolidated financial statements as set out in the Group’s accounting policies in note 3. Summarised financial information in respect of each of the Group’s material joint ventures is set out opposite. The summarised financial information below represents amounts in joint ventures’ financial statements prepared in accordance with IFRS adjusted by the Group for equity accounting purposes.

STRATEGIC REPORT GOVERNANCE FINANCIALS
123EG Group | 2020 Annual Report and Financial Statements
2020
Petroleum Products
Storage & Transport Company S.A./N.V.
$m
De Pooter Olie B.V.
$m
Dépôt Pétrolier de Lyon
S.A.S.$m
Total$m
Summarised balance sheet
Current assets 1 7 8 16
Non-current assets 5 4 7 16
Current liabilities (1) (3) (1) (5)
Non-current liabilities (2) (1) — (3)
Net assets 3 7 14 24
Summarised income statement
Revenue 3 57 5 65
Profit after tax for the year — 1 — 1
Reconciliation of the above summarised financial information to the carrying amount of the interest in the joint ventures recognised in the consolidated financial statements:
2020
Petroleum Products
Storage & Transport Company S.A./N.V.
$m
De Pooter Olie B.V.
$m
Dépôt Pétrolier de Lyon
S.A.S.$m
Total$m
Group’s share in ownership 50% 50% 50%
Group’s share of net assets/liabilities 1 4 7 12
Other adjustments — (1) (3) (4)
Carrying amount of the Group’s interest in the joint venture 1 3 4 8
2019
Petroleum Products
Storage & Transport Company S.A./N.V.
$m
De Pooter Olie B.V.
$m
Dépôt Pétrolier de Lyon
S.A.S.$m
Total$m
Summarised balance sheet
Current assets 1 7 6 14
Non-current assets 4 4 8 16
Current liabilities (1) (4) — (5)
Non-current liabilities (2) (1) (1) (4)
Net assets 2 6 13 21
Summarised income statement
Revenue 3 63 4 70
Profit after tax for the year 1 — — 1

124 EG Group | 2020 Annual Report and Financial Statements
NOTES TO THE CONSOLIDATED FINANCIAL STATEMENTS CONTINUEDFor the year ended December 31, 2020
19. JOINT VENTURES CONTINUEDDetails of joint ventures continuedReconciliation of the above summarised financial information to the carrying amount of the interest in the joint ventures recognised in the consolidated financial statements:
2019
Petroleum Products
Storage & Transport Company S.A./N.V.
$m
De Pooter Olie B.V.
$m
Dépôt Pétrolier de Lyon
S.A.S.$m
Total$m
Group’s share in ownership 50% 50% 50%
Group’s share of net assets/liabilities 1 3 6 10
Other adjustments — — (3) (3)
Carrying amount of the Group’s interest in the joint venture 1 3 3 7
The Group holds a 19.64% investment stake in Multi Tank Card B.V. (2019: 19.64%), which is held as a financial asset at fair value through other comprehensive income in line with the accounting policy in note 3.
20. INVENTORIES2020
$m2019
$m
Grocery & Merchandise products 317 308
Foodservice products 5 2
Fuel and oil products 332 349
654 659
The cost of inventories recognised as an expense during the year was $16,975m (2019: $19,252m). The carrying value of inventories recognised as an expense includes $42m (2019: $15m) in respect of write-downs of inventory to net realisable value.
Inventories with a carrying amount of $654m (2019: $659m) have been pledged as security for certain of the Group’s bank facilities.
21. TRADE AND OTHER RECEIVABLES2020
$m2019
$m
Trade receivables 299 330
Allowance for doubtful debts (6) (9)
293 321
Guarantee deposits 9 3
Loans to related parties (note 37) 85 72
Other receivables 153 199
Prepayments 126 129
666 724
The balances are analysed as follows:2020
$m2019
$m
Current 545 622
Non-current 121 102
666 724

STRATEGIC REPORT GOVERNANCE FINANCIALS
125EG Group | 2020 Annual Report and Financial Statements
Trade receivables are recognised initially at the amount of consideration that is unconditionally due from customers in the ordinary course of business. The Group holds trade receivables with the objective to collect the contractual cash flows and therefore measures trade receivables subsequently at amortised cost. Trade and other receivables are generally non-interest-bearing. Credit terms vary by country and the nature of the debt.
Trade and other receivables include $26m (2019: $37m) within prepayments and accrued income of amounts due from suppliers in relation to commercial income which has been earned but not yet invoiced.
Allowances against doubtful debts are recognised based on expected irrecoverable amounts determined by reference to past default experience and are adjusted to reflect current and forward-looking information based on macroeconomic factors and other factors which affect the ability of the customers to settle the receivables.
The ageing analysis of trade receivables and the provision for impairment of trade receivables is as follows:
2020 Current
%/$m
0-30 days past due
%/$m
31-60 days past due
%/$m
61-90 days past due
%/$m
Over 90 days past due
%/$mTotal
$m
Gross carrying amount – trade receivables 215 44 19 6 15 299
Expected credit loss rate 0% 0% 0% 0% 40%
Provision for impairment of trade receivables — — — — (6) (6)
2019 Current
%/$m
0-30 days past due
%/$m
31-60 days past due
%/$m
61-90 days past due
%/$m
Over 90 days past due
%/$mTotal
$m
Gross carrying amount – trade receivables 188 66 8 45 23 330
Expected credit loss rate 0% 0% 0% 0% 40%
Provision for impairment of trade receivables — — — — (9) (9)
As at December 31, 2020 and December 31, 2019, trade receivables that were neither past due nor impaired related to a receivable for whom there is no recent history of default. The other classes of receivables do not contain impaired assets.
At December 31, 2020, trade and other receivables of $15m (2019: $23m) were past due and impaired. Movement in the allowance for doubtful debts:
2020$m
2019$m
Balance at the beginning of the year (9) (4)
Loss allowance recognised — (5)
Amounts written off during the year as uncollectible 3 —
Balance at the end of the year (6) (9)
The Directors consider that the carrying amount of trade and other receivables is approximately equal to their fair value.
22. BORROWINGS2020
$m2019
$m
Secured borrowing at amortised cost
Bank loans (6,271) (5,843)
Secured loan notes (3,391) (3,213)
Revolving credit facilities — (406)
Bank overdrafts — (22)
Total borrowings (9,662) (9,484)
Amount due for settlement within twelve months (64) (489)
Amount due for settlement after twelve months (9,598) (8,995)
(9,662) (9,484)

126 EG Group | 2020 Annual Report and Financial Statements
NOTES TO THE CONSOLIDATED FINANCIAL STATEMENTS CONTINUEDFor the year ended December 31, 2020
22. BORROWINGS CONTINUED
Sterling$m
Euros$m
US Dollar$m
AustralianDollar
$mTotal
$m
Analysis of borrowings by currency:
December 31, 2020
Bank loans (708) (2,786) (2,482) (295) (6,271)
Secured loan notes — (2,024) (1,367) — (3,391)
(708) (4,810) (3,849) (295) (9,662)
December 31, 2019
Bank loans (519) (2,551) (2,502) (271) (5,843)
Secured loan notes — (1,849) (1,364) — (3,213)
Bank overdraft (16) — (2) (4) (22)
Revolving credit facilities — — (406) — (406)
(535) (4,400) (4,274) (275) (9,484)
At December 31, 2020 the Group has the following term loans:
i) A facility B GBP loan of £400m. The loan was taken out on February 7, 2018. Repayments totalling 1% per annum of the initial drawdown are made quarterly, with the balance repayable on maturity in 2025. The loan carries interest at 4.75% above LIBOR and is secured on the assets of the Group and guaranteed by certain entities of the Group.
ii) A facility B EUR loan of €2,160m. The loan was taken out on February 7, 2018. Repayments totalling 1% per annum of the initial drawdown are made quarterly, with the balance repayable on maturity in 2025. The loan carries interest at 4.0% above EURIBOR and is secured on the assets of the Group and guaranteed by certain entities of the Group.
iii) A facility B US$ loan of US$500m. The loan was taken out on February 7, 2018. Repayments totalling 1% per annum of the initial drawdown are made quarterly, with the balance repayable on maturity in 2025. The loan carries interest at 4.0% above US$ LIBOR and is secured on the assets of the Group and guaranteed by certain entities of the Group.
iv) A second lien EUR loan of €125m. The loan was taken out on April 18, 2018, repayable on maturity in 2026 with an initial value of €200m. An early repayment of €75m was made during 2019. The loan carries interest at 8.75% and is secured on the assets of the Group and guaranteed by certain entities of the Group.
v) A term US$ loan of US$1,700m. The loan was taken out on April 19, 2018. Repayments totalling 1% per annum of the initial drawdown are made quarterly, with the balance repayable on maturity in 2025. The loan carries interest at 4.0% above US$ LIBOR and is secured on the assets of the Group and guaranteed by certain entities of the Group.
vi) A second lien US$ loan of US$159m. The loan was taken out on April 19, 2018 (initially US$245m), repayable on maturity in 2026. An early repayment of US$86m was made during 2019. The loan carries interest at 8% above US$ LIBOR and is secured on the assets of the Group and guaranteed by certain entities of the Group.
vii) A term facility EUR loan of €75m. The loan was taken out on December 4, 2018. Repayments totalling 1% per annum of the initial drawdown are made quarterly, with the balance repayable on maturity in 2025. The loan carries interest at 4.0% above EURIBOR and is secured on the assets of the Group and guaranteed by certain entities of the Group.
viii) A term facility US$ loan of US$225m. The loan was taken out on December 4, 2018. Repayments totalling 1% per annum of the initial drawdown are made quarterly, with the balance repayable on maturity in 2025. The loan carries interest at 4.0% above US$ LIBOR and is secured on the assets of the Group and guaranteed by certain entities of the Group.
ix) A facility B A$ loan of A$400m. The loan was taken out on April 4, 2019. Repayments totalling 1% per annum of the initial drawdown are made quarterly, with the balance repayable on maturity in 2025. The loan carries interest at 5% above BBSY and is secured on the assets of the Group and is guaranteed by certain entities of the Group.
x) A term GBP loan of £138m. The loan was taken out on March 9, 2020. The loan carries interest at 5.25% above LIBOR and is secured on the assets of the Group and guaranteed by certain entities of the Group.
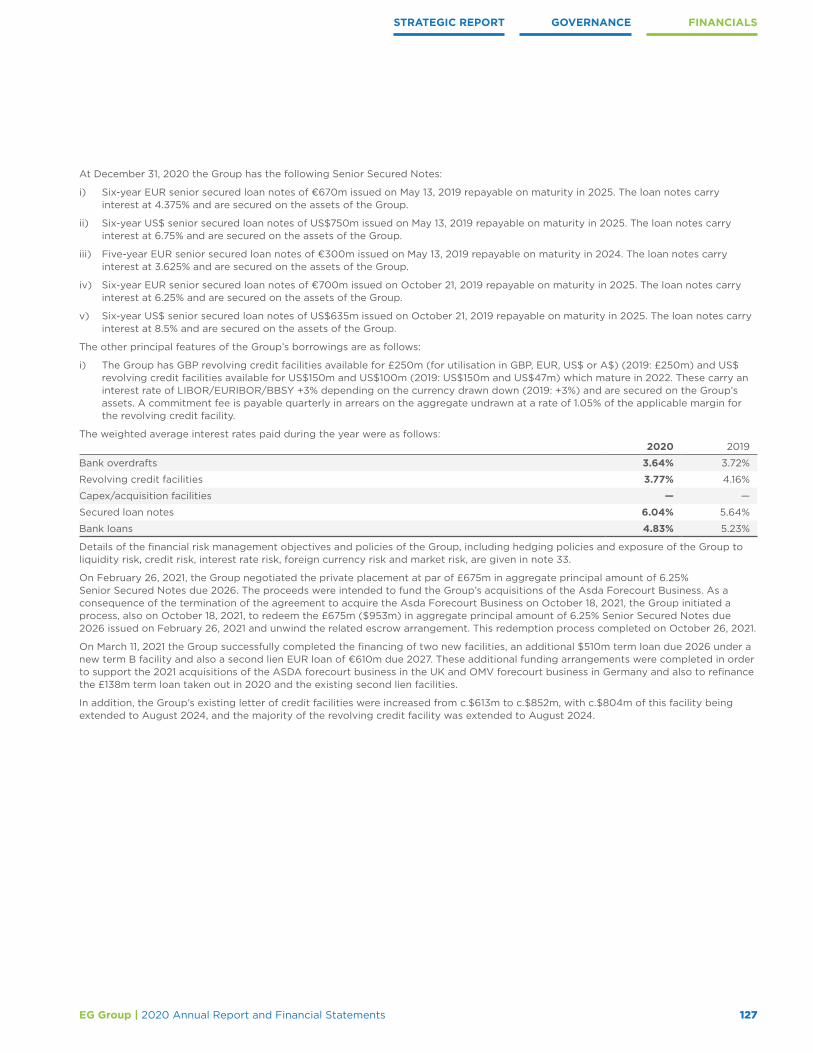
STRATEGIC REPORT GOVERNANCE FINANCIALS
127EG Group | 2020 Annual Report and Financial Statements
At December 31, 2020 the Group has the following Senior Secured Notes:
i) Six-year EUR senior secured loan notes of €670m issued on May 13, 2019 repayable on maturity in 2025. The loan notes carry interest at 4.375% and are secured on the assets of the Group.
ii) Six-year US$ senior secured loan notes of US$750m issued on May 13, 2019 repayable on maturity in 2025. The loan notes carry interest at 6.75% and are secured on the assets of the Group.
iii) Five-year EUR senior secured loan notes of €300m issued on May 13, 2019 repayable on maturity in 2024. The loan notes carry interest at 3.625% and are secured on the assets of the Group.
iv) Six-year EUR senior secured loan notes of €700m issued on October 21, 2019 repayable on maturity in 2025. The loan notes carry interest at 6.25% and are secured on the assets of the Group.
v) Six-year US$ senior secured loan notes of US$635m issued on October 21, 2019 repayable on maturity in 2025. The loan notes carry interest at 8.5% and are secured on the assets of the Group.
The other principal features of the Group’s borrowings are as follows:
i) The Group has GBP revolving credit facilities available for £250m (for utilisation in GBP, EUR, US$ or A$) (2019: £250m) and US$ revolving credit facilities available for US$150m and US$100m (2019: US$150m and US$47m) which mature in 2022. These carry an interest rate of LIBOR/EURIBOR/BBSY +3% depending on the currency drawn down (2019: +3%) and are secured on the Group’s assets. A commitment fee is payable quarterly in arrears on the aggregate undrawn at a rate of 1.05% of the applicable margin for the revolving credit facility.
The weighted average interest rates paid during the year were as follows:2020 2019
Bank overdrafts 3.64% 3.72%
Revolving credit facilities 3.77% 4.16%
Capex/acquisition facilities — —
Secured loan notes 6.04% 5.64%
Bank loans 4.83% 5.23%
Details of the financial risk management objectives and policies of the Group, including hedging policies and exposure of the Group to liquidity risk, credit risk, interest rate risk, foreign currency risk and market risk, are given in note 33.
On February 26, 2021, the Group negotiated the private placement at par of £675m in aggregate principal amount of 6.25% Senior Secured Notes due 2026. The proceeds were intended to fund the Group’s acquisitions of the Asda Forecourt Business. As a consequence of the termination of the agreement to acquire the Asda Forecourt Business on October 18, 2021, the Group initiated a process, also on October 18, 2021, to redeem the £675m ($953m) in aggregate principal amount of 6.25% Senior Secured Notes due 2026 issued on February 26, 2021 and unwind the related escrow arrangement. This redemption process completed on October 26, 2021.
On March 11, 2021 the Group successfully completed the financing of two new facilities, an additional $510m term loan due 2026 under a new term B facility and also a second lien EUR loan of €610m due 2027. These additional funding arrangements were completed in order to support the 2021 acquisitions of the ASDA forecourt business in the UK and OMV forecourt business in Germany and also to refinance the £138m term loan taken out in 2020 and the existing second lien facilities.
In addition, the Group’s existing letter of credit facilities were increased from c.$613m to c.$852m, with c.$804m of this facility being extended to August 2024, and the majority of the revolving credit facility was extended to August 2024.

128 EG Group | 2020 Annual Report and Financial Statements
NOTES TO THE CONSOLIDATED FINANCIAL STATEMENTS CONTINUEDFor the year ended December 31, 2020
23. DEFERRED TAXThe following are the major deferred tax liabilities and (assets) recognised by the Group and movements thereon during the current year and prior reporting year.
At December 31, 2019
$mReclassifications
$m
Arising on acquisition/
balance sheetmovements
$m
Charged/(credited)
to income statement
$m
Exchangedifferences
$m
At December 31, 2020
$m
Fixed assets 533 — 9 (56) 15 501
Goodwill (127) — — (1) — (128)
Intangibles 310 — 3 30 3 346
Rolled over gain 48 — — 7 6 61
IFRS 16 (3) — (1) 29 2 27
Pensions (4) — — — (1) (5)
Tax losses (160) 3 4 23 (2) (132)
Change of accounting policy 8 — — — — 8
Excess interest capacity (78) 13 — 36 — (29)
Provisions (99) (13) (4) (52) (10) (178)
Inventory 20 (3) — — (1) 16
Unfavourable contracts (86) — (1) 3 (8) (92)
Other (1) — — 1 — —
Total 361 — 10 20 4 395
At December 31, 2018
$mReclassifications
$m
Arising on acquisition/
balance sheetmovements
$m
Charged/(credited)
to income statement
$m
Exchangedifferences
$m
At December 31, 2019
$m
Fixed assets 277 — 153 107 (4) 533
Goodwill — (123) (2) (1) (1) (127)
Intangibles (22) 123 173 34 2 310
Rolled over gain — — — 48 — 48
IFRS 16 — — — (3) — (3)
Pensions (5) — — — 1 (4)
Tax losses (45) — 1 (116) — (160)
Change of accounting policy — 8 — — — 8
Excess interest capacity (19) — — (58) (1) (78)
Provisions — (22) (56) (20) (1) (99)
Inventory — 3 18 (1) — 20
Unfavourable contracts — 1 (93) 6 — (86)
Other (30) 24 — 4 1 (1)
Total 156 14 194 — (3) 361

STRATEGIC REPORT GOVERNANCE FINANCIALS
129EG Group | 2020 Annual Report and Financial Statements
Deferred tax assets and liabilities are offset where the Group has a legally enforceable right to do so. The following is the analysis of the deferred tax balances (after offset) for financial reporting purposes:
2020
$m2019
$m
Deferred tax liabilities 533 467
Deferred tax assets (138) (106)
395 361
The Group has reassessed and changed its presentation of deferred tax balances to offset certain deferred tax assets and deferred tax liabilities related to the same taxation authority, in accordance with the accounting policy for deferred tax described in note 3 to the financial statements. In the prior period these deferred tax assets and deferred tax liabilities were presented gross. The 2020 impact of this change in presentation decreased deferred tax assets by $474m and decreased deferred tax liabilities by $474m. Given the impact of this change in presentation is material and to aid comparability of the financial statements, the Group has restated the prior year comparatives, decreasing the 2019 deferred tax assets by $483m and deferred tax liabilities by $483m and also decreasing the 2018 deferred tax assets by $182m and deferred tax liabilities by $182m. There is no impact of this presentation change on the net assets of the group or profit after tax for any period presented.
At the balance sheet date, the Group has unused tax losses of $380m (2019: $1,022m) and excess interest capacity of $334m (2019: $384m) available for offset against future profits.
A deferred tax asset has been recognised in respect of $1,136m (2019: $732m) of losses and $155m (2019: $271m) in respect of excess interest capacity. The losses recognised are those which have arisen in the current period in entities in the UK, USA, Belgium and Luxembourg which are expected to have future taxable profits against which these losses can be offset, losses brought forward in entities which are utilising their brought-forward losses each year, and losses in respect of the head of the German fiscal group which should be available for offset against the future taxable profits of the consolidated fiscal group. The deferred tax asset on excess interest capacity relates to interest restrictions in the UK, USA and Netherlands.
No deferred tax asset has been recognised in respect of the remaining $380m (2019: $290m) of losses or $129m (2019: $113m) of excess interest capacity. There are restrictions in place against these losses such that it is not considered probable that there will be future taxable profits available against which to offset them. It is also not considered probable that there will be sufficient interest capacity in the foreseeable future to enable the remaining excess interest capacity to be utilised.
No deferred tax liabilities have been recorded with respect to investments in subsidiaries and joint ventures as any unremitted earnings may be repatriated tax free.
24. LEASES
Right of use assets
Land and buildings
$mVehicles
$mTotal
$m
Cost
At December 31, 2019 1,638 17 1,655
Additions 346 12 358
Remeasurements 29 — 29
Recognition on acquisition of subsidiaries 136 — 136
Exchange differences 126 (2) 124
At December 31, 2020 2,275 27 2,302
Accumulated depreciation
At December 31, 2019 (164) (2) (166)
Charge for the year (143) (8) (151)
Impairment charge for the year 22 — 22
Exchange differences (15) — (15)
At December 31, 2020 (300) (10) (310)
Carrying amount
At December 31, 2020 1,975 17 1,992
At December 31, 2019 1,474 15 1,489

130 EG Group | 2020 Annual Report and Financial Statements
NOTES TO THE CONSOLIDATED FINANCIAL STATEMENTS CONTINUEDFor the year ended December 31, 2020
24. LEASES CONTINUED
Right of use assets
Land and buildings
$mVehicles
$mTotal
$m
Cost
At January 1, 2019 889 2 891
Additions 84 1 85
Recognition on acquisition of subsidiaries 670 13 683
Exchange differences (5) 1 (4)
At December 31, 2019 1,638 17 1,655
Accumulated depreciation
At January 1, 2019 — — —
Charge for the year (124) (2) (126)
Impairment charge for the year (39) — (39)
Exchange differences (1) — (1)
At December 31, 2019 (164) (2) (166)
Carrying amount
At December 31, 2019 1,474 15 1,489
At January 1, 2019 889 2 891
The Group leases land and buildings and vehicles. The average lease term on a weighted average is 27 years (2019: 26 years).
The Group’s obligations under leases are secured by the lessors’ title to the leased assets.
Details of the impairment recognised in the year are set out in note 5.
Approximately 2.98% of the leases for land and buildings expired in the current financial year. Of these expired contracts, 3.26% were replaced by new leases for identical underlying assets. This resulted in additions to right of use assets of $0.2m in 2020.
Lease liabilities2020
$m2019
$m
At January 1 (1,414) (763)
Remeasurements (28) —
Additions (216) (77)
Interest expense (81) (59)
Payments 190 142
Recognition on acquisition of subsidiaries (132) (681)
Exchange differences (96) 24
At December 31 (1,777) (1,414)

STRATEGIC REPORT GOVERNANCE FINANCIALS
131EG Group | 2020 Annual Report and Financial Statements
Lease liabilities2020
$m2019
$m
Maturity analysis:
Year ended December 31
Within one year 205 165
Greater than one year but less than two years 200 161
Greater than two years but less than three years 193 153
Greater than three years but less than four years 181 146
Greater than four years but less than five years 173 136
After five years 2,452 1,115
Less: unearned interest (1,627) (462)
1,777 1,414
Analysed as:
Non-current 1,600 1,256
Current 177 158
1,777 1,414
The Group does not face a significant liquidity risk with regard to its lease liabilities.2020
$m2019
$m
Amounts recognised in profit and loss
Depreciation expense on right of use assets (151) (126)
Interest expense on lease liabilities (81) (59)
Expense relating to short-term leases (2) (4)
Expense relating to leases of low-value assets — (2)
Expense relating to variable lease payments not included in the measurement of the lease liability (58) (47)
At December 31, 2020, the Group is committed to $nil for short-term leases (2019: $1m).
Some of the property leases in which the Group is the lessee contain variable lease payment terms that are linked to sales generated from the leased sites. The breakdown of lease payments for these sites is as follows:
2020$m
2019$m
Fixed payments (7) (37)
Variable payments (58) (47)
Total payments (65) (84)
The total cash outflows for leases amount to $250m (2019: $142m).
The Group does not have any restrictions or covenants imposed by leases.
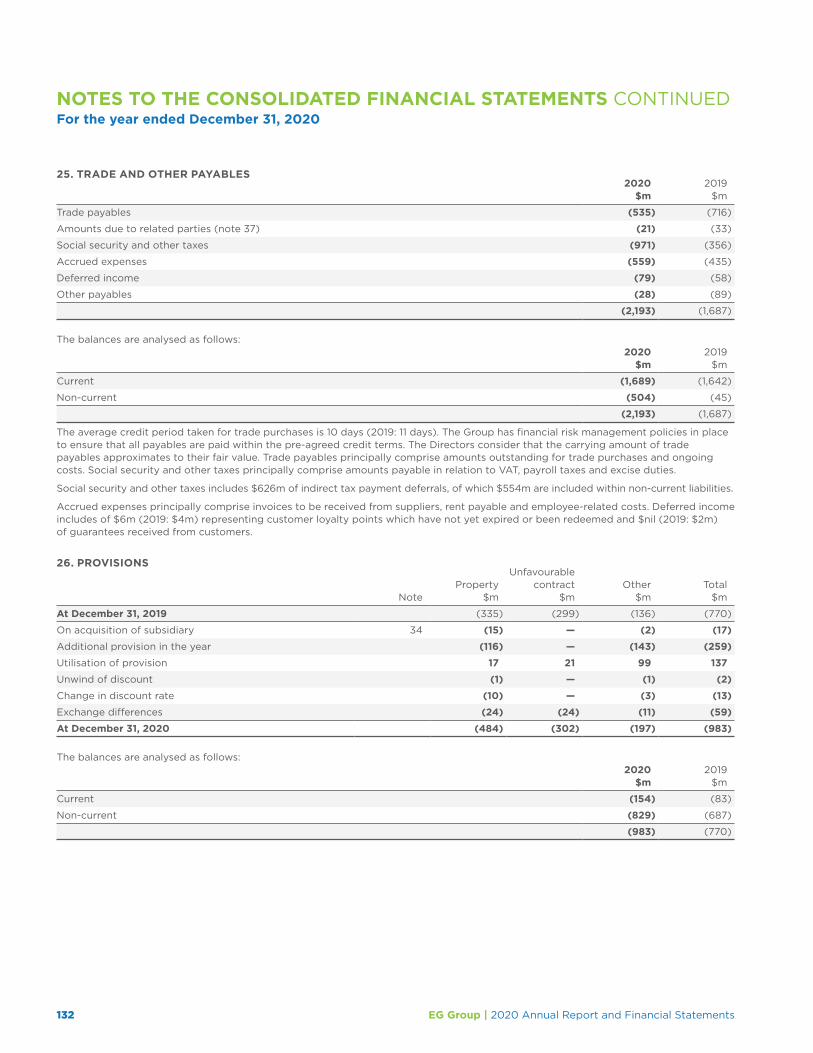
132 EG Group | 2020 Annual Report and Financial Statements
NOTES TO THE CONSOLIDATED FINANCIAL STATEMENTS CONTINUEDFor the year ended December 31, 2020
25. TRADE AND OTHER PAYABLES2020
$m2019
$m
Trade payables (535) (716)
Amounts due to related parties (note 37) (21) (33)
Social security and other taxes (971) (356)
Accrued expenses (559) (435)
Deferred income (79) (58)
Other payables (28) (89)
(2,193) (1,687)
The balances are analysed as follows:2020
$m2019
$m
Current (1,689) (1,642)
Non-current (504) (45)
(2,193) (1,687)
The average credit period taken for trade purchases is 10 days (2019: 11 days). The Group has financial risk management policies in place to ensure that all payables are paid within the pre-agreed credit terms. The Directors consider that the carrying amount of trade payables approximates to their fair value. Trade payables principally comprise amounts outstanding for trade purchases and ongoing costs. Social security and other taxes principally comprise amounts payable in relation to VAT, payroll taxes and excise duties.
Social security and other taxes includes $626m of indirect tax payment deferrals, of which $554m are included within non-current liabilities.
Accrued expenses principally comprise invoices to be received from suppliers, rent payable and employee-related costs. Deferred income includes of $6m (2019: $4m) representing customer loyalty points which have not yet expired or been redeemed and $nil (2019: $2m) of guarantees received from customers.
26. PROVISIONS
NoteProperty
$m
Unfavourable contract
$mOther
$mTotal
$m
At December 31, 2019 (335) (299) (136) (770)
On acquisition of subsidiary 34 (15) — (2) (17)
Additional provision in the year (116) — (143) (259)
Utilisation of provision 17 21 99 137
Unwind of discount (1) — (1) (2)
Change in discount rate (10) — (3) (13)
Exchange differences (24) (24) (11) (59)
At December 31, 2020 (484) (302) (197) (983)
The balances are analysed as follows:2020
$m2019
$m
Current (154) (83)
Non-current (829) (687)
(983) (770)
STRATEGIC REPORT GOVERNANCE FINANCIALS
133EG Group | 2020 Annual Report and Financial Statements
Property provisions Property provisions comprise asset retirement obligation provisions, environmental provisions for remediation works at petrol filling stations (“PFS”), debranding provisions and dilapidation provisions. The nature of the provisions and the judgements applied in determining the amount to be provided are described in further detail below:
• Asset retirement obligation (‘dismantling’) (December 31, 2020: $338m; 2019: $193m)Dismantling provisions relate to sites for which the Group only has a right to operate the site for a number of years under a lease arrangement with a third party. After the right to use has expired, the Group is obliged to dismantle all assets on the specific site and to restore the site to its original condition. Amounts provided are based on prior experience of costs incurred. The provision is expected to be utilised in the medium to long term.
• Environmental restoration (December 31, 2020: $114m; 2019: $122m) Environmental protection requirements for remediation works at petrol filling stations (“PFS”) vary by country and are regulated by different agencies in each country. In all countries, a provision is made in full when a liability is identified and assessed. A provision is recognised for the present value of costs to be incurred for the restoration of sites, based on third-party reports. The provision is expected to be utilised in the medium to long term.
• Debranding (December 31, 2020: $12m; 2019: $11m) Debranding provisions relate to sites where, on termination of existing contracts with fuel suppliers and brand licensors, the Group is obliged to debrand, at its own cost, sites and motorway concessions. Amounts provided are based on prior experience of costs incurred. The provision is expected to be utilised in the medium to long term.
• Dilapidations (December 31, 2020: $20m; 2019: $9m) Dilapidation provisions relate to sites acquired on leases which contain clauses under which the Group has to make good dilapidations or other damage which occurs to the property during the course of the lease or restore the property to a specified condition. Amounts provided are based on prior experience of costs incurred. The provision is expected to be utilised in the medium to long term.
Unfavourable contract and other provisions Other provisions relate primarily to legal claims, restructuring costs, onerous contracts and obligations to retailers/dealers who operate sites in the Group. The nature of the provisions and the judgements applied in determining the amount to be provided are described in further detail below:
• Legal claims (December 31, 2020: $33m; 2019: $45m) The amount provided primarily represents several legal claims brought against the Group (i) by retailers, wholesalers, suppliers and sub-lessees for wrongful termination of contracts and/or alleged contractual breach, or (ii) by landlords for an amendment of the rent, or (iii) by customers and employees claiming for injury or damages. Based on prior experience with such claims, the expected settlement date is uncertain and can extend for several years. Amounts provided for are based on estimated outcomes of the claims determined by internal and external legal counsel. The provision is expected to be utilised in the medium to long term.
• Retailer/dealer contract premiums (December 31, 2020: $28m; 2019: $22m) The Group provides for expected outflows to reflect the accumulated rights of the retailer/dealer. In certain jurisdictions, where the Group has an arrangement for a third-party retailer/dealer to operate a site, the third party is legally or contractually entitled to certain benefits relating to the length of their service. The Group provides for the expected outflows arising from this obligation on the basis of the award accumulated at the reporting date. The provision is expected to be utilised in the medium to long term.
• Unfavourable contracts (December 31, 2020: $302m; 2019: $299m) The amount provided represents unfavourable contracts acquired through business combinations in which the business was committed to a contract with less favourable cash inflows/outflows than those which could have been obtained in an equivalent contract negotiated at arm’s length as at the date of acquisition. Amounts provided for relate to the difference between the estimated fair value of the contract at acquisition date and the estimated fair value of an equivalent contract negotiated on the acquisition date. The provision is expected to be utilised in the medium to long term.
• Other (December 31, 2020: $136m; 2019: $69m) The Group has a number of other smaller provisions which make up this total balance. This balance includes items such as expected costs for the Group’s committed restructuring activity, insurance excess reserves, and real estate transfer taxes. During the period $28m of insurance excess liability has been transferred from legal claims to other provisions.

134 EG Group | 2020 Annual Report and Financial Statements
NOTES TO THE CONSOLIDATED FINANCIAL STATEMENTS CONTINUEDFor the year ended December 31, 2020
27. SHARE CAPITALNumber
of shares $
Authorised, issued and fully paid: ordinary shares of £1 each
At December 31, 2019 2,011 2,940
At December 31, 2020 2,011 2,940
The Company has one class of ordinary shares, which carry no right to fixed income. An issue of shares during 2019 occurred on October 21, 2019.
The holders of ordinary shares are entitled to receive dividends as declared from time to time and are entitled to one vote per share at general meetings of the Company.
28. SHARE PREMIUM ACCOUNTShare
premium$m
Balance at December 31, 2019 2,159
Balance at December 31, 2020 2,159
The share premium account arose on issue of ordinary shares on January 29, 2016 for consideration of $959m and a further issue of ordinary shares on November 17, 2016 for consideration of $764m. On October 21, 2019, the Group issued 100 ordinary shares for consideration of $446m.
29. OTHER RESERVESThe analysis of movements in reserves is shown in the statement of changes in equity. Details of the amounts included in other reserves are set out below.
Merger reserve The merger reserve arose on the acquisition of Euro Garages Jersey Limited by EG Group Limited. In the case of the Group, the merger reserve represents the difference between the fair value and the nominal value of the share capital issued by EG Group Limited.
Translation reserveExchange differences relating to the translation of the net assets of the Group’s foreign operations from their functional currency into the Group’s presentational currency, being US Dollars, are recognised directly in the translation reserve. Gains and losses on hedging instruments that are designated as hedges of net investments in foreign operations are also included in the translation reserve.
Translationreserve
$m
Balance at December 31, 2019 (35)
Exchange differences on translating the net assets of foreign operations 93
Balance at December 31, 2020 58

STRATEGIC REPORT GOVERNANCE FINANCIALS
135EG Group | 2020 Annual Report and Financial Statements
30. NOTES TO THE CASH FLOW STATEMENT2020 2019
Before exceptional
items$m
Exceptionalitems
$m
After exceptionals
$m
Before exceptional
items$m
Exceptionalitems
$m
After exceptionals
$m
Cash flows from operating activities
Loss for the year (204) (28) (232) (73) (71) (144)
Adjustments for:
Share of profit of equity accounted investments — — — (1) — (1)
Finance income (7) — (7) (8) — (8)
Finance costs 864 6 870 536 19 555
Income tax expense/(credit) 72 (7) 65 10 41 51
Loss on disposal of property, plant and equipment 2 — 2 2 — 2
Gain on disposal of business — — — — (173) (173)
Depreciation of property, plant and equipment and right of use asset 565 — 565 468 — 468
Amortisation of intangible assets 89 — 89 84 — 84
Impairment of property, plant and equipment and right of use asset 65 (40) 25 — 100 100
Goodwill adjustment — 12 12 — 17 17
Decrease in provisions (27) — (27) (41) — (41)
Operating cash flows before movements in working capital 1,419 (57) 1,362 977 (67) 910
Changes in working capital
Increase in inventories 39 (54)
(Increase)/decrease in receivables 109 (214)
Increase in payables 360 82
Cash generated by operations 1,870 724
Income taxes paid (35) (41)
Net cash from operating activities 1,835 683
Cash and cash equivalents comprise cash and short-term bank deposits (see accounting policy in note 3). The carrying amount of these assets is approximately equal to their fair value. Cash and cash equivalents at the end of the reporting year as shown in the consolidated statement of cash flows can be reconciled to the related items in the consolidated balance sheet position.
Included in the cash and cash equivalents balance of $661m at the year end is $112m of credit card receivables that are due within 72 hours of the year end date.

136 EG Group | 2020 Annual Report and Financial Statements
NOTES TO THE CONSOLIDATED FINANCIAL STATEMENTS CONTINUEDFor the year ended December 31, 2020
30. NOTES TO THE CASH FLOW STATEMENT CONTINUEDAnalysis of changes in net debt
Non-cash movements
2020
January 1,2020
$m
Financingcash flow(1)
$m
Acquisition of subsidiary
$mNew leases
$m
Exchange movements
$m
Other non-cash
movements(2)
$m
December 31,2020
$m
Bank loans (5,843) (123) — — (283) (22) (6,271)
Secured loan notes (3,213) — — — (172) (6) (3,391)
Revolving credit facilities (406) 406 — — — — —
Bank overdrafts (22) 22 — — — — —
Lease liabilities (1,414) 190 (132) (216) (96) (109) (1,777)
Total liabilities arising from financing activities (10,898) 495 (132) (216) (551) (137) (11,439)
Cash and bank balances 415 201 6 — 39 — 661
Net debt (10,483) 696 (126) (216) (512) (137) (10,778)
2019
Non-cash movements
January 1,2019
$m
Financingcash flow(1)
$m
Acquisition of subsidiary
$mNew leases
$m
Exchange movements
$m
Other non-cash
movements(2)
$m
December 31,2019
$m
Bank loans (5,817) (39) — — 24 (11) (5,843)
Secured loan notes — (3,252) — — (14) 53 (3,213)
Revolving credit facilities (297) (114) — — 5 — (406)
Bank overdrafts (52) 28 — — 2 — (22)
Lease liabilities (763) 142 (681) (77) 24 (59) (1,414)
Total liabilities arising from financing activities (6,929) (3,235) (681) (77) 41 (17) (10,898)
Cash and bank balances 308 97 — — 10 — 415
Net debt (6,621) (3,138) (681) (77) 51 (17) (10,483)(1) Financing cash flows consist of the net amount of proceeds from borrowings and repayments of borrowings in the cash flow statement for borrowings,
and lease repayments for lease liability movements (2) Other non-cash movements relate to additions to capitalised borrowing fees in the year offset by amortisation of borrowing fees and the unwind of
discounting on lease liabilities
Balances at December 31, 2020 comprise:Non-current
assets$m
Current assets
$m
Current liabilities
$m
Non-current liabilities
$mTotal
$m
Cash and bank balances — 661 — — 661
Borrowings — — (64) (9,598) (9,662)
Lease liabilities — — (177) (1,600) (1,777)
Net debt — 661 (241) (11,198) (10,778)

STRATEGIC REPORT GOVERNANCE FINANCIALS
137EG Group | 2020 Annual Report and Financial Statements
31. COMMITMENTS AND CONTINGENCIESCapital commitmentsCapital commitments are due to the acquisition or renewal of new highway stations and concessions. As a result of these acquisitions, the Group has an obligation to undertake specified constructions and refurbishment for these locations. The commitment as at December 31, 2020 is $77m (2019: $46m).
Fuel supply contractsIn the regular course of business, the Group enters into relationships with fuel suppliers whereby the Group commits itself to purchase certain minimum quantities of fuel in order to benefit from better pricing conditions. The duration of these contracts range from one to five years. The total volume of these purchase commitments over the remaining contract duration is 19,497m litres (2019: 36,048m litres). The fuel price at the time of purchase is not in excess of current market prices and reflects normal business operations.
Contingent liabilitiesThe Group recognises provisions for liabilities when it is more likely than not that a settlement will be required and the value of such a payment can be reliably estimated. On review of ongoing matters at the reporting date, management have concluded that all such claims other than those that are provided for are remote, and accordingly contingent liabilities have not been recognised. Contingent liabilities identified through business combinations are recognised on the balance sheet as provisions in accordance with IFRS 3.
Subsidiary audit exemptionsThe following wholly owned subsidiary undertakings, consolidated into the Group financial statements for the year ended December 31, 2020, are exempt from the requirements for the audit of individual accounts by virtue of Section 477 of the Companies Act 2006 in England. Information on the countries of incorporation, registered offices and principal activities are detailed in note 18.
Name Company
number
GB3 Limited 05147753
Urban Origin Limited 08201483
EG Group Limited will guarantee all outstanding liabilities that these subsidiaries are subject to as at the financial year ended December 31, 2020 in accordance with Section 477 of the Companies Act 2006 in England.
32. EMPLOYEE BENEFIT OBLIGATIONSThe Group operates a variety of post-employment benefit arrangements, covering both funded defined benefit schemes and funded defined contribution schemes. These benefits have been valued in conformity with IAS 19 and in accordance with the Group accounting policies described in note 3.
The table below outlines where the Group’s post-employment amounts and activity are included in the financial statements:
2020$m
2019$m
Balance sheet obligations for:
Defined benefit plan (41) (34)
Jubilee premium plan (4) (3)
Long service award (22) (25)
Liability in the balance sheet (67) (62)
Income statement charge:
Defined benefit plan (2) (2)
Defined contribution plan (22) (17)
Jubilee premium plan (1) (1)
(25) (20)
Defined contribution schemesThe Group operates defined contribution retirement benefit schemes for all qualifying employees. The only obligation of the Group with respect to the retirement benefit scheme is to make the specified contributions.
Other employee benefitsThe Group provides long service awards and jubilee benefits, rewarding employees for long years of service. The liability recognised in the consolidated balance sheet represents the present value of the obligation at the reporting date.

138 EG Group | 2020 Annual Report and Financial Statements
NOTES TO THE CONSOLIDATED FINANCIAL STATEMENTS CONTINUEDFor the year ended December 31, 2020
32. EMPLOYEE BENEFIT OBLIGATIONS CONTINUED
Defined benefit schemesFollowing the acquisition of EFR in November 2016 and Echo Tankstellen GmbH and Retail Operating Company GmbH in October 2018, the Group now operates the following long-term employee benefit plans for its working and retired personnel: retirement benefit plan, jubilee benefits for long years of service and bridge pension plan for employment terminated before the normal retirement date.
The Group operates five defined benefit plans (2019: five), one for employees in Belgium, three for employees in the Netherlands and one for employees in Germany. Employee contributions are required regarding the defined benefit plan.
In Belgium the defined benefit plan is subject to the Belgian law and is insured by AG Insurance. The pension plan is an annuity plan, which also provides an option for a lump sum payment at the retirement age based on the average salary. These arrangements are typical in the Belgian market. The plan in Belgium is funded. If the plan assets are below the legal minimum funding requirement, the employer is obliged to make an immediate contribution to the plan. The legal requirement is based on a 6% interest rate and the mortality table. The investments are governed by the insurer, who oversees all investment decisions.
In the Netherlands, the defined benefit plans are subject to Dutch law and are insured by Aegon Levensverzekering N.V. and Nationale-Nederlanden Levensverzekering Maatschappij N.V. One of the defined benefit plans is a final pay plan, which provides benefits to members in the form of annuities based on final salary. The other defined benefit plans are average pay plans, which provide benefits to members in the form of annuities based on average salary. The annuity arrangements are typical in the Dutch market and are required by Dutch law. After retirement or withdrawal, pensions are indexed conditionally with inflation. All of the plans in the Netherlands are funded. The plan assets are governed by the insurer, who also bears the risks and responsibility of the plan assets – overseeing all investment decisions and guaranteeing the accrued benefits in the case of a deficit position of the scheme.
In Germany, the defined benefit plan is unfunded. Members are eligible to receive life-long benefit payments in case of death, disability and when reaching normal retirement age. The amount of benefits depends mainly on the length of service and final salary of the plan members, while the exact details of the pension benefits vary based on the employee’s date of hire. Benefit payments will be paid directly from the Company.
The risks of the Group in the Netherlands are limited to pension increases and transfer of value. In Belgium an additional risk for the Group arises if the plan assets are below the legal minimum funding requirement. This requirement does not exist for the Group’s plans in the Netherlands. In Germany, as the plans are unfunded, the Group bears the risks of longevity, future salary increases, inflation (pension increases) and interest risk.
The schemes typically expose the Group to the following actuarial risks:
Investment risk The present value of the defined benefit plan liability is calculated using a discount rate determined by reference to high-quality corporate bond yields; if the return on plan asset is below this rate, it will create a plan deficit.
Interest risk A decrease in the bond interest rate will increase the plan liability but this will be partially offset by an increase in the return on the plan’s debt investments.
Longevity risk The present value of the defined benefit plan liability is calculated by reference to the best estimate of the mortality of plan participants both during and after their employment. An increase in the life expectancy of the plan participants will increase the plan’s liability.
Salary risk The present value of the defined benefit plan liability is calculated by reference to the future salaries of plan participants. As such, an increase in the salary of the plan participants will increase the plan’s liability.
The most recent full actuarial valuations of the plan assets and the present value of the defined benefit liabilities in Belgium, the Netherlands and Germany were carried out at December 31, 2020 by Mercer. The present value of the defined benefit liability, and the related current service cost and past service cost, were measured using the projected unit credit method.
The principal assumptions used for the purposes of the Netherlands actuarial valuations were as follows:
Key assumptions used: 2020 2019
Discount rate (%) 1.3 1.5
Expected rate of salary increase (%) — —
Future inflation (%) 1.5 2.2
Average age of active participants (years) 50.1 49.1
Average service of active participants (years) 20.5 19.5
Average longevity at retirement age for current pensioners (years)
Male 21.7 22.1
Female 24.0 24.5
Average longevity at retirement age for current employees (future pensioners) (years)
Male 24.0 24.7
Female 26.1 26.9

STRATEGIC REPORT GOVERNANCE FINANCIALS
139EG Group | 2020 Annual Report and Financial Statements
The principal assumptions used for the purposes of the Belgium actuarial valuations were as follows:
Key assumptions used: 2020 2019
Discount rate (%) 1.2 1.5
Expected rate of salary increase (%) 2.0 2.0
Future inflation (%) 1.5 2.2
Average age of active participants (years) 56.6 52.0
Average service of active participants (years) 29.3 24.0
Average longevity at retirement age for current pensioners (years)
Male 20.5 20.5
Female 24.1 24.1
Average longevity at retirement age for current employees (future pensioners) (years)
Male 23.5 20.5
Female 26.4 24.1
The principal assumptions used for the purposes of the Germany actuarial valuations were as follows:
Key assumptions used: 2020 2019
Discount rate (%) 1.2 1.5
Expected rate of salary increase (%) 3.0 3.0
Future inflation (%) 1.5 2.2
Average age of active participants (years) 50.2 49.0
Average service of active participants (years) 22.3 21.0
Average longevity at retirement age for current pensioners (years)
Male — —
Female — —
Average longevity at retirement age for current employees (future pensioners) (years)
Male — 23.5
Female — 26.4
The amount included in the balance sheet arising from the Group’s obligations in respect of its defined benefit retirement schemes is as follows:
2020 $m Belgium Netherlands Germany Total
Present value of defined benefit obligations 4.2 11.1 39.5 54.8
Fair value of plan assets (1.8) (11.1) — (12.9)
Net liability arising from defined benefit obligation 2.4 — 39.5 41.9
2019 $m Belgium Netherlands Germany Total
Present value of defined benefit obligations 6.0 9.9 30.6 46.5
Fair value of plan assets (1.2) (9.9) — (11.1)
Net liability arising from defined benefit obligation 4.8 — 30.6 35.4

140 EG Group | 2020 Annual Report and Financial Statements
NOTES TO THE CONSOLIDATED FINANCIAL STATEMENTS CONTINUEDFor the year ended December 31, 2020
32. EMPLOYEE BENEFIT OBLIGATIONS CONTINUEDDefined benefit schemes continuedMovements in the present value of defined benefit obligations in the year were as follows:
2020 $m Belgium Netherlands Germany Total
Opening defined benefit obligation (6.0) (9.9) (30.6) (46.5)
Current service cost (0.1) — (1.4) (1.5)
Interest cost (0.1) (0.1) (0.5) (0.7)
Remeasurement losses/(gains):
Actuarial gains and losses arising from changes in demographic assumptions — 0.2 — 0.2
Actuarial gains and losses arising from changes in financial assumptions (0.2) (0.4) (2.8) (3.4)
Actuarial gains and losses arising from experience adjustments 2.6 — (1.7) 0.9
Benefits paid 0.1 0.1 — 0.2
Exchange differences (0.5) (1.0) (2.5) (4.0)
Closing defined benefit obligation (4.2) (11.1) (39.5) (54.8)
2019 $m Belgium Netherlands Germany Total
Opening defined benefit obligation (5.3) (8.5) (23.9) (37.7)
Current service cost (0.1) — (1.1) (1.2)
Interest cost (0.1) (0.2) (0.6) (0.9)
Remeasurement losses/(gains):
Actuarial gains and losses arising from changes in financial assumptions (0.8) (1.5) (5.0) (7.3)
Actuarial gains and losses arising from experience adjustments — — (0.3) (0.3)
Benefits paid 0.2 0.1 — 0.3
Exchange differences 0.1 0.2 0.3 0.6
Closing defined benefit obligation (6.0) (9.9) (30.6) (46.5)
Movements in the fair value of plan assets in the year were as follows:
2020 $m Belgium Netherlands Germany Total
Opening fair value of plan assets 1.2 9.9 — 11.1
Interest income — 0.1 — 0.1
Remeasurement gain — 0.2 — 0.2
Employer contributions 0.5 — — 0.5
Benefits paid (0.1) (0.1) — (0.2)
Exchange differences 0.2 1.0 — 1.2
Closing fair value of plan assets 1.8 11.1 — 12.9
2019 $m Belgium Netherlands Germany Total
Opening fair value of plan assets 1.4 8.5 — 9.9
Interest income — 0.2 — 0.2
Remeasurement gain 0.1 1.5 — 1.6
Benefits paid (0.2) (0.1) — (0.3)
Exchange differences (0.1) (0.2) — (0.3)
Closing fair value of plan assets 1.2 9.9 — 11.1

STRATEGIC REPORT GOVERNANCE FINANCIALS
141EG Group | 2020 Annual Report and Financial Statements
The major categories and fair values of plan assets at the end of the reporting year for each category are as follows:
2020 $m Belgium Netherlands Germany Total
Assets held by insurance companies 1.8 11.1 — 12.9
2019 $m Belgium Netherlands Germany Total
Assets held by insurance companies 1.2 9.9 — 11.1
The average duration of the defined benefit obligations at the end of the reporting year is 22.8 years (2019: 24.7 years) relating to active, deferred and retired members.
The Group expects to make a contribution of $nil to the defined benefit schemes during the next financial year.
There has been no change in the processes used by the Group to manage its risks from prior years.
Sensitivity analyses Significant actuarial assumptions for the determination of the defined benefit obligation are discount rate and expected salary increase. The sensitivity analyses below have been determined based on reasonably possible changes of the respective assumptions occurring at the end of the reporting year, while holding all other assumptions constant.
The sensitivity analysis may not be representative of the actual change in the defined benefit obligation as it is unlikely that the changes in assumptions would occur in isolation of one another as some of the assumptions may be correlated. In presenting the above sensitivity analysis, the present value of the defined benefit obligation has been calculated using the projected unit credit method at the end of the reporting year, which is the same as that applied in calculating the defined benefit obligation liability recognised in the balance sheet. There was no change in the methods and assumptions used in preparing the sensitivity analysis from prior periods.
If the discount rate was 25bps higher/(lower) the defined benefit obligation would decrease/(increase) by $2.9m/($2.7m).
If the expected salary growth increases/(decreases) by 0.25%, the defined benefit obligation would (increase)/decrease by ($1.7m)/$1.8m.
33. FINANCIAL INSTRUMENTSCapital risk managementThe Group manages its capital to ensure that entities in the Group will be able to continue as a going concern while maximising the return to shareholders through the optimisation of the debt and equity balance and sustaining the future development of the business.
The capital structure of the Group consists of net debt (borrowings disclosed in notes 22 and 30 after deducting cash and bank balances) and equity of the Group (comprising issued capital, reserves and retained earnings as disclosed in notes 27 to 29). The Group is not subject to any externally imposed capital requirements.
The Board can manage the Group’s capital structure by diversifying the debt portfolio, recycling capital through sale and leaseback transactions and flexing capital expenditure. Part of the Group’s capital risk management is to monitor a broad range of financial metrics and ensure compliance with the general covenants included in the Group’s various borrowing facilities. There have been no breaches of financial covenants in the financial year ended December 31, 2020 or December 31, 2019.
Significant accounting policiesDetails of the significant accounting policies and methods adopted (including the criteria for recognition, the basis of measurement and the bases for recognition of income and expenses) for each class of financial asset, financial liability and equity instrument are disclosed in note 3.
Covenant leverageCovenant leverage at the year end is as follows:
2020$m
2019$m
Pro forma Adjusted EBITDA before IFRS 16 1,508 1,517
Net debt before lease liabilities (9,001) (9,069)
Adjustments to net debt per covenant agreement (158) 38
Covenant adjusted net debt (9,159) (9,031)
Covenant leverage 6.1 5.9
Covenant leverage is calculated as the Group’s net debt before lease liabilities (as defined on page 165), adjusted for certain items set out in the covenant agreement (predominantly unamortised debt costs), divided by the Group’s pro forma Adjusted EBITDA before IFRS 16 (as defined on page 165).

142 EG Group | 2020 Annual Report and Financial Statements
NOTES TO THE CONSOLIDATED FINANCIAL STATEMENTS CONTINUEDFor the year ended December 31, 2020
33. FINANCIAL INSTRUMENTS CONTINUEDCategories of financial instruments
2020$m
2019$m
Financial assets
At amortised cost
Cash and bank balances 661 415
Trade and other receivables (excluding prepayments) 540 595
Investments at fair value through OCI 2 2
Fair value through profit and loss (“FVTPL”) – mandatorily measured
Forward fuel contracts 1 2
1,204 1,014
Financial liabilities
At amortised cost
Borrowings (excluding finance lease liabilities) (9,662) (9,484)
Trade and other payables (excluding social security and other taxes) (1,222) (1,331)
Lease liabilities (1,777) (1,414)
Fair value through profit and loss (“FVTPL”) – mandatorily measured
Interest rate swaps (2) (2)
(12,663) (12,231)
Financial risk management objectivesRisks facing the Group include market risk (including currency risk and price risk), credit risk, liquidity risk and cash flow interest rate risk.
The Group’s overall risk management programme focuses on the unpredictability of financial markets and seeks to minimise potential adverse effects on the Group’s financial performance. The objective is to identify, quantify, manage and then monitor events or actions that could lead to financial losses. The Group occasionally seeks to minimise the effects of these risks by using derivative financial instruments (interest rate swaps or forward exchange contracts) to hedge certain risk exposures.
The Group does not enter into or trade financial instruments, including derivative financial instruments, for speculative purposes.
Market riskThe Group’s activities expose it primarily to the financial risks of changes in foreign currency exchange rates and interest rates (see below). The Group enters into a variety of derivative financial instruments to manage its exposure to interest rate and foreign currency risk, including:
• Forward foreign exchange contracts to hedge the exchange rate risk arising on purchase of fuel in US Dollars by European subsidiaries
• Interest rate swaps to mitigate the risk of rising interest rates
The Group has not applied cash flow hedge accounting on forward foreign exchange contracts.
There has been no change to the Group’s exposure to market risks or the manner in which these risks are managed and measured.

STRATEGIC REPORT GOVERNANCE FINANCIALS
143EG Group | 2020 Annual Report and Financial Statements
Foreign currency risk managementThe Group’s exposure to foreign currency risk is as follows. Amounts represent balances carried in non-functional currencies by Group entities. This is based on the carrying amount for monetary financial instruments except derivatives, when it is based on notional amounts:
2020 Euro
$mUS Dollar
$mGBP$m
AUD$m
Total$m
Cash and cash equivalents 227 9 — — 236
Trade and other receivables — 15 — — 15
Trade and other payables (16) (16) — — (32)
Borrowings (4,695) (1,848) — — (6,543)
Balance sheet exposure (4,484) (1,840) — — (6,324)
2019 Euro
$mUS Dollar
$mGBP$m
AUD$m
Total$m
Cash and cash equivalents 19 — — — 19
Trade and other receivables — 15 — — 15
Trade and other payables (15) (43) — — (58)
Borrowings (4,190) (2,078) — (4) (6,272)
Balance sheet exposure (4,186) (2,106) — (4) (6,296)
Foreign currency sensitivity analysisThe Group is mainly exposed to the Euro in relation to the servicing of Euro-denominated debt held by subsidiaries with a GBP functional currency, the servicing of US Dollar-denominated debt held by subsidiaries with a Euro functional currency and the US Dollar liabilities in relation to fuel purchases by European subsidiaries with a Euro functional currency.
The following table details the Group’s sensitivity to a 10% increase and decrease in GBP against the Euro and the Euro against the US Dollar. 10% represents management’s assessment of the reasonably possible change in foreign exchange rates. The sensitivity analysis includes only outstanding foreign currency denominated monetary items and adjusts their translation at the year end for a 10% change in foreign currency rates. The sensitivity analysis includes external loans as well as loans to foreign operations within the Group where the denomination of the loan is in a currency other than the currency of the lender or the borrower. A positive number below indicates an increase in profit and other equity where the functional currency strengthens 10% against the relevant foreign currency. For a 10% weakening of the functional currency against the relevant foreign currency, there would be a comparable impact on the profit and other equity, and the balances below would be negative.
Income statement Equity2020
$m2019
$m2020
$m2019
$m
10% change 194 636 194 636
In management’s opinion, a change in exchange rate of 10% of US Dollars against GBP, Euro or Australian Dollars would be offset against the foreign currency translation within equity. The table above therefore does not show the impact of the translation of foreign subsidiaries into presentational currency. A 10% change in US Dollars against GBP at year end would have an impact of $29m on equity, a 10% change in US Dollars against Euro at year end would have an impact of $7m on equity, and a 10% change in US Dollars against Australian Dollars at year end would have an impact of $103m on equity.
Interest rate risk managementThe Group is exposed to interest rate risk because entities in the Group borrow funds at floating interest rates. Hedging activities are evaluated regularly to align with interest rate views and a defined risk appetite, ensuring the most cost-effective hedging strategies are applied. The risk is managed through the use of interest rate swap contracts.

144 EG Group | 2020 Annual Report and Financial Statements
NOTES TO THE CONSOLIDATED FINANCIAL STATEMENTS CONTINUEDFor the year ended December 31, 2020
33. FINANCIAL INSTRUMENTS CONTINUED
Interest rate swap contractsUnder interest rate swap contracts, the Group exchanges the difference between fixed and floating rate interest amounts calculated on agreed notional principal amounts. Such contracts enable the Group to mitigate the earnings and cash flow risk of changing interest rates on the variable rate debt held. The fair value of interest rate swaps at the reporting date is determined by discounting the future cash flows using the curves at the reporting date and the credit risk inherent in the contract and is disclosed below. The average interest rate is based on the outstanding balances at the end of the financial year.
The following tables detail the notional principal amounts and remaining terms of interest rate swap contracts outstanding as at the reporting date:
OUTSTANDING RECEIVE FLOATING PAY FIXED CONTRACTS
Average contract fixed interest rate Notional principal value Fair value
2020%
2019%
2020$m
2019$m
2020$m
2019$m
Less than 1 year — — — — — —
1 to 2 years 5.5 — 20 — (2) —
2 to 5 years — 5.5 — 20 — (2)
5 years + — — — — — —
20 20 (2) (2)
The interest rate swaps settle on a quarterly basis. The floating rate on the interest rate swaps is three months LIBOR/EURIBOR. The Group will settle the difference between the fixed and floating interest rate on a net basis.
INTEREST RATE SENSITIVITY ANALYSISThe sensitivity analysis below has been determined based on the interest rate exposure for both derivative and non-derivative instruments at the balance sheet date. For floating rate liabilities, the analysis is prepared on the assumption that the liability outstanding at the balance sheet date was outstanding for the full year. A 100 basis point increase or decrease represents management’s assessment of a reasonably possible change in interest rates. If interest rates had been 100 basis points higher/lower and all other variables were held constant, the Group’s profit for the year would be impacted as follows:
2020$m
2019$m
Variable rate borrowings +/- 49 +/- 52
+/- 49 +/- 52
Credit risk managementCredit risk refers to the risk that a counterparty will default on its contractual obligations resulting in financial loss to the Group. Credit risk arises from cash and cash equivalents, deposits with banks and financial institutions, derivatives in an asset position, as well as credit exposures to wholesale and retail customers, including outstanding receivables and committed transactions. Sales to retail customers are settled in cash or using major credit cards. The Group has unsecured trade and other receivables of $540m (2019: $595m), reflecting its maximum exposure to credit risk. These receivables are normally settled when due and are spread across a number of counterparties so the likelihood of material losses arising as a result of this exposure is considered insignificant for the reasons set out below.
The Group’s trade receivable balances comprise a number of individually small amounts from unrelated customers, over a number of geographical areas. Concentration of risk is therefore limited.
The Group has adopted a policy of only dealing with creditworthy counterparties and obtaining sufficient collateral where appropriate, as a means of mitigating the risk of financial loss from defaults. The Group’s exposure and the credit ratings of its counterparties, taking into account the financial position of customers, past experience and other factors, are continuously monitored.
The Group has no significant concentration of credit risk. The credit risk on liquid funds and derivative financial instruments is limited because the counterparties are banks with high credit ratings assigned by international credit-rating agencies.

STRATEGIC REPORT GOVERNANCE FINANCIALS
145EG Group | 2020 Annual Report and Financial Statements
Liquidity risk managementUltimate responsibility for liquidity risk management rests with the Board of Directors, which has established an appropriate liquidity risk management framework for the management of the Group’s short, medium and long-term funding and liquidity management requirements. The Group manages liquidity risk by maintaining adequate reserves, banking facilities and reserve borrowing facilities, by continuously monitoring forecast and actual cash flows, and by matching the maturity profiles of financial assets and liabilities. Details of additional undrawn facilities that the Group has at its disposal to further reduce liquidity risk are set out on the following page.
Carrying amount
$m
1 year or less
$m
1 to <2 years
$m
2 to <5 years
$m5+ years
$m
Total contractual cash flows
$m
December 31, 2020
Non-derivative financial liabilities:
Trade and other payables (2,193) (1,689) (504) — — (2,193)
Lease liabilities (1,777) (205) (200) (547) (2,452) (3,404)
Fixed interest rate instruments (3,391) (208) (208) (3,905) — (4,321)
Variable interest rate instruments (6,271) (369) (369) (6,621) (346) (7,705)
(13,632) (2,471) (1,281) (11,073) (2,798) (17,623)
December 31, 2019
Non-derivative financial liabilities:
Trade and other payables (1,294) (1,286) (8) — — (1,294)
Finance lease liability (1,414) (165) (161) (153) (1,397) (1,876)
Fixed interest rate instruments (3,352) (210) (210) (581) (3,458) (4,459)
Variable interest rate instruments (6,129) (473) (352) (3,907) (2,380) (7,112)
(12,189) (2,134) (731) (4,641) (7,235) (14,741)
Liquidity risk tables The above tables detail the Group’s remaining contractual maturity for its non-derivative financial liabilities with agreed repayment periods. The tables have been drawn up based on the undiscounted cash flows of financial liabilities based on the earliest date on which the Group can be required to pay. The table includes both interest and principal cash flows. To the extent that interest flows are floating rate, the undiscounted amount is derived from interest rate curves at the balance sheet date. The contractual maturity is based on the earliest date on which the Group may be required to pay.
The following table details the Group’s liquidity analysis for its derivative financial instruments based on contractual maturities. The table has been drawn up based on the undiscounted net cash inflows and outflows on derivative instruments that settle on a net basis, and the undiscounted gross inflows and outflows on those derivatives that require gross settlement. When the amount payable or receivable is not fixed, the amount disclosed has been determined by reference to the projected interest rates or foreign exchange rates as illustrated by the yield curves existing at the reporting date.
Carrying amount
$m
1 year or less
$m
1 to <2 years
$m
2 to <5 years
$m5+ years
$m
Total contractual cash flows
$m
2020
Net settled:
Interest rate swaps (2) — (2) — — (2)
Forward fuel contracts 1 1 — — — 1
(1) 1 (2) — — (1)
2019
Net settled:
Interest rate swaps (2) — — (2) — (2)
Forward fuel contracts 2 2 — — — 2
— 2 — (2) — —

146 EG Group | 2020 Annual Report and Financial Statements
NOTES TO THE CONSOLIDATED FINANCIAL STATEMENTS CONTINUEDFor the year ended December 31, 2020
33. FINANCIAL INSTRUMENTS CONTINUEDLiquidity risk tables continuedFINANCING FACILITIES
2020$m
2019$m
Secured bank overdraft facility, reviewed annually and payable at call:
– amount used — 22
– amount unused 75 44
75 66
Secured revolving credit facilities maturing in 2022(1):
– amount used — 406
– amount unused 522 56
522 462
Secured term loan facilities maturing in 2025 and 2026:
– amount used 6,271 5,843
– amount unused — —
6,271 5,843
Secured loan notes maturing in 2024 and 2025:
– amount used 3,391 3,213
– amount unused — —
3,391 3,213
Letter of credit facilities maturing in 2022:
– amount used 464 468
– amount unused 158 174
622 642(1) Post year end the secured revolving credit facilities and the letter of credit facilities were renegotiated with extension out to 2024. The secured revolving
credit facilities have been decreased from $597m to $491m and the letter of credit facilities have been increased from $622m to $881m
Fair value measurementsThe information set out below provides information about how the Group determines fair values of various financial assets and financial liabilities.
The following table provides an analysis of financial instruments that are measured subsequent to initial recognition at fair value, grouped into Levels 1 to 3 based on the degree to which the fair value is observable:
• Level 1 fair value measurements are those derived from quoted prices (unadjusted) in active markets for identical assets or liabilities
• Level 2 fair value measurements are those derived from inputs other than quoted prices included within Level 1 that are observable for the asset or liability, either directly (i.e. as prices) or indirectly (i.e. derived from prices)
• Level 3 fair value measurements are those derived from valuation techniques that include inputs for the asset or liability that are not based on observable market data (unobservable inputs)

STRATEGIC REPORT GOVERNANCE FINANCIALS
147EG Group | 2020 Annual Report and Financial Statements
FAIR VALUE OF THE GROUP’S FINANCIAL ASSETS AND FINANCIAL LIABILITIES THAT ARE MEASURED AT FAIR VALUE ON A RECURRING BASISSome of the Group’s financial assets and financial liabilities are measured at fair value at the end of each reporting year. The following table gives information about how the fair values of these financial assets and financial liabilities are determined (in particular, the valuation techniques and inputs used).
Financial assets/financial liabilities
Fair value as at
Fair value hierarchy
Valuation technique(s) and key input(s)
Significantunobservable input(s)
Relationship of unobservableinputs to fairvalue
December 31, 2020
December 31,2019
1) Fuel purchase forwards
Assets – $1m Liabilities – $nil
Assets – $2m Liabilities – $nil
Level 2 Discounted cash flow. Future cash flows are estimated based on forward purchase prices (from observable forward purchase prices at the end of the reporting year) and contract forward rates, discounted at a rate that reflects the credit risk of various counterparties.
N/A N/A
2) Interest rate swaps
Assets – $nilLiabilities – $2m
Assets – $nil Liabilities – $2m
Level 2 Discounted cash flow. Future cash flows are estimated based on forward interest rates (from observable yield curves at the end of the reporting year) and contract interest rates, discounted at a rate that reflects the credit risk of various counterparties.
N/A N/A
3) Unquoted equity shares at FVTOCI(1)
Assets – $2m Liabilities – $nil
Assets – $2m Liabilities – $nil
Level 3 Discounted cash flow.Future cash flows are estimated using an income-based approach and discounted at the Group’s weighted average cost of capital (“WACC”).
Discount rate and future cash flow forecasts
A 1% increase/ (decrease) in the discount rate would result in a decrease/ (increase) in fair value of $nil
(1) The unquoted equity shares at FVTOCI financial asset included under Level 3 related to the Group’s non-controlling interest in Multi Tank Card B.V. in the Netherlands

148 EG Group | 2020 Annual Report and Financial Statements
NOTES TO THE CONSOLIDATED FINANCIAL STATEMENTS CONTINUEDFor the year ended December 31, 2020
33. FINANCIAL INSTRUMENTS CONTINUEDFair value measurements continued FAIR VALUE MEASUREMENTS RECOGNISED IN THE BALANCE SHEET
Fair value hierarchy as at December 31, 2020
Level 1$m
Level 2$m
Level 3$m
Total$m
Unquoted equity shares at FVTOCI
Unquoted equities — — 2 2
Total — — 2 2
Financial assets/liabilities at FVTPL
Derivative financial assets — 1 — 1
Derivative financial liabilities — (2) — (2)
Total — (1) — (1)
Fair value hierarchy as at December 31, 2019
Level 1$m
Level 2$m
Level 3$m
Total$m
Unquoted equity shares at FVTOCI
Unquoted equities — — 2 2
Total — — 2 2
Financial assets/liabilities at FVTPL
Derivative financial assets — 2 — 2
Derivative financial liabilities — (2) — (2)
Total — — — —
There were no transfers between Level 1 and Level 2 during the current year or prior year.
Fair value gains and losses for derivative financial assets and liabilities are included within finance income and finance costs in the income statement.
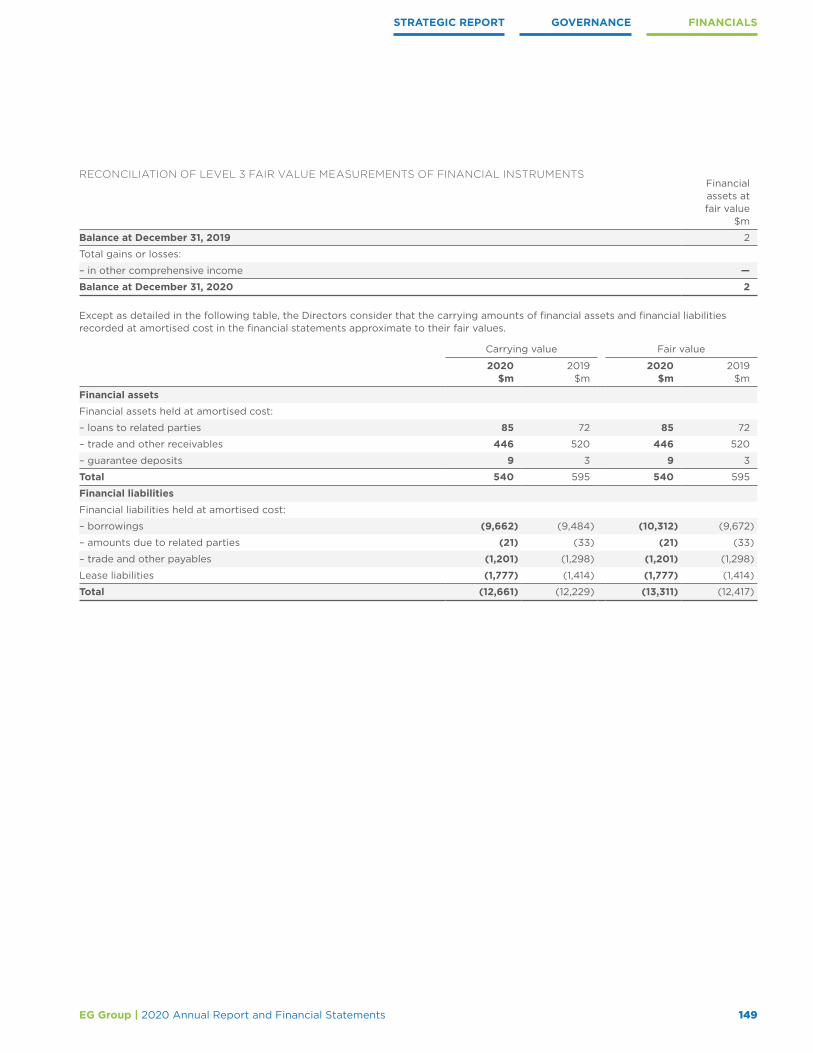
STRATEGIC REPORT GOVERNANCE FINANCIALS
149EG Group | 2020 Annual Report and Financial Statements
RECONCILIATION OF LEVEL 3 FAIR VALUE MEASUREMENTS OF FINANCIAL INSTRUMENTSFinancial assets at fair value
$m
Balance at December 31, 2019 2
Total gains or losses:
– in other comprehensive income —
Balance at December 31, 2020 2
Except as detailed in the following table, the Directors consider that the carrying amounts of financial assets and financial liabilities recorded at amortised cost in the financial statements approximate to their fair values.
Carrying value Fair value
2020$m
2019 $m
2020$m
2019$m
Financial assets
Financial assets held at amortised cost:
– loans to related parties 85 72 85 72
– trade and other receivables 446 520 446 520
– guarantee deposits 9 3 9 3
Total 540 595 540 595
Financial liabilities
Financial liabilities held at amortised cost:
– borrowings (9,662) (9,484) (10,312) (9,672)
– amounts due to related parties (21) (33) (21) (33)
– trade and other payables (1,201) (1,298) (1,201) (1,298)
Lease liabilities (1,777) (1,414) (1,777) (1,414)
Total (12,661) (12,229) (13,311) (12,417)

150 EG Group | 2020 Annual Report and Financial Statements
NOTES TO THE CONSOLIDATED FINANCIAL STATEMENTS CONTINUEDFor the year ended December 31, 2020
34. BUSINESS COMBINATIONS 2020 acquisitionsUK On March 10, 2020, the Group acquired 100% of the issued share capital of the largest KFC franchise in the UK & Ireland from Belfast-headquartered The Herbert Group. The acquisition consists of 145 KFC restaurants and one Pizza Hut. This acquisition increases the Group’s Foodservice presence in the UK & Ireland.
Fair value of assets and liabilities The amounts recognised in respect of the identifiable assets acquired and liabilities assumed are as set out in the table below. The exercise to determine the fair value of the acquired assets and liabilities is complete.
Note $m
Property, plant and equipment i. 64
Intangible assets ii. 2
Right of use assets iii. 139
Inventories 2
Cash and cash equivalents 6
Trade and other receivables iv. 3
Trade and other payables (20)
Provisions (15)
Deferred tax liabilities (2)
Lease liabilities iii. (137)
Total identifiable assets 42
Goodwill v. 118
Total consideration 160
Satisfied by:
Cash 174
Working capital adjustment (14)
160
Net cash outflow arising on acquisition:
Cash consideration (174)
Less: cash and cash equivalent balances acquired 6
Less: working capital adjustment 14
(154)
i) The fair value of the acquired property, plant and equipment was determined following an external valuation
ii) The fair value of intangible assets of $2m relates to capitalised franchise fees
iii) Represents the fair value of lease right of use assets and lease liabilities on acquisition
iv) The fair value of the acquired receivables is equal to the gross contractual amounts receivable
v) The goodwill arising on acquisition of $118m reflects the fact that the value of the acquired business is based on its existing cash-generating potential rather than its existing assets and that many of its strengths, such as scale and location, do not represent intangible assets as defined by IFRS
Transaction costs of $1.0m relating to stamp duty, professional and legal fees have been recognised as exceptional administrative expenses in the income statement.
The results of the Herbert Group business have been consolidated from March 10, 2020, contributing $172m of revenue and $7m profit after tax between the date of acquisition and December 31, 2020.

STRATEGIC REPORT GOVERNANCE FINANCIALS
151EG Group | 2020 Annual Report and Financial Statements
USA On December 31, 2020, the Group completed the acquisition of the trade and assets that constitute the business of Schrader Oil, comprising their 18-site network in Northern Colorado, USA, for purchase consideration of $51m. The acquisition forms part of the Group’s core growth strategy and enabled the Group to further expand into the USA market.
Fair value of assets and liabilities The amounts recognised in respect of the identifiable assets acquired and liabilities assumed are as set out in the table below. The finalisation of the fair value of the acquired assets and liabilities is now complete.
Note $m
Property, plant and equipment i. 29
Inventories 2
Trade and other payables (1)
Provisions (1)
Total identifiable assets 29
Goodwill ii. 22
Total consideration 51
Satisfied by:
Cash 51
Net cash outflow arising on acquisition:
Cash consideration (51)
i) The fair value of the acquired property, plant and equipment was determined following an external valuation
ii) The goodwill arising on acquisition of $22m reflects the Group’s core USA growth strategy and desire to further enhance our presence in the USA market. There are also significant synergies available between the Group and acquired entities. None of the goodwill is expected to be deductible for tax purposes
As the acquisition of Schrader Oil was completed on December 31, 2020, no contribution has been included in the 2020 financial results.
2020 other acquisitionsOn October 1, 2020, the Group completed the acquisition of all shares of The Spicy Company BV and The Tasty Company BV, comprising two trading sites in the Netherlands. As part of this acquisition, net assets of $1m were acquired for consideration of $3m, generating goodwill of $2m.
Had all of the 2020 acquisitions taken place at the start of the financial year, the consolidated revenue would have been $312m and consolidated profit after tax would have been $16m.

152 EG Group | 2020 Annual Report and Financial Statements
NOTES TO THE CONSOLIDATED FINANCIAL STATEMENTS CONTINUEDFor the year ended December 31, 2020
34. BUSINESS COMBINATIONS CONTINUED2019 acquisitionsAUSTRALIAOn April 1, 2019, the Group acquired 100% of the share capital of the Woolworths petrol business (‘Fuelco’), comprising 537 fuel c-stores sites across Australia. The acquisition forms part of the Group’s core growth strategy and enabled the Group to enter the Australian and Asia-Pacific market.
Fair value of assets and liabilities The amounts recognised in respect of the identifiable assets acquired and liabilities assumed are as set out in the table below. The finalisation of the fair value of the acquired assets and liabilities is now complete.
Note $m
Property, plant and equipment i. 373
Intangible assets ii. 299
Right of use assets iii. 476
Deferred tax asset 297
Inventories 73
Cash and cash equivalents 10
Trade and other receivables 8
Trade and other payables (138)
Provisions iv. (421)
Deferred tax liabilities (249)
Lease liabilities iii. (475)
Total identifiable assets 253
Goodwill v. 953
Total consideration 1,206
Satisfied by:
Cash 1,206
Net cash outflow arising on acquisition:
Cash consideration (1,206)
Less: cash and cash equivalent balances acquired 10
(1,196)
i) The fair value of the acquired property, plant and equipment was determined following an external valuation
ii) The fair value of intangible assets of $299m relates to the 15-year Woolworths redemption agreement
iii) Represents the fair value of lease right of use assets and lease liabilities on acquisition
iv) Represents provisions for obligations to dismantle or restore leased sites, environmental remediation obligations and an onerous customer loyalty programme with Woolworths and unfavourable fuel supply contract
v) The goodwill arising on acquisition of $953m reflects the Group’s core growth strategy and desire for further geographical diversification. There are also significant synergies available between the Group and acquired entities. None of the goodwill is expected to be deductible for income tax purposes
Transaction costs of $40m relating to stamp duty, professional and legal fees were recognised as administrative expenses in the income statement. These were separately presented as exceptional costs as detailed in note 3.

STRATEGIC REPORT GOVERNANCE FINANCIALS
153EG Group | 2020 Annual Report and Financial Statements
FASTRAC On July 1, 2019, the Group completed the acquisition of the trade and assets which constitute a business of Fastrac Markets, LLC, comprising their 71-site network in the USA, for purchase consideration of $273m. The acquisition forms part of the Group’s core growth strategy and enabled the Group to further expand into the USA market.
Fair value of assets and liabilities The amounts recognised in respect of the identifiable assets acquired and liabilities assumed are as set out in the table below. The finalisation of the fair value of the acquired assets and liabilities is now complete.
Note $m
Property, plant and equipment i. 101
Intangible assets ii. 3
Right of use assets iii. 3
Inventories 7
Trade and other receivables 3
Lease liabilities iii. (2)
Trade and other payables (1)
Provisions (5)
Total identifiable assets 109
Goodwill iv. 164
Total consideration 273
Satisfied by:
Cash 273
Net cash outflow arising on acquisition:
Cash consideration (273)
Less: cash and cash equivalent balances acquired —
(273)
i) The fair value of the acquired property, plant and equipment was determined following an external valuation
ii) The fair value of intangible assets includes $3m related to the acquired trade name of ‘Fastrac’ reflecting the future economic benefit expected to be realised
iii) Represents the fair value of lease right of use assets and lease liabilities on acquisition
iv) The goodwill arising on acquisition of $164m reflects the Group’s core USA growth strategy and desire to further enhance our presence in the USA market. There are also significant synergies available between the Group and acquired entities. None of the goodwill is expected to be deductible for income tax purposes
The results of the Fastrac business have been consolidated from July 1, 2019, contributing $206m of revenue and $8m profit after tax between the date of acquisition and December 31, 2019.

154 EG Group | 2020 Annual Report and Financial Statements
NOTES TO THE CONSOLIDATED FINANCIAL STATEMENTS CONTINUEDFor the year ended December 31, 2020
34. BUSINESS COMBINATIONS CONTINUED2019 acquisitions continuedCERTIFIED OILOn August 1, 2019, the Group completed the acquisition of 100% of the share capital of Certified Oil Company, Inc. for total consideration of $163m. The company owns and operates 69 sites in the USA. The acquisition forms part of the Group’s core growth strategy and enabled the Group to further expand into the USA market.
Fair value of assets and liabilities The amounts recognised in respect of the identifiable assets acquired and liabilities assumed are as set out in the table below. The exercise to determine the fair value of the acquired assets and liabilities is now complete.
Note $m
Property, plant and equipment i. 45
Intangible assets ii. 4
Right of use assets iii. 4
Inventories 8
Cash and cash equivalents 1
Trade and other receivables 7
Lease liability iii. (5)
Trade and other payables (21)
Provisions iv. (5)
Total identifiable assets 38
Goodwill v. 125
Total consideration 163
Satisfied by:
Cash 156
Contingent consideration 7
Total 163
Net cash outflow arising on acquisition:
Cash consideration (156)
Less: cash and cash equivalent balances acquired 1
(155)
i) The fair value of the acquired property, plant and equipment was determined following an external valuation
ii) The fair value of intangible assets includes $4m related to the acquired trade name of ‘Certified Oil’, reflecting the future economic benefit expected to be realised
iii) Represents the fair value of lease right of use assets and lease liabilities on acquisition
iv) Represents provisions for obligations to dismantle or restore leased sites and environmental remediation obligations
v) The goodwill arising on acquisition of $125m reflects the Group’s core USA growth strategy and desire to further enhance our presence in the USA market. There are also significant synergies available between the Group and acquired entities. None of the goodwill is expected to be deductible for income tax purposes
Transaction costs of $1m relating to professional and legal fees have been recognised as administrative expenses in the income statement. These have been separately presented as exceptional costs as detailed in note 3.
The results of the business have been consolidated from August 1, 2019, contributing $100m of revenue and $1m of profit after tax between the date of acquisition and December 31, 2019.

STRATEGIC REPORT GOVERNANCE FINANCIALS
155EG Group | 2020 Annual Report and Financial Statements
CUMBERLAND FARMSOn October 22, 2019, the Group completed the acquisition of 100% of the share capital of Cumberland Farms, Inc in the USA for $2,288m. Cumberland Farms, Inc operates 567 Grocery & Merchandise sites and fuel stations across seven north-east states and Florida. The acquisition forms part of the Group’s core USA growth strategy and enabled the Group to further expand into the USA market.
Fair value of assets and liabilities The amounts recognised in respect of the identifiable assets acquired and liabilities assumed are as set out in the table below. The exercise to determine the fair value of the acquired assets and liabilities is complete, however this will continue to be reviewed within the twelve-month post-acquisition measurement period and therefore remains provisional at the date of approval of these financial statements.
Note $m
Property, plant and equipment i. 1,035
Intangible assets ii. 348
Right of use assets iii. 203
Inventories 126
Cash and cash equivalents 138
Trade and other receivables iv. 35
Derivatives 2
Assets held for sale 12
Deferred tax liabilities (256)
Trade and other payables (161)
Provisions v. (73)
Lease liabilities iii. (199)
Income tax liability (1)
Total identifiable assets 1,209
Goodwill vi. 1,079
Total consideration 2,288
Satisfied by:
Cash 2,288
Net cash outflow arising on acquisition:
Cash consideration (2,288)
Less: cash and cash equivalent balances acquired 138
(2,150)
i) The fair value of the acquired property, plant and equipment was determined following an external valuation
ii) The fair value of intangible assets includes $348m related to the acquired trade name and intangible software
iii) Represents the fair value of lease right of use assets and lease liabilities on acquisition
iv) The fair value of the acquired receivables is equal to the gross contractual amounts receivable
v) Represents provisions for obligations to dismantle or restore leased sites and environmental remediation obligations
vi) The goodwill arising on acquisition of $1,079m reflects the Group’s core USA growth strategy and desire to further enhance our presence in the USA market. There are also significant synergies available between the Group and acquired entities. None of the goodwill is expected to be deductible for income tax purposes
Transaction costs of $4m relating to professional and legal fees have been recognised as administrative expenses in the income statement. These have been separately presented as exceptional costs as detailed in note 3.
The results of the Cumberland Farms business have been consolidated from October 22, 2019, contributing $772m of revenue and $15m of profit after tax between the date of acquisition and December 31, 2019.
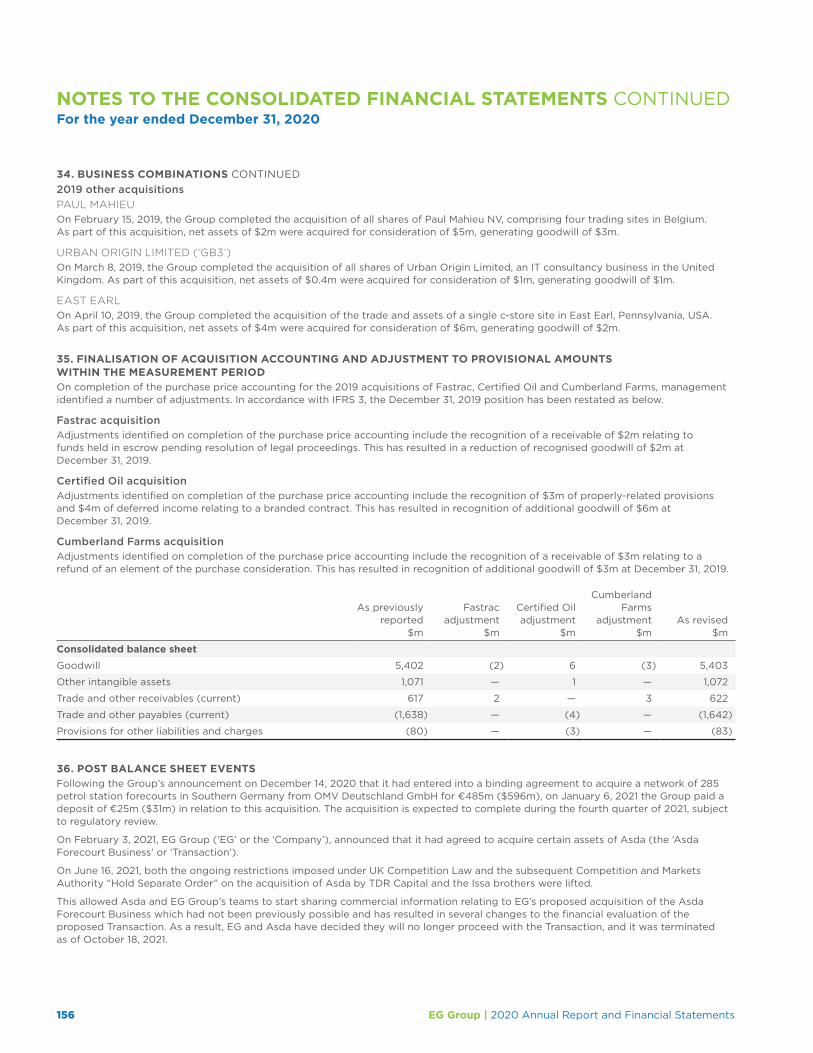
156 EG Group | 2020 Annual Report and Financial Statements
NOTES TO THE CONSOLIDATED FINANCIAL STATEMENTS CONTINUEDFor the year ended December 31, 2020
34. BUSINESS COMBINATIONS CONTINUED 2019 other acquisitionsPAUL MAHIEUOn February 15, 2019, the Group completed the acquisition of all shares of Paul Mahieu NV, comprising four trading sites in Belgium. As part of this acquisition, net assets of $2m were acquired for consideration of $5m, generating goodwill of $3m.
URBAN ORIGIN LIMITED (‘GB3’)On March 8, 2019, the Group completed the acquisition of all shares of Urban Origin Limited, an IT consultancy business in the United Kingdom. As part of this acquisition, net assets of $0.4m were acquired for consideration of $1m, generating goodwill of $1m.
EAST EARL On April 10, 2019, the Group completed the acquisition of the trade and assets of a single c-store site in East Earl, Pennsylvania, USA. As part of this acquisition, net assets of $4m were acquired for consideration of $6m, generating goodwill of $2m.
35. FINALISATION OF ACQUISITION ACCOUNTING AND ADJUSTMENT TO PROVISIONAL AMOUNTS WITHIN THE MEASUREMENT PERIOD On completion of the purchase price accounting for the 2019 acquisitions of Fastrac, Certified Oil and Cumberland Farms, management identified a number of adjustments. In accordance with IFRS 3, the December 31, 2019 position has been restated as below.
Fastrac acquisitionAdjustments identified on completion of the purchase price accounting include the recognition of a receivable of $2m relating to funds held in escrow pending resolution of legal proceedings. This has resulted in a reduction of recognised goodwill of $2m at December 31, 2019.
Certified Oil acquisitionAdjustments identified on completion of the purchase price accounting include the recognition of $3m of properly-related provisions and $4m of deferred income relating to a branded contract. This has resulted in recognition of additional goodwill of $6m at December 31, 2019.
Cumberland Farms acquisitionAdjustments identified on completion of the purchase price accounting include the recognition of a receivable of $3m relating to a refund of an element of the purchase consideration. This has resulted in recognition of additional goodwill of $3m at December 31, 2019.
As previouslyreported
$m
Fastracadjustment
$m
Certified Oiladjustment
$m
CumberlandFarms
adjustment $m
As revised $m
Consolidated balance sheet
Goodwill 5,402 (2) 6 (3) 5,403
Other intangible assets 1,071 — 1 — 1,072
Trade and other receivables (current) 617 2 — 3 622
Trade and other payables (current) (1,638) — (4) — (1,642)
Provisions for other liabilities and charges (80) — (3) — (83)
36. POST BALANCE SHEET EVENTSFollowing the Group’s announcement on December 14, 2020 that it had entered into a binding agreement to acquire a network of 285 petrol station forecourts in Southern Germany from OMV Deutschland GmbH for €485m ($596m), on January 6, 2021 the Group paid a deposit of €25m ($31m) in relation to this acquisition. The acquisition is expected to complete during the fourth quarter of 2021, subject to regulatory review.
On February 3, 2021, EG Group (‘EG’ or the ‘Company’), announced that it had agreed to acquire certain assets of Asda (the ‘Asda Forecourt Business’ or ‘Transaction’).
On June 16, 2021, both the ongoing restrictions imposed under UK Competition Law and the subsequent Competition and Markets Authority “Hold Separate Order” on the acquisition of Asda by TDR Capital and the Issa brothers were lifted.
This allowed Asda and EG Group’s teams to start sharing commercial information relating to EG’s proposed acquisition of the Asda Forecourt Business which had not been previously possible and has resulted in several changes to the financial evaluation of the proposed Transaction. As a result, EG and Asda have decided they will no longer proceed with the Transaction, and it was terminated as of October 18, 2021.

STRATEGIC REPORT GOVERNANCE FINANCIALS
157EG Group | 2020 Annual Report and Financial Statements
On February 8, 2021 the Group purchased interest bearing debt instruments for £160m ($220m). The asset is recognised at amortised cost.
On February 26, 2021, the Group negotiated the private placement at par of £675m ($953m) in aggregate principal amount of 6.25% Senior Secured Notes due 2026. The proceeds were intended to fund the Group’s acquisitions of the Asda Forecourt Business. As a consequence of the termination of the agreement to acquire the Asda Forecourt Business on October 18, 2021, the Group initiated a process, also on October 18, 2021, to redeem the £675m ($953m) in aggregate principal amount of 6.25% Senior Secured Notes due 2026 issued on February 26, 2021 and unwind the related escrow arrangement. This redemption process completed on October 26, 2021.
On March 11, 2021, the Group allocated $510m in aggregate principal amount of additional loans due 2026 under a new Term B Facility (issue price 99%, spread L+425 bps, LIBOR floor 0.5%) and €610m ($726m) in aggregate principal amount of additional loans due 2027 under a new Second Lien Facility (issue price 99%, spread E+700 bps, EURIBOR floor 0%). The proceeds were used to pay related fees and expenses and to refinance an existing bilateral bridge facility and the existing second lien facilities in full. The remaining funds will be used to fund the acquisition of OMV’s German forecourts. As part of the financing process, the Group also secured an increase in its committed letter of credit (“LC”) facilities by $240m and an extension to the maturity of RCF and LC facilities to 2024.
On March 18, 2021 the Group acquired KMS Autohof-Betriebsgesellschaft GmbH in Germany. The acquisition consisted of ten petrol filling stations, six Burger King restaurants and ten gaming halls. As part of the acquisition of 100% of the share capital of KMS Autohof-Betriebsgesellschaft GmbH and its two subsidiaries, provisional net assets of €4m ($5m) were acquired for consideration of €9m ($11m). At the date of approval of these financial statements, due to the proximity of the acquisition to the reporting date, a fair value exercise has not yet been completed, and so these values remain provisional.
On May 9, 2021 the Group acquired LEON Restaurants. The fast food chain has a network of over 70 restaurants in the UK, with a limited number located in Europe. As part of the acquisition of 100% of the share capital of LEON Restaurants Ltd and its subsidiaries, provisional net liabilities of £6m ($9m) were acquired for consideration of £84m ($118m). At the date of approval of these financial statements, due to the proximity of the acquisition to the reporting date, a fair value exercise has not yet been completed, and so these values remain provisional.
On June 1, 2021 the Group completed the acquisition of assets from Mercury Fuel Service, Inc at eight leased locations in Connecticut. Provisional net assets of $13m were acquired for consideration of $34m. At the date of approval of these financial statements, due to the proximity of the acquisition to the reporting date, a fair value exercise has not yet been completed, and so these values remain provisional.
In June 2021, the Group advanced $71m as a related party loan to Optima Bidco (Jersey) Limited, the ultimate parent Company of the Group in order for them to meet their obligations to preference shareholders. The loan has been provided at rates comparable with commercial rates of interest.
On September 26, 2021 the Group completed the acquisition of 100% of the shares in Amsric Foods Limited (now renamed Pollo Limited), together with its wholly owned subsidiary, Harland South Limited, and associated freehold property for total consideration of £120m ($164m), of which £15m ($21m) related to the acquisition of eleven freehold and three long leasehold properties from which the acquired KFC restaurants trade, from ADR Properties Limited. The acquired network consists of 52 KFC restaurants across the south and south-west of the UK, and a mix of drive-thru and traditional restaurant formats.
On October 2, 2021, the Group acquired CS Food Group Holdings Limited (‘Cooplands’) for a total consideration of £72m ($97m). Cooplands own and operates bakery assets in the United Kingdom (UK), including three bakeries that process ingredients and manufacture fresh food distributed through its supply and logistics network to c.180 stores and cafes, predominantly across the north-east and Yorkshire regions.
On October 5, 2021, the Group announced it had entered into a binding agreement to divest 27 petrol filling stations (“PFS”), located throughout the UK, to Park Garage Group for proceeds of £90m ($122m). This follows the CMA’s announcement in June 2021 that it had agreed formal undertakings offered by Mohsin Issa, Zuber Issa and TDR Capital LLP to divest some of EG Group’s PFS sites to address the competition concerns relating to their separate acquisition of Asda Group Limited (‘Asda’). The 27 sites include 26 sites required by the CMA to be divested, plus one other non-core location.
On October 23, 2021, the Group concluded negotiations to acquire 34 convenience stores and two development sites in the USA for gross consideration of $278m. The transaction was effective from October 30, 2021, is subject to regulatory approvals, and is expected to complete by the end of 2021.
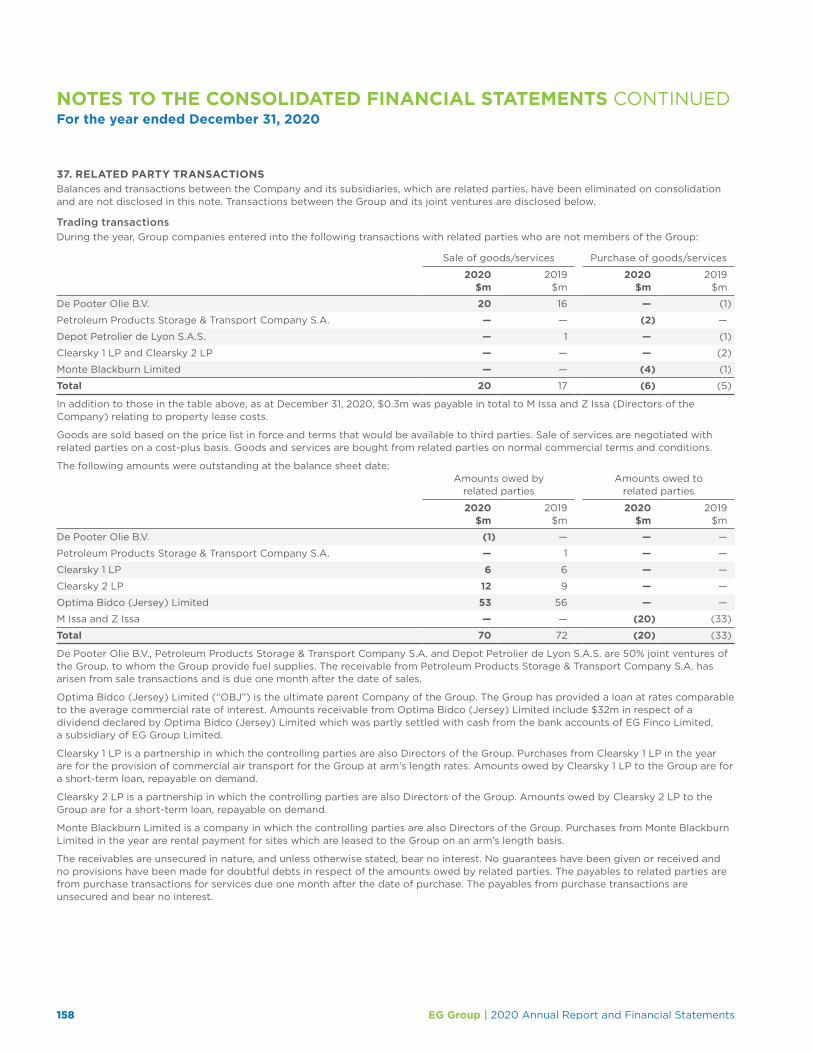
158 EG Group | 2020 Annual Report and Financial Statements
NOTES TO THE CONSOLIDATED FINANCIAL STATEMENTS CONTINUEDFor the year ended December 31, 2020
37. RELATED PARTY TRANSACTIONSBalances and transactions between the Company and its subsidiaries, which are related parties, have been eliminated on consolidation and are not disclosed in this note. Transactions between the Group and its joint ventures are disclosed below.
Trading transactionsDuring the year, Group companies entered into the following transactions with related parties who are not members of the Group:
Sale of goods/services Purchase of goods/services
2020$m
2019$m
2020$m
2019$m
De Pooter Olie B.V. 20 16 — (1)
Petroleum Products Storage & Transport Company S.A. — — (2) —
Depot Petrolier de Lyon S.A.S. — 1 — (1)
Clearsky 1 LP and Clearsky 2 LP — — — (2)
Monte Blackburn Limited — — (4) (1)
Total 20 17 (6) (5)
In addition to those in the table above, as at December 31, 2020, $0.3m was payable in total to M Issa and Z Issa (Directors of the Company) relating to property lease costs.
Goods are sold based on the price list in force and terms that would be available to third parties. Sale of services are negotiated with related parties on a cost-plus basis. Goods and services are bought from related parties on normal commercial terms and conditions.
The following amounts were outstanding at the balance sheet date:Amounts owed by
related partiesAmounts owed to
related parties
2020$m
2019$m
2020$m
2019$m
De Pooter Olie B.V. (1) — — —
Petroleum Products Storage & Transport Company S.A. — 1 — —
Clearsky 1 LP 6 6 — —
Clearsky 2 LP 12 9 — —
Optima Bidco (Jersey) Limited 53 56 — —
M Issa and Z Issa — — (20) (33)
Total 70 72 (20) (33)
De Pooter Olie B.V., Petroleum Products Storage & Transport Company S.A. and Depot Petrolier de Lyon S.A.S. are 50% joint ventures of the Group, to whom the Group provide fuel supplies. The receivable from Petroleum Products Storage & Transport Company S.A. has arisen from sale transactions and is due one month after the date of sales.
Optima Bidco (Jersey) Limited (“OBJ”) is the ultimate parent Company of the Group. The Group has provided a loan at rates comparable to the average commercial rate of interest. Amounts receivable from Optima Bidco (Jersey) Limited include $32m in respect of a dividend declared by Optima Bidco (Jersey) Limited which was partly settled with cash from the bank accounts of EG Finco Limited, a subsidiary of EG Group Limited.
Clearsky 1 LP is a partnership in which the controlling parties are also Directors of the Group. Purchases from Clearsky 1 LP in the year are for the provision of commercial air transport for the Group at arm’s length rates. Amounts owed by Clearsky 1 LP to the Group are for a short-term loan, repayable on demand.
Clearsky 2 LP is a partnership in which the controlling parties are also Directors of the Group. Amounts owed by Clearsky 2 LP to the Group are for a short-term loan, repayable on demand.
Monte Blackburn Limited is a company in which the controlling parties are also Directors of the Group. Purchases from Monte Blackburn Limited in the year are rental payment for sites which are leased to the Group on an arm’s length basis.
The receivables are unsecured in nature, and unless otherwise stated, bear no interest. No guarantees have been given or received and no provisions have been made for doubtful debts in respect of the amounts owed by related parties. The payables to related parties are from purchase transactions for services due one month after the date of purchase. The payables from purchase transactions are unsecured and bear no interest.
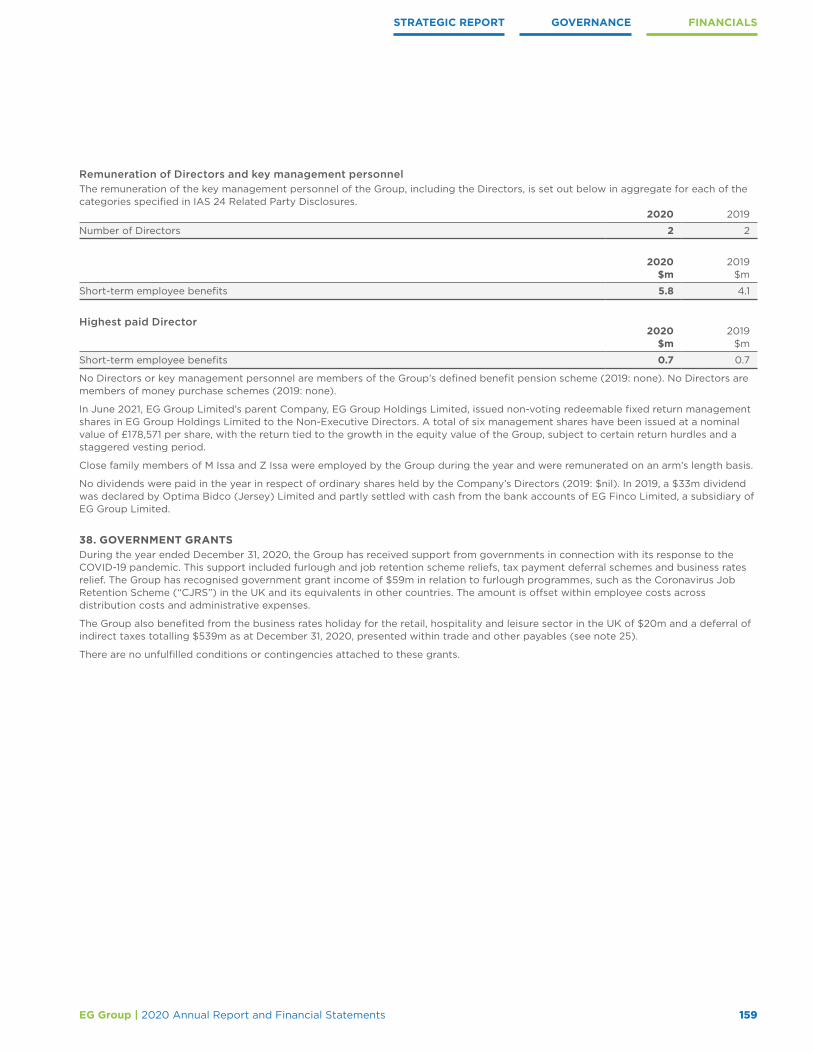
STRATEGIC REPORT GOVERNANCE FINANCIALS
159EG Group | 2020 Annual Report and Financial Statements
Remuneration of Directors and key management personnelThe remuneration of the key management personnel of the Group, including the Directors, is set out below in aggregate for each of the categories specified in IAS 24 Related Party Disclosures.
2020 2019
Number of Directors 2 2
2020$m
2019$m
Short-term employee benefits 5.8 4.1
Highest paid Director2020
$m2019
$m
Short-term employee benefits 0.7 0.7
No Directors or key management personnel are members of the Group’s defined benefit pension scheme (2019: none). No Directors are members of money purchase schemes (2019: none).
In June 2021, EG Group Limited’s parent Company, EG Group Holdings Limited, issued non-voting redeemable fixed return management shares in EG Group Holdings Limited to the Non-Executive Directors. A total of six management shares have been issued at a nominal value of £178,571 per share, with the return tied to the growth in the equity value of the Group, subject to certain return hurdles and a staggered vesting period.
Close family members of M Issa and Z Issa were employed by the Group during the year and were remunerated on an arm’s length basis.
No dividends were paid in the year in respect of ordinary shares held by the Company’s Directors (2019: $nil). In 2019, a $33m dividend was declared by Optima Bidco (Jersey) Limited and partly settled with cash from the bank accounts of EG Finco Limited, a subsidiary of EG Group Limited.
38. GOVERNMENT GRANTS During the year ended December 31, 2020, the Group has received support from governments in connection with its response to the COVID-19 pandemic. This support included furlough and job retention scheme reliefs, tax payment deferral schemes and business rates relief. The Group has recognised government grant income of $59m in relation to furlough programmes, such as the Coronavirus Job Retention Scheme (“CJRS”) in the UK and its equivalents in other countries. The amount is offset within employee costs across distribution costs and administrative expenses.
The Group also benefited from the business rates holiday for the retail, hospitality and leisure sector in the UK of $20m and a deferral of indirect taxes totalling $539m as at December 31, 2020, presented within trade and other payables (see note 25).
There are no unfulfilled conditions or contingencies attached to these grants.
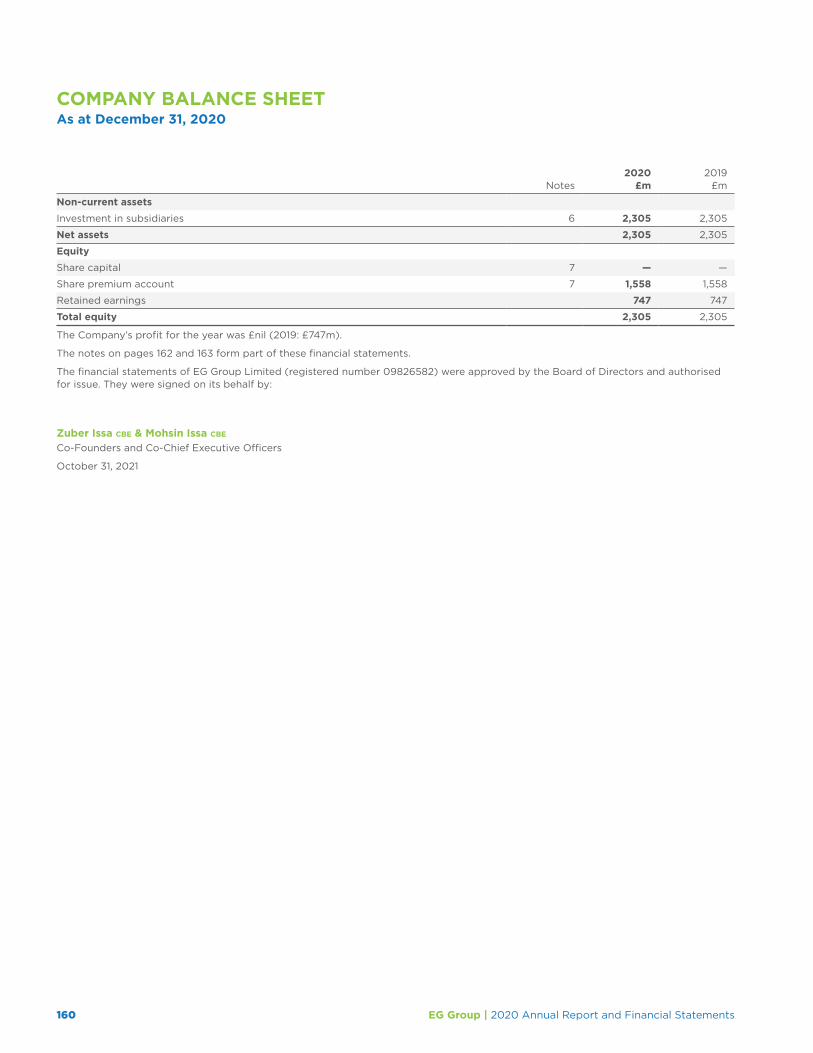
160 EG Group | 2020 Annual Report and Financial Statements
COMPANY BALANCE SHEETAs at December 31, 2020
Notes2020
£m2019
£m
Non-current assets
Investment in subsidiaries 6 2,305 2,305
Net assets 2,305 2,305
Equity
Share capital 7 — —
Share premium account 7 1,558 1,558
Retained earnings 747 747
Total equity 2,305 2,305
The Company’s profit for the year was £nil (2019: £747m).
The notes on pages 162 and 163 form part of these financial statements.
The financial statements of EG Group Limited (registered number 09826582) were approved by the Board of Directors and authorised for issue. They were signed on its behalf by:
Zuber Issa cbe & Mohsin Issa cbe
Co-Founders and Co-Chief Executive Officers
October 31, 2021

STRATEGIC REPORT GOVERNANCE FINANCIALS
161EG Group | 2020 Annual Report and Financial Statements
COMPANY STATEMENT OF CHANGES IN EQUITYAs at December 31, 2020
Share capital
£m
Share premium
£m
Retained earnings
£m
Total equity
£m
Balance at December 31, 2018 — 1,212 — 1,212
Issue of share capital — 346 — 346
Profit for the year — — 747 747
Balance at December 31, 2019 — 1,558 747 2,305
Balance at December 31, 2020 — 1,558 747 2,305

162 EG Group | 2020 Annual Report and Financial Statements
NOTES TO THE COMPANY FINANCIAL STATEMENTSFor the year ended December 31, 2020
1. GENERAL INFORMATIONThe principal activity of EG Group Limited (the ‘Company’) is as a holding company. The Company is incorporated and domiciled in the United Kingdom. The Company is a private company limited by shares and is registered in England and Wales, and the address of the registered office is Waterside Head Office, Haslingden Road, Guide, Blackburn, Lancashire, BB1 2FA, United Kingdom.
2. BASIS OF PREPARATION The separate financial statements of the Company have been prepared on the historical cost basis, in accordance with Financial Reporting Standard 101 Reduced Disclosure Framework (“FRS 101”) and are presented as required by the Companies Act 2006.
The Company meets the definition of a qualifying entity under FRS 100 Application of Financial Reporting Requirements as issued by the Financial Reporting Council.
As permitted by FRS 101, the Company has taken advantage of the disclosure exemptions available under that standard in relation to financial instruments, capital management, presentation of comparative information in respect of certain assets, presentation of a cash flow statement, standards not yet effective, impairment of assets and related party transactions. Where relevant, equivalent disclosures have been given in the Group accounts.
The Company’s financial statements are presented in Pounds Sterling, its functional currency, rounded to the nearest million.
The Directors have taken advantage of the exemption available under Section 408 of the Companies Act and not presented an income statement or a statement of comprehensive income for the Company alone.
3. SIGNIFICANT ACCOUNTING POLICIESBasis of accountingThe principal accounting policies adopted are the same as those set out in note 3 to the consolidated financial statements except as noted below.
InvestmentsInvestments in subsidiaries are stated at cost less, where appropriate, provisions for impairment.
Financial guarantees of subsidiary obligationsThe Company has provided financial guarantees in respect of the borrowings of certain subsidiaries. These are accounted for under IFRS 4 (rather than IFRS 9) as the Company regards such contracts as insurance for the lender against default by the borrower.
4. SIGNIFICANT ACCOUNTING JUDGEMENTS AND KEY SOURCES OF ESTIMATION UNCERTAINTYIn the application of the Company’s accounting policies, the Directors are required to make judgements, estimates and assumptions about the carrying amounts of assets and liabilities that are not readily apparent from other sources. The estimates and associated assumptions are based on historical experience and other factors that are considered to be relevant. Actual results may differ from these estimates.
The estimates and underlying assumptions are reviewed on an ongoing basis. Revisions to accounting estimates are recognised in the period in which the estimate is revised if the revision affects only that period, or in the period of the revision and future periods if the revision affects both current and future periods.
There are no significant accounting judgements applied in preparation of the Company’s financial statements.
Key sources of estimation uncertaintyThe key assumptions concerning the future, and other key sources of estimation uncertainty at the balance sheet date, that have a significant risk of causing a material adjustment to the carrying amounts of assets and liabilities within the next financial year, are discussed below.
Impairment of investments The carrying amounts of the Company’s investments are reviewed at each reporting date to determine whether there is any indication of impairment in accordance with the accounting policy set out in note 3 of the consolidated financial statements. Note 15 in the consolidated financial statements details the assumptions used together with an analysis of the sensitivity to changes in key assumptions.

STRATEGIC REPORT GOVERNANCE FINANCIALS
163EG Group | 2020 Annual Report and Financial Statements
5. INFORMATION REGARDING DIRECTORS, EMPLOYEES AND AUDITOR’S REMUNERATIONThere were no employees other than the Directors during the current year (2019: none). None of the Directors received any emolument in respect of their services as Directors of the Company.
The auditor’s remuneration for the audit and other services is disclosed in note 10 to the consolidated financial statements.
6. INVESTMENT IN SUBSIDIARIES£m
Cost and net book value
On December 31, 2019 2,305
On December 31, 2020 2,305
Details of the Company’s direct subsidiaries at December 31, 2020 are as follows:
Name
Place ofincorporation(or registration)and operation
Proportion of ownership
interest%
Proportion ofvoting
power held%
EG Finco Limited(1) UK 100 100
EG AsiaPac Limited(1) UK 100 100
EG America, LLC(2) USA 100 100(1) Registered address: Waterside Head Office, Haslingden Road, Guide, Blackburn, Lancashire, BB1 2FA, United Kingdom(2) Registered address: 165 Flanders Rd, Westborough, MA 01581, USA
All direct subsidiaries are holding companies.
The investments in subsidiaries are all stated at cost.
The list of the Company’s indirect subsidiary undertakings is provided in note 18 to the consolidated financial statements.
7. SHARE CAPITAL AND SHARE PREMIUM ACCOUNTThe movements on these accounts are disclosed within notes 27 and 28 to the consolidated financial statements. The movements in the Group financial statements are presented in US Dollars, rather than Sterling in the Company financial statements.
8. CONTROLLING PARTYIn the opinion of the Directors, the Company’s ultimate parent Company and ultimate controlling party is Optima Bidco (Jersey) Limited, a company registered in Jersey, Channel Islands. The Company’s immediate controlling party is EG Midco 1 Limited.
The parent undertaking of the largest group, which includes the Company and for which group accounts are prepared, is EG Group Holdings Limited, a company incorporated in Great Britain, registered at Waterside Head Office, Haslingden Road, Guide, Blackburn, Lancashire, BB1 2FA, United Kingdom.

164 EG Group | 2020 Annual Report and Financial Statements
OTHER INFORMATIONAlternative Performance Measures
INTRODUCTIONWhen assessing and discussing the Group’s reported financial performance, financial position and cash flows, management makes reference to Alternative Performance Measures (“APMs”) of historical or future financial performance, financial position or cash flows that are not defined or specified under International Financial Reporting Standards (“IFRS”).
The APMs used by the Group are financial APMs, usually derived from the financial statements prepared in accordance with IFRS. Certain financial measures cannot be directly derived from the financial statements as they contain additional information such as financial estimates. The accounting policies applied when calculating APMs are, where relevant and unless otherwise stated, substantially the same as those disclosed in the Group’s consolidated financial statements for the year ended December 31, 2020.
APMs are not uniformly defined by all companies, including those in the Group’s industry, and consequently the APMs used by the Group may not be comparable with similarly titled measures or disclosures made by other companies. APMs should be considered in addition to, and not as a substitute for, measures of financial performance, financial position or cash flows reported in accordance with IFRS.
PURPOSEThe Group uses APMs to improve the comparability of information between reporting periods and business units, either by adjusting for uncontrollable factors or special items which impact upon IFRS measures, or by aggregating measures, to aid the users of the Annual Report in understanding the activity taking place across the Group.
Their use is driven by characteristics particularly relevant to the EG Group:
• Adjustments to operating profit – the Group has a significant fixed asset base and consequently incurs a high proportion of depreciation and amortisation. APMs are used to provide adjusted measures for users of the financial statements to evaluate our operating performance and our ability to incur and service our indebtedness
• Transactional activity – the Group is in a growth phase in its lifecycle and has made significant acquisitions in the current and previous reporting periods. Consequently, a high volume of transaction, restructuring and financing costs are incurred within the Group which do not reflect its underlying business. APMs are used to provide an adjusted measure for users of the financial statements to consider performance after such items
• Interest cost – the Group is proportionately highly funded by debt when compared to other businesses in its industry and/or of similar size. APMs are used to provide an adjusted measure for users of the financial statements to consider performance before interest costs
• IFRS 16 transition – the Group applied a modified retrospective approach to the adoption of IFRS 16, and prior period results were not restated to show an equivalent result under IFRS 16. Certain of the Group’s financial covenants are assessed on a fixed GAAP basis under IAS 17. APMs are used for covenant calculations and to provide information to users of the accounts which is more readily comparable with that presented in previous periods
Consequently, APMs are used by the Board and management for planning and reporting. APMs are also referred to in the Group’s covenant calculations and debt facility arrangements. The measures are also used in discussions with investors in the Group’s secured notes and credit ratings agencies.

STRATEGIC REPORT GOVERNANCE FINANCIALS
165EG Group | 2020 Annual Report and Financial Statements
FINANCIAL APMs
Group APM Closest equivalent IFRS measure
Adjustments to reconcileto primary statements Rationale for adjustments
Income statement
Adjusted operating profit Loss for the year • Exceptional items • Excludes certain items due to their size and nature to aid comparability
Adjusted EBITDA Loss for the year • Depreciation and amortisation
• Exceptional items
• Tax
• Net finance costs
• Exceptional items excluded due to their size and nature to aid comparability
Adjusted EBITDA before IFRS 16
Loss for the year • Depreciation and amortisation
• Exceptional items
• Tax
• Net finance costs
• Estimated lease costs under IAS 17 legacy accounting standard
• Exceptional items excluded due to their size and nature to aid comparability
• Includes expenses which would have been presented in previous periods to aid comparability
Pro forma Adjusted EBITDA before IFRS 16
Loss for the year • Depreciation and amortisation
• Exceptional items
• Tax
• Net finance costs
• Estimated lease costs under IAS 17 legacy accounting standard
• Estimated operating profit, exceptional (costs)/income, depreciation and amortisation for acquired businesses in the pre-acquisition period
• Exceptional items excluded due to their size and nature to aid comparability
• Includes estimated annualised performance for acquired businesses to improve comparability to future periods and facilitate performance forecasting
• Excludes certain items due to their size and nature to aid comparability
Like-for-like No direct equivalent • Consistent with accounting policy • Like-for-like is a measure of the true year-on-year performance of the business, which excludes performance from operations that have been disposed of in either the current or prior year, and ensures that the same in-year period is used in both the current and prior years for reporting the performance of operations that have been acquired in the current or prior year
Balance sheet
Net debt before lease liabilities
Borrowings less cash • Borrowings
• Cash
• Excludes certain items due to their size and nature to aid comparability
Combined
Covenant leverage Borrowings less cash divided by loss for the year
• Depreciation and amortisation
• Exceptional items
• Estimated operating profit, exceptional (costs)/income, depreciation and amortisation for acquired businesses in the pre-acquisition period
• Includes estimated annualised performance and estimated annualised integration synergies for acquired businesses to improve comparability to future periods and facilitate performance forecasting
• Exceptional items excluded due to their size and nature to aid comparability
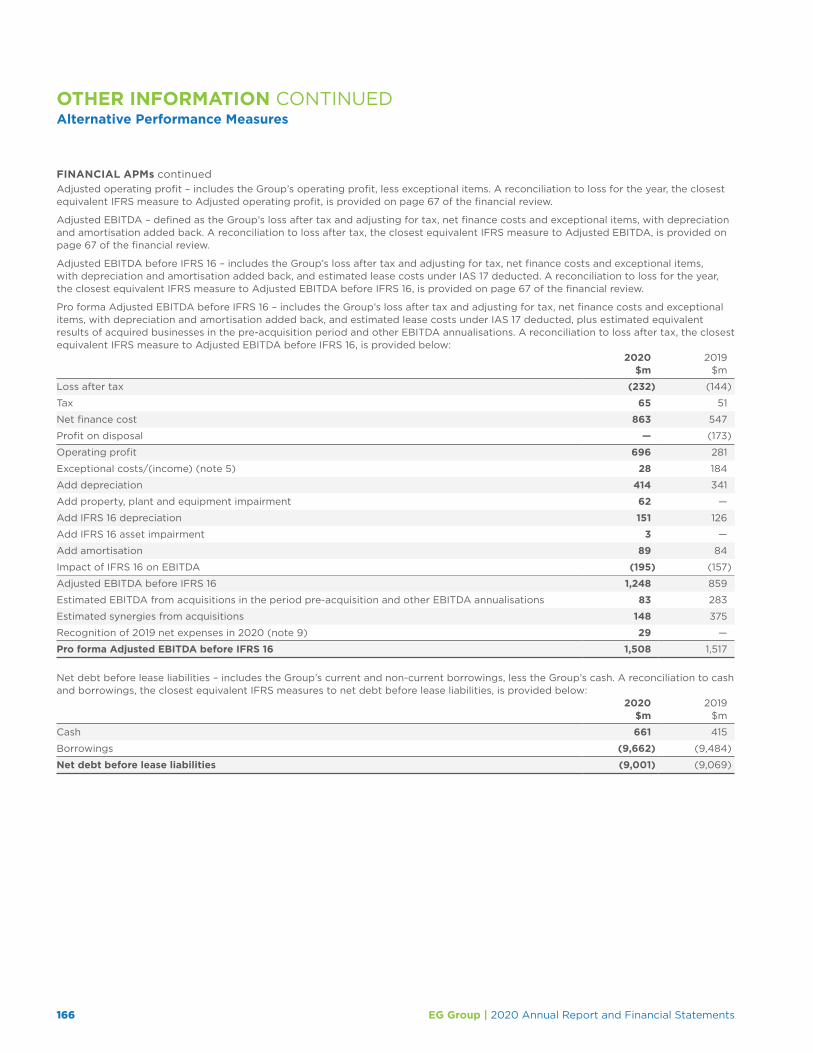
166 EG Group | 2020 Annual Report and Financial Statements
FINANCIAL APMs continuedAdjusted operating profit – includes the Group’s operating profit, less exceptional items. A reconciliation to loss for the year, the closest equivalent IFRS measure to Adjusted operating profit, is provided on page 67 of the financial review.
Adjusted EBITDA – defined as the Group’s loss after tax and adjusting for tax, net finance costs and exceptional items, with depreciation and amortisation added back. A reconciliation to loss after tax, the closest equivalent IFRS measure to Adjusted EBITDA, is provided on page 67 of the financial review.
Adjusted EBITDA before IFRS 16 – includes the Group’s loss after tax and adjusting for tax, net finance costs and exceptional items, with depreciation and amortisation added back, and estimated lease costs under IAS 17 deducted. A reconciliation to loss for the year, the closest equivalent IFRS measure to Adjusted EBITDA before IFRS 16, is provided on page 67 of the financial review.
Pro forma Adjusted EBITDA before IFRS 16 – includes the Group’s loss after tax and adjusting for tax, net finance costs and exceptional items, with depreciation and amortisation added back, and estimated lease costs under IAS 17 deducted, plus estimated equivalent results of acquired businesses in the pre-acquisition period and other EBITDA annualisations. A reconciliation to loss after tax, the closest equivalent IFRS measure to Adjusted EBITDA before IFRS 16, is provided below:
2020$m
2019$m
Loss after tax (232) (144)
Tax 65 51
Net finance cost 863 547
Profit on disposal — (173)
Operating profit 696 281
Exceptional costs/(income) (note 5) 28 184
Add depreciation 414 341
Add property, plant and equipment impairment 62 —
Add IFRS 16 depreciation 151 126
Add IFRS 16 asset impairment 3 —
Add amortisation 89 84
Impact of IFRS 16 on EBITDA (195) (157)
Adjusted EBITDA before IFRS 16 1,248 859
Estimated EBITDA from acquisitions in the period pre-acquisition and other EBITDA annualisations 83 283
Estimated synergies from acquisitions 148 375
Recognition of 2019 net expenses in 2020 (note 9) 29 —
Pro forma Adjusted EBITDA before IFRS 16 1,508 1,517
Net debt before lease liabilities – includes the Group’s current and non-current borrowings, less the Group’s cash. A reconciliation to cash and borrowings, the closest equivalent IFRS measures to net debt before lease liabilities, is provided below:
2020$m
2019$m
Cash 661 415
Borrowings (9,662) (9,484)
Net debt before lease liabilities (9,001) (9,069)
OTHER INFORMATION CONTINUEDAlternative Performance Measures

STRATEGIC REPORT GOVERNANCE FINANCIALS
167EG Group | 2020 Annual Report and Financial Statements
Covenant leverage is calculated as the Group’s net debt before lease liabilities (as defined above), adjusted for certain items set out in the covenant agreement (predominantly unamortised debt costs), divided by the Group’s pro forma Adjusted EBITDA before IFRS 16 (as defined above). A reconciliation of this calculation to operating profit and borrowings, the closest IFRS measure to these calculation components, is provided below:
2020$m
2019$m
Pro forma Adjusted EBITDA before IFRS 16 (see above) 1,508 1,517
Net debt before lease liabilities (see above) (9,001) (9,069)
Adjustments to net debt per covenant agreement (158) 38
Covenant adjusted net debt (9,159) (9,031)
Covenant leverage 6.1 5.9
The non-IFRS measures have limitations as an analytical tool and should not be considered in isolation, or as an alternative to, or a substitute for, profit/(loss) for the year or other financial statement data presented in the consolidated financial statements as indicators of financial performance. Some of the limitations of these non-IFRS measures are that:
• They do not reflect our cash expenditures or future requirements for capital expenditures or contractual commitments
• They do not reflect changes in, or cash requirements for, our working capital needs
• They do not reflect the significant interest expense, or the cash requirements necessary, to service interest or principal payments on our debt
• They do not reflect our tax expenses or the cash that may be required to pay our taxes
• They are not adjusted for all non-cash income or expense items that are reflected in our statements of cash flows
• They do not reflect the impact of earnings or charges resulting from certain matters we consider not to be indicative of our ongoing operations
• Although depreciation and amortisation are non-cash charges, the assets being depreciated and amortised will often need to be replaced in the future and EBITDA-based measures do not reflect any cash requirements that would be required for such replacements
• Some of the exceptional items that we eliminate in calculating certain EBITDA-based measures reflect cash payments that were made, or will in the future be made
• Other companies in our industry may calculate these measures differently than we do, limiting their usefulness as comparative measures
• Certain adjustments made in calculating Adjusted EBITDA, pro forma Adjusted EBITDA and pro forma Adjusted EBITDA before IFRS 16 contain estimates that management believes reflect the underlying results of operations and therefore are subjective in nature

168 EG Group | 2020 Annual Report and Financial Statements

Designed and produced by
www.lyonsbennett.com
The paper used in this report is produced using virgin wood fibre from well‑managed, FSC®‑certified forests and from recycled materials. All pulps used are elemental chlorine free and manufactured at a mill that has been awarded the ISO 14001 and EMAS certificates for environmental management.
This document was printed by Pureprint Group using its environmental print technology, with 100% of dry waste diverted from landfill, minimising the impact of printing on the environment. The printer is a CarbonNeutral® company.

EG GroupWaterside Head Office, Haslingden Road, Guide, Blackburn, Lancashire BB1 2FA, United Kingdom.
Registered in England and WalesCompany Number: 09826582
www.eurogarages.com

EG
Gro
up | 20
20 A
nn
ual R
epo
rt and
Fin
ancial S
tatemen
ts