Efficient use of local energy: An activity oriented modeling to ...
12
HAL Id: hal-01913169 https://hal.archives-ouvertes.fr/hal-01913169 Submitted on 6 Nov 2018 HAL is a multi-disciplinary open access archive for the deposit and dissemination of sci- entific research documents, whether they are pub- lished or not. The documents may come from teaching and research institutions in France or abroad, or from public or private research centers. L’archive ouverte pluridisciplinaire HAL, est destinée au dépôt et à la diffusion de documents scientifiques de niveau recherche, publiés ou non, émanant des établissements d’enseignement et de recherche français ou étrangers, des laboratoires publics ou privés. Effcient use of local energy: An activity oriented modeling to guide Demand Side Management Alexandre Rio, yoann Maurel, Olivier Barais, yoran Bugni To cite this version: Alexandre Rio, yoann Maurel, Olivier Barais, yoran Bugni. Effcient use of local energy: An activity oriented modeling to guide Demand Side Management. MODELS 2018 - 21th ACM/IEEE Inter- national Conference on Model Driven Engineering Languages and Systems, Oct 2018, Copenhagen, Denmark. pp.458-468, 10.1145/3239372.3239391. hal-01913169
-
Upload
khangminh22 -
Category
Documents
-
view
6 -
download
0
Transcript of Efficient use of local energy: An activity oriented modeling to ...

HAL Id: hal-01913169https://hal.archives-ouvertes.fr/hal-01913169
Submitted on 6 Nov 2018
HAL is a multi-disciplinary open accessarchive for the deposit and dissemination of sci-entific research documents, whether they are pub-lished or not. The documents may come fromteaching and research institutions in France orabroad, or from public or private research centers.
L’archive ouverte pluridisciplinaire HAL, estdestinée au dépôt et à la diffusion de documentsscientifiques de niveau recherche, publiés ou non,émanant des établissements d’enseignement et derecherche français ou étrangers, des laboratoirespublics ou privés.
Efficient use of local energy: An activity orientedmodeling to guide Demand Side Management
Alexandre Rio, yoann Maurel, Olivier Barais, yoran Bugni
To cite this version:Alexandre Rio, yoann Maurel, Olivier Barais, yoran Bugni. Efficient use of local energy: An activityoriented modeling to guide Demand Side Management. MODELS 2018 - 21th ACM/IEEE Inter-national Conference on Model Driven Engineering Languages and Systems, Oct 2018, Copenhagen,Denmark. pp.458-468, �10.1145/3239372.3239391�. �hal-01913169�

Efficient use of local energy: An activity oriented modeling toguide Demand Side Management
Alexandre RioGroupe OKWind, Univ Rennes 1,
Inria, IrisaVitré, France
Yoann Maurel, Olivier BaraisUniv Rennes 1, Inria, Irisa
Rennes, [email protected]
Yoran BugniGroupe OKWindVitré, France
ABSTRACTSelf-consumption of renewable energies is defined as electricitythat is produced from renewable energy sources, not injected tothe distribution or transmission grid or instantaneously withdrawnfrom the grid and consumed by the owner of the power productionunit or by associates directly contracted to the producer. Designingsolutions in favor of self-consumption for small industries or citydistricts is challenging. It consists in designing an energy produc-tion system made of solar panels, wind turbines, batteries that fitthe annual weather prediction and the industrial or human activ-ity. In this context, this paper reports the context of this businessdomain, its challenges, and the application of modeling that leadsto a solution. Through this article, we highlight the essentials of adomain specific modeling language designed to let domain expertsrun their own simulations, we compare with existing practices thatexist in such a company and we discuss the benefits and the limitsof the use of modeling in such context.
KEYWORDSSimulation, What-if Scenario Analysis, Case study
1 INTRODUCTIONAn interesting aspect of renewable energies is that they can beproduced locally, close to the consumers, thus considerably reduc-ing infrastructures and distribution costs [17]. These developmentshave led to significant gains that make credible the use of theseenergies on a daily basis as the main source of energy for a largenumber of industrial and agricultural activities. The autonomy ofsites with micro-generation capabilities is then greatly increased byself-consumption of locally produced energy. Self-consumptionof renewable energies is defined as electricity that is producedfrom renewable energy sources, not injected to the distribution ortransmission grid or instantaneously withdrawn from the grid andconsumed by the owner of the power production unit or by asso-ciates directly contracted to the producer. Self-consumption is seenas a solution to improve the use of renewable energy and decreasesenergy-network costs. Logically, the higher the self-consumption,the more the investments in solar panels or wind turbines willbe worth the expense — feeding production surplus into the gridpresupposes suitable collection infrastructures and is not alwayspossible nor desirable.
One striking challenge to self-consumption of renewable ener-gies is the disparities between power generation from solar panelsor wind turbines and the actual demand. Efficient use of renewableenergy requires the adaptation of consumption practices. Thesepractices and the current organization of activities have been indeed
strongly influenced by the traditional energy production model. Incity districts, for instance, most of the power production takes placewhen residents are not at home, pursuing their profession or otherdaily life activities[17]. Of course, this situation and the possibleadaptations of activities are very different depending on whetherone considers residential, industrial, services or agricultural areas.This paper focuses on the two latter.
Commercial enterprises could, due to the alignment of work-ing hours with power production from solar panels or wind tur-bines, achieve higher rates of self-consumption depending on thetype of enterprise. Demand Side Management (DSM)[19] refersto a set of measures to optimize the use of energy including De-mand Response (DR) and storage strategies. DR represents thepractice of managing electricity demand in a way that peak en-ergy use is shifted to off-peak periods enabling higher rates ofself-consumption. With electricity storage and DR, rates of selfconsumption can be raised.
On of the keys is thus to align production and consumptioneither by planning processes differently or by relying on storage ca-pabilities. Autonomy and self-consumption are intertwined: achiev-ing high levels of autonomy with renewable energies has a negativeimpact on self-consumption if no storage is available. Designing asystem that enables almost 80% or even 100% self-consumption anda high autonomy of 50% to 70% is, therefore, a complex problemwhen competitiveness in electricity costs prevails. It requires a)to dimension the nominal power to be produced according to theweather and the characteristics of production facilities (e.g, solarpanels or wind turbines), b) to assess the maximum volume of en-ergy to store to absorb peaks, c) to infer consumption of activities inthe business processes, and d) to identify the ones that can (and areworth to) be shifted. An expert designing such energy managementsystem will likely be interested in how to size energy productionfacilities and storage. What trade-off between autonomy and self-consumption have to be done to ensure an acceptable price level?Which regions are best suited for the implementation of such asolution? And, which process reorganizations allow the optimaluse of the energy produced?
Building a model of some real-world phenomenon seems tobe an intrinsic human endeavor to understand and predict occur-rences in the world [4]. If lots of approaches discuss the benefitsof Model-Driven Engineering (MDE) approach to help experts indesigning simulators, this paper proposes an industrial case study forrepresenting industrial process and energy management constraints.
This experience report discusses the benefits and current lim-itations of MDE to build such a simulator. We go in-depth in the
domain specific language that has been designed to provide ab-stractions to an expert to define its installation and its businessprocess. We also compare this approach regarding the practices ofa local company that design such system for medium size industry.We validate our approach in showing the design of such a DSLand discussing how we improve the accuracy of the simulationcompared to the state of the practices in this company. Next, wediscuss some findings regarding MDE technologies.
The rest of this paper is organized as follows. Section 2 presentsthe concrete case study and provides a journey in a renewableenergy engineer’s day. Section 3 illustrates our approach and intro-duces the domain specific language and the associated simulatorthat has been designed to assist a renewable energy engineer. Sec-tion 4 provides the evaluation of this work. Section 5 discussesrelated work. Section 6 discusses some findings regarding MDEtechnologies and highlights future work.
2 CASE STUDYThis work is carried out as part of a collaboration between
OKWind1 and researchers in computer science. OKWind’s focus isto bring energy production and consumption closer together with-out creating new infrastructures. The company is specialized in theproduction of renewable sources of energy. It proposes to deployself-production units directly where the consumption is done. It hasdeveloped expertise in vertical-axis wind turbines, photo-voltaictrackers, and heat pump. For example, the company produces sev-eral models of double-sided solar trackers ranging from 75 to 117square meters capable of producing 25 to 40MWh/year or 17 to23kW in peak conditions.
The company mainly targets businesses and has accumulated agreat deal of expertise in the instrumentation of agricultural andindustrial sites, as well as service companies. It has a network ofseveral hundred customers which allows it to study in detail the usesof its products. Experiments are currently underway at a number ofsites to study how the reorganization of activities can improve self-consumption. This is conducted in synergy with the site managers.OKWind’s long-term objective is to be able to achieve an autonomyof around 70% by offering competitive energy rates compared totraditional operators. To achieve this goal, the company intends todesign a system that integrates its business experience and as wellas site operators to tackle the following questions.
(1) How to size local renewable energy production unitsto meet a site’s energy consumption? This study breaksdown into the review of several factors for a given site: Whatis the desired level of autonomy? Are the weather conditionsmore favorable to wind or solar?Would it make sense to use acombination of multiple energy sources over long periods oftime? Does consumption occur when energy is produced oris it necessary to install batteries to store surplus production?Are there any specific tariff policies to integrate, for example,feed-in tariffs? In particular, energy cost constraints must betaken into account: self-consumption must be maximized ifreturn on investment is the main priority.
1http://www.okwind.fr/
(2) Which organization of activities enables the best au-tonomy and self-consumption? Shifting processes, how-ever, is conditioned by many business constraints: someactivities cannot be performed at night, are intertwined, orhave a significant impact on employees or animals’ health.The determination of the best organizations is generallydone through a complex iterative task which requires a goodknowledge and modeling of the processes. The idea is tobuild a system that provides sufficient guidance to operatorsto allow them to gradually optimize their practice.
(3) Which region would be the most interesting for theexpansion of its business? On the basis of meteorologicaldata, business knowledge and the results of previous projects,one may want to estimate whether an equivalent site in adifferent region could benefit from renewable energy pro-duction. If a simulation tool is available to estimate a siteon the basis of meteorological knowledge and descriptionof activities, it is then possible to estimate the ecologicalviability of such a project.
These questions, and the variability of the factors to be takeninto account, naturally led us to use a model-driven approach toconduct (What-If Scenario Analysis)2.
3 MODELIn this section we present the model on which our Energy Man-
agement System (EMS) is based. The goal is to provide a DomainSpecific Language (DSL) that enables experts to quickly integratetheir knowledge and algorithms, and to provide a library of reusablecomponents and algorithms. This library can be improved by ex-tending existing components or adding new ones. Flexibility andextensibility is mandatory as the number of machines, producers,and algorithms is important. Some of these components will alsoallow to play back historical data, which is a common use for siz-ing purposes. Using a DSL and components that clearly separatethe different concerns avoids code redundancies and facilitates thework of domain experts [13].
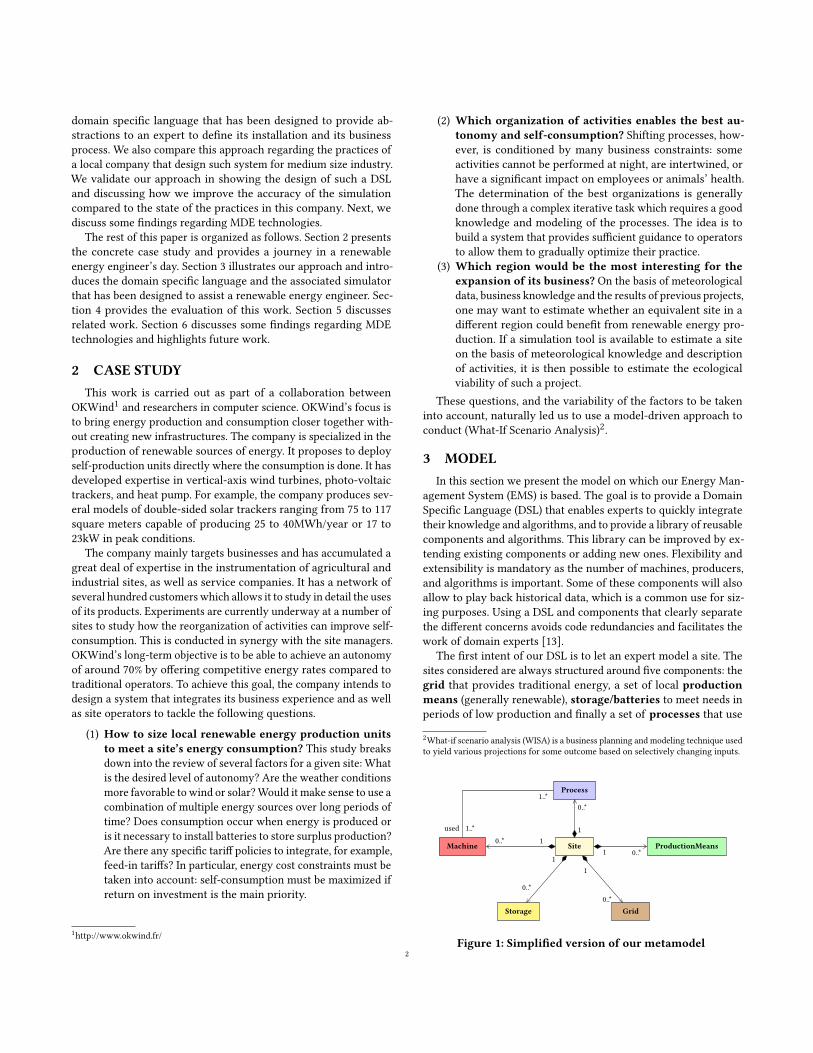
The first intent of our DSL is to let an expert model a site. Thesites considered are always structured around five components: thegrid that provides traditional energy, a set of local productionmeans (generally renewable), storage/batteries to meet needs inperiods of low production and finally a set of processes that use
2What-if scenario analysis (WISA) is a business planning and modeling technique usedto yield various projections for some outcome based on selectively changing inputs.
10..*1 0..*
1
0..*
1
0..*
1
0..*
used 1..*
1..*
SiteMachine ProductionMeans
Process
Storage Grid
Figure 1: Simplified version of our metamodel2
machines. As we are mainly interested in industrial/agriculturalsites we use Machine rather than Appliance – a term that oftencomes up in literature
Figure 1 shows our simplified model capturing these aspects.Some information, such as the name of the modeled site or physicallocation (GPS coordinates) are common to all objects, hencewe havea central class named Site to hold every aspect of our regulationsystem.
We will see that we dedicate an important part to the modelingof processes and the use of machines. In general many models onlyconsider fine-grained consumers such as machines. This makes rec-ommendations difficult because a machine can be used by differentactivities at different times of the day. Our aim here is to be able tolink consumption to business activities in order to guide users inplanning their activities.
The storages and the grid have a particular role here: they canboth absorb surpluses of local energy production, and meet needswhen local energy production is not sufficient. Their presence is op-tional, but to be able to operate 24 hours a site must generally haveone of the two. It could be noted here that we have deliberately cho-sen to represent them separately in this first version of the model,but it would be quite possible to consider them as a special caseof ProductionsMeans andMachine . This choice, which in practicehas a measured impact on implementation, comes partly from thefact that we wanted to be able to use these parts independently.
The rest of this section describes in depth the five main parts ofour language introduced in Figure 1. It ends in showing how wehandle flexibility in activity modeling.
3.1 ProductionOur work is mainly motivated and constrained by production as-pects. As a result of the intermittent nature of renewable energyproduction and its high dependence on external (mainly meteoro-logical) conditions, sites need to be constantly adapted. For thatreason, we need to define a GPS coordinate at site level so that eachmodule can access it.
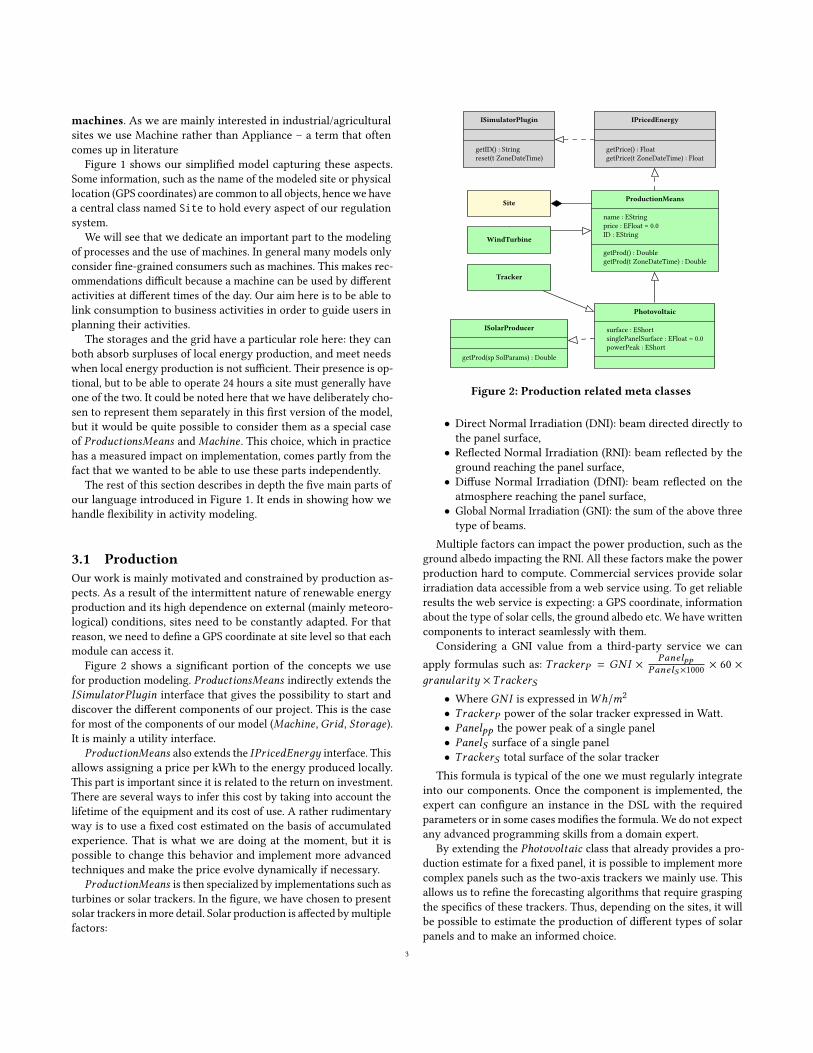
Figure 2 shows a significant portion of the concepts we usefor production modeling. ProductionsMeans indirectly extends theISimulatorPluдin interface that gives the possibility to start anddiscover the different components of our project. This is the casefor most of the components of our model (Machine ,Grid , Storaдe).It is mainly a utility interface.
ProductionMeans also extends the IPricedEnerдy interface. Thisallows assigning a price per kWh to the energy produced locally.This part is important since it is related to the return on investment.There are several ways to infer this cost by taking into account thelifetime of the equipment and its cost of use. A rather rudimentaryway is to use a fixed cost estimated on the basis of accumulatedexperience. That is what we are doing at the moment, but it ispossible to change this behavior and implement more advancedtechniques and make the price evolve dynamically if necessary.
ProductionMeans is then specialized by implementations such asturbines or solar trackers. In the figure, we have chosen to presentsolar trackers inmore detail. Solar production is affected bymultiplefactors:
Site
WindTurbine
Tracker
Photovoltaic
surface : EShortsinglePanelSurface : EFloat = 0.0powerPeak : EShort
ProductionMeans
name : EStringprice : EFloat = 0.0ID : EString
getProd() : DoublegetProd(t ZoneDateTime) : Double
ISolarProducer
getProd(sp SolParams) : Double
IPricedEnergy
getPrice() : FloatgetPrice(t ZoneDateTime) : Float
ISimulatorPlugin
getID() : Stringreset(t ZoneDateTime)
Figure 2: Production related meta classes
• Direct Normal Irradiation (DNI): beam directed directly tothe panel surface,
• Reflected Normal Irradiation (RNI): beam reflected by theground reaching the panel surface,
• Diffuse Normal Irradiation (DfNI): beam reflected on theatmosphere reaching the panel surface,
• Global Normal Irradiation (GNI): the sum of the above threetype of beams.
Multiple factors can impact the power production, such as theground albedo impacting the RNI. All these factors make the powerproduction hard to compute. Commercial services provide solarirradiation data accessible from a web service using. To get reliableresults the web service is expecting: a GPS coordinate, informationabout the type of solar cells, the ground albedo etc. We have writtencomponents to interact seamlessly with them.
Considering a GNI value from a third-party service we canapply formulas such as: TrackerP = GNI × Panelpp
PanelS×1000 × 60 ×дranularity ×TrackerS
• Where GNI is expressed inWh/m2
• TrackerP power of the solar tracker expressed in Watt.• Panelpp the power peak of a single panel• PanelS surface of a single panel• TrackerS total surface of the solar tracker
This formula is typical of the one we must regularly integrateinto our components. Once the component is implemented, theexpert can configure an instance in the DSL with the requiredparameters or in some cases modifies the formula. We do not expectany advanced programming skills from a domain expert.
By extending the Photovoltaic class that already provides a pro-duction estimate for a fixed panel, it is possible to implement morecomplex panels such as the two-axis trackers we mainly use. Thisallows us to refine the forecasting algorithms that require graspingthe specifics of these trackers. Thus, depending on the sites, it willbe possible to estimate the production of different types of solarpanels and to make an informed choice.
3
3.2 GridAlthough optional, the grid is often essential for the consumptionof most sites. Indeed, often to reach a reasonable level of autonomyat times when local production is low, it would require batteries oflarge capacities therefore expensive. It is sometimes more profitablein these cases to rely on the energy supplied by the grid. Theintegration of the grid into a model is interesting because pricingpolicies are varied. It is therefore, necessary to provide a flexiblemodel that can be adapted to the specificities of each site and region.
Site
GridIPricedEnergy
ISimulatorPlugin
Figure 3: Grid related meta classes
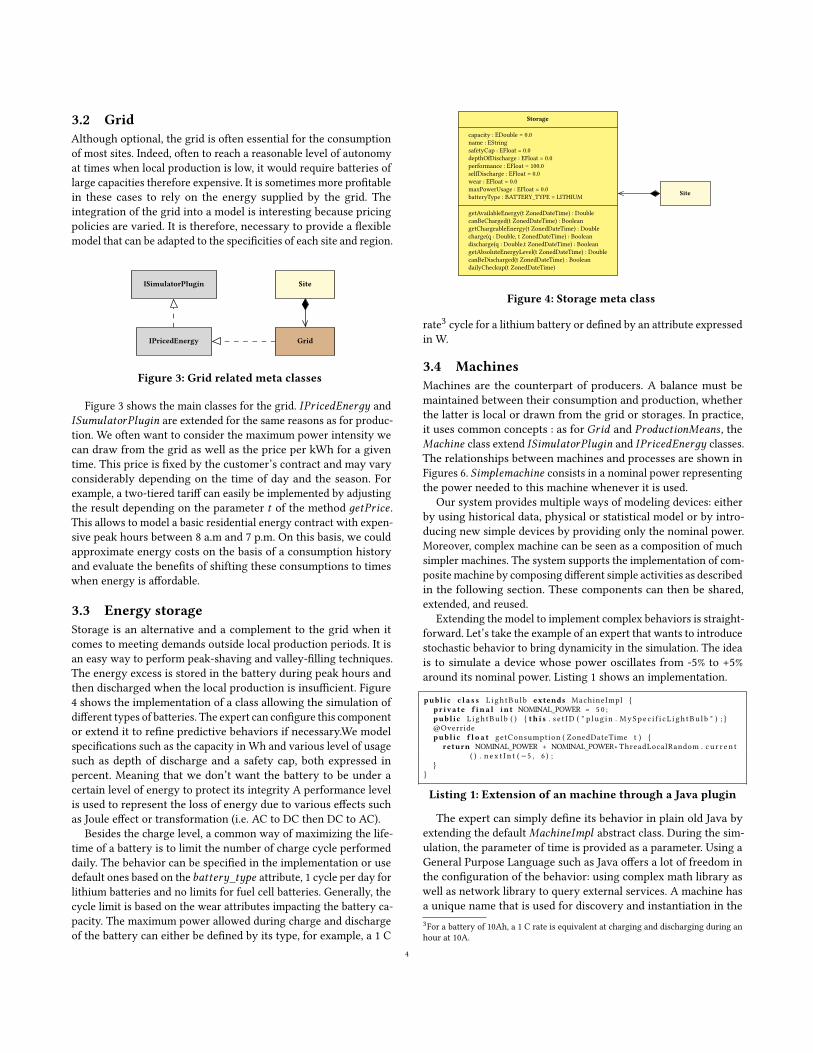
Figure 3 shows the main classes for the grid. IPricedEnerдy andISumulatorPluдin are extended for the same reasons as for produc-tion. We often want to consider the maximum power intensity wecan draw from the grid as well as the price per kWh for a giventime. This price is fixed by the customer’s contract and may varyconsiderably depending on the time of day and the season. Forexample, a two-tiered tariff can easily be implemented by adjustingthe result depending on the parameter t of the method дetPrice .This allows to model a basic residential energy contract with expen-sive peak hours between 8 a.m and 7 p.m. On this basis, we couldapproximate energy costs on the basis of a consumption historyand evaluate the benefits of shifting these consumptions to timeswhen energy is affordable.
3.3 Energy storageStorage is an alternative and a complement to the grid when itcomes to meeting demands outside local production periods. It isan easy way to perform peak-shaving and valley-filling techniques.The energy excess is stored in the battery during peak hours andthen discharged when the local production is insufficient. Figure4 shows the implementation of a class allowing the simulation ofdifferent types of batteries. The expert can configure this componentor extend it to refine predictive behaviors if necessary.We modelspecifications such as the capacity in Wh and various level of usagesuch as depth of discharge and a safety cap, both expressed inpercent. Meaning that we don’t want the battery to be under acertain level of energy to protect its integrity A performance levelis used to represent the loss of energy due to various effects suchas Joule effect or transformation (i.e. AC to DC then DC to AC).
Besides the charge level, a common way of maximizing the life-time of a battery is to limit the number of charge cycle performeddaily. The behavior can be specified in the implementation or usedefault ones based on the battery_type attribute, 1 cycle per day forlithium batteries and no limits for fuel cell batteries. Generally, thecycle limit is based on the wear attributes impacting the battery ca-pacity. The maximum power allowed during charge and dischargeof the battery can either be defined by its type, for example, a 1 C
Site
Storage
capacity : EDouble = 0.0name : EStringsafetyCap : EFloat = 0.0depthOfDischarge : EFloat = 0.0performance : EFloat = 100.0selfDischarge : EFloat = 0.0wear : EFloat = 0.0maxPowerUsage : EFloat = 0.0batteryType : BATTERY_TYPE = LITHIUM
getAvailableEnergy(t ZonedDateTime) : DoublecanBeCharged(t ZonedDateTime) : BooleangetChargeableEnergy(t ZonedDateTime) : Doublecharge(q : Double, t ZonedDateTime) : Booleandischarge(q : Double,t ZonedDateTime) : BooleangetAbsoluteEnergyLevel(t ZonedDateTime) : DoublecanBeDischarged(t ZonedDateTime) : BooleandailyCheckup(t ZonedDateTime)
Figure 4: Storage meta class
rate3 cycle for a lithium battery or defined by an attribute expressedin W.
3.4 MachinesMachines are the counterpart of producers. A balance must bemaintained between their consumption and production, whetherthe latter is local or drawn from the grid or storages. In practice,it uses common concepts : as for Grid and ProductionMeans , theMachine class extend ISimulatorPluдin and IPricedEnerдy classes.The relationships between machines and processes are shown inFigures 6. Simplemachine consists in a nominal power representingthe power needed to this machine whenever it is used.
Our system provides multiple ways of modeling devices: eitherby using historical data, physical or statistical model or by intro-ducing new simple devices by providing only the nominal power.Moreover, complex machine can be seen as a composition of muchsimpler machines. The system supports the implementation of com-positemachine by composing different simple activities as describedin the following section. These components can then be shared,extended, and reused.
Extending the model to implement complex behaviors is straight-forward. Let’s take the example of an expert that wants to introducestochastic behavior to bring dynamicity in the simulation. The ideais to simulate a device whose power oscillates from -5% to +5%around its nominal power. Listing 1 shows an implementation.
public c l a s s L i gh tBu l b extends MachineImpl {pr ivate f ina l int NOMINAL_POWER = 5 0 ;public L i gh tBu l b ( ) { th i s . s e t ID ( " p l ug i n . MySpe c i f i c L i gh tBu l b " ) ; }@Overridepublic f l o a t getConsumption ( ZonedDateTime t ) {
return NOMINAL_POWER + NOMINAL_POWER∗ ThreadLocalRandom . c u r r e n t( ) . n e x t I n t ( −5 , 6 ) ;
}}
Listing 1: Extension of an machine through a Java plugin
The expert can simply define its behavior in plain old Java byextending the defaultMachineImpl abstract class. During the sim-ulation, the parameter of time is provided as a parameter. Using aGeneral Purpose Language such as Java offers a lot of freedom inthe configuration of the behavior: using complex math library aswell as network library to query external services. A machine hasa unique name that is used for discovery and instantiation in the3For a battery of 10Ah, a 1 C rate is equivalent at charging and discharging during anhour at 10A.
4

Domain Specific Language (see Listing 2). The DSL allows expertswith little programming skills to use the components easily.machine l i g h t _ b u l b as " p l ug i n . MySpe c i f i c L i gh tBu l b "
Listing 2: External plugin used as internally definedmachines.
Most industrial machines use three-phase electric power, thismeans that to properly monitor the consumption of such machinethree sensors are needed and three data log files are produced. Amachine can, therefore, reference other machines as depicted inlisting 3.d ev i c e {
machine A_phase1 as " p l ug i n . t imedcsvconsumer "machine A_phase2 as " p l ug i n . t imedcsvconsumer "machine A_phase3 as " p l ug i n . t imedcsvconsumer "machine A { composed o f ( A_phase1 , A_phase2 , A_phase3 ) }
}
Listing 3: Three-phase electric power example
3.5 Activity modelingAs we have already stressed, the modeling of business processes isa key to provide effective recommendations to users. Modeling ma-chines alone is often not enough because they are frequently usedfor multiple activities. The idea is to induce behaviors that promoteself-consumption by aligning energy demanding activities and localproduction periods. If this idea is difficult to implement for residen-tial activities which are relatively unforeseeable as Bourgeois[3]pointed out, it applies well to the industrial and agricultural worldwhere the processes are known, industrialized, reproducible andplanned several months in advance. Furthermore, consumptionscales and potential gains are much higher than in the residentialsector, encouraging stakeholders to participate proactively. Finally,it is easier to reuse the experience gained on a type of business tosimulate the operation of similar ones.
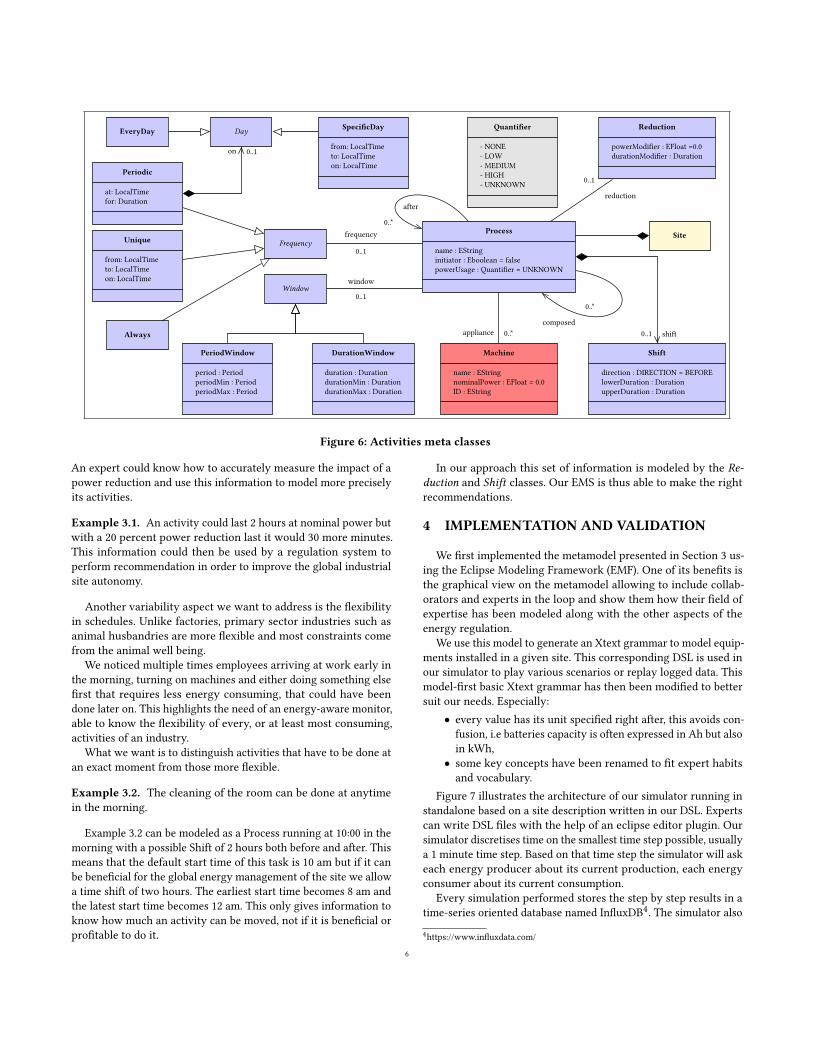
Figure 6 details the model developed to represent business pro-cesses and their relationship with energy-using machines. Processis the main class and holds both scheduling description and flexi-bility. Flexibility is captured through Reduction and Shift classesand is discussed further in Section 3.6. Based on this model, it ispossible for our EMS to apply scheduling algorithms to minimizelocally produced energy excess and grid usage so as to raise the siteautonomy. Such system is very close to a Cyber-Physical Systemthat integrates embedded sensors to monitor various metrics suchas the power consumption of physical devices. A study by [11]
StartUp:Process
initiator = true
Pause:Process
applianceA:Machine
nominalPower = 100.0
P:Periodic
at = 08:00for = 30s
-frequency
-device
-after
Pause:Periodic
for = 15s
-frequency
Nominal:Process
-after
-device SD:SpecificDay
days= MONDAY, TUESDAY
-on
Pause:Periodic
for = 5min
-frequency
Figure 5: machine behavior modeled with Process
showed that classic scheduling algorithms in operating systemscan be reused in our case.
A process is linked to none, one or multiples Machines (seeSection 3.4): we consider amachine to be active if one of its activitiesis active and logically it is not possible for two processes to use thesame machine at the same time. Process planning is very classic inits representation. We made it similar to the one expressed in thecompany’s or farm’s task schedule: a list of tasks with a start datetime and a duration or an end time. This allows to easily connectcompany calendars and the information reported by our system:we can, for example, evaluate the energy consumption of meetingsor rooms such as conference rooms by knowing the activities thattake place there.
As stated before industrial processes are predictable mostly dueto the constant frequency of some activities, to that extent wepropose to link a Frequency to an activity. A frequency can specifya particular recurrence of events: every day or every Monday at08:00 for 4 hours for instance. For more complex activities such asa sanitary emptying or holidays, activities are incorporated intoperiods of a given duration called Window. For fine grain control,one can also link activities with pauses between them as shown inFigure 5. With these concepts, it is possible to model an activityrunning every day during day time using a specific machine A.
It is also possible to model various mode of a machine. For in-stance, we could define an activity StartUp using a devicemachineAworking at 100W for 30 s, pausing for 15 s then working again for5min, on Monday on Tuesday at 8 am. This example is instantiatedas an object diagram in Figure5 using Process linked as dependen-cies, which means that a process must first be completed before anew process can start.
3.6 Modeling FlexibilityThe language is thus expressive enough to represent how the activ-ities follow each other and deduce their consumption by observingthe consumption of the machines. This can help replay complexscenarios involving power consumption and help to size of produc-tion means. However, modeling the sequence of activities in timeis not sufficient to take measures: it is also necessary to be able torepresent the level of flexibility offered to reduce their consumptionor shift them. Optimizing self-consumption by modifying processescan be done mainly in two ways: shifting activities to times whenenergy is produced and less expensive or reducing the intensity ofactivities where possible – it may be possible to reduce the lightintensity of lighting in certain rooms for instance.
The adaptation of activities cannot be done suddenly without agood understanding of the users, their process and their constraint.This requires the cooperation of the users. It is necessary to un-derstand how the activities are carried out at the present time andto understand the elements of variability: is it possible to reducethe intensity of a machine? what is the impact on comfort and theacceptable level of comfort? To what extent is it possible to movesome activities and over what time range? Starting from activitymodeling, see Section 3.5, we provide a way of capturing the set ofpossible actions to take.
For instance, ventilation systems or cleaning devices can operateat a lower nominal power but need more time to be as efficient.
5
on 0..1
shift0..1appliance 0..*
reduction
0..1
window
0..1
frequency
0..1
composed
0..*
after
0..*Site
Quantifier
- NONE- LOW- MEDIUM- HIGH- UNKNOWN
Process
name : EStringinitiator : Eboolean = falsepowerUsage : Quantifier = UNKNOWN
Shift
direction : DIRECTION = BEFORElowerDuration : DurationupperDuration : Duration
Machine
name : EStringnominalPower : EFloat = 0.0ID : EString
Reduction
powerModifier : EFloat =0.0durationModifier : Duration
Frequency
Window
PeriodWindow
period : PeriodperiodMin : PeriodperiodMax : Period
DurationWindow
duration : DurationdurationMin : DurationdurationMax : Duration
Unique
from: LocalTimeto: LocalTimeon: LocalTime
Always
Periodic
at: LocalTimefor: Duration
Day SpecificDay
from: LocalTimeto: LocalTimeon: LocalTime
EveryDay
Figure 6: Activities meta classes
An expert could know how to accurately measure the impact of apower reduction and use this information to model more preciselyits activities.
Example 3.1. An activity could last 2 hours at nominal power butwith a 20 percent power reduction last it would 30 more minutes.This information could then be used by a regulation system toperform recommendation in order to improve the global industrialsite autonomy.
Another variability aspect we want to address is the flexibilityin schedules. Unlike factories, primary sector industries such asanimal husbandries are more flexible and most constraints comefrom the animal well being.
We noticed multiple times employees arriving at work early inthe morning, turning on machines and either doing something elsefirst that requires less energy consuming, that could have beendone later on. This highlights the need of an energy-aware monitor,able to know the flexibility of every, or at least most consuming,activities of an industry.
What we want is to distinguish activities that have to be done atan exact moment from those more flexible.
Example 3.2. The cleaning of the room can be done at anytimein the morning.
Example 3.2 can be modeled as a Process running at 10:00 in themorning with a possible Shift of 2 hours both before and after. Thismeans that the default start time of this task is 10 am but if it canbe beneficial for the global energy management of the site we allowa time shift of two hours. The earliest start time becomes 8 am andthe latest start time becomes 12 am. This only gives information toknow how much an activity can be moved, not if it is beneficial orprofitable to do it.
In our approach this set of information is modeled by the Re-duction and Shift classes. Our EMS is thus able to make the rightrecommendations.
4 IMPLEMENTATION AND VALIDATION
We first implemented the metamodel presented in Section 3 us-ing the Eclipse Modeling Framework (EMF). One of its benefits isthe graphical view on the metamodel allowing to include collab-orators and experts in the loop and show them how their field ofexpertise has been modeled along with the other aspects of theenergy regulation.
We use this model to generate an Xtext grammar to model equip-ments installed in a given site. This corresponding DSL is used inour simulator to play various scenarios or replay logged data. Thismodel-first basic Xtext grammar has then been modified to bettersuit our needs. Especially:
• every value has its unit specified right after, this avoids con-fusion, i.e batteries capacity is often expressed in Ah but alsoin kWh,
• some key concepts have been renamed to fit expert habitsand vocabulary.
Figure 7 illustrates the architecture of our simulator running instandalone based on a site description written in our DSL. Expertscan write DSL files with the help of an eclipse editor plugin. Oursimulator discretises time on the smallest time step possible, usuallya 1 minute time step. Based on that time step the simulator will askeach energy producer about its current production, each energyconsumer about its current consumption.
Every simulation performed stores the step by step results in atime-series oriented database named InfluxDB4. The simulator also4https://www.influxdata.com/
6
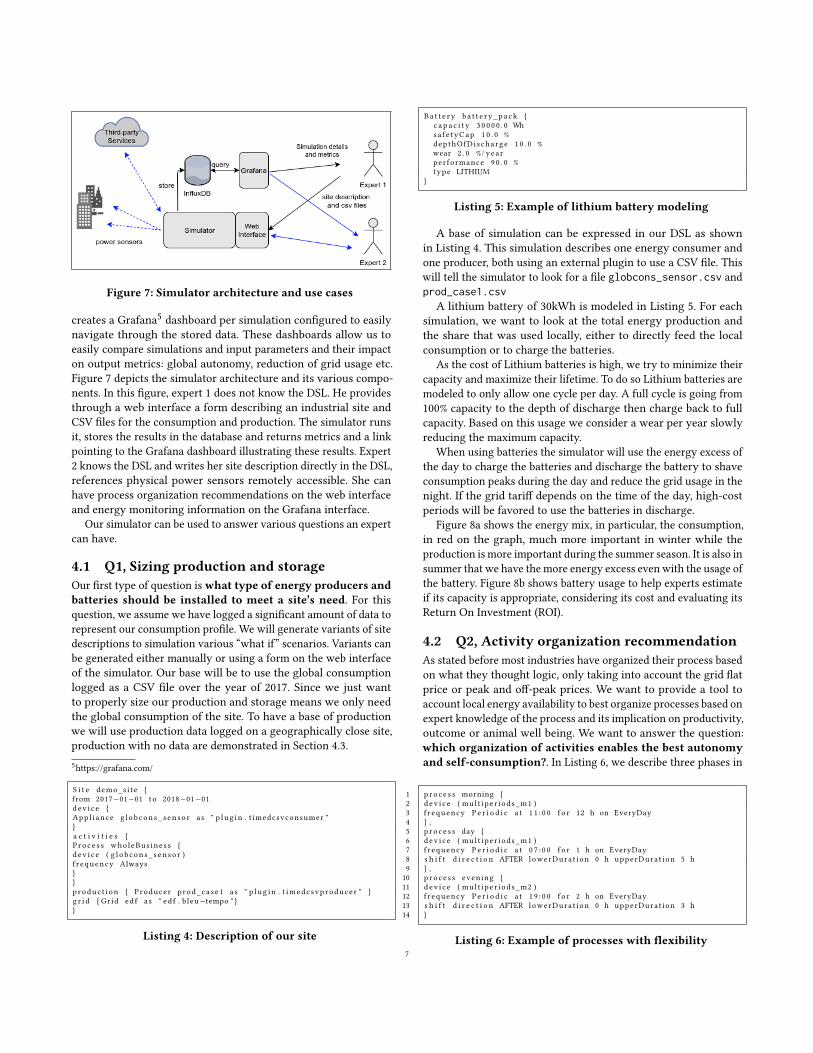
Figure 7: Simulator architecture and use cases
creates a Grafana5 dashboard per simulation configured to easilynavigate through the stored data. These dashboards allow us toeasily compare simulations and input parameters and their impacton output metrics: global autonomy, reduction of grid usage etc.Figure 7 depicts the simulator architecture and its various compo-nents. In this figure, expert 1 does not know the DSL. He providesthrough a web interface a form describing an industrial site andCSV files for the consumption and production. The simulator runsit, stores the results in the database and returns metrics and a linkpointing to the Grafana dashboard illustrating these results. Expert2 knows the DSL and writes her site description directly in the DSL,references physical power sensors remotely accessible. She canhave process organization recommendations on the web interfaceand energy monitoring information on the Grafana interface.
Our simulator can be used to answer various questions an expertcan have.
4.1 Q1, Sizing production and storageOur first type of question iswhat type of energy producers andbatteries should be installed to meet a site’s need. For thisquestion, we assume we have logged a significant amount of data torepresent our consumption profile. We will generate variants of sitedescriptions to simulation various “what if” scenarios. Variants canbe generated either manually or using a form on the web interfaceof the simulator. Our base will be to use the global consumptionlogged as a CSV file over the year of 2017. Since we just wantto properly size our production and storage means we only needthe global consumption of the site. To have a base of productionwe will use production data logged on a geographically close site,production with no data are demonstrated in Section 4.3.5https://grafana.com/
S i t e demo_s i t e {from 2017−01−01 to 2018−01−01d ev i c e {App l i ance g l o b con s _ s en so r as " p l ug i n . t imedcsvconsumer "}a c t i v i t i e s {P r o c e s s who leBus ines s {d e v i c e ( g l o b con s_ s en so r )f r equency Always}}p r oduc t i on { Producer p rod_ca se1 as " p l ug i n . t imedc svp roduce r " }g r i d { Gr id ed f as " ed f . b leu−tempo " }}
Listing 4: Description of our site
Ba t t e r y b a t t e r y _p a c k {c a p a c i t y 3 0 0 0 0 . 0 Whsa f e t yCap 1 0 . 0 %dep thOfD i s cha rge 1 0 . 0 %wear 2 . 0 %/ yearper formance 9 0 . 0 %type LITHIUM
}
Listing 5: Example of lithium battery modeling
A base of simulation can be expressed in our DSL as shownin Listing 4. This simulation describes one energy consumer andone producer, both using an external plugin to use a CSV file. Thiswill tell the simulator to look for a file globcons_sensor.csv andprod_case1.csv
A lithium battery of 30kWh is modeled in Listing 5. For eachsimulation, we want to look at the total energy production andthe share that was used locally, either to directly feed the localconsumption or to charge the batteries.
As the cost of Lithium batteries is high, we try to minimize theircapacity and maximize their lifetime. To do so Lithium batteries aremodeled to only allow one cycle per day. A full cycle is going from100% capacity to the depth of discharge then charge back to fullcapacity. Based on this usage we consider a wear per year slowlyreducing the maximum capacity.
When using batteries the simulator will use the energy excess ofthe day to charge the batteries and discharge the battery to shaveconsumption peaks during the day and reduce the grid usage in thenight. If the grid tariff depends on the time of the day, high-costperiods will be favored to use the batteries in discharge.
Figure 8a shows the energy mix, in particular, the consumption,in red on the graph, much more important in winter while theproduction is more important during the summer season. It is also insummer that we have themore energy excess evenwith the usage ofthe battery. Figure 8b shows battery usage to help experts estimateif its capacity is appropriate, considering its cost and evaluating itsReturn On Investment (ROI).
4.2 Q2, Activity organization recommendationAs stated before most industries have organized their process basedon what they thought logic, only taking into account the grid flatprice or peak and off-peak prices. We want to provide a tool toaccount local energy availability to best organize processes based onexpert knowledge of the process and its implication on productivity,outcome or animal well being. We want to answer the question:which organization of activities enables the best autonomyand self-consumption?. In Listing 6, we describe three phases in
1 p r o c e s s morning {2 d e v i c e ( mu l t i p e r i od s_m1 )3 f r equency P e r i o d i c a t 1 1 : 0 0 f o r 12 h on EveryDay4 } ,5 p r o c e s s day {6 d e v i c e ( mu l t i p e r i od s_m1 )7 f r equency P e r i o d i c a t 0 7 : 0 0 f o r 1 h on EveryDay8 s h i f t d i r e c t i o n AFTER lowerDura t i on 0 h upperDura t ion 5 h9 } ,10 p r o c e s s even ing {11 d ev i c e ( mu l t i p e r i od s_m2 )12 f r equency P e r i o d i c a t 1 9 : 0 0 f o r 2 h on EveryDay13 s h i f t d i r e c t i o n AFTER lowerDura t i on 0 h upperDura t ion 3 h14 }
Listing 6: Example of processes with flexibility7

(a) Yearly energy mix of solar production, winter consumption (red) are the most important, due to ventilation andcooling. Most of the production occurs in summer, producing important energy excess (yellow). Here we can see thatoptimization is required either by reorganizing activities or introducing new type of producer (wind turbine)
(b) Yearly battery usage, because of the long series of energy excess the battery is under used from April to Octobre
Figure 8: Visualization of the Case 2 simulation, from January 1st 2017 to December 31st 2017
a day using two devices. Lines 8 and 13 allow the process to startfrom 0 to 3 or 5 hours after the initial start time, this possible shiftis illustrated in Figure 9. Because of the local energy available themorning phase has been shifted to begin when energy is availablewhile the evening one has been left untouched because they wouldhave been no benefit of shifting it. For now, the simulator looks forshift flexibility and tries to use them to put a maximum numberof processes under the production curve. Our idea is to let expertswrite their own scheduling algorithm to try them out and see whichone is most effective for a particular industry type. We are planningon implementing Bin Packing: First Fit and Best Fit algorithms asSendama[21] et al. did and bottom left decreasing height packingfrom Ranjan[20] et al. in order to benchmark which algorithm givesthe best results considering a particular business sector.
Figure 9 shows that for this day shifting the morning processis beneficial for the self-consumption rate. The decision to shift ornot a process is based on the context of the regulation system, forinstance, local production state, storage rate etc.
4.3 Q3, Geographic comparisonLast type of question we address in this paper is a “what-for” ques-tion. Which region is most interesting for the expansion ofa business? The underlying question is to know which region hasthe weather better suited for my activity. Of course sunny regionsproduce more solar energy but bigger production systems mean
bigger inverter, cable section and in fine more indirect costs. Pro-ducing less and yet enough for a process can be more cost-effective.Some services such as PVGis6 can help size a photovoltaic installa-tion by providing an estimated monthly production based on morethan 20 years of historical data. The pitfall is that monthly datacan’t help us properly size a system: we want to be able to align theconsumption on the production and to know the ratio of energydirectly used from production and the quantity taken from the grid.Thus, we need more accurate data, with a granularity of a pointper minute or every five minutes.
Commercial third-party services provide irradiation data for aparticular GPS coordinate and given some solar cell specifications.They can take into account distant relief casting shadows at a certaintime of the day or period of the year. We have integrated their APIto query their server for a given site GPS coordinate giving ourproduction model as a parameter.
Listing 7 shows how we specify the GPS coordinate in our DSLand a 110m2 two-axis solar tracker. Each panel produces 310 Wattpeak. Other parameters, such as tilt and azimuth constraints areleft to their defaults value by our proxy program. Data are retrievedwith a granularity of 1 point per minute, which is enough to performsimulation as previously done in Question 1 and 2.
To answer our “what-for” question we need to generate vari-ants of our DSL with a different GPS coordinate for each variant.
6http://photovoltaic-software.com/pvgis.php
8

Figure 9: Question 2 : Shifting an activity to a production period when possible increase our self-consumption rate from 9% to20% for this specific dayc o o r d i n a t e s 4 8 . 8 5 8 8 3 7 7 N 2 . 2 7 7 0 2 0 6 E. . .T racke r t 1 {
s u r f a c e 110 m^2powerPeak 310 Wpa lbedo 0 . 8s i n g l e P a n e l S u r f a c e 1 . 6 6 6 7 m^2
}
Listing 7: Generic solar tracker at Paris, France coordinates
Figure 10 shows an estimation of the production in 14 variants inFrance. For each region, we have a fine grain simulated productionan expert can then use to size his production installation or opti-mize his activities. In this particular case, if we want the city withthe biggest production we can choose Bourges, Laguiole orMontpel-lier. We could also have estimated the best geographic installationfor battery life management, based on the consecutive number of“good” or “bad” weather day.
Figure 10: Simulated production taking into account reliefshadows for 14 different cities in France : greenest pointsrepresent the sites where the estimated production is best.
5 RELATEDWORKIndividually, every component of a smart grid has been studied
thoughtfully. This goes from local production means, in particular,the most common ones such as solar photovoltaic systems and windturbine to Energy Management Systems.
Solar energy is the most common renewable energy becauseof its almost constant production during the day. Furthermore,modern techniques such asMachine Learning[22] or Support VectorMachine[2][15] are becomingmore andmore reliable and are givingresults at a shorter term than it used to. Moreover, their granularitybecomes finer. Other external varying constraints are impactingregulation systems: the wind impacting local production, grid pricesetc. Scheduling activities have been done under these multiplevariable factors. Forecasting and learning techniques are importantto take more reliable decisions. Predictions could either be focusedon the energy price and site own consumption history[12] or humanactivity.
People model machine consumption with state machines[10] inorder to optimize the various states of a single appliance to optimizeits energy efficiency considering a particular task. Synchronizationbetween machines has been modeled using petri net[8][9]. A com-monway of aligning consumption on production is to use an energystorage unit as a buffer such as batteries[1]. We believe that to beeffective a regulation system must consider all the aspect above.Some approaches try to combine some of them but never addresswhat we consider the whole picture.
Vivekananthan[24] et al. propose a Home Energy ManagementSystem able to control appliances depending on a variable energyprice to reduce energy costs. Because of the domestic sector and itsuncertainty the activity cannot be modeled. Chen[6] et al. proposea similar system. To limit this uncertainty, one idea is to address agroup of apartments [7], this also has the benefits of mutualizing theinvestment costs. All these approaches lack the activity modelingaspect, important to better understand the consumption: how itwill behave in upcoming days and how it can be adapted.
Some approaches, such as Langer[14] et al. or Onar[18] et al.require too much detailed specifications about the generation unitsor the consuming devices. This prevents coarse-grained modelingor prototyping and can be too complicated for a non-expert. Focus-ing on market energy price hides local aspect and local return on
9
investment, this kind of approach cannot be used in our contextbecause of the local production and storage impacting the real costof the consumed energy.
On another side, Sendama[21] et al. propose a discrete Bin Pack-ing allocation algorithm taking into account local production andbatteries. They validate it on their Home Energy Management Sys-tem. Other algorithms from real-time systems exist[5], like EarliestDeadline First, and are good candidates for scheduling industrialactivities. We would like to integrate some of them as modules.
Finally, graphical user interfaces such as Tiree Energy Pulse[23]tells us about the importance of including the end user in the loopand how displaying the live state of a system can provide an Eco-Feedback by reconfiguring rules defined by experts to better suittheir habits and benefit the whole system. Bourgeois[3] et al. workfocuses on domestic demand-shifting and human integration.
In our opinion, no real solution has a global vision of an industrialsite in all its aspects to achieve efficient energy regulation withproperly sized energy sources and energy storage units.
6 LESSON LEARNED AND PERSPECTIVESIn this paper, we focused on designing an integrated tool-suite
to assist the engineers in dimensioning an Energy ManagementSystem (EMS) for an isolated site to reduce the construction ofnew network infrastructure and reduce its dependence on the grid.We advocate that the MDE is a very good candidate to integratethe various technological and business knowledge on the renew-able energy production and consumption forecasting techniques,the planning of processes, energy costs, grid, and batteries. Thismodel allows an engineer to address various concerns: sizing of pro-duction units, adapting of storage resources, choice of productiontechnologies, choice of geographical location, or even and above allrecommendations for process reorganization. The purposes of ourEMS are quite different from grid-centered approaches or largergrain approaches to energy distribution. Here our long-term goal isnot to complete the grid occasionally but to do without as much aspossible. That is why we are focusing on renewable energies andmodeling of single sites at the moment. A good understanding of asite provides huge savings levers on consumption from the grid.
As we pointed out, if there are many approaches to building suchsystem, to the best of our knowledge, this model is one of the veryfew that focuses specifically on one site and not on the grid as awhole and covers so many aspects of modeling. In particular, webelieve that modeling activities are essential to make good forecastsand recommendations. The model is also very extensible, whichenables the integration of the various techniques produced by theliterature. It is thus very easy to integrate new means of productionand their forecasting techniques, new types of activities or newappliances for instance.
After highlighting the different aspects of the model and oursystem, we discussed how the first version of our model couldanswer simple simulation questions: how to size a site, or installproduction equipment, and which activities could be moved tomaximize the use of local production means. These are the veryquestions that a company like OKWind, a specialist in the field,is regularly addressing. The implementation was done with veryclassical and well-known tools such as EMF. The system was built
in a little more than 9 months, from a skills upgrade on the businessproblem to technologies integration and packaging for end users.It results in the end 4500 loc of Java, 1300 loc of Lua and 78klocof generated files. The great interest of our tool is that it enablesto simulate easily a very wide range of situations and thus allowsto determine quickly the best options. If we compare with thecompany’s past practices, engineers mainly used homemade excelsheets and R script. Many scenarios discussed in the paper werenot possible. Sharing information among experts was very difficult.Detecting errors in site modeling was challenging. Building thisdomain specific language and its associated simulator saves lots oftime and produces more precise results compared to the traditionalmanual approaches used before. Within the framework of thisexperiment which was conducted on real historical data, we wereable to show that it was easy to integrate the various algorithmsused by the company and that it was easy to extend them. Theresults obtained are very comparable to those obtained by OKWindexperts but in much shorter times. The tool itself is an improvementon those available to the company and should make it possible toassist their experts in studies on a wider scale.
The system is, therefore, promising and the modeling approachis valid. Nevertheless, the implementation of a model-driven ap-proach has not been without challenges or lessons learned. Thefirst surprise was the lack of native support within a framework asEMF for the notion of measurement units. It is easy to specify itsown data-types but we expected to find either reusable libraries toincorporate the international system of Units as data-types within anew meta-model or a native support within EMF. In the same vein,no native support makes it possible to simplify the managementof time-series data. Again, redeveloping this support is tedious, itsurprised us not to find support within a commonly used modelingframework like EMF. On these two points, it could be great if thecommunity provides mechanisms to improve the reuse when de-signing a new metamodel. It means an algebra to import parts of ameta-model or a grammar but also a marketplace to automaticallysearch and import libraries of metamodel such as maven central.The last challenge we identify for the modeling community is theco-evolution of meta-model and concrete syntax. While Xtext pro-vides an excellent approach for building DSL, the joint evolution ofmeta-model and concrete syntax remains complex and tedious.
We are now conducting an experiment at several sites to see howadapting activities can improve production equipment profitability.This experience over a long period should provide us with relevantfeedback on what can and cannot be requested from a site operator.This should allow us to use our tool not only to simulate upstreambut also to make observations and recommendations on a weeklybasis. At the same time, we also want to compare similar sitesto see which variables are relevant for a particular business. Ourintuition is that it is possible to define, for certain specific domainsor profiles, parameters that will assist the configuration of themodeland refine the recommendations and simulations: the number ofanimals on a farm is an example. Finally, we would like to explorehow this model can be used as a basis for artificial intelligencealgorithms to manage real-time operations. All the informationdescribed is indeed very complementary to the type of informationthat a continuous management system such as those proposed bya company like Ubiant [16] would seek.
10

REFERENCES[1] H. Alharbi and K. Bhattacharya. 2018. Stochastic Optimal Planning of Battery
Energy Storage Systems for Isolated Microgrids. IEEE Transactions on SustainableEnergy 9, 1 (Jan. 2018), 211–227. https://doi.org/10.1109/TSTE.2017.2724514
[2] Kuk Yeol Bae, Han Seung Jang, and Dan Keun Sung. 2016. Hourly Solar Irradi-ance Prediction Based on Support Vector Machine and Its Error Analysis. IEEETransactions on Power Systems (2016). toread.
[3] Jacky Bourgeois. 2016. Interactive Demand-Shifting in the Context of DomesticMicro-Generation. Ph.D. Dissertation. cited.
[4] Jean-Michel Bruel, Benoit Combemale, Ileana Ober, and Hélène Raynal. 2015.MDE in Practice for Computational Science. In INTERNATIONAL CONFER-ENCE ON COMPUTATIONAL SCIENCE. Reykjavík, Iceland. https://hal.inria.fr/hal-01141393 cited.
[5] Davide Caprino,Marco L. Della Vedova, and Tullio Facchinetti. 2014. Peak shavingthrough real-time scheduling of household appliances. Energy and Buildings 75(2014), 133–148. https://doi.org/10.1016/j.enbuild.2014.02.013 cited.
[6] Shengbo Chen, Ness B. Shroff, and Prasun Sinha. 2013. Heterogeneous DelayTolerant Task Scheduling and Energy Management in the Smart Grid with Re-newable Energy. IEEE Journal on Selected Areas in Communications 31, 7 (jul2013), 1258–1267. https://doi.org/10.1109/JSAC.2013.130709 cited.
[7] Gabriele Comodi, Andrea Giantomassi, Marco Severini, Stefano Squartini,Francesco Ferracuti, Alessandro Fonti, Davide Nardi Cesarini, Matteo Morodo,and Fabio Polonara. 2015. Multi-apartment residential microgrid with elec-trical and thermal storage devices: Experimental analysis and simulation ofenergy management strategies. Applied Energy 137 (2015), 854–866. https://doi.org/10.1016/j.apenergy.2014.07.068 cited.
[8] Anton Dietmair and Alexander Verl. 2008. Energy consumption modeling and op-timization for production machines. IEEE International Conference on SustainableEnergy Technologies (2008), 574–579. https://doi.org/10.1109/ICSET.2008.4747073cited.
[9] Anton Dietmair and Alexander Verl. 2009. A generic energy consumptionmodel for decision making and energy efficiency optimisation in manufactur-ing. International Journal of Sustainable Engineering 2, 2 (jun 2009), 123–133.https://doi.org/10.1080/19397030902947041 cited.
[10] Anton Dietmair, Alexander Verl, and Philipp Eberspaecher. 2011. Model-basedenergy consumption optimisation in manufacturing system and machine con-trol. International Journal of Manufacturing Research (2011). http://www.inderscienceonline.com/doi/abs/10.1504/IJMR.2011.043238 cited.
[11] Tullio Facchinetti andMarco L. Della Vedova. 2011. Real-TimeModeling for DirectLoad Control in Cyber-Physical Power Systems. IEEE Transactions on IndustrialInformatics 7, 4 (nov 2011), 689–698. https://doi.org/10.1109/TII.2011.2166787cited.
[12] Vito Fusco, Ganesh K Venayagamoorthy, Stefano Squartini, and Francesco Pi-azza. 2016. Smart AMI based demand-response management in a micro-grid
environment. In 2016 Clemson University Power Systems Conference (PSC). IEEE,1–8. cited.
[13] Tomaž Kosar, Pablo E Martı, Pablo A Barrientos, Marjan Mernik, et al. 2008. Apreliminary study on various implementation approaches of domain-specificlanguage. Information and software technology 50, 5 (2008), 390–405.
[14] Tino Langer, Andreas Schlegel, Johannes Stoldt, andMatthias Putz. 2014. Amodel-based approach to energy-saving manufacturing control strategies. Procedia CIRP15 (2014), 123–128. cited.
[15] Maria Malvoni, Maria Grazia De Giorgi, and Paolo Maria Congedo. 2016. Dataon Support Vector Machines (SVM) model to forecast photovoltaic power. Datain brief 9 (2016), 13–16.
[16] Sébastien Mazac, Frédéric ARMETTA, and Salima Hassas. 2014. On bootstrap-ping sensori-motor patterns for a constructivist learning system in continuousenvironments. In Alife 14 : Fourteenth International Conference on the Synthesisand Simulation of Living Systems (Proceedings of the Fourteenth InternationalConference on the Synthesis and Simulation of Living Systems), The MIT Press(Ed.). New York, United States. https://doi.org/10.7551/978-0-262-32621-6-ch028
[17] Daniel E Olivares, Ali Mehrizi-Sani, Amir H Etemadi, Claudio A Cañizares, RezaIravani, Mehrdad Kazerani, Amir H Hajimiragha, Oriol Gomis-Bellmunt, MaryamSaeedifard, Rodrigo Palma-Behnke, et al. 2014. Trends in microgrid control. IEEETransactions on smart grid 5, 4 (2014), 1905–1919.
[18] Omer C. Onar, Mehmet Uzunoglu, and Mohammad S. Alam. 2008. Modeling, con-trol and simulation of an autonomous wind turbine/photovoltaic/fuel cell/ultra-capacitor hybrid power system. Journal of Power Sources 185, 2 (2008), 1273–1283.https://doi.org/10.1016/j.jpowsour.2008.08.083 cited.
[19] Peter Palensky and Dietmar Dietrich. 2011. Demand side management: Demandresponse, intelligent energy systems, and smart loads. IEEE transactions onindustrial informatics 7, 3 (2011), 381–388.
[20] Anshu Ranjan, Pramod Khargonekar, and Sartaj Sahni. 2016. Smart grid powerscheduling via bottom left decreasing height packing. In Computers and Commu-nication (ISCC), 2016 IEEE Symposium on. IEEE, 1128–1133.
[21] N Benjamin Sendama, Mehdi Laraki, Aawatif Hayar, and Yassine Rifi. 2016. NewRenewable Energy Allocation Algorithms based on Bin Packing in a Smart Home..In SMARTGREENS. 309–315.
[22] Navin Sharma, Pranshu Sharma, David Irwin, and Prashant Shenoy. 2011. Pre-dicting solar generation from weather forecasts using machine learning. In SmartGrid Communications (SmartGridComm), 2011 IEEE International Conference on.IEEE, 528–533.
[23] Will Simm, Maria Angela Ferrario, Adrian Friday, Peter Newman, Stephen For-shaw, Mike Hazas, and Alan Dix. 2015. Tiree energy pulse: exploring renewableenergy forecasts on the edge of the grid. In Proceedings of the 33rd Annual ACMConference on Human Factors in Computing Systems. ACM, 1965–1974.
[24] Cynthujah Vivekananthan, Yateendra Mishra, and Fangxing Li. 2014. Real-TimePrice Based Home Energy Management Scheduler. IEEE Transactions on PowerSystems (2014). https://doi.org/10.1109/TPWRS.2014.2358684 cited.
11