Efficient Text Color Modulation for Printed Side Communications and Data Hiding
8
Efficient Text Color Modulation for Printed Side Communications and Data Hiding Paulo Vinicius Koerich Borges, Ebroul Izquierdo Queen Mary, University of London Multimedia and Vision Research Group London, UK [email protected], [email protected] Joceli Mayer Federal University of Santa Catarina Digital Signal Processing Research Lab Florianopolis, SC, Brazil [email protected] Abstract This paper improves the use of text color modulation (TCM) as a reliable text document data hiding method. Us- ing TCM, the characters in a document have their color components modified (possibly unperceptually) according to a side message to be embedded. This work presents a de- tection metric and an analysis determining the detection er- ror rate in TCM, considering an assumed print and scan (PS) channel model. In addition, a perceptual impact model is employed to evaluate the perceptual difference between a modified and a non-modified character. Combining this per- ceptual model and the results from the detection error anal- ysis it is possible to determine the optimum color modu- lation values. The proposed detection metric also exploits the orientation characteristics of color halftoning to reduce the error rate. In particular, because color halftoning algo- rithms use different screen orientation angles for each color channel, this is used as an effective feature to detect the em- bedded message. Experiments illustrate the validity of the analysis and the applicability of the method. 1. Introduction Video, telephone, and Internet based communications have increased remarkably in the last few years. How- ever, communication over paper still remains an essential mean of conveying information. Very often, important pa- per copies of documents are exchanged between companies and people. As a consequence, several methods have been proposed aiming at reliably authenticating hardcopy docu- ments. This paper investigates the use of TCM [8] as an efficient document authentication method. Using TCM, each indi- vidual character has its color modulated from the standard black to a different color. This modulation is performed, possibly unperceptually to the human eye, according to a side message to be embedded in the document. This is il- lustrated in Fig. 1, where c is the original image and s is im- age watermarked according to bit string b. Detection is per- formed with the use of a scanner. Notice that it is not the goal of this paper to discuss the usefulness of TCM and re- lated methods such as text luminance modulation (TLM), in which only the luminance of the characters are modi- fied. This issue and practical implementation aspects have already been discussed in the literature [8, 13, 5]. In contrast, based on the TCM approach, this work pro- vides the following contributions: Figure 1. Example of text watermarking through TCM. (i) Considering a PS channel model, a detection met- ric for TCM is proposed, which combines information of different color channels. For this metric, an analysis to es- timate the theoretical error rate is presented. The Bhat- tacharyya bound [9] is used to determine the error proba- bility when the information from the blue and red channels are combined. (ii) The use of the CIE L*a*b* perceptual color space [1] is proposed, in order to determine the perceptual impact of the modulation in each color channel. (iii) Using the error analysis and the perceptual impact results, an optimum modulation level is achieved, consider- ing a tradeoff between error rate and perceptual impact.
-
Upload
independent -
Category
Documents
-
view
2 -
download
0
Transcript of Efficient Text Color Modulation for Printed Side Communications and Data Hiding

Efficient Text Color Modulation for Printed Side Communications and DataHiding
Paulo Vinicius Koerich Borges, Ebroul IzquierdoQueen Mary, University of London
Multimedia and Vision Research GroupLondon, UK
[email protected], [email protected]
Joceli MayerFederal University of Santa Catarina
Digital Signal Processing Research LabFlorianopolis, SC, Brazil
Abstract
This paper improves the use of text color modulation(TCM) as a reliable text document data hiding method. Us-ing TCM, the characters in a document have their colorcomponents modified (possibly unperceptually) accordingto a side message to be embedded. This work presents a de-tection metric and an analysis determining the detection er-ror rate in TCM, considering an assumed print and scan(PS) channel model. In addition, a perceptual impact modelis employed to evaluate the perceptual difference between amodified and a non-modified character. Combining this per-ceptual model and the results from the detection error anal-ysis it is possible to determine the optimum color modu-lation values. The proposed detection metric also exploitsthe orientation characteristics of color halftoning to reducethe error rate. In particular, because color halftoning algo-rithms use different screen orientation angles for each colorchannel, this is used as an effective feature to detect the em-bedded message. Experiments illustrate the validity of theanalysis and the applicability of the method.
1. Introduction
Video, telephone, and Internet based communicationshave increased remarkably in the last few years. How-ever, communication over paper still remains an essentialmean of conveying information. Very often, important pa-per copies of documents are exchanged between companiesand people. As a consequence, several methods have beenproposed aiming at reliably authenticating hardcopy docu-ments.
This paper investigates the use of TCM [8] as an efficientdocument authentication method. Using TCM, each indi-vidual character has its color modulated from the standardblack to a different color. This modulation is performed,
possibly unperceptually to the human eye, according to aside message to be embedded in the document. This is il-lustrated in Fig. 1, where c is the original image and s is im-age watermarked according to bit string b. Detection is per-formed with the use of a scanner. Notice that it is not thegoal of this paper to discuss the usefulness of TCM and re-lated methods such as text luminance modulation (TLM),in which only the luminance of the characters are modi-fied. This issue and practical implementation aspects havealready been discussed in the literature [8, 13, 5].
In contrast, based on the TCM approach, this work pro-vides the following contributions:
Figure 1. Example of text watermarkingthrough TCM.
(i) Considering a PS channel model, a detection met-ric for TCM is proposed, which combines information ofdifferent color channels. For this metric, an analysis to es-timate the theoretical error rate is presented. The Bhat-tacharyya bound [9] is used to determine the error proba-bility when the information from the blue and red channelsare combined.
(ii) The use of the CIE L*a*b* perceptual color space[1] is proposed, in order to determine the perceptual impactof the modulation in each color channel.
(iii) Using the error analysis and the perceptual impactresults, an optimum modulation level is achieved, consider-ing a tradeoff between error rate and perceptual impact.
(iv) In color printing, each color channel is printed ina given orientation angle to minimize the interference be-tween color channels [2]. This is exploited in this paper, asthe detection of the dominant angle in each character is alsoused to help identifying the type of color modulation em-ployed, reducing the error rate.
This paper is organized as follows. Section 2 describesa PS channel, which is used in the error rate analysis. Sec-tion 3 proposes the detection metric to extract the embed-ded symbol from the character, providing an analysis to de-termine the error rate for the metric. Section 4 discusses theperceptual impact caused by TCM. Section 5 determines theoptima modulation levels for a given detection error proba-bility. Section 6 presents a metric to determine the dominanthalftone orientation angle. Section 7 presents several exper-iments, validating the analysis and illustrating the applica-bility of the method. The paper closes with relevant conclu-sions in Section 8.
2. The Color Print and Scan Channel
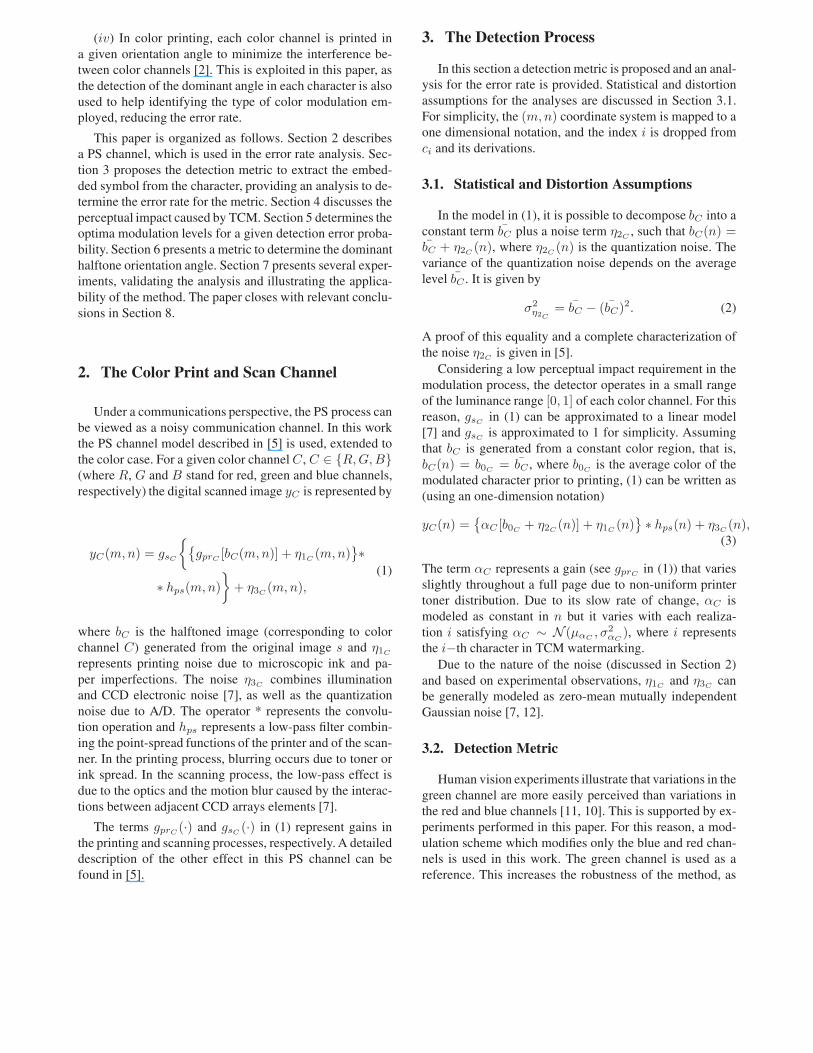
Under a communications perspective, the PS process canbe viewed as a noisy communication channel. In this workthe PS channel model described in [5] is used, extended tothe color case. For a given color channel C, C ∈ {R, G, B}(where R, G and B stand for red, green and blue channels,respectively) the digital scanned image yC is represented by
yC(m, n) = gsC
{{gprC [bC(m, n)] + η1C (m, n)
}∗∗ hps(m, n)
}+ η3C (m, n),
(1)
where bC is the halftoned image (corresponding to colorchannel C) generated from the original image s and η1C
represents printing noise due to microscopic ink and pa-per imperfections. The noise η3C combines illuminationand CCD electronic noise [7], as well as the quantizationnoise due to A/D. The operator * represents the convolu-tion operation and hps represents a low-pass filter combin-ing the point-spread functions of the printer and of the scan-ner. In the printing process, blurring occurs due to toner orink spread. In the scanning process, the low-pass effect isdue to the optics and the motion blur caused by the interac-tions between adjacent CCD arrays elements [7].
The terms gprC (·) and gsC (·) in (1) represent gains inthe printing and scanning processes, respectively. A detaileddescription of the other effect in this PS channel can befound in [5].
3. The Detection Process
In this section a detection metric is proposed and an anal-ysis for the error rate is provided. Statistical and distortionassumptions for the analyses are discussed in Section 3.1.For simplicity, the (m, n) coordinate system is mapped to aone dimensional notation, and the index i is dropped fromci and its derivations.
3.1. Statistical and Distortion Assumptions
In the model in (1), it is possible to decompose bC into aconstant term bC plus a noise term η2C , such that bC(n) =bC + η2C (n), where η2C (n) is the quantization noise. Thevariance of the quantization noise depends on the averagelevel bC . It is given by
σ2η2C
= bC − (bC)2. (2)
A proof of this equality and a complete characterization ofthe noise η2C is given in [5].
Considering a low perceptual impact requirement in themodulation process, the detector operates in a small rangeof the luminance range [0, 1] of each color channel. For thisreason, gsC in (1) can be approximated to a linear model[7] and gsC is approximated to 1 for simplicity. Assumingthat bC is generated from a constant color region, that is,bC(n) = b0C = bC , where b0C is the average color of themodulated character prior to printing, (1) can be written as(using an one-dimension notation)
yC(n) ={αC [b0C + η2C (n)] + η1C (n)
} ∗ hps(n) + η3C (n),(3)
The term αC represents a gain (see gprC in (1)) that variesslightly throughout a full page due to non-uniform printertoner distribution. Due to its slow rate of change, αC ismodeled as constant in n but it varies with each realiza-tion i satisfying αC ∼ N (μαC , σ2
αC), where i represents
the i−th character in TCM watermarking.Due to the nature of the noise (discussed in Section 2)
and based on experimental observations, η1C and η3C canbe generally modeled as zero-mean mutually independentGaussian noise [7, 12].
3.2. Detection Metric
Human vision experiments illustrate that variations in thegreen channel are more easily perceived than variations inthe red and blue channels [11, 10]. This is supported by ex-periments performed in this paper. For this reason, a mod-ulation scheme which modifies only the blue and red chan-nels is used in this work. The green channel is used as areference. This increases the robustness of the method, as

illumination variations and scanner and printing gains af-fect all the channels. Based on the characteristics of the ob-served printed and scanned characters, the proposed detec-tion metric is given by
d = [db dr]� (4)
where � represents the transpose operation and
db = dB − dG (5)
where
dB =1N
N∑n=1
yB(n) =1N
N∑n=1
{αB[wB + η2B(n)]
+ η1B(n)} ∗ hps(n) + η3B(n),
(6)
represents the average value in the blue channel after print-ing and wB represents the modulation level in the blue chan-nel prior to printing, such that bB = wB . Similarly, dG rep-resents the average value in the green channel. α representsand offset gain that varies from character to character [5].A statistical analysis shows that the expected value μdb
andthe variance σ2
dbof db are given by
μdb= E{db} = E{dB − dG} = μαB wB − μαGwG (7)
and
σ2db
=(σ2
αB+ μ2
αB)σ2
η2B+ σ2
η1B+ σ2
η3B
N
+(σ2
αG+ μ2
αG)σ2
η2G+ σ2
η1G+ σ2
η3G
N+ w2
Bσ2αB
+ w2Gσ2
αG,
(8)
where σ2η2B
= (wB − w2B).
First, assume that the detection is performed using onlythe blue channel, for example. Considering the S = 2 (or 1bit) case, for example, the conditional error probability p01
of receiving a bit 0 given that bit 1 was transmitted is de-scribed by p01 = Pr(db > λB|bit = 1), where λb is adecision threshold. Defining the complementary error func-
tion erfc(x) = 2√π
∫ ∞x
e−t2dt, p01 = 12erfc
(λb−μdb/1√
2σ2db/1
),
where μdb/1 and σ2db/1 are respectively the mean and the
variance of db for bit 1. Equivalently, if bit 0 is transmit-ted, the conditional error probability is given by p10 =12 erfc
(μdb/0−λb√
2σ2db/0
), where μdb/0 and σ2
db/0 are respectively
the mean and the variance of db for bit 0. Finally, the aver-age error probability is expressed by
Pedb= P0p10 + P1p01 (9)
where P0 and P1 are the probabilities of occurrence of bits0 and 1, respectively. A similar approach is valid for the redchannel.
3.3. Bhattacharyya Bound on the Error Rate
To reduce the error rate, the metric db and dr of the blueand red channels described in (4) are combined into a singlemetric. For this task, the Bayes decision rule is employed inthis work. Because the metrics are assumed normally dis-tributed, the Bayes decision rule guarantees the lowest av-erage error rate [9].
An upper bound on the error rate is given by the Bhat-tacharyya bound for Gaussian variables [9]. Therefore, theclassification error probability is:
Ped =√
P0P1e−k (10)
where k is given by
k =18(μd/1 − μd/0)
T
(Σ/0 + Σ/1
2
)−1
(μd/1 − μd/0)
+12
ln|Σ/0+Σ/1
2 |√|Σ/0||Σ/1|(11)
where Σ/0 and Σ/1 represent the covariance matrices cor-responding to bit 0 and bit 1, respectively.
Notice that k depends on the results from (7) and (8).Applying (11) to (10), the plot presented in Fig. 2 is gener-ated. This figure illustrates the upper bound on the error rategiven in (10) as a function of the modulation level in the redand blue channels, given by wR and wB , respectively. Thenoise parameters for generating this plot are given in the ex-periments section.
Notice that modulating both color channels yields alower error rate than modulating only one color channel,at the expense of increased perceptual impact. The percep-tual impact caused by the color modulation is discussed inthe next section.
4. Perceptual Evaluation of Color Modulation
Using the CIELAB color difference metric discussed in[14], it is possible to estimate the perceptual impact of themodulation level, as the original image color is black (blackcharacters). The perceptual distortion metric D is given by:
D =√
(L0 − L)2 + (a0 − a)2 + (b0 − b)2 (12)
where L0, a0 and b0 represent the parameters of the originalcolor in the L∗a∗b∗ color space.
The graph in Fig. 3 shows the perceptual difference Dbetween black and a color generated by the modulation ofthe blue and red channels. In this figure, the green channelis not modulated.

0.7
0.8
0.9
1
0.7
0.8
0.9
1
−6
−5
−4
−3
−2
−1
wRw
B
Log(
Pe )
Pe = 10−3
Figure 2. Bhattacharyya upper bound on theerror probability using the Bayes classifier,as a function of the modulation in the red andblue channels.
0.70.8
0.91
0.70.8
0.91
0
20
40
60
80
wR
wB
Dis
tort
ion
D
Figure 3. Perceptual impact based on theCIELAB color space caused by the charactercolor modulation, as a function of the modu-lation in the red and blue channels.
5. Optimum Modulation Level Consider-ing Error Probability and Perceptual Im-pact
Considering the least perceptual modulation (from Sec-tion 4) for a given error rate (from Section 3.3), the follow-
0.70.8
0.91
0.70.8
0.910
20
40
60
80
X: 0.8863Y: 0.7608Z: 39.03
wR
wB
Dis
tort
ion
D
Figure 4. Illustration of the distortion as afunction of wB and wR, considering an errorprobability Pe = 0.0001.
ing optimization is performed
argminwB ,wR∈[0,1]|Ped
=P ′D(wB, wR) (13)
which returns the values wB and wR for which the dis-tortion D is minimum, constrained to an error probabilityequal to Ped = P ′. This optimization process cannot be per-formed analytically. Instead, the modulation values whichcorrespond to P ′ are tested regarding the distortion given in(12), where the minimum value is chosen as optimum.
Fig. 4 illustrates the distortion curve as a function ofthe modulation wB and wR, for an error probability up-per bound equal to Ped = 0.0001, based on the plot givenin Fig. 2. Notice that when the distortion parameters of PSchannel used are obtained, the error rates are obtained via(11) and the modulation levels that cause the least distor-tion (according to (12)) can be employed.
6. Auxiliary Metric to Improve Detection
In color printing, the dithering matrices for each channelare rotated to be as far apart in angle as possible. This ro-tation is usually set to 0◦ for the Y screen, 15◦ for the Mscreen, 45◦ for the K screen, and 75◦ for the C screen. Thisis illustrated in Fig. 5, which shows a halftone test target, ex-tracted from ‘The Londoner’ newspaper. Therefore, when acharacter suffers color modulation, an “orientation modula-tion” also occurs as a consequence. This section proposes

Figure 5. Example of color halftoning test tar-gets, illustrating the C, M, Y and K colorants.
to use this characteristic as an auxiliary metric to help im-proving the detection in TCM.
Because the expected screen angle is known, the use of adirectional edge detection filter “matched in angle” is a sim-ple and efficient solution. The average energy of the filteredversion of the character is an efficient discrimination met-ric to determine the predominant screen angle, therefore de-termining whether or not the character is color modulated.The maximum energy is attained when the filtering angle isset to 90◦ to the predominant screen angle of the modulatedcharacter, as the filtered patterns energies vary dependingon the color used. The experiments illustrate the applicabil-ity of this type of detection.
7. Experiments
This section presents Monte Carlo simulations to illus-trate the applicability of TCM and the reduced error ratewhen using the Bayes classifier to combine the color chan-nels. It also presents experiments to validate the error rateanalyses derived in Section 3, in addition to comparative re-sults between TLM and TCM.
As expected, it was noticed that the distortion param-eters and the noise in the PS channel vary according tothe color channel and the printing and scanning devicesused. The printing and scanning resolutions were set to 600and 300 dots/inch and pixels/inch, respectively. The exper-iments were conducted with printers HP IJ-855C and Ri-coh aficio 2238c, HP SJ-5P and Canon CanoScan LiDE 20.Typical values for the parameters in (1) are ση1R = 0.015,ση3R = 0.012, μαR = 0.83, σαR = 0.04, for the red chan-nel, ση1G = 0.02, ση3G = 0.01, μαG = 0.85, σαG = 0.03,for the green channel, and ση1B = 0.015, ση3B = 0.01,μαB = 0.82, σαB = 0.03, for the blue channel.
The remaining noise terms σ2η2R
and σ2η2B
are level de-pendent and are given by σ2
η2B= wB − w2
B and σ2η2R
=wR − w2
R, as presented in (2), in Section 3.1.
These values were estimated using test targets of differ-ent colors, analyzing only the corresponding color channel.If different PS devices are used, a new parameter estima-tion is necessary if the user wishes to determine the theoret-ical error rate using (9).
To model the low-pass effect of the PS channel repre-sented by hps in (1), the filter described in [3] is used inthis paper, which is a Butterworth filter of order 1 and cut-off frequency equal to 0.17. Using the noise, gain and blur-ring filter parameters described above, a character distortedwith the proposed PS model is perceptually similar to an ac-tual printed and scanned character.
7.1. Experiment 1: Blue Channel Modulation
Consider the 1 bit/element case (S = 2). A large se-quence of K = 30360 characters (as in ‘abcdef...’ ) isprinted, with font type ‘Arial’, size 12 points. In the experi-ments small text elements such as commas and dots are notwatermarked. Due to the small number of pixels in these el-ements, they are more susceptible to segmentation and de-tection errors.
Prior to printing, the blue channel of the character se-quence was modulated with a gain wBi = 1 (no color al-teration) for odd i, i = 1, 3, . . . , K − 1, and with a gainwBi = 0.81 for even i, i = 2, 4, . . . , K . Using these values,empirical tests indicate that it is hard for a human observerto distinguish between a modulated and a non-modulatedcharacter. In this case, according to the perceptual distor-tion metric described in (12), the distortion is given byD = 34.67. In fact, the empirical tests performed with hu-man observers have illustrated that D < 40 are usually notperceivable by the human eye.
The elements with no color alteration (wBi = 1) carrybit 0, and the elements modulated with wBi = 0.81 carrybit 1. The task is to classify each printed character as hav-ing a bit 0 or bit 1 embedded into it. In this example, the dif-ference db = dB−dG is used as a detection metric, as givenin (5).
To retrieve the embedded information, the document isscanned and the text is segmented from the background us-ing simple thresholding. Segmentation errors are not ob-served in this set of tests, however it is clear that they maycause synchronization detection errors. The use of channelcoding is an efficient option to reduce the bit errors causedby wrong segmentation [6].
The histogram of the detection results are presented inFig. 6. The error rates for this experiment are presented inTable 1, in the row corresponding to db. For comparison,this table also presents error rates using simple TLM, wherethe three channels are modulated with the same gain, sim-ulating a single-channel gray level modification only. Withthe same equipment and resolutions, the modulation gains

−0.1 0 0.1 0.2 0.3Blue Channel ( d
b )
Bit 1Bit 0
Figure 6. Histogram of the detection metricdB, for the blue channel.
for TLM was 0.81, which causes D = 39.59, also makingthe modulation hard to perceive. The modulation level us-ing TLM was evaluated using only the average luminanceas a detection metric. Although additional metrics can beused in TLM (variance and higher order statistics, as dis-cussed in [4]), these additional metrics can also be appliedin TCM. Notice that color modulation presents a lower er-ror rate in comparison with simple luminance modulation.
7.2. Experiment 2: Red Channel Modulation
This experiment is similar to Experiment 1, however thered channel is modulated, with a gain wRi = 0.85 fori = 2, 4, . . . , K . This gain value was modified such thatthe distortion D remained the same as in Experiment 1, thatis, D = 34.67. In this example, the difference dr = dR−dG
is used as a detection metric, as described in (5). The his-togram of the detection results and the error rates for this ex-periment are given in Fig. 7 and Table 1, respectively. No-tice that when no modulation is performed (bit 0), no differ-ence between the averages of the red and green channels isexpected, in agreement with the experimental results.
7.3. Experiment 3: Combined Blue-Red ChannelModulation
In this experiment, the blue and the red channels aremodulated in characters ci, i = 2, 4, . . . , K . The modula-tion gain is given by wB = 0.76 and wR = 0.88, which arethe modulation values that yield the minimum distortion foran error probability equal to 0.0001, according to the re-sult presented in Figure 4. In this case, the distortion of themodulated characters is given by D = 39.03.
−0.2 −0.1 0 0.1 0.2 0.3 0.4Red Channel ( d
r )
Bit 1Bit 0
Figure 7. Histogram of the detection metricdR, for the red channel.
Detection Number ErrorType of Errors RateTLM 139 4.6 × 10⁻³
Blue Modulation (db) 35 1.2 × 10⁻³
Red Modulation (dr) 53 1.7 × 10⁻³
Red-Blue Modulation (d2) 6 1.96 × 10⁻⁴
Orientation (da) 1040 3.39 × 10⁻²
Red-Blue-Orientation (d3) 2 6.59 × 10⁻⁵
Table 1. Experimental error rates for TCM andTLM.
In the detection, the information from the blue and redchannels are combined according to the Bayes classifier, asdescribed in Section 3.3. Fig. 8 shows a scattered plot withthe decision function obtained for this set of tests.
The experimental error rates combining the two chan-nels with the Bayes classifier is given in Table 1, in the rowcorresponding to d2. This illustrates that the detection us-ing two color channels is more efficient than single channeldetection, at the expense of a slight increase in the distor-tion. However, this distortion is still hardly perceived by ahuman observer.
7.4. Experiment 4: Auxiliary Angular Detection
This experiment presents the improved performance us-ing the approach described in Section 6, where the averageenergy da of the output of the directional filter fdir is usedas a detection metric. The experiments illustrate that whenda is used alone, it does not bring an error rate as low as themetrics db and dr, as shown in Table 1. However, da can becombined with db and dr used in Experiments 1 and 2 us-

−0.2 0 0.2 0.4 0.6−0.2
0
0.2
0.4
Red Channel (dr )
Blu
e C
hann
el (
d b )
Bit 0Bit 1
Figure 8. Scatter plot illustrating curve sep-arating the detection values for bit 1 and bit0.
ing the Bayesian approach, to help reducing the error rate.Results using this approach are also given in Table 1, in therow corresponding to d3.
Fig. 9 shows a 3-D plot showing a surface separating themodulated from the non-modulated characters. The direc-tional filter used in this example was oriented at 165◦, whichcorresponds to the cyan screen angle plus 90◦. As the pre-dominant screen used to represent blue is the cyan (althoughit is mixed with magenta for plain blue and with the othercolors for dark blue), 165◦ is the filtering angle which out-puts the greatest energy. Notice that for devices which usedifferent printing angles/halftoning algorithms, an evalua-tion of the angular/texture properties is necessary before ap-plying this detection metric.
7.5. Experiment 5: Variable Modulation Gains
This experiment extends ‘Experiment 3’ by observingthe error rates for different gains in the red-blue channelmodulation case. Instead of testing only for wBi = 0.76and wRi = 0.88, i = 2, 4, . . . , K (even i), the testedgains are wRi = wBi = 0.97, wRi = wBi = 0.9,wRi = wBi = 0.84, for even i. The goal of this experi-ment is to evaluate how accurate is the upper bound on theerror rate compared to practical results.
Fig. 10 shows a plot with the theoretical (full line) up-per bound on the error probability described by (11) de-rived in the analysis of Section 3, as a function of the gainwR = wB . Because wR = wB , a two-dimensional plot isused to illustrate the errors, instead of the 3-D plot shownin Fig. 2. Figure 10 also shows the experimental error rates(represented by crosses) as a function of the difference be-tween the original character luminance and the gain wB,R.This figure indicates the similarity between the theoreticaland the experimental results after printing and scanning.
00.10.20.3
0
0.2
0.4
0.035
0.04
0.045
0.05
Red Channel (
d r )
Blue Channel ( db )
Filt
er E
nerg
y
Bit 0Bit 1
Figure 9. Plot illustrating surface separatingthe detection values for bit 1 and bit 0, usingdb, dr and da as detection metrics.
0 0.02 0.04 0.06 0.08 0.1 0.12 0.14 0.16 0.1810
−4
10−3
10−2
10−1
100
TheoreticalExperimental
Figure 10. Error probability for differentgains, using wB = wR = 0.97, 0.9, 0.84. Thehorizontal axis indicates the luminance dif-ference between the original and the modu-lated character, for the red and blue chan-nels. The full line represents the theoreticalerror rate derived in Section 3, the cross dotsrepresent the experimental error rates afterPS.
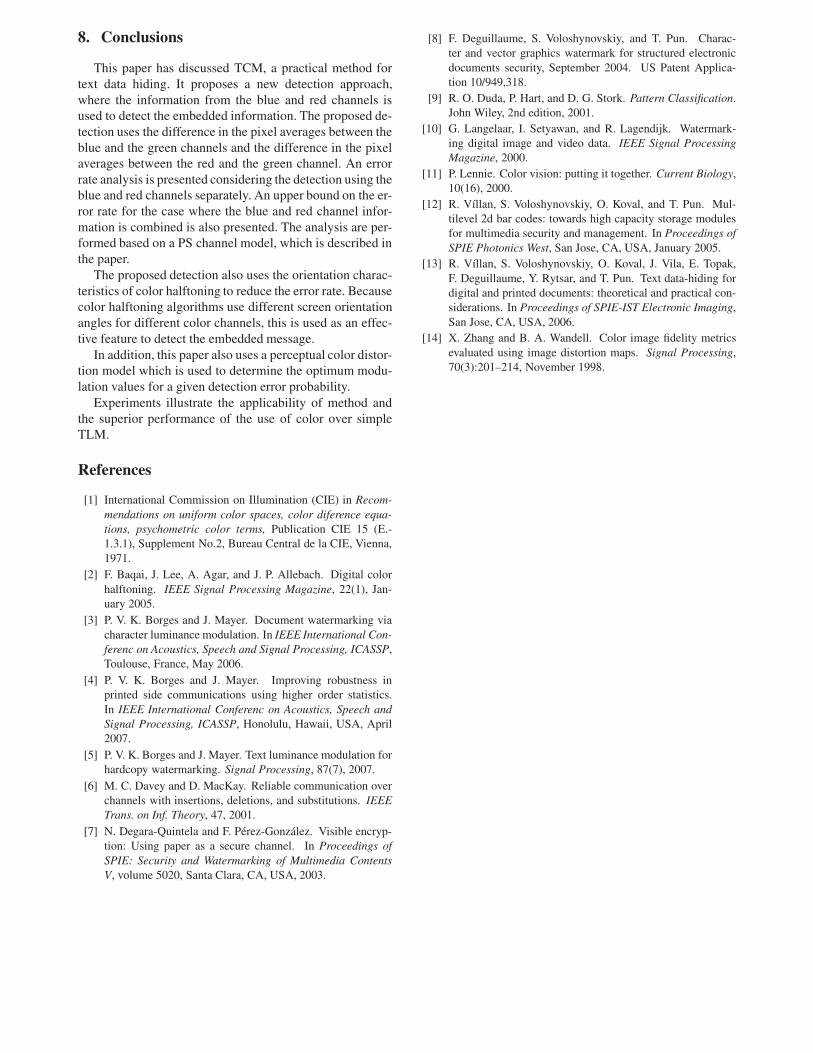
8. Conclusions
This paper has discussed TCM, a practical method fortext data hiding. It proposes a new detection approach,where the information from the blue and red channels isused to detect the embedded information. The proposed de-tection uses the difference in the pixel averages between theblue and the green channels and the difference in the pixelaverages between the red and the green channel. An errorrate analysis is presented considering the detection using theblue and red channels separately. An upper bound on the er-ror rate for the case where the blue and red channel infor-mation is combined is also presented. The analysis are per-formed based on a PS channel model, which is described inthe paper.
The proposed detection also uses the orientation charac-teristics of color halftoning to reduce the error rate. Becausecolor halftoning algorithms use different screen orientationangles for different color channels, this is used as an effec-tive feature to detect the embedded message.
In addition, this paper also uses a perceptual color distor-tion model which is used to determine the optimum modu-lation values for a given detection error probability.
Experiments illustrate the applicability of method andthe superior performance of the use of color over simpleTLM.
References
[1] International Commission on Illumination (CIE) in Recom-mendations on uniform color spaces, color diference equa-tions, psychometric color terms, Publication CIE 15 (E.-1.3.1), Supplement No.2, Bureau Central de la CIE, Vienna,1971.
[2] F. Baqai, J. Lee, A. Agar, and J. P. Allebach. Digital colorhalftoning. IEEE Signal Processing Magazine, 22(1), Jan-uary 2005.
[3] P. V. K. Borges and J. Mayer. Document watermarking viacharacter luminance modulation. In IEEE International Con-ferenc on Acoustics, Speech and Signal Processing, ICASSP,Toulouse, France, May 2006.
[4] P. V. K. Borges and J. Mayer. Improving robustness inprinted side communications using higher order statistics.In IEEE International Conferenc on Acoustics, Speech andSignal Processing, ICASSP, Honolulu, Hawaii, USA, April2007.
[5] P. V. K. Borges and J. Mayer. Text luminance modulation forhardcopy watermarking. Signal Processing, 87(7), 2007.
[6] M. C. Davey and D. MacKay. Reliable communication overchannels with insertions, deletions, and substitutions. IEEETrans. on Inf. Theory, 47, 2001.
[7] N. Degara-Quintela and F. Perez-Gonzalez. Visible encryp-tion: Using paper as a secure channel. In Proceedings ofSPIE: Security and Watermarking of Multimedia ContentsV, volume 5020, Santa Clara, CA, USA, 2003.
[8] F. Deguillaume, S. Voloshynovskiy, and T. Pun. Charac-ter and vector graphics watermark for structured electronicdocuments security, September 2004. US Patent Applica-tion 10/949,318.
[9] R. O. Duda, P. Hart, and D. G. Stork. Pattern Classification.John Wiley, 2nd edition, 2001.
[10] G. Langelaar, I. Setyawan, and R. Lagendijk. Watermark-ing digital image and video data. IEEE Signal ProcessingMagazine, 2000.
[11] P. Lennie. Color vision: putting it together. Current Biology,10(16), 2000.
[12] R. Vıllan, S. Voloshynovskiy, O. Koval, and T. Pun. Mul-tilevel 2d bar codes: towards high capacity storage modulesfor multimedia security and management. In Proceedings ofSPIE Photonics West, San Jose, CA, USA, January 2005.
[13] R. Vıllan, S. Voloshynovskiy, O. Koval, J. Vila, E. Topak,F. Deguillaume, Y. Rytsar, and T. Pun. Text data-hiding fordigital and printed documents: theoretical and practical con-siderations. In Proceedings of SPIE-IST Electronic Imaging,San Jose, CA, USA, 2006.
[14] X. Zhang and B. A. Wandell. Color image fidelity metricsevaluated using image distortion maps. Signal Processing,70(3):201–214, November 1998.