Effects of Roof Pitch on Air Flow and Heating Load of ... - MDPI
23
Sustainability 2012, 4, 1999-2021; doi:10.3390/su4091999 sustainability ISSN 2071-1050 www.mdpi.com/journal/sustainability Article Effects of Roof Pitch on Air Flow and Heating Load of Sealed and Vented Attics for Gable-Roof Residential Buildings Shimin Wang and Zhigang Shen * The Durham School of Architectural Engineering and Construction, University of Nebraska—Lincoln, 113 NH, Lincoln, NE 68588-0500, USA; E-Mail: [email protected] * Author to whom correspondence should be addressed; E-Mail: [email protected]; Tel.: +1-402-472-9470; Fax: +1-402-472-4087. Received: 29 June 2012; in revised form: 10 August 2012 / Accepted: 20 August 2012 / Published: 30 August 2012 Abstract: Pitch value is an important consideration in residential gable roof design and construction. However, how roof pitch, coupled with air flows in attic space, affects the energy performance of building attics has been barely investigated. In this paper, a 2D unsteady computational fluid dynamics (CFD) model is employed to investigate the effects of roof pitch on air flow and heating load of both sealed and vented attics for gable-roof residential buildings. The simulation results show that air flow in the sealed attics is steady and asymmetric, while that in the vented attics is a combination of an essentially symmetric base flow and a periodically oscillating flow. For both the sealed and vented attic cases, the heating load is found to increase with the roof pitch, and the heat transfer of turbulent air flow in attic space can be satisfactorily correlated by a simple relationship between appropriately defined Nusselt number and Rayleigh number. Keywords: attic; roof pitch; air flow; heating load; turbulence; CFD Nomenclature c p specific heat, J kg −1 K −1 f elliptic relaxation function g gravitational acceleration, m s −2 h heat transfer coefficient, W m −2 K −1 H attic height, m k turbulence kinetic energy, m 2 s −2 L turbulence length scale, m Nu Nusselt number p pressure, Pa p atm atmospheric pressure, Pa q heat flux, Wm −2 OPEN ACCESS
-
Upload
khangminh22 -
Category
Documents
-
view
5 -
download
0
Transcript of Effects of Roof Pitch on Air Flow and Heating Load of ... - MDPI

Sustainability 2012, 4, 1999-2021; doi:10.3390/su4091999
sustainability ISSN 2071-1050
www.mdpi.com/journal/sustainability
Article
Effects of Roof Pitch on Air Flow and Heating Load of Sealed and Vented Attics for Gable-Roof Residential Buildings
Shimin Wang and Zhigang Shen *
The Durham School of Architectural Engineering and Construction, University of Nebraska—Lincoln,
113 NH, Lincoln, NE 68588-0500, USA; E-Mail: [email protected]
* Author to whom correspondence should be addressed; E-Mail: [email protected];
Tel.: +1-402-472-9470; Fax: +1-402-472-4087.
Received: 29 June 2012; in revised form: 10 August 2012 / Accepted: 20 August 2012 /
Published: 30 August 2012
Abstract: Pitch value is an important consideration in residential gable roof design and
construction. However, how roof pitch, coupled with air flows in attic space, affects the
energy performance of building attics has been barely investigated. In this paper, a 2D
unsteady computational fluid dynamics (CFD) model is employed to investigate the effects
of roof pitch on air flow and heating load of both sealed and vented attics for gable-roof
residential buildings. The simulation results show that air flow in the sealed attics is steady
and asymmetric, while that in the vented attics is a combination of an essentially
symmetric base flow and a periodically oscillating flow. For both the sealed and vented
attic cases, the heating load is found to increase with the roof pitch, and the heat transfer of
turbulent air flow in attic space can be satisfactorily correlated by a simple relationship
between appropriately defined Nusselt number and Rayleigh number.
Keywords: attic; roof pitch; air flow; heating load; turbulence; CFD
Nomenclature
cp specific heat, J kg−1 K−1
f elliptic relaxation function
g gravitational acceleration, m s−2
h heat transfer coefficient, W m−2 K−1
H attic height, m
k turbulence kinetic energy, m2 s−2
L turbulence length scale, m
Nu Nusselt number
p pressure, Pa
patm atmospheric pressure, Pa
q heat flux, Wm−2
OPEN ACCESS

Sustainability 2012, 4 2000
Q heat transfer rate, W/m
R thermal resistance, K m2/W
Ra Rayleigh number
S strain rate, s−1
tc ceiling thickness, m
T temperature, K
T0 reference temperature, K
Tin inlet air temperature, K
u velocity component, m/s
2v turbulence velocity variance scale, m2 s−2
W half width of attic, m
x,y coordinates, m
Greek symbols
β thermal expansion coefficient, K−1
ε turbulence dissipation rate, m2 s−3
λ thermal conductivity, W m−1 K−1
λc ceiling thermal conductivity, W m−1 K−1
µ molecular viscosity, kg m−1 s−1
µt eddy viscosity, kg m−1 s−1
ρ density, kg m−3
σk effective turbulence Prandtl number for k
σε effective turbulence Prandtl number for ε
σT effective turbulence Prandtl number for T
τ turbulence time scale, s
Subscripts
a air
c ceiling
cb ceiling-bottom
ct ceiling-top
r roof
rb roof-bottom
rt roof-top
t total
1. Introduction
Pitched roofs are widely used in residential building construction. In general, houses in areas with
more precipitations have steeper roofs. The steepness of a roof is quantitatively measured by roof
pitch, which is usually expressed as a rational fraction between the vertical rise and the corresponding
horizontal run distance.
For a given roof footprint, a steeper roof requires a larger area of roof material and forms a larger
and higher attic space. Therefore, it is natural to expect that roof pitch, coupled with air flows in attic
space, will affect the energy performance of a building. The primary objective of this study is to
numerically investigate the effects of roof pitch on air flow and heating load of sealed and vented attics
for gable-roof residential buildings, which can be reasonably represented by 2D numerical models.
Attic ventilation has been a common practice in the United States since 1940s [1]. For decades, the
ASHRAE Handbook—Fundamentals has included recommendations for attic ventilation in residential
roof construction, and many existing building codes across the United States (e.g., the BOCA National
Building Code, International Building Code, Standard Building Code, and Uniform Building Code)
require attic spaces to be ventilated [2]. Typically, the net free vent area (unobstructed area where air
can freely flow from outside to inside to outside) is required to be 1/150 of the floor area of the attic
space being ventilated, and a reduction of the ventilation ratio from 1/150 to 1/300 is allowed only if at
least 50% of the ventilating area is in the upper portion of the space and a continuous vapor retarder is
installed on the warm side of the ceiling in cold climates [3].
Sustainability 2012, 4 2001
Despite these long-established guidelines for attic ventilation in residential building construction
and retrofit, the technical data used to derive these ventilation requirements are very limited [2].
Recent research has suggested that the advantages and disadvantages of providing attic ventilation
need to be evaluated on a case-by-case basis, i.e., ventilation should be treated as a design option
instead of a universal requirement (e.g., [2,4]). It is anticipated that this study will help us to better
understand the natural ventilation phenomenon in different attic designs, by providing quantitative data
on how airflow and heating load are affected by roof pitches. The quantified relationship between roof
pitches, and airflow and heating load will provide much-needed scientific guidance for residential
roof design.
The majority of the previous research on heat transfer in attic spaces is concerned with natural
convection in triangular enclosures, as reviewed by Kamiyo et al. [5] and by Saha and Khan [6].
Although the air flow in real residential attics is almost always turbulent, a considerable number of
experimental and numerical studies have been devoted to the analysis of flow and heat transfer under
laminar conditions (e.g., [7–16]), and only a few studies investigated turbulent flow and heat transfer
in sealed attics. For example, Ridouane et al. [17] employed a low-Reynolds-number k-ε model to
simulate the turbulent natural convection in an air-filled isosceles triangular enclosure representing
attic spaces under winter conditions, and Talabi et al. [18] numerically investigated the turbulent
natural convections in sealed attics under both summer and winter conditions using the Reynolds stress
turbulence model and considering both isothermal and isoflux boundary conditions. Air flow and
heat transfer in vented attic spaces have been scarcely investigated in the past. For example,
Medina et al. [19,20] proposed a correlation-based mathematical model for vented residential attics
and compared model predictions with experimental data, and Moujaes and Alsaiegh [21] employed a
finite element model to simulate the thermal effects of placing a radiant barrier system inside a vented
residential attic for a case study under summer weather conditions. In a recent study [22], we
employed a two-dimensional steady-state computational fluid dynamic (CFD) model to simulate the
buoyancy-driven turbulent ventilation and heat transfer in a triangular attic space of a gable-roof
residential building under winter conditions. The impacts of ambient air temperature, vent size, and
ceiling insulation on heating load and ventilating air flow rate suggested that both sufficient ventilation
and insulation are needed to ensure the proper functions of the attic and its energy efficiency. The attic
studied in [22], however, was assumed to have a fixed roof pitch of 5/12.
In the present study, the effects of roof pitch on the thermal performance of gable-roof residential
buildings are investigated by simulating attics with roof pitches of 3/12, 5/12, 8/12, 12/12, and 18/12,
respectively. For each roof pitch value, both a sealed attic case and a vented attic case are modeled.
Similar to [22], the turbulent air flow and natural convection heat transfer inside the attics are modeled
in terms of the v2f model [23–25], which has been shown by previous studies (e.g., [26–28]) to be the
best Reynolds-averaged Navier-Stokes (RANS) model for indoor air flow simulation. A major
difference from [22] is that an unsteady numerical formulation is adopted in this study, because the
steady model could not produce convergent solutions for some cases with roof pitches higher than
8/12, even after carefully adjusting the various under-relaxation factors. Unsteady RANS (URANS)
modeling has been shown to be an effective approach to overcome numerical stiffness and improve
solution convergence in previous studies for natural convection flows in enclosures [18,29–32]. Such
an approach is also a recommended strategy in commercial CFD manuals [33] for solving natural

Sustainability 2012, 4 2002
convection problems. In the following sections, the numerical model is introduced followed by
detailed discussion of the numerical simulation results.
2. Numerical Model
A schematic diagram of a cross-section plan of the physical model is shown in Figure 1. In the
direction perpendicular to the cross-section shown in Figure 1, it is assumed that the building is long
enough to ignore the effects of the gable-end walls, and thus the problem is simplified to two
dimensional. The modeled attic space is in a shape of an isosceles triangle, with a ceiling width of 2W
and a height of H, resulting in a pitch of H/W. In this study, the modeled attic is assumed to have a
fixed ceiling width of 8 m and a height varying between 1 m and 6 m, corresponding to a roof pitch
varying from 3/12 to 18/12. For simplicity, neither roofs nor ceiling trusses are included in the model,
and the computational domain is only occupied by air, which is assumed to be a Boussinesq fluid with
a reference temperature, T0, that is specified to the outside ambient air temperature to correctly
calculate the buoyancy effects. In all the cases reported in this study, T0 = 267 K is assumed. In order
to correctly account for the thermal resistances of the ceiling and roofs, which are excluded from the
computational domain, convection-type boundary conditions are applied to both the ceiling and roof
boundaries. For example, energy balance across the ceiling thickness gives
cbctccb0c
c0 TThTT
ty
Tyy
(1)
where T and λ are the temperature and thermal conductivity of air; tc and λc are the thickness
and thermal conductivity of the ceiling; Tct and Tcb are the temperatures at the ceiling-top and
ceiling-bottom, respectively; and the heat transfer coefficient hc is the reciprocal of the ceiling
thermal resistance.
Sustainability 2012, 4 2003
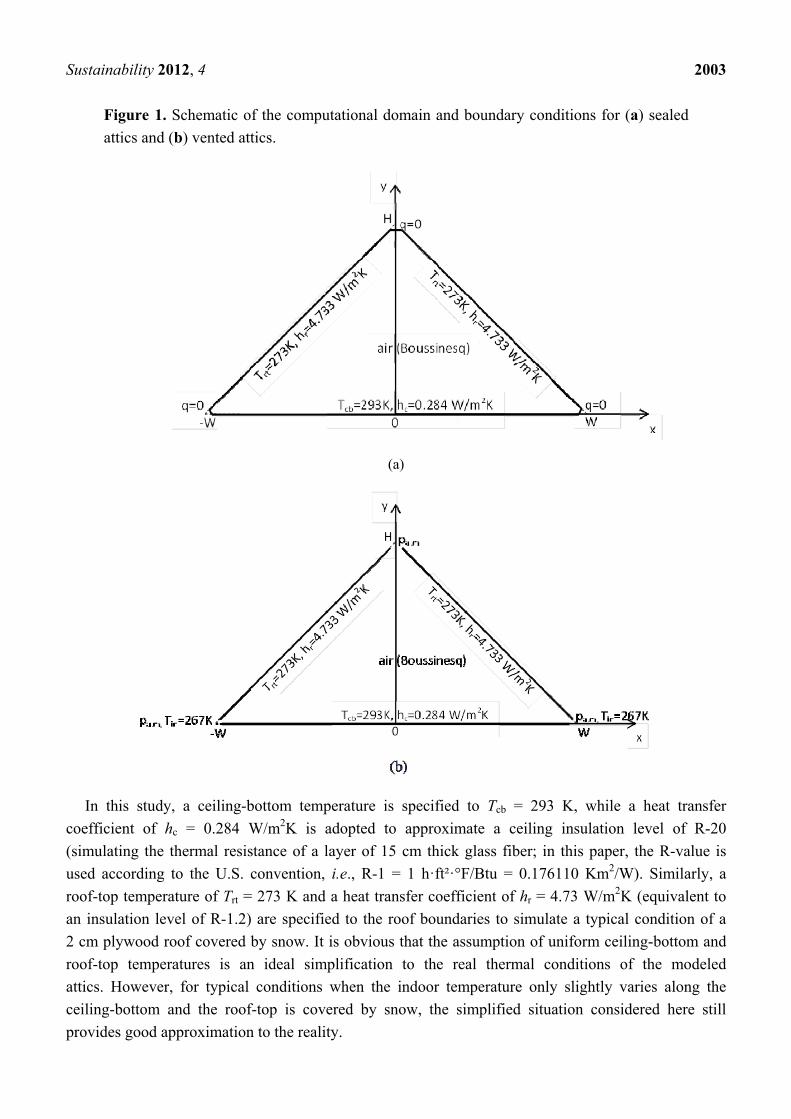
Figure 1. Schematic of the computational domain and boundary conditions for (a) sealed
attics and (b) vented attics.
(a)
In this study, a ceiling-bottom temperature is specified to Tcb = 293 K, while a heat transfer
coefficient of hc = 0.284 W/m2K is adopted to approximate a ceiling insulation level of R-20
(simulating the thermal resistance of a layer of 15 cm thick glass fiber; in this paper, the R-value is
used according to the U.S. convention, i.e., R-1 = 1 h·ft²·°F/Btu = 0.176110 Km2/W). Similarly, a
roof-top temperature of Trt = 273 K and a heat transfer coefficient of hr = 4.73 W/m2K (equivalent to
an insulation level of R-1.2) are specified to the roof boundaries to simulate a typical condition of a
2 cm plywood roof covered by snow. It is obvious that the assumption of uniform ceiling-bottom and
roof-top temperatures is an ideal simplification to the real thermal conditions of the modeled
attics. However, for typical conditions when the indoor temperature only slightly varies along the
ceiling-bottom and the roof-top is covered by snow, the simplified situation considered here still
provides good approximation to the reality.
Sustainability 2012, 4 2004
For all the cases investigated in this study, balanced vent areas are assumed. Both the left and right
soffit vents are assumed to be 1 cm wide, while the ridge vent is assumed to 2 cm wide, resulting in a
ventilation ratio of 1/200. For the sealed attic cases, as shown in Figure 1a, all the vents are represented
by wall boundaries and assumed to be adiabatic. For the vented attic cases, as shown in Figure 1b,
pressures at the soffit and ridge vents are all specified to the atmospheric pressure, patm. Therefore, the
obtained air flow is purely driven by the thermally induced buoyancy forces, i.e., the stack effect.
At the soffit vents, the inlet air is assumed to enter at the ambient temperature of 267 K with a
turbulent intensity of 1%.
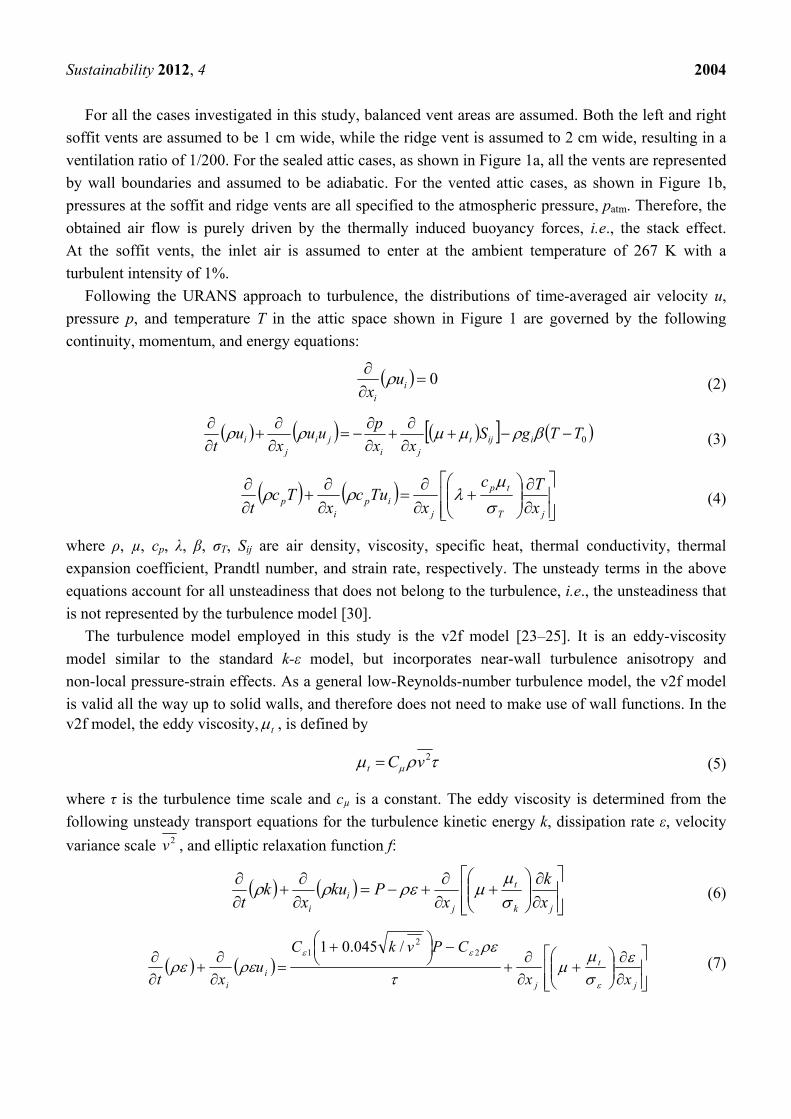
Following the URANS approach to turbulence, the distributions of time-averaged air velocity u,
pressure p, and temperature T in the attic space shown in Figure 1 are governed by the following
continuity, momentum, and energy equations:
0
ii
ux
(2)
0TTgSxx
puu
xu
t iijtji
jij
i
(3)
jT
tp
jip
ip x
Tc
xTuc
xTc
t
(4)
where ρ, µ, cp, λ, β, σT, Sij are air density, viscosity, specific heat, thermal conductivity, thermal
expansion coefficient, Prandtl number, and strain rate, respectively. The unsteady terms in the above
equations account for all unsteadiness that does not belong to the turbulence, i.e., the unsteadiness that
is not represented by the turbulence model [30].
The turbulence model employed in this study is the v2f model [23–25]. It is an eddy-viscosity
model similar to the standard k-ε model, but incorporates near-wall turbulence anisotropy and
non-local pressure-strain effects. As a general low-Reynolds-number turbulence model, the v2f model
is valid all the way up to solid walls, and therefore does not need to make use of wall functions. In the v2f model, the eddy viscosity, t , is defined by
2vCt (5)
where τ is the turbulence time scale and cµ is a constant. The eddy viscosity is determined from the
following unsteady transport equations for the turbulence kinetic energy k, dissipation rate ε, velocity
variance scale 2v , and elliptic relaxation function f:
jk
t
ji
i x
k
xPku
xk
t
(6)
j
t
ji
i xx
CPvkCu
xt
22
1 /045.01
(7)

Sustainability 2012, 4 2005
jk
t
ji
i x
v
xkvkfuv
xv
t
2222 6
(8)
kv
k
PC
kvC
x
fLf
j
2
2
2
12
22 5/3/2
1
(9)
where
ijijt SSP 2 (10)
i
j
j
iij x
u
x
uS
2
1 (11)
and the turbulence time scale and length scale are defined by
ijijSSCv
kk
23,6,maxmin
2
2/3
(12)
4/1
3
3
2
2/32/3
,6
,minmax
CSSCv
kkCL
ijij
L
(13)
The model constants take the following default values [23–25]:
3.1 ,1 ,85.0 ,23.0 ,22.0
,70 ,9.1 ,4.1 ,3.0 ,4.1 ,6.0 2121
kTLCC
CCCCC (14)
The governing equations formulated above are solved by the commercial CFD software Ansys
Fluent 13.0 [33], with the space variables being discretized by the finite volume method and time
domain discretized by the fully implicit scheme. The SIMPLE algorithm is employed for solving the
pressure and velocity coupling. The discretization of pressure is based on the PRESTO! scheme, while
the QUICK scheme is adopted for all the other variables. Non-uniform quadrilateral-dominant grids
are employed, and the boundaries are inflated with nodes tightly clustered near the walls to ensure that
the y+ value for the first grid close to the walls is everywhere less than 1.
The modeling results presented in this paper are based on grids consisting of about 30,000–50,000
nodes and a time step size of 1 s. All the calculations start from initial conditions of zero velocity and
uniform temperature. Within each time step, 20 iterations are executed. Numerical experiments show
that decreasing the time step to 0.5 s or requiring 40 iterations in each time step generate negligible
difference in solutions. In addition, a grid dependence test shows that refinement of the grids by
doubling the node numbers results in less than 2% difference in the total mass flow rate and wall heat
transfer rate results.
Sustainability 2012, 4 2006
3. Results and Discussion
3.1. Sealed Attics
For sealed attics with different roof pitches and subject to the boundary conditions depicted in
Figure 1a, it turns out that all the calculations converge to steady solutions after ~3000 time steps.
The predicted steady streamlines and isotherms are shown in Figure 2. Although the geometry and
boundary conditions are symmetric about x = 0, the predicted air flows in the sealed attics are
asymmetric, independent of the roof pitch variation. The asymmetric flow pattern found here is
consistent with the previous numerical studies (e.g., [17,18,22]) and the experimental results of
Holtzman et al. [10]. In this flow visualization experiment, smoke was slowly injected into an air-filled
triangular enclosure, which was constructed of aluminum plates with milled passageways for
circulating fluid to maintain isothermal surfaces and to impose a temperature difference between the
base and upper walls. When the applied temperature difference was small, corresponding to low values
of Grashof number, symmetric flow was observed in the isosceles triangle.
However, as the Grashof number was increased above a critical value, the flow was observed to
undergo a supercritical pitchfork bifurcation, in which case one of two possible mirror-image
asymmetric flows was obtained, since the symmetric flow was no longer physically stable.
The existence of multiple solutions above the pitchfork bifurcation point (including both stable and
unstable solutions) necessitates that particular care be exercised during numerical simulation,
e.g., setting sufficient iterations to allow finite numerical perturbations to grow, so that the solution
can deviate from an unstable symmetric result and eventually converge to one of the two stable
asymmetric results.
For all the roof pitches investigated, both the flow and temperature fields shown in Figure 2 are
dominated by multiple convection cells. Although the air flow in the biggest cell is always
counterclockwise, while that in its neighboring small cells is always clockwise, the spatial distribution
pattern of the convection cells constantly changes with the attic aspect ratio. It seems that the cells tend
to line horizontally in the low pitched attics but sit one over another in the high pitched attics.
Furthermore, the streamlines in Figure 2 show that the intensities of the major vortices increase with
the roof pitch and control the pattern change in isotherms. The observed increase of vortex intensity
with roof pitch is a manifest of the controlling role of Rayleigh number, which is proportional to the
cubic of attic height, on the intensity of natural convection in sealed attics. It can also be observed in
Figure 2 that for all the roof pitch cases, the predicted isotherms are tightly clustered along the ceiling
and roof walls, manifesting the slenderness of the turbulence boundary layers, and elevated along a
rising hot plume where the biggest convection cell meets its right-hand neighboring cell.
Figure 3 shows the predicted steady profiles of horizontal velocity and temperature along x = 0.
The air flow directions are clearly controlled by the convection cell distributions, and the peak air flow
rates generally increase with the roof pitch, as a stronger turbulent natural convection occurs at a
higher Rayleigh number associated with a higher pitch. On the other hand, the predicted air
temperatures along x = 0 are quite uniform within the height range of 0.05 < y/H < 0.9 (in contrast to
the sharp variation within the near-wall boundary layers) and decrease with the increasing roof pitch.
Such a dependence of attic air temperature on the roof pitch is also evident in Figure 4, which shows

Sustainability 2012, 4 2007
the predicted steady temperature distributions at the ceiling-top and roof-bottom boundaries. The peaks
and valleys of the curves in Figure 4 clearly exhibit the control role of the convection cells on the
temperature distributions. Furthermore, it can be observed that both the average ceiling-top (Figure 4a)
and roof-bottom (Figure 4b) temperatures tend to decrease, as the roof pitch increases. The decrease of
the average ceiling-top temperature with the increasing roof pitch shown in Figure 4a is a consequence
of that a stronger natural convection accompanying a higher roof pitch.
Figure 2. Predicted (left) steady streamlines (in kg/m s) and (right) isotherms (in K) in
sealed attics with roof pitches of 3/12, 5/12, 8/12, 12/12, and 18/12, respectively.

Sustainability 2012, 4 2008
Figure 3. Predicted steady profiles of (a) horizontal velocity and (b) temperature along the
central vertical line x = 0 for sealed attics with different roof pitches.
(a) (b)
Figure 4. Predicted steady temperatures at the ceiling (a) and roof (b) boundaries for
sealed attics with different roof pitches.
(a) (b)
For the given ceiling-bottom temperature of 293 K, a decrease in the ceiling-top temperature
indicates a greater temperature difference across the ceiling thickness and thus an increase in the attic
heat loss, reflecting the enhanced heat transfer effect associated with a stronger natural convection.
The decrease of the average roof-bottom temperature with the increasing roof pitch shown in Figure 4b
indicates that the heat flux across the roof boundary decreases as a result of reduced temperature
difference across the roof thickness. However, this decrease in roof heat flux is over compensated by
the increase of roof area with the roof pitch. The net effect of the reduced heat flux and increased heat
transfer area for a higher roof pitch is an increase in roof heat loss that exactly matches the increase in
ceiling heat loss, as the overall energy balance of the steady flow of attic air requires.
The results shown in Figures 2–4 provide detailed information for the velocity and temperature
distributions. Such information is critical for a better understanding of the fundamental mechanism of
momentum and heat transport in the sealed attic spaces. However, for a practical engineering purpose,
Sustainability 2012, 4 2009
it is the overall energy performance of the attic spaces that is of the most importance to construction
professionals and building owners. In the following, the obtained numerical results will be integrated
and a new heat transfer correlation will be developed to best quantify the overall energy performance
of the sealed attics.
The integrated heat transfer rates across the ceiling and roof boundaries are compared in Table 1 for
the different roof pitch cases. It is clear that the heat transfer rate across each boundary increases with
the roof pitch. For all the cases, the total heat gain from the ceiling is equal to the total heat loss
through the roofs (as a result of the overall energy balance for the modeled closed system), and reflects
the energy consumption share of the attic space in the heating load of the building. Table 1 suggests
that gable-roof buildings with high pitched roofs will consume more energy for space heating, as
compared with those with low pitched roofs. As the roof pitch increases from 3/12 to 5/12, 8/12, 12/12,
and 18/12, the attic heating load is predicted to increase by 0.6%, 2.1%, 4.6%, 6.6%, respectively.
Table 1. Predicted heat transfer through the ceiling and roof boundaries for sealed attics
with different roof pitches.
Pitch Heat Gain from Left Ceiling (W/m)
Heat Gain from Right Ceiling (W/m)
Heat Loss from Left Roof (W/m)
Heat Loss from Right Roof (W/m)
Qt (W/m)
3/12 17.21 16.79 15.78 18.21 34.00
5/12 17.33 16.87 15.98 18.22 34.20
8/12 17.57 17.15 17.31 17.41 34.72
12/12 17.98 17.60 17.71 17.86 35.58
18/12 18.30 17.93 17.99 18.24 36.23
It is also clear from Table 1 that regardless of the roof pitch, the heat gain from the right ceiling is
less than that from the left ceiling, whereas the heat loss through the right roof is more than that
through the left roof. This is mainly caused by the rising hot plume, as shown by the elevated
isotherms in Figure 2. The rising hot plume generates a hot spot at both the right ceiling and the right
roof boundaries. However, the increased temperature within the ceiling hot spot corresponds to a
reduced temperature difference across the ceiling thickness and thus results in less heat gain from the
right ceiling, as compared to the left ceiling, whereas the elevated temperature within the roof hot spot
involves an increased temperature difference across the roof thickness, resulting in a greater heat loss
through the right roof.
A correlation for heat transfer dominated by natural convection is typically expressed as a
relationship between Nusselt number (Nu) and Rayleigh number (Ra). In case of heat transfer in attic
spaces, both the dimensionless numbers should be defined based on a representative constant
temperature difference across the attic space, Tct − Trb. Although it is possible to obtain this
temperature difference by subtracting a curve in Figure 4a by the one corresponding to the same roof
pitch in Figure 4b and then taking average over the ceiling range, we prefer an alternative approach,
i.e., evaluating Tct − Trb by the classical method of thermal resistance analysis. An advantage of the
thermal resistance approach is that the thermal resistance of attic air flow can be obtained as well,
which itself is also of engineering significance.

Sustainability 2012, 4 2010
The thermal resistance diagram for the sealed attics, as shown in Figure 5, suggests that the total
thermal resistance of the ceiling-air-roof system, Rt, equals the sum of the thermal resistances of the
sub-systems
ract RRRR (15)
and can be evaluated by
WQ
TTR
2/t
rtcbt
(16)
where Qt is the total heat transfer rate, as listed in the last column of Table 1. Since the ceiling and roof
insulations are specified to be R-20 and R-1.2, respectively, Equations (15,16) can be used to obtain all
the thermal resistances, and the obtained results are listed in Table 2. It should be noted that the Rr
column in Table 2 is obtained by scaling R-1.2 by the roof-ceiling area ratio, (W2 + H2)1/2/W, so that all
the resistances are defined based on unit ceiling area. Table 2 shows that the thermal resistance
of the attic air is around R-5 level and decreases about 31% from the 3/12 pitched attic to the 18/12
pitched attic.
Figure 5. Diagram of thermal resistance for sealed attics.
Table 2. Thermal resistances, in R-value (R-1 = 0.17611 Km2/W), for sealed attics with
different roof pitches.
Pitch Rt (Total) Rc (Ceiling) Rr (Roof) Ra (Air)
3/12 26.721 20 1.164 5.556
5/12 26.565 20 1.108 5.457
8/12 26.167 20 0.998 5.179
12/12 25.535 20 0.849 4.686
18/12 25.077 20 0.666 4.411
In terms of the resistance diagram (Figure 5) and the thermal resistances listed in Table 2, the
representative ceiling-top and roof-bottom temperatures are calculated and listed in Table 3.
A comparison between Table 3 and Figure 4 confirms that the temperatures obtained by the thermal
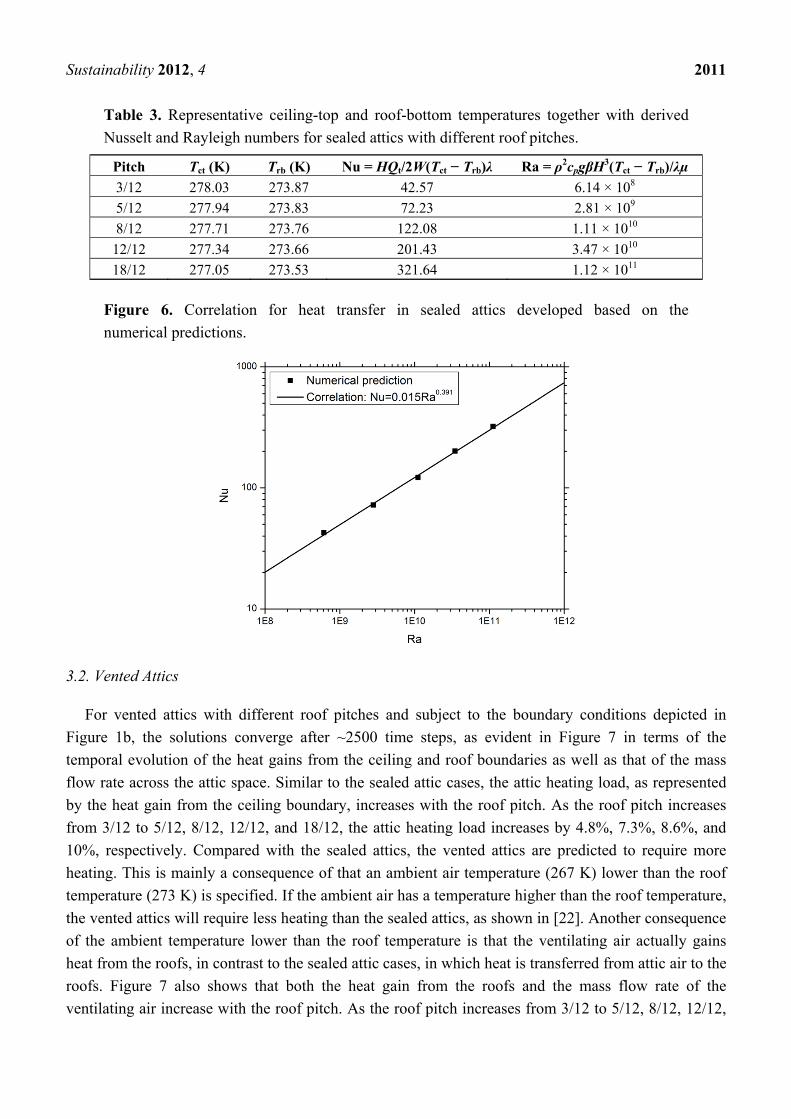
resistance analysis are indeed good representatives of the data in Figure 4. Accordingly, the Nusselt
number and Rayleigh number can be evaluated for each case. The results are listed in Table 3 and
plotted in Figure 6. Figure 6 shows that the (Nu, Ra) data points are almost linearly distributed on a
log-log plot, suggesting the following empirical correlation for heat transfer in sealed attics
391.0Ra015.0Nu (17)
More experimental or numerical data are needed to fully test the applicable domain of this
correlation, including if it is approximately valid for situations beyond uniform thermal conditions, e.g.,
those with slight variations in roof-top and ceiling-bottom temperatures.
Sustainability 2012, 4 2011
Table 3. Representative ceiling-top and roof-bottom temperatures together with derived
Nusselt and Rayleigh numbers for sealed attics with different roof pitches.
Pitch Tct (K) Trb (K) Nu = HQt/2W(Tct − Trb)λ Ra = ρ2cpgβH3(Tct − Trb)/λµ
3/12 278.03 273.87 42.57 6.14 × 10⁸
5/12 277.94 273.83 72.23 2.81 × 10⁹
8/12 277.71 273.76 122.08 1.11 × 10¹⁰
12/12 277.34 273.66 201.43 3.47 × 10¹⁰
18/12 277.05 273.53 321.64 1.12 × 10¹¹
Figure 6. Correlation for heat transfer in sealed attics developed based on the
numerical predictions.
3.2. Vented Attics
For vented attics with different roof pitches and subject to the boundary conditions depicted in
Figure 1b, the solutions converge after ~2500 time steps, as evident in Figure 7 in terms of the
temporal evolution of the heat gains from the ceiling and roof boundaries as well as that of the mass
flow rate across the attic space. Similar to the sealed attic cases, the attic heating load, as represented
by the heat gain from the ceiling boundary, increases with the roof pitch. As the roof pitch increases
from 3/12 to 5/12, 8/12, 12/12, and 18/12, the attic heating load increases by 4.8%, 7.3%, 8.6%, and
10%, respectively. Compared with the sealed attics, the vented attics are predicted to require more
heating. This is mainly a consequence of that an ambient air temperature (267 K) lower than the roof
temperature (273 K) is specified. If the ambient air has a temperature higher than the roof temperature,
the vented attics will require less heating than the sealed attics, as shown in [22]. Another consequence
of the ambient temperature lower than the roof temperature is that the ventilating air actually gains
heat from the roofs, in contrast to the sealed attic cases, in which heat is transferred from attic air to the
roofs. Figure 7 also shows that both the heat gain from the roofs and the mass flow rate of the
ventilating air increase with the roof pitch. As the roof pitch increases from 3/12 to 5/12, 8/12, 12/12,

Sustainability 2012, 4 2012
and 18/12, the mass flow rate of the ventilating air is predicted to increase by 23%, 53%, 83%, and
124%, respectively.
Different from the sealed attic cases in which the steady solutions are obtained, the converged
solutions for the vented attics actually include periodical oscillation, which is reflected by the weak
waves on some of the curves in Figure 7, and is clearly shown in Figure 8 by the temporal variation of
the vertical velocity at the location of x = 0 and y = H/2. To our knowledge, such periodical oscillation
has never been reported for turbulent natural convection in triangles (either closed or open
configurations), although similar oscillation was reported as a controversial issue by previous studies
on turbulent natural convection in rectangular enclosures [29,30].
Figure 7. Temporal evolution of (a) heat gain from the ceiling boundary; (b) heat gain
from the roof boundaries; and (c) mass flow rate across the attic space for vented attics
with different roof pitches.
(a) (b)
(c)

Sustainability 2012, 4 2013
Figure 8. Periodical oscillation in vertical velocity at the location of x = 0 and y = H/2 for
vented attics with different roof pitches.
In order to clearly show a detailed picture of this periodical oscillation, snapshots of the velocity
and temperature fields at selected instances within one oscillation cycle for the 12/12 pitch case are
given in Figures 9,10, in terms of streamlines and isotherms, respectively. It can be observed from
Figure 9 that the oscillation is mainly confined in the core region and related to the periodical variation
in vortex intensity of multiple convection cells. As the vortex intensity varies alternately, the spatial
pattern of convection cells changes as well. In turn, the flow pattern change controls the variation in
isotherm pattern, as shown in Figure 10.
Although more theoretical and experimental studies are needed to determine the fundamental
mechanism that generates this periodical oscillation, we consider such oscillation as physically
meaningful phenomenon, instead of a reflection of numerical singularity, based on the following
observations. Firstly, the periodical oscillation is independent of the selection of turbulence model. It is
found that essentially the same periodical oscillation also appears in solutions based on the SST k-ω
model [33] for the same vented attic problems. Secondly, the oscillation does not decay with the flow
time. It does not die out even after hundreds of thousands time steps. Thirdly, the oscillation occurs in
all the vented attic cases but in none of the sealed attic cases. It suggests that the oscillation may be
actuated by the additional degrees of freedom provided by the ventilating air. Finally, the period of the
oscillation seems to be of physical significance. As shown in Figure 8, the oscillations in the 3/12 and
5/12 attics have a period of around 75 s, while those in the 8/12, 12/12 and 18/12 attics have a period
of around 150 s. Such a period double phenomenon may have a physical basis, e.g., the number of the
oscillating convection cells in the high pitched attics is twice that in the lower pitched attics. Since the
oscillation features captured in Figures 9,10 are hardly represented by the existing RANS turbulence
models, a direct numerical simulation or large eddy simulation may be the best way to further
investigate the nature of the periodical oscillation.
Figure 11 shows the distributions of streamlines and isotherms at t = 10,000 s for the vented attics
with various roof pitches. Disregarding the influence of the periodical oscillation discussed above, the
velocity and temperature fields for all the roof pitch cases are basically symmetric about x = 0, which
is clearly different from the asymmetric fields in the sealed attics shown in Figure 2. It is also clear

Sustainability 2012, 4 2014
from Figure 11 that the temperature distribution in the upper portion is stratified, and the thermal
stratified region grows remarkably with the attic height.
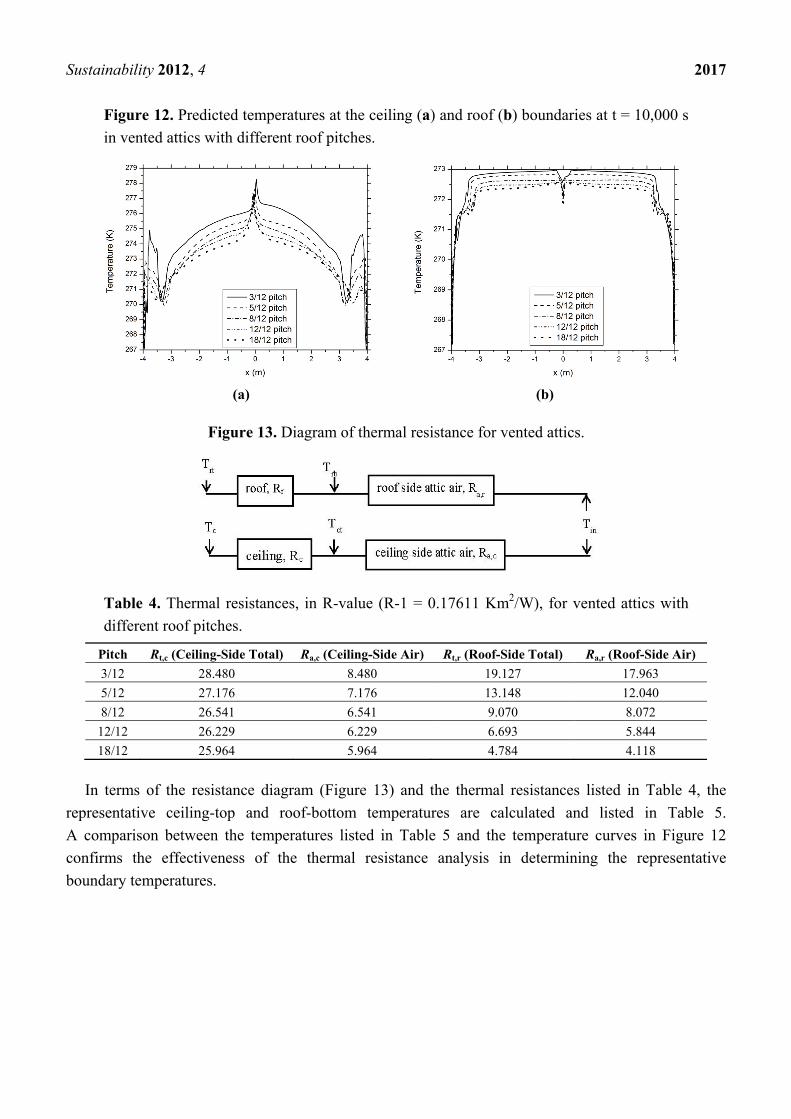
The predicted temperature distributions at the ceiling and roof boundaries at t = 10,000 s for the
vented attics with various roof pitches are shown in Figure 12. The peaks and valleys of the curves are
controlled by the convection cell distributions. For all the cases, the predicted boundary temperatures
are essentially symmetric about x = 0, and not affected by the periodical oscillation. This may be
explained by the strongest viscous effects existing along the boundaries. Similar to the sealed attic
cases, it can be observed in Figure 12 that both the ceiling-top and roof-bottom temperatures tend to
decrease with the roof pitch.
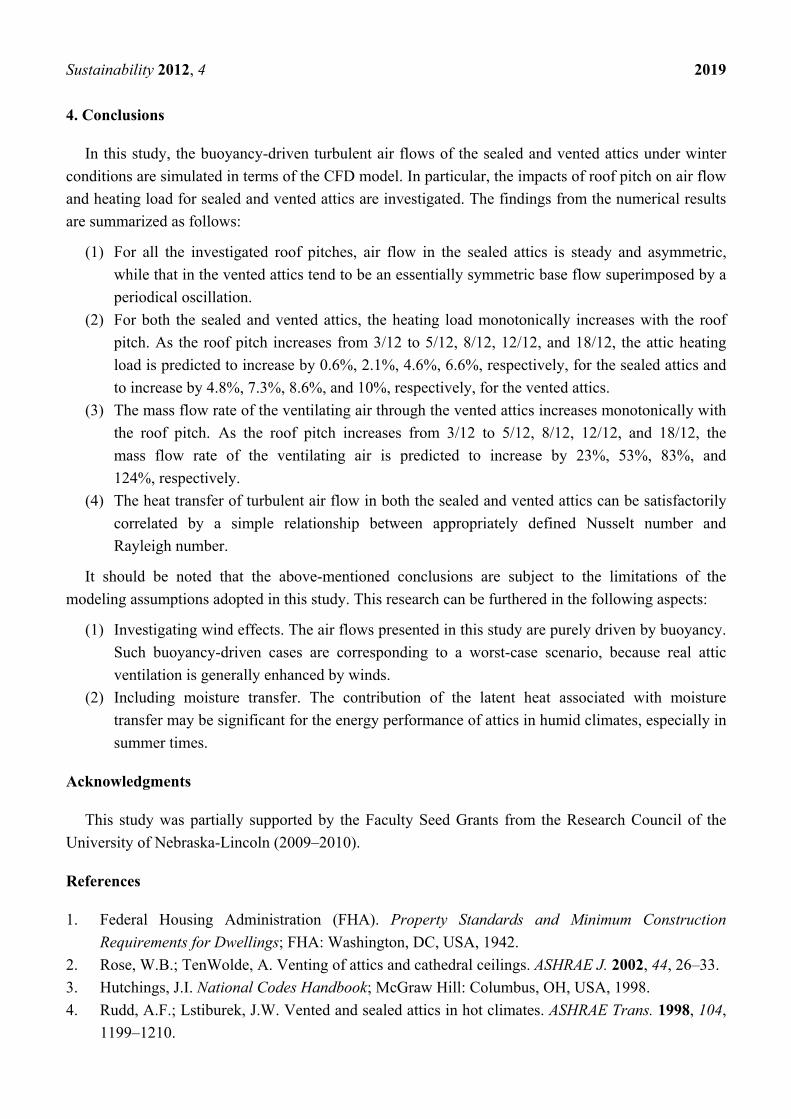
The overall thermal performance of the vented attics can be quantified based on a thermal resistance
analysis, similar to the analysis for the sealed attics. The thermal resistance diagram for the vented
attics is shown in Figure 13. Different from the resistances in series shown in Figure 5 for the sealed
attics, the resistance diagram for the vented attics consists of two parallel branches, one for the ceiling
side and the other for the roof side. Consequently, the resistances on each side are determined
separately, based on the converged heat gains (Figure 7) from the ceiling and roof boundaries,
respectively. The obtained various resistances are listed in Table 4, which shows that both the ceiling
and roof side resistances decrease with the increase in roof pitch.
Figure 9. Snapshots of predicted streamlines (in kg/m s) at various times in the vented attic
with a 12/12 pitch.
(a) t = 10016 s (b) t = 10032 s (c) t = 10048 s
(d) t = 10064 s (e) t = 10080 s (f) t = 10096 s
(g) t = 10112 s (h) t = 10128 s (i) t = 10144 s

Sustainability 2012, 4 2015
Figure 10. Snapshots of predicted isotherms (in K) at various times in the vented attic with
a 12/12 pitch.
(a) t = 10016 s (b) t = 10032 s (c) t = 10048 s
(d) t = 10064 s (e) t = 10080 s (f) t = 10096 s
(g) t = 10112 s (h) t = 10128 s (i) t = 10144 s
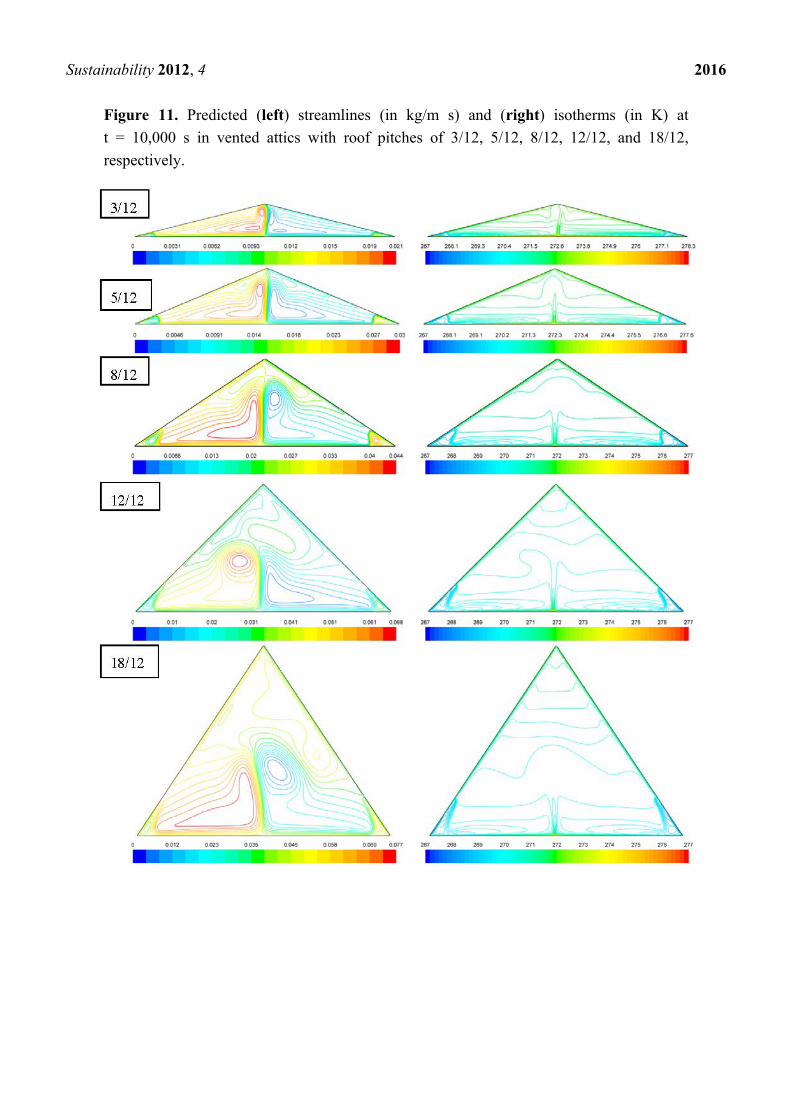
Sustainability 2012, 4 2016
Figure 11. Predicted (left) streamlines (in kg/m s) and (right) isotherms (in K) at
t = 10,000 s in vented attics with roof pitches of 3/12, 5/12, 8/12, 12/12, and 18/12,
respectively.
Sustainability 2012, 4 2017
Figure 12. Predicted temperatures at the ceiling (a) and roof (b) boundaries at t = 10,000 s
in vented attics with different roof pitches.
(a) (b)
Figure 13. Diagram of thermal resistance for vented attics.
Table 4. Thermal resistances, in R-value (R-1 = 0.17611 Km2/W), for vented attics with
different roof pitches.
Pitch Rt,c (Ceiling-Side Total) Ra,c (Ceiling-Side Air) Rt,r (Roof-Side Total) Ra,r (Roof-Side Air)
3/12 28.480 8.480 19.127 17.963
5/12 27.176 7.176 13.148 12.040
8/12 26.541 6.541 9.070 8.072
12/12 26.229 6.229 6.693 5.844
18/12 25.964 5.964 4.784 4.118
In terms of the resistance diagram (Figure 13) and the thermal resistances listed in Table 4, the
representative ceiling-top and roof-bottom temperatures are calculated and listed in Table 5.
A comparison between the temperatures listed in Table 5 and the temperature curves in Figure 12
confirms the effectiveness of the thermal resistance analysis in determining the representative
boundary temperatures.

Sustainability 2012, 4 2018
Table 5. Representative ceiling-top and roof-bottom temperatures together with derived
Nusselt and Rayleigh numbers for vented attics with different roof pitches.
Pitch Tct (K) Nu = HQc/2W
(Tct − Tin)λ Ra = ρ2cpgβH3
(Tct − Tin)/λµ Trb (K) Nu = HQr/2W
(Trb − Tin)λ Ra = ρ2cpgβH3
(Trb − Tin)/λµ 3/12 274.74 27.91 1.14 × 10⁹ 272.63 13.18 8.29 × 10⁸ 5/12 273.87 54.91 4.69 × 10⁹ 272.49 32.78 3.75 × 10⁹ 8/12 273.41 96.42 1.79 × 10¹⁰ 272.34 78.16 1.49 × 10¹⁰
12/12 273.17 152.05 5.83 × 10¹⁰ 272.24 162.05 4.95 × 10¹⁰ 18/12 272.97 238.12 1.90 × 10¹¹ 272.16 345.02 1.64 × 10¹¹
Accordingly defined Nusselt numbers and Rayleigh numbers for both the ceiling and roof sides are
listed in Table 5 as well. Figure 14 shows that the (Nu, Ra) data points for both the ceiling and roof
sides are linearly distributed on a log-log plot, and the following empirical correlations are obtained by
fitting the data points, i.e.,
417.0Ra0049.0Nu (18)
for the ceiling side air flow, and
618.0Ra00004.0Nu (19)
for the roof side air flow. Both the correlations are expected to be valid for vented attics under
conditions similar to those specified in this study. More experimental or numerical data are needed to
test if these correlations can be generalized to cover a wider parameter range.
Figure 14. Correlations for heat transfer on (a) the ceiling side and (b) the roof side within
vented attics developed based on numerical predictions.
(a) (b)
Sustainability 2012, 4 2019
4. Conclusions
In this study, the buoyancy-driven turbulent air flows of the sealed and vented attics under winter
conditions are simulated in terms of the CFD model. In particular, the impacts of roof pitch on air flow
and heating load for sealed and vented attics are investigated. The findings from the numerical results
are summarized as follows:
(1) For all the investigated roof pitches, air flow in the sealed attics is steady and asymmetric,
while that in the vented attics tend to be an essentially symmetric base flow superimposed by a
periodical oscillation.
(2) For both the sealed and vented attics, the heating load monotonically increases with the roof
pitch. As the roof pitch increases from 3/12 to 5/12, 8/12, 12/12, and 18/12, the attic heating
load is predicted to increase by 0.6%, 2.1%, 4.6%, 6.6%, respectively, for the sealed attics and
to increase by 4.8%, 7.3%, 8.6%, and 10%, respectively, for the vented attics.
(3) The mass flow rate of the ventilating air through the vented attics increases monotonically with
the roof pitch. As the roof pitch increases from 3/12 to 5/12, 8/12, 12/12, and 18/12, the
mass flow rate of the ventilating air is predicted to increase by 23%, 53%, 83%, and
124%, respectively.
(4) The heat transfer of turbulent air flow in both the sealed and vented attics can be satisfactorily
correlated by a simple relationship between appropriately defined Nusselt number and
Rayleigh number.
It should be noted that the above-mentioned conclusions are subject to the limitations of the
modeling assumptions adopted in this study. This research can be furthered in the following aspects:
(1) Investigating wind effects. The air flows presented in this study are purely driven by buoyancy.
Such buoyancy-driven cases are corresponding to a worst-case scenario, because real attic
ventilation is generally enhanced by winds.
(2) Including moisture transfer. The contribution of the latent heat associated with moisture
transfer may be significant for the energy performance of attics in humid climates, especially in
summer times.
Acknowledgments
This study was partially supported by the Faculty Seed Grants from the Research Council of the
University of Nebraska-Lincoln (2009–2010).
References
1. Federal Housing Administration (FHA). Property Standards and Minimum Construction
Requirements for Dwellings; FHA: Washington, DC, USA, 1942.
2. Rose, W.B.; TenWolde, A. Venting of attics and cathedral ceilings. ASHRAE J. 2002, 44, 26–33.
3. Hutchings, J.I. National Codes Handbook; McGraw Hill: Columbus, OH, USA, 1998.
4. Rudd, A.F.; Lstiburek, J.W. Vented and sealed attics in hot climates. ASHRAE Trans. 1998, 104,
1199–1210.

Sustainability 2012, 4 2020
5. Kamiyo, O.M.; Angeli, D.; Barozzi, G.S.; Collins, M.W.; Olunloyo, V.O.S.; Talabi, S.O.
A comprehensive review of natural convection in triangular enclosures. ASME Appl. Mech. Rev.
2010, 63, 1–13.
6. Saha, S.C.; Khan, M.M.K. A review of natural convection and heat transfer in attic-shaped space.
Energy Build. 2011, 43, 2564–2571.
7. Flack, R.D.; Witt, C.L. Velocity measurements in two natural convection air flows using a laser
velocimeter. ASME J. Heat Transf. 1979, 101, 256–260.
8. Flack, R.D. The experiment al measurement of natural convection heat transfer in triangular
enclosures heated or cooled from below. ASME J. Heat Transf. 1980, 102, 770–772.
9. Poulikakos, D.; Bejan, A. Natural convection experiments in a triangular enclosure.
ASME J. Heat Transf. 1983, 105, 652–655.
10. Holtzman, G.A.; Hill, R.W.; Ball, K.S. Laminar natural convection in isosceles triangular
enclosures heated from below and symmetrically cooled from above. ASME J. Heat Transf. 2000,
122, 485–491.
11. Asan, H.; Namli, L. Laminar natural convection in a pitched roof of triangular cross-section:
Summer day boundary conditions. Energy Build. 2000, 33, 69–73.
12. Ridouane, E.H.; Campo, A.; McGarry, M. Numerical computation of buoyant airflows confined
to attic spaces under opposing hot and cold wall conditions. Int. J. Therm. Sci. 2005, 44,
944–952.
13. Lei, C.; Armfield, S.W.; Patterson, J.C. Unsteady natural convection in a water-filled isosceles
triangular enclosure heated from below. Int. J. Heat Mass Transf. 2008, 51, 2637–2650.
14. Kent, E.F. Numerical analysis of laminar natural convection in isosceles triangular enclosures.
J. Mech. Eng. Sci. 2009, 223, 1157–1169.
15. Saha, S.C.; Patterson, J.C.; Lei, C. Natural convection and heat transfer in attics subject to
periodic thermal forcing. Int. J. Therm. Sci. 2010, 49, 1899–1910.
16. Saha, S.C. Unsteady natural convection in a triangular enclosure under isothermal heating.
Energy Build. 2011, 43, 695–703.
17. Ridouane, E.H.; Campo, A.; Hasnaoui, M. Turbulent natural convection in an air-filled isosceles
triangular enclosure. Int. J. Heat Fluid Flow 2006, 27, 476–489.
18. Talabi, S.O.; Olunloyo, V.O.S.; Kamiyo, O.M.; Collins, M.W.; Karayiannis, T.G. Flow field and
reynolds stress distribution in low turbulence natural convection in a triangular cavity.
Int. Cent. Heat Mass Transf. 2006, 10, 511–514.
19. Medina, M.A.; O’Neal, D.L.; Turner, W.D. A transient heat and mass transfer model of
residential attics used to simulate radiant barrier retrofits, Part I: Development.
ASME J. Sol. Energy Eng. 1998, 120, 32–38.
20. Medina, M.A.; O’Neal, D.L.; Turner, W.D. A transient heat and mass transfer model of
residential attics used to simulate radiant barrier retrofits, Part II: Validation and simulations.
ASME J. Sol. Energy Eng. 1998, 120, 39–44.
21. Moujaes, S.F.; Alsaiegh, N.T. Numerical heat transfer attic model using a radiant barrier system.
J. Energy Eng. 2000, 126, 32–51.
22. Wang, S.; Shen, Z.; Gu, L. Numerical simulation of buoyancy-driven turbulent ventilation in attic
space under winter conditions. Energy Build. 2010, 47, 360–368.

Sustainability 2012, 4 2021
23. Durbin, P.A. Separated flow computations with the k-ε-v2 model. AIAA J. 1995, 33, 659–664.
24. Behnia, M.; Parneix, S.; Shabany, Y.; Durbin, P.A. Numerical study of turbulent heat transfer in
confined and unconfined impinging jets. Int. J. Heat Fluid Flow 1999, 20, 1–9.
25. Parneix, S.; Durbin, P.A.; Behnia, M. Computation of a 3D turbulent boundary layer using the
V2F model. Flow Turbul. Combust. 1998, 10, 19–46.
26. Heschl, C.H.; Sanz, W.; Klanatsky, P.; Madou, F. Comparison of Different Turbulence Models to
Compute Wall Affected Room Airflows. In CFD Forum, Bad Nauheim, Wetteraukreis,
Germany, 19 October 2005.
27. Zhang, Z.; Zhang, W.; Zhai, Z.; Chen, Q. Evaluation of various turbulence models in predicting
airflow and turbulence in enclosed environments by CFD: Part 2—Comparison with experimental
data from literature. HVAC&R Res. 2007, 13, 871–886.
28. El-Behery, S.M.; Hamed, M.H. A comparative study of turbulence models performance for
turbulent flow in a planar asymmetric diffuser. World Acad. Sci. Eng. Technol. 2009, 53, 769–780.
29. Ozoe, H.; Mouri, A.; Ohmuro, M.; Churchill, S.W.; Lior, N. Numerical calculations of laminar
and turbulent natural convection in water in rectangular channels heated and cooled isothermally
on the opposing vertical walls. Int. J. Heat Mass Transf. 1985, 28, 125–138.
30. Henkes, R.A.W.M.; van der Vlugt, F.F.; Hoogendoorn, C.J. Natural-convection flow in a square
cavity calculated with low-Reynolds-number turbulence models. Int. J. Heat Mass Transfer 1991,
34, 377–388.
31. Henkes, R.A.W.M.; Hoogendoorn, C.J. Scaling of the turbulent natural convection flow in a
heated square cavity. ASME J. Heat Transf. 1994, 116, 400–408.
32. Hsieh, K.J.; Lien, F.S. Numerical modeling of buoyancy-driven turbulent flows in enclosures.
Int. J. Heat Fluid Flow 2004, 25, 659–670.
33. ANSYS FLUENT 13.0. ANSYS, Inc.: Canonsburg, PA, USA, 2011.
© 2012 by the authors; licensee MDPI, Basel, Switzerland. This article is an open access article
distributed under the terms and conditions of the Creative Commons Attribution license
(http://creativecommons.org/licenses/by/3.0/).