Effects of resource and remembering on social networks
6
837 Effects of Resource and Remembering on Social Networks Chung-Yuan Huang Department of Computer Science and Information Engineering Chang Gung University 259 Wen Hwa 1st Road Taoyuan 333, Taiwan +886-3-2118800 Ext. 3474 [email protected] Yu-Shiuan Tsai Department of Computer Science National Chiao Tung University 1001 Ta Hsueh Road Hsinchu 300, Taiwan +886-3-5712121 Ext, 56612 [email protected] Chuen-Tsai Sun Department of Computer Science National Chiao Tung University 1001 Ta Hsueh Road Hsinchu 300, Taiwan +886-3-5712121 Ext, 56612 [email protected] ABSTRACT To better represent human interactions in social networks, the authors take a network-oriented simulation approach to analyze the evolution of acquaintance networks based on local interaction rules. Our approach takes into consideration shared friendships, resources, remembering, meetings by chance, and arriving and leaving. Our three main findings are: (a) the topological features of acquaintance networks are affected by initial average values for parameters (i.e., resources, remembering, and number of friendships), but not by their statistical distributions; (b) resources, remembering, and initial friendships positively influence increases in average numbers of friends and decreases in degrees of clustering and separation; and (c) widely used fieldwork sampling methods do not capture the actual node degree distributions of social networks. In addition to confirming the successful use of a network-oriented simulation approach to social network research, the findings indicate a strong need for an approach that stresses interactive rules and “what-if” type simulation experiments. Categories and Subject Descriptors I.6.3 [Simulation and Modeling]: Applications General Terms Algorithms, Economics, Experimentation, Human Factors. Keywords acquaintance networks, social networks, small world phenomena, network-oriented simulations. 1. INTRODUCTION The primary feature of any social network is its small world phenomena of low degree of separation (indicating how small the world is) and high degree of clustering (explaining why our friend’s friend is often our friend also). Watts and Strogatz’s [1] research has been the basis for building social simulation models, many of which mix regular and random networks (see, for example, [2][3][4]). However, these models have a significant drawback: since they neglect local rules that affect interactions and relationships between individuals, they are good for explaining small world phenomena but inadequate for explaining the evolutionary mechanisms and detailed connection patterns of social networks. Furthermore, researchers have shown a tendency to focus on the final products of network topologies and a bias toward top-down approaches that facilitate theoretical analyses [1][2][3]–[8]. Actual social network evolution involves bottom-up processes that entail local human interactions, which explains our study focus on local interaction rules and dynamic growth processes that affect social network formation. Examples of other complex network models and applications for referencing when researching social networks are (a) Barabási and Albert’s (hereafter referred to as BA’s) [9] use of growth and preferential attachment mechanisms to establish a scale-free network model in which node degree distribution follows a power-law feature, and (b) Albert et al.’s [10] proposal that the Internet possesses scale-free features. Nodes and edges in BA’s scale-free model are added continuously to a network over time (growth); edges are more likely to link with high connectivity nodes than low connectivity nodes (preferential attachment mechanism). To realistically simulate this kind of complex network, Li and Chen [11] have added the concept of local-world connectivity that is found in many complex physical networks. Their local-world model exhibits transitions between power-law and exponential scaling; BA’s scale-free model is one of several special cases. As is the case with other complex networks, social networks exhibit the small world phenomena of low degree of separation and high degree of clustering, but they differ in terms of detail [12]. However, we believe there are three reasons why Internet or Web-based growth models are inappropriate for describing growth in social networks: (a) in many social networks the node degree distribution does not reflect power-law features; (b) social networks usually have high degrees of clustering, but Internet or Web-based growth models reflect low degrees of clustering; and (c) preferential attachment mechanisms are not an important feature of social networks. Accordingly, Jin et al.’s [13] model of social network evolution entails a sharply peaked distribution that is in accordance with observations for many real social networks. Features of real social networks that they have identified in their simulation models include the formation of closely-knit communities and high degrees of network transitivity. Acquaintance networks are social networks that represent the processes and results of people meeting people. Befriending someone in a social network is an important daily activity, one that more often than not involves a friend or acquaintance who serves as an intermediary. However, a significant number of acquaintances occur by chance, with two or more individuals coming together at a specific time in a specific place because of a shared interest or activity. Davidsen et al. [14] have proposed a model based on two local and interactive rules for building Cite as: Effects of Resource and Remembering on Social Networks, Chung-Yuan Huang, Yu-Shiuan Tsai, Chuen-Tsai Sun, Proc. of 8th Int. Conf. on Autonomous Agents and Multiagent Systems (AAMAS 2009), Decker, Sichman, Sierra and Castelfranchi (eds.), May, 10–15, 2009, Budapest, Hungary, pp. 837–842 Copyright © 2009, International Foundation for Autonomous Agents and Multiagent Systems (www.ifaamas.org), All rights reserved.
-
Upload
independent -
Category
Documents
-
view
8 -
download
0
Transcript of Effects of resource and remembering on social networks

837
Effects of Resource and Remembering on Social NetworksChung-Yuan Huang
Department of Computer Science and Information Engineering Chang Gung University 259 Wen Hwa 1st Road Taoyuan 333, Taiwan
+886-3-2118800 Ext. 3474
Yu-Shiuan Tsai Department of Computer Science National Chiao Tung University
1001 Ta Hsueh Road Hsinchu 300, Taiwan
+886-3-5712121 Ext, 56612
Chuen-Tsai Sun Department of Computer Science National Chiao Tung University
1001 Ta Hsueh Road Hsinchu 300, Taiwan
+886-3-5712121 Ext, 56612
ABSTRACTTo better represent human interactions in social networks, the authors take a network-oriented simulation approach to analyze the evolution of acquaintance networks based on local interaction rules. Our approach takes into consideration shared friendships, resources, remembering, meetings by chance, and arriving and leaving. Our three main findings are: (a) the topological features of acquaintance networks are affected by initial average values for parameters (i.e., resources, remembering, and number of friendships), but not by their statistical distributions; (b) resources, remembering, and initial friendships positively influence increases in average numbers of friends and decreases in degrees of clustering and separation; and (c) widely used fieldwork sampling methods do not capture the actual node degree distributions of social networks. In addition to confirming the successful use of a network-oriented simulation approach to social network research, the findings indicate a strong need for an approach that stresses interactive rules and “what-if” type simulation experiments.
Categories and Subject DescriptorsI.6.3 [Simulation and Modeling]: Applications
General TermsAlgorithms, Economics, Experimentation, Human Factors.
Keywordsacquaintance networks, social networks, small world phenomena, network-oriented simulations.
1. INTRODUCTION The primary feature of any social network is its small world phenomena of low degree of separation (indicating how small the world is) and high degree of clustering (explaining why our friend’s friend is often our friend also). Watts and Strogatz’s [1] research has been the basis for building social simulation models, many of which mix regular and random networks (see, for example, [2][3][4]). However, these models have a significant drawback: since they neglect local rules that affect interactions and relationships between individuals, they are good for explaining small world phenomena but inadequate for explaining the evolutionary mechanisms and detailed connection patterns of social networks. Furthermore, researchers have shown a tendency to focus on the final products of network topologies and a bias toward top-down approaches that facilitate theoretical analyses
[1][2][3]–[8]. Actual social network evolution involves bottom-up processes that entail local human interactions, which explains our study focus on local interaction rules and dynamic growth processes that affect social network formation.
Examples of other complex network models and applications for referencing when researching social networks are (a) Barabási and Albert’s (hereafter referred to as BA’s) [9] use of growth and preferential attachment mechanisms to establish a scale-free network model in which node degree distribution follows a power-law feature, and (b) Albert et al.’s [10] proposal that the Internet possesses scale-free features. Nodes and edges in BA’s scale-free model are added continuously to a network over time (growth); edges are more likely to link with high connectivity nodes than low connectivity nodes (preferential attachment mechanism). To realistically simulate this kind of complex network, Li and Chen [11] have added the concept of local-world connectivity that is found in many complex physical networks. Their local-world model exhibits transitions between power-law and exponential scaling; BA’s scale-free model is one of several special cases.
As is the case with other complex networks, social networks exhibit the small world phenomena of low degree of separation and high degree of clustering, but they differ in terms of detail [12]. However, we believe there are three reasons why Internet or Web-based growth models are inappropriate for describing growth in social networks: (a) in many social networks the node degree distribution does not reflect power-law features; (b) social networks usually have high degrees of clustering, but Internet or Web-based growth models reflect low degrees of clustering; and (c) preferential attachment mechanisms are not an important feature of social networks. Accordingly, Jin et al.’s [13] model of social network evolution entails a sharply peaked distribution that is in accordance with observations for many real social networks. Features of real social networks that they have identified in their simulation models include the formation of closely-knit communities and high degrees of network transitivity.
Acquaintance networks are social networks that represent the processes and results of people meeting people. Befriending someone in a social network is an important daily activity, one that more often than not involves a friend or acquaintance who serves as an intermediary. However, a significant number of acquaintances occur by chance, with two or more individuals coming together at a specific time in a specific place because of a shared interest or activity. Davidsen et al. [14] have proposed a model based on two local and interactive rules for building
Cite as: Effects of Resource and Remembering on Social Networks, Chung-Yuan Huang, Yu-Shiuan Tsai, Chuen-Tsai Sun, Proc. of 8th Int. Conf. on Autonomous Agents and Multiagent Systems (AAMAS 2009), Decker, Sichman, Sierra and Castelfranchi (eds.), May, 10–15, 2009, Budapest, Hungary, pp. 837–842Copyright © 2009, International Foundation for Autonomous Agents and Multiagent Systems (www.ifaamas.org), All rights reserved.

AAMAS 2009 • 8th International Conference on Autonomous Agents and Multiagent Systems • 10–15 May, 2009 • Budapest, Hungary
838
acquaintance networks—one for introductions and meeting by chance, and one for the effects of aging on acquaintance networks. Their model is considered more realistic because it acknowledges the simple observation that everyone’s friends regularly introduce them to additional friends. However, their model is still inadequate for explaining changes that occur once acquaintances evolve into friendships—that is, strengthening, weakening, or separation prior to death.
In this paper we will introduce what we believe is an essential rule that reflects limited individual resources and remembering—the latter defined as a memory factor through which individuals maintain or neglect their friendships. This bottom-up, network-oriented simulation approach allows for analyses of how individual interaction factors affect the evolution and detailed connection structures of acquaintance networks. For example, researchers can adopt different friend-making resource distributions and probe their effects on entire acquaintance networks, or measure correlations between statistical topology features under different circumstances. We believe that simulation models that consider limited resources and remembering will produce results of use to sociologists, epidemiologists, computer scientists, and public health professionals—all of whom regularly work with social and epidemic transmission dynamics that involve acquaintance networks.
2. MODEL Davidsen et al. [14] have proposed a two-rule model of acquaintance network evolution: the first addresses how people make new friends via introductions or meetings-by-chance, and the second addresses how friendships are broken when one party dies. Their model formulates a fixed number of N nodes and undirected links between pairs of nodes representing individuals who know each other. Here we will introduce a remembering rule that allows for the weakening and strengthening of friendships (Fig. 1), with simulation models repeating the resulting new set of rules until the acquaintance network being simulated reaches a statistically stationary state:
1. Friend making. Randomly chosen persons introduce two friends to each other. If this is their first meeting, a new link is formed. Randomly chosen persons with less than two friends introduce themselves to one other random person. Note that we use the term “introduce” to describe meetings by chance as well as through a common friend.
2. Arriving and leaving. At probability p, a randomly chosen individual and all associated links are removed from a network and replaced by another person. Accordingly, groups of acquaintances can be viewed as friend circles whose members can enter for reasons other than birth and leave for reasons other than death.
3. Remembering. A certain number of friendships are updated, with the number depending on an update proportion b.
We considered three selection methods for updating friendships. In the first (person selection), b × N persons are chosen randomly before selecting a specific friend for each person and updating their friendship. Updates do not occur for persons who do not have any friends. N denotes the number of persons in the network and b is a proportion factor for deciding how many persons are
chosen. In the second method (pair selection), b × N pairs of persons are chosen randomly and their friendships are updated. Updating is canceled if the paired persons do not know each other a frequent occurrence, since the network in question is sparse compared to complete graphs. In this method, b denotes a proportion factor for deciding how many pairs are chosen. In the final method (edge selection), b × M friendships are directly selected for updating. Here b is a proportion factor for deciding how many friendships are chosen, and M the number of friendships (or edges) at any given moment.
NoYes
StartStart
Stationary?Stationary?
StopStop
Friend MakingFriend Making
Leaving and Arriving
Leaving and Arriving
Friend Remembering
Friend Remembering
Rule 1
Rule 2
Rule 3
InitializationInitialization
NoYes
StartStart
Stationary?Stationary?
StopStop
Friend MakingFriend Making
Leaving and Arriving
Leaving and Arriving
Friend Remembering
Friend Remembering
Rule 1
Rule 2
Rule 3
InitializationInitialization
Figure 1. Three-rule model flow diagram. We rejected the first two methods because in both cases the numbers of chosen friendships were proportional to N (number of nodes or persons). Furthermore, we adopted the edge selectionmethod for choosing friendships because [N × (N – 1) / 2] (the upper bound of number of friendships) is directly proportional to M (the total number of edges or friendships). If a selected friendship links person u with person v, their friendship is updated using the following equation, dependent upon individual remembering, resource, and breakup threshold factors:
( ),, ,
,
1 ,,
0,
old u vu vnew old
u vu v u v
oldu v
r rq f q J D Dk kf if f
if f
θ
θ
⋅ + − ⋅= ≥
<
,
(1)
where ,new
u vf represents the new friendship between u and
v, ,old
u vf the original friendship, q the remembering of an old friend, θ the breakup threshold, ru person u’s friend-making resources, ku his or her number of friends, and rv and kvperson v’s resources and friend numbers, respectively. J is a joint function and D a distribution function. For

Chung-Yuan Huang, Yu-Shiuan Tsai, Chuen-Tsai Sun • Eff ects of Resource and Remembering on Social Networks
839
convenience, the q, r, and θ parameters are normalized between 0 and 1. Simplification without loss of generality was the motivation behind our decision to use D(x) = x as the distribution function and J(a, b) = (a + b) / 2 as the joint function. The updated equation is written as
( ),, ,
,
112 ,
0,
old u vu vnew new
u vu v u vnew
u v
r rq f qk kf if f
if fθ
θ
⋅ + − ⋅ + ⋅= ≥
<
.(2)
The equation is divided into two parts by the breakup threshold, θ.The first part consists of the terms q (representing the effect of old friendships) and (1 – q) (representing the effect of limited resources). The newly updated friendship may weaken or strengthen. It may also theoretically equal zero if the new friendship is below the breakup threshold, as shown in the second part of the equation.
3. RESULTSAny simulation based on our proposed model begins with parameter initialization and ends once the acquaintance network reaches a statistically stationary state. As shown in Table 1, initialized parameters include the number of persons N, arriving and leaving probability p, updated friendship proportion b, old friend remembering q, breakup threshold θ, distribution of friend-making resources r, and distribution of initial friendship f0. Statistically stationary states were determined by observing average node degree <k>, average node square degree <k2>, clustering coefficient C, and average path length L. Each of these four statistics eventually converged to values with slight rippling.
Table 1. Terms and abbreviations for initialized parameters and distributions.
Abbreviation DescriptionN Number of persons (nodes) in acquaintance network. M Number of friendships (edges) in acquaintance
network. f0, f(t=0) Initial friendship distribution.
p Leaving and arriving probability in rule 2. b Proportion of updated friendships in rule 3. f Friendships. q Friend remembering. r Friend-making resource distribution.
θ, th Breakup threshold. μ, mu Mean
Figure 2 presents a statistically stationary state of parameter initialization at N = 1,000, p = 0, b = 0.001, q = 0.9, θ = 0.1, rwith a fixed value of 0.5, and a beta14 f0 (μ = 0.9). Solid blue lines indicate the acquaintance network, and the dashed green lines in Figures 2c and d indicate ER random model values at the same average node degree as the acquaintance model.
Figure 3 presents a node degree distribution comparison of one of our acquaintance networks at a statistically stationary state (solid
blue curve) with Davis’ corporate directors data (green dashes). Our acquaintance network parameters were initialized at N = 1,000, p = 0, b = 0.001, q = 0.4, θ = 0.1, r = 0.5 (fixed) and f0 = 0.5 (fixed). Davis’ data are for connections among nearly 8,000 directors on the boards of Fortune 1,000 companies in 1999 [23]; the corresponding node degree distribution has a strong peak and a fast exponential tail decay—much faster than for a power-law distribution, but slower than for a Poisson or normal distribution (see also [6][20]). Interlocking networks of boards and directors reveal a remarkable node degree distribution that differs significantly from either scale-free or ER random networks [24]. Both curves exhibit similar peaks and long tails that do not decay smoothly.
0 1 0 2 0 3 0 4 0 5 0 6 0 7 0 8 0time step (x1000)
05
1 01 52 02 53 03 54 04 5
<k>
(a )
0 1 0 2 0 3 0 4 0 5 0 6 0 7 0 8 0time step (x1000)
0
5 0 0
1 0 00
1 5 00
2 0 00
2 5 00
<k2 >
(b )
0 1 0 2 0 3 0 4 0 5 0 6 0 7 0 8 0time step (x1000)
0 .0
0 .1
0 .2
0 .3
0 .4
0 .5
0 .6
0 .7
C
(c )
Ac q .Ra n d om
0 1 0 2 0 3 0 4 0 5 0 6 0 7 0 8 0time step (x1000)
0
5
1 0
1 5
2 0
2 5
L
(d )
Ac q .Ra n d om
0 1 0 2 0 3 0 4 0 5 0 6 0 7 0 8 0time step (x1000)
05
1 01 52 02 53 03 54 04 5
<k>
(a )
0 1 0 2 0 3 0 4 0 5 0 6 0 7 0 8 0time step (x1000)
0
5 0 0
1 0 00
1 5 00
2 0 00
2 5 00
<k2 >
(b )
0 1 0 2 0 3 0 4 0 5 0 6 0 7 0 8 0time step (x1000)
0 .0
0 .1
0 .2
0 .3
0 .4
0 .5
0 .6
0 .7
C
(c )
Ac q .Ra n d om
0 1 0 2 0 3 0 4 0 5 0 6 0 7 0 8 0time step (x1000)
0
5
1 0
1 5
2 0
2 5
L
(d )
Ac q .Ra n d om
Figure 2. Examples of a statistically stationary state using the proposed model.
Figure 3. Node degree distribution comparison between one instance of our acquaintance network (solid blue line) and
Davis’ board director data (dashed green line). For model validation purposes, we reproduced Davidsen et al.’s [14] simulations using their original parameters of N = 7,000 and p values of 0.04, 0.01, and 0.0025. As noted in an earlier section, the arriving and leaving probability p is the only parameter in rule 2. In addition to node degree distribution data, we gathered <k>, C, and L values (all with varying p values) and analyzed their
AAMAS 2009 • 8th International Conference on Autonomous Agents and Multiagent Systems • 10–15 May, 2009 • Budapest, Hungary
840
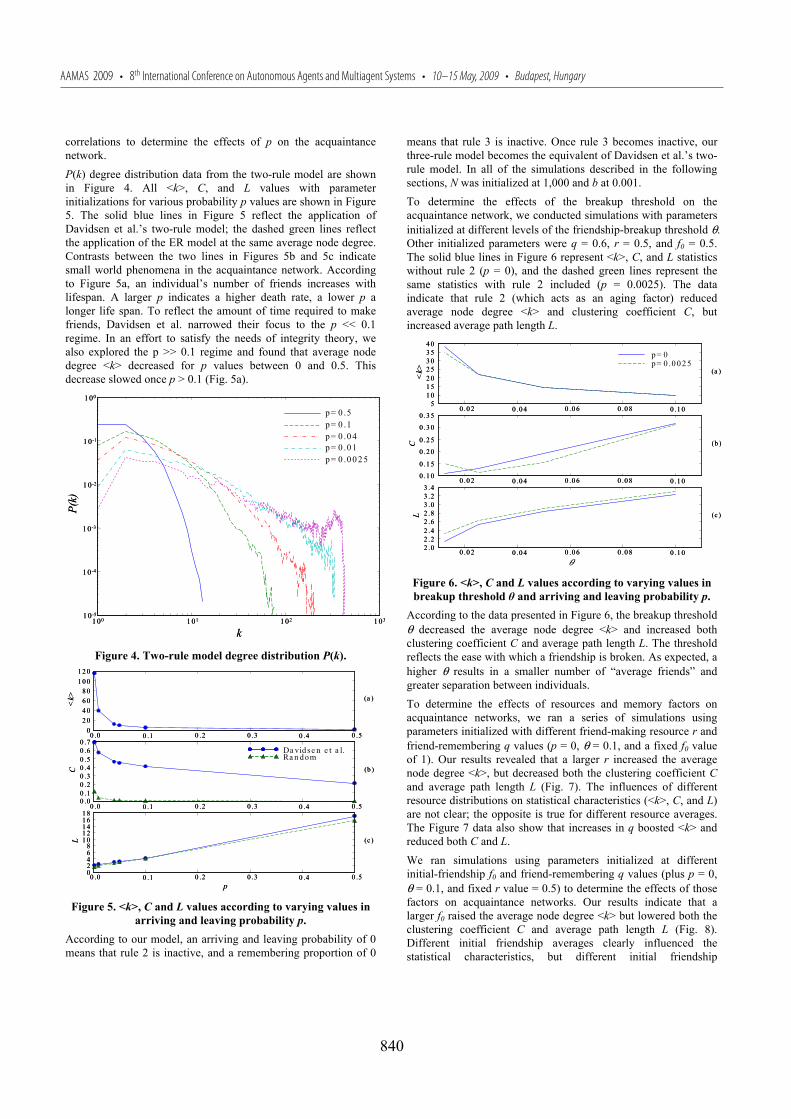
correlations to determine the effects of p on the acquaintance network.P(k) degree distribution data from the two-rule model are shown in Figure 4. All <k>, C, and L values with parameter initializations for various probability p values are shown in Figure 5. The solid blue lines in Figure 5 reflect the application of Davidsen et al.’s two-rule model; the dashed green lines reflect the application of the ER model at the same average node degree. Contrasts between the two lines in Figures 5b and 5c indicate small world phenomena in the acquaintance network. According to Figure 5a, an individual’s number of friends increases with lifespan. A larger p indicates a higher death rate, a lower p a longer life span. To reflect the amount of time required to make friends, Davidsen et al. narrowed their focus to the p << 0.1 regime. In an effort to satisfy the needs of integrity theory, we also explored the p >> 0.1 regime and found that average node degree <k> decreased for p values between 0 and 0.5. This decrease slowed once p > 0.1 (Fig. 5a).
1 00 1 01 1 02 1 03
k1 0-5
1 0-4
1 0-3
1 0-2
1 0-1
1 00
P(k)
p = 0 .5p = 0 .1p = 0 .0 4p = 0 .0 1p = 0 .0 0 25
1 00 1 01 1 02 1 03
k1 0-5
1 0-4
1 0-3
1 0-2
1 0-1
1 00
P(k)
p = 0 .5p = 0 .1p = 0 .0 4p = 0 .0 1p = 0 .0 0 25
Figure 4. Two-rule model degree distribution P(k).
0 .0 0 .1 0 .2 0 .3 0 .4 0 .50
2 04 06 08 0
1 0 01 2 0
<k> (a )
0 .0 0 .1 0 .2 0 .3 0 .4 0 .50 .00 .10 .20 .30 .40 .50 .60 .7
C (b )
Da vid se n e t a l.Ra n dom
0 .0 0 .1 0 .2 0 .3 0 .4 0 .5p
02468
1 01 21 41 61 8
L (c )
0 .0 0 .1 0 .2 0 .3 0 .4 0 .50
2 04 06 08 0
1 0 01 2 0
<k> (a )
0 .0 0 .1 0 .2 0 .3 0 .4 0 .50 .00 .10 .20 .30 .40 .50 .60 .7
C (b )
Da vid se n e t a l.Ra n dom
0 .0 0 .1 0 .2 0 .3 0 .4 0 .5p
02468
1 01 21 41 61 8
L (c )
Figure 5. <k>, C and L values according to varying values in arriving and leaving probability p.
According to our model, an arriving and leaving probability of 0 means that rule 2 is inactive, and a remembering proportion of 0
means that rule 3 is inactive. Once rule 3 becomes inactive, our three-rule model becomes the equivalent of Davidsen et al.’s two-rule model. In all of the simulations described in the following sections, N was initialized at 1,000 and b at 0.001. To determine the effects of the breakup threshold on the acquaintance network, we conducted simulations with parameters initialized at different levels of the friendship-breakup threshold θ.Other initialized parameters were q = 0.6, r = 0.5, and f0 = 0.5. The solid blue lines in Figure 6 represent <k>, C, and L statistics without rule 2 (p = 0), and the dashed green lines represent the same statistics with rule 2 included (p = 0.0025). The data indicate that rule 2 (which acts as an aging factor) reduced average node degree <k> and clustering coefficient C, but increased average path length L.
0 .0 2 0 .0 4 0 .0 6 0 .0 8 0 .1 05
1 01 52 02 53 03 54 0
<k> (a )
p = 0p = 0 .0 0 2 5
0 .0 2 0 .0 4 0 .0 6 0 .0 8 0 .1 00 .1 0
0 .1 5
0 .2 0
0 .2 5
0 .3 0
0 .3 5C (b )
0 .0 2 0 .0 4 0 .0 6 0 .0 8 0 .1 02 .02 .22 .42 .62 .83 .03 .23 .4
L (c )
0 .0 2 0 .0 4 0 .0 6 0 .0 8 0 .1 05
1 01 52 02 53 03 54 0
<k> (a )
p = 0p = 0 .0 0 2 5
0 .0 2 0 .0 4 0 .0 6 0 .0 8 0 .1 00 .1 0
0 .1 5
0 .2 0
0 .2 5
0 .3 0
0 .3 5C (b )
0 .0 2 0 .0 4 0 .0 6 0 .0 8 0 .1 02 .02 .22 .42 .62 .83 .03 .23 .4
L (c )
Figure 6. <k>, C and L values according to varying values in breakup threshold and arriving and leaving probability p.
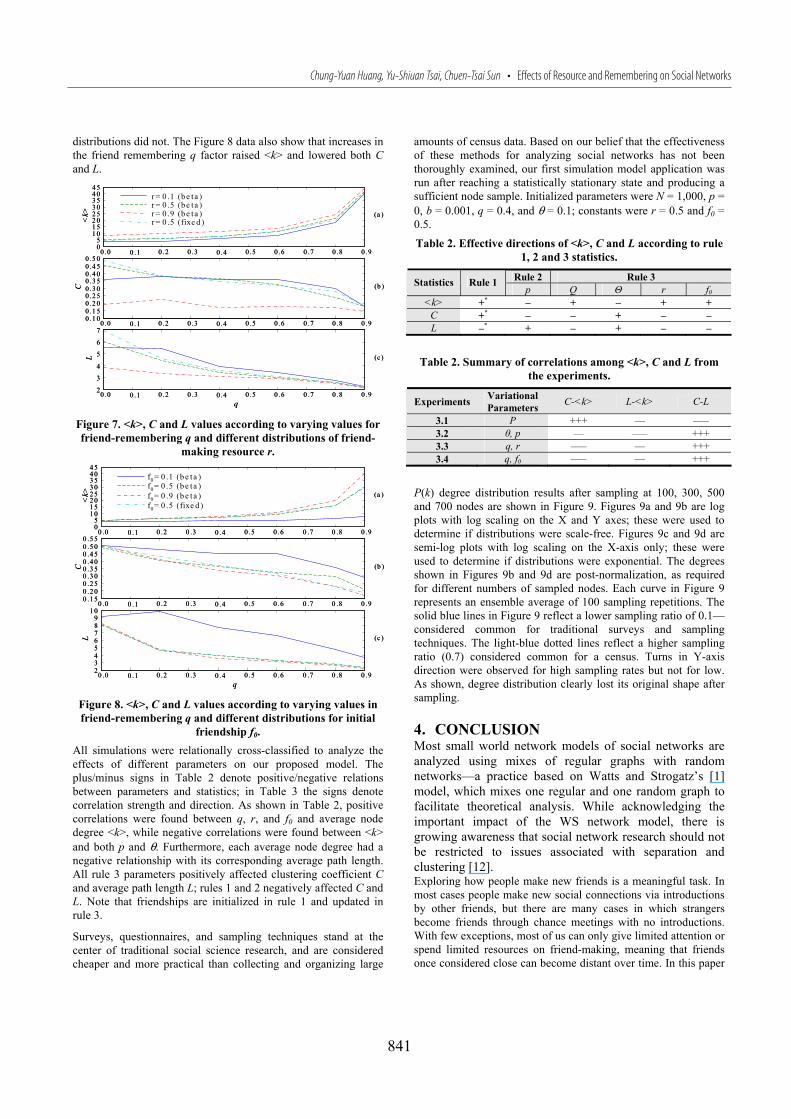
According to the data presented in Figure 6, the breakup threshold θ decreased the average node degree <k> and increased both clustering coefficient C and average path length L. The threshold reflects the ease with which a friendship is broken. As expected, a higher θ results in a smaller number of “average friends” and greater separation between individuals. To determine the effects of resources and memory factors on acquaintance networks, we ran a series of simulations using parameters initialized with different friend-making resource r and friend-remembering q values (p = 0, θ = 0.1, and a fixed f0 value of 1). Our results revealed that a larger r increased the average node degree <k>, but decreased both the clustering coefficient Cand average path length L (Fig. 7). The influences of different resource distributions on statistical characteristics (<k>, C, and L)are not clear; the opposite is true for different resource averages. The Figure 7 data also show that increases in q boosted <k> and reduced both C and L.We ran simulations using parameters initialized at different initial-friendship f0 and friend-remembering q values (plus p = 0, θ = 0.1, and fixed r value = 0.5) to determine the effects of those factors on acquaintance networks. Our results indicate that a larger f0 raised the average node degree <k> but lowered both the clustering coefficient C and average path length L (Fig. 8). Different initial friendship averages clearly influenced the statistical characteristics, but different initial friendship
Chung-Yuan Huang, Yu-Shiuan Tsai, Chuen-Tsai Sun • Eff ects of Resource and Remembering on Social Networks
841
distributions did not. The Figure 8 data also show that increases in the friend remembering q factor raised <k> and lowered both Cand L.
0 .0 0 .1 0 .2 0 .3 0 .4 0 .5 0 .6 0 .7 0 .8 0 .905
1 01 52 02 53 03 54 04 5
<k> (a )
r = 0 .1 (b e t a )r = 0 .5 (b e t a )r = 0 .9 (b e t a )r = 0 .5 (fixe d )
0 .0 0 .1 0 .2 0 .3 0 .4 0 .5 0 .6 0 .7 0 .8 0 .90 .1 00 .1 50 .2 00 .2 50 .3 00 .3 50 .4 00 .4 50 .5 0
C (b )
0 .0 0 .1 0 .2 0 .3 0 .4 0 .5 0 .6 0 .7 0 .8 0 .9q
2
3
4
5
6
7
L (c )
Figure 7. <k>, C and L values according to varying values for friend-remembering q and different distributions of friend-
making resource r.
0 .0 0 .1 0 .2 0 .3 0 .4 0 .5 0 .6 0 .7 0 .8 0 .905
1 01 52 02 53 03 54 04 5
<k> (a )
f0= 0 .1 (b e ta )f0= 0 .5 (b e ta )f0= 0 .9 (b e ta )f0= 0 .5 (fixe d )
0 .0 0 .1 0 .2 0 .3 0 .4 0 .5 0 .6 0 .7 0 .8 0 .90 .1 50 .2 00 .2 50 .3 00 .3 50 .4 00 .4 50 .5 00 .5 5
C (b )
0 .0 0 .1 0 .2 0 .3 0 .4 0 .5 0 .6 0 .7 0 .8 0 .9q
23456789
1 0
L (c )
Figure 8. <k>, C and L values according to varying values in friend-remembering q and different distributions for initial
friendship f0.All simulations were relationally cross-classified to analyze the effects of different parameters on our proposed model. The plus/minus signs in Table 2 denote positive/negative relations between parameters and statistics; in Table 3 the signs denote correlation strength and direction. As shown in Table 2, positive correlations were found between q, r, and f0 and average node degree <k>, while negative correlations were found between <k>and both p and θ. Furthermore, each average node degree had a negative relationship with its corresponding average path length. All rule 3 parameters positively affected clustering coefficient Cand average path length L; rules 1 and 2 negatively affected C and L. Note that friendships are initialized in rule 1 and updated in rule 3.
Surveys, questionnaires, and sampling techniques stand at the center of traditional social science research, and are considered cheaper and more practical than collecting and organizing large
amounts of census data. Based on our belief that the effectiveness of these methods for analyzing social networks has not been thoroughly examined, our first simulation model application was run after reaching a statistically stationary state and producing a sufficient node sample. Initialized parameters were N = 1,000, p = 0, b = 0.001, q = 0.4, and θ = 0.1; constants were r = 0.5 and f0 = 0.5.Table 2. Effective directions of <k>, C and L according to rule
1, 2 and 3 statistics.
Rule 2 Rule 3 Statistics Rule 1p Q r f0
<k> +* – + – + + C +* – – + – – L –* + – + – –
Table 2. Summary of correlations among <k>, C and L from the experiments.
Experiments VariationalParameters C-<k> L-<k> C-L
3.1 P +++ –– ––– 3.2 , p –– ––– +++ 3.3 q, r ––– –– +++ 3.4 q, f0 ––– –– +++
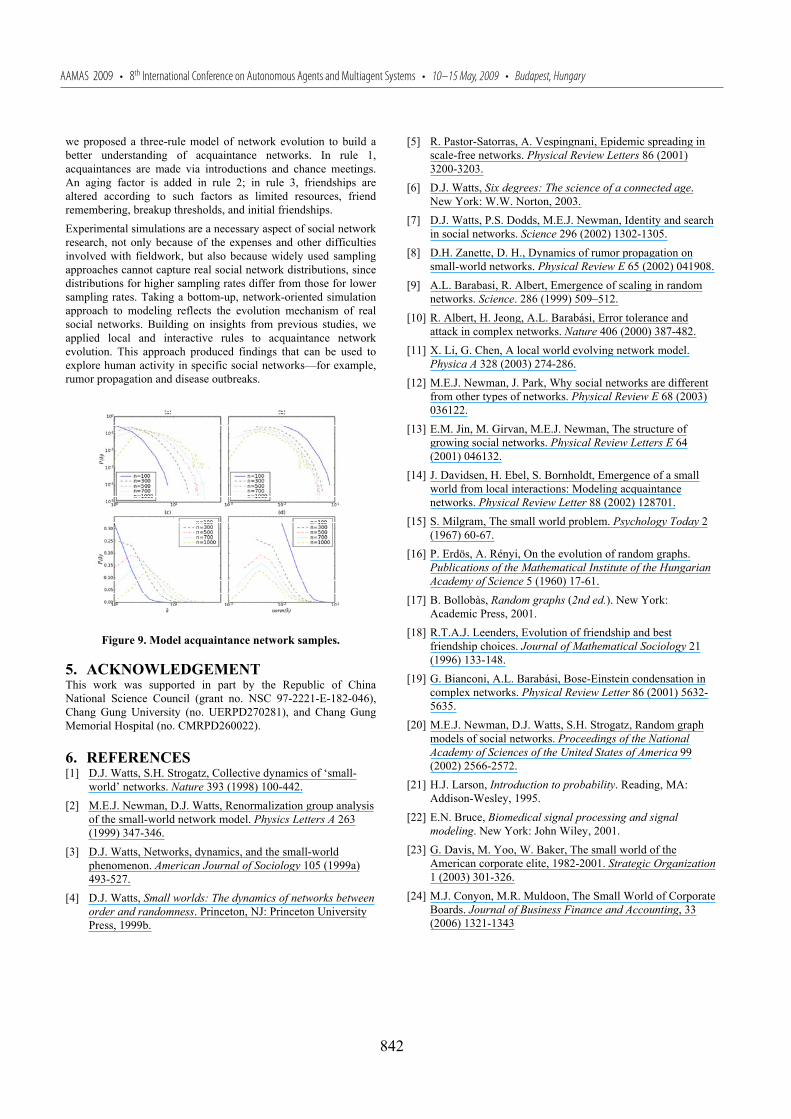
P(k) degree distribution results after sampling at 100, 300, 500 and 700 nodes are shown in Figure 9. Figures 9a and 9b are log plots with log scaling on the X and Y axes; these were used to determine if distributions were scale-free. Figures 9c and 9d are semi-log plots with log scaling on the X-axis only; these were used to determine if distributions were exponential. The degrees shown in Figures 9b and 9d are post-normalization, as required for different numbers of sampled nodes. Each curve in Figure 9 represents an ensemble average of 100 sampling repetitions. The solid blue lines in Figure 9 reflect a lower sampling ratio of 0.1—considered common for traditional surveys and sampling techniques. The light-blue dotted lines reflect a higher sampling ratio (0.7) considered common for a census. Turns in Y-axis direction were observed for high sampling rates but not for low. As shown, degree distribution clearly lost its original shape after sampling.
4. CONCLUSION Most small world network models of social networks are analyzed using mixes of regular graphs with random networks—a practice based on Watts and Strogatz’s [1] model, which mixes one regular and one random graph to facilitate theoretical analysis. While acknowledging the important impact of the WS network model, there is growing awareness that social network research should not be restricted to issues associated with separation and clustering [12]. Exploring how people make new friends is a meaningful task. In most cases people make new social connections via introductions by other friends, but there are many cases in which strangers become friends through chance meetings with no introductions. With few exceptions, most of us can only give limited attention or spend limited resources on friend-making, meaning that friends once considered close can become distant over time. In this paper
AAMAS 2009 • 8th International Conference on Autonomous Agents and Multiagent Systems • 10–15 May, 2009 • Budapest, Hungary
842
we proposed a three-rule model of network evolution to build a better understanding of acquaintance networks. In rule 1, acquaintances are made via introductions and chance meetings. An aging factor is added in rule 2; in rule 3, friendships are altered according to such factors as limited resources, friend remembering, breakup thresholds, and initial friendships. Experimental simulations are a necessary aspect of social network research, not only because of the expenses and other difficulties involved with fieldwork, but also because widely used sampling approaches cannot capture real social network distributions, since distributions for higher sampling rates differ from those for lower sampling rates. Taking a bottom-up, network-oriented simulation approach to modeling reflects the evolution mechanism of real social networks. Building on insights from previous studies, we applied local and interactive rules to acquaintance network evolution. This approach produced findings that can be used to explore human activity in specific social networks—for example, rumor propagation and disease outbreaks.
Figure 9. Model acquaintance network samples.
5. ACKNOWLEDGEMENT This work was supported in part by the Republic of China National Science Council (grant no. NSC 97-2221-E-182-046), Chang Gung University (no. UERPD270281), and Chang Gung Memorial Hospital (no. CMRPD260022).
6. REFERENCES[1] D.J. Watts, S.H. Strogatz, Collective dynamics of ‘small-
world’ networks. Nature 393 (1998) 100-442. [2] M.E.J. Newman, D.J. Watts, Renormalization group analysis
of the small-world network model. Physics Letters A 263 (1999) 347-346.
[3] D.J. Watts, Networks, dynamics, and the small-world phenomenon. American Journal of Sociology 105 (1999a) 493-527.
[4] D.J. Watts, Small worlds: The dynamics of networks between order and randomness. Princeton, NJ: Princeton University Press, 1999b.
[5] R. Pastor-Satorras, A. Vespingnani, Epidemic spreading in scale-free networks. Physical Review Letters 86 (2001) 3200-3203.
[6] D.J. Watts, Six degrees: The science of a connected age.New York: W.W. Norton, 2003.
[7] D.J. Watts, P.S. Dodds, M.E.J. Newman, Identity and search in social networks. Science 296 (2002) 1302-1305.
[8] D.H. Zanette, D. H., Dynamics of rumor propagation on small-world networks. Physical Review E 65 (2002) 041908.
[9] A.L. Barabasi, R. Albert, Emergence of scaling in random networks. Science. 286 (1999) 509–512.
[10] R. Albert, H. Jeong, A.L. Barabási, Error tolerance and attack in complex networks. Nature 406 (2000) 387-482.
[11] X. Li, G. Chen, A local world evolving network model. Physica A 328 (2003) 274-286.
[12] M.E.J. Newman, J. Park, Why social networks are different from other types of networks. Physical Review E 68 (2003) 036122.
[13] E.M. Jin, M. Girvan, M.E.J. Newman, The structure of growing social networks. Physical Review Letters E 64 (2001) 046132.
[14] J. Davidsen, H. Ebel, S. Bornholdt, Emergence of a small world from local interactions: Modeling acquaintance networks. Physical Review Letter 88 (2002) 128701.
[15] S. Milgram, The small world problem. Psychology Today 2 (1967) 60-67.
[16] P. Erdös, A. Rényi, On the evolution of random graphs. Publications of the Mathematical Institute of the Hungarian Academy of Science 5 (1960) 17-61.
[17] B. Bollobàs, Random graphs (2nd ed.). New York: Academic Press, 2001.
[18] R.T.A.J. Leenders, Evolution of friendship and best friendship choices. Journal of Mathematical Sociology 21 (1996) 133-148.
[19] G. Bianconi, A.L. Barabási, Bose-Einstein condensation in complex networks. Physical Review Letter 86 (2001) 5632-5635.
[20] M.E.J. Newman, D.J. Watts, S.H. Strogatz, Random graph models of social networks. Proceedings of the National Academy of Sciences of the United States of America 99 (2002) 2566-2572.
[21] H.J. Larson, Introduction to probability. Reading, MA: Addison-Wesley, 1995.
[22] E.N. Bruce, Biomedical signal processing and signal modeling. New York: John Wiley, 2001.
[23] G. Davis, M. Yoo, W. Baker, The small world of the American corporate elite, 1982-2001. Strategic Organization1 (2003) 301-326.
[24] M.J. Conyon, M.R. Muldoon, The Small World of Corporate Boards. Journal of Business Finance and Accounting, 33 (2006) 1321-1343