Effects of Particulate Matter Exposure on Blood 5-hydroxymethylation: Results from the Beijing Truck...
33
This article was downloaded by: [Marco Sanchez Guerra] On: 15 May 2015, At: 08:55 Publisher: Taylor & Francis Informa Ltd Registered in England and Wales Registered Number: 1072954 Registered office: Mortimer House, 37-41 Mortimer Street, London W1T 3JH, UK Click for updates Epigenetics Publication details, including instructions for authors and subscription information: http://www.tandfonline.com/loi/kepi20 Effects of Particulate Matter Exposure on Blood 5- hydroxymethylation: Results from the Beijing Truck Driver Air Pollution Study Marco Sanchez-Guerra a , Yinan Zheng b , Citlalli Osorio-Yanez c , Jia Zhong a , Yana Chervona d , Sheng Wang e , Dou Chang f , John P. McCracken g , Anaite Díaz g , Pier Alberto Bertazzi h , Petros Koutrakis a , Choong-Min Kang a , Xiao Zhang i , Wei Zhang i , Hyang-Min Byun a , Joel Schwartz a , Lifang Hou i & Andrea A. Baccarelli a a Department of Environmental Health, Harvard T.H. Chan School of Public Health, USA. b Institute for Public Health and Medicine, Northwestern University Feinberg School of Medicine, USA. c Department of Epidemiology, Harvard T.H Chan School of Public Health, USA. d Department of Environmental Medicine, New York University School of Medicine, USA. e Department of Occupational and Environmental Health, Peking University Health Science Center, China. f Department of Safety Engineering, China Institute of Industrial Relations, China. g Center for Health Studies, Universidad del Valle de Guatemala, Guatemala. h Department of Clinical Sciences and Community Health—DISCO, Università degli Studi di Milano, Italy. i Department of Preventive Medicine, Northwestern University Feinberg School of Medicine, USA. Accepted author version posted online: 13 May 2015. To cite this article: Marco Sanchez-Guerra, Yinan Zheng, Citlalli Osorio-Yanez, Jia Zhong, Yana Chervona, Sheng Wang, Dou Chang, John P. McCracken, Anaite Díaz, Pier Alberto Bertazzi, Petros Koutrakis, Choong-Min Kang, Xiao Zhang, Wei Zhang, Hyang-Min Byun, Joel Schwartz, Lifang Hou & Andrea A. Baccarelli (2015): Effects of Particulate Matter Exposure on Blood 5-hydroxymethylation: Results from the Beijing Truck Driver Air Pollution Study, Epigenetics, DOI: 10.1080/15592294.2015.1050174 To link to this article: http://dx.doi.org/10.1080/15592294.2015.1050174 Disclaimer: This is a version of an unedited manuscript that has been accepted for publication. As a service to authors and researchers we are providing this version of the accepted manuscript (AM). Copyediting, typesetting, and review of the resulting proof will be undertaken on this manuscript before final publication of the Version of Record (VoR). During production and pre-press, errors may be discovered which could affect the content, and all legal disclaimers that apply to the journal relate to this version also. PLEASE SCROLL DOWN FOR ARTICLE Taylor & Francis makes every effort to ensure the accuracy of all the information (the “Content”) contained in the publications on our platform. However, Taylor & Francis, our agents, and our licensors make no representations or warranties whatsoever as to the accuracy, completeness, or suitability for any purpose of the Content. Any opinions and views expressed in this publication are the opinions and views of the authors, and
-
Upload
hsph-harvard -
Category
Documents
-
view
0 -
download
0
Transcript of Effects of Particulate Matter Exposure on Blood 5-hydroxymethylation: Results from the Beijing Truck...

This article was downloaded by: [Marco Sanchez Guerra]On: 15 May 2015, At: 08:55Publisher: Taylor & FrancisInforma Ltd Registered in England and Wales Registered Number: 1072954 Registered office: Mortimer House,37-41 Mortimer Street, London W1T 3JH, UK
Click for updates
EpigeneticsPublication details, including instructions for authors and subscription information:http://www.tandfonline.com/loi/kepi20
Effects of Particulate Matter Exposure on Blood 5-hydroxymethylation: Results from the Beijing TruckDriver Air Pollution StudyMarco Sanchez-Guerraa, Yinan Zhengb, Citlalli Osorio-Yanezc, Jia Zhonga, Yana Chervonad,Sheng Wange, Dou Changf, John P. McCrackeng, Anaite Díazg, Pier Alberto Bertazzih, PetrosKoutrakisa, Choong-Min Kanga, Xiao Zhangi, Wei Zhangi, Hyang-Min Byuna, Joel Schwartza,Lifang Houi & Andrea A. Baccarelliaa Department of Environmental Health, Harvard T.H. Chan School of Public Health, USA.b Institute for Public Health and Medicine, Northwestern University Feinberg School ofMedicine, USA.c Department of Epidemiology, Harvard T.H Chan School of Public Health, USA.d Department of Environmental Medicine, New York University School of Medicine, USA.e Department of Occupational and Environmental Health, Peking University Health ScienceCenter, China.f Department of Safety Engineering, China Institute of Industrial Relations, China.g Center for Health Studies, Universidad del Valle de Guatemala, Guatemala.h Department of Clinical Sciences and Community Health—DISCO, Università degli Studi diMilano, Italy.i Department of Preventive Medicine, Northwestern University Feinberg School of Medicine,USA.Accepted author version posted online: 13 May 2015.
To cite this article: Marco Sanchez-Guerra, Yinan Zheng, Citlalli Osorio-Yanez, Jia Zhong, Yana Chervona, Sheng Wang,Dou Chang, John P. McCracken, Anaite Díaz, Pier Alberto Bertazzi, Petros Koutrakis, Choong-Min Kang, Xiao Zhang,Wei Zhang, Hyang-Min Byun, Joel Schwartz, Lifang Hou & Andrea A. Baccarelli (2015): Effects of Particulate MatterExposure on Blood 5-hydroxymethylation: Results from the Beijing Truck Driver Air Pollution Study, Epigenetics, DOI:10.1080/15592294.2015.1050174
To link to this article: http://dx.doi.org/10.1080/15592294.2015.1050174
Disclaimer: This is a version of an unedited manuscript that has been accepted for publication. As a serviceto authors and researchers we are providing this version of the accepted manuscript (AM). Copyediting,typesetting, and review of the resulting proof will be undertaken on this manuscript before final publication ofthe Version of Record (VoR). During production and pre-press, errors may be discovered which could affect thecontent, and all legal disclaimers that apply to the journal relate to this version also.
PLEASE SCROLL DOWN FOR ARTICLE
Taylor & Francis makes every effort to ensure the accuracy of all the information (the “Content”) containedin the publications on our platform. However, Taylor & Francis, our agents, and our licensors make norepresentations or warranties whatsoever as to the accuracy, completeness, or suitability for any purpose of theContent. Any opinions and views expressed in this publication are the opinions and views of the authors, and

are not the views of or endorsed by Taylor & Francis. The accuracy of the Content should not be relied upon andshould be independently verified with primary sources of information. Taylor and Francis shall not be liable forany losses, actions, claims, proceedings, demands, costs, expenses, damages, and other liabilities whatsoeveror howsoever caused arising directly or indirectly in connection with, in relation to or arising out of the use ofthe Content.
This article may be used for research, teaching, and private study purposes. Any substantial or systematicreproduction, redistribution, reselling, loan, sub-licensing, systematic supply, or distribution in anyform to anyone is expressly forbidden. Terms & Conditions of access and use can be found at http://www.tandfonline.com/page/terms-and-conditions
Dow
nloa
ded
by [
Mar
co S
anch
ez G
uerr
a] a
t 08:
55 1
5 M
ay 2
015

1
Effects of Particulate Matter Exposure on Blood 5-hydroxymethylation: Results from the
Beijing Truck Driver Air Pollution Study
Marco Sanchez-Guerra1†, Yinan Zheng2, Citlalli Osorio-Yanez3, Jia Zhong1, Yana Chervona4,
Sheng Wang5, Dou Chang6, John P. McCracken7, Anaite Díaz7, Pier Alberto Bertazzi8, Petros
Koutrakis1, Choong-Min Kang1, Xiao Zhang9, Wei Zhang9, Hyang-Min Byun1, Joel Schwartz1,
Lifang Hou9*†, and Andrea A. Baccarelli1*
1Department of Environmental Health, Harvard T.H. Chan School of Public Health, USA. 2Institute for Public Health and Medicine, Northwestern University Feinberg School of
Medicine, USA. 3Department of Epidemiology, Harvard T.H Chan School of Public Health, USA. 4Department of Environmental Medicine, New York University School of Medicine, USA. 5Department of Occupational and Environmental Health, Peking University Health Science
Center, China. 6Department of Safety Engineering, China Institute of Industrial Relations, China. 7Center for Health Studies, Universidad del Valle de Guatemala, Guatemala. 8Department of Clinical Sciences and Community Health—DISCO, Università degli Studi di
Milano, Italy. 9Department of Preventive Medicine, Northwestern University Feinberg School of Medicine,
USA.
*Equal contributions †Corresponding authors: Marco Sanchez-Guerra, Ph.D., MSc., BA.; E-mail:
[email protected]; Lifang Hou, M.D., Ph.D; E-mail: [email protected]
Competing interests: The authors declare they have no actual or potential competing financial
interests.
Keywords: Epigenetics, Particulate Matter, DNA methylation, 5-hydroxymethylcytosine, 5-
methylcytosine.
Dow
nloa
ded
by [
Mar
co S
anch
ez G
uerr
a] a
t 08:
55 1
5 M
ay 2
015

2
Abbreviations:
5hmC: 5-hydroxymethylcytosine; 5mC: 5-methylcytosine; Al: aluminum; BC: black carbon;
BMI: body mass index; Ca: calcium; CI: confidence interval; ELISA: enzyme-linked
immunosorbent assay; Fe: iron; FWER: family-wise error rate; HPLC: high-performance liquid
chromatography; K: potassium; PM: particulate matter; PM2.5: particulate matter ≤ 2.5 μm;
PM10: particulate matter ≤ 10 μm; S: sulfur, Si: silicon; TET: ten-eleven translocation enzymes;
Ti: titanium and Zn: zinc.
ABSTRACT
Previous studies have reported epigenetic changes induced by environmental exposures.
However, previous investigations did not distinguish 5-methylcytosine (5mC) from a similar
oxidative form with opposite functions, 5-hydroxymethylcytosine (5hmC). Here, we measured
blood DNA global 5mC and 5hmC by ELISA and used adjusted mixed-effects regression models
to evaluate the effects of ambient PM10 and personal PM2.5 and its elemental components—black
carbon (BC), aluminum (Al), calcium (Ca), potassium (K), iron (Fe), sulfur (S), silicon (Si),
titanium (Ti), and zinc (Zn)—on blood global 5mC and 5hmC levels. The study was conducted
in 60 truck drivers and 60 office workers in Beijing, China from The Beijing Truck Driver Air
Pollution Study at two exams separated by one to two weeks. Blood 5hmC level (0.08%) was
~83-fold lower than 5mC (6.61%). An inter-quartile range (IQR) increase in same-day PM10 was
associated with increases in 5hmC of 26.1% in office workers (P=0.004), 20.2% in truck drivers
(P=0.014), and 21.9% in all participants combined (P<0.001). PM10 effects on 5hmC were
increasingly stronger when averaged over 4, 7, and 14 days preceding assessment (up to 132.6%
for the 14-day average in all participants, P<0.001). PM10 effects were also significant after
controlling for multiple testing (family-wise error rate; FWER<0.05). 5hmC was not correlated
Dow
nloa
ded
by [
Mar
co S
anch
ez G
uerr
a] a
t 08:
55 1
5 M
ay 2
015

3
with personal measures of PM2.5 and elemental components (FWER>0.05). 5mC showed no
correlations with PM10, PM2.5, and elemental components measures (FWER>0.05). Our study
suggests that exposure to ambient PM10 affects 5hmC over time, but not 5mC. This finding
demonstrates the need to differentiate 5hmC and 5mC in environmental studies of DNA
methylation.
Dow
nloa
ded
by [
Mar
co S
anch
ez G
uerr
a] a
t 08:
55 1
5 M
ay 2
015
4
INTRODUCTION
Urban air pollution is a major public health concern that, according to the World Health
Organization, is responsible for ~3.7 million deaths annually, representing 6.7% of all deaths
worldwide.1 Governments and regulatory agencies have made concerted efforts to abate air
pollution emissions, specifically by regulating particulate matter (PM) levels.2-4 However, further
abatements are constrained by high marginal costs.5, 6 Moreover, limited resources are available
to identify individuals who are affected by air pollution and ascertain their risks. Biomarkers that
reflect adverse exposures could be vital for identifying people who are affected by PM exposure
before it becomes clinically evident.
Epigenetic features like DNA methylation are increasingly being implicated as sensitive
to environmental exposures, and therefore could serve as important biomarkers for exposure
effects.7-12 DNA methylation modifications, both in specific genes and in non-coding repetitive
elements, have been shown to be altered following PM exposure.13-18 Traditional DNA
methylation involves the transfer of a methyl group to the carbon 5 position of cytosine to produce
5-methylcytosine (5mC). However, research has shown that the Tet family of cytosine
oxygenase enzymes are involved in oxidizing 5-methylcytosine into 5-hydroxymethylcytosine
(5hmC). In contrast to 5mC, which is often associated with suppressed gene expression, 5hmC
has been found to be specifically enriched in expressed genes, and may play a role in activating
and/or maintaining gene expression.19-21 Therefore, distinguishing these two forms of
methylation is critical for understanding the potential effects of methylation changes.
Because the standard technologies for DNA methylation analysis, including those based
on bisulfite treatment of DNA, fail to separate 5hmC from 5mC22-24 (providing instead a
Dow
nloa
ded
by [
Mar
co S
anch
ez G
uerr
a] a
t 08:
55 1
5 M
ay 2
015

5
composite measure of the sum of 5mC and 5hmC), most epigenetic studies have not
differentiated 5hmC from 5mC. This differentiation, however, is particularly critical for air
pollution studies, because PM exposures can introduce oxidative stress. Oxidative stress can alter
the activity of the Ten-eleven translocation (TET) protein family members, which catalyze
enzymatic reactions that generate 5hmC from 5mC.25 Further, Chia et al. suggested that pro-
oxidant environmental exposures can increase the global genomic content of 5hmC.25
However—while previous studies have reported that PM exposure is negatively associated with
5mC or total methylation levels13, 26-28—no study to date has evaluated whether PM exposure
changes 5hmC levels in human DNA.
In the present study, we determined the genomic content of both 5hmC and 5mC in a
study of two highly exposed groups with different occupations, i.e., office workers and truck
drivers, in Beijing, China. Beijing has one of the highest air pollution levels worldwide.29 We
used measures of ambient PM less than 10 µm in diameter (PM10) mass from ambient monitors
across Beijing City, as well as personal measures of both PM2.5 and elemental components using
personal samplers. We hypothesized that PM exposure—by facilitating the oxidation of 5mC
into 5hmC—would result in increased blood levels of 5hmC. The findings underscore the
necessity for distinguishing these two types of DNA methylation to achieve a better
understanding of the effects of environmental exposures and the roles of epigenetic mechanisms
in non-communicable diseases development due to pro-oxidant exposures.
RESULTS
Characteristics of the study participants
Dow
nloa
ded
by [
Mar
co S
anch
ez G
uerr
a] a
t 08:
55 1
5 M
ay 2
015
6
The participants in the Beijing Truck Driver Air Pollution Study have been described
elsewhere.13, 30-32 Truck drivers were moderately but significantly older than office workers.
Truck drivers had higher BMI, reported more pack-years of smoking, and smoked more
cigarettes during the examination time.
Ambient PM10 mass and personal PM2.5 mass and elemental components
Office workers and truck drivers were examined on days with average ambient PM10
mass of 118.1 ± 52.8 and 124.9 ± 51.2 µg/m3 for the two groups, respectively (Table 1, P=0.33
for difference in PM10 mass between the two groups). Table 1 also reports the multi-day averages
of ambient PM10 mass on and before the examination days (including means of 4, 7, and 14
days).
Personal levels of PM2.5 mass, and elemental components (BC, Al, Ca, Fe, K, S, Si, Ti,
and Zn) measured during eight work hours on examination days were significantly higher in
truck drivers than in office workers (P<0.001 for all exposures). However, all personal exposure
metrics showed largely overlapping distributions between the two groups.
Ambient PM10 mass and personal exposure measures (PM2.5 mass, BC, and elemental
components) showed variable degrees of correlation (Figure 1). In particular, the four time-
window averages of ambient PM10 mass showed strong-to-moderate correlations with each other.
As expected, correlations were higher for the closer averages (i.e., 24-hour and 4-day average, or
4-day and 7-day average). Personal exposures, which all were measured on particles sampled
during eight work hours on the days of examination, mostly showed medium to high
correlations, but had moderate or little correlation with ambient PM10 mass.
Descriptive statistics of 5hmC and 5mC levels
Dow
nloa
ded
by [
Mar
co S
anch
ez G
uerr
a] a
t 08:
55 1
5 M
ay 2
015

7
The characteristics of the 60 office workers and 60 truck drivers by blood levels of 5-
hydroxymethylcytosine (5hmC) and 5-methylcytosine (5mC) are presented in Table 2.
The geometric mean of 5hmC (0.08%; 95% CI: 0.08 - 0.09) was ~83-fold lower than the
geometric mean of 5mC (6.61%, 95% CI: 6.24 - 7.01). The 5hmC values ranged between 0.02%
(min) and 0.29% (max); 5mC ranged between 3.29% (min) and 10.19% (max). The levels of
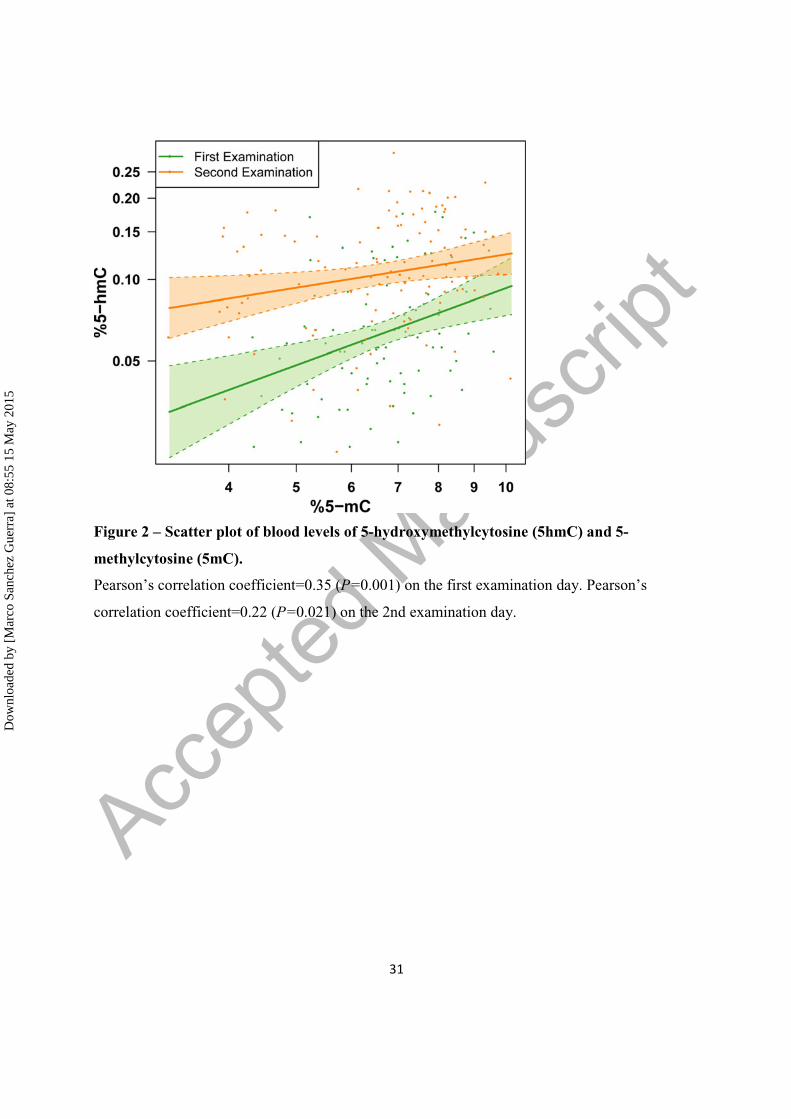
5hmC and 5mC in blood DNA were significantly correlated with each other (Pearson’s
correlation=0.35, P=0.001 on the first examination day; Pearson’s correlation=0.22, P=0.021 on
the 2nd examination day) (Figure 2).
The geometric means of 5hmC levels (Table 2) did not differ between office workers
(0.09%, 95% CI: 0.08 - 0.10) and truck drivers (0.08%, 95% CI: 0.07 - 0.09, P=0.28). Males had
significantly higher 5hmC than females (0.10%, 95% CI: 0.09 - 0.11, and 0.06%, 95% CI: 0.06;
0.07 respectively, P<0.001). Further, 5hmC decreased moderately and non-significantly with
participant age (P=0.094). Former smokers and current smokers had marginally higher 5hmC
than never smokers (P=0.082). 5hmC tended to fluctuate across the days of the week (P=0.035)
and increased with higher dew point (P=0.048), whereas BMI (P=0.58) and temperature
(P=0.40) were not related with 5hmC.
The geometric mean of 5mC levels (Table 2) also did not differ between office workers
(6.47%, 95% CI: 6.19 - 6.77) and truck drivers (6.75%, 95% CI: 6.46 - 7.06, P=0.19). As for
5hmC, 5mC levels were higher in males (6.93%, 95% CI: 6.67 - 7.21) than females (6.10%, 95%
CI: 5.80 - 6.41, P<0.001). 5mC also decreased slightly with age (P=0.069), but was not
associated with BMI, smoking, day of week, temperature, or dew point (P>0.1). Based on our
results, 5hmC measurements exhibited less day-to-day variability (about 28 times lower median
intra-individual variability), compared to 5mC (Supplemental Figure S1). These findings
Dow
nloa
ded
by [
Mar
co S
anch
ez G
uerr
a] a
t 08:
55 1
5 M
ay 2
015

8
suggested that global 5hmC in our study population was likely to be a relatively stable DNA
modification compared to 5mC, which is in line with previous studies.33
Effects of ambient and personal exposures on blood genomic levels of 5hmC and 5mC
We used mixed-effects regression models adjusted for age, gender, BMI, smoking status,
day of week, temperature, and dew point to evaluate the associations of 5hmC with ambient and
personal exposure levels (Table 3). An IQR increase in ambient PM10 levels on the examination
days was associated with an increase in blood 5hmC equal to 26.1% in office workers (95% CI:
7.9 - 47.4, P=0.004), 20.2% in truck drivers (95% CI: 4.0 - 39.0, P=0.014), and 21.9% in all
participants combined (95% CI: 10.3 - 34.7, P<0.001). The correlations between 5hmC and
ambient PM10 mass increased in strength with increasing number of days included in multi-day
averages. Among office workers, an IQR increase ambient PM10 mass was associated with
increased 5hmC of 27.7% (95% CI: 9.0 - 49.5, P=0.003) with the 4-day average, 43.2% (95%
CI: 15.6 - 77.4, P=0.001) with the 7-day average, and 152.1% (95% CI: 59.8 - 297.8, P<0.001)
with the 14-day average. In truck drivers, an IQR increase of ambient PM10 mass was associated
with increased 5hmC of 34.1% (95% CI: 13.3 - 58.6, P=0.001) with the 4-day average, 39.9%
(95% CI: 11.6 - 75.5, P=0.005) with the 7-day average, and 122.6% (95% CI: 49.9 - 230.6,
P<0.001) with the 14-day average. In all participants combined, an IQR increase in ambient
PM10 mass was associated with increased 5hmC of 28.1% (95% CI: 15.3 - 42.2, P<0.001) with
the 4-day average, 37.3% (95% CI: 18.8 - 58.6, P<0.001) with the 7-day average, and 132.6%
(95% CI: 75.6 - 208.0, P<0.001) with the 14-day average. To account for the multiple dependent
statistical tests conducted in our analysis, we calculated permutation-based P-values adjusted for
multiple comparisons using FWER. At FWER<0.05, all the different time windows of ambient
PM10 mass remained highly significant for office workers, truck drivers, and all participants
Dow
nloa
ded
by [
Mar
co S
anch
ez G
uerr
a] a
t 08:
55 1
5 M
ay 2
015

9
combined. The increasingly larger cumulative effects of PM10 on 5hmC with more days before
the examination days suggest that the effect of PM10 on 5hmC tend to build up in time. Although
an IQR increase BC was significantly associated with increased 5hmC of 27.0% (95% CI: 6.5 -
51.4, P=0.009) in office workers and 14.6% (95% CI: 3.5 - 26.9, P=0.010) in truck drivers, at
the same FWER threshold, none of the personal measures of exposures (PM2.5 mass, BC, and
elemental components during eight work hours on examination days) was associated with 5hmC.
We conducted the same set of statistical analyses in relation to 5mC (Table 4). 5mC did
not show significant associations with ambient PM10 mass, personal PM2.5 mass, BC, or
elemental components at FWER<0.05.
DISCUSSION
In this study of truck drivers and office workers in Beijing, China, we found that
exposure to ambient PM10 mass was associated with increased levels of 5hmC, while no
association was observed with 5mC. The effects of ambient PM10 mass levels on 5hmC were
progressively higher in relation to longer time windows of exposure, possibly due to
accumulation of effects over time. Consistent with this time-dependent dynamics, short-term (8-
hour) personal exposures to PM2.5, BC, Al, C, K, Fe, S, Si, Ti, and Zn were not associated with
either blood global 5hmC or 5mC.
As expected based on previous analysis of human blood,34 we found that the levels of
5hmC were much lower than those of 5mC. We found higher global 5mC in males than females,
consistent with previous studies conducted in Chinese populations and in a Belgian population;
26, 35, 36 findings were similar for global 5hmC. However, the ratio of 5mC/5hmC was higher in
our data compared to previous studies. In our study, 5hmC was ~83-fold lower than 5mC. In 48
Dow
nloa
ded
by [
Mar
co S
anch
ez G
uerr
a] a
t 08:
55 1
5 M
ay 2
015
10
participants in the US Strong Heart Study, 5hmC levels were just ~2.5-fold lower than 5mC,
with median values of 0.12% for 5hmC and 0.32% for 5mC in DNA isolated from frozen buffy
coat, and 0.15 for 5hmC and 0.32 for 5mC in frozen whole blood.34 In a study of 48 healthy men
from Spain, 5hmC levels were 10-fold lower than 5mC in DNA from whole blood (0.09% for
5hmC vs. 0.90% for 5mC). We note that 5hmC levels in our Beijing population (0.08%) were
remarkably similar to those reported in these previous studies in Spain (0.09%) and the United
States (0.12%). Although, the 5mC (6.61%) levels differed between 7-fold and 21-fold across the
three studies; the levels found in this study are more similar to those reported by De Prins et al.
(4.3%).26
Previous investigations have suggested that DNA methylation is highly sensitive to
environmental exposures,7-11 including air pollution. To the best of our knowledge, the present
study is the first human investigation of both 5hmC and 5mC in relation to PM exposure. Our
results show that 5hmC may reflect PM-related epigenetic changes that were not captured by
previous studies only examining 5mC. The positive correlation between ambient PM10 and
5hmC is in line with 5hmC biology. PM exposure results in generation of reactive oxygen
species (ROS),37-39 which are chemically reactive molecules that can induce oxidation of 5mC
into 5hmC.25 Our findings are also consistent with recent in vitro results by Coulter et al,40 who
showed that hydroquinone—a benzene metabolite that has been shown to heighten ROS levels—
increased 5hmC content in HEK293 cells.41 Chia et al.25 have proposed that ROS affects 5hmC
patterns via metabolic alterations influencing the tricarboxylic acid cycle and thereby activating
TET and other chromatic modifying proteins. We note that our study was based on global
measures of genomic content of 5hmC and 5mC. It is plausible that PM and other environmental
exposures may have different effects on specific genes and non-coding sequences across the
Dow
nloa
ded
by [
Mar
co S
anch
ez G
uerr
a] a
t 08:
55 1
5 M
ay 2
015

11
human genome. Our results support further studies using emerging platforms for epigenome-
wide scans of 5hmC, which will allow the mapping of environmental effects on 5hmC across the
human genome.
In contrast to previous studies, we did not observe any robust significant effects on 5mC.
In a study on healthy adults with an annual low PM10 exposure (21.7 ± 2.0 µg/m3), De Prins et al.
showed that 5mC was negatively associated with PM10 average exposure in the 14 days before
blood drawing.26 Differences in analytical methods may help account for the differences in
results compared to our study. While we used ELISA, De Prins et al. used high-performance
liquid chromatography (HPLC) to measure 5mC. Head-to-head comparisons of the performances
of HPLC and ELISA in measuring DNA methylation are not yet available, but previous
reproducibility studies for other analytes have shown better precision for HPLC.42, 43 ELISA,
which we selected because of the higher sample throughput, may be sufficiently precise to detect
environment-induced differences in 5hmC, but it might be inadequate to identify potentially
smaller effects on 5mC. In addition, there is a big difference in concentration range of particulate
matter air pollution between the present study (range: 60 – 186 μg/m3 in office workers and 72 –
190 μg/m3 in truck drivers) and De Prins et al (range: 18.5–27.7 μg/m3). This could be another
contributing factor that leads to the discrepancy in the conclusions.
Differences in the levels and patterns of 5hmC and 5mC are also expected. While the two
marks often co-exist, 5hmC is significantly enriched at gene transcription start sites coinciding with TET1
on genes with high CpG-content.44 Additionally, 5hmC exhibits lower levels in repetitive elements
and minor satellites compared with 5mC.44 Therefore, 5hmC and 5mC have distinct genomic
distributions; the different localizations of 5hmC and 5mC reflect their distinct biological
functions and might help to explain the differential effects of PM observed in our study.
Dow
nloa
ded
by [
Mar
co S
anch
ez G
uerr
a] a
t 08:
55 1
5 M
ay 2
015

12
In our study, we did not find any significant associations of personal measures of
exposures to PM2.5 mass and elemental components with 5hmC. Ambient PM10 mass measures
and personal measures differed for the time windows over which they were evaluated. Ambient
PM10 mass data were available as daily averages, while we conducted our personal measures for
eight hours during the participants’ work shifts. This difference in sampling times might have
contributed to the differences in the results. In fact, our data show stronger effects of ambient
PM10 with longer multi-day averages. The increasingly larger effects of PM10 on 5hmC with
longer PM10 averages over the days preceding the exams suggest that the effect of PM10 on
5hmC tend to build up in time. Shorter hourly averages, such as the eight-hour time window used
for personal exposure, might have comparatively weaker effects, explaining the lack of
associations in our study. Taken together, since personal PM2.5 measurement were only collected
for 8-hr average, we are not able to draw a definite conclusion on the impact of short-term PM2.5
exposure on 5hmC. However, it is possible that PM10 and PM2.5 may have distinct biologic
effects on 5hmC due to their differences in composition and size. Future toxicological studies are
required to ascertain the mechanistic underpinning of the different effects of PM10 and PM2.5 on
5hmC.
Our results suggested potential effect modification by occupation (truck driver/office
workers), which might imply that office workers were more sensitive/vulnerable to the effect of
BC on 5hmC, compared to truck drivers due to unknown physiological/sociological factors.
However, due to limited sample size we did not have enough statistical power to detect effect
modification.
We recognize that our study is subject to a number of limitations. We cannot exclude
false negative findings or chance findings due to the relatively small sample size; however, all
Dow
nloa
ded
by [
Mar
co S
anch
ez G
uerr
a] a
t 08:
55 1
5 M
ay 2
015

13
our findings were significant using a stringent cutoff of 0.05 for FWER, limiting the chance of
false-positive results. While our study population may not be representative of the general
population, consistent internal validity and adjustment for various lifestyle factors and
demographic characteristics allow for moderate generalizability. Our main findings are based on
stationary measures of ambient PM10, which are used as a proxy of personal exposure. Based on
the study operations, it is reasonable to assume that the measurement error occurred independent
of the outcome (global 5mC and 5hmC in blood DNA). Therefore, the misclassification was
likely non-differential and can only bias the results towards to null. Previous studies have also
shown that the error introduced by using data from stationary monitors usually leads to
underestimating of the effects of air pollution.45 Moreover, we used multivariable models to
control potential confounders, while residual confounding due to unmeasured variables is not
unlikely, chances that the observed association reflected bias resulting from residual confounding
are minimized. Finally, due to the lack of blood cell counts data, we cannot exclude actual
epigenetic variation from exposure-related differences in cellular composition. It is possible that
the change in methylation status was partially due to changes in cell composition following PM10
exposures.
Conclusion
In summary, our study suggests that exposure to ambient PM10 affects blood genomic
content of 5hmC over time, but not of 5mC. If confirmed, this finding would indicate the need to
differentiate 5hmC and 5mC in environmental studies of DNA methylation. Further studies are
warranted to evaluate the patterns of 5hmC in relation to PM across the human epigenome and to
identify relevant biological pathways for human health effects.
Dow
nloa
ded
by [
Mar
co S
anch
ez G
uerr
a] a
t 08:
55 1
5 M
ay 2
015

14
METHODS
Study population and design
The Beijing Truck Driver Air Pollution Study,13, 30-32 conducted between June 15 and
July 27, 2008, included 60 truck drivers and 60 indoor office workers. All study participants
worked and lived in the Beijing metropolitan area and had held their current jobs for at least two
years. Truck drivers and indoor office workers were similarly distributed by age, sex, smoking,
and education level. In-person interviews using a detailed questionnaire were conducted to
collect information on demographics, lifestyle, and other exposures. Information on time-varying
factors, including alcohol consumption and smoking status, was obtained for past usual exposure
as well as for each examination day. Because PM levels vary on a day-to-day basis, we examined
all participants on two workdays separated by a 1-2 week period. Individual written informed
consent was obtained from all participants before enrollment in the study. Institutional Review
Board approval was obtained at all participating institutions before study participant recruitment.
Sample collection and DNA global methylation analysis (5hmC and 5mC)
All blood draw procedures were conducted at approximately the same time of the day
between 4-6 pm (after participants completed a full work-day) to eliminate confounding due to
diurnal variation. Their whole blood was collected in EDTA tubes and processed within two
hours. The samples were centrifuged at 2,500 rpm to separate the buffy coat and stored at -80°C
until analysis. Wizard Genomic DNA Purification Kit (Promega, Madison, WI) was used to
extract total DNA from 200 μL buffy coat.32 One hundred nanograms of genomic DNA in each
reaction were used to measure global %5hmC and %5mC by specific ELISA. 5hmC was
measured using the Quest 5hmC™ DNA ELISA Kit. 5mC was measured using the 5mC DNA
ELISA Kit (both kits from Zymo Research, Orange, CA, USA). Analyses were conducted
Dow
nloa
ded
by [
Mar
co S
anch
ez G
uerr
a] a
t 08:
55 1
5 M
ay 2
015

15
according to the manufacturer’s protocols, and all experiments were run in triplicate. Blood
DNA samples were randomized across plates to limit potential bias from plate effects, and
laboratory personnel were blinded to exposure groups and exposure study. Both kits are highly
sensitive and specific to the mC modification of concern, with no cross-reactivity for the other
mC modification. The within- and between-assay coefficients of variation were 3.9% and 10.8%,
respectively, for 5hmC; and 3.01% and 14.5%, respectively, for 5mC. The detection limit for per
100 ng input DNA was 0.02% for 5hmC and 0.5% for 5mC.
Ambient PM10 mass data
Ambient PM10 data during the study period were obtained from the Beijing Municipal
Environmental Protection Bureau (http://www.bjepb.gov.cn/). To determine individual-level
PM10 exposures, we used the aggregate measures (the daily averages of PM10 levels across all the
27 monitoring stations) as surrogate measures of individual-level exposure in Beijing on that
specific day. We then constructed the exposure matrix for each individual based on the time
window of interest. In detail, we calculated the individual-level exposure for 1-day mean (PM10
on examination day), 4-day mean (average of PM10 mass on the examination day and on the 3
days before examination), 7-day mean (average of PM10 on the examination day and on the 6
days before examination), and 14-day mean (average of PM10 on the examination day and on the
13 days before examination). We obtained daily outdoor temperature data for Beijing city from
the National Oceanic and Atmospheric Administration online database.30
Personal PM2.5 mass and elemental component measurements
We measured average personal PM2.5 on both examination days using gravimetric
samplers worn by the study participants during eight hours of work. The air sampler was carried
in a belt pack with the inlet clipped near the breathing zone. Each air sampler setup included an
Dow
nloa
ded
by [
Mar
co S
anch
ez G
uerr
a] a
t 08:
55 1
5 M
ay 2
015

16
Apex pump (Casella Inc., Bedford, UK), a Triplex Sharp-Cut Cyclone (BGI Inc., Waltham,
Massachusetts, USA), and a 37-mm Teflon filter placed on top of a drain disc and inside a metal
filter holder. The filters were kept under atmosphere-controlled conditions before and after
sampling and were weighed with a microbalance (Mettler-Toledo Inc., Columbus, Ohio, USA).
A time-weighted average of PM2.5 concentrations was calculated by dividing the change in filter
weight before and after sampling by the volume of air sampled. We found high reproducibility of
PM2.5 measures (r=0.944) in replicate samples on a subset of 24 participants who wore two
monitors at the same time (data not shown). The blackness of the same filters was used to
measure PM2.5 and was assessed using an EEL Model M43D smoke stain reflectometer, applying
the standard black-smoke index calculations of the absorption coefficients based on reflectance.46
We assumed a factor of 1.0 for converting the absorption coefficient to black carbon (BC)
mass,47, 48 which was then divided by the sampled air volume to calculate average BC exposure
concentration.46 BC is a combustion by -product contained in PM that has been used as a
surrogate measure for PM from gasoline- and, especially, diesel-powered motor vehicles,47 and
others like coal combustion and biomass burning.49
Elemental components of PM were measured from the PM collected on the filters using
an XRF PANanalytical Epsilon 5 analyzer (Almelo, Netherlands), as described previously.50, 51
We selected the eight elements, i.e., potassium (K), sulfur (S), iron (Fe), silicon (Si), aluminum
(Al), zinc (Zn), calcium (Ca), and titanium (Ti), that showed the highest reproducibility (r>0.75)
in replicate samples from the subset of 24 participants who wore two monitors at the same time
(data not shown).
Statistical analysis
Dow
nloa
ded
by [
Mar
co S
anch
ez G
uerr
a] a
t 08:
55 1
5 M
ay 2
015

17
In the present study, we examined each participant on two different days. Therefore,
measures may lack independence within participants. To account for this data feature, we used
mixed-effects regression models with random intercept in all analyses (PROC MIXED in SAS
9.3, SAS Institute Inc., Cary, NC).
To evaluate the association of short-term variations on air particle with 5hmC and 5mC, the
following mixed-effects model was used:
Yij = β0 + β1(Air particle)ij + β2X2ij +...+ βnXnij + ξj + eij
where Yij is the measures of 5hmC or 5mC for the jth participant measured on the ith
examination day; β0 is the overall intercept; β1 is the regression coefficient for exposure variable,
i.e., air particle level; β2 … βn are the regression coefficients for the time-dependent covariates
(i.e., temperature and dew point) or time-independent covariates (i.e., occupation group, gender,
age, BMI, and smoking status) included in multivariate models; ξj is the random effect for the
participant, and eij is the residual error term. A two-sided p level of less than 0.05 was considered
significant. To account for multiple hypothesis testing where the underlying tests are dependent,
we conducted a single-step permutation max T procedure52 within the four ambient PM10
measures, and within the other personal monitor measures (PM2.5, BC, and elemental
component), respectively. The conventional used Benjamini-Hochberg False Discovery Rate
correction assumes that all hypotheses should be independent, which was not the case in our
study. In fact, the four PM10 time windows are inherently inter-related, as the shorter moving
averages are embedded in the longer moving averages. The personal monitor measures (PM2.5,
BC, and constituents) are not independent as BC and constituents are all analyzed on the same
PM2.5 sample collected from the same device and same filter. Adjusted p-values were calculated
from 1,000 permutations in a way that matches the null hypothesis. This method strongly
Dow
nloa
ded
by [
Mar
co S
anch
ez G
uerr
a] a
t 08:
55 1
5 M
ay 2
015

18
controls FWER (family-wise error rate), which is the probability of having at least one false
positive among the whole set of comparisons. All analyses were performed in SAS 9.3 (SAS
Institute Inc., Cary, NC).
Acknowledgements
This work has been supported by the NIEHS (R21ES020984, R21ES020010, R01ES021733).
MSG has been financially supported by the Fundación México en Harvard, A.C and Consejo
Nacional de Ciencia y Tecnología (CONACYT-Mexico). Additional support was received
from center grants from the NIEHS (ES00002) and the US EPA (R-82735301).
Authors' contributions
SW, CD, PAB, JS, WZ, LH, and AAB designed the study and supervised the study operations.
CD, JPM, AD, and XZ prepared the study protocols and oversaw their implementation. MSG,
COY, YC, and HMB developed and/or supervised the epigenetic analyses. JM, CMK, and PK
were responsible for personal exposure measures. YZ performed the statistical analyses. MSG,
COY, JZ, LH, and AAB wrote the manuscript. All authors read and approved the final
manuscript.
Dow
nloa
ded
by [
Mar
co S
anch
ez G
uerr
a] a
t 08:
55 1
5 M
ay 2
015
19
References
1. World Health Organization. Burden of disease from Ambient Air Pollution for 2012 - Summary of Results. Geneva, Switzerland: WHO, 2014. 2. EPA. Identification of Nonattainment Classification and Deadlines for Submission of State Implementation Plan (SIP) Provisions for the 1997 Fine Particle (PM2.5) National Ambient Air Quality Standard (NAAQS) and 2006 PM2.5 NAAQS Federal register, 2014. 3. Johnson PR, Graham JJ. Fine particulate matter national ambient air quality standards: public health impact on populations in the northeastern United States. Environmental health perspectives 2005; 113:1140-7. 4. Johnson PR, Graham JJ. Analysis of primary fine particle national ambient air quality standard metrics. Journal of the Air & Waste Management Association 2006; 56:206-18. 5. Li CZ, Budh E. Environmental Objectives, Cost Efficiency, and Multivariate Stochastic Control. Environ Model Assess 2008; 13:315-25. 6. Amann M, Asman A, Bertok I, Cofala J, Heyes C, Klimont Z, Rafaj P, Schöpp W, Wagner F. Cost-optimized reductions of air pollutant emissions in the EU Member States to address the environmental objectives of the Thematic Strategy on Air Pollution. Laxenburg, Austria: International Institute for Applied Systems Analysis (IIASA), 2007. 7. Bollati V, Baccarelli A. Environmental epigenetics. Heredity 2010; 105:105-12. 8. Cortessis VK, Thomas DC, Levine AJ, Breton CV, Mack TM, Siegmund KD, Haile RW, Laird PW. Environmental epigenetics: prospects for studying epigenetic mediation of exposure-response relationships. Human genetics 2012; 131:1565-89. 9. Hou L, Zhang X, Wang D, Baccarelli A. Environmental chemical exposures and human epigenetics. International journal of epidemiology 2012; 41:79-105. 10. Alegria-Torres JA, Baccarelli A, Bollati V. Epigenetics and lifestyle. Epigenomics 2011; 3:267-77. 11. Baccarelli A, Ghosh S. Environmental exposures, epigenetics and cardiovascular disease. Current opinion in clinical nutrition and metabolic care 2012; 15:323-9. 12. Fleisch AF, Wright RO, Baccarelli AA. Environmental epigenetics: a role in endocrine disease? Journal of molecular endocrinology 2012; 49:R61-7. 13. Guo L, Byun HM, Zhong J, Motta V, Barupal J, Zheng Y, Dou C, Zhang F, McCracken JP, Diaz A, et al. Effects of short-term exposure to inhalable particulate matter on DNA methylation of tandem repeats. Environmental and molecular mutagenesis 2014; 55:322-35. 14. Tarantini L, Bonzini M, Apostoli P, Pegoraro V, Bollati V, Marinelli B, Cantone L, Rizzo G, Hou L, Schwartz J, et al. Effects of particulate matter on genomic DNA methylation content and iNOS promoter methylation. Environmental health perspectives 2009; 117:217-22. 15. Baccarelli A, Wright R, Bollati V, Litonjua A, Zanobetti A, Tarantini L, Sparrow D, Vokonas P, Schwartz J. Ischemic heart disease and stroke in relation to blood DNA methylation. Epidemiology 2010; 21:819-28. 16. Bind MA, Lepeule J, Zanobetti A, Gasparrini A, Baccarelli A, Coull BA, Tarantini L, Vokonas PS, Koutrakis P, Schwartz J. Air pollution and gene-specific methylation in the Normative Aging Study: Association, effect modification, and mediation analysis. Epigenetics : official journal of the DNA Methylation Society 2014; 9:448-58. 17. Hou L, Zhang X, Zheng Y, Wang S, Dou C, Guo L, Byun HM, Motta V, McCracken J, Diaz A, et al. Altered methylation in tandem repeat element and elemental component levels in inhalable air particles. Environmental and molecular mutagenesis 2014; 55:256-65.
Dow
nloa
ded
by [
Mar
co S
anch
ez G
uerr
a] a
t 08:
55 1
5 M
ay 2
015

20
18. Byun HM, Motta V, Panni T, Bertazzi PA, Apostoli P, Hou L, Baccarelli AA. Evolutionary age of repetitive element subfamilies and sensitivity of DNA methylation to airborne pollutants. Particle and fibre toxicology 2013; 10:28. 19. Pastor WA, Pape UJ, Huang Y, Henderson HR, Lister R, Ko M, McLoughlin EM, Brudno Y, Mahapatra S, Kapranov P, et al. Genome-wide mapping of 5-hydroxymethylcytosine in embryonic stem cells. Nature 2011; 473:394-7. 20. Branco MR, Ficz G, Reik W. Uncovering the role of 5-hydroxymethylcytosine in the epigenome. Nature reviews Genetics 2012; 13:7-13. 21. Wu H, D'Alessio AC, Ito S, Wang Z, Cui K, Zhao K, Sun YE, Zhang Y. Genome-wide analysis of 5-hydroxymethylcytosine distribution reveals its dual function in transcriptional regulation in mouse embryonic stem cells. Genes & development 2011; 25:679-84. 22. Huang Y, Pastor WA, Shen Y, Tahiliani M, Liu DR, Rao A. The behaviour of 5-hydroxymethylcytosine in bisulfite sequencing. PloS one 2010; 5:e8888. 23. Nestor C, Ruzov A, Meehan R, Dunican D. Enzymatic approaches and bisulfite sequencing cannot distinguish between 5-methylcytosine and 5-hydroxymethylcytosine in DNA. BioTechniques 2010; 48:317-9. 24. Booth MJ, Branco MR, Ficz G, Oxley D, Krueger F, Reik W, Balasubramanian S. Quantitative sequencing of 5-methylcytosine and 5-hydroxymethylcytosine at single-base resolution. Science 2012; 336:934-7. 25. Chia N, Wang L, Lu X, Senut MC, Brenner C, Ruden DM. Hypothesis: environmental regulation of 5-hydroxymethylcytosine by oxidative stress. Epigenetics : official journal of the DNA Methylation Society 2011; 6:853-6. 26. De Prins S, Koppen G, Jacobs G, Dons E, Van de Mieroop E, Nelen V, Fierens F, Int Panis L, De Boever P, Cox B, et al. Influence of ambient air pollution on global DNA methylation in healthy adults: a seasonal follow-up. Environment international 2013; 59:418-24. 27. Madrigano J, Baccarelli A, Mittleman MA, Wright RO, Sparrow D, Vokonas PS, Tarantini L, Schwartz J. Prolonged exposure to particulate pollution, genes associated with glutathione pathways, and DNA methylation in a cohort of older men. Environmental health perspectives 2011; 119:977-82. 28. Baccarelli A, Wright RO, Bollati V, Tarantini L, Litonjua AA, Suh HH, Zanobetti A, Sparrow D, Vokonas PS, Schwartz J. Rapid DNA methylation changes after exposure to traffic particles. American journal of respiratory and critical care medicine 2009; 179:572-8. 29. Bank TW. The World Bank. 2012. World Development Indicators. Washington, D.C., 2012. 30. Baccarelli A, Barretta F, Dou C, Zhang X, McCracken JP, Diaz A, Bertazzi PA, Schwartz J, Wang S, Hou L. Effects of particulate air pollution on blood pressure in a highly exposed population in Beijing, China: a repeated-measure study. Environmental health : a global access science source 2011; 10:108. 31. Hou L, Wang S, Dou C, Zhang X, Yu Y, Zheng Y, Avula U, Hoxha M, Diaz A, McCracken J, et al. Air pollution exposure and telomere length in highly exposed subjects in Beijing, China: a repeated-measure study. Environment international 2012; 48:71-7. 32. Hou L, Zhang X, Dioni L, Barretta F, Dou C, Zheng Y, Hoxha M, Bertazzi PA, Schwartz J, Wu S, et al. Inhalable particulate matter and mitochondrial DNA copy number in highly exposed individuals in Beijing, China: a repeated-measure study. Particle and fibre toxicology 2013; 10:17. 33. Bachman M, Uribe-Lewis S, Yang X, Williams M, Murrell A, Balasubramanian S. 5-Hydroxymethylcytosine is a predominantly stable DNA modification. Nature chemistry 2014; 6:1049-55. 34. Tellez-Plaza M, Tang WY, Shang Y, Umans JG, Francesconi KA, Goessler W, Ledesma M, Leon M, Laclaustra M, Pollak J, et al. Association of Global DNA Methylation and Global DNA Hydroxymethylation with Metals and other Exposures in Human Blood DNA Samples. Environmental health perspectives 2014.
Dow
nloa
ded
by [
Mar
co S
anch
ez G
uerr
a] a
t 08:
55 1
5 M
ay 2
015

21
35. Sarter B, Long TI, Tsong WH, Koh WP, Yu MC, Laird PW. Sex differential in methylation patterns of selected genes in Singapore Chinese. Human genetics 2005; 117:402-3. 36. Kim M, Long TI, Arakawa K, Wang R, Yu MC, Laird PW. DNA methylation as a biomarker for cardiovascular disease risk. PloS one 2010; 5:e9692. 37. Gurgueira SA, Lawrence J, Coull B, Murthy GG, Gonzalez-Flecha B. Rapid increases in the steady-state concentration of reactive oxygen species in the lungs and heart after particulate air pollution inhalation. Environmental health perspectives 2002; 110:749-55. 38. Kim JY, Mukherjee S, Ngo LC, Christiani DC. Urinary 8-hydroxy-2'-deoxyguanosine as a biomarker of oxidative DNA damage in workers exposed to fine particulates. Environmental health perspectives 2004; 112:666-71. 39. Ren C, Park SK, Vokonas PS, Sparrow D, Wilker E, Baccarelli A, Suh HH, Tucker KL, Wright RO, Schwartz J. Air pollution and homocysteine: more evidence that oxidative stress-related genes modify effects of particulate air pollution. Epidemiology 2010; 21:198-206. 40. Kolachana P, Subrahmanyam VV, Meyer KB, Zhang L, Smith MT. Benzene and its phenolic metabolites produce oxidative DNA damage in HL60 cells in vitro and in the bone marrow in vivo. Cancer research 1993; 53:1023-6. 41. Coulter JB, O'Driscoll CM, Bressler JP. Hydroquinone increases 5-hydroxymethylcytosine formation through ten eleven translocation 1 (TET1) 5-methylcytosine dioxygenase. The Journal of biological chemistry 2013; 288:28792-800. 42. Pirestani A, Tabatabae SN, Fazeli MH, Antikchi M, Baabaei B. Comparison of HPLC and Elisa for Determination of Aflatoxin Concentration in the Milk and Feeds of Dairy Cattle. Journal of Research in Agricultural Science 2011; 7:71-8. 43. Fischer JB, Michael JL. Use of ELISA immunoassay kits as a complement to HPLC analysis of imazapyr and triclopyr in water samples from forest watersheds. Bulletin of environmental contamination and toxicology 1997; 59:611-8. 44. Williams K, Christensen J, Pedersen MT, Johansen JV, Cloos PA, Rappsilber J, Helin K. TET1 and hydroxymethylcytosine in transcription and DNA methylation fidelity. Nature 2011; 473:343-8. 45. Zeger SL, Thomas D, Dominici F, Samet JM, Schwartz J, Dockery D, Cohen A. Exposure measurement error in time-series studies of air pollution: concepts and consequences. Environmental health perspectives 2000; 108:419-26. 46. ISO. ISO 9835, Ambient air – Determination of a black smoke index. Geneva: International Organization for Standardization. 1993. 47. Kinney PL, Aggarwal M, Northridge ME, Janssen NA, Shepard P. Airborne concentrations of PM(2.5) and diesel exhaust particles on Harlem sidewalks: a community-based pilot study. Environmental health perspectives 2000; 108:213-8. 48. Janssen NA vVP, Aarts F, Harssema H, Brunekree B. Assessment of exposure to traffic related air pollution of children attending schools near motorways. Atmospheric Environment 2001; 35:9. 49. Schleicher N, Norra S, Fricker M, Kaminski U, Chen Y, Chai F, Wang S, Yu Y, Cen K. Spatio-temporal variations of black carbon concentrations in the Megacity Beijing. Environmental pollution 2013; 182:392-401. 50. Watson GJ, Chow JC, Frazier CA. X-ray fluorescence analysis of ambient air samples. In: Landsberger SC, M. , ed. Elemental analysis of airborne particles. Amsterdam, The Netherlands Gordon and Breach Science Publishers 1999:67-96. 51. Chow JC, Watson JG. Guideline on speciated particulate monitoring. Draft report 3 prepared for the US Environmental Protection Agency, Office of Air Quality Planning and Standards. Research Triangle Park, NC: Desert Research Institute, Reno, NV, 1998.
Dow
nloa
ded
by [
Mar
co S
anch
ez G
uerr
a] a
t 08:
55 1
5 M
ay 2
015
22
52. Westfall P, Young S. Resampling-Based Multiple Testing: Examples and Methods for p-Value Adjustment (Wiley Series in Probability and Statistics). Wiley-Interscience, 1993.
Dow
nloa
ded
by [
Mar
co S
anch
ez G
uerr
a] a
t 08:
55 1
5 M
ay 2
015

23
Tables
Table 1 - Levels of ambient PM10 on and before the examination days, and personal PM2.5 and elemental components of PM during
work hours.
Time window Office workers* Truck drivers*
Mean ± SD 10pct 25pct 50pct 75pct 90pct Mean ± SD 10pct 25pct 50pct 75pct 90pct p-value † PM10 (μg/m3) from ambient monitors on the examination days (24-hour average) and multi-day averages on and before the examination days 24-hour mean 118.1 ± 52.8 60.0 82.0 114.0 150.0 186.0 124.9 ± 51.2 72.0 88.0 118.0 168.0 190.0 0.33
4-day mean 119.0 ± 32.0 78.8 89.8 114.5 136.5 165.0 120.5 ± 29.8 83.8 101.3 117.0 136.5 164.0 0.59
7-day mean 117.9 ± 24.1 83.3 98.3 115.1 137.4 147.7 119.0 ± 22.4 94.4 99.9 116.6 137.4 147.7 0.76
14-day mean 119.0 ± 19.3 93.4 99.7 124.7 139.0 141.4 121.8 ± 18.4 97.1 104.2 127.0 140.1 143.1 0.26
Particle and elemental component measures (μg/m3) during the eight work hours on the examination days, from personal monitors PM2.5 94.3 ± 68.2 22.4 43.3 84.5 131.6 185.9 128.6 ± 70.9 45.4 75.3 118.9 162.9 215.8 <0.001
BC 13.0 ± 4.2 7.1 10.0 13.1 15.9 18.4 17.1 ± 6.9 8.9 12.2 16.6 20.7 26.2 <0.001
Al 0.53 ± 0.25 0.23 0.37 0.49 0.70 0.85 1.35 ± 0.94 0.42 0.59 1.29 1.85 2.28 <0.001
Ca 0.32 ± 0.17 0.16 0.19 0.28 0.41 0.52 2.07 ± 2.23 0.29 0.39 1.59 3.02 4.50 <0.001
Fe 0.38 ± 0.19 0.18 0.24 0.34 0.44 0.67 1.00 ± 0.63 0.37 0.49 0.82 1.33 1.75 <0.001
K 0.72 ± 0.74 0.18 0.26 0.52 0.74 1.68 1.33 ± 1.05 0.34 0.46 0.93 2.10 2.77 <0.001
S 6.28 ± 5.25 0.75 1.63 5.31 8.64 14.37 8.67 ± 4.97 2.82 5.02 7.26 12.70 16.29 <0.001
Si 0.79 ± 0.55 0.28 0.43 0.68 1.01 1.42 2.37 ± 1.78 0.63 0.82 2.10 3.54 4.12 <0.001
Ti 0.02 ± 0.01 0.01 0.01 0.02 0.03 0.04 0.06 ± 0.04 0.02 0.03 0.05 0.08 0.10 <0.001
Zn 0.15 ± 0.17 0.02 0.05 0.09 0.23 0.36 0.27 ± 0.22 0.07 0.11 0.17 0.40 0.68 <0.001 * Number of observations used for analysis was 103 for office workers and 109 for truck drivers (missing values were from missing %5hmC or
%5mC measures, since we did not have samples from some individuals). † P-values were obtained from Wilcoxon-Mann-Whitney tests.
Dow
nloa
ded
by [
Mar
co S
anch
ez G
uerr
a] a
t 08:
55 1
5 M
ay 2
015

24
Table 2 - Participant characteristics and blood levels of 5-hydroxymethylcytosine (5hmC) and 5-methylcytosine (5mC).
Variables 5hmC (%C*) 5mC (%C*)
Obs† Mean‡ (95% CI)‡ P-value§ Obs† Mean‡ (95% CI)‡ P-value§
Group Office Worker 103 0.09 (0.08; 0.10)
0.28 102 6.47 (6.19; 6.77)
0.19 Truck Driver 109 0.08 (0.07; 0.09) 106 6.75 (6.46; 7.06)
Sex Male 136 0.10 (0.09; 0.11)
<0.001 131 6.93 (6.67; 7.21)
<0.001 Female 76 0.06 (0.06; 0.07) 77 6.10 (5.80; 6.41)
Age (Quartiles)
Q1 [18-27 years] 49 0.10 (0.08; 0.11)
0.094
46 6.96 (6.51; 7.43)
0.069 Q2 [28-32 years] 54 0.09 (0.08; 0.10) 56 6.85 (6.45; 7.27)
Q3 [33-37 years] 54 0.08 (0.07; 0.09) 52 6.43 (6.04; 6.84)
Q4 [39-46 years] 55 0.07 (0.06; 0.09) 54 6.27 (5.90; 6.67) BMI
14.8-24.9 kg/m2 148 0.08 (0.08; 0.09)
0.58 146 6.51 (6.27; 6.76)
0.27 25-29.9 kg/m2 55 0.08 (0.07; 0.10) 54 6.83 (6.42; 7.26)
30-32.4 kg/m2 9 0.10 (0.07; 0.15) 8 7.15 (6.09; 8.40) Smoking status
Never-smoker 125 0.08 (0.07; 0.09)
0.082 124 6.44 (6.18; 6.71)
0.14 Former smoker 8 0.09 (0.06; 0.13) 8 6.77 (5.77; 7.94)
Current smoker 79 0.09 (0.08; 0.10) 76 6.88 (6.53; 7.25) Day of week
Monday 28 0.08 (0.05; 0.08)
0.035
29 6.79 (5.73; 6.79)
0.40 Tuesday 26 0.09 (0.06; 0.09) 25 7.57 (6.31; 7.57)
Wednesday 28 0.11 (0.08; 0.11) 28 7.49 (6.30; 7.49) Thursday 34 0.11 (0.07; 0.11) 35 7.07 (6.06; 7.07)
Dow
nloa
ded
by [
Mar
co S
anch
ez G
uerr
a] a
t 08:
55 1
5 M
ay 2
015

25
Friday 35 0.11 (0.08; 0.11) 34 7.03 (6.01; 7.03)
Saturday 30 0.11 (0.07; 0.11) 29 7.61 (6.42; 7.61)
Sunday 31 0.10 (0.07; 0.10) 28 6.91 (5.81; 6.91) Temperature (Median)**
Low [20-25 °C] 91 0.08 (0.07; 0.09) 0.40 89 6.74 (6.42; 7.07)
0.30 High [26-29 °C] 121 0.09 (0.08; 0.09) 119 6.52 (6.25; 6.79)
Dew point (Median)** Low [16-20 °C] 86 0.08 (0.07; 0.09)
0.048 84 6.76 (6.43; 7.10) 0.27
High [21-24 °C] 126 0.09 (0.08; 0.10) 124 6.51 (6.25; 6.79) * Percent of hydroxymethylated (for 5hmC) or methylated (for 5mC) cytosines in blood genomic DNA. † Number of non-missing 5hmC or 5mC measures. ‡ Geometric means and 95% confident intervals (95% CI) of 5hmC or 5mC. § P-values were calculated using mixed-effects regression models with log transformed measures of 5hmC or 5mC. ** Temperature and dew point were measured on the study examination day.
Dow
nloa
ded
by [
Mar
co S
anch
ez G
uerr
a] a
t 08:
55 1
5 M
ay 2
015

26
Table 3 - Percent changes on 5-hydroxymethylcytosine associated with an interquartile range (IQR) increase in exposure levels.*
Study group Office Workers†
Truck Drivers†
All participants†
% 95% CI P-value‡ Adj.
% 95% CI P-value ‡ Adj.
% 95% CI P-value ‡ Adj.
P-value§
P-value§
P-value§ PM10 (μg/m3) from ambient monitors on the examination days (24-hour average) and multi-day averages on and before the examination days
24-hour average 26.1 (7.9; 47.4) 0.004 0.025 20.2 (4.0; 39.0) 0.014 0.042 21.9 (10.3; 34.7) <0.001 <0.001
4-day average 27.7 (9.0; 49.5) 0.003 0.019 34.1 (13.3; 58.6) 0.001 0.002 28.1 (15.3; 42.2) <0.001 <0.001
7-day average 43.2 (15.6; 77.4) 0.001 0.011 39.9 (11.6; 75.5) 0.005 0.014 37.3 (18.8; 58.6) <0.001 <0.001
14-day average 152.1 (59.8; 297.8) <0.001 0.001
122.6 (49.9; 230.6) <0.001 <0.001
132.6 (75.6; 208.0) <0.001 <0.001
Particle measures (μg/m3) during the eight work hours on the examination days, from personal monitors PM2.5 10.0 (-3.7; 25.6) 0.16 0.79
10.0 (-6.8; 29.8) 0.26 0.92
8.9 (-0.7; 19.5) 0.072 0.44
BC 27.0 (6.5; 51.4) 0.009 0.18 3.1 (-9.5; 17.4) 0.65 0.99
7.9 (-2.1; 18.9) 0.13 0.60
Al 1.1 (-29.5; 44.9) 0.95 0.99 8.3 (-3.8; 22.0) 0.19 0.83
5.7 (-4.0; 16.4) 0.26 0.85
Ca -1.9 (-57.1; 124.3) 0.96 0.99 3.2 (-3.7; 10.6) 0.38 0.98
3.2 (-3.0; 9.8) 0.32 0.91
Fe 3.0 (-24.9; 41.3) 0.85 0.99 4.7 (-6.3; 16.9) 0.42 0.99
2.9 (-5.9; 12.6) 0.53 0.99
K 10.0 (-3.9; 25.9) 0.17 0.80
3.3 (-8.1; 16.0) 0.59 0.99
4.3 (-3.6; 12.7) 0.30 0.89
S 14.3 (-1.1; 32.2) 0.074 0.56 9.5 (-7.8; 30.1) 0.31 0.95
9.1 (-1.2; 20.5) 0.087 0.49
Si -18.4 (-38.9; 9.1) 0.17 0.99 9.5 (-2.3; 22.7) 0.12 0.69
4.2 (-4.9; 14.1) 0.38 0.96
Ti -12.6 (-32.9; 13.7) 0.32 0.99 14.6 (3.5; 26.9) 0.010 0.16
8.2 (-0.7; 18.0) 0.075 0.45
Zn -0.4 (-14.4; 15.8) 0.96 0.99 0.3 (-12.3; 14.7) 0.96 0.99
-1.4 (-9.5; 7.5) 0.75 0.99
* Adjusted for age, sex, BMI, smoking status, day of week, and average of temperature and dew point values corresponding to the average of
exposure metrics. † Number of observations used for analysis was 103 for office workers, 109 for truck drivers, and 212 for all participants. ‡ P-values were calculated using mixed-effects regression models.
Dow
nloa
ded
by [
Mar
co S
anch
ez G
uerr
a] a
t 08:
55 1
5 M
ay 2
015

27
§ Adjusted P-values were estimated by a resampling-based approach, which takes dependent structures among exposures into consideration. This
approach controls family-wise error rate (FWER), i.e., probability of having at least one false positive among the whole set of comparisons at a
given significance level.
Dow
nloa
ded
by [
Mar
co S
anch
ez G
uerr
a] a
t 08:
55 1
5 M
ay 2
015

28
Table 4 - Percent changes on 5-methylcytosine associated with an interquartile range (IQR) increase in air particle levels.*
Study group Office Workers† Truck Drivers† All participants†
% 95% CI P-value‡ Adj. % 95% CI P-value‡
Adj. % 95% CI P-value‡ Adj.
P-value§ P-value§ P-value§ PM10 (μg/m3) from ambient monitors on the examination days (24-hour average) and multi-day averages on and before the examination days 24-hour average -1.2 (-9.0; 7.2) 0.77 0.99
1.8 (-4.5; 8.6) 0.58 0.91 -0.4 (-5.2; 4.6) 0.87 0.99
4-day average 3.3 (-4.3; 11.5) 0.41 0.71
-2.7 (-9.9; 5.1) 0.49 0.99
-0.1 (-5.0; 5.1) 0.98 0.99
7-day average 6.0 (-4.2; 17.3) 0.26 0.52
-3.0 (-12.5; 7.5) 0.57 0.99
0.3 (-6.3; 7.3) 0.94 0.99
14-day average 2.5 (-17.9; 28.0) 0.83 0.99
1.9 (-16.4; 24.3) 0.85 0.99
-1.8 (-14.7; 13.1) 0.80 0.99
Particle measures (μg/m3) during the eight work hours on the examination days, from personal monitors PM2.5 8.6 (1.7; 16.0) 0.016 0.10
7.5 (0.1; 15.5) 0.050 0.25
3.9 (-0.5; 8.5) 0.085 0.35
BC 10.6 (1.4; 20.6) 0.025 0.15
2.3 (-3.2; 8.2) 0.42 0.94
3.0 (-1.6; 7.8) 0.21 0.69
Al 9.5 (-8.0; 30.4) 0.31 0.88
4.2 (-1.4; 10.1) 0.15 0.57
0.0 (-4.6; 4.8) 0.99 0.99
Ca 68.4 (5.6; 168.4) 0.031 0.18
1.3 (-2.0; 4.7) 0.45 0.96
-0.7 (-3.7; 2.5) 0.67 0.99
Fe 7.5 (-8.2; 25.9) 0.37 0.94
2.5 (-2.5; 7.6) 0.34 0.88
-0.4 (-4.6; 3.9) 0.84 0.99
K 6.7 (-0.5; 14.5) 0.074 0.34
4.6 (-0.6; 10.0) 0.085 0.39
2.3 (-1.4; 6.2) 0.23 0.74
S 6.1 (-1.4; 14.2) 0.12 0.48
4.1 (-3.5; 12.3) 0.30 0.85
2.1 (-2.6; 7.0) 0.39 0.93
Si 4.7 (-9.2; 20.7) 0.53 0.99
3.8 (-1.5; 9.3) 0.16 0.62
-0.1 (-4.4; 4.3) 0.96 0.99
Ti 6.2 (-6.5; 20.7) 0.36 0.92
4.7 (-0.1; 9.7) 0.061 0.30
1.3 (-2.8; 5.7) 0.54 0.99
Zn 3.3 (-4.1; 11.4) 0.39 0.95
1.0 (-4.8; 7.1) 0.75 0.99
0.3 (-3.6; 4.5) 0.88 0.99 * Adjusted for age, sex, BMI, smoking status, day of week, and average of temperature and dew point values corresponding to the average of
exposure metrics. † Number of observations used for analysis was 102 for office workers, 106 for truck drivers, and 208 for all participants. ‡ P-values were calculated using mixed-effects regression models.
Dow
nloa
ded
by [
Mar
co S
anch
ez G
uerr
a] a
t 08:
55 1
5 M
ay 2
015

29
§ Adjusted P-values were estimated by a resampling-based approach, which takes dependent structures among exposures into consideration.
This approach controls family-wise error rate (FWER), i.e., probability of having at least one false positive among the whole set of comparisons
at a given significant level.
Dow
nloa
ded
by [
Mar
co S
anch
ez G
uerr
a] a
t 08:
55 1
5 M
ay 2
015

Accep
ted M
anus
cript
30
Figure 1 – Heat map for pair-wise correlations of the levels of ambient PM10 (24-hour, 4-
day, 7-day, and 14-day averages) and personal levels of PM2.5, BC, and elemental
components of PM2.5 measured during 8 work hours.
The four ambient PM10 measures were correlated with each other. Measures from personal
monitors (i.e., PM2.5, BC, and elemental components of PM2.5) tend to be correlated with each
other.
Abbreviations: PM10, Particulate matter 10 μm; PM2.5, Particulate matter 2.5 μm; BC, Black
Carbon.
Dow
nloa
ded
by [
Mar
co S
anch
ez G
uerr
a] a
t 08:
55 1
5 M
ay 2
015
Accep
ted M
anus
cript
31
Figure 2 – Scatter plot of blood levels of 5-hydroxymethylcytosine (5hmC) and 5-
methylcytosine (5mC).
Pearson’s correlation coefficient=0.35 (P=0.001) on the first examination day. Pearson’s
correlation coefficient=0.22 (P=0.021) on the 2nd examination day.
Dow
nloa
ded
by [
Mar
co S
anch
ez G
uerr
a] a
t 08:
55 1
5 M
ay 2
015