EFFECTS OF ORGANISATIONAL COMMUNICATION ON ...
272
UNIVERSITY FOR DEVELOPMENT STUDIES, TAMALE EFFECTS OF ORGANISATIONAL COMMUNICATION ON ADMINISTRATIVE PERFORMANCE OF STAFF IN THE UNIVERSITY OF EDUCATION, WINNEBA BABA CHARLES CAMPION 2019 www.udsspace.uds.edu.gh
-
Upload
khangminh22 -
Category
Documents
-
view
0 -
download
0
Transcript of EFFECTS OF ORGANISATIONAL COMMUNICATION ON ...

i
UNIVERSITY FOR DEVELOPMENT STUDIES, TAMALE
EFFECTS OF ORGANISATIONAL COMMUNICATION ON
ADMINISTRATIVE PERFORMANCE OF STAFF IN THE
UNIVERSITY OF EDUCATION, WINNEBA
BABA CHARLES CAMPION
2019
www.udsspace.uds.edu.gh
ii
UNIVERSITY FOR DEVELOPMENT STUDIES, TAMALE
EFFECTS OF ORGANISATIONAL COMMUNICATION ON
ADMINISTRATIVE PERFORMANCE OF STAFF IN THE
UNIVERSITY OF EDUCATION, WINNEBA
BY
BABA CHARLES CAMPION (BBA, ACIS, MA, PGMS)
THESIS SUBMITTED TO THE FACULTY OF AGRIBUSINESS AND
COMMUNICATION SCIENCES, UNIVERSITY FOR DEVELOPMENT
STUDIES, IN PARTIAL FULFILLMENT OF THE REQUIREMENTS
FOR THE AWARD OF DOCTOR OF PHILOSOPHY IN INNOVATION
COMMUNICATION
APRIL, 2019
www.udsspace.uds.edu.gh

iii
CANDIDATE’S DECLARATION
I hereby declare that this thesis entitled “Effects of Organisational
Communication on Administrative Performance of staff in the University of
Education, Winneba” is the result of my own original work and that no part of
it has been presented for another degree in this University or elsewhere:
Candidate’s Signature : ………………….................. Date:.…………….
Baba Charles Campion
www.udsspace.uds.edu.gh
iv
SUPERVISORS’ DECLARATION
We hereby declare that the preparation and presentation of the thesis were
supervised in accordance with the guidelines on supervision of thesis laid down
by the University for Development Studies.
Principal Supervisor’s Signature: ……………………Date:...………….…..
Dr. Francis. K. Obeng
Co-Supervisor’s Signature:…..….…….................. Date:……………….….
Prof. Amin Alhassan
www.udsspace.uds.edu.gh

v
ABSTRACT
Communication in a multi-campus University is perceived to be riddled with
delays, distortions, high cost or reduction in quality of information flow within
and/or across campuses and consequently affect performance. The study
examined the effects of organizational communication on administrative
performance of staff in the University of Education, Winneba, Ghana with the
application of the System theory and a developed conceptual framework. The
mixed research design was used and a multistage sampling technique was
applied with staff. Questionnaires were administered to over 400 staff out of
which 309 (77.3%) questionnaires were returned. Descriptive and inferential
statistics such as percentages, means, factor analysis, cluster analysis, chi-
square, t-test, correlation and F-test were used to analyse the data with the use
of SPSS software version 18.0 and Microsoft Excel. The results revealed that
staff generally perceived the communication system in the University to agree
with a grand mean value of 3.86 which is equivalent to “Agree” on the response
scale. The two step cluster analysis revealed four groups of employee cohesion
patterns, and the factor analysis also revealed four independent communication
constructsv is a vis group cohesion. The rotated factors showed four major
constraints: Human, Communication Systems, Administrative and Structural.
The researcher concludes that significant differences do not exist in the patterns
of communication among campuses of the University.This means that a
congenial managerial communication system is likely to improve the
organisational environment. It is recommended among others that
standardisation and decentralisation in administration and management should
be encouraged by management of the University and various campuses given
some autonomy to enhance performance. For feedback, acknowledging good
performance, periodic progressive conversations to enhance policy direction in
communication, there is the need to upgrade the knowledge and skills of staff
through appropriate training.
www.udsspace.uds.edu.gh

vi
ACKNOWLEDGEMENTS
To God be the Glory, Great and Holy is His name!
My sincere gratitude goes to Dr. Francis K. Obeng (former Head of Department
of Extension, Rural Development and Gender Studies, Vice Dean, Faculty of
Agribusiness and Communication Sciences and currently Director of TTFPP),
who supervised this thesis. He provided numerous support and suggestions,
editing and critiquing to improving this work. I sincerely appreciate his brotherly
and personal attention throughout my studies.
I am most grateful to Prof. Amin Alhassan, the current Principal of Wa Campus
andformer Dean of Faculty of Agribusiness and Communication Sciences, who
co-supervised this work. He gave excellent advice and support. I also appreciate
the lead support and encouragement offered me on this work by Prof. Abayormi
Oloruntoba, until he left the UDS for Nigeria. God bless them all.
I am particularly inspired by all staff of the Faculty; especially Prof. S. A.
Donkoh (current Dean of Faculty of Agribusiness and Communication Sciences)
Dr. R.W. N. Yeboah, Mr. P.K. Adraki and Mr. V. Lolig for their lectures and
initial preparations, coupled with their moral support and their individual
contributions to enriching this work. I appreciate the current Head of
Department of Extension, Rural Development and Gender Studies (Dr. Hamza
Adams) too.
Again, I owe the Management of the University of Education, Winneba (UEW)
sincere gratitude for the opportunity created for me to pursue the programme.
My immediate superiors in the College of Technology Education, Kumasi of
UEW were supportive throughout the period. They include: The current Acting
Principal: Prof. F.K. Sarfo, the late Prof. Ing. Reynolds Okai, former Principal,
Prof. J.E. Flolu, Mr. Kofi Adu, the College Registrar (my superior), Dr. E.O.
Agyenim-Boateng, former Deputy Registrar in charge of Human Resources and
Mr. Francis Donkor, former Dean of Faculty of Vocational Education and
Director, Center for Competency-Base Training and Research. I am very
grateful to them all.
www.udsspace.uds.edu.gh
vii
Special thanks to the teaching and non-teaching staff of the College, particularly
Mr. Betrand Yosangfoe, previously on National Service in UEW, Mr. C.
Maazure, Ms. Yaa Akubia, Mr. Ampiah Otoo and many others who provided
various academic and administrative support to facilitate the smooth completion
of the work. I wish to render my sincere gratitude to staff of the various
campuses of the University for Development Studies (UDS), especially most of
the senior members who assisted me with my pilot work before data was
collected. During the data collection on UEW campuses, many staff were again
very supportive. The following staff deserve my special appreciation and
blessings: Mr. Cletus Bondere, Mampong Campus; Ms. Vida Dery, Ajumako
Campus; Ms. Debora Aful, Winneba Campus and in Kumasi; Ms. Vivian Anane,
Miss. Mavis Adu-Gyamfi, Miss. Debora Dufie Takyi and all staff currently in
the Academic Affairs Department.
It is impossible mentioning all individuals who have also contributed in diverse
ways to the realisation and the completion of this work. To all my friends and
staff: Dr. Moses Teyi, Mr. Alex Faalong, Ms Luciana Agbemu and all those
unavoidably not listed here, I stand proxy to thank you all. I cannot forget of the
numerous support of Madam Joyce Ofori Manso who had been behind the
typesetting and formatting of this work.
I thank my dearest wife, Lydia, for her support and encouragement, despite my
numerous absence for days and weeks from home in the course of my study. I
also thank my children; Louis, Dam, Roger, Hillary and Junior for their prayers
and sacrifices. I also apologise to them for shirking some family responsibilities
in the course of the study.
To all the Campions (my brothers and sisters) I say, God bless you.
www.udsspace.uds.edu.gh

viii
DEDICATION
To the memory of my late parents (Mary and John) who I consider the first
communicators and who instructed me; ‘Baba, go to school!’- My source of
hope and inspiration.
www.udsspace.uds.edu.gh

ix
TABLE OF CONTENTS
Content Page
CANDIDATE’S DECLARATION...................................................................iii
SUPERVISORS’ DECLARATION..................................................................iv
ABSTRACT .......................................................................................................v
ACKNOWLEDGEMENTS...............................................................................vi
DEDICATION.................................................................................................viii
TABLE OF CONTENTS ..................................................................................ix
LIST OF TABLES............................................................................................xv
LIST OF FIGURES .........................................................................................xvi
CHAPTER ONE: INTRODUCTION
1.1 Background to the Study ..............................................................................1
1.2 Nature of Multi Campus Institutions ............................................................3
1.3 The Multi Campus University System in Ghana..........................................4
1.3.1 UEW as a multi-campus University ..........................................................5
1.3.1.1 The Winneba Campus ............................................................................5
1.3.1.2 The Ajumako Campus ............................................................................6
1.3.1.3 The Asante – Mampong Campus ...........................................................6
1.3.1.4 The Kumasi Campus ..............................................................................6
1.4 Nature of Communication in UEW..............................................................7
1.5 Statement of Problem ...................................................................................8
1.6 Research Questions.......................................................................................9
1.6.1 Main Research Question............................................................................9
1.6.2 Specific Research Questions ...................................................................10
www.udsspace.uds.edu.gh

x
1.7 Objectives of the Study...............................................................................10
1.7.1 Main Objective ........................................................................................10
1.7.2 Specific objectives ...................................................................................10
1.8 Justification for the Study...........................................................................11
1.9 Hypotheses for the Study............................................................................12
1.10 Delimitation of the Study .........................................................................12
1.11 Operational Definition of Terms ..............................................................12
CHAPTER TWO: LITERATURE REVIEW
2.1 Introduction ................................................................................................14
2.2 Concept of Communication........................................................................14
2.2.1 Diversity and Group Communication.....................................................18
2.2.2 Organisational Identity and Communication...........................................19
2.2.3 Workplace Diversity and Communication ..............................................20
2.3 Communication and Information Theories.................................................22
2.3.2 Information theory..................................................................................23
2.4 Barriers to Communication ........................................................................25
2.5 Information and Communication Technologies (ICTs) .............................31
2.6 Staff Communication Needs.......................................................................34
2.7 Bureaucracy in Communication .................................................................36
2.8 Organisational Structures ...........................................................................37
2.9 Multi-Campus Institutions..........................................................................39
2.9 Communication Models .............................................................................41
2.9.1 The Communication Orientation Model..................................................42
2.9.2 The Social Identity Model .......................................................................44
www.udsspace.uds.edu.gh

xi
2.9.3 The Communication Orientation Model..................................................46
2.9.4 Homogeneous Platforms Communication Models..................................48
2.9.5 Communication Performance Models for Heterogeneous Clusters ........50
2.9.6 Linear Model ...........................................................................................51
2.9.7 Interactive Model.....................................................................................52
2.9.8 Transactional Model ................................................................................52
2.9.9 Derivative Models of the Communication Process .................................55
2.9.10 Ecological Model of Communication Process ......................................56
2.9.11 Berlor’s Model ………………………………………………………..58
2.9.12 Dance’s Helical Spiral ...........................................................................60
2.9.13 Barnlund’s Transactional Model ...........................................................61
2.10 Organisational Communication...............................................................62
2.10.1 Effectiveness of Organisational Communication ..................................67
2.10.2 Communication Process ........................................................................69
2.10.2.1 Sender .................................................................................................70
2.10.2.2 Message ..............................................................................................71
2.10.2.3 Channel ...............................................................................................71
2.10.2.4 Receiver ..............................................................................................72
2.10.2.5 Feedback .............................................................................................73
2.10.2.6 Feed forward.......................................................................................74
2.10.2.7 Noise...................................................................................................75
2.10.3 Concept of Job Performance..................................................................77
2.10.3.1 Job Demands-Resources (JD-R) Model .............................................78
2.10.3.2 Determinants of Job Performance ......................................................79
2.10.3.3 Model on Administrative Performance. .............................................82
www.udsspace.uds.edu.gh

xii
2.10.4 Group cohesion......................................................................................85
2.10.5 Directions of Communication ...............................................................87
2.10.5.1 Downward Communication................................................................88
2.10.5.2 Upward Communication.....................................................................90
2.10.5.3 Horizontal (Lateral) Communication .................................................93
2.10.5.4 Diagonal Flow ....................................................................................94
2.10.6 Communication Networks.....................................................................95
2.10.6.1 Formal and informal small group networks .......................................95
2.10.6.2: Verbal and Nonverbal Messages .......................................................97
2.11 Conceptual Framework...........................................................................100
2.3.1 Systems Theory (Theoretical Framework) ............................................103
CHAPTER THREE: METHODOLOGY
3.1 Introduction ..............................................................................................106
3.2 Study Area ................................................................................................106
3.3 Research Design .......................................................................................107
3.4 The Targeted Population ..........................................................................108
3.5 Sampling Techniques and Sample Size Determination............................109
3.6 Instruments for Data Collection ...............................................................110
3.7 Validity and Reliability of Questionnaire.................................................112
3.8 Data Collection Strategy...........................................................................113
3.9 Measurement of Variables........................................................................115
3.9.1 Independent Variable.............................................................................116
3.9.2 Dependent Variable ...............................................................................116
3.9.3 Intervening Variables ............................................................................117
www.udsspace.uds.edu.gh

xiii
3.9.4. Independent Variables ..........................................................................118
3.9 Method of Data Analysis ..........................................................................119
CHAPTER FOUR: RESULTS AND DISCUSSION
4.1 Selected Demographic characteristics of staff..........................................122
4.1.1 Age.........................................................................................................123
4.1.2 Sex .........................................................................................................126
4.1.3 Educational qualification.......................................................................127
4.1.4 Marital Status.........................................................................................128
4.1.5 Rank/Title ..............................................................................................129
4.1.6 Tenure ....................................................................................................130
4.1.7 Status of Staff ........................................................................................131
4.1.3 : A Cross Tabulation of Status and Campus of Respondents ................134
4.1.4: A Cross Tabulation of Campus and Sex of Respondents....................135
4.1.5: A Cross Tabulation between Rank and the Campus ...........................136
4.2: Perceptions of Staff on Organisational Communication in UEW...........136
4.3: Performance of the Organisational Communication System ..................143
4.4.1 Cluster Analysis of Staff on Group Cohesion in UEW.........................158
4.4.2 Categorical variable importance in cluster determination.....................162
4.4.2 Group Cohesion and Organisational communication pattern................166
4.4.3 ANOVA of group cohesion...................................................................169
4.4.4 Post Hoc Test Analysis..........................................................................170
4.5: Ranking of Constraints Millitating Agaist Communication Flow ..........173
4.5.1 Factor Analysis on Constraints millitating agaist communication flow175
4.5.1.2 System Constraints .............................................................................176
www.udsspace.uds.edu.gh

xiv
4.5.1.3 Administrative Constraints .................................................................177
4.5.1.4 Structural Constraints .........................................................................177
4.6 Hypothesis Testing ..................................................................................180
4.6.1 Hypothesis 1 ..........................................................................................180
4.6.2 Hypothesis 2 ..........................................................................................183
4.6.2.1 Marital status ......................................................................................183
4.6.2.2 Educational level of Staff ...................................................................183
4.6.2.3 Staff Status/rank .................................................................................184
4.6.3: Hypothesis 3 ........................................................................................184
CHAPTER FIVE: SUMMARY, CONCLUSIONS AND
RECOMMENDATIONS
5.1 Summary of Findings ...............................................................................190
5.2 Conclusions ..............................................................................................192
5.3Recommendations .....................................................................................195
5.4 Areas for Further Research.......................................................................198
REFERENCES ...............................................................................................200
APPENDIX A: QUESTIONNAIRES ...........................................................239
APPENDIX B: SAMPLES DETERMINATION .........................................251
APPENDIX C: POST HOC TESTS USING DUNNETT T..........................255
APPENDIX D: STAFF STRENGTH AS AT MAY 15, 2012 ......................256
www.udsspace.uds.edu.gh
xv
LIST OF TABLES
Table Page
3.1: UEW Staff by Campus and Staff Category.............................................108
3.2: Sample Size Determination .....................................................................110
3.3: Summary of responses from Test, Re-test and the Main Study ..............112
4.1: Selected Demographic Characteristics of Staff .......................................124
4.1.1: A Cross Tabulation of Status and Sex of Respondents ........................133
4.1.2: A Cross Tabulation of Rank and Sex of Respondents ........................133
4.2: Perception of Staff on Organisational Communication in UEW ............138
4.3: Organisational Communication System and Performance......................151
4.4: Group Cohesion effect on organisational communication ......................158
4.4.1. Summary of Group of Staff/Roles........................................................160
4.4.2 Cluster Distribution of Staff ..................................................................161
4.4.3 Cluster distribution across campus ........................................................162
4.4.4 Cluster Membership Distribution ..........................................................162
4.4.5: PPMC Correlation on Organisational Communication........................168
4.4.6: Oneway ANOVA on group cohesion..................................................170
4.5: Coefficient of concordance (W) rank of Communication.......................174
4.5.1: Communication Constraints : Rotated Factor Matrixa .........................179
4.6.: F Test Difference of Communication Performance ...............................181
4.6.1: Chi square results of staff profile and communication performance...184
4.6.2: Pearson Correlation Matrix constraints ................................................188
www.udsspace.uds.edu.gh

xvi
LIST OF FIGURES
Figure Page
2.1: Peirce’s notion of the triangular relationship ............................................25
2.2: Moderating Effects of Communication ...................................................44
2.3 : Linear Model on Communication ............................................................51
2.4 :Interactive Model 54.................................................................................52
2.5: Transactional Model ..................................................................................54
2.6: Derivative Model of Communication........................................................56
2.7: Ecological Model of Communication .......................................................57
2.8: Berlo’s Model ............................................................................................58
2.9: Communication Effectiveness..................................................................67
2.10: Personal Communication Model ..........................................................70
2.11 Determinants of Job Performance ............................................................81
2.12: Administrative Performance Model .....................................................82
2.13: Administrative Performance....................................................................85
2.14: Downward, Upward, Horizontal and Diagonal directions ..................88
2.15 Small Group Networks .............................................................................96
2.16: Centralised and Decentralised Structure .................................................96
2.17: The conceptual framework ....................................................................102
2.18: Multiple dimensions of Organizational Communication .....................104
4.4.1: Determinants of Cluster One………………………………………... 163
4.4.2 : Determinants of Cluster Two………………………………………...164
4.4.3: Determinants of Cluster Three………………………………………..165
4.4.4: Determinants of Cluster Four………………………………………..165
www.udsspace.uds.edu.gh

1
CHAPTER ONE
INTRODUCTION
1.1 Background to the Study
In any work setting and indeed among humans, effective communication flow
could enhance administrative performance between staff members and
management of the organisation. Communication allows organisations to exploit
the value that information for proper functioning, effective and efficient
performance, competitiveness and continued success. Communication in every
organisation is a critical resource for performance. Effective communication
takes place when there is a perfect convergence in meaning between the sender
and the receiver. Wright (2005) stressed that communication in organisation is
the development of a common understanding between the communicator and the
manager or practitioner about the existence and utility of an innovation, leaving
the same encounter with different perceptions of that encounter. Morrison (2014)
also indicated that of all the life skills available to us, communication is perhaps
the most empowering in work settings. It is therefore imperative to view
organisational communication as process with the embodiment of social units
formed by individuals with different views and knowledge aimed at a common
goal through establishing links with external world with the information they
gained from the environment.
According to Adereti, F. O., Fapojuwo, O. E. and Onasanya, A. S. (2006), it is
when data has been put into a meaningful and useful context that one can say
communication has taken place with another and a decision is made. Samuel
(2001) indicated that information on the other hand is data for decision-making
www.udsspace.uds.edu.gh

2
collected as a resource and passed on as acquired and used to make an informed
decision. Consequently, accessing communication is implicit across
organisations, while disseminating information is explicit to staff. This implies
that communication could constitute a great asset to organizations if the
appropriate quantity and quality of information obtained is seriously considered.
Shoveller (1987) posited several reasons for distortion in organisational
communication resulting in communication dissatisfaction which includes:
individuals failing to accept the responsibility to communicate and the lack of
interest on the part of the receiver as well as non-convergent in meaning of what
are being communicated. Cramton (2001) indicated that management of
knowledge resources for knowledge workers in different locations is often
difficult than management of centralised knowledge workers. For instance, in
some organisations with dispersed centers or branches, members often face
difficulty or inability to create and maintain mutual knowledge and understanding
about work-related issues. This may thus cause misunderstanding, distrust or
even frustration among staff of the organisation.
The perception of organisational communication is also considered as the way
people view and feel about communication. According to Akinsorotan (2001),
perception is a psychological reasoning or conclusion drawn from observing a
given phenomenon following experience or prevailing conditions. It is an active
cognitive process, a mechanistic system fixed by inherent structure of the
nervous system. Poon (2002) stated that several factors, including strength and
quality of stimuli, attention, cognitive style, arrangement of subject matter, the
experience of the child, physical and emotional health, mood of individual and
www.udsspace.uds.edu.gh
3
other factors influence the perception of the individual at work. Furthermore,
personal factors such as attitudinal needs, values, credit, situational factors (like
work ambiguity, climate and financial factors) could also influence perception
of the individual. Hinkson and Keith (2000) indicated that the individual’s
current appraisal of an object is his perception. It is therefore recognised with
social psychologist around the world that perceptions towards work activities
including organisational communication affect responses on how people speak,
think and view situations in general. Hence, the perception of organisational
communication could facilitate or slow the flow of information in a given
environment. The flow of information in organisations depends on the necessary
tools available to ensure that staff who communicate adhere to the standards and
regulations that are embraced by members in the organisation. In the University
set up, the effectiveness of organisational communication on administrative
performance could be complex most especially in a multi-campus institution like
the University of Education, Winneba (UEW).
1.2 Nature of Multi Campus Institutions
Holland and Sullivan (2005) indicated that a multi-campus institution most often
has a complex and challenging administrative perspective. A typical multi
campus institution with its mission drives the policies, practices, services, and
organisational structure at each campus. Campuses that are part of a large
University system generally have diverse student populations, including those
from senior secondary schools, moving through a four-year program, or matured
students who are much older and employed. In addition, individual campuses
and their schools/faculties, typically develop business processes at different
www.udsspace.uds.edu.gh

4
times using a variety of systems. For instance, different tuition and fee, academic
year calendars, human resource policies and communication issues vary too.
These differences could result in a large diverse constituency that takes into
consideration uniformity in communication and general implementation of
activities.
In a related study, Yingxian-Zou (2011) pointed out thedisadvantages of multi-
campus University in China to include: less exchange between teachers and
students, the time wasted on the way for teachers, the additional trafficcosts for
the universities and the environmental pollution caused by additional traffic
among campuses. In Xi’an Jiaotong University with four campuses at Xingqing,
Qujiang, Yantaand Caotan, many lecturers move from one campus to another in
long distances with traffic issues every day. Besides these distances, delays and
time wasted are huge cost associated with claims from staff on fuel and hotel
bills.
1.3 The Multi Campus University System in Ghana
One of the few multi-campus universities in Ghana is the University for
Development Studies (UDS), Tamale in the Northern Region. UDS was
established in 1992 as a multi-campus institution and as the fifth public
University in Ghana. It was created within the four northern regions of the
country in mind, which deviates from the usual practice of having universities
with central campuses and administrations. The Brong Ahafo Region, Northern
Region, Upper East Region and the Upper West Region were to accommodate
UDS under decentralised administrative structures with the Deans forming
www.udsspace.uds.edu.gh

5
constituent campuses. This novel experiment brought along with-it certain
challenges to educational administrators, teachers, learners and surrounding
communities. Similarly, the NIIT in Ghana (now known as Blue Crest College)
has also forged an alliance with other partner institutions like the UEW in Ghana
for students to acquire degree in IT without leaving the country. With this, are
large populations of students with Campuses spread throughout six regions of
Ghana to train IT professionals.
1.3.1 UEW as a multi-campus University
The University of Education has four campuses in Ghana, namely: Winneba,
Kumasi, Mampong and Ajumanko.
1.3.1.1 The Winneba Campus
The Winneba Campus which is the main campus of the University is spread over
three sites (North, Central and South) within the Winneba Municipality. The
Central Administration of the University is located at the South Campus. The
Winneba Campus host the following Faculties, Schools, Institute, Centres and
Offices: Faculty of Educational Studies, Faculty of Languages Education,
Faculty of Science Education, School of Creative Arts, School of Research and
Graduate Studies, Institute for Educational Development and Extension (IEDE),
National Centre for Research into Basic Education (NCRIBE), Centre for
School and Community Science and Technology Education (SACOST), Centre
for Hearing and Speech Service (CHSS), Office for International Relations,
Office for Institutional Advancement, Gender Directorate, Counseling Centre
and Educational Resource Centre.
www.udsspace.uds.edu.gh

6
1.3.1.2 The Ajumako Campus
The Ajumako Campus currently hosts the first-year students of the Development
of Akan-Nzema Education of the Faculty of Languages Education. Gradually
the Faculty of Languages Education will move from Winneba Campus to the
Ajumako Campus and will eventually become the College of Languages
Education.
1.3.1.3 The Asante – Mampong Campus
The Asante – Mampong Campus hosts the College of Agriculture Education and
is situated 51 kilometers north-east of Kumasi. The Asante – Mampong Campus
is the home of the faculty of Agriculture Education Agriculture Education.
1.3.1.4 The Kumasi Campus
The Kumasi Campus which hosts the College of Technology Education of the
University of Education, Winneba became part of the University of Education
Winneba in 1996 following the Educational reforms carried out by the Ministry
of Education in 1992 by the PNDC Law 322, 1992. The college hosts three
Faculties: Faculty of Business Education, Faculty Technical Vocational
Education and Faculty of Education and Communication Sciences. The College
has a total of six departments, Teacher Training Unit and African Studies Unit,
a main library, departmental and hall libraries and two halls of residence;
namely, Opoku Ware II Hall and Atwima Hall.
The campuses of UEW are satellite in nature and their spatial nature has the
potential of posing challenge to effective communication. These campuses rely
www.udsspace.uds.edu.gh

7
on means of communication with networks of technology available, staff
support, laid down procedures and patterns, and even means of transport
(vehicles). Considering the volume of teaching and learning activities and the
growing numbers of student’s vis a vis the limited resources available, UEW
current communication systems have a challenge.
1.4 Nature of Communication in UEW
University as a center of knowledge requires information generation and
dissemination. It is a complex environment, yet academically structured system
with strict regulations in communication. Some tertiary institutions in Ghana,
whether public or private, run multi-campus satellite system. The University of
Education, Winneba (UEW) in Ghana is one of such institutions with satellite
campuses that maintain statutory functions of ensuring that information is well
accessed and disseminated to both staff and students by instituting appropriate
organisational communication system; notwithstanding the distance among
campuses. At the UEW, communication involves the transfer of information and
exchange of facts, ideas, opinions and emotions and obtaining feedback among
and between staff and students. Hence, staff may transmit information and
obtain feedback, indicating their understanding or lack of it and confirmation.
Poor communication could result in interpersonal conflict and affect output.
Staff within the University system usually spends time working and
communicating by speaking, reading, writing and listening and through the
hierarchy of structure as routine. Other systems of communication in the
University are the upwards, downwards and horizontal communication. In the
University for instance, communication takes place between the Deputy
www.udsspace.uds.edu.gh

8
Registrars, the Heads of Department and Management and among staff at all
levels. Communication that flows ‘downwards ‘from superior to subordinates is
referred to as downwards communication; and ‘Upwards’ communication is
when communication is passed on to members of the management team, from
staff of a lower level. Upwards communication gives employees the opportunity
to express their concerns, problems and anxieties and find solutions that may
enhance job effectiveness and efficiency. Other forms of communication in the
University include: face-to-face, on telephone, at meetings, the use of fax,
campus radio and more recently, the electronic mail, teleconferences and voice
mail. Some other internal means of communication include: memoranda,
notices, circulars, minutes of meetings and the University journals. Keeping in
view the importance of organisational communication, this study was conducted
to examine the effects of organisational communication on administrative
performance at UEW, Ghana which runs multi-campus system in Winneba
(main campus), Kumasi, Mampong-Ashanti and Ajumako.
1.5 Statement of Problem
The multi- campus nature of UEW presupposes that regular, prompt and
effective communication among staff of the University could be achieved to
support the realisation of her mission (to train competent professional teachers
for all levels of education as well as conduct research, disseminate knowledge
and contribute to educational policy and development) and vision (to be an
internationally reputable institution for teacher education and research). The
result of such vision couldencourage standardisation and effective processes in
delivery, resulting in cost reduction and quality promotion. Apart from that, a
www.udsspace.uds.edu.gh

9
Universitycould employ other alternative channels of information flow, allowing
for more open communication between individuals and group members in the
University (Argenti, 2003). Despite the important roles’ communication play in
the development of every institution, communication in a multi campus
institution is perceived by staff as being poor resulting in a gulf in information
flow and delay or distortion (Holland and Sullivan, 2005). One potential setback
ofsuch challenge is that the University could easily lose sight of its mandate
(Adereti et al., 2006), and sometimes could create myriads of communication
arc, for instance between the management (the sender) and staff (the receiver)
and the vice versa (Yingxian-Zou, 2011). These communication problems could
have adverse effect on administrative performance (office management skills,
leadership and personal effectiveness, managing conflict, project management,
planning events and utilizing office technology), causing frustration and erode
good will (Holland and Sullivan, 2005). Since the establishment of the
University, there has not been any known empirical study to ascertain the effect
of organisational communication on administrative performance of staff in the
University. It is against this backdrop that this study sought to determine the
effects of organisational communication on administrative performance of staff
at the University of Education, Winneba (UEW), Ghana.
1.6 Research Questions
1.6.1 Main Research Question
The main research question that guided this study was stated thus:
What are the effects of organisational communication on the administrative
performance of staff of UEW?
www.udsspace.uds.edu.gh

10
1.6.2 Specific Research Questions
Specifically, the study sought to find answers to the following questions:
What is the perception of staff on the nature of communication in the
University?
How does the present nature of communication in the University affect
administrative performance?
How does staff perception of organisational communication affect group
cohesion of staff?
What are the constraints militating against communication flow in this multi-
campus University?
How does the demographic characteristic of staff influence communication
in the University?
1.7 Objectives of the Study
1.7.1 Main Objective
The main objective of the study was to assess the effects of organisational
communication on administrative performance at the University of Education,
Winneba, Ghana.
1.7.2 Specific objectives
The specific objectives are to:
Ascertain staff perception of the nature of communication in the University;
Examine the effect of organisational communication on staff administrative
performances;
www.udsspace.uds.edu.gh

11
Determine the effect of organisational communication on group cohesion;
Ascertain the constraints militating against organisational communication in
the University; and
Determine the effect of staff demographic profile on organizational
communication in the University.
1.8 Justification for the Study
Effective communication forms an integral part of enhancing administrative
performance in educational institution. Since the inception of UEW in 1993, the
tripodal mandate of teaching, research and community services seems to be
undertaken within the University catchment areas at Winneba, Kumasi,
Mampong and Ajumako. However, there had neither been empirical study on
the nature of communication within the University nor examination of the
administrative performance of staff in the system. This is without prejudice to
the fact that the campus-wide nature requires interplay of communication to
enhance and maintain academic milieu on the campuses; and how it affects
performance. To this end, it is imperative to document the effect of
organisational communication on administrative performance the UEW in terms
of perception of staff at this time, since it could have the potential to impact on
staff pattern of behaviour. The outcome of the study could create an institutional
framework for information flow and further engender a two-way communication
between management and staff, staff and management, or even among staff in
the University. Recommendations from the study could guide policy
formulation in the University as it relates to communication. Furthermore, the
study would contribute to knowledge in development communication.
www.udsspace.uds.edu.gh

12
1.9 Hypotheses for the Study
The following hypotheses for the study were tested in null forms as follows:
H01: There is no significant difference in the effectiveness of organisational
communication among various campuses.
H02: There is no significant relationship between staff profile (location of campus,
age, sex, ethno-linguistic, rank/title, marital status, tenure-years in office and
educational qualification) and effectiveness of organisational communication.
H03: There is no significant difference in effect of communication on group
cohesion among various campuses.
1.10 Delimitation of the Study
The scope of this study was narrowed down to the University of Education,
Winneba and limited to staff.Geographically, the study focused on the four
campuses at Winneba in the Central Region, with six faculties, the Ajumako
Campus with the Faculty of Languages and in the Central Region, the Kumasi
Campus in Ashanti Region with three faculties which house the College of
Technology Education and the Mampong-Ashanti Campus also in Ashanti
Region with two faculties and house the College of Agriculture Education.
1.11 Operational Definition of Terms
Information: This is processed data that have been verified and organised
for a specific purpose and presented within a context that gives meaning and
understanding.
Effective Communication: This is the process of conveying more
meaningful information from a sender to a receiver through a channel with a
www.udsspace.uds.edu.gh

13
view to arriving at a convergence in meaning for a feedback and feed
forward.
Perception: This is the way and manner staff feel about something or a
situation. It is a psychological reasoning or conclusion drawn from observing
a given phenomenon following experience or prevailing conditions.
Administrative performance: A systematic approach to improving the
efficiency and advance the potential of individual through step-by-step
office management skills, demonstrating leadership and personal
effectiveness, managing conflict and projects, planning events, and utilizing
office technology.
Organisational communication: This is the process of creating and
exchanging opinions or information at the work settings by creating
conducive atmosphere for information flow among staff of the organisation.
Staff: This is an official designation to title of membership, belongingness, a
social rank or a degree of social prestige supporting professional development
goals and well-being of the work. Staff here will center on working
colleagues (junior staff, senior staff and senior members) irrespective of the
position or title one occupies.
Group cohesion: This is the degree to which a number of people constantly
work together in a given environment for the achievement of a common goal.
www.udsspace.uds.edu.gh

14
CHAPTER TWO
LITERATURE REVIEW
2.1 Introduction
This chapter extensively reviewed literature on communication and information
theories, barriers to communication, staff communication needs, bureaucracy,
organisational structure and more importantly, adopted both the theoretical
framework (systems theory) and the conceptual framework of communication.
Some empirical literature on communication models were evidence of what
existed and those parts the researcher believed were particularly relevant to this
study.
2.2 Concept of Communication
Communication is derived from a Latin word ‘Communicare’ which means to
make common, to share, to impart or to transmit. Today, the idea of “sharing” is
still the core of communication. Simply put, communication is the process of
conveying message from one person to the other, with the recipient of the
massage understanding the content and the meaning of the message (Rouse and
Rouse, 2005). According to Barth (2003) communication touches every sphere
of human activity and it is an important instrument of social interaction.
Communication provides a means by which people in business, industry, politics
and the professions act and interact; exchange information and ideas; develop
policies, plans and proposals; make decisions and manage people and materials.
Barth (2003) argued further that, in both public and private organisations,
business and industry, communication helps to orient workers to one another
www.udsspace.uds.edu.gh

15
and to the goals of an organisation, and it is the same means by which such goals
can be pursued, attained, sustained and improved.
According to the Harvard Business Review’s (1999) the process of
communication could be classified at the micro levels; formal and informal
communications; and internal communication practices (memos, circulars,
newsletters, presentations, strategic communications, work direction,
performance reviews, and meetings) as well as externally directed
communications (public, media, inter-organisational). Baker (2003) also pointed
out that communication process could address issues such as innovation,
organisational learning, knowledge management, conflict management,
diversity, and communication technologies. Thill (2000), defined organisational
communication as “exchanging knowledge and opinions in the organisation”,
while Argenti (2003) defines it as “allowing the creation of a positive
atmosphere for all employees of an organisation”. These definitions make
organisational communication a wider dimensional concept rather than
information traffic per se.
Effective communication in organisation should involve free a transfer of
information from the executive to subordinate and the vice versa. However, as
organisation becomes bigger and more complex, communication also becomes
more difficult necessitating the need for quality institutional communication
(Kalla, 2005). Barth (2003) added that the subject under review is the lubricant
that keeps the machinery of bureaucratic organisations functioning; it is the
means through which roles are identified and assigned; and, serves as the life-
www.udsspace.uds.edu.gh

16
blood of an organisation. The role of communication in modern organisations
therefore emphasises its importance in human interaction, of which this research
focuses on.
In many ways, organisations have evolved in the directions that make
appropriate changes confronting organisations and the associated changes and
forms (Von Krogh et al, 2000) and that have made communication in
organisations increasingly important to the overall organisational functions.
Anon (2012) quoting from Rogers and Rogers (1996) and Neher (1997)
emphasised social and organisational functions of communication rather than
focusing on areas of specific communication exchanges. They thus combined
the functions of informing, directing, and regulating into the broader category
of behavioural compliance and made the role of communication in managing
threats to organisational order and control.
More literature indicated that communication is the most important variable
for management and administrative performance process and it is the key to
successful integration of two potentially clashing organisational cultures
(Appelbaum et al., 2000). Shearer et al. (2001) opined that integrating different
goals, values, beliefs, ideas, systems, leadership styles, management practices,
and processes should all form part of communication. Indeed, the problems
often arise from lack of understanding between working groups in merging
companies, or between headquarters and subsidiaries that decrease the
effectiveness of cooperation (Noerreklit and Schoenfeld, 2000). Thus,
communication is necessary for forming a strong commitment to blending
www.udsspace.uds.edu.gh
17
business cultures and operations, required for achieving successful
administrative performance (Henry, 2002).
Appelbaum et al., (2000) further argued that change in organisations requires
not only that good decisions should be made about how the change will affect
profits, productivity, or quality, but also that these points should be well
communicated. Yazdifar (2005) added that effective communication will
inform employees that it is not what is done (or is going to be done), but rather
why and how it is done (or will be done) which really matters. Emphasising on
the importance of communication, Cartwright and Cooper (2009) also
suggested the need to avoid ambiguous language and jargon specific to
organisations in the communication process. This is important both at the
time of the announcement and throughout the integration period, in order to
dispel rumours, reduces uncertainty and overcome the ‘fear-the-worst’
syndrome. Employees in public service organisations have the tendency to
attend to information which reinforces their worst fears regardless of the
validity of the source (Cartwright and Cooper, 2009). Cooper (2009)
indicated that clearly communicating on a regular basis, even if the content
of the message is only to reaffirm that at the current time, was important.
Appropriate communications, in addition to other requirements such as
training, will equip employees with the knowledge and tools to help them
deal productively with the concept of constant change, to develop new
relationships and to engender the support of output (Appelbaum et al., 2000).
www.udsspace.uds.edu.gh

18
Hence, true business transformation means equipping employees with
actionable knowledge and skills to achieve business results (Henry, 2002).
From the foregoing it should be noted that all forms of communication do not
have the same effect, and true communication is difficult to achieve since the
communication process faces numerous potential obstacles (Appelbaum et al.,
2000) and may lead to “confusion or distortion”, “misunderstanding or different
interpretations”. Furthermore, Henry (2002) emphasised that, appropriate
communication was necessary for change in behaviours. Arguably, systems of
measurement and accountability display the potential for improving intra
organisation communication by infusing managers and ‘non-accountants’ with
a common financial vocabulary for communication and ‘reading’ the state of
the business affairs (Busco, 2001).
2.2.1 Diversity and Group Communication
According to Riedlinger et al., (2004), the increased diversity within
organisations means that communication now occurs across many more
boundaries, including cultural and professional ones. Nevertheless, Gardner et.al
(2001) reported that organisational communication processes from an intergroup
perspective is still very limited. Taylor et al. (2001) discussed the need for
greater research attention to groups as mediating structures in organisational
communication. More specifically, DeWine and Daniels (1993) opined that
cross-cultural communication is among the least studied subjects in
organisational contexts. The importance of intergroup communication was
highlighted by other scholars who noted the gap in research at this level of
www.udsspace.uds.edu.gh

19
diversity and intergroup communication (Deetz and Putnam, 2001). Again, Scott
and Lane (2000), stressed that complex organisations, individuals are likely to
identify more strongly with salient groups within the organisation, like work
units, than with the organisation. In studies over a decade taking an intergroup
perspective organisational communication, researchers have explored how
social identity influences communication.
2.2.2 Organisational Identity and Communication
Willemyns, Gallois and Callan (2004) analysed cross-functional barriers to
change as an intergroup communication and change issues involving work unit
identification. Social identities, particularly those related to work and
professional contexts then become relatively stable parts of self-definition
(Haslam, 2000). Willemyns et al., (2004) examined strategies for reactions to
communication accommodation in supervisor-subordinate interactions.
McCroskey and Richmond (2000) then theorised the role of accommodation in
inter gender interactions in male-dominated workplaces; and Winsor (2000) also
examined the difficulty in comprehension between white-collar and blue-collar
workers. Haslam (2000) suggested that communication both reflects and creates
social identities in organisations, noting that shared identity provides motivation
to communicate and a shared cognitive framework on which productive
communication can be based. Paulsen et al. (2004) called on researchers to
integrate Social Identity Theory (SIT) with communication theories and
methodologies, such as critical discourse analysis. Communication
accommodation theory as espoused by Gallois et al. (2004) is well suited to
exploring intergroup aspects of organisational communication.
www.udsspace.uds.edu.gh
20
2.2.3 Workplace Diversity and Communication
According Huff Post Life (2014) in a 2011 study from Forbes Insights, "diversity
is considered no longer simply a matter of creating a heterogeneous workforce,
but rather using that workforce to innovate and give it a competitive advantage
in the marketplace." In the study of 321 companies, 85 percent of those surveyed
agreed that diversity is key to driving innovation in the workplace. Oetzel et al
(2001) believe that there is a parallel tradition of research on communication
within and between culturally or professionally diverse work groups. The
research highlights the difficulties in interpersonal communication and cohesion
that arises in heterogeneous as opposed to more homogeneous groups. Duignan
(2013) in explaining an integrated approach to workplace diversity through
human resource again stressed on similar challenge on workplace diversity and
communication as being very important process.
Green (2010) opined that, valuing diversity and having a diverse workforce are
morally correct and that make economic sense as it could be a key component
of effective people management to improve workplace productivity. Gaining
some rising benefits, organizations need to tap into increasingly globalised and
diverse markets. Thomas (2005) issues on diversity also border on the
distribution of organisational members in terms of physical and psychological
attributes. Physical attributes which promote workplace diversity are seen as
easily detectable such as ethnicity, age, gender and skin colour (Berdahl and
Moore, 2006) and usually more enduring as it may form the first basis of
alignment among diverse workers (Bezrukova, Thatcher and Jehn, 2007).
www.udsspace.uds.edu.gh

21
According to Bagshaw (2004), Esen (2005) and Konrad (2006), diversity has
been expanded to mean the collective differences brought to the workplace,
based on individual and group characteristics, attributes, values, beliefs, skills
and abilities, backgrounds, socialization, life experiences, and power dynamics.
Notwithstanding the above, McGuire and Bagher (2010) have stated that
diversity helps to promote greater understanding, communication and
integration of different worldviews in decision-making and problem-solving
situations. Many studies on diverse work groups now explicitly refer to
application of Social Identity Theory (SIT) in organizations on attractive feature
of his discussion of how areas of leadership, motivation, communication, power,
decision-making, work performance and productivity and dispute and
negotiation management are addressed within each paradigm (Haslam, 2000;
Riedlinger et al., 2004), and the intergroup lens has great potential. Haslam
(2004) citing Katz and Kahn (1966) emphasise how the overall design of his
approach to organisational behaviour is shaped by the Michigan open systems
model. Where SIT opens new possibilities in operational as well as strategic
management is in its emphasis on using language to raise the salience of social
identity of individuals and groups.
According to Haslam (2004) the pattern of power in communication at workmay
be expressed through a mix of impersonal grandiose proclamations of values
and literally physically impossible safety aspirations. Tyler (2003) indicates
how procedural justice contributes to the identity of sustainable leadership; and
therefore, reparation of trust. Williams and Miller (2002) reported that
assessment on the nature of audience is influenced by both reason and emotion,
www.udsspace.uds.edu.gh

22
but the weight given to each of the elements during the decision-making process
can vary widely depending on the person. Lewin and Koza (2001) were rather
concerned with complex processes of persuasive communication and strategic
decision-making and pointed out that these processes operate across many
different levels of analysis, including the actions of individual managers;
interaction between powerful sub-groups within the organisation; and wider
economic, social and cultural influences.
2.3 Communication and Information Theories
Communication theories refer to the work of past researchers account, drawn
extensively to include Silverman (2001) and Norton (1978), who have
influenced both the development of theoretical model and practical research.
This background explains no framework can be recommended as the best in
communication. According to Chapanis (1990), theoretical models clarify the
structure of complex events by reducing complexity to simpler, more familiar
terms, but rather to give it order and coherence. While the field of
communication has changed considerably over the last thirty years, the models
used were that of Foulger (2004) adopted in an introductory chapters of
communication also cited in Adler, Rosenfeld, and Towne (1996); Barker and
Barker, 1993; Becker and Roberts, 1992; Bittner, 1996; Burgoon, Hunsaker, and
Dawson, 1994; DeFleur, Kearney, and Plax, 1993; DeVito, 1994; Gibson and
Hanna, 1992; Ruggles (1998), were the same models that were used forty years
ago and in some sense, a testament to their enduring value.
www.udsspace.uds.edu.gh

23
Theoretically, the internet can be conceptualised as a complex communication
space in which distributed digital inscriptions proliferate in ways that build upon
and differ from the distribution of other types of inscriptions (Schein, 1993;
Wang, 2002). This social space mediates both practices of technology design
and development, and knowledge practices. Epistemic objects are generators of
questions and the creation of novel types, strongly related to technologically
embedded paradigms or scientific styles Souitaris, (1999). Braun et al. (2000)
argued that the most effective form of communication occurs when information
is not only exchanged but acted on collaboratively. Ramirez and Quarry (2004)
also hold the view that communication and participation are two sides of the
same coin. Zahra (1993) on the other hand developed a level of knowledge about
communication that managers need to succeed in today’s business environment
on how to analyse audiences, organize ideas effectively, and choose appropriate
media and how to sell products and ideas to a wide range of audiences.
2.3.2 Information theory
Nainby (2010), inspired by developments in systems theory and cybernetics,
stressed the introduction of a new communication model called “information
theory”, viewed as a measure of entropy or uncertainty in a system. In the
information theory model of communication, a source produces a message; this
message is passed along a channel, to a receiver that interprets the message.
McGrath (2005) holds that a new Information Theory concept, known as
“dialogic models” is when one understands that the speaker has used a metaphor,
the rule holds, and the conversation makes sense.
www.udsspace.uds.edu.gh

24
Kelly (1999) indicate that “throwing the baby out with the bath water” might be
a metaphorical example, as the origin of the phrase while “raining cats and dogs”
may not actually a be metaphor, but of mythological derivation. According to
Silverman (2001), conversation analysis is a way of describing “people’s
methods for producing orderly social interaction”. Just like Casmir, Waldman
and Yang (2006) developed the concepts of turn-taking and other conversational
rules and gave a series of lectures that prepared the foundations for conversation
analysis today. Silverman (2001) indicated that one significant feature of
conversation analysis is that it centers on talk as the data. Which Norton (2002)
opined that the context of information theory is not excluded from dialogic
models; the concept of “Institutional Talk” in conversation analysis explicitly
seeks to connect communicators with their contexts. Anything that is created
through human interaction could be studied from a communication perspective.
Human endeavours such as architecture, clothing, and literature and so on are
all expressions of people functioning and communicating in a social world.
These different forms of expression also vary according to the social context in
which they have been created (Norton, 2002).
A key feature of Peirce’s semiotic theory is his creation of three semiotic
categories as firstness, secondness and thirdness. Since there were three
categories, which were related to each other, they could be represented in a
triangular fashion, as shown in Figure 2.2.
www.udsspace.uds.edu.gh

25
Figure 2.1: Peirce’s notion of the triangular relationshipSource: Peirce (1839–1914)
Concurrently, but independently of each other therefore, Saussure and Peirce
developed a line of thinking that treats languages as sign systems, which are
governed by rules.
2.4 Barriers to Communication
Bird (2002) discusses three communication-related barriers to ethical behavior
in business organisations. These barriers were summarized in the following
terms:
Moral silence, which means failing to speak up about issues that are known
to be wrong;
Moral deafness, meaning a failure to hear or attend to moral concerns raised
by others; and
Moral blindness, which is the failure to recognize the moral implications of
actions.
www.udsspace.uds.edu.gh

26
The quality and effectiveness of communication flowing through any channel
therefore could depend ultimately on the communicative practices adopted by
users.
‘Many people in business fail to speak up about their moral convictions. Theyfail to do so in a number of different ways. As a result, many of the ethical issuesand concerns facing business are not addressed as fully, as clearly, and as wellas they would be if people voiced their concerns. Moral silence is occasionaland reinforced by the correlative phenomena of moral blindness and moraldeafness as well as the quite contrary practice of giving voice to moralisticconcerns’ (Bird, 2002).
Hofstede’s (2001) famous definition of culture highlights the differences that are
measured across these dimensions. He treats culture as ‘the collective
programming of the mind that distinguishes the members of one group or
category of people from another’. His work, Tayeb (2000a) with other
researchers, hold different perspective of culture, as an enduring source of
difference in convergence in meaning in communication process debate. It is
certainly the case that ‘culture clash’ remains an important barrier to
communication, but there are increasing doubts about the continuing relevance
of this perspective in the multi-cultural settings of many contemporary
organisations (Holden, 2002). According to Luft (2000), research into the
communication barriers experienced by deaf employees indicated that
organisations need to address a much more complex set of social and cultural
factors beyond those directly related to hearing loss.
Shahin and Wright (2004) has challenged parties in the communication process
stating that even though managers spend most of their time communicating, one
cannot assume that meaningful communication occurs in all exchanges. Once a
memorandum, letter, fax, or e-mail has been sent, many are inclined to believe
www.udsspace.uds.edu.gh

27
that communication has taken place. Communication does however not occur
until information and understanding have passed between the sender and the
intended receiver. Okiy (2005) points out poor and inadequate
telecommunication facilities; poor level of computer literacy, even within the
academic community; poor level of computer facilities; poor level of awareness
of internet facilities among policy makers, government officials and the ruling
class in general; and minimum involvement of academic institutions in network
building as challenges militating against communication.
One major drawback in communication, according to Cramton (2001), in
dispersed collaboration is the organisation’s members’ difficulty or inability to
create and maintain mutual knowledge and understanding about work-related
issues. This situation could cause misunderstanding, distrust or even frustration
among staff of the organisation. Communicating information, especially in any
decentralised organisation is perceived to suffer from severe communication
problems. According to Taylor (2004) barriers to communication in the
workplace could include not thinking clearly, not listen intelligently, not
selecting appropriate media, poor timing and place of communication, using in
appropriate language, not obtaining feedback and if care is not taken could be
disastrous, resulting in failure of communication all-together. Fleury (2005) also
believed that one may also consciously or unconsciously engage in selective
perception or be influenced by fear or jealousy.
Relating to effective decentralised organization, Maznevski and Chudoba,
(2000) opined matching communication patterns with their on-going tasks and
www.udsspace.uds.edu.gh

28
activities. It is therefore important to know that there are benefits or something
vital still to be known in managing communication in decentralised locations
and virtual organisations (Barth, 2010). According to Chory and Hubbell
(2008)), hostility statements and interpersonal aggression acts like starting
rumours about someone and putting down phone calls. These kinds of negations
arise from unhealthy communication and it shows how communication is
important for organisational success. In addition to this communication barrier
that interrupts organisational activities, could commence from limited capacity
building to provide required information due to lack of money and time. That is
why Morreale, Shockley-Zalabak and Whitney (2007) have mentioned the
scarcity of the formation of necessary relations between resource and receiver is
another obstacle.
Effective communication is one of the most critical goals of organisations but
challenges exist and cannot easily be avoided (Spillan, Mino, and Rowles,
2002). Sperry and Whiteman (2003) also argued in similar direction that, to plan
strategic communication, managers must develop a methodology for thinking
through and effectively communicating with their superiors, staff, and peers in
five components as:
Outcome; the specific result that an individual wants to achieve
Context; the organisational importance of the communication
Messages; the key information that staff need to know
Tactical reinforcement; tactics or methods used to reinforce the message
Feedback; the way the message is received and its impact on the
individual, team, unit, or organisation.
www.udsspace.uds.edu.gh

29
McDonough et al., (2001) indicated that personal barriers could arise due to an
individual’s frame of reference or beliefs and values. They are based on one’s
socio-economic background and prior experiences and shapes and how the
messages are related. Macro barriers in communication, according to Ulmer
(1998) include:
Information overload,
Lack of subject knowledge,
Cultural differences,
Organisational climate,
Sender/receiver,
Message competition and
Project jargon and terminology.
Pearce (2002), intimated that it is common to mix up quotations from ancient
classics, trying to describe what the ‘English’ are like by quoting Chaucer and
mixing observations made. Holden (2002), however, said it was possible to take
a more critical approach to communication practices and the principles that
underpin them. Tayeb (2000b) also noted that confining behavior to a handful
of dimensions presents a simplistic and picture of reality’ in organisations.
Pearce, (2002) outlined an approach, as the authors argued that professional
communication in international settings could not be standardised around the
practices of a single social or cultural group. Culture jamming according to Klein
(2000) suggests that jamming resulting from a combination of technological
advances and an underlying popular resentment against the overpowering
commercialism of the leading corporate brands. A more fundamental challenge
www.udsspace.uds.edu.gh

30
to culture jamming is demonstrated by the ease with which corporate advertising
and branding has been able to appropriate jamming techniques for its own
purposes (Klein, 2000). In some cases, lack of confidence in a person because
of lack of prior experience and fear of being exposed to external criticism could
result in barrier to communication (Ruderstam and Newton 2001). However, as
many authors have commented, the activity of writing is itself a source of
learning, as one engages with the subject and begins to think about the ways that
information sources are connected to Phillips and Brown (2000). In that vein,
Putnam (2004) advises that when writing to communicate effectively for
audience, the writer needs to consider:
Apparent cultural differences,
Unspoken cultural differences and
Unconscious cultural differences.
Hofstede (2007) intimated that a culture that takes a collectivist approach to life,
would welcome in the cover letter to a report, personal aspect of a relationship
such as complementing a recent achievement, whereas this might be seen as
unnecessary and distracting in a more individualist culture. Long introduction
which illustrates the genesis of the issue to be examined and provides a
retrospective analysis or historical overview of the issue is a must, regardless of
the wording of the question Whitley, (2000). A British reader, however, would
see this as lack of “convergence” to the point, or even “waffling”, engaging in a
long and irrelevant discussion until the second page of the essay that concepts
expressed are regarded as being pertinent, and aimed at answering the question
(De Vita, 2001).
www.udsspace.uds.edu.gh

31
2.5 Information and Communication Technologies (ICTs)
According to Fiske (2006), Innovation systems are networks of interlinked
actors, and an environment that encourages effective information and
communication management (ICM) contributing directly to innovation, and to
social and economic development. ICM and knowledge management (KM) are
often characterised as having three components: People, Processes and
Technology Hargie and Tourish (2002). ICT play very important role in every
organisation to ensure effective communication. Jorgenson and Stiroh (2000)
studies found that technological progress shows that investment in (ICT) is
making an important contribution to economic growth and labour productivity
growth. Jablin et al (2001), among others, argued that while there has been
tremendous productivity growth in ICT in industries, there is only limited
evidence of any incremental productivity growth in using ICT in industrial
environment.
In reviewing literature, Brynjolfsson and Hitt (2000) provided evidence from
ICT and performance studies which indicated mixed information. Johns (2001),
however, linked technology surveys to longitudinal data on the performance of
manufacturing plants. The result was that plants that use advanced technologies
were more likely to experience productivity growth and that the superior
productivity growth was then reflected in market share gains. In similar vein,
OECD (2002) argued that ICT improves productivity by enabling
“organisational innovation”.
www.udsspace.uds.edu.gh

32
According to Shelby (2001), ICT has become a main determinant of productivity
growth in transport, wholesale and retail trade sectors. Previous studies at the
aggregate level suggest that dynamic services are more innovative and require a
higher share of knowledge workers. Omolayole (2002) points out three strong
reasons that stand against the effective use of ICTs in Nigerian academic
libraries to include: low level of computer culture, poor telecommunication
infrastructure and the general lack of awareness. Chisenga (2004) surveyed the
use of ICTs in public libraries in ten (10) Anglophone African countries and
revealed that all libraries studied pointed out to lack/inadequate ICT personnel
and lack of funds. Tully (2003) states that the environment where one grows up
can determine his or her ability to fully use modern technologies. The digital
divide is far from closed and in most parts of the world it is still widening
Tourish and Hargie (2004a).
Ali et al, (2002) opined that invention, discovery and technological change are
activities which increase the stock of intangible knowledge or ideas. ICTs have
created a world that is more interconnected than ever before. Information
Provision and Participation in Regulatory and Policy Processes according to
Bollinger and Smith (2005), has been designed to address information provision
practices and communication with a view to enhancing the participation of a
wider range of stakeholders in the regulatory and policy making processes.
Alternative models of ownership, management and financing can influence
access and adoption of ICTs Coeling and Cukr (2000). Smidths et al (2001) also
indicated that the breakdown of factor productivity aggregate into sectoral
www.udsspace.uds.edu.gh

33
contributions has helped to show attributions to ICT producing sectors and other
sectors.
The dynamism of ICT is expected to come from several sources including the
decline in the prices of information processing, convergence in communication
and computing technologies and the rapid growth in network computing. Ali et
al, (2002) also holds that the communication networks and interactive
multimedia applications provide the foundation for transformation of existing
social and economic relations into an information society. The role of ICT
according to Ali et al, (2002) in economic development, is therefore expected to
be manifested in productivity increase, enhancing the quality of life, reducing
prices, creating new economic activities and new employment activities as well
as generating wealth. Smidths et al (2001) also observed that the OECD
countries that improved performance in the 1990s were generally able to draw
more people into employment, increase investment and improve factor
productivity through ICT. In his contribution, Porter (2000) added that the
suppliers or subcontracted firms are likely to benefit from membership in the
production networks through transfer of technology gains, access to specialized
technical and marketing expertise; and that globalisation of production of ICT
is likely to deter most developing countries from reaping the benefits of
producing ICT. Whitney (2007) mentioned experience in other countries with
major challenge here is in addressing the question of how ICT should be
integrated and how classroom conduct could be changed to take full advantage
of the new technology. Chisenga (2004) indicated that ICT plays a leading role
in knowledge creation, codification and transmission and international R&D
www.udsspace.uds.edu.gh
34
spillovers have been shown to be significant whether in terms of social rates of
return, elasticity of growth contributions. The main determinants of spillover
appropriation are the acquisition of expertise through own R&D and education,
the openness to international contacts and close collaboration with foreign
researchers.
2.6 Staff Communication Needs
Meeting the communication needs of employees was one study done by Grunig
(2007) who defined various internal publics and described their communication
needs and habits, determined the probability of each group actively,
communicating within the Center, and made recommendations for enhancing
the existing communication program. Daniels (2010) on the other hand, studied
into why communicating with employees concluded that the mechanisms of
two-way communications, and its potential benefits were important and
involved management talking to employees, and listening to responses and
acting in relation to those responses. Good two-way communication can help to
build a psychological contract, in which employees feel valued by their
employer, and the employer values their employees’ contributions (Daniels,
2010).
Communication is an important aspect of employee engagement. The two most
important drivers of employee engagement identified by the Chartered Institute
of Personnel Development (CIPD), 2000, researched into engagement levels
emphasised the need for dialogue. They are:
Having opportunities to feed upwards and
www.udsspace.uds.edu.gh

35
Feeling well-informed about what is happening in the organisation.
Harrison and Falvey (2009) also stated that:
“During the first half of my PR career, most corporate managers thoughtall employee communication required was for someone, usually a junioremployee, to churn out the internal newsletter regularly. Slowly itdawned on them that employees wanted more than that. And what’smore, the employees wanted to see more face-to-face communicationfrom their supervisor or manager rather than outpourings from the PRteam.”
However, many communicators have continued to use the traditional arms-
length channels of print and electronic media. Putnam (2004) indicated that
employees use the wrong tools to communicate. Gray again found that the
traditional tools of newsletters, senior executive road shows, emails and the
intranet usually have little impact on overall employee satisfaction. Harrison and
Falvey (2009) pointed out that the basic requirement for good internal
communication is built around the needs of employees which generally include:
General information about the organisation
Specific information about their roles in the organisation
Clarity about their duties and roles
A clear understanding of organisational vision
Information on work place practices
Opportunities to be involved and consulted
Feedback on performance
Access to training and development
Access to communication channels.
www.udsspace.uds.edu.gh
36
Communications may be working effectively at higher levels but fail dismally
at the more local level. In their book developing your PR skills, Harrison and
Falvey (2009) stressed that internal communication strategy that addresses the
needs of workers effectively should produce and engage workforce who enjoy
their work because they feel valued.
2.7 Bureaucracy in Communication
According to Bozeman (2000), bureaucracy, sometimes termed as “red tape”, is
the rules, regulations and procedures that remain in force and entail a compliance
burden but do not advance the legitimate purposes the rules were intended to
serve. Other studies focused on factors that can cause and determine perceptions
of red tape Brewer and Walker (2006); Pandey and Patrick (2000). Several other
researchers have dealt with red tape as an independent variable that can influence
various organisational issues, including motivation, satisfaction, work
alienation, and innovation DeHart-Davis and Pandey, (2005), Pandey and
Patrick (2000); Scott and Lane, (2000); Brewer and Walker (2006). Government
is likely to have higher degrees of perceived red tape in general due to external
control, the need for accountability, and the shift to inter organisational
governance arrangements for the delivery of public service (Brewer and Walker,
2006). Scott and Lane (2000) have indicated that red tape has been considered
as a barrier to improve benefits provided to clients. This study seeks to advance
the research on organisational communication and assess the impact of red tape
on communication in the University. The question remains whether the
perceptions of red tape different according to persons with whom employees
www.udsspace.uds.edu.gh

37
communicate; and if so, the kinds of factors that mediate the relationship
between communication types and red tape.
2.8 Organisational Structures
Goldhaber et al. (1984) defined organisational structure as “the network of
relationships and roles existing throughout the organisation”. However, few
studies have explored the antecedents of supply chain integration.
Organisational structure experts agreed that it has influences communication and
facilitates the flow and processing of information; while Koufteros et al., (2007)
and Kalla (2003) provided empirical evidence about the relationship between
organisational structure and internal communication. The resource-based view
(RBV) on organizational structure has its roots back to Penrose (1959) as quoted
by Vickery et al., (2003) who views organisations as bundles of resources that
are managed, deployed, and reorganized in ways to provide unique form and
value. The theoretical model of the relationship between organisational
structure, internal communication, integration, and performance is based on the
resource-based view assumption that; with previous studies showing that
integration it’s related to product development performance. Koufteros et al.,
(2007) other theoretical model has three organisational structure constructs.
First, centralization of decision-making process can be defined as the degree to
and minimizes status differences. A flat organisation can reduce problems of
information delays, distortion and corruption as information flows from one
level to another. Third, specialization of departments and employees refer to the
level of horizontal integration existent within an organisation.
www.udsspace.uds.edu.gh

38
Organisational structure is recognized by many authors to have effects on the
level of internal communication (Grunig, 2002). According to Robbins (2009)
organisational structure determines the pattern of communication as well as the
formal lines of interaction between individuals within organisations. In a
research conducted by Holtzhausen (2002), organisational structural changes
results in information flow and face-to-face communication improvements.
Grunig et al., (2007) showed that organic structures have symmetrical systems
of internal communication while mechanical structures have asymmetrical
systems of internal communication. Similar results were found in the study
conducted by Kalla (2003), in which organic structure is positively correlated
with symmetrical communication and negatively correlated with asymmetrical
communication.
An organisational structure can stimulate or inhibit the flow of communication
by developing mechanisms to encourage participation and information sharing;
and this capability according to Galunic and Eisenhardt (2001); Symon (2000)
are increasingly developed through intensely social and communicative
processes, which may not be tied to physical resources or locations. Symon
(2000) described the emergence of post bureaucratic forms of organisation that
are flatter and leaner, and thus supposedly more flexible and responsive to
change. Many new organisational structures have come about because of
advances in technology, but Garud and Karnoe ((2001) made a critique of the
implied link between networks and the networked organisation. McPhee and
Poole (2001) argued that there is a stronger relationship between structure and
communication in new organisational configurations than in traditional
www.udsspace.uds.edu.gh

39
organisational structures. Much of the work in this area has involved
interpersonal, small-group, or team communication.
2.9 Multi-Campus Institutions
Dale (2012) examined, analysed and compared data collected by surveying all
full-time employees using Organizational Culture Assessment Instrument
(OCAI) and through personal interviews. The OCAI results indicated that
employees perceived the overall culture type as predominantly Clan and
Hierarchy, the preferred overall culture type as predominantly Clan and
Hierarchy, with a significant increase in adhocracy. The Main Campus
employees perceived dominant Clan culture type. Other Campus employees
perceived dominant Hierarchy culture type. Both Main Campus and Other
Campus employees preferred dominant Clan culture type. Administrators and
Support stakeholder groups perceived dominant Clan culture; Professional and
Faculty stakeholder groups perceived dominant Hierarchy culture. All four
stakeholder groups, as in the above case, preferred dominant Clan culture.
Conclusions were drawn that employees perceived dominant Clan and hierarchy
cultures and preferred dominant clan and adhocracy cultures, enhancing
flexibility, respect for one another and discretion for employees, internal
integration and external differentiation.
Roth, et al (2006) indicated that although the presence of free communication
reduces the complexity of multi-organisations, such organizations as Partially
Observable Markov Decision Processes (POMDP) have emerged as popular
decision-theoretic framework for modeling and generating policies for the
www.udsspace.uds.edu.gh

40
control of multi-organisation teams. The question of what to communicate in the
above case were described using two paradigms for representing limitations on
communication and present an algorithm that enabled multi-organisation teams
to make execution-time decisions on how to effectively utilize available
communication resources.
With multi-disciplinary, multi-national projects studied, Fox (2009) found that
shared understanding could be better enabled through the application of
information and communication design. Formidable inherent barriers to the
understanding in multi-disciplinary multi-national projects were identified.
Generic methods for communication of information; such as the use of gestures,
speaking business English, and the application of standard process charting
could be ineffective. Again, inherent challenges in establishing shared
understanding; limitations of generic methods for the communication of
information; issues underlying information and communication designed.
Further, practical recommendations in reducing time and cost related to the
challenges were done.
Munene (2004) indicated that the face of increasing social demand and cutbacks
in state budgetary support for universities in African countries are now turning
towards a multi-campus system strategy. In analysing the paradox surrounding
the performance of multi-campus University systems, Munene (2004) argued on
avenues of broadening University access and concluded that structural success
may be qualitatively contested. Dispersed Institutions in Africa, according to
Brown (2000), provides some useful reflective insights into the changing
www.udsspace.uds.edu.gh
41
dynamics between campuses at the University of Natal (now KwaZulu-Natal) in
South Africa. Nickerson and Schaefer (2001) provide an extensive survey of
educational branch campus administrators. Dengerink (2001) focuses on issues
of institutional identity and organisational structure in relation to multi-campus
arrangements, using the University of Washington and Washington State
University as cases in points. Scott et al., (2007) provide a study of Australian
multi-campus universities with a focus on comparison of the operational
efficiency of multi-campus organisations as compared with single campus
institutions. Smith (2009) examines the external factors that influence academics
working in a campus of an Australian University in the United Arab Emirates.
McBurnie and Ziguras (2007) and Heffernan and Poole (2004, 2005) provide
further studies of transnational campus arrangements. Developing a definition
of what ‘satellite campus’ could be, Scott et al., (2007) based it on key
characteristics which included the existence of an identifiable main site for the
institution, a minimum travelling time between main and satellite, and a critical
mass of students at the satellite, both in absolute terms and percentage of
institutional full-time equivalent student numbers.
2.9 Communication Models
One dynamic process in which a person strives at conveying meaning or making
argument with another as a fundamental approach in gaining understanding of
events, objects, and other people is done with the use of communication model
(Foulger, 2004). Communication model also lays a sound foundation which may
facilitate understanding of the process of communication; as this could be
disrupted in many ways. Croft (2004) opined that the sender’s senses may
www.udsspace.uds.edu.gh
42
inaccurately be perceived as the object or event, by permanent or temporary
damage to the sensory organs, by psychological or emotional damage to the
decoding mechanism, or by spiritual forces which interfere with the sender’s
perception and interpretation. A case in point is a damage to the encoding
mechanism through sending device (by mouth, pencil, hand); or by spiritual
forces which interfere with his or her transmission of information regarding the
object or event. This model may be useful in our understanding of what it means
to communicate. While all the elements of communication are likely not to be
included in this process, it does provide insight into this intriguing process.
2.9.1 The Communication Orientation Model
The model attempts to explain the face-to-face contact that can hinder as well as
help the ability to craft and achieve mutually satisfactory negotiation agreements
and high-quality decision-making outcomes. Diverse effects of sight, sound, and
synchronicity on negotiation and group decision-making the literature is divided
regarding their impact on negotiations and group decision making although the
effects of communication channels have been widely studied by psychologists
and communication scholars. Some researchers, including McGinn and Keros
(2002); Tanis and Postmes (2008) and Wolbert (2002) support mixed results to
have been reported for the role of visual channels, vocal channels, and
synchronicity, such that their presence does not always have a positive impact
on social interactions. A case in point is how evidence provided inconsistency
and contradictory conclusions on how communication channels and the potential
presence of sight, sound, and communication synchronicity influence the quality
of negotiation and group decision-making processes. Valley, Moag and
www.udsspace.uds.edu.gh

43
Bazerman (1998) in their studies found that the presence of these
communication channels increases the quality of outcomes. On the contrary
however, Croson (1999) studied into similar face-to-face contact
communication and concluded that the quality of outcomes decreases. The
advantage of the model supports the meta-analyses and provides theoretical
synthesis and practical guidelines to help negotiators and decision makers decide
when to use versus avoid certain communication channels to achieve high-
quality interaction outcomes. Again, this model resolves and synthesises
contradictions and offer a new model that proposes the presence of visual, vocal,
and synchronous communication channels to: (a) helps communicators with a
neutral orientation achieve efficient and effective negotiation and group
decision-making outcomes, (b) does not affect the achievement of high-quality
outcomes for communicators with a cooperative orientation, but (c) hurts the
outcomes of communicators with a non-cooperative orientation.
Dennis, Fuller and Valacich (2008) opined that the underlying reasoning in
communication synchronicity facilitates the ease with which people can socially
validate each other’s opinion, which then increases the exchange of information.
Byron (2008) observed that a synchronous communication on the other hand, in
which people are not able to provide direct feedback (with letter or email), makes
it harder to communicate spontaneously and increases the likelihood that
messages are misinterpreted. Loewenstern and Morris (2011) rather support
instant messaging negotiators which is asynchronous communication.
www.udsspace.uds.edu.gh
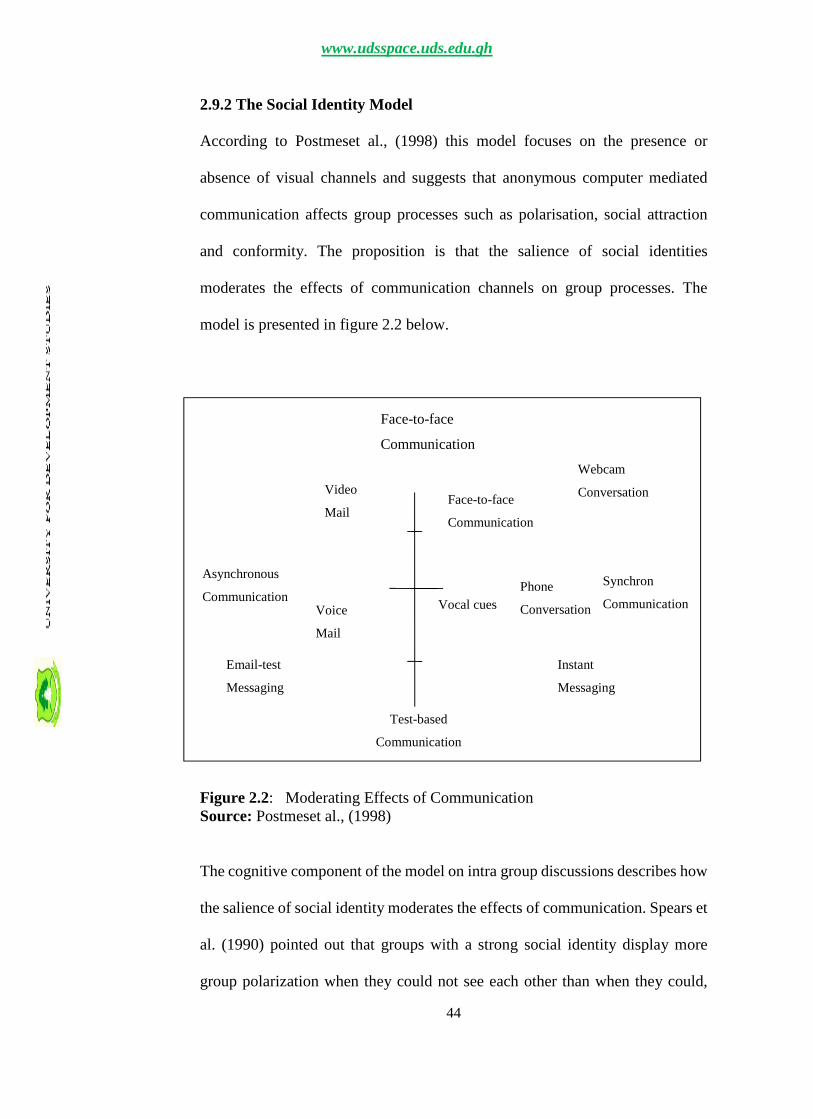
44
2.9.2 The Social Identity Model
According to Postmeset al., (1998) this model focuses on the presence or
absence of visual channels and suggests that anonymous computer mediated
communication affects group processes such as polarisation, social attraction
and conformity. The proposition is that the salience of social identities
moderates the effects of communication channels on group processes. The
model is presented in figure 2.2 below.
Figure 2.2: Moderating Effects of CommunicationSource: Postmeset al., (1998)
The cognitive component of the model on intra group discussions describes how
the salience of social identity moderates the effects of communication. Spears et
al. (1990) pointed out that groups with a strong social identity display more
group polarization when they could not see each other than when they could,
Video
Face-to-face
Communication
Webcam
ConversationFace-to-face
Communication
Asynchronous
CommunicationVoice
Vocal cues
Phone
Conversation
Synchron
Communication
Instant
Messaging
Email-test
Messaging
Test-based
Communication
www.udsspace.uds.edu.gh
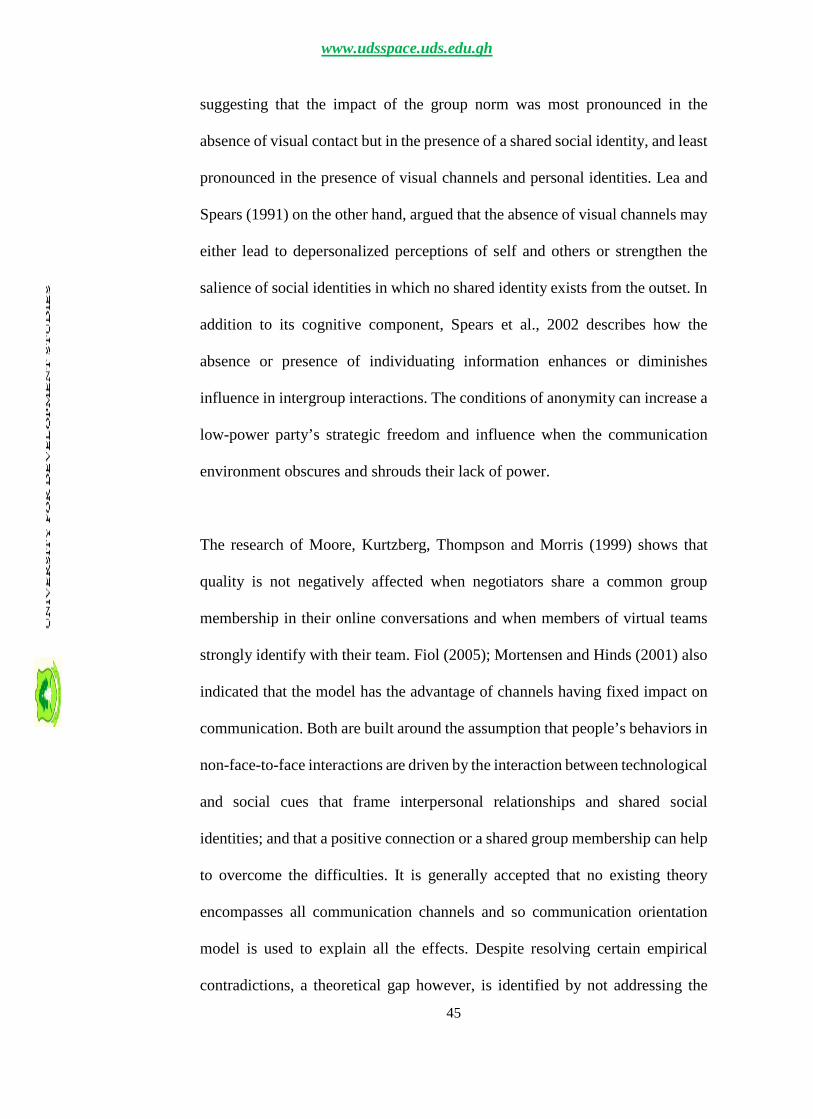
45
suggesting that the impact of the group norm was most pronounced in the
absence of visual contact but in the presence of a shared social identity, and least
pronounced in the presence of visual channels and personal identities. Lea and
Spears (1991) on the other hand, argued that the absence of visual channels may
either lead to depersonalized perceptions of self and others or strengthen the
salience of social identities in which no shared identity exists from the outset. In
addition to its cognitive component, Spears et al., 2002 describes how the
absence or presence of individuating information enhances or diminishes
influence in intergroup interactions. The conditions of anonymity can increase a
low-power party’s strategic freedom and influence when the communication
environment obscures and shrouds their lack of power.
The research of Moore, Kurtzberg, Thompson and Morris (1999) shows that
quality is not negatively affected when negotiators share a common group
membership in their online conversations and when members of virtual teams
strongly identify with their team. Fiol (2005); Mortensen and Hinds (2001) also
indicated that the model has the advantage of channels having fixed impact on
communication. Both are built around the assumption that people’s behaviors in
non-face-to-face interactions are driven by the interaction between technological
and social cues that frame interpersonal relationships and shared social
identities; and that a positive connection or a shared group membership can help
to overcome the difficulties. It is generally accepted that no existing theory
encompasses all communication channels and so communication orientation
model is used to explain all the effects. Despite resolving certain empirical
contradictions, a theoretical gap however, is identified by not addressing the
www.udsspace.uds.edu.gh

46
evidence supporting the richness approach in visual channels, vocal channels, or
synchronicity to increase the ability to achieve high-quality outcomes.
2.9.3 The Communication Orientation Model
This model explains the main orientation with which people approach their
interaction that holds the key to theoretical and empirical parsimony, proposing
that sharing and integrating information is a critical process by which these
orientations interact with communication channels to affect negotiation and
group decision-making outcomes. Krauss and Fussell (1990) stressed that the
model formulated draws contributions on awareness of what the addressee does
and does not know. The assumption here is that information sharing, and
integration is critical for effective social interactions because it increases the
likelihood of comprehension, problem solving. De Dreu and Carnevale (2003);
De Dreu et al., (2008) opined that information sharing and integration are
strongly influenced by the orientation that people hold toward their negotiation
or group discussion partners. As a result of limited knowledge about their
counterpart’s interdependent decision making and social settings some
communicators adopt a cooperative approach whereas others have a less
cooperative approach while others are unsure of what approach to take.
The above model also stresses on the fact that a non-cooperative orientation
refers to where communicators strive to maximize only their own outcomes,
typically results in withholding information that could benefit others as well as
a reluctance to accept and trust information from others; hence quality is
compromised. Individuals often come to the bargaining table with a social value
www.udsspace.uds.edu.gh

47
orientation geared toward cooperation or noncooperation, and these social
motives influence the extent to which groups disseminate information and reach
settlements, especially when both negotiators share similar orientation.
According to Postmes, Haslam and Swaab (2005), communication orientations
are rooted in social categorization processes when people interact with others
who belong to similar social categories and understanding; hence high quality
of information.
There are also positive effects of communication channels for communicators
with unknown orientations and will look for information to determine what
orientation to embrace. The presence of non-semantic information such as head
nods, smiles, and brief verbalizations such as “yeah” and “m-hmmm” helps to
determine whether the other side is cooperative or not. This means also that the
presence of paraverbal and nonverbal cues such as tone of voice, facial
expression, and gesture allows communicators with unknown orientations to
learn more about the other side and potentially trust them enough to share and
integrate information. Again, the absence of communication channels can
decrease the ability to develop rapport and trust and thus reduce their tendency
to share and integrate information (Thompson and Nadler, 2002).
Similarly, there limited or no effect of communication channels for
cooperatively oriented communicators. They are more likely to value joint
welfare, share information about priorities and preferences, and interpret others’
actions as efforts to coordinate, which, in turn, increases the quality of their
interaction outcomes. As a result, the paucity of preverbal and nonverbal cues
www.udsspace.uds.edu.gh

48
presents when the partners cannot see or hear each other no longer poses a threat
to trust and rapport; the communication between the partners is still interpreted
with the best of intentions. McGinn and Keros (2002) demonstrated that people
have greater difficulty developing a shared logic of exchange and coordination
when they communicate through email but only when they interact with
strangers and not when they interact with others with whom they have strong
social ties. Similarly, online negotiations, according to Moore et al., (1999), are
less likely to result in an impasse when they take place between people who are
interpersonally acquainted or share common group membership
2.9.4 Homogeneous Platforms Communication Models
This model explains point-to-point parameters of traditional communication
performance model’s estimation for homogeneous platforms. There are two
ways to obtain a statistically reliable estimation of the Hockney model
parameters (Hockney, 1994):
To perform two series of roundtrips: with empty messages (to get the
latency parameter from the average execution time), and with non-
emptyones (to get the bandwidth).
To perform a series of roundtrips with messages of different sizes and use
results in a linear regression which fits the execution time into a linear
combination of the Hockney parameters and a message size.
Thakur, Rabenseifner, and Gropp (2005) used the Hockney model to estimate
the communication performance of different algorithms of collective operations.
For a particular collective operation, they suggested switching between
www.udsspace.uds.edu.gh

49
algorithms to choose the fastest one for each given message size and number of
processors. One application of communication performance models is the
optimisation of collective operations. The goal is to find the optimal algorithm
for each particular network configuration with respect to the prediction provided
by the communication performance model. The design of their algorithms of
collective operations is based on intra- and inter-cluster graphs of processors;
they switch between different shapes of graphs for different message sizes to get
the best prediction of execution time. All these approaches were applied to
homogeneous platforms. They considered a fixed set of commonly used
algorithms for each collective with a predetermined form of communication
trees. The heterogeneous communication performance models can provide
another approach to the model-based optimization: the building of optimal
communication trees by using the prediction of the execution time for each link.
Bhat, Prasanna, and Raghavendra (2003) and Hatta and Shibusawa (2000) used
a heterogeneous Hockney model to build the optimal communication trees for
broadcast and gather. They applied different heuristics based on the Hockney
prediction on either the whole or some of its parameters. The authors of these
works used the heterogeneous Hockney extension just for relative estimation of
the point-to-point communications but did not build models of collective
operations. To the best of the authors’ knowledge, there are no publications on
the modeling of collective operations on heterogeneous clusters.
www.udsspace.uds.edu.gh

50
2.9.5 Communication Performance Models for Heterogeneous Clusters
The model-based optimization can significantly improve the performance of
collective operations on both homogeneous and heterogeneous platforms
(Kielmann et al. 1999; Hatta and Shibusawa 2000; Bhat et al. 2003; Thakur et
al. 2005; Pjesivac-Grbovic et al., 2007). Heterogeneous computational clusters
with the principle programming system have become a popular platform for
parallel computing. Unfortunately, many applications that were originally
designed for homogeneous platforms do not demonstrate the same performance
on heterogeneous ones and require optimization. The optimization of parallel
applications is typically based on the performance models of heterogeneous
clusters, which are used for prediction of the execution time of different
configurations of the application, including its computation and communication
costs. The optimisation of communications, in collective operations, is an
important aspect of the optimisation of parallel applications.
There are two main approaches to modeling the performance of communication
operations on heterogeneous clusters. The first is to apply traditional
homogeneous communication performance models to heterogeneous clusters. In
this case, the parameters of the models are estimated for each pair of processors
and the average values for all pairs are then used in modeling. The second
approach is to use dedicated heterogeneous models, where different pairs of
heterogeneous processors are characterized by different parameters. These two
approaches are in use; heterogeneous communication models are more accurate
and outperform their homogeneous counterparts in the model-based
optimization of communication operations on heterogeneous clusters. At the
www.udsspace.uds.edu.gh

51
same time, the cost of the estimation can be significantly reduced if the
heterogeneous cluster can simultaneously execute several independent
communications involving non-overlapping sets of processors without
degradation of their performance. In this case, the parallel execution of the non-
overlapping communication experiments does not affect the experimental
results and can be used for acceleration of the estimation procedure.
2.9.6 Linear Model
The linear model views communication as a one-way or linear process in which
the speaker speaks and the listener listens. Laswell’s (1948) model as used in
Foulger (2004) was based on the five questions below, which effectively
describe how communication works.
Wood (2009) quoting from Shannon and Weaver’s (1949) model includes noise
or interference that distorts understanding between the speaker and the listener.
Figure 2.3 shows a linear model of communication:
Figure 2.3 : Linear Model on CommunicationSource: Adopted from Wood (2009).
www.udsspace.uds.edu.gh

52
2.9.7 Interactive Model
The main flaw in the linear model is that it depicts communication as a one-way
process where speakers only speak and never listen. It also implies that listeners
listen and never speak or send messages. Schramm (1955) in Wood (2009)
came out with a more interactive model that saw the receiver or listener
providing feedback to the sender or speaker. The speaker or sender of the
message also listens to the feedback given by the receiver or listener. Both the
speaker and the listener take turns to speak and listen to each other. Feedback is
given either verbally or non-verbally, or in both ways. This model also indicates
that the speaker and listener communicate better if they have common fields of
experience, or fields which overlap as in Figure 2.5
Figure 2.4 :Interactive Model 54Source: Adopted from Wood (2009).
2.9.8 Transactional Model
The main drawback in the interactive model is that it does not indicate that
communicators can both send and receive messages simultaneously. This model
also fails to show that communication is a dynamic process which changes over
time. The transactional model shows that the elements in communication are
www.udsspace.uds.edu.gh

53
interdependent. Each person in the communication act is both a speaker and a
listener and can be simultaneously sending and receiving messages.
There are three implications in the transactional model:
i. “Transactional” means that communication is an ongoing and
continuously changing process. You are changing, the people with whom
you are communicating are changing, and your environment is also
continually changing as well.
ii. In any transactional process, each element exists in relation to all the
other elements. There is this interdependence where there can be no
source without a receiver and no message without a source.
iii. Each person in the communication process reacts depending on factors
such as their background, prior experiences, attitudes, cultural beliefs
and self-esteem.
Figure 2.6 shows a transactional model of communication that takes into account
“noise” or interference in communication as well as the time factor. The outer
lines of the model indicate that communication happens within systems that both
communicators share (e.g., a common campus, hometown, and culture) or
personal systems (e.g., family, religion, friends, etc). It also takes into account
changes that happen in the communicators’ fields of personal and common
experiences. The model also labels each communicatoras both sender as well as
receiver simultaneously.
www.udsspace.uds.edu.gh
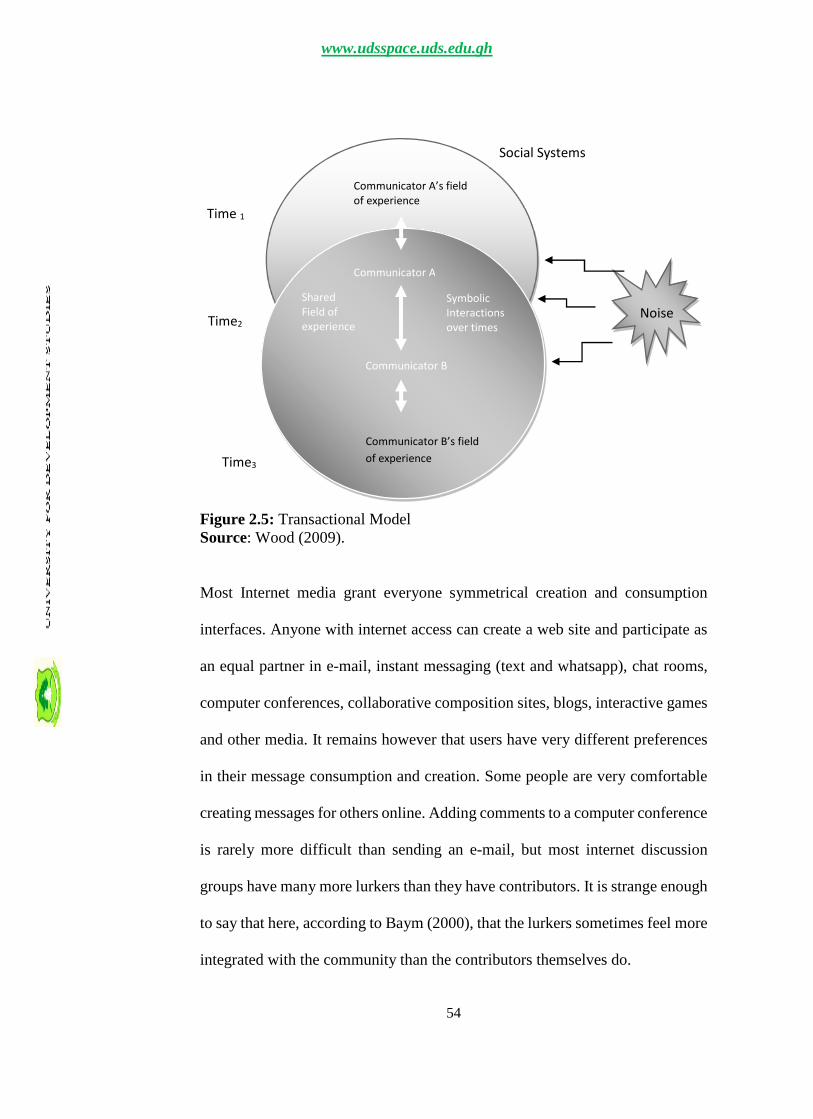
54
Figure 2.5: Transactional ModelSource: Wood (2009).
Most Internet media grant everyone symmetrical creation and consumption
interfaces. Anyone with internet access can create a web site and participate as
an equal partner in e-mail, instant messaging (text and whatsapp), chat rooms,
computer conferences, collaborative composition sites, blogs, interactive games
and other media. It remains however that users have very different preferences
in their message consumption and creation. Some people are very comfortable
creating messages for others online. Adding comments to a computer conference
is rarely more difficult than sending an e-mail, but most internet discussion
groups have many more lurkers than they have contributors. It is strange enough
to say that here, according to Baym (2000), that the lurkers sometimes feel more
integrated with the community than the contributors themselves do.
Communicator A’s fieldof experience
Communicator A
Communicator B’s field
of experience
SharedField ofexperience
SymbolicInteractionsover times
Communicator B
Time 1
Time2
Time3
Noise
Communicator A
Social Systems
www.udsspace.uds.edu.gh
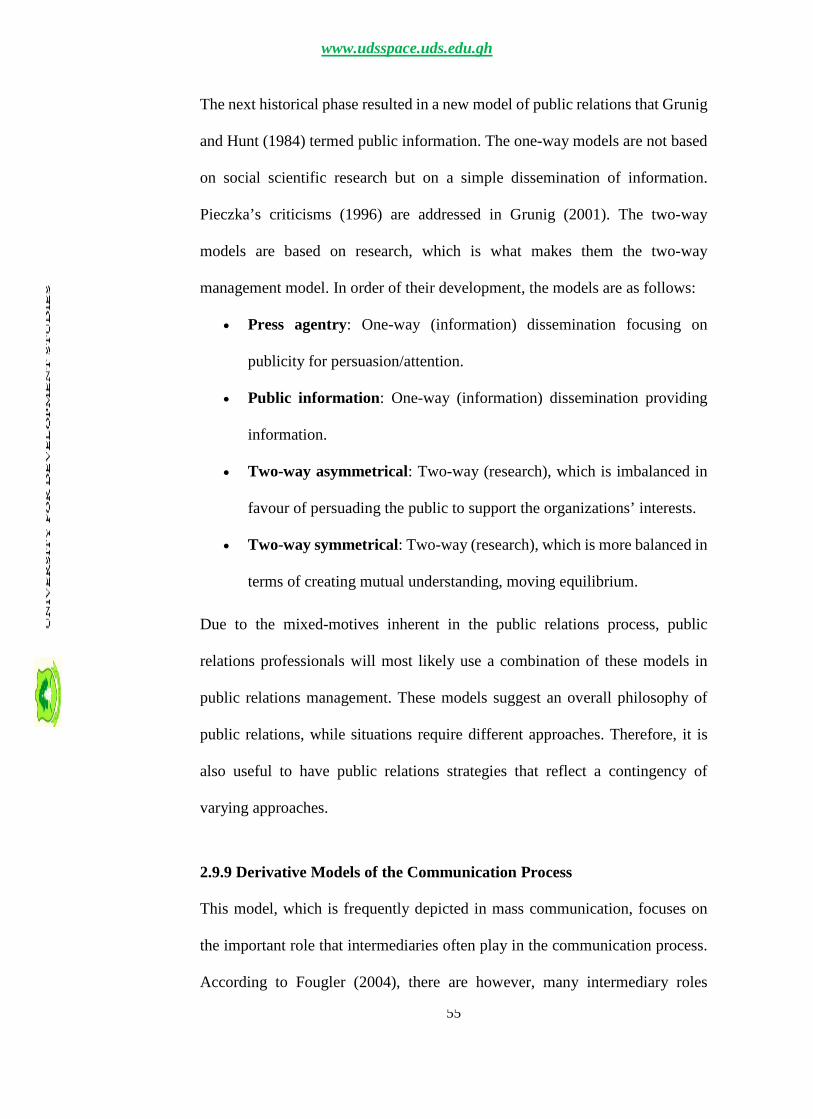
55
The next historical phase resulted in a new model of public relations that Grunig
and Hunt (1984) termed public information. The one-way models are not based
on social scientific research but on a simple dissemination of information.
Pieczka’s criticisms (1996) are addressed in Grunig (2001). The two-way
models are based on research, which is what makes them the two-way
management model. In order of their development, the models are as follows:
Press agentry: One-way (information) dissemination focusing on
publicity for persuasion/attention.
Public information: One-way (information) dissemination providing
information.
Two-way asymmetrical: Two-way (research), which is imbalanced in
favour of persuading the public to support the organizations’ interests.
Two-way symmetrical: Two-way (research), which is more balanced in
terms of creating mutual understanding, moving equilibrium.
Due to the mixed-motives inherent in the public relations process, public
relations professionals will most likely use a combination of these models in
public relations management. These models suggest an overall philosophy of
public relations, while situations require different approaches. Therefore, it is
also useful to have public relations strategies that reflect a contingency of
varying approaches.
2.9.9 Derivative Models of the Communication Process
This model, which is frequently depicted in mass communication, focuses on
the important role that intermediaries often play in the communication process.
According to Fougler (2004), there are however, many intermediary roles
www.udsspace.uds.edu.gh

56
associated with communication. Relating to this model, a postal delivery worker
for instance, who act as intermediaries have the ability to act as gatekeepers but
are generally restricted from doing so as a matter of ethics and/or law.
Figure 2.6: Derivative Model of CommunicationSource: Fougler (2004)
The network diagrams often presume, or at least allow bi-directional arrows
such that they are more consistent with the notion that communication is most
often bidirectional.
2.9.10 Ecological Model of Communication Process
The ecological model of communication, shown in Figure 2.8, attempts to
provide a platform on which these issues of communication can be explored. It
asserts that communication occurs in the intersection of four fundamental
constructs: communication between people (creators and consumers) is
mediated by messages which are created using language within media and
consumed from media and interpreted using language. This model is a more
detailed elaboration of Lasswell's (1948) used in Foulger (2013). It outlines the
study of communication on: "Who ... says what ... in which channel ... to whom
... with what effect". In the ecological model, the "who" are the creators of
messages, the "says what" are the messages, the "in which channel", is
elaborated into languages and media, "to whom" are the consumers of messages;
and the effects are found in various relationships between the primitives,
www.udsspace.uds.edu.gh
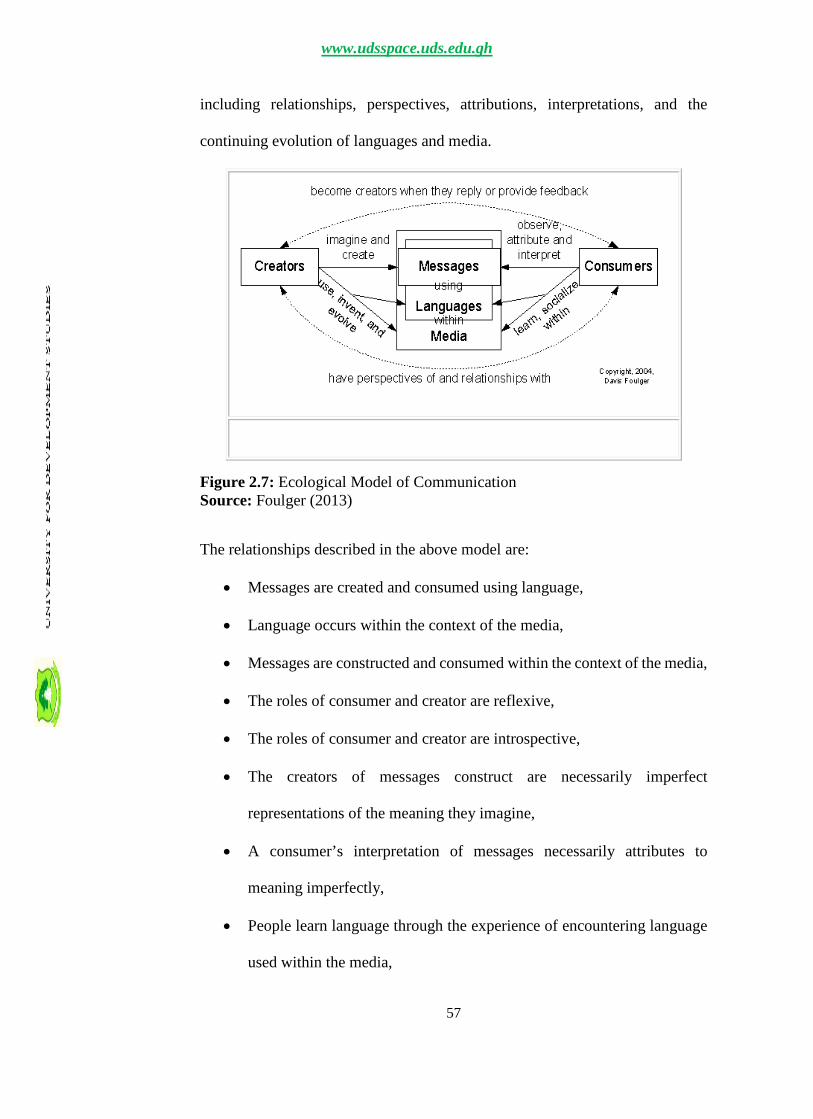
57
including relationships, perspectives, attributions, interpretations, and the
continuing evolution of languages and media.
Figure 2.7: Ecological Model of CommunicationSource: Foulger (2013)
The relationships described in the above model are:
Messages are created and consumed using language,
Language occurs within the context of the media,
Messages are constructed and consumed within the context of the media,
The roles of consumer and creator are reflexive,
The roles of consumer and creator are introspective,
The creators of messages construct are necessarily imperfect
representations of the meaning they imagine,
A consumer’s interpretation of messages necessarily attributes to
meaning imperfectly,
People learn language through the experience of encountering language
used within the media,
www.udsspace.uds.edu.gh

58
People learn the media by using media people they communicate with,
People invent and evolve around languages. While some behavior
expressions (a baby's cry) occur naturally and some aspects of language
structure may mirror the ways in which the brain structures ideas,
language does not occur naturally,
People invent and evolve around the media, while some of the modalities
and channels associated with communication are naturally occurring; the
media we use to communicate are not.
2.9.11 Berlor’s Model
Figure 2.8: Berlo’s ModelSource: Foulger (2004)
www.udsspace.uds.edu.gh

59
The significance of Belo’s Model includes
The idea of “source” was flexible enough to include oral, written,
electronic (the principle of redundancy) or any other kind of “symbolic”
generator-of-messages;
The “Message” was made the central element, stressing the transmission
of ideas;
The model recognized that receivers were important to communication,
for they were the targets;
The notions of “encoding” and “decoding” emphasised the problems we
all have (psycho-linguistically) in translating our own thoughts into
words or other symbols and in deciphering the words or symbols of
others into terms we ourselves can understand.
The Weaknesses in Berlo’s Model are that:
It tends to stress the manipulation of the message that is in the encoding
and decoding processes;
It implies that human communication is like machine communication,
like signal-sending in telephone, television, computer, and radar
systems;
The model seems to stress that most problems in human communication
can be solved by technical accuracy, which are choosing the “right”
symbols, preventing interference and sending efficient messages;
It is further argued that even with the “right” symbols, people
misunderstand each other. “Problems in “meaning” or “meaningfulness”
often aren’t a matter of comprehension, but of reaction, agreement,
www.udsspace.uds.edu.gh

60
shared concepts, beliefs, attitudes and values. To put the model in the
right perspective, we need a more meaning-centered theory of
communication.”
2.9.12 Dance’s Helical Spiral
Dance (1967) stated that: “At all times, the helix gives geometrical testimonyto the concept that communication while moving forward is at the samemoment coming back upon itself and being affected by its past behavior, forthe coming curve of the helix is fundamentally affected by the curve fromwhich it emerges. Yet, even though slowly, the helix can gradually free itselffrom its lower-level distortions. The communication process, like the helix,is constantly moving forward and yet is always to some degree dependentupon the past, which informs the present and the future. The helicalcommunication model offers a flexible communication process”.
The Strengths of this modal are:
Mortensen: “As a heuristic device, the helix is interesting not so much
for what it says as for what it permits to be said. Hence, it exemplifies a
point made earlier: It is important to approach models in a spirit of
speculation and intellectual play”;
Chapanis (1961) called “sophisticated play”;
The helix implies that communication is continuous, unrepeatable,
additive, and accumulative. That is, each phase of activity depends upon
present forces at work as they are defined by all that has occurred before.
All experience contributes to the shape of the unfolding moment; there
is no break in the action, no fixed beginning, no pure redundancy, no
closure.
The Weaknesses associated with this model are that:
www.udsspace.uds.edu.gh

61
It may not be a model at all and have too few variables;
Mortensen: It is believed that if judged against conventional
scientific standards, the helix does not fare well as a model. Indeed,
some would claim that it does not meet the requirements of a model
at all. More specifically, it is not a systematic or formalized mode of
representation. Neither does it formalise relationships or isolated key
variables. It describes in the abstract but does not explicitly explain
or make hypotheses testable;
It also generates questions and leaves much unanswered;
Mortensen: As case in point does not imply a false degree of
continuity if countless questions are raised here. The model brings
problems of abstraction into the open, artificial or unproductiveness.
Countless other questions could be raised with the model and that
brings problems of abstraction into the open.
2.9.13 Barnlund’s Transactional Model
It is perceived that by far the most systematic of the functional models is
Barnlund (1970) transactional approach as reported by Croft (2004). The most
striking feature is the absence of any simple directionality in the interplay
between self and the physical world. The spiral lines connect the functions of
encoding and decoding and give graphic representation to the continuous,
unrepeatable, and irreversible assumptions mentioned earlier. Moreover, the
directionality of the arrows seems deliberately to suggest that meaning is
actively assigned or attributed rather than simply passively received. Any one of
the three signs or cues may elicit a sense of meaning. Public cues derive from
www.udsspace.uds.edu.gh

62
the environment, are either natural, that is, part of the physical world, or artificial
and man-made. Private objects of orientation are a second set of cues. Examples
mentionedwere cues gained from sunglasses, earphones, or the sensory cues of
taste and touch. Both public and private cues may be verbal or nonverbal in
nature. What is critical is that they are outside the direct and deliberate control
of those interacting. The third set of cues is deliberate; they are the behavioral
and nonverbal cues that a person initiates and controls himself.
The strengths of the transactional model are that, the assumptions posit a view
of communication in which communicators attribute meaning to events in ways
that are dynamic, continuous, circular, unrepeatable, irreversible and complex.
The weaknesses on the other hand are that: it is assumed that communication
describes the evolution of meaning. In effect, the model presupposes that the
terms of communication and meaning are synonymous and interchangeable.
Nowhere does the model deal in even a rudimentary way with the difficult
problem of meaning. The inclusion of decoding and encoding may be taken as
only a rough approximation of the “evolution of meaning” but such dualistic
categories are not particularly useful in explaining the contingencies of meaning.
2.10 Organisational Communication
Communication helps organisations to strengthen employees to reach
organisational goals (Hindi et al., 2004). On the other hand, communication also
makes provision for sharing organisational values and beliefs among employees
(Klein, 2000). Information in an organisation should be transferred from an
www.udsspace.uds.edu.gh

63
executive person to another and from an employee to another. In the light of this,
Kalla (2003) indicated that when organisations become bigger and more
complex, organisational communication becomes harder and the necessity of
quality increases. Bovee and Thill (2003) defined organisational communication
as exchanging knowledge and opinions in the organisation, and Argenti and
Forman (2002) defined it as the process of creating a positive atmosphere for all
employees in organisation. These definitions make organisational
communication a wider dimensional concept rather than information traffic
perse.
Hartley (2008) also defined organisational communication as transmitting news
about the work from organisation to employees and through employees. Chen
and Hung (2006) opined that it is a social process that provides contact and
information exchange between both departments and units of the organization.
For the purpose of operation, administrative communication is an important
dimension of organisational communication. It is regarded as the horizontal or
vertical information exchange that transfers meaning through official and non-
official channels to achieve the organisation’s objectives. Daniels (2010) holds
that the process of communication at work place involves combining some
functions to create and build together all types of relations among people,
organisations and societies. When communication process is done effectively,
employees will understand their roles and functions and the objective of
organisation will be well understood. In his contribution, Ali and Warne (2002)
stressed that organisational communication enable us to provide support in areas
like making team work possible, supporting decision process and eliminating
www.udsspace.uds.edu.gh

64
the barriers among departments. Management can deliver information about the
organisation via channels such as control group meetings, issuing of brochure
and newsletters, mission declaration (Bird, 2002) and he use of company web
site (Ng et al., 2006).
The efficiency of every organisation is dependent on effective communication
and its management (Klein, 2000). Recent studies on communication showed
that, communication has positive correlation with many organisational outputs
like: organisational commitment, job performance, organisational citizenship
behaviours and job satisfaction. In contrast, communication failure may cause
functionless results like stress, job dissatisfaction, low trust, decrease in
organisational commitment, severance intention; and absence of these could
affect organisational efficiency negatively (Zhang and Agarwal, 2009). Thus,
commitment of the person who works in a good working condition could give
rise in job satisfaction and this contribute to the increase in organisational
success (Tosun, 2009). Effective communication in organisations can simplify
successful organisation operation. In other organisational communication
recruitment suggestions, Champoux (1996) opined that message sent by
resource persons should be short, clear, plain and understandable with noise
should be reduced as much as possible during communication and technologic
developments.
Cheney et al., (2004) opined that organisational communication as an academic
discipline, embraces the study of symbols, messages, media, interactions,
relationships, networks, persuasive campaigns and broader discourses within an
www.udsspace.uds.edu.gh

65
organisation; be it a corporation, governmental agency, religious institution,
social movement and the like. In international circles, organisational
communication is a flourishing field of research. Its breadth and diversity makes
it impossible to review as a whole (Johns, 2001). Organizational communication
traditionally employed dividing lines between internal/external and
formal/informal communication (Johansson 2003). Hindi et al (2004) argued
that, organisational communication researchers study internal formal
communication, while public relations researchers study external formal
communication. Research focusing on informal communication is still largely
non-existent.
According to McGrath (2005) public relations developed their own specialised
journals, professional and scholarly associations, publishers, and network of
collaborative relationships. Cheney and Christensen (2001) are certain that both
arenas are to blame for lack of information, interaction, networking, and cross-
fertilization of ideas. The theory on organisational communication evolved from
the concept as a tool of management, designed to facilitate task completion and
as such was to operate as one of many organisational variables (Shelby, 2001).
As a tool for management, communication is the central means by which
individual activity is coordinated and pursued the organisational goals (Gardner
et al, 2001). Secondly, most communication departments are responsible for
both internal and external communication, and practitioners work with
communication in its entirety. Concepts like “total communication” and
“integrated communication” surface in the popular literature (Gallois et al,
2004). There is growing awareness that activities of internal organisational
www.udsspace.uds.edu.gh

66
communication, often managed by managers, are important to public relations
practitioners and scholars (Cheney and Christensen, 2001). In agreement with
Foulger (2004), it is proposed that researchers in organisational communication
and public relations regime cooperation for performance. In a case of Hindi et
al (2004) communication between departmental managers and employees in
meetings, managers were caught in information and communication roles but
were not practicable. Instead, leadership in this organisation permeated with the
transmission view of communication. One other conclusion made by Hindi was
that conversations were the most important medium to people’s potential to learn
(Henry, 2002). All mediation via technical and digital media involves
information losses, which in turn affects the receivers’ possibilities to interpret
and understand the senders’ intentions – and to convert information into
knowledge. Winsor (2000) focused on communication in project teams,
particularly how different ideas and notions were expressed, confronted and
developed.
Busco (2001) also studied sense making in management control processes and
the results showed that sense making processes integrates written documents,
verbal communication and actions. It means that when co-workers interpret texts
and documents, new conditions for action were created. Thus, management
control is an ongoing process, where sense making is both an important element
and a basis for meaningful actions. Callan and Paulsen (2004) employed a
critical approach to communication during a meeting on reorganization to
enhance understanding of power, dominance of subordinate and multiple
interpretations. The resulting interpretations disclosed how communication both
www.udsspace.uds.edu.gh

67
functions as manifestation and source of common meanings and understandings
of reality, power relations and communicative disorders.
2.10.1 Effectiveness of Organisational Communication
Mehralizadeh et al., (2008) developed a theoretical framework enumerating five
factors directly affecting effectiveness of organisational communication to
include: organisational structure, technology, the surrounding environment,
personal character of employees and channels, procedures and methods of
feedback. This frame work is detailed in figure 2.10
Figure 2.9: Communication EffectivenessSource: Mehralizadeh, Shahi and Sharify (2008)
Effectiveness oforganisational
communication
Channels,
procedures and
methods of feedbackEnvironment Personal
characteristics of
employees
Organisational
structure
{
Technology
Formalisation
www.udsspace.uds.edu.gh

68
The theoretical framework developed appears as a social system in an
Educational Institution, analysising the performance of the educational system
to solving problems. Hindi (2004) on the other hand indicated that organisations
coordinate the members’ activities and incorporate them with organisational
goals. Mutual communications between subordinates and superiors also makes
them more acquainted with each other and that could result in effective
cooperation in any organisation. In their contribution, Gizir and Simsek, (2005)
agreed that the last perspective is the system-interaction unlike the interpretive-
symbolic perspective, concentrates on external behaviour as the fundamental
units of analysis.
Luft (2000) also pointed out that the perceived quality of information
communicated within organisations is significantly linked to organizational
performance and employees of organisations. Organic organisations are opened,
with a free flow of information throughout the organisations and their
operational styles vary freely, with decisions-making based on expertise of the
individual. McCollough et al (2004) emphasized that such organisations could
have loose informal control with emphasis on a norm of cooperation. McShane
and Von Glinow (2003) stated that organizations have a mechanism by which
they divide and distribute tasks throughout. A decentralized organisational
structure transfers authority and control for decision making from management
throughout the organisation to many more members of the organisation (Luft,
2000; Kelly, 1999 and Robbins, 2000). It is important to realize the close
relationship between the concept of vertical complexity and the span of control
and organisational size (Zorn 2002).
www.udsspace.uds.edu.gh

69
Technology in the above framework refers to how an organisations inputs into
output or shortly, because how jobs get accomplished (Robbins, 2000). Forms
of organisations are possible and are now emerging; with explanation for the
inconsistency of the empirical evidence and the impact of IT on organisation.
As Omolayole (2002) indicated, nondeterministic IT creates options for
organisations, and the organisational choice among those options creates the
variation in observed outcomes. To make matters more complicated, the same
technology could lead to different results depending on the characteristics of the
organisation and the characteristics of the processes employing the technology
within the organisation (Omolayole, 2002). It is clear from the above literature
framework that though the explanations on effective communication may not be
conclusive, the theory offers ideas in communication policy direction for
consideration by organisations.
2.10.2 Communication Process
Communication from the foregoing is a complex process to every individual,
any human endeavor or institution. From the author’s view point on the adopted
personal communicating model it fits a decentralized organisation where many
channels of information flow are utilised, allowing for more open communication
between individuals and group members. Even though the model is more
conducive to solving complex problems, it could easily lose sight of the
organisation's common mission. Most information sources act as both sources
and destinations. Transmitters, receivers, channels, signals and even messages
have multiple signals, transmitted and received, when they are converted into a
common signal stream and a common channel. It remains, however, that there
www.udsspace.uds.edu.gh
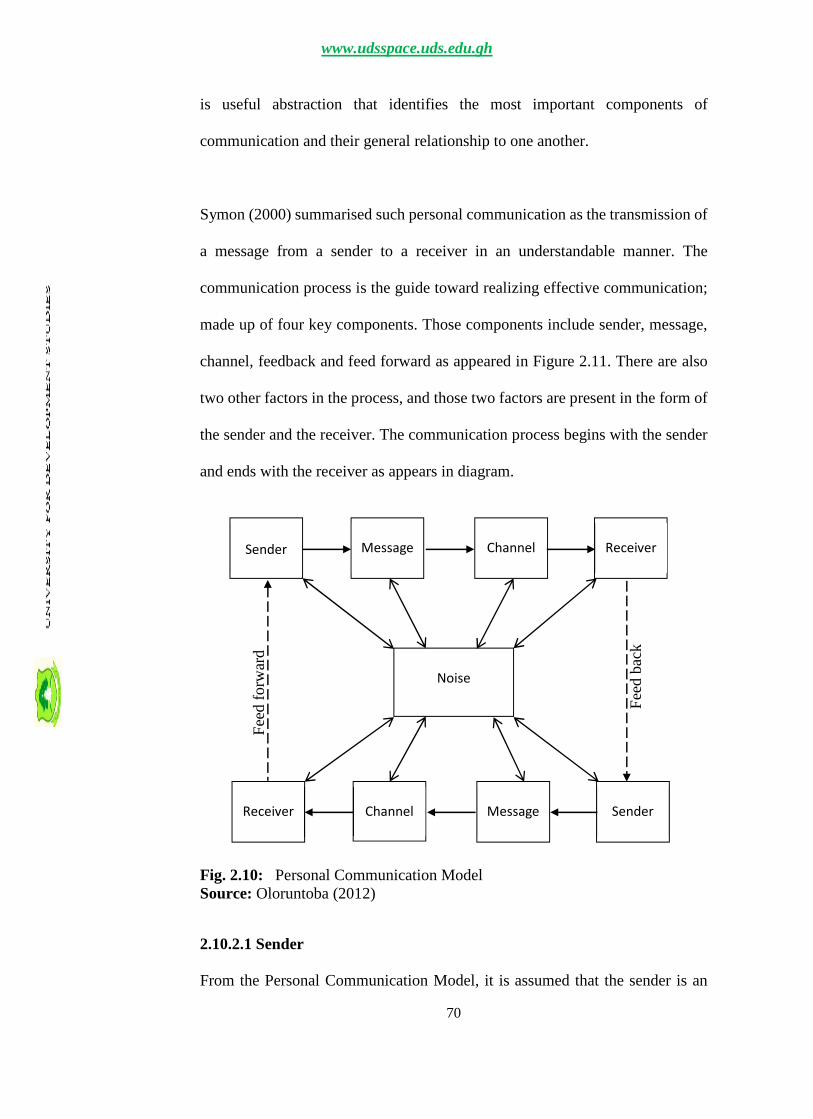
70
is useful abstraction that identifies the most important components of
communication and their general relationship to one another.
Symon (2000) summarised such personal communication as the transmission of
a message from a sender to a receiver in an understandable manner. The
communication process is the guide toward realizing effective communication;
made up of four key components. Those components include sender, message,
channel, feedback and feed forward as appeared in Figure 2.11. There are also
two other factors in the process, and those two factors are present in the form of
the sender and the receiver. The communication process begins with the sender
and ends with the receiver as appears in diagram.
Fig. 2.10: Personal Communication ModelSource: Oloruntoba (2012)
2.10.2.1 Sender
From the Personal Communication Model, it is assumed that the sender is an
Fee
dba
ck
Fee
dfo
rwar
d
Sender Message Channel Receiver
Noise
Receiver Channel Message Sender
www.udsspace.uds.edu.gh
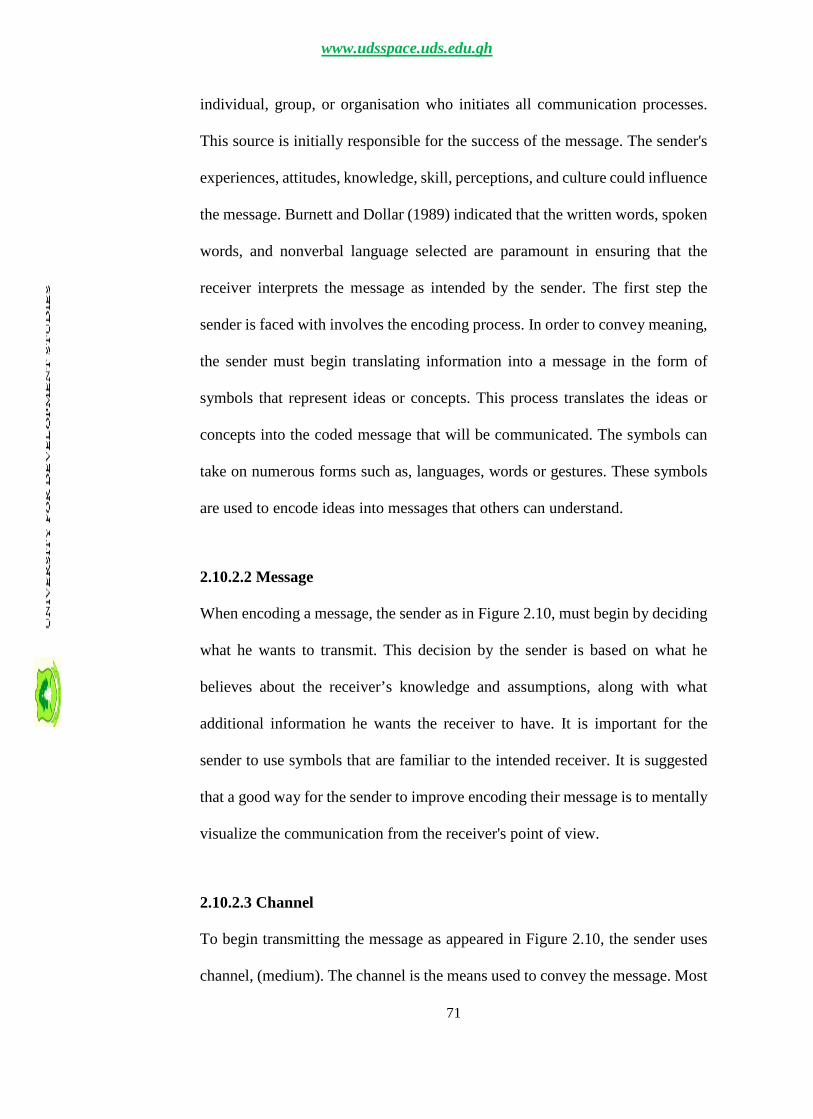
71
individual, group, or organisation who initiates all communication processes.
This source is initially responsible for the success of the message. The sender's
experiences, attitudes, knowledge, skill, perceptions, and culture could influence
the message. Burnett and Dollar (1989) indicated that the written words, spoken
words, and nonverbal language selected are paramount in ensuring that the
receiver interprets the message as intended by the sender. The first step the
sender is faced with involves the encoding process. In order to convey meaning,
the sender must begin translating information into a message in the form of
symbols that represent ideas or concepts. This process translates the ideas or
concepts into the coded message that will be communicated. The symbols can
take on numerous forms such as, languages, words or gestures. These symbols
are used to encode ideas into messages that others can understand.
2.10.2.2 Message
When encoding a message, the sender as in Figure 2.10, must begin by deciding
what he wants to transmit. This decision by the sender is based on what he
believes about the receiver’s knowledge and assumptions, along with what
additional information he wants the receiver to have. It is important for the
sender to use symbols that are familiar to the intended receiver. It is suggested
that a good way for the sender to improve encoding their message is to mentally
visualize the communication from the receiver's point of view.
2.10.2.3 Channel
To begin transmitting the message as appeared in Figure 2.10, the sender uses
channel, (medium). The channel is the means used to convey the message. Most
www.udsspace.uds.edu.gh

72
channels are either oral or written, but currently visual channels are becoming
more common as technology expands. Common channels include the telephone
and a variety of written forms such as memos, letters, and reports. The
effectiveness of the various channels fluctuates depending on the characteristics
of the communication. For example, when immediate feedback is necessary, oral
communication channels are more effective because any uncertainties can be
cleared up on the spot. In a situation where the message must be delivered to
more than a small group of people, written channels are often more effective.
Although in many cases, both oral and written channels should be used because
one supplements the other. If a sender relays a message through an inappropriate
channel, its message may not reach the right receivers. That is why senders need
to keep in mind that selecting the appropriate channel will greatly assist in the
effectiveness of the receiver's understanding. The sender's decision to utilize
either an oral or a written channel for communicating a message is influenced
by several factors. The sender should ask different questions, so that they can
select the appropriate channel. (Is the message urgent? Is immediate feedback
needed? Is documentation or a permanent record required? Is the content
complicated, controversial, or private?) Is the message going to someone inside
or outside the organization. What oral and written communication skills does
the receiver possess? Once the sender has answered all of these questions, they
will be able to choose an effective channel.
2.10.2.4 Receiver
After the appropriate channel or channels are selected as shown in Figure 2.10,
the message enters the decoding stage of the communication process. Decoding
www.udsspace.uds.edu.gh
73
is conducted by the receiver. Once the message is received and examined, the
stimulus is sent to the brain for interpreting, to assign some type of meaning to
it. It is this processing stage that constitutes decoding. The receiver begins to
interpret the symbols sent by the sender, translating the message to their own set
of experiences to make the symbols meaningful. Successful communication
takes place when the receiver correctly interprets the sender's message. The
receiver is the individual or individuals to whom the message is directed. The
extent to which this person comprehends the message will depend on several
factors, which include the following: how much the individual or individuals
know the subject, their receptivity to the message, and the relationship and trust
that exists between sender and receiver. All interpretations by the receiver are
influenced by their experiences, attitudes, knowledge, skills, perceptions, and
culture. It is similar to the sender's relationship with encoding.
2.10.2.5 Feedback
According to Gibson and Hanna (1992), “communication must be a dialogue,
not a monologue.” The next stage is the feedback, is a term from cybernetics,
the study of messages. It refers to an inquiry, response to experiment. Feedback
as appeared in Figure 2.10 can be positive (when the required result is achieved)
or negative; instantaneous (when the response is immediate) or delayed.
Feedback is used to gauge the effectiveness of a message put forth, or a situation
that has taken place. There are two kinds of feedback: action feedback and
person feedback. The first can normally be seen with a great amount of ease and
is simply watching the other person’s actions to judge whether or not you were
understood. A case in point of this was in the military, a simple order of “send
www.udsspace.uds.edu.gh

74
reinforcements we are going to attack” was misheard and interpreted as “send
three or four pence, we are going to a dance”; as can imagine, this had disastrous
consequences. Feedback is the final link in the chain of the communication
process. After receiving a message, the receiver responds in some way and
signals that response to the sender. The signal may take the form of a spoken
comment, a long sigh, a written message, a smile, or some other action. Bovee
and Thill (2003) have stated that even a lack of response, is in a sense, a form of
response. Without feedback however, the sender cannot confirm that the
receiver has interpreted the message correctly.
Feedback is therefore a key component in the communication process (as in the
diagram) because it allows the sender to evaluate the effectiveness of the
message. Feedback ultimately provides an opportunity for the sender to take
corrective action to clarify a misunderstood message. Feedback, according to
Bovee and Thill (2003) plays an important role by indicating significant
communication barriers: differences in background, different interpretations of
words, and differing emotional reactions.
2.10.2.6 Feed forward
Even though feedback is the final link in the chain of the communication
process, as in Figure 2.10, a similar link; feed forward, allows the receiving to
further respond, possibly the second time as a way of emphasising information
from the feedback. Just like feedback, feed forward is a component in the
communication process because it allows further push and evaluation to stress
on the importance of the message. For senior executives the main concern is to
www.udsspace.uds.edu.gh

75
ensure their exposure to relevant streams of feedback from all parts of the
organization. Clearly, Gibson and Hanna (1992) noted that those at the Centre
of the organisation are not able to absorb all the incoming information in details.
However, subject to appropriate filtering, their exposure to a diversity of
feedback can enable senior executives to make important connections,
informing their strategic decision-making. The communication process is the
perfect guide toward achieving effective communication, and when followed
properly, the process can ensure that the sender's message will be understood by
the receiver. Although the communication process seems simple, it is not.
Certain barriers present themselves throughout the process. Those barriers are
factors that have a negative impact on the communication process. Some
common barriers include the use of an inappropriate medium (channel),
incorrect grammar, inflammatory words, words that conflict with body
language, and technical jargon.
2.10.2.7 Noise
Noise essentially is anything that distorts a message by interfering with the
communication process. Noise can take many forms, including a radio playing
in the background, another person trying to enter your conversation, sending
barriers, encoding barriers, transmission barriers, decoding barriers, response
barriers and receiving barriers and any other distractions that prevent the
receiver from paying attention. Noise as appeared in Figure 2.11, is a barrier to
the communication process. Noise can occur during any stage of the
communication process. When information is transferred from the transmitter to
the receiver, not all of the information may be received by the receiver because
www.udsspace.uds.edu.gh

76
of holes called noise. Each of the noise may be affected by the amount of
information transferred. Just as in a leaky bucket, more holes decrease the
amount of water, more noise also decreases the amount of correct information
received. Encoding a notion may be a simple case of putting an idea into words
but there may also be language barriers or a simple ineffectiveness in using
language. Can the message be made in simpler language or does it have to be in
complicated terms; between the sender, the message and receiver, noise could
get in the way and complicate the process. A noiseless communication however,
may not exist. Physical noise, for example, is static or psychological, that is
when culture, taboos or values come into play to disrupt the normal transmission
process of communication. Misunderstanding of a message that is distortion of
meaning is a form of noise, example, in a Chinese game, Whisper to a person
starts off with a particular message, and then the original message is distorted
by the time it comes to the final player.
Successful and effective communication within an organisation stems from the
implementation of a well-developed communication process. All members
within an organisation will improve their communication skills if they follow
the communication process and stay away from the different barriers. It has been
proven that individuals that understand the communication process will blossom
into more effective communicators, and effective communicators have a greater
opportunity to becoming successful.
www.udsspace.uds.edu.gh
77
2.10.3 Concept of Job Performance
Administrative performance could mean both behaviour and result which
improve the productivity of the organisation. According to Armstrong (2004),
behaviour emanates from the performer and transforms performance from
abstraction to action. Administrative performance is the outcome of work that
one thinks the society and the organisation expect. It is an important factor that
contributes to improve the outcomes, behaviour and traits of employees in
organisation. A more comprehensive view of performance is achieved if it is
defined as embracing both behaviour and outcomes (Armstrong, 2004). There
are theoretical explanations or arguments in respect of effects of leadership style,
organisation structure, organisational culture and performance evaluation on
perceived administrative performance (Lawson, 2000). According to Behn
(2003), measures that are not directly connected to improving performance are
measures that are means to achieving that ultimate purpose of the organisation.
In the light of the above, Behn (2003) gives eight reasons for adopting
performance measurements as:
To evaluate how well a public agency is performing.
To control how managers can ensure their subordinates are doing the
right thing.
To budget for tools in improving performance.
To Motivate, giving people significant goals to achieve and then use
performance measures- including interim targets.
To celebrate, organisations need to commemorate their
accomplishments- such ritual tie their people together, give them a sense
of their individual and collective relevance. Moreover, by achieving
www.udsspace.uds.edu.gh
78
specific goals, people gain sense of personal accomplishment and self-
worth (Landy, 2003).
To promote how public managers can convince political superiors,
legislators, stakeholders, journalists, and citizens that their agency is
doing a good job.
To learn, learning is involved with some process, of analysis information
provided from evaluating corporate performance (identifying what
works and what does not).
To improve what exactly people or organisations should do, what should
be done differently to improve performance.
Apart from the above action to adopting performance measurements, a
Performance Reference Model (2005) was developed to assist in standards of
measure in performance. An employee development programme is based on the
premise that people need to be physically fit and mentally focused and energized
if they are to give high performance. This programme included guidance in
fitness, nutrition and self-awareness (Chan, 2004). In larger international
organisations, presentations as part of performance were often relayed
electronically, either as video recording or as ‘live’ webcasts, in order to reach
staff located around the world (Collier 1998, Chan 2004).
2.10.3.1 Job Demands-Resources (JD-R) Model
The core assumption of the JD-R model is that every occupation has its own job
characteristics, but nevertheless these characteristics can be categorized in two
general overarching categories, namely, job demands and job resources (Bakker
www.udsspace.uds.edu.gh

79
and Demerouti, 2007). Job demands are associated with psychological and/or
physical costs which include work pressure, emotionally demanding interactions
with colleagues or client, and an unfavorable physical environment. According
to Demerouti et al., (2001a), job resources reduce the impact of job demands and
the associated costs which are functional in achieving work goals that stimulate
growth, learning and development. In short, demands are related to stress, and
resources have motivational potential.
The JD-R model as supported by Metzer et al (2007), states that two different
processes play a role in the development of motivation and job strain. In the
motivational process, job resources like opportunities for development,
autonomy and social support satisfy employees’ basic needs, including the need
for autonomy and the need to belong. Therefore, resources lead to high employee
engagement and optimal organisational performance. Schaufeli et al (2009) in
contrast, indicated that job demands that are too high or have a chronic character
that may exhaust employees leading to a depletion of energy and accompanying
health problems, including job burnout. Job demands, and resources also interact
with each other and produce combined effects. Specifically, the JD-R model
according to Bakker and Baker, (2005) and Xanthopoulou et al., (2006), job
resources may buffer the impact of job demands on strain.
2.10.3.2 Determinants of Job Performance
Johnson et al (2008) detailed a more complete model of performance
determinants quoting Campbell et al. (2004) and Motowidlo et al. (1997) models
as good general models of performance prediction. Deficiency in the process by
www.udsspace.uds.edu.gh

80
whichspecific individual differences influence performance on specific
dimensions were pointed out by Johnson (2004), whostressed that motivation
was given inadequate attention by those models and proposed anexpanded
model of how individual differences influence job performance.
Mitchell and Daniels (2003) also identified two components of motivation:
proactive cognitive processes, and on-line cognitive processes. Control theory,
action theory, and self-regulation were on-line theories of motivation (Mitchell
and Daniels, 2003). Johnson (2003) added psychological motives as a third
component of motivation. A motive is a reason (value, interest, preference, and
attitude) for choosing to exert effort in a particular direction. Brett and
VandeWalle (1999) motive-based theories recognise that people may have very
different purposes for exhibiting the same behavior.Job attitudes therefore tend
to be more strongly related to citizenship performance than personality variables
(Podsakoff et al., 2000); leading to Ryan and Deci, 2000) to conclude that the
relationship between personality and citizenship performance is probably
mediated by attitudes such as job satisfaction, organisational commitment, and
fairness perceptions. Gade (2003) on the other hand opined that, organisational
commitment is an important motive for the military context, its components
have been shown to predict various types of job-related behaviors (Gade, Tiggle
and Schumm, 2003; Karrasch, 2003).
Johnson’s (2003) general model of the pathways by which individual differences
in predictor variables influence performance on a given dimension is presented
in Figure 2.12. Campbell (2004) also suggested that the determinants of
www.udsspace.uds.edu.gh

81
performance components should be based on individual differences on function
of three main areas: declarative knowledge, procedural knowledge and skill, and
motivation. Consistent with Campbell et al. (1993), performance is a function of
knowledge, skill, and motivation. The model could be expanded to include other
classes of individual organisation, indirect performance determinants and also
recognise the numerous potential moderators that can influence the extent to
which individual differences predict performance.
Figure 2.11 Determinants of Job PerformanceSource: Johnson (2003)
The model describes the potential paths through which different classes of
variables may operate to influence different levels of performance. The relative
strength of each path from one construct to another depends on the specific
Knowledge
Ability
Variable
Personality
Variable
Skill
MotiveProactive
Processes
Online
Processes
Performance
Competent
Work
Habits
Moderating
Variables
www.udsspace.uds.edu.gh

82
predictor variables included in the model and the specific performance
dimension that is the criterion. For example, if achievement were used to predict
the demonstrating effort dimension of citizenship performance, the strongest
path would go through motivation (because motivation is highly relevant to
demonstrating effort, and achievement is highly relevant to each component of
motivation). If sociability were used to predict the maintenance of good working
relationship dimension of citizenship performance, the stronger paths were
likely to go through knowledge and skill.
2.10.3.3 Model on Administrative Performance presented in Figure 2.13.
Figure 2.12: Administrative Performance ModelSource: Author’s Typology Field Work (2012)
Administrative performance (jp), as in Figure 2.12, shows a function of effective
communication (ec), opportunity on channels of communication available (occ),
the sender/receivers of message observed (srm) and the willingness to act upon
the message (wa). The concept above can be represented in a mathematical
Willingness to act
upon message being
delivered
Sender/Receiver
of the message
being observed
Effective
Communication
Administrative Performance
Opportunity for
various channels of
communication
www.udsspace.uds.edu.gh

83
equation as: jp = f (ec, occ, srm, wa). Paradoxically, the above shows a clear link
between Administrative Performance and Effective Communication.
The model concept means that the factors indicated above affect performance
and that is determined by the degree at which each component is affected in the
communication process. For instance, the more efforts people in the
communication process put in, the better the performance. Similarly, if one of
the components of the above concept is missing, performance is likely to be
poor.
Vigoda (2003) also indicated that the search for higher performance in public
administrative systems draws on a continuous exploration of measurable output
and outcome indicators. This doctrine as implemented in the public sector
implies that if you can’t measure a public output/outcome, it probably isn’t
worth considering. Many performance indicators (PIs) have been developed to
evaluate administrative performance (Berman 2000; Nyhan 1995). Nonetheless,
two of the most commonly used perceptual measures are (1) attitudes towards
the general responsiveness of governments and public administration and, (2)
detailed evaluations of citizens’ satisfaction with governmental services.
Responsiveness to citizens as clients may be regarded as the Holy Grail of
modern public administration. A responsive bureaucracy delivers services and
goods to its destinations with optimal speed and accuracy (Chi 1999; Vigoda
2000). Thomas and Palfrey (1996) argued that responsiveness attests to the
speed and accuracy with which a service provider replies to a request for action
or for information. Speed can refer to the waiting time between citizens’ request
for action and the reply of the public agency. Accuracy means the extent to
www.udsspace.uds.edu.gh

84
which the provider’s response is appropriate to the needs or wishes of the service
user (Rourke 1992; Stewart and Ranson 1994).
Beyond the idea of measuring the general responsiveness of public agencies
there is also a need to evaluate in greater detail the satisfaction from services
received. Administrative performance means a comprehensive, distinctive,
reliable and continuous managerial quality, administrative performance and trust
in governance assessment of citizens’ satisfaction from governmental operation
in various fields. In recent decades, satisfaction measures have become prevalent
in state and federal agencies. They were largely prompted by the client canon
and by the vision of ‘putting citizens first’ (Caiden and Caiden 2002). Hence,
public administration encourages the use of satisfaction measures as part of
performance evaluations both inside public agencies and around them (Poister
and Henry 1994; Swindell and Kelly 2000). It should also be noted that this
strategy has been adopted despite some limitations and criticism it needs to
address (Stipak, 1979, 1980).
From the foregoing literature, many variables including trust, transparency and
accountability, could result in performance. Similarly, effective communication
could result in administrative performance. This model is shown in Figure 2.13
www.udsspace.uds.edu.gh

85
Figure 2.13: Administrative PerformanceSource: Anther’s Field Work, 2012
This model follows a typology adopted by Citrin and Muste (1999) and Ruscio
(1997). It represents the thesis that effective communication is a precondition
for the emergence of better performance. From the above, effective
communication leads to performance with government and University
administration for instance, mediates the relationship between a set of variables
representing quality of performance and stakeholder’s satisfaction (including
staff).
2.10.4 Group cohesion
Group cohesion could be regarded as the degree to which a number of people
constantly support each other in a given work environment for the achievement
of a common goal. Yoo and Alavi (2001) found that in established groups, group
cohesion had a larger influence than communication media for measures of task
participation and social presence. Furthermore, they found that group cohesion
influenced how group members perceived communication media in established
Human Quality (HQ)
Transparency and
Accountability (TA)
Morality and Ethics (IC)
Innovation and Creativity
(IC)
Effective
Communication
Responsiveness
(RS)
Staff
Satisfaction
(ST)
www.udsspace.uds.edu.gh

86
organisations. Yoo and Alavi (2001) again argued that group cohesion can
sometimes help to improve the richness of lean media. Cohesiveness is an
important component of every groups, and it contributes to the overall
effectiveness of the goals of the group. An effective way for a leader to increase
the cohesiveness of their group is to become competent in nonverbal
communication. Also, nonverbal competence is important to interaction within
the group in order to correct inadvertent messages, and if possible, to eliminate
them (Daniels 2002). Further, those groups that are cohesive tend to be happier
and more productive (Engleberg and Wynn, 2003). According to Kolb, Jin, and
Song (2008), most teamwork training effectively covers relationship
management, yet not much attention is directed toward communication and
conflict.
McBride (2006) writes that the more cohesive the group, the happier and more
productive the group is. When leading a small group, it is important to
understand the appropriate times to use nonverbal competence to avoiding
misunderstandings which pays a high reward by enhancing our self-esteem and
gaining the esteem of others (Caputo, Hazel, McMahon, and Dannels, 2002).
Engleberg and Wynn (2003) stated that when analyzing the effectiveness of a
group, it is important to consider that increased productivity and increased
cohesiveness have a reciprocal relationship in the group functionality. From
casual peer chatting to formal meetings, regular group discussions, and
presentations, small group interactions are governed by complex conscious and
subconscious rules (Gatica-Perez, 2009). In addition to the above, Kolb, Jin, and
Song (2008), indicated that organisations benefit greatly from effective
www.udsspace.uds.edu.gh

87
teamwork, unfortunately, (despite possessing the necessary members, tools, and
resources) not all groups today have successful outcomes. However, effective
ways to improve worker performance are sought more and more today, and
group performance is one of the most important focal points (Robertson and
Huang, 2005). Numerous scholars have studied the value and properties of group
effectiveness and such studies have shown that the abilities of the leaders are
important in terms of group effectiveness (Kolb, Jin and Song, 2008).
Nevertheless, close and collaborative relationships with customers may be an
important factor in influencing cohesion and performance (Riggio, 2006),
market performance (Swink and Song, 2007) and innovation (Koufteros et al.,
2007). Stokes (1993) indicated that because of its strategic nature, supplier
integration can be characterized by the collaborative and long-term relationship
between buyer and supplier involving high levels of trust, commitment and
information sharing; which could be no different from group cohesion.
2.10.5 Directions of Communication
According to Luneburg and Ornstein (2008), the structure of an organisation
should provide for communication in three distinct directions: downward,
upward, and horizontal. These three directions establish the framework within
which communication in an organisation takes place. These communication
directional flows are depicted in Figure 2.14, a typology of what was developed
by Engleberg and Wynn, (2003). Building on Engleberg and his colleague’s
work makes clear a fourth direction of communication – diagonal
communication (as appeared) ‘a’ to ‘b’ and the vice versa in figure…). Here, a
www.udsspace.uds.edu.gh

88
superior at ‘b’ who requires information from a subordinate in a different
department ‘a’, may walk there directly for it; instead of going through a
colleague on the same level at the top (in ‘c’, ‘d’ or ‘e’). This approach is in
collecting information could be faster, quicker and avoids possible bureaucracy
in communication; and sometimes the mere absence of such colleague.
Figure 2.14: Downward, Upward, Horizontal and Diagonal directions ofCommunication
Source: Author’s Field work, 2012
2.10.5.1 Downward Communication
In support of the directions of communication as in Figure 2.15, Downs and
Adrian (2004) noted that there is often a discrepancy in organisations between
management’s perception of what employees say they need and want to know.
Importance of openness and trust has been recognised by many theorists and is
echoed throughout the literature; including Gibb theory of “defensive” versus
“supportive” climates in communication. Maslow’s (1954) contribution to the
Downward
commu
nication
Upward
commu-
nication
e d c
Horizontal
Communication
b
a
www.udsspace.uds.edu.gh

89
above as cited by Mullins (2002) classic hierarchy of needs model, postulate that
workers must satisfy their basic needs before being motivated by higher level
needs. Downs and Adrian (2004) noted that there is often a discrepancy in
organisations between management’s perception of what employees say they
need and want to know. Euster (1981) opined on open communication climate
and indicated that upward, downward and lateral information flows were
necessary for both formal and informal communication methods.
Traditional views of the communication process in school organisation have
been dominated by downward communication flows. Such flows transmit
information from higher position (teacher) to lower levels position (student) of
the school organisation. School leaders, from central office administrators to
building-level administrators, communicate downward to group members
through speeches, instructional messages in school bulletins, school board
policy manuals, and school procedure handbooks. Canary (2011) has identified
five general purposes of downward communication:
Implication of goals, strategies, and objectives.
Job instructions and rationale.
Procedures and practices.
Performance feedback.
Socialisation.
The downward flow of communication provides a channel for directives,
instructions, and information to organisational members. However, much
information gets lost as it is passed from one person to another. Moreover, the
www.udsspace.uds.edu.gh

90
message can be distorted if it travels a great distance from its sender to the
ultimate receiver down through the formal school organisation hierarchy
(Tourish, 2010).
2.10.5.2 Upward Communication
Upward communication as appeared in Figure 2.15, refers to information that
flows from subordinates to supervisors and managers and may include
suggestions for organisational improvement, employee concerns, and
information about operational issues. This component of internal
communication is often cited as being the most deficient given the critical or
negative nature of upward feedback. Hall (2007) suggested filtering out “upward
communication, out of a need for self-preservation related to their mobility
aspirations and their desire to gain their managers’ trust. However, it is widely
acknowledged that upward feedback, upward communication and open-door
policies deliver significant organisational benefits” such as enhanced
participation, better decision making, and an enhancement of organisational
benefits (Tourish and Hargie, 2004). As with downward communication, poor
upward communication can have a significant impact on employee satisfaction,
productivity and overall organisational performance (Downs and Adrian, 2004).
Upward communication flow helps employees to meet their personal needs, by
allowing those in positions of lesser authority to express opinions and
perceptions to those in higher authority. To increase the effectiveness of upward
communication, Luthans (1994) recommends the use of grievance procedures,
open door policies, counseling, employee questionnaires, exit interviews,
www.udsspace.uds.edu.gh

91
participative decision-making techniques, and the use of an ombudsperson. In
addition to above, McCelland (1988) found a number of employee-based
reasons why upward communication tends to be poor include:
Fears of reprisal – people are afraid to speak their minds.
Filters – employees feel their ideas/concerns are modified as they get
transmitted upward.
Time – managers give the impression that they don’t have the time to
listen to employees.
Grievance procedureisa clear case of upwards communication which allows
employees to make an appeal (upward) beyond their immediate supervisor. It
protects the individual from arbitrary action by their direct supervisor and
encourages communication about complaints. To increase the effectiveness of
upward communication, Luthans (1994) recommends the use of grievance
procedures, open door policies, counseling, employee questionnaires, exit
interviews, participative decision-making techniques, and the use of an
ombudsperson.
The behaviourists have emphasised the establishment of upward communication
flows. In a school organisation, this was referred to as communication that
travels from staff member to leader. This is necessary not only to determine if
staff members have understood the information sent downward, but also to meet
the ego needs of staff. Five types of information communicated upwards,
according to Canary (2011) in a school environment, could include:
Problems and exceptions.
Suggestions for improvement.
www.udsspace.uds.edu.gh

92
Performance reports.
Grievances and disputes.
Financial and accounting information.
Ideally, organisational structure should provide for both upward and downward
communication flows. Communication should travel in both directions through
the formal school organisational hierarchy. Unfortunately, communication from
the bottom does not flow as freely as communication from the top. Again
Cheney (2011) opined some barriers to effective upward communication in a
school set up to include:
Administrators failing to respond when staff members bring up
information or problems.
Administrators tend to be defensive on less-than-perfect actions.
The administrator’s attitude is concerned and hardly listens.
Physical barriers can also inhibit upward communication flow.
Time lags between the communication and the action can inhibit upward
communication.
Keyton (2011) suggested some methods of improving the effectiveness of
upward communication in a school environment to include:
The open-door policy
Counseling, attitude questionnaire and exit interview
Participative techniques
The ombudsperson
The union contract
www.udsspace.uds.edu.gh

93
The grapevine
2.10.5.3 Horizontal (Lateral) Communication
Upward and downward communications are inadequate for effective
organisational performance without the flow of lateral communication. The
purpose of lateral or horizontal communication as shown in Figure 2.15 is the
sharing of information among peers at similar levels to keep staff informed of
all current practices, policies, and procedures (Spillan et al., 2002). Committees,
task forces, and cross-functional project teams are all useful forms of horizontal
communication. Fox (2001) also indicated that horizontal communication
appears among people of the same status within a department or among different
working units.
It should be noted that if an organisation has open communication, it will serve
as an effective method to give their employees information with which to
identify itself (Bartels, Peters, de Jong, Pruyn and Van der Molen, 2010).
Executives and other managers communicate organisational goals and support
their subordinates by horizontal means (Bartels et al., 2010). Horizontal
communication also encourages identification within their department, branch,
or sector of the company. Stevens (1983) argued that the most effective means
of solving problems within organisation is to provide for a high degree of lateral
communication among and between first-line supervisors and their staff, as they
jointly deal with the many problems of coordinating work flow. Downs and
Adrian (2004) assert that horizontal communication is usually informal in
nature, is task-oriented or takes place for social reasons, often stimulating
organisational commitment.
www.udsspace.uds.edu.gh

94
2.10.5.4 Diagonal Flow
Longest et al, (2000) opined that the least used channel of communication, as a
case in point, in healthcare organisations is diagonal flow. While diagonal flow
does not follow the typical hierarchical chain of command, it is especially useful
to other especially in health care for efficient communication and coordination
of patient care; whereas the diagonal communication appears among people of
the different status who are not formally connected in the organisational
communication system. According to Fox (2001), the diagonal communication
occurs when, for example, the Director of Nursing asks the Data Analyst in the
medical records department to generate a medical records report for the month
on all patients in the intensive care unit. This case in point is further augmented
in a typology shown in Figure 2.15 (b to a) above.
Wilson (1992) stressed that diagonal communication refers to communication
between managers and workers located in different functional divisions. The
concept of diagonal communication was introduced to capture the new
communication challenges associated with new organisational forms, such as
matrix and project-based organisations. Wilson also observed that with the rise
of the network organisation communication flows can no longer be restricted to
vertical, horizontal, and diagonal. Diagonal flow occurs between different levels
of different departments. Longest et al., (2000) provides us with several forms
of intra communication for public sector organisations.
www.udsspace.uds.edu.gh
95
2.10.6 Communication Networks
Communication networks represent a complex system of the flow of
information, orders, wishes and references made from two partially
complementary systems: formal communication network and informal -
communication network (Fox, 2001). Formal communication is described as a
systematic and formal process of information transmission in spoken and written
form planned and adjusted with the needs of the organization while informal
communication does not follow the line determined in advance, but there is an
undisturbed communication between particular groups within the organisation
(Fox, 2001).
2.10.6.1 Formal and informal small group networks
Formal small group communication takes place within the official channels
approved by senior management. An example would be a marketing manager
talking to the marketing director: his or her immediate boss. Within that channel
any form of communication is regarded as formal. Communication channels, are
established by the organisation and is accepted and recognised by employees
and managers. Formal Network is split into two different areas in a central
location as follows:
www.udsspace.uds.edu.gh
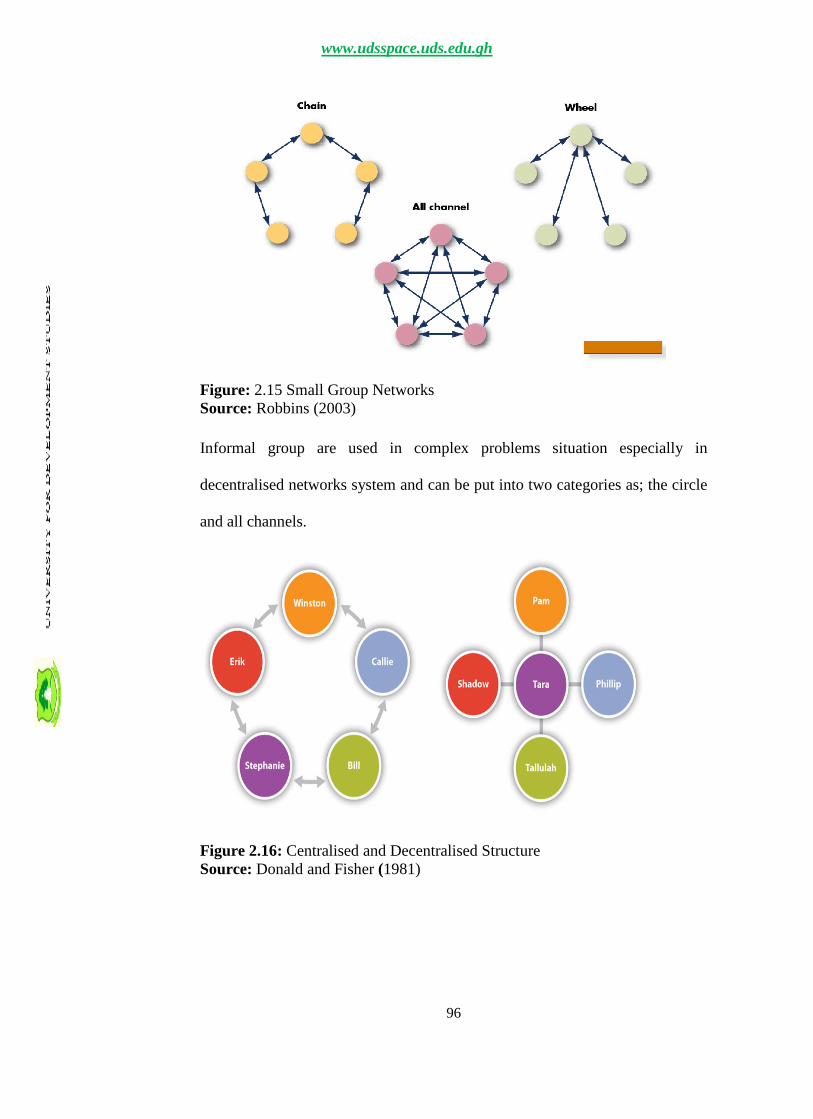
96
Figure: 2.15 Small Group NetworksSource: Robbins (2003)
Informal group are used in complex problems situation especially in
decentralised networks system and can be put into two categories as; the circle
and all channels.
Figure 2.16: Centralised and Decentralised StructureSource: Donald and Fisher (1981)
www.udsspace.uds.edu.gh

97
The wheel is an example of a centralized structure, while the circle is
decentralized. Research has shown that centralized groups are better than
decentralized groups in terms of speed and efficiency. “Informal communication
in some cultural certain is known as grapevine. Grapevineis not a less important
source of information, managers should however acknowledge also the informal
communication systems in the organisation, and use them for the welfare of their
organisation. Informal communication reflects the employees’ perception
concerning the organisation.
It often carries or asks for information that the management, accidentally or
deliberately, has not formally disclosed (Fox, 2001). Grapevine communication
consists of three main features as; first, it is not controlled by
the management; secondly, most of the employees consider it more feasible and
more reliable than the official notifications provided by the top management;
and thirdly, it is mostly used for the self-interest of the people within it (Robbins,
2003).
2.10.6.2: Verbal and Nonverbal Messages
Griffin (2009) stated that the process of interpersonal communication is mutual
and ongoing and both verbal and nonverbal messages are used with another
person to create and alter the images in both minds. According to Caputo, Hazel,
McMahon and Dannels (2002), the process of nonverbal communication is:
ongoing; can be intentional or unintentional; ambiguous; the foremost mode for
expressing emotions; culture based; and nonverbal messages are more
believable than verbal messages. One’s verbal and nonverbal messages are
www.udsspace.uds.edu.gh

98
either validated or discounted by other people’s perception of their character and
competence (Griffin, 2009). Nonverbal communications, as suggested by
researchers, have the most important role in interpersonal communications and
account for a majority (about sixty-five to ninety percent) of the meaning within
an interaction (Crane and Crane, 2010). However, the context of the interaction
also plays a large part in the outcome of the interaction itself.
Caputo, et al., (2002) indicated further that the characterization of nonverbal
communication differs in many ways from the ways verbal communication is
characterized. Burgoon’s expectancy violations theory predicts the responses
that the inappropriate actions of a communicator will elicited in nonverbal
communication (Griffin, 2009). The lens of the expectancy violations theory
allows for the examination of nonverbal competence. Another theory that lends
itself to guiding the research of the use of nonverbal competence to increase
group cohesiveness is Pearce (2009) coordinated management of meaning. The
theory of coordinated management of meaning suggests that communication
should be used by all to make sense of interaction, through the coordination of
our actions and behavior of others. A third theory that provides an opportunity
for guidance in the use of nonverbal competence to increase group cohesiveness
is Mead’s symbolic interactions.
According to Griffin (2009), Mead’s focus was to understand the way we attach
labels to people and their actions. Pearce’s theory of coordinated management
of meaning states that the context in which people say things are not nearly as
important as the way people communicate (Griffin, 2009). Nonverbal
communication is an integral part of the way people communicate; form
www.udsspace.uds.edu.gh

99
relationships from the dynamic dance over coordinated actions and meanings;
but not limited to, eye contact, touch, and facial expression. Griffrin (2009) again
pointed out that Mead’s theory of symbolic interactionism analyzes the way we
look at the world and a closer examination of the effect of nonverbal
communication on the effectiveness of small groups is one way to look at the
world. Research shows that the nonverbal behavior of a group can be affected
by the task assigned during that group’s interaction (Puccinelli and Rosenthal,
2003). The leader of that group can also affect the nonverbal behavior of a group
and the leader’s ability to demonstrate their competence in nonverbal
communication, and as a result increasing the group’s cohesiveness.
Controlling nonverbal messages, as the sender, is not possible one hundred
percent of the time (Griffin, 2009). When the behavior in an interpersonal
interaction appears to be naturally synchronous there is a likely chance that the
interaction will reflect positively on the relationship (Stewart, 2009). Stewart
(2009) discusses the idea that whether the nonverbal cues are intended or
unintended, universal or culturally bound, they play an important part in our
interactions with others. Behavioral synchrony refers to the degree that two
people’s behaviors coordinate with each other, and behavioral synchrony also
indicates the degree of intimacy and equality people have with one another
(Stewart, 2009). Facial expressions, vocal qualities, body movements, distances
between those we interact, and other associated voice elements are all included
under the concept of nonverbal messages (Caputo, et al; 2002). These elements,
among others, are those that are considered to fit into two categories of
nonverbal communication. Rashotte (2002) stated that the elements of speech
www.udsspace.uds.edu.gh

100
rate, tone of voice, pauses, voice volume, pitch and self-interruptions (such as
coughing or laughing) are considered paralinguistic, or verbal communication.
Gatica-Perez (2009) added that in accordance with the spoken word, nonverbally
there is a wealth of information conveyed during group conversations including
nonverbal, and some of these nonverbal signals are intentional while others are
as a result of automatic processes.
It is important to also consider that everyone has differing abilities in conveying
and interpreting nonverbal communication, and they therefore vary in their
abilities to monitor and control their nonverbal communication (Riggio, 2003).
Yet, Riggio (2003) stressed that in order for someone to be skilled in nonverbal
interpretation they must have a heightened sensitivity to the nonverbal messages
of others, and also be able to interpret the nonverbal messages of others
accurately. Caputo, et al (2002) opined that people can be trained to more
accurately “read” nonverbal messages when it is not possible to seek or give
feedback.
2.11 Conceptual Framework
Ideally effective organisational and communication should contribute to
administrative performance. Some explanations have been made on
organisational communication and administrative performance in the preceding
pages. Longest et al., (2000) on the other hand provides us with several forms
of intra organisational communication for public service organisations; some of
which reflect the pages that follow. The Conceptual framework on this work on
the other hand indicates organisational communication and administrative
performance of staff at the University with interrelated variables: independent,
www.udsspace.uds.edu.gh

101
dependent and intervening variables. The independent variables of this
framework consist of the organisational communication with components: as the
systems of communication, means of communication and the personal
characteristics of staff. The intervening variables are group cohesion, University
policy and macro and micro barriers; while the dependent variable is
administrative performance (improved job behaviour). All these variables are
interrelated and depend on each other. Staff within the organisation with their
personal characteristics such as age, sex, marital status, rank, ethnic-linguistic
(tribe) years of experience and educational qualification could have direct
influence on organisational communication and the perception of staff on
administrative performance in the University. Again, the perception of
organisational communication could determine how satisfied staff of the
University is at the work place.
The intervening variables made of group cohesion, University policy and macro
and micro barriers of communication could equally influence job performance.
For instance, when group cohesion is weak, the relationship between perception
of staff communication and administrative performance will be weak. On the
other hand, when group cohesion is strong, the relationship between
organisational communication and administrative performance will equally be
strong. This however further perceived could happen or achieved with proper
organisational policies and ameliorated communication barriers positively or
negatively which either could strongly impact on job performance.
www.udsspace.uds.edu.gh

102
Figure 2.17: The conceptual framework of effectiveness on organisationalcommunication and administrative performance of staff in UEW
INDEPENDENT
VARIABLES
INTERVENING
VARIABLESDEPENDENT
VARIABLES
ORGANISATIONAL
COMMUNICATION
Group
Cohesion
Organisational
policies
Macro / Micro
barriers
Sources ofCommunication
Means ofCommunication
Levels ofCommunication
Types ofCommunication
Channel ofCommunication
Systems ofCommunication
Direction ofcommunication
ADMINISTRATIVE
PERFORMANCE
(Improved Job
behavior)
Personal
Characteristics
Age
Sex
Marital status
Tenure in office Educational
qualification
Trust:
1. In management
2. In co-worker
Ethnicity
www.udsspace.uds.edu.gh

103
2.3.1 Systems Theory (Theoretical Framework)
Systems theory treated human communication in the same manner as all other
communicative processes, be they engineering systems, physical
communication phenomena such as light or energy transfer processes, living
biological systems, or entire social systems Scott (2000). Open Systems
applications were also made by Katz and Kahn (1966), as self-renewing systems
that ingest energy from the environment (input), transform that energy
(throughput), and expend it back into the environment (output) for maintenance
and production purposes in an organisation. For this reason, a system model and
communication model are depicted to indicate ideal functioning of the
organisation. Many other approaches to human communication have been
developed after as systems theory which played a significant role in the
development of communication theory (Cohen, 1996). Bertalanffy et al (1968)
developed systems and cybernetics theories, and focused on human
communication studies on language, linguistics and semiotics. Scott maintained
that communication can be treated like any other system, containing features
such as feedback processes and other aspects of control theory.
Again, in his contribution on the key lesson from systems theory on each sub-
division of the organisation as affected by activity in other parts, Miller (2006)
pointed out that the organisation itself is an ‘open system’, exposed to a wider
environment in which it both experiences competitive threats and finds its
collaborative partners. In short, he meant that organisations do not operate like
thermostats, rather their actions are the result of countless human decisions, each
of which is based on subjective perceptions of the world in which they are
www.udsspace.uds.edu.gh

104
operating and their preexisting values and experiences. Cheney and Christensen
(2001) and Zorn (2002), however, indicated that there have been efforts to
reintegrate internal and external communication issues, an approach that points
to the increasingly ‘blurred’ boundaries of today’s organisations, and argue that
there is an underlying continuity between what have previously been termed
‘internal’ and ‘external’ communication processes. Figure 2.1 is an illustration
of the multiple dimensions of organizational communication as depicted by
Blundel & Ippolito (2008).
Figure 2.18: Multiple dimensions of Organizational CommunicationSource: Blundel & Ippolito (2008)
The diagram (fig. 2.1) illustrates a “modern-system” approach of inter-related
part of an entity, which no separated aspect of an organisation in the
communication process exists but depends on one another, a whole entity and is
interdependent too. Organisation from the system theory, therefore changes
from time to time. Yates and Orlikowski (2002) reflecting on the finding of the
www.udsspace.uds.edu.gh
105
concept of ‘genre systems’, also indicated that the patterns of communication
and collaboration are shaped by established technologies. With this Cane (2007)
predicts that by 2011, instant messaging will be the de facto tool for voice, video
and text communications in businesses, replacing the relatively inaccessible e-
mail (Cane 2007). Yates and Orlikowski’s (ibid) research work pointed out how
communication practices developed into established norms, structuring the way
that we interact with one another. Their more recent work, on ‘genre systems’
(focused on the ways that technologically-mediated communication shapes the
way that people collaborate at work). Clark (2000), Dannels and Gaffney (2009)
supporting the above, have encountered a similar range of perspectives
elsewhere in organisation theory, management studies and other areas of social
science.
www.udsspace.uds.edu.gh

106
CHAPTER THREE
METHODOLOGY
3.1 Introduction
This chapter discusses the profile of UEW, study area, the research design, the
targeted population, sampling procedure and sample size, data collection,
instruments used, measurement of variables, data analysis and testing the
hypothesis.
3.2 Study Area
The study was conducted in the four campuses of the UEW (Winneba, Kumasi,
Mampongand Ajumako) in Ghana. Specifically, these campuses are in two
regions, the Central region (Winneba and Ajumako) and Ashanti region (Kumasi
and Mampong); guided by the Ghana Statistical Service (2010) summary report
of final results of the 2010 population and housing census. The Winneba campus
is the main campus of the University and is in the Effutu Municipality of the
Central Region of Ghana. The population of the Municipality is 60,331 and is
on the south coast, 140 km east of Cape Coast. The second campus, the College
of Technology Education is in the Kumasi Metropolis in the Ashanti Region.
The third campus, the College of Agriculture Education is also in the Mampong
Municipality of the Ashanti Region with a population of over 1.7 million people.
Mampong Municipality has a population of 42,037 people. Ajumako campus is
the fourth and hosts the Faculty of Languages Education, located in the Central
Region of Ghana. Ajumako is a district capital in the region and is about 40
kilometers northeast of Cape Coast, the regional capital with a population over
www.udsspace.uds.edu.gh

107
35,000 people. The location of the four campuses of UEW in Ghana is indicated
in figure 3.1.
Figure 3.1: Map of Ghana showing the location of the four campuses(Winneba, Adjumako, Mampong and Kumasi) of UEW
Source: Author’s Field Work (2012)
3.3 Research Design
The research design is planned to include the conditions for collection and
analysing data collected in a manner that aims at combining relevance to the
www.udsspace.uds.edu.gh
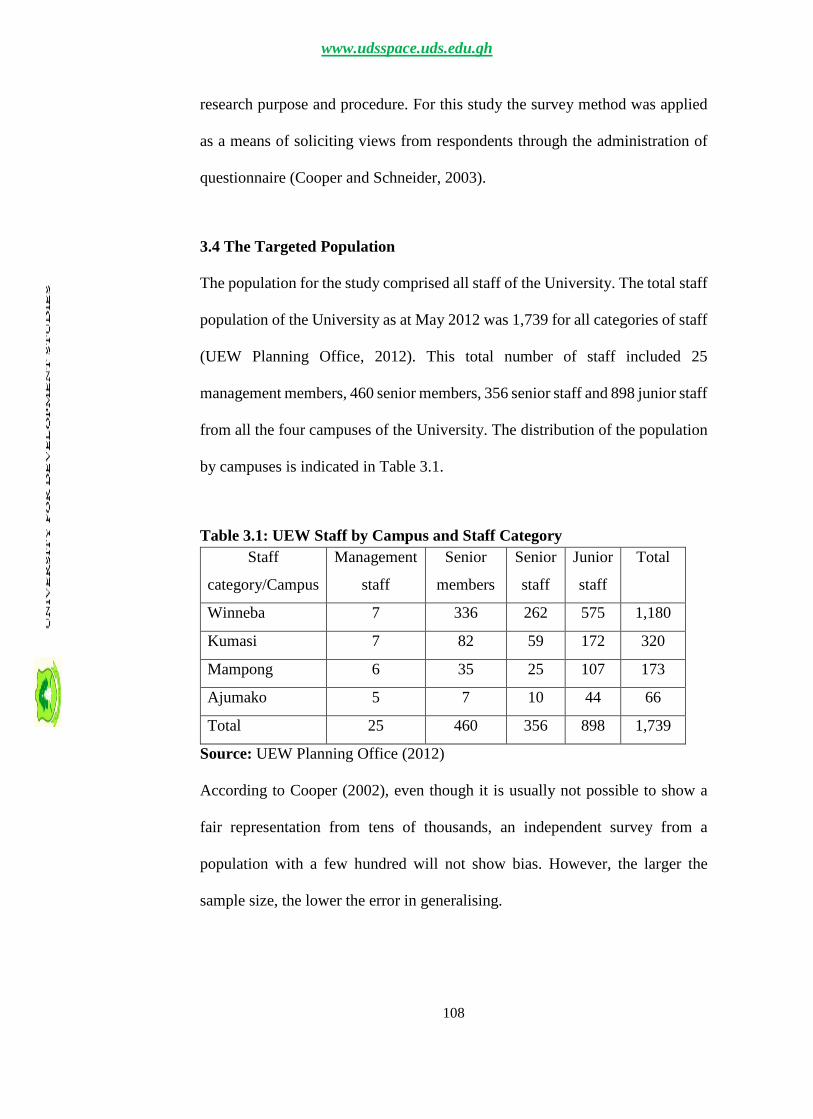
108
research purpose and procedure. For this study the survey method was applied
as a means of soliciting views from respondents through the administration of
questionnaire (Cooper and Schneider, 2003).
3.4 The Targeted Population
The population for the study comprised all staff of the University. The total staff
population of the University as at May 2012 was 1,739 for all categories of staff
(UEW Planning Office, 2012). This total number of staff included 25
management members, 460 senior members, 356 senior staff and 898 junior staff
from all the four campuses of the University. The distribution of the population
by campuses is indicated in Table 3.1.
Table 3.1: UEW Staff by Campus and Staff Category
Staff
category/Campus
Management
staff
Senior
members
Senior
staff
Junior
staff
Total
Winneba 7 336 262 575 1,180
Kumasi 7 82 59 172 320
Mampong 6 35 25 107 173
Ajumako 5 7 10 44 66
Total 25 460 356 898 1,739
Source: UEW Planning Office (2012)
According to Cooper (2002), even though it is usually not possible to show a
fair representation from tens of thousands, an independent survey from a
population with a few hundred will not show bias. However, the larger the
sample size, the lower the error in generalising.
www.udsspace.uds.edu.gh

109
3.5 Sampling Techniques and Sample Size Determination
The multi-stage sampling technique was used in arriving at the sample for this
study, as this enabled the researcher to elaborate, refine and deepen the initial
analysis (Al-hassan, 2015). To begin with UEW was purposively selected
because of the focus of the study. This was followed by stratifying the University
into four strata based on the number of campuses (Winneba, Kumasi, Mampong
and Ajumako). Stratified sampling technique was again used to categories the
staff on each campus into four, namely, management staff (Vice Chancellor, Pro
Vice Chancellor, Registrar, Finance Officer, Librarian, Development Officer
and the various College Principals), senior members (Lecturers, Registrars,
Medical staff, Finance staff and other Officers), senior staff (Administrators,
Accountants and Research Assistants) and junior staff (Clerks and Labourers).
With a total staff population (sample frame) of 1,739, a sample size of 313 was
determined using the Krejcie and Morgan (1970) table for sample size
determination. This was used to help the researcher to arrive at a more
statistically realistic sample size to work with. Proportional sampling procedure
was used to determine the proportions of management staff, senior members,
senior staff and junior staff of the total sample for the study. The number of
respondents to be selected from each campus per staff category was also
determined. Simple random sampling was then used to select the individual
respondents on each campus. Table 3.2 is a summary of how the study sample
(313) was arrived at.
www.udsspace.uds.edu.gh

110
Table 3.2: Sample Size Determination
Staff category Winneba Kumasi Mampong Ajumanko Totals
N n* N n* N n* N n* N n*
Management Staff 7 4 7 4 6 3 5 2 25 13
Senior Members 336 70 82 40 35 17 7 3 460 130
Senior Staff 262 60 59 31 25 15 10 4 356 110
Junior Staff 575 30 172 15 107 10 44 5 898 60
Total 1180 164 320 90 173 45 66 14 1739 313
Convenient and purposive sampling can be applied in non-probability sampling
respondents where they do not have equal chance of being selected in a study; a
judgment could be obtained according to the discretion of the researcher familiar
with the relevant characteristics of the target population (Al-hassan, 2015). The
researcher conveniently selected 60 junior staff members of the University
because most of them are not active participants in the formal communication
process in the University, as some cannot even read or writes. Besides, this
category of staff communicates only through limited channels. Thus, the few
who demonstrated their ability to read and write were conveniently selected for
the study.
3.6 Instruments for Data Collection
A structured questionnaire was designed to reflect the objectives of the study.
The questionnaire was categorized into five sections, numbering sections A to
E. Section ‘A’ covered thirty (30) manifest variables measuring the perceptions
of respondents about the nature of communication in the University. A five-
point Likert scale was used in measuring the perceptions of respondents. The
www.udsspace.uds.edu.gh

111
scale ranged from Strongly Agree to Strongly Disagree and was indicated as
follows: Strongly agreed = 5, Agreed = 4,Somewhat Agree = 3, Disagree = 2
and Strongly Disagree = 1.
Section ‘B’ also used a five-point Likert scale to measure respondents’
perceptions of organisational communication system and administrative
performance. They were asked to indicate their levels of agreement with thirty
(30) statements. The response categories were: Excellent = 5, Very Good = 4,
Good = 3, Fair = 2 and Poor = 1.
Section ‘C’ contained thirty-two (32) statements on a 3-point Likert scale and
was used to measure respondents’ perceptions of the impact of University
communication on group cohesion. The scale ranged from high to low as: High
= 3, Moderate = 2 and Low = 1.
Section ‘D’ covered thirty (30) statements measuring the constraints militating
against effective communication in the University. A five-point Likert scale was
used with the following response categories: Very serious = 5, Serious = 4,
Somehow serious = 3, Not serious = 2 and No constraint = 1.
The last section, ‘E’ covered the demographic characteristics of respondents.
There were eleven (11) variables consisting of the name of respondent, campus,
sex, age, marital status, department/section, status/job title, rank, ethno
linguistic, number of years in service (experience) and educational qualification.
Interview schedules were also designed for the collection of qualitative data.
www.udsspace.uds.edu.gh
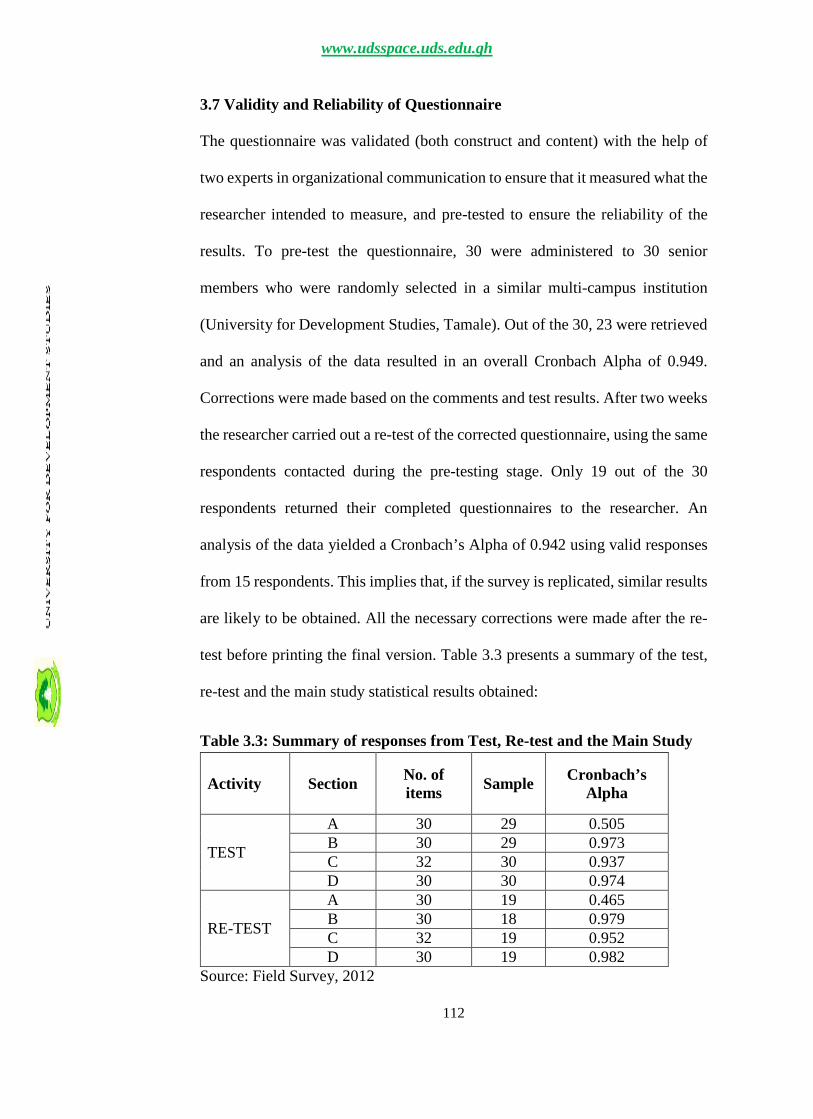
112
3.7 Validity and Reliability of Questionnaire
The questionnaire was validated (both construct and content) with the help of
two experts in organizational communication to ensure that it measured what the
researcher intended to measure, and pre-tested to ensure the reliability of the
results. To pre-test the questionnaire, 30 were administered to 30 senior
members who were randomly selected in a similar multi-campus institution
(University for Development Studies, Tamale). Out of the 30, 23 were retrieved
and an analysis of the data resulted in an overall Cronbach Alpha of 0.949.
Corrections were made based on the comments and test results. After two weeks
the researcher carried out a re-test of the corrected questionnaire, using the same
respondents contacted during the pre-testing stage. Only 19 out of the 30
respondents returned their completed questionnaires to the researcher. An
analysis of the data yielded a Cronbach’s Alpha of 0.942 using valid responses
from 15 respondents. This implies that, if the survey is replicated, similar results
are likely to be obtained. All the necessary corrections were made after the re-
test before printing the final version. Table 3.3 presents a summary of the test,
re-test and the main study statistical results obtained:
Table 3.3: Summary of responses from Test, Re-test and the Main Study
Activity SectionNo. ofitems
SampleCronbach’s
Alpha
TEST
A 30 29 0.505B 30 29 0.973C 32 30 0.937D 30 30 0.974
RE-TEST
A 30 19 0.465B 30 18 0.979C 32 19 0.952D 30 19 0.982
Source: Field Survey, 2012
www.udsspace.uds.edu.gh

113
3.8 Data Collection Strategy
For ethical reasons permission was sought from the University’s management
concerning the participation of the staff and the use of relevant official
University documents for the study. The purpose of the study was also explained
to the individual respondents and their consent sought before the administration
of the questionnaire. The researcher spent one week on each of the four
campuses to collect data. After the four weeks, four Research Assistants, one for
each campus, were appointed and trained to make follow-ups to retrieve the
remaining questionnaire that could not be completed by the respondents during
the one week stay of the researcher on each campus.
Considering the research questions that were to be addressed, this study
employed a combination of quantitative and qualitative methods to collect data.
Qualitative data were collected using interviews and observations, while
questionnaires were used to collect quantitative data. Baker (1994) emphasized
the importance of using multiple methods in data collection which allows for
cross-checking the reality of certain phenomena by gathering data from many
sources for purposes of comparing different versions to produce a balanced
report. The use of multiple data collection methods assisted the researcher to
confirm or disapprove other findings (Patton, 2002). This makes it is possible to
build on their strengths while minimizing the weakness of any single approach.
Hogan (2007) asserted that, the limitations in one technique can be compensated
for by the strengths of the other.
www.udsspace.uds.edu.gh

114
Four hundred (400) copies of the questionnaire were produced for
administration to the respondents. Eighty-seven (87) out of the 400 were
reserved for replacement; because fifty (50) respondents lost theirs and asked
for replacement; and few other respondents requested for questionnaire twice or
thrice. The questionnaires were personally distributed to all the selected
categories of respondents (313) on all the campuses of the University. Out of the
number administered, 309 were received from respondents after several follow
ups. This gives a response rate of 98.7%. Out of the 309 received 304 (98.4%)
were answered fully whilst 5 (1.6%) were incomplete. Data collection was done
from 6th March to 2nd June 2012 on all the four campuses of the University.
The interview schedule was also used to gather qualitative information from
some selected staff. The respondents were selected from all the four categories
of staff (junior staff, senior staff, senior members and management staff) on all
the campuses of the University using convenience and purposive sampling
techniques. In all 28 respondents, comprising 13 females and 15 males were
interviewed. Out of the 28 respondents, there were 6 junior staff, 10 senior staff,
12 senior members and 2 management members. Each interview lasted between
14 and 65 minutes and was conducted at locations convenient to the respondents.
All 28 interviews involved individual meetings. To ensure that ethical
considerations were followed, the researcher requested for respondents’
permission to take down notes to ensure that they understood their rights as
respondents; and were also reminded that their identity would remain
confidential in all stages of the study. Data was collected by using note-taking
and tape-recording if interviewees were comfortable with any of them (Yates,
www.udsspace.uds.edu.gh
115
2004). This was intended to improve the outcome of the study and give
confidence to the accuracy of the interview process and to ensure the reliability
of the findings in general.
Equally, the researcher observed formal and informal forms of communications
of system of staff at meetings, the use of memos and letters, committee reports,
to mention but few areas to explore more complex situations. Those which have
multiple answers and truths from another person’s point of view and provide a
detailed understanding of how social realities were produced and maintained
through every day practices (Baxter and Babbie, 2004). In this study, the
researcher engaged in limited interaction, interviewing only when more
clarification of both verbal and non-verbal actions was needed. The researcher
visited all the four campuses of the University to acquaint himself with such
findings. Similarly, those visits also enabled the researcher to observe how staff
informally interacted with their peers, subordinates and superiors in the work
setting. However, care was taken in other to respect desired ethical standards
required in all these areas.
This research relied extensively on the use of notes taking to document
descriptions of settings, people, activities, and sounds. Lofland and Lofland
(1984) recommended that, writing down notes serve as a memory aid when full
field notes are constructed.
3.9 Measurement of Variables
Three main variables types were used in this study. These were the independent,
dependent and intervening variables and were operationalised as follows:
www.udsspace.uds.edu.gh

116
3.9.1 Independent Variable
In Section A, perception of staff on the nature of Organisational Communication
in the University, is the first objective, with Organisational Communication
being the main independent variable measured. The nature of Organisational
communication was measured using 30 perceptive statements as indicated in
Section A of appendix I. Respondents were asked to rate their perceptions
regarding organisational communication on a 5-point Likert type scale ranging
from 1 to 5 as: Strongly Agree = 5, Agree = 4, Somewhat Agree = 3,
Disagree = 2 and Strongly Disagree = 1
3.9.2 Dependent Variable
Section B of the questionnaire sought to satisfy the requirements of the second
objective: examining the effect of organisational communication on
administrative performance of staff in UEW. Here, Administrative Performance
was the subject of interest and considered as the dependent variable. Dependent
variable is a measurable characteristic that shows the effect of manipulating the
independent variables. It is the execution of tasks in line with the employee’s
job description for the attainment of optimal standard of effectiveness and
efficiency expected within the organisation. In this study, respondents were
requested to respond to 30 statements by indicating their perceptions on a 5-point
Likert type scale, ranging from 1 to 5 as: Excellent Performance = 5; Very Good
Performance = 4; Good Performance = 3; Fair Performance = 2; Poor
Performance = 1.
www.udsspace.uds.edu.gh

117
3.9.3 Intervening Variables
These are variables that help in explaining the relationship between the
dependent and independent variables. This part of the instrument looked at the
fourth objective of the study. The objective examined the constraints militating
against organisational communication in the University. Constraints to
organisational communication were measured using the Likert scale.
Group Cohesion (Section C)
Group cohesion refers to a situation in which individuals are bound to one
another by common organisational, social and cultural commitments.
Respondents were asked to rate their perceptions on a 3-point Likert type scale
using 32 perceptive statements with the following response categories:
High = 3, Moderate = 2 and Low = 1.
Constraints to Organisational Communication (Section D)
This part featured 30 constraints militating against communication flow in the
University which were derived from both literature and from personal
experience. Respondents were requested to indicate their perceptions regarding
the level of seriousness of each constraint on organisational communication on
their campuses on a 5-point Likert scale and coded as:
Very Serious Constraint = 5, Serious Constraints = 4, Somewhat Serious
Constraints = 3, Not Serious = 2 and No Constraint = 1
www.udsspace.uds.edu.gh

118
3.9.4. Independent Variables
Section E looked at the fifth objective of the study which formed part of the
independent variables. In this study, the socio-demographic characteristics, apart
from organisational communication, were the independent variables. The major
socio-demographic characteristics were measured using appropriate codes as
follows:
Location of Campus: This is a continuous categorical variable measured at
nominal level. Respondents were asked to indicate their campus and were coded
as: Winneba = 1, Kumasi = 2, Mampong = 3 and Ajumanko = 4
Age: This is an interval scale measurement. The respondents were asked to
indicate the age range they belonged to and coded as: Less than 25years = 1, 26-
30years = 2, 31-40years = 3, 41-50years = 4, 51-60 = 5 and above 60years = 6
Sex: This is a categorical variable measured at nominal level and coded as:
Male = 1 and Female = 2
Ethno-Linguistic Grouping: This is a continuous categorical variable
measured at nominal level. This relates to the language spoken and respondents
were asked to indicate their ethno linguistic group as follows: Akan = 1, Fanti=
2, Ewe = 3, Ga = 4, Others = 5 and No response = 6
Marital Status: Is a continuous categorical variable measured at nominal level.
Respondents were asked to indicate their marital status and were coded as:
Single = 1, Married = 2, Divorce = 3, Widow(er) = 4, Separated = 5
www.udsspace.uds.edu.gh
119
Title/Rank: This was measured at ordinal level into six categories and coded
as: Professor/ Registrar = 1, Associate Professor/Deputy Registrar = 2, Senior
Lecturer/Senior Assistant Registrar = 3 Lecturer/Assistant Registrar = 4, Senior
Research Assistant/Senior Administrative Assistant = 5, Others (Clerks and
Technicians) = 6
Status: This is a continuous categorical variable measured at nominal level and
coded. Respondents were asked to indicate their status as: Junior staff = 1, Senior
Staff = 2, Senior Member = 3, Management Member = 4
Number of years at post (Experience): This was the actual number of years
spent on the job. Respondents were asked to specify the number of years spent
on their job and was measured at interval level (1-20 years, since the area of
study is only 20 years old) and coded as:
1-5 = 1, 6-10 = 2, 11-15 = 3 and 16-20 = 4
Educational qualification: Respondents were asked to indicate their
educational qualification and was measured at nominal level and coded as:
PhD = 1, MPhil/MSc/MBA/MA = 2, BSc/BA/BEd/BBA = 3, Diploma = 4
3.9 Method of Data Analysis
Data collected from the survey was analysed using the Statistical Package for
Social Sciences (SPSS) software version 20.0.
Objectives 1: Descriptive statistics in the form of frequencies, percentages and
cross tabulations were used to analyse the demographic characteristics of
respondents as assessed by participants. This was presented in a quantitative
www.udsspace.uds.edu.gh

120
summary to allow for simpler and quicker interpretation of the data. It provided
understanding of the data in detail and helped put the findings in proper
perspective.
Objectives 2 and 3: inferential statistics in the form of one sample t-test was
used to analyse them. This study employed the means to determine respondents’
levels of agreement with the various perceptive statements and t-values and p-
values to establish the levels of significance of the agreements with the
statements.
Objective 4: Two step cluster analysis was used to analyse group cohesion
among respondents and to identify the natural group. Though the variables were
measured on a three point Likert scale (low, moderate, high), the two step cluster
analysis was deemed appropriate to meet the four groups of employee cohesion
patterns. A chi-square test of independence between the groups and employee
ranks was also considered here, since employee rank could influence the interest
group patterns. Again the chi-square test for employee membership of a cluster
(group) was also used to check the influence level by campus of the employee.
All these were carried out to check the consistency of communication practice
in the University.
Objective 5: Kendall Coefficient of Concordance (W) was used to rank
constraints to communication in the University. It is a tool that was used to
assess agreement among raters. The researcher also used factor analysis with the
Varimax rotation method to categorise the constraints.
www.udsspace.uds.edu.gh
121
Hypotheses testing
Hypothesis 1 (H01): There are no significant differences in the effectiveness of
organisational communication among various campuses. Analysis of variance
(ANOVA) was used to test this hypothesis.
Hypothesis 2 (H02): Staff profile (age, marital status, educational qualification,
campus of staff, tenure in office, rank and ethno linguistic) does not influence
the effectiveness of organisational communication. Chi-square was used to test
this hypothesis.
Hypothesis 3 (H03): There is no siginificant relationship among staff profile,
perception of communication pattern, communication performance, group
cohesion and constraints. PPMC correlation matrix was used to test this
hypothesis
www.udsspace.uds.edu.gh

122
CHAPTER FOUR
RESULTS AND DISCUSSION
Introduction
The presentation of the results and discussion in this chapter is summarised
under the following headings:
4.1 Demographic profile of staff in the University;
4.2 Staff perception on the nature of communication in the University;
4.3 Organisational communication system and the perception of staff on job
performance;
4.4 Staff perception of organisational communication on group cohesion;
4.5 Constraints militating against organisational communication in the
University;
4.6 Significant differences in the effectiveness of organisational
communication among various campuses.
4.7 Significant relationship between staff profile (age, marital status,
educational qualification, campus of staff, tenure in office, rank and
ethno linguistic) and effectiveness of organisational communication.
4.8 Significant relationship among staff profile, perception of
communication pattern, communication performance, group cohesion
and constraints.
4.1 Selected Demographic characteristics of staff
The results of selected demographic characteristics of staff; age, campuses,
gender (sex), rank (title), status in the University, educational qualification,
years at post (tenure) and marital status are presented in Table 4.1.
www.udsspace.uds.edu.gh

124
Table 4.1: Selected Demographic Characteristics of StaffVariable Winneba Kumasi Mampong Ajumako Pooled
Freq Per cent Freq Per cent Freq Per cent Freq Per cent Freq Per centSexMale 74 59.2 55 55 29 60.4 10 66.7 168 58.3Female 51 40.2 45 45 19 39.6 5 33.3 120 41.7Total 125 100 100 100 48 16.7 15 100 288 100Age ≤ 25 5 4.8 10 11.1 1 2.9 2 13.3 18 7.4 26-40 52 50 63 70 23 67.6 11 73.3 149 61.341-50 28 26.9 13 14.4 8 23.5 1 6.7 50 20.651-59 15 14.4 4 4.4 2 5.9 1 6.7 22 9.1≥ 60 4 3.8 0 0 0 0 0 0 4 1.6 Total 104 100 90 100 34 100 15 100 243 100Marital statusMarried 81 68.6 58 64.4 24 55.8 3 21.4 166 62.6Single 34 28.8 30 33.3 15 34.9 10 71.4 89 33.6Divorced 3 2.5 1 1.1 4 9.3 0 0 8 3.0Widow/er 0 0 1 1.1 0 0 1 7.1 2 0.8Total 118 100 90 100 43 100 14 100 265 100Educational QualificationPhD 8 6.3 0 0 0 0 0 0 8 2.8Masters 72 57.1 42 41.6 12 26.1 1 7.1 127 44.3Bachelors 33 26.2 35 34.7 18 39.1 6 42.9 92 32.1Diploma 10 7.9 17 16.8 12 26.1 5 35.7 44 15.3Certificate 3 2.4 7 6.9 4 8.7 2 14.3 16 5.6Total 126 100 101 100 46 100 14 100 287 100
www.udsspace.uds.edu.gh

125
Table 4.1: Selected Demographic Characteristics of Staff cont’dWinneba Kumasi Mampong Ajumako Pooled
Variable Freq Percent Freq Percent Freq Percent Freq Percent Freq PercentStatusJunior staff 16 12.7 19 17.9 2 4.1 3 20 40 13.5Senior staff 38 30.2 48 45.3 36 73.5 10 66.7 132 44.6Senior member 67 51.6 37 34.9 11 22.4 2 13.3 115 38.9Management member 7 5.6 2 1.9 0 0 0 0 9 3Total 126 100 106 100 49 100 15 100 296 100RankAss Prof/DR 6 5.1 1 1.1 0 0 0 0 7 2.7Snr Lecturer/SAR 16 13.7 0 0 2 5.9 0 0 18 7Lecturer/AR 43 36.8 37 41.1 13 38.2 2 12.5 95 37SRA/SAA 28 23.9 25 27.8 9 26.5 8 5 70 27.2Others 24 20.5 27 30 10 29.4 6 37.5 67 26.1Total 117 100 90 100 34 100 16 100 257 100Tenure(Experience)
1. 1-5year 53 42.4 59 58.4 37 78.7 13 86.7 162 56.22. 6-1years 46 36.8 24 23.8 5 10.6 1 6.7 76 26.4
11-15 years 20 16 14 13.9 2 4.3 1 6.7 37 12.816-20 years 6 4.8 4 4 3 6.4 0 0 13 4.5Total 125 100 101 100 47 100 15 100 288 100
Source: Author’s Field Work, 2012
www.udsspace.uds.edu.gh

123
4.1.1 Age
The age of staff was important variable since that could help eastablish the
number of staff nearing retirement and their possible replacements. Table 4.1
indicates that more than half of the staff at the three campuses (61.3%) are in the
age bracketof 26-40 years. The rest fall in the younger and older age groups with
7.4% and 1.6% respectively. The 1.6% represents staff who are either due for
retirement or have retired already and therefore need to be replaced. There is the
need for the human resource division of the University to plan towards
replacement ofthis category of staff. The findingis similar to that of De Wet et
al. (2008) who found out that most working staff in South Africa were between
40-49 years of age, with an average age of 42.3 years and the majority of
respondents (80.8%) were in their active age. Grunig et al. (2001) also opined
that age balance was required within the education profession to ensure the
transfer of knowledge from older colleagues to younger ones. Age can also be
related to the practitioners time of working in the organisation, as well as their
years of experience in the performance of their functions. However, Le Roux
(2004) suggested that younger practitioners could be appointed to higher level
positions if they demostrated their ability to handle such positions effectively.
www.udsspace.uds.edu.gh
126
4.1.2 Sex
Respondents in this study were simply requested to indicate their sex, either
male or female. Table 4.1a shows the sexdistribution of the respondents. From
the results,more males (58.3%) employed in the University participated in the
study than females (41.7%). In Winneba Campus for instance, where the
population reflects a larger size, 59.2% of the respondents were males while
40.2% were females; whiles at Ajumako, the lowest in number of staff,66.7% of
the respondents were males and 33.3% were females. The implication here is
that gender discrepancies exist in the hiring of female staff in the University.
This findings are similar to the findings of Oloruntoba and Ajayi (2006) who
also found out in their research in three Nigerian Universities that male
employees outnumbered their female counterparts. Again Grunig et al. (2001)
studied extensively on the issue of gender and suggested the need to bridge the
gap between male and female positions.They cautioned, however, that in
seeking to bridge the gap care should be taken so that the situation would not
lead to loss of credibility,indiscipline, less competence in the workplace and less
seriousness at the work place when the females are compared to their male
counterparts. Aldoory and Toth (2002) added that there are still gender
discrepancies in hiring, promoting and renumerating female practitioners, which
confirms the findings in this study. Niemann-Struweg and Meintjies (2008) on
the contrary found in their study that 64% of their respondents were females as
against 36% in public relations research.
www.udsspace.uds.edu.gh

127
4.1.3 Educational qualification
As an academic institution, it is obvious that educational qualification is
considered as a very important variable. It is perceived that the higher the
qualification of staff, the better they can communicate and consequently perform
better. The respondents were asked to indicate their highest levels of educational
qualification, starting from PhD (the highest qualification) to Certificate (the
lowest qualification). From the distribution in Table 4.1, 2.8% of the
respondents, being the lowest in number, hold PhD qualification compared to
44.3% who hold Masters Degree qualification and constitute the majority. Only
5.6% of respondents hold certificate qualification. 15.3% have diploma while
32.1% hold bachelors degree qualification.
The implication here is that, as an educational institution, higher academic
qualifications are very important to its sustainable development. Regarding the
targeted population of the study, it is not surprising that majority of the
respondents of 47.1% hold higher qualifications (PhD, Masters Degrees)
compared to very few staff (20.8%) having diploma and certificate
qualifications. This is in line with the findings of Boynton (2006) and Plowman
(2005) who found that higher education was necessary within the mixed-motive
model (inherent in the public relations management which requires different
approaches in communication) in equipping the practitioners to contributebetter
to organisational performance.
It should be noted that although educational qualification was important in
administrative performance, it may not be enough to enable the practitioner
contributemeaningfully to organisational performance. According to Le Roux
www.udsspace.uds.edu.gh

128
(2004) knowledge needs to be combined with creating shared expectations
between management and working within a participative organisational culture,
as well as by using networking and relationship building skills and gaining the
appropriate corporate communication experience.
4.1.4 Marital Status
The variable was operationalised into four as married, single, divorced and
widow(er) for respondent to choose. From the distribution in Table 4.1c,
majority of respondents (62.6%)are married while very few (0.8%) are
widows/ers. About a third (33.6%) of the respondents are single while 3% are
divorced. Similarly, majority of the respondents on various campuses are
married followed by those who are single. Very few are either divorced or
widowed.
The implication here is that the majority of the staff are in relationships and
could assume extra responsibilities at home that could affect output at the place
of work. A significant percentage of staff are single and could also request for
matrimonial and maternity leave in the near future and these could equally affect
productivity of staff. Again working hours in the University could reduce when
such category of staff are associated with matrimonial, outdooring and other
ceremonies which adequate time to prepare. In a study on marital status by
Jordan and Zitek (2012) they concluded that mere bias on employees’ marital
status should not be a basis for assessing staff performance. Jordan and Zitek
(ibid) conducted three studies on the effects of marital status on perceptions of
employees and prospective employees. In the first of the three studies
www.udsspace.uds.edu.gh

129
participants rated a married female job applicant as less suitable for employment
than her single female counterpart. In the second study, participants again
perceived a female job applicant less favorably when she was married. In
contrast, a male applicant was perceived to be more favorable when married. In
the third experiment, participants predicted that a recently married woman’s
administrative performance and dedication would decline, whereas a recently
married man’s dedication was predicted to rise. This difference made
participants more willing to lay off the women than the men.
4.1.5 Rank/Title
The rank or title of a staff, to a large extent, determines his/her influence in the
University or the way people will receive the message communicated. Rank here
can therefore influence the status of a staff in the University hierarchy. Rank or
title in this study is operationalised as Professor, Senior Lecturer, Lecturer,
Senior Research Assistant and other staff with their analogous positions
(Registrars and Administrators) as in Table 4.1. It is perceived here that rank
could determine the level of communication and performance in the University.
For instance, it is likely for a Professor, Lecturer or the Registrar to communicate
better and to be attended to more quickly than an office clerk or messenger. With
this variable, only very few respondents (2.7%) hold Professorial positions or
work at that analogous level (Deputy Registratrar) and 7% are Senior Lecturers
and their anologous positions (Senior Assistant Registrar). Again majority of the
respondents (37%) were Lecturers with nearly the same number of respondents
(27.2% and 26.1%) were Senior staff and Junior staffrespectively.
www.udsspace.uds.edu.gh

130
The implication here is that a large number of Senior staff and Senior members
constitue 73.9%as evidenced in Table 4.1, and are more capable of
identifyingcommunication challenges in the University. It could also be the
reason why academic institutions will invest more in staff development and in
academic qualification. Jansen, Liu and Simon (2012) researched into the effect
of employee’s rank on performance and their findings showed that rank had
significant effect on most of metrics such as advertising campaigns, clicks and
sales, indicating a general compelling performance of top-ranked position and
consequently generating about 80% of the total profits. The results therefore
indicates that, staff of academicand research institutions place more priority on
academic staff, hence more qualified and competent staff to meet their mandate
and help solve communication challenges.
4.1.6 Tenure
Tenure represents the number of years staff has worked in the University in the
last 20 years since its establisment. It could be argued that the longer a staff
works in the University, the more experience he might have acquired. The result
in Table 4.1 presents the distribution of respondents on the number of years in
service. From the results, more than half of the respondents ( 56.2%) have served
between 1-5 years, a little more than a quarter (26.4%) have served between 6-
10years. Very few people have served for 11-15years (12.8%) and 16-20years
(4.5%). On campus basis, 53 (42.4%) of the respondents in Winneba have
worked for 1-5 years, while in Ajumako 13 (86.7%) of respondents have spent
beween 1-5years. The smaller size of staff with longer years of servicecould be
explained by the fact that those above the age of 40years who were in active
www.udsspace.uds.edu.gh

131
service at the commencement of the University (as pioneers) might have retired
from active service.
The limitation of fewer staff with requisite experience could affect performance
as a whole if mentors are absent. The above scenario cuts accross the campuses
and is an indication of the fact that there are many more staff with less years of
work experience in the University and this could possiblyaffect performance and
output as a whole. Some reasons offered for this situation was that the
progressively younger institutions were now growing in population but that
many could have had their experiences elsewhere long before the establishment
of the University. On the contrary in a study by Watt (2008), it was observed
that sometimes staff are employed directly from within the University without
any experience. However,experience should not necessarily be measured using
time (years) that the practitioner has spent in the profession or the organisation,
but rather in their contribution to the organisation (Wolf, 2006).
4.1.7 Status of Staff
Staff have been categorised in the University as Junior Staff, Senior Staff, Senior
Members and Management Members. These categorisations confer statuses on
the staff of the University and could also influence communication and
administrative performance in the University. This means that it is likely for a
Senior Member or Management Member of staff to have more impact and
influence in performance and in communication in general than a Senior and
Junior staff of the University by virtue of the person’s status. Staff were asked
to tick appropriately, from the questionnaire (Appendix 1E), their status. From
table 4.1, majority of staff (44.6%) are Senior staff while only 3% are
www.udsspace.uds.edu.gh

132
inManagement positions. Again 13.5% and 38.9% are Junior staff and Senior
Members respectively.
The information above implies that fewer staff are in Management position
while majority ofthe respondents serve under them as subordinates.With English
as the main medium ofcommunication, those in higher status brackets (senior
members, management member and senior staff) are more likely to
communicate better than those of lower rank (junior staff). Some literatures hold
that when considering your communication style and strategy, your rank plays
an important part. According to Barker (1994) some key elements that are
involved in audience's evaluation of a person in the communication process
include one’s title, perceived good will and common ground. For instance a
Management member may communicate better than an office clerk, just as a
Senior Administrative Assistant may communicate better than a conservacy
labourer.
Writing on the influence of social status on communication predispositions of
staff, Tasaki, Kim, and Lee (2007) indicated that individuals show greater level
of argumentativeness in their conversation with a low status communicator
(classmate or roommate) than in the conversation with a high status
communicator (professor). On the other hand, individuals showed greater level
of communication apprehension in the conversation with high status
communicator (professor) than in the conversation with low status
communicator too.
www.udsspace.uds.edu.gh

133
Table 4.1.1: A Cross Tabulation of Status and Sex of RespondentsStatus: Junior Staff Senior Staff Senior
MemberMgt
MemberTotal
f % F % f % f % f %
Se x
Male 17 6 82 29 62 21.9 3 1.1 164 58Female 20 7.1 45 15.9 48 17 6 2.1 119 42
Total 37 13.1 127 44 110 38.9 9 3.2 283 100
Source: Field Survey, 2012
A cross tabulation between status and sex (Table 4.1.1) shows that majority
(58%) of the respondents were males out of which a larger pecentage of 87.8%
constituted senior staff and senior members. The females were 42% out of which
a larger percentage 78.2% were senior staff and senior members. The
implication here is that fewer females were at senior level positions compared
to their male counterparts. On the contrary, the statistics for managerial position
indicate 1.1% for males and 2.1% for females. This is contrary to the assersion
that male dominance in an institution means they occupy higher positions in that
institution.See Oloruntoba and Ajayi (2006).
Table 4.1.2: A Cross Tabulation of Rank and Sex of RespondentsRank: Ass.
Prof/DRSnr Lec.
/SARLecturer/
ARSRA/SAA Others Total
Sex: Male 3 13 53 40 40 149
(1.2) (5.3) (21.8) (16.5) (16.5) (61.3)
Female 3 2 39 23 27 94
(1.2) (0.8) (16) (9.5) (11.1) (38)
Total 6 15 92 63 67 243
(2.5) (6.2) (37.9) (25.9) (27.6) (100)
Source: Field Survey, 2012 figures in parentheses are percentagesDR =Deputy Registrar; SAR = SeniorAssitant Registrar; AR = AssistantRegistrar; SRA = Senior Research Assistant; SAA = Senior AdministrativeAssistant
Results of a cross tabulation between rank and gender of respondents show
majority (61.3%) were males, with 28.3% occupying senior members position
www.udsspace.uds.edu.gh

134
(from lecturer/assistant registrar to associalte professor/deputy registrar
positions), senior staff is 16.5% (SRA/SAA positions) and junior staff (others)
is 16.5%. Fewer staff (38%) in total were females, out of which 18% were senior
members,9.5% being senior staff and junior staff (others) were 11.1%. The
implication here is that more men in the University are of higher level status
than females. This also means that the University authorities may have to
encourage more women to pursue further training to get to higher levels in
future. A similar study by Olormtoba and Ajayi (2006) revealed that more men
occupy leadership positions than women.
4.1.3 : A Cross Tabulation of Status and Campus of Respondents
Status: JuniorStaff
SeniorStaff
SeniorMember
Mgt.Member Total
Campus: Winneba 16 38 65 7 126
(5.4) (12.8) (22) (2.4) (43.2)
Kumasi 19 48 37 2 106
(6.4) (16.2) (12.5) (0.7) (35.8)
Mampong 2 36 11 0 49
(0.7) (12.2) (3.7) (0) (16)
Ajumako 3 10 2 0 15
(1) (3.4) (0.7) (0) (4.4)
Total 40 132 115 9 296
(13.5) (44.6) (38.9) (3) (100)
Source: Field Survey, 2012 figures in parentheses are percentages
A cross tabulation of status and campus of respondents revealed that there are
more senior members (22.6%) in Winneba than all the other campuses, with
Kumasi (12.5%), Mampong (3.7%) and Ajumako (0.7%). These numbers reflect
in the size of the campuses vis a vis the available academic programmes and
students. Appointments of senior members to the various campuses are based on
the academic programmes offered on these campuses. This means that the more
www.udsspace.uds.edu.gh

135
the academic programmes and the larger the campus, the more the resource
persons required to support academic work. This is reflected in the University
Corporate Strategic Plan (2009-2013).
4.1.4: A Cross Tabulation of Campus and Sex of Respondents
Campus J/Staff S/Staff S/Member M/Member Total
Sex: Male 17 82 62 3 164
(6) (29) (21.9) (1.1) (58)
Female 20 45 48 6 119
(7.1) (15.9) (17) (2.1) (42)
Total 37 127 110 9 283
(13.1) (44.9) (38.9) (3.2) (100)
Source: Field Survey, 2012 figures in parentheses are percentages
A Cross Tabulation of Campus and Sex of Respondents revealed that majority
of the respondents (58.3%) in all the campuses were males while 41.7% of
females responded for all the campuses. The implication here is that there are
more men in the University than women in all campuses of the University. This
also means that the distribution of human resources to campuses does not depend
on gender. Staff allocation to a campus depends on the need and individual
capability to perform on a madate required and therefore any attempt to bridge
the gender inbalances here may not be very important. Again this differences in
gender imbalances on various campuses may not necessarily affect
communication.
www.udsspace.uds.edu.gh

136
4.1.5: A Cross Tabulation between Rank and the Campus of the RespondentsRank: Ass Prof/
DRSnr Lec./
SARLecturer/
ARSRA/SAA Others Total
Campus: Winneba 6(2.3)
16(6.2)
43(16.7)
28(10.9)
24(9.3) 117
Kumasi 1(0.4)
0(0.0)
37(14.4)
25(9.7)
27(10.5)
90(35)
Mampong 0(0)
2(0.8)
13(5.1)
9(3.5)
10(3.9) 34
Ajumako 0(0)
0(0)
2(0.8)
8(3.1)
6(2.3) 16
Total 7(2.7)
18(7)
95(37)
70(27.2)
67(26.1) 257
Source: Field Survey, 2012 figures in parentheses are percentages
A Cross Tabulation between rank and the campus of the respondents revealed
that more senior members (26.1%) from Winneba responded, while 14.8%
responded from Kumasi, 5.9% from Mampong and none (0%) responded from
Ajumako. The rest of the respondents were senior and junior staff (53.2%) in all
the campuses. The implication is that, there are more junior and senior staff in
the University. This goes to affairm the ratio in statistics requirement of
manpower needs for the University by the National Accreditation Board (NAB)
of one senior member to five supporting staff.
4.2: Perceptions of Staff on Organisational Communication in UEW
Staff perception on organisational communication in UEW were ascertained by
asking them to state the extent to which they agreed with 30 items that
constituted their perspective on nature of communication in UEW. A one sample
t-test was conducted to determine whether the responses varied from the mean
score. The results of one sample t-test computed at Df = 308; p ≤ 0.05, as
www.udsspace.uds.edu.gh

137
indicated in Table 4.2, show that the t-values for all the statements were
significant at 5%. The implication is that responses to statements from the
sample were representative of the population’s perceptions with respect to
organizational communication in UEW.
This implies that, respondents generally agreed that the nature of communication
in the University is good. This is indicated in the p-values of all the statements
and the mean of means value of 3.86 which is equivalent to 4 on the scale and
corresponds to the ‘Agree’ response category. This means that communication
in the University clearly reflects the general nature of communication and takes
a wide variety of forms ranging from two people having a face to face
conversation to hand signals to messages sent over the global
telecommunication networks (Rouse and Rouse, 2005). Though some mean
values are less than the mean of means value of 3.86, they are perceived to be
statisically significant as evidennced in the study.
www.udsspace.uds.edu.gh

138
Table 4.2: Perception of Staff on Organisational Communication in UEW
Statements N Mean SD t pUse of different Communication channels 309 4.14 0.93 78.39 .000Interpersonal Communication reducedelays
309 3.96 0.74 94.19 .000
Channel of communication chosen 309 4.08 1.02 70.49 .000
Communication skills are necessary 309 4.27 0.91 82.51 .000
Com. /organizational effectiveness exist 309 3.91 1.08 63.31 .000
Communication behavior is required 309 4.04 0.89 79.60 .000Distance in communication is a challenge 309 3.62 1.24 51.49 .000
Use of different channel is important 309 3.95 1.03 67.13 .000Staff state of health influencecommunication
309 3.95 1.15 60.40 .000
Social/cultural issues affect communication 309 3.57 1.29 48.58 .000Level of education influencecommunication
309 3.91 1.08 63.44 .000
Work schedule can affect commnication 309 3.66 1.19 53.81 .000
Sources of information is important 309 3.86 1.03 66.20 .000Place/time of communication is important 309 4.08 0.79 90.29 .000
Team work influence communication 309 4.17 0.97 75.32 .000
University policy affects communication 309 4.31 0.72 105.08 .000
Organizational structure affectscommunication
309 3.87 1.11 61.24 .000
Bureaucracy affects communication 309 4.17 1.06 69.41 .000
Ethnicity/tribalism/nepotism influence c’tn 309 3.82 1.17 57.40 .000
Poor working conditions affects c’tn 309 3.65 1.12 56.94 .000
Dissatisfaction at work affects c’tn 309 3.86 1.11 61.07 .000
Lack of feedbackinfluences c’tn 309 4.27 0.86 87.08 .000
Level of grievances influences c’tn 309 4.08 0.89 80.84 .000
Colleagues level of support influence c’tn 309 3.91 0.96 71.54 .000
Conflict resolution mechanism is necessary 309 3.98 0.97 72.20 .000
Adverse information affects c’tn 309 3.63 1.12 57.23 .000
Use of memo/meeting is necessary 309 3.56 1.12 54.63 .000University regulations/rulesare required 309 2.65 1.21 38.62 .000Lack of vision/mission affects ctn 309 3.42 1.16 51.66 .000Volume of information affects c’tn 309 3.36 1.21 48.65 .000Mean of means 3.86
Source: Field Survey, 2012SCALE: Strongly Agree = 5; Agree = 4; Somewhat Agree = 3; Disagree = 2;
Strongly Disagree = 1. Df = 308; p ≤ 0.05 (significant; 2-tailed)
Common forms of communication in the University include speaking, writing,
gesturing and broadcasting. When a person communicates, he establishes a
www.udsspace.uds.edu.gh

139
common ground of understanding and in the organisational context; it brings
about unity of purpose, interest and effort (Barth, 2003). The process by which
information and feelings are shared by people through exchange of verbal and
non-verbal messages, or the successful transmission of information through a
common system of symbols, signs, behaviour, speech, or writing signals their
understanding of the message received (Kalla, 2005).
In this study, respondents agreed with the perceptive statement that numerous
pathways, channels (oral, written, electronic) are used to convey messages in
UEW (mean =4.08, SD = 1.02) because the satellite nature of the campuses
necessitates the use of various forms of communication. This is done to ensure
that recipients of information are always reached through one form of
communication or the other. This scenario is consistent with the assertion by
Belo (1990) that, the use of different mediums in delivering information would
ensure that, at least, one means of communication reaches the recipient. In an
interview, a staff reported similarly that,
“I sometimes use the memo, whatsapp and short message service (SMS)to communicate simultaneously to staff to ensure that information getsto the recipients through one of these channels. My boss will often askme to go to the recipients in person to deliver or give out informationand further advice that when the person is absent, I call his cell phoneor send him a text message.”
Again respondents agreed with the statement that Interpersonal communication
are more likely to meet specific needs of staff in overcoming risk and
complexities in communication in the University. The statement scored a mean
of 3.96,above the grand mean of 3.86, signifying a higher level of importance as
a communication channel. This finding is in line with Oetzel et al. (2001), whose
research highlighted the link between interpersonal communication and staff
www.udsspace.uds.edu.gh

140
cohesion. In a heterogeneous community like the UEW the use of interpersonal
communication will be one of the surest ways of ensuring staff cohesion and
harmony which will ultimately lead to improvement in job performance.
In an interview, a staff submitted that,
“Our fax machine is not working at the moment and so we resort to theuse of telephones, reports and letters more when communicating outsidethe University and also depending on the right means chosen. How canI work better when I have to go outside the University to fax urgentdocuments?”
This response is in agreement with Longest et al., (2000) that, the least used
channel of communication in a large organisation is the diagonal flow which
links up many staff in the organisation to make information move faster to avoid
bureaucracy.
The perceptive statement,“well developed communication skills were also found
to be statistically significant for personal effectiveness”with a meanscore of
4.27. This implies that effective performance on the job depends on ones
personal communication skills. This will ensure better dissemination of
information as well as better understanding of information so disseminated by
staff. Kay (2000) noted that,the use of a well developed communicationchannel
and skill was necessary for personal effectiveness.
The perception of location of office and time of communication were also both
established to be relevant in the communication process according to the
findings. With amean score of 4.08, it implies distance have some effect on
communication and hence performance in a mult-campus University.These
effects include interuption of messages, delays by the sender, absence of vehicle
www.udsspace.uds.edu.gh

141
or means of communication, poor weather conditions, and power outage on
recipient campus. Message can be distorted if it travels a great distance from its
sender to the ultimate receiver down through the formal school organisation
hierarchy (Tourish, 2010).
This obsevation is again strengthened by a respondent who recounted his
experiences during the interview that,
“I believe our system here is complex because of the different campuses,the distance involved and the short periods we sometimes need to sendmessages which results in interruptions or information loss. Evenrecently we were having meeting of all campus senior staff by videoconference and it keeps going-off!”
Again from the results that, staff agreed teamwork supports the free flow of
information in the University, scored a mean of 4.17. Working in teams help in
fosterimg relationships among staff and promotes cordiality as well. This
facilitates free information flow and engenders trust among staff. This notion is
in line with the findings of Ada (2007) in his contribution to organisational
communication and eliminating barriers in organization that, unclear regulation
and poor team work could affect communication flow in an organisation.
From Table 4.2, staff strongly agreed with the statement that the nature of
communication in the University is bureaucratic and full of red-tapism (mean =
4.31). Bureaucracy has the tendency of slowing down communication or
distorting the message that is being transmitted because it has to pass through
several hands before getiing to the intended users. This strong assersion agrees
with that of Bozeman (2000) who opined that bureaucracies (red-tapes) like
rules, regulations and procedures that remain in force and entail compliance tend
to become a burden in large organisations. Scott and Pandey (2000) have also
www.udsspace.uds.edu.gh

142
indicated that red-tape has been considered as a barrier to improved
communication and and does not benefit clients in general. The adverse effect
of bureaucracy was expressed vividly by a respondent in an interview thus:
“What annoys me most is when I send message and some people tell methey don’t get it just because sometimes it is delivered late. Again, adecision that could be made on a campus after one request will haveto be sent to Winneba; and you have to wait for a long time”
Lack of feedback or not communicating at all is another important statementthat
respondents perceived as necessary and affect information flow(mean = 4.27).
Feedback in the University ensures that the communication process is complete
and there is convergence in meaning in relation to the communication process.
This finding is in agreement with that ofTaylor (2004) that the work place
barriers to communication include not obtaining feedback at all. Again in
supporting this view, Sperry and Whiteman (2003), enumerated five
components of effective communication with feedback as one that is important,
to the individual, team, unit and organisation as a whole. Richardson and Laville
(2010) also pointed out that feedback is a basic requirement of good
interpersonal communication, and plays an important role in the success of
performance in organisations. Feedback has again been shown to be very
important in Personal Communication Model (Oloruntoba, 2012), which
expantiates on both feedback and feed forward of staff in interactive
communication process.
Another important statement that describes the nature of communication in
UEW has to do with the magnitude of grievance and how it influences
communication flow with a mean score of 4.07. The more staff begin to make
www.udsspace.uds.edu.gh

143
complains and file grievances, the slower the communication process and this
tends to affect the general performance of staff. This is because the complaints
and grievances have to be investigated and possibly redressed before further
progress can be made. In discussing the nature of communication, especially
vertical communication in organisations, Carnary (2011) indicated that the
lesser the number of grievances and disputes in organisations, the faster the flow
of information. The findings of Richardson and Laville (2010) also lend
credence to the effect of complaints and grievances on communication flow in
organisations.
4.3: Performance of the Organisational Communication System
Communication systems in the UEW are broad and their levels of availability
depends on the performance of the University’s communication system. These
systems include the staff themselves, telephone, fax machines, computer,
scanners video conference and the networks that are available in the
offices of the University. The knowledge and use of the systems of
communication, the availability and use of ICT and other facilities in the
University determine the communication systems and how they relate to
performance; as appeared in the conceptual framework of this study.
Communication performance here refers to the execution of various tasks in
line with one’s job description vis a vis the tools and channels of communication
available to the individual on the job to meet optimal standard. It also includes
the expectation of a person’s day to day job schedule, depending on his
effectiveness and efficiency within the organisation. The foregoing assertion is
similar toMcGinn and Keros (2002) who demonstrated that people have greater
www.udsspace.uds.edu.gh

144
difficulty developing a shared logic of exchange and coordination when they
communicate with channels with challenges. Similarly, negotiations, according
to Moore et al., (1999) on communication issues to the individual on the job can
result in improved performance if the channels are good. In seeking to bring to
the fore the frustrations in the systems of communication in the University a
staff had this to say:
“I didn’t know how to use the fax machine and that cost me a lot.Sometimes tonner in my printer runs out and I have no spare immediatelyfrom the stores. Paper jam in my old printer also causes frustration”
To further analyse staff perceptions of communication systems’ performance in
the University, the perceptive statements in table 4.8 were subjected to t-test to
determine their influence the communication system performance and the
results, as shown in table 4.8, indicate that all of them were significant at 0.05
or 5% level of significance. This is indicated by the p-values for all the
statements. This implies that they all contributed significantly in influencing the
performance of the communication system in UEW.
In line with the above outcome, Sperry and Whiteman (2003) are of the view
that managers must develop a methodology for thinking through and effectively
communicating with superiors, subordinates and their peers. Communication
with colleagues, should be open to all, whether junior or senior staff with the
view of enhancing performance, information provision and paraticipation in
regulatory and policy process. The finding is again in agreement with that of
Kalla (2005).
The use of magazines/newsletters, sign and demonstrations, characterised as non
verbal communication equally affect performance of staff. In all cases, it is
www.udsspace.uds.edu.gh
145
preferred that for effectiveness in communication, both verbal and non verbal
communication processes in the University should be applied. According to
Riggio (2006) it is important to consider everyone as having difficulties in
conveying and interpreting non-verbal communication, like the use of
magazines/newsletters, sign and demonstrations. Individuals therefore vary in
their abilities to monitor and control their use. In an interview with staff on the
above subject a staff said,
“To a large extent our newsletters and magazines help to make us awareof things but come very late. Currently we use videoconference systemalso to save costs and minimize risks. I remember how we used to travellong distances to campuses for meetings and other programmes, so therecent installation of the video conference system has made me stableand I can now have more time to engage with my students.”
Communication with superiors also significantly influenced the perception of
organizational systems performance (see table 4.8). Communication with
superior affords subordinates the opportunity to air their views, make
complaints, make appeals and, in most cases, make some requests too. Generally
it gives them the opportunity to be part of the decision making process and thus
contributes to the feedback system in the communication process. Table 4.8
again shows that respondents agreed that superiors’ communication with staff
was good with mean value of 3.34. This indicates that majority of the
respondents see communication with superiors to be good in the University. The
means of improving superiors communication with subordinate staff could be
through the vertical communication (top-down and bottom-up) approach in the
organisation. The bottom-up approach to communication affords the staff at
lower levels of the organizational structure the opportunity to freely
communicate with their supervisors. This is likely to improve their performance
www.udsspace.uds.edu.gh

146
at work and hence increase in behavioural conformity with the University’s
goals. This assertion is in agreement with Hall (2007) who suggested that
filtering out “upward communication widely acknowledges that upward
feedback, upward communication and open-door policies deliver significant
organisational benefits” such as enhanced participation and better decision
making. On the other hand, Downs and Adrian (2004) contended that downward
communication and poor upward communication can have significant impact on
employee satisfaction, productivity and overall organisational performance.
The mean values for the use of circulars and notices in communication (3.22) as
shown in table 4.8, is indicative of the fact that the respondents perceive them to
be effective channels of communication. The 3.22 is equivalent to ‘Good’ on the
scale. The results also show that in addition to circulars and notices similar
channels like the use of letters, newsletters, memos, periodicals and magazines,
also influence communication systems and administrative performance in the
University. The availability of information through these channelshelp in
marketing the University, at local, national and international levels. The Harvard
Business Review (1999) classifies the process of communication at the micro
level into formal and informal communication, internal communication
practices (memos, circulars, newsletters, presentations, strategic
communications, work direction, performance reviews and meetings) and
externally directed communications (public, media, inter-organisational).
Though respondents generally perceived the use of circulars, memos and
newsletters to be a good channel of communication, some had some reservation
www.udsspace.uds.edu.gh
147
about their effectiveness and these reservations are captured in the sentiments of
a staff member:
“Even though we get information from our newsletters, they often comevery late. For instance, things you should have known months earlierand act on are sometimes communicated to us very late. I even missed ascholarship opportunity because of the late delivery of a circular”
Superiors communicating with subordinates also influences the communication
systems and performance in the University. The mean score was 3.0 implying
that the communication between superiorsand subordinate is good and it gives
the subordinates the opportunity to contribute to the decision-making process.
More importantly, superiors’ communicatoin with subordinates were usually in
the form of instructions, cautionings and advise and were related to job
termination issues, arbitration outcomes and general news and information about
the organisation. All these communication channels and their availability could
affect job performance. Many researchers agree with the findings of this study.
McGinn and Keros (2002); Tanis and Postmes (2008) and Wolbert (2002)
support involving staff in decision making to improve communication, and De
Dreu and Carnevale (2003) and De Dreu et al., (2008) opined that information
sharing and integration are strongly influenced by the orientation that people
hold toward their negotiation or group discussion partners. Koufteros et al.,
(2007), however, indicated that centralization of decision making process help
minimize communication challenges. A highly elated junior staff member could
not hide her joy about their involvement in decision-making in the University
and had this to say:
“I am always happy when they call us at meetings and ask us of ouropinion. I was a member of the committee that evaluated theprocurement of our furniture because the first one bought three yearsago was not good”
www.udsspace.uds.edu.gh

148
The nature of information flow from colleagues was also perceived to influence
communication systems and performance in the University. A mean value of
3.26 was recorded, indicating that the flow of information from colleague staff
members is perceived to be good. The type of information is either based on
facts or can be classified as grapevine information. Keyton (2011) suggested the
grapevine as one of the methods of improving informal communication but
warned on the careful use of it. Donald et al., (1981) in adding their voice to the
use of grapevine, indicated that it is not a less important source of information.
They also admonished managers to acknowledge the informal communication
systems and use them for the welfare of their staff.
Official information that flow from colleagues to other staff include notices
relating to promotions, transfers, pensions and other conditions of service.
Besides these notices and other detailed information are embodied in the
conditions of service, statute and the scheme of service of the University. In
some few instances the grapevine serves as the initial channel of communication
official information until it is formerly communicated to staff. These happen
when there is information leakage from staff and such instances lend themselves
to all forms of interpretations and assessments, some of which may sometimes
be completely wrong. According to Lumberg and Ornstein (2008) a superior
who requires information from a subordinate in a different department could
obtain it easily and faster through the diagonal approach in communication. This
belief is also in line with the traditional views of communication dominated by
the downward or top-down communication flows.
www.udsspace.uds.edu.gh
149
Other statements that were perceived to influence communication system and
performance in the University had mean values ranging from 2.90 to 2.99. These
statements include staff educational level, knowledge in communication,
management of information, location of campuses and the use of staff
suggestion box. Other statements; quality of media, staff from different
background, chain of communication, sources of information, level of
interaction, use of channel, coaching, staff motivation, staff awareness, staff
opinion and the use of ICT had lower mean scores of between 2.40 and 2.88,
indication that their influence on communication system performance in the
University was rather low.
Poor communication systems, whether for written or oral, can serve as serious
barriers to business and could obstruct the efficiency of work organization. For
instance, vague electronic mail (email) messages that require clarification,
documents that need rewriting due to errors, and uninformed presentations and
speeches, can greatly affect the flow of work in work environment. Effective
communication skills are crucial to successfully completing any job, be it large
or small. Usually when staff team up to complete a task, the value of each
person's skills will increase exponentially. Without implementing clear
communication practices, however, the achievement of the task may come at a
slow pace or may never be completed. Management of organisations should also
be aware that communication skills impact the motivation of staff as a whole. A
highly communicative and collaborative work environment is likely to promote
higher productivity, creativity and inspiration. If communication skills are poor,
employees will have no enthusiasm in doing their work and may question the
www.udsspace.uds.edu.gh

150
value of what they do. Poor communication skills could therefore demoralise
staff and force them to sit through dull and boring presentations where they are
provided with unclear instructions, leading to confusion and monotony. This
behaviour could also cripple the organisation’s innovation and capacity to make
positive contributions to society. The results further indicate that all the t-values
were significant at 5% and this means that all the statements contributed
significantly to the performance of the communication system at UEW.
www.udsspace.uds.edu.gh

151
Table 4.3: Organisational Communication System and Performance
Statement N Mean SD t P
The nature of c'tn system in UEW 309 3.13 0.99 55.49 .000
The use of verbal/non verbal C'tn 309 3.02 1.03 51.74 .000
C'tn with superiors in UEW 309 3.34 1.06 55.45 .000
Staff use of ICT in UEW 309 2.66 1.13 41.34 .000
Use of circulars/notices 309 3.22 1.07 52.71 .000
Staff suggestions Ctn system 309 2.98 1.09 48.19 .000
Staff opinions Ctn system 309 2.72 1.24 38.36 .000
Level of staff awareness on Ctn system 309 2.56 1.04 43.53 .000
Contributions made by staff 309 3.03 0.97 54.96 .000
Nature of staff feedback 309 2.54 1.03 43.23 .000
Level of staff motivation 309 2.56 1.17 38.58 .000
Information available in UEW 309 2.76 0.96 50.62 .000
Feedback from superior 309 2.78 1.52 32.08 .000
Subordinate C'tn level 309 3.00 1.56 33.84 .000
Opinion on location of campuses 309 2.94 1.05 49.18 .000
System of C'tn in general 309 2.85 0.10 50.35 .000
Effect of size of campus in Ctn 309 2.76 1.02 47.44 .000
Nature of coaching & communication 309 2.44 1.11 38.80 .000
Time of C'tn in intra-campus 309 2.53 1.09 40.86 .000
System of C'tn with campuses 309 2.63 1.02 45.29 .000
The use of of channel of Ctn 309 2.72 1.07 44.67 .000
Level of interaction of staff 309 2.85 1.07 46.57 .000
Information flow from colleagues 309 3.26 0.93 61.26 .000
Management of information 309 2.90 0.93 54.80 .000
Sources of information 309 2.82 0.85 58.23 .000
Chain of communication 309 2.75 0.97 49.85 .000
Knowledge in communication 309 2.92 0.94 52.96 .000
Staff of different backgrounds 309 2.79 0.91 53.77 .000
Staff educational level in Ctn 309 2.99 0.87 60.37 .000
Level of quality of media 309 2.77 0.99 49.31 .000
Mean of means 2.84
Source: Field Survey, 2012Scale: Excellent = 5; Very Good = 4; Good = 3; Fair = 2; Poor = 1, df = 308;
p ≤ 0.05 (significant; 2-tailed)
www.udsspace.uds.edu.gh

152
4.4: Organisational Communication and Group Cohesion
Staff cohesion in the University was expected to influence larger group
communication and general participation in University activities. Group
cohesion as used in this thesis refers to the degree to which a number of people
constantly work together for the achievement of a common goal. The effects of
organisational communication system on group cohesion was measured on a 3-
point Likert scale with response categories as high (3), medium (2) and low (1).
On the whole respondents are of the opinion that group cohesion in the
University is moderate with a mean of means of 1.90 which is equivalent to 2
on the scale. All statements with mean values greater than the mean of means
value of 1.90, were deemed to influence group cohesion in the University
positively.
The first variable, staff cooperation, had a mean value of 2.04 and therefore
influences group cohesion in the University. The cohesion among staff has
resulted in cordiality and collaborations that ensure complimentality in terms of
job performance. Sections within the University complement each others efforts
where necessary, to ensure effectiveness and efficiency. Staff with heavier work
load sometimes get assistance from colleagues. Some departments on the same
campus in the University which do not offer sandwich academic programmes,
for instance, rely on the support of staff of other departments to augment their
mapower base for effective implementation of their programmes. Similarly,
there is cross-campus collaboration among staff that makes it possible for staff
with special skills and expertise to offer support in the running and management
of programmes that require their expertise. Neorreklit and Schoenfeld (2000)
www.udsspace.uds.edu.gh

153
however, opined that the problems of cooperation among staff arise from lack
of understanding between work groups in merging organisations and that
reduces effectiveness at work. Staff cooperation, according to Alagheband
(2004), is rather a mutual communication between subordinates and superiors
that makes them more acqainted with each other. Building acquaintances among
staff ensures cordiality and harmony which ultimately enables them to work
together without much difficulty.
Allowing staff to express their opinions freely on matters relating to the
management of the University yielded a mean score of 2.14, meaning that the
staff are of the view that expression of opinions has a moderate influence on
group cohesion. See Table 4.4. When individuals in groups are given the
opportunity to air their views in the University, it could enhance the level of
cohesion of those groups. Decision-making process in most cases, give staff the
opportunity to make their suggestions and bring forward their views on critical
issues. This makes them feel involved and enhances their active participation in
the decision-making process. It again enhances ownership of decisions made
and thus reduces resistance during inplementation. Boree and Thill (2000) are
of the view that exchanging knowledge and opinions in organisational
communication promotes positive atmosphere in organisations.
The following statement from a staff member during the interview conducted
apear to be in line with the above outcome,
“Some meetings like the open forum facilitate group cohesion. The endof year party for me is best and that is where people have theopportunity to socialise. I get satisfied and closer to people when ourleader is good and sociable but rather afraid when he is the strict type.”
www.udsspace.uds.edu.gh

154
Tribalism influences group cohesion in the University with a mean score of 2.08.
From the results in Table 4.4 respondents agreed that the influence of tribalism
was moderate within staff of the University. It is normal to find people from the
same cultural background with the same values/beliefs interacting more often at
work places than they would do with people from other cultural backgrounds.
This could result in segregation, sidelining, exclusion, non-recognition and
nepotism. Even though tribalism may not be new to staff experiences in UEW,
the fact that it has a moderate influence on group cohesion is indicative of the
fact that management has to find ways of encouraging interaction across cultures
and tribes so as to further reduce its influence to the bearest minimum. The
findings of this study confirm what was discovered by Grunig et al (2001) and
Tindal (2009) that people coming from different backgrounds could promote
racial, tribal insensitivity, tension and mistrust in the work place. This sentiment
expressed by one of the respondents about the medium of communication lends
credence to the influence of tribalism on group cohesion in the University.
“I feel comfortable communicating in my local language than in English,so I am closer to people from my traditional or cultural background.”
The effect of dissatisfaction among staff in the University on group cohesion
also recorded mean of 2.01 as indicated in Table 4.4. From the results,
respondents agreed that dissatisfaction among staff at work was moderate.
Factors that make staff unhappy or uncomfortable are most likely to result in
dissatisfaction among staff. Some of these factors are management/leadership
style, conditions of service, inadequate facilities for work and selective justice.
This finding by this study falls in line with the outcome of Zhang and Agarwal’s
www.udsspace.uds.edu.gh

155
(2009) research which indicated that many organisational output including staff
disasisfacation could affect organisational efficiency negativity.
Inadequate and/or unclear information communicated through the use of
circulars, bulletins and magazines is also perceived by the respondents to
moderately affect group cohesion with a mean score of 2.08. It is perceived that
the use of such documented means of communication could promote group
cohesion, enhance performance and promote information flow in the University
if staff were well informed and well connected on their availability and use. In
the opinion of Cheney and Christenson (2001), lack of adequate information,
interaction, the right network and cross-fertilisation of ideas could partly be
blamed on poor group cohesion.
Respondents perceived all the remaining statements to have moderate influence
on group cohesion in the University. These statements have mean values ranging
from 1.65 for gender stereotyping to 2.05 for non-uniformity in salary.
University management need to work towards addressing these sentiments or
opinions expressed by staff so as not to situation. A further deterioration in group
cohesion could create divisions and disunity among staff. This will, in turn
reduce staff morale and ultimately affect performance adversely.
Another variable that lowly affected group cohesion was the inadequate nature
of capacity building in communication among peers in the University with a
mean score of 2.04. In effect, the availability of training (long and short term),
in-services training, on-the-job training, orientations and attachments for staff in
www.udsspace.uds.edu.gh

156
the University, could greatly affect the level of cohesion. Inadquate nature of
capacity building in communication among peers was observed by Chory and
Hubbell (2008) who stressed that communication barriers that interupt activities
could commence from limited capacity building due to lack of money and time.
Non uniformity in the single spine salary structure on group cohesion also
influences group cohesion in the University with a mean score of 2.05, indicating
the effect of disparities in pay structure on group cohesion. When senior
members, senior staff and junior staff of the University have issues on salary
placements and some disparities, it beholds on the Public Service Authorities
(PSA) to streamline such issues to avoid possible strikes and other social unrest
cases. Non uniformity here is similar to absence of fairness and if not considered
could affact not only group cohesion but general commitment of staff in UEW.
In a similar argument on fairness in working environment, Podskeoff et
al.,(2000) developing their argument from Organ and Ryan (1995) concluded
that when personality and citizenship performance are carefully considered, it
will result in organisatinal commitment in the long run.
Other Variables from the analysis have effect on group cohesion but were at a
lower level. Whiles promotion/transfer of staff, communication facilities, level
of development/growth, staff moral nature of communication and unclear
University policy all scored a mean greater than 1.90, in-fighting among staff,
individual personal interest, inter/intra campus communication, time/place of
communication, the use of grapevine information, divide and rule method, the
multi campus nature of the University, well defined nature of job description,
www.udsspace.uds.edu.gh

157
the availability of information feedback information and the level of motivation
also scored means greater than 1.80.
Variables with the least influence on group cohesion scored mean values
between 1.60 and 1.80 and include gender stereotyping, information from
colleagues, effect of job improvement/rotation, the use of ICT and periodic
training for staff Okiy (2005) in line with similar with the above points out poor
and inadequate telecommuniation facilities among others as challenges
militating against effective communication. Improving on effective
communication upwards, grapevine communication, among others, that could
more faster in working organisations should be restored to (Keyton, 2011).
Again communication based on feed back for effectiveness. Harvey-Jones
(2005) indicated that communication must be seen as a dialogue and not a
monologue.
www.udsspace.uds.edu.gh

158
Table 4.4: Group Cohesion effect on organisational communication
Source: Field Survey, 2012 Grand mean 1.90Scale: Low = 1 Moderate = 2 High = 3
4.4.1 Cluster Analysis of Staff on Group Cohesion in UEW
The University promotes the use of committee system which contributes to
building team spirit among staff across the organisational structure. Creation of
Statement N Mean SD
Level of staff cooperation 304 2.04 0.59
Level of staff motivation 301 1.88 0.59
Periodic training available 300 1.70 0.71
Existence of a two-way communication 300 1.84 0.62
Effect of feedback in communication 300 1.84 0.70
Use of ICT in communication 301 1.79 0.68
Opinion on expression communication 297 2.14 0.72
Promotion/transfer of staff 301 1.94 0.72
Communication facilities available 296 1.95 0.75
Information availability for staff 296 1.84 0.65
Well-defined job description 299 1.84 0.79
Effect of job improvement on Ctn 291 1.73 0.75
Effect of multi-campus nature in Ctn 296 1.86 0.79
Level of growth &dev't in Ctn 294 1.94 0.68
Existence of divide & rule method 292 1.80 0.82
Staff morale on communication 296 1.91 0.72
Level in use of grapevine information 293 1.90 0.79
Effect of tribalism communication 296 2.08 0.81
Self ego/selfishness in communication 290 1.98 0.84
Dissatisfaction among staff in Ctn 294 2.09 0.84
Time of communication by staff 294 1.89 0.81
Lack of circulars/bulletins 292 2.08 0.85
Intra/inter campus communication 294 1.90 0.79
Effect of C'tn on staff 296 1.91 0.74
Nature of communication 285 1.93 0.79
Information from Colleagues 283 1.80 0.82
Gender stereotyping in Ctn 288 1.65 0.78
Personal interest on Ctn 282 1.81 0.82
Nature of capacity building 287 2.04 0.82
Unclear policy statements 289 1.94 0.84
Non-uniformity in salaries 292 2.05 0.87
In fighting among colleagues 291 1.83 0.88
www.udsspace.uds.edu.gh

159
committees are based on policy documents provided by the University and
officially communicated to all staff. Team dynamics such as personality
differences, qualification and personal interest drive the action(s) of each staff,
hence the tendency to either stick to work norms or get involved in other
personal matters or organisational politics in an attempt to lobby for specific
policy measures to be taken in the University. These team differences,
competition and indirect struggle for limited budgeted resources could again
result in the formation of natural cliques, given the different background of staff.
These cliques, again, ould metamorphose into ideological blocs, thereby
creating larger groups (clusters) in communicating directives on task execution
to promote the objectives of the University.
A two step cluster analysis was therefore used to identify the natural group
cohesion of staff in UEW. Though the variables were measured on a three-point
Likert scale (low, moderate, high), the two step cluster analysis was deemed
appropriate, because, it was to identify the tendency for respondents to converge
in a particular group, even if the variables were measured differently or not on
the same scale.
In all, four clusters were identified and these were based on staff classification.
Cluster one was dorminated by Senior members and Senior staff (lecturers,
Assistant Registrars, Senior Research Assistants and Senior Administrative
Assisstants) who are likely to assist or be directly involved in the implementation
of the strategic objectives of the University. The cluster is therefore labled
tactical group, which serves as the medium for work plan implementation too.
Cluster two was also dorminated by Junior and senior staff (Senior Research
www.udsspace.uds.edu.gh

160
Assistants, Senior Administrative Assisstants and clerks) and is named as
operational group (cluster). This group contributes to communication through
proposals, suggestions, appeals and requests. Clusters three (3) comprise only
Senior members of the University community: Professors, Registrar, Associate
Professors, Deputy Registrars, Senior Lecturers and Senior Assistant Registrars,
hence the cluster is the Strategic communication group in the University. The
calibre of staff here are likely to make final decisions for the University and
approve all plans including the corporate strategic plan initiated by the tactical
group. Contingent cluster, cluster four (4) on the other hand, is not dominated
by any management level group but consists of a mixed spectrum of staff who
associate themselves with the work environment based on the situation at hand.
Membership of this cluster is drawn from various segments of the University
based on expertise, skill, interest among others. A case in point is a committee
put in place to investigate issues or staff or a representation to a funeral on behalf
of staff in the University. The clusters, names, membership and their roles are
summarised in Table 4.4.1.
Table 4.4.1. Summary of Group of Staff/RolesCluster
Name Membership Roles
1 Tacticalgroup
Seniormembers andsenior staff
Supervisory role (leading, directing andinstructing) Implementor of tasks
2 Operationalgroup
Senior staffand Juniorstaff
Executing day to day tasks, workforce(executing task, taking instructions &reporting)
3 Strategiccommunication group
Seniormembers
Managerial role of providing vision(terms of reference, resources,discipline, etc)
4 Contingentgroup
Mixed staff Depending on situation/tasks, staff areselected for particular an specific tasks.(eg. Crises Communicationmanagement, Ad-hoc committee, etc)
www.udsspace.uds.edu.gh

161
The four clusters identified represent employee cohesion patterns. Cluster 1 had
105 respondents, representing 34%. Cluster 2 had 107, respondents representing
34.6. Clusters 3 and 4 had 81 and 16 members, representing 26.2% and 5.2%
respectively. A chi-square test of independence between the groups and
employee ranks showed : 51.797 (df = 15) P < 0.01. This means that
employee rank has the tendency of influencing group patterns as staff usually
will feel more comfortable with colleagues of the same rank. Again the chi-
square test for employee membership of a cluster (group) was also influenced
by the campus of the employee with : 19.061 (df = 12) P < 0.05. The results
are consistent with communication practice in the University, since ranks and
campuses determine the job specification (various campuses have different areas
of specialisation). Winneba campus specialises in Arts and Social Science;
Kumasi, in Business and Technology; Mampong is into Agriculture while
Ajumako specialises in Languages.
Table 4.4.2 Cluster Distribution of StaffCLUSTERS
1(Tactical)
2(Operational)
3(Strategic)
4(Contingent)
Total
Ass Prof/DR 0 1(0.3) 5(1.6) 1(0.3) 7(2.3)SnrLecturer/SAR
6(1.9) 2(0.6) 10(3.2) 0 18(5.8)
Lecturer/AR 31(10) 26(8.4) 34(11) 5(1.6) 96(31.1)SRA/SAA 14(4.5) 39(12.6) 12(3.9) 6(1.9) 71(23)Others 31(10) 24(7.8) 11(3.6) 1(0.3) 67(21.7)
Figures in parentheses are percentagesSource: Field Survey, 2012
2
2
www.udsspace.uds.edu.gh

162
Table 4.4.3 Cluster distribution across campus
Figures in parentheses are percentagesSource: Field Survey, 2012
Table 4.4.4 Cluster Membership Distribution
n% of
Sample% of Cummulative
Sample
Cluster 1 105 34.0 34.0
2 107 34.6 68.6
3 81 26.2 94.8
4 16 5.2 100
Total 309 100.0
Source: Field Survey, 2012
4.4.2 Categorical variable importance in cluster determination
To better understand communication parameters influencing respondents
membership of a group, cluster determination was conducted with the
Bonferroni Adjustment, with the Chi-square as the test statistics for the four
groups. In Cluster 1, the test revealed that staff moral, communication facilities,
promotion/transfer of staff, time of communication and the two-way
communication channels were the communication variables that influenced
respondents cluster membership. In Cluster 2, staff moral, divide and rule
method, the multi-campus nature, well defined job description and nature of
capacity building, significantly determined employees’ membership of the
cluster.
CLUSTERS
1(Tactical)
2(Operational)
3(Strategic)
4(Contingent)
Total
Winneba 39(12.6) 43(13.9) 38(12.3) 12(3.9) 132(42.7)Kumasi 36(11.7) 43(13.9) 25(8.1) 3(1) 107(34.6)Mampong 23(7.4) 13(4.2) 14(4.5) 0 50(16.2)Ajumako 6(1.9) 7(2.3) 2(0.6) 0 15(4.9)
www.udsspace.uds.edu.gh
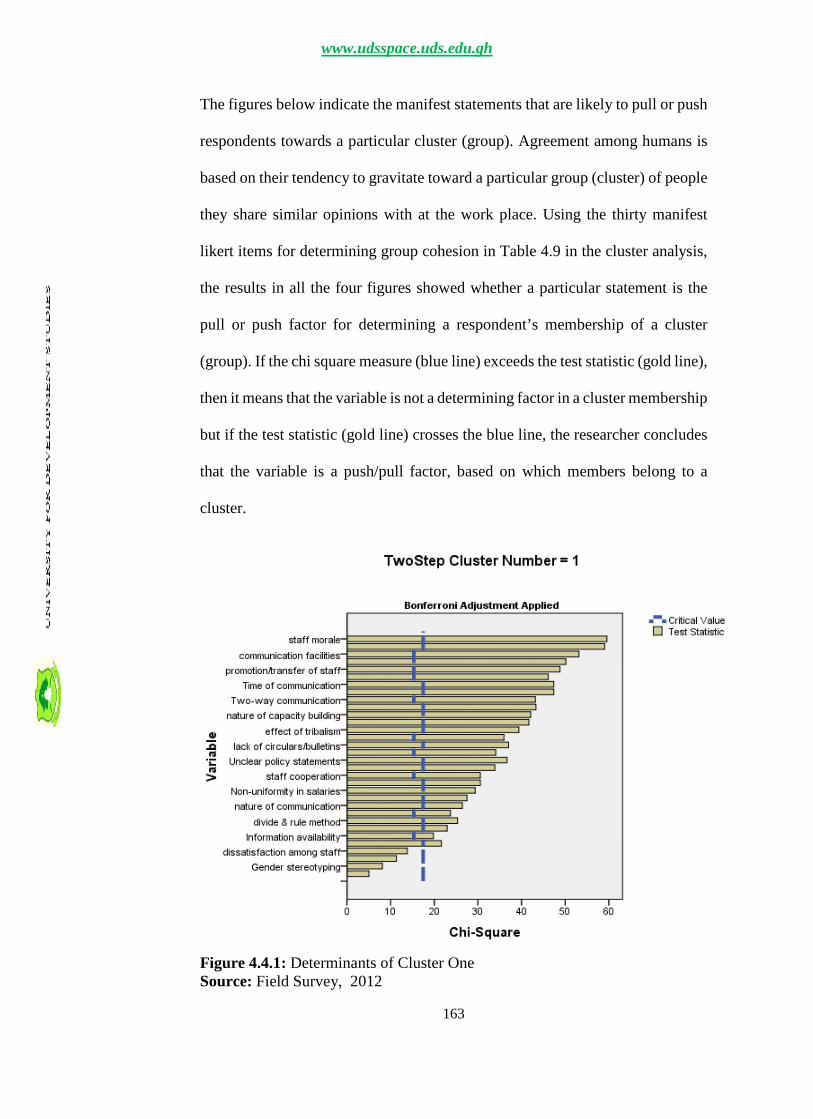
163
The figures below indicate the manifest statements that are likely to pull or push
respondents towards a particular cluster (group). Agreement among humans is
based on their tendency to gravitate toward a particular group (cluster) of people
they share similar opinions with at the work place. Using the thirty manifest
likert items for determining group cohesion in Table 4.9 in the cluster analysis,
the results in all the four figures showed whether a particular statement is the
pull or push factor for determining a respondent’s membership of a cluster
(group). If the chi square measure (blue line) exceeds the test statistic (gold line),
then it means that the variable is not a determining factor in a cluster membership
but if the test statistic (gold line) crosses the blue line, the researcher concludes
that the variable is a push/pull factor, based on which members belong to a
cluster.
Figure 4.4.1: Determinants of Cluster OneSource: Field Survey, 2012
www.udsspace.uds.edu.gh

164
Figure 4.4.2 : Determinants of Cluster Two
Source: Field Survey, 2013
In Cluster 3 respondents generally agreed that personal interest, effect of
tribalism, feedback and self ego determined their membership of the cluster. In
cluster 4, non-uniformity in salary structure, unclear policy statements, nature of
capacity building and information from colleagues influenced respondents
membership.
www.udsspace.uds.edu.gh

165
Figure 4.4.3: Determinants of Cluster ThreeSource: Field Survey, 2013
Figure 4.4.4: Determinants of Cluster FourSource: Field Survey, 2013
www.udsspace.uds.edu.gh
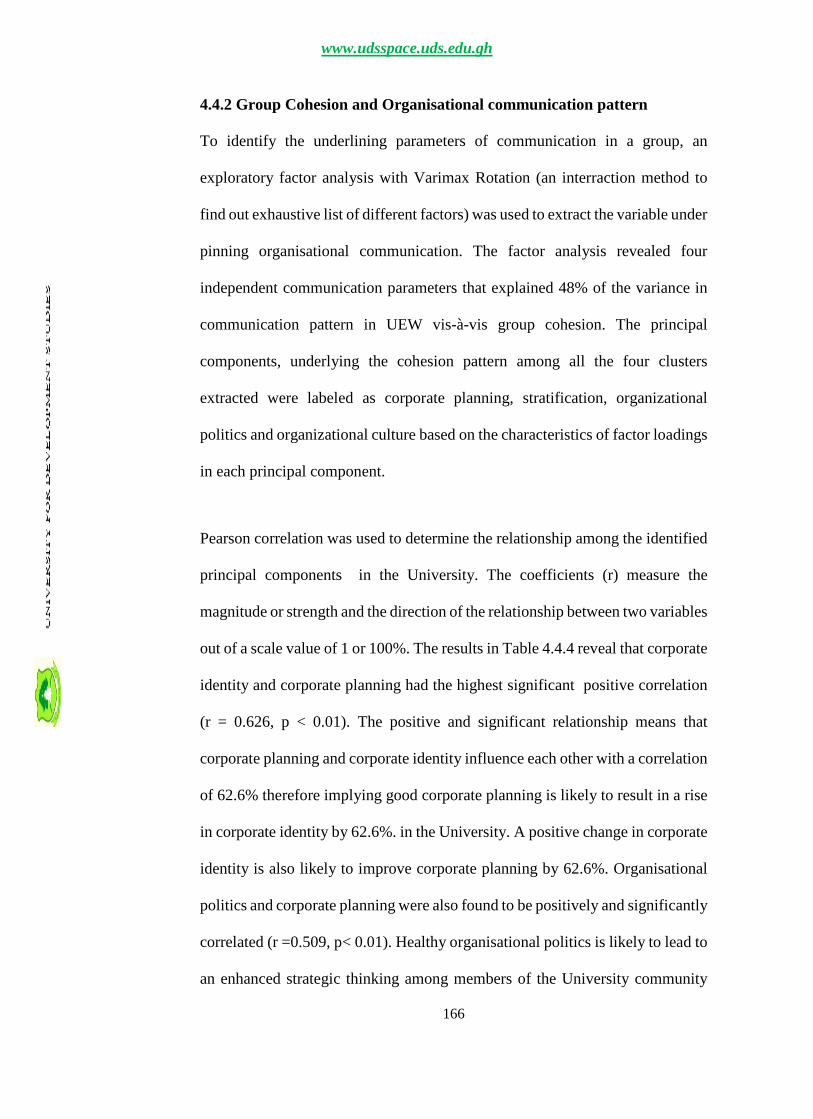
166
4.4.2 Group Cohesion and Organisational communication pattern
To identify the underlining parameters of communication in a group, an
exploratory factor analysis with Varimax Rotation (an interraction method to
find out exhaustive list of different factors) was used to extract the variable under
pinning organisational communication. The factor analysis revealed four
independent communication parameters that explained 48% of the variance in
communication pattern in UEW vis-à-vis group cohesion. The principal
components, underlying the cohesion pattern among all the four clusters
extracted were labeled as corporate planning, stratification, organizational
politics and organizational culture based on the characteristics of factor loadings
in each principal component.
Pearson correlation was used to determine the relationship among the identified
principal components in the University. The coefficients (r) measure the
magnitude or strength and the direction of the relationship between two variables
out of a scale value of 1 or 100%. The results in Table 4.4.4 reveal that corporate
identity and corporate planning had the highest significant positive correlation
(r = 0.626, p < 0.01). The positive and significant relationship means that
corporate planning and corporate identity influence each other with a correlation
of 62.6% therefore implying good corporate planning is likely to result in a rise
in corporate identity by 62.6%. in the University. A positive change in corporate
identity is also likely to improve corporate planning by 62.6%. Organisational
politics and corporate planning were also found to be positively and significantly
correlated (r =0.509, p< 0.01). Healthy organisational politics is likely to lead to
an enhanced strategic thinking among members of the University community
www.udsspace.uds.edu.gh

167
and thereby improving corporate planning by 50.9%. In other words, effective
corporate planning would likely strengthen corporate identity in the University.
The relationships between the other variables (corporate planning and
stratification, organizational politics and stratification, corporate identity and
corporate planning and corporate identity and organizational politics) all had r <
0.5; though statistical evidence points to a significant relationship among these
parameters. What it means is management need to consider these factors in
enhancing and improving staff cohesion in future. Besides it draws the attention
of management to the importance of various informal and formal groups,
constituents and committees in attempt to realise its vision.
www.udsspace.uds.edu.gh

168
Table 4.4.5: PPMC Correlation on Organisational Communication
Control Variables CorporatePlaning
Stratification OrganisationalPolitics
Corporate Identity
CLUSTERS CorporatePlaning
Correlation 1.00Significance (2-tailed)Df
Stratification Correlation 0.416*** 1.00Significance (2-tailed) 0.00Df 306
OrganisationalPolitics
Correlation 0.509*** 0.496*** 1.00Significance (2-tailed) 0.00 0.00Df 306 306
CorporateIdentity
Correlation 0.626*** 0.340*** 0.396*** 1.00Significance (2-tailed) 0.00 0.00 0.00Df 306 306 306
*** indicates significance at 0.01 alpha levelSource: Field Survey, 2012
www.udsspace.uds.edu.gh
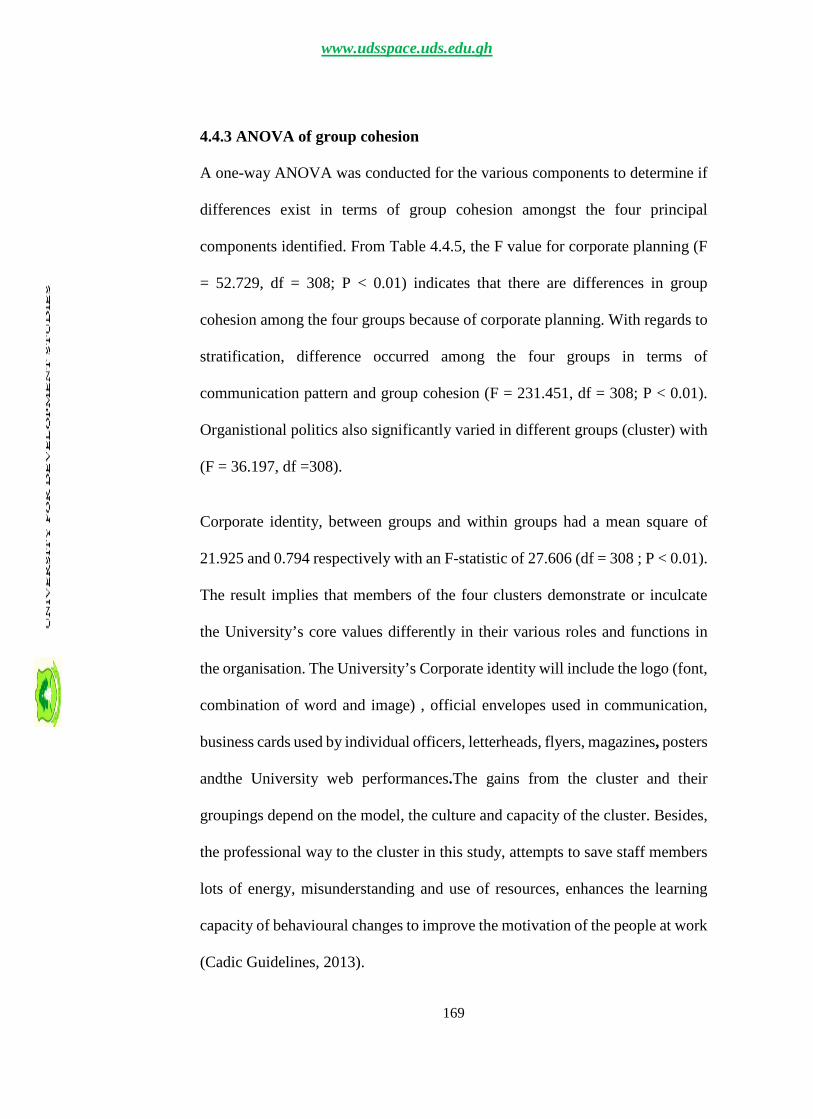
169
4.4.3 ANOVA of group cohesion
A one-way ANOVA was conducted for the various components to determine if
differences exist in terms of group cohesion amongst the four principal
components identified. From Table 4.4.5, the F value for corporate planning (F
= 52.729, df = 308; P < 0.01) indicates that there are differences in group
cohesion among the four groups because of corporate planning. With regards to
stratification, difference occurred among the four groups in terms of
communication pattern and group cohesion (F = 231.451, df = 308; P < 0.01).
Organistional politics also significantly varied in different groups (cluster) with
(F = 36.197, df =308).
Corporate identity, between groups and within groups had a mean square of
21.925 and 0.794 respectively with an F-statistic of 27.606 (df = 308 ; P < 0.01).
The result implies that members of the four clusters demonstrate or inculcate
the University’s core values differently in their various roles and functions in
the organisation. The University’s Corporate identity will include the logo (font,
combination of word and image) , official envelopes used in communication,
business cards used by individual officers, letterheads, flyers, magazines, posters
andthe University web performances.The gains from the cluster and their
groupings depend on the model, the culture and capacity of the cluster. Besides,
the professional way to the cluster in this study, attempts to save staff members
lots of energy, misunderstanding and use of resources, enhances the learning
capacity of behavioural changes to improve the motivation of the people at work
(Cadic Guidelines, 2013).
www.udsspace.uds.edu.gh

170
Table 4.4.6: Oneway ANOVA on group cohesion
Sum ofSquares
dfMeanSquare
FSig.Decision
CorporatePlaning
Between Groups 105.188 3 35.063 52.729.000Reject Ho
Within Groups 202.812 305 .665
Total 308.000 308
Stratification
Between Groups 213.999 3 71.333 231.451.000Reject Ho
Within Groups 94.001 305 .308
Total 308.000 308
OrganisationalPolitics
Between Groups 80.867 3 26.956 36.197.000Reject Ho
Within Groups 227.133 305 .745
Total 308.000 308
CorporateIdentity
Between Groups 65.774 3 21.925 27.606.000Reject Ho
Within Groups 242.226 305 .794
34Total
308.000 308
Source: Field Survey, 2012
4.4.4 Post Hoc Test Analysis
To be sure that the conclusions from the ANOVA Analysis were not spurious, a
Post Hoc analysis with multiple comparison was conducted for all clusters at
95% confidence interval with Dunnett T3 (Appendix 5) being the test statistics
because unequal variances was assumed. Clusters had unequal weights in the
sampled population due to the varying number of respondents in each cluster.
The Dunnett T3 test revealed that, differences do not exist in the various groups
in terms of corporate planning as a determinant of group cohesion. However,
differences do actually exist with regards to the effect of stratification in
communication pattern on group cohesion in UEW.
www.udsspace.uds.edu.gh

171
The above case implies that no differences exist in relation to the effect of
organizational politics on group cohesion. Insignificant relationship also exist
between group 1 and 4, groups 2 and 4, groups 3 and 4 and groups 4 and all
other groups; hence we conclude that no significant differences exist among the
various groups (clusters), giving organizational politics as parameters for group
cohesion. Since there are no differences from the rsults, cohesion here could
influence job performance. Riggio (2006) opined that close and collaborative
relationships with clients may be an important factor in influencing group
cohesion and staff performance. Engleberg and Wynn (2003) also stressed that
when analysing the general effectiveness in group cohesions, there is clear
indication that this cohesion could be weakened when there are differences
among staff, hence productivity and cohesiveness could equally be affected. The
more cohesive the group, the happier and more productive the group can be too
(McBride, 2006).
In brief with objective four, group cohesion here refers to the “social glue” or
bonding relationship for staff to stay together and to be attracted to the group. It
is believed that work teams demonstrating strong group cohesion will function
and perform better in achieving work goals. Cohesion is, however, not caused
by one single factor, but the interaction of more than one factor as has been
depicted by the variables in objective four. While group cohesion may influence
group performance, group performance may create or increase group cohesion
(Tactics, 2012). This could make sense as everyone would want to be on a
winning team. According to Tactics (2012), the influential factor that will create
a positive relationship between group cohesion and group performance is when
www.udsspace.uds.edu.gh
172
the group members' commitment to the organization's performance goals and
norms is high. Another school of thought (Anon, 2014) confirmed a positive
relationship between group cohesion and group performance when the group's
commitment to the organisation's performance/goals was high.
There is the likelihood that members of highly cohesive groups may also be
motivated to accomplish more, which may not necessarily be in line with the
organisation's interest in communication performance process. In such
instances, group cohesion can also have a negative effect on group
task/performance. A case in point is a team of senior members in the University
could have a group interest in helping each other to develop their skills and place
emphasis on matters relating to their promotion rather than on their productivity
or job performance. This should be a wake-up call to management in attempt to
promote cohesion as stated in McBride (2006), that the more cohesive the group,
the happier and more productive it can be. However, when group commitment
to its organisation's performance/goals was low, group cohesiveness will have a
negative relationship with its job performance. Hence when leading a small
group, it is important to understand the appropriate times to use organisation’s
interest alone to avoid misunderstandings (Caputo, Hazel, McMahon, and
Dannels, 2002). Similarly, Engleberg and Wynn (2003) stated that when
analysing the effectiveness of a group, it is important to consider that increased
productivity and increased cohesiveness have a reciprocal relationship in the
group functionality.
www.udsspace.uds.edu.gh

173
4.5: Ranking of Constraints Millitating Agaist Communication Flow
Communication constraints were measured from 30 statements on a five point
Likert scale with the following response categories: 1 = no constraint, 2 = not
serious, 3 = somehow serious, 4 = serious and 5 = very serious constraints. The
Kendall’s coefficient of concordance was used to rank the 30 constraints as
reported by the respondents. The overall mean rank showed a value of 0.04 with
chi-square value ( ) of 389.895 (df = 2) p< 0.01.
The results in table 4.13 indicated that, lack of suggestion boxes is the least
constraint militating against communication with a mean rank of 19.02.
Inadequate office spaces, laboratories and poor transportation system were
ranked as the second least communication barriers with means of 17.95 each.
Bureaucratic procedures has a fair share of 17.19 and was ranked as the third
least factor affecting communication in the University. Low staff morale and
attitude to work had mean ranks of 17.12 and 16.87 respectively, and were
ranked as the 24th and 25thleasts barriers to communication flow in the
University. Other variables such as inadequate motivation, distributed
information, personality differences, absence of mentors, among others had
mean ranks of between 16.75 and 14.51 as indicated in Table 4.5. Unclear
organizational structure and lack of supervision had a mean value of 13.17 each
and ranked as the4th constraints. Distance in the location of offices or
laboratories, inadequate qualified human resource and inexperienced staff were
ranked the most serious constraints in communication patterns with mean values
of 12.98, 12.24 and 12.16 respectively.
2
www.udsspace.uds.edu.gh

174
In conclusion, distances between offices or laboratories (because of where they
are located), inadequate qualified human resource and inexperienced staff are
the most challenging barriers to communication in the University whiles
physical communication facilities such as lack of suggestion boxes, inadequate
office space and poor transportation systems are the least communication
constraints in the University.
Table 4.5: Coefficient of concordance (W) rank of communication constraintsNO. CONSTRAINTS MEAN
RANKPOSITION
1 Lack of suggestion boxes 19.02 28
2 Inadequate office space/ laboratories 17.95 27
3 Poor transportation system 17.95 27
4 Bureaucratic procedures 17.19 26
5 Low staff morale 17.12 25
6 Attitude to work 16.87 24
7 Inadequate motivation 16.75 23
8 Inadequate consultations 16.72 22
9 Inadequate/poor equipment 16.42 21
10 Distort of information 16.38 20
11 Inadequate lighting system 16.31 19
12 No exit interview 16.24 18
13 Personality differences 16.09 17
14 Little grievance procedures 15.96 16
15 Dysfunctional systems 15.64 15
16 Not communicating 15.34 14
17 Geographical location of Campus 15.3 13
18 No open-door policy 15.2 12
19 Ambiguous communication 15.17 11
20 No mentors 14.9 10
21 No meetings/for a 14.74 9
22 Unclear responsibilities 14.71 8
23 Poor room conditions 14.54 7
24 Lack of capacity 14.51 6
25 Lack of c'tn skills 14.3 5
26 Unclear organisational structure 13.17 4
27 Lack of supervision 13.17 4
28 Distance of offices/laboratories 12.98 3
29 Inadequate qualified staff 12.23 2
30 Inexperienced staff 12.16 1
Kendall’s W 0.044; 389.895 (df = 29) p < 0.01. 1 = Hghest constraint and
28 = Least constraintsSource: Field Survey, 2012
2
www.udsspace.uds.edu.gh
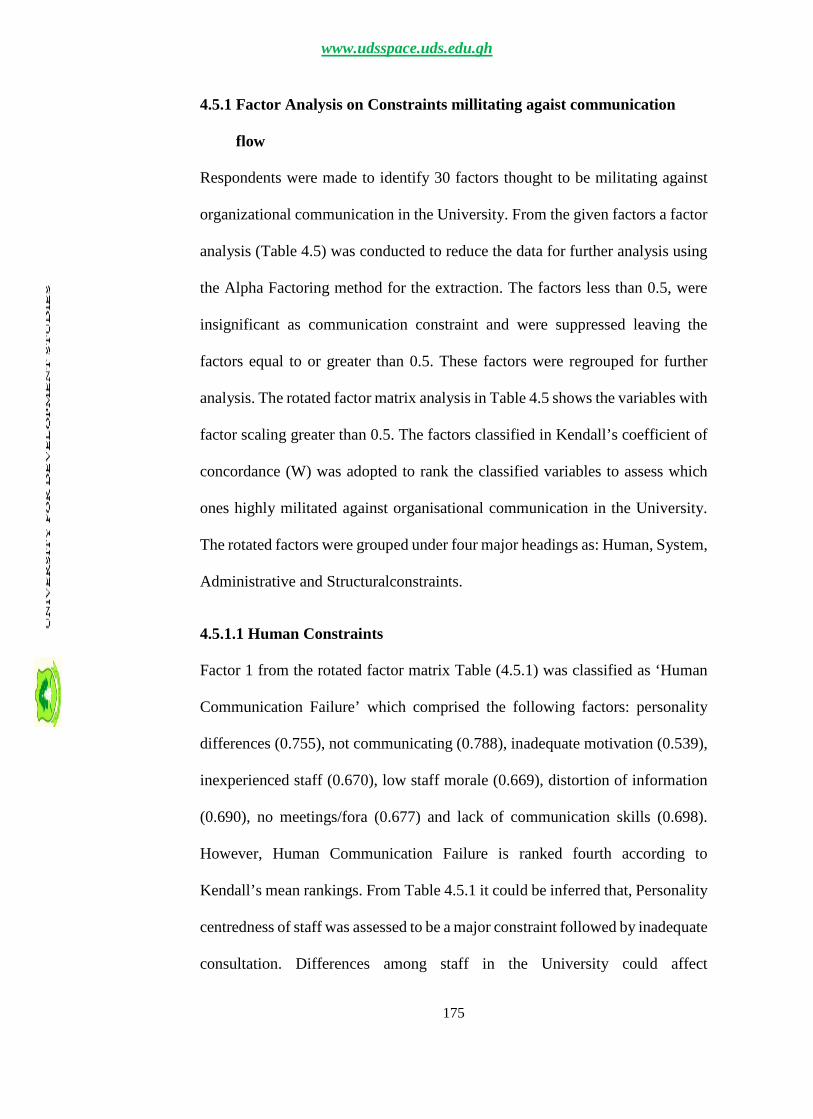
175
4.5.1 Factor Analysis on Constraints millitating agaist communication
flow
Respondents were made to identify 30 factors thought to be militating against
organizational communication in the University. From the given factors a factor
analysis (Table 4.5) was conducted to reduce the data for further analysis using
the Alpha Factoring method for the extraction. The factors less than 0.5, were
insignificant as communication constraint and were suppressed leaving the
factors equal to or greater than 0.5. These factors were regrouped for further
analysis. The rotated factor matrix analysis in Table 4.5 shows the variables with
factor scaling greater than 0.5. The factors classified in Kendall’s coefficient of
concordance (W) was adopted to rank the classified variables to assess which
ones highly militated against organisational communication in the University.
The rotated factors were grouped under four major headings as: Human, System,
Administrative and Structuralconstraints.
4.5.1.1 Human Constraints
Factor 1 from the rotated factor matrix Table (4.5.1) was classified as ‘Human
Communication Failure’ which comprised the following factors: personality
differences (0.755), not communicating (0.788), inadequate motivation (0.539),
inexperienced staff (0.670), low staff morale (0.669), distortion of information
(0.690), no meetings/fora (0.677) and lack of communication skills (0.698).
However, Human Communication Failure is ranked fourth according to
Kendall’s mean rankings. From Table 4.5.1 it could be inferred that, Personality
centredness of staff was assessed to be a major constraint followed by inadequate
consultation. Differences among staff in the University could affect
www.udsspace.uds.edu.gh
176
communication, especially when they decide not to communicate. Bird (2002)
identified three communication-related barriers in business organizations as
moral silence (failing to speak up about issues that are known to be wrong),
moral deafness (failing to hear or attend to moral concerns raised by others) and
moral blindness (failure to recognize the moral implications of actions).
Inadequate motivation and inexperienced staff also millitates against
communication as shown in Table 4.12. This finding confirms that of Johnson
(2003) that motivation was given inadequate attention by models on specific
individual differences that influence performance and further proposed
anexpanded model of how individual differences could influence administrative
performance in organisations. Low morale among staff, distortion of
information, lack of meetings/fora and lack of communication skills among staff
affect communication between and among the staff of the institution. Again lack
of confidence in a person as a result of lack of prior experience and fear of being
exposed to external criticism could serve as a barrier to communication
(Ruderstam and Newton, 2001).
4.5.1.2 System Constraints
Factor 2 from Table 4.5.1 was also classified as ‘System Constraints’ in
communication and values obtained after the analysis were all above 0.5. These
variables included: Inadequate/Poor equipment (0.553), Inadequate qualified
staff (0.588), Inadequate lighting system (0.572), Unclear organisational
structure (0.568), Lack of supervision (0.600) and Unclear responsibilities
(0.706).The results indicate that all the constraints were significant since they
www.udsspace.uds.edu.gh

177
were all above 0.5, emphasising general consensus of respondent. Okiy (2005)
stated that in an academic environment in Nigeria, poor and inadequate
telecommunication facilities, poor level of computer literacy, poor level of
computer facilities, poor level of awareness of internet facilities among policy
makers, government officials and the ruling class in general and minimum
involvement of academic institutions in network building, were challenges
militating against communication. Simmilarly, Chisenga (2004) surveyed the
use of ICTs in public libraries and listed poor equipment and unqualified staff
as some of the factors militating against information, communication and
technology development in Africa.
4.5.1.3 Administrative Constraints
Bureaucratic procedures(0.566), No exit interview(0.527) and Inadequate
consultations (0.537) constituted the third factor. Again from Table 4.5.1, all
figures were above 0.5 and classified as ‘Administrative Constraints’.This
suggests that in a way, administrative bottlenecks such as bureaucratic
procedures, no exit interviews and inadequate consultations militate against
communication and could affect performance in the University. Scott and
Pandey (2000) have indicated that red tape has been considered as a barrier to
improving benefits provided to clients through communication.
4.5.1.4 Structural Constraints
Factor 4 is classified as‘Structural Constraints’ in Table 4.5.1 with values
significant at 0.5 and above. The factor comprises distance of
offices/laboratories (0.500), inadequate office space/ laboratories (0.555), poor
www.udsspace.uds.edu.gh

178
transportation system (0.707) andlack of suggestion boxes (0.592).From the
general findings, the four factor mention have the tendency of affecting
communication performance since they are constraints measured at significant
level. Taylor (2004), opined that barriers to effective communication in the
workplace included staff not thinking clearly before communicating, not
listening intelligently, not selecting appropriate media, poor timing and place of
communication, using inappropriate language and failing to obtain feedback. He
adds that if care is not taken, structural constraint could be disastrous and result
in failure of communication all-together. In addition, distance of office and
laboratories, inadequate office space and laboratories, poor transportation
system and lack of suggestion boxes in the University; all influence the way staff
communicate, as they are not of any form of support in the communication
performance process. Simillarly, Tourish (2010) contends that a message is
distorted if it travels a great distance from its sender to the ultimate receiver
through the formal organisation hierarchy.
www.udsspace.uds.edu.gh

179
Table 4.5.1: Communication Constraints : Rotated Factor Matrixa
Variables Factors
1 2 3 4
Geographical location of Campus
Distance of offices/laboratories .500
Inadequate/poor equipment .553
Inadequate qualified staff .588
Inadequate lighting system .572
Poor room conditions
Inadequate office space/ laboratories .555
Poor transportation system .707
Lack of suggestion boxes .592
Dysfunctional systems
Unclear organizational structure .568
Lack of supervision .600
Unclear responsibilities .706
bureaucratic procedures .566
Ambiguous communication
Lack of capacity
No exit interview .527
Little grievance procedures
No mentors
No open-door policy
attitude to work
Inadequate consultations .537
Personality differences .775
Not communicating .788
Inadequate motivation .539
Inexperienced staff .670
Low staff morale .669
distort of information .690
No meetings/for a .677
Lack of communication skills .698
Extraction Method: Alpha Factoring.Rotation Method: Varimax with Kaiser Normalization.Source: Field Survey, 2012
www.udsspace.uds.edu.gh

180
4.6 Hypothesis Testing
In this part of the analysis and discussions, the null hypotheses were tested for
acceptance or rejection. A case in point is the relationship between demographic
characteristics of staff (independent varibles) and administrative performance
(dependent variable), which were accordingly investigated in the study. Both F-
test and chi-square methods were employed in the calculations and discussed
subsequently.
4.6.1: H01: There are no significant differencesin the effectiveness of
organisational communication among various campuses
The assumption made here is that since the campuses of the University are
located in various distant places, there could be differences also in the
nature/pattern of communication on the different campuses and also between
campuses of the University. Table 4.6 shows the result of the F-test statistics
within campus and between campuses with their mean squares.
www.udsspace.uds.edu.gh

181
Table 4.6.: F Test Difference of Communication PerformanceVariables Sum of
squaresDf Mean
SquareF Sig.
Effect oforganizationalenvironmentcommunicationon groupcohesion
BetweenGroups
120.447 3 40.149 0.778 0.507
WithinGroups
15491.080 300 51.637
Total15611.526 303
Effect ofmanagerialcommunicationon groupcohesion
BetweenGroups
156.435 3 52.145 1.371 0.252
WithinGroups
11408.196 300 38.027
Total 11564.632 303
Constraint tocommunicationflow
BetweenGroups
3926.1703
1308.723
2.482 0.061
WithinGroups
158188.17 300 527.294
Total 162114.34 303
Effectivenessofcommunicationin University
BetweenGroups
2644.484 3 881.495 2.207 0.087
WithinGroups
119437.03 299 399.455
Total 122081.51 302
Perception ofcommunicationenvironment inUniversity
BetweenGroups
889.267 3 296.422 1.837 0.140
WithinGroups
48397.072 300 161.324
Total 49286.339 303
Source: Field Survey, 2012
The null hypothesis of no significant difference in the effectiveness of
communication has not been rejected,in respect of the variables in Table 4.6 at
5% alpha level. The researcher concludes that significant differences do not exist
in the patterns of communication among the four campuses of the University of
Education, Winneba. The implication here is that, the patterns and modes of
communication on the various campuses of the University are similar.
www.udsspace.uds.edu.gh

182
Differences exist in areas of specialisation in academic programmes on various
campuses. The Mampong campus for instance specialises in Agriculture
Education, Kumasi campus is into Technology Education and Business
Education. Ajumako Campus on the otherhand, specialises in Languages, while
the main campus in Winneba, specialises in Sciences, Arts and other Social
disciplines. The implication here is that both non-teaching and teaching staff of
the University are employed based on their competence and specialisation, in
relation to the discipline and this could also influence the pattern of
communication but not significantly. The significance level of the organisational
environment on communication depends on the nature/level of team work,
ethnic influences, social/cultural issues and organisational structure of the
University. The University operates as a unit under one council and policy, one
management, irrespective of the location of campus.
Another variable, managerial communication also does not significantly
influence the nature of communication among staff in the University as indicated
in Table 4.6. This could also be as a results of communication skills, use of
different channels to communicate and the general behaviour of staff in the
University. identity in this direction could be uniform across campuses hence
the level of semblance.
From the above out come, we therefore fail to reject the null hypothesis, hence
there is no significant difference in pattern of communicatin among various
campuses of the University.
www.udsspace.uds.edu.gh

183
4.6.2 H02: Staff profile does not influence the effectiveness of
organisational communication
To test the hypothesis on the selected demographic characteristics of staff, a chi-
square statistic was used to compute the influence.Such demographic
characteristics include gender, rank, education and marital status.
4.6.2.1 Marital status
Marital status from Table 4.6.1 significantly influences the level of
communication effectiveness in the University at 0.01 24.783, df = 6, P < 0.01.
Currently the demographics from Table 4.6.1 show a sizable number,
89(33.6%) of staff are in the single category. The implication here is that many
more of staff in the single category, were likely to proceed on matrimonial and
maternity leave in the near future, hence more responsibility to family life too.
The implication here is that productive working hours in the University as a
whole is likely to reduce in the absence of such staff.
4.6.2.2 Educational level of Staff
The study further revealed that level of education significantly determines the
level of performance. in the University at a significant level of 0.01 24.605, df
8 P < 0.01 that the higher educational qualification one has the better the
performance all things being equal. The implication here is that, as an
educational institution, higher academic qualifications are very important to its
sustainable development. This observation of many well educated staff likely to
perform better falls in line with Boynton (2006) and Plowman (2005) who
2
2
www.udsspace.uds.edu.gh

184
opined that, being highly educated within the mixed-motive model could better
to contribute to communication performance.
4.6.2.3 Staff Status/rank
From Table 4.6.1 Status shows a test statistic of 0.05 20.481, df = 8 , P < 0.01,
meaning that the status of a staff influence his level of communication
effectiveness. The higher the status (senior member or management member)
the more likely it will influence communication effectiveness in the University.
Professional status, like belonging to a Royal Charter, according to Tobin
(2004), could assist pracationers emensely in thier work.
Table 4.6.1: Chi square results of staff profile and communication
performance
Variable 2cal
2tab Df p-value Decision
Gender 4.413 5.992 2 0.110 Not significantMarital status 24.783 12.592 6 0.000 SignificantEducation 24.605 15.507 8 0.002 SignificantRank 20.481 15.507 8 0.009 Significant
Source: Field Survey, 2012
4.6.3: There is no siginificant relationship among staff profile, perception
of communication pattern, communication performance, group
cohesion and constraints (Ho3)
To test for group cohesion, two constructs were derieved from the variables;
staff cooperation, opinion expression, effect of job improvement, dissatisfaction
among employees, use of circulars, nature of communication and non uniformity
in salaries structure were considered. The constructs underpinning group
cohesion are managerial communication and organisational environment. The
2
www.udsspace.uds.edu.gh

185
results of a Pearson correlation test in Table 4.6.2 show that communication
effectiveness is positivelyinfluenced by managerial communication and
organisational environment. The results show that managerial communication (
r = 0.496; p-value = 0.00) is positively correlated and significantly influences
communication effectiveness among employees in UEW, meaning that as
managerial communication improves communication effectiveness also rises.
The effect of organisational environment on effectiveness of communication
among staff ( r = 0.376; p-value = 0.00) is also positive and significant therefore
a conducive organisational environment for communication will increase the
communication effectiveness among staff of the University.
The two variables that measure the group cohesion among staff are organisation
environment and managerial communication and results from Table 4.6.2
indicate a positive relationship with communication performance. When
cohesion is weak, the relationship among staff becomes weak too and that could
affect general performance of staff. This is in line with the findings of Long et
al., (2000). Innovative policies suggested by Long et al (ibid) in dealing with the
effects of weak cohesion on staff performance include motivation, participation,
promotion and consultations.
The correlation matrix in Table 4.6.2 indicates that organisational environment
and managerial communication positively and significantly influence each other
(r = 0.851; p < 0.05). This means that a congenial organisational environment is
likely to improve magerial communication. An organisational environment that
www.udsspace.uds.edu.gh

186
is based on issues rather than personality cult is also more likely to encourage
open managerial communication in the University.
The results in Table 4.6.2 further reveal that a positive and significant
relationship exists between respondents perception of the communication
pattern and the constraints (r = 0.504; p < 0.05). This means that the constraints
militating against the achievement of an effective communication performance
increases staff perception of the communication system in the University. This
implies that management’s inability to overcome the challenges facing the
University communication system is likely to increase staff perception of
insummortable communication barriers in the organisation.
The organisational environment is also positively and significantly related to the
constraints facing the communication system (r = 0.386; p < 0.05). A conducive
organisational environment will minimise the constraints of the communication
contraints in the University. However, an unfriendly or tensed organisational
environment will worsen or increase the communication contraints because of
increased distrust among member of staff.
The ability of management to accept different shades of opinions and employee
willingness to contribute to discussions on management directives and activities
promote group cohesion. This means that communication objectives in the
University should encourage constructive criticisms from employees to promote
team work and enhance productivity, considering the fact that the University
working system also depends on the committee system. This assertion is in line
with the outcome of Yoo and Alari (2001) who found that in established groups,
www.udsspace.uds.edu.gh

187
group cohesion had larger influence than communication media for measure of
task participation and social presence.
Job improvement determines the level of group cohesion. When staff are happy,
it automatically affects their performance and those factors as group cohesion
and increase productivity can be realised (McBride, 2006). Management will
therefore have to design jobs that improve employee capacity and performance
since the University evolves on global parameters in shaping higher education.
Again, when staff become dissatisfied with the communication parameters, it is
likely to affect the team spiritedness and employee performance at the work
place (since people will tend to rely on their own efforts to do everything at the
expense of other employees capacity training). Similarly on the foregoing, Kolb,
Jin and Song (2008) opined that team work, training effectively and employee
participation should cover relationship management, yet little attention is made
towards communication and conflict management.
www.udsspace.uds.edu.gh

188
Table 4.6.2: Pearson Correlation Matrix between staff profile, perception of communication pattern, communication performance, group cohesion
and constraints
Variables Age Experience Organisational
Environment
Managerial
communication
Constraints Communication
effectiveness
Communication
Perception
Age 1
Experience 0.49***
(0.00)
1
Organisational
Environment
-0.101
(0.117)
0.014
(0.813)
1
Managerial
communication
-0.071
(0.27)
0.022
(0.711)
0.851***
(0.00)
1
Constraints -0.048
(0.454)
0.005
(0.934)
0.386***
(0.00)
0.323***
(0.00)
1
Communication
effectiveness
-0.009
(0.886)
-0.017
(0.771)
0.376***
(0.00)
0.496***
(0.00)
0.031
(0.59)
1
Perception of
communication
0.035
(0.59)
0.024
(0.687)
0.244***
(0.00)
0.158***
(0.00)
0.504***
(0.00)
0.032
(0.571)
1
Figures in parentheses are p-values and *** denotes significance at 1% alpha level.
Source: Field Survey, 2012
www.udsspace.uds.edu.gh

189
CHAPTER FIVE
SUMMARY, CONCLUSIONS AND RECOMMENDATIONS
Effective Organizational communication is widely believed to have the capacity
to improve administrative performance in organisations. This study was
premised on the perception that output will seriously be affected if
communication in UEW is ineffective. The study examined the effectiveness of
organisational communication on administrative performance in UEW which
run a multi-campus system. Considering the need for prompt and effective
communication within and between staff of the University for the realisation of
its mission and vision, the study examined the available systems of
communication, administrative performance of the staff and challenges in
communication among others. The mixed research design was adopted for the
study. Using multistage sampling techniques, 428 staff were selected.
Questionnaires were administered to 400 staff and the remaining 28 were
interviewed. A total of 309 (77.3%) questionnaires were returned. The data
collected were analysed using the Statistical Package for Social Sciences (SPSS)
version 18.0 and Microsoft Excel. Descriptive statistics such as frequency
counts, means, standard deviations, percentages, means, factor analysis, cluster
analysis, chi-square, t-test, correlation and F-test were used to analyse objectives
one to five of the study. Three hypotheses were tested in null forms at 0.05 level
of significance using Analysis of Variance (ANOVA) and chi-square.
www.udsspace.uds.edu.gh

190
5.1 Summary of Findings
This section highlights the main findings of the study based on the objectives.
Objective one looked at selected socio-demographic characteristics of staff
were: age, campuses, gender (sex), rank (title), status in the University,
educational qualification, years at post (tenure) and marital status. Majority of
thestaff were in active age group, between 26-40 years. The University has more
malestaff (58.3%) than female(41.7%). Majority of staff involved in the
communication process (37%)were Senior members. In terms of educational
qualification majority of the staff hold Masters Degree. More than half of the
staff (56.2%) have served theUniversity between 1 to 5 years with the rest
serving between 6 to 20 years. Majority of respondents (62.6%) are married.
Objective two sought to measure the perceptions of staff on the nature of
communication in the University using a five point Likert scale.Respondents
generally agreed that the Likert items or perceptive statements reflected the
nature of communication in the University. This is indicated by the overall mean
value of 3.86 which is equivalent to ‘Agree’ on the response scale.
Objective three examined the organizational communication system and the
perception of staff on performance. It was found that, communication systems
available for use in the University are large and were perceived to influence
administrative performance. The knowledge and use of the systems of
communication, the availability and use of ICT and other facilities in the University
are the underlying determinants of communication systems in relation to
performance. Here a mean difference test was used to identify the variables that
www.udsspace.uds.edu.gh

191
influence communication system andadministrative performance.The majority of
the respondents (83.1%) agreed that the natureofcommunication system in the
University was at least good. Their responses ranged from good to excellent.
With respect toobjective four, organisational communicationwas found to have
moderate influnce on staff cohesion with a grand mean of 1.90. Further analysis
using the two step cluster analysis yielded four clusters, namely, tactical group,
operational group, strategic group and contingency group which represented
four employee cohesion patterns, Senior members and Senior staff, Senior staff
and Junior staff, Senior members only and a Mixed group respectively. The two
step cluster analysis againrevealed four groups of employee cohesion patterns.
Clusters I and II showed high cohesion while clusters III and IV showed low
cohesion. This shows that employee rank influences the grouping patterns and
membership of a cluster (group) and was also influenced by the campus of the
employee, as revealed from the chi-square analysis.
An exploratory factor analysis with Varimax Rotation showedthat four
independent communication parameters explained 48% of variance in
communication pattern in UEW vis-à-vis group cohesion.A Pearson correlation
coefficient value of 0.026showed organizational culture and corporate planning
to bepositively and significantly correlated at p < 0.01.The results of a one-way
ANOVA conducted for the various clusters to determine if differences exist
among the four groups identifiedin terms of group cohesion revealed that
corporate planning (F = 52.729, df = 308; P < 0.01) accounted for the
differences.
www.udsspace.uds.edu.gh

192
With objectivefive, respondents were made to identify 30 factors militating
against organizational communication in the University. Factoranalysiswas
conducted to reduce the data for further analysis using the Alpha Factoring
method for the extraction. The factors classified in Kendall’s coefficient of
concordance (W) was adopted to rank the classified variables to assess which
ones highly militated against organisational communication in the University.
Location of offices or laboratories, inadequate qualified human resource and
inexperienced staff were the most challenging barriers to communication in the
University whiles physical communication facilities such as lack of suggestion
boxes, inadequate office space and poor transportation systems ranked the least
communication constraints in the University.
5.2 Conclusions
Based on the findings of the study, the researcher reached the following
conclusions:Selected demographic characteristics play important aspect of the
study. Majority of the staff in UEW are in the 26-40 age range as compared to
the older age groups. The gender structure of staff is also male dominated and
only very few respondents, constituting 2.7% hold Professorial positions.
Majority (44.3%) of the respondents had Masters Degree qualifications in terms
of their educational level. It was clear that more than half of the respondents
have served the University for between 1and 5 years, implying that the
University could continue to rely on the services of experienced staff outside the
University on some academic and administrative matters. Majority of
respondents (62.6%) are married while those who were single constitute 33.6%.
www.udsspace.uds.edu.gh

193
The nature of communication systerm in the University is influenced by the
availability of numerous pathways, channels (oral, written, electronic),
interpersonal communication,communication skills of staff,location of office
and time of communication, teamwork, bureaucracy and red-tapism, feedback
and the magnitude of grievance resolution mechanisms. The effectiveness of
communication at UEW is influenced by the nature of the current
communication system, staff communication with superiors, staff contributions
to discussions, subordinate communication and information flow from
colleagues, the various sources of information and staff educational level. Others
include the use of magazines/newsletters and sign language and demonstrations
(characterised as non-verbal communication). In all cases communication
channel make an interplay in effective flow of information but that comes with
challenges too.
Official information that flow from colleagues to other staff include notices
relating to promotions, transfers, pensions and other conditions of service. In
some few instances the grapevine serves as the initial channel of communication
of official information until it is formerlly communicated to staff.
The effectiveness of communication is also positively influenced by
organisational environment and managerial communication. The demographic
characteristics that influence communication performance among staff are
gender, rank, education and marital status
The factors affecting group cohesion are staff cooperation, expression of
opinions relating to management issues, level of staff dissatisfaction, inadequacy
www.udsspace.uds.edu.gh
194
of information communicated, availability of training (long and short term),
orientations and attachments for staff in the University, Non uniformity in the
single spine salary structure and the multi campus nature of the University.
The most serious constraints millitating against communication flow in the
University are inexperience of staff, inadequate qualified human resource,
distance to offices/ laboratories, unclear organisational structure leading to role
conflict, lack of supervision and lack of communication skills.
Contribution to Knowledge
This study has made significant original contributions to knowledge at both the
academic and practical levels in Ghana as the first explanatory empirical
study. The research is the first of its kind in a Ghanaian University and it has
provided in-depth exploration on the effect of Organisational Communication
on Staff Performance. The literature reviewed as well as the field survey that
was conducted revealed the need for more empirical research to establish
the capacity of effective Organisational Communication to deliver
intended outcomes. The study will contribute to the understanding of gaps that
need to be filled to make Communication more efficient.
Earlier studies on the effect of Organisational Communication on staff
performance were conducted in jurisdictions whose cultural settings are
strikingly dissimilar from the Ghanaian context; hence, another major
contribution to knowledge. The results of this study has added new dimensions
to the study and coupled with the existing stock of theories, it has increased the
www.udsspace.uds.edu.gh

195
knowledge base of the model in training and practice, but in a new context.
The review of the literature in study revealed a methodological deficit because
there is over reliance on qualitative approach in most of the previous studies which
lacked in-depth empirical investigation. However, this study employed both
quantitative and qualitative approaches which made it possible for all aspects of
the study to be extensively explored. Therefore, this study is the first of its
kind to use these approaches and to provide a richer appreciation of
Organisational Communication in Ghana and beyond.
5.3 Recommendations
Based on the findings of the study, the following recommendations are made to
improve the effectiveness of communication in UEW.
1. To ensure effective communication and administrative performance, there is
the need for upgrading the knowledge and skills of staff. Again, majority of
the respondents (73.9%) have degree qualifications. However out of this
large population, only 2.7% are professors or hold analogous position. It is
therefore recommended that management of the University to support the
development of senior members to move towards attaining the statuses of
senior lecturers, associate professors and professors; which could improve
on communication in general.
2. Considering the dispersed nature of the UEW (multi campus nature),
campuses should be given the opportunity to act on routine issues at College
level, making them semi-autonomous, before getting to central
administration. This attempt in decentralizing information through the
www.udsspace.uds.edu.gh

196
support of management could reduce the communication traffic among
campuses or from the main campus, Winneba, to satellite campuses to
further appreciate the essence of time.
3. To enhance administrative performance and effective communication, it is
recommended that the University authority should promote the use of
information flow, feedback, relationships between superiors and
subordinates; and use of circulars, letters, notices, newsletters, should be
greatly enhanced in the University.
4. To enhance organisational communication, group cohesion and team work
is important. The result revealed that staff were unhappy with the influence
of ethno-linguistic use at work place, salary discrimination, lack of capacity
and little cooperation of some staff. It is therefore recommended for
management of the University could use the organissation of durbars and
other social events periodically to bring staff together, create awareness and
foster stronger cooperation to enhance the communication system.
5. For a University to have good organisaional communication and effective
administrative performance, the bottlenecks hindering communication
performance must be done away with. This research revealed a tall list of
communication challenges in UEW. These challenges were classified into
four main constraints (Human, systems, administrative and structural) and
the support of management could reduce the bottlenecks.
a. Human constraint: With human constraint, individuals and groups were
perceived to be the sole cause of such challenges at work. It is recommended
that such staff are identified and given further training and education in
www.udsspace.uds.edu.gh

197
communication, human relations, and appropriate ethical behaviour and with
the needed motivation.
b. Systems constraint: This challenge has to do with the use of machines,
equipment and other resources, e.g. unreliable power supply, poor telephone
network and lack of computers. It is recommended that priority is given to
the provision of appropriate and adequate innovative and durable machines
and equipment to ensure effective communication.
c. Administrative constraint: Bureaucracy was identified as a major
constraint to effective communication and information flow in the
University. It is recommended that the administrative structure should be re-
examined and the possible causes of delays in information flow removed to
ensure effective and timely information dissemination within and without
the University system. There is also the need to create awareness among staff
through education and training on work ethics to make them more effective
and efficient in their work.
d. Structural constraint: Some of the constraints identified in the study were
poor transportation system, lack of suggestion boxes, long distances and lack
of adequate space. It is recommended that management of the University
should make provision for the procurement and supply of these items in
future budgets.
6. Managers need to communicate effectively to motivate staff put up their
best. The following suggestions could improve communication skills in the
work place in the University:
a. Formal speeches, one-on-one and group discussions are popular forms of
verbal communication. Verbal communication ensures speedy information
www.udsspace.uds.edu.gh

198
flow and feedback. However, senior members in the University who have
supervisory roles should be encouraged to constantly reinforce verbal
communication when relating to other levels of staff at work place.
b. Staff lamented that some superiors do not communicate clearly. It is
recommended therefore that management should ensure that through the
periodic in-service training, supervisors are reminded to present their
information, whether verbal or written, in clear and unambiguous language
to reduce the misinterpretation and misunderstanding among staff.
c. The study further identified appropriate media and other effective forms of
communication to include memoranda, SMS messages, notices, meetings
and house journals. The researcher recommends that staff should apply more
than one means of communication (using the principle of redundancy) for
effective information flow among staff. This approach will ensure that at
least one of the messages is received and feedback obtained.
5.4 Areas for Further Research
Though this study has provided valuable insight in to the effect of
communication of staff performance in the study area, it has equally led to
some unanswered questions relative to its capacity to produce the desired
outcomes in Ghana. The research therefore represents the beginning of an
effort that is geared towards making Organisational Communication better.
As a result, further studies are required to broaden this research so as to help
improve the quality of Organisational Communication in Ghana and other
jurisdictions. In view of this, the following recommendations are made for
future research:
www.udsspace.uds.edu.gh

199
This study was limited to only UEW, and it is therefore
recommended that future works should have a larger scope that
would strengthen the findings of this study in order to ascertain
whether generalising these findings is possible beyond where this
research was undertaken.
The researcher also recommends further research to investigate the
influence of other factors such as cultural, job related factors of
trainees, and other environmental issues that could affect the
quality of Organisational Communication in institutions with the
same governance architecture.
Another acknowledged limitation of this study was its over reliance on
data obtained within the period of study. A repetition of this study in
the future could add the benefit of a longitudinal scope and could allow
researchers to understand how the effect of Organisational
Communication can affect Staff Performance.
www.udsspace.uds.edu.gh
200
REFERENCES
Adereti, F. O., Fapojuwo, O. E. & Onasanya, A. S. (2006).Information
utilization on cocoa production techniques by framers in Oluyolelocal
government area of Oyo State, Nigeria. European Journal of Social
Science, 3 (1),1–7.
Adler, R. B., Rosenfeld, L. B., & Towne, N. (1996). Interplay: The process of
interpersonal communication. New York, p.56. Administration Research
and Theory, 10(4), 779-800.
Akinsorotan, A.O. (1995). Village extension agents’ perception of the
appraisal systems in Oyo State agricultural development programme in
Nigeria. Journal of Extension Systems, 17(1), 59–67.
Aldoory, L. &Toth, E., (2002). Gender discrepancies in a gendered profession:
A developing theory for public relations. Journal of Public Relations
Research, 14(2), 103-126.
Ali, M., Pascoe, C. & Warne, L. (2002). Interactions of organizational culture
and collaboration in working and learning. Educational Technology &
Society. 5/2: 60-68. Analysis of boundaries and relationships”, Journal
of Business Communication, Vol. 30.
Alternative explanations from a social psychological model. Journal of Public
Appelbaum, S.H., Gandell, J., Yortis, H., Proper, S. & Jobin F. (2000). Anatomy
of a merger: Behavior of organizational factors and processes. New
York, 44-61.
Argenti, P. A., Howell, R. A., & Beck, K. A. (2005). The strategic
communication imperative.
www.udsspace.uds.edu.gh

201
Argenti, P.A. (1996), “Corporate communication as a discipline”, Management
Communication.
Argenti, P.A. & Forman, J. (2002). The power of corporate communication:
grafting the voice and image of your business. McGraw-Hill, New York.
NY. Pp123-127.
Armstrong, M. & Baron, A. (2004). Managing performance: Performance
management in action. London, CIPD. Pp.303-340.
Bachrach, D. G. (2000). Organizational citizenship behaviours: A critical review
of the theoretical and empirical literature and suggestions for future
research. Journal of Management, 77-98.
Bagshaw, M. (2004). Is diversity divisive? A positive training approaches.
Industrial and Commercial Training, 36, 153-157.
Baker, A. (2003). Biotechnology's growth-innovation paradox and the new
model for success. Journal of Commercial Biotechnology 9 (4), 286–88.
Baker,K.A. (2002). Organizational communication. Chapter 13 Organizational
Communication doc pp1-15.
Bakker, A. B., & Demerouti, E. (2007). The job demands resources model: State
of the art. Journal on American East Zone Study Group, 45.
Baldwin, J. R. & Sabourin D. (2003). Impact of advanced technology use on
firm performance in the Canadian food processing sector.Economic
Analysis Research Paper Series.No. 12.
Barker, L. L. & Barker, D. L. (1993). Communication.Prentice Hall.p.33.
Barnalund (1970): A transactional model of communication. In Mortensen C.
(ed.). Communication theory. (2nd ed.). pp 47-57. New Jersey, NY:
Transaction publications.
www.udsspace.uds.edu.gh

202
Bartels, J., Pruyn, A., De Jong, M., & Van der Molen, M. (2010). Horizontal and
vertical communication as determinants of professional and
organizational identification. Personnel Review, 39(2), 210-226.
Barth, S. (2003). A framework for personal knowledge management tools.KM
World, 12(1), 20-21.
Baym, N. K. (2000). Tune in, log on: Soaps, fandom, and the online community.
Newbury Park, CA; Sage, p.33.
Becker, S. L. & Roberts, C. L. (1992). Discovering mass communication. Harper
Collins, pp. 455-447.
Behn, R. (2003). Why measure performance? Different purposes require
different measures. Public Administration Review 63 (5), 586 – 604.
Bensen, L., Harkavy, I., & Puckett, J. (2000). An implementation revolution as
a strategy for fulfilling the democratic promise of University community
partnerships: Penn-West Philadelphia as an experiment in progress.
Nonprofit and Voluntary Sector Quarterly, 1,24-45.
Berdahl, J. L. & Moore, C. (2006). Workplace harassment: Double jeopardy for
minority women. Journal of Applied Psychology, 91, 426-436.
Berlo, D. (1960). The process of communication: An introduction to theory and
practice. New York: Holt, Rinehart and Winston.
Berman, E. (2000). Performance measurement in US counties: Capacity for
reform. Public Administration Review 60(5), 409–20.
Bezrukova, K., Thatcher, S. M. B. & Jehn, K. (2007). Group heterogeneity and
faultiness: Comparing alignment and dispersion theories of group
composition.
www.udsspace.uds.edu.gh

203
Bhat, P., Prasanna, V., &Raghavendra, C. (2003). Efficient collective
communication in distributed heterogeneous systems.J. Parallel and
Distributed Computing, 63(3), 251–263.
Bird, F.B. (2002). The muted conscience: moral silence and the practice of ethics
in business. Quorum, Westport CT, 45.
Bittner, J. R. (1996). Mass communication (2nd ed.) Canada, 99-102.
Blumberg, M., & Pringle, C. C. (1982). The missing opportunity in
organizational research:
Blundel, R. &Ippolito, K. (2008). Effective organisational communication:
perspectives, principles and practices (3rd ed.). Financial Times/
Prentice Hall, 88-111.
Bollinger, A.S., & Smith, R.D. (2005). Managing organizational knowledge as
a strategic asset. Journal of Knowledge Management, 5(1), 8-18.
Borman, W. C., Penner, L. A., Allen, T. D., &Motowidlo, S. J. (2001).
Personality Trends in Communication. New York, pp456-476.
Bovée, C.L. & Thill, J.V. (2003). Business communication today (7th ed.). Upper
Saddle River, Prentice-Hall.pp332-343.
Bovee, C.L., & Thill, J.V. (1999). Business Communication Today.
Boynton, L.A. (2006). What we value: ADelphi study to identify key values that
guide ethical decision-making in public relations. Public relations
review, 32(4), 325-330.
Bozeman, B. (2000). Bureaucracy in organisation. Upper Saddle River, NJ:
Prentice Hall.
Braun, A. R., Thiele, G. & Fernanez, M., (2000). Farmer field schools and local
agricultural research committees: Complementary platforms for
www.udsspace.uds.edu.gh

204
integrated decision-making in sustainable agriculture. Network Paper
No. 105. ODI Agricultural Research and Extension Network, July 2000.
Brett, J.F., &VandeWalle, D. (Chapanis, A. (1999).) Goal orientation and goal
content as predictors of performance in a training program. Journal of
Applied Psychology, 84 (1999): 863-873.
Brewer, G.A. &Walker, R.M. (2006). The Impact of red tape on governmental
performance: An empirical analysis. Journal of Public Administration
Research and Theory. 20 (2), 233-257.
Brown, H. D. (2004). Language assessment: Principles and classroom
practices: White plains. New York: Pearson Education. p 324.
Brynjolfsson, E. & Hitt, L. (2000). Beyond computation: Information
technology, organization transformation and business performance.
Journal of Economic Perspectives, 14, 23-48.
Burgoon, M., Hunsaker, F. G., & Dawson, E. J. (1994). Human communication.
Thousand. Oaks, CA; Sage.p 47.
Burnett, M. J., & Dollar, A. (1989). Business communication: strategies for
success. Houston, Texas: Dane. pp 99-101.
Busco, C. (2001). When crisis arises and the need for change confronts
organizational communication. Communication Plan Report on South
East Zone of Nigeria, p.87.
Byron, K. (2008). Carrying too heavy a load. The communication and
miscommunication of emotion by email. Academy of Management
Review, 33, 309-327.
Caiden, J.& Caiden, N. (2002). Toward more democratic governance:
Modernising the administrative state in Australia, Canada, the United
www.udsspace.uds.edu.gh
205
Kingdom and the United States’ in E Vigodaed. Public administration:
An interdisciplinary critical analysis, Marcel Dekker, New York.
Callan, V. J. (2004). How vocational education and training providers are
working innovatively with industry. New York, p140.
Callan, V.J., Latemore, G., & Paulsen, N. (2004). The best laid plans:
Uncertainty, complexity and large scale organisational change. Mt Eliza
Business Review (Special Issue), 7, 10-17.
Campbell, J. P. (1999). Modeling the performance prediction problem in
industrial and organizational psychology. In Dunnette, M. D. & Hough,
L. M. (Eds.), Handbook of industrial and organizational psychology,
2nd ed., 1, 687–732.
Campbell, S. L., Fowles, E. R., & Weber, B. J. (2004). Organizational structure
and job.New York, p120.
Canary, H. (2011). Communication and organizational knowledge:
Contemporary issues for theory and practice. Florence, KY: Taylor &
Francis.
Cane, A. (2007). Where do we go from here? Financial Times 11th July 2007.
(Available at http://www.ft.com/home/uk (accessed 30th August 2007).
Caputo, J. S., Hazel, H. C., McMahon, C., &Dannels, D. (2002). Communicating
effectively: Linking thought and expression. Dubuque, IA: Kendall-
Hunt. pp89-102.
Cartwright, S. & Cooper, C.L. (2009). The impact of mergers and acquisitions
on people at work: Existing research and issues. British Journal of
management, 1, 65-76.
www.udsspace.uds.edu.gh

206
Casimir, G., Waldman, D. A., Bartram, T., & Yang, S. (2006). Trust and the
relationship between leadership and follower performance: Opening the
black box in Australia and China. Journal of Leadership &
Organizational Studies, 12(3), 68-84.
Champoux, J. E. (1996). Organizational behaviour: Individual, groups, and
processes. New York. Oxford Press, 45-55.
Chan, Y. (2004). Performance measurement and adoption of balanced
scorecards: A survey of municipal governments in the USA and Canada,
The International Journal of Public Sector Management, 17(3), 204-
221.
Chapanis, A. (1961). Men, machines, and models. American Psychologist, 16,
113-131.
Chapanis, A. (1990). Specifying human-computer interface requirements.
Behaviour and Technology, (9) 6, 479-492.
Chen, J., Silverthorne, C. & Hung, J. (2006). Organizational communication,
job stress and organizational commitment. Communication Research
Report on Students in Stanford University. P.44.
Cheney, G. (2011). Organizational communication in an age of globalization:
Issues, reflections, practice. Long Grove, IL: Waveland Press p.34.
Cheney, G. & Christensen, L. (2001). Organizational identity linkages between
internal and external communication: The New Handbook of
Organizational Communication. Thousand Oaks, CA:Sage. pp 345-453.
www.udsspace.uds.edu.gh

207
Cheney, G. & Christensen, L.T. (2004). Organizational identity: Linkages
between internal and external organizational communication. Thousand
Oaks, CA: Sage.pp.231-69.
Chi, K. S. (1999). Improving responsiveness. Public Administration Review,
59(3), 278–80.
Chisenga J. (2004). ICT in libraries: The new handbook of organizational
communication. South Africa. p 456.
Chory, R., & Hubbell, A. (2008). Organizational justice and managerial trust as
predictors of antisocial employee responses. Communication Quarterly,
56 (4), 357-375.
Citrin, J. & Muste, C. (1999). Trust in government in Robinson, J. P., Shaver, P.
R., & Wrightsman, L. S. Measures of Political Attitudes, San Diego, CA
Clark, P.A. (2000). Organizations in action: competition between contexts.
Communication in culturally diverse work groups: A review and
synthesis. Communication Yearbook. Routhledge, London, 25, 237–
271.
Clark, S. C. (2000). Work/family border theory: A new theory of work/family
balance. Human Relations, 53(6), 747-770.
Coeling, H.V.E., Cukr, P.L. (2000). Communication styles that promote
perceptions of collaboration, quality, and nurse satisfaction. J. Nurse
Care Qual. 14(2), 63-74.
Cohen, A. (1996). Speech acts. In McKay, S.L. &H ornberger, N.H.(Eds.),
Sociolinguistics and language teaching, pp. 383 – 420. Cambridge:
Cambridge University Press.
www.udsspace.uds.edu.gh

208
Coleman, P. T. (2009). A tale of two theories. Implicit theories of power and
power sharing in organisations. In Tjosvold, D &Wisse, B. (eds.) Power
and interdependence in organizations, Cambridge: Cambridge
University Press.
Collier, P. (1998). Operations and Accountability: the role of performance
indicators, financial devolution and strategy in the management of a
police force. International Journal of Police Science and Management,
1(1),81-93.
Communication: Development of internal communications. Public Relations
Review, Vol. 21 No. 3, pp. 181-98.
Cooper, R. (2009). Organization/disorganization in the theory and philosophy
of organizations. (2nd eds.), London: Routledge. pp 167-197.
Coursey, D. H., & Moynihan, D. P. (2007). Organizational effectiveness and
bureaucratic red tape: A multi-method Study. Public Performance &
Management Review, 30(3), 398-425.
Cramton, C. D. (2001). The mutual knowledge problem and its consequences
for dispersed collaboration. Research Management Study for
Communication Research Institutes in Nigeria.1, p.34.
Crane, J. & Crane, F. G. (2010). Optimal non-verbal communications strategies
educationists should engage in to promote positive communication
outcomes. Communication Management. Quarterly, 27 (3), 262-274.
Croson, R. T. A. (1999). Look at me when you say that: An electronic
negotiation simulation. Simulation & Gaming, 30,23-37.
www.udsspace.uds.edu.gh

209
D’Aprix, R. (1996). Communicating for Change – Connecting the workplace
with the market place, San Francisco. Volume 35, Issue 1. Pages 116–
117
Dannels, D.P. & Gaffney, A.H. (2009). Communication across the curriculum
and in the disciplines: A call for cross-curricular advocacy.
Communication Education, 58(1), 124- 153.
Daniels, J. (2010). Assessing the barriers and changes of cross‐cultural
supervision: A case study. Counselor Education and Supervision,
38(3),191-204.
Daniels, J.S. (2002). “Foreword” Information and communication technology
in education – A curriculum for schools and programme for
teacher development. Paris: UNESCO.
De Dreu, C. K. W., & Carnevale, P. (2003). Motivational bases for information
processing and strategy in negotiation and conflict. In Zanna M. P. (Ed.),
Advances in experimental social psychology, 35, 235-291. New York,
NY: Academic Press.
De Dreu, C. K. W., Nijstad, B. A., & Van Knippenberg, D. (2008). Motivated
information processing in group judgment and decision making.
Personality and Social Psychology Review, 12,22-49.
De Vita, G. (2001). Inclusive approaches to effective communication and active
participation in the multicultural classroom. Active Learning in Higher
Education, 1, 2, 168-80.
De Wet, G., Meintjies, C., Niemann-Struweg, I. & Goodman, M.B. (2008).
Corporate communication practices and trends: South Africa
www.udsspace.uds.edu.gh

210
benchmark study 2007/8: report for Corporate Communication
International. 31p.http://www.corporatecomm.org/pdf.
Deetz, S. A., & Putnam, L. L. (2001). Thinking about the future of
communication studies. Communication Yearbook. Canada. pp24, 1-14.
DeFleur, M. L., Kearney, P. (1993). Mastering communication in contemporary
America. Mountain View, CA; Mayfield, p.333.
DeHart, D. & Sanjay, P. (2005). Red tape and public employees: Does perceived
rule dysfunction alienate managers? Journal of Public Administration
Research and Theory 15, 133–48.
Demerouti, E., Bakker, A. B., Nachreiner, F., & Schaufeli, W. B. (2001). The
job demands resources model of burnout. Journal of Applied
Psychology, 86, 499–512.
Dengerink, W. (2015). Teacher educators - A hidden profession: A practical
reflection for administrative and law studies. Social and Behavioral
Sciences, 187, 668-673.
Dengerink, J. (2001). Towards a professional standard for Dutch teacher
educators, European Journal of Teacher Education, 24(3), 343-354.
Dennis, A. R., Fuller, R. M., & Valacich, J. S. (2008). Media, tasks, and
communication processes: A theory of media synchronicity. MIS
Quarterly, 32, 575-600.
Devito, J. A. (1994). Human communication: The basic course. New York:
Harper Collins. pp 32- 48.
DeVito, J. A. (1986). The communication handbook: A dictionary. New York:
Harper & Row.
www.udsspace.uds.edu.gh

211
DeWine, S., & Daniels, T. (1993). Beyond the snapshot: Setting a research
agenda in organizational communication. Communication Yearbook, 16,
331–346.
Dirks, K. T. & De Cremer, D. (2013). The repair of trust: Insights from
organizational behavior and social psychology. In D De Cremer, R van
Dick and J K Murnighan, (eds.) Social psychology in organizations.
London: Routledge.
Downs, C. W., & Adrian, A. D. (2004). Assessing organizational
communication: Strategic Communication Audits. pp. 292
Duignan, K. (2013). Integrated approach to workplace diversity through human
resource. Management Journal of Social and Development Sciences,
4(9), 435-445.
Engleberg, I. N., & Wynn, D. R. (2003). Working in groups’ communication
principles and strategies. Boston, MA: Houghton Mifflin.
Esen, E. (2005). Workplace diversity practices: Survey report. Alexandria, VA:
Society for Human Resource Management.
Euster, J. (1981). Changing patterns in internal communication in large
academic libraries.
Fiol, M. C. (2005). Identification in face-to-face, hybrid, and pure virtual teams:
Untangling the contradictions. Organization Science, 16, 19-32.
Fisher, C.D. (2010). Happiness at work. International Journal of Management
Reviews. British Academy of Management and Blackwell Publishing
Ltd. Volume 12, Issue 4, pp 384–412
www.udsspace.uds.edu.gh

212
Fiske, J. (2006). Introduction to Communication Studies. (2nd ed.,) London:
Routledge.
Fleury, A. (2005). Liberal education and communication against the disciplines.
Communication Education. 54(1), 72-79.
Foulger, D. (2004). Models of the Communication Process. Brooklyn College/
CUNY.pp66.
Foulger, D. (2004). An Ecological Model of the Communication Process.
Retrieved from: httpf://davis.foulger.info/papers/ecological Model of
Communication.html.
Foulger, D. (2013). Models of communication process; davis.foulger.info/
research/ unified Model of Communication.htm
Fox, R. (2001). Poslovnakomunikacija, Hrvatskasveučilišnanaklada. ISBN953-
169-1290 pp, Zagreb.
Gade, P.A. (2003). Organizational commitment in the military: An overview.
Military Psychology. 15, 163-166.
Gade, P.A., Tiggle, R.B., &Schumm, W.R. (2003). The measurement and
consequences of military organizational commitment in soldiers and
spouses. Military Psychology. 15, 191-207.
Gallois, C., Ogay, T., & Giles, H. (2004). Communication accommodation
theory: A look back and a look ahead. In W. B. Gudykunst (Ed.),
Theorizing about communication and culture (pp. 121–148). Thousand
Oaks, CA: Sage.
Galunic, D. C. & Eisenhardt, K. M. (2001). Architectural innovation and
modular corporate forms. Academy of Management Journal, 888-871.
www.udsspace.uds.edu.gh

213
Gardner, M. J., Paulsen, N., Gallois, C., Callan, V. J., & Monaghan, P. G. (2001).
Communication in organizations: An intergroup perspective: The new
handbook of language and social psychology (2nd ed.,) pp. 561-584.
Gardner, M. J., Paulsen, N., Gallois, C., Callan, V.J., & Monaghan, P. (2001).
An intergroup perspective on communication in organizations. In H.
Giles & W. P. Robinson (Eds), The new handbook of language and social
psychology. pp.561-584.
Garud, R. & Karnoe, P. (2001). Path creation as a process of mindful deviation.
Nigeria, Somya press. pp.99-112.
Gaticia-Perez, D. (2009). Automatic non-verbal analysis of social interaction in
small groups: A review Image and vision computing, 27 (12), 1775-
1787.
Ghana Statistical Service, (2012). The 2010 population and housing census,
post enumeration survey report.
Gibson, J. W. & Hanna, M. S. (1992). Introduction to human communication.
Nigeria: Dubuque, IA, pp34-65.
Girard, B. (2003). The one to watch: Radio, new ICTs and interactivity. Rome:
FAO.
Gizir, S., &Simsek, H. (2005). Communication in an academic context. Higher
Education. 50(2), 197-221.
Goldhaber, G.M., Dennis, H.S., Richetto, G.M., &Wiio, O.A. (1984).
Information strategies: New pathways to management productivity. New
York: Ablex. p 455.
Green, T. K. (2010). Race and sex in organizing work: Diversity, discrimination
and integration. Emory Law Journal, 59, 585-647.
www.udsspace.uds.edu.gh

214
Griffin, E. (1994). Communication: A first look at communication theory (2nd
ed.). New York: McGraw-Hill. pp 36-47: A review. Image & Vision
Computing, 27(12), 1775-1787.
Grunig, J., Grunig, L., & Toth, E. (2007). The future of excellence in public
relations and communication management. London: Sage. pp55-70.
Grunig, J.E. (2002). Symmetrical system of internal communication. In J. E.
Grunig (Ed.), Excellence in public relations and communication
management. Hillsdale, NJ: Lawrence Erlbaum Associates. p77.
Hall, M.T., (2007). Becoming authentic: The search for wholeness and calling
as a servant leader.
Hargie, O. &Tourish, D. (2002). How are we doing? Measuring and monitoring
organizational communication. In Tourish, D. & Hargie, O. (Eds), Key
issues in organizational communication, Routledge, London, pp. 234-
51.
Harrison, T. M., & Falvey, L. (2009). Democracy and new communication
technologies. Communication Yearbook, 25, 1–44. Journal of
Communication, December 2004. Paper 444. Harvard Business Journal
Review 77(2): 106–116 pp.
Hartley, J. F. (2008). Intergroup relations in organizations. In M. A. West (Ed.),
Handbook of work psychology London: Wiley.pp. 397–422.
Harvard Business Review (1999), 180, 25-33 (July).
Harvard Business Review. Communication, Negotiation, and Persuasion:
Approaches for Better Results. 30 (4):46-52
Harvey Jones, J. (2005). Facebook: Threats to Privacy Public Policy, MIT
www.udsspace.uds.edu.gh

215
Haslam, S. A. (2000). Motivating individuals and groups at work: A social
identity perspective on leadership and group performance. Academy of
Management Review, 29(3), 459-478.
Haslam, S. A. (2001). Psychology in organizations: The social identity
approach. (2nd ed.). London: Sage.
Haslam, S.A. (2004). Psychology in organizations. A social identity approach
(2n ed.). London: Sage.
Haslam, S.A., Reicher, S.D. & Platow, M. J (2011).The new psychology of
leadership, identity, influence and power. Psychology Press
Hatta, J & Shibusawa, S. (2000). Efficient collective operations of
communication on heteroge- neous networks, Proc. 10th Znt ’1.Parallel
Processings ymp.,pp 399-405.
Heffernan, T. and Poole, D., (2005). "Catch me I'm falling": Key factors in the
deterioration of offshore education partnerships. Journal of Higher
Education Policy and Management, 26(1), 75-90.
Henry, P. (2002). Learning enters the boardroom: making the connection
between strategy and enterprise wide learning. Industrial and
Commercial Training, 34(2), 66 – 69.
Hindi, N. M., Miller, D. S. &Catt, S. E. (2004). Communication and
miscommunication in corporate America: Evidence from fortune 200
firms. Journal of Organizational Culture, Communications and Conflict,
8(2): 13-26.
www.udsspace.uds.edu.gh

216
Hirschheim, R., & Klein, H. K. (1994). Realizing emancipatory principles in
information systems development: The case for Ethics. Management
Information Systems Quarterly, 18(1), 83–109.
Hockney, R. (1994). The communication challenge for MPP: Intel Paragon and
Meiko CS-2, Parallel Comput., 20(3): 389–398.
Hofstede, G. (2001). Culture’s consequences: comparing values, behaviours,
institutions and organizations across nations. (2nd ed). London: Sage
publications. pp 99-112.
Hofstede, G. (2007). Culture: organizations, personalities and nations. European
Journal of International Management, 1(1/2), 14-22.
Holden. N. J. (2002). Central Europe: A precarious playground of business
cultures.’ Keynote address at CEI (Central Europe Initiative). Summit
Economic Forum, Skopje, November, 2001. Paper 100.
Holtzhausen, D. (2002). The effect of a divisionalized and decentralized
organizational structure on a formal internal communication functions in
a South African organization. Journal of Communication Management,
6, 323-339.
Huff Post Life (2014) http://www.huffingtonpost.com/2013/04/08/workplace-
diversity-hindered-by-failure-to-communicate_n_3036874.html
Jablin, F.M., Putnam, L.L., Roberts, K.H. & Porter, L.W., (2001). The new
handbook of organizational communication: Advances in job demands
on burnout. Journal of Occupational Health Psychology, 10, 170-180.
Janssen, O., Van de Vliert, E. & West, M. A. (2004). The bright and dark sides
of individual and group innovation: A special issue introduction.
Journal of Organizational Behavior, 25, 129-145.
www.udsspace.uds.edu.gh

217
Johansson, C. (2003). Visions and realities. case study of communication on
corporate strategy, Uppsala, Uppsala University. P.109.
Johns, G. (2001). In praise of context. Journal of Organizational Behavior,
22(1), 19.
Johnson, B. B. (2004). Risk comparisons, conflict, and risk acceptability claims.
Risk Analysis, 24(1), 131– 134.
Johnson, J. W. (2003). Toward a better understanding of the relationship
between personality and individual job performance. In M. R. Barrick&
A. M. Ryan (Eds.), Personality and work:83–120. San Francisco:
Jossey-Bass.
Johnson, M. W., Christensen, C. C., & Kagermann, H. (2008). Reinventing your
business model. Harvard Business Review, 86, 50-59.
Jordan. A.H & Zitek, E.M. (2012). Marital status bias in perceptions of
employees. Basic and Applied Social Psychology, 34,474–481.
Jorgenson, D.W. & Stiroh K. J. (2000). Raising the speed limit: U.S. economic.
Jossey Bass Journal of Applied Communication Research, 10, 29–37.
Kalla, H. K. (2005). Integrated internal communications: A multidisciplinary
perspective. Corporate Communications 10(4), 302-314.
Kalla, H. (2003). Exploration of the relationship between knowledge creation,
organisational learning, and social capital: role of communication.
Helsinki School of Economics Working Papers, W-360, Helsinki Print
press. P 66.
Katz, D., and Kahn, R.L. (1966). The social psychology of organization. New
York, NY: Willey.
www.udsspace.uds.edu.gh
218
Kelly, D. (1999). Using vision to improve organizational communication:
Leadership & organization. Development Journal, 21(2), 92-101.
Keyton, J. (2011). Communication and organizational culture: A key to
understanding work experiences. Thousand Oaks, CA: Sage.pp 201-222.
Kielmann, T., Hofman, R.F.H., Bal, H.E., Plaat, A., &Bhoed-jang, R.A.F.
(1999). MagPIe: MPI’s collective communication operations for
clustered wide area systems, ACM SIG-PLAN Notices, 34(8), 131–140.
Kim. M, Tasaki. K, Kim, I & Lee. H., (2007). The influence of social status on
communication predispositions. Journal of Asian Pacific
Communication 17(2), 303–329.
Klein, N. (2000). No Logo. London: Harvard Yale University. Pp 25-29.
Kolb, J.A., Jin, S. & Song, J.H. (2008). A model of small group facilitator
competencies. The Pennsylvania State University manual pp.1-8
Konrad, A. M. (2006). Leveraging workplace diversity in organizations.
Organization Management Journal, 3, 164-189.
Koufteros, X.A., Nahm, A.Y., Cheng, T. C. E., & Lai, K. (2007). An empirical
assessment of a nomological network of organizational design
constructs: From culture to structure to pull production to performance.
International Journal of Production Economics, 106(2), 468-492.
Krauss, R. M., & Fussell, S. R. (1990). Mutual knowledge and communicative
effectiveness. In J. Galegher, R. E. Kraut & C. Egido (Eds.), Intellectual
teamwork: Social and technical bases of collaborative work (pp. 111-
146). Hillsdale, NJ: Lawrence.
www.udsspace.uds.edu.gh

219
Kvavik, R.B. & Katz R.N. (2002). The promise and performance of enterprise
systems. Center for Applied Research, Research Study, 4.
Landy, Frank J. & Conte Jeffrey M. (2010). Work in the 21st Century: An
introduction to industrial and organizational psychology. (3rd ed.).
McGraw Hill. pp 56-7.
Lang, J.C. (2001). Managerial concerns in knowledge management. Journal of
Knowledge Management, 5(1), 43-57.
Laswell, H. (1948). The structure and function of communication in society. In
L. Bryson (Ed.), The communication of ideas. pp55. New York: Harper.
Lawson, L. (1999). Determinants of goal orientation. Paper presented at the
annual meeting of the Academy of Management, Chicago. pp55-67.
Le Roux, T. (2004). Practitioner’s constraints in advancing to more senior
corporate communication roles: An exploratory study in the South
African banking industry. Pretoria: University of Pretoria. (Mini-
dissertation - M.Com. Communication Management). p.54.
Le Roux. T., (2010). The contribution of South African corporate
communication practitioners to organisational performance. Thesis
submitted for the degree Philosophy Doctor in Communication Studies
at the Potchefstroom Campus of the North-West University. 2010.
Potchefstroom.
Lea, M., & Spears, R. (1991). Computer mediated communication, de-
individuation and group decision-making. International Journal of Man
Machine Studies, 34, 283-301.
www.udsspace.uds.edu.gh

220
Lewin, A. Y. & Koza, M. P. (2001). Empirical research in co-evolutionary
processes of strategic adaptation and change: the promise and the
challenge. Organization Studies, 22, 6, 5-12.
Loewenstein, J., & Morris, M. W. (2011). In synch and in agreement, for better
or worse: Synchronous communication, Manuscript submitted for
publication.
Longest, B. B., Rakich, J. S., &Darr, K. (2000). Managing health services
organizations (4th ed.). Baltimore: Health Professions Press, Inc.
Luft, P. (2000). Communication barriers for deaf employees: Needs assessment
and problem-solving strategies. pp 14, 51–59.
Lunenburg, F. C., & Ornstein, A. O. (2008). Educational administration:
Concepts and practices. Belmont, CA: Wadsworth/Cengage.pp 88-98.
Luthans, F. (2010). Organizational behavior. (12th ed.) New York: McGraw
Hills. San Francisco: Jossey-Bass Publishers.
Maznevski, M. L., & Chudoba, K. M. (2000). Bridging space over time: Global
virtual team dynamics and effectiveness. Organization Science, 11(5),
473- 492.
McBride, M. C. (2006). "-Ing" project: Encouraging cohesion in small groups.
University of the Witwatersrand, Johannesburg: Historical Papers
Research Archive.
McBurnie, G. & Ziguras, C. (2007). Transnational education: Current issues
and future trends in offshore higher education. London: Routledge.
McClelland, V. A. (1988). Upward communication: Is anyone listening?
Personnel Journal, 124-130.
www.udsspace.uds.edu.gh

221
McCroskey, J. C., & Richmond, V. P. (2000). Applying reciprocity and
accommodation theories to supervisor/subordinate communication.
Journal of Applied Communication Research, 28, 278–289.
McCullough, M. E., Fincham, F. D., & Tsang, J. (2003). Forgiveness,
forbearance, and time: The temporal unfolding of transgression related
interpersonal motivations. Journal of Personality and Social
Psychology, 84, 540–557.
McDonough, E., Kahn, K., & Barczak, G. (2001). An Investigation of the use of
global, virtual, and collocated new product development teams. The
Journal of Product Innovation, 90-99.
McGinn, K. L., & Keros, A. T. (2002). Improvisation and the logic of exchange
in socially embedded transactions. Administrative Science Quarterly, 47,
442-473.
McGinn, K. L., & Keros, A. T. (2002). Improvisation and the logic of exchange
in socially embedded transactions. Administrative Science Quarterly, 47,
442-473.
McGrath, J., M. (2005), A pilot study testing aspects of the integrated marketing
communications concept. Journal of Marketing Communications, 11(3),
191-214.
Mc Guire and Bagher (2010); Diversity training in organisations, an
introduction”, Journal of European Industrial Training, 34(6), 493-505.
McMillan, J. (2004). Quantifying creative destruction: Entrepreneurship and
productivity in New Zealand, New Zealand Economic Papers, Taylor &
Francis Journals, 38(2), 153-173.
www.udsspace.uds.edu.gh

222
McPhee, R.D. &Poole, M.S. (2001). Organizational structures and
configurations. Journal of Personality and Social Psychology, 75(6),
1586-1603.
McShane, S. L., & Von Glinow, M. A. (2003). Organizational behavior:
Emerging realities for the workplace revolution. (2nd ed.). Boston:
McGraw-Hill.
Mehralizadeh, Y. (2005). Globalization of organizational changes and human
resource development Planning. New York. 4(67), 125-155.
Mehralizadeh, Y., Shahi, S., & Sharify, A. (2008). Effectiveness of
organizational Communication. New York: Ablex. p77.
Miller, K. (2006). Communication as constructive. In G. Shepherd, & J. St. John
(Eds), Communication as...perspectives on theory. (pp. 31-37).
Thousand Oaks, CA: Sage Publishing.
Mitchell, T.R., & Daniels, D. (2003). Motivation. In B. Weiner, series ed., and
W.C. Borman, D.R. Ilgen, & R. J. Klimoski, (Eds)., Handbook of
Psychology, Vol. 12: Industrial and Organizational Psychology (pp.
225-254). Hoboken, NJ: John Wiley & Sons, 2003. Print.
Moore, D. A., Kurtzberg, T. R., Thompson, L., & Morris, M. W. (1999). Long
and short routes to success in electronically mediated negotiations:
Group affiliations and good vibrations. Organizational Behaviour and
Human Decision Processes, 77, 22-43.
Morreale, S., Shockley-Zalabak, P., & Whitney, P. (2007). The center for
excellence in oral communication: Integrating communication across
the curriculum. Communication Education, 42 (1), 10-21.
www.udsspace.uds.edu.gh
223
Mortensen, M., & Hinds, P. (2001). Conflict and shared identity in
geographically distributed teams. International Journal of Conflict
Management, 12, 212-238.
Motowidlo, S. J., Borman, W. C., & Schmit, M. J. (1997). A theory of individual
differences in task and contextual. Yearbook of communication
Psychology. pp 55-98.
Mullins L.J. (2002). Management and organizational behavior Italy.New
York, NY: Pearson Education Limited. p 66.
Munene, M. W. (2004). Language planning in South Africa: Towards a
language management approach. PhD Thesis, University of the Free
State.
Nainby, K. (2010). The philosophical and methodological foundations of
communication education. In D.L Fassett & J.T. Warren (Eds),
Communication and education. (pp.3-10). Thousand Oaks, CA: Sage
Publications.
Neher, W.W. (1997). Organizational communication – challenges of change,
diversity, and continuity. Boston: Allyn and Bacon. pp. 241-67.
Newcomb, T. (1953). An approach to the study of communicative acts.
Psychological Review, 60, 393-404.
Nickerson, Mark and Schaefer, Sue (2001) Autonomy and Anonymity:
Characteristics of Branch Campus Faculty, Metropolitan Universities,
Spring 2001, 12, 2, ProQuest Education Journals, p49-59
Niemann-Struweg, I., & Meintjes, C. (2008). Public relations professionalism in
South Africa: A comparative perception study at industry, consultancy
and institutional level. Public Relations Review, 34(1), 224-229.
www.udsspace.uds.edu.gh

224
Noerreklit, H. &Hanns-Martin W. Schoenfeld (2000). Controlling multinational
companies: An attempt to analyze some unresolved issues. The
International Journal of Accounting. 35(3), 415-430.
Norton, R., (2002). Policy paradox: The art of political decision making. pp.428
Norton, R. (1978). Foundation of a communicator style construct. Human
communication Research Journal in Nigeria Institute. 4, 99-112.
Occasional Paper Number 6, p.25.
Nyhan, R. C., (1995). Performance measurement in the public sector:
Challenges and opportunities. Public Productivity and Management
Review 18, 333–48.
OECD, (2002). ICT improves productivity via enabling organisational
innovation. pp 90-121.
OECD (2003), Organisational change and firm performance, DSTI/DOC
(2002)14. Organisation de Coopération et de Développement
Economiques Organisation for Economic Co-operation and
Development
Oetzel, J. G., Burtis, T. E., Chew Sanchez, M. I., & Perez, F. G. (2001).
Investigating the role of communication in culturally diverse work
groups: A review and synthesis. Communication Yearbook of
Managerial Psychology, 22, 309–328.
Okiy, R.B. (2005). Strengthening information provision in Nigerian University
libraries. 397-400libraries. A key note to organizational dynamics.
organizational communication: An interdisciplinary perspective. Sage,
Newbury Park, CA. 29(4), 274–288.
www.udsspace.uds.edu.gh

225
Oloruntoba, A., & Ajayi, M.T. (2003). Motivational factors and employees job
satisfaction in large scale private farms in Ogun State, Nigeria. Journal
of International Agriculture and Extension Education, 10(1), 67-72.
Oloruntoba, A., Ajayi, M.T. (2007). Gender and Research Attainment in
Nigerian Agricultural
Olountuba, A. (2008). Agricultural student preparations of farm practical
programme of University of Agriculture, Abekuta, Nigeria. Original
Scientific Paper, 73(4), 245-252.
Olountuba, A. (2011). Lectures and personal communication. University for
Development Studies, Tamale. Unpublished.
Omolayole, O. (2002). The impact of technology mediated distance learning on
American Business Colleges. An empirical investigation. Proceedings of
the OOICTL- business 2000 International conference, September, pg
143-146. Sheveport, LA.
Pandey, S. K., &Patrick, G. A. (2000). Organizations: Three possible culprits.
Academy of Management Journal 17(2):205-225.
Pandey, S. K., & Welch, E. W. (2005). Beyond stereotypes: A multistage model
of managerial perceptions of red tape. Administration and Society, 37(5),
542-575.
Pandey, S. K., & Patrick G. S. (2000). Red tape: A review and assessment of
concepts and measures. Journal of Public Administration Research and
Theory 12, 553–80.
Pandey, S., & Kingsley, G. (2000). Examining red tape in public and private
organizations: Alternative explanations from a social psychological
www.udsspace.uds.edu.gh
226
model. Journal of Public Administration: Research and Theory. 25(3),
371 – 390.
Paulsen, N., Graham, P., Jones, E., Gallan, V., &Gallois, C. (2004).
Organisations as intergroup contexts: communication, discourse and
identification. In J. Harwood& H. Giles (Eds). pp 33. Intergroup
communication: Multiple perspectives. New York: Peter Lang.
Pearce, W. (2002). Communication and the human condition. Carbondale, ILL:
Southern Illinois University Press. p 40.
Pearce, W. (1989). Communication and the human condition. Carbondale, IL:
Southern Illinois University Press. 30(5): pp 112-124.
Penrose, E. T. (1959). The theory of the growth of the firm. New York, NY:
Wiley.
Philips, E. & Pugh, D. (2000). How to get a PhD (3rd ed.). Milton Keynes: Open
University Press.
Phillips, N., & Brown, J. L. (2000). Analyzing communication in and around
organizations: A critical hermeneutic approach. Academy of
Management Journal, 36, 1547–1576.
Pjesivac-Grbovic, J., Angskun, T., Bosilca, G., Fagg, G., Gabriel, E., &
Dongarra, J. (2007). Performance analysis of MPI collective operations,
Cluster Computing, 10(2), 127–143.
Plowman, K.D. (2005). Conflict, strategic management, and public
relations.Public relations review, 31(1) 131-138.
Podsakoff, P. M., MacKenzie, S. B., Paine, J. B., & Bachrach, D. G. (2000).
Organizational citizenship behaviors: A critical review of the theoretical
www.udsspace.uds.edu.gh

227
and empirical literature and suggestions for future. Research Journal of
Management, 26(3) 513–563.
Poister, T. H.& Henry, G.T. (1994). Citizen ratings of public and private service
quality: A comparative perspective. Public Administration Review 54,
155–160.
Porter, M. E. (2000). Locations, clusters, and company strategy. The Oxford
handbook of economic geography. pp 253-274.
Porter, M. E. (2000). The competitive advantage of nations. New York: Free
Press. Predictors of citizenship performance. International Journal of
Selection and Assessment, pp.9.
Postmes, T., Haslam, S. A., & Swaab, R. I. (2005). Social influence in small
groups: An interactive model of social identity formation. European
Review of Social Psychology, 16, 1-42.
Postmes, T., Spears, R., & Lea, M. (1998). Breaching or building social
boundaries? Side effects of computer-mediated communication.
Communication Research, 25, 689-715.
Powers, V.J. (1999). Xerox creates a knowledge-sharing culture through
grassroots efforts, knowledge management in practice. London: Sage.
Puccinelli, N. M. L. & Rosenthal, R. (2003). Effect of the dyadic context on
judgments of rapport: Dyad Task and partner presence. Journal of non-
verbal behaviour 28(3),2117-220.
Putnam, L. L. (1998). Metaphors of communication and organization. In J. S.
Trent (Ed.), Communication: Views from the helm for the 21st century
(pp. 145–152).
www.udsspace.uds.edu.gh

228
Putnam, L. L. (2004). Metaphors of communication and organization. In J. S.
Trent (Ed.), Communication: Views from the helm for the 21st century.
(pp. 145–152).
Ramirez, R. & Quarry, W. (2004). Communication for development, a medium
for innovation in natural resource management. FAO and IDRC.
Rashote, L. S. (2002). What does the smile mean? The meaning of non-verbal
behaviors in social interaction. Social Psychology Journal, 65, 92-102.
Riedlinger, M., Gallois, C., McKay, S., & Pittam, J. (2004). Impact of social
group processes and functional diversity on communication in
networked organizations. Journal of Applied Communication Research,
32, 55–79.
Riggio, R. (2006). Nonverbal skills and abilities. In V. Manusov, & M. Patterson
(Eds.),
Riggio, R. E. (2003). Introduction to industrial/organizational psychology. (4th
ed.). New York, NY: Pearson Education International.pp 88-101.
Robbins, S.P. (2009). Organizational theory: Structure, design, and application
(3rded.). Englewood Cliffs, NJ: Prentice Hall.
Roberts, K. H., & O’Reilly, C. A. (1974). Measuring organizational
communication. Journal of Applied Psychology, 59(3), 321-326.
Robertson, M. M., & Yueng-Hsiang H. (2006). Effect of a workplace design and
training intervention on individual performance, group effectiveness and
collaboration: the role of environmental. Institute for Safety, Center for
Safety, Hopkinton, MA. US National Library of Medicine National
Institutes of Health
www.udsspace.uds.edu.gh

229
Rogers, C, R., & Roethlisberger, F.J. (1952). Barriers and gateways to
communication. Harvard Business School, Review. No. 91610
Rogers, E. M., & Rekha A. R. (1996). Communication in Organizations. New
York: Free Press.
Rogers, E. M., & Rekha A. R. (1976). Communication in Organizations. New
York: The Free Press, pp 49-50
Roth, B., Koelemeij J. C. J., Daerr, H., and Schiller, S., (2006). Rovibrational
spectroscopy of trapped molecular hydrogen ions at millikelvin temperatures.
Institutfür Experimentalphysik, Heinrich-Heine-Universität Düsseldorf, 40225
Düsseldorf, Germany.
Rourke, F. E. (1992). Responsiveness and neutral competence in American
bureaucracy. Public Administration Review 52, 539–46.
Rouse, M. J. & Rouse, S. (2005). Poslovnekomunikacije: Masmedia. Zagreb.
90-99 pp.
Rudestam, K.E. & Newton, B. R. (2001). Surviving your dissertation. Newbury
Park, California: Sage.
Ruggles, R. (1998). The state of the notion: Knowledge management in practice.
California Management Review, 40(3), 80-89.
Ruscio, K. P (1997). Trust in the administrative state. Public Administration
Review 57,454–58.
Ryan, R. M., & Deci, E. L. (2000). Self-determination theory and the facilitation
of intrinsic motivation, social development, and well-being. American
Psychologist. 55, 68-78.
www.udsspace.uds.edu.gh
230
Sapienza, A.M. (1995). Managing scientists – Leadership strategies in scientific
research. (2nd Ed.). Boston, MA: School for Health Studies.
Schaufeli, W. B., Bakker, A. B., & van Rhenen, W. (2009). How changes in
job demands and resources predict burnout, work engagement, and
sickness absenteeism. Journal of Organizational Behavior, 30, 893–
917.
Schein, E.H. (1993). Dialogue, culture, and organizational learning.
Organizational Learning, 22(2), 40-51.
Schmidt, F. L., Hunter, J. E., McKenzie, R. C., & Muldrow, T. W. (1979).
Impact of valid selection procedures on work-force productivity.
Journal of Applied Psychology, 64, 609-626.
Schramm, W. (1954). How communication works. In W. Schramm (Ed.), The
process and effects of mass communication. Urbana, IL: University of
Illinois Press.
Scott, J. (2000). Social network analysis: A handbook (2nd ed.). London: Sage.
p.123.
Scott, S. G., & Lane, V. R. (2000). A stakeholder approach to organizational
identity. Academy of Management Review, 25(1), 43–62.
Shahi, S, &Naveh Ibrahim A, & Mehralizadeh, Y. (2008). Higher education
encountering global challenges in organisational hierarchy. New York:
Free Press. pp456-766.
Shahi, S., (2006). Investigating organizational communication structure in
graduate studies in the path to success. New York: Free Press. pp74-76.
www.udsspace.uds.edu.gh

231
Shahin, A. I., & Wright, P. L. (2004). Leadership in the context of culture: An
Egyptian perspective. The Leadership and Organizational Development
Journal, 25(6), 499-511.
Shannon, C.E., & Weaver, W. (1949). The mathematical theory of
communication. Urbana, IL, University of Illinois Press. Pp 55-58.
Shearer, C. S., Hames, D. S., & Runge, B. J. (2001): How CEOs influence
organizational culture following acquisitions. Leadership&
Organizational Development Journal, 22(3), 105-113.
Shelby, A.N. (2001). Organisational, business, management, and corporate
communication: An analysis of boundaries and relationships. Journal of
Business Communication, 30(3), 224-258.
Silverman, G. (2001). The secrets of word-of-mouth marketing: How to trigger
exponential sales through runaway word-of-mouth. New York:
American Marketing Association. pp 100-109.
Smidts, A., Pruyn, A.T. H., & Van Riel, C.B.M. (2001). The impact of employee
communication and perceived external prestige on organizational
identification. Academy of Management Journal, 49(5), 1051-1062.
Smith, J. A. (2004). Reflecting on the development of interpretative
phenomenological analysis and its contribution to qualitative research
in psychology. Qualitative Research in Psychology, 1, 39-54.
Souitaris, V. (1999). Research on the determinants of technology innovation: A
contingency approach. International Journal of Innovation
Management, 3(3), 287-305.
www.udsspace.uds.edu.gh

232
Spears, R., (1991). Computer-mediated communication, de-individuation, and
group decision-making. International Journal of Man-Machine Studies
34, 283-301.
Spears, R., Lea, M., & Lee, S. (1990). De-individuation and group polarization
in computer-mediated communication. British Journal of Social
Psychology, 29, 121-134.
Spears, R., Postmes, T., Lea, M., & Wolbert, A. (2002). The power of influence
and the influence of power in virtual groups: A side look at CMC and
the Internet. Journal of Social Issues, 58, 91-108.
Sperry, L., & Whiteman, A. (2003). Communicating effectively and
strategically. New York: McGraw-Hill.pp 55-66.
Spillan, J. E., Mino, M., & Rowles, M. S. (2002). Sharing organizational
messages through effective lateral communication. Communication
Quarterly, 50 (2), 89-90.
Stevens, D. (1983). On symmetric stability and instability of zonal mean flows
near the equator. Journal of the Atmospheric Sciences, 40, 882–893.
Stewart, J. & Ranson, S. (1994). Management in the public domain. InD
McKevitt & A Lawton (Eds) Public Sector Management. London:
Sage.pp 56-58
Stewart, J. (Ed.). (2009). Bridges not walls: A book about interpersonal
communication. London: Macmillan. pp 90 – 98.
Stipak, B. (1979). Citizen satisfaction with urban services: Potential misuse as a
performance indicator. Public Administration Review, 39(1), 46-52.
www.udsspace.uds.edu.gh

233
Stipak, B. (1980). Local governments’ use of citizen surveys. Public
Administration Review 40, 521–25.
Stokes, J. P. (1983). Components of group cohesion suggestions for future
research: Strategic communication audits. New York: The Guilford
Press. pp212-214.
Swindell, D., & Kelly, J.M. (2000). Linking citizen satisfaction data to
performance measures: a preliminary examination. Public Performance
and Management Review 24, 30–52.
Swink, M., & Song, M. (2007). Effects of marketing-manufacturing integration
on new product development time and competitive advantage. Journal
of Operations Management, 25 (1), 203-217.
Symon, G. (2000). Information and communication technologies and network
organization: A critical analysis. Journal of Occupational and
Organizational Psychology, 73(4), 389-414.
Tanis, M. A., & Postmes, T. (2008). Cues to identity in online dyads: Effects of
interpersonal versus intragroup perception on performance. Group
Dynamics: Theory, Research, and Practice, 12(2), 96-111.
Tayeb, M.H. (2000). The management of international enterprises: A socio-
political view. Basingstoke: Macmillan. pp120-121.
Tayeb, M.H. (2000). International business: theories, policies and practices.
London: Pearson Education. p66.
Taylor, M., Kent, M. L., & White, W. J. (2001). How activist organiszations are
using the internet to build relationships. Public Relations Review 27(3),
263–284.
www.udsspace.uds.edu.gh

234
Taylor, A. G. (2004). The organization of information. Westport: Libraries
Unlimited.
Taylor, J. R., Flanagin, A. J., Cheney, G., &Seibold, D. R. (2001).
Organizational communication research: Key moments, central
concerns, and future challenges. Annals of the International
Communication Association, 24(1),99-137.
Thakur, R., Rabenseifner, R., & Gropp, W. (2005). Optimization of collective
communication operations in MPICH. International Journal of High
Performance Computing Applications, 19(1), 49–66.
Thomas, K. M. (2005). Diversity dynamics in the workplace. Belmont, CA:
Wadsworth.
Thomas, P., & Palfrey, C. (1996). Evaluation: Stakeholder focused criteria.
Social Policy and Administration 30, 125–42.
Thompson, L. F., & Coovert, M. D. (2002). Stepping up to the challenge: A
critical examination of face-to-face and computer mediated team
decision making. Group Dynamics, 6, 52-64.
Tindall, N.T.J. (2009). In search of career satisfaction: African-American public
relations practitioners, pigeonholing, and the workplace. Public
Relations Review, 35(4), 443-445.
Tosun, C. (2009). Managing communication skills in organisations. Anahtar -
Canada. 21(242), 20-23.
Tourish, D., & Hargie, O. (2004). Key issues in organizational communication,
Routledge, London. pp. 12-25.
Tsetsura, K., (2004). In Van Ruler, B. &Vercic, D., (Eds.) Public relations and
communication management in Europe: a nation-by-nation introduction
www.udsspace.uds.edu.gh

235
to public relations theory and practice. Berlin: Mouton de Gruyter. p.
331-346.
Tucker, M. L., Meyer, G. D., & Westerman, J. W. (1996).
Organizational communication: Development of internal strategic
competitive advantage. Journal of Business Communication. 33(1), 51-
69.
Tully, C.J. (2003). Growing up in technological worlds: How modern types of
inscriptions are perceived. London: Sage. p.888.
Tyler, T. (2003). Justice, identity and leadership. In D van Knippenberg and M.
A. Hogg, (Eds.) Leadership and power: Identity processes in groups and
organizations. London: Sage.
Ulmer, R. R. (1998). Communication, organization, and crisis. In M. E. Roloff
(Ed.), Communication Yearbook: Vol. 21. pp. 231-276. Thousand Oaks,
CA: Sage.
Universities. Council for the Development of Social Science Research in
Africa 2006 (ISSN 0851–7762) JHEA/RESA Vol. 4, No. 2, 2006, pp.
83–98
University of Illinois Press, 1325 South Oak Street MC-566.Champaign, IL
61820-6903.
Valley, K. L., Moag, J., & Bazerman, M. H. (1998). A matter of trust: Effects of
communication on the efficiency and distribution of outcomes. Journal
of Economic Behavior& Organization, 34, 211-238.
Varona, F. (2012). Relationship between communication satisfaction and
organizational commitment in three Guatemalan organizations. The
Journal of Business Communication, 33(2),111-140.
www.udsspace.uds.edu.gh

236
Vickery, S. K., Jayaram, J., Droge, C., & Calantone, R. (2003). The effects of
an integrative supply chain strategy on customer service and financial
performance: An analysis of direct versus indirect relationships. Journal
of Operations Management, 21, 523-539.
Vigoda, E. (2000). Are you being served? The responsiveness of public
administration to citizens’ demands: An empirical examination in Israel.
Public Administration 78, 165–191.
Vigoda, E. (2003). Trust in governance: Can we point to causality? Australian
Journal of Public Administration, 62(3),12–25.
Von Krogh, G., Ichijo, K., & Nonaka, I. (2000).Enabling knowledge creation:
How to unlock the mystery of tacit knowledge and release the power of
innovation. New York: Oxford University Press. Vol 1, p.22.
Walther, J. B. (1994). Anticipated ongoing interaction versus channel effects on
relational communication in computer-mediated interaction. Human
Communication Research, 20, 473-501.
Weiner, N. (1986). Human use of human being; Cybernetics and Society. Avon
Welch, E. W., & Pandey, K. S. (2005). Government and bureaucracy: Toward a
better understanding of internet implementation and its effect on red
tape. Journal of Public Administration Research and Theory Advance,
17,379-404.
Whitley, R. (2000). Divergent capitalism: the social structuring and change of
business systems. Oxford: Oxford University Press. pp89.
Willemyns, M., Gallois, C. & Callan, V. (2004). Trust me, I’m your boss: Trust
and power in supervisor-supervisee communication. International
Journal of Human Resource Management, 14(1), 117-127.
www.udsspace.uds.edu.gh

237
Williams, G. & Miller, R. B. (2002). Change the way you persuade. Harvard
Business Review, 80, 65-73.
Wilson, D.O. (1992). Diagonal communication links within organizations. The
Journal of Business Communication 29, 129-141.
Winsor, D. A. (2000). Ordering work: Blue collar literacy and the political
nature of genre. Written Communication, 17, (2) 155–184.
Wolbert, A., (2002). The power of influence in computer-mediated
communication. The Journal of Social Issues, 58(1) 91-107.
Wolf, K. (2006). PR career progression - The gap between traditional research
and the UK industry's perception. Journal of Communication
Management, 10(2), 174-190.
Womack, F. W. &. Podemski, R. S. (1985). Criteria for effective planning in
multi-campus systems. Planning for Higher Education, 13, 1-4.
Wood, J. T. (2002). Gendered speech communities. In L. Samovar & R. Porter
(Eds.), Interpersonal communication: A reader (10th ed.). Belmont
p.218–229.
Wood, J. T. (2009). Communication in our lives (4th ed.). Belmont, CA:
Thomson-Wadsworth.
Wright, D. (1995). The role of corporate public relations executives in the
future of employee
Xanthopoulou, D., Bakker, A.B., Demerouti, E. & Schaufeli, W.B. (2006). The
role of interpersonal Communication. Journal for South East of Nigeria.
Paper 80.
www.udsspace.uds.edu.gh

238
Yates, J., & Orlikowski, W. (2002). Genre systems: structuring interaction
through communicative norms. Journal of Business Communication
39(1), 13–35.
Yazdifar, H. (2005): Management accounting change in a subsidiary
organization. Working paper 122.
Yoo, Y., &Alavi, M. (2001). Media and group cohesion: relative influences on
social presence task. New York: Free Press.
Zahra, S. A. (1993). A conceptual model of entrepreneurship as firm behaviour:
A critique and extension. Entrepreneurship: Theory and Practice, 17(4),
5-21.
Zhang, H. & Agarwal N. C. (2009). The mediating roles of organizational justice
on the relationships between HR practices and workplace outcomes: an
investigation in China. The International Journal of Human Resource
Management, 20(3), 676-693.
Zorn T. E. (2002). The emotionality of information and communication
technology implementation. Journal of Communication Management, 7
(2),160 - 171.
www.udsspace.uds.edu.gh

239
APPENDIX A
QUESTIONNAIRES
DEPARTMENT OF AGRICULTURAL EXTENSION, RURAL
DEVELOPMENT AND GENDER STUDIES
FACULTY OF AGRIBUSINESS AND COMMUNICATION SCIENCES
UNIVERSITY FOR DEVELOPMENT STUDIES, NYANKPALA
CAMPUS, TAMALE, GHANA
QUESTIONNAIRE ON ORGANISATIONAL COMMUNICATION AND
JOB
PERFORMANCE AT THE UNIVERSITY OF EDUCATION,
WINNEBA (UEW)
Dear Respondent,
I should be grateful if you could spare me few minutes of your busy schedule to
respond to these questions. The outcome of the exercise which is purely for
academic purpose would be treated in strict confidence.
I therefore urge you to please complete and return this questionnaire to the
undersigned as soon as possible.
Thank you in advance for your cooperation.
B.C. Campion(Signed)
www.udsspace.uds.edu.gh

240
SECTION A: Perception of Staff on the Nature of Communication in the
University
Please tick (√) as appropriate in the space(s) provided.
S/NStatements
Nature of CommunicationStrongly
Agree(5)
Agree(4)
SomewhatAgree
(3)
Disagree(2)
StronglyDisagree
(1)
1 Numerous pathways,channels/oral, written, ICTare used to conveymessages in UEW
2 Inter-personalcommunication are morelikely to meet specificneeds of staff inovercoming risk andcomplexities in delays
3 Obtaining the rightinformation sometimesdepends on the channelchosen to communicate
4 Well-developedcommunication skills arenecessary to personaleffectiveness inorganisation
5 There is a strongrelationship betweencommunicationeffectiveness andorganisationaleffectiveness in UEW
6 Communication is one ofthe several types ofmotivated behaviours inorganisations
7 When the distancebetween the communicatorand the recipient increases,quality and quantity ofmessage decreases
8 I sometimes use a numberof channels to ensure thatmessages reach staff ontime
9 The state of staff well-being health condition)can affect communication
www.udsspace.uds.edu.gh

241
S/NStatements
Nature of CommunicationStrongly
Agree(5)
Agree(4)
SomewhatAgree
(3)
Disagree(2)
StronglyDisagree
(1)
10 Social and cultural issuesamong staff affectcommunication
11 The low level ofeducational qualificationof the Sender/Receivercould affectcommunication
12 Communication could beaffected by tight workschedule of staff
13 Staff identify theirsuperior as the primarysource for receivinginformation from topmanagement
14 Generally the office andtime of communication isrelevant to both parties inthe process
15 Team work supports freeflow of information inUEW
16 Unclear University Policy/Regulations could affectcommunication
17 The nature and size oforganisational structureaffects the free flow ofinformation
18 Bureaucracy and red-tapeaffect communicationprocess
19 Ethnicity/Tribalism/Nepotism at work affectcommunication
20 General office workingconditions affectcommunication
21 Dissatisfaction in workingconditions affectscommunication
22 If staff do not get thenecessary feedback itaffects communicationflow
23 The magnitude ofgrievances in organisation
www.udsspace.uds.edu.gh

242
S/NStatements
Nature of CommunicationStrongly
Agree(5)
Agree(4)
SomewhatAgree
(3)
Disagree(2)
StronglyDisagree
(1)
can influencecommunication flow
24 Lack of support fromcolleagues results ininsufficient information
25 The absence of conflictresolution mechanismaffect the flow ofinformation
26 Receipt of adverseinformation from two ormore people will not augurwell for effectivecommunication
27 Sometimes a memo is poorchoice, whereas a smallgroup meeting is a betterchoice in communication
28 I sometimes go contrary tothe Universitycommunication policy tocarry out an assignment
29 In some instances unclearvision/mission are passedon without adequateinformation
30 The large volume ofinformation in multi-campus institutions is ahindrance incommunication flow
www.udsspace.uds.edu.gh

243
SECTION B: Organisational Communication system and administrative
performance in UEW
Please tick (√) as appropriate in the space(s) provided.
S/N
Job Performance
Statements Excellent(5)
VeryGood
(4)
Good(3)
Fair(2)
Poor(1)
1 The nature oforganisationalcommunication in UEW
2. The availability and useof verbal and non-verbalcommunication
3 The way my superiorcommunicates with me
4 The use of ICT generallyby staff
5 The use of the circularsand notices incommunicating with staff
6 Superior’s willingness tolisten to staff suggestions
7 Superior’s readiness toencourage employees toexpress their opinions
8 Staff awareness of majorpolicy changes
9 Staff contributions atmeetings
10 General feedback on day-to-day activities of staff
11 Staff motivation bysuperior
12 The amount of informationavailable to enhance work
13 Nature of feedback fromsuperior
14 Subordinatescommunication withsuperior
15 The nature and location ofthe campuses
16 My general assessment ofcommunication in UEW
www.udsspace.uds.edu.gh

244
S/N
Job Performance
Statements Excellent(5)
VeryGood
(4)
Good(3)
Fair(2)
Poor(1)
17 The nature and size of thecampuses andcommunication
18 Coaching as used toenhance communication inUEW
19 The time taken to enhanceinter-campuscommunication
20 Despite the distance,communication with staffbetween campuses
21 Familiarity withchannel/system ofcommunication
22 The level of interactionbetween superior and hissubordinates
23 The level of informationflow from colleagues ofsame status
24 The nature of managementinformation
25 Sources and amount ofinformation received
26 The chain ofcommunication in UEW
27 The general knowledgeand skills of staff incommunication
28 The effect ofcommunication with staffof different background
29 The level of staffeducational background incommunication
30 The quality of mediaavailable incommunication
www.udsspace.uds.edu.gh

245
SECTION C: Staff Perception of Organisational Communication on Group
Cohesion
Please tick (√) as appropriate in the space(s) provided.
S/N Group Cohesion
Statement High(3)
Moderate(2)
Low(1)
1 The effect of staff cooperation in theUniversity on group cohesion
2. The effect of improved staff motivationon group cohesion
3. The promotion of periodic training ongroup cohesion
4. Two-way communication on groupcohesion in UEW
5. The effect of feedback incommunication with superiors on groupcohesion.
6. The use of ICT by staff to promotecohesion
7. When staff are encouraged to expresstheir opinion, the effect on groupcohesion
8 The effect of promotion and transfer ofstaff on group cohesion
9. The nature of communication facilitiesavailable and their effect on groupcohesion
10. The level of group cohesion and effecton the amount of information available
11 Effect of well-defined job descriptionand group cohesion
12 The effect of job improvement on groupcohesion
13 The effect of multi-campus nature ofUEW on group cohesion
14 Then effect staff cohesion on growthand development in UEW
15 The effect of divide and rule method ofmanaging cohesion
16. The level of staff morale on groupcohesion
17. The over-dependence and use ofgrapevine affect group cohesion
www.udsspace.uds.edu.gh

246
S/N Group Cohesion
Statement High(3)
Moderate(2)
Low(1)
18 Ethnicity, tribalism and nepotism andtheir effect on group cohesion
19 The effect of self-ego and selfishness onthe part of staff and the promotion ofgroup cohesion.
20 The effect of dissatisfaction among staffon group cohesion
21 The effect of failure to follow the line ofcommunication on group cohesion
22 The effect of lack of explicitinformation, circulars and bulletins ongroup cohesion.
23. The effect of intra/inter campuscommunication on group cohesion
24 The intra and inter campuscommunication on level of groupcohesion
25 The nature of communication system inthe University on group cohesion
26 The absence of information fromcolleagues whenever needed on groupcohesion
27 The effect of gender stereotype inleadership positions on group cohesion
28 Effect of personal interest incommunication at work on groupcohesion
29 The inadequate nature of capacitybuilding in communication among peersand its effects on group cohesion
30. The effect of unclear policy statementsfrom Government on group cohesion
31 The effect of non-uniformity in thesingle-spine salary scale on groupcohesion
32 The effect on in-fighting amongcolleagues on group cohesion
www.udsspace.uds.edu.gh
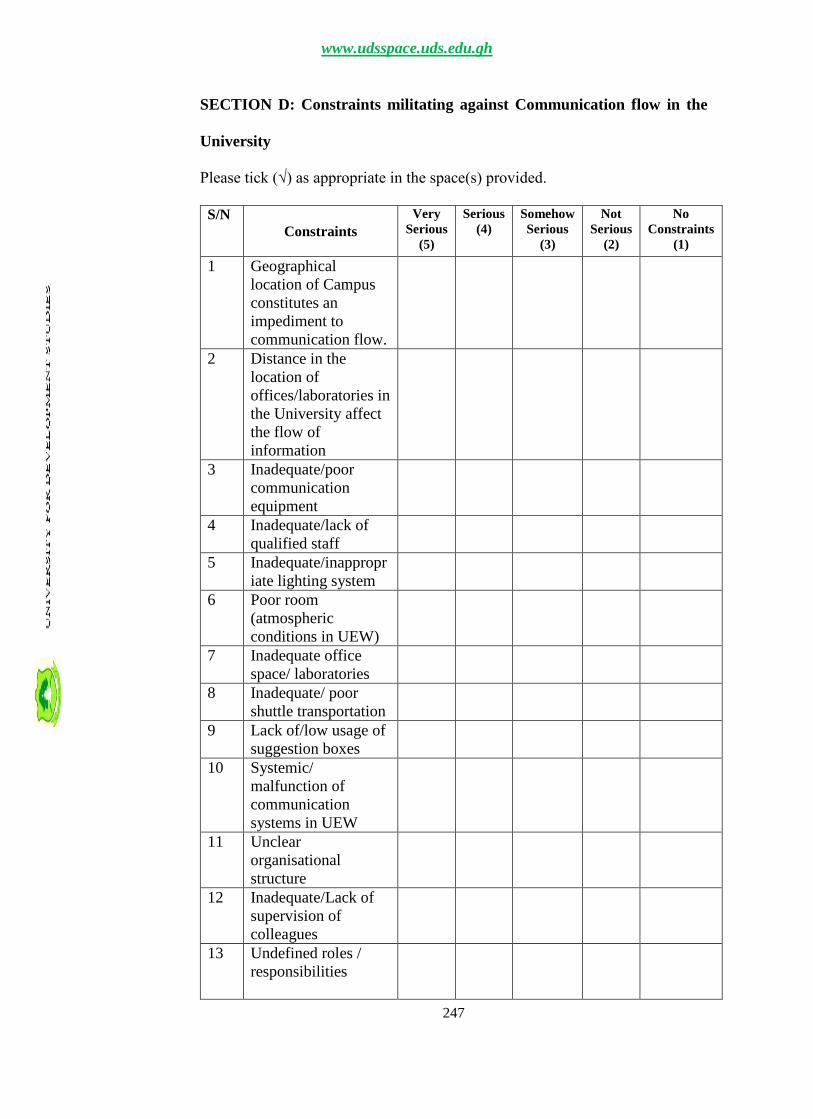
247
SECTION D: Constraints militating against Communication flow in the
University
Please tick (√) as appropriate in the space(s) provided.
S/NConstraints
VerySerious
(5)
Serious(4)
SomehowSerious
(3)
NotSerious
(2)
NoConstraints
(1)
1 Geographicallocation of Campusconstitutes animpediment tocommunication flow.
2 Distance in thelocation ofoffices/laboratories inthe University affectthe flow ofinformation
3 Inadequate/poorcommunicationequipment
4 Inadequate/lack ofqualified staff
5 Inadequate/inappropriate lighting system
6 Poor room(atmosphericconditions in UEW)
7 Inadequate officespace/ laboratories
8 Inadequate/ poorshuttle transportation
9 Lack of/low usage ofsuggestion boxes
10 Systemic/malfunction ofcommunicationsystems in UEW
11 Unclearorganisationalstructure
12 Inadequate/Lack ofsupervision ofcolleagues
13 Undefined roles /responsibilities
www.udsspace.uds.edu.gh

248
S/NConstraints
VerySerious
(5)
Serious(4)
SomehowSerious
(3)
NotSerious
(2)
NoConstraints
(1)
14 Clumsy/ bureaucraticprocedures/red-tape
15 Lack of convergencein clarity duringcommunication withstaff
16 Lack of appropriatecapacity/capability
17 Absence of exitinterview for staff
18 Little or nogrievance/ resolutionprocedures in UEW
19 Absence of mentors20 Lack of open-door
policy21 Poor attitude towards
work22 Inadequate
consultations amongstaff
23 Personality conflict/personal differences
24 Refusing tocommunicate all-together
25 Inadequatemotivation of staff
26 Inexperienced staff27 Low staff morale28 Rumours/grapevine
to distort information29 Absence of staff from
meetings/fora30 Lack of
communicationskills/knowledge
www.udsspace.uds.edu.gh

249
SECTION E: Demographic Characteristics of Staff
Please tick (√) as appropriate in the space(s) provided.
1. Name of respondent (Optional) …………………………………………
2. Name of Campus………………………………………………………...
3. Your Department/Section/Unit …………………………………………
4. Gender Male [ ] Female [ ]
5. Age (in years) ……………………………………………………...........
6. Ethno-linguistic group (tribe): ……………………………………….…
7. Marital status:
Married [ ]
Single [ ]
Divorce [ ]
Widow/er [ ]
Separated [ ]
8. Job title/Rank: ……………………………………..…………………...
9. Your status in the University
Junior [ ]
Senior [ ]
Senior member [ ]
Management member [ ]
10. Number of years at post (tenure): …………………………………..…
11. Highest educational Qualification: …………………………………….
PhD [ ]
MPhil/MSc/MBA/MA [ ]
BSc/BA/BEd/BBA [ ]
Diploma [ ]
www.udsspace.uds.edu.gh

250
INTERVIEW GUIDE (QUESTIONS)
How does the geographical location (distance) of one campus constitute
impediment to another in communication?
How does the use of equipment affect the flow of information?
How does the nature/supply of power affect communication?
How does the use of transport affect communication?
How does the structure of UEW affect communication in the University?
How does the level of education affect communication?
Can the individual personality affect communication in the University?
Can role conflict affect communication flow in the University?
Does motivation of staff affect communication flow in the university?
How can grapevine affect communication flow in the university?
Does meeting have effect on communication flow in the university?
www.udsspace.uds.edu.gh

251
APPENDIX B
DETERMINING SAMPLES FOR RESEARCH ACTIVITIES
www.udsspace.uds.edu.gh

252
www.udsspace.uds.edu.gh

253
www.udsspace.uds.edu.gh

254
www.udsspace.uds.edu.gh

255
APPENDIX C
POST HOC TESTS USING DUNNETT T
DependentVariable (I) CLUSTERS
(J)CLUSTERS
Mean Difference(I-J) Std. Error Sig.
95% Confidence Interval
LowerBound Upper Bound
Corporate Plans DunnettT3
1 2 -1.27447709* .09937325 .000 -1.5383102 -1.0106440
3 -.94209072* .08184969 .000 -1.1598852 -.7242962
4 .23043209 .58325850 .999 -1.5093973 1.9702615
2 1 1.27447709* .09937325 .000 1.0106440 1.5383102
3 .33238637* .08356831 .001 .1100256 .5547472
4 1.50490918 .58350216 .109 -.2352764 3.2450947
3 1 .94209072* .08184969 .000 .7242962 1.1598852
2 -.33238637* .08356831 .001 -.5547472 -.1100256
4 1.17252281 .58077457 .291 -.5637093 2.9087549
4 1 -.23043209 .58325850 .999 -1.9702615 1.5093973
2 -1.50490918 .58350216 .109 -3.2450947 .2352764
3 -1.17252281 .58077457 .291 -2.9087549 .5637093
Stratification DunnettT3
1 2 -.82133969* .08438881 .000 -1.0454107 -.5972687
3 -.52233883* .07868810 .000 -.7315568 -.3131208
4 2.97676873* .06242228 .000 2.8094986 3.1440389
2 1 .82133969* .08438881 .000 .5972687 1.0454107
3 .29900086* .07429809 .000 .1015096 .4964921
4 3.79810842* .05678847 .000 3.6459877 3.9502292
3 1 .52233883* .07868810 .000 .3131208 .7315568
2 -.29900086* .07429809 .000 -.4964921 -.1015096
4 3.49910756* .04790904 .000 3.3700176 3.6281975
4 1 -2.97676873* .06242228 .000 -3.1440389 -2.8094986
2 -3.79810842* .05678847 .000 -3.9502292 -3.6459877
3 -3.49910756* .04790904 .000 -3.6281975 -3.3700176
OrganisationalPolitics
DunnettT3
1 2 -1.00554121* .09739003 .000 -1.2641081 -.7469743
3 -.50580715* .09522210 .000 -.7589637 -.2526506
4 .83394654 .62753063 .706 -1.0389679 2.7068610
2 1 1.00554121* .09739003 .000 .7469743 1.2641081
3 .49973406* .09545765 .000 .2459775 .7534906
4 1.83948775 .62756642 .056 -.0334787 3.7124542
3 1 .50580715* .09522210 .000 .2526506 .7589637
2 -.49973406* .09545765 .000 -.7534906 -.2459775
4 1.33975369 .62723364 .240 -.5327304 3.2122378
4 1 -.83394654 .62753063 .706 -2.7068610 1.0389679
2 -1.83948775 .62756642 .056 -3.7124542 .0334787
3 -1.33975369 .62723364 .240 -3.2122378 .5327304
Corporate Identity DunnettT3
1 2 -.88541965* .12125960 .000 -1.2073595 -.5634798
3 -.30520200* .10069092 .017 -.5731633 -.0372407
4 .82489581 .50928397 .514 -.6887331 2.3385247
2 1 .88541965* .12125960 .000 .5634798 1.2073595
3 .58021766* .10071171 .000 .3122494 .8481860
4 1.71031547* .50928808 .023 .1966808 3.2239501
3 1 .30520200* .10069092 .017 .0372407 .5731633
2 -.58021766* .10071171 .000 -.8481860 -.3122494
4 1.13009781 .50478621 .202 -.3768845 2.6370801
4 1 -.82489581 .50928397 .514 -2.3385247 .6887331
2 -1.71031547* .50928808 .023 -3.2239501 -.1966808
3 -1.13009781 .50478621 .202 -2.6370801 .3768845
The mean difference is significant at the 0.05 level.
www.udsspace.uds.edu.gh

256
APPENDIX D
STAFF STRENGTH AS AT MAY 15, 2012
Category
Winneba Campus Kumasi Campus Mampong CampusAjumakoCampus Total
M F T M F T M F T M F T M F T
SeniorMembers
(Teaching)195 58 253 57 9 66 24 4 28 6 4 10 282 75 357
SeniorMembers
(Non-teaching)
69 21 90 14 9 23 13 0 13 2 0 2 98 30 128
Senior Staff 171 91 262 35 24 59 18 7 25 8 2 10 232 124 356
Junior Staff 422 153 575 136 36 172 85 22 107 32 12 44 675 223 898
Grand Total 857 323 1180 242 78 320 140 33 173 48 18 66 1287 452 1739
www.udsspace.uds.edu.gh