Effects of oil on the rate and trajectory of Louisiana marsh shoreline erosion
9
This content has been downloaded from IOPscience. Please scroll down to see the full text. Download details: IP Address: 72.205.206.232 This content was downloaded on 15/02/2016 at 20:21 Please note that terms and conditions apply. Effects of oil on the rate and trajectory of Louisiana marsh shoreline erosion View the table of contents for this issue, or go to the journal homepage for more 2013 Environ. Res. Lett. 8 044030 (http://iopscience.iop.org/1748-9326/8/4/044030) Home Search Collections Journals About Contact us My IOPscience
Transcript of Effects of oil on the rate and trajectory of Louisiana marsh shoreline erosion
This content has been downloaded from IOPscience. Please scroll down to see the full text.
Download details:
IP Address: 72.205.206.232
This content was downloaded on 15/02/2016 at 20:21
Please note that terms and conditions apply.
Effects of oil on the rate and trajectory of Louisiana marsh shoreline erosion
View the table of contents for this issue, or go to the journal homepage for more
2013 Environ. Res. Lett. 8 044030
(http://iopscience.iop.org/1748-9326/8/4/044030)
Home Search Collections Journals About Contact us My IOPscience
IOP PUBLISHING ENVIRONMENTAL RESEARCH LETTERS
Environ. Res. Lett. 8 (2013) 044030 (8pp) doi:10.1088/1748-9326/8/4/044030
Effects of oil on the rate and trajectoryof Louisiana marsh shoreline erosionGiovanna McClenachan, R Eugene Turner and Andrew W Tweel
Department of Oceanography and Coastal Sciences, Louisiana State University, Baton Rouge, LA, USA
E-mail: [email protected]
Received 27 August 2013Accepted for publication 28 October 2013Published 13 November 2013Online at stacks.iop.org/ERL/8/044030
AbstractOil can have long-term detrimental effects on marsh plant health, both above- andbelowground. However, there are few data available that quantify the accelerated rate oferosion that oil may cause to marshes and the trajectory of change. Between November 2010and August 2012, we collected data on shoreline erosion, soil strength, per cent cover ofSpartina alterniflora, and marsh edge overhang at 30 closely spaced low oil and high oil sitesin Bay Batiste, Louisiana. Surface oil samples were taken one meter into the marsh inFebruary 2011. All high oiled sites in Bay Batiste were contaminated with Macondo 252 oil(oil from the Deepwater Horizon oil spill, 20 April–15 July 2010). The results suggest thatthere is a threshold where soil parameters change dramatically with a relatively small increasein oil concentration in the soil. Heavy oiling weakens the soil, creating a deeper undercut ofthe upper 50 cm of the marsh edge, and causing an accelerated rate of erosion that cascadesalong the shoreline. Our results demonstrate that it could take at least 2 yr to document theeffects heavy oiling has had on the marsh shoreline. The presence of aboveground vegetationalone may not be an appropriate indicator of recovery.
Keywords: wetland, Deepwater Horizon oil spill, salt marsh, Louisiana, erosion
1. Introduction
Salt marshes have long been considered to be resilient tonatural and anthropogenic disturbances (Gedan et al 2011).However, other coastal ecosystems have shifted to alternativestable states induced by human activity (Jackson et al 2001),leading to a decline in the services they supply (McClenachan2009, zu Ermgassen et al 2013). Originally thought to provideno benefit in their natural state, wetlands have been altered byhumans for centuries through levees, impoundments, canals,and diversions (Salinas et al 1986). As natural hydrologicregimes are modified, the coast becomes more vulnerable toland loss (Deegan et al 1984), potentially pushing a marsh’serosional resilience past a threshold where one perturbationcould result in cascading effects (van de Koppel et al 2005).
Content from this work may be used under the terms ofthe Creative Commons Attribution 3.0 licence. Any further
distribution of this work must maintain attribution to the author(s) and thetitle of the work, journal citation and DOI.
The 20 April 2010 Deepwater Horizon (DWH) oil spillat Mississippi Canyon Block 252 killed 11 people, injured 17,and released approximately 5 million barrels of oil into theGulf of Mexico 66 km from the Louisiana coastline from 20April to 15 July. It was the largest spill event in US history andthe fifth largest in the world. Of all five of the Gulf of Mexicostates, the oil released disproportionately affected Louisiana.Roughly 1000 km of Louisiana’s shoreline was oiled, equalingabout 60% of the total oiled shoreline in the Gulf of Mexico(Owens et al 2011). 7 times larger than the Exxon Valdezoil spill, the DWH spill had the potential to cause significantdamage to Louisiana’s coastal habitats.
The rate of land loss in Louisiana was significant before2010 (42.92 km2 yr−1 from 1985 to 2010; Couvillion et al2011), and so the threat of increased erosion rates fromthe oiling in 2010 are an additional concern. There aremany contributing factors to the disappearance of Louisiana’scoastal marshes, both anthropogenic (e.g., oil and gas canals(Bass and Turner 1997), sediment supply (Tweel and Turner2012, Blum and Roberts 2009)) and natural (e.g., subsidence;
11748-9326/13/044030+08$33.00 c© 2013 IOP Publishing Ltd Printed in the UK
Environ. Res. Lett. 8 (2013) 044030 G McClenachan et al
Blum and Roberts 2009). Major episodic disturbances, suchas the DWH spill, can contribute to the short- and long-termyearly estimates of land loss, but, depending on the time seriesanalyzed, may not be recognized as the source of elevatederosion. Chronic exposure to oil can cause increased shorelineerosion (Hershner and Lake 1980), and results from a smallsample size of heavily oiled marsh sites (n= 3) after the DWHspill indicate that exposure to oil elevated marsh shorelineerosion rates (Silliman et al 2012). Although thought to betied to salt marsh plant health, the mechanisms controlling thisincreased erosion are poorly understood.
The below- and aboveground biomass of Spartinaalterniflora, the dominant salt marsh grass in coastalLouisiana salt marshes, helps to increase marsh resistanceto erosion. The belowground plant biomass provides erosionprotection for the shoreline edge via root strength and mass(Gabet 1998, Micheli and Kirchner 2002). The abovegroundstems of S. alterniflora trap sediment by slowing tidal andwave energy, which can help maintain a sustainable marshelevation as sea level continues to rise (Redfield 1972, Stumpf1983, Li and Yang 2009). Marsh loss potentially will beenhanced if the marsh plants’ health is compromised.
The results of laboratory and field studies on the effects ofoil on S. alterniflora growth have shown that high amounts ofoil can have significant negative impacts on both above- andbelowground production (Li et al 1990, Lin and Mendelssohn1996). The most severe impacts tend to occur when the oil isapplied during the growing season of the plants (spring andearly summer) (Alexander and Webb 1985, Webb 1994) andwhen the oil persists in highly organic soils (Pezeshki et al2000). NOAA reported DWH oil entering Louisiana’s coastalmarshes in June 2010 (NOAA 2010a). This timing coincideswith the most intense growth of S. alterniflora, giving the oilthe potential to impart substantial damage to the vegetationand, in turn, cause a significant increase in shoreline erosion.Lin and Mendelssohn (2012) reported significant initialaboveground dieback of heavily oiled S. alterniflora, whileSilliman et al (2012) documented significantly greater erosionat three heavily oiled sites following the DWH spill event,which is attributed to a decrease in aboveground plant cover.
Here, we provide a trajectory of the rate of erosion andrecovery over 2 yr in low and high oiled coastal marshesin southeast Louisiana. We also investigated some of thephysical and biological mechanisms driving the variation inthe erosion rates among sites and over time.
2. Materials and methods
2.1. Site selection
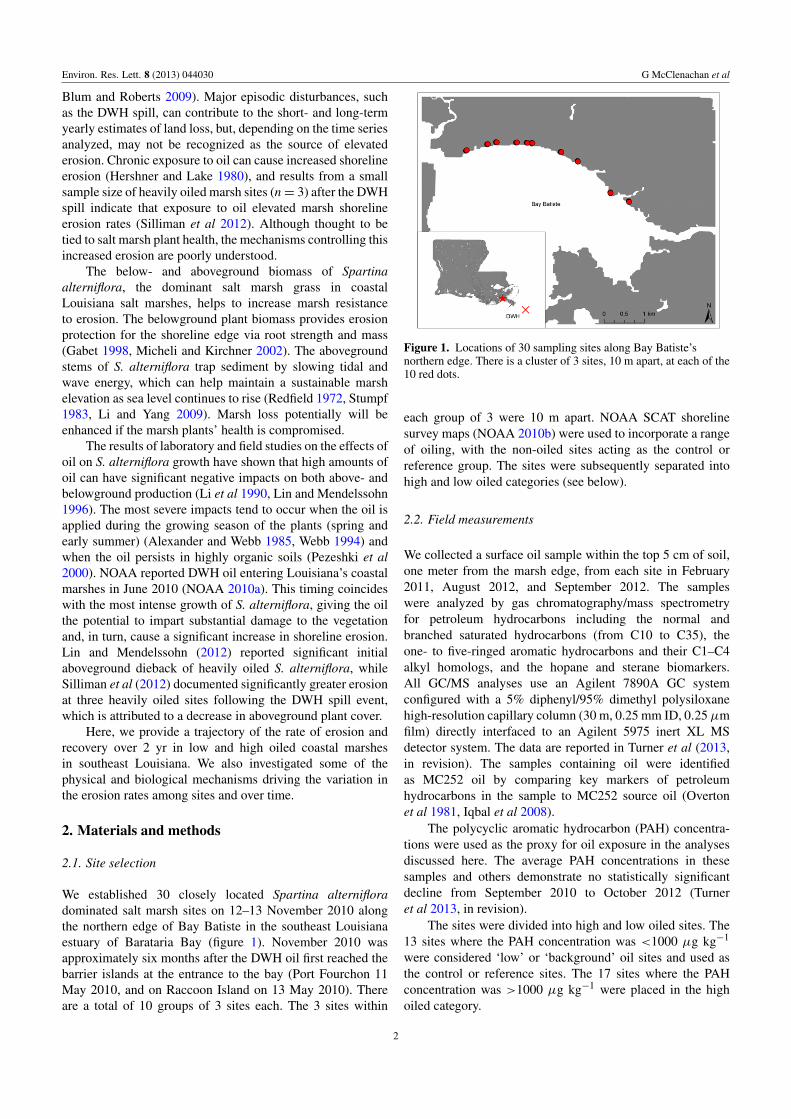
We established 30 closely located Spartina alternifloradominated salt marsh sites on 12–13 November 2010 alongthe northern edge of Bay Batiste in the southeast Louisianaestuary of Barataria Bay (figure 1). November 2010 wasapproximately six months after the DWH oil first reached thebarrier islands at the entrance to the bay (Port Fourchon 11May 2010, and on Raccoon Island on 13 May 2010). Thereare a total of 10 groups of 3 sites each. The 3 sites within
Figure 1. Locations of 30 sampling sites along Bay Batiste’snorthern edge. There is a cluster of 3 sites, 10 m apart, at each of the10 red dots.
each group of 3 were 10 m apart. NOAA SCAT shorelinesurvey maps (NOAA 2010b) were used to incorporate a rangeof oiling, with the non-oiled sites acting as the control orreference group. The sites were subsequently separated intohigh and low oiled categories (see below).
2.2. Field measurements
We collected a surface oil sample within the top 5 cm of soil,one meter from the marsh edge, from each site in February2011, August 2012, and September 2012. The sampleswere analyzed by gas chromatography/mass spectrometryfor petroleum hydrocarbons including the normal andbranched saturated hydrocarbons (from C10 to C35), theone- to five-ringed aromatic hydrocarbons and their C1–C4alkyl homologs, and the hopane and sterane biomarkers.All GC/MS analyses use an Agilent 7890A GC systemconfigured with a 5% diphenyl/95% dimethyl polysiloxanehigh-resolution capillary column (30 m, 0.25 mm ID, 0.25µmfilm) directly interfaced to an Agilent 5975 inert XL MSdetector system. The data are reported in Turner et al (2013,in revision). The samples containing oil were identifiedas MC252 oil by comparing key markers of petroleumhydrocarbons in the sample to MC252 source oil (Overtonet al 1981, Iqbal et al 2008).
The polycyclic aromatic hydrocarbon (PAH) concentra-tions were used as the proxy for oil exposure in the analysesdiscussed here. The average PAH concentrations in thesesamples and others demonstrate no statistically significantdecline from September 2010 to October 2012 (Turneret al 2013, in revision).
The sites were divided into high and low oiled sites. The13 sites where the PAH concentration was <1000 µg kg−1
were considered ‘low’ or ‘background’ oil sites and used asthe control or reference sites. The 17 sites where the PAHconcentration was >1000 µg kg−1 were placed in the highoiled category.
2
Environ. Res. Lett. 8 (2013) 044030 G McClenachan et al
The horizontal shoreline erosion, soil strength, per centcover of S. alterniflora, and marsh edge overhang weresampled at each site. We placed permanent PVC poles 1.5and 4.5 m in a straight line into the marsh from the shorelineedge. Edge erosion and gain were measured 5 times usingthese poles as reference points. Soil strength measurementswere taken in November 2010 and August 2012. Soil strengthand per cent cover of S. alterniflora were measured at the1.5 m pole until the edge eroded past this location; afterthis occurred, the readings were taken 1.5 m into the marshfrom the marsh edge. A shear vane was used to measuresoil strength in a 1 m profile, at 10 cm intervals using aDunham E-290 Hand Vane Tester. The per cent cover oflive S. alterniflora was estimated for a 0.5 m × 0.5 m plot.The portion of the intact marsh overhanging a missing layerbeneath was measured as an indicator for future erosionpotential. We measured marsh overhang roughly 15 cm belowthe top of the marsh surface.
2.3. Energy calculation
We calculated the wave energy at each site to test thehypothesis that the erosion rates we measured were due tonormal physical stress (i.e., wave and wind force) at thesespecific locations and that they were not due to the exposureto oil. Because of their close proximity, we calculated waveenergy for each of the 10 groupings of 3 sites rather thanthe individual sites, with the middle site in each groupingserving as the location for the estimation of fetch. The PAHconcentrations and total erosion were also averaged for the 3sites in each grouping of 10. Wind speed and direction datawere downloaded from the Louisiana State University (LSU)AgCenter website for a weather station located in Port Sulfur,LA at 10 m-height and 13 km from our study sites (LSU2012). The data interval is for April 2007 to June 2011. Weused SAS (SAS 9.3, SAS Institute, Inc. 2012) to calculate theper cent frequency the wind blew from each direction and theassociated average wind speed with this direction. We usedfetch lengths calculated using ArcInfo10.0 (EnvironmentalSystems Research Institute), together with the wind speedand direction data and an online software program (USGS2007), to estimate wave height and period for each of theeight major directions (N, NE, E, SE, S, SW, W, NW) at eachof the 10 locations for the prevailing wind patterns. A waterdepth of 2 m was used for all sites since Bay Batiste hasa relatively shallow homogeneous depth. These parameterswere then used to calculate a weighted average ‘wave energy’at each site based on the per cent frequency of time the windblew from each direction.
2.4. Bay Batiste shoreline change
We used vectorized aerial imagery to investigate historicalchanges to the morphology of the Bay Batiste shoreline.Imagery was compiled at four time intervals between 1956and 2012 from the USGS Earth Explorer (1956, 1972,and 1998) and TerraServer (2012). Pixel sizes were 2.2 m(1956), 3 m (1972), and 1 m for all other years, and data
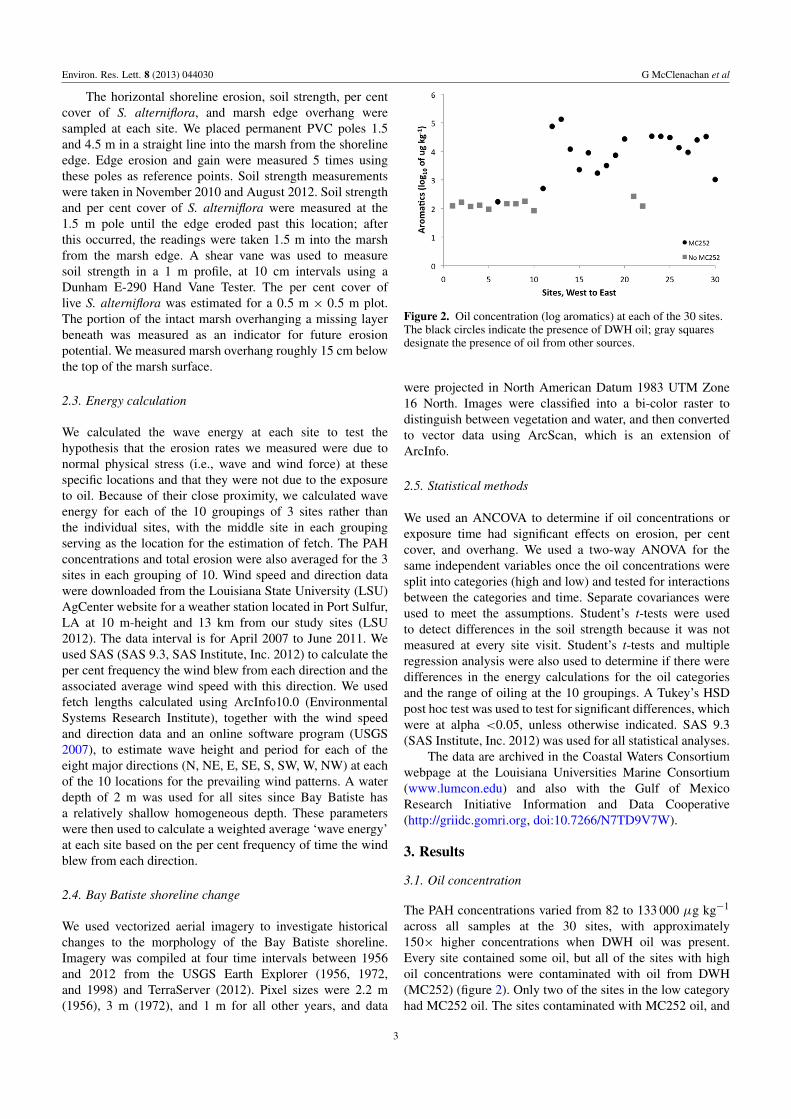
Figure 2. Oil concentration (log aromatics) at each of the 30 sites.The black circles indicate the presence of DWH oil; gray squaresdesignate the presence of oil from other sources.
were projected in North American Datum 1983 UTM Zone16 North. Images were classified into a bi-color raster todistinguish between vegetation and water, and then convertedto vector data using ArcScan, which is an extension ofArcInfo.
2.5. Statistical methods
We used an ANCOVA to determine if oil concentrations orexposure time had significant effects on erosion, per centcover, and overhang. We used a two-way ANOVA for thesame independent variables once the oil concentrations weresplit into categories (high and low) and tested for interactionsbetween the categories and time. Separate covariances wereused to meet the assumptions. Student’s t-tests were usedto detect differences in the soil strength because it was notmeasured at every site visit. Student’s t-tests and multipleregression analysis were also used to determine if there weredifferences in the energy calculations for the oil categoriesand the range of oiling at the 10 groupings. A Tukey’s HSDpost hoc test was used to test for significant differences, whichwere at alpha <0.05, unless otherwise indicated. SAS 9.3(SAS Institute, Inc. 2012) was used for all statistical analyses.
The data are archived in the Coastal Waters Consortiumwebpage at the Louisiana Universities Marine Consortium(www.lumcon.edu) and also with the Gulf of MexicoResearch Initiative Information and Data Cooperative(http://griidc.gomri.org, doi:10.7266/N7TD9V7W).
3. Results
3.1. Oil concentration
The PAH concentrations varied from 82 to 133 000 µg kg−1
across all samples at the 30 sites, with approximately150× higher concentrations when DWH oil was present.Every site contained some oil, but all of the sites with highoil concentrations were contaminated with oil from DWH(MC252) (figure 2). Only two of the sites in the low categoryhad MC252 oil. The sites contaminated with MC252 oil, and
3
Environ. Res. Lett. 8 (2013) 044030 G McClenachan et al
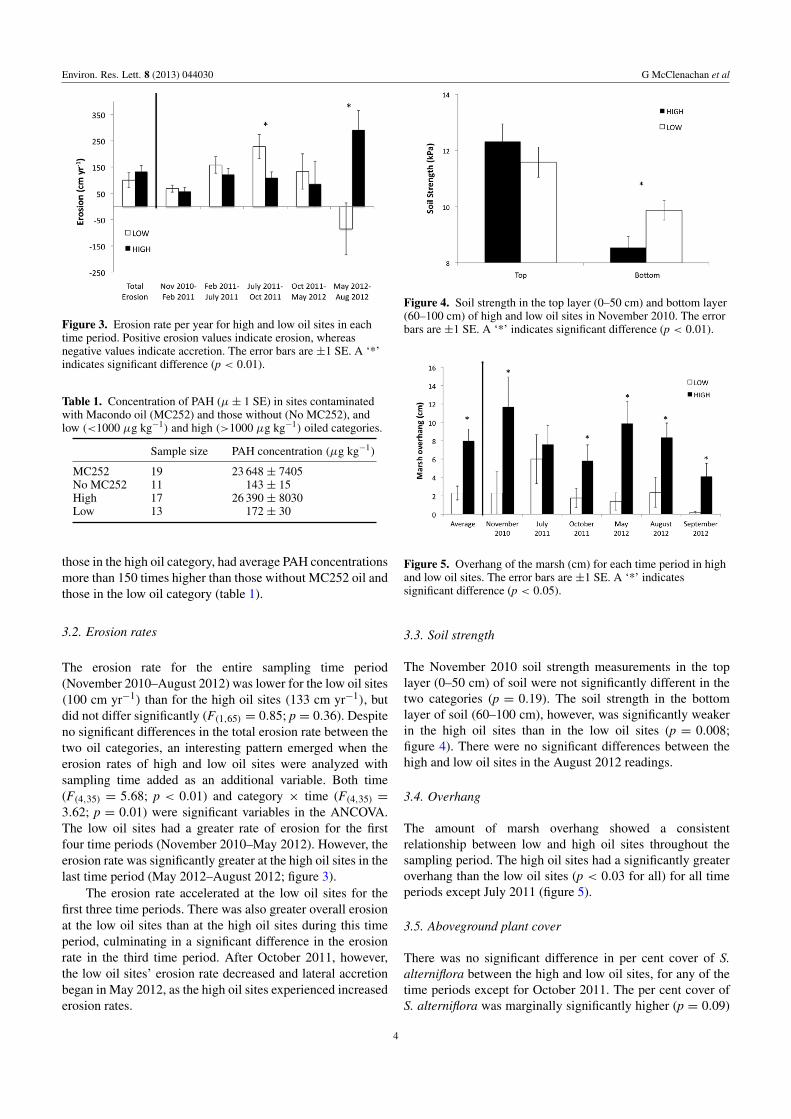
Figure 3. Erosion rate per year for high and low oil sites in eachtime period. Positive erosion values indicate erosion, whereasnegative values indicate accretion. The error bars are ±1 SE. A ‘*’indicates significant difference (p < 0.01).
Table 1. Concentration of PAH (µ± 1 SE) in sites contaminatedwith Macondo oil (MC252) and those without (No MC252), andlow (<1000 µg kg−1) and high (>1000 µg kg−1) oiled categories.
Sample size PAH concentration (µg kg−1)
MC252 19 23 648 ± 7405No MC252 11 143 ± 15High 17 26 390 ± 8030Low 13 172 ± 30
those in the high oil category, had average PAH concentrationsmore than 150 times higher than those without MC252 oil andthose in the low oil category (table 1).
3.2. Erosion rates
The erosion rate for the entire sampling time period(November 2010–August 2012) was lower for the low oil sites(100 cm yr−1) than for the high oil sites (133 cm yr−1), butdid not differ significantly (F(1,65) = 0.85; p = 0.36). Despiteno significant differences in the total erosion rate between thetwo oil categories, an interesting pattern emerged when theerosion rates of high and low oil sites were analyzed withsampling time added as an additional variable. Both time(F(4,35) = 5.68; p < 0.01) and category × time (F(4,35) =
3.62; p = 0.01) were significant variables in the ANCOVA.The low oil sites had a greater rate of erosion for the firstfour time periods (November 2010–May 2012). However, theerosion rate was significantly greater at the high oil sites in thelast time period (May 2012–August 2012; figure 3).
The erosion rate accelerated at the low oil sites for thefirst three time periods. There was also greater overall erosionat the low oil sites than at the high oil sites during this timeperiod, culminating in a significant difference in the erosionrate in the third time period. After October 2011, however,the low oil sites’ erosion rate decreased and lateral accretionbegan in May 2012, as the high oil sites experienced increasederosion rates.
Figure 4. Soil strength in the top layer (0–50 cm) and bottom layer(60–100 cm) of high and low oil sites in November 2010. The errorbars are ±1 SE. A ‘*’ indicates significant difference (p < 0.01).
Figure 5. Overhang of the marsh (cm) for each time period in highand low oil sites. The error bars are ±1 SE. A ‘*’ indicatessignificant difference (p < 0.05).
3.3. Soil strength
The November 2010 soil strength measurements in the toplayer (0–50 cm) of soil were not significantly different in thetwo categories (p = 0.19). The soil strength in the bottomlayer of soil (60–100 cm), however, was significantly weakerin the high oil sites than in the low oil sites (p = 0.008;figure 4). There were no significant differences between thehigh and low oil sites in the August 2012 readings.
3.4. Overhang
The amount of marsh overhang showed a consistentrelationship between low and high oil sites throughout thesampling period. The high oil sites had a significantly greateroverhang than the low oil sites (p < 0.03 for all) for all timeperiods except July 2011 (figure 5).
3.5. Aboveground plant cover
There was no significant difference in per cent cover of S.alterniflora between the high and low oil sites, for any of thetime periods except for October 2011. The per cent cover ofS. alterniflora was marginally significantly higher (p = 0.09)
4
Environ. Res. Lett. 8 (2013) 044030 G McClenachan et al
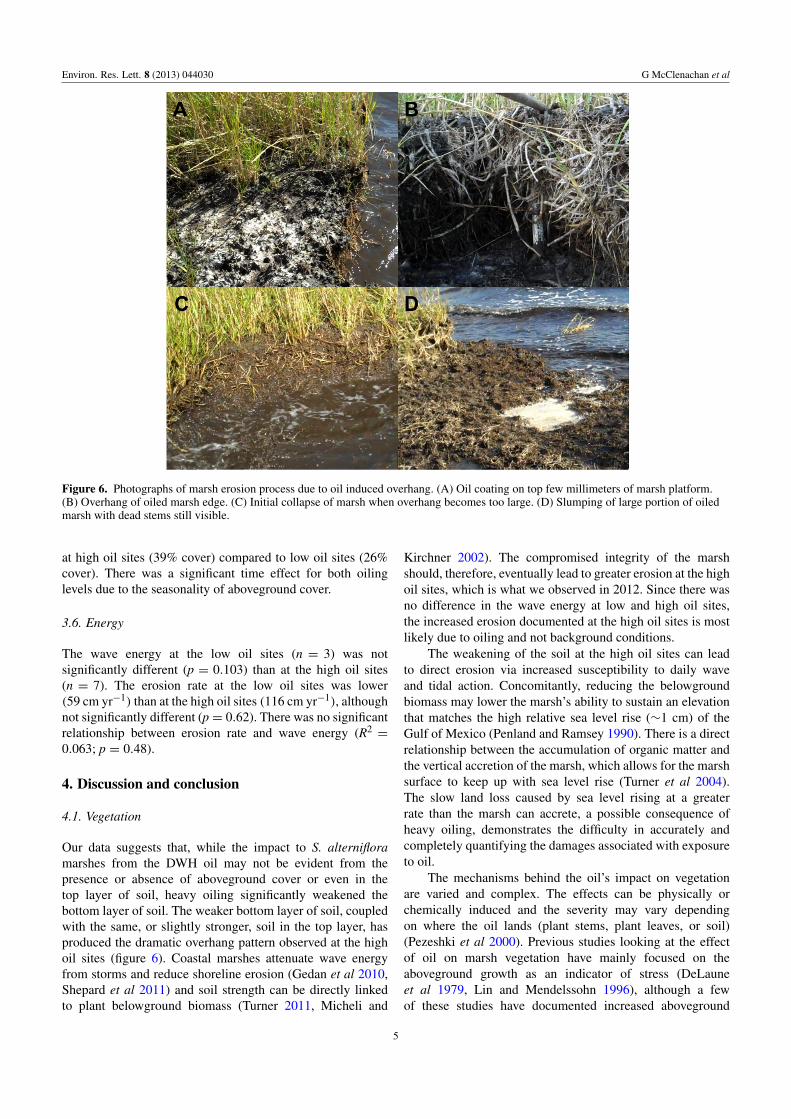
Figure 6. Photographs of marsh erosion process due to oil induced overhang. (A) Oil coating on top few millimeters of marsh platform.(B) Overhang of oiled marsh edge. (C) Initial collapse of marsh when overhang becomes too large. (D) Slumping of large portion of oiledmarsh with dead stems still visible.
at high oil sites (39% cover) compared to low oil sites (26%cover). There was a significant time effect for both oilinglevels due to the seasonality of aboveground cover.
3.6. Energy
The wave energy at the low oil sites (n = 3) was notsignificantly different (p = 0.103) than at the high oil sites(n = 7). The erosion rate at the low oil sites was lower(59 cm yr−1) than at the high oil sites (116 cm yr−1), althoughnot significantly different (p = 0.62). There was no significantrelationship between erosion rate and wave energy (R2
=
0.063; p = 0.48).
4. Discussion and conclusion
4.1. Vegetation
Our data suggests that, while the impact to S. alternifloramarshes from the DWH oil may not be evident from thepresence or absence of aboveground cover or even in thetop layer of soil, heavy oiling significantly weakened thebottom layer of soil. The weaker bottom layer of soil, coupledwith the same, or slightly stronger, soil in the top layer, hasproduced the dramatic overhang pattern observed at the highoil sites (figure 6). Coastal marshes attenuate wave energyfrom storms and reduce shoreline erosion (Gedan et al 2010,Shepard et al 2011) and soil strength can be directly linkedto plant belowground biomass (Turner 2011, Micheli and
Kirchner 2002). The compromised integrity of the marshshould, therefore, eventually lead to greater erosion at the highoil sites, which is what we observed in 2012. Since there wasno difference in the wave energy at low and high oil sites,the increased erosion documented at the high oil sites is mostlikely due to oiling and not background conditions.
The weakening of the soil at the high oil sites can leadto direct erosion via increased susceptibility to daily waveand tidal action. Concomitantly, reducing the belowgroundbiomass may lower the marsh’s ability to sustain an elevationthat matches the high relative sea level rise (∼1 cm) of theGulf of Mexico (Penland and Ramsey 1990). There is a directrelationship between the accumulation of organic matter andthe vertical accretion of the marsh, which allows for the marshsurface to keep up with sea level rise (Turner et al 2004).The slow land loss caused by sea level rising at a greaterrate than the marsh can accrete, a possible consequence ofheavy oiling, demonstrates the difficulty in accurately andcompletely quantifying the damages associated with exposureto oil.
The mechanisms behind the oil’s impact on vegetationare varied and complex. The effects can be physically orchemically induced and the severity may vary dependingon where the oil lands (plant stems, plant leaves, or soil)(Pezeshki et al 2000). Previous studies looking at the effectof oil on marsh vegetation have mainly focused on theaboveground growth as an indicator of stress (DeLauneet al 1979, Lin and Mendelssohn 1996), although a fewof these studies have documented increased aboveground
5
Environ. Res. Lett. 8 (2013) 044030 G McClenachan et al
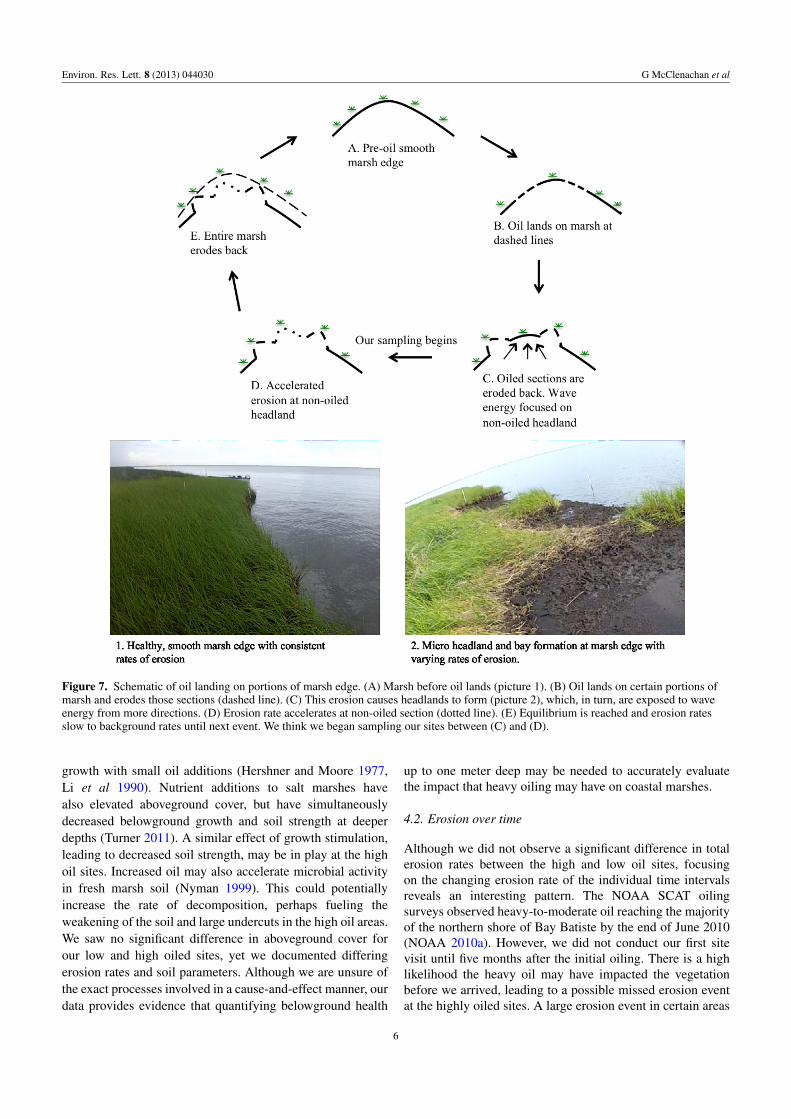
Figure 7. Schematic of oil landing on portions of marsh edge. (A) Marsh before oil lands (picture 1). (B) Oil lands on certain portions ofmarsh and erodes those sections (dashed line). (C) This erosion causes headlands to form (picture 2), which, in turn, are exposed to waveenergy from more directions. (D) Erosion rate accelerates at non-oiled section (dotted line). (E) Equilibrium is reached and erosion ratesslow to background rates until next event. We think we began sampling our sites between (C) and (D).
growth with small oil additions (Hershner and Moore 1977,Li et al 1990). Nutrient additions to salt marshes havealso elevated aboveground cover, but have simultaneouslydecreased belowground growth and soil strength at deeperdepths (Turner 2011). A similar effect of growth stimulation,leading to decreased soil strength, may be in play at the highoil sites. Increased oil may also accelerate microbial activityin fresh marsh soil (Nyman 1999). This could potentiallyincrease the rate of decomposition, perhaps fueling theweakening of the soil and large undercuts in the high oil areas.We saw no significant difference in aboveground cover forour low and high oiled sites, yet we documented differingerosion rates and soil parameters. Although we are unsure ofthe exact processes involved in a cause-and-effect manner, ourdata provides evidence that quantifying belowground health
up to one meter deep may be needed to accurately evaluatethe impact that heavy oiling may have on coastal marshes.
4.2. Erosion over time
Although we did not observe a significant difference in totalerosion rates between the high and low oil sites, focusingon the changing erosion rate of the individual time intervalsreveals an interesting pattern. The NOAA SCAT oilingsurveys observed heavy-to-moderate oil reaching the majorityof the northern shore of Bay Batiste by the end of June 2010(NOAA 2010a). However, we did not conduct our first sitevisit until five months after the initial oiling. There is a highlikelihood the heavy oil may have impacted the vegetationbefore we arrived, leading to a possible missed erosion eventat the highly oiled sites. A large erosion event in certain areas
6
Environ. Res. Lett. 8 (2013) 044030 G McClenachan et al
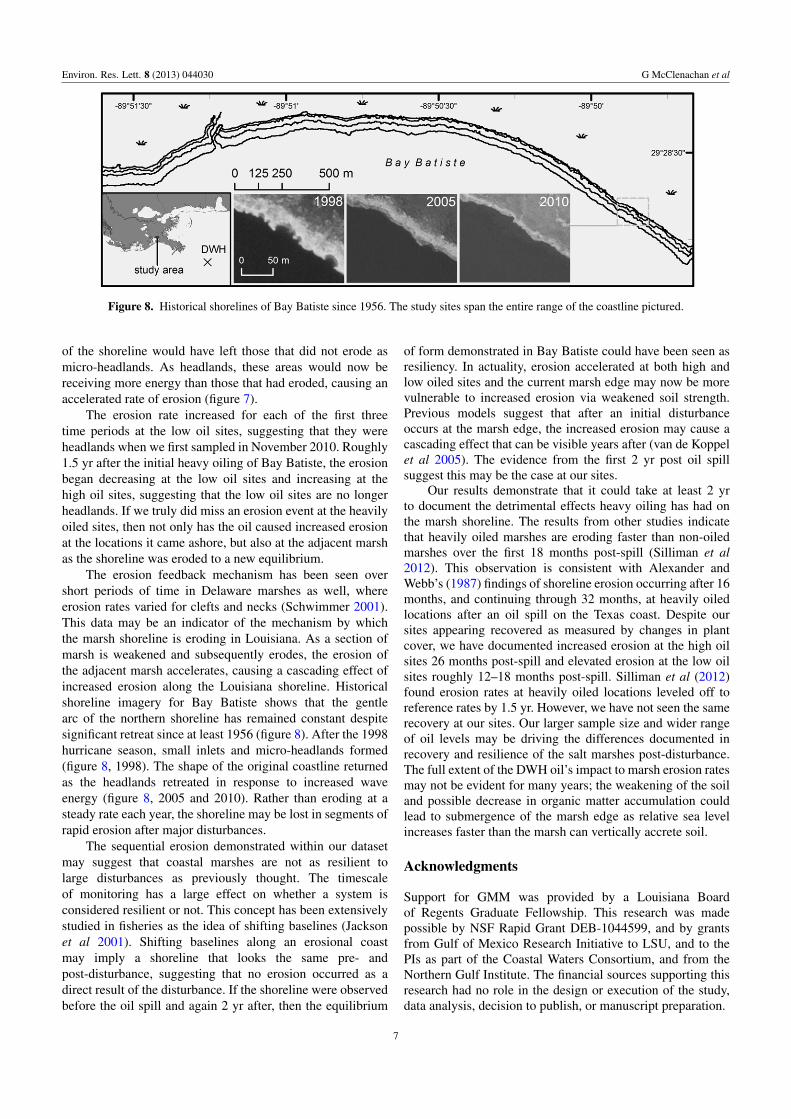
Figure 8. Historical shorelines of Bay Batiste since 1956. The study sites span the entire range of the coastline pictured.
of the shoreline would have left those that did not erode asmicro-headlands. As headlands, these areas would now bereceiving more energy than those that had eroded, causing anaccelerated rate of erosion (figure 7).
The erosion rate increased for each of the first threetime periods at the low oil sites, suggesting that they wereheadlands when we first sampled in November 2010. Roughly1.5 yr after the initial heavy oiling of Bay Batiste, the erosionbegan decreasing at the low oil sites and increasing at thehigh oil sites, suggesting that the low oil sites are no longerheadlands. If we truly did miss an erosion event at the heavilyoiled sites, then not only has the oil caused increased erosionat the locations it came ashore, but also at the adjacent marshas the shoreline was eroded to a new equilibrium.
The erosion feedback mechanism has been seen overshort periods of time in Delaware marshes as well, whereerosion rates varied for clefts and necks (Schwimmer 2001).This data may be an indicator of the mechanism by whichthe marsh shoreline is eroding in Louisiana. As a section ofmarsh is weakened and subsequently erodes, the erosion ofthe adjacent marsh accelerates, causing a cascading effect ofincreased erosion along the Louisiana shoreline. Historicalshoreline imagery for Bay Batiste shows that the gentlearc of the northern shoreline has remained constant despitesignificant retreat since at least 1956 (figure 8). After the 1998hurricane season, small inlets and micro-headlands formed(figure 8, 1998). The shape of the original coastline returnedas the headlands retreated in response to increased waveenergy (figure 8, 2005 and 2010). Rather than eroding at asteady rate each year, the shoreline may be lost in segments ofrapid erosion after major disturbances.
The sequential erosion demonstrated within our datasetmay suggest that coastal marshes are not as resilient tolarge disturbances as previously thought. The timescaleof monitoring has a large effect on whether a system isconsidered resilient or not. This concept has been extensivelystudied in fisheries as the idea of shifting baselines (Jacksonet al 2001). Shifting baselines along an erosional coastmay imply a shoreline that looks the same pre- andpost-disturbance, suggesting that no erosion occurred as adirect result of the disturbance. If the shoreline were observedbefore the oil spill and again 2 yr after, then the equilibrium
of form demonstrated in Bay Batiste could have been seen asresiliency. In actuality, erosion accelerated at both high andlow oiled sites and the current marsh edge may now be morevulnerable to increased erosion via weakened soil strength.Previous models suggest that after an initial disturbanceoccurs at the marsh edge, the increased erosion may cause acascading effect that can be visible years after (van de Koppelet al 2005). The evidence from the first 2 yr post oil spillsuggest this may be the case at our sites.
Our results demonstrate that it could take at least 2 yrto document the detrimental effects heavy oiling has had onthe marsh shoreline. The results from other studies indicatethat heavily oiled marshes are eroding faster than non-oiledmarshes over the first 18 months post-spill (Silliman et al2012). This observation is consistent with Alexander andWebb’s (1987) findings of shoreline erosion occurring after 16months, and continuing through 32 months, at heavily oiledlocations after an oil spill on the Texas coast. Despite oursites appearing recovered as measured by changes in plantcover, we have documented increased erosion at the high oilsites 26 months post-spill and elevated erosion at the low oilsites roughly 12–18 months post-spill. Silliman et al (2012)found erosion rates at heavily oiled locations leveled off toreference rates by 1.5 yr. However, we have not seen the samerecovery at our sites. Our larger sample size and wider rangeof oil levels may be driving the differences documented inrecovery and resilience of the salt marshes post-disturbance.The full extent of the DWH oil’s impact to marsh erosion ratesmay not be evident for many years; the weakening of the soiland possible decrease in organic matter accumulation couldlead to submergence of the marsh edge as relative sea levelincreases faster than the marsh can vertically accrete soil.
Acknowledgments
Support for GMM was provided by a Louisiana Boardof Regents Graduate Fellowship. This research was madepossible by NSF Rapid Grant DEB-1044599, and by grantsfrom Gulf of Mexico Research Initiative to LSU, and to thePIs as part of the Coastal Waters Consortium, and from theNorthern Gulf Institute. The financial sources supporting thisresearch had no role in the design or execution of the study,data analysis, decision to publish, or manuscript preparation.
7
Environ. Res. Lett. 8 (2013) 044030 G McClenachan et al
References
Alexander S K and Webb J W 1985 Seasonal response of Spartinaalterniflora to oil Proc., Oil Spill Conf. (Prevention, Behavior,Control, Cleanup) pp 355–7
Alexander S K and Webb J W 1987 Relationship of Spartinaalterniflora to sediment oil content following an oil spill Proc.:1987 Oil Spill Conf. pp 445–9
Bass A and Turner R E 1997 Relationships between salt marsh lossand dredged canals in three Louisiana estuaries J. Coast. Res.13 895–903
Blum M D and Roberts H H 2009 Drowning of the Mississippi deltadue to insufficient sediment supply and global sea-level riseNature Geosci. 2 488–91
Couvillion B R, Barras J A, Steyer G D, Sleavin W, Fischer M,Beck H, Trahan N, Griffin B and Heckman D 2011 Land areachange in coastal Louisiana from 1932 to 2010: US GeologicalSurvey Scientific Investigations Map vol 3164, p 12, scale1:265,000, Pamphlet
Deegan L, Kennedy H and Neill C 1984 Natural factors and humanmodifications contributing to marsh loss in Louisiana’sMississippi River deltaic plain Environ. Manag. 8 519–27
DeLaune R D, Patrick W H Jr and Buresh R J 1979 Effect of crudeoil on a Louisiana Spartina alterniflora salt marsh Environ.Pollut. 20 21–31
Gabet E 1998 Lateral migration and bank erosion in a salt marshtidal channel in San Francisco Bay, California EstuariesCoasts 21 745–53
Gedan K B, Altieri A and Bertness M 2011 Uncertain future of NewEngland salt marshes Mar. Ecol. Prog. Ser. 434 229–37
Gedan K B, Kirwan M L, Wolanski E, Barbier E B andSilliman B R 2010 The present and future role of coastalwetland vegetation in protecting shorelines: answering recentchallenges to the paradigm Clim. Change 106 7–29
Hershner C and Lake J 1980 Effects of chronic oil pollution on asalt-marsh grass community Mar. Biol. 56 163–73
Hershner C and Moore K 1977 Effects of the Chesapeake Bay oilspill on salt marshes of the lower bay Int. Oil Spill Conf. Proc.pp 529–33
Iqbal J, Overton E B and Gisclair D 2008 Polycyclic aromatichydrocarbons in Louisiana rivers and coastal environments:source fingerprinting and forensic analysis Environ. Forensics9 63–74
Jackson J et al 2001 Historical overfishing and the recent collapse ofcoastal ecosystems Science 293 629–38
Li H and Yang S 2009 Trapping effect of tidal marsh vegetation onsuspended sediment, Yangtze Delta J. Coast. Res. 25 915–24
Li Y, Morris J and Yoch D 1990 Chronic low level hydrocarbonamendments stimulate plant growth and microbial activity insalt-marsh microcosms J. Appl. Ecol. 27 159–71
Lin Q and Mendelssohn I A 1996 A comparative investigation ofthe effects of south Louisiana crude oil on the vegetation offresh, brackish and salt marshes Marine Poll. Bull. 32 202–9
Lin Q and Mendelssohn I A 2012 Impacts and recovery of theDeepwater Horizon oil spill on vegetation structure andfunction of coastal salt marshes in the northern Gulf of MexicoEnviron. Sci. Technol. 46 3737–43
McClenachan L 2009 Documenting loss of large trophy fish fromthe Florida Keys with historical photographs Conserv. Biol.23 636–43
Micheli E R and Kirchner J W 2002 Effects of wet meadow riparianvegetation on streambank erosion 2. Measurements ofvegetated bank strength and consequences for failuremechanics Earth Surf. Process. Landf. 27 687–97
NOAA: (National Oceanic and Atmospheric Administration) 2010aERMA Deepwater Gulf Response. 6/25/2010 Shoreline SCATOiling Ground Observation: shttp://gomex.erma.noaa.gov/layerfiles/4809/files/Reduced MC252ShorelineCurrentOilingSituation 062510.pdf
NOAA: (National Oceanic and Atmospheric Administration) 2010bERMA Deepwater Gulf Response. 9/17/2010 Shoreline SCATOiling Ground Observation: http://gomex.erma.noaa.gov/layerfiles/11144/files/Reduced MC252ShorelineCurrentOilingSituation 091710.pdf
Nyman A 1999 Effect of crude oil and chemical additives onmetabolic activity of mixed microbial populations in freshmarsh soils Microb. Ecol. 37 152–62
Overton E B et al 1981 Petroleum residue source identificationfollowing a fire and oil spill Proc. 1981 Oil Spill Conf.
Owens E H, Santner R, Cocklan-Vendl M, Michel J, Reimer P Dand Stong B 2011 Shoreline treatment during the DeepwaterHorizon-Macondo response Int. Oil Spill Conf. Proc. (Feb.2011) vol 2011, p 271
Penland S and Ramsey K 1990 Relative sea-level rise in Louisianaand the Gulf of Mexico: 1908–1988 J. Coast. Res. 6 323–42
Pezeshki S, Hester M, Lin Q and Nyman J 2000 The effects of oilspill and clean-up on dominant US Gulf coast marshmacrophytes: a review Environ. Pollut. 108 129–39
Redfield A 1972 Development of a New England Salt Marsh Ecol.Monogr. 42 201–37
Salinas L, DeLaune R D and Patrick W Jr 1986 Changes occurringalong a rapidly submerging coastal area: Louisiana, USAJ. Coast. Res. 2 269–84
Schwimmer R 2001 Rates and processes of marsh shoreline erosionin Rehoboth Bay, Delaware, USA J. Coast. Res. 17 672–83
Shepard C C, Crain C M and Beck M W 2011 The protective role ofcoastal marshes: a systematic review and meta-analysis PLoSOne 6 1–11
Silliman B R, Van de Koppel J, McCoy M W, Diller J, Kasozi G N,Earl K, Adams P N and Zimmerman A R 2012 Degradationand resilience in Louisiana salt marshes after theBP-Deepwater Horizon oil spill Proc. Natl Acad. Sci. USA109 11234–9
Stumpf R 1983 The process of sedimentation on the surface of a saltmarsh Estuar. Coast. Shelf Sci. 17 495–508
Turner R E 2011 Beneath the salt marsh canopy: loss of soil strengthwith increasing nutrient loads Estuaries Coasts 34 1084–93
Turner R E et al 2013 Distribution and recovery trajectory ofMacondo (Mississippi Canyon 252) oil in Louisiana coastalwetlands PLoS One at press
Turner R E, Swenson E M, Milan C S, Lee J M and Oswald T A2004 Belowground biomass in healthy and impaired saltmarshes Ecol. Res. 19 29–35
Tweel A W and Turner R E 2012 Watershed land use and riverengineering drive wetland formation and loss in theMississippi River birdfoot delta Limnol. Oceanogr. 57 18–28
USGS 2007 Fetch- and Depth-Limited Wave Calculations. http://woodshole.er.usgs.gov/staffpages/csherwood/sedx equations/RunSPMWave.html (accessed December 2012)
van de Koppel J, van der Wal D, Bakker J and Herman P 2005Self-organization and vegetation collapse in salt marshecosystems Amer. Nat. 165 E1–12
Webb J W 1994 Effects of oil on salt marshes Symp. Proc. Gulf ofMexico and Caribbean Oil Spill in Coastal Ecosystems:Assessing Effects, Natural Recovery, and Progress inRemediation Research pp 55–61
zu Ermgassen P, Spalding M, Grizzle R and Brumbaugh R 2013Quantifying the loss of a marine ecosystem service: filtrationby eastern oysters in US estuaries Estuaries Coasts 36 36–43
8