Effects of low-pass filtering on the intelligibility of speech in quiet for people with and without...
12
Effects of low pass filtering on the intelligibility of speech in noise for people with and without dead regions at high frequencies a) Thomas Baer, Brian C. J. Moore, b) and Karolina Kluk c) Department of Experimental Psychology, University of Cambridge, Downing Street, Cambridge CB2 3EB, United Kingdom ~Received 29 January 2002; revised 9 May 2002; accepted 14 June 2002! People with high-frequency sensorineural hearing loss differ in the benefit they gain from amplification of high frequencies when listening to speech. Using vowel–consonant–vowel ~VCV! stimuli in quiet that were amplified and then low pass filtered with various cutoff frequencies, Vickers et al. @J. Acoust. Soc. Am. 110, 1164 –1175 ~2001!# found that the benefit from amplification of high-frequency components was related to the presence or absence of a cochlear dead region at high frequencies. For hearing-impaired subjects without dead regions, performance improved with increasing cutoff frequency up to 7.5 kHz ~the highest value tested!. Subjects with high-frequency dead regions showed no improvement when the cutoff frequency was increased above about 1.7 times the edge frequency of the dead region. The present study was similar to that of Vickers et al. but used VCV stimuli presented in background noise. Ten subjects with high-frequency hearing loss, including eight from the study of Vickers et al., were tested. Five had dead regions starting below 2 kHz, and five had no dead regions. Speech stimuli at a nominal level of 65 dB were mixed with spectrally matched noise, amplified according to the ‘‘Cambridge’’ prescriptive formula for each subject and then low pass filtered. The noise level was chosen separately for each subject to give a moderate reduction in intelligibility relative to listening in quiet. For subjects without dead regions, performance generally improved with increasing cutoff frequency up to 7.5 kHz, on average more so in noise than in quiet. For most subjects with dead regions, performance improved with cutoff frequency up to 1.5–2 times the edge frequency of the dead region, but hardly changed with further increases. Calculations of speech audibility using a modified version of the articulation index showed that application of the Cambridge formula was at least partially successful in making high-frequency components of the speech audible for subjects with dead regions, and that such subjects often failed to benefit from increased audibility of the speech at high frequencies. © 2002 Acoustical Society of America. @DOI: 10.1121/1.1498853# PACS numbers: 43.71.Ky, 43.72.Kb, 43.66.Ts, 43.66.Sr @CWT# I. INTRODUCTION There have been reports over a period of many years suggesting that people with moderate-to-severe hearing loss at high frequencies often do not benefit from amplification of high frequencies, or even perform more poorly when high frequencies are amplified ~Villchur, 1973; Moore et al., 1985; Murray and Byrne, 1986; Hogan and Turner, 1998; Ching et al., 1998; Turner and Cummings, 1999; Amos and Humes, 2001!; for reviews see Moore ~2001! and Vickers et al. ~2001!. These studies clearly show that, when the hear- ing loss exceeds about 55 dB at high frequencies, amplifica- tion of high frequencies is often not beneficial, although it usually is beneficial for people with milder losses ~Skinner and Miller, 1983; Vickers et al., 2001!. The lack of benefit of high-frequency amplification, when found, has often been interpreted in terms of damage to inner hair cells ~IHCs! in the basal region of the cochlea. When the IHCs or neurons over a specific region of the co- chlea are not functioning, we refer to this as a dead region ~Moore and Glasberg, 1997; Moore et al., 2000; Moore, 2001!. It has been suggested that subjects who do not benefit from amplification have dead regions ~or at least extensive damage to the IHCs! at high frequencies, while subjects who do benefit from amplification have surviving IHCs and neu- rons with high CFs. Vickers et al. ~2001! were among the first to examine the benefits of high-frequency amplification for people with diagnosed dead regions. Both psychophysical tuning curves ~PTCs!~Moore and Alca ´ ntara, 2001! and the TEN test ~Moore et al., 2000! were used to detect and define the limits of any dead regions. The TEN test involves measurement of masked thresholds for pure tones presented in a threshold- equalizing noise. An abnormally high threshold at a specific frequency is taken as indicating a dead region at that fre- quency. All subjects tested by Vickers et al. had high- frequency hearing loss, but some had high-frequency dead regions and some did not; generally, the subjects with dead regions had more severe high-frequency hearing losses than those without dead regions. The speech stimuli were vowel– a! Small portions of the data described in this paper were presented in Baer et al. ~2002!. b! Electronic mail: [email protected] c! Current address: Institute of Acoustics, Adam Mickiewicz University, 85 Umultowska Street, 61-614 Poznan, Poland. 1133 J. Acoust. Soc. Am. 112 (3), Pt. 1, Sep. 2002 0001-4966/2002/112(3)/1133/12/$19.00 © 2002 Acoustical Society of America
Transcript of Effects of low-pass filtering on the intelligibility of speech in quiet for people with and without...

Effects of low pass filtering on the intelligibility of speechin noise for people with and without dead regionsat high frequenciesa)
Thomas Baer, Brian C. J. Moore,b) and Karolina Klukc)
Department of Experimental Psychology, University of Cambridge, Downing Street, Cambridge CB2 3EB,United Kingdom
~Received 29 January 2002; revised 9 May 2002; accepted 14 June 2002!
People with high-frequency sensorineural hearing loss differ in the benefit they gain fromamplification of high frequencies when listening to speech. Using vowel–consonant–vowel~VCV!stimuli in quiet that were amplified and then low pass filtered with various cutoff frequencies,Vickers et al. @J. Acoust. Soc. Am.110, 1164–1175 ~2001!# found that the benefit fromamplification of high-frequency components was related to the presence or absence of a cochleardead region at high frequencies. For hearing-impaired subjects without dead regions, performanceimproved with increasing cutoff frequency up to 7.5 kHz~the highest value tested!. Subjects withhigh-frequency dead regions showed no improvement when the cutoff frequency was increasedabove about 1.7 times the edge frequency of the dead region. The present study was similar to thatof Vickers et al. but used VCV stimuli presented in background noise. Ten subjects withhigh-frequency hearing loss, including eight from the study of Vickerset al., were tested. Five haddead regions starting below 2 kHz, and five had no dead regions. Speech stimuli at a nominal levelof 65 dB were mixed with spectrally matched noise, amplified according to the ‘‘Cambridge’’prescriptive formula for each subject and then low pass filtered. The noise level was chosenseparately for each subject to give a moderate reduction in intelligibility relative to listening in quiet.For subjects without dead regions, performance generally improved with increasing cutofffrequency up to 7.5 kHz, on average more so in noise than in quiet. For most subjects with deadregions, performance improved with cutoff frequency up to 1.5–2 times the edge frequency of thedead region, but hardly changed with further increases. Calculations of speech audibility using amodified version of the articulation index showed that application of the Cambridge formula was atleast partially successful in making high-frequency components of the speech audible for subjectswith dead regions, and that such subjects often failed to benefit from increased audibility of thespeech at high frequencies. ©2002 Acoustical Society of America.@DOI: 10.1121/1.1498853#
PACS numbers: 43.71.Ky, 43.72.Kb, 43.66.Ts, 43.66.Sr@CWT#
aloo
ig
98nd
aci
n,e.
co-ion
nefit
ou-
eithrves
itst ofold-ificfre-
eadeadthanel–
Ba
85
I. INTRODUCTION
There have been reports over a period of many yesuggesting that people with moderate-to-severe hearingat high frequencies often do not benefit from amplificationhigh frequencies, or even perform more poorly when hfrequencies are amplified~Villchur, 1973; Moore et al.,1985; Murray and Byrne, 1986; Hogan and Turner, 19Ching et al., 1998; Turner and Cummings, 1999; Amos aHumes, 2001!; for reviews see Moore~2001! and Vickerset al. ~2001!. These studies clearly show that, when the heing loss exceeds about 55 dB at high frequencies, amplifition of high frequencies is often not beneficial, althoughusually is beneficial for people with milder losses~Skinnerand Miller, 1983; Vickerset al., 2001!.
The lack of benefit of high-frequency amplificatiowhen found, has often been interpreted in terms of damaginner hair cells~IHCs! in the basal region of the cochlea
a!Small portions of the data described in this paper were presented inet al. ~2002!.
b!Electronic mail: [email protected]!Current address: Institute of Acoustics, Adam Mickiewicz University,Umultowska Street, 61-614 Poznan, Poland.
J. Acoust. Soc. Am. 112 (3), Pt. 1, Sep. 2002 0001-4966/2002/112(3)/1
rsssfh
;
r-a-t
to
When the IHCs or neurons over a specific region of thechlea are not functioning, we refer to this as a dead reg~Moore and Glasberg, 1997; Mooreet al., 2000; Moore,2001!. It has been suggested that subjects who do not befrom amplification have dead regions~or at least extensivedamage to the IHCs! at high frequencies, while subjects whdo benefit from amplification have surviving IHCs and nerons with high CFs.
Vickers et al. ~2001! were among the first to examinthe benefits of high-frequency amplification for people wdiagnosed dead regions. Both psychophysical tuning cu~PTCs! ~Moore and Alca´ntara, 2001! and the TEN test~Mooreet al., 2000! were used to detect and define the limof any dead regions. The TEN test involves measuremenmasked thresholds for pure tones presented in a threshequalizing noise. An abnormally high threshold at a specfrequency is taken as indicating a dead region at thatquency. All subjects tested by Vickerset al. had high-frequency hearing loss, but some had high-frequency dregions and some did not; generally, the subjects with dregions had more severe high-frequency hearing lossesthose without dead regions. The speech stimuli were vow
er
1133133/12/$19.00 © 2002 Acoustical Society of America

imatedct
TABLE I. Audiometric ~air conduction! thresholds of the test ears of the subjects, in dB HL. An asterisk indicates frequencies falling within the estdead region. An arrow indicates that audiometric thresholds were too high to be measured with the available audiometer. The age of each subje~years! isalso shown.
Subject Ear Age
Frequency~kHz!
0.25 0.5 0.75 1.0 1.5 2.0 3.0 4.0 6.0 8.0
JC L 82 10 5 20 30 35 35 50 60 70R 20 10 20 30 35 40 40 60 70
KC L 65 10 10 10 40 65 70 75 70 65R 10 10 10 15 45 60 60 60 55
VW L 73 50 60 70 60 70 60 65R 40 55 70 75 65 75 85 75 90
MR L 49 5 0 25 55 60 60 45 40 30R 5 0 10 65 75 70 65 55 45
DT L 76 25 15 15 45 45 50R 20 10 5 60 65 60 60
CA L 55 25 30 45 65* 110* ↑* ↑* ↑* ↑* ↑*MW L 60 30 55 60 65 85* 110* 110* 100* ↑* ↑*RC L 71 15 10 5 60* 75* 105* 90*LR R 48 10 55 65 80 90* 110* 95* ↑* ↑*NC L 76 20 25 30 35 60* 70* 95* 110* ↑* ↑*
R 25 25 55 70* 90* 95* 95* 110* ↑* ↑*
ofo
hntee-th
ienecy
obemn
f tmeo
f
dsig
iteineaot
nTh
s-mits
re
reof
lygh-
2nalas-
jects,
ir-ome
withsted.ble
ectsromthatdthaningiskstedow-
ick-
consonant–vowel~VCV! nonsense syllables, using onethree vowels and 21 different consonants. In a baseline cdition, subjects were tested using broadband stimuli witnominal level of 65 dB SPL. Prior to presentation via Senheiser HD580 earphones, the stimuli were subjected tofrequency-gain characteristic prescribed by the ‘‘Cambridgformula ~Moore and Glasberg, 1998; see the following dtails!. The stimuli for all other conditions were initially subjected to this same frequency-gain characteristic. Then,speech was low pass filtered with various cutoff frequenc
For subjects without dead regions, performance geally improved progressively with increasing cutoff frequenup to the highest frequency tested~7.5 kHz!. For subjectswith dead regions, two patterns of performance wereserved. For most subjects, performance initially improvwith increasing cutoff frequency and then reached an asytote. The asymptote was reached when the cutoff frequewas about 1.5–2 times the estimated edge frequency odead region. For a few subjects, performance initially iproved with increasing cutoff frequency, and then worsenwith further increases. This indicates that amplificationhigh frequencies impaired performance.
For the six ears without dead regions, the mean scorethe broadband speech~77.2%! was significantly higher (p50.015) than the mean score for speech low pass filtere2000 Hz~65.1%!. However, for nine ears with dead regionstarting below 2000 Hz, the mean scores did not differ snificantly for the broadband speech~48.5%! and for thespeech low pass filtered at 2000 Hz~47.1%!.
The study of Vickerset al. ~2001! used speech stimulpresented in quiet. However, in everyday life, speech ofoccurs in the presence of background noise, and hearimpaired people generally have the greatest difficulty whnoise is present. It is not clear whether the results of low pfiltering would be the same in quiet and in the presencebackground noise. In the present paper, we determinedeffect of low pass filtering on the intelligibility of speech inoise, using subjects with high-frequency hearing loss.
1134 J. Acoust. Soc. Am., Vol. 112, No. 3, Pt. 1, Sep. 2002
n-a-he’’-
es.r-
-dp-cyhe-df
or
at
-
ng-nssf
he
e
TEN test ~Moore et al., 2000! was used to detect the preence of dead regions and PTCs were used to define the liof any dead regions more precisely~Moore and Alca´ntara,2001!. Subjects both with and without dead regions wetested.
II. METHOD
A. Subjects
Ten subjects with high-frequency hearing loss wetested. Eight of them had previously served in the studyVickers et al. ~2001!, where they were comprehensivetested for dead regions. Of these eight, five had hifrequency dead regions extending to frequencies belowkHz and the other three had no dead regions. Two additiosubjects without dead regions were tested. They weresessed in the same way as the other subjects. For all sublosses were diagnosed as being sensorineural~presumablycochlear! based on normal tympanometry and lack of an abone gap. Testing was done separately for each ear, but ssubjects were tested using one ear only. In total, six earsdead regions and ten ears without dead regions were teThe audiograms of the ears tested are given in Table I. TaI also shows the ages of the subjects. For all of the subjwith dead regions, the dead region appeared to extend fthe estimated edge frequency up to the highest frequencywas evaluated~10 kHz!. Generally, the subjects with dearegions had more severe high-frequency hearing lossesthose without dead regions. Audiometric frequencies fallwithin the diagnosed dead regions are indicated by asterin Table I. Edge frequencies of the dead regions, estimafrom the PTC measurements, are given in the figures shing the data~presented later!.
B. Stimuli and conditions
The speech stimuli were the same as those used by Vers et al. ~2001!, namely, vowel–consonant–vowel~VCV!
Baer et al.: Intelligibility of filtered speech
itiaba
istnlisf
th
gw
b
ng
sen-he
frx48dele
aa
geeis1gfofreo
ith
n-eg
ecnetim
sru
ar
heere
oisemethissianusthe
echin
ifiedveltheer.wlowthat
e-here-y atII
jectally,e ex-con-tocy
foredm--
nts,to
achc-wasistsntedr ofinond
omeually
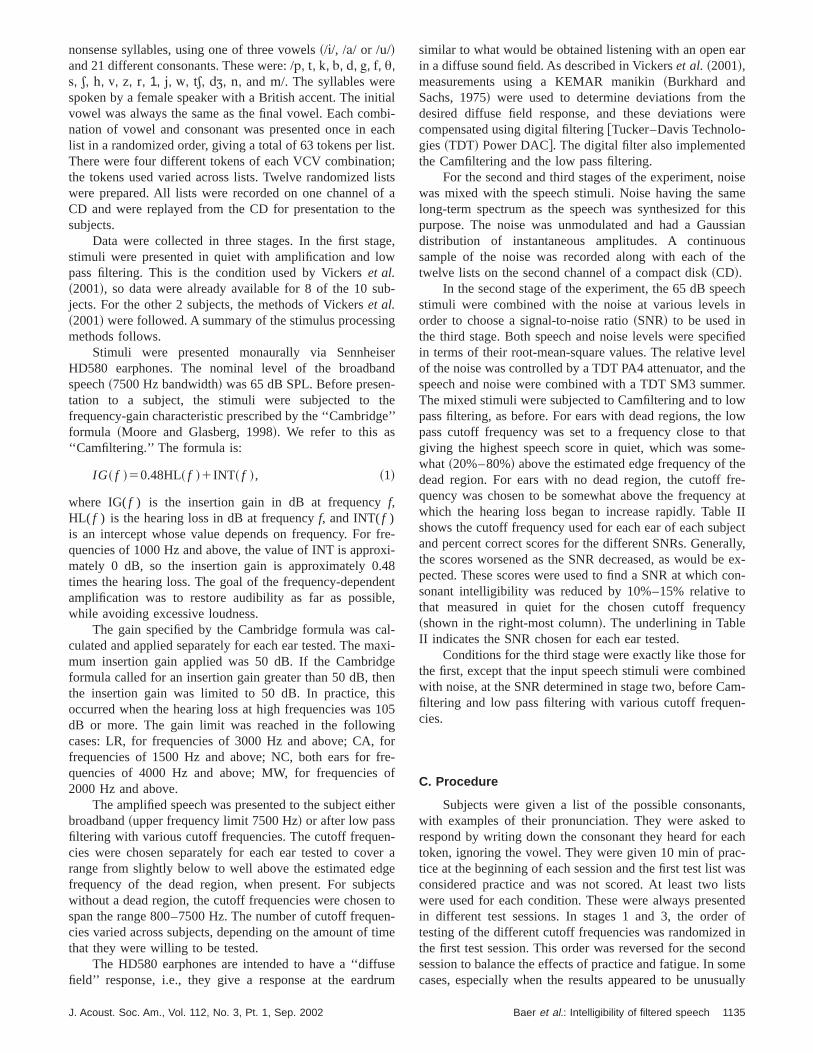
nonsense syllables, using one of three vowels~/{/, /~/ or /É/!and 21 different consonants. These were: /!, #, %, ", $, ,, ), Y,2, b, *, 3, 6, ., 1, -, 4, #b, $c, ', and &/. The syllables werespoken by a female speaker with a British accent. The invowel was always the same as the final vowel. Each comnation of vowel and consonant was presented once in elist in a randomized order, giving a total of 63 tokens per lThere were four different tokens of each VCV combinatiothe tokens used varied across lists. Twelve randomizedwere prepared. All lists were recorded on one channel oCD and were replayed from the CD for presentation tosubjects.
Data were collected in three stages. In the first stastimuli were presented in quiet with amplification and lopass filtering. This is the condition used by Vickerset al.~2001!, so data were already available for 8 of the 10 sujects. For the other 2 subjects, the methods of Vickerset al.~2001! were followed. A summary of the stimulus processimethods follows.
Stimuli were presented monaurally via SennheiHD580 earphones. The nominal level of the broadbaspeech~7500 Hz bandwidth! was 65 dB SPL. Before presentation to a subject, the stimuli were subjected to tfrequency-gain characteristic prescribed by the ‘‘Cambridgformula ~Moore and Glasberg, 1998!. We refer to this as‘‘Camfiltering.’’ The formula is:
IG~ f !50.48HL~ f !1INT~ f !, ~1!
where IG(f ) is the insertion gain in dB at frequencyf,HL( f ) is the hearing loss in dB at frequencyf, and INT(f )is an intercept whose value depends on frequency. Forquencies of 1000 Hz and above, the value of INT is appromately 0 dB, so the insertion gain is approximately 0.times the hearing loss. The goal of the frequency-depenamplification was to restore audibility as far as possibwhile avoiding excessive loudness.
The gain specified by the Cambridge formula was cculated and applied separately for each ear tested. The mmum insertion gain applied was 50 dB. If the Cambridformula called for an insertion gain greater than 50 dB, ththe insertion gain was limited to 50 dB. In practice, thoccurred when the hearing loss at high frequencies wasdB or more. The gain limit was reached in the followincases: LR, for frequencies of 3000 Hz and above; CA,frequencies of 1500 Hz and above; NC, both ears forquencies of 4000 Hz and above; MW, for frequencies2000 Hz and above.
The amplified speech was presented to the subject ebroadband~upper frequency limit 7500 Hz! or after low passfiltering with various cutoff frequencies. The cutoff frequecies were chosen separately for each ear tested to covrange from slightly below to well above the estimated edfrequency of the dead region, when present. For subjwithout a dead region, the cutoff frequencies were chosespan the range 800–7500 Hz. The number of cutoff frequcies varied across subjects, depending on the amount ofthat they were willing to be tested.
The HD580 earphones are intended to have a ‘‘diffufield’’ response, i.e., they give a response at the eard
J. Acoust. Soc. Am., Vol. 112, No. 3, Pt. 1, Sep. 2002
li-ch.;tsae
e,
-
rd
e’’
e-i-
nt,
l-xi-
n
05
r-f
er
r aetston-
e
em
similar to what would be obtained listening with an open ein a diffuse sound field. As described in Vickerset al. ~2001!,measurements using a KEMAR manikin~Burkhard andSachs, 1975! were used to determine deviations from tdesired diffuse field response, and these deviations wcompensated using digital filtering@Tucker–Davis Technolo-gies~TDT! Power DAC#. The digital filter also implementedthe Camfiltering and the low pass filtering.
For the second and third stages of the experiment, nwas mixed with the speech stimuli. Noise having the salong-term spectrum as the speech was synthesized forpurpose. The noise was unmodulated and had a Gausdistribution of instantaneous amplitudes. A continuosample of the noise was recorded along with each oftwelve lists on the second channel of a compact disk~CD!.
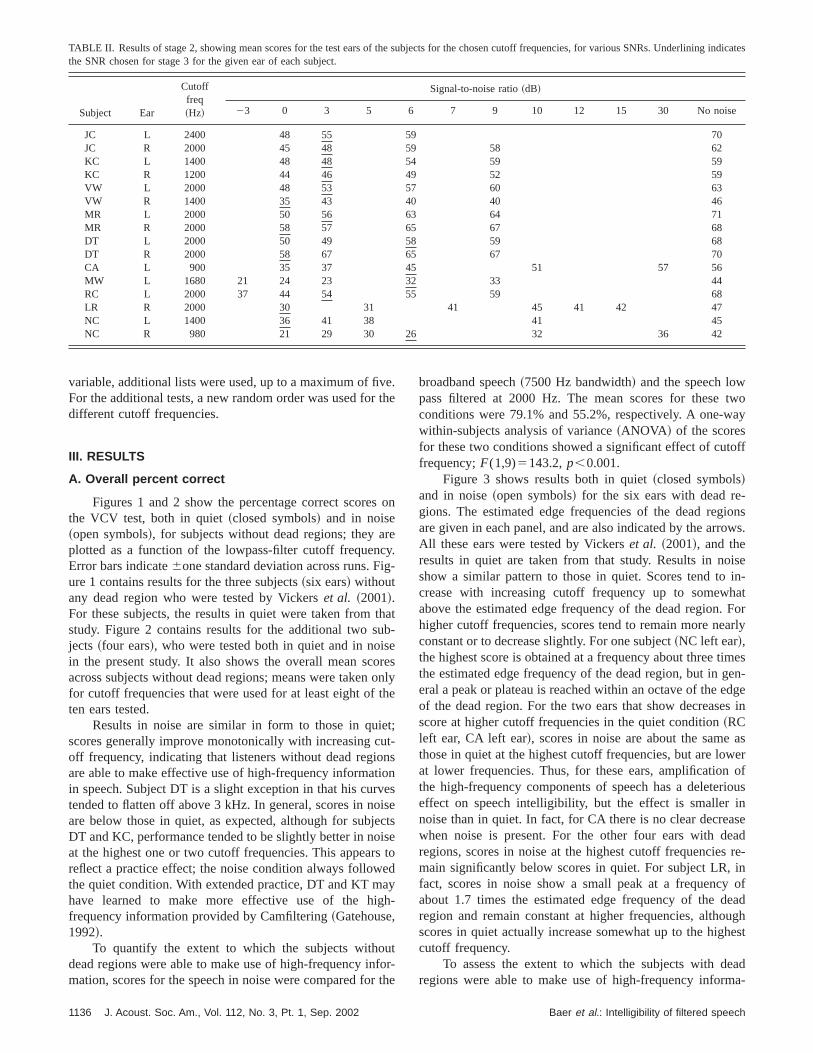
In the second stage of the experiment, the 65 dB spestimuli were combined with the noise at various levelsorder to choose a signal-to-noise ratio~SNR! to be used inthe third stage. Both speech and noise levels were specin terms of their root-mean-square values. The relative leof the noise was controlled by a TDT PA4 attenuator, andspeech and noise were combined with a TDT SM3 summThe mixed stimuli were subjected to Camfiltering and to lopass filtering, as before. For ears with dead regions, thepass cutoff frequency was set to a frequency close togiving the highest speech score in quiet, which was somwhat ~20%–80%! above the estimated edge frequency of tdead region. For ears with no dead region, the cutoff fquency was chosen to be somewhat above the frequencwhich the hearing loss began to increase rapidly. Tableshows the cutoff frequency used for each ear of each suband percent correct scores for the different SNRs. Generthe scores worsened as the SNR decreased, as would bpected. These scores were used to find a SNR at whichsonant intelligibility was reduced by 10%–15% relativethat measured in quiet for the chosen cutoff frequen~shown in the right-most column!. The underlining in TableII indicates the SNR chosen for each ear tested.
Conditions for the third stage were exactly like thosethe first, except that the input speech stimuli were combinwith noise, at the SNR determined in stage two, before Cafiltering and low pass filtering with various cutoff frequencies.
C. Procedure
Subjects were given a list of the possible consonawith examples of their pronunciation. They were askedrespond by writing down the consonant they heard for etoken, ignoring the vowel. They were given 10 min of pratice at the beginning of each session and the first test listconsidered practice and was not scored. At least two lwere used for each condition. These were always presein different test sessions. In stages 1 and 3, the ordetesting of the different cutoff frequencies was randomizedthe first test session. This order was reversed for the secsession to balance the effects of practice and fatigue. In scases, especially when the results appeared to be unus
1135Baer et al.: Intelligibility of filtered speech
g ind
TABLE II. Results of stage 2, showing mean scores for the test ears of the subjects for the chosen cutoff frequencies, for various SNRs. Underlininicatesthe SNR chosen for stage 3 for the given ear of each subject.Subject Ear
Cutofffreq~Hz!
Signal-to-noise ratio~dB!
23 0 3 5 6 7 9 10 12 15 30 No noise
JC L 2400 48 55 59 70JC R 2000 45 48 59 58 62KC L 1400 48 48 54 59 59KC R 1200 44 46 49 52 59VW L 2000 48 53 57 60 63VW R 1400 35 43 40 40 46MR L 2000 50 56 63 64 71MR R 2000 58 57 65 67 68DT L 2000 50 49 58 59 68DT R 2000 58 67 65 67 70CA L 900 35 37 45 51 57 56MW L 1680 21 24 23 32 33 44RC L 2000 37 44 54 55 59 68LR R 2000 30 31 41 45 41 42 47NC L 1400 36 41 38 41 45NC R 980 21 29 30 26 32 36 42
ver t
s
recyig
thubseoroth
etutnioveis
ecisseaygh
utfor t
twoay
off
-ionsws.
isein-
hatFor
arly
imesen-dges in
aswer
ofiousinaseead
re-inof
eadughhest
eada-
variable, additional lists were used, up to a maximum of fiFor the additional tests, a new random order was used fodifferent cutoff frequencies.
III. RESULTS
A. Overall percent correct
Figures 1 and 2 show the percentage correct scorethe VCV test, both in quiet~closed symbols! and in noise~open symbols!, for subjects without dead regions; they aplotted as a function of the lowpass-filter cutoff frequenError bars indicate6one standard deviation across runs. Fure 1 contains results for the three subjects~six ears! withoutany dead region who were tested by Vickerset al. ~2001!.For these subjects, the results in quiet were taken fromstudy. Figure 2 contains results for the additional two sjects ~four ears!, who were tested both in quiet and in noiin the present study. It also shows the overall mean scacross subjects without dead regions; means were takenfor cutoff frequencies that were used for at least eight often ears tested.
Results in noise are similar in form to those in quiscores generally improve monotonically with increasing coff frequency, indicating that listeners without dead regioare able to make effective use of high-frequency informatin speech. Subject DT is a slight exception in that his curtended to flatten off above 3 kHz. In general, scores in noare below those in quiet, as expected, although for subjDT and KC, performance tended to be slightly better in noat the highest one or two cutoff frequencies. This appearreflect a practice effect; the noise condition always followthe quiet condition. With extended practice, DT and KT mhave learned to make more effective use of the hifrequency information provided by Camfiltering~Gatehouse,1992!.
To quantify the extent to which the subjects withodead regions were able to make use of high-frequency inmation, scores for the speech in noise were compared fo
1136 J. Acoust. Soc. Am., Vol. 112, No. 3, Pt. 1, Sep. 2002
.he
on
.-
at-
esnlye
;-snsetsetod
-
r-he
broadband speech~7500 Hz bandwidth! and the speech lowpass filtered at 2000 Hz. The mean scores for theseconditions were 79.1% and 55.2%, respectively. A one-wwithin-subjects analysis of variance~ANOVA ! of the scoresfor these two conditions showed a significant effect of cutfrequency;F(1,9)5143.2,p,0.001.
Figure 3 shows results both in quiet~closed symbols!and in noise~open symbols! for the six ears with dead regions. The estimated edge frequencies of the dead regare given in each panel, and are also indicated by the arroAll these ears were tested by Vickerset al. ~2001!, and theresults in quiet are taken from that study. Results in noshow a similar pattern to those in quiet. Scores tend tocrease with increasing cutoff frequency up to somewabove the estimated edge frequency of the dead region.higher cutoff frequencies, scores tend to remain more neconstant or to decrease slightly. For one subject~NC left ear!,the highest score is obtained at a frequency about three tthe estimated edge frequency of the dead region, but in geral a peak or plateau is reached within an octave of the eof the dead region. For the two ears that show decreasescore at higher cutoff frequencies in the quiet condition~RCleft ear, CA left ear!, scores in noise are about the samethose in quiet at the highest cutoff frequencies, but are loat lower frequencies. Thus, for these ears, amplificationthe high-frequency components of speech has a deletereffect on speech intelligibility, but the effect is smallernoise than in quiet. In fact, for CA there is no clear decrewhen noise is present. For the other four ears with dregions, scores in noise at the highest cutoff frequenciesmain significantly below scores in quiet. For subject LR,fact, scores in noise show a small peak at a frequencyabout 1.7 times the estimated edge frequency of the dregion and remain constant at higher frequencies, althoscores in quiet actually increase somewhat up to the higcutoff frequency.
To assess the extent to which the subjects with dregions were able to make use of high-frequency inform
Baer et al.: Intelligibility of filtered speech

frequ
FIG. 1. Results for six ears without dead regions. The percentage correct score on the VCV test is plotted as a function of the low pass filter cutoffency.Scores in quiet and in noise are indicated by closed and open symbols, respectively. Error bars indicate6 one standard deviation across runs.asonine
inintoncae
t
ltsthet
e
oise. 4
egedi-
fre-re-
b-the
offs atap-z.
ctsng
ri-Thetive
tion, scores for speech in noise were compared for the broband speech~7500 Hz bandwidth! and the speech low pasfiltered at 2000 Hz. The mean scores for these two conditiwere 41.1% and 39.3%, respectively. A one-way withsubjects ANOVA of scores for these two conditions showno significant effect of cutoff frequency;F(1,5)55.98, p50.058.
To assess the statistical significance of the worsenwith increasing cutoff frequency found for the resultsnoise for LR and RC, scores were compared for the cufrequency giving the highest score and the cutoff frequeof 7500 Hz. This was done using both t-tests and chi-squtests~under the null hypothesis that the expected scores wequal for the two cutoff frequencies!. The worsening was nosignificant in either case.
To give an overall impression of the pattern of resufor the subjects with dead regions starting below 2 kHz,cutoff frequencies used for each ear of the ears tested wexpressed relative to the estimated edge frequency ofdead region for that ear. The data for each ear~percent cor-rect versus relative frequency! were fitted with a cubic splinefunction. The cubic spline functions were then averag
J. Acoust. Soc. Am., Vol. 112, No. 3, Pt. 1, Sep. 2002
d-
s-d
g
ffyrere
ere
he
d
across ears. This was done separately for the quiet and nconditions; results are shown in the left-hand panel of Fig~broken and solid lines, respectively!. On average, the noishas a roughly equal effect on intelligibility across the ranof cutoff frequencies tested. For both noise and quiet contions, average scores increase systematically with cutoffquency up to relative frequencies between 1 and 2, andmain roughly constant at higher cutoff frequencies.
A similar analysis was applied to the results for the sujects without dead regions; these results are plotted inright-hand panel of Fig. 4 as a function of absolute~notrelative! frequency in kHz. For both conditions~quiet andnoise!, average scores increase monotonically with cutfrequency. The difference between conditions decreasehigher cutoff frequencies; on average, scores in noiseproach those in quiet for cutoff frequencies above 3 kHThis may partly reflect the increasing ability of the subjeto make use of high-frequency information with increasipractice.
The left- and right-hand panels in Fig. 4 allow compason of scores for subjects with and without dead regions.two frequency scales are roughly comparable, as a rela
1137Baer et al.: Intelligibility of filtered speech

cts wi
FIG. 2. As in Fig. 1, but showing results for a further four ears without dead regions. The lower left-hand panel shows mean scores across all subjethoutdead regions; in this panel error bars indicate6 one standard error.neci
adin0y1tocuitte
te
freainlifi
eaen
eadlowfre-thetwoays
reinetic
ns.ach
ma-ce,
ibed
frequency of 1 corresponds, on average, to a frequency1 kHz; the geometric mean of the estimated edge frequenof the dead regions was 1.007 kHz. In quiet~dashed lines!,performance is similar for subjects with and without deregions for the lowest abscissa values. The curves begdiverge at an abscissa value of 1.3 to 1.4, and differ by 1at about 1.7. In noise~solid lines!, performance is essentiallthe same for the two groups up to abscissa values of 1.3–and the difference is again about 10% at 1.7. Thus, the cufrequencies for which scores begin to diverge for subjewith and without dead regions are about the same in qand in noise. For the subjects with dead regions, the fifunction increases with increasing relative frequency upabout 1.7, and then flattens off. This indicates that thertypically some benefit to intelligibility of amplifying fre-quencies up to about 70% above the estimated edgequency of the dead region. For the subjects without dregions, the fitted function increases progressively withcreasing cutoff frequency, indicating that broadband ampcation gives the best performance.
To assess the extent to which the subjects with dregions were able to make use of information from frequ
1138 J. Acoust. Soc. Am., Vol. 112, No. 3, Pt. 1, Sep. 2002
ares
to%
.5,ff
tsetdois
e-d--
d-
cies just above the estimated edge frequency of the dregion for speech in noise, scores were compared for thepass filter cutoff frequency closest to the estimated edgequency, and for the cutoff frequency closest to 1.7 timesestimated edge frequency. The mean scores for theseconditions were 33.1% and 41.1%, respectively. A one-wwithin-subjects ANOVA of scores for these two conditionshowed that the difference was significant;F(1,5)58.19, p50.035.
B. Transmission of phonetic features
It is of interest to determine which phonetic features aaffected most by changes in bandwidth, and to determwhether the effect of bandwidth on transmission of phonefeatures differs for subjects without and with dead regioTo examine these issues, the results for each ear of esubject were analyzed to determine the percentage infortion transmission for the phonetic features of voicing, plaand manner~Miller and Nicely, 1955! as a function of filtercutoff frequency. The method used was exactly as descrby Vickers et al. ~2001!. The results were very similar to
Baer et al.: Intelligibility of filtered speech
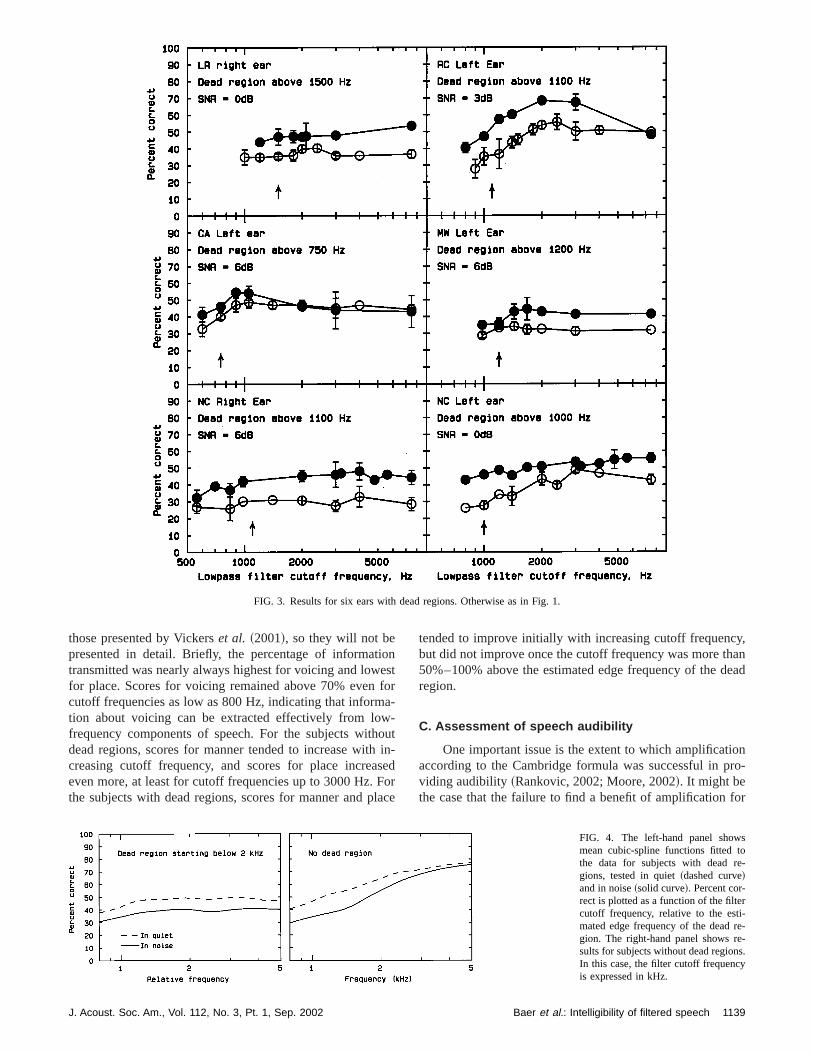
FIG. 3. Results for six ears with dead regions. Otherwise as in Fig. 1.
ioesfoa-o
sFola
y,anead
onro-
for
those presented by Vickerset al. ~2001!, so they will not bepresented in detail. Briefly, the percentage of informattransmitted was nearly always highest for voicing and lowfor place. Scores for voicing remained above 70% evencutoff frequencies as low as 800 Hz, indicating that informtion about voicing can be extracted effectively from lowfrequency components of speech. For the subjects withdead regions, scores for manner tended to increase withcreasing cutoff frequency, and scores for place increaeven more, at least for cutoff frequencies up to 3000 Hz.the subjects with dead regions, scores for manner and p
J. Acoust. Soc. Am., Vol. 112, No. 3, Pt. 1, Sep. 2002
ntr-
utin-edrce
tended to improve initially with increasing cutoff frequencbut did not improve once the cutoff frequency was more th50%–100% above the estimated edge frequency of the dregion.
C. Assessment of speech audibility
One important issue is the extent to which amplificatiaccording to the Cambridge formula was successful in pviding audibility ~Rankovic, 2002; Moore, 2002!. It might bethe case that the failure to find a benefit of amplification
s
-
r-e--
s.
FIG. 4. The left-hand panel showmean cubic-spline functions fitted tothe data for subjects with dead regions, tested in quiet~dashed curve!and in noise~solid curve!. Percent cor-rect is plotted as a function of the filtecutoff frequency, relative to the estimated edge frequency of the dead rgion. The right-hand panel shows results for subjects without dead regionIn this case, the filter cutoff frequencyis expressed in kHz.
1139Baer et al.: Intelligibility of filtered speech
tieadadinbykepi
trath
th
eratruoulto
ngxcib-d
eadwat,thhcnt
oo-w
h
ee
n
ovhaz
sncththreit
lowita-a
e
n,l’’
re-we
arttionn thenal
hus,s 0teddB
ro--
icpor-
ectlcu-hisnce
notine
of
here
oftext.ight
frequencies more than a factor of 1.7 above the estimaedge frequency of a dead region was caused by insufficamplification of those frequencies; if the speech is not maudible, there can be no benefit from amplification. Todress this issue, we calculated a form of the articulationdex ~AI !, using a modification of the procedure describedMoore and Glasberg~1998!. This procedure was specificalldesigned for use with hearing-impaired people, and it tainto account the broadening of the auditory filters that tycally occurs in people with cochlear hearing loss~Moore,1998!. When the filters are broader than normal, specenergy is integrated over a wider range than normal, sothreshold for detecting a broadband sound may be lowerwould be anticipated from the pure-tone audiogram.
In the procedure described by Moore and Glasb~1998!, the first stage is the calculation of an excitation ptern for an input with the same long-term average spectas the speech signals under consideration. For this purpwe used the long-term average spectra of our VCV stimtaking into account the effects of the digital filtering usedimplement the Cambridge formula and the low pass filteriand the transfer function of the HD580 earphone. The etation patterns were calculated using the procedure descrby Moore and Glasberg~1997!, except that the stage simulating the transfer function through the middle ear was mofied to be the same as described in Mooreet al. ~1997!. Thisprocedure allows for the possibility of dead regions, by sting the excitation to a very low value within a specified deregion. However, for the present analyses, the program‘‘told’’ that no dead region was present. The excitation pterns were specified on an ERB scale~Glasberg and Moore1990!. For points with equal ERB-spacing, we calculatedexcitation level relative to the excitation required for thresold. From this we calculated the proportion of the speedynamic range that was above threshold in a given frequeband, assuming that this range extends from 15 dB belowrms level to 15 dB above it~ANSI, 1997!. For example, ifthe rms excitation is 15 dB above threshold, then the proption is 1, while if the rms excitation is at threshold, the prportion is 15/3050.5, and if the rms excitation is 5 dB belothreshold the proportion is 10/3050.333. Band importancefunctions were adapted from those for average speecspecified in the ‘‘critical band SII procedure’’~ANSI, 1997!,but values were adjusted to allow for the difference betwtraditional critical bandwidth values~Zwicker and Terhardt,1980! and ERB values~Glasberg and Moore, 1990!. Theimportance values are specified in Table 2 of Moore aGlasberg~1998!. The AI was calculated by multiplying theproportion of the speech dynamic range that was abthreshold in a given band, by the importance value for tband, and then summing across all bands from 189.7 H9.302 kHz.
This method of calculating the AI is based on the asumption that the audibility of excitation at a particular ceter frequency is closely related to the audibility of the speespectrum at that frequency. In other words, we assumethe excitation at a specific frequency is determined byspeech energy close to that frequency, rather than the spof excitation from adjacent frequencies. To check the valid
1140 J. Acoust. Soc. Am., Vol. 112, No. 3, Pt. 1, Sep. 2002
ednte--
y
s-
le
an
g-mse,i,
,i-ed
i-
t-
as-
e-hcyhe
r-
as
n
d
etto
--hatead
y
of this assumption, we assessed the effect of sharplypass filtering the input spectrum used to calculate the exction pattern. In all cases, removal of spectral energy inspecific frequency region~for example by decreasing thlowpass cutoff frequency from 2 to 1.8 kHz! resulted in areduction in the excitation level in that frequency regioconfirming that the excitation was produced by ‘‘locarather than by ‘‘remote’’ frequency components.
Moore and Glasberg~1998! did not apply their proce-dure for the calculation of the AI to the case of speech psented in noise. To extend their procedure to this case,assumed that the noise limited the audibility of the lower pof the speech dynamic range. Experiments on the detecof tones in noise suggest that tones can be detected wheSNR at the output of the auditory filter centered on the sigfrequency is about23 dB ~Patterson and Moore, 1986!. Weassumed that this was also the case for speech in noise. Tfor example, when the SNR used with a given subject wadB, we assumed that useful information could be extracfrom the speech when the short-term speech level was 3below that of the noise. For this example, the audible pportion of the speech dynamic range~assuming that the absolute threshold is not a limiting factor! is 18/3050.6. Moregenerally, the audible proportion of the speech dynamrange in a specific frequency band was taken as the protion above the absolute threshold, or as (SNR118)/30,whichever was the smaller.
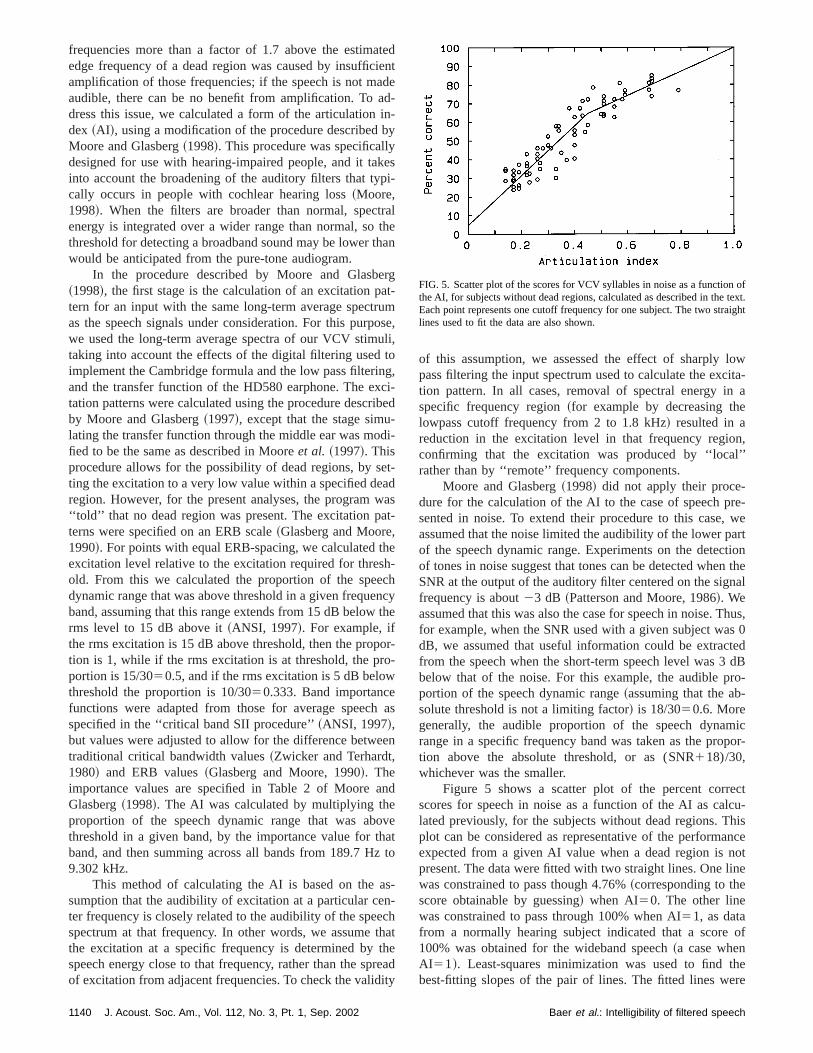
Figure 5 shows a scatter plot of the percent corrscores for speech in noise as a function of the AI as calated previously, for the subjects without dead regions. Tplot can be considered as representative of the performaexpected from a given AI value when a dead region ispresent. The data were fitted with two straight lines. One lwas constrained to pass though 4.76%~corresponding to thescore obtainable by guessing! when AI50. The other linewas constrained to pass through 100% when AI51, as datafrom a normally hearing subject indicated that a score100% was obtained for the wideband speech~a case whenAI51!. Least-squares minimization was used to find tbest-fitting slopes of the pair of lines. The fitted lines we
FIG. 5. Scatter plot of the scores for VCV syllables in noise as a functionthe AI, for subjects without dead regions, calculated as described in theEach point represents one cutoff frequency for one subject. The two stralines used to fit the data are also shown.
Baer et al.: Intelligibility of filtered speech
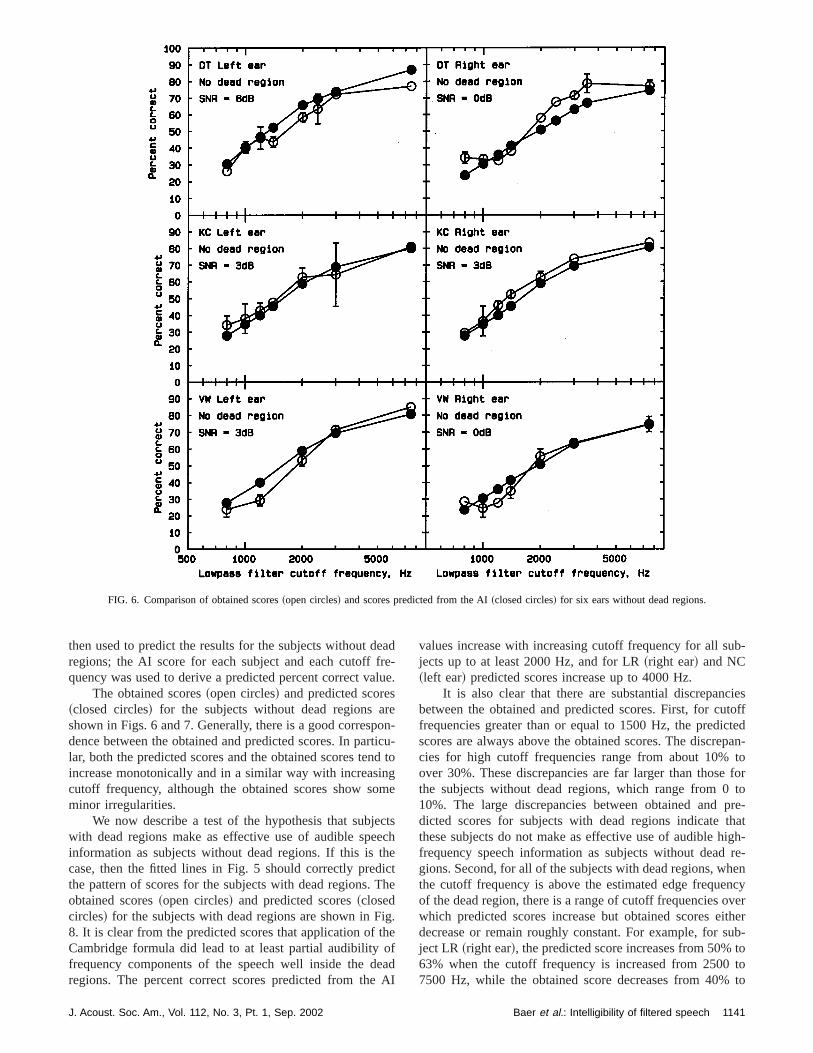
FIG. 6. Comparison of obtained scores~open circles! and scores predicted from the AI~closed circles! for six ears without dead regions.
eafrelu
sreoti
ndingm
ce
thicT
igthofeaA
b-
ciestofftedpan-toforto
pre-thatigh-re-
henncyveritherub-tototo
then used to predict the results for the subjects without dregions; the AI score for each subject and each cutoffquency was used to derive a predicted percent correct va
The obtained scores~open circles! and predicted score~closed circles! for the subjects without dead regions ashown in Figs. 6 and 7. Generally, there is a good correspdence between the obtained and predicted scores. In parlar, both the predicted scores and the obtained scores teincrease monotonically and in a similar way with increascutoff frequency, although the obtained scores show sominor irregularities.
We now describe a test of the hypothesis that subjewith dead regions make as effective use of audible speinformation as subjects without dead regions. If this iscase, then the fitted lines in Fig. 5 should correctly predthe pattern of scores for the subjects with dead regions.obtained scores~open circles! and predicted scores~closedcircles! for the subjects with dead regions are shown in F8. It is clear from the predicted scores that application ofCambridge formula did lead to at least partial audibilityfrequency components of the speech well inside the dregions. The percent correct scores predicted from the
J. Acoust. Soc. Am., Vol. 112, No. 3, Pt. 1, Sep. 2002
d-e.
n-cu-
to
e
tschet
he
.e
dI
values increase with increasing cutoff frequency for all sujects up to at least 2000 Hz, and for LR~right ear! and NC~left ear! predicted scores increase up to 4000 Hz.
It is also clear that there are substantial discrepanbetween the obtained and predicted scores. First, for cufrequencies greater than or equal to 1500 Hz, the predicscores are always above the obtained scores. The discrecies for high cutoff frequencies range from about 10%over 30%. These discrepancies are far larger than thosethe subjects without dead regions, which range from 010%. The large discrepancies between obtained anddicted scores for subjects with dead regions indicatethese subjects do not make as effective use of audible hfrequency speech information as subjects without deadgions. Second, for all of the subjects with dead regions, wthe cutoff frequency is above the estimated edge frequeof the dead region, there is a range of cutoff frequencies owhich predicted scores increase but obtained scores edecrease or remain roughly constant. For example, for sject LR ~right ear!, the predicted score increases from 50%63% when the cutoff frequency is increased from 25007500 Hz, while the obtained score decreases from 40%
1141Baer et al.: Intelligibility of filtered speech
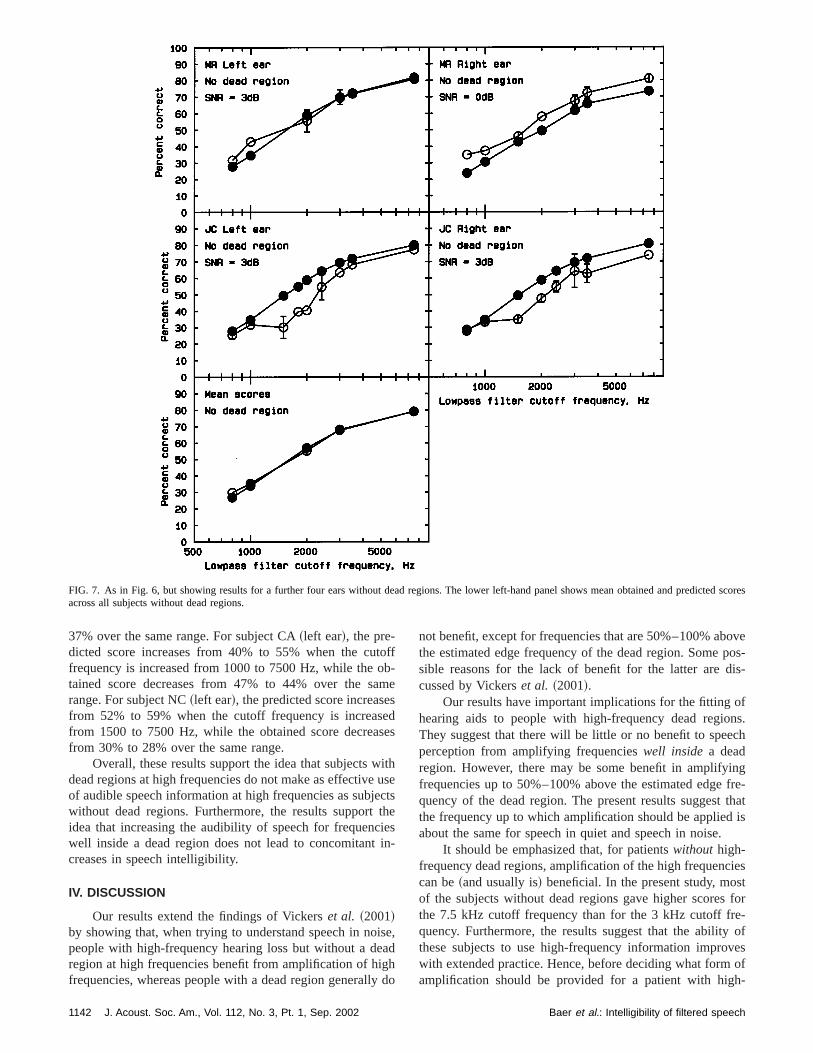
ted score
FIG. 7. As in Fig. 6, but showing results for a further four ears without dead regions. The lower left-hand panel shows mean obtained and predicsacross all subjects without dead regions.toobamses
iu
ecthiein
isa
ghy
ovepos-is-
ofns.ch
ingfre-thatis
iesstfor-of
vesof
h-
37% over the same range. For subject CA~left ear!, the pre-dicted score increases from 40% to 55% when the cufrequency is increased from 1000 to 7500 Hz, while thetained score decreases from 47% to 44% over the srange. For subject NC~left ear!, the predicted score increasefrom 52% to 59% when the cutoff frequency is increasfrom 1500 to 7500 Hz, while the obtained score decreafrom 30% to 28% over the same range.
Overall, these results support the idea that subjects wdead regions at high frequencies do not make as effectiveof audible speech information at high frequencies as subjwithout dead regions. Furthermore, the results supportidea that increasing the audibility of speech for frequencwell inside a dead region does not lead to concomitantcreases in speech intelligibility.
IV. DISCUSSION
Our results extend the findings of Vickerset al. ~2001!by showing that, when trying to understand speech in nopeople with high-frequency hearing loss but without a deregion at high frequencies benefit from amplification of hifrequencies, whereas people with a dead region generall
1142 J. Acoust. Soc. Am., Vol. 112, No. 3, Pt. 1, Sep. 2002
ff-e
des
thsetses-
e,d
do
not benefit, except for frequencies that are 50%–100% abthe estimated edge frequency of the dead region. Somesible reasons for the lack of benefit for the latter are dcussed by Vickerset al. ~2001!.
Our results have important implications for the fittinghearing aids to people with high-frequency dead regioThey suggest that there will be little or no benefit to speeperception from amplifying frequencieswell inside a deadregion. However, there may be some benefit in amplifyfrequencies up to 50%–100% above the estimated edgequency of the dead region. The present results suggestthe frequency up to which amplification should be appliedabout the same for speech in quiet and speech in noise.
It should be emphasized that, for patientswithout high-frequency dead regions, amplification of the high frequenccan be~and usually is! beneficial. In the present study, moof the subjects without dead regions gave higher scoresthe 7.5 kHz cutoff frequency than for the 3 kHz cutoff frequency. Furthermore, the results suggest that the abilitythese subjects to use high-frequency information improwith extended practice. Hence, before deciding what formamplification should be provided for a patient with hig
Baer et al.: Intelligibility of filtered speech

FIG. 8. As in Fig. 6, but for six ears with dead regions.
hes
o
if-nha
ee-vecyf tcynmas-
eadom
ineis
,en
ch
ad
frequency hearing loss, it is important to determine whetthat patient has a high-frequency dead region, and, ifwhat its extent is. The TEN test~Moore et al., 2000! is rec-ommended for this purpose.
V. CONCLUSIONS
For VCV syllables presented in noise, the benefithigh-frequency amplification~according to the ‘‘Cambridge’’formula! for subjects with high-frequency hearing loss dfered according to whether or not there was a dead regiohigh frequencies. The pattern of results was similar to tfound for speech in quiet by Vickerset al. ~2001!. For sub-jects without dead regions, identification scores improvprogressively with increasing low pass filter cutoff frquency. For subjects with dead regions, scores improwith increasing cutoff frequency until the cutoff frequenwas 50%–100% above the estimated edge frequency odead region. With further increases in cutoff frequenscores remained roughly constant. Analyses based omodified version of the articulation index indicated that aplification according to the Cambridge formula was at lepartially successful in restoring the audibility of high
J. Acoust. Soc. Am., Vol. 112, No. 3, Pt. 1, Sep. 2002
ro,
f
att
d
d
he,a
-t
frequency components in the speech for subjects with dregions, and that such subjects often failed to benefit frincreased audibility of the speech at high frequencies.
ACKNOWLEDGMENTS
This work was supported primarily by the MRC~UK!with additional support from Starkey~USA!, DefeatingDeafness~UK!, and the RNID~UK!. We thank Jose´ Alcant-ara, Henry Chubb, Brian Glasberg, Martina Huss, JosephMarriage, and Debi Vickers for their contributions to thwork. We also thank Chris Turner for helpful comments.
Amos, N. E., and Humes, L. E.~2001!. ‘‘The contribution of high frequen-cies to speech recognition in sensorineural hearing loss,’’ inPhysiologicaland Psychophysical Bases of Auditory Function, edited by D. J. BreebaartA. J. M. Houtsma, A. Kohlrausch, V. F. Prijs, and R. Schoonhov~Shaker, Maastricht!.
ANSI ~1997!. ANSI S3.5-1997, ‘‘Methods for the Calculation of the SpeeIntelligibility Index’’ ~American National Standards Institute, New York!.
Baer, T., Moore, B. C. J., and Kluk, K.~2002!. ‘‘Effects of low pass filteringon the intelligibility of speech in noise for listeners with and without deregions at high frequencies,’’ Int. J. Audiol.~in press!.
Burkhard, M. D., and Sachs, R. M.~1975!. ‘‘Anthropometric manikin foracoustic research,’’ J. Acoust. Soc. Am.58, 214–222.
1143Baer et al.: Intelligibility of filtered speech

-h-
li-o
and
r’’ J
l
ng
J.
m-
ding
st.
ral
-
st.
Ching, T., Dillon, H., and Byrne, D.~1998!. ‘‘Speech recognition of hearingimpaired listeners: Predictions from audibility and the limited role of higfrequency amplification,’’ J. Acoust. Soc. Am.103, 1128–1140.
Gatehouse, S.~1992!. ‘‘The time course and magnitude of perceptual accmatization to frequency responses: Evidence from monaural fittinghearing aids,’’ J. Acoust. Soc. Am.92, 1258–1268.
Glasberg, B. R., and Moore, B. C. J.~1990!. ‘‘Derivation of auditory filtershapes from notched-noise data,’’ Hear. Res.47, 103–138.
Hogan, C. A., and Turner, C. W.~1998!. ‘‘High-frequency audibility: Ben-efits for hearing-impaired listeners,’’ J. Acoust. Soc. Am.104, 432–441.
Miller, G. A., and Nicely, P. E.~1955!. ‘‘An analysis of perceptual confu-sions among some English consonants,’’ J. Acoust. Soc. Am.27, 338–352.
Moore, B. C. J.~1998!. Cochlear Hearing Loss~Whurr, London!.Moore, B. C. J.~2001!. ‘‘Dead regions in the cochlea: Diagnosis, perceptu
consequences, and implications for the fitting of hearing aids,’’ TreAmplif. 5, 1–34.
Moore, B. C. J.~2002!. ‘‘Response to ‘Articulation index predictions fohearing-impaired listeners with and without cochlear dead regions,’Acoust. Soc. Am.~in press!.
Moore, B. C. J., and Alca´ntara, J. I.~2001!. ‘‘The use of psychophysicatuning curves to explore dead regions in the cochlea,’’ Ear Hear.22, 268–278.
Moore, B. C. J., and Glasberg, B. R.~1997!. ‘‘A model of loudness percep-tion applied to cochlear hearing loss,’’ Aud. Neurosci.3, 289–311.
Moore, B. C. J., and Glasberg, B. R.~1998!. ‘‘Use of a loudness model forhearing aid fitting. I. Linear hearing aids,’’ Br. J. Audiol.32, 317–335.
Moore, B. C. J., Glasberg, B. R., and Baer, T.~1997!. ‘‘A model for theprediction of thresholds, loudness and partial loudness,’’ J. Audio ESoc.45, 224–240.
1144 J. Acoust. Soc. Am., Vol. 112, No. 3, Pt. 1, Sep. 2002
f
ls
.
.
Moore, B. C. J., Huss, M., Vickers, D. A., Glasberg, B. R., and Alca´ntara, J.I. ~2000!. ‘‘A test for the diagnosis of dead regions in the cochlea,’’ Br.Audiol. 34, 205–224.
Moore, B. C. J., Laurence, R. F., and Wright, D.~1985!. ‘‘Improvements inspeech intelligibility in quiet and in noise produced by two-channel copression hearing aids,’’ Br. J. Audiol.19, 175–187.
Murray, N., and Byrne, D.~1986!. ‘‘Performance of hearing-impaired annormal hearing listeners with various high-frequency cut-offs in hearaids,’’ Aust. J. Audiol.8, 21–28.
Patterson, R. D., and Moore, B. C. J.~1986!. ‘‘Auditory filters and excitationpatterns as representations of frequency resolution,’’ inFrequency Selec-tivity in Hearing, edited by B. C. J. Moore~Academic, London!.
Rankovic, C. M. ~2002!. ‘‘Articulation index predictions for hearing-impaired listeners with and without cochlear dead regions,’’ J. AcouSoc. Am.~in press!.
Skinner, M. W., and Miller, J. D.~1983!. ‘‘Amplification bandwidth andintelligibility of speech in quiet and noise for listeners with sensorineuhearing loss,’’ Audiology22, 253–279.
Turner, C. W., and Cummings, K. J.~1999!. ‘‘Speech audibility for listenerswith high-frequency hearing loss,’’ Am J. Audiol.8, 47–56.
Vickers, D. A., Moore, B. C. J., and Baer, T.~2001!. ‘‘Effects of lowpassfiltering on the intelligibility of speech in quiet for people with and without dead regions at high frequencies,’’ J. Acoust. Soc. Am.110, 1164–1175.
Villchur, E. ~1973!. ‘‘Signal processing to improve speech intelligibility inperceptive deafness,’’ J. Acoust. Soc. Am.53, 1646–1657.
Zwicker, E., and Terhardt, E.~1980!. ‘‘Analytical expressions for criticalband rate and critical bandwidth as a function of frequency,’’ J. AcouSoc. Am.68, 1523–1525.
Baer et al.: Intelligibility of filtered speech