Recently Discovered Adipokines and Cardio-Metabolic Comorbidities in Childhood Obesity
Upload
khangminh22Category
view
0download
0
Copyright
by
Heath Marcus Burton
2019

The Dissertation Committee for Heath Marcus Burton Certifies that this is the
approved version of the following dissertation:
Effects of Inactivity on Cardio-Metabolic Responses to
Exercise
Committee:
Edward F. Coyle, Supervisor
Audrey J. Stone
Harold W. Kohl, III
Molly S. Bray

Effects of Inactivity on Cardio-Metabolic Responses to
Exercise
by
Heath Marcus Burton
Dissertation
Presented to the Faculty of the Graduate School of
The University of Texas at Austin
in Partial Fulfillment
of the Requirements
for the Degree of
Doctor of Philosophy
The University of Texas at Austin
December 2019
Dedication
To my wife, Cassady. For your unending love and support without which none of this
would be possible.

v
Acknowledgements
I would first thank my advisor and mentor, Dr. Edward F. Coyle, for his guidance
and support throughout my years at The University of Texas at Austin, culminating in this
dissertation. I will always be grateful for the experience gained under your leadership. Your
willingness to challenge me with new opportunities and responsibilities has fostered an
environment where I have been able to grow as an exercise scientist and a person. It has
been an honor to work closely and learn from you each day over the past 5 years.
A special thanks to each member of the Human Performance Laboratory during my
time here. To Brian Leary, Anthony Wolfe, Emre Vardarli, Ting Chou, John Akins, Kiki
Crawford, Remzi Satiroglu, Ryan Bjellquist-Ledger, Jakob Allen, Mike Dial, Rebecca
Braden, Dongwoo Hanh, Luke Montzingo, and Mike Brenneman, each one of you has
played an instrumental role, in your own way, in the fulfillment of this work. It has been
an honor and a privilege to work alongside some of the best scientist and people I have
ever had the pleasure of working with.
To my parents, Michael and Stacy, and my brothers, Hunter and Peyton, thank you
for your love and encouragement throughout my graduate studies. Even from sixteen hours
away, your words of affirmation and belief in me had a profound impact on my ability to
reach this day. Thank you to all my friends and family for your unwaivering love, support,
and encouragement: Jimmy and Karen Kendrick, William and Hannah Kendrick, Lindsey
Burton, Toriano and Natalie Mayo, and Keith and Nancy Phillips.

vi
Abstract
Effects of Inactivity on Cardio-Metabolic Responses to
Exercise
Heath Marcus Burton, Ph.D.
The University of Texas at Austin, 2019
Supervisor: Edward F. Coyle
Physical inactivity has been known to cause deleterious health effects. New
evidence suggests current physical activity recommendations may not be enough to reduce
the risk of developing cardiovascular disease and mortality for those experiencing high
levels of physical inactivity (e.g.; prolonged sitting). The purpose of study one was to
determine if daily physical inactivity in a group taking low steps (i.e.; 4,767377 steps/day,
LS) impairs postprandial lipemia (PPL), fat oxidation, and submaximal exercise responses
to short term training, compared to a group taking high steps (16,048725 steps/day; HS).
After an initial high fat tolerance test (HFTT) to establish baseline responses to a high fat
meal, participants (n=16) completed an 11-day training program with assigned step counts
and five exercise training bouts consisting of 20 minutes of cycling at 80% VO2peak and
two 5-minute intervals at 90% VO2peak. The day following the first and final bouts of
exercise training, participants completed a second and third HFTT, respectively, to assess
acute responses of PPL to the training. Within HS, a 31% reduction (p<0.05) was observed

vii
in plasma triglyceride incremental area under the curve (AUCI) after acute, as well as a
27% reduction (p<0.05) following chronic training. Further in HS, but not LS, there were
significant (p<0.05) reductions in markers of stress during submaximal exercise, such as
blood lactate and heart rate, after training. These findings suggest step reductions can lead
to an impaired ability to adapt to short term exercise training. The purpose of study two
was to determine the effect of reducing step count over two days on the ability of a 1-h
bout of exercise to reduce PPL. Participants (n= 10) completed three trials: Low
(2,675314 steps/day), Limited (4,759276 steps/day) and Normal Activity (8,481581
steps/day) for two days followed by a 1-h bout of treadmill running at 64% VO2max with
a HFTT the following morning. PPL responses following 2,675 and 4,759 step/day trials
did not differ. However, following exercise in a condition of 8,481 steps/day, AUCI was
reduced 22% and 23% (p<0.05) compared to the 2,675 and 4,759 step/day trials,
respectively. This suggests that a 1-h bout of running has a decreased ability to lower PPL
the next day when taking 4,759 steps/day or less. Taken together these studies highlight
the importance of maintaining a healthy level of daily non-exercise physical activity,
regardless of participation in exercise. From these studies it is recommended that
individuals maintain a daily step count of at least 8,500 steps in additional to any planned
exercise in order to achieve improvements in PPL as a result of acute or chronic exercise.

viii
Table of Contents
List of Tables ...........................................................................................................x
List of Figures ...................................................................................................... xiii
Chapter I: General Introduction ..............................................................................1
Chapter II: Purpose and Hypothesis .......................................................................4
Chapter III: Study #1 ..............................................................................................6
The Effect of Prolonged Sitting on Cardio-Metabolic Responses to Short Term
Exercise Training ...................................................................................6
Abstract .........................................................................................6
Introduction ...................................................................................8
Methods.......................................................................................10
Results .........................................................................................17
Discussion ...................................................................................21
Tables and Figures ......................................................................28
Chapter IV: Study #2 ............................................................................................37
Dose Response of Physical Inactivity on Plasma Triglycerides After a Meal37
Abstract .......................................................................................37
Introduction .................................................................................39
Methods.......................................................................................42
Results .........................................................................................47
Discussion ...................................................................................50
Tables and Figures ......................................................................56
Chapter VI: General Summary .............................................................................66
Chapter VII: Review of Literature ........................................................................69
Introduction .................................................................................69
Postprandial Metabolism and Health ..........................................71
Prevalence of Inactivity in Modern Culture................................74
Deleterious Effects of Inactivity .................................................77

ix
Exercise and Postprandial Metabolism .......................................79
Alterations in Ambulatory Activity ............................................85
Exercise Resistance .....................................................................88
Possible Mechanisms Inducing Exercise Resistance ..................93
Future Work ................................................................................95
Appendices .............................................................................................................98
Appendix A: Methodological Techniques ....................................................98
Appendix B: Research Consent Forms .......................................................103
Appendix C: Health History Questionnaire ................................................115
Appendix D: Additional Tables for Study 1 ...............................................121
Appendix E: Additional Tables & Figures for Study 2 ..............................126
Appendix F: Bihourly RER measurements.................................................128
Appendix G: Study 1 Individual Data Tables ............................................131
Biographical and VO2peak Data .................................................131
Submaximal Exercise Data .......................................................132
Daily Steps ................................................................................133
Plasma Triglyceride Concentrations .........................................134
Plasma Glucose Concentrations ................................................136
RER Data ..................................................................................138
Postprandial Fat Oxidation .......................................................140
Appendix H: Study 2 Individual Data Tables ............................................141
Biographical & Exercise Data ..................................................141
Daily Steps ................................................................................142
Plasma Triglyceride Concentrations .........................................143
Plasma Glucose Concentrations ................................................144
RER Data ..................................................................................145
Postprandial Fat Oxidation .......................................................146

x
List of Tables
Table 1. Descriptive Statistics of the two groups (i.e. High Step and Low Step) at the
beginning of the study. All Data are reported as Mean SE............34
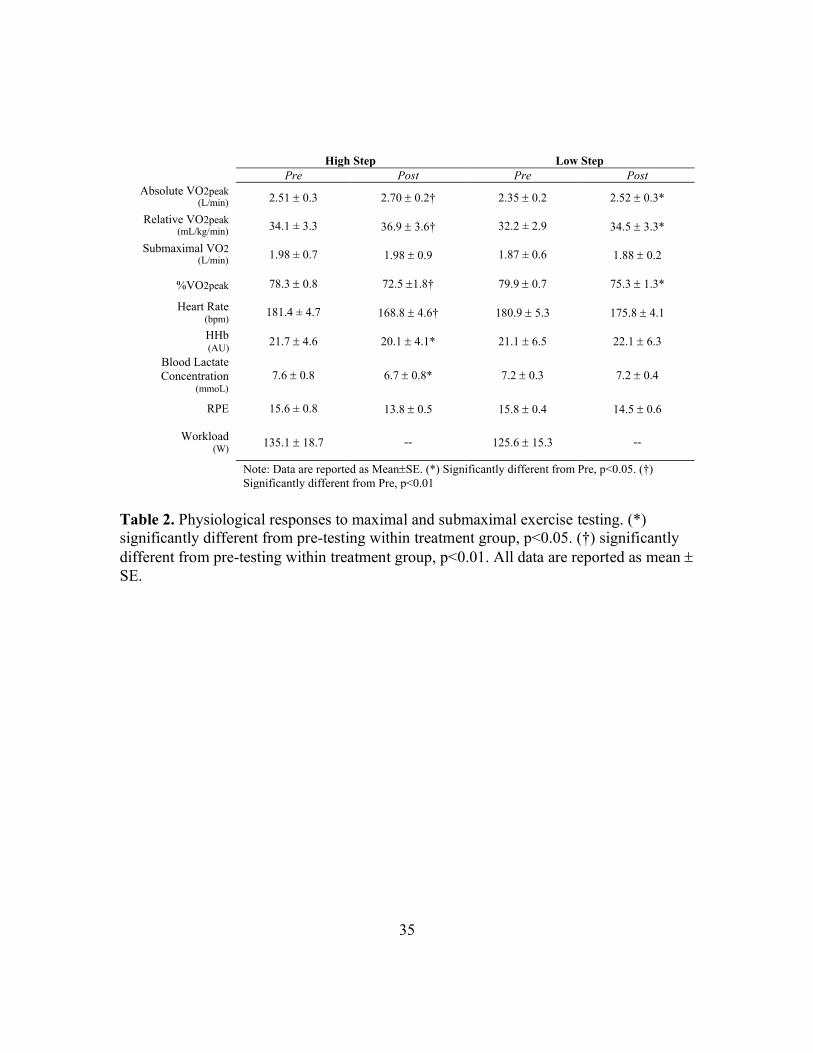
Table 2. Physiological responses to maximal and submaximal exercise testing. (*)
significantly different from pre-testing within treatment group, p<0.05.
(†) significantly different from pre-testing within treatment group,
p<0.01. All Data are reported as Mean SE. ...................................35
Table 3. Overall postprandial substrate oxidation during HFTTs at Baseline,
following a single bout of exercise (Acute), and following 5 training
bouts over the 9-days of training (Post Training). (*) Significantly
different from Baseline, (p<0.05). Data reported MeanSE. ...........36
Table 4. Descriptive Statistics for participants at the beginning of the study. All Data
are reported as Mean SE. ...............................................................61
Table 5. Responses to maximal exercise and the 1-h bout of submaximal exercise.
All data are reported as Mean SE. .................................................62
Table 6. Average daily steps were measured via activPal activity monitor, attached
on the participant’s anterior thigh throughout each trial. Average daily
step counts for each trial are presented for Control (C1 & C2) and
Intervention Phases (D1 & D2). (*) significantly different from Low,
p<0.05. (**) significantly different from Low, p<0.01. (†) significantly
different from Low & Limited step trial, p<0.05. .............................63

xi
Table 7. Hourly responses (e.g.; H2, H3, etc.) of plasma triglyceride and plasma
glucose concentrations during HFTT for each trial. (*) Significantly
different from Low, p<0.05. (†) Significantly different from Limited,
p<0.05. Data reported MeanSE. .....................................................64
Table 8. Overall postprandial substrate oxidation during HFTT for each trial. (*)
significantly different from Low & Limited, p<0.05. Data reported
MeanSE...........................................................................................65
Table 9. Summary of findings (*) signifies impaired metabolism ........................68
Table 10. Average Daily Steps for both treatment groups during 11-day intervention
(D4- D14). Average daily steps were significantly different between
groups for each day measured (p<0.001).(*) significantly different from
D12 and D14 within treatment group (p<0.05). Data are presented as
MSE. .............................................................................................121
Table 11. Total and incremental areas under the curve of plasma triglyceride
concentrations during HFTTs at Baseline, following a single bout of
exercise (Acute), and following 5 training bouts over the 9-days of
training (Post Training). (*) Significantly different from Baseline,
p<0.05. (†) significantly different from Baseline, p<0.01. All Data are
reported as Mean SE. ...................................................................122
Table 12. Total and incremental areas under the curve of plasma glucose
concentrations during HFTTs at Baseline, following a single bout of
exercise (Acute), and following 5 training bouts over the 9-days of
training (Post Training). All Data are reported as Mean SE........123

xii
Table 13. Temporal Responses of plasma triglyceride concentration for High Step
treatment during HFTT at Baseline, following a single bout of exercise
(Acute), and following 5 training bouts over the 9-days of training (Post
Training). (*) significantly different from Baseline, p< 0.05. (†)
significantly different from Baseline, p< 0.01. Data reported MeanSE.
.........................................................................................................124
Table 14. Temporal Responses of plasma triglyceride concentration for Low Step
treatment during High Fat Tolerance Test at Baseline, following a single
bout of exercise (Acute), and following 5 training bouts over the 9-days
of training (Post Training). Data reported MeanSE. .....................125
Table 15. Total and Incremental areas under the curve of plasma triglyceride &
glucose concentrations during HFTT for each trial. (*) Significantly
different from Low & Limited step group, p<0.05. (†) Significantly
different from Low step group, p<0.01 Data reported MeanSE. ..127
Table 16. Average postprandial substrate oxidation at each measurement for HS
Treatment group. (*) Significantly different from Baseline, (p<0.05). All
Data are reported as Mean SE. ....................................................128
Table 17. Average postprandial substrate oxidation at each measurement for LS
Treatment group. All Data are reported as Mean SE. ..................129
Table 18. Average postprandial substrate oxidation at each measurement for each
trial. (*) significantly different from both Low & Limited, p<0.05. All
Data are reported as Mean SE. ....................................................130

xiii
List of Figures
Figure 1. Study Design. Participants were separated into two groups (High Step or
Low Step) and completed a short-term exercise regime with
physiological and metabolic testing pre and post training. Subjects took
their assigned step number on days 4-14. .........................................28
Figure 2. Daily steps were measured via activPal activity monitor, attached on the
participant’s anterior thigh throughout each trial. Average daily step
count, for each group are presented for the 11-day intervention period
(D4-D14). Average daily steps were significantly different between
groups for every day measured (p<0.001). (*) significantly different
from D12 and D14 within treatment group (p<0.05). .......................29
Figure 3. Total and Incremental areas under the curve of plasma triglyceride
concentration during HFTT at Baseline, following a single bout of
exercise (Acute), and following 5 training bouts over the 9-days of
training (Post Training). (*) Significantly different from Baseline within
treatment group, p<0.05. (†) significantly different from Baseline within
treatment group, p<0.01. Data reported MeanSE. ..........................30
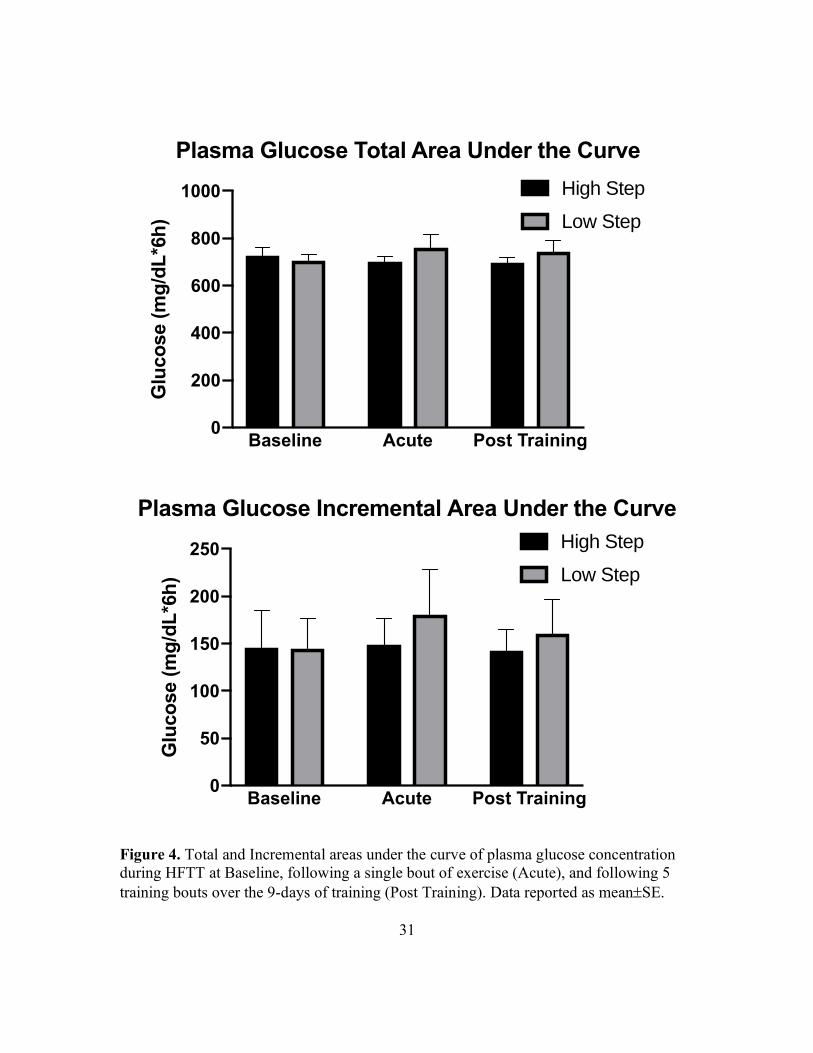
Figure 4. Total and Incremental areas under the curve of plasma glucose
concentration during HFTT at Baseline, following a single bout of
exercise (Acute), and following 5 training bouts over the 9-days of
training (Post Training). Data reported MeanSE. ...........................31

xiv
Figure 5. Temporal Responses of plasma triglyceride & plasma glucose
concentrations for High Step treatment during the HFTT at Baseline,
following a single bout of exercise (Acute), and following 5 training
bouts over the 9-days of training (Post Training). (*) Acute significantly
different from Baseline, p< 0.05. (†) Acute & Post Training significantly
different from Baseline, p< 0.01. (#) Post Training significantly different
from Baseline, p<0.05. Data reported MeanSE. .............................32
Figure 6. Temporal Responses of plasma triglyceride & glucose concentrations for
Low Step treatment during HFTT at Baseline, following a single bout of
exercise (Acute), and following 5 training bouts over the 9-days of
intervention (Post Training). Data reported MeanSE. ....................33
Figure 7. Study Design. Participants completed a five-day randomized, crossover
experimental design with differing levels of daily step reduction (i.e.
Low- 2,675, Limited- 4,759, & Normal Activity-8,480 Steps/Day).
Participants completed two control days with activity monitoring before
the initiation the two-day step reduction (D1 & D2). Participants also
completed an hour of treadmill running on the night of D2 followed by
HFTT on the morning of D3. ............................................................56
Figure 8. Total and Incremental areas under the curve of plasma triglyceride
concentrations during HFTT for each trial. (*) significantly different
from Low & Limited step group, p<0.05. (†) significantly different from
Low step group, p<0.01. Data reported as MeanSE. ......................57
Figure 9. Total and Incremental areas under the curve of plasma glucose
concentrations during HFTT for each trial. Data reported as MeanSE.
...........................................................................................................58

xv
Figure 10. Temporal Responses of plasma triglyceride concentrations for each trial
during HFTT. (*) Normal significantly different from Low, p<0.05. (†)
Normal significantly different from Limited, p<0.05. (#) Normal
significantly different from Low, p<0.01. Data reported as MeanSE.
...........................................................................................................59
Figure 11. Temporal Responses of plasma glucose concentrations for each trial
during HFTT. Data reported as MeanSE. .......................................60
Figure 12. Diagram of OxiplexTS probe for measuring deoxygenated hemoglobin in
skeletal muscle during submaximal exercise ....................................99
Figure 13. Average daily steps were measured via activPal activity monitor, attached
on the participant’s anterior thigh throughout each trial. Average daily
step counts for each trial are presented for Control (C1 & C2) and
Intervention Phases (D1 & D2). (*) significantly different from Low,
p<0.05. (**) significantly different from Low, p<0.01. (†) significantly
different from Low & Limited step trial, p<0.05. ...........................126

1
Chapter I: General Introduction
The consequences of physical inactivity have been recognized for four millennia or
more (19, 20, 112) and the evidence for health benefits of physical activity have been
clearly documented (68, 203, 208). Nevertheless, physical inactivity continues to be a
growing problem for the health and wellness of large swaths of the population worldwide
(105). Physical activity has been almost systematically engineered out of the daily lives of
many, with advancements in automation and mechanical transport, drastically increasing
the amounts sedentary time and inactivity overall (9, 26). The prevalence and effects of
physical inactivity on health result in an impact on the population that, while not given the
same attention, is at least as deleterious as that of smoking and obesity (112). However
drastic the consequence, there seems to be no abatement of this trend in sight (65).
From the work of Morris (133) through present day investigations physical
inactivity has been directly linked to at least 35 chronic diseases directly linked to physical
inactivity (20). Of note in the diseases linked to physical inactivity is atherosclerotic
cardiovascular disease, which remains the leading cause of both death and disability
worldwide (6, 78). In 1979, Zilversmit et al. (223) characterized atherosclerosis as a
postprandial phenomenon. The postprandial or non-fasting state predominates the waking
hours of individuals in most developed countries, whose population rarely go more than 6-
8 hours without eating a meal. A rise in physical inactivity in these countries leads to
scenario in which these two regularly coincide and may further amplify the elevation of
plasma triglycerides which typically peaks 3-5 hours after a meal. If these plasma

2
triglycerides remain abnormally elevated the result is the deposition of fatty plaques in the
arterial walls which characterizes atherosclerosis (223).
Current recommendations advise combatting the development of cardiovascular
diseases, like atherosclerosis, with 30 minutes of moderate-to-vigorous physical activity a
day or 150 minutes per week (149, 157, 208). Indeed, available evidence clearly documents
the ability of a single bout of exercise to attenuate the exaggerated rise is plasma
triglycerides following a meal, or postprandial lipemia (PPL), in individuals who are
physically active and who normolipidimic (52, 77, 83, 120) and hyperlipidemic (124, 221)
and across a range of training status (54, 66, 77). Although these well-established (49) and
newly formed recommendations (39) for exercise are firmly grounded in data driven
conclusions, it seems some individuals who achieve levels of activity commensurate with
these recommendations are not incurring the protective effects of said activity (1, 16, 98,
150, 198, 218). In several recent studies, inactivity has been shown to prevent individuals
from realizing classic improvements in postprandial triglyceride (1, 98) and glucose (38)
metabolism following a bout of exercise. Similar impairments have also been shown to
occur in protein synthesis following prolonged inactivity (22).
This alarming phenomenon, which has been termed ‘exercise resistance’(98), has
just begun to be examined and warrants much more investigation. These studies indicate
that efficacy of exercise, per se, may be diminished or even abolished if it does not coincide
with a healthy lifestyle characterized by daily physical activity. Therefore, it is important
to carefully control levels of daily physical activity when examining the protective effect
of exercise on PPL. While previous investigations have evaluated the response to a single

3
bout of exercise, there are no studies that have investigated the effect of more regular
exercise bouts over a few weeks, in conjunction with a physically inactive lifestyle.
Further, the current literature does not clearly delineate at what levels of physical inactivity
this phenomenon becomes significant. In these studies, we examined 1) the effect of an
accumulated training stimulus (i.e. 5 training bouts) on PPL and other classic responses to
exercise and 2) the PPL response to exercise across three levels physical inactivity.

4
Chapter II: Purpose and Hypothesis
STUDY #1: Study 1 focused on the adaptations to 5 bouts of exercise training at high
intensities in two separate groups with a low and a high level of physical activity. The
purpose of study 1 was to determine if the background level of daily physical inactivity
(e.g.; ~4,767 steps/day) impairs postprandial lipemia (PPL) compared to an active control
condition (e.g.; 16,048 steps/day) and to determine if the background level of daily
physical activity impairs other cardiovascular and metabolic adaptations to short term
training compared to an active control condition. We hypothesized that a low daily step
count treatment would lead to a lower responsiveness to the exercise training compared
with a high step count group. The measurements made include the area under the curve
for plasma triglyceride (PPL) and fat oxidation in response to a high fat meal, as well as
post-intervention measures of peak oxygen consumption (VO2peak) and submaximal
heart rate, blood lactate concentration and muscle deoxygenation.
STUDY #2: Study 2 focused on the effect of inactivity, measured by daily step count for
2 days on the ability of acute 1-h bout of moderate intensity exercise to reduce the
postprandial plasma triglyceride and plasma glucose responses to a meal high in fat and
glucose. The purpose of study 2 was to determine the effect of altering daily step counts
for two days (i.e.; 2,675, 4,759, and 8,481 steps/day) on the ability of a 1-h bout of
moderate-intensity exercise to reduce PPL. We hypothesized that increasing daily step
counts would lead to greater reductions in area under the curve for plasma triglyceride in

5
response to a high fat meal as well increases in fat oxidation, in response to acute
exercise. This pattern might allow recommendations about the number of steps per day
needed to achieve a healthy PPL and fat oxidation responses following a high fat meal.

6
Chapter III: Study #1
THE EFFECT OF PROLONGED SITTING ON CARDIO-METABOLIC RESPONSES TO SHORT
TERM EXERCISE TRAINING
Abstract
Background: The effects of exercise and physical inactivity on development of
cardiovascular disease have been evaluated individually in numerous investigations. Yet
in reality the two interact but the concurrent effects have yet to be fully described.
Therefore, the objective of the current study was to investigate in young adults, whether an
inactive group (<5,000 steps/day) responds similarly to short-term aerobic exercise training
compared to a highly active group (>15,000 steps/day)
Methods: Sixteen initially sedentary participants completed an intense short-term training
protocol while taking 4,767377 steps/day (n=8) or 16,048725 steps/day (n=8).
Participants completed five bouts of training at ~79% VO2peak. Following acute exercise
and short-term training, metabolic responses to a high fat meal (i.e. plasma triglyceride and
glucose excursions and areas under the curve and fat oxidation) were assessed during a 6-
hour high fat tolerance test (HFTT) on the morning after exercise and compared to a non-
exercise baseline HFTT completed before the initiation of the training. Additionally,
submaximal exercise responses were recorded during 15-minute cycling test (~79%
VO2peak), including: heart rate, blood lactate, and deoxygenated hemoglobin were
compared within and between groups, before and after training.
Results: Maintaining 16,048 steps/day while completing short-term exercise training
resulted in reduced incremental area under the curve (AUCI) for plasma triglyceride
concentrations by 31% after acute exercise and by 27% after chronic training, compared to
baseline (p<0.05). This was accompanied by increased whole-body fat oxidation (p<0.05).
Further, muscle stress during submaximal exercise, as marked by heart rate, blood lactate

7
and deoxygenated hemoglobin, was also reduced (p<0.05). Despite completing the same
training regimen, participants taking <5,000 steps/day showed no significant
improvements in postprandial responses or markers of stress during submaximal exercise
after training (p>0.05). However, the two groups showed a similar increase in VO2peak.
Conclusion: In conclusion, when completing a 5-bout exercise training program at
vigorous intensity, decreasing daily steps to approximately 5,000 steps/day appears to
prevent or significantly blunt some of the classic cardio-metabolic adaptations that occur
with 16,000 steps/day. Based on these findings, it appears that the effects of inactivity cause
a blunting of the normal adaptations to exercise including both cardio-metabolic measures
as well as exercise stress measures such as heart rate, blood lactate concentrations, and
deoxygenation of hemoglobin in the active muscle, but not VO2peak.

8
Introduction
The modernization of society has led to vast technological advancements that have
changed life throughout the world. These advances have intended to improve the quality
of life for many individuals, and to a degree, increased automation has done so. However,
the resultant increased physical sedentary time in modernized cultures has been
accompanied with serious problems. Public health professionals assert that individuals in
modern society have become a victim of their own success, in which physical activity have
been systematically “engineered out” of daily life, and further argue that this has
compromised the health of many (100).
Couple this with improvements in agriculture and sustainability and people are
spending more time being inactive in a fed state. Ingestion of fatty foods causes a
concomitant rise in chylomicron triglyceride concentration in the blood as lipids from
digestion begin to enter the blood and are subsequently cleared into other tissues over the
course of up to 8-12 h (32, 56, 86). The rise in chylomicron triglyceride in the blood after
a meal high in fat produces postprandial lipemia (PPL). The high concentration of
triglycerides in the plasma leads to subsequent breakdown into more atherosclerotic
byproducts, resulting in the possible formation of atherosclerotic plaques in arteries (135).
Along with the rise in sedentary behavior has come an increase in the mortality rate as
caused by cardiovascular disease (137). As early as 1979, atherosclerosis was described as
a “postprandial phenomenon” (223). Exaggerated rises plasma triglyceride concentration

9
after a meal (32, 56, 86) caused by a variety of factors including extended periods of
inactivity (3, 33, 51, 135) may be driving the pathogenesis of atherosclerosis.
Exercise has been a well-documented method to attenuate the rise in PPL (76, 83,
120, 168, 222) and prevent a detriment to cardiovascular function (27, 50, 61, 95, 160,
200). However, recent epidemiological evidence suggest that exercise training may not
be adequate to reduce incidences of disease and other morbidities, and even death in
people who spend a large amount of time sitting (70). Despite well-established (49) and
newly formed recommendations (39), exercise performed concomitant with these
recommendations may not be enough to overcome the detrimental effects of sedentary
time.
New evidence has emerged suggesting prolonged inactivity and sedentary time
may impede or eliminate the positive effects classically associated with exercise (38, 98).
In an investigation by Kim et al (98) a group of individuals who sat for >14 h/day for 4
days did not show the “classic” attenuation PPL that has been shown previously with 60
minutes of aerobic exercise on the fifth day (99, 183). These authors termed this
phenomenon “exercise resistance” because it seems exercise was unable to acutely
improve cardio-metabolic indicators of health (e.g.; PPL and relative fat oxidation). In
order to counteract this “exercise resistance” due to prolonged sitting higher levels of
physical activity throughout the day may be needed. In fact, some studies are now
pointing to the idea that breaking up sedentary time, independent of total moderate to
vigorous physical activity, may be able to attenuate PPL (38, 69, 153) and restore or
maintain endothelial function (127, 132, 176). It is also important to systematically

10
evaluate if this “exercise resistance” extends to other typical training adaptations besides
improved lipid tolerance.
Most of these studies have evaluated the effect of inactivity time on responses to
acute (e.g.; one bout) of exercise. Yet, to test a true “exercise resistance” phenomenon it
would be vital to assess training adaptations incurred over the periods of training than
longer than simply an acute exercise bout. Thus, it is imperative to determine if short-term
training adaptations (i.e.; after 5 bouts of exercise training over 9 days) are blunted in
participants who are also relatively inactive outside of training (i.e.; <5,000 daily steps).
The purpose of this study is to determine if cardiovascular and metabolic responses
to exercise are improved in individuals who participate in intense exercise training, yet
reduce daily steps below 5,000, over the course of 5 training bouts over 9 days compared
to a group following the same training protocol but are physically active (i.e.; >15,000
daily steps). We proposed examining the differences in physiological (as assessed via heart
rate, blood lactate, and NIRS) and metabolic (as assessed by postprandial triglyceride and
glucose responses) adaptations to short-term training between Low Step (LS) and High
Step (HS) treatments. We hypothesized LS would exhibit differences in both physiological
and metabolic adaptations to short-term training compared to HS.
Methods
Sixteen healthy, initially sedentary and untrained male (n= 8) and female (n=8)
participants were recruited and randomly assigned to two groups. Both groups completed
a training regimen administered under supervision of the investigators. Outside of said
exercise regimen, one group was physically active (n=8), taking 16,048 steps/day, and the

11
other group was sedentary (n=8), taking 4,767 steps/day. Both groups were asked to refrain
from any planned exercise outside of the experimental design. Participants were given
written and verbal description of all the procedures and measurements used in this study,
and written informed consent was obtained. The Institutional Review Board of the
University of Texas at Austin approved this study (ClinicalTrials.gov Identifier:
NCT03352063).
Experimental Design
The experimental design consisted 17 days with three distinct phases (see Figure
1). Days 1-3 (Pre-training) consisted of baseline or pre-training measures. Days 4-14
(Training) consisted of alternating days of training and rest days. The final three days, 15-
17, (Post-Training) consisted of repeating measurements taken in pre-testing phase.
Following informed consent and completion of a health history questionnaire, On
the first day participants visited the Human Performance Laboratory (HPL) for initial or
baseline high fat tolerance test (HFTT). One the second day determination of peak
oxygen uptake while cycling (VO2peak). The following day, D3, participants completed a
15-minute submaximal cycling test at 79% of VO2peak value. While the maximal and
submaximal tests were being conducted, participants wore the activity monitor for
familiarization purposes. This activity monitor (activPAL, PAL Technologies, Glasgow,
Scotland)) is small and noninvasive in nature, measuring roughly 2 in x 1in x 0.1in in size
and worn anteriorly on the thigh. The monitor was placed in a small rubber sheath and

12
attached via transparent film dressing. The activity monitor is not waterproof and cannot
be worn while showering. Participants were thus instructed to remove the device prior to
showering and were provided with the materials to change the dressing immediately after
showering once the area is dry. Therefore, aside from showering, the activity monitor was
worn continuously throughout the training phase (D4 - D14). After testing on D3,
participants were asked to refrain from any planned exercise and to begin adhering to the
prescribed daily step count.
After the first bout of exercise training on the evening of day 6, another HFTT
was performed on day 7 to evaluate responses an acute bout of exercise. Participants
continued the training regimen, exercising and resting on alternating days such that there
were five exercise sessions and four rest days in this training phase. All exercise bouts
were identical and consisted of a 20-minute cycling bout at 79% of the participant’s pre-
training VO2peak followed by 10 minutes of rest. Participants then completed two 5-
minute bouts at ~90% VO2peak with 5-minute rest intervals between each bout. This
exercise prescription is in line with, or exceeds, the current physical activity guidelines
published by the American Heart Association (AHA) and American College of Sports
Medicine (ACSM) for improvements in cardiovascular fitness (49).
In the post-training phase, participants completed a HFTT following the final bout
of exercise on the evening on D14. On the D15, participants completed another
submaximal test at the same duration and absolute work rate as the submaximal test

13
during the pre-testing phase (15-minute submaximal cycling test at 80% of VO2peak). On
the final day participants completed a post-training VO2peak test.
Dietary Control
During the course of the study participants were asked to eat to satiety, following
a diet standard in macronutrient breakdown (126). Also, participants logged all food
using the MyFitnessPal mobile application (MyFitnessPal, Inc.). Participants were asked
to consume the same foods on the day prior to each HFTT. On the evening prior to the
HFTT participants were given a low-fat meal to consume as fat in the previous meal can
affect the response to a high-fat test meal (42, 184).
High Fat Tolerance Test (HFTT)
On the morning of the HFTT, participants arrived at the HPL following a 12-hour
fast and having consumed 500 ml of water 1 hour prior to arrival. Prior to the HFTT,
participants have body mass was measured. After resting for 5-minutes, an intravenous
catheter was inserted into an antecubital vein. A resting blood sample was taken and 10-
minutes later, the HFTT test meal consisting of melted ice cream and heavy cream;
approximately 14.8 kcal/kg (0.8 g, 1.2 g, and 0.2 g/kg BW of carbohydrate, fat, and
protein, respectively) was consumed in 5-minutes. Blood samples were then taken hourly
for the next 6-hours.

14
Postprandial Substrate Oxidation
During the HFTT, expired gas was collected for determination of whole body
carbohydrate and lipid metabolism. Participants rested for 10-minutes in a seated
position, followed by 10-minutes of expired gas collection via meteorological balloons
performed at 0, 2, 4, and 6 hours. It has been previously demonstrated that inactivity
reduces whole body fat oxidation (98).
Energy expenditure and substrate oxidation were calculated from oxygen
consumption, carbon dioxide production, and respiratory exchange ratio (RER), energy
expenditure and substrate oxidation were calculated based on the methods of Lusk (118),
below.
% Energy from carbohydrate (CHO) oxidation = ((RER – 0.707)/0.293) x 100
% Energy from fat oxidation = 100 – % Energy from CHO oxidation
CHO oxidation (kcal/min) = (%CHO oxidation/100) x VO2) x 5.05kcal/L O2
Fat oxidation (kcal/min) = ((1-%CHO oxidation/100) x VO2) x 4.7kcal/L O2
Energy expenditure (kcal/min) = CHO oxidation + Fat oxidation
Maximal Oxygen Consumption Testing
During this procedure, participants breathed into a mouth-piece (while wearing a
nose-clip) that collected and analyzed the O2 and CO2 content of expired air. From this
participants oxygen consumption was determined and their peak value (VO2peak)

15
identified. The intensity of exercise, measured in watts, was increased every 1-2 min.
until they reached their maximal effort level and become fatigued. Volitional fatigue was
associated with a difficulty or inability to maintain cadence (>60 RPMs) while cycling.
The total length of the test was ~6-12 min, including a 4-minute warm-up. Heart rate was
also measured continuously from a strap worn around the chest (Suunto, Vantaa,
Finland). Heart rate data was used as a validation method for obtaining VO2peak.
Submaximal Exercise Testing
Submaximal exercise testing was conducted on a cycle ergometer and consisted
of a 15-minute bout at an intensity of ~80% of VO2peak derived from the VO2peak testing
described above. Blood samples were taken from an indwelling venous catheter at the
beginning and end of the 15 min submaximal exercise protocol to evaluate blood lactate
responses. Heart rate and VO2 were measured continuously, as described above. Near-
Infrared Spectroscopy (NIRS) (OxiplexTS, ISS Oximeter Model 95205, Champaign, IL)
was used to measure deoxygenated hemoglobin during exercise in the vastus lateralis, as
a final measure of physiological stress during submaximal testing. The acquisition
frequency of 2 Hz was used for this study. The data between 9 and 10 minute of the
testing protocol were averaged and recorded.
Biochemical Analysis
For plasma triglyceride and glucose concentrations, all blood samples collected

16
were immediately transferred to K2 EDTA collection tubes (BD Vacutainer, Franklin
Lakes, NJ), centrifuged at 3,000 g for 15 minutes at 4°C. Plasma was then stored in
separate aliquots at -80°C until later analysis. All measurements for each participant were
performed in duplicate within the same analysis. Plasma triglyceride and glucose
concentrations were measured by a spectrophotometric method using commercially
available kits (Pointe Scientific, Inc. Canton, USA).
For blood lactate concentrations, Blood samples were immediately deproteinized
by placing it in 8% perchloric acid and lactic acid levels were later measured on the
supernatant. Enzymatic analysis was used to determine blood lactate concentration based
on methods of Farrell et al (41). Intraassay coefficients of variation for plasma
triglyceride, glucose, and blood lactate concentrations were all less than 10%.
Statistical Analysis
Descriptive Statistics are reported as Mean SE. Descriptive statistics were
compared using students t-test (= 0.05). Differences in daily steps, maximal and
submaximal exercise responses, postprandial responses and incremental (AUCI) and total
(AUCT) areas under the curve for concentrations of plasma triglyceride and glucose were
determined by two-way ANOVA (Treatment X Time). Within group differences in
plasma triglyceride concentration and postprandial substrate oxidation were determined
using repeated measures two-way ANOVA (Trial X Time). Tukey’s LSD was performed
to determine if statistical significance exists. All data were analyzed using GraphPad

17
Prism 7 (GraphPad Software Inc., La Jolla, CA). The probability level for statistical
significance was sat at = 0.05.
Results
Participant Characteristics
Participants’ characteristics are described in Table 1. The total number of
participants was 16 (8 males, 8 females), with each participant randomly assigned to one
of the experimental conditions. Participants were generally young (23.6 4.7 years),
healthy individuals that were initially sedentary with similar VO2peak values (HS: 34.1
3.3; LS: 32.2 2.9 ml/kg/min, p>0.05). There were no differences in age (HS: 23.4. 5.6
yrs; LS: 23.8 4.0 yrs), height (HS: 166.4 7.9 cm; LS: 167.2 8.4 cm) or body mass
(HS: 74.4 0.1 kg; LS: 72.5 0.2 kg) between groups (p>0.05). Participant HR,
%VO2peak, RPE during exercise were all similar (p>0.05) and suggest exercise bouts that
could be classified as vigorous intensity (Table 2).
Daily Steps
Daily Steps (Figure 2) were recorded throughout the experimental design. A
significant main effect was found for treatment group. HS treatment group took
significantly more daily steps than LS group (HS: 16,048 725 steps/day; LS: 4767 376,
p<0.001). The groups adhered well to their prescribed step number. However, post hoc
analyses revealed that on D7, individuals in HS took significantly less steps than the same
group did on D12 and D14 (D7: 11,096 1361 steps/day; D12: 18,524 2481). These
differences most likely resulted from HFTT (i.e. required sitting for 6h) that occurred on
D7.

18
Total Plasma Area Under the Curve Responses
Plasma triglyceride concentrations were analyzed at each time point in all trials
for both treatments and calculated for incremental area under the curve (AUCI) and total
area under the curve (AUCT) (Figure 3). Plasma TG AUCT & AUCI showed significant
interactions (Treatment x Time, p< 0.05). Within the LS treatment group, no significant
differences were found between HFTT time points at Baseline, Acute or Post-training for
the AUCT or AUCI. Concurrently in HS, AUCT was significantly lower in both Acute
(760.9 73.7 mg/dL per 6 h, p< 0.01) and Post Training (762.2 65.5 mg/dL per 6 h,
p<0.01) as compared with those in Baseline (886.8 79.6 mg/dL per 6 h) with no
significant difference between Acute and Post Training (p>0.05). The incremental plasma
TG responses (TG AUCI) was significantly different in both Acute (221.7 49.7 mg/dL
per 6h, p<0.05) and Post Training (236.7 61.4 mg/dL per 6h, p<0.05) compared to
Baseline AUCI (322.9 67.2). Additionally, no differences were detected between
Acute and Post Training AUCI. Furthermore, plasma glucose AUCT and AUCI showed
no significant effects within, or between either treatment groups (p> 0.05) (Figure 4).
Overall, no between group differences reach statistical at Baseline, Acute or Post-
Training (p>0.05).
Postprandial Substrate Oxidation

19
Postprandial substrate oxidation was determined using indirect calorimetry (Table
3). Oxidation calculations were limited to 7 participants from each treatment group due to
possible hyperventilation at rest. Evaluation of postprandial RER data revealed
significant differences. Within HS, RERs during the HFTT were reduced after both
Acute (0.79 0.01) and Post Training (0.80 0.01) compared to Baseline (0.83 0.01,
p> 0.05). However, but no significant differences were found within LS or between
treatment groups. Likewise, Percent carbohydrate oxidation and percent fat oxidation
were found to have significant differences between trials in HS (p<0.05); while no
differences were seen within LS or between trials. Further, postprandial absolute fat
oxidation (i.e.; kcal*6h) was higher by 24% in Acute (p< 0.05) and 19% in Post Training
(p< 0.05) compared with that in Baseline. IN LS, there were no increases in absolute fat
oxidation during HFTT between Baseline or Acute or Post Training (p>0.05). Finally,
energy expenditures for the HFTT were not different within or between trials (p>0.05)
(Table 3).
Plasma Triglyceride & Glucose Concentrations
Plasma triglyceride and glucose concentrations (Figure 5 & 6) were analyzed at
Baseline, Acute and Post-training for both treatment groups and calculated for incremental
area under the curve (AUCI) and total area under the curve (AUCT). In LS, no significant
difference was found between trials at any time point for the six-hour triglyceride excursion
(Figure.6). However, in HS significant differences existed at several time points with
Acute and Post Training values compared to Baseline. Hour 1, 2 and 3 measurements were
significantly lower in both Acute and Post Training compared with Baseline (p<0.05). For
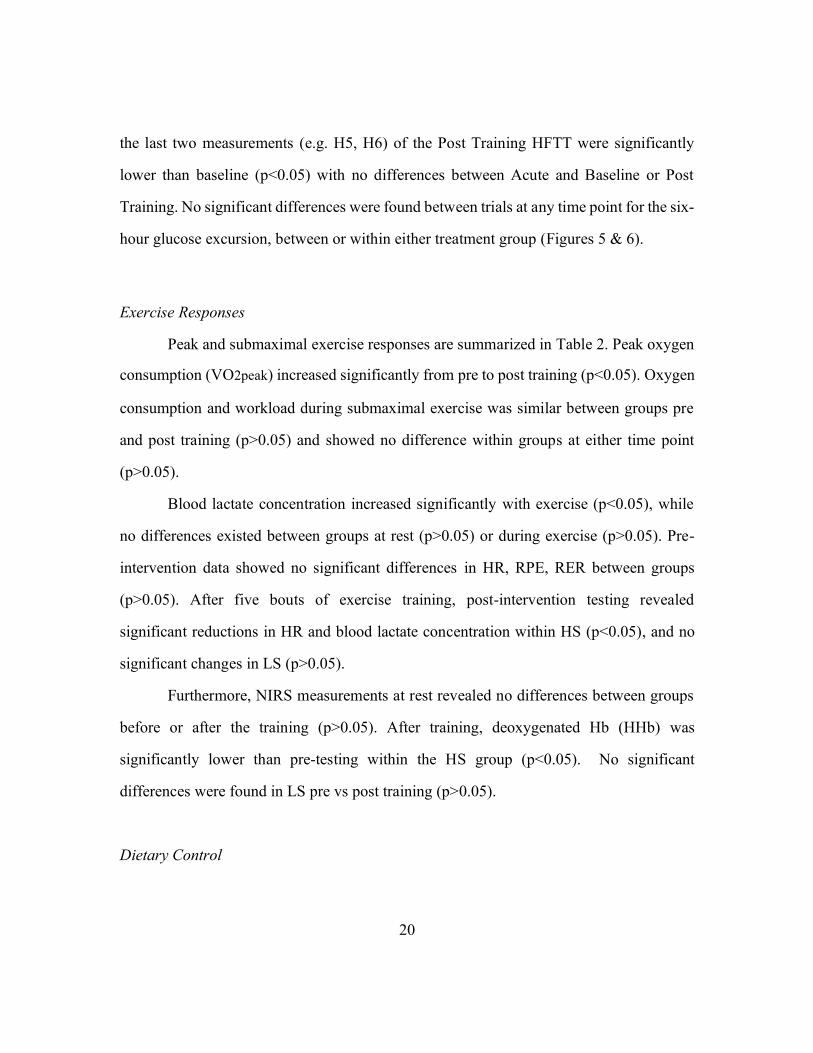
20
the last two measurements (e.g. H5, H6) of the Post Training HFTT were significantly
lower than baseline (p<0.05) with no differences between Acute and Baseline or Post
Training. No significant differences were found between trials at any time point for the six-
hour glucose excursion, between or within either treatment group (Figures 5 & 6).
Exercise Responses
Peak and submaximal exercise responses are summarized in Table 2. Peak oxygen
consumption (VO2peak) increased significantly from pre to post training (p<0.05). Oxygen
consumption and workload during submaximal exercise was similar between groups pre
and post training (p>0.05) and showed no difference within groups at either time point
(p>0.05).
Blood lactate concentration increased significantly with exercise (p<0.05), while
no differences existed between groups at rest (p>0.05) or during exercise (p>0.05). Pre-
intervention data showed no significant differences in HR, RPE, RER between groups
(p>0.05). After five bouts of exercise training, post-intervention testing revealed
significant reductions in HR and blood lactate concentration within HS (p<0.05), and no
significant changes in LS (p>0.05).
Furthermore, NIRS measurements at rest revealed no differences between groups
before or after the training (p>0.05). After training, deoxygenated Hb (HHb) was
significantly lower than pre-testing within the HS group (p<0.05). No significant
differences were found in LS pre vs post training (p>0.05).
Dietary Control

21
Daily caloric intake and percent of macronutrients were averaged across the 11-day
training phase. HS participants consumed 2389.1 153 kcal/day comprised of 50.7 0.3%
carbohydrate, 29.8 0.2% fat, & 19.5 0.2% protein. Daily caloric intake for LS averaged
1949.9 47 kcal/day comprised of 51.9 0.4% carbohydrate, 29.2 0.5% fat, & 18.9
0.2% protein. Caloric intake was significantly different between groups (p<0.001) No
differences existed between groups in percent macronutrient consumption (p>0.05).
Discussion
This study investigated the effect of 11 days of inactivity (<5,000 steps/day) on the
ability of a short-term exercise training regimen, consisting of 5 bouts over 9 days, to
improve postprandial triglyceride and classic markers of training adaptation. The foremost
finding was that, against a background of reduced daily steps (i.e.; low step; LS), intense
training (i.e.; 20-minute exercise bout at 80% VO2peak with two 5-minute intervals at 95%
VO2peak) failed to improve the postprandial metabolic responses to a high-fat meal or
promote classic whole body adaptations during submaximal exercise. This is noteworthy,
in that exercise of this intensity and duration was found to elicit sizable improvements in
high step (HS) as observed previously (46, 124, 183). In those who are active (e.g.; HS),
our findings suggest that a single acute bout of the prescribed exercise was effective in
lowering postprandial TG. Both AUCT and AUCI were significantly lower than baseline
after an acute bout of exercise, in the HS group accumulating ~16,000 daily steps.
Following four additional bouts of the same exercise postprandial metabolic responses
were similar to those seen after the single acute bout. Thus, the exercise was effective at
lowering PPL in an active group taking ~16,000 steps/day and additional bouts of training

22
appear to offer no greater benefit compared to a single bout. This agrees with previous
observations suggesting no additive effect of exercise bouts of consecutive days (40, 45).
Therefore, it seems that a reduced daily step count may somehow prevent or
severely encumber the healthy cardiometabolic adaptations that normally occur in response
to this training, both acute and chronically (46, 76, 77, 81, 83, 120, 221). This inability to
derive the protective effects of training, caused by physical inactivity, agrees with the
phenomenon of ‘exercise resistance’ first postulated by Kim et al (98). Further, this study
is the first to provide evidence that the implications of exercise resistance may extend to
short-term training.
While Kim et al (98) and one other study (1) also induced exercise resistance by
reducing daily steps to <2000 and <4000 steps/day, respectively, and used similar HFTT
testing procedures, these prior observations were limited to acute exercise bouts. In both
these studies a 1-h hour bout of exercise at ~65% VO2max failed to improve postprandial
metabolic responses, as would typically be seen following exercise of this duration and
intensity (76, 120, 167, 222). The present design contributes significantly in expanding the
consequences of daily physical inactivity beyond responses to a single bout of exertion into
a paradigm of more regular exercise that would fit within current recommendations (157).
Indeed, epidemiological studies have clearly documented that individuals who meet
current recommendations may not realize the reduced risk of CVD usually associated with
meeting guidelines, if these individuals are also inactive for the remainder of the day (16,
65). As others have noted (64, 65, 181, 205) it is possible, if not likely, that people living
in the US and similar industrialized countries could achieve or exceed physical activity
guidelines while still being inactive for 15 or more hours each day. It seems this interplay,
of prolonged inactivity and exercise, reduces the potency of the stimulus provided by
exercise training (1, 38, 98). However, there is a dearth of data on how the consequences

23
of this interplay would manifest themselves with even short term training as presently
employed. That is to say, while exercise resistance has been shown following acute
exercise, one might not expect the same results from a single bout of exercise to be derived
from short-term exercise training (96, 157). The findings from this investigation provide
evidence explaining, in part, the observations seen in previous epidemiological studies that
have found some individuals who are meeting published guidelines on physical activity are
not realizing reduced risk of CVD and premature mortality (16, 39, 150, 198, 218).
The findings from this study suggest individuals meeting current physical activity
guidelines may not derive the protective effect of daily physical activity to improve health,
at least in regard to postprandial triglycerides, if they are also experience extended periods
of inactivity. Our finding that, in a group of individuals taking 4767 steps/day, postprandial
responses were similar to untrained baseline whether individuals performed a single bout
of exercise or five exercise bouts is noteworthy. Further the exercise performed in this
study was a higher intensity (i.e. ~80-90% VO2peak) than in previous studies noting
exercise resistance (1, 98). This is significant in that higher intensity exercise has been
shown to exert greater PPL lowering effects than moderate, or low intensity (99, 183) and
may provide additional insight into the potency of the induced ‘exercise resistance’.
While our findings did not suggest an additive effect of the final four training bouts
for lowering PPL beyond the acute response to exercise, it is important to note that the
consistent exercise sessions should not be viewed as ineffective. It is probable that the TG
lowering effect of the training was exerted after each additional bout, not just after the first
and final bouts when HFTTs were performed, serving to maintain consistently-low daily
plasma TG levels. Regular exercise is likely to have beneficial effects on PPL through
short-term increases in LPL (164) as well as the other cardiovascular benefits generally
(149).

24
Among these cardiovascular benefits are indicators of muscular stress that are
typically reduced following exercise training while exercising at a given intensity. These
measures such as heart rate and blood lactate accumulation seem to be similarly unaffected
in LS compared to HS. While our findings clearly demonstrate that both conditions (high
and low step count) benefited from training, by increasing their VO2peak and thereby
decreasing the relative percentage of VO2peak needed to sustain an absolute work rate
while cycling, it seems adaptations at the level of the muscle (i.e.; blood lactate) may have
been impaired. It is unlikely that the changes seen in HS were due to the higher number of
steps causing an additional training effect beyond that provided by the intense training (80-
90%VO2peak), but that possibility can’t be discounted. Individual who simply increase
their daily step count over several weeks, typically don’t increase VO2max or show the
adaptations to submaximal exercise currently seen in HS (170).This study could have
benefitted from an additional control group in which participants maintained a high step
count but did not participate in the short-term training. This would have allowed isolation
of the effects of increasing daily activity alone. While is it probable that this level of daily
walking, in HS, was somewhat higher than the participants would experience during
normal daily living, it is highly unlikely that the intensity of walking (e.g. ~30% VO2max)
elicited significant adaptation (212). This suggests the lack of improvement in blood lactate
in LS pre-vs-post training may be due to inactivity producing an intramuscular
environment that might be ‘resistant’ to the stimulus provided by training.
Reductions in daily steps, whether imposed by prolonged sitting or another form of
induced inactivity may lead to a condition in which uptake of substrates in the blood by
muscle is reduced. While this requires speculation, it is possible that the similar levels of
blood lactate, plasma triglycerides, and plasma glucose where due to decreases in cellular
expression or activity of membrane transporters such as MCT, GLUT4, and GPIHBP1

25
proteins responsible for increased uptake of these energy substrates. Disuse, modeled
through denervation of a rats hindlimb resulted in decreases in MCT1 in the soleous and
MCT4 in the gastrocnemius (210). Because muscle serves as a primary consumer of lactate
during exercise, any decreased expression of MCTs could lead to increased lactate
concentrations during steady state exercise, or the lack of improvement blood lactate levels
seen in LS. Similarly It has been suggested that hindlimb suspension could result in
decreases in GLUT4 expression at the surface of the sarcolemma (94).
Recent observations support this contention in that not only is the postprandial
triglyceride response impaired with inactivity but a plethora of other metabolic responses
may be diminished or abolished as well (1, 13, 38). Consistent with our findings,
Bergouignan et al. (13) showed that 32 days of bed rest increased PPL by 27%, compared
to an ambulatory control, and this effect was not averted by exercise training performed
every 3 days during the bed rest. Duvivier et al. (38) showed an hour of exercise was not
sufficient to counteract the effects of sitting for 13 hours which resulted in no significant
improvements in triglycerides, non-HDL cholesterol and apolipoprotein B plasma levels
compared to a sitting condition without exercise. Interesting a group with matched energy
expenditure through increased daily walking did see improvements in each of those
measures, compared to sitting plus exercise, without structured exercise(38). Further
reduced myofibrillar protein synthesis can be seen in elderly (22) and young healthy
individuals (166) in response to step reductions of two weeks or less. This could be due to
reduced uptake of amino acids from circulation, similar to the reduced plasma triglyceride
and plasma glucose uptake shown by this study and others (1, 13, 98).
Primary amongst the limitations of the current study was a lack of sufficient power.
Power analyses indicated that a sample size of approximately 38 individuals would be
necessary to detect between groups differences in triglyceride AUCI. Despite sizable

26
differences in postprandial triglyceride responses within the respective treatments, it is
likely that this lack of power prevented our ability to detect difference between our
treatment groups, both in postprandial and exercise responses. Therefore, while it can be
concluded that the short term exercise training significantly improved PPL both acutely
and chronically in HS, whereas it did not significantly improve PPL in LS, it cannot be
concluded that HS was found to be significantly better than LS.
Secondly, it is possible that our results were influenced by selection bias.
Participants were all previously sedentary, and were randomly assigned to each ‘step’
group. It is unclear if that those who participated in the study are fully representative of a
broader sedentary population, as they sought out an opportunity to participate in intense
exercise testing and training and were willing to commit to and strictly follow a structured
program of that nature.
Participants in the study, especially within LS, also began to wane from strict
adherence to the daily step protocol as the training phase progressed. Due to the nature of
the study, extending 11 days across 2-3 weekends, to carefully ensure adherence to the
assigned daily step goal would have caused an undue burden on the participants in this
study by removing them from their normal routine. Having participants remain in the
laboratory or under direct observation is impractical for the scope of this work. Despite
taking more than 6,000 steps/day on a few days prior to the ‘Post Training’ HFTT (D10,
D12, and D13), the relative increase in daily steps seems to have little effect on the
postprandial responses. This is evidenced by similar AUCI during ‘Acute’ and ‘Post
Training’ HFTTs while taking less than 4,400 step/day, on average, in the days preceding
the ‘Acute’ HFTT. This may indicate that 6,000 steps/day is also inadequate to counteract
‘exercise resistance’ and realize the protective effects of exercise training, at least in terms
of PPL. Currently, however, this requires speculation as ‘exercise resistance’ has only

27
recently been recognized (98)) and the nature of its development and abatement have yet
to be fully described. That is, we cannot say conclusively that 6,000 step/day results in the
development exercise resistance in the absence of prior days of an even further reduced
daily step count as presented here. Further work is needed to address these issues
definitively.
In conclusion, the data presented here suggest that 11 days of step reduction (i.e.;
LS; 4,767 steps/day) prevents the improvements in PPL typically seen following intense
exercise training when background step count is high (e.g.; HS: 16,048 steps/day). Instead
of reductions in TG AUCs, as seen with training in HS, the results indicate no
improvements compared to baseline after acute exercise or short-term training. The finding
from the current investigation indicate that reducing steps below approximately 5,000
steps/day may generate reduced responsiveness to normal, healthy stimuli of intense short-
term exercise training. These findings suggest that reliance on exercise may not be enough
to sustain a low PPL in those whose lifestyles are characterized by regular, prolonged
inactivity.

28
Tables and Figures
Figure 1. Study Design. Participants were separated into two groups (High Step or Low
Step) and completed a short-term exercise regime with physiological and metabolic
testing pre and post training. Subjects took their assigned step number on days 4-14.

29
Figure 2. Daily steps were measured via activPal activity monitor, attached on the
participant’s anterior thigh throughout each trial. Average daily step count, for each
group are presented for the 11-day intervention period (D4-D14). Average daily steps
were significantly different between groups for every day measured (p<0.001). (*)
significantly different from D12 and D14 within treatment group (p<0.05).
D4 D5 D6 D7 D8 D9 D10 D11 D12 D13 D140
5000
10000
15000
20000
25000
Day of Trial
Nu
mb
er o
f S
tep
s
Step Data Low Step
High Step
*

30
Figure 3. Total and Incremental areas under the curve of plasma triglyceride
concentration during HFTT at Baseline, following a single bout of exercise (Acute), and
following 5 training bouts over the 9-days of training (Post Training). (*) Significantly
different from Baseline within treatment group, p<0.05. (†) significantly different from
Baseline within treatment group, p<0.01. Data reported as meanSE.
Baseline Acute Post Training0
500
1000
1500
Tri
gly
ceri
de (
mg
/dL
*6h
)
Plasma Triglyceride Total Area Under the Curve
High Step
Low Step
† †
Baseline Acute Post Training0
100
200
300
400
Tri
gly
ceri
de (
mg
/dL
*6h
)
Plasma Triglyceride Incremental Area Under the Curve
High Step
Low Step
* *
31
Figure 4. Total and Incremental areas under the curve of plasma glucose concentration
during HFTT at Baseline, following a single bout of exercise (Acute), and following 5
training bouts over the 9-days of training (Post Training). Data reported as meanSE.
Baseline Acute Post Training0
200
400
600
800
1000
Glu
co
se (
mg
/dL
*6h
)Plasma Glucose Total Area Under the Curve
High Step
Low Step
Baseline Acute Post Training0
50
100
150
200
250
Glu
co
se (
mg
/dL
*6h
)
Plasma Glucose Incremental Area Under the Curve
High Step
Low Step

32
Figure 5. Temporal responses of plasma triglyceride & plasma glucose concentrations
for High Step treatment during the HFTT at Baseline, following a single bout of exercise
(Acute), and following 5 training bouts over the 9-days of training (Post Training). (*)
Acute significantly different from Baseline, p< 0.05. (†) Acute & Post Training
significantly different from Baseline, p< 0.01. (#) Post Training significantly different
from Baseline, p<0.05. Data reported as meanSE.
0 1 2 3 4 5 650
100
150
200
Time (Hours Postprandial)
Tri
gly
ceri
de
(mg/d
L)
Acute
Baseline
Post Training
High Step Plasma Triglyceride Response
†
**
##
0 1 2 3 4 5 680
100
120
140
160
Time (Hours Postprandial)
Glu
co
se (
mg
/dL
) Acute
Baseline
Post Training
High Step Plasma Glucose Response

33
Figure 6. Temporal Responses of plasma triglyceride & glucose concentrations for Low
Step treatment during HFTT at Baseline, following a single bout of exercise (Acute), and
following 5 training bouts over the 9-days of intervention (Post Training). Data reported
as meanSE.
0 1 2 3 4 5 650
100
150
200
Time (Hours Postprandial)
Tri
gly
ceri
de
(mg/d
L) Acute
Baseline
Post Training
Low Step Plasma Triglyceride Response
0 1 2 3 4 5 680
100
120
140
160
Time (Hours Postprandial)
Glu
co
se (
mg
/dL
)
Acute
Baseline
Post Training
Low Step Plasma Glucose Response

34
Physical Characteristics High Step (n=8) Low Step (n=8)
M/F 4/4 4/4
Age (y) 23.4 2.0 23.8 1.4
Height (cm) 166.4 2.8 167.2 3.0
Body Mass (kg) 74.4 5.9 72.6 3.9
BMI (kg/m2) 26.7 1.9 25.9 1.0
Note: Data are reported as MeanSE
Table 1. Descriptive statistics of the two groups (i.e. High Step and Low Step) at the
beginning of the study. All data are reported as mean SE.
35
High Step Low Step
Pre Post Pre Post
Absolute VO2peak (L/min) 2.51 0.3 2.70 0.2† 2.35 0.2 2.52 0.3*
Relative VO2peak (mL/kg/min)
34.1 ± 3.3 36.9 3.6† 32.2 ± 2.9 34.5 3.3*
Submaximal VO2
(L/min) 1.98 ± 0.7 1.98 0.9 1.87 ± 0.6 1.88 0.2
%VO2peak 78.3 0.8 72.5 1.8† 79.9 0.7 75.3 1.3*
Heart Rate (bpm)
181.4 ± 4.7 168.8 4.6† 180.9 5.3 175.8 4.1
HHb (AU)
21.7 4.6 20.1 4.1* 21.1 6.5 22.1 6.3
Blood Lactate
Concentration (mmoL)
7.6 0.8 6.7 0.8* 7.2 0.3 7.2 0.4
RPE 15.6 ± 0.8 13.8 0.5 15.8 0.4 14.5 0.6
Workload (W)
135.1 18.7 -- 125.6 15.3 --
Note: Data are reported as MeanSE. (*) Significantly different from Pre, p<0.05. (†)
Significantly different from Pre, p<0.01
Table 2. Physiological responses to maximal and submaximal exercise testing. (*)
significantly different from pre-testing within treatment group, p<0.05. (†) significantly
different from pre-testing within treatment group, p<0.01. All data are reported as mean
SE.

36
Variables High Low
Baseline Acute Post Training Baseline Acute Post Training
RER 0.83 0.01 0.79 0.01* 0.80 0.01* 0.83 0.01 0.82 0.01 0.81 0.01
Fat Oxidation (%) 58.5 3.18 70.7 2.32* 67.3 2.10* 57.7 3.89 62.6 2.81 63.9 2.57
Fat Oxidation (kcal/6h) 310.2 18.2 384.1 25.1* 368.9 16.5* 330.4 37.2 351.8 43.4 350.7 29.2
CHO Oxidation (%) 41.5 3.18 29.3 2.32* 32.7 2.10* 42.3 3.89 37.4 2.81 36.1 2.57
CHO Oxidation
(kcal/6h) 216.6 19.1 157.8 11.9 181.2 13.7 233.9 22.5 203.5 11.3 201.1 23.1
Total Energy
Expenditure (kcal/6h) 526.8 18.7 541.9 26.3 550.1 18.6 564.3 39.6 555.3 45.2 551.8 43.9
Note: Data are reported as Mean SE.
Table 3. Overall postprandial substrate oxidation during HFTTs at Baseline, following a
single bout of exercise (Acute), and following 5 training bouts over the 9-days of training
(Post Training). (*) Significantly different from Baseline, (p<0.05). Data reported as
meanSE.

37
Chapter IV: Study #2
DOSE RESPONSE OF PHYSICAL INACTIVITY ON PLASMA TRIGLYCERIDES AFTER A
MEAL
Abstract
Background: It has been suggested that there is a linear, inverse dose-response
relationship between the daily steps and cardiovascular events. However, it seems if
individuals severely reduced the number of steps taken throughout the day the protective
effects of exercise may not be realized. The objective of this study was to determine
differences in postprandial metabolic responses following acute exercise against a
background of differing levels of daily step reduction.
Methods: Ten participants completed three, five-day trials in a randomized, crossover
design with differing levels of daily step reduction. Following two days of controlled
activity, participants completed two days of Low, Limited, or Normal Activity (2,675,
4,759, or 8,480 steps/day, respectively). Participants also completed a one-hour bout of
exercise on the evening of the second day of step reduction. A high fat tolerance test was
performed on the following morning. Postprandial responses were compared in each trial.
Results: Daily steps were significantly different in each trial (2,675, 4,759, or 8,480
steps/day, respectively; p<0.05) while responses to the acute moderate intensity exercise
were similar (p>0.05). Following the NORM trial, participants’ incremental plasma
triglyceride response was lower than LIM by 23% (p<0.05) and LOW by 22% (p<0.05).
Whole body fat oxidation was also significantly increased in NORM compared to the two
other trials (p<0.05). No significant differences were found between LIM and LOW in any
postprandial measure.
Conclusion: In conclusion, two days of daily step reduction in young healthy individuals
can impair the ability of acute exercise to attenuate PPL. The finding that the participants
38
don’t lower PPL or increase fat oxidation in response to exercise when taking ~4700 steps
or less, may indicate a reduced responsiveness of skeletal muscle to exercise. This agrees
with the newfound phenomenon of ‘exercise resistance’ in individuals whose daily life is
characterized by inactivity (e.g. prolonged sitting) and low step count.
39
Introduction
The cardio-metabolic health benefits of physical activity and exercise such as
improved postprandial hypertriglyceridemia and improved glucose tolerance, can be
gained acutely from a single bout of exercise and lost with several days of inactivity (80,
82, 83). However, studies in which acute exercise resulted in reduced postprandial
hypertriglyceridemia, the participants were accumulating approximately 7,000-8,500
steps on the day before evaluation of postprandial metabolism (99, 183, 184). Although,
in a recent study Kim et al. (98), the authors reported that in participants who were sitting
for >14 h/day and taking only 1,650 steps/day, a one-hour bout of running at 67%
maximal oxygen consumption (VO2max) failed to improve postprandial
hypertriglyceridemia the next morning. It seems that physical inactivity (i.e; severely
reduced step count) rendered the participants resistant to the normal acute improvements
in indices of cardio-metabolic health that are normally derived from a one-hour bout of
running. This phenomenon is referred to as ‘exercise resistance’ (98). A follow-up study
in 2019 (1), used additional controls to verify the existence of this phenomenon found a
group taking ~3700 steps/day also exhibited exercise resistance. Therefore, it is important
to systematically delineate what magnitude of daily step reduction causes impairment of
the ability of acute exercise to improve the postprandial plasma triglyceride response.
In modern culture, we have engineered physical activity out of our daily lives.
Periods of prolonged inactivity, characterized by mostly sitting, have become routine in
the lives of many and routinely coincide with the non-fasting or postprandial state. In the
postprandial state, triglyceride levels in the plasma can remain elevated for up to 10

40
hours, typically peaking 3 - 6 hours after a meal rich in fat (152). The magnitude and
duration of this elevation is influenced by prior physical activity (52, 120, 221), diet
(174), and genetics (173, 204). As demonstrated in recent epidemiological studies (5,
142), non-fasting plasma triglyceride levels, i.e., post-prandial lipemia (PPL), better
predicts cardiovascular events than fasting plasma triglyceride levels and are known to be
associated with diseases, including metabolic syndrome, type 2 diabetes, and
atherosclerosis. In fact, several recent epidemiological studies, inactivity and/or sitting
time has been strongly associated with the risk of obesity, metabolic disorders including
type 2 diabetes mellitus and especially with cardiovascular disease and death (16, 198,
218). Surprisingly, some have reported that the risks from prolonged sitting appears
“independent” of the volume of exercise being performed (16, 150, 198, 218). This
means people who meet the recommended guidelines (AHA or ACSM) for physical
activity of 150 min/week of moderate intensity exercise appear to still be at risk for
developing cardiovascular disease and all-cause death if they have a lifestyle routinely
incorporating prolonged periods of inactive, sedentary behavior (>10-12 h/day).
One of the strongest negative correlations (r=-0.96) in relation to sedentary time is
time in light-intensity activity, such as walking (65). This means increasing time spent
ambulatory reduces sitting time. Accordingly, manipulation of daily step count has been a
popular and potent method of studying the effects of inactivity. Appropriately, increased
daily walking has been shown to reduce cardiovascular events (122) while reductions in
daily step number for as little as one week have been associated with drastic increases the
area under the curve of plasma insulin during an oral glucose tolerance test (OGTT)

41
(145). This increase showed the potential to grow to nearly 80% greater, if the reductions
were maintained for 2 more weeks (145). Daily step reductions have also been linked to
decreased VO2max, endothelial dysfunction, decreased insulin sensitivity, decreased lean
leg mass and increased abdominal fat (22, 109, 145).
Meanwhile, it is well established that a single bout of moderate exercise lasting
60-90 minutes attenuates PPL regardless of prior lipid levels (221) and training status
(66, 120, 151). Many studies (52, 120, 221) have been conducted to investigate the effect
of a single bout of moderate intensity exercise on postprandial triglyceride levels in
comparison to a control condition. Participants in these studies were asked to refrain from
any planned exercise but their ambulatory activity, including walking, was not carefully
controlled. Furthermore, very few studies (1, 98) have investigated the collective effect of
daily step reduction and moderate exercise. Although recent data (1) present compelling
evidence that drastically reducing daily step number may abolish the ability of an acute
bout of exercise to attenuate the increase in PPL, some other studies seem to suggest this
may not occur with as little as ~7,900 steps/day (183).
Thus, the purpose of this study was to investigate the effect of reductions in daily
step number and a single 1h bout of moderate intensity exercise on postprandial
concentrations of plasma triglyceride and glucose, as well as fat oxidation. We
hypothesized that postprandial responses, following a single bout of 1-hour of running at
65% VO2max, would differ as daily steps increased.

42
Methods
Ten healthy untrained, recreationally active male (n=7) and female (n=3)
participants completed three different trials of differing daily step counts based on
previously established cut-points for physical activity (194). Participants were assigned to
Low Activity (LOW): 2675 steps/day, Limited Activity (LIM): 4,759, and Normal Activity
(NORM): 8480 steps/day in a randomized, crossover design, each occurring over five days
with at least a week interval between trials (See Figure 7). Participants were asked to refrain
from any planned exercise outside of the experimental design. Participants were given
written and verbal description of all the procedures and measurements used in this study,
and written informed consent was obtained. The Institutional Review Board of the
University of Texas at Austin approved this study (ClinicalTrials.gov Identifier:
NCT03697382).
Experimental Design
Each trial consisted of three phases: the first two days served as a control phase
(C1 and C2), that allowed for familiarization and control, followed by a 2-day
intervention phase consisting Low, Limited, or Normal physical activity consisting of
daily step counts of 2,675, 4,759, or 8,480 steps per day, respectively, with 1-h of running
on the evening of the second day of each trial at 64% VO2max on a laboratory treadmill.
On the morning of Day 3 all participants ingested a high fat shake (i.e.; high fat tolerance
tests; HFTT) and the postprandial responses were measured over the subsequent 6h
period. Throughout the three trials, participants were instructed to refrain from any
43
exercise other than that prescribed in the study design. Participants were also asked to
keep a consistent sleep/wake cycle during the trials.
Preliminary Testing
One week prior to the initiation of the first trial, participants visited the Human
Performance Laboratory (HPL) for a 20-min, 4-stage submaximal test to determine
oxygen consumption while jogging at different paces followed by determination of
maximal oxygen uptake (VO2max). This served to determine the appropriate treadmill
speed to elicit the desired intensity during the 1-h exercise bout. In order to determine
VO2max participants performed an incremental treadmill test lasting 8-12 minutes during
which the incline was increased 2% every 2 minutes (29). VO2, VCO2, and heart rate
were monitored throughout the test, and the highest 30 second VO2 average was recorded
for the participant’s maximal oxygen consumption. The ACSM criteria for VO2max was
used in assessing a successful VO2max test. These criteria are: a plateau in oxygen
consumption (less than 150 ml/min increase in VO2 with increasing work), respiratory
exchange ratio (RER) >1.1, maximal heart rate within 10 bpm of predicted maximal heart
rate, and a rating of perceived exertion (RPE) of 17 or greater.
Control Phase

44
Participants were instrumented with an activity monitor worn on their thigh to
record step count (activPAL, PAL Technologies, Glasgow, Scotland) and the monitor
began recording at 0:00hrs on the first day of the control phase (C1). Participants were
asked to remain aware of their step count and to limit steps to 8000 or less to approximate
a non-sedentary, low level of physical activity (189). If participants were unable to
achieve 8,000 step limit in their first trial, they were the asked to repeat their activity as
closely as possible during the control phases of the subsequent trials.
Intervention Phase
During the intervention phase, D1 & D2, participants were asked to remain seated
or lying for much of the day to accommodate their assigned level of non-exercise activity
(2,675, 4,759, or 8,480 steps/day). On D2 of each trial participants continued to adhere to
the assigned step count, but completed a 1-h run at 64.4% VO2max at 18:00h. The steps
during this bout of exercise were not included as part of the participants total for D2.
High Fat Tolerance Test (HFTT)
Participants were given a low fat meal the evening prior to high fat tolerance test
(HFTT) given that the plasma TG response to a high fat shake (HFS) may be affected by
the fat content of a previous meal (42). On the day of the HFTT (D5), participants
reported to the laboratory at 07:00 h. Body weight was measured. They then lie on a
padded table for 5 minutes before insertion of a catheter into an antecubital vein. A
45
fasting blood sample was collected 10 min before consumption of a high fat shake (HFS)
(mostly melted ice cream and heavy cream; approximately 14.8 kcal/kg (0.8 g, 1.2 g, and
0.2 g/kg BW of carbohydrate, fat, and protein, respectively). Participants were asked to
consume the HFS in 5 minutes. Blood samples were collected over the next 6 hours at 0,
2, 3, 4 and 6h post consumption of the HFS. All blood samples collected were transferred
to K2EDTA collection tubes (BD), centrifuged at 2,000 g for 15 minutes at 4◦C and then
stored in -80◦C freezer until later analysis. During HFTT, participants were asked to
remain seated quietly reading, watching movies, and/or surfing the internet. Participants
were allowed to
Postprandial Substrate Oxidation
Postprandial expired gas collection was used for indirectly assessing substrate
oxidation. Participants rested in a chair for 10 minutes, followed by expired gas
collection through meteorological balloons for 10 minutes at 0, 2, 4, and 6 h. It has been
previously demonstrated that inactivity reduces whole body fat oxidation (98).
Energy expenditure and substrate oxidation were calculated from oxygen
consumption, carbon dioxide production, and respiratory exchange ratio (RER), energy
expenditure and substrate oxidation were calculated based on the methods of Lusk (118).
% Energy from carbohydrate (CHO) oxidation = ((RER – 0.707)/0.293) x 100
% Energy from fat oxidation = 100 – % Energy from CHO oxidation
CHO oxidation (kcal/min) = (%CHO oxidation/100) x VO2) x 5.05kcal/L O2

46
Fat oxidation (kcal/min) = ((1-%CHO oxidation/100) x VO2) x 4.7kcal/L O2
Energy expenditure (kcal/min) = CHO oxidation + Fat oxidation
Dietary Control
During the course of the study participants were asked to eat to satiety.
Participants logged all food and were asked to consume the same foods on the day prior
to each HFTT. On the evening prior to the HFTT participants were given a low-fat meal
to consume as fat in the previous meal can affect the response to a high-fat test meal (42,
184). Participants were allowed to supplement higher energy expenditure during the LIM
and NORM step trials with a small snack but were asked to adhere to a diet standard in
macronutrient breakdown (126).
Biochemical Analysis
For plasma triglyceride and glucose concentrations, all blood samples collected
were immediately transferred to K2 EDTA collection tubes (BD Vacutainer, Franklin
Lakes, NJ), centrifuged at 3,000 g for 15 minutes at 4°C. Plasma was then stored in
separate aliquots at -80°C until later analysis. All measurements for each participant were
performed in duplicate within the same analysis. Plasma triglyceride and glucose
concentrations were measured by a spectrophotometric method using commercially
available kits (Pointe Scientific, Inc. Canton, USA). Intraassay coefficients of variation
for plasma triglyceride and glucose concentrations were all less than 10%.

47
Statistical Analysis
Incremental (AUCI) and total area under the curve (AUCT) for plasma triglyceride
and glucose were calculated. Once calculated, repeated measures one-way analysis of
variance (ANOVA) was used to test for differences. Plasma glucose and triglyceride curves
were calculated and analyzed using repeated measures two-way ANOVA (trial x time).
Daily step counts were analyzed using repeated measures two-way ANOVA (trial x time).
Similarly, respiratory exchange ratio (RER), as well as fat and carbohydrate oxidation,
were analyzed using repeated measure two-way ANOVA (trial x time). When interactions
were significant, Tukey’s honestly significant difference post hoc tests were run. All data
were analyzed using GraphPad Prism 7 (GraphPad Software Inc., La Jolla, CA). All data
are expressed as mean standard error of the mean (SE), unless otherwise noted, the level
for statistical significance was set at p 0.05.
Results
Participant Characteristics
Participant characteristics are summarized in Table 4. A total of 10 participants
were recruited (7 males, 3 females), with all participants completing all three trials.
Participants were apparently healthy, young adults (24.0 ± 1.8) that were untrained to
recreationally active.
Responses to Maximal and Submaximal Exercise
Responses to maximal and submaximal treadmill running are shown in Table 5.
Submaximal exercise bouts elicited a heart rate of 153.9 3.9 bpm and an oxygen

48
consumption of 2210.2 154 ml/min, which equated to approximately 64.4% of
participants VO2max. These responses were indicative of moderate intensity exercise and
were not different between trials.
Daily Steps
Daily steps are presented in Table 6. A significant Trial x Time interaction was
found daily step count (p<0.001). Post hoc analyses revealed no significant differences
within or between trials for control days (p>0.05). However, daily steps on Day 1 of the
intervention were significantly different for all trials (LOW: 2,744331, LIM: 4,482318,
NORM: 8,431732). Likewise, during Day 2 of the intervention, excluding exercise steps,
daily steps were significantly different for all trials (LOW: 2,605313, LIM: 5,037206,
NORM: 8,530420; p<0.01 for all comparisons).
Total Plasma Area Under the Curve Responses
Plasma triglyceride concentrations were analyzed at each time point in all trials
for all trials and calculated for incremental area under the curve (AUCI) and total area
under the curve (AUCT) (Figure 8). Analysis of plasma TG AUCT revealed significant
differences with NORM being significantly lower than LOW (p<0.01) and a trend toward
difference compared to LIM (p=0.09). AUCI in NORM (267.539.2 mg/dL*6h) was
significantly different from LOW and LIM (342.347.8 and 348.648.9 mg/dL*6h,
respectively, p<0.05). No differences were detected between LOW and LIM in AUCT,

49
nor AUCI. Plasma glucose areas under the curve showed no differences (p>0.05)
between the three trials in AUCT or AUCI (Figure 9).
Plasma Triglyceride & Glucose Concentrations
Plasma triglyceride and glucose concentrations were analyzed at each time point in
all trials for both treatments. Triglyceride and glucose excursions are shown in Figure 10
for TG, and Figure 11 for glucose. Significant differences existed at multiple time points
between trials. At hours 2 and 3, NORM was significantly different from LOW (p<0.05).
At hour 3, NORM was also significantly different from both LIM (p<0.05). NORM was
also significantly different from LOW (p<0.01) and LIM (p<0.05) at hour 4. No differences
existed at baseline or hour 6 for triglyceride concentrations (p>0.05). Furthermore, no
significant differences were found between trials at any time point for the six-hour
triglyceride excursion.
Postprandial Substrate Oxidation
Postprandial substrate oxidation was determined using indirect calorimetry (Table
8). Postprandial RER was significantly different in NORM (0.770.01) compared to LOW
(0.800.01, p<0.05) with a strong trend toward significant from LIM (0.81 0.01, p=0.06).
Similarly, percent fat and carbohydrate oxidation, as well as absolute carbohydrate
oxidation (i.e. kcal*6h) were different in NORM compared with LOW (p<0.05). Notably,
Absolute fat oxidation was significant different in NORM (396.027.5 kcal), compared
with LOW (318.934.5 kcal, p<0.05) and LIM (342.430.9, p<0.05).

50
Post hoc analysis for bihourly RER measurements (Appendix F) revealed
differences for hour 2 between NORM and both LOW and LIM (p<0.05), while RER was
similar between trials at other measurement time points (p>0.05). Similarly, differences in
percent fat oxidation and percent carbohydrate oxidation were significant at hour 2. Finally,
no difference was found between trials in overall postprandial energy expenditure, or
energy expenditure at any single time point between or within trials (p>0.05).
Discussion
The purpose of this study was to investigate the effect of daily step reductions on
postprandial responses to a high fat meal the morning after an acute bout of moderate-
intensity exercise. We hypothesized our key measures, TG AUCI, and fat oxidation would
display a curvilinear dose-response relationship with daily steps taken in the two days
preceding an acute exercise bout. The primary finding of this study was that when
individuals take ~8500 daily steps their postprandial triglyceride responses and whole body
fat oxidation during a HFTT, following 1-hour of exercise at 64% VO2max, the night before
were significantly improved compared with the same individuals taking 4,759 steps/day or
2,675. In this randomized, cross over experimental design individuals displayed a 23% and
22% reduction in TG AUCI when averaging 8480 steps/day, compared to those same
individuals when taking 4,759 or 2,675 steps/day, respectively. The reduction in plasma
TG concentration may be due to an increased uptake by tissue and increased oxidation,
which was also significantly increased in NORM compared to the other trials.
This is a striking difference as reductions in TG AUCI after similar exercise has
been shown to induce TG AUCI reductions on the order of 20-40%, compared to a non-
exercise control (46, 99, 183, 221). In other words, when taking 8480 steps/day (i.e.;
51
NORM), the observed reductions in TG AUCI, compared to both of the LOW and LIM
trials, were similar to reductions typically seen compared to a “no exercise” condition.
Despite completing identical exercise bouts, the night before commencement of the HFTT,
participants seem to have displayed decreased responsiveness to said exercise if they
reduced daily steps below ~4,700 steps/day; at least in regards to PPL. Olsen et al (145)
found simply reducing steps from ~10,500 to ~1,400 steps/day for two weeks increased
TG AUCT by 21% in the absence of exercise.
Recent research has begun to place a particular emphasis on the benefits of
increases in daily step counts (107, 111, 189, 191). This is probably due to the ease of
translation as a step/day metric is easy to understand and practical, thanks to technology
such as wearables that increase the ease of self-monitoring effectively and affordably.
Some have recently proposed an inverse dose-response between daily step counts and
incidence of cardiovascular disease, type 2 diabetes, and all-cause mortality (107) (111).
Lee et al. (111) found rates of mortality progressively declined with increasing daily steps
until plateauing at approximately 7,500 steps/day. Contrary to the findings in the present
study, the authors reported groups taking as few at 4,363 steps/day displayed reduced
mortality compared those taking 2,718 step/day. The difference in findings may be due to
the fact that the participants in Lee et al. were substantially older than the population
recruited for the current study. Moreover, a recent meta-analysis (107) suggested a 10%
reduced risk of cardiovascular events for each 2,000 step increase in daily step number up
to 10,000 steps/day. These investigations differ from the findings in this study, as we did
not find any improvement in postprandial responses when an individual increased daily
walking from ~ 2,700 to ~ 4,750 steps/day. A few important distinctions should be noted
and may explain this discrepancy. First, and most obviously, the current investigation
focused on responses following moderate exercise which was not employed in the

52
aforementioned studies. Secondly, the “baseline” step counts in almost all of these
investigations, and given as a hypothetical baseline within one (107), exceeded 5,000
steps/day (107, 111, 216) which excludes comparisons below this level of daily walking,
such as the 2675 step/day trial presented herein. The current investigation was also
conducted over a much shorter time period than the observations. Lastly PPL, while
indicative of CVD events, is only a single factor contributing to the development of CVD
and should not be considered equivalent or wholly indicative of CVD.
It is possible that at severely reduced step counts (<5,000 steps/day) physiological
and metabolic responses differ from those above ~8,000 steps/day. This seems to be
buttressed by a growing public health literature that suggest a daily step count at or below
5,000 should be classified as a “sedentary lifestyle index” (189, 191) and should be viewed
as a problematic because of the distinct health ramifications seen below this level of
activity due to “non-exercise activity deficiency” (64). Though this is a reduction below
the level some would consider ‘normal’, it should not be ignored. In fact estimates from
the NHANES study, based on objectively collected accelerometer data, indicate
approximately 37% of the US population would fall below this level of daily activity (194).
Our findings are particularly interesting in light of recent findings of a phenomenon
termed “exercise resistance” (1, 98). These authors observed individuals taking less than
4,000 daily steps were resistant to the exercise stimulus provided by 1-h of running at ~65%
VO2max. In these randomized crossover trials (1, 38, 98) the protective effects of exercise,
preventing exaggerated rises in postprandial plasma triglycerides and glucose, were not
realized if daily step counts were reduced by imposed sitting of 13 hours or more. It seems
by drastically reducing the contractile activity in the study participants, an environment
was produced within the muscle that prevented the classic improved response to the
exercise stimulus. It has been postulated in a recent meta-analysis by Ekelund et al (39)

53
that individuals experiencing high levels of daily inactivity are at an increased risk of
mortality even when participating in similar levels of daily activity (e.g. MET hours).
Taken together it seems that reduced contractile activity causes a condition in which current
exercise recommendations may not be enough to derive protective benefits. Thus a higher
minimum level of recommended physical activity may be needed for populations regularly
experiencing prolonged inactivity.
Muscle lipoprotein lipase (LPL) is the rate limiting enzyme for clearance of plasma
triglycerides (202). Therefore, decreased LPL activity is a rational candidate for explaining
the increased PPL found in this study with LOW and LIM. Although not measured directly
in the present investigation, low levels of contractile activity have been observed to
drastically reduce the activity in LPL in muscle. In an animal model, hind-limb
immobilization has been shown to have sizeable reductions (i.e. 90% decrease) in LPL
activity and developed rapidly (>60% reduction in <12h) (15). However, it seems the
downregulation is post-transcriptional. Even in the tissue with more than 90% reduction in
LPL activity, LPL mRNA was similar to baseline (15). Additionally, the data from this
study (15) indicate LPL mRNA is not increased with walking or levels of contractile
activity associated with maximal increases in LPL activity. It seems LPL activity may be
down regulated by GPIHBP1 protein endocytosis induced by some co-factor produced
during periods of prolonged inactivity (12, 94). However, this hypothesis was not tested in
the present study and needs additional investigation to fully elucidate a mechanism.
It is plausible that this study would have a greater impact if it were conducted in an
older population. This is due to the increased magnitude and duration of the postprandial
triglyceride elevation in older populations, compared with their younger counterparts (11,
62). Postprandial TG concentrations have been observed to peak 2-3 hrs earlier in young
people while aged participants showed increased rates of chylomicron accumulation
54
peaking at concentrations nearly four-fold greater (141). The durations of these elevations
above baseline mirrored these findings, returning to baseline after 6 hours in the young
compared to 24 hours in an older population (11). However, it has been postulated that this
increased PPL is due to the decreases in non-exercise activity associated with aging (62).
Moreover, technological advances have drastically decreased occupational physical
activity such that activity in much of the workforce can approximate that of sedentary,
elderly individuals (26). This is not obviated completely even in health-conscious
individuals. For example, ‘workday’ sedentary time in 208 marathon and half-marathon
participants was observed to be similar to those seen in the elderly in assisted living
communities (90, 206). Thus, this work addresses a population that may still be at
significant health risk.
In conclusion, to the best of our knowledge the current investigation is the first to
indicate that 2 days of step reduction can decrease an individual’s responsiveness to an
acute aerobic exercise bout in terms of stimulating improved PPL and fat oxidation. When
participants took 8,480 daily steps and performed a 1h bout of exercise, their responses in
TG excursions and AUCs were significantly lower than following the same exercise with
step counts at 2,675 and 4,759 steps/day. When viewed from the perspective of previous
literature, the reduction in TG AUCI when participants took 8,480 steps, compared to either
of the lower daily step counts in this study, were similar to expected reductions that have
been observed to occur in a non-exercise control (46). This may support the exercise
resistance phenomenon recently coined by Kim et al (98), in which individuals who spend
the majority of their day sitting and take relatively few steps are unable to reap the benefits
generally associated with acute aerobic exercise (39, 124). Based on these data, from the
current investigation and others, it seems that reducing daily steps may cause development
of a condition in which the inactive muscle demonstrates blunted responses to normal,
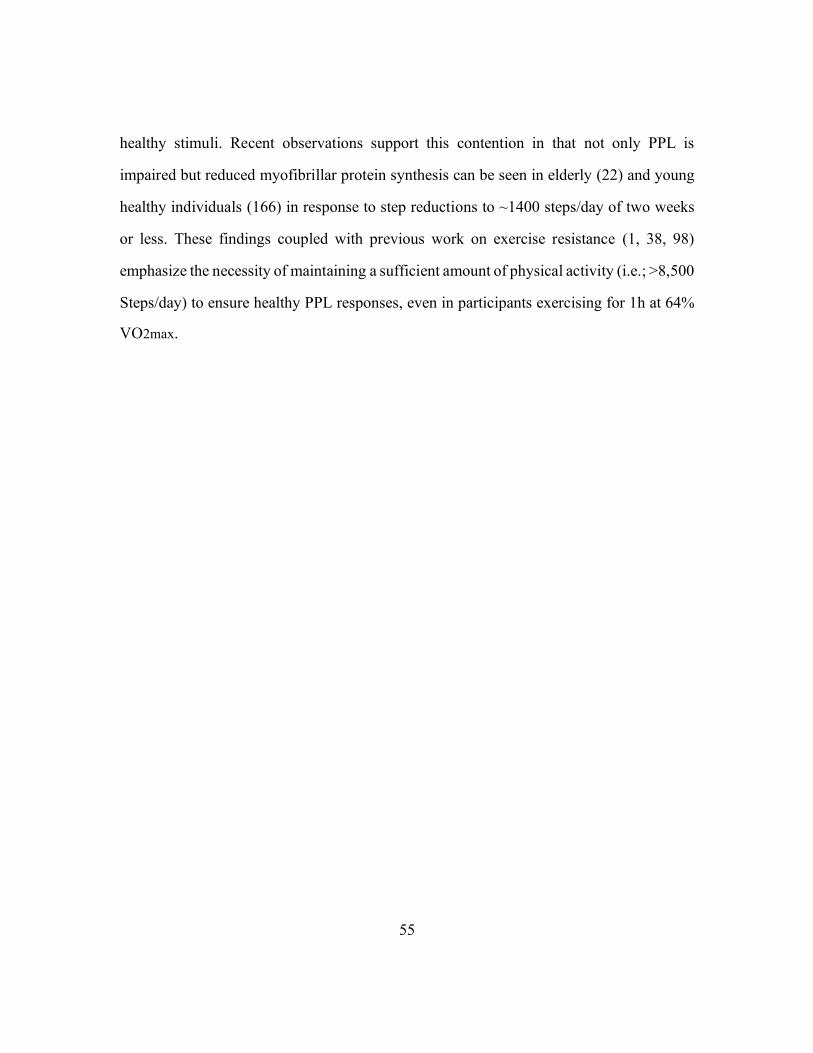
55
healthy stimuli. Recent observations support this contention in that not only PPL is
impaired but reduced myofibrillar protein synthesis can be seen in elderly (22) and young
healthy individuals (166) in response to step reductions to ~1400 steps/day of two weeks
or less. These findings coupled with previous work on exercise resistance (1, 38, 98)
emphasize the necessity of maintaining a sufficient amount of physical activity (i.e.; >8,500
Steps/day) to ensure healthy PPL responses, even in participants exercising for 1h at 64%
VO2max.

56
Tables and Figures
Figure 7. Study Design. Participants completed a five-day randomized, crossover
experimental design with differing levels of daily step reduction (i.e. Low- 2,675,
Limited- 4,759, & Normal Activity-8,480 Steps/Day). Participants completed two control
days with activity monitoring before the initiation the two-day step reduction (D1 & D2).
Participants also completed an hour of treadmill running on the night of D2 followed by
HFTT on the morning of D3.

57
Figure 8. Total and Incremental areas under the curve of plasma triglyceride
concentrations during HFTT for each trial. (*) significantly different from Low &
Limited step group, p<0.05. (†) significantly different from Low step group, p<0.01. Data
reported as meanSE.
Low Limited Normal0
200
400
600
800
1000
1200
Tri
gly
ceri
de (
mg
/dL
*6h
)
Plasma Triglyceride Total Area Under the Curve
†
Low Limited Normal0
100
200
300
400
500
Tri
gly
ceri
de (
mg
/dL
*6h
)
Plasma Triglyceride Incremental Area Under the Curve
*

58
Figure 9. Total and Incremental areas under the curve of plasma glucose concentrations
during HFTT for each trial. Data reported as meanSE.
Low Limited Normal0
200
400
600
800
1000G
luco
se (
mg
/dL
*6h
)
Plasma Glucose Total Area Under the Curve
Low Limited Normal0
50
100
150
200
250
Glu
co
se (
mg
/dL
*6h
)
Plasma Glucose Incremental Area Under the Curve

59
Figure 10. Temporal Responses of plasma triglyceride concentrations for each trial
during HFTT. (*) Normal significantly different from Low, p<0.05. (†) Normal
significantly different from Limited, p<0.05. (#) Normal significantly different from
Low, p<0.01. Data reported as meanSE.
0 1 2 3 4 5 6
50
100
150
200
Time (Hours Postprandial)
Tri
gly
ceri
de (
mg
/dL
)
Plasma Triglyceride Response
Low
Limited
Normal
*
*† #†

60
Figure 11. Temporal Responses of plasma glucose concentrations for each trial during
HFTT. Data reported as meanSE.
0 1 2 3 4 5 6
80
100
120
140
Time (Hours Postprandial)
Glu
co
se (
mg
/dL
)Low
Limited
Normal
Plasma Glucose Response

61
Table 4. Descriptive statistics for participants at the beginning of the study. All data
reported as mean SE.
Physical Characteristics mean SE
Age (y) 23.4 5
Height (cm) 166.4 7.9
Body Mass (kg) 74.4 16.9
BMI (kg·m-2) 26.7 5.2
Note: Data are presented as MSE

62
Exercise Responses mean SE
Maximal Oxygen Consumption
VO2max Absolute (ml/min) 3,405 242
VO2max Relative (ml/kg/min) 42.7 1.4
Submaximal Exercise During 1-h Run
Heart Rate (bpm) 154 4
Rating of Perceived Exertion 11.4 1.1
VO2 (ml/min) 2210 154
% VO2max 64.4 0.4
Treadmill Speed (mph) 4.8 0.2
Note: Data are presented as MSE
Table 5. Responses to maximal exercise and the 1-h bout of submaximal exercise.
All data reported as mean SE.

63
Trial
Day of Trial
C1 C2 D1 D2
Daily Steps
Low 10198 1476 11015 1159 2744 331 2605 313
Limited 9808 1207 10568 1112 4482 318* 5037 206**
Normal 11056 1324 10732 936 8431 732† 8530 420†
Note: Data are presented as MSE. (*) Significantly different from Low, p<0.05. (**) Significantly different from Low, p<0.01.
(†) Significantly different from both Low & Limited, p<0.01
Table 6. Average daily steps measured via activPal activity monitor, attached on the
participant’s anterior thigh throughout each trial. Average daily step counts for each trial
are presented for Control (C1 & C2) and Intervention Phases (D1 & D2). (*) significantly
different from Low, p<0.05. (**) significantly different from Low, p<0.01. (†)
significantly different from Low & Limited step trial, p<0.05.

64
Trial Postprandial Time (Hours)
Baseline H2 H3 H4 H6
Triglyceride Concentration (mg/dl)
Low 89.8 7.5 147.5 13.5 172.4 13.0 176.5 16.2 133.0 13.6
Limited 81.1 9.1* 134.0 11.1 175.4 15.5 167.6 16.3 126.2 14.2
Normal 80.0 5.8 125.3 9.8* 151.3 11.3*† 141.6 11.9*† 115.7 12.2
Glucose Concentration (mg/dl)
Low 91.8 4.3 116.4 6.7 --- 139.7 16.8 116.3 10.4
Limited 92.5 3.4 115.4 5.7 --- 122.7 10.6 110.1 5.4
Normal 94.5 3.7 108.2 4.4 --- 130.4 7.3 111.4 6.2
Table 7. Hourly responses (e.g.; H2, H3, etc.) of plasma triglyceride and plasma glucose
concentrations during HFTT for each trial. (*) Significantly different from Low, p<0.05.
(†) Significantly different from Limited, p<0.05. Data reported as meanSE.
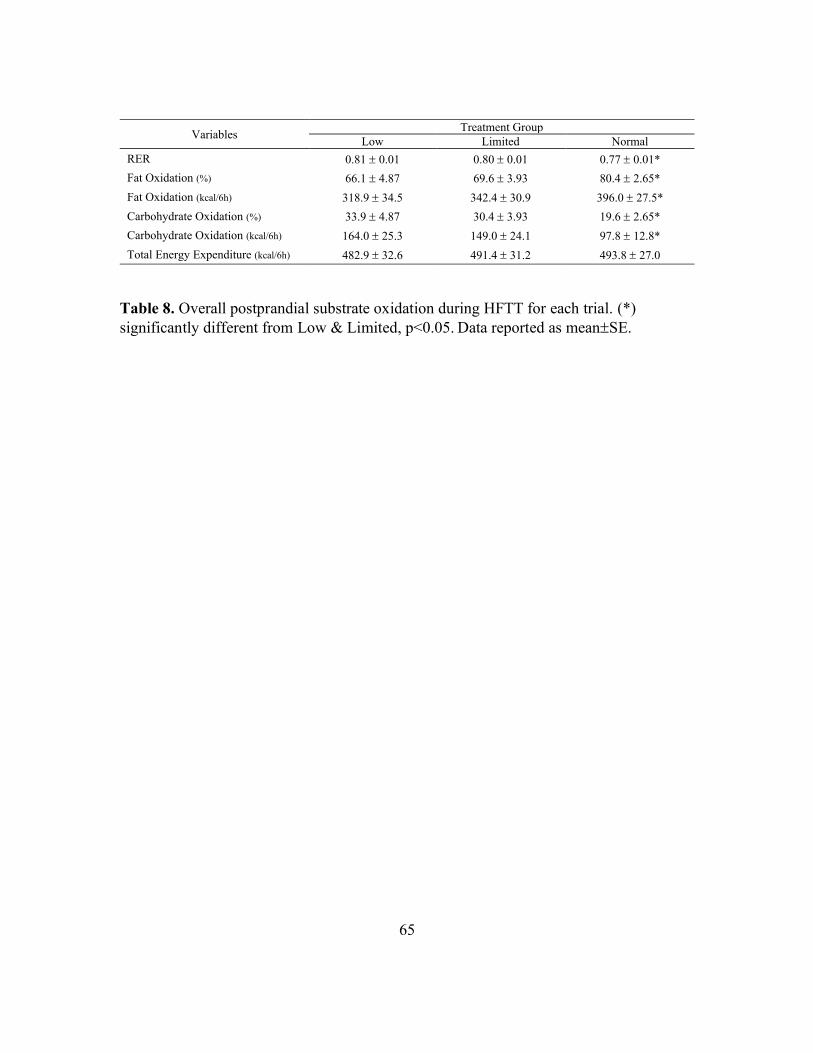
65
Variables Treatment Group
Low Limited Normal
RER 0.81 0.01 0.80 0.01 0.77 0.01*
Fat Oxidation (%) 66.1 4.87 69.6 3.93 80.4 2.65*
Fat Oxidation (kcal/6h) 318.9 34.5 342.4 30.9 396.0 27.5*
Carbohydrate Oxidation (%) 33.9 4.87 30.4 3.93 19.6 2.65*
Carbohydrate Oxidation (kcal/6h) 164.0 25.3 149.0 24.1 97.8 12.8*
Total Energy Expenditure (kcal/6h) 482.9 32.6 491.4 31.2 493.8 27.0
Table 8. Overall postprandial substrate oxidation during HFTT for each trial. (*)
significantly different from Low & Limited, p<0.05. Data reported as meanSE.

66
Chapter VI: General Summary
These studies were conducted in order to determine: 1) if the background level of
daily physical inactivity impairs postprandial lipemia (PPL) and cardiovascular adaptations
to short term training and 2) the effect of altering daily step counts for two days on the
ability of a 1-h bout of moderate-intensity exercise to reduce PPL.
In Study 1, it was shown that inducing physical inactivity by reducing daily step
count to 4,767 steps over 11 days, in conjunction with vigorous-intensity exercise training,
resulted in an inability to incur the classic PPL-lowering effect of acute exercise as well as
short term training. Furthermore, classic adaptations, such as decreases in heart rate and
blood lactate concentration and increases in muscle oxygenation and fat oxidation when
exercising at an absolute workrate, typically seen with exercise training and displayed in
the High Step group (p<0.05), were not significant in the Low Step group. This is consistent
with the findings of Kim et al. (98) that first coined the term ‘exercise resistance’, but also
extends this phenomenon to an impairment of short-term training adaptations as well as
measures of postprandial metabolism. These data indicate that, even in individuals who
participate in the early stages of regular exercise training, background inactivity results in
elevated PPL and impaired cardiometabolic adaptations to short term training.
In Study 2, it was demonstrated that reducing daily steps to 4,759 or below is
associated with a decreased ability of acute exercise to lower PPL, compared to a trial
taking 8,480 steps/day. Responses to a high fat meal on the morning following a 1-h run at
64% of VO2max were similar in groups taking 2,675 (LOW) and 4,759 steps/day (LIM).
However, following an identical exercise bout, participants taking 8,480 steps/day
(Normal) significantly reduced their plasma triglyceride incremental area under the curve
compared to LOW and LIM trials (p<0.05). This indicates that the development of the

67
aforementioned ‘exercise resistance’ occurs when steps/day drop below approximately
5,000. These findings suggest that some beneficial effects of acute exercise can be
diminished if individuals experience regular periods of inactivity leading to reduced daily
steps (i.e. below approximately 5,000 steps/day).
Taken together, these studies suggest deleterious effects of inactivity on an
individual’s ability to properly respond in terms of cardiometabolic adaptations (i.e; PPL,
HR, lactic acid, fat oxidation and muscle oxygenation) to an exercise stimulus provided by
1-h of running or 9 days of chronic training. The Low Step treatment group in study 1 took
approximately 5,000 steps/day which is similar to the limited step trial (LIM) in study 2.
This is useful in comparing the effects of reduced step counts in both studies. Taking
~5,000 steps/day seems to have rendered the exercise training ineffective in lowering PPL
in study 1 in that postprandial responses following training were not significantly different
from baseline responses. Additionally, data from study 2 shows acute exercise while taking
~5,000 steps/day or less (i.e. LIM & LOW trials) is less effective at lowering PPL
compared to taking ~8,400 steps/day. Jointly the findings in this dissertation suggest that
< 5,000 steps/day is insufficient to realize the protective effects of acute or short term
exercise training, at least in terms of PPL and fat oxidation (Table 9). The exercise
resistance phenomenon first postulated by Kim (1) seems to manifest itself when taking
less than 5,000 steps/day, regardless if the exercise is of moderate or vigorous intensity and
persists even with regular, short-term training. It should be realized however, that although
taking less than 5,000 steps/day appear ineffective in preventing exercise resistance, and
taking approximately 8,500 steps/day is effective, it is still unclear how activity levels
between these step counts affects the development of this phenomenon.
These findings suggest that reductions in daily step counts are associated with
impaired cardio-metabolic responses (i.e.; postprandial lipemia and fat oxidation) to both
68
acute and short term exercise training. These studies have some noteworthy strengths in
that they add pertinent information to the literature especially surrounding the newfound
“exercise resistance” phenomenon. To the authors knowledge this is the first study to
consider the interplay of physical inactivity and short-term training. Moreover, the second
study provides important information on hoe to characterize the onset of this new
phenomenon. Lastly, these findings suggest that even young, healthy individuals are
susceptible to negative cardio-metabolic effects of physical inactivity that cannot be easily
overcome with exercise.
Trial
Study 1 (Training) HIGH STEP LOW STEP
Steps per Day 16,048 4,767*
Study 2 (Acute) NORMAL LIMITED LOW
Steps per Day 8,431 4,759 * 2,744*
Table 9. Summary of findings (*) signifies impaired metabolism

69
Chapter VII: Review of Literature
Introduction
The perils of physical inactivity have been generally appreciated for several
millennia. Susruta, an Indian physician in the 7th century BC, may have been the first
physician to prescribe daily activity. He believed daily physical activity was necessary to
ward-off disease, even stating “diseases fly from the presence” of such individuals
participating in habitual physical activity (177). Not long after in the 5th century BC,
Hippocrates is quoted as saying “walking is man’s best medicine” and, “all parts of the
body… if they are unused and left idle, become liable to disease…” (106). Moreover, the
effects of physical inactivity have been observed and studied systematically since the
1950’s. The seminal work by Morris et al. (133) found an increased rate of coronary
artery disease in London bus drivers compared with their more active counterparts on the
busses, the conductors. These findings suggest that individuals who are chronically
inactive can suffer serious detriments to health as a result. Since then, numerous studies
have been conducted to evaluate the deleterious effects of physical inactivity. However,
even with the recent interest and the emergence of the field of inactivity physiology (63),
it seems we have only scratched the surface in understanding the harmful effects of
inactivity and its increasing prevalence in many modern cultures.
In modern culture we are continually engineering activity out of our daily lives.
As such, periods of prolonged inactivity have become routine in the lives of many. This
is especially prevalent in well-developed countries in which technological advances allow

70
for increased automation and vehicular transportation (217). The populations of such
societies also rarely go more than 8 hours without eating. Consequently, these individuals
spend most of their time in a non-fasting or postprandial state. As a consequence of an
increasingly sedentary lifestyle, periods of prolonged sitting and the postprandial state
routinely coincide resulting in chronically elevated levels of plasma triglyceride and
glucose. The consequences of prolonged sitting have begun to be recognized by some
countries who have already made a conscious effort to advise against prolonged bouts of
sitting (217). In the postprandial state, triglyceride levels in the plasma can remain
elevated for up to 10 hours, typically peaking 3 - 6 hours after a meal rich in fat (152).
The magnitude and duration of this elevation is influenced by prior physical activity (52,
120, 221), diet (174), and genetics (173, 204). As demonstrated in recent epidemiological
studies (5, 142), non-fasting plasma triglyceride levels, i.e., post-prandial lipemia (PPL),
better predicts cardiovascular events than fasting plasma triglyceride levels and are
known to be associated with diseases, including metabolic syndrome, type 2 diabetes, and
atherosclerosis.
In several other recent epidemiological studies, sitting time has been strongly
linked with the risk of obesity, metabolic disorders including type 2 diabetes mellitus and
especially with cardiovascular disease and death (16, 198). Exercise as an intervention
has been studied with promising results (76, 120, 222). However, recent epidemiological
studies have reported that the risks from prolonged sitting appears “independent” of the
volume of exercise being performed (16, 150, 198). This means individuals who meet the
recommended guidelines (AHA or ACSM) for physical activity of 150 min/week of

71
moderate intensity exercise appear to still be at risk for developing cardiovascular disease
if they have a lifestyle routinely incorporating prolonged periods of sitting (>10-12 h/day)
(39). In 2016, the term ‘exercise resistance’ was first introduced to describe a
phenomenon in which individuals who experience prolonged periods of inactivity seem
unable to realize some of classic metabolic benefits associated with an acute bout of
aerobic exercise (98).
Postprandial Metabolism and Health
In order to best analyze the effects of physical inactivity on health, it is necessary
to establish a measure that can serve as a proxy for cardiometabolic health and is
sensitive to the changes associated with inactivity. The method that seems to be the most
promising is the measurement of blood lipids, in both the fasted and non-fasted state.
Much is understood about the dangers linked to elevated fasting plasma triglyceride
levels (79, 121). However, recent epidemiological and scientific evidence suggests
postprandial lipemia (PPL) is a stronger indicator of CVD risk than is fasting plasma
triglyceride level (5, 87, 88, 142).
Chronic dyslipidemia and the oft-resultant atherosclerosis are two of the principal
contributors to CVD (87, 207, 223, 224). Within first-world countries, where food is
plentiful, a significant amount of time is spent in the postprandial state, leading to longer
periods of elevated triglycerides. These increased PPL levels are associated with reduced
high-density lipoprotein production and increased low-density lipoprotein cholesterol
72
production (44), impaired endothelial function (199), and increased atherosclerotic
plaque formation (223).
There are two major sources of circulating triglycerides. These can be produced
from an endogenous pathway within the liver (e.g. lipogenesis) or can be consumed
through exogenous dietary sources (73). Dietary consumption can lead to two different
ultimate destinations of exogenous lipids, depending upon their type. Short-to-medium
chain fatty acids are transported primarily to the liver, then successively to their final
destination, often being skeletal muscle, undergoing beta oxidation to aid in successfully
supplying the energy needs of the tissue. However, triglycerides composed of long chain
fatty acids, are carried predominantly via chylomicrons and/or very low-density
lipoproteins (VLDL), and transported to adipose and muscle tissues (144). The main
transporter of endogenous lipid production are VLDLs. Conversely, for ingested
triglycerides, chylomicrons are the primary vehicle (56, 140). Chylomicrons are formed
in the endoplasmic reticulum of small intestine enterocytes and are secreted into the
lymphatic system. Subsequently chylomicrons travel through the lyphatic system and
enter systemic circulation via vena cava (86). In the postprandial state, the formation of
chylomicrons may compete with lipoproteins to interact with lipoprotein lipase (LPL), an
enzyme located on the luminal side of vascular endothelial cells in adipose, skeletal
muscle, and myocardial tissue (18, 32, 201). LPL hydrolyzes the triglycerides from both
VLDL and chylomicron sources. However, after a meal as the chylomicrons
concentration increases, VLDL production continues as it is modified by liver
concentrations of FFAs. The result is a level of circulating triglycerides and cholesterols

73
that is elevated significantly (223). As chylomicrons and VLDLs both utilize LPL as an
uptake mechanism, postprandial saturation of LPL can occur as the two molecules
compete for binding sites (32, 201). Therefore, this increase in circulating
cholesterol/triglycerides and concomitant saturation of LPL allows for the opportunity for
chylomicron and VLDL byproducts to build up in the subendothelial space. During
instances where dietary consumption leads to an increase in PPL. Furthermore, residual
fatty acids from chylomicron hydrolysis may be re-esterified in the liver as VLDL and
eventually used to synthesize various byproducts, including low-density lipoproteins
(LDL) (55, 87). It is this production and accumulation of LDL, and other VLDL
remnants which is the genesis of atherosclerosis (59, 223, 224).
Atherosclerosis has numerous sources that contribute to its development including
endothelial dysfunction (3, 33) and abnormal blood lipids (134, 142, 223). The most
common explanation for the onset of atherosclerotic formation begins with an increased
accumulation of lipoprotein behind the endothelial wall of the vasculature (117, 138,
209). Here these lipoproteins undergo modification through oxidation, lipolysis,
proteolysis, and aggregation. Eventually fostering the formation of foam cells via
macrophage infiltration/conversion and to inflammation of the surrounding tissue (117,
172). The resulting damage is eventually repaired but leaves behind underlying tissue
which may begin to form a necrotic core and exterior calcification. This tissue is then
vulnerable to later injury which may cause release of the interior contents of the lesion
and can lead to thrombosis (117, 171). This thrombosis is a likely cause of cardiovascular
events such as stroke or myocardial infarction.

74
Prevalence of Inactivity in Modern Culture
The magnitude and consequences of physical inactivity in modern times have led
to it being appropriately termed a global pandemic (105). In order to understand the
prevalence of inactivity in a modern lifestyle, it is important first to define the terms by
which one would be considered inactive. In 1995 the Centers for Disease Control and
Prevention (CDC) and American College of Sports Medicine (ACSM) published
minimum recommendations prescribing 30 minutes of moderate intensity exercise on
most, preferably all, days of the week (149). These guidelines were recently updated with
additional support for beneficial effects of physical activity and the removal of a 10-
minute minimum duration for activity (157). This level of physical activity equates to
about two miles of brisk walking, accumulated throughout the waking hours of an
individual’s day. Physical inactivity is generally defined as failing to meet these
requirements. Specifically, failure to achieve 150 minutes of weekly moderate to
vigorous physical activity (MVPA), 75 min of vigorous physical activity, or a combined
equivalent achieving 600 metabolic equivalent (MET)-minutes per week (208, 213, 214).
Based on accelerometer data from the National Health and Nutrition Examination
Survey, the prevalence of meeting these guidelines could be as low as 5% in the United
States (182). Other more hopeful, yet still concerning estimates put this number at about
31% meeting guidelines (60).

75
It is necessary to understand why this number is so low. Much of the increase in
inactivity can be linked to modernization of the culture and the technology associated
with said modernization. As societies continue to advance, technology must improve in
order that the time spent in menial tasks can be better invested in more meaningful
pursuits which spur further progress. However, it seems rather than current technology
providing time savings that can be reinvested in other activities, it is instead being
replaced by inactive behaviors causing a dramatic rise in daily inactivity.
For example, estimates of daily step numbers indicate the introduction of powered
machinery has causes a decrease of 50-70% of daily activity (19, 20, 143). Even in
modern times populations, such as some Amish communities, who limit or completely
abstain from the use of many modern technological conveniences take four times more
daily steps as those who do not (9, 10). This is bolstered by observations like the 2017
American Time Use Survey which revealed just over 5% of leisure time is spent in
“exercise, sports, and recreation” (196). It seems that the lives of many are dominated by
sedentary actives such as prolonged sitting. Some have suggested it is possible, if not
likely, that 95-97% of an individual’s waking hours could be spent in sedentary activities
(72, 205). Sedentary activities are defined as activities that involve energy expenditure at
the level of 1.0-1.5 metabolic equivalent units (METs)(148). More tangibly, sedentary
behavior includes activities that do not increase energy expenditure markedly above the
resting level. Such as sleeping, sitting, lying down, and watching television. While
exercise is prescribed broadly, a 30-minute daily session still allows for upwards of 16
hours of inactivity. Further, evidence suggests that there may be no difference in sitting

76
time between those who achieve recommended levels of physical activity and those who
do not (30).
Engagement in light-intensity activity may be the best way to reduce sedentary
behaviors. One of the strongest negative correlations (r=-0.98)(71) in relation to
sedentary time is time in light physical activity, such as walking, which involves energy
expenditure at the level of 1.6-2.9 METs. (65, 139, 148). While the energy expenditure
may only be slightly above that of sitting, these activities are the predominant
determinant of overall daily energy expenditure - even in those who exercise regularly
(34). Unfortunately, modern cultures fall short on this score as well. Tudor-Locke et al.
(194) provides data suggesting 17% of US adults take fewer than 2,500 steps per day.
Further about 37% take fewer than 5,000 steps, with anything under this level being
considered by most to be indicative of a very inactive or sedentary lifestyle (163, 191,
194). A decrease of 2,500 steps/day is associated with increases in sitting time on the
order of 37-45 mins/day (191) or as much as 75 minutes (128).
Another area that has seen a dramatic rise in inactivity is occupational time. (26,
101). Nearly half of occupations in the 1960s could be characterized as requiring
moderate activity. That number had dropped to less than 20% by 2008 and this trend is
expected to continue (26). These authors concluded that the decrease from occupational
energy expenditure over 4 decades could almost entirely explain the increase in weight
seen in the NHANES study over the same period (26). This trend effects even those who
are most active. Data from one study (206), more clearly illustrates this alarming point. In
this study, marathon and half marathon participants who, by the nature of their

77
recreational choices, are presumably very active were found to have daily sitting times
roughly equivalent to those found in elderly community-dwelling populations during the
work week (90, 206).
Deleterious Effects of Inactivity
The prevalence of inactivity is extremely concerning, especially given the effects
on the health of millions. While the health hazards do not command the same attention
from governments and health organizations, the deleterious effects of inactivity are
similar to, if not greater than, those seen with smoking and obesity (112). The impact of
these on an individual health can be more hazardous but, the prevalence of inactivity is
much higher than either smoking or obesity, leading to an effect on the population that is
no doubt more severe. In 2009, physical inactivity was officially recognized as the fourth
independent risk factor for non-communicable diseases and accounted for more than 5
million preventable deaths per year (112, 213).
It is estimated that 20% of all CVD and 10% of strokes occur due to physical
inactivity (35) and over 30% of ischemic heart diseases (105). According to data
published in The Lancet, inactivity is a causal factor in 9% of premature mortality (112).
Further, a reduction in the prevalence of inactivity by just 25% worldwide would prevent
over 1.3 million deaths each year (112). Well-reasoned estimates contend that if every
person in the United States were to meet physical activity guidelines nationwide, life
expectancy would increase by at least 0.68 years on global life expectancy (112). This

78
number may seem low, as discussed by the authors, but when viewed in the proper light it
is actually substantial. That is, those who are already sufficiently active would see no
increase in life expectancy, therefore inactive individuals under this estimate could see an
increase of four or more years in life expectancy.
One of the starkest examples illustrating the potency of inactivity to cause
deleterious health outcomes is the classic Dallas Bed Rest Study. In this study, trained
participants underwent 20 days of bed rest. This intervention induced reductions of over
25% in VO2max, cardiac output, and stroke volume and an 11% decline in total heart
volume (162). In a follow-up study, McGuire et al. found that these decrements were
greater than the decline in these variable resulting from 30 years of aging (125). Given
the inverse relationship between cardiorespiratory fitness and all-cause mortality (103) it
is clear that inactivity, at least with respect to this level of inactivity, is particularly
unhealthy.
It is important to understand why these concerns are especially pertinent to first
world countries like the US in which heart disease is the number one cause of death
(102). CVD and premature mortality seem to be strongly linked and show a direct dose
response relationship to physical inactivity (39, 104). Therefore, several other models of
inactivity have been employed in studying the deleterious effects that lead to these health
outcomes. Dunstan et al (2004) observed that, when comparing TV time, those who
spent the most time watching television were more likely to have diabetes. Additionally,
when comparing those with the most TV time to group with the least reported time,

79
women were more likely to have compromised glucose tolerance. These results held even
after adjusting for total time in physical activity as well as other covariates (37). Another
analysis of prospective data (84), found a significant trend for increasing obesity and
Type II diabetes risk across categories of increasing TV viewing time. Again, this trend
remained significant after adjusting for covariates including a measure of exercise
participation. Katzmarzyk, et al. (93) provided data from a prospective study of physical
activity, sitting time and mortality. These data revealed a significant dose-response
relationship between sitting time and both all-cause and cardiovascular disease mortality.
Intriguingly, When participants were stratified by activity this dose-response relationship
was slightly attenuated, but persisted even among those meeting PA guidelines (93)
Due to these and other similar revelations, a new field of inactivity physiology was born.
The main contention of this field is that inactivity is harmful in that it not only impacts
typical exercise induced health benefits but prompt a set of completely divergent health
implications that arise not from the lack of exercise but from the effects of inactivity (64,
147).
Exercise and Postprandial Metabolism
Physical inactivity has been recognized as a major independent risk factor in the
development of CVD (28). Thus, it stands to reason that one remedy for the rise of CVD
in modern culture would be engaging in regular exercise. Exercise is universally
recognized to decrease the risk of a variety of chronic diseases and metabolic disorders

80
(154). Exercise training has been shown to reduce risk of atherosclerotic plaque
formation associated with excessive blood lipid concentrations (43),which leads to lower
cardiovascular disease (CVD) risk in individuals who are physically active compared to
inactive individuals (14). More specifically, a single bout of exercise can have impact on
PPL by affecting circulating triglyceride levels following a meal (46, 76, 120, 168, 222).
Studies using an intravenous lipid tolerance test indicate that the protective effect of an
intense bout of exercise is attributed to accelerated TG clearance from the circulation
(165)
This effect of exercise is fairly robust. Prior exercise attenuates PPL when a meal
is given several hours after exercise (i.e.12 h) regardless of whether the meal is of
moderate or high fat (85), or exercise is of low, moderate, or high intensity (129, 183,
186) and even in response to resistance exercise (186, 219). There are several variables
that can influence the exerted effects of exercise such as timing of exercise, intensity, and
energy balance as well as the composition of the test meal.
Timing of the exercise seems to be an important factor in assessing this effect. It
is important to understand when a bout of exercise begins to exert a sizable effect on
postprandial metabolism and when that effect subsides. Once these are correctly
understood, it becomes easier to sustain healthy plasma triglyceride levels and ward off
atherosclerosis and associated CVD.
It seems that the delayed effect (>12h) of exercise on PPL is more robust than the
acute effect (222). When test meals are given immediately following exercise or closely
there after (<4h) some mixed results have been reported (124). During this time many

81
factors can confound the effect of exercise such as the flux in fasting triglyceride levels
from the resultant increase in lipolysis and subsequent increase in free fatty acid (FFA)
delivery to the liver (175). Some of these studies show discernable difference in PPL in
response to a high-fat meal, but these differences could not be seen if a moderately-fat
test meal was employed (155, 158). The lack of a difference persists in cases where either
moderate or low intensity exercise was undertaken (155, 156). Also during this time,
very-low intensity (25-30% VO2max) and resistance exercise have shown no effect, or
even adverse effects on PPL (23, 92).
Conversely, when a test meal is given 12-16 hours after an exercise bout the
effects are much more ubiquitous on PPL. The effectiveness of exercise is apparent over
a vast range of intensities from 25-90% of maximal oxygen uptake (VO2max), and
durations of exercise ranging 30-120 minutes (52, 76, 120, 130, 168, 183, 222). This is
also true regarding the mode and type of exercise. As previously mentioned, aerobic and
resistance training both show clearly discernable benefits on PPL. High intensity interval
training (HIIT) has also been employed and seems to show an even greater ability to
attenuate PPL (47, 183)
However, this attenuation does not continue indefinitely. Data suggest this effect
of acute exercise is transient in nature and may only continue to show appreciable effects
on PPL for 24-40 hours (76, 124, 187). It seems that while this attenuated PPL response
is still distinct from non-exercising controls up to 42 hours post exercise, (75, 76) but this
difference is no longer apparent after 60 hours (76, 77). Therefore despite evidence that
82
active middle-aged men have lower plasma triglyceride concentrations than their
sedentary counterparts, both fasting (83) and in response to a high-fat meal (164), this
training provides no protective effect after the transient effects of the last bout subsides in
42-60 h. This has been seen in investigations ranging from 1 week of training to 6
months. After one week of training investigators report improved postprandial
metabolism in the absence of any other metabolic changes, suggesting the improvements
are a transient and induced by activity in the final bout of exercise (159). When
participants are asked to abstain from exercise for 60 h prior to measuring PPL, the
difference between active (endurance and sprint/strength trained) and inactive
counterparts is abolished (185). Interventional studies have shown that one month of
aerobic training appears ineffective in positively influencing PPL, when it is measured 2
(53, 169), 2.5 (77), or 9 days (7) after detraining.
Intensity is also an important factor in modulating this PPL response. A bout of
high intensity interval aerobic exercise or resistance exercise may reduce fasting plasma
triglycerides the next day in a similar magnitude and via a similar mechanism as
moderate intensity aerobic exercise of almost twice the energy expenditure (24, 67).
Furthermore, HIIT training has been shown to induce a larger reduction in the
incremental area under the curve (iAUC) response than aerobic (46, 184). Freese et al.
(47) found that an accumulation of 18 minutes of HIIT could induce an attenuation of
PPL similar to continuous aerobic exercise lasting 30 minutes or longer. Further these
authors compared 30 minutes of brisk walking to five, 30 second maximal sprints with 4
minutes of rest and found that only the HIIT sprints caused a reduction in PPL

83
incremental AUC (48). Some contend that this method is flawed in the inability to
accurately account for total energy expenditure because of the anaerobic component of
this type of exercise and subsequent increase post-exercise oxygen consumption (46).
However, when Trombold et al. (183) compared 2 min intervals at 90% of VO2peak to 1
hour of continuous exercise at 50% of VO2peak resulting in the same energy expenditure,
these investigators found the intervals significantly reduced PPL compared to control and
continuous exercise. The results indicated HIIT exercise was better at attenuating PPL, as
the investigators found a significantly reduced triglyceride incremental AUC when
compared to the continuous exercise and non-exercise groups (183). Nevertheless, the
same group produced data indicating that intensities as low as 25% VO2max still
produced significant differences in PPL compared with controls (99). Cumulatively these
data suggest that while a large range of intensities can be employed to combat PPL,
increased intensities do, in fact, result in more effective and potent reductions.
It has been suggested that this most crucial variable in permitting an attenuation
of PPL is not the intensity or duration of exercise but the existence of an energy deficit
resulting from the exercise undertaken (8, 46, 124, 129, 178). Under this premise, Gill
and Hardman (52) investigated energy deficits induced by exercise and reduced caloric
intake. They found caloric restriction produced positive results but the deficit imposed
via exercise was superior at reducing PPL compared with equivalent deficits resulting
from caloric restriction. However, aerobic exercise has been shown to lower plasma
triglyceride concentrations in the absence of concomitant energy deficit (2). Tolfrey et al.

84
(179) found that high intensity cycling can reduce PPL, even when energy expenditure is
replaced. However, a still greater effect existed in a group which remained hypocaloric,
suggesting an interaction.
One prevailing hypothesis suggests that the mechanism by which these exercise-
induced improvements in postprandial metabolism are achieved is via an increase in
lipoprotein lipase (LPL) activity within the active skeletal muscle (46, 124). This is
supported by studies suggesting the exercise-induced attenuation of PPL cannot be
attributed to acute exercise-induced changes in blood flow or energy stores (225).
Skeletal muscle LPL, found on the vascular endothelium, is the main site of triglyceride
removal, and the activity of LPL can be increased through exercise (58, 164, 165). It
seems contractions of the skeletal muscle cause a transient (165), tissue specific (164)
increase in skeletal muscle LPL enzyme activity. This increase in LPL activity, as well as
protein, is a local, delayed response to contractile activity and is independent of
catecholamine and other cardiometabolic responses to exercise (58). The exercise-
induced increase in LPL mRNA levels peaks 4 h after exercise, whereas LPL protein
peaks 8 h after exercise and returns to baseline values within 24 h post-exercise (97, 165).
While exercise has a robust effect on LPL, inactivity may have an even greater effect.
Over 90% of LPL activity typically present in skeletal muscle can be lost by preventing
ambulatory activity, while light activity has been shown to increase LPL activity (15). In
fact, Bey and Hamilton (15) reported that intensities roughly equivalent to casual walking
could maximally activate LPL in slow muscle fibers.
It seems that elevated plasma insulin concentrations can suppress LPL activity

85
(97). Three days of high carbohydrate (CHO) diet results in increased plasma insulin and
55% lower LPL activity (89). Conversely, a low-CHO diet for the same duration results
in an increase in LPL activity (115). This may serve to reconcile some of the spurious
results found in previous research. Even if the same exercise was employed the
carbohydrate content of the test meal could results in divergent responses. To address
this, Trombold et al (184) used a high (83%) and low CHO (12.5%) test meal following
identical exercise regimens. In this study, although both replaced the exercise-induced
calorie deficit, only the group given the low-CHO test meal showed reductions in PPL. It
stands to reason that an exaggerated rise in plasma insulin could cause a subsequent
suppression of LPL activity in response to the high carbohydrate content of the test meal.
Nevertheless, exercise-induced reductions in PPL have also been documented even in the
absence of significant changes in plasma insulin or improvements in insulin sensitivity
(54, 123, 129).
Alterations in Ambulatory Activity
It is well established in the current literature that regular physical activity,
including exercise, is advantageous for those seeking to reduce risk of detrimental health
outcomes (68). Exercise is different from physical activity by its purposive nature (25).
While the dramatic effects of the various types and modes of exercise have dominated the
literature, more recently the effects of changing regular non-exercise physical activity

86
have gained a greater appreciation and considered more frequently in interventional
studies.
Light intensity activity has an inverse linear relationship with a number of cardio-
metabolic markers and the impact of these activities as a biological stimulus contributing
to better health has probably been significantly underestimated (36, 72). Much of this is
attributed to the replacement of unhealthy behaviors with healthy ones. In fact, almost all
variation in sedentary time across the population is related to the extent to which
sedentary time is replaced by light intensity activity (36)
One of the most attractive and practical interventions currently used in
investigations of the effects of physical inactivity is reductions in daily step number. This
is because reductions in daily steps are less extreme than bedrest, spaceflight, and other
models of inactivity. Moreover, using easily accessible pedometers and accelerometers
makes monitoring much less arduous and more replicable. Due to the tangible nature of a
daily step number metric and the ability to employ these interventions under free-living
conditions, the conclusions garnered from these studies are more readily applicable to a
general population. This is also reasonable in view of growing epidemiological evidence
that suggest increased daily walking, which is the largest component of daily physical
activity (113, 114), is associated with decreased risk of cardiovascular events (122).
Conversely, decreased walking has been shown to have a number of adverse health
effects such as insulin resistance (109, 145) and obesity (114).
Several recommendations have been given as to the number of steps individuals
should accrue each day. Many cite a 10,000 step daily goal as a benchmark to improve

87
health, although this seems to be a rather arbitrary number that finds its origins nearly 60
years ago in Japanese health clubs and pedometer promotions (189). Further studies on
this topic have focused on empirically-driven data to craft a daily step goal (119, 188).
Tudor-Locke et al (195) and others (161) have found that, when translating the current
PA guidelines into a standard daily step number, approximately 8,000 steps/day was
consistent with obtaining the recommended 30 minutes/day of MVPA.
While these studies are considered less extreme than studies of extended bed-rest
and the like, they are still quite potent with relatively short interventions exerting sizable
effects. Some authors have found reducing daily step numbers from >10,000 to <2,000
steps/day in participants that VO2max decreased ~7% in just two weeks (108, 109). These
data are underscored by the assertion made by Trappe et al (180) that the decline in
cardiorespiratory fitness from ages 30 to 50 is due almost exclusively to the increase in
physical inactivity. Further, as individuals age daily step counts decrease (190, 192, 215)
even as daily walking makes up a greater portion of an individual’s total physical activity
(182, 193).
Furthermore, reduced ambulatory activity in durations shorter than a week have
been shown to impair insulin sensitivity and elevated glucose responses to oral glucose
tolerance tests (OGTT) (108, 109, 128, 145). By experimentally reducing daily step
number for 1 week from ~10,500 to ~1,500 Olsen et al. (145) reported an increase of
more than 52% in the area under the curve of plasma insulin during an (OGTT) with the
potential to grow to nearly 80% greater, if the reductions were maintained for 2 more
88
weeks (145). This is due to a decrease in insulin sensitivity and increases in insulin and c-
peptide in response to an OGTT within 3 days of reduced ambulatory activity. Due to
these changes, development of type 2 diabetes and metabolic syndrome become more
prevalent in inactive individuals. In an analysis of 2,500 participants Vander Berg et al
(197) found that for each additional hour of sitting or lying during the waking hours odds
of developing type 2 diabetes increased 22% and 39% for development of metabolic
syndrome. Interestingly these elevated odds were independent of participation in high-
intensity physical activity. Much less work has been done to directly investigate the effect
of decreasing daily steps and PPL responses. However, a two-week reduction in steps has
been associated with an increase of 27% in postprandial plasma triglyceride AUC (109,
145). This indicates the effects may be similar to those on glucose metabolism.
Exercise Resistance
Recently an alarming phenomenon of ‘exercise resistance’ has been postulated by
some in response to inactivity (1, 22, 38, 98). Relatively few studies have considered the
effects of inactivity on metabolism in conjunction with acute and chronic exercise. This
type of design is pertinent in a culture where individuals are able to achieve physical
activity guidelines (i.e. a 30-minute brisk walk) and sit for 15 hours or more in the same
day (64, 65). Epidemiologists have begun to recognize an alarming trend, identifying a
subset of those classified as “physically active” are not fully realizing the protective
effect of that activity (146). It seems that physical inactivity may cause the production of
some unknown factors that impair normally healthy physiological stimuli, such as

89
exercise, from occurring or being realized. Or, alternatively, the adverse effects of a
physically inactive lifestyle may be independent of the protective effects normally
associated with exercise (36, 65, 146).
A plausible explanation to this trend arose in 2016 when the term exercise
resistance was coined in a recent paper from Kim et al. (98). In this study it was found
that participants that sat for ~14 hours (<1700 steps) in their waking day did not respond,
by attenuating the 6-hour PPL excursion, the morning after 1-hour of running at 63% of
VO2max,. Yet, participants in a group that were not sitting to such an extent did improve
PPL the morning after the acute exercise. Interestingly, this non-response was observed
in groups of both eucaloric and hypercaloric energy balance (98). While this was a
remarkable observation, the study was not designed to make definitive statements on
‘exercise resistance’, as it did not include a non-exercise control group. In order to
address this, a follow up study by Akins et al. (1) was conducted to test the existence of
this phenomenon. Using a similar, randomized, cross-over design, this study employed
inactivity to slightly lesser extent (~13.5h/day sitting and ~3600 steps/day) but provided
an adequate control in which one of the two trials entailed prolonged sitting without
exercise on the day before the HFTT. Following the 1h of exercise, the participants in
this study showed no significant improvement in PPL, glucose or insulin excursions over
6 hours compared to the non-exercise control group (1). Thus, they appeared resistant to
improving PPL as a results of the 1h of exercise.
Cumulatively, these finding indicate that chronic inactivity abolishes the

90
beneficial effect of acute exercise on reducing PPL and bolstering fat oxidation. These
data show that, in participants who experience prolonged periods of inactivity, an acute
bout of exercise (e.g.; 1h of running) did not improve PPL. Due to this inactivity the body
appears to be resistant to deriving one of the main acute health benefits of exercise; in
this case attenuation of PPL.
In yet another study, Duvivier et al. (38) asked participants to undergo one of
three free living conditions. The participants either sat for 14 hours/day, sat for 13
hours/day with 1-hour exercise bout interjected to replace an hour of sitting, and a
condition with light physical activity that consisted of substituting 6 hours/day of sitting,
with 4 hours of walking, and 2 hours of idly standing. While both light PA and exercise
increased energy expenditure above sitting, neither differed from each other in total
energy expenditure even though the number of steps in the low-PA group was 5 to 6
times higher (38). Interestingly, the 1-hour bout of exercise was not able to improve
resting, fasting plasma triglycerides, cholesterol, or insulin concentration over sitting
alone. Conversely, minimal-PA was able to improve resting, fasting plasma triglycerides
and cholesterol over sitting and insulin concentration compared to the exercise group
(38). Although these results did not administer a HFTT and only reported no significant
effect on fasting levels the morning after exercise, it agrees with but does not prove the
concept of exercise resistance.
Naturally, questions arise as to which is the likely culprit inducing this
phenomenon of ‘exercise resistance’. Could it be there is something inherently harmful
with the seated posture itself or, rather, is it due to a lack of contractile activity within the

91
muscle due to sitting? To answer this several studies have broken up prolonged periods of
sitting with standing and found no discernable reductions of triglyceride iAUC (4, 74).
Still, some doubted that the extent of standing employed in previous studies was
sufficient to induce a significant difference. Crawford et al (31) had participants stand for
12 hours, or more, on the day prior a HFTT. In this study, the standing intervention
group, displayed plasma triglyceride and insulin iAUCs that were no different than a
group who sat for more than 14 hours (31). In another study (211), participants completed
40-sprint bouts of 4 sec on an inertial load ergometer. Participants either completed these
bouts consecutively at the end of 8 hours of sitting, or five sprint bouts at the top of each
hour over the 8 hours of sitting. While sitting time did not differ between groups, this
study showed improved PPL on the following day in the individuals who spread the
sprint bouts throughout the day but not in those who completed these bouts consecutively
in the evening (211). The findings suggest that exercise resistance may arise if exercise is
performed in the evening following a day of inactivity but can be avoided if the same
level of activity is spread throughout the day. Interestingly, because daily inactivity and
exercise were similar between groups, this study suggest the development of exercise
resistance may be avoided with regular contraction spread throughout the waking hours.
Regular contraction may be necessary to maintain healthy function and sensitivity to
healthy stimuli. While the mechanisms are yet to be clearly elucidated, the observations
of Lambernd et al (110) may provide insight as they observed that single muscle fibers
treated with TNF- did not show impaired insulin sensitivity if they were also contracted.
It is possible that physical inactivity causes the production of some factor(s) that impair

92
normally healthy physiological stimuli, such as exercise, from occurring or being
realized. This hypothesis agrees with the observation that people who exercise regularly,
do not realize the decreased risk of cardiovascular disease or death if they also have
lifestyles characterized by chronic inactivity, or that the exercise needs to be extreme in
order to be protective (e.g.; 60-75 min vigorous each day)(39).
Furthermore, available evidence suggests that this ‘exercise resistance’ may not
be an exclusive phenomenon to just postprandial metabolism. Breen et al. (22) found that
reducing daily steps for two weeks, from ~6,000 steps to ~1400 steps, induced an
‘anabolic resistance’. With the use of muscle biopsies, this study was able to show that
the increase in myofibrillar protein synthesis, after consumption of high-grade protein,
was attenuated by 26% in inactive participants compared to baseline, after 2 weeks of
reducing daily step count.
In light of these new and intriguing findings the interpretation of previous studies
might be reconsidered. It is possible that inactivity impairs other healthy adaptations to
normally effective stimuli. While indirectly contested (131), this new evidence may
provide additional insight by which the concept of non-response to acute and chronic
exercise can, at least partly, be further elucidated. If these hypotheses can be generalized,
it may provide an explanation for any study that found a non-response to a physiological
stimulus in that it might be related to participants having a background of too much
inactivity. It is possible this phenomenon may have been present in previous studies but
has gone largely unrecognized due to a lack of evidence suggesting non-exercise activity
may play a role in the hypothesized response. For example, Rogers et al. (159) found 7
93
days of aerobic exercise resulted in a significant improvement in glucose tolerance,
measured as 3-hour area under the curve of plasma glucose excursion, in response to
100g oral glucose tolerance test (OGTT) compared with a non-exercising control. This
improvement occurred in the absence of cardiovascular adaptation and without changes
in body mass or fat content. Thus these authors concluded the changes in glucose
tolerance must be due to persistent effects of the last bout of exercise. These investigators
again studied subjects after 6 months of sedentary, free-living, and found that OGTT after
a single bout of exercise at the same intensity and duration as that was performed in the
previous intervention failed to improve plasma glucose or insulin responses following
acute exercise (159). While this seemed counterintuitive to these authors at the time,
recent evidence, including the emergence of exercise resistance, may shed light on a
possible explanation to results that seemed perplexing by these authors own admission in
1988. It’s possible that the second group of subjects were too inactive to benefit from the
acute bout of exercise.
Possible Mechanisms Inducing Exercise Resistance
Although these previous studies have demonstrated that inactivity, even with
moderate exercise, has deleterious effects on triglyceride and glucose tolerance (1, 38, 98),
none have directly investigated the mechanisms for exercise resistance. Therefore, current
understanding requires speculation. Reduced activity of muscle LPL is perhaps the most
likely explanation for the impaired triglyceride clearance (63). As previously described,
LPL is upregulated post exercise inducing the insertion of additional extra binding sites on

94
the muscle’s capillary endothelium (76, 77, 91, 124). Because of the role of LPL as the
rate-limiting enzyme for removing chylomicrons and VLDL triglyceride from the
circulation (201), hydrolysis of triglycerides from these carriers and subsequent uptake by
the muscle would therefore be delayed (55). With the lack of difference in PPL with or
without exercise found in the previous studies (1, 98), it seems inactivity can impair or
completely abolish the exercise-induced upregulation of LPL. In an animal model, physical
inactivity modeled by hind-limb unloading, significantly reduced the in vitro activity of
muscle lipoprotein lipase, and decreased the amount of heparin-released LPL and may
reduce its activity by up to 90% (15, 220). This difference in activity was seen without
changes in LPL mRNA. This suggests the inhibition of LPL is post-transcriptional.
One possible, post-transcriptional mechanistic explanation for this impairment
could be thioredoxin-interacting protein (TXNIP). It was recently observed that 6-h of
hind-limb immobilization in rats resulted in an increase in TXNIP protein expression and
mRNA and a decrease in insulin-stimulated glucose uptake in the soleus muscle (94). It
was speculated that this was possibly due to endocytosis and subsequent decrease in the
amount of GLUT4 at the surface of the sarcolemma (94). It seems possible a similar
process could affect plasma TG clearance by skeletal muscle via downregulation of LPL
on capillary endothelium, either directly or indirectly through manipulation of GPIHBP1
responsible for binding and tethering LPL to the luminal surface of the capillary (12, 17).
Whether the lack of contractile activity in humans that experience severe reductions in
daily steps causes dramatic increases TXNIP remains to be determined. However, the
previously mentioned increase in TXNIP with immobilization protocols can be

95
eliminated by activation of AMPK via AICAR administration (94). This adds additional
credence to the hypothesis linking accumulation of TXNIP to lack of a precursor that
senses energy turnover and exercise resistance. Interestingly, both TXNIP and LPL
activity are sensitive to changes in contractile activity, even at low intensity such as those
seen during leisurely walking (e.g. 30% VO2max) (15, 63). Furthermore, AMPK
activation has been shown to also upregulate LPL activity in skeletal muscle (116).
Future studies are needed to test the hypothesis that AMPK activation prevents TXNIP
elevation and allows a healthy increase in GLUT4 and LPL to augment the uptake of
glucose and plasma triglyceride into skeletal muscle.
Future Work
While we know that exercise is beneficial for health and wellness, we are just
learning that inactivity is more than the lack of exercise and it seems to be having a
separate impact on health independent of exercise. This is especially true in light of
emerging evidence suggesting that this exercise may not reduce the risk of developing
chronic disease and premature mortality against a background of inactivity.
Future research should expand on the newfound ‘exercise resistance’ hypothesis
and the nature of this phenomenon, determining if it extends beyond the measures of
PPL. It would be increasingly useful for the medical practitioner, exercise scientist, and
public health professionals to understand this and how to counteract it. If inactivity

96
progressively encroaches on adaptations to aerobic exercise in a ‘dose-response’ fashion
or occurs at some threshold, further characterizing this would be invaluable to identify
what minimum level of activity is necessary to fully realize the full and proper responses
to acute and chronic exercise.
Furthermore, while current research is beginning to expound on the inability of
exercise to improve indices of health, much of the work has focused solely on acute bouts
of exercise. It is vital that data be provided to expand on ‘exercise resistance’ and its
presence or absence in response to an accumulated training stimulus. Investigations into
postprandial metabolism have shown great merit and have been shown to be sensitive to
changes induced by inactivity. However, it is also important to investigate if these
adverse responses, including ‘exercise resistance’, extend to other cardiometabolic
responses to exercise training beyond PPL. In doing so, the data provided would provide
substantial evidence which could aid in crafting additional and more tangible guidelines
for health and wellness. The current guidelines are currently limited to generalities such
as “move more, sit less” and “avoid inactivity”. This seems to be a result of suffering
from a lack of quantitative evidence on the effects of inactivity. It is prudent to avoid
development of prescriptive standards without sufficient data to buttress them.
Nevertheless, this only underscores the need for more systematic examination of varying
degrees of inactivity and their effect on markers of health. While these are laudable in
their intent, the lack of definitive, quantitative conclusions on inactivity relegate these
guidelines to subjective interpretation and can cause disparate effects from group to
group, and individual to individual.

97
Lastly, whether it be accumulation of TXNIP or some other co-factor within the
muscle, it is important for future research to elucidate the mechanism by which ‘exercise
resistance’ develops and, again, if it is limited mainly to PPL. A mechanistic
understanding of this phenomenon would be of great benefit to practitioners and scientist
who will be tasked with combatting this as our society continues to grow more inactive.

98
Appendices
APPENDIX A: METHODOLOGICAL TECHNIQUES
Oxygen Consumption
During exercise the participants breathed through a two-way non-rebreathing
valve (Hans Rudolph, Kansas City, MO). Ventilation was measured via an inspiratory
pneumotachometer attached to the two-way valve (Hans Rudolph, Kansas City, MO).
Expired gas samples were taken from a mixing chamber which was directly connected
via capillary tubing to oxygen and carbon dioxide analyzers (Applied Electrochemistry,
Models S-3A/I and CD-3A, respectively). MOXUS metabolic software (Applied
Electrochemistry) was then used to continuously analyze VO2 and VCO2
Near-Infrared Spectroscopy
Near-infrared spectroscopy (NIRS) (OxiplexTS, ISS Oximeter Model 95205,
Champaign, IL) was used to measure deoxygenated hemoglobin [HHb] during exercise in
a thigh muscle (i.e.; vastus lateralis). NIRS analyzes the chromophores of O2Hb and
HHb, which have different optical properties of absorbing near-infrared (wave length:
690 nm, 830 nm). This enables NIRS to measure the absolute concentrations of O2Hb
and HHb in real-time and noninvasively (21, 57, 136).
Before every test, the NIRS was calibrated after about 30 minutes of warm-up.
Figure 12 shows the description of the probe designed for skeletal muscle measurements

99
and this probe was used for this study. The schematic of the near-infrared light
penetrating 2.0 cm, 2.5 cm, 3.0 cm, and 3.5 cm in depth from skin. The acquisition
frequency of 2 Hz was used for this study. NIRS data was continuously monitored and
averaged between minutes 9 and 10 of submaximal exercise tests for data analysis.
Figure 12. Diagram of OxiplexTS probe for measuring deoxygenated hemoglobin in
skeletal muscle during submaximal exercise
Blood Lactate Measurements
Blood lactate concentration was determine using the following procedures and enzymatic
reactions:
Part 1: Supplies, solutions, etc.
Glassware
1. Acupette capillary tubes Qty: 2 per blood sample? 2. Eppendorf 1.5ml tube Qty:((x+3)*2) 3. Polyproylene 12 x 75 mm test tube Qty: (2 per blood sample)
Solutions and Reagents
1. NAD Sigma N-7004
2. LDH Sigma L-3916
3. Hydrazine Sigma H-9507

100
4. Glycine Fisher G-46
5. Lactate Std Sigma 826-10
6. Perchloric Acid Fisher A-229 70%
PCA: to get 8%, take 57.14ml of 70% stock, bring to 500ml with dH20
Glycine-Hydrazine Buffer for 1000ml 0.33M glycine 25.02g 0.27M hydrazine 23.98mL Mix and bring up to 1000mL with dH20, pH to 9.2
Part 2: Sample Preparation
Step 1: Prepare Reagent Cocktail
1. Prepare reagent cocktail for each sample or tube
a. 1ml of glycine-hydrazine buffer
b. 0.83mg of NAD
c. 5uL of LDH, if using 1000ul/ml stock, need 5ul
2. If you have X blood samples:
. ((x+3)*2 +1) of the above cocktail recipe
a. Need the samples, one blank, two standards, all in duplicate, plus one extra so you have
enough buffer for all of your samples
Step 2: Blood deproteinization
1. Protective gloves, glasses, and lab coat should be used when handling blood
2. Exactly 0.5mL of whole blood should be immediately mixed with 1.5 mL 8% PCA in
Eppendorf tube
3. Vortex the tube to fully deproteinize the sample
4. Centrifuge at 4degreesC for at least 15min t 3000RPM
5. Transfer the clear supernatant to an appropriately labeled tube
a. Lactate is stable in supernatant for at least one week at 2-6degrees C, longer if frozen
Step 3: Supernatant/ Reagent Mixture 1. Add 1ml of reagent cocktail (see part 2, step 1 above)
2. Add 50uL of 8% PCA to the Eppendorf 1.5mL tubes for the blank
3. Add 50uL of two lactic acid standards to std1 and std2 Eppendorf 1.5ml tube.
4. Add 50uL of sample supernatant to sample 1 to sample N Eppendorf 1.5mL tubes.
5. Vortex each Eppendorf tube
6. Incubate tubes at 37degrees C for 45 min in shaking water bath at 60RPM
Part 3: Sample Analysis
Step 1: Spectrophotometer and Calculations
1. Warm the spectrophotometer for 30 min, read the sample at 340nM
a. Instrument: Spectrophotometer Beckmann DU-600
b. Method: A:\LAT

101
c. Read average time: 0.5s
d. Fixed wavelength: 340nM
e. Factor 10.13
2. Calculations
Lactate standard 40mg/100ml, 400mg/L, or 4.44mM (Sigma 826-10, now Trinity Biotech 82610)
i.Low 10mg/100mL (1.11mM)
ii.High 20mg/100mL (2.22mM)
a. Abs/E.C. = Abs/6.22
b. 1.05/0.05 = cuvette dilution (0.05mL blood in 1mL reagent cocktail)
c. Standard concentration = Abs/6.22 x cuvette dilution = Abs x 3.38
d. 3/1 = blood dilution (0.5mL blood in 1.5mL of 8% PCA)
e. Sample concentration = (Abs/6.22) x 1.05/0.05 x 3/1 = Abs x 10.13mM
f. [La] = abs x 10.13mM
Plasma Glucose Measurement
Plasma glucose we measured via spectrophotometry using commercially available
kits (Pointe Scientific, Inc. Canton, USA). The plasma samples were removed from freezer
(-80°C) and thawed. 5 μL of plasma sample is added to 500 μL of glucose hexokinase
reagent and then incubated at room temperature for 3 minutes, following gentle mixing via
a benchtop votex machine. Glucose is phosphorylated with ATP to produce glucose 6-
phosphate (G-6-P) in the reaction catalyzed by hexokinase (HK). The glucose 6-phosphate
is then oxidized via reduction of NAD to NADH in the reaction catalyzed by glucose 6-
phosphate dehydrogenase (G6PDH). The absorbance of NADH formed was measured at
340 nm using a via spectrophotometry (Cary Eclipse Florescence Spectrophotometer,
Agilent Technologies, Santa Clara, California). The concentration of NADH is directly
proportional to the concentration (mg•dL-1) of glucose in the sample.
Plasma Triglyceride Measurement
Plasma triglyceride was measured via spectrophotometry using a commercially
available kit (Pointe Scientific, Inc., Canton, USA). Samples were removed from freezer

102
(-80°C) and thawed. 3.5 μL of plasma is then pipetted off and added to 350 μL of pre-
warmed (37°C) triglyceride reagent. These samples are and incubated for 30 minutes on
an oscillating tray in a warm (37°C) oven. The reagent hydrolyzes triglycerides in the
sample via lipase and produces glycerol and free fatty acids. Glycerol is then
phosphorylated by ATP to glycerol 1- phosphate and ADP through a reaction catalyzed
by glycerol kinase (GK). The glycerol 1-phosphate is then oxidized by glycerol
phosphate oxidase (GPO) to yield hydrogen peroxide. The condensation of hydrogen
peroxide with 4-chlorophenol and 4- aminophenazone (4-AA) in the presence of
peroxidase (POD) produces a red colored quinonimine dye. The intensity of the colored
complex formed is directly proportional to the triglycerides concentration of the sample.
The plate is read at 500 nm using a microplate reader (Tecan Infinite 200 PRO, Tecan
Group Ltd., Männedorf, Switzerland).

103
APPENDIX B: RESEARCH CONSENT FORMS
Consent for Participation in Research
Title:
The Effect of Prolonged Sitting on Metabolic and Cardiovascular Responses to Short
Term Exercise Training
Introduction
The purpose of this form is to provide you information that may affect your decision as to
whether or not to participate in this research study. The person performing the research
will answer any of your questions. Read the information below and ask any questions
you might have before deciding whether or not to take part. If you decide to be involved
in this study, this form will be used to record your consent.
Purpose of the Study
The purpose of this study is to investigate the effect of daily sitting time on plasma
triglycerides, artery function and other training adaptations resulting from 1.5 weeks of
intense cycle training.
What will you be asked to do?
Before you can be admitted to the study, you will be given brief preliminary tests. This
will include filling out a brief Health Research Questionnaire, and taking measurements
of your height and weight. Only if you are apparently healthy and at low risk for
cardiovascular disease will you be invited to participate in this study. Prior to your
enrollment in the study, your peak oxygen uptake (VO2peak) will be determined while
exercising on a cycle ergometer (lab exercise bike) and also your heart rate during
submaximal cycling will be determined.
Participation will span seventeen days, with periodic visits to the Human Performance
Laboratory (HPL). You will randomly assigned to one of two groups:
Low Sitting Group: Metabolic and cardiovascular responses to exercise program and low
sitting lifestyle (sitting <5h/d, >15,000 steps/d) outside of exercise.
High Sitting Group: Metabolic and cardiovascular responses to exercise program and
high sitting lifestyle (sitting >11h/d, <2,500 steps/d) outside of exercise.
Step-by-Step Protocol:
Pre-Intervention Phase (Week 1)
Day 1: High Fat Tolerance Test (HFTT) and Flow Mediated Dilation 1. Arrival at the Human Performance Laboratory (HPL), informed consent, health history
questionnaires, body mass and height.
2. Flow mediated dilation measurement.
3. Catheter insertion and fasting blood collection.
4. High fat shake consumption
5. Postprandial blood sampling hourly for 6 h (6 additional samples).
6. Expired gas collection for 20 minutes at baseline and 1, 3, 5 h after high fat shake intake.
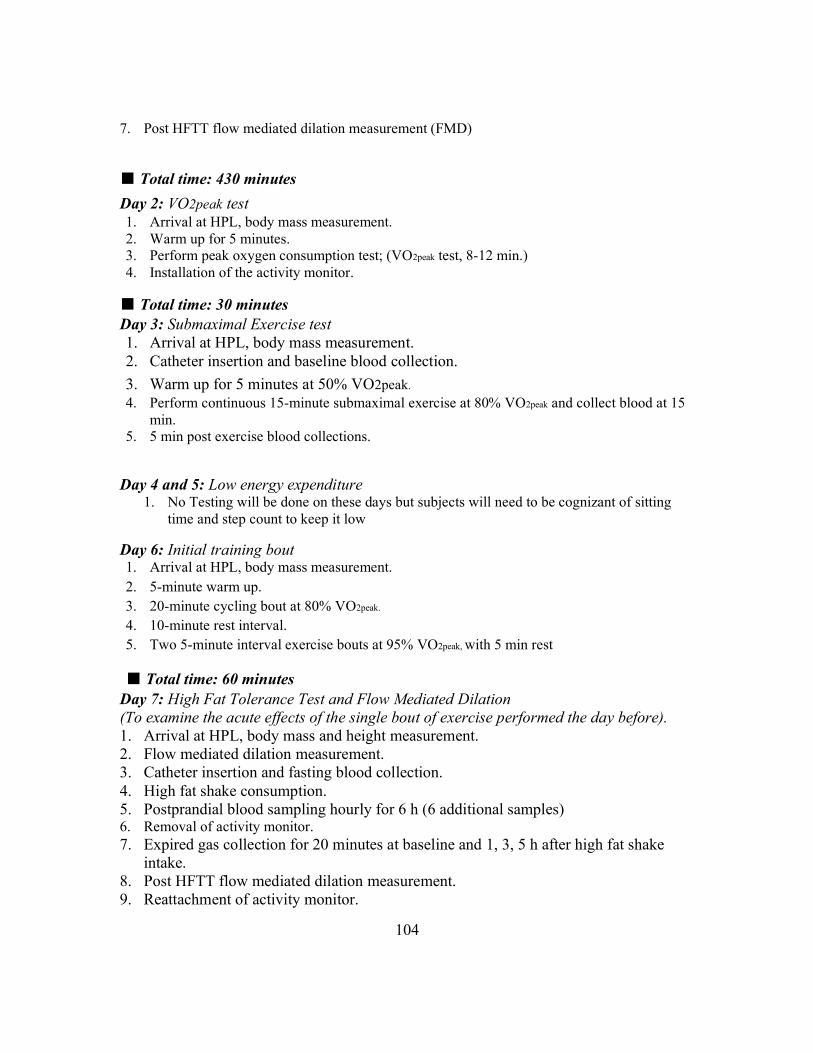
104
7. Post HFTT flow mediated dilation measurement (FMD)
■ Total time: 430 minutes
Day 2: VO2peak test 1. Arrival at HPL, body mass measurement.
2. Warm up for 5 minutes.
3. Perform peak oxygen consumption test; (VO2peak test, 8-12 min.)
4. Installation of the activity monitor.
■ Total time: 30 minutes
Day 3: Submaximal Exercise test
1. Arrival at HPL, body mass measurement.
2. Catheter insertion and baseline blood collection.
3. Warm up for 5 minutes at 50% VO2peak.
4. Perform continuous 15-minute submaximal exercise at 80% VO2peak and collect blood at 15
min.
5. 5 min post exercise blood collections.
Day 4 and 5: Low energy expenditure 1. No Testing will be done on these days but subjects will need to be cognizant of sitting
time and step count to keep it low
Day 6: Initial training bout 1. Arrival at HPL, body mass measurement.
2. 5-minute warm up.
3. 20-minute cycling bout at 80% VO2peak.
4. 10-minute rest interval.
5. Two 5-minute interval exercise bouts at 95% VO2peak, with 5 min rest
■ Total time: 60 minutes
Day 7: High Fat Tolerance Test and Flow Mediated Dilation
(To examine the acute effects of the single bout of exercise performed the day before).
1. Arrival at HPL, body mass and height measurement.
2. Flow mediated dilation measurement.
3. Catheter insertion and fasting blood collection.
4. High fat shake consumption.
5. Postprandial blood sampling hourly for 6 h (6 additional samples) 6. Removal of activity monitor.
7. Expired gas collection for 20 minutes at baseline and 1, 3, 5 h after high fat shake
intake.
8. Post HFTT flow mediated dilation measurement.
9. Reattachment of activity monitor.

105
■ Total time: 420 minutes
Training Phase (Week 2)
Day 1, 3 , 5 & 7: Training Days 1. Arrival at HPL, body mass measurement.
2. 5-minute warm up.
3. 20-minute cycling bout at 80% VO2peak.
4. 10-minute rest interval.
5. Two 5-minute interval exercise bouts at 95% VO2peak.
■ Total time: 240 minutes (60 min each of 4 days)
Post-Intervention Phase (Week 3)
Day 1: High Fat Tolerance Test and Flow Mediated Dilation 1. Arrival at HPL, body mass
2. Flow mediated dilation measurement.
3. Catheter insertion and fasting blood collection.
4. High fat shake consumption.
5. Postprandial blood sampling hourly for 6 h (6 additional samples).
6. Removal of activity monitor.
7. Expired gas collection for 20 minutes at baseline and 1, 3, 5 h after high fat shake intake.
8. Post HFTT flow mediated dilation measurement.
■ Total time: 420 minutes
Day 2: Post-training submaximal exercise test
1. Arrival at HPL, body mass measurement.
2. Catheter insertion and baseline blood collection. 3. Warm up for 5 minutes.
4. Perform continuous 15-minute submaximal exercise at 80% VO2peak (of pretaining VO2peak)
5. Post exercise blood collections.
■ Total time: 40 minutes
Day 3: Post-training VO2peak test. 1. Arrival at the HPL, body mass..
2. Warm up for 5 minutes.
3. Perform continuous peak oxygen consumption test; (VO2peak test, 8-12 min.)
■ Total time: 40 minutes
Total time per subject for both trials is approximately 28h ( 1,680 minutes) over 17
days.
What are the risks involved in this study?
None of the above procedures are expected to be unduly painful or unsafe in healthy
individuals. Maximal and submaximal cycling tests as well as the 30-minute training

106
sessions will all be performed in comfortable environmental conditions (e.g. 20 - 25 º C
and relative humidity of ~ 50%). During VO2peak testing, the last 2-4 minutes of the test
may cause a feeling of fatigue and heavy breathing similar to performing ‘high intensity
interval training’. This feeling of fatigue generally subsides soon after completion (e.g.
within 2-10 minutes). However, with all aerobic exercise, there is a risk of cardiovascular
events. The risk of any sort of cardiovascular complication in apparently healthy (no
documented CV disease) individuals is very low with no complications in 380,000 tests.
Furthermore, in over 35 years involving several thousand exercise sessions, no subject in
the Human Performance Lab has experienced any cardiac event. During each trial, an
AED will be present and a CPR certified test administrator will be present. There is a
small risk of muscular injury or muscular soreness within 24- to 48-hours post-session.
To reduce these risks, a brief warm-up period will be performed.
Blood samples will be drawn during each HFTT and submaximal exercise visit via a
venous catheter in the forearm or antecubital vein. A certified phlebotomist will insert all
catheters. Minor discomfort may occur during the insertion of the catheter. The
discomfort associated with the insertion of the catheter is similar to a venipuncture. Risks
associated with placement of the catheter include bleeding, pain, swelling, bruising,
infection, and thrombophlebitis. Each blood draw will be approximately 6 mL of blood or
the equivalent of 162 mL for the entire experiment. This amount of blood is
approximately 11 tablespoons, and less than 4% of total blood volume. After analysis, if
subjects are found to have abnormally high fasting or post-prandial triglyceride levels,
they will be alerted of this and advised to follow-up with their primary care physician.
The activity monitor will be placed on your leg the day before study participation
commences. Participants may experience a low level annoyance. The activity monitor
will be detached for 30-60 min to load data to a computer. Subjects will carry a
pedometer attached to their waist for a week before the initiation of the first trial for the
estimation of an average daily steps and throughout the trials. It will not give participants
any discomfort.
During the tests, participants may stop performing the task at any time and for any reason
if he or she feels the need to do so. If participants wish to discuss the information above
or any other risks participants may experience, participants may ask questions now or call
the Principal Investigators.
What are the possible benefits of this study?
You will receive no direct benefit from participating in this study; however, each subject
completing the study will be provided with a graphic and verbal description and
explanation on their peak aerobic capacity, heart rate, blood pressure and metabolic
responses both in fasted and non-fasting states in response to different prior physical
activity/inactivity status.
Do you have to participate?
No, your participation is voluntary. You may decide not to participate at all or, if you
start the study, you may withdraw at any time. Withdrawal or refusing to participate will
107
not affect your relationship with The University of Texas at Austin (University) in
anyway.
If you would like to participate please fully read, sign, and return this form to the
principal investigator of this study (Heath Burton). You will receive a copy of this form
for your personal records.
Will there be any compensation?
You will not receive any type of payment participating in this study.
What if you are injured because of the study?
1. The University has no program or plan to provide treatment for research related
injury or payment in the event of a medical problem. In the event of a research
related injury, please contact the principal investigator.
2. The University has no program or plan for continuing medical care and/or
hospitalization for research-related injuries or for financial compensation.
3. If injuries occur as a result of study activity, eligible University students may be
treated at the usual level of care with the usual cost for services at the Student
Health Center, but the University has no program or plans to provide payment in
the event of a medical problem.
How will your privacy and confidentiality be protected if you participate in this
research study?
Each subject will be assigned a unique Subject ID code. This informed consent form and
the Health History Questionnaire are the only places where any personal identifying
information will be recorded. These forms will be stored in a locked file cabinet. In all
other cases, your data will only be identifiable by your unique code. Only the director of
the laboratory (Dr. Coyle) will have access to a master list that will link your identity to
your code.
Because you will be participating in this study and may do so along with other subjects in a
small group, we will ask that you do not disclose names of participants in your group or
any information that was discussed with other group members outside of the experimental
session.
If it becomes necessary for the Institutional Review Board to review the study records,
information that can be linked to you will be protected to the extent permitted by law.
Your research records will not be released without your consent unless required by law or
a court order. The data resulting from your participation may be made available to other
researchers in the future for research purposes not detailed within this consent form. In
these cases, the data will contain no identifying information that could associate it with
you, or with your participation in any study.
If you choose to participate in this study, you may be photographed or video recorded.
Any photographs or video recordings will be stored securely and only the research team

108
will have access to the recordings. Recordings will be kept for 3 years after the research
experiment has been completed and then erased.
Whom to contact with questions about the study?
Prior, during or after your participation you can contact the researcher Heath Burton at
(864)-940-4103 or send an email to [email protected] for any questions or if you
feel that you have been harmed.
This study has been reviewed and approved by The University Institutional Review
Board and the study number is 2017-07-0074
Whom to contact with questions concerning your rights as a research participant?
For questions about your rights or any dissatisfaction with any part of this study, you can
contact, anonymously if you wish, the Institutional Review Board by phone at (512) 471-
8871 or email at [email protected].
Participation
If you agree to participate please sign and return this form to a member of the
research team.
Signature
You have been informed about this study’s purpose, procedures, possible benefits and
risks, and you have received a copy of this form. You have been given the opportunity
to ask questions before you sign, and you have been told that you can ask other
questions at any time. You voluntarily agree to participate in this study. By signing this
form, you are not waiving any of your legal rights.
Photography and video recording of your sessions is optional. However, if
participants agree to be photographed or video recorded their images may also
be used for professional and educational presentations not related to this
research study.
______ I agree to be photographed and video recorded.
______ I do not want to be photographed and video recorded.
_________________________________
Printed Name
_________________________________ _________________
Signature Date
As a representative of this study, I have explained the purpose, procedures, benefits, and
the risks involved in this research study.
_________________________________
Print Name of Person obtaining consent
_________________________________ _________________
Signature of Person Obtaining Consent Date

109
Consent for Participation in Research
Title:
Dose Response of Physical Inactivity on Plasma Triglyceride Elevation After a Meal.
Introduction
The purpose of this form is to provide you information that may affect your decision as to
whether or not to participate in this research study. The person performing the research
will answer any of your questions. Read the information below and ask any questions
you might have before deciding whether or not to take part. If you decide to be involved
in this study, this form will be used to record your consent.
Purpose of the Study
The purpose of this study is to investigate the effect of two days of reduced daily
stepping, and moderate exercise on plasma triglyceride elevation after a meal.
What will you be asked to do?
Before you can be admitted to the study, you will be given brief preliminary tests. This
will include filling out a brief Health Research Questionnaire, and taking measurements
of your height and weight. Only if you are apparently healthy and at low risk for
cardiovascular disease will you be invited to participate in this study. Prior to your
enrollment in the study, your maximal oxygen uptake (VO2max) will be determined while
running on a treadmill and also your heart rate during submaximal running will be
determined.
Each trial will require five days, with periodic visits to the HPL:
Trial 1: Plasma triglyceride responses with two days of 2,500 steps per day and a single
one-hour bout of exercise on the night of the fourth day.
Trial 2: Plasma triglyceride responses with two days of 5,000 steps per day and a single
one-hour bout of exercise on the night of the fourth day.
Trial 3: Plasma triglyceride responses with two days of 7,500 steps per day and a single
one-hour bout of exercise on the night of the fourth day.
The order of protocols will be randomized.
Step-by-Step Protocol:
Week prior to the initiation: Health history questionnaires, familiarization, VO2max test.
5. Arrival at the Human Performance Laboratory (HPL), informed consent, health history
questionnaires, body mass and height.
6. Installation of the activity monitor.
7. Perform resting gas measurement.
8. Warm up for 5 minutes on a treadmill.
9. Perform submaximal exercise test with four treadmill speeds lasting five minutes each. The
intensity will approximate 40, 60, 70 and 80% of age predicted maximal heart rate.
10. Recover for ~ 15-20 minutes (re-hydrate to pre-exercise bodyweight)
11. Perform continuous maximal oxygen consumption test; (VO2max test, 8-12 min.)

110
■ Total time: 150 minutes
Trial sessions
Control Phase: Control Day 1 and 2 (C1 and C2)
Day prior to Control day 1: Activity monitor installation
1. Arrival at the laboratory any time before 17:00 h.
2. Installation of activity monitor
- Total time: 30 minutes
■ Total time spent during Control Phase: 30 minutes
Intervention Phase: D1
Day 1: Reduced daily steps
1. Sitting in preferred place to accommodate step reductions (not necessarily in HPL).
Day 2: Reduced daily steps & 1-hr treadmill running
1. Sitting in preferred place to accommodate step reductions (not necessarily in HPL).
2. Arrival at HPL at 16:50 h.
3. Exercise at 65%VO2max for one hour at around 17:00 h
4. Dinner provided in the laboratory.
- Total time: 120 min
Day 3: High fat tolerance test and resting fat oxidation
8. Arrival at HPL, body weight, 8:00 h.
9. Catheter insertion and fasting blood collection.
10. High fat shake intake
11. Postprandial blood sampling hourly for 6 h (6 additional samples)
12. Expired gas collection for 10 minutes at 2, 4, 6 h after high fat shake intake
13. Detachment of the activity monitor
- Total time: 420 minutes
■ Total time spent during Intervention Phase:
- All Trials: 600-700 minutes
Total time per subject for all trials is approximately 1900 minutes
What are the risks involved in this study?

111
None of the above procedures are expected to be unduly painful or unsafe in healthy
individuals. The maximal oxygen uptake (VO2max), submaximal tests, and 1 hour of
moderate exercise at 65% VO2max will be performed at 20 - 25 º C and relative
humidity of ~ 50%. During VO2max test, only the final 2 to 4 minutes of the test is at
or near maximal levels of exertion and thus accompanied by a sensation of leg fatigue
and heavy breathing. This moderate feeling of fatigue will subside soon after
completion (i.e.; 2-10 min). There is a very small risk that participants could
experience a muscular injury, such as muscle strain. It is also possible that muscle
soreness may develop 24 to 48 hours after any given testing session. To help reduce
these risks, a warm up session will be mandatory prior to performing these tests.
Blood samples will be drawn during each HFTT via venous catheter in an antecubital
vein. A certified phlebotomist will insert the catheters. Minor discomfort may occur
during the insertion of the catheter. The discomfort associated with the insertion of
the catheter is similar to a venipuncture. Risks associated with placement of the
catheter include bleeding, pain, swelling, bruising, infection, and thrombophlebitis.
Approximately 42 ml of blood will be drawn per trial. Over the course of the entire
study approximately 126 ml of blood will be drawn. This sample volume is
approximately 2.3 % of the individual’s total blood volume. If participants are found
to have abnormally high triglyceride levels, they will be alerted of this and advised to
follow-up with their primary care physician.
The risk of any sort of cardiovascular complication in apparently healthy (no
documented CV disease) individuals is very low, with no complications in numerous
tests. Furthermore, in over 36 years involving more than 50,000 exercise sessions, no
subject in the Human Performance Lab has experienced any cardiac event. The
laboratory is currently equipped with AED. A CPR certified member of the research
team will be present during all testing visits in the unlikely event of an adverse
reaction. During the tests, participants may stop performing the task at any time and for any reason if
he or she feels the need to do so. If participants wish to discuss the information above or any
other risks participants may experience, participants may ask questions now or call the
Principal Investigators.
What are the possible benefits of this study?
You will receive no direct benefit from participating in this study. However, each subject
completing the study will be provided with a graphic and verbal description and
explanation on their maximal aerobic capacity, heart rate, blood pressure and metabolic
responses both in fasted and non-fasting states in response to different prior physical
activity/inactivity status.
Do you have to participate?

112
No, your participation is voluntary. You may decide not to participate at all or, if you
start the study, you may withdraw at any time. Withdrawal or refusing to participate will
not affect your relationship with The University of Texas at Austin (University) in
anyway.
If you would like to participate please fully read, sign, and return this form to the
principal investigator of this study (Heath Burton). You will receive a copy of this form
for your personal records.
Will there be any compensation?
You will not receive any type of payment participating in this study.
What if you are injured because of the study?
4. The University has no program or plan to provide treatment for research related
injury or payment in the event of a medical problem. In the event of a research
related injury, please contact the principal investigator.
5. The University has no program or plan for continuing medical care and/or
hospitalization for research-related injuries or for financial compensation.
6. If injuries occur as a result of study activity, eligible University students may be
treated at the usual level of care with the usual cost for services at the Student
Health Center, but the University has no program or plans to provide payment in
the event of a medical problem.
How will your privacy and confidentiality be protected if you participate in this
research study?
Each subject will be assigned a unique Subject ID code. This informed consent form and
the Health History Questionnaire are the only places where any personal identifying
information will be recorded. These forms will be stored in a locked file cabinet. In all
other cases, your data will only be identifiable by your unique code. Only the director of
the laboratory (Dr. Coyle) will have access to a master list that will link your identity to
your code.
Because you will be participating in this study and may do so along with other subjects in a
small group, we will ask that you do not disclose names of participants in your group or
any information that was discussed with other group members outside of the experimental
session.
If it becomes necessary for the Institutional Review Board to review the study records,
information that can be linked to you will be protected to the extent permitted by law.
Your research records will not be released without your consent unless required by law or
a court order. The data resulting from your participation may be made available to other
researchers in the future for research purposes not detailed within this consent form. In
these cases, the data will contain no identifying information that could associate it with
you, or with your participation in any study.

113
If you choose to participate in this study, you may be photographed or video recorded.
Any photographs or video recordings will be stored securely and only the research team
will have access to the recordings. Recordings will be kept for 3 years after the research
experiment has been completed and then erased.
Whom to contact with questions about the study?
Prior, during or after your participation you can contact the researcher Heath Burton at
(864)-940-4103 or send an email to [email protected] for any questions or if you
feel that you have been harmed.
This study has been reviewed and approved by The University Institutional Review
Board and the study number is:
2018-08-0031
Whom to contact with questions concerning your rights as a research participant?
For questions about your rights or any dissatisfaction with any part of this study, you can
contact, anonymously if you wish, the Institutional Review Board by phone at (512) 471-
8871 or email at [email protected].
Participation
If you agree to participate please sign and return this form to a member of the
research team.
Signature
You have been informed about this study’s purpose, procedures, possible benefits and
risks, and you have received a copy of this form. You have been given the opportunity
to ask questions before you sign, and you have been told that you can ask other
questions at any time. You voluntarily agree to participate in this study. By signing this
form, you are not waiving any of your legal rights.
Photography and video recording of your sessions is optional. However, if
participants agree to be photographed or video recorded their images may also
be used for professional and educational presentations not related to this
research study. Therefore, these may be kept indefinitely.
______ I agree to be photographed and video recorded.
______ I do not want to be photographed and video recorded.
_________________________________
Printed Name
_________________________________ _________________
Signature Date
As a representative of this study, I have explained the purpose, procedures, benefits, and
the risks involved in this research study.
_________________________________
Print Name of Person obtaining consent

114
_________________________________ _________________
Signature of Person obtaining consent Date

115
APPENDIX C: HEALTH HISTORY QUESTIONNAIRE
HEALTH HISTORY QUESTIONNAIRE
HUMAN PERFORMANCE LABORATORY – THE UNIVERSITY OF TEXAS
Subject ID:____________
Date of Birth (mm/dd/yy) ____________________________
Age: ________________________
MALE _____ FEMALE ____
Height ___________ Weight ___________

116
HEALTH HISTORY QUESTIONNAIRE
HUMAN PERFORMANCE LABORATORY – THE UNIVERSITY OF TEXAS
Subject ID:____________
GENERAL HEALTH QUESTIONS
1. Are you taking any of the following medications on a regular basis? Y / N
(Psychotropics, Antihistamines, Asthma Meds, Aldomet, Clonidine,Anti-Depressants,
Anti-Anxiety Meds)
2. Any over-the-counter meds? Y / N
If yes, explain:
3. Do you have any disability or impairment that affects physical performance? Y / N
4. Have you ever had any broken bones, surgery or injury to your lower extremities? Y/N
If yes, explain:
5. Have you had any significant medical problems within the last 10 years? Y / N
If yes, explain:
6. Do you have any drug and/or alcohol dependence? Y / N
If yes, explain:
7. Do you have any heart problems or coronary artery disease? Y / N
If yes, explain.
8. Do you have hypertension (high blood pressure)? Y / N
If yes, explain.
9. Do you have any lung or respiratory problems? Y / N

117
If yes, explain.
10. Do you, or have you previously had a history of blood clotting issues Y / N
If yes, explain.
11. Have you been diagnosed with diabetes? Y / N
12. Are you currently pregnant? Y / N
13. Do you smoke? Y / N
If yes, pattern.
14. Do you use alcohol? Y / N
If yes, pattern.
15. Do you use caffeine (cola, coffee, etc…)? Y / N
If yes, pattern.
16. Do you have any allergies that require medication? Y / N
If yes, explain.
17. Do you experience difficulty swallowing medications or vitamins? Y / N
If yes, explain.
18. Do you take any dietary supplements to increase your exercise performance? Y / N
If yes, what supplements so you normally take?
19. Have you been diagnosed with an obstructive disease of the gastrointestinal tract
including but not limited to esophageal stricture, diverticulous, inflammatory bowel
disease (IBD), peptic ulcer disease, Crohn’s disease,ulcerative colitis, and previous
gastro-esophageal surgery. Y / N
HAVE YOU EVER HAD ANY SIGNIFICANT SYMPTOMS ASSOCIATED
118
WITH EXERCISE?
1. Easy fatigability or prolonged fatigue after exercise? Y / N
If yes, explain.
2. Persistent chest pain during and/or after exercise? Y / N
If yes, explain.
3. Fainting or loss of consciousness during exercise? Y / N
If yes, explain.
4. Palpitations (rapid, irregular, or skipped heartbeats) during exercise? Y / N
5. Have you ever been told to give up sports because of a health problem? Y / N
PHYSICAL TRAINING HISTORY
How many years have you been training?
_______________________________________________________________________
What type of physical training do you participate in?
_______________________________________________________________________
Describe in general, the type of training you have performed for each of your years of
training.
1st
2nd
3rd
4th
5th
6th

119
7th
8th
others
What is your personal best race time (if more than one please list distance, time and type)
________________________________________________________________________
________________________________________________________________________
________________________________________________________________________
________________________________________________________________________
___________________________________________________________________
PLEASE GENERALLY DESCRIBE YOUR TRAINING PROGRAM DURING
THE LAST 6 MONTHS
Type of training:
_______________________________________________________________________
_______________________________________________________________________
_______________________________________________________________________
Average time spent or work done (i.e.; distance):
_______________________________________________________________________
_______________________________________________________________________
_______________________________________________________________________
General Intensity:

120
_______________________________________________________________________
_______________________________________________________________________
_______________________________________________________________________

121
AP
PE
ND
IX D
: A
DD
ITIO
NA
L T
AB
LE
S F
OR
ST
UD
Y 1
Day
of
Tri
al
D1
4
Tre
atm
ent
18536
1534
3942
792
Tab
le 1
0. A
ver
age
Dai
ly S
teps
for
both
tre
atm
ent
gro
ups
duri
ng 1
1-d
ay i
nte
rven
tion (
D4
- D
14).
Aver
age
dai
ly s
teps
wer
e si
gn
ific
antl
y d
iffe
rent
bet
wee
n g
rou
ps
for
each
day
mea
sure
d (
p<
0.0
01).
(*)
signif
ican
tly
dif
fere
nt
fro
m D
12 a
nd D
14 w
ithin
tre
atm
ent
gro
up (
p<
0.0
5).
Dat
a ar
e pre
sente
d a
s M
SE
.
D1
3
15852
2045
6618
873
D1
2
18524
2481
6185
782
D1
1
15231
3044
4898
774
D1
0
17820
2255
6414
1182
D9
17913
2341
4561
1022
D8
15734
885
3884
577
D7
11096
1361*
2808
170
D6
18076
2184
5392
963
D5
13961
1110
3664
489
D4
13787
1339
4071
844
Dai
ly
Ste
ps
Hig
h
Ste
p
Lo
w
Ste
p

122
Triglycerides High Step Low Step
AUCT AUCI AUCT AUCI
Baseline 886.8 79.6 322.9 67.2 929.4 73.3 295.9 40.3
Acute Exercise 760.9 73.7† 221.7 49.7* 967.5 98.6 291.6 66.5
Post Training 762.2 65.5† 236.7 61.4* 890.4 64.9 257.8 27.0
Note: Data are presented as MSE. (*) Significantly different from Baseline, p<0.05. (†) significantly different from baseline,
p<0.01
Table 11. Total and incremental areas under the curve of plasma triglyceride
concentrations during HFTTs at Baseline, following a single bout of exercise (Acute),
and following 5 training bouts over the 9-days of training (Post Training). (*)
Significantly different from Baseline, p<0.05. (†) significantly different from Baseline,
p<0.01. All Data are reported as Mean SE.
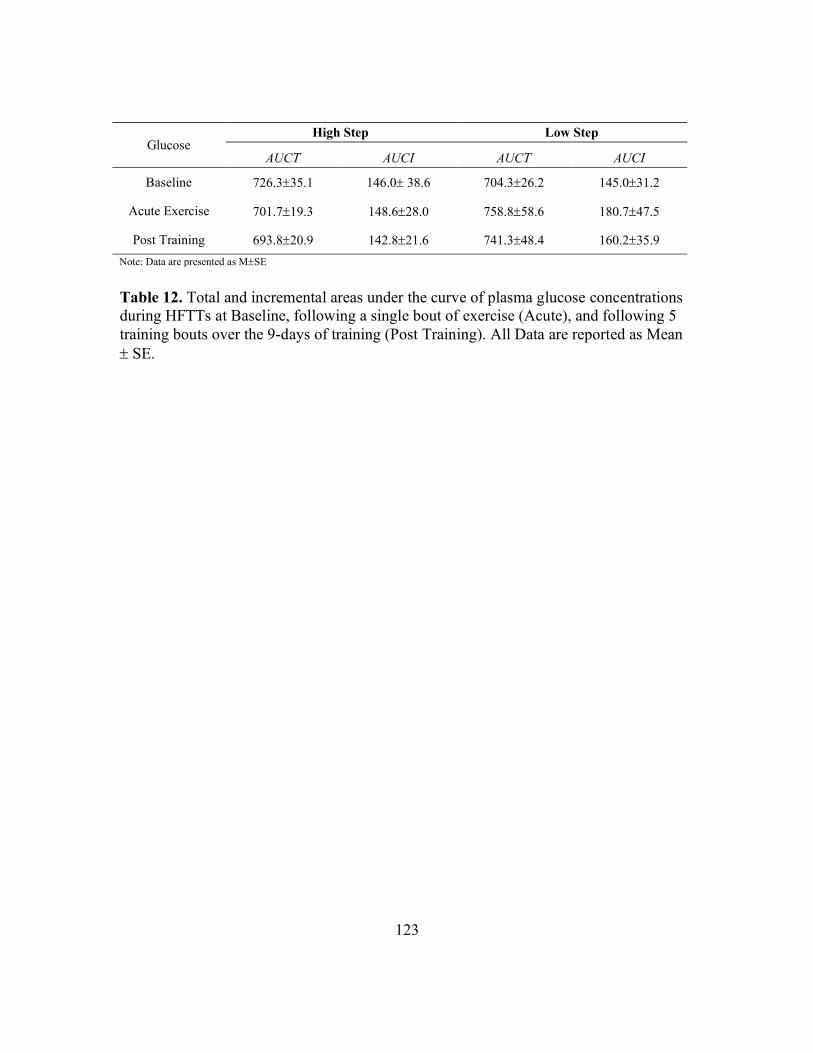
123
Table 12. Total and incremental areas under the curve of plasma glucose concentrations
during HFTTs at Baseline, following a single bout of exercise (Acute), and following 5
training bouts over the 9-days of training (Post Training). All Data are reported as Mean
SE.
Glucose High Step Low Step
AUCT AUCI AUCT AUCI
Baseline 726.335.1 146.0 38.6 704.326.2 145.031.2
Acute Exercise 701.719.3 148.628.0 758.858.6 180.747.5
Post Training 693.820.9 142.821.6 741.348.4 160.235.9
Note: Data are presented as MSE

124
High Step Hours Postprandial
Baseline H1 H2 H3 H4 H5 H6
Triglycerides (mg/dL)
Baseline 94.0 3.5 144.9 6.2 163.3 21.4 174.4 23.2 152.4 14.6 138.8 9.5 131.9 9.7
Acute Exercise 89.9 6.6 114.4 7.3† 138.9 18.6* 148.6 21.2* 134.7 13.8 123.9 10.8 111.2 8.8
Post Training 87.6 5.6 120.7 6.8† 145.2 17.9 150.7 20.2 133.5 11.6 116.9 7.3* 102.8 6.8*
Glucose (mg/dL) Baseline 97.44.1 -- 127.58.9 -- 133.39.2 -- 107.37.1
Acute Exercise 92.64.9 -- 118.95.0 -- 129.19.4 -- 113.04.8
Post Training 93.86.4 -- 118.88.5 -- 122.73.8 -- 117.06.6
Note: Data are presented as MSE. (*) significantly different from Baseline, p< 0.05. (†) significantly different from Baseline, p< 0.01.
Table 13. Temporal Responses of plasma triglyceride concentration for High Step
treatment during HFTT at Baseline, following a single bout of exercise (Acute), and
following 5 training bouts over the 9-days of training (Post Training). (*) significantly
different from Baseline, p< 0.05. (†) significantly different from Baseline, p< 0.01. Data
reported MeanSE.

125
Low Step Hours Postprandial
Baseline H1 H2 H3 H4 H5 H6
Triglycerides (mg/dL)
Baseline 105.6 6.7 140.5 7.4 167.7 18.3 184.6 19.9 164.7 13.9 149.7 12.8 138.8 11.8
Acute Exercise 112.6 11.0 148.5 12.4 175.3 22.2 191.6 23.9 171.5 18.0 154.5 15.2 139.2 15.9
Post Training 105.5 7.3 140.4 7.4 162.6 14.5 176.6 14.0 155.4 16.4 140.3 11.4 124.7 11.0
Glucose (mg/dL)
Baseline 93.33.5 -- 118.27.1 -- 126.78.6 -- 121.210.5
Acute Exercise 97.83.9 -- 135.6+12.5 -- 135.514.7 -- 118.88.6
Post Training 97.12.7 -- 129.211.4 -- 134.511.3 -- 116.79.6
Note: Data are presented as MSE.
Table 14. Temporal Responses of plasma triglyceride concentration for Low Step
treatment during High Fat Tolerance Test at Baseline, following a single bout of exercise
(Acute), and following 5 training bouts over the 9-days of training (Post Training). Data
reported MeanSE.

126
APPENDIX E: ADDITIONAL TABLES & FIGURES FOR STUDY 2
Figure 13. Average daily steps were measured via activPal activity monitor, attached on
the participant’s anterior thigh throughout each trial. Average daily step counts for each
trial are presented for Control (C1 & C2) and Intervention Phases (D1 & D2). (*)
significantly different from Low, p<0.05. (**) significantly different from Low, p<0.01.
(†) significantly different from Low & Limited step trial, p<0.05.
C1 C2 D1 D20
5000
10000
15000
20000
Day of Trial
Nu
mb
er o
f S
tep
sDaily Steps
Low
Limited
Normal† †
* **

127
Trial AUCT AUCI
Triglycerides
Low 881.3 70.7 342.3 47.8
Limited 835.1 73.7 348.6 48.9
Normal 751.2 54.6† 267.5 39.2*
Glucose
Low 709.1 46.8 159.2 35.2
Limited 678.7 37.7 126.4 25.8
Normal 683.0 23.6 124.9 20.6
Table 15. Total and Incremental areas under the curve of plasma triglyceride & glucose
concentrations during HFTT for each trial. (*) Significantly different from Low &
Limited step group, p<0.05. (†) Significantly different from Low step group, p<0.01 Data
reported MeanSE.

128
APPENDIX F: BIHOURLY RER MEASUREMENTS
Study 1
Pairwise comparisons (Tables 9 &10) for time points during the HFTT indicated
significant differences during the second hour for RER, percent fat and percent
carbohydrate oxidation.
High Step Trial
Baseline Acute Post Training
Respiratory Exchange Ratio
Baseline 0.760 0.01 0.759 0.02 0.774 0.01
Hour 2 0.890 0.01† 0.833 0.01* 0.846 0.01
Hour 4 0.819 0.01 0.780 0.01 0.793 0.01
Hour 6 0.777 0.01 0.766 0.01 0.771 0.01
Percent Fat Oxidation
Baseline 80.6 4.58 81.1 5.87 75.7 4.57
Hour 2 37.5 4.71† 57.0 4.13* 52.7 3.71
Hour 4 61.9 3.20 75.1 3.57 72.2 3.68
Hour 6 76.1 3.39 80.0 3.32 77.0 2.87
Percent CHO Oxidation
Baseline 19.4 4.58 18.9 5.87 24.3 4.57
Hour 2 62.5 4.71† 43.0 4.13* 47.3 3.71
Hour 4 38.1 3.20 24.9 3.57 27.8 3.68
Hour 6 23.9 3.39 20.0 3.32 23.0 2.87
Note: Data are presented as MSE
Table 16. Average postprandial substrate oxidation at each measurement for HS
Treatment group. (*) Significantly different from Baseline, (p<0.05). All Data are
reported as Mean SE.

129
Low Step Trial
Baseline Acute Post Training
Respiratory Exchange Ratio
Baseline 0.773 0.01 0.754 0.01 0.760 0.02
Hour 2 0.879 0.01 0.879 0.01 0.861 0.01
Hour 4 0.826 0.02 0.793 0.1 0.814 0.01
Hour 6 0.789 0.02 0.779 0.01 0.763 0.01
Percent Fat Oxidation
Baseline 76.2 4.44 86.9 3.19 80.6 5.14
Hour 2 41.4 3.83 41.4 2.52 47.3 3.02
Hour 4 59.5 5.26 70.7 4.06 68.3 6.74
Hour 6 72.2 5.39 75.6 4.91 76.1 2.95
Percent CHO Oxidation
Baseline 23.8 4.44 13.1 3.19 19.4 5.14
Hour 2 58.6 3.83 58.6 2.52 52.7 3.02
Hour 4 40.5 5.26 29.3 4.06 31.7 6.74
Hour 6 27.8 5.39 24.4 4.91 23.9 2.95
Note: Data are presented as MSE
Table 17. Average postprandial substrate oxidation at each measurement for LS
Treatment group. All Data are reported as Mean SE.

130
Study 2
Postprandial Measurements Trial
Low Limited Normal
Respiratory Exchange Ratio
Baseline 0.782 0.010 0.750 0.007 0.739 0.006
Hour 2 0.844 0.018 0.833 0.014 0.793 0.011*
Hour 4 0.789 0.016 0.781 0.019 0.764 0.015
Hour 6 0.776 0.015 0.755 0.012 0.738 0.012
Percent CHO Oxidation
Baseline 25.60 3.52 14.74 2.23 11.95 1.77
Hour 2
46.89 6.13 43.14 4.70 29.39 3.89*
Hour 4 28.05 5.58 25.12 6.49 18.09 5.48
Hour 6 23.62 5.09 16.52 4.17 11.26 4.16
Percent Fat Oxidation
Baseline 74.40 3.52 85.26 2.23 88.05 1.77
Hour 2 53.11 6.13 56.86 4.70 70.61 3.89*
Hour 4 71.95 5.58 74.88 6.49 81.91 5.48
Hour 6 76.38 5.09 83.48 4.18 88.74 4.16
Note: Data are presented as MSE (*) significantly different from both Low & Limited, p<0.05.
Table 18. Average postprandial substrate oxidation at each measurement for each trial.
(*) significantly different from both Low & Limited, p<0.05. All Data are reported as
Mean SE.

131
APPENDIX G: STUDY 1 INDIVIDUAL DATA TABLES
Biographical and VO2peak Data
LS Age Height Mass VO2peak
(ml/min)
VO2peak
(ml/kg/min)
Pre Post Pre Post
1 20 157.5 71.3 2364 2409 33.2 33.2
2 21 168.9 74.2 2864 3320 38.6 45.2
3 24 162.6 70.8 1547 1719 21.9 24.0
4 21 172.7 79.9 2684 2986 33.6 37.0
5 26 177.8 68.5 3242 3376 47.3 50.3
6 21 162.6 62.2 1792 1788 28.8 28.7
7 32 157.5 59.1 1431 1449 24.2 24.7
8 25 177.8 94.9 2877 3089 30.3 33.0
HS Age Height Mass VO2peak
(ml/min)
VO2peak
(ml/kg/min)
Pre Post Pre Post
1 19 154.9 60.6 2321 2594 38.3 41.4
2 35 167.6 94.1 2419 2569 25.7 27.6
3 21 175.3 90.2 3875 3888 43.0 43.4
4 26 167.6 91.25 2459 2517 26.9 28.3
5 19 167.6 69.6 3126 3560 44.9 50.7
6 18 177.8 68.25 2942 3098 43.1 46.1
7 26 157.5 45.5 1312 1596 28.8 35.4
8 23 162.6 75.9 1659 1746 21.9 22.6

132
Submaximal Exercise Data
LS
Work
Rate
(W) VO2
%VO2peak Heart Rate Blood Lactate
Rating of
Perceived
Exertion
Pre Post Pre Post Pre Post Pre Post
1 115 1834 77.6 76.1 184 182 7.4 7.5 16 14
2 164 2356 82.2 71 180 173 7.5 8.1 17 13
3 75 1269 82.0 73.8 183 184 5.8 5.1 14 15
4 148 2147 80.0 71.9 196 186 6.3 6.2 17 15
5 175 2482 76.6 73.5 187 179 6.6 6.3 16 12
6 91 1433 79.9 80.2 198 182 7.6 7.7 16 15
7 70 1153 80.6 79.5 167 169 8.8 8.8 14 14
8 167 2306 80.1 74.6 152 151 7.8 7.8 16 18
HS
Work
Rate
(W) VO2
%VO2peak Heart Rate Blood Lactate
Rating of
Perceived
Exertion
Pre Post Pre Post Pre Post Pre Post
1 119 1804 77.7 69.5 185 177 7.8 6.5 16 14
2 132 1915 79.1 74.5 182 171 6.3 4.1 17 12
3 222 3086 79.6 79.4 178 170 8.7 7.8 17 16
4 130 1808 73.5 71.8 156 151 5.7 5.0 14 13
5 176 2504 80.1 70.3 200 189 11.2 10.1 17 16
6 165 2373 80.7 76.6 194 179 8.4 6.1 17 13
7 55 1010 77.0 63.3 181 156 4.3 5.7 11 13
8 82 1306 78.7 74.8 175 157 8.6 8.0 16 13

133
Daily Steps
Day of
LS
Participant #
1 2 3 4 5 6 7 8
4 2489 2026 2446 4133 1576 7162 7836 4903
5 2964 2130 4484 5564 1948 2926 5314 3979
6 3821 4196 6190 3681 8420 7238 8748 840
7 2004 3012 3255 2412 2622 3008 2651 3501
8 2488 2564 4684 5281 1816 5894 5564 2783
9 3602 2943 1352 3821 8066 9902 3936 2867
10 4019 3620 11626 2013 8802 5194 9734 6305
11 5473 2751 3201 5471 7198 2056 8364 4674
12 5824 2416 8150 6882 7956 6768 8164 3325
13 5722 2003 9766 7668 8984 5384 5616 7802
14 2855 2366 1600 4105 8418 6006 3478 2709
Day of
HS
Participant #
1 2 3 4 5 6 7 8
4 10855 13664 10756 20844 8800 15544 16002 13828
5 11226 15886 13598 15802 8436 18244 15862 12630
6 15896 15242 12584 21266 28880 24314 15578 10850
7 17888 7896 8619 7926 15811 11829 8243 10557
8 14956 12886 18286 15896 19210 17500 14996 12142
9 14502 18952 30254 15890 16150 24584 13436 9538
10 10661 11003 27204 16194 17816 26742 19022 13918
11 11285 8004 32422 12570 8994 23268 16638 8670
12 8656 15679 32974 21572 17368 18840 19002 14104
13 9984 14898 17830 16824 15850 27264 16284 7884
14 12061 15017 25292 18664 21164 21866 19322 14904

134
Plasma Triglyceride Concentrations
Participant
#
LS TG Postprandial Time (Hours)
Baseline H1 H2 H3 H4 H5 H6
Baseline
1 66.7 107.9 108.8 107.9 101.9 84.8 85.0
2 119.5 148.1 168.5 211.3 200.0 172.0 144.0
3 118.1 157.7 188.9 204.5 195.9 176.8 157.6
4 109.3 158.5 189.4 207.9 189.2 183.5 177.9
5 99.9 125.1 131.9 151.6 162.4 146.9 131.3
6 92.1 116.5 122.5 115.6 105.6 109.0 112.4
7 122.1 149.7 158.9 201.2 179.1 180.4 181.7
8 116.8 160.4 272.6 276.9 183.5 144.3 120.3
Acute
1 58.2 94.7 95.4 97.8 93.3 87.9 75.4
2 109.8 134.5 140.9 177.2 173.4 146.1 118.8
3 158.0 198.7 221.1 231.0 195.5 187.2 178.9
4 124.8 184.0 224.9 255.8 225.7 216.3 206.9
5 110.4 137.0 145.3 149.3 139.0 126.6 114.3
6 91.2 114.2 118.9 120.3 122.3 115.0 107.7
7 145.5 168.8 173.7 208.5 180.7 181.0 181.3
8 103.2 156.4 282.4 292.6 242.3 176.1 130.2
Post Training
1 83.2 124.8 120.9 136.4 123.1 110.6 77.4
2 83.2 139.5 177.5 150.8 110.2 114.8 119.4
3 122.2 155.5 170.5 211.3 210.0 186.4 162.8
4 128.0 172.2 198.2 208.1 201.9 162.8 123.6
5 93.1 118.2 125.0 155.6 121.8 119.0 116.3
6 86.6 111.0 117.0 141.1 100.1 103.5 106.9
7 122.3 149.8 159.1 164.8 172.3 173.9 175.6
8 125.7 151.9 232.6 245.0 203.7 151.2 115.7

135
Participant
#
HS TG Postprandial Time (Hours)
Baseline H1 H2 H3 H4 H5 H6
Baseline
1 78.0 133.2 145.5 157.8 133.9 120.5 125.5
2 109.2 185.6 311.9 335.6 250.4 202.5 195.2
3 99.3 139.4 139.6 139.5 127.8 128.1 114.4
4 101.8 152.8 158.0 159.0 146.0 133.5 118.9
5 96.6 138.4 136.5 149.2 148.9 144.9 142.8
6 85.3 134.5 130.5 145.8 125.5 126.8 130.1
7 90.1 136.7 139.9 146.0 129.6 121.3 113.0
8 91.5 139.0 144.9 162.5 156.8 132.9 114.9
Acute
1 56.2 91.1 102.1 105.1 84.2 77.8 75.0
2 109.5 148.5 260.7 290.6 199.5 157.3 125.0
3 82.3 103.3 110.3 114.6 102.7 115.1 111.2
4 104.2 111.9 122.4 129.0 139.4 120.5 113.9
5 104.9 132.8 143.7 151.5 153.7 140.1 132.1
6 96.5 104.3 114.4 124.8 123.1 115.9 104.7
7 71.3 93.5 103.1 117.0 102.4 94.9 79.4
8 94.1 129.9 154.4 156.4 172.3 169.4 148.0
Post Training
1 57.7 91.5 104.7 75.3 77.0 75.6 66.3
2 79.9 153.8 261.9 276.0 192.4 149.7 127.9
3 83.9 105.0 108.8 121.8 110.3 108.8 106.3
4 93.5 127.9 138.7 159.7 134.5 123.4 117.2
5 111.9 137.4 161.5 155.1 147.2 124.5 109.1
6 100.4 119.8 136.6 142.6 132.6 119.0 110.5
7 87.7 113.0 120.0 142.0 127.4 112.1 84.4
8 85.9 117.6 129.4 133.2 146.2 122.4 100.4

136
Plasma Glucose Concentrations
Participant
#
LS Glucose Postprandial Time (Hours)
Baseline H2 H4 H6
Baseline
1 92.7 126.9 169.7 132.5
2 93.6 97.2 112.1 88.7
3 77.7 160.4 95.7 92.5
4 83.0 116.2 114.5 166.5
5 101.8 105.7 121.9 96.5
6 109.8 127.6 144.9 122.0
7 96.1 106.0 110.1 112.6
8 91.7 105.5 144.7 158.5
Acute
1 90.9 131.8 158.6 143.6
2 93.1 103.1 119.0 90.4
3 99.3 131.4 123.2 112.4
4 87.0 121.9 122.4 134.5
5 101.3 112.1 129.4 103.1
6 116.2 203.4 228.5 160.2
7 110.4 106.8 98.7 105.7
8 84.5 174.4 104.1 100.6
Post Training
1 91.0 121.0 178.3 128.1
2 88.8 93.0 90.3 82.1
3 95.8 106.5 121.2 145.1
4 100.5 140.6 144.9 159.6
5 89.0 104.1 98.2 89.3
6 109.5 196.2 175.6 104.8
7 96.1 129.5 133.9 102.1
8 106.1 142.9 134.0 122.2

137
Participant
#
HS Glucose Postprandial Time (Hours)
Baseline H2 H4 H6
Baseline
1 103.3 124.3 125.4 107.9
2 103.2 111.2 122.6 99.7
3 86.5 101.8 115.2 97.1
4 104.8 111.8 121.9 120.2
5 114.9 176.0 125.6 91.2
6 94.2 155.5 187.4 147.9
7 78.3 124.9 157.6 84.0
8 94.2 114.9 110.7 110.2
Acute
1 89.5 112.4 122.1 108.8
2 98.1 112.5 184.9 92.8
3 83.1 94.1 99.8 130.9
4 100.2 120.1 123.3 113.1
5 104.5 142.9 101.4 97.3
6 106.4 128.3 137.2 112.7
7 64.2 123.9 134.9 128.3
8 95.1 117.4 129.5 120.2
Post
Training
1 76.1 81.4 131.9 121.4
2 95.8 151.9 118.3 113.2
3 70.0 93.3 124.4 81.3
4 98.8 132.2 120.8 123.9
5 125.5 143.6 101.1 107.8
6 90.0 120.6 134.7 123.6
7 84.4 111.6 131.4 148.1
8 110.1 115.5 119.1 116.6

138
RER Data
Participant
#
LS RER Postprandial Time (Hours)
Baseline H2 H4 H6
Baseline
1 0.78 0.9 0.88 0.86
2 0.82 0.85 0.88 0.81
3 0.8 0.87 0.79 0.77
4 0.72 0.93 0.83 0.81
5 0.75 0.85 0.78 0.77
6 0.79 0.89 0.82 0.73
7 0.75 0.86 0.8 0.77
Acute
1 0.77 0.88 0.83 0.84
2 0.78 0.87 0.81 0.82
3 0.72 0.9 0.8 0.76
4 0.72 0.9 0.8 0.76
5 0.75 0.85 0.78 0.77
6 0.79 0.89 0.73 0.73
7 0.75 0.86 0.8 0.77
Post Training
1 0.81 0.9 0.89 0.77
2 0.77 0.88 0.8 0.78
3 0.72 0.86 0.79 0.74
4 0.78 0.84 0.8 0.79
5 0.73 0.86 0.81 0.76
6 0.71 0.86 0.81 0.71
7 0.8 0.83 0.8 0.79

139
Participant
#
HS RER Postprandial Time (Hours)
Baseline H2 H4 H6
Baseline
1 0.76 0.89 0.79 0.77
2 0.79 0.91 0.85 0.81
3 0.74 0.92 0.84 0.8
4 0.71 0.88 0.79 0.77
5 0.81 0.94 0.83 0.79
6 0.78 0.84 0.8 0.77
7 0.73 0.85 0.83 0.73
Acute
1 0.8 0.83 0.81 0.78
2 0.77 0.89 0.81 0.75
3 0.73 0.82 0.75 0.72
4 0.71 0.85 0.77 0.76
5 0.83 0.79 0.79 0.8
6 0.71 0.84 0.79 0.77
7 0.76 0.81 0.74 0.78
Post Training
1 0.77 0.8 0.79 0.74
2 0.77 0.84 0.8 0.79
3 0.83 0.87 0.76 0.81
4 0.77 0.85 0.8 0.77
5 0.81 0.89 0.81 0.76
6 0.74 0.84 0.77 0.75
7 0.73 0.83 0.82 0.78

140
Postprandial Fat Oxidation (kcal/6h)
High Step
1 2 3 4 5 6 7
Baseline 282.3 252.2 284.7 362.4 280.2 382.1 327.1
Acute 312.2 277.8 446.2 444.4 433.8 388.8 385.4
Post
Training 403.9 295.3 360.1 385.3 372.6 427.2 337.6
Low Step
1 2 3 4 5 6 7
Baseline 248.8 261.0 430.0 187.0 420.3 419.0 346.7
Acute 245.8 269.7 312.8 275.2 548.1 474.7 336.2
Post
Training 298.2 287.2 418.1 299.0 491.1 305.6 355.8

141
APPENDIX H: STUDY 2 INDIVIDUAL DATA TABLES
Biographical & Exercise Data
Participant
# Age Height Mass
VO2max
(ml/min)
VO2max
(ml/kg/min)
Exercise
VO2 %VO2max
Heart
Rate RPE Speed
1 20 71 94.1 3834 40.7 2438 63.6 134 12 4.3
2 22 71 86.4 3999 46.3 2599 64.8 172 13 5.5
3 32 61 54.6 1980 36.3 1287 65.2 139 10 4.4
4 24 73 75.7 3233 42.7 2102 61.9 161 10 4.8
5 21 62 73.5 2880 39.2 1868 64.8 166 11 4.6
6 36 73 116.2 4658 40.1 3022 64.9 140 11 4.6
7 32 67 84.1 3450 41.1 2284 66.2 153 12 4.5
8 27 69 68.3 3213 47.0 2010 62.6 155 11 5.1
9 19 66 66.1 2771 41.9 1896 65.2 159 13 4.1
10 24 69 78.4 4028 51.4 2597 64.5 160 11 6.2

142
Daily Steps
Participant
#
Steps Day of Trial
C1 C2 D1 D2
Low
1 5752 13302 1534 1006
2 6076 9650 3594 904
3 15844 13944 3365 3420
4 9911 9063 2812 2292
5 8891 10273 1305 3625
6 5257 5712 2476 3169
7 7805 8111 4610 3541
8 8554 10841 1599 2210
9 17886 19002 2833 3009
10 16013 10254 3316 2881
Limited
1 4420 11826 3296 3484
2 7906 7691 3921 5904
3 10112 12248 5380 5078
4 9225 5852 4801 4732
5 10112 11540 6343 5203
6 6661 8040 4470 5240
7 7155 7440 4366 5110
8 10185 11013 3937 4993
9 16641 18145 3038 5728
10 15662 11892 5265 4896
Normal
1 9003 7991 7853 8109
2 8114 10846 5844 5730
3 11550 14868 7578 8441
4 8841 8857 6572 7880
5 12208 11660 10571 9023
6 5855 6827 7550 7827
7 9194 7993 7191 8864
8 10777 9945 8122 9751
9 21016 15398 13856 8924
10 14003 12933 9175 10751

143
Plasma Triglyceride Concentrations
Participant
#
TG Postprandial Time (Hours)
Baseline H2 H3 H4 H6
Low
1 109.7 148.6 169.9 209.1 172.9
2 113.1 179.4 169.7 175.4 157.8
3 86.6 122.6 130.4 146.2 112.6
4 98.6 152.3 158.7 142.8 124.0
5 48.6 99.5 151.7 172.2 104.1
6 124.5 232.1 260.1 299.6 231.3
7 57.2 87.2 194.4 164.1 94.9
8 85.6 138.0 137.1 130.5 117.6
9 87.6 131.0 134.2 125.1 91.1
10 86.9 184.8 217.5 199.9 124.2
Limited
1 103.9 139.4 182.2 197.6 161.5
2 105.4 139.6 164.6 175.8 154.6
3 83.8 114.4 137.9 130.7 108.4
4 90.9 133.2 140.9 139.2 124.7
5 40.3 81.2 149.4 136.8 68.0
6 130.3 219.4 289.5 286.5 225.2
7 38.6 120.1 213.3 194.3 115.7
8 77.1 143.4 168.9 140.3 110.8
9 66.1 118.5 116.5 102.2 79.6
10 74.3 130.7 190.9 172.8 113.6
Normal
1 92.0 146.3 188.9 178.7 182.9
2 111.4 147.3 155.1 156.4 134.7
3 82.3 112.4 115.4 118.3 99.0
4 83.6 129.9 134.4 121.6 118.9
5 52.1 63.7 130.2 128.5 66.3
6 89.3 175.0 221.0 214.9 168.3
7 50.7 96.8 165.4 135.6 71.2
8 75.3 127.7 127.5 106.8 93.2
9 72.7 110.8 105.2 88.9 95.4
10 90.1 143.2 169.9 166.5 126.6
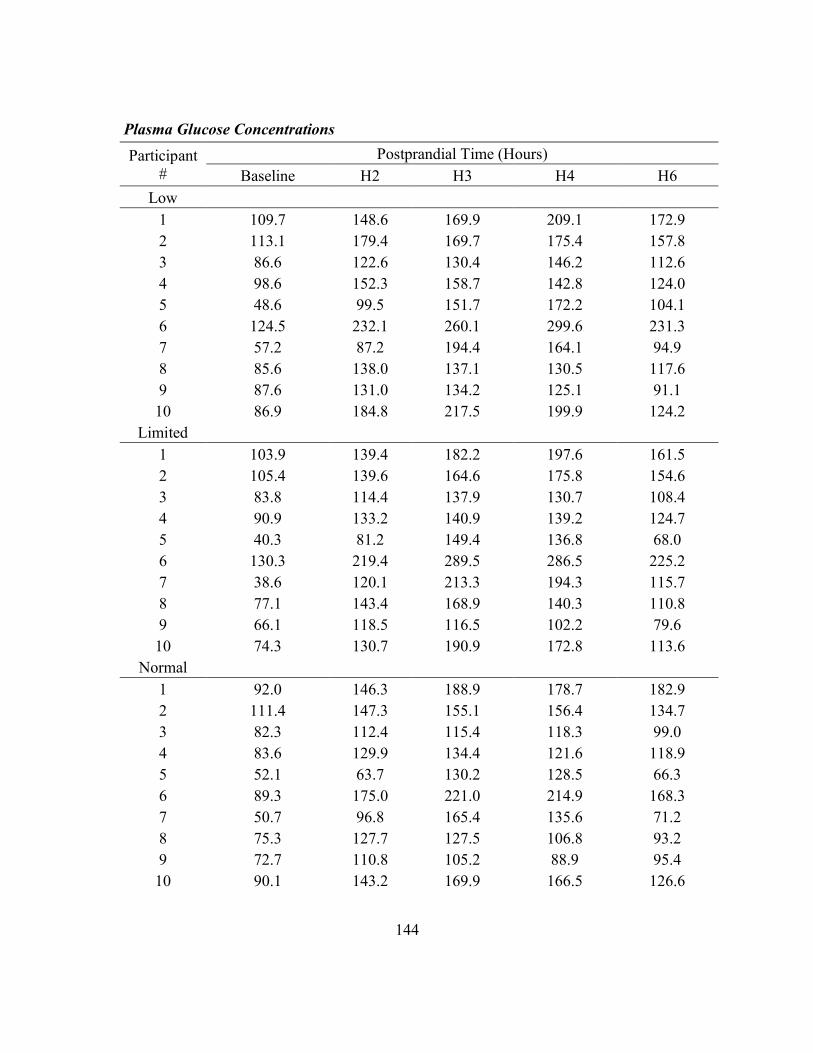
144
Plasma Glucose Concentrations
Participant
#
Postprandial Time (Hours)
Baseline H2 H3 H4 H6
Low
1 109.7 148.6 169.9 209.1 172.9
2 113.1 179.4 169.7 175.4 157.8
3 86.6 122.6 130.4 146.2 112.6
4 98.6 152.3 158.7 142.8 124.0
5 48.6 99.5 151.7 172.2 104.1
6 124.5 232.1 260.1 299.6 231.3
7 57.2 87.2 194.4 164.1 94.9
8 85.6 138.0 137.1 130.5 117.6
9 87.6 131.0 134.2 125.1 91.1
10 86.9 184.8 217.5 199.9 124.2
Limited
1 103.9 139.4 182.2 197.6 161.5
2 105.4 139.6 164.6 175.8 154.6
3 83.8 114.4 137.9 130.7 108.4
4 90.9 133.2 140.9 139.2 124.7
5 40.3 81.2 149.4 136.8 68.0
6 130.3 219.4 289.5 286.5 225.2
7 38.6 120.1 213.3 194.3 115.7
8 77.1 143.4 168.9 140.3 110.8
9 66.1 118.5 116.5 102.2 79.6
10 74.3 130.7 190.9 172.8 113.6
Normal
1 92.0 146.3 188.9 178.7 182.9
2 111.4 147.3 155.1 156.4 134.7
3 82.3 112.4 115.4 118.3 99.0
4 83.6 129.9 134.4 121.6 118.9
5 52.1 63.7 130.2 128.5 66.3
6 89.3 175.0 221.0 214.9 168.3
7 50.7 96.8 165.4 135.6 71.2
8 75.3 127.7 127.5 106.8 93.2
9 72.7 110.8 105.2 88.9 95.4
10 90.1 143.2 169.9 166.5 126.6

145
RER Data
Participant
#
Postprandial Time (Hours)
Baseline H2 H4 H6
Low
1 0.829 0.815 0.791 0.784
2 0.809 0.774 0.747 0.741
3 0.721 0.771 0.756 0.733
4 0.814 0.836 0.798 0.761
5 0.786 0.87 0.748 0.77
6 0.786 0.848 0.761 0.796
7 0.794 0.799 0.851 0.762
8 0.772 0.947 0.898 0.885
9 0.748 0.891 0.79 0.721
10 0.761 0.923 0.812 0.809
Limited
1 0.764 0.776 0.714 0.697
2 0.754 0.812 0.747 0.75
3 0.72 0.831 0.772 0.744
4 0.793 0.818 0.774 0.729
5 0.726 0.851 0.763 0.751
6 0.736 0.888 0.756 0.759
7 0.745 0.848 0.827 0.794
8 0.752 0.914 0.85 0.841
9 0.757 0.781 0.908 0.752
10 0.755 0.895 0.795 0.737
Normal
1 0.721 0.766 0.727 0.731
2 0.724 0.777 0.791 0.718
3 0.74 0.809 0.739 0.726
4 0.743 0.789 0.741 0.723
5 0.776 0.836 0.788 0.726
6 0.717 0.755 0.757 0.735
7 0.721 0.829 0.75 0.73
8 0.745 0.844 0.732 0.735
9 0.758 0.79 0.729 0.71
10 0.748 0.736 0.886 0.844
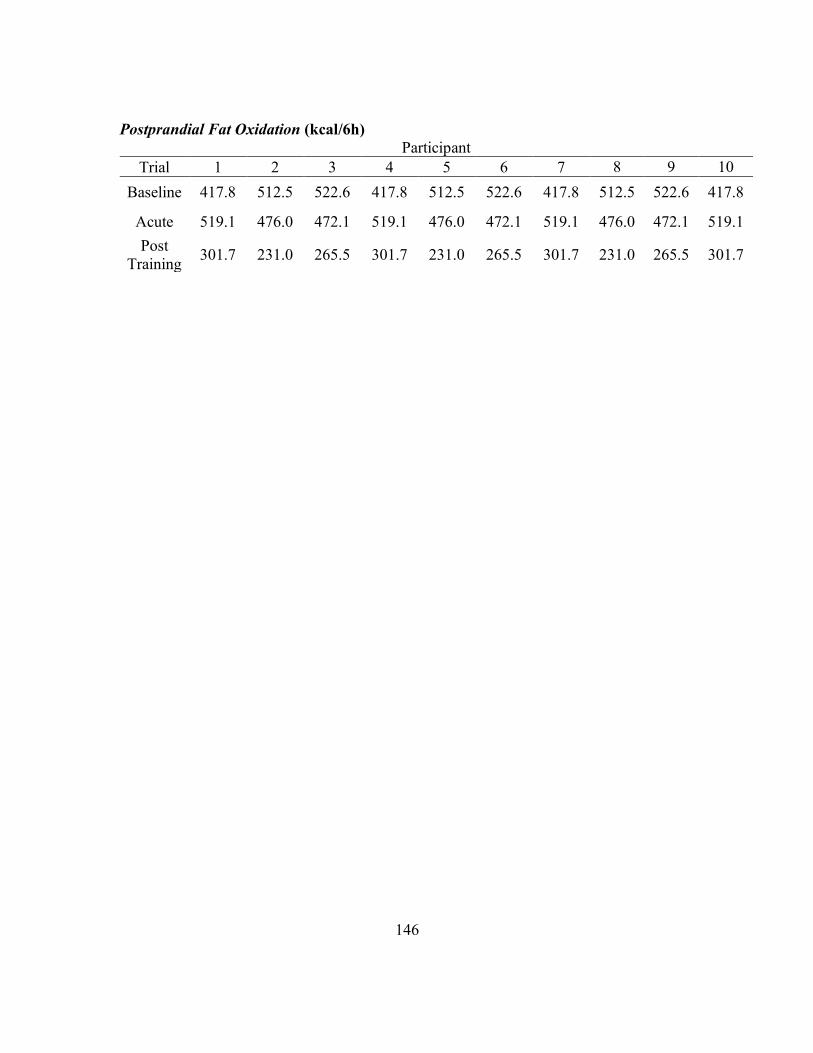
146
Postprandial Fat Oxidation (kcal/6h)
Participant
Trial 1 2 3 4 5 6 7 8 9 10
Baseline 417.8 512.5 522.6 417.8 512.5 522.6 417.8 512.5 522.6 417.8
Acute 519.1 476.0 472.1 519.1 476.0 472.1 519.1 476.0 472.1 519.1
Post
Training 301.7 231.0 265.5 301.7 231.0 265.5 301.7 231.0 265.5 301.7

147
REFERENCES
1. Akins JD, Crawford CK, Burton HM, Wolfe AS, Vardarli E, and Coyle EF.
Inactivity Induces Resistance to the Metabolic Benefits Following Acute Exercise. Journal
of applied physiology (Bethesda, Md : 1985) 2019.
2. Altena TS, Michaelson JL, Ball SD, and Thomas TR. Single sessions of
intermittent and continuous exercise and postprandial lipemia. Medicine and science in
sports and exercise 36: 1364-1371, 2004.
3. Anderson TJ, Gerhard MD, Meredith IT, Charbonneau F, Delagrange D,
Creager MA, Selwyn AP, and Ganz P. Systemic nature of endothelial dysfunction in
atherosclerosis. Am J Cardiol 75: 71B-74B, 1995.
4. Bailey DP, and Locke CD. Breaking up prolonged sitting with light-intensity
walking improves postprandial glycemia, but breaking up sitting with standing does not. J
Sci Med Sport 18: 294-298, 2015.
5. Bansal S, Buring JE, Rifai N, Mora S, Sacks FM, and Ridker PM. Fasting
compared with nonfasting triglycerides and risk of cardiovascular events in women. JAMA
298: 309-316, 2007.
6. Barquera S, Pedroza-Tobías A, Medina C, Hernández-Barrera L, Bibbins-
Domingo K, Lozano R, and Moran AE. Global overview of the epidemiology of
atherosclerotic cardiovascular disease. Archives of medical research 46: 328-338, 2015.
7. Barrett LA, Morris JG, Stensel DJ, and Nevill ME. Effects of intermittent games
activity on postprandial lipemia in young adults. Medicine and science in sports and
exercise 38: 1282-1287, 2006.
8. Barrett LA, Morris JG, Stensel DJ, and Nevill ME. Exercise and postprandial
plasma triacylglycerol concentrations in healthy adolescent boys. Medicine and science in
sports and exercise 39: 116-122, 2007.
9. Bassett DR, Schneider PL, and Huntington GE. Physical Activity in an Old
Order Amish Community. Medicine and science in sports and exercise 36: 79-85, 2004.
10. Bassett DR, Wyatt HR, Thompson H, Peters JC, and Hill JO. Pedometer-
Measured Physical Activity and Health Behaviors in U. S. Adults. Medicine and science
in sports and exercise 42: 1819-1825, 2010.
11. Becker GH, Meyer J, and Necheles H. Fat absorption and atherosclerosis. Science
(New York, NY) 110: 529, 1949.
12. Beigneux AP. GPIHBP1 and the processing of triglyceride-rich lipoproteins.
Clinical lipidology 5: 575-582, 2010.
13. Bergouignan A, Trudel G, Simon C, Chopard A, Schoeller DA, Momken I,
Votruba SB, Desage M, Burdge GC, and Gauquelin-Koch G. Physical inactivity
differentially alters dietary oleate and palmitate trafficking. Diabetes 58: 367-376, 2009.
14. Berlin JA, and Colditz GA. A Metaanalysis of Physical-Activity in the Prevention
of Coronary Heart-Disease. American Journal of Epidemiology 132: 612-628, 1990.
15. Bey L, and Hamilton MT. Suppression of skeletal muscle lipoprotein lipase
activity during physical inactivity: a molecular reason to maintain daily low-intensity
activity. J Physiol 551: 673-682, 2003.
148
16. Biswas A, Oh PI, Faulkner GE, Bajaj RR, Silver MA, Mitchell MS, and Alter
DA. Sedentary time and its association with risk for disease incidence, mortality, and
hospitalization in adults: a systematic review and meta-analysis. Ann Intern Med 162: 123-
132, 2015.
17. Bjorkegren J, Packard C, Hamsten A, Bedford D, Caslake M, Foster L,
Shepherd J, Stewart P, and Karpe F. Accumulation of large very low density lipoprotein
in plasma during intravenous infusion of a chylomicron-like triglyceride emulsion reflects
competition for a common lipolytic pathway. Journal of lipid research 37: 76-86, 1996.
18. Bjorkegren J, Packard CJ, Hamsten A, Bedford D, Caslake M, Foster L,
Shepherd J, Stewart P, and Karpe F. Accumulation of large very low density lipoprotein
in plasma during intravenous infusion of a chylomicron-like triglyceride emulsion reflects
competition for a common lipolytic pathway. J Lipid Res 37: 76-86, 1996.
19. Booth FW, Roberts CK, and Laye MJ. Lack of exercise is a major cause of
chronic diseases. Compr Physiol 2012.
20. Booth FW, Roberts CK, Thyfault JP, Ruegsegger GN, and Toedebusch RG.
Role of Inactivity in Chronic Diseases: Evolutionary Insight and Pathophysiological
Mechanisms. Physiological Reviews 97: 1351-1402, 2017.
21. Boushel R, Langberg H, Olesen J, Nowak M, Simonsen L, Bulow J, and Kjaer
M. Regional blood flow during exercise in humans measured by near-infrared
spectroscopy and indocyanine green. Journal of applied physiology 89: 1868-1878, 2000.
22. Breen L, Stokes KA, Churchward-Venne TA, Moore DR, Baker SK, Smith K,
Atherton PJ, and Phillips SM. Two weeks of reduced activity decreases leg lean mass
and induces “anabolic resistance” of myofibrillar protein synthesis in healthy elderly. The
Journal of Clinical Endocrinology & Metabolism 98: 2604-2612, 2013.
23. Burns SF, Broom DR, Miyashita M, Ueda C, and Stensel DJ. Increased
postprandial triacylglycerol concentrations following resistance exercise. Medicine and
science in sports and exercise 38: 527-533, 2006.
24. Burns SF, Miyashita M, Ueda C, and Stensel DJ. Multiple bouts of resistance
exercise and postprandial triacylglycerol and serum C-reactive-protein concentrations.
International Journal of Sport Nutrition and Exercise Metabolism 17: 556-573, 2007.
25. Chodzko-Zajko WJ, Proctor DN, Singh MAF, Minson CT, Nigg CR, Salem
GJ, and Skinner JS. Exercise and physical activity for older adults. Medicine & science
in sports & exercise 41: 1510-1530, 2009.
26. Church TS, Thomas DM, Tudor-Locke C, Katzmarzyk PT, Earnest CP,
Rodarte RQ, Martin CK, Blair SN, and Bouchard C. Trends over 5 decades in U.S.
occupation-related physical activity and their associations with obesity. PLoS One 6:
e19657, 2011.
27. Clarkson P, Montgomery HE, Mullen MJ, Donald AE, Powe AJ, Bull T, Jubb
M, World M, and Deanfield JE. Exercise training enhances endothelial function in young
men. J Am Coll Cardiol 33: 1379-1385, 1999.
28. Control CfD. Protective effect of physical activity on coronary heart disease.
MMWR Morb Mortal Wkly Rep 36: 426-430, 1987.
149
29. Costill DL. Metabolic responses during distance running. J Appl Physiol 28: 251-
255, 1970.
30. Craft LL, Zderic TW, Gapstur SM, Vaniterson EH, Thomas DM, Siddique J,
and Hamilton MT. Evidence that women meeting physical activity guidelines do not sit
less: an observational inclinometry study. The international journal of behavioral nutrition
and physical activity 9: 122, 2012.
31. Crawford CK, Akins JD, Wolfe AS, Vardarli E, and Coyle EF. The Effects of
Prolonged Standing Compared to Prolonged Sitting on Postprandial Lipemia.
(Unpublished).
32. Dash S, Xiao C, Morgantini C, and Lewis GF. New Insights into the Regulation
of Chylomicron Production. Annu Rev Nutr 35: 265-294, 2015.
33. Davignon J, and Ganz P. Role of endothelial dysfunction in atherosclerosis.
Circulation 109: III27-32, 2004.
34. Donahoo WT, Levine JA, and Melanson EL. Variability in energy expenditure
and its components. Curr Opin Clin Nutr Metab Care 7: 599-605, 2004.
35. Dumith SC, Hallal PC, Reis RS, and Kohl HW, 3rd. Worldwide prevalence of
physical inactivity and its association with human development index in 76 countries. Prev
Med 53: 24-28, 2011.
36. Dunstan DW, Howard B, Healy GN, and Owen N. Too much sitting - A health
hazard. Diabetes Res Clin Pr 97: 368-376, 2012.
37. Dunstan DW, Salmon J, Owen N, Armstrong T, Zimmet PZ, Welborn TA,
Cameron AJ, Dwyer T, Jolley D, Shaw JE, and Comm AS. Physical activity and
television viewing in relation to risk of undiagnosed abnormal glucose metabolism in
adults. Diabetes Care 27: 2603-2609, 2004.
38. Duvivier BM, Schaper NC, Bremers MA, van Crombrugge G, Menheere PP,
Kars M, and Savelberg HH. Minimal intensity physical activity (standing and walking)
of longer duration improves insulin action and plasma lipids more than shorter periods of
moderate to vigorous exercise (cycling) in sedentary subjects when energy expenditure is
comparable. PLoS One 8: e55542, 2013.
39. Ekelund U, Steene-Johannessen J, Brown WJ, Fagerland MW, Owen N,
Powell KE, Bauman A, and Lee IM. Does physical activity attenuate, or even eliminate,
the detrimental association of sitting time with mortality? A harmonised meta-analysis of
data from more than 1 million men and women. Lancet 388: 1302-1310, 2016.
40. Farah N, Malkova D, and Gill J. Effects of exercise on postprandial responses to
ad libitum feeding in overweight men. Medicine and science in sports and exercise 42:
2015-2022, 2010.
41. Farrell PA, Wilmore JH, Coyle EF, Billing JE, and Costill DL. Plasma Lactate
Accumulation And Distance Running Performance. Medicine and science in sports and
exercise 11: 338-344, 1979.
42. Fielding BA, Callow J, Owen RM, Samra JS, Matthews DR, and Frayn KN.
Postprandial lipemia: the origin of an early peak studied by specific dietary fatty acid intake
during sequential meals. Am J Clin Nutr 63: 36-41, 1996.
150
43. Fletcher B, Berra K, Ades P, Braun LT, Burke LE, Durstine JL, Fair JM,
Fletcher GF, Goff D, Hayman LL, Hiatt WR, Miller NH, Krauss R, Kris-Etherton P,
Stone N, Wilterdink J, and Winston M. Managing abnormal blood lipids - A
collaborative approach. Circulation 112: 3184-3209, 2005.
44. Ford ES, Giles WH, and Dietz WH. Prevalence of the metabolic syndrome among
US adults - Findings from the Third National Health and Nutrition Examination Survey.
Jama-J Am Med Assoc 287: 356-359, 2002.
45. Freese EC, Gist NH, Acitelli RM, McConnell WJ, Beck CD, Hausman DB,
Murrow JR, Cureton KJ, and Evans EM. Acute and chronic effects of sprint interval
exercise on postprandial lipemia in women at-risk for the metabolic syndrome. Journal of
applied physiology (Bethesda, Md : 1985) 118: 872-879, 2015.
46. Freese EC, Gist NH, and Cureton KJ. Effect of prior exercise on postprandial
lipemia: an updated quantitative review. Journal of Applied Physiology 116: 67-75, 2013.
47. Freese EC, Levine AS, Chapman DP, Hausman DB, and Cureton KJ. Effects
of acute sprint interval cycling and energy replacement on postprandial lipemia. Journal of
Applied Physiology 111: 1584-1589 %@ 8750-7587, 2011.
48. Gabriel B, Ratkevicius A, Gray P, Frenneaux MP, and Gray SR. High-intensity
exercise attenuates postprandial lipaemia and markers of oxidative stress. Clinical science
123: 313-321 %@ 0143-5221, 2012.
49. Garber CE, Blissmer B, Deschenes MR, Franklin BA, Lamonte MJ, Lee IM,
Nieman DC, Swain DP, and American College of Sports M. American College of Sports
Medicine position stand. Quantity and quality of exercise for developing and maintaining
cardiorespiratory, musculoskeletal, and neuromotor fitness in apparently healthy adults:
guidance for prescribing exercise. Med Sci Sports Exerc 43: 1334-1359, 2011.
50. Ghisi GL, Durieux A, Pinho R, and Benetti M. Physical exercise and endothelial
dysfunction. Arq Bras Cardiol 95: e130-137, 2010.
51. Giannotti G, and Landmesser U. Endothelial dysfunction as an early sign of
atherosclerosis. Herz 32: 568-572, 2007.
52. Gill JM, and Hardman AE. Postprandial lipemia: effects of exercise and
restriction of energy intake compared. The American journal of clinical nutrition 71: 465-
471, 2000.
53. Gill JMR, Frayn KN, Wootton SA, Miller GJ, and Hardman AE. Effects of
prior moderate exercise on exogenous and endogenous lipid metabolism and plasma factor
VII activity. Clin Sci 100: 517-527, 2001.
54. Gill JMR, Herd SL, Vora V, and Hardman AE. Effects of a brisk walk on
lipoprotein lipase activity and plasma triglyceride concentrations in the fasted and
postprandial states. European journal of applied physiology 89: 184-190, 2003.
55. Ginsberg HN, Zhang YL, and Hernandez-Ono A. Regulation of plasma
triglycerides in insulin resistance and diabetes. Arch Med Res 36: 232-240, 2005.
56. Goldberg IJ. Hypertriglyceridemia: impact and treatment. Endocrinol Metab Clin
North Am 38: 137-149, 2009.
57. Grassi B. Oxygen uptake kinetics: old and recent lessons from experiments on
isolated muscle in situ. European journal of applied physiology 90: 242-249, 2003.

151
58. Greiwe JS, Holloszy JO, and Semenkovich CF. Exercise induces lipoprotein
lipase and GLUT-4 protein in muscle independent of adrenergic-receptor signaling.
Journal of applied physiology (Bethesda, Md : 1985) 89: 176-181, 2000.
59. Griffin BA. Lipoprotein atherogenicity: an overview of current mechanisms.
Proceedings of the Nutrition Society 58: 163-169 %@ 1475-2719, 1999.
60. Hallal PC, Andersen LB, Bull FC, Guthold R, Haskell W, and Ekelund U.
Global physical activity levels: surveillance progress, pitfalls, and prospects. Lancet 380:
247-257, 2012.
61. Hambrecht R, Wolf A, Gielen S, Linke A, Hofer J, Erbs S, Schoene N, and
Schuler G. Effect of exercise on coronary endothelial function in patients with coronary
artery disease. N Engl J Med 342: 454-460, 2000.
62. Hamilton MT, Areiqat E, Hamilton DG, and Bey L. Plasma triglyceride
metabolism in humans and rats during aging and physical inactivity. Int J Sport Nutr Exerc
Metab 11 Suppl: S97-104, 2001.
63. Hamilton MT, Hamilton DG, and Zderic TW. Exercise physiology versus
inactivity physiology: an essential concept for understanding lipoprotein lipase regulation.
Exercise and sport sciences reviews 32: 161-166, 2004.
64. Hamilton MT, Hamilton DG, and Zderic TW. Role of low energy expenditure
and sitting in obesity, metabolic syndrome, type 2 diabetes, and cardiovascular disease.
Diabetes 56: 2655-2667, 2007.
65. Hamilton MT, Healy GN, Dunstan DW, Zderic TW, and Owen N. Too Little
Exercise and Too Much Sitting: Inactivity Physiology and the Need for New
Recommendations on Sedentary Behavior. Current cardiovascular risk reports 2: 292-
298, 2008.
66. Hardman AE, Lawrence JE, and Herd SL. Postprandial lipemia in endurance-
trained people during a short interruption to training. Journal of applied physiology
(Bethesda, Md : 1985) 84: 1895-1901, 1998.
67. Harrison M, O'Gorman DJ, McCaffrey N, Hamilton MT, Zderic TW, Carson
BP, and Moyna NM. Influence of acute exercise with and without carbohydrate
replacement on postprandial lipid metabolism. Journal of Applied Physiology 106: 943-
949, 2009.
68. Health UDo, and Services H. 2008 physical activity guidelines for Americans: Be
active, healthy, and happy! http://www/ health gov/paguidelines 2008.
69. Healy GN, Dunstan DW, Salmon J, Cerin E, Shaw JE, Zimmet PZ, and Owen
N. Breaks in sedentary time: beneficial associations with metabolic risk. Diabetes Care 31:
661-666, 2008.
70. Healy GN, Dunstan DW, Salmon J, Shaw JE, Zimmet PZ, and Owen N.
Television time and continuous metabolic risk in physically active adults. Medicine and
science in sports and exercise 40: 639-645, 2008.
71. Healy GN, Matthews CE, Dunstan DW, Winkler EAH, and Owen N. Sedentary
time and cardio-metabolic biomarkers in US adults: NHANES 2003-06. Eur Heart J 32:
590-597, 2011.

152
72. Healy GN, Wijndaele K, Dunstan DW, Shaw JE, Salmon J, Zimmet PZ, and
Owen N. Objectively measured sedentary time, physical activity, and metabolic risk.
Diabetes care 31: 369-371, 2008.
73. Hellerstein MK, Schwarz J-M, and Neese RA. Regulation of hepatic de novo
lipogenesis in humans. Annual review of nutrition 16: 523-557 %@ 0199-9885, 1996.
74. Henson J, Davies MJ, Bodicoat DH, Edwardson CL, Gill JM, Stensel DJ,
Tolfrey K, Dunstan DW, Khunti K, and Yates T. Breaking Up Prolonged Sitting With
Standing or Walking Attenuates the Postprandial Metabolic Response in Postmenopausal
Women: A Randomized Acute Study. Diabetes Care 39: 130-138, 2016.
75. Herbert PN, Bernier DN, Cullinane EM, Edelstein L, Kantor MA, and
Thompson PD. High-density lipoprotein metabolism in runners and sedentary men. Jama
252: 1034-1037 %@ 0098-7484, 1984.
76. Herd SL, Kiens B, Boobis LH, and Hardman AE. Moderate exercise,
postprandial lipemia, and skeletal muscle lipoprotein lipase activity. Metabolism 50: 756-
762, 2001.
77. Herd SL, Lawrence JE, Malkova D, Murphy MH, Mastana S, and Hardman
AE. Postprandial lipemia in young men and women of contrasting training status. Journal
of applied physiology (Bethesda, Md : 1985) 89: 2049-2056, 2000.
78. Herrington W, Lacey B, Sherliker P, Armitage J, and Lewington S.
Epidemiology of Atherosclerosis and the Potential to Reduce the Global Burden of
Atherothrombotic Disease. Circulation Research 118: 535-546, 2016.
79. Hokanson JE, and Austin MA. Plasma triglyceride level is a risk factor for
cardiovascular disease independent of high-density lipoprotein cholesterol level: a
metaanalysis of population-based prospective studies. Journal of cardiovascular risk 3:
213-219 %@ 1350-6277, 1996.
80. Holloszy J, Rennie M, Hickson R, Conlee R, and Hagberg J. Physiological
consequences of the biochemical adaptations to endurance exercise. Annals of the New
York Academy of Sciences 301: 440-450, 1977.
81. Holloszy JO. REGULATION BY EXERCISE OF SKELETAL MUSCLE
CONTENT OF MITOCHONDRIA AND GLUT4. J Physiol Pharmacol 59: 5-18, 2008.
82. Holloszy JO, and Kohrt WM. Regulation of carbohydrate and fat metabolism
during and after exercise. Annu Rev Nutr 16: 121-138, 1996.
83. Holloszy JO, Skinner JS, Toro G, and Cureton TK. Effects of a Six Month
Program of Endurance Exercise on the Serum Lipids of Middle-Aged Man. Am J Cardiol
14: 753-760, 1964.
84. Hu FB, Li TY, Colditz GA, Willett WC, and Manson JE. Television watching
and other sedentary behaviors in relation to risk of obesity and type 2 diabetes mellitus in
women. Jama-J Am Med Assoc 289: 1785-1791, 2003.
85. Hurren NM, Eves FF, and Blannin AK. Is the effect of prior exercise on
postprandial lipaemia the same for a moderate-fat meal as it is for a high-fat meal? Brit J
Nutr 105: 506-516, 2011.
86. Hussain MM. A proposed model for the assembly of chylomicrons.
Atherosclerosis 148: 1-15, 2000.

153
87. Hyson D, Rutledge JC, and Berglund L. Postprandial lipemia and cardiovascular
disease. Curr Atheroscler Rep 5: 437-444, 2003.
88. Jackson KG, Poppitt SD, and Minihane AM. Postprandial lipemia and
cardiovascular disease risk: Interrelationships between dietary, physiological and genetic
determinants. Atherosclerosis 220: 22-33 %@ 0021-9150, 2012.
89. Jacobs I, Lithell H, and Karlsson J. Dietary effects on glycogen and lipoprotein
lipase activity in skeletal muscle in man. Acta physiologica Scandinavica 115: 85-90, 1982.
90. Jefferis BJ, Sartini C, Shiroma E, Whincup PH, Wannamethee SG, and Lee
IM. Duration and breaks in sedentary behaviour: accelerometer data from 1566
community-dwelling older men (British Regional Heart Study). British journal of sports
medicine 49: 1591-1594, 2015.
91. Kantor MA, Cullinane EM, Herbert PN, and Thompson PD. Acute increase in
lipoprotein lipase following prolonged exercise. Metabolism 33: 454-457, 1984.
92. Katsanos CS, Grandjean PW, and Moffatt RJ. Effects of low and moderate
exercise intensity on postprandial lipemia and postheparin plasma lipoprotein lipase
activity in physically active men. Journal of Applied Physiology 96: 181-188, 2004.
93. Katzmarzyk PT, Church TS, Craig CL, and Bouchard C. Sitting Time and
Mortality from All Causes, Cardiovascular Disease, and Cancer. Medicine and science in
sports and exercise 41: 998-1005, 2009.
94. Kawamoto E, Tamakoshi K, Ra S-G, Masuda H, and Kawanaka K.
Immobilization rapidly induces thioredoxin-interacting protein gene expression together
with insulin resistance in rat skeletal muscle. Journal of Applied Physiology 125: 596-604,
2018.
95. Kemi OJ, Haram PM, Loennechen JP, Osnes JB, Skomedal T, Wisloff U, and
Ellingsen O. Moderate vs. high exercise intensity: differential effects on aerobic fitness,
cardiomyocyte contractility, and endothelial function. Cardiovasc Res 67: 161-172, 2005.
96. Kesaniemi YA, Danforth E, Jensen MD, Kopelman PG, Lefèbvre P, and
Reeder BA. Dose-response issues concerning physical activity and health: an evidence-
based symposium. Medicine & Science in Sports & Exercise 33: S351-S358, 2001.
97. Kiens B, Lithell H, Mikines KJ, and Richter EA. Effects of insulin and exercise
on muscle lipoprotein lipase activity in man and its relation to insulin action. The Journal
of clinical investigation 84: 1124-1129, 1989.
98. Kim I-Y, Park S, Chou T-H, Trombold JR, and Coyle EF. Prolonged Sitting
Negatively Affects the Postprandial Plasma Triglyceride Lowering Effect of Acute
Exercise. American Journal of Physiology - Endocrinology And Metabolism 2016.
99. Kim IY, Park S, Trombold JR, and Coyle EF. Effects of Moderate- and
Intermittent Low-Intensity Exercise on Postprandial Lipemia. Medicine and science in
sports and exercise 46: 1882-1890, 2014.
100. King AC. The coming of age of behavioral research in physical activity. Annals of
Behavioral Medicine 23: 227-228, 2001.
101. Knuth AG, and Hallal PC. Temporal trends in physical activity: a systematic
review. Journal of physical activity & health 6: 548-559, 2009.

154
102. Kochanek KD, Murphy SL, Xu J, and Arias E. Mortality in the United States,
2016. NCHS Data Brief, no 293. National Center for Health Statistics 2017.
103. Kodama S, Saito K, Tanaka S, and et al. Cardiorespiratory fitness as a
quantitative predictor of all-cause mortality and cardiovascular events in healthy men and
women: A meta-analysis. JAMA 301: 2024-2035, 2009.
104. Kohl HW. Physical activity and cardiovascular disease: evidence for a dose
response. Medicine and science in sports and exercise 33: S472-S483, 2001.
105. Kohl HW, Craig CL, Lambert EV, Inoue S, Alkandari JR, Leetongin G,
Kahlmeier S, and Group LPASW. The pandemic of physical inactivity: global action for
public health. The Lancet 380: 294-305, 2012.
106. Kokkinos P, and Myers J. Exercise and physical activity: clinical outcomes and
applications. Circulation 122: 1637-1648, 2010.
107. Kraus WE, Janz KF, Powell KE, Campbell WW, Jakicic JM, Troiano RP,
Sprow K, Torres A, and Piercy KL. Daily Step Counts for Measuring Physical Activity
Exposure and Its Relation to Health. Medicine & Science in Sports & Exercise 51: 1206-
1212, 2019.
108. Krogh-Madsen R, Pedersen M, Solomon TPJ, Knudsen SH, Hansen LS,
Karstoft K, Lehrskov-Schmidt L, Pedersen KK, Thomsen C, Holst JJ, and Pedersen
BK. Normal physical activity obliterates the deleterious effects of a high-caloric intake.
Journal of Applied Physiology 116: 231-239, 2014.
109. Krogh-Madsen R, Thyfault JP, Broholm C, Mortensen OH, Olsen RH,
Mounier R, Plomgaard P, van Hall G, Booth FW, and Pedersen BK. A 2-wk reduction
of ambulatory activity attenuates peripheral insulin sensitivity. Journal of applied
physiology (Bethesda, Md : 1985) 108: 1034-1040, 2010.
110. Lambernd S, Taube A, Schober A, Platzbecker B, Görgens S, Schlich R,
Jeruschke K, Weiss J, Eckardt K, and Eckel J. Contractile activity of human skeletal
muscle cells prevents insulin resistance by inhibiting pro-inflammatory signalling
pathways. Diabetologia 55: 1128-1139, 2012.
111. Lee IM, Shiroma EJ, Kamada M, Bassett DR, Matthews CE, and Buring JE.
Association of Step Volume and Intensity With All-Cause Mortality in Older Women.
JAMA internal medicine 2019.
112. Lee IM, Shiroma EJ, Lobelo F, Puska P, Blair SN, and Katzmarzyk PT. Impact
of Physical Inactivity on the World’s Major Non-Communicable Diseases. Lancet 380:
219-229, 2012.
113. Levine JA. Nonexercise activity thermogenesis–liberating the life‐force. Journal
of internal medicine 262: 273-287, 2007.
114. Levine JA, Eberhardt NL, and Jensen MD. Role of nonexercise activity
thermogenesis in resistance to fat gain in humans. Science (New York, NY) 283: 212-214,
1999.
115. Lithell H, Karlstrom B, Selinus I, Vessby B, and Fellstrom B. Is muscle
lipoprotein lipase inactivated by ordinary amounts of dietary carbohydrates? Human
nutrition Clinical nutrition 39: 289-295, 1985.

155
116. Long Y, Barnes B, Mahlapuu M, Steiler T, Martinsson S, Leng Y, Wallberg-
Henriksson H, Andersson L, and Zierath J. Role of AMP-activated protein kinase in the
coordinated expression of genes controlling glucose and lipid metabolism in mouse white
skeletal muscle. Diabetologia 48: 2354-2364, 2005.
117. Lusis AJ. Atherosclerosis. Nature 407: 233-241, 2000.
118. Lusk G. Animal calorimetry. Twenty-fourth paper. Analysis of the oxidation of
mixtures of carbohydrate and fat. A correction. Journal of Biological Chemistry 59: 41-42,
1924.
119. Macfarlane DJ, Chan D, Chan KL, Ho EYK, and Lee CCY. Using three
objective criteria to examine pedometer guidelines for free-living individuals. European
journal of applied physiology 104: 435, 2008.
120. Malkova D, Evans RD, Frayn KN, Humphreys SM, Jones PR, and Hardman
AE. Prior exercise and postprandial substrate extraction across the human leg. American
journal of physiology Endocrinology and metabolism 279: E1020-1028, 2000.
121. Manninen V, Tenkanen L, Koskinen P, Huttunen JK, Manttari M, Heinonen
OP, and Frick MH. Joint effects of serum triglyceride and LDL cholesterol and HDL
cholesterol concentrations on coronary heart disease risk in the Helsinki Heart Study.
Implications for treatment. Circulation 85: 37-45, 1992.
122. Manson JE, Greenland P, LaCroix AZ, Stefanick ML, Mouton CP, Oberman
A, Perri MG, Sheps DS, Pettinger MB, and Siscovick DS. Walking compared with
vigorous exercise for the prevention of cardiovascular events in women. N Engl J Med 347:
716-725, 2002.
123. Maraki M, Magkos F, Christodoulou N, Aggelopoulou N, Skenderi KR,
Panagiotakos D, Kavouras SA, and Sidossis LS. One day of moderate energy deficit
reduces fasting and postprandial triacylglycerolemia in women: The role of calorie
restriction and exercise. Clin Nutr 29: 459-463, 2010.
124. Maraki MI, and Sidossis LS. The latest on the effect of prior exercise on
postprandial lipaemia. Sports Med 43: 463-481, 2013.
125. McGuire DK, Levine BD, Williamson JW, Snell PG, Blomqvist CG, Saltin B,
and Mitchell JH. A 30-year follow-up of the Dallas bed rest and training study.
Circulation 104: 1358-1366, 2001.
126. McGuire S. US department of agriculture and US department of health and human
services, dietary guidelines for americans, 2010. Washington, DC: US government printing
office, January 2011. Oxford University Press, 2011.
127. McManus AM, Ainslie PN, Green DJ, Simair RG, Smith K, and Lewis N.
Impact of prolonged sitting on vascular function in young girls. Exp Physiol 100: 1379-
1387, 2015.
128. Mikus CR, Oberlin DJ, Libla JL, Taylor AM, Booth FW, and Thyfault JP.
Lowering physical activity impairs glycemic control in healthy volunteers. Medicine and
science in sports and exercise 44: 225-231, 2012.
129. Miyashita M, Burns SF, and Stensel DJ. Accumulating short bouts of brisk
walking reduces postprandial plasma triacylglycerol concentrations and resting blood

156
pressure in healthy young men. American Journal of Clinical Nutrition 88: 1225-1231,
2008.
130. Miyashita M, Burns SF, and Stensel DJ. Acute Effects of Accumulating Exercise
on Postprandial Lipemia and C-Reactive Protein Concentrations in Young Men. Int J Sport
Nutr Exe 19: 569-582, 2009.
131. Montero D, and Lundby C. Refuting the myth of non‐response to exercise
training:‘non‐responders’ do respond to higher dose of training. The Journal of Physiology
595: 3377-3387, 2017.
132. Morishima T, Restaino RM, Walsh LK, Kanaley JA, Fadel PJ, and Padilla J.
Prolonged sitting-induced leg endothelial dysfunction is prevented by fidgeting. Am J
Physiol Heart Circ Physiol 311: H177-182, 2016.
133. Morris JN, Heady J, Raffle P, Roberts C, and Parks J. Coronary heart-disease
and physical activity of work. The Lancet 262: 1111-1120, 1953.
134. Mozaffarian D, Benjamin EJ, Go AS, Arnett DK, Blaha MJ, Cushman M, de
Ferranti S, Despres JP, Fullerton HJ, Howard VJ, Huffman MD, Judd SE, Kissela
BM, Lackland DT, Lichtman JH, Lisabeth LD, Liu SM, Mackey RH, Matchar DB,
McGuire DK, Mohler ER, Moy CS, Muntner P, Mussolino ME, Nasir K, Neumar
RW, Nichol G, Palaniappan L, Pandey DK, Reeves MJ, Rodriguez CJ, Sorlie PD,
Stein J, Towfighi A, Turan TN, Virani SS, Willey JZ, Woo D, Yeh RW, Turner MB,
Comm AHAS, and Subcomm SS. Executive Summary: Heart Disease and Stroke
Statistics-2015 Update A Report From the American Heart Association. Circulation 131:
434-441, 2015.
135. Mudau M, Genis A, Lochner A, and Strijdom H. Endothelial dysfunction: the
early predictor of atherosclerosis. Cardiovasc J Afr 23: 222-231, 2012.
136. Murias JM, Spencer MD, Pogliaghi S, and Paterson DH. Noninvasive
estimation of microvascular O2 provision during exercise on-transients in healthy young
males. American journal of physiology Regulatory, integrative and comparative
physiology 303: R815-823, 2012.
137. National Center for Health Statistics. In: Health, United States, 2015: With
Special Feature on Racial and Ethnic Health Disparities. Hyattsville, MD: 2016.
138. Navab M, Fogelman AM, Berliner JA, Territo MC, Demer LL, Frank JS,
Watson AD, Edwards PA, and Lusis AJ. Pathogenesis of atherosclerosis. Am J Cardiol
76: 18C-23C, 1995.
139. Network SBR. Letter to the editor: standardized use of the terms "sedentary" and
"sedentary behaviours". Applied physiology, nutrition, and metabolism = Physiologie
appliquee, nutrition et metabolisme 37: 540-542, 2012.
140. Nichols AV. Functions and interrelationships of different classes of plasma
lipoproteins. Proc Natl Acad Sci U S A 64: 1128-1137, 1969.
141. Niemi T, and Nikkila EA. Effect of age on the lipemia clearing activity of serum
after administration of heparin to human subjects. Journal of gerontology 12: 44-47, 1957.
142. Nordestgaard BG, Benn M, Schnohr P, and Tybjaerg-Hansen A. Nonfasting
Triglycerides and Risk of Myocardial Infarction, Ischemic Heart Disease, and Death in
Men and Women. JAMA 298: 299-308, 2007.

157
143. O'Keefe JH, Vogel R, Lavie CJ, and Cordain L. Achieving Hunter-gatherer
Fitness in the 21st Century: Back to the Future. The American Journal of Medicine 123:
1082-1086, 2010.
144. Ockner RK, Hughes FB, and Isselbacher KJ. Very low density lipoproteins in
intestinal lymph: role in triglyceride and cholesterol transport during fat absorption. The
Journal of clinical investigation 48: 2367-2373 %@ 0021-9738, 1969.
145. Olsen RH, Krogh-Madsen R, Thomsen C, Booth FW, and Pedersen BK.
Metabolic responses to reduced daily steps in healthy nonexercising men. JAMA 299:
1261-1263, 2008.
146. Owen N, Healy GN, Matthews CE, and Dunstan DW. Too much sitting: the
population health science of sedentary behavior. Exercise and sport sciences reviews 38:
105-113, 2010.
147. Owen N, Sparling PB, Healy GN, Dunstan DW, and Matthews CE. Sedentary
behavior: emerging evidence for a new health risk. Elsevier, 2010, p. 1138-1141 %@ 0025-
6196.
148. Pate RR, O'Neill JR, and Lobelo F. The evolving definition of "sedentary".
Exercise and sport sciences reviews 36: 173-178, 2008.
149. Pate RR, Pratt M, Blair SN, Haskell WL, Macera CA, Bouchard C, Buchner
D, Ettinger W, Heath GW, King AC, and et al. Physical activity and public health. A
recommendation from the Centers for Disease Control and Prevention and the American
College of Sports Medicine. Jama 273: 402-407, 1995.
150. Patel AV, Bernstein L, Deka A, Feigelson HS, Campbell PT, Gapstur SM,
Colditz GA, and Thun MJ. Leisure time spent sitting in relation to total mortality in a
prospective cohort of US adults. Am J Epidemiol 172: 419-429, 2010.
151. Paton CM, Brandauer J, Weiss EP, Brown MD, Ivey FM, Roth SM, and
Hagberg JM. Hemostatic response to postprandial lipemia before and after exercise
training. J Appl Physiol 101: 316-321, 2006.
152. Patsch JR, Miesenböck G, Hopferwieser T, Mühlberger V, Knapp E, Dunn
JK, Gotto A, and Patsch W. Relation of triglyceride metabolism and coronary artery
disease. Studies in the postprandial state. Arteriosclerosis, Thrombosis, and Vascular
Biology 12: 1336-1345, 1992.
153. Peddie MC, Bone JL, Rehrer NJ, Skeaff CM, Gray AR, and Perry TL.
Breaking prolonged sitting reduces postprandial glycemia in healthy, normal-weight
adults: a randomized crossover trial. Am J Clin Nutr 98: 358-366, 2013.
154. Pedersen BK, and Saltin B. Exercise as medicine - evidence for prescribing
exercise as therapy in 26 different chronic diseases. Scandinavian Journal of Medicine &
Science in Sports 25: 1-72, 2015.
155. Pfeiffer M, Ludwig T, Wenk C, and Colombani PC. The influence of walking
performed immediately before meals with moderate fat content on postprandial lipemia.
Lipids in health and disease 4: 24, 2005.
156. Pfeiffer M, Wenk C, and Colombani PC. The influence of 30 minutes of light to
moderate intensity cycling on postprandial lipemia. European journal of cardiovascular
prevention and rehabilitation : official journal of the European Society of Cardiology,

158
Working Groups on Epidemiology & Prevention and Cardiac Rehabilitation and Exercise
Physiology 13: 363-368, 2006.
157. Piercy KL, Troiano RP, Ballard RM, Carlson SA, Fulton JE, Galuska DA,
George SM, and Olson RD. The Physical Activity Guidelines for Americans. JAMA 320:
2020-2028, 2018.
158. Plaisance EP, Mestek ML, Mahurin AJ, Taylor JK, Moncada-Jimenez J, and
Grandjean PW. Postprandial triglyceride responses to aerobic exercise and extended-
release niacin. American Journal of Clinical Nutrition 88: 30-37, 2008.
159. Rogers MA, Yamamoto C, King DS, Hagberg JM, Ehsani AA, and Holloszy
JO. Improvement in glucose tolerance after 1 wk of exercise in patients with mild NIDDM.
Diabetes care 11: 613-618, 1988.
160. Rognmo O, Bjornstad TH, Kahrs C, Tjonna AE, Bye A, Haram PM, Stolen T,
Slordahl SA, and Wisloff U. Endothelial function in highly endurance-trained men:
effects of acute exercise. J Strength Cond Res 22: 535-542, 2008.
161. Rowe DA, Kemble CD, Robinson TS, and Mahar MT. Daily walking in older
adults: day-to-day variability and criterion-referenced validity of total daily step counts.
Journal of physical activity & health 4: 434-446, 2007.
162. Saltin B, Blomqvist G, Mitchell JH, Johnson Jr RL, Wildenthal K, and
Chapman CB. Response to exercise after bed rest and after training. Circulation 38: VII1-
78, 1968.
163. Schuna JM, Jr., Johnson WD, and Tudor-Locke C. Adult self-reported and
objectively monitored physical activity and sedentary behavior: NHANES 2005-2006. The
international journal of behavioral nutrition and physical activity 10: 126, 2013.
164. Seip RL, Angelopoulos TJ, and Semenkovich CF. Exercise induces human
lipoprotein lipase gene expression in skeletal muscle but not adipose tissue. American
Journal of Physiology-Endocrinology And Metabolism 268: E229-E236, 1995.
165. Seip RL, Mair K, Cole TG, and Semenkovich CF. Induction of human skeletal
muscle lipoprotein lipase gene expression by short-term exercise is transient. American
Journal of Physiology-Endocrinology and Metabolism 272: E255-E261, 1997.
166. Shad BJ, Thompson JL, Holwerda AM, Stocks B, Elhassan YS, Philp A, and
Wallis G. One Week of Step Reduction Lowers Myofibrillar Protein Synthesis Rates in
Young Men. Medicine and science in sports and exercise 2019.
167. Silvestre R, Kraemer WJ, Quann EE, Seip RL, Maresh CM, Vingren JL,
Hatfield DL, and Volek JS. Effects of exercise at different times on postprandial lipemia
and endothelial function. Med Sci Sports Exerc 40: 264-274, 2008.
168. Silvestre R, Kraemer WJ, Quann EE, Seip RL, Maresh CM, Vingren JL,
Hatfield DL, and Volek JS. Effects of exercise at different times on postprandial lipemia
and endothelial function. Med Sci Sport Exer 40: 264-274, 2008.
169. Smith BK, Sun GY, Donahue OM, and Thomas TR. Exercise plus n-3 fatty
acids: Additive effect on postprandial lipemia. Metab-Clin Exp 53: 1365-1371, 2004.
170. Soroush A, Der Ananian C, Ainsworth BE, Belyea M, Poortvliet E, Swan PD,
Walker J, and Yngve A. Effects of a 6-month walking study on blood pressure and

159
cardiorespiratory fitness in US and swedish adults: ASUKI step study. Asian journal of
sports medicine 4: 114, 2013.
171. Tabas I. Lipids and atherosclerosis. In: Biochemistry of Lipids, Lipoproteins and
Membranes, edited by Vance D, and Vance J. Amsterdam: Elsevier, 2004, p. 573-597.
172. Tabas I, Williams KJ, and Boren J. Subendothelial lipoprotein retention as the
initiating process in atherosclerosis: update and therapeutic implications. Circulation 116:
1832-1844, 2007.
173. Tanaka T, Ordovas JM, Delgado-Lista J, Perez-Jimenez F, Marin C, Perez-
Martinez P, Gomez P, and Lopez-Miranda J. Peroxisome proliferator-activated receptor
alpha polymorphisms and postprandial lipemia in healthy men. J Lipid Res 48: 1402-1408,
2007.
174. Thomas TR, Fischer BA, Kist WB, Horner KE, and Cox RH. Effects of exercise
and n-3 fatty acids on postprandial lipemia. J Appl Physiol 88: 2199-2204, 2000.
175. Thompson PD, Cullinane E, Henderson LO, and Herbert PN. Acute Effects of
Prolonged Exercise on Serum-Lipids. Metab-Clin Exp 29: 662-665, 1980.
176. Thosar SS, Bielko SL, Mather KJ, Johnston JD, and Wallace JP. Effect of
prolonged sitting and breaks in sitting time on endothelial function. Med Sci Sports Exerc
47: 843-849, 2015.
177. Tipton CM. Susruta of India, an unrecognized contributor to the history of exercise
physiology. Journal of Applied Physiology 104: 1553-1556, 2008.
178. Tolfrey K, Bentley C, Goad M, Varley J, Willis S, and Barrett L. Effect of
energy expenditure on postprandial triacylglycerol in adolescent boys. European journal
of applied physiology 112: 23-31, 2012.
179. Tolfrey K, Doggett A, Boyd C, Pinner S, Sharples A, and Barrett L.
Postprandial triacylglycerol in adolescent boys: A case for moderate exercise. Medicine
and science in sports and exercise 40: 1049-1057, 2008.
180. Trappe SW, Costill DL, Vukovich MD, Jones J, and Melham T. Aging among
elite distance runners: a 22-yr longitudinal study. Journal of applied physiology (Bethesda,
Md : 1985) 80: 285-290, 1996.
181. Tremblay MS, Esliger DW, Tremblay A, and Colley R. Incidental movement,
lifestyle-embedded activity and sleep: new frontiers in physical activity assessment.
Canadian journal of public health = Revue canadienne de sante publique 98 Suppl 2:
S208-217, 2007.
182. Troiano RP, Berrigan D, Dodd KW, Masse LC, Tilert T, and McDowell M.
Physical activity in the United States measured by accelerometer. Medicine and science in
sports and exercise 40: 181, 2008.
183. Trombold JR, Christmas KM, Machin DR, Kim IY, and Coyle EF. Acute high-
intensity endurance exercise is more effective than moderate-intensity exercise for
attenuation of postprandial triglyceride elevation. Journal of applied physiology (Bethesda,
Md : 1985) 114: 792-800, 2013.
184. Trombold JR, Christmas KM, Machin DR, Van Pelt DW, Chou T-H, Kim I-
Y, and Coyle EF. Postexercise macronutrient intake and subsequent postprandial
triglyceride metabolism. Medicine & Science in Sports & Exercise 46: 2099-2106, 2014.
160
185. Tsetsonis NV, and Hardman AE. Effects of low and moderate intensity treadmill
walking on postprandial lipaemia in healthy young adults. European Journal of Applied
Physiology and Occupational Physiology 73: 419-426, 1996.
186. Tsetsonis NV, and Hardman AE. Reduction in postprandial lipemia after
walking: Influence of exercise intensity. Medicine and science in sports and exercise 28:
1235-1242, 1996.
187. Tsetsonis NV, Hardman AE, and Mastana SS. Acute effects of exercise on
postprandial lipemia: A comparative study in trained and untrained middle-aged women.
American Journal of Clinical Nutrition 65: 525-533, 1997.
188. Tudor-Locke C, Ainsworth BE, Thompson RW, and Matthews CE.
Comparison of pedometer and accelerometer measures of free-living physical activity.
Medicine and science in sports and exercise 34: 2045-2051, 2002.
189. Tudor-Locke C, and Bassett DR, Jr. How many steps/day are enough?
Preliminary pedometer indices for public health. Sports medicine (Auckland, NZ) 34: 1-8,
2004.
190. Tudor-Locke C, Bassett DR, Jr., Rutherford WJ, Ainsworth BE, Chan CB,
Croteau K, Giles-Corti B, Le Masurier G, Moreau K, Mrozek J, Oppert JM,
Raustorp A, Strath SJ, Thompson D, Whitt-Glover MC, Wilde B, and Wojcik JR.
BMI-referenced cut points for pedometer-determined steps per day in adults. Journal of
physical activity & health 5 Suppl 1: S126-139, 2008.
191. Tudor-Locke C, Craig CL, Thyfault JP, and Spence JC. A step-defined
sedentary lifestyle index: < 5000 steps/day. Applied Physiology Nutrition and Metabolism
38: 100-114, 2013.
192. Tudor-Locke C, Giles-Corti B, Knuiman M, and McCormack G. Tracking of
pedometer-determined physical activity in adults who relocate: results from RESIDE. The
international journal of behavioral nutrition and physical activity 5: 39, 2008.
193. Tudor-Locke C, Hart TL, and Washington TL. Expected values for pedometer-
determined physical activity in older populations. International Journal of Behavioral
Nutrition and Physical Activity 6: 59, 2009.
194. Tudor-Locke C, Johnson WD, and Katzmarzyk PT. Accelerometer-determined
steps per day in US adults. Medicine and science in sports and exercise 41: 1384-1391,
2009.
195. Tudor-Locke C, Leonardi C, Johnson WD, Katzmarzyk PT, and Church TS.
Accelerometer steps/day translation of moderate-to-vigorous activity. Preventive medicine
53: 31-33, 2011.
196. United States Bureau of Labor Statistics PO. American Time Use Survey - 2017.
2018.
197. van der Berg JD, Stehouwer CD, Bosma H, van der Velde JH, Willems PJ,
Savelberg HH, Schram MT, Sep SJ, van der Kallen CJ, and Henry RM. Associations
of total amount and patterns of sedentary behaviour with type 2 diabetes and the metabolic
syndrome: The Maastricht Study. Diabetologia 59: 709-718, 2016.

161
198. van der Ploeg HP, Chey T, Korda RJ, Banks E, and Bauman A. Sitting time
and all-cause mortality risk in 222 497 Australian adults. Arch Intern Med 172: 494-500,
2012.
199. Vogel RA, Corretti MC, and Plotnick GD. Effect of a single high-fat meal on
endothelial function in healthy subjects. American Journal of Cardiology 79: 350-354,
1997.
200. Walther C, Gielen S, and Hambrecht R. The effect of exercise training on
endothelial function in cardiovascular disease in humans. Exerc Sport Sci Rev 32: 129-134,
2004.
201. Wang H, and Eckel RH. Lipoprotein lipase: from gene to obesity. Am J Physiol
Endocrinol Metab 297: E271-288, 2009.
202. Wang H, and Eckel RH. Lipoprotein lipase: from gene to obesity. American
Journal of Physiology-Endocrinology and Metabolism 297: E271-E288, 2009.
203. Warburton DE, Charlesworth S, Ivey A, Nettlefold L, and Bredin SS. A
systematic review of the evidence for Canada's Physical Activity Guidelines for Adults.
International Journal of Behavioral Nutrition and Physical Activity 7: 39, 2010.
204. Weiss EP, Brandauer J, Kulaputana O, Ghiu IA, Wohn CR, Phares DA,
Shuldiner AR, and Hagberg JM. FABP2 Ala54Thr genotype is associated with
glucoregulatory function and lipid oxidation after a high-fat meal in sedentary nondiabetic
men and women. The American journal of clinical nutrition 85: 102-108, 2007.
205. Whitfield G, Gabriel KKP, and Kohl HW. When Meeting Physical Activity
Guidelines is not Enough: the Interplay of Sedentary and Active Behaviors. Journal of the
Japanese Association for Exercise Epidemiology 13: 30-35, 2011.
206. Whitfield G, Pettee Gabriel KK, and Kohl HW. Sedentary and active: self-
reported sitting time among marathon and half-marathon participants. Journal of physical
activity & health 11: 165-172, 2014.
207. WHO. Cardiovascular Diseases
http://www.who.int/mediacentre/factsheets/fs317/en/. [11/02/2017, 2017].
208. WHO. WHO Guidelines Approved by the Guidelines Review Committee. In:
Global Recommendations on Physical Activity for Health. Geneva: World Health
Organization
Copyright (c) World Health Organization 2010., 2010.
209. Williams KJ, and Tabas I. Lipoprotein retention--and clues for atheroma
regression. Arterioscler Thromb Vasc Biol 25: 1536-1540, 2005.
210. Wilson MC, Jackson VN, Heddle C, Price NT, Pilegaard H, Juel C, Bonen A,
Montgomery I, Hutter OF, and Halestrap AP. Lactic acid efflux from white skeletal
muscle is catalyzed by the monocarboxylate transporter isoform MCT3. The Journal of
biological chemistry 273: 15920-15926, 1998.
211. Wolfe AS, Burton HM, Vardarli E, and Coyle E. Interrupting Prolonged Sitting
with Intermittent Exercise: Effects on Postprandial Lipemia. (Unpublished).
212. Workman JM, and Armstrong BW. OXYGEN COST OF TREADMILL
WALKING. Journal of Applied Physiology 18: 798-&, 1963.

162
213. WorldHealthOrganization. Global health risks: mortality and burden of disease
attributable to selected major risks. World Health Organization, 2009.
214. WorldHealthOrganization. Physical Activity
http://www.who.int/topics/physical_activity/en/. [10/5/2016, 2016].
215. Wyatt HR, Peters JC, Reed GW, Barry M, and Hill JO. A Colorado statewide
survey of walking and its relation to excessive weight. Medicine and science in sports and
exercise 37: 724-730, 2005.
216. Yates T, Henson J, Khunti K, Morris DH, Edwardson C, Brady E, and Davies
MJ. Effect of physical activity measurement type on the association between walking
activity and glucose regulation in a high-risk population recruited from primary care.
International journal of epidemiology 42: 533-540, 2013.
217. Young DR, Hivert M-F, Alhassan S, Camhi SM, Ferguson JF, Katzmarzyk
PT, Lewis CE, Owen N, Perry CK, Siddique J, and Yong CM. Sedentary Behavior and
Cardiovascular Morbidity and Mortality. A Science Advisory From the American Heart
Association 2016.
218. Young DR, Hivert MF, Alhassan S, Camhi SM, Ferguson JF, Katzmarzyk PT,
Lewis CE, Owen N, Perry CK, Siddique J, Yong CM, Physical Activity Committee of
the Council on L, Cardiometabolic H, Council on Clinical C, Council on E,
Prevention, Council on Functional G, Translational B, and Stroke C. Sedentary
Behavior and Cardiovascular Morbidity and Mortality: A Science Advisory From the
American Heart Association. Circulation 2016.
219. Zafeiridis A, Goloi E, Petridou A, Dipla K, Mougios V, and Kellis S. Effects of
low- and high-volume resistance exercise on postprandial lipaemia. Brit J Nutr 97: 471-
477, 2007.
220. Zderic TW, and Hamilton MT. Physical inactivity amplifies the sensitivity of
skeletal muscle to the lipid-induced downregulation of lipoprotein lipase activity. J Appl
Physiol (1985) 100: 249-257, 2006.
221. Zhang JQ, Ji LL, Fretwell VS, and Nunez G. Effect of exercise on postprandial
lipemia in men with hypertriglyceridemia. European journal of applied physiology 98:
575-582, 2006.
222. Zhang JQ, Thomas TR, and Ball SD. Effect of exercise timing on postprandial
lipemia and HDL cholesterol subfractions. J Appl Physiol (1985) 85: 1516-1522, 1998.
223. Zilversmit DB. Atherogenesis: a postprandial phenomenon. Circulation 60: 473-
485, 1979.
224. Zilversmit DB. Atherogenic nature of triglycerides, postprandial lipidemia, and
triglyceride-rich remnant lipoproteins. Clin Chem 41: 153-158, 1995.
225. Zotou E, Magkos F, Koutsari C, Fragopoulou E, Nomikos T, Sidossis LS, and
Antonopoulou S. Acute resistance exercise attenuates fasting and postprandial
triglyceridemia in women by reducing triglyceride concentrations in triglyceride-rich
lipoproteins. European journal of applied physiology 110: 869-874, 2010.
Copyright © 2022 FDOKUMEN