Effects of fouling on the efficiency of heat exchangers in lignite utility boilers
11
Applied 771wrw1/Engirwwirtg Vol. 17. Nos. 8-10. pp. 739-749. 1997 (_ European Communities 1997. Published by Elsevier Science Ltd Printed in Great Britain Pergamon PII: s1359-4311(97)oooo6-9 1359-431 l/97 $17.00 + 0.00 EFFECTS OF FOULING ON THE EFFICIENCY OF HEAT EXCHANGERS IN LIGNITE UTILITY BOILERS G. Bergeles,* D. Bout-is,* M. Yianneskis,? S. Balabani,t A. Kravaritisf and S. Itskos$ *Laboratory of Aerodynamics, National Technical University of Athens, Heroon Polytechniou 5. 15700 Zografou, Athens, Greece, tCentre for Heat Transfer and Fluid Flow Measurement, King’s College London, Strand, London, WCZR 2LS, UK and ZPublic Power Corporation of Greece, Halkokondili 30, 10432, Athens, Greece Abstract-The work presented in this article is directed towards the understanding of the mechanism of ash deposition on the surfaces of tubes of heat exchangers in lignite utility boilers and the evaluation of the influence of fouling on heat exchanger efficiency. For this purpose a numerical model was developed to predict the deposition of particles onto the heat transfer surfaces. The deposition model is combined with a numerical procedure that solves the two phase flow and temperature field around the tubes of the heat exchanger. Predictions of the flow field in both in-line and staggered tube bundles are validated through comparisons with experimental measurements that are conducted in laboratory model geometries. Experimental techniques include laser-sheet flow visualisation and laser Doppler Anemometry (LDA). Observations in full scale geometries of lignite utility boiler heat exchangers that are in current operation are provided by the industrial partner. The results of the work performed indicate that the maximum deposit height on the surface of the first tube is reached in about two weeks for a staggered tube bundle arrangement. It is the actual spacing of the tube arrangement that plays an important role in reducing the fouling rate while closely spaced tubes in in-line arrangements show signs of bridge formation between subsequent tube rows. IQ European Communities 1997. Published by Elsevier Science Ltd. Keywords-Heat exchangers, fouling. ash deposition model, laser Doppler Anemometry NOMENCLATURE area Interfacial surface energy Young’s modulus of elasticity Poisson’s ratio constant-parameter of the strength of the deposit mass impacting mass flux mass deposition flux oarticle densitv ii? - P, - PL . l/2 mV’ is the initial kinetic energy of the particle the energy lost because of plasticdeformatibn the energy caused by attractive forces between particle and surface the energy that is dissipated because of elastic wave propagation the aerodynamic lift energy acting on a particle because of the velocity gradient on the particle radius of the sphere eroding shear stress fluid shear stress velocity normal to the surface tangential impact velocity tangential rebound velocity elastic yield limit INTRODUCTION This article presents work performed under a JOULE II research programme funded in part by the Commission of the European Communities in the framework of the JOULE II Programme. The work is performed through the collaboration of the Laboratory of Aerodynamics, N.T.U.A., the Centre for Heat Transfer and Fluid Flow Measurement, King’s College London and the Public Power Corporation of Greece. The main objective of the work is to understand the mechanism 739
-
Upload
independent -
Category
Documents
-
view
1 -
download
0
Transcript of Effects of fouling on the efficiency of heat exchangers in lignite utility boilers
Applied 771wrw1/ Engirwwirtg Vol. 17. Nos. 8-10. pp. 739-749. 1997 (_ European Communities 1997. Published by Elsevier Science Ltd
Printed in Great Britain Pergamon PII: s1359-4311(97)oooo6-9 1359-431 l/97 $17.00 + 0.00
EFFECTS OF FOULING ON THE EFFICIENCY OF HEAT EXCHANGERS IN LIGNITE UTILITY BOILERS
G. Bergeles,* D. Bout-is,* M. Yianneskis,? S. Balabani,t A. Kravaritisf and S. Itskos$
*Laboratory of Aerodynamics, National Technical University of Athens, Heroon Polytechniou 5. 15700 Zografou, Athens, Greece, tCentre for Heat Transfer and Fluid Flow Measurement, King’s
College London, Strand, London, WCZR 2LS, UK and ZPublic Power Corporation of Greece, Halkokondili 30, 10432, Athens, Greece
Abstract-The work presented in this article is directed towards the understanding of the mechanism of ash deposition on the surfaces of tubes of heat exchangers in lignite utility boilers and the evaluation of the influence of fouling on heat exchanger efficiency. For this purpose a numerical model was developed to predict the deposition of particles onto the heat transfer surfaces. The deposition model is combined with a numerical procedure that solves the two phase flow and temperature field around the tubes of the heat exchanger. Predictions of the flow field in both in-line and staggered tube bundles are validated through comparisons with experimental measurements that are conducted in laboratory model geometries. Experimental techniques include laser-sheet flow visualisation and laser Doppler Anemometry (LDA). Observations in full scale geometries of lignite utility boiler heat exchangers that are in current operation are provided by the industrial partner. The results of the work performed indicate that the maximum deposit height on the surface of the first tube is reached in about two weeks for a staggered tube bundle arrangement. It is the actual spacing of the tube arrangement that plays an important role in reducing the fouling rate while closely spaced tubes in in-line arrangements show signs of bridge formation between subsequent tube rows. IQ European Communities 1997. Published by Elsevier Science Ltd.
Keywords-Heat exchangers, fouling. ash deposition model, laser Doppler Anemometry
NOMENCLATURE
area Interfacial surface energy Young’s modulus of elasticity Poisson’s ratio constant-parameter of the strength of the deposit mass impacting mass flux mass deposition flux oarticle densitv ii? - P, - PL . l/2 mV’ is the initial kinetic energy of the particle the energy lost because of plasticdeformatibn the energy caused by attractive forces between particle and surface the energy that is dissipated because of elastic wave propagation the aerodynamic lift energy acting on a particle because of the velocity gradient on the particle radius of the sphere eroding shear stress fluid shear stress velocity normal to the surface tangential impact velocity tangential rebound velocity elastic yield limit
INTRODUCTION
This article presents work performed under a JOULE II research programme funded in part by the Commission of the European Communities in the framework of the JOULE II Programme. The work is performed through the collaboration of the Laboratory of Aerodynamics, N.T.U.A., the Centre for Heat Transfer and Fluid Flow Measurement, King’s College London and the Public Power Corporation of Greece. The main objective of the work is to understand the mechanism
739
740 G. Bergeles er nl.
of ash deposition on the surfaces of tubes of heat exchangers in lignite utility boilers and to evaluate the influence of fouling on heat exchanger efficiency. Heat exchanger fouling is a common problem in lignite utility boilers that leads to a reduction in heat transfer efficiency. An interesting evaluation of the economics of fouling can be found in [l].
In order to achieve the desired insight about the fouling phenomenon, a numerical model was developed to predict the mechanism of ash deposition onto the heat exchanger tubes. Many numerical models were developed to predict the fouling phenomenon, [2-4] are only a few who used exponential equations with different terms representing each mechanism of particle deposition or removal to predict the development of the thickness of the deposit in time. However, these models are not able to predict the distribution of the deposit layer on the surface of the tubes and therefore they cannot predict the effect of the deformed tube (because of the deposit layer) on the flow field. Also, with the exception of [3] and [4], the effect of turbulence was not taken into account. An extensive literature survey regarding gas-side fouling research was performed under the present project [5]. Through this research project a novel approach to the fouling mechanism is presented. Based on the energy balance of the impact of a solid particle with a solid surface, as presented by [6], a Lagrangian simulation of particle trajectories in turbulent flows [7] is used to simulate particle flow around the tubes of heat exchangers and to predict their deposition to the tube surface. The novelty of the present approach is that the energy balance is extended to include the influence of an aerodynamic lift force on the particle and the deposit build up is predicted based on a Kern and Seaton type exponential equation which was also extended to include the influence of the fluid shear and the eroding shear stress of the impacting particles on the mechanisms of deposit removal. Both these stresses are determined by the first part of the simulation.
Although the flow over a single cylinder has been extensively investigated experimentally, tube bundles have received less attention because of the complexity of the flows and the associated measurement difficulties. The problem is further complicated by the vast number of configurations encountered in practice, resulting in different flow patterns, and by the effects of parameters such as Reynolds number, surface roughness and free stream turbulence. Most of the early experimental studies were concerned with the overall pressure drop and heat transfer coefficients since these parameters are of prime interest in the design of heat exchangers. However, in order to establish reliable design and performance criteria for tube bundle heat exchangers and validate the numerical models, detailed and accurate velocity data are needed. Such data can be obtained with LDA measurements. Only a few LDA studies, concerned with specific tube arrangements, were reported. For example [8], reported detailed experimental data for the mean velocity and turbulence distributions through successive rows of a triangularly pitched staggered tube bank with a pitch to diameter ratio of 1.58 and Re, ranging from 60 000 to 110 000. [9] measured the two velocity components in a square array with a pitch to diameter ratio of 1.47 at Re, = 20 000 in flow of water. In a later article [lo], the flow development across the same staggered arrangement up to the sixth row was measured at a Re, = 18 000 and the results were compared with predictions from a numerical code employing the k-6 turbulence model.
In this study, the flow in staggered and in-line arrays was investigated experimentally under subcritical flow conditions (Re = 13 000). The configurations investigated were scale models of typical heat exchangers found in utility boilers where severe fouling is encountered mainly in the first 2-3 tube rows. Mean velocities, turbulence levels, pressure drop and recirculation characteristics were determined. Time-resolved measurements were carried out in order to determine the velocity spectra and to identify discrete periodicities. The data were analysed by removing periodic oscillations from the turbulence spectra and estimating associated quantities such as scales and dissipation rates.
Industrial observations of the phenomenon in operating utility boilers are also provided, allowing practical validation of the numerical and experimental findings. Chemical analysis of the lignite fuel, the fly ash and the deposits lead to more insight regarding the operating conditions of the boiler and the chemistry of the fouling phenomenon. The chemical composition is accompanied by size distributions which help in the understanding of the behaviour of the various particle sizes.
Effects of fouling on the efficiency of heat exchangers 741
EXPERIMENTAL MEASUREMENTS
Experimental measurements were performed by the Centre for Heat Transfer and Fluid Flow Measurement at King’s College London.
E,xpevimental ,facilities
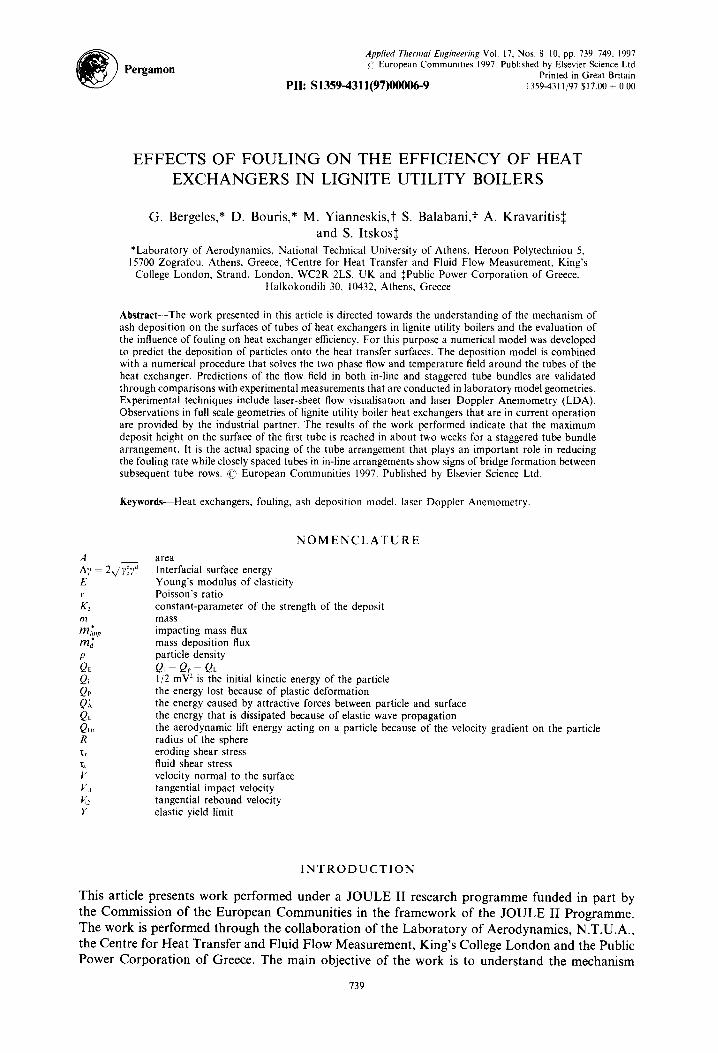
The experiments were performed in a purpose-designed water tunnel which was described in detail in [I 11. Three different tube bundle configurations were tested: in order to study the effect of tube spacing, two staggered arrays were employed; the transverse pitch ratio was 3.6 and the longitudinal ones were 1.6 and 2.1 respectively; the bundles consisted of 6 transverse rows of rods. An in-line array consisting of 5 transverse rows with pitch ratios of 3.6 and 2.1 respectively was investigated also, in order to study the effect of tube arrangement. All test sections were made of transparent cast acrylic with cast acrylic rods, 10 mm in diameter and had a square cross-section (72 x 72 mm). The length to diameter ratio of the rods was 7.2 so that measurements obtained at midspan could be considered free from end effects. The rods were rigidly mounted on the walls and half rods were fixed on the side walls to simulate an infinite tube bundle and minimise boundary layer effects. A schematic of two of the three tube bundle configurations and the co-ordinate system employed is shown in Fig. 1. Pressure tappings were installed in all test sections, upstream and downstream of the tube bundle, in order to determine the pressure drop across the bundle, which was measured with an inverted U-tube manometer.
Esperimen tal techniques
The laser Doppler system consisted of a single component 10 mW He-Ne laser operating in forward-scatter. The diameter and length of the control volume were 48.8 urn and 466 pm respectively. The light scattered by naturally occurring particles in the water was detected by a photomultiplier tube. The photomultiplier signal was processed by a frequency counter interfaced to a PC equipped with appropriate data acquisition software. The transmitting and receiving optics were mounted on a three-dimensional traversing mechanism so that the control volume could be positioned anywhere in the flow field. The positional accuracy in all three directions was 0.05 mm.
The flow approaching the tube bundles was uniform and, away from the side walls, two-dimensional. Detailed ensemble-averaged measurements of the axial and transverse velocity components were taken in the first 5 rows of all three configurations at Re, = 12 858 (subcritical flow conditions). The third component could only be measured in a few locations because of restricted optical access. All measurements were taken at the plane of symmetry (z/d = 0) and in the region 0.0 I ~‘/d I 1.8 since the flow was found to be symmetrical with respect to the x-axis.
C,=36 mm
I 1 I i
I &=I6 mm C,=21 mm I; ??
I , Cy=36 mm
. ??
t-e-3
t-$--t
Fig. 1. Cross-sections of staggered (Cs/d= 1.6, C,v/d = 3.6) and in-line (Cs/d = 2.1, Cyjd = 3.6) experimental tube arrangements.
742 G. Bergeles Ed al.
Detailed measurements were taken in the wake regions and relevant recirculating parameters were estimated. The pressure drop across the tube bundles was also measured. The effect of Re, on both the wake characteristics and the pressure drop was investigated in the range from 3 104 to 12 858.
Time-resolved LDA velocity measurements were carried out in the 3.6 x 1.6 staggered tube bundle in order to identify flow instabilities and study in detail the turbulence structure. From these measurements, the autocorrelation functions, power spectra, time and length scales of turbulence and the rates of dissipation of the turbulence kinetic energy were estimated. The accuracy of the mean velocity and turbulence level measurements was calculated as l%-5% and 5%-10% respectively, with the higher errors occurring in regions of steep velocity gradients. Numerical integration of the axial velocity profiles showed that mass conservation across the banks is established within 5%: because of the inherent interpolation errors in the integration, the experimental error in the velocity measurements is expected to be lower.
The experimental work described here was extended to study the effects of the tube surface roughness, tube shape and particle-laden flows. A liquid thermographic technique was developed and applied to determine quantitatively and qualitatively surface temperature distributions in convective flows over tube bundles. The above experimental work is described in detail in [12].
INDUSTRIAL OBSERVATIONS
Observations of fouling phenomena in operating lignite utility boilers were performed by the industrial partner the Public Power Corporation of Greece.
During the 1993 annual maintenance of the Coal power plant at Amyntaion-Filota, the inspection of boiler II revealed a coating of the metal side-walls of the furnace (water walls) and fouling of super heater II even at a height of 46 m. There were no deposits present on the inclined metal area of the furnace but erosion was evident.
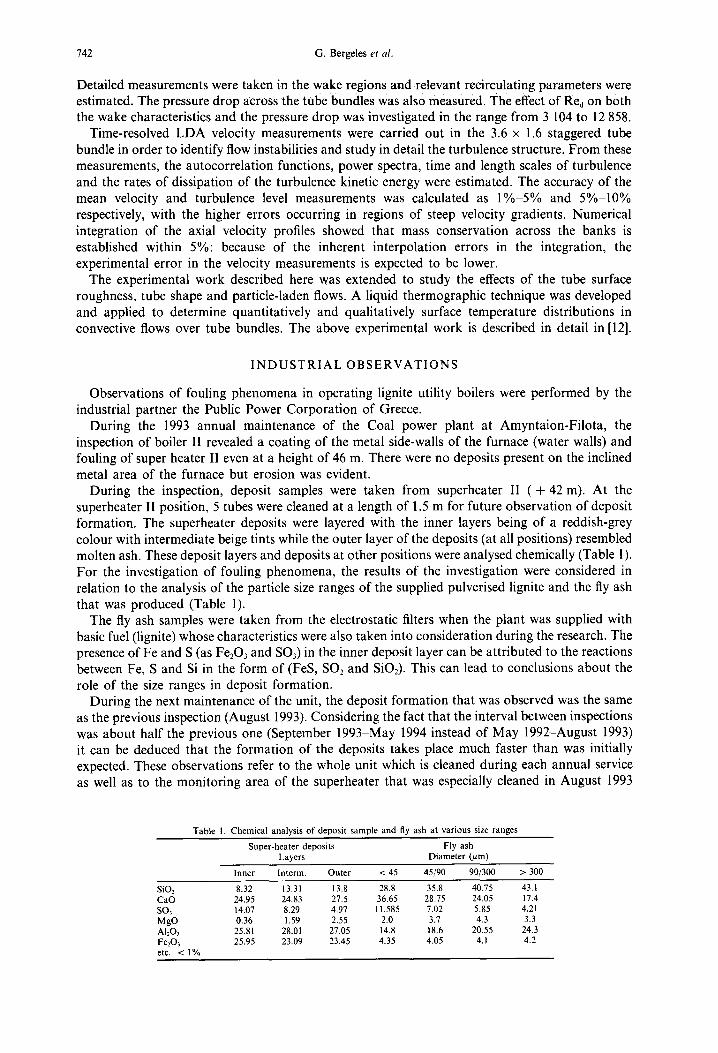
During the inspection, deposit samples were taken from superheater II ( + 42 m). At the superheater II position, 5 tubes were cleaned at a length of 1.5 m for future observation of deposit formation. The superheater deposits were layered with the inner layers being of a reddish-grey colour with intermediate beige tints while the outer layer of the deposits (at all positions) resembled molten ash. These deposit layers and deposits at other positions were analysed chemically (Table 1). For the investigation of fouling phenomena, the results of the investigation were considered in relation to the analysis of the particle size ranges of the supplied pulverised lignite and the fly ash that was produced (Table 1).
The fly ash samples were taken from the electrostatic filters when the plant was supplied with basic fuel (lignite) whose characteristics were also taken into consideration during the research. The presence of Fe and S (as Fe,O, and SO,) in the inner deposit layer can be attributed to the reactions between Fe, S and Si in the form of (FeS, SO, and SiO,). This can lead to conclusions about the role of the size ranges in deposit formation.
During the next maintenance of the unit, the deposit formation that was observed was the same as the previous inspection (August 1993). Considering the fact that the interval between inspections was about half the previous one (September 1993-May 1994 instead of May 1992-August 1993) it can be deduced that the formation of the deposits takes place much faster than was initially expected. These observations refer to the whole unit which is cleaned during each annual service as well as to the monitoring area of the superheater that was especially cleaned in August 1993
Table I. Chemical analysis of deposit sample and fly ash at various size ranges
Super-heater deposits Fly ash Layers Diameter (pm)
Inner Interm. Outer < 45 45190 90/300 > 300
SiO: 8.32 13.31 13.8 28.8 35.8 40.75 43.1 Cd0 24.95 24.83 27.5 36.65 28.75 24.05 17.4 so> 14.07 8.29 4.97 II.585 7.02 5.85 4.21 M8O 0.36 1.59 2.55 2.0 3.7 4.3 3.3 Al20, 25.81 28.01 27.05 14.8 18.6 20.55 24.3 FezOl 25.95 23.09 23.45 4.35 4.05 4.1 4.2 etc. < 1%
Effects of fouling on the efficiency of heat exchangers 743
for observation of the deposit formation. The deposit that was formed here could not be distinguished either in form or in extent from the other areas which had received no special treatment. The deposit that was formed on the first tubes reached a height of 2-3 tube diameters.
NUMERICAL SIMULATJONS
The numerical simulations were performed by the Laboratory of Aerodynamics of the National Technical University of Athens.
Two phase flow simulations The algorithm used to solve the flow field is based on the standard SIMPLE algorithm [13] which
solves the Navier Stokes and temperature equations using the Boussinesq hypothesis for the calculation of the Reynolds stresses and incorporates the k-t turbulence model for calculating the turbulent viscosity. Modifications to this standard form include the use of a body fitted orthogonal curvilinear co-ordinate system as well as the implementation of a collocated arrangement of the variables on the computational grid. For upwind differencing, the second order BSOU scheme was used [14]. A Lagrangian stochastic model is used to track the particles flowing through the tube bundle. This model was used successfully in the past and here it was further modified to perform in a more general form on orthogonal curvilinear co-ordinates.
The anisotropy of the turbulence (instantaneous velocity components) is taken into account through temporal and spatial correlations that are calculated from the Reynolds stresses of the flow field and thus an algebraic Reynolds stress model is used [7].
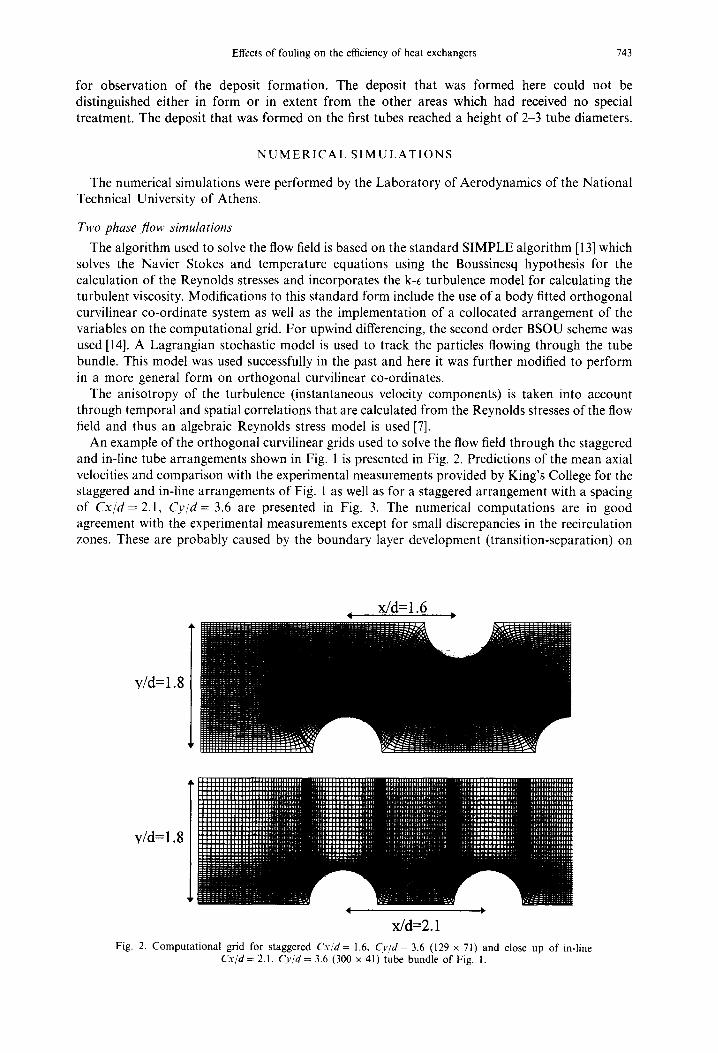
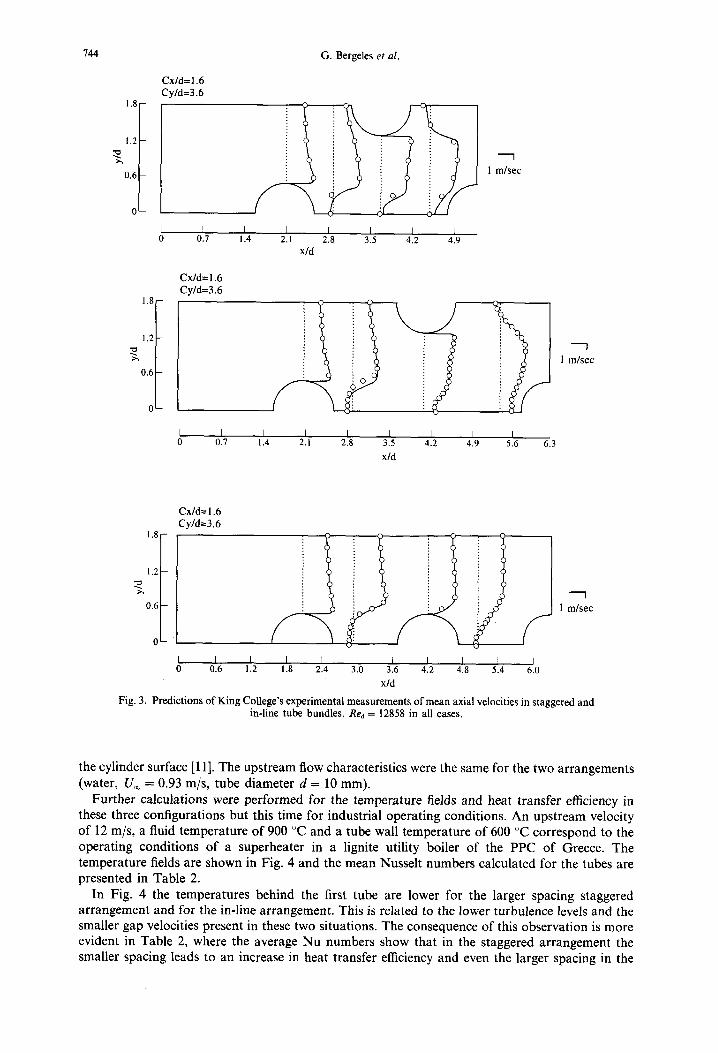
An example of the orthogonal curvilinear grids used to solve the flow field through the staggered and in-line tube arrangements shown in Fig. 1 is presented in Fig. 2. Predictions of the mean axial velocities and comparison with the experimental measurements provided by King’s College for the staggered and in-line arrangements of Fig. 1 as well as for a staggered arrangement with a spacing of C.x/d = 2.1, Q/d = 3.6 are presented in Fig. 3. The numerical computations are in good agreement with the experimental measurements except for small discrepancies in the recirculation zones. These are probably caused by the boundary layer development (transition-separation) on
xfd=2.1 Fig. 2. Computational grid for staggered C-y/d = 1.6, Q/d = 3.6 (129 x 71) and close up of in-line
C.u/d = 2.1, C_v/d = 3.6 (300 x 41) tube bundle of Fig. 1.
144 G. Bergeles et al.
Cx/d=l.6 Cy/d=3.6
1.2
? x
0.6
1 1 mlsec
I I I I I I I I 0 0.7 I .4 2.1 2.8 3.5 4.2 4.9
x/d
1.8
Cxld=1.6 Cy/d=3.6
1.2
? a.
0.6
0 0.7 1.4 2.1 2.8 3.5
xld 4.2 4.9 5.6 6.3
1.8
1.2
9 x
0.6
Cx/d=1.6 Cy/d=3.6
1 1 mlsec
I I I I I I I I I I I 0 0.6 1.2 1.8 2.4 3.0 3.6 4.2 4.8 5.4 6.0
xld
Fig. 3. Predictions of King College’s experimental measurements of mean axial velocities in staggered and in-line tube bundles. Red = 12858 in all cases.
the cylinder surface [l 11. The upstream flow characteristics were the same for the two arrangements (water, U, = 0.93 m/s, tube diameter d = 10 mm).
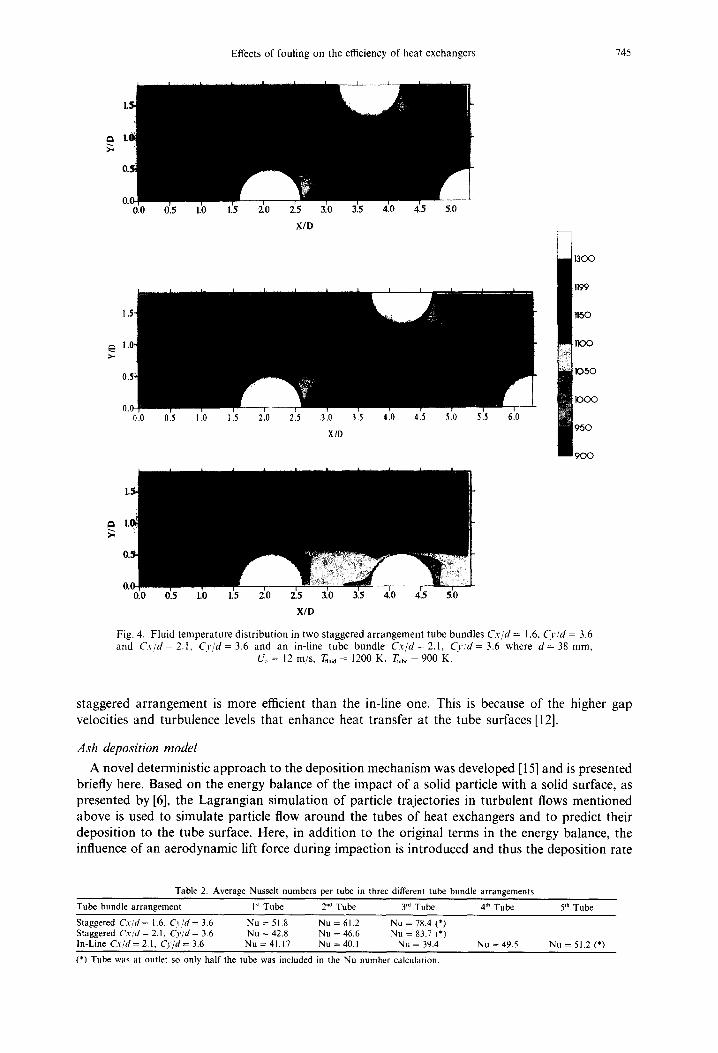
Further calculations were performed for the temperature fields and heat transfer efficiency in these three configurations but this time for industrial operating conditions. An upstream velocity of 12 m/s, a fluid temperature of 900 “C and a tube wall temperature of 600 “C correspond to the operating conditions of a superheater in a lignite utility boiler of the PPC of Greece. The temperature fields are shown in Fig. 4 and the mean Nusselt numbers calculated for the tubes are presented in Table 2.
In Fig. 4 the temperatures behind the first tube are lower for the larger spacing staggered arrangement and for the in-line arrangement. This is related to the lower turbulence levels and the smaller gap velocities present in these two situations. The consequence of this observation is more evident in Table 2, where the average Nu numbers show that in the staggered arrangement the smaller spacing leads to an increase in heat transfer efficiency and even the larger spacing in the
745
X/D
0.0 0.5 I .o 1 .5 210 215 310 315 410 415 510 515 610
X/D
X/D
Fig. 4. Fluid temperature distribution in two staggered arrangement tube bundles C.u/d = I .6, CJ/d = 3.6 and C-y/d = 2.1, CJ,jd = 3.6 and an in-line tube bundle Cvjd = 2.1, Cy:d = 3.6 where cl = 38 mm,
C!, = 12 m/s. suld = 1200 K, I;uhc = 900 K.
staggered arrangement is more efficient than the in-line one. This is because of the higher gap velocities and turbulence levels that enhance heat transfer at the tube surfaces [12].
Ash deposition model A novel deterministic approach to the deposition mechanism was developed [ 151 and is presented
briefly here. Based on the energy balance of the impact of a solid particle with a solid surface, as presented by [6], the Lagrangian simulation of particle trajectories in turbulent flows mentioned above is used to simulate particle flow around the tubes of heat exchangers and to predict their deposition to the tube surface. Here, in addition to the original terms in the energy balance, the influence of an aerodynamic lift force during impaction is introduced and thus the deposition rate
Table 2. Average Nusselt numbers per tube in three different tube bundle arrangements
Tube bundle arrangement I- Tube 2”’ Tube 3’d Tube 4’” Tube 51h Tube
Staggered Q/d = I .6. CJ,/d = 3.6 Nu = 51.8 Nu = 61.2 Nu = 78.4 (*) Staggered &jr/ = 2. I, Cy/d = 3.6 Nu = 42.8 Nu = 46.6 Nu = 83.7 (*) In-Line C.u/d = 2. I, Q/d = 3.6 Nu = 41.17 Nu = 40. I Nu = 39.4
(*) Tube was at outlet so only half the tube was included in the Nu number calculation.
Nu = 49.5 Nu = 51.2 (*)
146 G. Bergeles et al.
is calculated. The deposit build up is then predicted based on a Kern and Seaton type exponentiaf equation which was extended in this project so that the development in time, which includes the mechanisms of deposit removal, is influenced by both the fluid shear and the eroding shear stress of the impacting particles. Both these stresses are determined by the simulation of the flow field.
For a spherical particle with mass (m), radius (R), moving with a velocity (V) normal to a plane surface and impacting on to this surface the rebound velocity can be calculated from;
Ql- Q, - Q'.A - QL + (’ j ’ (1)
where Qi = l/2 m V* is the initial kinetic energy of the particle, Qp is the energy lost because of plastic deformation, Q/A is the energy caused by attractive forces between particle and surface that must be overcome by the particle and QL is the energy that is dissipated because of elastic wave propagation (this is a modification to [6], based on [16] and is significant only for elastic impacts). If QE > Q’A the particle will rebound, otherwise it will stick to the surface. Finally Qlif, is the aerodynamic lift energy acting on a particle caused by the velocity gradient on the particle (a novel modification to [6]). As stated by [3] the lift force (Saffman lift force, [17]) can be expected to play an important role in the area near a wall where shear stress is significant.
This part of the deposition model was verified against experimental measurements first for the case of a stagnation point flow on a flat plate and for various surface materials [ 181. The rebound velocities were calculated and compared with the experimental measurements of [6] while the effect of the flow field was neglected. The second validation was for the cross flow of the combustion gases of an experimental burner past a circular cylinder [15].
For a particle of known size and velocity, the information needed regarding the materials of the particle and the surface to which it impacts is: E (Young’s modulus), v (Poisson’s ratio), Y (elastic yield limit of the softer of the two materials), p (particle density) and Ay = 2m (Interfacial surface energy derived from the dispersive surface energies of the two materials [19]. The full expressions for the energies in equation (1) which are based on these parameters can be found in [16] [6] and [15].
It would obviously be an error to consider the deposition to evolve linearly in time since the reentrainment of deposit into the flow increases as a function of deposit growth. [2] presented a model for predicting fouling rates considering a deposition flux and a removal flux which is dependent on the amount of mass already deposited and the final form that is used in this work is;
m,’ m = K*(?v + G,)
{l- exp[ -K,(r,+r.,)l]j (2)
The term outside the brackets in (2) is the assymptotic (maximum) deposit mass that is reached after a certain time when the mechanisms of deposition and removal will be in equilibrium. The deposition rate is calculated from the impact-adhesion model presented above, and the shear stress is calculated from the solution of the Navier-Stokes equations around the tubes. So far the tangential impact velocity has not been taken into account, but here an extra shearing stress was added which accounts for the particles tangentially impacting a surface that cause a certain amount of ‘erosion’ of the deposit and reentrainment back into the flow. Through a rather complex analysis of impact energies and material deformation, [20] reaches two expressions for the tangential rebound velocity. It actually turns out that this is dependent on the impact angle of the particle and that for an impact angle above a certain limit c(~, the tangential velocity becomes zero during impaction while below CX~ the particle retains at least some of the tangential velocity throughout the impact. The limiting impact angle a0 is most strongly influenced by the elastic yield limit Y and common values are between 12” and 25”.
Depending on the impact angle, the tangential rebound velocity LG is calculated and thus an eroding shear stress is defined and added to the fluid shear stress in (2) [15]:
Effects of fouling on the efficiency of heat exchangers 141
276 hrs. (12 days)
1.8 - Cx/d=1.6 Cy/d=3.6
1.2 - d=38 mm R Uo= 12 mkec -
0.6 - T,“~e=600”C T,u,,=900”C
o-
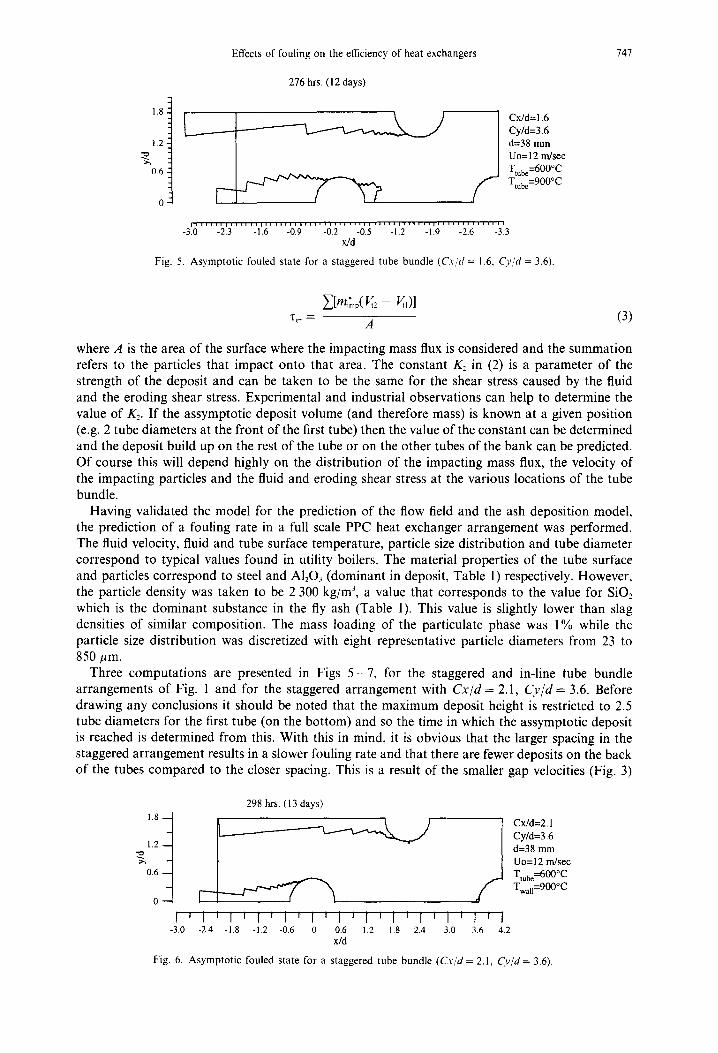
Fig. 5. Asymptotic fouled state for a staggered tube bundle (C-Y/~ = I .6, Cy/d = 3.6).
where A is the area of the surface where the impacting mass flux is considered and the summation refers to the particles that impact onto that area. The constant K2 in (2) is a parameter of the strength of the deposit and can be taken to be the same for the shear stress caused by the fluid and the eroding shear stress. Experimental and industrial observations can help to determine the value of K?. If the assymptotic deposit volume (and therefore mass) is known at a given position (e.g. 2 tube diameters at the front of the first tube) then the value of the constant can be determined and the deposit build up on the rest of the tube or on the other tubes of the bank can be predicted. Of course this will depend highly on the distribution of the impacting mass flux, the velocity of the impacting particles and the fluid and eroding shear stress at the various locations of the tube bundle.
Having validated the model for the prediction of the flow field and the ash deposition model, the prediction of a fouling rate in a full scale PPC heat exchanger arrangement was performed. The fluid velocity, fluid and tube surface temperature, particle size distribution and tube diameter correspond to typical values found in utility boilers. The material properties of the tube surface and particles correspond to steel and A&O, (dominant in deposit, Table 1) respectively. However, the particle density was taken to be 2 300 kg/m’, a value that corresponds to the value for SiOz which is the dominant substance in the fly ash (Table 1). This value is slightly lower than slag densities of similar composition. The mass loading of the particulate phase was 1% while the particle size distribution was discretized with eight representative particle diameters from 23 to 850 pm.
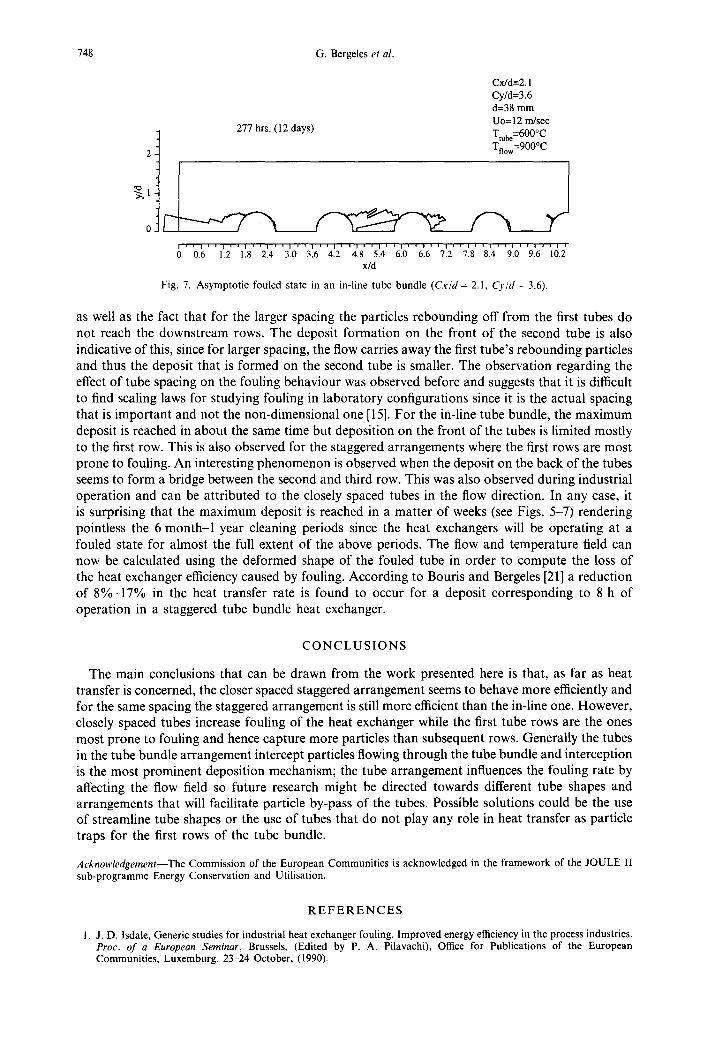
Three computations are presented in Figs 5 - 7, for the staggered and in-line tube bundle arrangements of Fig. 1 and for the staggered arrangement with Cxjd = 2.1, Cyjd = 3.6. Before drawing any conclusions it should be noted that the maximum deposit height is restricted to 2.5 tube diameters for the first tube (on the bottom) and so the time in which the assymptotic deposit is reached is determined from this. With this in mind, it is obvious that the larger spacing in the staggered arrangement results in a slower fouling rate and that there are fewer deposits on the back of the tubes compared to the closer spacing. This is a result of the smaller gap velocities (Fig. 3)
298 hrs. (13 days)
I’ I ’ I ’ l ’ I ’ I ’ I ’ I ’ I ’ I ’ I ’ I r 1 -3.0 -2.4 -1.8 -1.2 -0.6 0 0.6 1.2 1.8 2.4 3.0 3.6 4.2
x/d
Fig. 6. Asymptotic fouled state for a staggered tube bundle (&id = 2.1, Cvjd = 3.6)
748
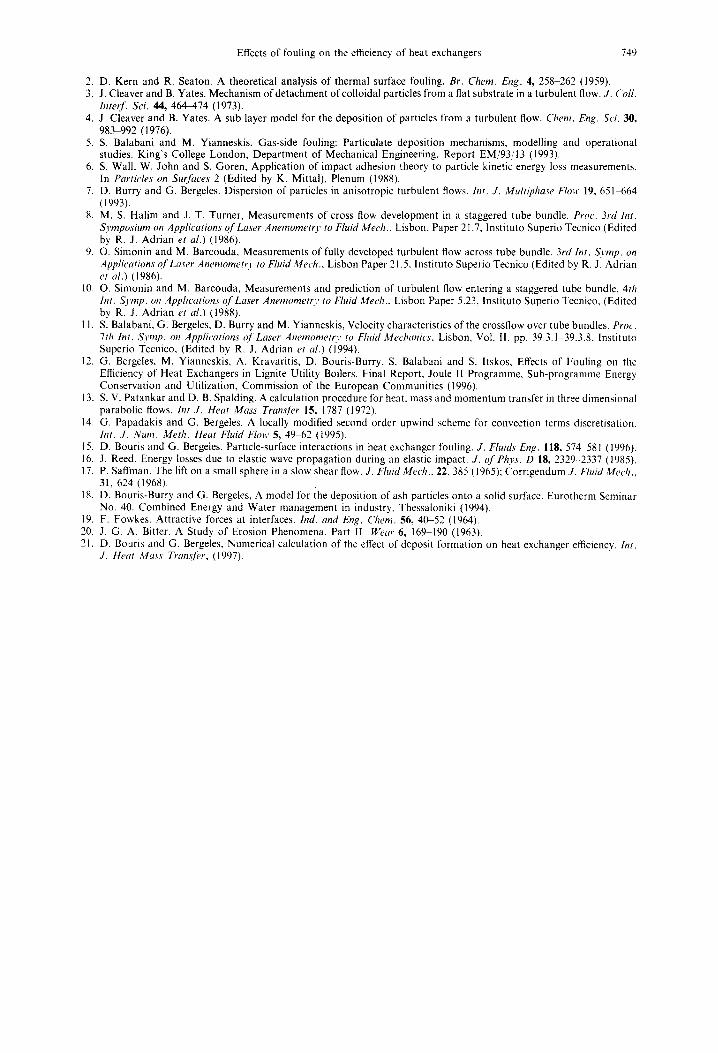
3 277 hrs. (12 days)
2
G. Bergeles et al.
Cxld=2.1 Cyld=3.6 d=38 mm Uo= 12 m/set T,“,e=600”C TnoW=900”C
1~~,‘~1~(1~~1~~1~11I’I~)JI~II~I~~J”I~’II~I~~(~~~~~JI 0 0.6 1.2 1.8 2.4 3.0 3.6 4.2 4.8 5.4 6.0 6.6 7.2 7.8 8.4 9.0 9.6 10.2
x!d
Fig. 7. Asymptotic fouled state in an in-line tube bundle (C.u/d = 2.1, Cy/d = 3.6).
as well as the fact that for the larger spacing the particles rebounding off from the first tubes do not reach the downstream rows. The deposit formation on the front of the second tube is also indicative of this, since for larger spacing, the flow carries away the first tube’s rebounding particles and thus the deposit that is formed on the second tube is smaller. The observation regarding the effect of tube spacing on the fouling behaviour was observed before and suggests that it is difficult to find scaling laws for studying fouling in laboratory configurations since it is the actual spacing that is important and not the non-dimensional one [15]. For the in-line tube bundle, the maximum deposit is reached in about the same time but deposition on the front of the tubes is limited mostly to the first row. This is also observed for the staggered arrangements where the first rows are most prone to fouling. An interesting phenomenon is observed when the deposit on the back of the tubes seems to form a bridge between the second and third row. This was also observed during industrial operation and can be attributed to the closely spaced tubes in the flow direction. In any case, it is surprising that the maximum deposit is reached in a matter of weeks (see Figs. 5-7) rendering pointless the 6 month-l year cleaning periods since the heat exchangers will be operating at a fouled state for almost the full extent of the above periods. The flow and temperature field can now be calculated using the deformed shape of the fouled tube in order to compute the loss of the heat exchanger efficiency caused by fouling. According to Bouris and Bergeles [21] a reduction of 8%-17% in the heat transfer rate is found to occur for a deposit corresponding to 8 h of operation in a staggered tube bundle heat exchanger.
CONCLUSIONS
The main conclusions that can be drawn from the work presented here is that, as far as heat transfer is concerned, the closer spaced staggered arrangement seems to behave more efficiently and for the same spacing the staggered arrangement is still more efficient than the in-line one. However, closely spaced tubes increase fouling of the heat exchanger while the first tube rows are the ones most prone to fouling and hence capture more particles than subsequent rows. Generally the tubes in the tube bundle arrangement intercept particles flowing through the tube bundle and interception is the most prominent deposition mechanism; the tube arrangement influences the fouling rate by affecting the flow field so future research might be directed towards different tube shapes and arrangements that will facilitate particle by-pass of the tubes. Possible solutions could be the use of streamline tube shapes or the use of tubes that do not play any role in heat transfer as particle traps for the first rows of the tube bundle.
Acknou&dgement-The Commission of the European Communities is acknowledged in the framework of the JOULE II sub-programme Energy Conservation and Utilisation.
REFERENCES
1. J. D. Isdale, Generic studies for industrial heat exchanger fouling. Improved energy efficiency in the process industries. Proc. of a European Seminnr, Brussels, (Edited by P. A. Pilavachi), Office for Publications of the European Communities, Luxemburg, 23-24 October, (1990).
Effects of fouling on the efficiency of heat exchangers 749
2. D. Kern and R. Seaton. A theoretical analysis of thermal surface fouling. Br. Chem. Eng. 4, 258-262 (1959). 3. J. Cleaver and B. Yates. Mechanism of detachment of colloidal particles from a flat substrate in a turbulent flow. J. Co//.
Interf:f: Sri. 44, 464-474 (1973). 4. J. Cleaver and B. Yates. A sub layer model for the deposition of particles from a turbulent flow. Chem. Eng. Sci. 30,
983-992 (1976). 5. S. Balabani and M. Yianneskis, Gas-side fouling: Particulate deposition mechanisms, modelling and operational
studies. King’s College London, Department of Mechanical Engineering, Report EM/93113 (1993). 6. S. Wall, W. John and S. Goren, Application of impact adhesion theory to particle kinetic energy loss measurements.
In l’orticles on Surf&s 2 (Edited by K. Mittal), Plenum (1988). 7. D. Burry and G. Bergeles. Dispersion of particles in anisotropic turbulent flows. bzr. J. Multiphnse F/on, 19, 651-664
(1993). 8. M. S. Halim and J. T. Turner. Measurements of cross flow development in a staggered tube bundle. Proc. 3rd Inr.
S~~mposium on Applicntions qfLn.wr Anemometrr to Fluid Mwh.. Lisbon. Paper 21.7. lnstituto Superio Tecnico (Edited by R. J. Adrian ef ol.) (1986).
9. 0. Simonin and M. Barcouda, Measurements of fully developed turbulent flow across tube bundle. 3rd Int. Swap. on Applicntions of’ Lrrsrr Anemometr~~ to Fluid Mech., Lisbon Paper 21.5. lnstituto Superio Tecnico (Edited by R. J. Adrian et c/l.) (1986).
IO. 0. Simonin and M. Barcouda, Measurements and prediction of turbulent flow entering a staggered tube bundle, 4th In/. Sjw7p. on Applicn/ions ofLaser Anemometry to Fluid Me&., Lisbon Paper 5.23, lnstituto Superio Tecnico, (Edited by R. J. Adrian et ~1.) (1988).
I I. S. Balabani, G. Bergeles. D. Burry and M. Yianneskis, Velocity characteristics of the crossflow over tube bundles, Proc. 7th In/. Symp. on Appliccrtions of’ Laser Anemometry to Fluid Mechtmics, Lisbon, Vol. II. pp. 39.3.1-39.3.8, Instituto Superio Tecnico, (Edited by R. J. Adrian et ol.) (1994).
12. G. Bergeles, M. Yianneskis, A. Kravaritis, D. Bouris-Burry, S. Balabani and S. Itskos, Effects of Fouling on the Efficiency of Heat Exchangers in Lignite Utility Boilers. Final Report, Joule II Programme, Sub-programme Energy Conservation and Utilization, Commission of the European Communities (1996).
13. S. V. Patankar and D. B. Spalding. A calculation procedure for heat, mass and momentum transfer in three dimensional parabolic flows. Int .J. Hear Mass Trcmsftir 15, 1787 (1972).
14. G. Papadakis and G. Bergeles. A locally modified second order upwind scheme for convection terms discretisation. Int. J. Num. Me/h. Herrt Fluid Flo11, 5, 49-62 (1995).
15. D. Bouris and G. Bergeles. Particle-surface interactions in heat exchanger fouling. J. F1uid.s Erg. 118, 574581 (1996). 16. J. Reed. Energy losses due to elastic wave propagation during an elastic impact. J. qf’Ph?s. D 18, 2329-2337 (1985). 17. P. Saffman, The lift on a small sphere in a slow shear flow. J. Fluid Mrch.. 22. 385 (1965); Corrigendum J. Fluid Me&..
31, 624 (1968). 18. D. Bouris-Burry and G. Bergeles, A model for the deposition of ash particles onto a solid surface. Eurotherm Seminar
No. 40: Combined Energy and Water management in industry. Thessaloniki (1994). 19. F. Fowkes. Attractive forces at interfaces. Znd. and Eng. Chem. 56, 40-52 (1964). 20. J. G. A. Bitter. A Study of Erosion Phenomena. Part II. Werrr 6, 1699190 (1963). 21. D. Bouris and G. Bergeles, Numerical calculation of the elfect of deposit formation on heat exchanger efficiency. ~trr.
J. Hcwt Mass Trons/iv. (I 997).