Effects of dietary source and intake of energy on immune competence and the response to an...
30
1 RUNNING HEAD: ENERGY AND IMMUNE RESPONSES 1 2 Effects of dietary source and intake of energy on immune competence and the response to 3 an Infectious Bovine Rhinotracheitis Virus (IBRV) challenge in cattle 4 5 6 7 8 9 L. R. Schwertner 1 , M. L. Galyean 1 , L. E. Hulbert 1,2 , J. A. Carroll 2 , and M. A. Ballou 1* 10 1 Department of Animal and Food Sciences, Texas Tech University, Lubbock, TX, USA 11 2 Livestock Issues Research Unit, USDA-ARS, Lubbock, TX, USA 12 13 14 15 16 17 18 19 20 21 22 * Corresponding author: Michael A. Ballou. Email: [email protected] 23
Transcript of Effects of dietary source and intake of energy on immune competence and the response to an...

1
RUNNING HEAD: ENERGY AND IMMUNE RESPONSES 1
2
Effects of dietary source and intake of energy on immune competence and the response to 3
an Infectious Bovine Rhinotracheitis Virus (IBRV) challenge in cattle 4
5
6
7
8
9
L. R. Schwertner1, M. L. Galyean
1, L. E. Hulbert
1,2, J. A. Carroll
2, and M. A. Ballou
1* 10
1Department of Animal and Food Sciences, Texas Tech University, Lubbock, TX, USA 11
2Livestock Issues Research Unit, USDA-ARS, Lubbock, TX, USA 12
13
14
15
16
17
18
19
20
21
22
*Corresponding author: Michael A. Ballou. Email: [email protected] 23

2
ABSTRACT 24
Objectives were to evaluate how dietary energy intake and source affect immune 25
competence and response to an infectious bovine rhinotracheitis virus (IBRV) challenge in cattle. 26
Forty-eight crossbred beef steers were stratified by body weight within 2 periods and randomized 27
to 1 of 3 dietary treatments (8 steers/treatment within period). Treatments were: a 70% 28
concentrate diet fed ad libitum (70AD); a 30% concentrate diet fed ad libitum (30AD); and 70% 29
concentrate diet restricted to the net energy for gain intake of 30AL (70RES). Ex vivo immune 30
responses were evaluated after treatments were applied for 28 d, after which cattle were moved 31
into individual pens (d 28 to 40) and intranasally challenged with IBRV on d 30. On d 34, all 32
cattle were offered a 50% concentrate diet ad libitum until d 50. Both energy source (P < 0.02) 33
and intake level (P < 0.04) affected peripheral blood mononuclear cell synthesis of tumor 34
necrosis factor-α, with cell culture supernatant concentrations averaging 2,264, 1,887, and 1,241 35
pg/mL for 70AD, 70RES, and 30AD, respectively. Neither whole blood killing of Mannheimia 36
haemolytica nor neutrophil oxidative burst in response to M. haemolytica was affected by 37
treatments. Rectal temperature following IBRV peaked 3 d after the IBRV challenge and 38
returned to baseline by d 6, but it was not affected by treatment. No differences were observed 39
in dry matter intake among treatments while the cattle were individually penned and fed a 50% 40
concentrate diet from d 4 to 10 after the IBRV challenge. When cattle were group-penned from 41
d 40 to 50 of the study (d 10 to 20 after the IBRV challenge), the 70RES cattle had greater DMI 42
(P < 0.04) than cattle in the other 2 groups. Following the IBRV challenge, serum glucose 43
concentrations did not differ among treatments; however, the 70AD cattle had greater blood urea 44
N concentrations (P < 0.01). There was a treatment x time interaction (P < 0.01) for non-45
esterified fatty acids, such that cattle fed the 70AD had increased non-esterified fatty acids on d 3 46

3
and 5 after the IBRV challenge. Results indicate that cattle fed diets with a greater energy 47
concentration and to an extent a greater percentage of concentrates had a more pronounced pro-48
inflammatory response, but other aspects of innate immune responses were not influenced by 49
intake or source of energy. 50
Key words: energy, immune, receiving cattle, stress 51
52
IMPLICATIONS 53
A higher energy diet could be the most appropriate diet to feed to stressed cattle. The 54
higher acute-phase immune response could benefit cattle by allowing the rapid recognition, 55
recruitment of other immune cells to the site of infection, and elimination of the potential 56
pathogen. The more aggressive acute-phase immune response could also allow the cattle to 57
more clearly show clinical signs of disease, which would allow producers to recognize the 58
animals and administer appropriate therapeutic treatments, thereby improving animal welfare. 59
60
INTRODUCTION 61
Morbidity and mortality from bovine respiratory disease complex (BRDC) plagues newly 62
weaned and received cattle. The high incidence of BRDC in these cattle adversely affects animal 63
welfare, as well as the economics of beef production. Management practices, stress, nutrition, 64
genetics, and microbial exposure play a role in the complex etiology of BRDC (Duff and 65
Galyean, 2007). Currently, metaphalactic antibiotic treatment is the most effect management 66
practice to decrease the incidence of the disease in lightweight, stressed cattle (Rivera et al, 67
2005), but concerns are increasing that antibiotic use in animal agriculture might increase 68
antibiotic-resistant bacterial strains that could affect human disease (Sayah et al., 2005). 69

4
Therefore, strategies to decrease the use of antibiotics, especially metaphalactic use, need to be 70
identified. 71
Nutrition is an attractive approach to increase disease resistance as well as limit the 72
adverse effects of disease on animal performance. Our interest in the nutritional effects on 73
BRDC centers on data from rodent models and beef cattle suggesting that dietary energy intake 74
and source influence various aspects of immune competence and disease resistance (Pahlavani, 75
2000; Jolly, 2004; Duff and Galyean, 2007; Reuter et al., 2008). Thus, the objective of this study 76
was to evaluate the effects of preconditioning diets varying in energy intake and source of energy 77
on innate immune competence and the response to an infectious bovine rhinotracheitis virus 78
(IBRV) challenge in crossbred beef steers. 79
80
MATERIALS AND METHODS 81
Experimental Design, Cattle, and Diets 82
The Texas Tech Animal Care and Use Committee reviewed and approved all of the 83
procedures that involved the use of live animals in the current study. The experiment was 84
conducted at the Texas Tech University Burnett Center Research Feedlot, 24 km northeast of 85
Lubbock, TX between May and July 2009. 86
An outline of the experimental procedures is presented in Figure 1. Forty-eight crossbred 87
steers (284 ± 25.9 kg) were purchased from an order buyer and transported from West Plains, 88
Missouri, USA, to the Texas Tech University Burnett Center research feedlot in New Deal, 89
Texas, USA. On arrival, all steers were processed, which included an individual BW 90
measurement, ear tag, vaccination with Vista 5 SQ (Intervet, Inc., Millsboro, DE; IBRV, BVD, 91
PI-3, BRSV modified live virus vaccine) and clostridial bacterin toxoid (Vision 7 with SPUR; 92

5
Intervet), and treatment with Safe-Guard (Intervet). Either 2 or 4 wk after arrival (the study was 93
conducted in 2 periods, 2 wk apart), cattle were stratified by BW and assigned randomly to 1 of 3 94
dietary treatments. Treatments included a 70% concentrate diet fed ad libitum (70AL); a 30% 95
concentrate diet fed ad libitum (30AL); and a 70% concentrate diet restricted (70RES) to equal 96
the net energy for gain (NEg) intake of the 30AL for a 28-d preconditioning period (Table 1). 97
For practicality, the same diet was used for 70AD and 70 RES treatments; thus, the intake of 98
protein (g/d) was not equal among treatments. A booster of the Vista 5 SQ was given to all 99
steers at enrollment and 2 wk later. During the preconditioning period, steers were group penned 100
(n = 4/pen) in outdoor, concrete-slotted floor pens with concrete feed bunkers and automatic 101
water troughs. Quantity of feed offered to each pen was recorded daily and feed bunk were 102
managed to leave minimal orts at the time fresh feed was offered each day. 103
On d 28, the steers were moved into individual stanchions (0.8 m x 2.1 m) in an enclosed 104
barn that was continuously illuminated. The steers had ad libitum access to water. Individual 105
feed intake was recorded from d 28 to 40. On d 30, all steers were intranasally challenged with 106
IBRV in 2 mL (titer value = 108.5
tissue culture infected dose50/mL) of sterile, isotonic saline (1 107
mL per nostril) using a MAD®, Mucosal Atomization Device (Wolfe Tory Medical, Inc., Salt 108
Lake City, UT). To simulate the situation in a commercial feedlot in which animals would be 109
removed from their pen and housed in a hospital pen and fed 1 diet ad libitum, all steers were 110
switched to a 50% concentrate diet (Table 1) fed ad libitum on d 34. Steers were switched on d 111
34 because this is when peak rectal temperatures were expected, thereby corresponding to the 112
time when the cattle would likely be moved to a hospital pen in a commercial facility. All steers 113
remained on the 50% concentrate diet for the rest of the study. 114
Sampling 115

6
Individual BW measurements were collected at enrollment and on d 28, 40, and 50 using 116
a calibrated scale (Silencer Hydraulic Scale, Moly MFG. Inc, Lorraine, KS). A peripheral blood 117
sample (20 mL) was collected into heparinized and no additive vacutainers via jugular 118
venipuncture for biochemical and ex vivo immunological analyses on d 28. In addition, 119
peripheral blood samples (10 mL) were collected into vacutainers with no additive via jugular 120
venipuncture on d 30, 33, 35, 37, 40, and 50 for biochemical analyses. Serum was harvested by 121
centrifuged at 1,200 x g for 15 min and stored at -40°C for later analysis. Rectal temperatures 122
were collected daily at 0800 h from d 30 to 40 using a calibrated, hand-held thermometer (GLA 123
M700 Digital Thermometer, San Luis Obispo, CA). 124
Laboratory Analyses 125
The oxidative burst of polymorphonuclear neutrophils in response to Mannheimia 126
haemolytica (ATCC #43270) was analyzed. The M. haemolytica was grown overnight in tryptic 127
soy broth + 5% defibrinated sheep blood and quantified by serial dilution and spread-plating on 128
tryptic soy agar + 5% defibrinated sheep blood. The bacteria were heat-killed at 60oC for 30 129
min, washed, and resuspended at 109 colony forming units/mL in 1X PBS. Bacteria were 130
aliquoted into 1 mL volumes and stored at -80oC. Two hundred microliters of whole blood from 131
each steer was aseptically transferred into the bottom of a 1.7-mL microcentrifuge tube and 132
placed in an ice bath for 10 min. Forty microliters each of a 100 µM working concentration of 133
dihydrorhodamine and the M. haemolytica were added to each tube, vortexed thoroughly, and 134
then placed in a 38.5°C re-circulating water bath where they were incubated for 10 min. After 135
completion of incubation, the samples were removed from the water bath and placed 136
immediately in an ice bath for 10 min to suspend the reaction at a constant rate in all samples. 137
Erythrocytes were hypotonically lysed and remaining leukocytes washed once with 1X PBS. 138

7
Leukocyte suspensions were analyzed by single color flow cytometry on a Cell Lab Quanta SC 139
flow cytometer (Beckman Coulter, Fullerton, CA). Data are reported as the percentage of 140
neutrophils, as well as the geometric mean fluorescence intensity of the positive neutrophil 141
population. The neutrophil population was determined from the scatter plot of electronic volume 142
and side scatter light characteristics. 143
The ability of whole blood to kill a live culture of the M. haemolytica used in the 144
oxidative burst assay was evaluated. Briefly, an overnight broth culture of the M. haemolytica 145
was diluted in 1X PBS to an approximate concentration of 25 colony forming units/µL and kept 146
in an ice bath. Whole blood was diluted 1:2 with RPMI 1640 to a final volume of 200 µL. All 147
tubes were placed in an ice bath for 15 min. Twenty microliters of the working M. haemolytica 148
culture were added to each tube of diluted whole blood, vortexed thoroughly, and incubated in a 149
re-circulating water bath at 38.5oC for 10 min, which corresponded with the oxidative burst 150
assay. Following the incubation, cultures were vortexed thoroughly, 50 µL of the culture 151
pipetted and spread plated on tryptic soy agar + 5% defibrinated sheep blood plates in duplicate, 152
and incubated overnight before the number of colony forming units were determined. Data are 153
expressed as the percentage of killing and were calculated from plating the diluted working M. 154
haemolytica culture in 200 µL of RPMI 1640 only. 155
Peripheral blood mononuclear cell cultures (2 x 10⁶ cells/mL) were cultured in RPMI 156
1640 and 10% autologous serum and 1% penicillin/streptomycin and stimulated at a final 157
concentration of 5 ng/mL recombinant interferon-γ (Invitrogen, Carlsbad, CA) and either 0, 0.01, 158
or 5 µg/mL of lipopolysaccharide (Escherichia coli 0111:B5; Sigma, St. Louis, MO) for 24 h 159
after which the supernatant was collected and stored at -80oC until analysis of tumor necrosis 160
8
factor-α concentrations using a commercially available ELISA (Thermo Scientific, Waltham, 161
MA). 162
Serum glucose and urea nitrogen were analyzed by commercially available enzymatic, 163
colorimetric kits (Stanbio Laboratory, Boerne, TX). In addition, serum non-esterified fatty acids 164
were analyzed using commercially available reagents from Wako Diagnostics (NEFA-HR(2); 165
Wako Diagnostics, Richmond, VA) as described by Ballou et al. (2009). All colorimetric and 166
enzymatic assays were analyzed on a SpectraMax 340PC microplate reader (Molecular Devices, 167
Sunnyvale, CA). 168
Statistical Analyses 169
Ex vivo immunological analyses on d 28 were analyzed by ANOVA using the general 170
linear model procedure of SAS (v.9.2, SAS Inst. Inc., Cary, NC, USA) with treatment as the 171
main effect. All repeated, continuous data were analyzed by restricted maximum likelihood 172
ANOVA using the MIXED procedure of SAS (v.9.2, SAS Inst. Inc., Cary, NC, USA). A linear, 173
mixed model with the fixed effects of treatment, sampling time, and the interaction of treatment 174
x sampling time was fitted. The ante-regression covariance structure for the within-subject 175
measurement was used. Steer nested within treatment was the random effect. For the 176
biochemical responses following the IBRV challenge, samples collected on d28 were used as a 177
covariate in the model. Means separations were performed at each time using a sliced-effect 178
multiple comparison approach with a Tukey-Kramer adjustment. All data were tested for 179
normality of the residuals by evaluating the Shapiro-Wilk statistic using the UNIVARIATE 180
procedure of SAS (v.9.2, SAS Inst. Inc., Cary, NC, USA). Contrasts were performed on all data 181
to determine the effects of energy source (30AL vs. 70AL and 70RES) and energy intake (70AL 182
vs. 30AL and 70RES). The interactions of period x sampling time, period x treatment, and 183

9
period x sampling time x treatment were evaluated and found to be non-significant (P > 0.10); 184
therefore, period was not included in the model. Least squares means (±SEM) are reported 185
throughout. A treatment difference at P ≤ 0.05 was considered significant, and 0.05 < P ≤ 0.10 186
was considered a tendency. 187
188
RESULTS 189
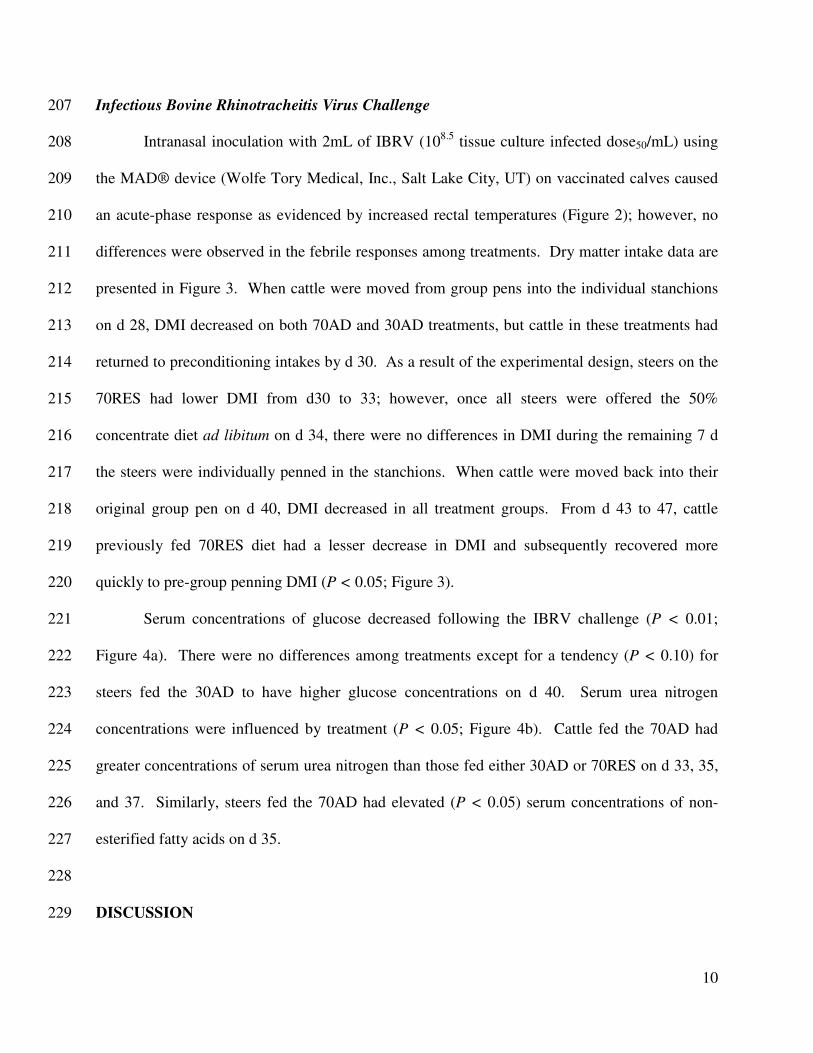
Preconditioning Performance and Serum Constituents 190
During the preconditioning period, predicted differences in average daily gain (ADG), 191
dry matter intake (DMI), and NEg intake were observed (P < 0.001;Table 2). Following along 192
with the design of the treatments, cattle on the 70AD had greater ADG and NEg intake than cattle 193
in either the 30AD or 70RES treatments. The cattle in the 30AD had greater DMI than cattle fed 194
either the 70AD or 70RES. There were no differences in either serum glucose or urea nitrogen 195
concentrations among treatments at the end of the preconditioning period (Table 2). 196
Preconditioning Immune Responses 197
Following the 28 d preconditioning period, many ex vivo immune responses were 198
evaluated from peripheral leukocytes including the killing ability of whole blood against M. 199
haemolytica, the oxidative burst capacity of neutrophils to M. haemolytica, and the ability of 200
mononuclear cells to produce TNF-α when co-cultured with LPS. No differences were observed 201
among treatments for either whole blood killing or neutrophil oxidative burst capacities when co-202
cultured with M. haemolytica (Table 3). The secretion of TNF-α by peripheral blood 203
mononuclear cell cultures was influenced by both source and intake of energy (P < 0.05; Table 204
3). Mononuclear cells isolated from steers fed the 30AD, as well as those fed the 70RES 205
treatment, secreted less TNF-α when stimulated with LPS than steers fed 70AD. 206
10
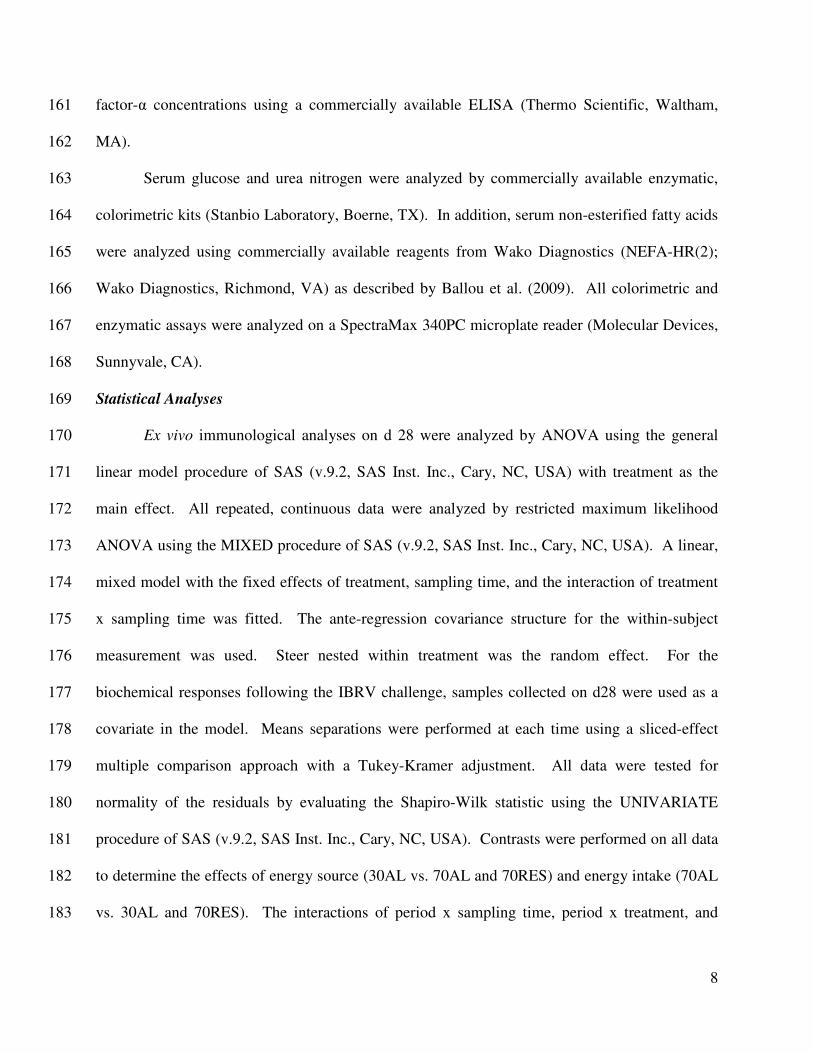
Infectious Bovine Rhinotracheitis Virus Challenge 207
Intranasal inoculation with 2mL of IBRV (108.5
tissue culture infected dose50/mL) using 208
the MAD® device (Wolfe Tory Medical, Inc., Salt Lake City, UT) on vaccinated calves caused 209
an acute-phase response as evidenced by increased rectal temperatures (Figure 2); however, no 210
differences were observed in the febrile responses among treatments. Dry matter intake data are 211
presented in Figure 3. When cattle were moved from group pens into the individual stanchions 212
on d 28, DMI decreased on both 70AD and 30AD treatments, but cattle in these treatments had 213
returned to preconditioning intakes by d 30. As a result of the experimental design, steers on the 214
70RES had lower DMI from d30 to 33; however, once all steers were offered the 50% 215
concentrate diet ad libitum on d 34, there were no differences in DMI during the remaining 7 d 216
the steers were individually penned in the stanchions. When cattle were moved back into their 217
original group pen on d 40, DMI decreased in all treatment groups. From d 43 to 47, cattle 218
previously fed 70RES diet had a lesser decrease in DMI and subsequently recovered more 219
quickly to pre-group penning DMI (P < 0.05; Figure 3). 220
Serum concentrations of glucose decreased following the IBRV challenge (P < 0.01; 221
Figure 4a). There were no differences among treatments except for a tendency (P < 0.10) for 222
steers fed the 30AD to have higher glucose concentrations on d 40. Serum urea nitrogen 223
concentrations were influenced by treatment (P < 0.05; Figure 4b). Cattle fed the 70AD had 224
greater concentrations of serum urea nitrogen than those fed either 30AD or 70RES on d 33, 35, 225
and 37. Similarly, steers fed the 70AD had elevated (P < 0.05) serum concentrations of non-226
esterified fatty acids on d 35. 227
228
DISCUSSION 229

11
The influence of energy source and level during the preconditioning period on various 230
aspects of innate immune competence and the response to an IBRV challenge were investigated. 231
Higher NEg intake by cattle in the 70AD treatment increased the ADG by these steers. Reuter et 232
al. (2008) fed similar diets as in the current study, and reported similar differences in 233
performance among treatments. Feeding diets with a greater proportion of concentrates is known 234
to improve performance (Lofgreen et al., 1975); however, little is known about how energy 235
intake or source influences the innate immune responses of preconditioning cattle. 236
No differences were observed among treatments in either the oxidative burst capacity of 237
neutrophils or the bactericidal activity of whole blood to M. haemolytica. The lack of treatment 238
effects could be the result of similar concentrations of blood glucose. Newbould (1973) 239
observed that when serum glucose concentrations increased, the phagocytic actions of blood 240
leukocytes increased. The current data contrast those of Sun et al. (2001), who observed that 241
mice fed 40% calorie restriction for 6 mo had lower macrophage phagocytic function; however, 242
it should be noted that the energy restricted mice in the study of Sun et al. (2001) did not grow 243
over the 6-mo study period, which contrasts with the cattle fed the lower energy diets in the 244
current study. In Holstein cows, plasma non-esterified fatty acid concentrations greater than 400 245
µEq/L 1 wk before parturition were associated with large reductions in myeloperoxidase activity 246
of neutrophils (Hammon et al., 2006). Taken together, these data suggest that low energy intake 247
of animals, no growth in young animals or negative energy balance in adult animals, decreases 248
neutrophil functions, whereas decreased energy intake in young, growing animals does not 249
influence neutrophil or bactericidal responses. 250
Secretion of the pro-inflammatory cytokine, TNF-α, by peripheral blood mononuclear 251
cells stimulated with LPS was lower in cattle fed either 30AD or 70RES compared with 70AD. 252

12
In agreement with this finding, mice in the study of Sun et al. (2001) had lower mRNA 253
expressions of pro-inflammatory cytokine genes as well as secretion of interleukin-6 when 254
macrophages were stimulated ex vivo with LPS. In that same study, pro-inflammatory response 255
was evaluated following cecal ligation and puncture to induce polymicrobial septicemia. 256
Following the cecal ligation and puncture, mice on the calorie-restricted diet displayed increased 257
concentrations of systemic TNF-α, and survival analysis indicated a more rapid mortality in the 258
calorie-restricted mice. These data suggest that calorie restriction decreases the pro-259
inflammatory response of macrophages in response to Gram-negative bacteria, which might 260
allow for growth of the pathogen once it has evaded the physical barriers of the immune system, 261
thereby resulting in a greater degree of septicemia (Sun et al., 2001). In contrast to our data, 262
Reuter et al. (2008) observed an increased concentration of serum TNF-α following an 263
intravenous LPS challenge in cattle fed lower-energy (70RES) and higher-roughage (30AD) 264
diets. The reason for the discrepancies observed between the current data and that observed by 265
Reuter et al. (2008) is not known, but could be reflect the use of different experimental models. 266
Reuter et al. (2008) used an in vivo LPS challenge, whereas isolated peripheral mononuclear 267
cells stimulated with LPS ex vivo in the current study. The ex vivo model might reflect the 268
sensitivity of the monocyte/macrophages to LPS, whereas the in vivo challenge may be more 269
indicative of how an animal will respond once they have become septicemic. The role that either 270
the results from in vivo or ex vivo models plays in defining resistance to disease of cattle in not 271
known and should be addressed with future research. 272
Decreased pro-inflammatory responses observed in cattle fed lower energy intakes might 273
have negative effects on resistance to disease in cattle that are exposed to pathogens. The 274
decreased secretion of TNF-α could potentially decrease the ability of the cattle’s immune 275

13
system to recognize, sequester, and eliminate the pathogen. In dairy cattle, data indicate that the 276
severity of Escherichia coli mastitis is inversely related to the speed of neutrophil recruitment 277
into the mammary gland (Hill, 1981). Lower secretion of TNF-α could result in less neutrophils 278
and other effector leukocytes being recruited to tissue sites of infection, which could allow 279
growth of the pathogen. If pathogen growth continues, there will be more pathogen-derived 280
immunogens for a subsequent systemic inflammatory response. This effect was likely observed 281
in the study by Sun et al. (2001), in which ex vivo pro-inflammatory cytokine responses were 282
lower in energy restricted mice; however, those mice had greater cytokine responses and higher 283
mortality following a cecal ligation and puncture septicemia model. Therefore, an ideal acute-284
phase response within an animal would be a rapid and robust response to sequester and eliminate 285
the pathogen, followed by a rapid down-regulation of the response to prevent excessive host 286
tissue damage. These data indicate that cattle fed higher energy and to an extent higher 287
concentrate diets may have a more desirable pro-inflammatory immune response phenotype. 288
During the IBRV challenge, no differences were observed among treatments in rectal 289
temperatures; however, the challenge caused a mild febrile response from d 33 to 35. Therefore, 290
using vaccinated cattle challenged intranasally with the MAD®, Mucosal Atomization Device 291
(Wolfe Tory Medical, Inc., Salt Lake City, UT) caused a mild acute-phase response. Similar to 292
the rectal temperatures, DMI was not influenced following the IBRV challenge while cattle were 293
individually penned. Nonetheless, once cattle were moved back to their original pen on d 40, 294
DMI was decreased in all treatments, possibly because of the stress associated with handling 295
and/or redefining the social dominance structure in the pen. From d 43 to 47, DMI in the 70RES 296
cattle was greater than by cattle in other 2 treatments. The reason(s) for the difference in DMI 297
observed during this period is not known, but it could be the result of cattle fed restricted 298

14
quantities of feed being conditioned to cope with the social stress because they were 299
“programmed” to have to compete for available resources. This is an area that warrants further 300
research, as it might be an effective management strategy to keep cattle on feed during periods of 301
stress. 302
Serum concentrations of glucose decreased following the IBRV challenge. Activation of 303
innate immune cells increases whole body glucose utilization, which could explain the decreased 304
plasma glucose in these cattle following the IBRV challenge (Gamelli et al., 1996). The effects 305
that individual penning had on plasma glucose concentrations, however, cannot be ascertained 306
because of the experimental design of the current study. 307
Serum urea nitrogen concentrations were elevated on d 33 to 40 in steers fed the 70AD. 308
Orr et al. (1988) observed an increase in the concentration of serum urea nitrogen after cattle 309
were challenged with IBRV. The greater concentrations of serum urea nitrogen in 70AD could 310
have resulted from elevated catabolism of whole body protein pool (Nielsen et al., 2005). Whole 311
body nitrogen balance is decreased during infection, and the higher response in 70AD steers 312
could be a reflection of a stronger response. Although intake of crude protein was not equal 313
among treatments due to the 70RES consuming less dry matter during the preconditioning 314
period, the intake of crude protein among steers fed 70AD were not influenced by time during 315
the IBRV challenge (data not shown). Therefore, it is unlikely that the elevated serum urea 316
nitrogen concentrations observed in these steers on d 33 to 40 was associated with changes in the 317
intake of crude protein. Similar to the serum urea nitrogen concentrations, on d 35 the steers fed 318
the 70AD had increased concentrations of serum non-esterified fatty acids. Whitney et al. (2005) 319
reported similar findings when they challenged steers with IBRV. The diets fed by Whitney et 320
al. (2005) were 3 high-roughage diets and a 70% concentrate diet. Steers fed the 70% 321

15
concentrate diet had greater non-esterified fatty acid concentrations than steers fed the high-322
roughage diets. The increased non-esterified fatty acids observed in cattle fed 70AD could be 323
connected to production of pro-inflammatory cytokines, as they can stimulate hormone-sensitive 324
lipase (Coppack, 2001). The present data are consistent with the ex vivo sensitivity of 325
monocyte/macrophages to LPS. As noted previously, we cannot completely rule out that the 326
differences observed in the 70AD cattle following the IBRV were caused by the individual 327
penning of the steers from d 28 to 40 or that all cattle were switched to a 50% concentrate diet on 328
d 34. 329
Our data are consistent with the suggestion made by Rivera et al. (2005) that feeding 330
higher concentrate diets might produce a more aggressive acute-phase response in cattle when 331
exposed to a pathogen. The observations of Lofgreen et al. (1975) that cattle fed lower energy 332
diets had decreased morbidity might reflect lower expression of pro-inflammatory cytokines. 333
Cattle with a lower pro-inflammatory cytokine response could display fewer of the usual clinical 334
signs that accompany disease and are known as sickness behaviors. Therefore, BRDC in cattle 335
fed higher-roughage diets might go undetected. Other data support the fact that the feedlot 336
industry needs more sensitive measures of morbidity, as Gardner et al. (1999) reported that 68% 337
of cattle not treated for BRDC during the finishing period had pulmonary lesions at slaughter 338
indicative of a previous incidence of BRDC. 339
In conclusion, a higher-energy diet (lower in roughage) might be the most appropriate 340
diet to feed preconditioning and stressed, newly received cattle. The more aggressive acute-341
phase response could benefit cattle by allowing the rapid recognition, recruitment, and 342
elimination of a potential pathogen. Moreover, a more visual display of signs associated with 343
infection and disease would allow the cattle to be detected, removed from their pen, and 344

16
administered appropriate medical treatments. In addition, the observation that steers previously 345
fed 70RES were able to return to feed more quickly when being group penned needs to be 346
further investigated, as this could be a management strategy employed during the 347
preconditioning period that could help cattle cope with the social stress on entering a feedlot. 348
349
ACKNOWLEDGEMENTS 350
The authors thank Clayton and Colton Cobb of Texas Tech University for their assistance with 351
animal husbandry. This research was partially funded by the Texas Cattle Feeders Association 352
in Amarillo, TX, USA. 353
354

17
REFERENCES 355
356
Ballou MA, Gomes RC, Juchem SO, and DePeters EJ. 2009. Effects of dietary supplemental fish 357
oil during the peripartum period on blood metabolites and hepatic fatty acid compositions 358
and total triacylglycerol concentrations of multiparous Holstein cows. J. Dairy Sci. 359
92:657–669. 360
Coppack SW. 2001. Pro-inflammatory cytokines and adipose tissue. Proc. Nutr. Soc. 60:349–361
356. 362
Duff GC and Galyean ML. 2007. BOARD-INVITED REVIEW: Recent advances in 363
management of highly stressed, newly received feedlot cattle. J. Anim. Sci. 85: 823-840. 364
Gamelli RL, Liu H, He L, and Hoffman CA. 1996. Augmentations of glucose uptake and glucose 365
transporter-I in macrophages following thermal injury and sepsis in mice. J. Leuk. Biol. 366
59:639-647. 367
Gardner BA, Dolezal HG, Bryant LK, Owens FN, and Smith RA. 1999. Health of finishing 368
steers: Effects on performance, carcass traits, and meat tenderness. J. Anim. Sci. 369
77:3168–3175. 370
Hammon DS, Evjen IM, Dhiman TR, Goff JP, and Walters JL. 2006. Neutrophil function and 371
energy status in Holstein cows with uterine health disorders. Vet. Immunol. 372
Immunopathol. 113:21-29. 373
Hill AW. 1981. Factors influencing the outcome of Escherichia coli mastitis in cows. J. Dairy 374
Sci. 73:985-994. 375
Jolly CA. 2004. Dietary restriction and immune function. J. Nutr. 134:1853-1856. 376

18
Lofgreen GP, Dunbar JR, Addis DG, and Clark JG. 1975. Energy level in starting rations for 377
calves subjected to marking and shipping stress. J. Anim. Sci. 41:1256. 378
Newbould FHS. 1973. The effects of added serum and glucose, and some inherent factors, on 379
phagocytosis in vitro by milk leukocytes from several cows. Can. J. Comp. Med. 37:189-380
194. 381
Nielsen SS, Grøft T, Tygstrup N, and Vilstrup H. 2005. Effect of lipopolysaccharide on in vivo 382
and genetic regulation of rat urea synthesis. Liver Int. 25:177–183. 383
Orr C, Hutcheson DP, Cummins JM, and Thompson GB. 1988. Nitrogen Kinetics of infectious 384
bovine rhinotracheitis-stressed calves. J. Anim. Sci. 66:1982-1989. 385
Pahlavani MA. 2000. Caloric restriction and immunosenescence: A current perspective. Front. 386
Biosci. 5:d580-d587. 387
Reuter RR, Carroll JA, Dailey JW, Cook BJ, and Galyean ML. 2008. Effects of dietary energy 388
source and level and injection of tilmicosin phosphate on immune function in 389
lipopolysaccharide challenged beef steers. J. Anim. Sci. 86:1963–1976. 390
Rivera JD, Galyean ML, and Nichols WT. 2005. Review: Dietary roughage concentration and 391
health of newly received cattle. Prof. Anim. Sci. 21:345–351. 392
Sayah RS, Kaneene JB, Johnson Y, and Miller R. 2005. Patterns of antimicrobial resistance 393
observed in Escherichia coli isolates obtained from domestic and wild animal fecal 394
samples, human septage, and surface water. Appl. Environ. Microbiol. 71:1394-1404. 395
Sun D, Muthukumar AR, Lawrence RA, and Fernandes G. 2001. Effects of calorie restriction on 396
polymicrobial peritonitis induced by cecum ligation and puncture in young C57BL/6 397
mice. Clin. Diagn. Lab. Immunol. 8: 1003–1011. 398

19
Whitney TR, Duff GC, Collins JK, Schafer DW, Hallford DM. 2006. Effects of diet for early-399
weaned crossbred beef steers on metabolic profiles and febrile response to an infectious 400
bovine herpesvirus-1 challenge. Livest. Sci. 101:1–9. 401
402

20
Table 1. Description of experimental diets (%DM).
% Concentrate
70 30 50
Item
Alfalfa Hay 15 35 25
Cottonseed Hulls 15 35 25
Steam-flaked Corn 52.5 12.7 32.6
Cottonseed Meal 8.5 8.5 8.5
Urea 0.5 0.3 0.4
Molasses 4 4 4
Supplement1 2.5 2.5 2.5
Fat - Yellow grease 2 2 2
Analyzed composition2
CP, % 13.15 13.52 12.77
ADF, % 17.48 39.10 35.64
NDF, % 25.26 49.44 47.80
Ca, % 0.54 0.73 0.60
P, % 0.32 0.27 0.27
Mg, % 0.21 0.23 0.21
K, % 1.10 1.85 1.72
Calculated composition3
NEm, Mcal/kg 1.97 1.24 1.35
NEg, Mcal/kg 1.27 0.52 0.64
403 1Supplement contained (DM basis): 66.382% cottonseed meal; 0.500% Endox (antioxidant; 404
Kemin Industries, Des Moines, IA); 0.647% dicalcium phosphate; 10.000% potassium chloride; 405
0.333% manganous oxide; 4.167% ammonium sulfate; 15.000% salt; 0.0022% cobalt carbonate; 406
0.196% copper sulfate; 0.0833% iron sulfate; 0.0031% ethylenediamine dihydroiodide; 0.125% 407
selenium premix (0.2% Se); 0.986% zinc sulfate; 0.0099% vitamin A (1,000,000 IU/g); 0.157% 408
vitamin E (500 IU/g); 0.844% Rumensin (Elanco Animal Health, Greenfield, IN); and 0.56% 409
Tylan (Elanco Animal Health). Concentration values in parentheses are expressed on a 90% DM 410
basis. 411
2Diets were sampled once weekly and composited by period prior to analyses by a commercial 412
laboratory. 413
3Composition calculated from the tabular values in NRC (1996). 414
415
416
20
Table 2. Performance during the 28-day preconditioning period1
Item 70AD 30AD 70RES SEM Trt Contrasts1
Pens, n 4 4 4 - - -
Initial BW, kg 283 284 285 6.5 - -
BW d 28, kg 317 310 308 5.2 - -
ADG, kg 1.2 0.91 0.82 0.069 0.01 1
DMI, kg 8.9 9.6 5.9 0.26 0.0001 1,2
NEg intake, Mcal/d 10.7 7.1 7.1 0.30 0.0001 1,2
Serum glucose, mg/dL 101.6 92.4 92.0 5.92 0.42 -
Serum urea nitrogen, mg/dL 7.1 7.8 6.5 0.76 0.43 -
1Contrasts: (1) Energy Level 70% concentrate fed ad libitum vs 30% concentrate fed ad libitum and 70%
concentrate diet fed in a quantity restricted to equal the NEg intake of the 30% concentrate treatment; (2) Energy
Source: 30% concentrate fed ad libitum vs 70% concentrate fed ad libitum and 70% concentrate diet fed in a
quantity restricted to equal the NEg intake of the 30% concentrate treatment.
1Treatments included a 70% concentrate diet fed ad libitum (70AD), a 30% concentrate diet fed ad libitum (30AD),
and the 70% concentrate diet restricted to the NEg intake of the 30AD treatment (70RES). 2Contrasts: (1) Energy Intake: 70% concentrate fed ad libitum vs. 30% concentrate fed ad libitum and 70%
concentrate diet fed in a quantity restricted to equal the NEg intake of the 30% concentrate treatment; (2) Energy
Source: 30% concentrate fed ad libitum vs. 70% concentrate fed ad libitum and 70% concentrate diet fed in a
quantity restricted to equal the NEg intake of the 30% concentrate treatment.

21
Table 3. Immune competence measurements on d 28 of the preconditioning period1
Item 70AD 30AD 70RES SEM Trt Contrasts1
Steers, n 16 16 16 -
Mannheimia haemolytica killing, % 72 69 69 6 0.90 -
Oxidative burst neutrophils, % 81.9 76 77.5 5.8 0.49 -
Oxidative burst neutrophils, geometric mean fluorescence 96.6 94.8 89.2 13.70 0.92 -
Tumor necrosis factor-α, pg/mL3
2264 1241 1887 269.8 0.03 1,2
1Treatments included a 70% concentrate diet fed ad libitum (70AD), a 30% concentrate diet fed ad libitum (30AD),
and the 70% concentrate diet restricted to the NEg intake of the 30AD treatment (70RES). 2Contrasts: (1) Energy Intake: 70% concentrate fed ad libitum vs. 30% concentrate fed ad libitum and 70%
concentrate diet fed in a quantity restricted to equal the NEg intake of the 30% concentrate treatment; (2) Energy
Source: 30% concentrate fed ad libitum vs. 70% concentrate fed ad libitum and 70% concentrate diet fed in a
quantity restricted to equal the NEg intake of the 30% concentrate treatment. 3There was no effect of concentration of lipopolysaccharide in culture. Data is reported as the mean of the 0.01 and
5 µg/mL of lipopolysaccharide in the culture media.

22
Preconditioning Period Individually Penned Group Penned
D 0 28 40 30 33 35
0 37 50
BW
BS
BW
BS
IR
IBRV
BS
BS BS BS BW
BS BW
BS
70AD, 30AD, or 70RES 50AD

23
Figure 2
Day of study
28 30 32 34 36 38 40
Tem
pe
ratu
re,
o C
38.4
38.5
38.6
38.7
38.8
38.9
39.0
39.1

24
Figure 3
Day of study
25 30 35 40 45 50 55
Dry
matte
r in
take, kg / d
5
6
7
8
9
10
11
70AD
30AD
70RES
* *
* *
*
Group Penned Individually Penned
IBRV

25
Figure 4a
Day of study
25 30 35 40 45 50 55
Se
rum
glu
co
se, m
g/d
L
60
70
80
90
100
110
120
70AD
30AD
70RES
#
Individually Penned Group Penned
IBRV

26
Figure 4b
Time of study, day
25 30 35 40 45 50 55
Se
rum
ure
a n
itro
gen
, m
g/d
L
5
6
7
8
9
10
11
12
70AD
30AD
70RES
IBRV
Individually Penned Group Penned
# *
* *

27
Figure 4c
Day of study
25 30 35 40 45 50 55
Se
rum
no
n-e
ste
rifie
d f
atty a
cid
s, u
Eq
/L
50
100
150
200
250
300
350
400
450
70AD
30AD
70RES
IBRV
Individually Penned Group Penned
*
*

28
Figure 1: Timeline and sampling dates of the experimental plan. Steers were fed either
a 70% concentrate diet ad libitum (70AD), a 30% concentrate diet ad libitum (30AD), or
the 70% concentrate diet restricted to the NEg intake of the 30AD (70RES) for 34 d. All
steers were switched to a 50% concentrate diet ad libitum on d 34 (50AD). BW = body
weight; BS = blood sample; IR = ex vivo immune responses; IBRV = intranasal
challenge with infectious bovine rhinotracheitis virus.
Figure 2: Least square means of all steer’s (n = 48) rectal temperature measured daily at
0800 h following the IBRV challenge. No differences were detected among treatments.
All animals displayed a moderate febrile response in response to the viral challenge (P <
0.05). Error bars represent ± SEM.
Figure 3: Least square means of steer dry matter intake following the IBRV challenge.
Dietary treatments were 70% concentrate diet fed ad libitum (70AD; closed circle, n =
16), 30% concentrate diet fed ad libitum (30AD; open circle, n = 16), and 70%
concentrate diet fed in a quantity restricted to equal the NEg intake of the 30%
concentrate treatment (70RES; closed triangle, n = 16). * = (P < 0.05). Error bars
represent ± SEM.
Figure 4a: Least square means of plasma glucose concentrations following the IBRV
challenge. Dietary treatments were 70% concentrate diet fed ad libitum (70AD; closed
circle, n = 16), 30% concentrate diet fed ad libitum (30AD; open circle, n = 16), and 70%
concentrate diet fed in a quantity restricted to equal the NEg intake of the 30%

29
concentrate treatment (70RES; closed triangle, n = 16). No differences between
treatments were detected. # = (P ≤ 0.10). Error bars represent ± SEM.
Figure 4b: Least square means of plasma urea nitrogen concentrations following the
IBRV challenge. Dietary treatments were 70% concentrate diet fed ad libitum (70AD;
closed circle, n = 16), 30% concentrate diet fed ad libitum (30AD; open circle, n = 16),
and 70% concentrate diet fed in a quantity restricted to equal the NEg intake of the 30%
concentrate treatment (70RES; closed triangle, n = 16). * = (P < 0.05); # = (P ≤ 0.10).
Error bars represent ± SEM.
Figure 4c: Least square means of steer plasma non-esterified fatty acids concentrations
following the IBRV challenge. Dietary treatments were 70% concentrate diet fed ad
libitum (70AD; closed circle, n = 16), 30% concentrate diet fed ad libitum (30AD; open
circle, n = 16), and 70% concentrate diet fed in a quantity restricted to equal the NEg
intake of the 30% concentrate treatment (70RES; closed triangle, n = 16). * = (P < 0.05).
Error bars represent ± SEM.