Effects of data presentation and perceptual speed on speed and accuracy in table reading for...
11
Occupational Ergonomics 12 (2015) 119–129 119 DOI 10.3233/OER-150229 IOS Press Effects of data presentation and perceptual speed on speed and accuracy in table reading for inventory control Martina Ziefle ∗ , Philipp Brauner and Frederic Speicher Communication Science, Human-Computer Interaction Center, RWTH Aachen University, Aachen, Germany Abstract. BACKGROUND: The increasing amount of available data in digital working environments raise considerable usability chal- lenges. Beyond the trend for automation of such processes, strategic decisions still depend on humans in the loop who have to perceive, understand and process increasingly complex information and to make quick and correct decisions with considerable consequences for the effectiveness of the production process. OBJECTIVE: This work is concerned with a baseline experiment in which effects of data presentations and information complexity on speed and accuracy were studied taking table reading for inventory control as an example. METHODS: Experimentally, the information complexity (number of lines per table, number of digits, specificity of labels) as well as operators’ cognitive ability (perceptual speed) was examined in terms of decision speed and accuracy. In addition, learnability effects were assessed. RESULTS: Results show a significant effect of all factors on task performance. With increasing information complexity deci- sion speed is considerably decreased. Operators’ perceptual speed modulates performance. Low perceptual speed in conjunction with insufficient data presentation results in significantly lower task performance. CONCLUSIONS: Usability and user-centered information displaying is of vital importance for efficient operators’ perfor- mance and to balance mental workload. The findings contribute to an understanding of the effects of single factors in combi- nation for mental workload and may lead to better managerial decisions concerning the design of working conditions (e.g. by automating processes). Keywords: Usability, performance, speed, accuracy, table reading, inventory control, tabular data 1. Introduction Traditionally, enterprise resource planning (ERP) systems are managing complex information from different sources in order to support the workers’ decision-making process [1] and to increase compa- nies’ productivity (for an overview [2]). In many industrial work environments, in which office workers have to monitor and control processes by means of ERP systems, usability of information presentation and the ease of using these systems is critical [3,4]. Studies dealing with an assessment of the usability of current ERP systems [5,6] reveal several usability concerns: (1) Weaknesses in the presentation of information (visual factors, output, user interface), (2) weaknesses in the navigation (search of relevant ∗ Corresponding author: Martina Ziefle, RWTH Aachen University, Campus Boulevard 57, 52074 Aachen, Germany. Tel.: +49 241 80 49220; E-mail: ziefl[email protected]. 1359-9364/15/$35.00 c 2015 – IOS Press and the authors. All rights reserved AUTHOR COPY
-
Upload
rwth-aachen -
Category
Documents
-
view
5 -
download
0
Transcript of Effects of data presentation and perceptual speed on speed and accuracy in table reading for...
Occupational Ergonomics 12 (2015) 119–129 119DOI 10.3233/OER-150229IOS Press
Effects of data presentation and perceptualspeed on speed and accuracy in table readingfor inventory control
Martina Ziefle∗, Philipp Brauner and Frederic SpeicherCommunication Science, Human-Computer Interaction Center, RWTH Aachen University, Aachen,Germany
Abstract.BACKGROUND: The increasing amount of available data in digital working environments raise considerable usability chal-lenges. Beyond the trend for automation of such processes, strategic decisions still depend on humans in the loop who have toperceive, understand and process increasingly complex information and to make quick and correct decisions with considerableconsequences for the effectiveness of the production process.OBJECTIVE: This work is concerned with a baseline experiment in which effects of data presentations and informationcomplexity on speed and accuracy were studied taking table reading for inventory control as an example.METHODS: Experimentally, the information complexity (number of lines per table, number of digits, specificity of labels)as well as operators’ cognitive ability (perceptual speed) was examined in terms of decision speed and accuracy. In addition,learnability effects were assessed.RESULTS: Results show a significant effect of all factors on task performance. With increasing information complexity deci-sion speed is considerably decreased. Operators’ perceptual speed modulates performance. Low perceptual speed in conjunctionwith insufficient data presentation results in significantly lower task performance.CONCLUSIONS: Usability and user-centered information displaying is of vital importance for efficient operators’ perfor-mance and to balance mental workload. The findings contribute to an understanding of the effects of single factors in combi-nation for mental workload and may lead to better managerial decisions concerning the design of working conditions (e.g. byautomating processes).
Keywords: Usability, performance, speed, accuracy, table reading, inventory control, tabular data
1. Introduction
Traditionally, enterprise resource planning (ERP) systems are managing complex information fromdifferent sources in order to support the workers’ decision-making process [1] and to increase compa-nies’ productivity (for an overview [2]). In many industrial work environments, in which office workershave to monitor and control processes by means of ERP systems, usability of information presentationand the ease of using these systems is critical [3,4]. Studies dealing with an assessment of the usabilityof current ERP systems [5,6] reveal several usability concerns: (1) Weaknesses in the presentation ofinformation (visual factors, output, user interface), (2) weaknesses in the navigation (search of relevant
∗Corresponding author: Martina Ziefle, RWTH Aachen University, Campus Boulevard 57, 52074 Aachen, Germany. Tel.:+49 241 80 49220; E-mail: [email protected].
1359-9364/15/$35.00 c© 2015 – IOS Press and the authors. All rights reserved
AUTH
OR
COPY

120 M. Ziefle et al. / Effects of data presentation and perceptual speed on speed and accuracy
information), (3) weaknesses in the learnability of the system (steep learning curves) as well as (4) lowtask support (inconsistent terminology, no adequate support). Users reported that the increasing amountof available data delivered by ERP systems in combination with suboptimal information representationleads to high (perceived) workload and a low motivation to use these systems [3]. As strategic decisionsstill depend on humans in the loop who have to perceive, understand and process increasingly complexinformation and to make quick and correct decisions with considerable consequences for the effective-ness of the production process [2,7], the usability and the adequacy of the information visualization arecritical factors [2,6,8].
The tasks’ complexity and the workload for operators when using ERP systems is considerable: Work-ers are faced with an increasing amount of displayed information, resulting in a high visual load, causedby a high information density [9–11]. In addition, cognitive load is present, as not only different modi ofinformation (numbers, text, tables) have to be processed at a time but also different cognitive operations(comparison of different information and fast decisions) [12,13]. Also, inspection processes often have tobe executed under time and performance pressure and decision errors might have long-lasting and graveconsequences for workers, companies as well as the complete logistics of the supply chain [14,15]. Longinspection periods are further aggravating the cognitive load in addition, not to mention emotional andmotivational consequences for the operator under control [16,17].
The capacity of the human information processing is limited [18,19], especially when operators haveto control different information types using interfaces that suffer from complicated screen layouts, diffi-cult to understand labels and buttons, undistinguishable and unclear icons [20], and steep learning curves.Receiving too much and too complex information under time pressure necessarily leads to informationoverload [21], and results in prominent performance decreases in both, effectiveness and efficiency of thedecision making process [22]. A recent study dealing with poor data presentation of ERP systems [23]found that high cognitive abilities of workers, specifically high perceptual speed, are able to compen-sate the poor usability of data management systems, but that low perceptual speed in conjunction withinsufficient data presentation leads to significantly lower task performance.
2. Questions addressed and logic of experiment
While there is considerable knowledge about the effects of single factors of information presentationdecreasing human performance in ERP systems [2], still, it is not possible to draw a clear picture on howto optimize information presentation in ERP systems and to increase usability. This is due to the factthat, across studies, factors were either studied in isolation, or by means of different task types (support,decision, inspection or comparison tasks) and, also, with different task difficulties (consisting of severalsubtasks that have to be executed consecutively), as it is the case in real ERP systems. With respect toinformation presentation, it is not clear which of the factors decrease performance to what extent (andare possibly more critical than others) and which of the factors might be able to compensate performancedeterioration (e.g. a high information processing ability). For practitioners it is thus difficult to deriveguidelines or managerial decisions for an optimization of working conditions (e.g. the development oftutor systems).
In this paper, we therefore pursue an experimental bottom-up approach and use a simplified task (tablereading in inventory control). Experimentally, we assess the decision quality of users alongside of fourvariables, which contribute to the usability of information presentation in inventory control. Three factorsrelate to the complexity of information (lines per table, number of digits to be monitored at a time), andthe task context (generic vs. concrete task setting). Another factor addresses the different ability of users
AUTH
OR
COPY

M. Ziefle et al. / Effects of data presentation and perceptual speed on speed and accuracy 121
to quickly process information. As dependent variables, the speed and accuracy of the decision wasdetermined, in order to quantify the factual effects on decision performance (rather than to assess theperceived workload only). This experimental bottom-up approach should reveal the “decision costs” ofthe single factors on performance, which can be assessed not only in isolation but also in combination.
3. Method
3.1. Task
For the experiment we simulated prototypical decision situations in the domain of material dispositionand inventory control, using a simplified experimental task. Users had to monitor stock levels for a setof supplies and must place orders if insufficient production resources are or will be available. Two tableswith alphanumerical data were presented side by side. The first table on the left side of the screenrepresents the minimum stock levels for a set of supplies required for the production. The second tableon the right side represents the current stock of the supplies. An order needs to be placed if for at leastone supply the current stock level is below the required stock level. The supplies in both tables are thesame order, meaning that the first rows need to be compared, then the second rows and so on.
3.2. Independent variables
Number of Lines: The first variable models the number of distinct items presented in the inventorylist. The number of items and therefore the number of lines of the table ranged from 2 to 12 items (i.e.,2, 4, 6, 8, 10, 12 lines).
Number of digits: The second variable models the length of the numerical data within each cell of thetables. The number of digits is constant within a table, but varies across the tables and ranges from 2 to10 (2, 4, 6, 8, 10 digits).
Decision context: The third variable models the context with the two levels generic and concrete. Halfof the presented tables simulated an inventory management screen of a brewery with concrete goods(e.g., “Water”, “Hops”, “Malt”, etc.). In contrast, the other half of the tables just had generic labels (i.e.,“Element 05”).
Perceptual Speed: The fourth variable considers perceptual speed as a moderator variable on per-formance in this kind of supply chain planning tasks. Capturing this cognitive ability, the number-comparison test [24] was used (reliability of 0.82).
3.3. Dependent variables
As dependent variables the speed of the decision (ms) and the accuracy (%) was captured with logfiles. Correct decisions were defined twofold. A “Yes” answer, whenever additional supplies need tobe ordered to fulfill the production demand (order) or a “No” answer, if enough supplies are available(no order). New supplies must be ordered whenever supplies for at least one item are insufficient. Thedecisions are equally distributed (i.e., in about 50% of the trails an order is necessary).
3.4. Design
We used a 6 (lines) × 5 (digits) × 2 (context) × 2 (perceptual speed) multifactorial design withrepeated measurements on the first three factors, while information processing speed was treated as a
AUTH
OR
COPY
122 M. Ziefle et al. / Effects of data presentation and perceptual speed on speed and accuracy
Info
rmat
ion
Com
plex
ity
Decision Context{generic, concrete}
Speed{ms}
Accuracy{correct, error}
Number of Digits{2, 4, 6, 8, 10}
Number of Lines{2, 4, 6, 8, 10, 12}
Perceptual Speed
Experiment
Dec
isio
n
Table
Table
Table
...
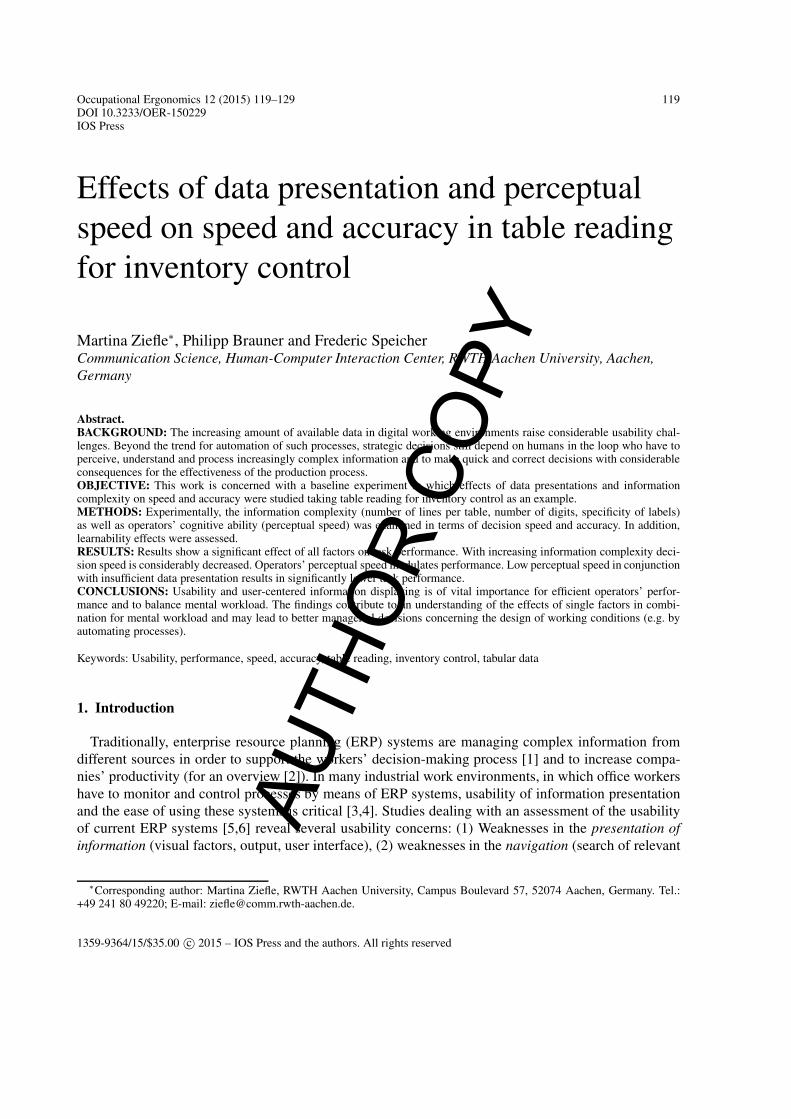
Fig. 1. Schematic overview of the experimental design.
between subject variable. The experimental setup is illustrated in Fig. 1. To investigate learning effectseach participant did 3 blocks of 30 trails (lines and digits full factorial; context and decision uniformlydistributed).
3.5. Procedure
First, participants were introduced to the experiment. Next, participants’ perceptual speed was mea-sured by a psychometric test [24]. Participants were seated in front of a desk with a 13.3” display, theviewing distance was approx. 50 cm. The measurement started with a brief introduction and two trainingtrials. It then iterated through all trials in random order. Each trial started with the press and release ofthe space bar, followed by a fixation cross presented at the center of the screen for 250 ms. After thedisappearance of the fixation cross the actual task stimuli are shown with a table at the left side (requiredstock) and a table at the right side of the screen (available stock). If enough stocks are available for eachof the supplies, participants had to press the “m” key, whereas else the “c” key had to be pressed, as atleast one supply is short. Feedback on the correctness of the decision was given after each trial. Partic-ipants were instructed to decide precise and fast. To investigate learnability, the same set of tables waspresented three times (randomized). In total 90 trails were carried out per participant. The experimenttook about 40 minutes to complete.
3.6. Participants
In total, 18 well-educated participants volunteered and were not gratified for their efforts. The ageranged from 23 to 38 years and all participants reported normal or corrected-to normal visual acuity.Perceptual speed ranged from 21 to 38 points (M = 26.5; SD = 4.5) from 48 points to be reached max.On the base of the median, two groups were formed, one with a (comparably) lower processing speed(M = 22.8; SD = 1.1) and a group with higher processing speed (M = 30.0; SD = 3.1). Perceptualspeed was not associated with age (n.s.) or gender (n.s.).
4. Results
Data was analyzed by ANOVA procedures (repeated measurements). The significance of the omnibusF-Tests were taken from Pillai’s values. Significance level was set at 5%. The reporting structure of
AUTH
OR
COPY
M. Ziefle et al. / Effects of data presentation and perceptual speed on speed and accuracy 123
0
2000
4000
6000
8000
10000
12000
14000
2 lines 4 lines 6 lines 8 lines 10 lines 12 lines 0
20
40
60
80
100
2 lines 4 lines 6 lines 8 lines 10 lines 12 lines
Number of lines per table Number of lines per table
Acc
urac
y (%
)
Dic
isio
n tim
es (m
sec)
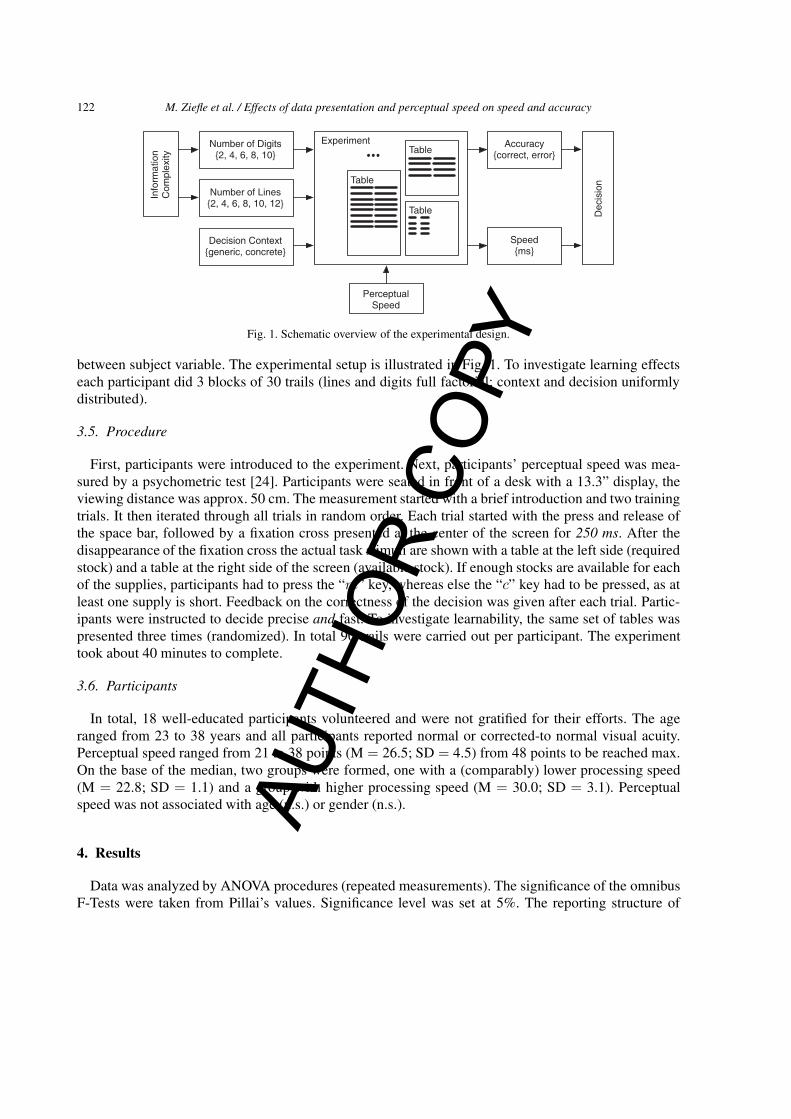
Fig. 2. Mean effects of the number of lines per table on decision times (left) and accuracy (right).
the result section is as follows. First we report on main effects, i.e. effects of the number of lines pertable, effects of the number of digits of numbers in tables, and the effects of labels on both, speed ofdecisions and accuracy. Then learnability effects are addressed, contrasting the performance in the threeconsecutive trials, followed by effects of participants’ information processing speed. In a second step,interaction effects of independent variables on performance are outlined.
4.1. Effects of the number of lines per table
A first analysis regarded the complexity effect of the number of lines per table, which had to becontrolled. Note that this factor had been varied in six steps, thus there were tables with only two linesup to tables with 12 lines, each (Fig. 2).
Reaction times increased by more factor 3.5 from the condition with the lowest complexity (M = 4 s;SE = 2.7) to the most complex condition with 12 lines (M = 14 s; SE = 2.5). When looking at accuracy,outcomes do not comparably reflect task complexity. Values level off at about 90% (varying unsystem-atically from 87 to 95%). While omnibus F-tests showed a significant effect on overall performance(F(5,85) = 80.1; p < 0.0000), single F-tests revealed that the number of lines affect predominatelydecision times (F(5,85) = 228.8; p < 0.0000), with no systematic effect on the accuracy.
4.2. Effects of number of digits of numbers in tables
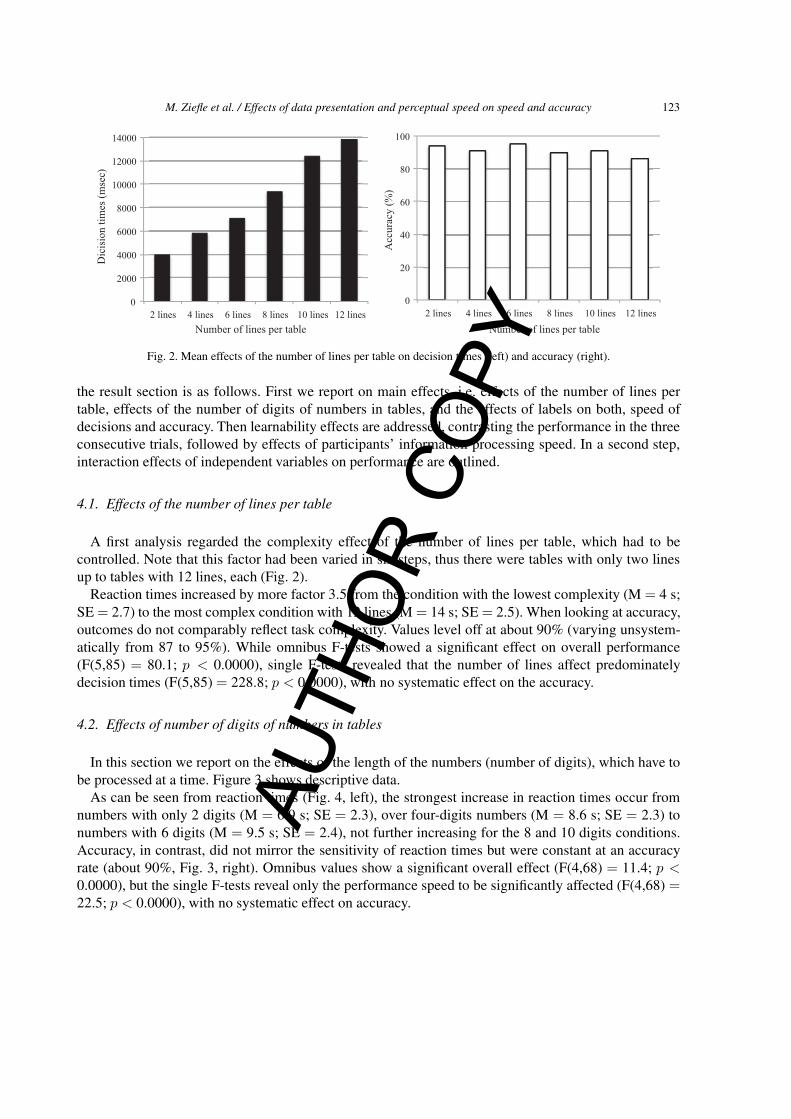
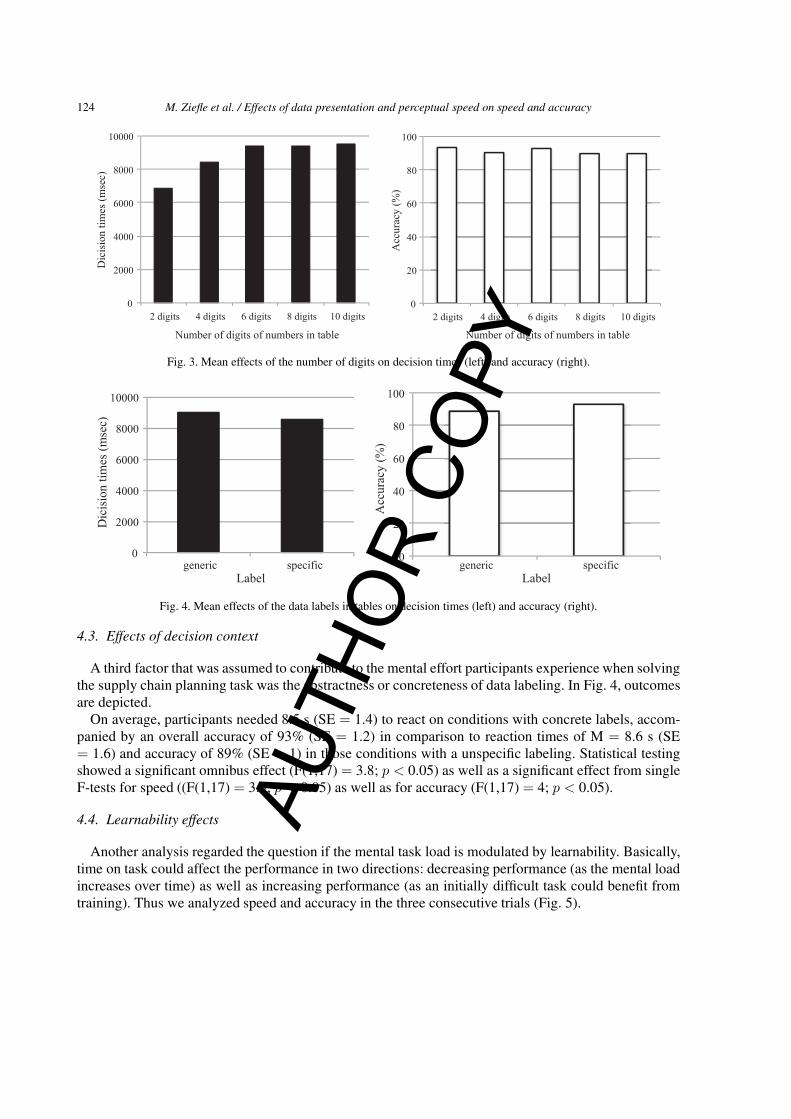
In this section we report on the effects of the length of the numbers (number of digits), which have tobe processed at a time. Figure 3 shows descriptive data.
As can be seen from reaction times (Fig. 4, left), the strongest increase in reaction times occur fromnumbers with only 2 digits (M = 6.9 s; SE = 2.3), over four-digits numbers (M = 8.6 s; SE = 2.3) tonumbers with 6 digits (M = 9.5 s; SE = 2.4), not further increasing for the 8 and 10 digits conditions.Accuracy, in contrast, did not mirror the sensitivity of reaction times but were constant at an accuracyrate (about 90%, Fig. 3, right). Omnibus values show a significant overall effect (F(4,68) = 11.4; p <0.0000), but the single F-tests reveal only the performance speed to be significantly affected (F(4,68) =22.5; p < 0.0000), with no systematic effect on accuracy.
AUTH
OR
COPY
124 M. Ziefle et al. / Effects of data presentation and perceptual speed on speed and accuracy
0
2000
4000
6000
8000
10000
2 digits 4 digits 6 digits 8 digits 10 digits 0
20
40
60
80
100
2 digits 4 digits 6 digits 8 digits 10 digits
Acc
urac
y (%
)
Dic
isio
n tim
es (m
sec)
Number of digits of numbers in table Number of digits of numbers in table
Fig. 3. Mean effects of the number of digits on decision times (left) and accuracy (right).
0
2000
4000
6000
8000
10000
generic specific 0
20
40
60
80
100
generic specific
Acc
urac
y (%
)
Dic
isio
n tim
es (m
sec)
Label Label
Fig. 4. Mean effects of the data labels in tables on decision times (left) and accuracy (right).
4.3. Effects of decision context
A third factor that was assumed to contribute to the mental effort participants experience when solvingthe supply chain planning task was the abstractness or concreteness of data labeling. In Fig. 4, outcomesare depicted.
On average, participants needed 8.5 s (SE = 1.4) to react on conditions with concrete labels, accom-panied by an overall accuracy of 93% (SE = 1.2) in comparison to reaction times of M = 8.6 s (SE= 1.6) and accuracy of 89% (SE = 1) in those conditions with a unspecific labeling. Statistical testingshowed a significant omnibus effect (F(1,17) = 3.8; p < 0.05) as well as a significant effect from singleF-tests for speed ((F(1,17) = 3.9; p < 0.05) as well as for accuracy (F(1,17) = 4; p < 0.05).
4.4. Learnability effects
Another analysis regarded the question if the mental task load is modulated by learnability. Basically,time on task could affect the performance in two directions: decreasing performance (as the mental loadincreases over time) as well as increasing performance (as an initially difficult task could benefit fromtraining). Thus we analyzed speed and accuracy in the three consecutive trials (Fig. 5).
AUTH
OR
COPY
M. Ziefle et al. / Effects of data presentation and perceptual speed on speed and accuracy 125
0
2000
4000
6000
8000
10000
12000
first second third 0
20
40
60
80
100
first second third
Acc
urac
y (%
)
Dic
isio
n tim
es (m
sec)
Trial Trial
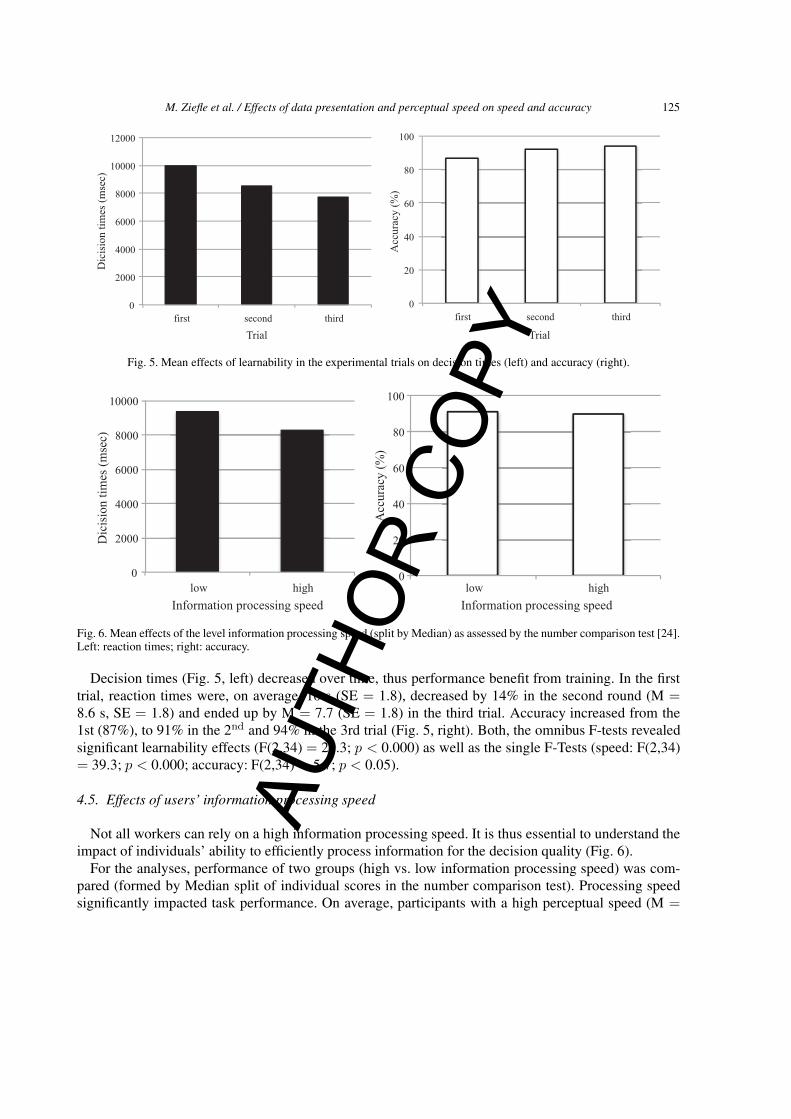
Fig. 5. Mean effects of learnability in the experimental trials on decision times (left) and accuracy (right).
0
2000
4000
6000
8000
10000
low high 0
20
40
60
80
100
low high
Acc
urac
y (%
)
Dic
isio
n tim
es (m
sec)
Information processing speed Information processing speed
Fig. 6. Mean effects of the level information processing speed (split by Median) as assessed by the number comparison test [24].Left: reaction times; right: accuracy.
Decision times (Fig. 5, left) decreased over time, thus performance benefit from training. In the firsttrial, reaction times were, on average, 10 s (SE = 1.8), decreased by 14% in the second round (M =8.6 s, SE = 1.8) and ended up by M = 7.7 (SE = 1.8) in the third trial. Accuracy increased from the1st (87%), to 91% in the 2nd and 94% in the 3rd trial (Fig. 5, right). Both, the omnibus F-tests revealedsignificant learnability effects (F(2,34) = 21.3; p < 0.000) as well as the single F-Tests (speed: F(2,34)= 39.3; p < 0.000; accuracy: F(2,34) = 5.7; p < 0.05).
4.5. Effects of users’ information processing speed
Not all workers can rely on a high information processing speed. It is thus essential to understand theimpact of individuals’ ability to efficiently process information for the decision quality (Fig. 6).
For the analyses, performance of two groups (high vs. low information processing speed) was com-pared (formed by Median split of individual scores in the number comparison test). Processing speedsignificantly impacted task performance. On average, participants with a high perceptual speed (M =
AUTH
OR
COPY
126 M. Ziefle et al. / Effects of data presentation and perceptual speed on speed and accuracy
Number of lines per table
Dic
isio
n tim
es (m
sec)
0
2000
4000
6000
8000
10000
12000
14000
16000
18000
2 lines 4 lines 6 lines 8 lines 10 lines 12 lines
2 digits 4 digits 6 digits 8 digits 10 digits
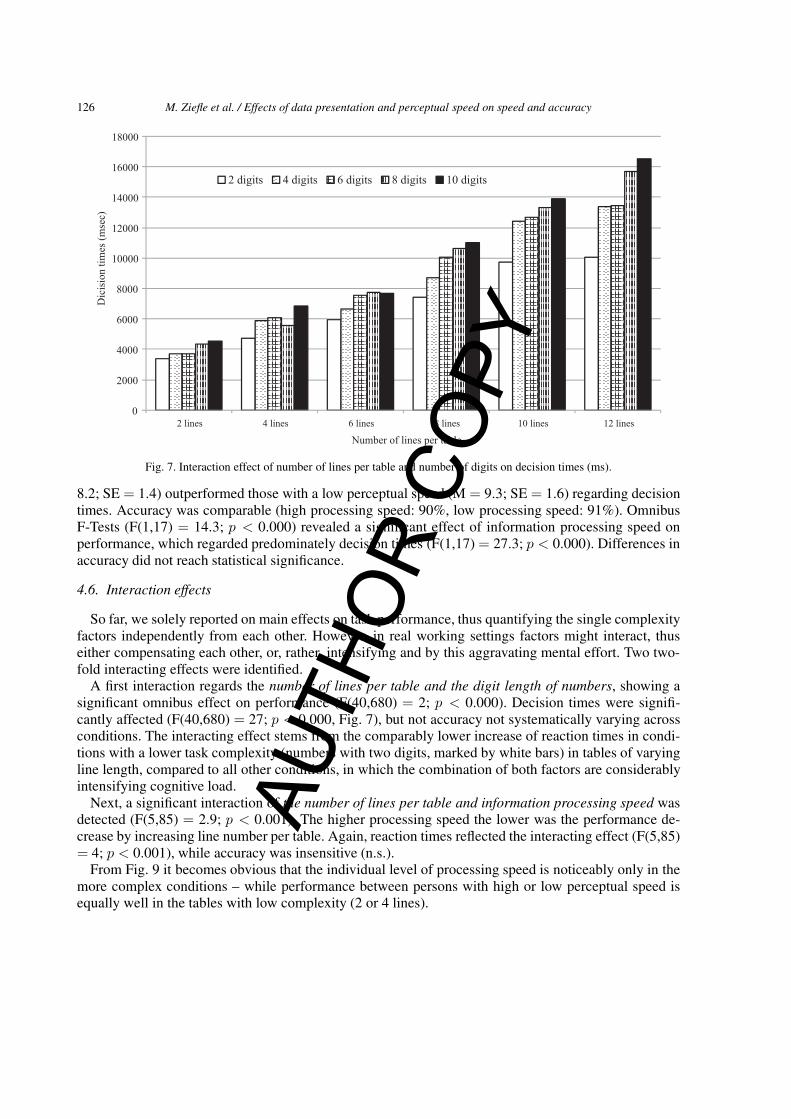
Fig. 7. Interaction effect of number of lines per table and number of digits on decision times (ms).
8.2; SE = 1.4) outperformed those with a low perceptual speed (M = 9.3; SE = 1.6) regarding decisiontimes. Accuracy was comparable (high processing speed: 90%, low processing speed: 91%). OmnibusF-Tests (F(1,17) = 14.3; p < 0.000) revealed a significant effect of information processing speed onperformance, which regarded predominately decision times (F(1,17) = 27.3; p < 0.000). Differences inaccuracy did not reach statistical significance.
4.6. Interaction effects
So far, we solely reported on main effects on task performance, thus quantifying the single complexityfactors independently from each other. However, in real working settings factors might interact, thuseither compensating each other, or, rather, intensifying and by this aggravating mental effort. Two two-fold interacting effects were identified.
A first interaction regards the number of lines per table and the digit length of numbers, showing asignificant omnibus effect on performance (F(40,680) = 2; p < 0.000). Decision times were signifi-cantly affected (F(40,680) = 27; p < 0.000, Fig. 7), but not accuracy not systematically varying acrossconditions. The interacting effect stems from the comparably lower increase of reaction times in condi-tions with a lower task complexity (numbers with two digits, marked by white bars) in tables of varyingline length, compared to all other conditions, in which the combination of both factors are considerablyintensifying cognitive load.
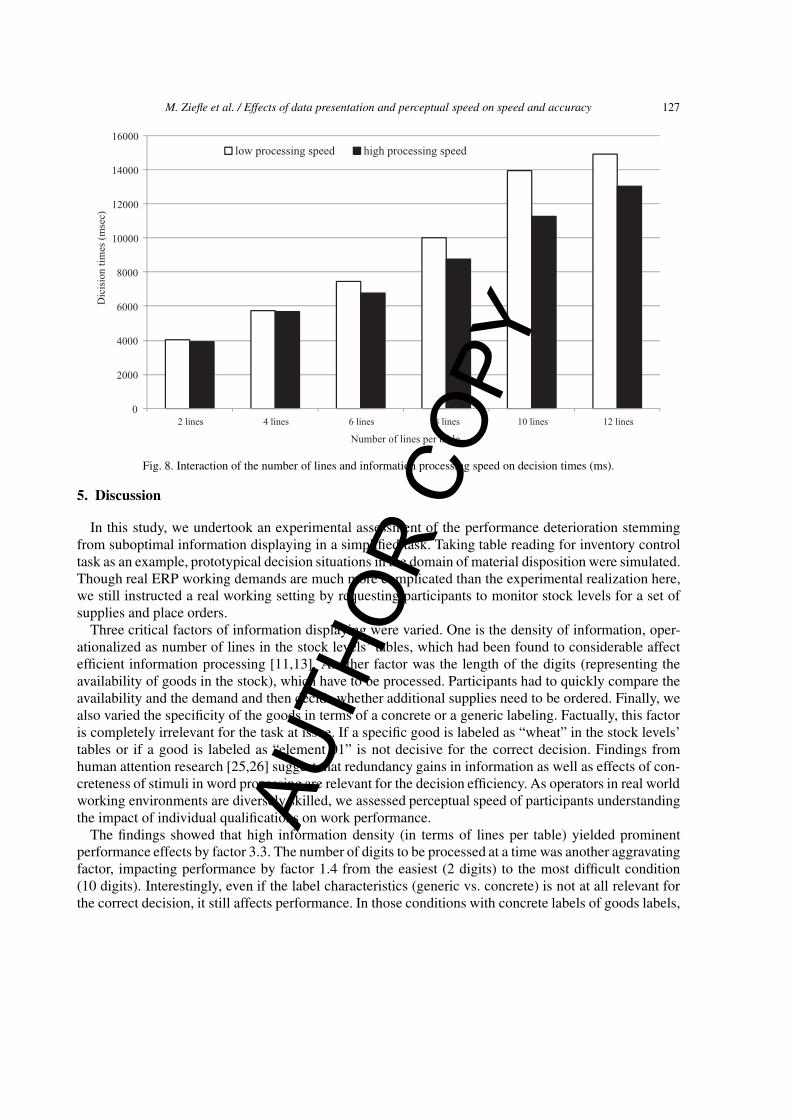
Next, a significant interaction of the number of lines per table and information processing speed wasdetected (F(5,85) = 2.9; p < 0.001). The higher processing speed the lower was the performance de-crease by increasing line number per table. Again, reaction times reflected the interacting effect (F(5,85)= 4; p < 0.001), while accuracy was insensitive (n.s.).
From Fig. 9 it becomes obvious that the individual level of processing speed is noticeably only in themore complex conditions – while performance between persons with high or low perceptual speed isequally well in the tables with low complexity (2 or 4 lines).
AUTH
OR
COPY
M. Ziefle et al. / Effects of data presentation and perceptual speed on speed and accuracy 127
Number of lines per table
Dic
isio
n tim
es (m
sec)
0
2000
4000
6000
8000
10000
12000
14000
16000
2 lines 4 lines 6 lines 8 lines 10 lines 12 lines
low processing speed high processing speed
Fig. 8. Interaction of the number of lines and information processing speed on decision times (ms).
5. Discussion
In this study, we undertook an experimental assessment of the performance deterioration stemmingfrom suboptimal information displaying in a simplified task. Taking table reading for inventory controltask as an example, prototypical decision situations in the domain of material disposition were simulated.Though real ERP working demands are much more complicated than the experimental realization here,we still instructed a real working setting by requesting participants to monitor stock levels for a set ofsupplies and place orders.
Three critical factors of information displaying were varied. One is the density of information, oper-ationalized as number of lines in the stock levels’ tables, which had been found to considerable affectefficient information processing [11,13]. Another factor was the length of the digits (representing theavailability of goods in the stock), which have to be processed. Participants had to quickly compare theavailability and the demand and then decide whether additional supplies need to be ordered. Finally, wealso varied the specificity of the goods in terms of a concrete or a generic labeling. Factually, this factoris completely irrelevant for the task at issue. If a specific good is labeled as “wheat” in the stock levels’tables or if a good is labeled as “element 01” is not decisive for the correct decision. Findings fromhuman attention research [25,26] suggest that redundancy gains in information as well as effects of con-creteness of stimuli in word processing are relevant for the decision efficiency. As operators in real worldworking environments are diversely skilled, we assessed perceptual speed of participants understandingthe impact of individual qualifications on work performance.
The findings showed that high information density (in terms of lines per table) yielded prominentperformance effects by factor 3.3. The number of digits to be processed at a time was another aggravatingfactor, impacting performance by factor 1.4 from the easiest (2 digits) to the most difficult condition(10 digits). Interestingly, even if the label characteristics (generic vs. concrete) is not at all relevant forthe correct decision, it still affects performance. In those conditions with concrete labels of goods labels,
AUTH
OR
COPY
128 M. Ziefle et al. / Effects of data presentation and perceptual speed on speed and accuracy
decision speed was faster (4%, factor 1.04) in comparison to goods in the tables with generic labeling.This shows that humans tend to process even irrelevant information on a given display.
Two factors might have a compensation potential for operators’ mental load when processing thosetasks – even though their relative power is lower than the disadvantage of suboptimal information dis-plays. One is that time on task leads to learnability effects (factor 1.3) showing that participants getfamiliarized with the task over the 90 decisions to be carried out consecutively. Of course, this is only afirst glimpse into the nature of learnability effects in this context, as it is probable that a further extensionof task completion might have still detrimental effects on the long run (e.g., when workers have to dothose tasks for several hours). The other performance-increasing factor is the individual competency inperceptual speed, thus the ability to fast compare stimuli and make adequate decisions. Persons withhigh perceptual speed can compensate poor presentations more effectively than individuals with lowperceptual speed using good presentations (13%). From this it can be concluded that task performanceprofits from operators’ high perceptual speed. However, from an occupational ergonomic point of viewit is much more important to argue from the other side: Not all persons can rely on outstanding cognitivecompetencies, especially as future work generations are characterized by highly diverse skills [7] withvery different educational and professional backgrounds.
6. Conclusion
The implication of the findings for real world work environments can be summarized in two majorcornerstones. First, usability issues in this kind of tasks are considerable. Second there is urgent need foraction in both, raising substantial awareness for the requirements of the human information processingsystem for an efficient work as well as for the high potential of increasing work performance by providingusable visual interfaces. This not only applies to software developers, but also to organizations andcompanies, likewise.
Critically one could argue that any of these usability issues can be easily removed if processes wouldbe automated. On the one hand this is factually one of the solutions, which might be quite effective asa managerial company decision. On the other hand, in many contexts strategic decisions still depend onhumans in the loop who have to perceive, understand and process increasingly complex information andto make quick and correct decisions. It is thus still a duty to ensure that information processing and userinterfaces are in line with the tasks’ demands and the abilities of the operators.
Follow-up studies must evaluate if the findings from the singular decision screens are also transfer-able to more complex or realistic environments. We propose to use business simulation as a suitableexperimental paradigm for that purpose [22]. The interface of these games can be specifically manipu-lated in line with the present study and the effect on speed, accuracy, and total company profit can beinvestigated. In addition, further research has to consider not only a comparably young, technologicallyexperienced healthy sample but a more heterogeneous group of operators which is more representativefor the nowadays workforce. On the long run, adaptive tutor systems could be developed which assistoperators, visually and cognitively under higher mental workload.
Acknowledgements
The authors would like to thank the German Research Foundation (DFG) for its kind support withinthe Cluster of Excellence “Integrative Production Technology for High-Wage Countries”.
AUTH
OR
COPY
M. Ziefle et al. / Effects of data presentation and perceptual speed on speed and accuracy 129
References
[1] Chen, I. J. (2001). Planning for ERP systems: analysis and future trend. Business process management journal, 7(5),374-386.
[2] Botta-Genoulaz, V., Millet, P. A., & Grabot, B. (2005). A survey on the recent research literature on ERP systems.Computers in Industry, 56(6), 510-522.
[3] Hurtienne, J., Prulmper, J., & Roltting, M. (2009). When Enterprise Resource Planning Needs Software Ergonomics –Some Typical Scenarios. In Proceedings of the 17th World Congress on Ergonomics 2009.
[4] Chang, M. K., Cheung, W., Cheng, C. H., & Yeung, J. H. (2008). Understanding ERP system adoption from the user’sperspective. International Journal of Production Economics, 113(2), 928-942.
[5] Calisir, F., & Calisir, F. (2004). The relation of interface usability characteristics, perceived usefulness, and perceivedease of use to end user satisfaction with enterprise resource planning (ERP) systems. Computers in Human Behavior,20(4), 505-515.
[6] Singh, A., and Wesson, J. (2009). Evaluation Criteria for Assessing the Usability of ERP Systems. In Proceedings ofSAICSIT 2009 (pp. 87-95). Riverside, Vanderbiljpark, South Africa: ACM.
[7] Brauner, P. & Ziefle, M. (2014). Human Factors in Production Systems. In Christian Brecher (Ed.). Advances in Produc-tion Technology. Lecture Notes in Production Engineering (pp. 187-199). Heidelberg: Springer.
[8] Philipsen, R; Brauner, P; Stiller, S.; Ziefle, M. & Schmitt, R. (2014). The Role of Human Factors in Production Net-works and Quality Management. In: Fiona Fui-Hoon Nah (Ed.): HCIB/HCII 2014, LNCS 8527, pp. 80-91. Switzerland:Springer.
[9] Ziefle M (2010) Information presentation in small screen devices: The trade-off between visual density and menu fore-sight. Applied Ergonomics 41:719–730.
[10] Schlick, Christopher; Winkelholz, Carsten; Ziefle, Martina; Mertens, Alexander (2012). Visual Displays. In J.A. Jacko(ed.). The Human Computer Interaction Handbook: Fundamentals, Evolving Technologies and Emerging Applications.3rd edition, pp. 157-191. Boca Raton: CRC Press.
[11] Drury, C. G., & Clement, M. R. (1978). The effect of area, density, and number of background characters on visualsearch. Human Factors: The Journal of the Human Factors and Ergonomics Society, 20(5), 597-602.
[12] Parush, A. Hod, A. & Shtub, A. (2007). Impact of visualization type and contextual factors on performance with enter-prise resource planning systems. Computers & Industrial Engineering, 52(1) 133–142, 2007.
[13] J. Meyer, J. Shinar, D. & Leiser, D. (1997). Multiple Factors that Determine Performance with Tables and Graphs, HumanFactors, 39(2) 268–286.
[14] Davies, D. R., Matthews, G., Stammers, R. B., & Westerman, S. J. (2013). Human performance: Cognition, stress andindividual differences. Psychology Press.
[15] Gilboa, S., Shirom, A., Fried, Y., & Cooper, C. (2008). A metaanalysis of work demand stressors and job performance:examining main and moderating effects. Personnel Psychology, 61(2), 227-271.
[16] Sanders, A. (1983). Towards a model of stress and human performance. Acta psychologica, 53(1), 61-97.[17] Wickens, C.D. (2008). Multiple resources and mental workload. Human Factors: The Journal of the Human Factors and
Ergonomics Society, 50(3), 449-455.[18] Kail, R., & Salthouse, T. A. (1994). Processing speed as a mental capacity. Acta psychologica, 86(2), 199-225.[19] Ramsey, N. F., Jansma, J. M., Jager, G., Van Raalten, T., & Kahn, R. S. (2004). Neurophysiological factors in human
information processing capacity. Brain, 127(3), 517-525.[20] Ziefle, M. & Arning, K. (2014). The role of user factors on the usability of Graphical Notation Systems in Process
Modeling Languages. In B. Amala & B. Dalgetty (Eds.). Advances in Human Factors, Software and System Engineering(141-153). AHFE Conference c© 2014.
[21] Edmunds and A. Morris, “Problem of information overload in business organizations: A review of the literature,” Inter-national Journal of Information Management, vol. 20, no. 1, pp. 17-28, 2000.
[22] Brauner P, Runge S, Groten M, et al (2013) Human Factors in Supply Chain Management – Decision making in complexlogistic scenarios. In: Yamamoto S (ed) Proceedings of the 15thHCI International 2013, Part III, LNCS 8018. Springer-Verlag Berlin Heidelberg, Las Vegas, Nevada, USA, pp. 423-432.
[23] Mittelstädt V, Brauner P, Blum M, Ziefle M. (2015). On the visual design of ERP systems – the role of information com-plexity, presentation and human factors. In 6th International Conference on Applided Human Factors and Ergonomics(pp. 270-277). Procedia Manufacturing. Elsevier.
[24] Ekstrom, R. B., French, J. W., Harman, H. H., & Dermen, D. (1976). Manual for the kit of factor-referenced cognitivetests. Princeton, NJ: Educational Testing Service.
[25] Miller, J., Beutinger, D., & Ulrich, R. (2009). Visuospatial attention and redundancy gain. Psychological research, 73(2),254-262.
[26] Paivio, A. (1978). Mental comparisons involving abstract attributes. Memory & Cognition, 6(3), 199-208.
AUTH
OR
COPY