Effects of culture density and live prey on growth and survival of juvenile cuttlefish, Sepia...
18
Effects of culture density and live prey on growth and survival of juvenile cuttlefish, Sepia officinalis P. DOMINGUES 1, *, R. POIRIER 2 , L. DICKEL 2 , E. ALMANSA 3 , A. SYKES 1 and J.P. ANDRADE 1 1 Faculdade de Ciências do Mar e do Ambiente – Campus de Gambelas, CCMar, Universidade do Al- garve, 8000 – 810 Faro, Portugal; 2 Laboratoire de Psychophysiologie, Université de Caen, Esplanade de la Paix, Caen, 14032, Cedex, France; 3 Departamento de Biologia Animal, Facultad de Biología, Universidad de La Laguna, La Laguna, Tenerife, 38206, Canary Islands, Spain; *Author for correspon- dence (e-mail: [email protected]) Received 23 May 2002; accepted in revised form 23 January 2003 Key words: Cephalopods, Culture, Cuttlefish, Densities, Lipids, Live prey Abstract. The effects of culture density on growth and survival of juvenile cuttlefish were tested. Groups of 1, 3 and 5 hatchlings were placed in small containers with bottom surface of 80 cm 2 , obtaining in- dividual densities of 125, 375 and 625 cuttlefish m -2 , respectively. Additionally, groups of 5 hatchlings were placed in containers with 2 different bottom areas (80 and 240 cm 2 ), providing culture densities of 625 and 42 cuttlefish m -2 , respectively. A total of 120 hatchlings were used and experiments lasted for 40 days. No differences were found in growth between any of the densities tested throughout the ex- periment until 35 days old. After this, cuttlefish placed in isolation grew significantly larger. A second experiment was conducted in a flow through system, using two rectangular tanks with bottom surface of 0.5 m 2 . Two groups of 25 cuttlefish hatchlings were used in this experiment, which lasted for 40 days. Both groups were fed live juvenile shrimp (Crangon crangon) during the first 5 days. Afterwards, one group was fed live fish fry of different species, while the other continued to be fed shrimp. After day 10 and until the end of the experiment, hatchlings fed shrimp grew significantly larger than those fed fish fry. Survival of hatchlings fed shrimp or fish fry after 40 days was of 100% and 68%, respectively.Total protein content of both prey types was similar. Therefore, the higher polar lipid content, especially due to the higher phosphatidylcholine and phosphatidylethanolamine levels observed in the shrimp, com- pared to fish fry could possibly be one of the major factor to explain the significantly higher growth rates for S. offıcinalis juveniles fed shrimp. Also, the percentage of polar lipids in the shrimp (47.4%) was closer to the one of juvenile cuttlefish (38.1%) than the composition of polar lipids in fish fry (10.4%). This could also be an important factor to explain the poor growth and survival obtained when feeding fish fry to the cuttlefish. Introduction The European cuttlefish, Sepia offıcinalis Linnaeus 1758, has a number of charac- teristics, such as a fast growth rate and benthic life style, which make this one of the most promising species for large-scale culture (Domingues 1999). One of the key factors in large-scale aquaculture is to optimise growth while minimizing the culture space required (Forsythe et al. 2002). Until now, only Nabhitabhata (1999) and Forsythe et al. (1994), Koueta and Boucaud-Camou (1999) indicated stocking Aquaculture International 11: 225–242, 2003. © 2003 Kluwer Academic Publishers. Printed in the Netherlands.
-
Upload
independent -
Category
Documents
-
view
0 -
download
0
Transcript of Effects of culture density and live prey on growth and survival of juvenile cuttlefish, Sepia...
Effects of culture density and live prey on growth andsurvival of juvenile cuttlefish, Sepia officinalis
P. DOMINGUES1,*, R. POIRIER2, L. DICKEL2, E. ALMANSA3, A. SYKES1
and J.P. ANDRADE1
1Faculdade de Ciências do Mar e do Ambiente – Campus de Gambelas, CCMar, Universidade do Al-garve, 8000 – 810 Faro, Portugal; 2Laboratoire de Psychophysiologie, Université de Caen, Esplanadede la Paix, Caen, 14032, Cedex, France; 3Departamento de Biologia Animal, Facultad de Biología,Universidad de La Laguna, La Laguna, Tenerife, 38206, Canary Islands, Spain; *Author for correspon-dence (e-mail: [email protected])
Received 23 May 2002; accepted in revised form 23 January 2003
Key words: Cephalopods, Culture, Cuttlefish, Densities, Lipids, Live prey
Abstract. The effects of culture density on growth and survival of juvenile cuttlefish were tested. Groupsof 1, 3 and 5 hatchlings were placed in small containers with bottom surface of 80 cm2, obtaining in-dividual densities of 125, 375 and 625 cuttlefish m−2, respectively. Additionally, groups of 5 hatchlingswere placed in containers with 2 different bottom areas (80 and 240 cm2), providing culture densities of625 and 42 cuttlefish m−2, respectively. A total of 120 hatchlings were used and experiments lasted for40 days. No differences were found in growth between any of the densities tested throughout the ex-periment until 35 days old. After this, cuttlefish placed in isolation grew significantly larger. A secondexperiment was conducted in a flow through system, using two rectangular tanks with bottom surface of0.5 m2. Two groups of 25 cuttlefish hatchlings were used in this experiment, which lasted for 40 days.Both groups were fed live juvenile shrimp (Crangon crangon) during the first 5 days. Afterwards, onegroup was fed live fish fry of different species, while the other continued to be fed shrimp. After day 10and until the end of the experiment, hatchlings fed shrimp grew significantly larger than those fed fishfry. Survival of hatchlings fed shrimp or fish fry after 40 days was of 100% and 68%, respectively. Totalprotein content of both prey types was similar. Therefore, the higher polar lipid content, especially dueto the higher phosphatidylcholine and phosphatidylethanolamine levels observed in the shrimp, com-pared to fish fry could possibly be one of the major factor to explain the significantly higher growthrates for S. offıcinalis juveniles fed shrimp. Also, the percentage of polar lipids in the shrimp (47.4%)was closer to the one of juvenile cuttlefish (38.1%) than the composition of polar lipids in fish fry(10.4%). This could also be an important factor to explain the poor growth and survival obtained whenfeeding fish fry to the cuttlefish.
Introduction
The European cuttlefish, Sepia offıcinalis Linnaeus 1758, has a number of charac-teristics, such as a fast growth rate and benthic life style, which make this one ofthe most promising species for large-scale culture (Domingues 1999). One of thekey factors in large-scale aquaculture is to optimise growth while minimizing theculture space required (Forsythe et al. 2002). Until now, only Nabhitabhata (1999)and Forsythe et al. (1994), Koueta and Boucaud-Camou (1999) indicated stocking
Aquaculture International 11: 225–242, 2003.© 2003 Kluwer Academic Publishers. Printed in the Netherlands.
densities for cultured cuttlefish populations. Laboratory-cultured cuttlefish havebeen studied in several aspects of their behaviour. Nevertheless, effects of tank sizeand animal density on growth, condition and reproduction are not known (Boal etal. 1999). Crowding can have a major effect on growth and behaviour in many spe-cies, and in aquaculture this factor can be very important (Sumpter 1993). For S.offıcinalis, which is a semi-solitary species in nature (Boletzky 1983), crowdingmay be a limiting factor in achieving successful large-scale culture of this species.Although the most common measure in determining optimum densities has beenthe carrying capacity, other aspects such as behavioural interactions could be ofgreat importance (Boal et al. 1999).
Cephalopods have a predominant amino acid metabolism (Lee 1994). Becauseof this, research on lipid and fatty acid requirements have been neglected, and thereis little knowledge about them at the present stage (Navarro and Villanueva 2000).Cephalopod paralarvae and juvenile must require a food rich in polyunsaturatedfatty acids (PUFA), phospholipids and cholesterol, and a moderate content in neu-tral lipids (Navarro and Villanueva 2000). Some of the most important fatty acidsimplied in many physiological processes and adaptive responses are the highly un-saturated fatty acids of the n-3 serie (n-3 HUFA). These fatty acids are very im-portant in the formation of the nervous and visual system, reproduction, growthand embryonic and larval development (Bell et al. 1986; Sargent et al. 1995). Then-3 HUFA are essential in many marine species since they cannot be synthesisedfrom the precursor, linolenic acid (18:3 n-3). Therefore, they must be included inthe diet of these species (Sargent et al. 1995; Arts et al. 2001).
Two experiments were conducted during this study. The first experiment testedthe effects of culture density on growth and survival, while a second experimentwas conducted to determine the effects of different live prey (fish fry of differentspecies, and shrimp, Crangon crangon) on growth and survival of S. offıcinalis upto the age of 40 days. Total protein, lipid classes and fatty acid composition of totallipids of these live prey and of juvenile S. offıcinalis were determined, to try tounderstand the reason for the much lower growth of hatchlings fed fish fry, com-pared to the ones fed the common shrimp, C. crangon. The same composition wasdetermined for two other preys normally used to feed cuttlefish hatchlings (mysidshrimp, Paramysis nouvelli and grass shrimp, Palaemonetes varians) (Domingueset al. 2001a, 2001b, 2002) with very good results.
Material and methods
Hatchlings used in the two experiments were born in the research facility of Luc-sur-Mer, France, from eggs laid in the laboratory by females captured from naturewith bottom trawling. For all experiments, a natural light cycle was used and ex-periments were conducted between June and August of 2001. In both experiments,cuttlefish were weighed every 5 days, and mean weight was used to calculate theMean Instantaneous Growth Rate (IGR) (% Body Weight d−1) = ((LnW2-LnW1)/
226
t*100), where W2 and W1 are the final and initial weight of the cuttlefish, respec-tively, Ln the natural logarithm and t the number of days of the time period.Weighing procedures consisted in collecting cuttlefish with a net, leave them dry-ing for a few seconds to eliminate water and weighing them in a container withseawater, to reduce stress. Shrimp (C. crangon) used to feed cuttlefish in both ex-periments were collected by hand-trawling every day, preferably at low tide, with asmall net. Fish fry were also collected on a daily basis, in small ponds, usually atlow tide. Therefore, no prey used in the experiments was cultured, and were usedwithin 24 h after being captured. Both experiments lasted for 40 days.
Density studies
A total of 120 cuttlefish hatchlings with 0.233 ± 0.050 g of wet weight were usedin this study. From these, 24 were placed in isolation, in rectangular chambers withbottom area of 80 cm2 (10 × 8 cm) and 6 cm water depth. The walls and bottom ofthe chambers had numerous holes that allowed water to circulate, but were smallenough in order to prevent both live prey and cuttlefish from escaping. No sub-strate was added to the containers. This provided a density of 125 cuttlefish m−2
(density 1). Other 36 hatchlings in groups of 3 were placed in identical containersproviding 12 replicates, at densities of 375 cuttlefish m−2 (density 2). Finally, a to-tal of 30 hatchlings in groups of 5 were placed in similar containers, providing 6replicates and densities of 625 cuttlefish m−2 (density 3). Additionally, another 30hatchlings were also grouped in 5, and placed in larger containers of 240 cm2 ofbottom area (30 × 8 cm) and 6 cm water depth, providing a density of 42 cuttlefishm−2 (density 4) to compare the effects of density and crowding on growth betweenthese groups of 5 cuttlefish. The containers were placed in a large tank (1000 L).At the start of the experiments, no significant differences in wet weight (p > 0.05)were found between all the groups of hatchlings used. Hatchlings were fed liveshrimp (C. crangon) twice a day (10:00 h and 17:00 h) at rates of approximately25% body weight d−1. A recirculating water system was used, and about 50% ofthe water was exchanged every week. Water flow was high, with all the water inthe circuit passing by the filtration system in less than 2 hours. Experiments wereconducted in a controlled temperature circuit, with water temperature of 19 °C andsalinity of 35 ppt. Individual growth rates were calculated for hatchlings placed inisolation, but these results were gathered together and compared with the otherdensities. As for cuttlefish placed in isolation, individual weights were taken fromall cuttlefish placed in groups of 3 and 5. Comparisons (one-way ANOVA’s andstudent t-tests) were done using all individual weights for each density: 24 cuttle-fish for density 1, 36 for density 2 and 30 for densities 3 and 4. If any cuttlefish inone of the replicates with 3 or 5 animals in each group died, the remaining animalsin that container were not used in the comparisons from that day onwards, sincedensity was different (less animals in the containers provided a lower culture den-
227
sity for that particular container). Cuttlefish survival was determined for all densi-ties, every 5 days.
Fish fry vs. shrimp (C. crangon)
Growth experiment
Two groups of 25 newly born cuttlefish were cultured during the first 40 days oftheir life in a flow through system that was composed by two separate tanks withbottom area of 0.5 m2, and water volume of 100 L. Water-flow was of 10 L h−1. Asfor the first experiment, no substrate was used in the tanks. Water temperature wasof 20 ± 1 °C. Both groups were fed small live shrimp (C. crangon) for the first 5days. Afterwards, one group was fed live fish fry of several species (mainly Ble-nius sp. and Gobius sp.), while the other group continued to be fed live shrimp.Both groups were always fed ad libitum throughout the experiment. Hatchlingswere weighed every 5 days, and the experiments lasted for 40 days. Student t tests(Zar 1984) were performed to compare growth of both populations every 5 days.Survival of cuttlefish in both groups was determined. At the end of 40 days, 3cuttlefish from each group were killed and frozen, for determination of body com-position in proteins and lipids. Fish fry and shrimp were also frozen (3 g from eachdiet) in order to determine their protein and lipid composition.
Protein and lipid determination
The samples containing the 3 cuttlefish fed each diet that had been sacrificed after40 days were lost during shipping from France to the Algarve in Portugal. Samplescontaining the different prey arrived in good condition and where analysed for pro-tein and lipid composition. Since the cuttlefish samples were lost, we performedthat analysis on three 30 days old cuttlefish (whole animal) reared in our laboratoryin the Algarve (South Portugal). These were fed live mysids for the first two weeksand live grass shrimp afterwards.
Moisture content was determined from 500 mg samples using the method ofHorwitz (1980). Protein content was determined according to the Kjeldahl method(A.O.A.C. 1985). Total lipid from original tissue was extracted with chloroform-:methanol (2:1 v/v) containing 0.01% of butylated hydroxytoluene (BHT) as anti-oxidant (Christie 1982). The organic solvent was evaporated under a stream of ni-trogen and the lipid content determined gravimetrically. Lipid classes were sepa-rated by one dimensional double development high performance thin layerchromatography (HPTLC) using methyl acetate/ isopropanol/ chloroform/ metha-nol/ 0.25% (w/v) KCl (25:25:25:10:9 by vol.), as the polar solvent system and hex-ane/ diethyl ether/ glacial acetic acid (80:20:2 by vol.), as the neutral solvent sys-tem. Lipid classes were quantified by charring with a copper acetate reagent fol-lowed by calibrated scanning densitometry using a Shimadzu CS-9001PC dual
228
wavelength flying spot scanner (Olsen and Henderson 1989). Total lipid (TL) ex-tracts were subjected to acid-catalyzed transmethylation for 16 h at 50 °C, using 1ml of toluene and 2 ml of 1% sulphuric acid (v/v) in methanol. The resultant fattyacid methyl esters (FAME) were purified by thin layer chromatography (TLC), andvisualized under UV light with 2�,7�-dichlorofluorescein in 98% (v/v) methanol,containing 0.01% BHT (Christie 1982). FAME were separated and quantified byusing a Shimadzu GC-14A gas chromatograph equipped with a flame ionizationdetector (250 °C) and a fused silica capillary column Supelcowax™ 10 (30 m ×0.32 mm I.D.). Helium was used as carrier gas and the initial oven temperaturewas 180 °C for 10 min, followed by an increase at a rate of 2.5 °C min−1 to a finaltemperature of 215 °C. Individual FAME were identified by reference to authenticstandards and to a well-characterised fish oil.
BHT, potassium chloride, potassium bicarbonate, 2�,7�-dichlorofluorescein weresupplied by Sigma Chemical Co (St. Louis, MO). TLC (20 × 20 cm × 0.25 mm)and HPTLC (10 × 10 cm × 0.15 mm) plates, precoated with silica gel (withoutfluorescent indicator) were purchased from Macheren-Nagel (Düren, Germany). Allorganic solvents used were of reagent grade and were purchased from Panreac(Barcelona, Spain). Results are presented as means ± SD from the analyses of trip-licate experiments.
Results
Density studies
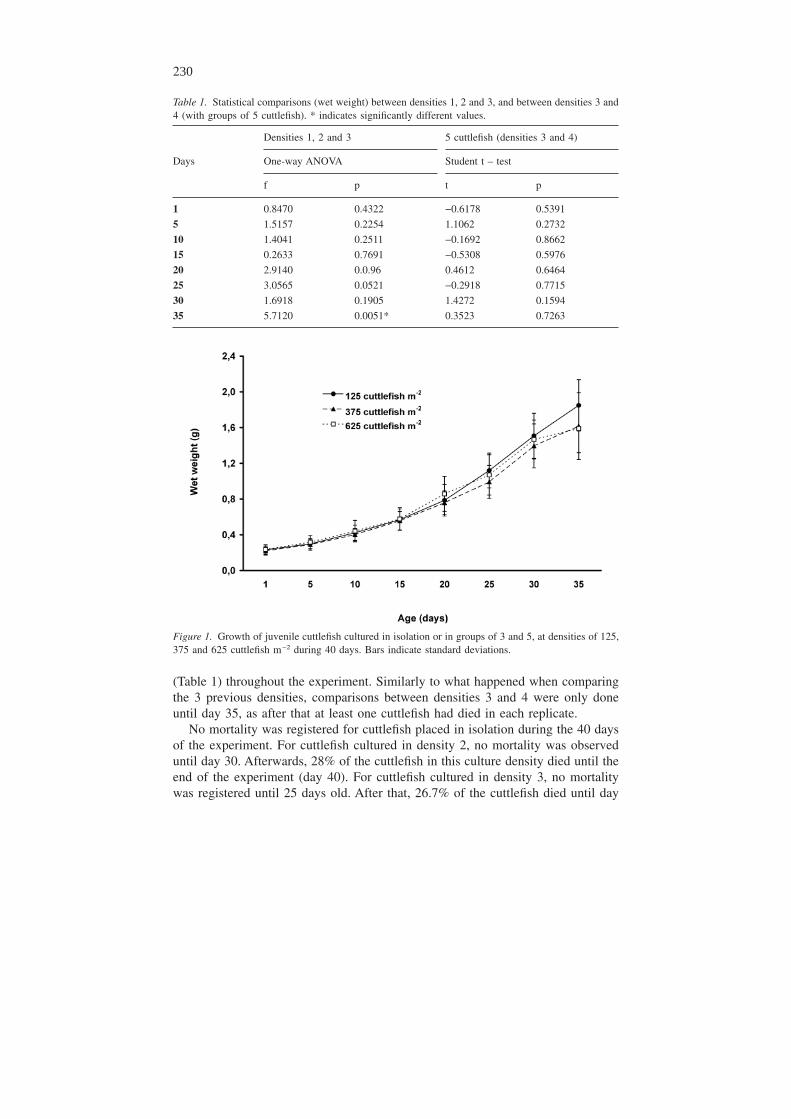
Table 1 shows statistical comparisons between cuttlefish placed in isolation or ingroups of 3 and 5, with densities of 125, 375 and 625 cuttlefish m−2, respectively,as well as comparisons between groups of 5 cuttlefish cultured in two densities of625 and 42 cuttlefish m−2, respectively. Only after 35 days were significant differ-ences found in growth, when cuttlefish placed in isolation grew larger (p < 0.05).
Figure 1 shows mean growth of cuttlefish cultured at densities of 125, 375 and625 cuttlefish m−2, respectively. Towards the end of the experiment, mainly afterday 25, cuttlefish placed in isolation (125 cuttlefish m−2), grew larger than thosecultured at 375 and 625 cuttlefish m−2, respectively. Nevertheless, significant dif-ferences were only found after 35 days old (Table 1), when cuttlefish cultured at125 cuttlefish m−2, were larger that the ones cultured at 375 cuttlefish m−2, (p =0.0316) and the ones cultured at 625 cuttlefish m−2, (p = 0.0097); no significantdifferences were found between the two higher culture densities (p = 0.8405).Comparisons between densities 1, 2 and 3 were not possible after day 35, since atleast one cuttlefish had died in one of the 6 replicates cultured at 625 cuttlefishm−2. Nevertheless, at day 40, cuttlefish cultured at 125 cuttlefish m−2 were larger (t= 3.5328; p = 0.0009) than the ones cultured at 375 cuttlefish m−2.
Figure 2 shows mean growth of cuttlefish cultured in groups of 5, in densities 3and 4. No significant differences were found between these two culture densities
229
(Table 1) throughout the experiment. Similarly to what happened when comparingthe 3 previous densities, comparisons between densities 3 and 4 were only doneuntil day 35, as after that at least one cuttlefish had died in each replicate.
No mortality was registered for cuttlefish placed in isolation during the 40 daysof the experiment. For cuttlefish cultured in density 2, no mortality was observeduntil day 30. Afterwards, 28% of the cuttlefish in this culture density died until theend of the experiment (day 40). For cuttlefish cultured in density 3, no mortalitywas registered until 25 days old. After that, 26.7% of the cuttlefish died until day
Table 1. Statistical comparisons (wet weight) between densities 1, 2 and 3, and between densities 3 and4 (with groups of 5 cuttlefish). * indicates significantly different values.
Densities 1, 2 and 3 5 cuttlefish (densities 3 and 4)
Days One-way ANOVA Student t – test
f p t p
1 0.8470 0.4322 −0.6178 0.5391
5 1.5157 0.2254 1.1062 0.2732
10 1.4041 0.2511 −0.1692 0.8662
15 0.2633 0.7691 −0.5308 0.5976
20 2.9140 0.0.96 0.4612 0.6464
25 3.0565 0.0521 −0.2918 0.7715
30 1.6918 0.1905 1.4272 0.1594
35 5.7120 0.0051* 0.3523 0.7263
Figure 1. Growth of juvenile cuttlefish cultured in isolation or in groups of 3 and 5, at densities of 125,375 and 625 cuttlefish m−2 during 40 days. Bars indicate standard deviations.
230
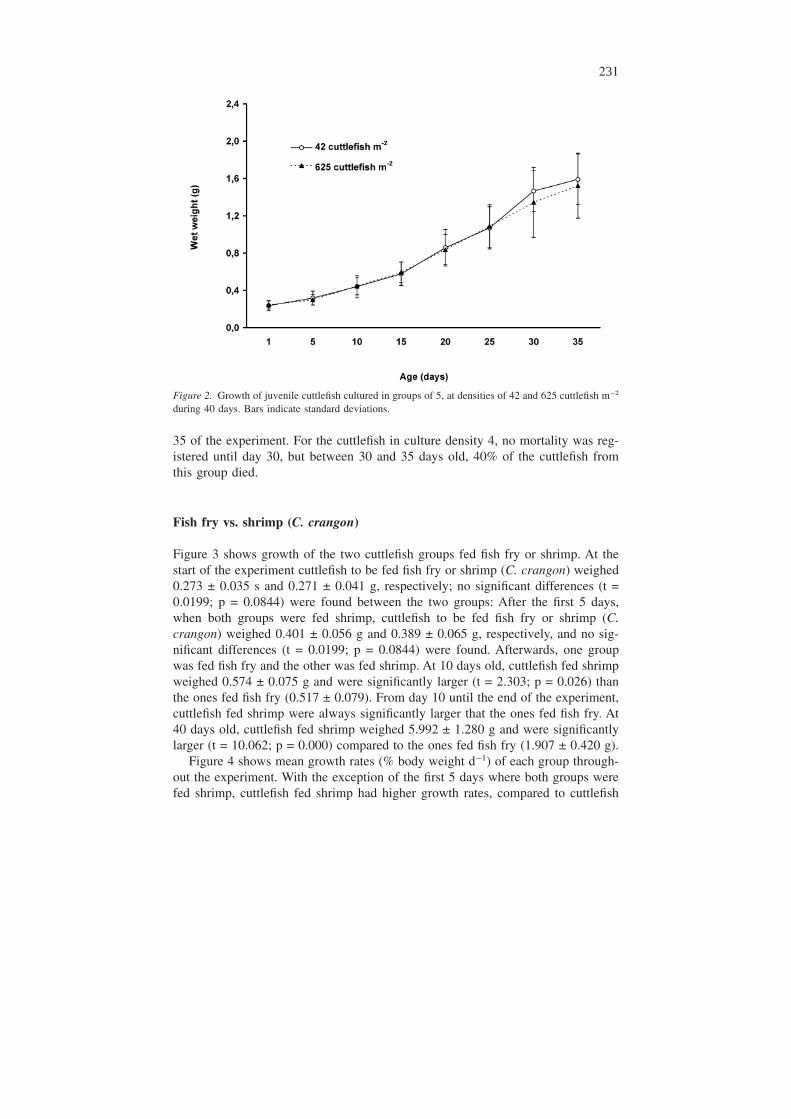
35 of the experiment. For the cuttlefish in culture density 4, no mortality was reg-istered until day 30, but between 30 and 35 days old, 40% of the cuttlefish fromthis group died.
Fish fry vs. shrimp (C. crangon)
Figure 3 shows growth of the two cuttlefish groups fed fish fry or shrimp. At thestart of the experiment cuttlefish to be fed fish fry or shrimp (C. crangon) weighed0.273 ± 0.035 s and 0.271 ± 0.041 g, respectively; no significant differences (t =0.0199; p = 0.0844) were found between the two groups: After the first 5 days,when both groups were fed shrimp, cuttlefish to be fed fish fry or shrimp (C.crangon) weighed 0.401 ± 0.056 g and 0.389 ± 0.065 g, respectively, and no sig-nificant differences (t = 0.0199; p = 0.0844) were found. Afterwards, one groupwas fed fish fry and the other was fed shrimp. At 10 days old, cuttlefish fed shrimpweighed 0.574 ± 0.075 g and were significantly larger (t = 2.303; p = 0.026) thanthe ones fed fish fry (0.517 ± 0.079). From day 10 until the end of the experiment,cuttlefish fed shrimp were always significantly larger that the ones fed fish fry. At40 days old, cuttlefish fed shrimp weighed 5.992 ± 1.280 g and were significantlylarger (t = 10.062; p = 0.000) compared to the ones fed fish fry (1.907 ± 0.420 g).
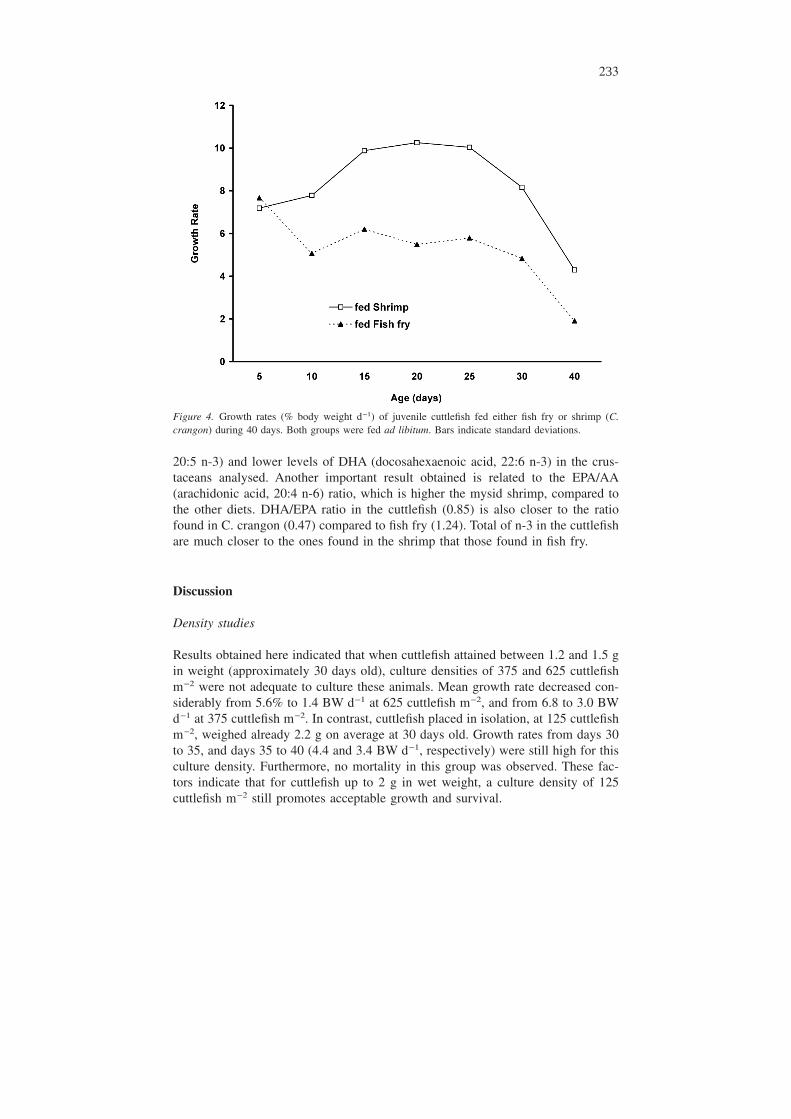
Figure 4 shows mean growth rates (% body weight d−1) of each group through-out the experiment. With the exception of the first 5 days where both groups werefed shrimp, cuttlefish fed shrimp had higher growth rates, compared to cuttlefish
Figure 2. Growth of juvenile cuttlefish cultured in groups of 5, at densities of 42 and 625 cuttlefish m−2
during 40 days. Bars indicate standard deviations.
231
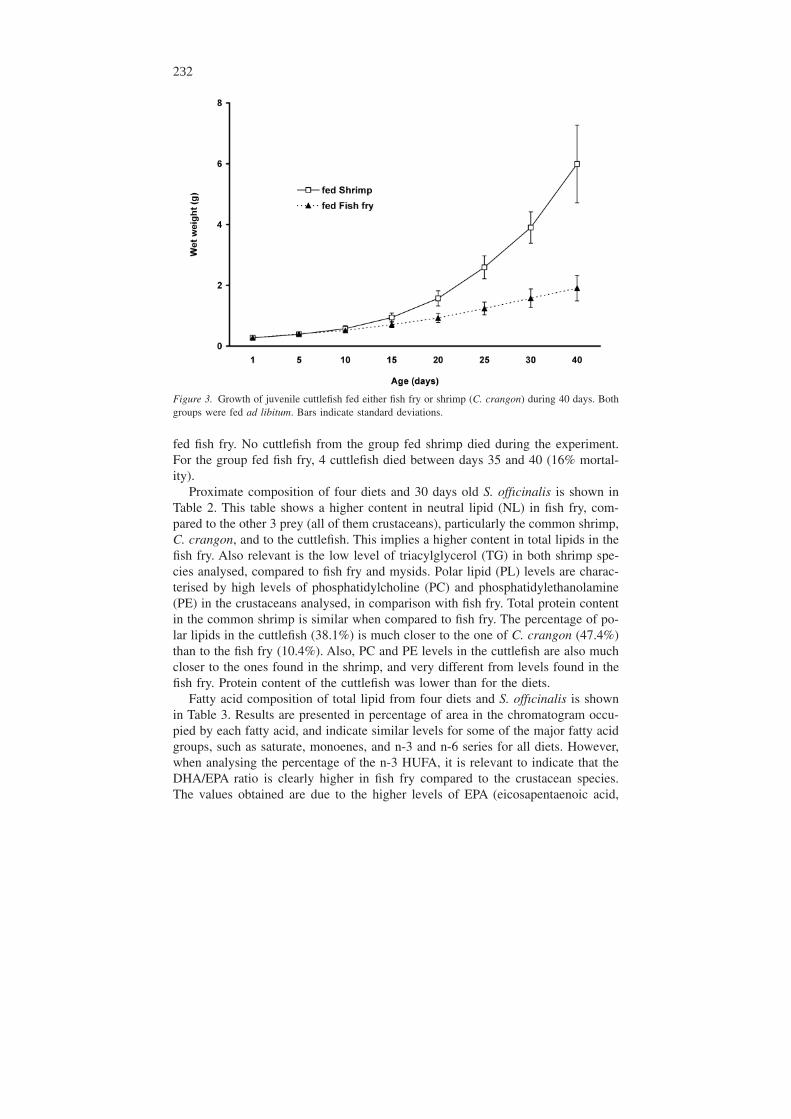
fed fish fry. No cuttlefish from the group fed shrimp died during the experiment.For the group fed fish fry, 4 cuttlefish died between days 35 and 40 (16% mortal-ity).
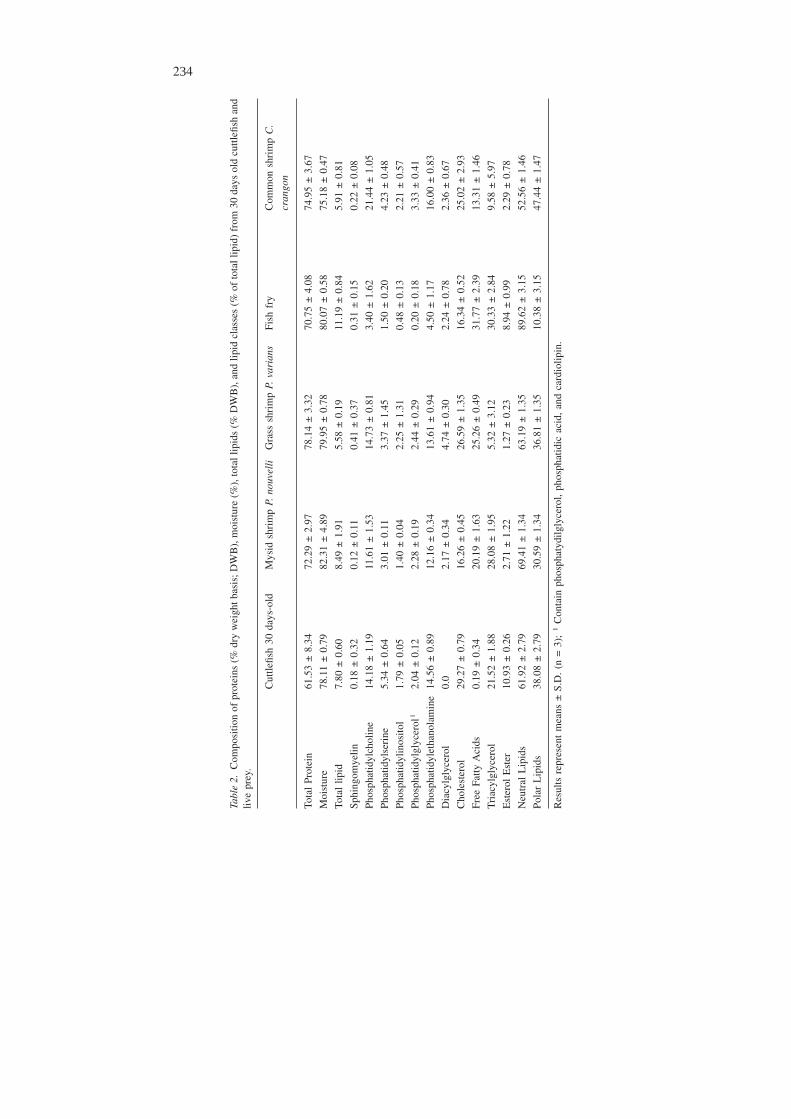
Proximate composition of four diets and 30 days old S. offıcinalis is shown inTable 2. This table shows a higher content in neutral lipid (NL) in fish fry, com-pared to the other 3 prey (all of them crustaceans), particularly the common shrimp,C. crangon, and to the cuttlefish. This implies a higher content in total lipids in thefish fry. Also relevant is the low level of triacylglycerol (TG) in both shrimp spe-cies analysed, compared to fish fry and mysids. Polar lipid (PL) levels are charac-terised by high levels of phosphatidylcholine (PC) and phosphatidylethanolamine(PE) in the crustaceans analysed, in comparison with fish fry. Total protein contentin the common shrimp is similar when compared to fish fry. The percentage of po-lar lipids in the cuttlefish (38.1%) is much closer to the one of C. crangon (47.4%)than to the fish fry (10.4%). Also, PC and PE levels in the cuttlefish are also muchcloser to the ones found in the shrimp, and very different from levels found in thefish fry. Protein content of the cuttlefish was lower than for the diets.
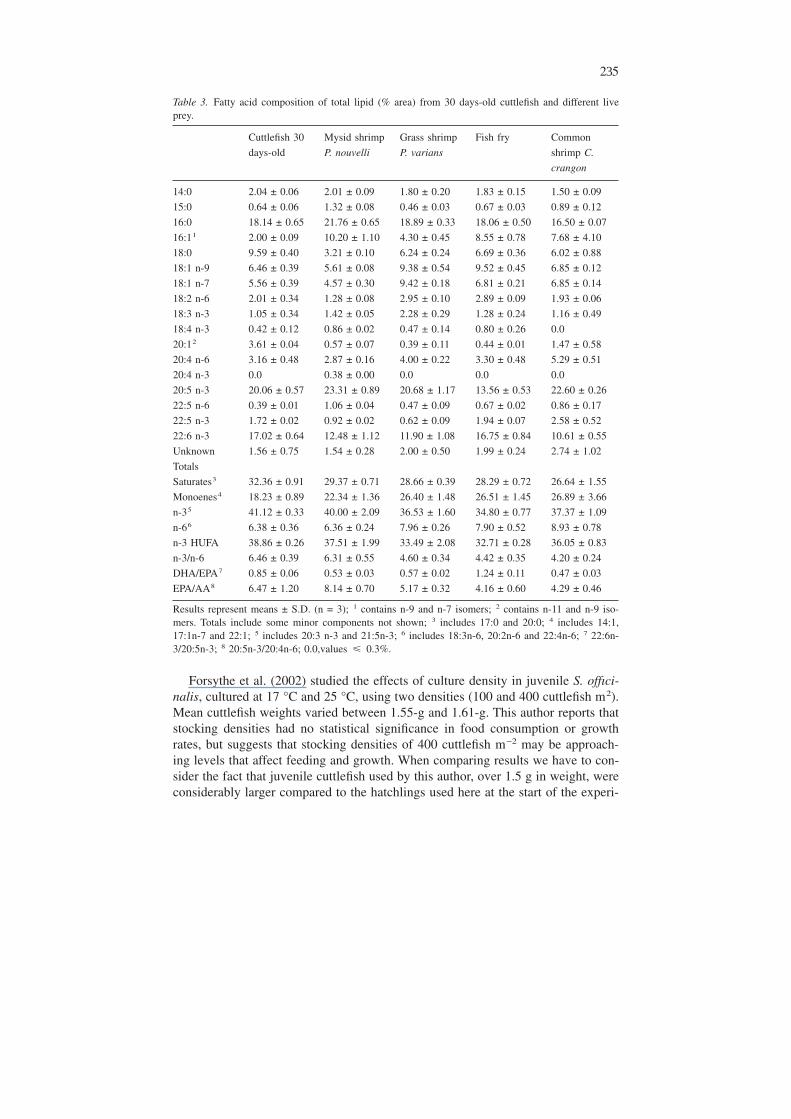
Fatty acid composition of total lipid from four diets and S. offıcinalis is shownin Table 3. Results are presented in percentage of area in the chromatogram occu-pied by each fatty acid, and indicate similar levels for some of the major fatty acidgroups, such as saturate, monoenes, and n-3 and n-6 series for all diets. However,when analysing the percentage of the n-3 HUFA, it is relevant to indicate that theDHA/EPA ratio is clearly higher in fish fry compared to the crustacean species.The values obtained are due to the higher levels of EPA (eicosapentaenoic acid,
Figure 3. Growth of juvenile cuttlefish fed either fish fry or shrimp (C. crangon) during 40 days. Bothgroups were fed ad libitum. Bars indicate standard deviations.
232
20:5 n-3) and lower levels of DHA (docosahexaenoic acid, 22:6 n-3) in the crus-taceans analysed. Another important result obtained is related to the EPA/AA(arachidonic acid, 20:4 n-6) ratio, which is higher the mysid shrimp, compared tothe other diets. DHA/EPA ratio in the cuttlefish (0.85) is also closer to the ratiofound in C. crangon (0.47) compared to fish fry (1.24). Total of n-3 in the cuttlefishare much closer to the ones found in the shrimp that those found in fish fry.
Discussion
Density studies
Results obtained here indicated that when cuttlefish attained between 1.2 and 1.5 gin weight (approximately 30 days old), culture densities of 375 and 625 cuttlefishm−2 were not adequate to culture these animals. Mean growth rate decreased con-siderably from 5.6% to 1.4 BW d−1 at 625 cuttlefish m−2, and from 6.8 to 3.0 BWd−1 at 375 cuttlefish m−2. In contrast, cuttlefish placed in isolation, at 125 cuttlefishm−2, weighed already 2.2 g on average at 30 days old. Growth rates from days 30to 35, and days 35 to 40 (4.4 and 3.4 BW d−1, respectively) were still high for thisculture density. Furthermore, no mortality in this group was observed. These fac-tors indicate that for cuttlefish up to 2 g in wet weight, a culture density of 125cuttlefish m−2 still promotes acceptable growth and survival.
Figure 4. Growth rates (% body weight d−1) of juvenile cuttlefish fed either fish fry or shrimp (C.crangon) during 40 days. Both groups were fed ad libitum. Bars indicate standard deviations.
233
Tabl
e2.
Com
posi
tion
ofpr
otei
ns(%
dry
wei
ghtb
asis
;DW
B),
moi
stur
e(%
),to
tall
ipid
s(%
DW
B),
and
lipid
clas
ses
(%of
tota
llip
id)
from
30da
ysol
dcu
ttlefi
shan
dliv
epr
ey.
Cut
tlefis
h30
days
-old
Mys
idsh
rim
pP.
nouv
elli
Gra
sssh
rim
pP.
vari
ans
Fish
fry
Com
mon
shri
mp
C.
cran
gon
Tota
lPr
otei
n61
.53
±8.
3472
.29
±2.
9778
.14
±3.
3270
.75
±4.
0874
.95
±3.
67
Moi
stur
e78
.11
±0.
7982
.31
±4.
8979
.95
±0.
7880
.07
±0.
5875
.18
±0.
47
Tota
llip
id7.
80±
0.60
8.49
±1.
915.
58±
0.19
11.1
9±
0.84
5.91
±0.
81
Sphi
ngom
yelin
0.18
±0.
320.
12±
0.11
0.41
±0.
370.
31±
0.15
0.22
±0.
08
Phos
phat
idyl
chol
ine
14.1
8±
1.19
11.6
1±
1.53
14.7
3±
0.81
3.40
±1.
6221
.44
±1.
05
Phos
phat
idyl
seri
ne5.
34±
0.64
3.01
±0.
113.
37±
1.45
1.50
±0.
204.
23±
0.48
Phos
phat
idyl
inos
itol
1.79
±0.
051.
40±
0.04
2.25
±1.
310.
48±
0.13
2.21
±0.
57
Phos
phat
idyl
glyc
erol
12.
04±
0.12
2.28
±0.
192.
44±
0.29
0.20
±0.
183.
33±
0.41
Phos
phat
idyl
etha
nola
min
e14
.56
±0.
8912
.16
±0.
3413
.61
±0.
944.
50±
1.17
16.0
0±
0.83
Dia
cylg
lyce
rol
0.0
2.17
±0.
344.
74±
0.30
2.24
±0.
782.
36±
0.67
Cho
lest
erol
29.2
7±
0.79
16.2
6±
0.45
26.5
9±
1.35
16.3
4±
0.52
25.0
2±
2.93
Free
Fatty
Aci
ds0.
19±
0.34
20.1
9±
1.63
25.2
6±
0.49
31.7
7±
2.39
13.3
1±
1.46
Tri
acyl
glyc
erol
21.5
2±
1.88
28.0
8±
1.95
5.32
±3.
1230
.33
±2.
849.
58±
5.97
Est
erol
Est
er10
.93
±0.
262.
71±
1.22
1.27
±0.
238.
94±
0.99
2.29
±0.
78
Neu
tral
Lip
ids
61.9
2±
2.79
69.4
1±
1.34
63.1
9±
1.35
89.6
2±
3.15
52.5
6±
1.46
Pola
rL
ipid
s38
.08
±2.
7930
.59
±1.
3436
.81
±1.
3510
.38
±3.
1547
.44
±1.
47
Res
ults
repr
esen
tm
eans
±S.
D.
(n=
3);
1C
onta
inph
osph
atyd
ilgly
cero
l,ph
osph
atid
icac
id,
and
card
iolip
in.
234
Forsythe et al. (2002) studied the effects of culture density in juvenile S. offıci-nalis, cultured at 17 °C and 25 °C, using two densities (100 and 400 cuttlefish m2).Mean cuttlefish weights varied between 1.55-g and 1.61-g. This author reports thatstocking densities had no statistical significance in food consumption or growthrates, but suggests that stocking densities of 400 cuttlefish m−2 may be approach-ing levels that affect feeding and growth. When comparing results we have to con-sider the fact that juvenile cuttlefish used by this author, over 1.5 g in weight, wereconsiderably larger compared to the hatchlings used here at the start of the experi-
Table 3. Fatty acid composition of total lipid (% area) from 30 days-old cuttlefish and different liveprey.
Cuttlefish 30
days-old
Mysid shrimp
P. nouvelli
Grass shrimp
P. varians
Fish fry Common
shrimp C.
crangon
14:0 2.04 ± 0.06 2.01 ± 0.09 1.80 ± 0.20 1.83 ± 0.15 1.50 ± 0.09
15:0 0.64 ± 0.06 1.32 ± 0.08 0.46 ± 0.03 0.67 ± 0.03 0.89 ± 0.12
16:0 18.14 ± 0.65 21.76 ± 0.65 18.89 ± 0.33 18.06 ± 0.50 16.50 ± 0.07
16:11 2.00 ± 0.09 10.20 ± 1.10 4.30 ± 0.45 8.55 ± 0.78 7.68 ± 4.10
18:0 9.59 ± 0.40 3.21 ± 0.10 6.24 ± 0.24 6.69 ± 0.36 6.02 ± 0.88
18:1 n-9 6.46 ± 0.39 5.61 ± 0.08 9.38 ± 0.54 9.52 ± 0.45 6.85 ± 0.12
18:1 n-7 5.56 ± 0.39 4.57 ± 0.30 9.42 ± 0.18 6.81 ± 0.21 6.85 ± 0.14
18:2 n-6 2.01 ± 0.34 1.28 ± 0.08 2.95 ± 0.10 2.89 ± 0.09 1.93 ± 0.06
18:3 n-3 1.05 ± 0.34 1.42 ± 0.05 2.28 ± 0.29 1.28 ± 0.24 1.16 ± 0.49
18:4 n-3 0.42 ± 0.12 0.86 ± 0.02 0.47 ± 0.14 0.80 ± 0.26 0.0
20:12 3.61 ± 0.04 0.57 ± 0.07 0.39 ± 0.11 0.44 ± 0.01 1.47 ± 0.58
20:4 n-6 3.16 ± 0.48 2.87 ± 0.16 4.00 ± 0.22 3.30 ± 0.48 5.29 ± 0.51
20:4 n-3 0.0 0.38 ± 0.00 0.0 0.0 0.0
20:5 n-3 20.06 ± 0.57 23.31 ± 0.89 20.68 ± 1.17 13.56 ± 0.53 22.60 ± 0.26
22:5 n-6 0.39 ± 0.01 1.06 ± 0.04 0.47 ± 0.09 0.67 ± 0.02 0.86 ± 0.17
22:5 n-3 1.72 ± 0.02 0.92 ± 0.02 0.62 ± 0.09 1.94 ± 0.07 2.58 ± 0.52
22:6 n-3 17.02 ± 0.64 12.48 ± 1.12 11.90 ± 1.08 16.75 ± 0.84 10.61 ± 0.55
Unknown 1.56 ± 0.75 1.54 ± 0.28 2.00 ± 0.50 1.99 ± 0.24 2.74 ± 1.02
Totals
Saturates3 32.36 ± 0.91 29.37 ± 0.71 28.66 ± 0.39 28.29 ± 0.72 26.64 ± 1.55
Monoenes4 18.23 ± 0.89 22.34 ± 1.36 26.40 ± 1.48 26.51 ± 1.45 26.89 ± 3.66
n-35 41.12 ± 0.33 40.00 ± 2.09 36.53 ± 1.60 34.80 ± 0.77 37.37 ± 1.09
n-66 6.38 ± 0.36 6.36 ± 0.24 7.96 ± 0.26 7.90 ± 0.52 8.93 ± 0.78
n-3 HUFA 38.86 ± 0.26 37.51 ± 1.99 33.49 ± 2.08 32.71 ± 0.28 36.05 ± 0.83
n-3/n-6 6.46 ± 0.39 6.31 ± 0.55 4.60 ± 0.34 4.42 ± 0.35 4.20 ± 0.24
DHA/EPA7 0.85 ± 0.06 0.53 ± 0.03 0.57 ± 0.02 1.24 ± 0.11 0.47 ± 0.03
EPA/AA8 6.47 ± 1.20 8.14 ± 0.70 5.17 ± 0.32 4.16 ± 0.60 4.29 ± 0.46
Results represent means ± S.D. (n = 3); 1 contains n-9 and n-7 isomers; 2 contains n-11 and n-9 iso-mers. Totals include some minor components not shown; 3 includes 17:0 and 20:0; 4 includes 14:1,17:1n-7 and 22:1; 5 includes 20:3 n-3 and 21:5n-3; 6 includes 18:3n-6, 20:2n-6 and 22:4n-6; 7 22:6n-3/20:5n-3; 8 20:5n-3/20:4n-6; 0.0,values � 0.3%.
235
ments (0.233 g). When comparing cuttlefish biomass (wet weight), the lower den-sity of 100 cuttlefish m−2 used by Forsythe et al. (2002) is similar to the higherdensity of 625 cuttlefish m−2 used here. Therefore, results obtained by this authorare much better, compared to ours. Still, we have to pay close attention to the ac-tual physical space available. Although bottom oriented, cuttlefish do require somespace to swim. Our culture containers (10 × 8 cm, with water depth of 6 cm) weremuch smaller than the tanks used by this author. Hatchlings, especially the ones ingroups of 3 and 5, had almost no space to move. We believe that growth in ourexperiment could have been affected by density, even from the start, due to thesmall containers used. Survival obtained by Forsythe et al. (2002) was higher thanfor the present study for densities of 375 and 625 cuttlefish m−2, but lower whencompared to our lower density of 125 cuttlefish m−2. Therefore, for these smallavailable bottom areas, we believe that densities of 125 cuttlefish m−2 are stillwithin acceptable limits for the culture of this species, up to 2 g. It is likely thatwhen using larger tanks, higher densities could be used with better growth and sur-vival.
Forsythe et al. (2002) fed 20–30% BW d−1 to cuttlefish grown at 17 °C. Aver-age feeding rate in the present experiment, of 25% BW d−1 at 19 °C, fall withinthat interval. DeRusha et al. (1989) and Koueta and Boucaud-Camou (1999) reportideal feeding rates for juvenile cuttlefish between 15 and 20% BW d−1, and 13%BW d−1, respectively. We have supplied a higher feeding rate in the present study,and believe that it was appropriate for this species at this culture temperature.Therefore this should have not been a limiting factor when comparing growth ofcuttlefish at the end of the experiment.
Boal et al. (1999) tested the effects of crowding in cuttlefish (10–19 cm ML),using two different culture densities, and suggests that cuttlefish cultured at lowerdensities were less stressed, and because of this ate more, while the ones culturedat higher densities showed signs of stress. Contrary to the results observed by thisauthor, cuttlefish in the present experiment ate all the live prey added to each con-tainer, independent of density. Cuttlefish displayed characteristic behaviour andbody patterns associated to stress; nevertheless, feeding did not seem to be affected.
Warnke (1994) reported that group reared cuttlefish ate more and grew larger(up to 9%) compared to others placed in isolation. Dickel (1999) and Dickel et al.(2000) reported that S. offıcinalis reared in isolation, or in poor environments (e.g.,simple tank with no substrate or hiding places) grew less than others placed ingroups, or in enriched environments (e.g., tanks with shells, sand and shelters).DeRusha et al. (1989) indicated that S. offıcinalis can be cultured in isolation forshort-term experiments, but long-term isolation had negative effects on the indi-viduals. Our results do not support these findings. In fact, cuttlefish placed in iso-lation were the ones that grew larger, even if they seemed to be more stressed. Whenusing isolated hatchlings to determine individual growth and feeding rates,Domingues et al. (2001a) also observed that isolated cuttlefish inked more and ap-peared to be more stressed. Cuttlefish used here appeared to be more stressed whenin isolation, but this was not reflected in growth or survival. Again, we must stressthat there are two factors to be taken in consideration here; one is the isolation, and
236
the other the culture density. In the present culture conditions, at these culture den-sities, and especially in such small containers, density and lack of space appear tobe more limiting than isolation. Also, since cuttlefish used here were only a fewhours old, and therefore in company of others for a short period of time beforebeing isolated, the effects of isolation should not be as significant as if we wereusing older cuttlefish that had been cultured in large groups before being isolatedfor an experiment.
S. offıcinalis is very tolerant of high stocking densities (Forsythe et al. 2002).Maximum densities of about 10 cm2 cuttlefish−1 for small juveniles (< 3 cm ML)and 400 cm2 cuttlefish−1 for larger juveniles (< 15 cm ML) and of 2500 cm2, or0.25 m2 cuttlefish−1 for adults (> 15 cm ML) were suggested by (Forsythe et al.1994). Results from the present study support this idea, although we think that forthe larger hatchlings, close to 3 cm ML, this value is exaggerated, and lower den-sities should be considered. Nabhitabhata (1995) indicated optimum densities for S.pharaonis hatchlings of 500 m−3 (< 3 cm ML) and of 10 m−3 for juveniles (< 15cm ML). Since this species is bottom orientated, we believe that culture densityvalues should be reported by area and not volume, although, as mentioned beforein the discussion, physical space should not be neglected, especially when verysmall containers are used. Richard (1975) suggested that optimal densities for S.offıcinalis should be less than 1/10 (ratio of the animal’s surface to the tank sur-face). During the present study, much higher densities were stocked, with no vis-ible effects on growth until 30 days old.
Although culture temperatures from the two experiments were similar, resultsobtained during the experiment testing densities should not be directly compared tothe ones obtained from the group fed live shrimp when testing the two diets in thesecond experiment. This is mainly because food supplied in the latest was ad libi-tum, while in the first it was limited (25% BW d−1). Also, experiments were con-ducted in a recirculating and a flow-through circuit, respectively. Nevertheless, wecould observe that growth of cuttlefish in the second experiment, placed in a cul-ture density of 50 cuttlefish m−2 (25 cuttlefish in a bottom area of 0.5 m−2) wasmuch higher than growth obtained in any of the three culture density tested in thefirst experiment. We believe that the much lower density in the second experiment,added to the much larger tanks and space to swim must have had great influence inthe differences in growth obtained. Again, we must stress the fact that cuttlefish inthe second experiment were most likely eating more, but this alone should not ex-plain the very high differences in growth obtained in the two experiments.
Fish fry vs. shrimp (C. crangon)
Cuttlefish have been grown throughout the life cycle using only live prey(Domingues et al. 2001b, 2002), or using live prey initially, mainly mysid shrimp,and being then transitioned to dead prey, such as frozen shrimp (Forsythe et al.1994) or fish (DeRusha et al. 1989) after a few weeks. Cephalopod paralarvae and
237
juvenile need a food rich in polyunsaturated fatty acids (PUFA), phospholipids andcholesterol, and a moderate content in neutral lipids (Navarro and Villanueva 2000).The importance of n-3 HUFA for the early stages of cephalopod species is alsosupported by Koueta et al. (2002).
Polar lipid (PL) levels are characterised by high levels of phosphatidylcholine(PC) and phosphatidylethanolamine (PE) in S. offıcinalis hatchlings (Navarro andVillanueva 2000). Adult cephalopods are rich in long chain PUFA (Nash et al.1978). According to the composition of adults, and the generic composition of theirprey, we believe that paralarvae must require high amounts of PUFA. All cephalo-pod paralarvae analysed by Navarro and Villanueva (2000) had high contents incholesterol and polar lipids especially PE and PC. We also found high levels of PL,especially PC and PE in the crustacean species and the 30 days old cuttlefishanalysed, and much lower levels in the fish fry, which could help to explain themuch better growth obtained when feeding shrimp to cuttlefish hatchlings. Thishypothesis is supported by the results obtained in the analysis of the other two di-ets (mysids and grass shrimp), which also have high total polar lipid contents. Theselive preys are commonly used to culture S. offıcinalis during the early stages oftheir life with excellent results on growth and survival (Domingues et al. 2001a,2001b).
Although cephalopods have a mainly protein metabolism (Lee 1994; Domingues1999), we believe that the lipid and fatty acids profiles, particularly in the struc-tural lipids, are of extreme importance for the optimal development of S. offıcina-lis, similarly to other marine species (Sargent et al. 1995).
For most marine fish species, body lipids consist mainly of saturated, monoenoicand polyenoic fatty acids (Shehata and Wassef 1989). Wassef and Shehata (1991)reported that total protein and lipids increased in the muscle of gilthead bream(Sparus aurata) with age and size, while Shehata and Wassef (1989) reported thatpolyenoic fatty acids percentage for the same species increased with fish age andsize. This might indicate that fish fry used in this study had low concentrations inlipids and proteins, and were not adequate for the early stages of cuttlefish lifecycle.
The natural diet of young cuttlefish (< 8.5 cm ML) captured from the wild wascomposed essentially of crustaceans (89%), while fish only represented 4.6% (Blancet al. 1998). Nevertheless, Castro and Guerra (1990) reported that the importanceof fish in the diet increased and importance of crustaceans decreased, as cuttlefishgrow bigger. These findings strongly indicate that crustaceans are indeed a betterfood for hatchlings and juvenile of this species, and could explain the much betterresults obtained during this experiment when feeding them with shrimp, comparedto fish fry.
We observed that shrimp were easier to capture compared to fish fry, indicatingthat it is likely that more energy is necessary for the pursuit and capture of fish fry.Nevertheless, these were still easily captured and consumed by cuttlefish hatchlings.Therefore, the great differences in growth, condition and survival of hatchlings af-ter 40 days could be associated to the biochemical composition of the shrimp andthe fish fry, namely on protein and lipids (especially n-3 PUFA and phospholipids).
238
Nevertheless, for a better comprehension of the importance of proteins, other as-pects such as protein digestibility and amino acid composition should be consid-ered. Also, we cannot neglect the possible influence and importance of other com-ponents in the diet, such as carotenes. Further studies are necessary to test theimportance of these compounds and determine their importance for cuttlefishgrowth.
When comparing the fatty acid composition of total lipids from the four diets,the difference observed in the ratio between the DHA (docosahexaenoic acid, 22:6n-3) and the EPA (eicosapentaenoic acid, 20:5 n-3) is of great importance. Both ofthese fatty acids are included in the n-3 highly unsaturated fatty acid (n-3 HUFA)group. DHA plays a multifunctional role in a wide variety of adaptive processes,which occur in cell membranes, whereas the EPA is one of the most importanteicosanoids precursors, which are implicated in numerous physiological processes(Sargent et al. 1995). These fatty acids are very important in the formation of thenervous and visual system, reproduction, growth and embryonic and larval devel-opment (Bell et al. 1986; Sargent et al. 1995; Almansa et al. 1999).
The ratio DHA/EPA in the diet has been observed to be relevant in the earlydevelopment and growth of several marine species. Interestingly, a ratio of 2/1 haspromoted better development for the earlier stages in gilthead seabream Sparus au-rata (Rodríguez et al. 1998), red seabream Pagrus major (Watanabe et al. 1989)and turbot Scophthalmus maximus (Reitan et al. 1994), but for juvenile specimens,an opposite ratio (1/2) has been reported for optimal development (Ibeas et al.1997). During our experiment, the 1/2 ratio that is found in the common shrimp issimilar to the optimal reported for juvenile gilthead seabream. It could be possiblethat, since S. offıcinalis hatchlings are already fully developed when they hatch,resembling miniature adults, they require a similar 1/2 ratio as the juvenile giltheadseabream. This 1/2 ratio was also found on the other prey analysed (mysids andgrass shrimp), which are commonly used to feed S. offıcinalis hatchlings. On theother hand, fish fry, which promoted lower growth and survival, had a very differ-ent ratio (1.2/1) for these two important fatty acids, which could have some effecton the lower growth of cuttlefish fed fish fry. DHA/EPA ratios can vary consider-ably, even for similar organisms. Navarro and Villanueva (2000) indicate a 1/1 ra-tio for a mysid shrimp (Acanthomysis longicornis), while during the present study,the mysid shrimp P. nouvelli has a close to 1/2 DHA/EPA ratio.
The lipid composition of 30 days old cuttlefish is generally closer to the onefound for C. crangon, compared to composition of fish fry. This is particularly trueof the polar lipids and neutral lipids, the n-3 contents and PC and PE levels. Also,DHA/EPA ratios in cuttlefish are closer to those found in the shrimp. This couldalso help to explain the better growth obtained when feeding shrimp. The lowercontent in total protein for the cuttlefish could be associated to the fact that thewhole animal was used for protein determination, including the cuttlebone.
The importance of PUFA for the early stages of S. offıcinalis, and possibly otherspecies of cephalopods should be more closely studied. Further studies, using thesame species to feed cuttlefish hatchlings as the ones used here, as well as enrichedArtemia sp., mysids and other shrimp will be conducted. The lipid and protein
239
composition of these diets, as well as composition of cuttlefish eggs, newly-bornand juvenile will be determined in order to better understand their role and impor-tance on growth, condition and survival of the early stages of S. offıcinalis.
Acknowledgements
The authors wish to thank the University of Caen, and the research facility fromthe C.R.E.C. in Luc-sur-Mer, Normandy, France, where experiments were con-ducted, and the Department of Marine Biology from the University of La Laguna,Tenerife, Spain, where the determination of protein and lipids from each diet wasperformed. Pedro Domingues wishes to thank The Fundação para a Ciência e aTecnologia and the program PRAXIS XXI (BPD/22057/99) from the PortugueseGovernment for the funding for this research.
References
A.O.A.C. 1985. Official Methods of Analysis of the Association of Analytical Chemist. A.O.A.C, Wash-ington, USA, 1018 pp.
Almansa E., Cejas M.J., Badía P., Villamandos J.R. and Lorenzo A. 1999. Influence of broodstock Gilt-head seabream (Sparus aurata L.) dietary fatty acids on egg quality and egg fatty acid compositionthroughout the spawning season. Aquaculture 170: 323–336.
Arts M.T., Ackman R.G. and Holub B.J. 2001. “Essential fatty acids” in aquatic ecosystems: a cruciallink between diet and human health and evolution. Canadian Journal of Fisheries and Aquatic Sci-ences 58: 122–137.
Bell M.V., Henderson R.J. and Sargent J.R. 1986. The role of polyunsaturated fatty acids in fish. Com-parative Biochemistry and Physiology, B 83: 711–719.
Blanc A., Pinczon du Sel G. and Daguzan J. 1998. Habitat and diet of early stages of Sepia offıcinalisL. (Cephalopoda) in Morbihan Bay, France. Journal of Molluscan Studies 64: 263–274.
Boal J.G., Hylton R.A., Gonzales S.A. and Hanlon R.T. 1999. Effects of crowding on the social behav-iour of cuttlefish (Sepia offıcinalis). Contemporary Topics in Laboratory Animal Science 38: 49–55.
Boletzky S. 1983. Sepia officinalis. In: Boyle P.R. (ed.), Cephalopod Life Cycles. Vol. 1. Academic Press,London, pp. 31–52.
Castro B.G. and Guerra A. 1990. The diet of Sepia offıcinalis (Linneaus, 1758) and Sepia elegans (Bla-inville, 1827) (Cephalopoda, Sepioidea) from the Ria of Vigo (NW Spain). Sciencia Marina 54:375–388.
Christie W.W. 1982. Lipids Analysis. 2nd edn. Pergamon Press, Oxford.DeRusha R.H., Forsythe J.W., DiMarco F.P. and Hanlon R.T. 1989. “Alternative Diets for Maintaining
and Rearing Cephalopods in Captivity”. Laboratory Animal Science 39. American Association forLaboratory Animal Science, pp. 306–312.
Dickel L. 1999. Effects de l’expérience précoce sur la maturation des capacités mnésiques au cours del’ontogenèse post-emryonnaire ches la seiche (Sepia offıcinalis). Annales de la Fondation Fyssen 14:86–94.
Dickel L., Boal J.G. and Budelmann B.U. 2000. The effect of early experience on learning and memoryin cuttlefish. Developmental Psychobiology 36: 101–110.
Domingues P.M. 1999. Development of Alternative Diets for the Mass Culture of the European Cuttle-fish Sepia offıcinalis. PhD Dissertation, Univ. of the Algarve, 95 p.
240
Domingues P.M., Kingston T., Sykes A. and Andrade J.P. 2001a. Growth of young cuttlefish, Sepia of-ficinalis (Linnaeus, 1758) at the upper end of the biological distribution temperature range. Aqua-culture Research 32: 923–930.
Domingues P.M., Sykes A. and Andrade J.P. 2001b. The use of artemia or mysids as food source forhatchlings of the cuttlefish (Sepia offıcinalis L.): effects on growth and survival throughout the lifecycle. Aquaculture International 9: 319–331.
Domingues P.M., Sykes A. and Andrade J.P. 2002. The effects of temperature in the life cycle of twoconsecutive generations of the cuttlefish Sepia offıcinalis (Linnaeus, 1758), cultured in the Algarve(South Portugal). Aquaculture International 10: 207–220.
Forsythe J.W., DeRusha R.H. and Hanlon R.T. 1994. Growth, reproduction and life span of Sepia offı-cinalis (Cephalopoda: Mollusca) cultured through seven consecutive generations. Journal of Zool-ogy, London 233: 175–192.
Forsythe J., Lee P., Walsh L. and Clark T. 2002. The effects of crowding on growth of the Europeancuttlefish Sepia offıcinalis Linnaeus, 1758 reared at two temperatures. Journal of Experimental Ma-rine Biology & Ecology 269: 173–185.
Horwitz W. 1980. Methods of Analysis. 13th edn. Association of Official Analytical Chemists, Wash-ington, DC.
Ibeas C., Cejas J.R., Fores R., Badía P., Gómez T. and Lorenzo Hernández A. 1997. Influence of eicosa-pentaenoic to docosahexaenoic acid ratio (EPA/DHA) of the dietary lipids on growth and fatty acidcomposition of gilthead seabream (Sparus aurata) juveniles. Aquaculture 150: 91–102.
Koueta N. and Boucaud-Camou E. 1999. Food intake and growth in reared early juvenile cuttlefish Se-pia offıcinalis L. (Mollusca: Cephalopoda). Journal of Experimental Marine Biology and Ecology240: 93–109.
Koueta N., Boucaud-Camou E. and Noel B. 2002. Effects of enriched natural diet on survival and growthof juvenile cuttlefish Sepia offıcinalis L. Aquaculture 203: 293–310.
Lee P.G. 1994. Nutrition of cephalopods: fuelling the system. Marine and Freshwater Behaviour Physi-ology 25: 35–51.
Nabhitabhata J. 1995. Mass culture of cephalopods in Thailand. World Aquaculture 26: 25–29.Nabhitabhata J. 1999. Life cycle of pharaoh cuttlefish, Sepia pharaonis Ehrenberg, 1831. Phuket Ma-
rine Biological Center Special Publication 19: 25–40.Nash D.M., Eaton C.A. and Crewe N.F. 1978. Lipid classes and fatty acid composition of squid (Illex
illecebrosus). Technical Reports of the Fisheries and Marine Service of Canada., 8 pp.Navarro J.C. and Villanueva R. 2000. Lipid and fatty acid composition of early stages of cephalopods:
an approach to their lipid requirements. Aquaculture 183: 161–177.Olsen R.E. and Henderson R.J. 1989. The rapid analysis of neutral and polar marine lipids using
double-development HPTLC and scanning densitometry. Journal of Experimental Marine Biologyand Ecology 129: 189–197.
Reitan K.I., Rainuzzo J.R. and Olsen Y. 1994. Influence of lipid composition of live feed on growth,survival and pigmentation of turbot larvae. Aquaculture International 2: 33–48.
Richard A. 1975. L’elevage de la seiche (Sepia offıcinalis L., Mollusque, Céphalopode). In: 10th Euro-pean Symposium on Marine Biology. Vol. 1., Ostend, Belgium, pp. 359–380.
Rodríguez C., Pérez J.A., Badía P., Izquierdo M.S., Fernández-Palacios H. and Lorenzo Hernández A.1998. The n-3 highly unsaturated fatty acids requirements of the gilthead seabream (Sparus aurataL.) larvae when using an appropriate DHA/EPA ratio in the diet. Aquaculture 169: 9–23.
Sargent J.R., Bell M.V., Bell J.G., Henderson R.J. and Tocher D.R. 1995. Origins and functions of n-3polyunsaturated fatty acids in marine organisms. In: Ceve G. and Paltauf F. (eds), Phospholipids:Characterization, Metabolism and Novel Biochemical Applications. American Oil Chemical SocietyPress, Champaign, IL, USA, pp. 248–259.
Shehata M.B. and Wassef E.A. 1989. Fatty acid composition of muscle lipids of Gilthead Bream Sparusaurata L. Third Egyptian-Brithish Conference on Animal, Fish and Poultry Production., pp. 797–804.
241

Sumpter J.P. 1993. The deleterious effects of stress and their effects to aquaculture. In: Production, En-vironment and Quality. Special Publication of the European Aquaculture Society. Vol. 18. EuropeanAquaculture Society, pp. 157–166.
Warnke K. 1994. Some aspects of social interaction during feeding in Sepia offıcinalis (Mollusca:Cephalopoda) hatched and reared in the laboratory. Vie Millieu 44: 125–131.
Wassef E.A. and Shehata M.B. 1991. Biochemical composition of Gilthead Bream Sparus aurata L.from Lake Bardawil (Egypt). Marine Science 2: 111–122.
Watanabe T., Izquierdo M.S., Takeuchi T., Satoh S. and Kitajima C. 1989. Comparison between eicosa-pentaenoic and docosahexaenoic acids in terms of essential fatty acid efficacy in larval red seabream.Nippon Suisan Gakkaishi 55: 1635–1640.
Zar J.H. 1984. Biostatistical Analysis. McElroy W. and Swanson P. (eds). Prentice-Hall Inc., EnglewoodCliffs, NJ, USA, 619 p.
242