Effects of crystalline amino acid supplementation to the diet on odor from pig manure
39
M. Ogink and M. W. A. Verstegen P. D. Le, A. J. A. Aarnink, A. W. Jongbloed, C. M. C. van der Peet-Schwering, N. W. manure Effects of crystalline amino acid supplementation to the diet on odor from pig published online Dec 4, 2006; J Anim Sci http://jas.fass.org located on the World Wide Web at: The online version of this article, along with updated information and services, is www.asas.org by on May 14, 2011. jas.fass.org Downloaded from
-
Upload
independent -
Category
Documents
-
view
0 -
download
0
Transcript of Effects of crystalline amino acid supplementation to the diet on odor from pig manure

M. Ogink and M. W. A. Verstegen P. D. Le, A. J. A. Aarnink, A. W. Jongbloed, C. M. C. van der Peet-Schwering, N. W.
manureEffects of crystalline amino acid supplementation to the diet on odor from pig
published online Dec 4, 2006; J Anim Sci
http://jas.fass.orglocated on the World Wide Web at:
The online version of this article, along with updated information and services, is
www.asas.org
by on May 14, 2011. jas.fass.orgDownloaded from

Running Head: Amino acids and odor from pig manure1
2
3
4
Effects of crystalline amino acid supplementation to the diet on odor from pig manure15
6
P. D . Le*†, A. J. A. Aarnink*2, A. W. Jongbloed*, C. M. C. van der Peet-Schwering*, N. W.7
M. Ogink* and M. W. A. Verstegen*8
9
10
* Animal Sciences Group, Wageningen-UR, Bornsesteeg 59, 6708 PD Wageningen PO Box 11
17 The Netherlands12
† Department of Animal Sciences, Hue University of Agriculture and Forestry, Vietnam13
14
15
16
17
18
19
20
21
22
1 Research was supported by the Dutch Ministry of Agriculture, Nature and Food Quality23
2 Corresponding author: [email protected]
Page 1 of 37 Journal of Animal Science
Published Online First on December 4, 2006 as doi:10.2527/jas.2006-644 by on May 14, 2011. jas.fass.orgDownloaded from

ABSTRACT: The objective of this study was to determine effects of specific crystalline AA 25
supplementation to a diet on odor emission, odor intensity, odor hedonic tone, and ammonia 26
emission from pig manure, and on manure characteristics (pH, ammonium-N, total nitrogen, 27
sulfurous, indolic and phenolic compounds and VFA concentrations). An experiment was 28
conducted with growing pigs (n = 18) in a randomized complete block design with 3 29
treatments in 6 blocks. Treatment groups were 1) 15% CP basal diet with 3 times the 30
requirement of sulfur-containing AA (14.2 g/kg diet, as fed basis); 2) basal diet with 2 times 31
the requirement of Trp, and Phe+Tyr (2.9 and 20.4 g/kg diet, as fed basis, respectively); and 3) 32
basal diet with AA supplementation to levels sufficient for maximum protein gain. Pigs with 33
an initial BW of 41.2 ± 0.8 kg were individually penned in partly slatted floor pens and offered 34
a daily feed allowance of 2.8 x maintenance requirement for NE (293 kJ/BW0.75). Feed was 35
mixed with water, 1/2.5 (w/w). Feces and urine of each pig was allowed to accumulate in 36
separate manure pits under the slatted floor. After an adaptation period of 2 wk, and after 37
cleaning the manure pits, manure was subsequently collected. In the wk 5 of the collection 38
period, separate samples were collected directly from each manure pit for odor, ammonia, and 39
manure composition analysis. Air samples were analyzed for odor concentration, and for 40
hedonic tone and odor intensity above odor detection threshold. Results showed that 41
supplementing crystalline S-containing AA in surplus of the requirement increased odor 42
emission (P < 0.001) and odor intensity (P < 0.05), and reduced odor hedonic tone (P < 0.05) 43
from air above the manure pits. Supplementing crystalline Trp, Tyr, and Phe in surplus of 44
recommended requirements did not affect odor emission, odor intensity, or odor hedonic tone. 45
Regardless of dietary treatment, all pigs had similar performance levels. No differences were 46
observed in ammonia emission from manure of pigs fed different levels of AA 47
supplementation (P = 0.20). In order to reduce odor from pig manure, dietary S-containing AA 48
should be minimized to just meet recommended requirements.49
Key words: crystalline amino acids, diet, growing pig, odor50
Page 2 of 37Journal of Animal Science
by on May 14, 2011. jas.fass.orgDownloaded from
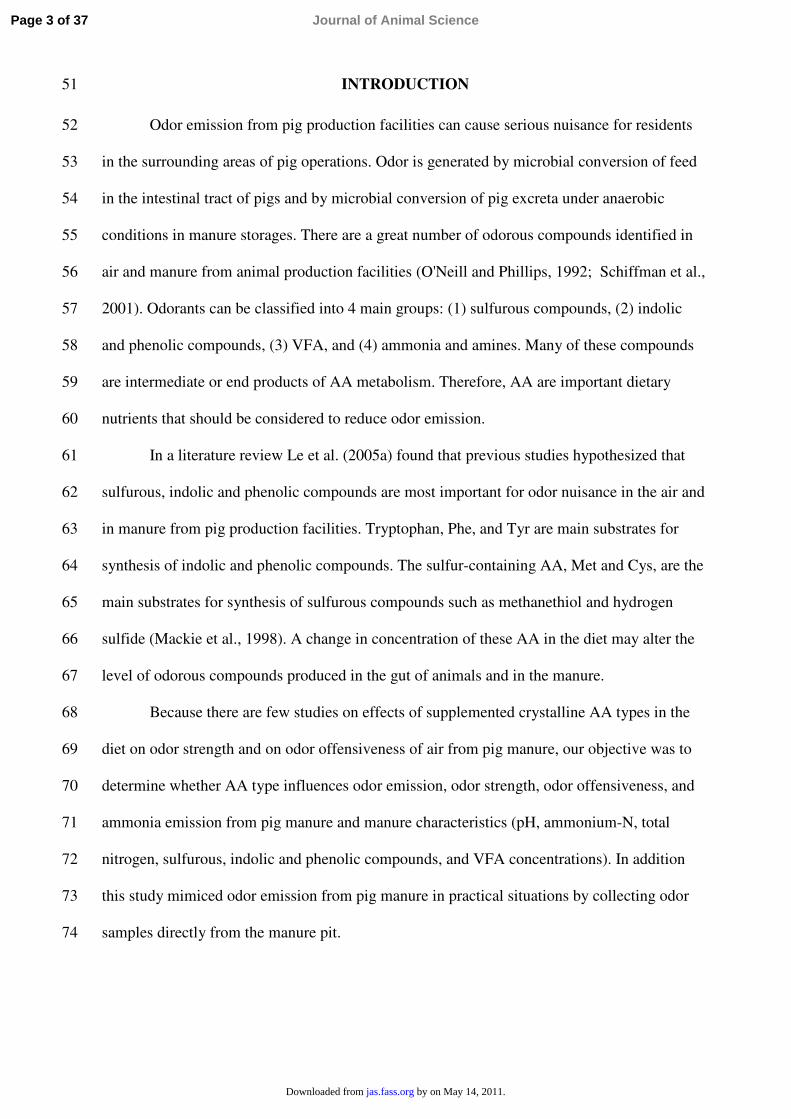
INTRODUCTION51
Odor emission from pig production facilities can cause serious nuisance for residents 52
in the surrounding areas of pig operations. Odor is generated by microbial conversion of feed 53
in the intestinal tract of pigs and by microbial conversion of pig excreta under anaerobic 54
conditions in manure storages. There are a great number of odorous compounds identified in 55
air and manure from animal production facilities (O'Neill and Phillips, 1992; Schiffman et al.,56
2001). Odorants can be classified into 4 main groups: (1) sulfurous compounds, (2) indolic 57
and phenolic compounds, (3) VFA, and (4) ammonia and amines. Many of these compounds 58
are intermediate or end products of AA metabolism. Therefore, AA are important dietary 59
nutrients that should be considered to reduce odor emission. 60
In a literature review Le et al. (2005a) found that previous studies hypothesized that 61
sulfurous, indolic and phenolic compounds are most important for odor nuisance in the air and 62
in manure from pig production facilities. Tryptophan, Phe, and Tyr are main substrates for 63
synthesis of indolic and phenolic compounds. The sulfur-containing AA, Met and Cys, are the 64
main substrates for synthesis of sulfurous compounds such as methanethiol and hydrogen 65
sulfide (Mackie et al., 1998). A change in concentration of these AA in the diet may alter the 66
level of odorous compounds produced in the gut of animals and in the manure.67
Because there are few studies on effects of supplemented crystalline AA types in the 68
diet on odor strength and on odor offensiveness of air from pig manure, our objective was to 69
determine whether AA type influences odor emission, odor strength, odor offensiveness, and 70
ammonia emission from pig manure and manure characteristics (pH, ammonium-N, total 71
nitrogen, sulfurous, indolic and phenolic compounds, and VFA concentrations). In addition 72
this study mimiced odor emission from pig manure in practical situations by collecting odor 73
samples directly from the manure pit.74
Page 3 of 37 Journal of Animal Science
by on May 14, 2011. jas.fass.orgDownloaded from

MATERIALS AND METHODS75
Animals, Experimental Design, and Diets 76
All procedures involving animal handling were reviewed and approved by 77
Wageningen University and Research Center Committee on Animal Care and Use. A 78
randomized complete block design with 3 treatments in 6 blocks was used to study effects of 79
AA types in the diet on odor concentration, odor emission, odor intensity, odor hedonic value, 80
and ammonia emission from manure of growing pigs, and on manure characteristics. Three 81
groups of pigs were fed different diets: 1) 15% CP basal diet with 3 times the requirement82
(CVB, 2004) of sulfur-containing AA (SAA) (14.2 g/kg diet, as fed basis); 2) basal diet with 2 83
times the requirement of Trp, and Phe+Tyr (TAA) (2.9 and 20.4 g/kg diet, as fed basis, 84
respectively); and 3) basal diet with AA supplementation to levels sufficient for maximum 85
protein gain (NOAA). In all diets, additional AA were supplemented to the diets in crystalline 86
form. Each treatment was replicated 6 times, 1 replicate in each of 6 blocks, of which a block 87
consisted of samples collected on the same day and animals with similar initial BW.88
In total 18 growing barrows (Great Yorkshire x Dutch Landrace) with an initial BW of 89
41.2 ± 0.8 kg were allocated to 6 blocks, with blocks based on initial BW. Pigs were penned 90
individually in galvanized steel pens (2.1 x 0.96 m), consisting of a slatted floor at the back 91
(0.97 x 0.96 m). There was a separate manure pit under the slatted floor of each pen. The size 92
of the manure pit was 1.35 x 0.91 x 0.36 m (length x width x depth). Pigs were housed in a 93
mechanically ventilated and temperature controlled room. Temperature and relative humidity 94
were recorded every 5 min. The average temperature and relative humidity of the room during 95
the experimental period were 21.0 0C ± 0.84 and 50.0 % ± 5.32 (mean ± SD), respectively.96
Diets were formulated to have similar contents of NE, non-starch polysaccharides 97
(NSP), electrolyte balance, minerals, and vitamins (Tables 1 and 2). The basal diet (NOAA) 98
was formulated to contain 15% CP with AA supplementation to meet the requirement for the 99
pig based on ileal AA digestibility (CVB, 2004). To formulate the SAA diet, additional Met 100
Page 4 of 37Journal of Animal Science
by on May 14, 2011. jas.fass.orgDownloaded from

was added so that sulfur-containing SAA in the diet was 3 times the recommended level. To 101
formulate the TAA diet, additional Trp, Phe, and Tyr were added to provide 2 times the 102
requirements of these AA of Trp, Tyr, and Phe (TAA) based on ileal digestibility. Addition of 103
AA replaced tapioca meal. Analyzed AA composition of the diets are presented in Table 2 104
with concentrations of sulfur-containing AA 0.49, 1.42, and 0.51%; Trp, 0.19, 0.20, and 105
0.29%; and Phe + Tyr, 1.13, 1.15 and 2.04%; in NOAA, SAA, and TAA diets, respectively.106
Experimental diets were analyzed for AA composition, ash, DM, CP, minerals, crude 107
fiber, fat, starch, sugar, and gross energy. The AA (except Met, Cys, and Trp) were assayed by 108
ion-exchange column chromatography after hydrolysis for 23 h in HCl (6 mol/L). Cystine and 109
Met were determined as cysteic acid and methionine sulfone after oxidation with performic 110
acid before hydrolysis (Schram et al., 1954). Tryptophan was determined according to Sato et 111
al. (1984). Starch content was determined enzymatically according to the amyloglucosidase/ 112
hexokinase method (NEN 3574). Sugar was assayed according to the non-starch 113
polysaccharides (NSP) procedure (Gelder et al., 1992). Crude fiber was determined 114
gravimetrically after treatment with sulfuric acid and potassium hydroxide (ISO/DIS 6895). 115
For total fat, samples were hydrolyzed with chloric acid, followed by extraction of fat with 116
petroleum ether. The Ca, P, Mg, Na, K, Cu, and Zn contents were determined using the 117
inductively coupled plasma atomic emission spectrometry (ICP-AES). The Cl content was 118
determined by potentiometric titration of water-diluted solid samples with the chloride specific 119
ion electrode (Jenway Chloride Meter, model PCLM3). For sulfate, samples were extracted 120
with chloric acid. Sulfate was separated with ion chromatography using a water sodium 121
hydroxide gradient and an Ionpac AS 11 (Dionex) as column. Detection takes place by 122
suppressed electric conductivity. Identification and quantification occurs using an external 123
standard solution. The DM was determined gravimetrically after 4 h at 103°C (ISO 6496). 124
Content of ash was determined gravimetrically after ashing at 550 °C (ISO 5984). Nitrogen 125
content was determined by the Kjeldahl method (ISO 5983).126
Page 5 of 37 Journal of Animal Science
by on May 14, 2011. jas.fass.orgDownloaded from

Pigs were fed 2.8 times the maintenance NE requirement (293 kJ/BW0.75). Water was 127
restricted by mixing feed with water in the ratio of 1/2.5 (w/w). Apart from water with feed, 128
no additional water was given to the pigs with the aim to excrete the same amount of feed and 129
water intake by the pigs giving almost a similar amount of manure. Pigs were fed twice daily130
day at 0800 and 1500. The amount of feed provided was adjusted each day according to an 131
assumed BW gain of 780 g/d. Feed intake was recorded daily. Pigs were weighed at the 132
beginning and at the end of the experimental period just before the morning feed. Daily gain 133
and G:F were derived from the feed intake and the increase in BW during a period of 46 d. 134
After an adaptation period of 2 wk to allow pigs to acclimatize to the experimental diets and 135
pens, manure pits were cleaned. Subsequently, feces and urine accumulated in the manure pit. 136
In wk 5 of the collection period, odor, ammonia, and manure samples were collected for 137
subsequent analysis.138
Collecting Air Samples and Measuring Odor Concentration, Odor Hedonic Tone, and Odor 139
Intensity140
Collection of Air Samples for Odor Measurement. Air samples were used to measure 141
odor concentration, odor hedonic tone, and odor intensity. Air samples were collected directly 142
from air above the manure in the pit. A schematic view of the odor sampling arrangement is 143
shown in Figure 1. A vessel without a bottom was placed in the middle of the manure pit. The 144
bottom of the vessel touched the bottom of the manure pit. The net surface of the vessel was 145
595 cm2; and the diameter was 28 cm. The vessel was divided into 2 compartments by a lid. 146
The net height of the lower compartment was 40 cm and the net height of the upper 147
compartment was 20 cm. Air entering the upper compartment of the vessel from a pressurized 148
cylinder was odor-free air. Air entered the lower compartment of the vessel via 24 holes of 1149
mm diameter each, located at the edge of the lid. Air was exhausted from the vessel by a hole 150
of 5 mm diameter in the middle of the lid. 151
Page 6 of 37Journal of Animal Science
by on May 14, 2011. jas.fass.orgDownloaded from

The outgoing air from the vessel was split into 2 streams. One stream was used to 152
collect the air sample for odor measurement. It was connected to an odor-sampling bag placed 153
in a rigid container. This container was connected to a critical glass capillary, which had a 154
flow rate of 0.5 L min-1, and then to a vacuum pump. The other stream was used to collect 155
ammonia and was connected to 2 connected impingers. The outgoing air from the impinger 156
was connected to a critical glass capillary, which had a flow rate of 0.5 L m-1, and then to the 157
vacuum pump.158
Air samples were collected according to the European standard (CEN standard 13725, 159
2003). The sampling method for delayed olfactometry was applied using the 'lung principle'. A 160
40 L Nalophaan odor sampling bag was placed in a rigid container. The sample bag had been 161
flushed with compressed and odorless air 3 times before it was placed in a rigid container for 162
collection of the odor sample. The sample bag was used once for each air sample as 163
recommended by European standard (CEN standard 13725, 2003). The air was removed from 164
the container by the vacuum pump. The lower pressure in the container caused the bag to fill 165
with a volume of sample air equal to the volume removed from the container (Figure 1).166
One air sample was collected from each manure pit. During transport and storage, air167
samples were kept at a temperature above the dew point of the sample to avoid condensation. 168
This was achieved by warming the rigid container of the odor bag to about 4 0C above the 169
ambient temperature. The interval between sampling and measuring odor concentration did 170
not exceed 30 h, as recommended by European standard (CEN standard 13725, 2003).171
Measurement of Odor Concentration. Odor concentration was measured by 172
olfactometry according to the European standard (CEN standard 13725, 2003) as described in 173
detail by Le et al. (2005b). Odor concentrations of the examined samples were expressed in 174
European odor units per cubic meter air (ouE m-3). One odor unit is defined as the amount of 175
odor-causing gases which, when diluted in 1 m3 of air, can just be distinguished from clean air 176
by 50% of the members of an odor panel. 177
Page 7 of 37 Journal of Animal Science
by on May 14, 2011. jas.fass.orgDownloaded from
Odor emission was defined as the number of odor units emitted from a manure surface 178
per second and it was obtained by multiplying the ventilation rate with the corresponding odor 179
concentration (Equation 1).180
Eodor = (Codor * V * 10,000) / (60 * 1,000 * 595) [1]181
where Eodor = odor emission s-1 m-2 (ouE s-1m-2), Codor = odor concentration (ouE m
-3), and V = 182
ventilation rate (L min-1), 10,000 = cm2 m-2, 60 = sec min-1, 1,000 = liters m-3, and 595 = the 183
cm2 surface area of the manure pit.184
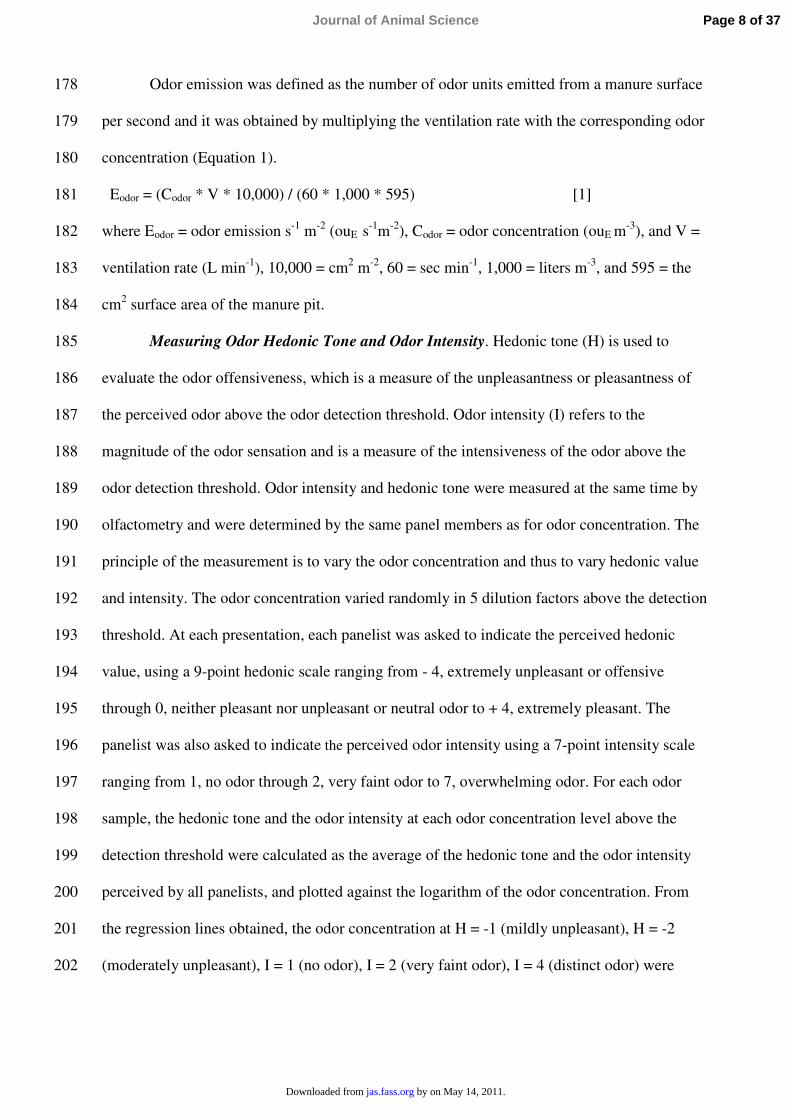
Measuring Odor Hedonic Tone and Odor Intensity. Hedonic tone (H) is used to 185
evaluate the odor offensiveness, which is a measure of the unpleasantness or pleasantness of 186
the perceived odor above the odor detection threshold. Odor intensity (I) refers to the 187
magnitude of the odor sensation and is a measure of the intensiveness of the odor above the 188
odor detection threshold. Odor intensity and hedonic tone were measured at the same time by 189
olfactometry and were determined by the same panel members as for odor concentration. The 190
principle of the measurement is to vary the odor concentration and thus to vary hedonic value 191
and intensity. The odor concentration varied randomly in 5 dilution factors above the detection 192
threshold. At each presentation, each panelist was asked to indicate the perceived hedonic 193
value, using a 9-point hedonic scale ranging from - 4, extremely unpleasant or offensive 194
through 0, neither pleasant nor unpleasant or neutral odor to + 4, extremely pleasant. The 195
panelist was also asked to indicate the perceived odor intensity using a 7-point intensity scale 196
ranging from 1, no odor through 2, very faint odor to 7, overwhelming odor. For each odor 197
sample, the hedonic tone and the odor intensity at each odor concentration level above the 198
detection threshold were calculated as the average of the hedonic tone and the odor intensity 199
perceived by all panelists, and plotted against the logarithm of the odor concentration. From 200
the regression lines obtained, the odor concentration at H = -1 (mildly unpleasant), H = -2 201
(moderately unpleasant), I = 1 (no odor), I = 2 (very faint odor), I = 4 (distinct odor) were 202
Page 8 of 37Journal of Animal Science
by on May 14, 2011. jas.fass.orgDownloaded from

derived. Regression lines of the hedonic tone and the odor intensity were also plotted against 203
the logarithm of the odor concentration for all samples in the same treatment.204
Collecting and Measuring Ammonia Emission 205
Samples for determining ammonia emission were collected during the same period 206
and with the same system as samples for odor measurement (Figure 1). One air sample for 207
ammonia measurement was collected from each manure pit. Ammonia in outgoing air was 208
removed by passing through 2 ammonia traps (impingers), each containing about 20 mL 0.5 M 209
HNO3 solution. The system was run for about 90 min. The ammonia concentration and the 210
volume of the liquid were determined in the first and the second impingers. Ammonia 211
emission per time unit and surface unit was calculated as (Equation 2): 212
MNH3 = (CNH3 * V * 10,000) / (T x 60 * 595) 213
where MNH3 = ammonia emission (mg s-1 m-2), CNH3 = ammonia concentration (mg 214
mL-1 HNO3), V = volume of HNO3 solution (mL), 10,000 = cm2 m-2, T = sampling time 215
(min), 60 = s min-1, and 595 = the cm2 surface area of the manure pit.216
Collection and Measurement of Manure Characteristics 217
Manure samples were analyzed to evaluate the effect of the diets on manure 218
characteristics. These include DM, ash, total N (total-N), ammonium-N, pH, VFA (acetic, 219
propionic, butanoic, pentanoic, iso-butanoic, iso-pentanoic, hexanoic, and heptanoic acid), 220
indolic (indole and 3-methyl indole) and phenolic compounds (phenol, 4-ethyl phenol, and 221
cresols), and sulfurous compounds (carbon disulfide, methyl sulfide, methyl disulfide, and 222
ethanethiol). One manure sample was collected from each manure pit. Immediately after 223
collecting odor samples, manure in each manure pit was mixed thoroughly before a sample of 224
about 1 kg was collected. Manure samples were stored at - 20 0C until analysis. 225
Ammonium was determined spectrophotometrically according to NEN 6472 (Derikx et226
al., 1994). Volatile fatty acids were measured using a Packard 427 gas chromatograph, 227
Page 9 of 37 Journal of Animal Science
by on May 14, 2011. jas.fass.orgDownloaded from

equipped with a flame ionization detector. Manure pH was measured by a pH electrode. For 228
determination of indolic and phenolic compounds and sulfurous compounds, 2.5 g fresh 229
manure was extracted with 15 ml 50% methanol for 2 h. The sample was centrifuged and the 230
supernatant was analyzed by the HPLC. The HPLC conditions were a water-methanol gradient 231
as elution solution and Alltima C18 (Alltech) as column. Detection was done by UV-232
absorption at 200 nm. For identification and quantification, an external standard solution was 233
used.234
Statistical Analysis 235
The effect of AA types on ADG, ADFI, G : F, odor emission, odor hedonic value, odor 236
intensity, ammonia emission, and manure characteristics were analyzed using ANOVA 237
appropriate for a randomized complete block design with 6 pigs/treatment. Each treatment was 238
replicated 6 times, 1 replicate in each of 6 blocks, of which a block consisted of samples 239
collected on the same day and animals with similar IBW. The individual pig or the manure pit 240
was the experimental unit. 241
A natural logarithm transformation was applied to odor emission, concentrations of 242
VFA, total-N, ammonium-N, indolic and phenolic compounds, and sulfur-containing 243
compounds since they were skewed and non-normally distributed. Statistical analyses were 244
conducted on the natural logarithm scale. Data were presented as either arithmetic or 245
geometric mean. Geometric mean is the antilog of the arithmetic average of logarithms of data 246
on original scale. In other words, geometric mean is the back-transformed value of data on 247
logarithm scale.248
In each treatment, odor hedonic tone and odor intensity was plotted against the natural 249
logarithm of odor concentration, and odor hedonic tone was plotted against odor intensity. The 250
differences between slopes and between intercepts were tested to decide whether there should 251
be separate regression lines for treatments or a common line for all treatments. The 252
relationship between ammonia emission and odor emission was also determined by linear 253
Page 10 of 37Journal of Animal Science
by on May 14, 2011. jas.fass.orgDownloaded from

regression. Analyses were computed using GenStat statistical package 7th version (GenStat 254
VSN International Ltd., 2004).255
RESULTS256
Effects of Amino Acid Supplementation on Animal Performance 257
To detect whether there are any effects of treatments on production parameters, the 258
effects of AA supplementation to the diet on ADG, ADFI, and G:F are summarized in Table 3. 259
Average daily feed intake, ADG, and G:F were similar among treatments (P > 0.30).260
Effects of Amino Acid Supplementation on Odor Strength and Offensiveness 261
Descriptive statistics and ANOVA of diet effects on odor strength, and offensiveness 262
from pig manure are given in Table 4. Geometric odor concentration and odor emission from 263
pig manure were highest from pigs fed the SAA treatment, 111,302 ouE m-3 and 15.48 ouE s-1 264
m-2, respectively. The NOAA treatment had the lowest odor concentration and odor emission, 265
13,224 ouE m-3 and 1.88 ouE s-1 m-2, respectively. Analyses of variance showed that diets 266
affected odor concentration and odor emission from pig manure (P < 0.001). Further analyses 267
showed that pigs fed the the SAA treatment had a greater odor concentration and odor 268
emission than pigs fed the TAA and NOAA treatments (P < 0.05). No differences were 269
observed in odor concentration and odor emission between pigs fed the TAA and NOAA 270
treatments. At the same level of odor hedonic tone or odor intensity, odor concentration from 271
the pigs fed the SAA treatment was lowest (P < 0.05). No differences in odor concentration at 272
different levels of hedonic tone and odor intensity were found between pigs fed the TAA and 273
NOAA treatments.274
Relationships between odor concentration and odor hedonic tone, between odor 275
concentration and intensity, and between intensity and hedonic tone are shown in Figures 2, 3,276
and 4, respectively. In each figure, a difference in intercepts (P < 0.05) of different regression 277
lines was observed. The intercept of the pigs fed the SAA treatment differed from that of pigs 278
Page 11 of 37 Journal of Animal Science
by on May 14, 2011. jas.fass.orgDownloaded from

fed the TAA and NOAA treatments (P < 0.05), but it was similar for pigs fed the TAA and 279
NOAA. The regression lines were similar in slopes. There was a strong linear relationship 280
between hedonic tone and the natural logarithm of odor concentration (R2 = 0.66), between 281
odor intensity and the natural logarithm of odor concentration (R2 = 0.71) and between 282
hedonic tone and intensity (R2 = 0.89). Hedonic tone decreased while odor intensity increased 283
as the odor concentration increased. Hedonic tone decreased as odor intensity increased.284
Effects of AA Supplementation on Manure Characteristics and Ammonia Emission 285
Descriptive statistics and ANOVA of the impacts of AA supplementation on manure 286
characteristics and ammonia emission are shown in Table 5. Volatile fatty acids, carbon 287
disulfide, ethanethiol, phenol, and 3-methyl indole concentrations in the manure of pigs fed 288
diets supplemented with different kinds of AA were similar. Manure from pigs fed SAA diet 289
had the greatest total N (P = 0.04). Ammonium-N concentrations were greater in pigs fed 290
SAA and TAA than in NOAA diet (P < 0.01). Ammonia emission and manure pH were 291
similar between manure of pigs fed different diets. Diets affected cresols (P < 0.01), 4-ethyl 292
phenol (P = 0.03), indole (P < 0.01), and methyl sulfide (P = 0.04) concentrations in the 293
manure. Manure from pigs fed the TAA diet had greater cresols and indole concentrations than 294
manure from pigs fed the SAA and NOAA diets. Manure from pigs fed the SAA diet had 295
greater 4-ethyl phenol concentration than manure from pigs fed the TAA diet. Pigs fed the 296
TAA diet produced manure with greater concentrations of methyl sulfide than pigs fed the 297
SAA and NOAA diets. Methyl disulfide, hexanoic, heptanoic, and pentanoic acids were not 298
detected in the manure of the different treatments. The detection limits of methyl disulfide and 299
the 3 VFA are 0.5 mg/kg and 0.1 g/kg, respectively. The correlation between ammonia 300
emission and odor emission was – 0.3 (P > 0.05).301
Page 12 of 37Journal of Animal Science
by on May 14, 2011. jas.fass.orgDownloaded from

DISCUSSION302
Odor nuisance from pig production facilities is a growing concern for the society and 303
consequently; it needs to be reduced. It is preferable that odor abatement solutions are done at 304
source of production. Diet is the first step in odor generation in animal husbandry (Le et al., 305
2005a) and it is generally accepted that dietary manipulation can influence odor from pig 306
manure. Odor is a complex mixture of various compounds, in which sulfurous compounds, 307
indolic, and phenolic compounds are considered the most important related to odor strength 308
and offensiveness (O'Neill and Phillips, 1992; Mackie et al., 1998). Reducing precursors of 309
these compounds in the diet should reduce odor strength and offensiveness. Therefore, the 310
primary objective of this study was to determine manure odor strength and offensiveness from 311
pigs fed diets with different types of AA supplementation. In addition, ammonia emission and 312
manure characteristics were evaluated.313
We hypothesized that the surplus of sulfur-containing AA in the diet would provide 314
precursors for the production of odorous sulfur compounds, such as hydrogen sulfide and 315
methanethiol, both of which can volatilize from the manure and create odor. As expected, 316
manure of pigs fed the SAA diet had a higher odor concentration, and thus odor emission, than 317
pigs fed the NOAA and TAA diets. 318
In addition to the greater odor concentration and emission, there was a consistently 319
lower odor concentration at different levels of odor hedonic tone and odor intensity of manure 320
from pigs fed the SAA diet, implying that manure from pigs fed the SAA diet produces a 321
strong and offensive odor at lower levels of odor concentration than manure from pigs fed the 322
TAA and NOAA treatments. 323
Literature shows that surplus of sulfur-containing AA in the diet provides precursors 324
for many odorous compounds in manure and in the odorous air such as hydrogen sulfide (Ren, 325
1999; Sutton et al., 1999), methanethiol (Inoue et al., 1995; Yoshimura et al., 2000), dimethyl 326
sulfide (Kelly et al., 1994), dimethyl disulfide (Bonnarme et al., 2001), and dimethyl trisulfide 327
Page 13 of 37 Journal of Animal Science
by on May 14, 2011. jas.fass.orgDownloaded from

(Chin and Lindsay, 1994). In addition sulfurous compounds have a lower odor detection 328
threshold than other odorous compounds. Furthermore, concentrations of sulfurous 329
compounds in the odorous air can be relatively high. Finally, the nature of the smell of 330
sulfurous compounds is more offensive than other odorous compounds. This explains why 331
manure from pigs fed the SAA diet had greater odor emission, and odor intensity and lower 332
hedonic tone (more unpleasant) than manure from pigs fed the TAA and NOAA diets.333
It is generally accepted that crystalline sulfur-containing AA are absorbed completely 334
by the time digesta reaches the terminal ileum. The excess sulfur-containing AA are absorbed 335
in the small intestine of animals and end up as pyruvate (from Cys), Succinyl CoA (Met), and 336
SO42-. Sulfates are excreted via urine; in the manure sulfates are quickly converted to sulfur 337
odorous compounds, mainly hydrogen sulfide and methanethiol. According to Spoelstra 338
(1980), sulfate-reducing bacteria produce a trace amount of carbon disulfide, methyl sulfide, 339
and ethanethiol.340
Considering manure characteristics, analyzed sulfurous compounds, carbon disulfide, 341
methyl sulfide, and ethanethiol concentrations in the manure of pigs fed the SAA treatment 342
were not greater than in the other 2 treatments. These 3 compounds may not be important in 343
terms of mass concentration compared to other sulfurous compounds. In this experiment, 344
precursors for sulfurous compounds in manure are mainly sulfates from the urine. Carbon 345
disulfide, methyl sulfide, and ethanethiol are primarily produced from metabolism of sulfur-346
containing AA in the intact protein in the large intestine of animals and in manure. This is 347
supported by the finding of Le et al. (unpublished data) who reported that increased dietary CP 348
levels resulted in greater concentrations of these compounds in the manure. According to 349
Banwart and Bremmer (1975) hydrogen sulfide and methanethiol (methyl mercaptan) 350
represented 70 to 90% of the total S volatilized in the manure while Beard and Guenzi (1983)351
stated that most of the S emitted is in the form of hydrogen sulfide (39%) and methanethiol 352
(34%). In addition, according to O'Neill and Phillips (1992), carbon disulfide and methyl 353
Page 14 of 37Journal of Animal Science
by on May 14, 2011. jas.fass.orgDownloaded from

sulfide are not among the compounds having the lowest odor detection threshold, as 354
methanethiol and hydrogen sulfide were the compounds having the lowest odor detection 355
threshold, 0.0003 and 0.1 µg/m3, respectively. These 2 compounds were not analyzed in this 356
experiment, because they have boiling points (6 and – 60.7 0C, respectively) too low to be 357
captured in manure samples for subsequent analysis. Furthermore, it is difficult to analyze 358
these compounds by a normal gas chromatography. 359
From the results of odor strength and offensiveness and the concentrations of sulfurous 360
compounds in the manure of pigs fed different diets, it is difficult to correlate the 361
concentrations of single odorous compounds in the manure and the odor strength and 362
offensiveness of the odorous air emitting from the manure. Therefore, it is necessary to 363
analyze odorous compounds in the air. We feel the focus should be on very volatile sulfurous 364
compounds because this better reflects the relationship between odor sulfurous compounds 365
and odor strength and offensiveness. Techniques to collect and to analyze compounds in the 366
air are, however, still under development.367
Supplementation with a surplus of Trp and Phe + Tyr to a level twice the requirement 368
estimate did not increase odor concentration, emission, and intensity, nor did it reduce hedonic 369
tone from pig manure. These AA are precursors for phenol (Hammond et al., 1989; Sutton et 370
al., 1999), 4-methylphenol (Hengemuhle and Yokoyama, 1990), 4-ethylphenol (Spoelstra, 371
1977; Hengemuhle and Yokoyama, 1990), indole, and 3-methylindole (Honeyfield and 372
Carlson, 1990; Jensen and Jørgensen, 1994). There are 2 possible reasons for the non-effect of 373
crystalline Trp, Phe, and Tyr supplementation to a diet on odor from pig manure. First, the 374
excess of ileal absorbed Trp, Tyr, and Phe are degraded to a carbon chain and nitrogen, where 375
excess show up only as an increased urea excretion in urine. In our experiment, this led to a 376
greater ammonium concentration of this diet compared to the NOAA diet (Table 5). In 377
general, crystalline AA are absorbed 100% before the digesta reach the ileum. If this is the 378
case, excess Trp, Tyr, and Phe absorbed in the small intestine of animals will not cause much 379
Page 15 of 37 Journal of Animal Science
by on May 14, 2011. jas.fass.orgDownloaded from

odor nuisance from the manure. Second, although these compounds are thought to be mainly 380
responsible for the smell in the headspace and ventilation air of pig houses (Schaefer, 1977; 381
Williams, 1984; O'Neill and Phillips, 1992), these phenolic and indolic compounds may not be 382
as important in causing odor nuisance as expected. The hypothesis for the importance of these 383
compounds within previous studies was mainly based on their concentration in the air and/or 384
in manure from pig production facilities and their olfactometry detection threshold. Odor is a 385
complex mixture of various compounds. For example, Schiffman et al. (2001) reported 331 386
compounds, in which the relationship between each individual odor compound or a group of 387
odor compounds and the odor strength and offensiveness of the mixture of the odor air is not 388
yet clear. In a review, Le et al. (2005a) found a large variation in the concentration of an 389
odorous compound and its detection threshold. 390
One may consider the logic using 2 and 3 times the requirements of Trp, Phe + Tyr,391
and S-containing AA for the test diets. This research was designed as a model experiment to 392
verify if an oversupply of specific AA causes much more odor nuisance. In addition, it was a 393
fundamental experiment that provided knowledge on odor precursors and their excretion 394
pathways. Results show that an excess of S-containing AA results in much more odor 395
nuisance, while Trp, Phe + Tyr did not. If a large oversupply does not cause more odor 396
nuisance, then a slight oversupply will not cause odor nuisance, as well.397
From the analyzed concentration of Met, Cys, and sulfate in the diets (Table 2), the 398
concentration of S was calculated. They were 1.55, 3.55, and 1.66 g kg-1 diet as-fed basic, 399
respectively for NOAA, SAA, and TAA diets. Although the SAA diet had 3 times the 400
requirement of S-containing AA, the S concentration was not high compared to other diets.401
For example, diets used in the experiment of Kerr et al. (2006) contained approximately 17 g 402
kg-1. 403
Although the main objective of this study was to determine the effect of AA 404
supplementation to the diet on odor strength and offensiveness, ammonia emission was also 405
Page 16 of 37Journal of Animal Science
by on May 14, 2011. jas.fass.orgDownloaded from

considered because it is a serious environmental problem. Odor abatement strategies are only 406
of interest if they do not increase other environmental problems such as ammonia. Ammonia 407
emission from pig manure is mainly influenced by pH and ammonia concentration. These 2408
factors are mainly influenced by dietary protein content and electrolyte balance (Canh et al., 409
1998a, b). The similar ammonia emission from manure of pigs fed the diets supplemented 410
with different types of AA can be explained by the fact that the pigs fed the NOAA, SAA, and 411
TAA diets had similar CP and electrolyte balance concentrations (Table 2). In addition, 412
although total N and ammonium-N concentrations in the manure from pigs fed the SAA 413
treatment were greater than in manure from pigs fed the NOAA and TAA treatments, 414
differences were small and partly compensated by small differences in pH (Table 6).415
This study showed that the correlation between ammonia emission and odor emission 416
was low and negative (-0.3). Inconsistent findings were found in literature and between our 417
finding and others. Schulte et al. (1985) and Miner (1995) found a high correlation between 418
ammonia and odor emission from pig production facilities. On the other hand Williams 419
(1984), Oldenburg (1989), Liu et al. (1993) and Verdoes and Ogink (1997) found only a low 420
correlation between ammonia and odor emission from pig houses. The inconsistencies in the 421
relationship between ammonia and odor emission likely comes from the fact that ammonia and 422
odor samples were collected from different farms and at different times. Farms are different in 423
animal types, housing design, and dietary composition, especially fermentable carbohydrates 424
which may vary greatly among diets. Different times of sample collection and farms might 425
have different environmental factors. These farms and environmental factors play key roles in 426
influencing odor and ammonia emission (Le et al., 2005a, b) and consequently the relationship 427
between them. In our study, these sources of variation were prevented, because we collected 428
odor and ammonia samples from the manure of the different treatments in the same animal 429
house, at the same time, under the same environmental conditions, and with the same air flow 430
rate.431
Page 17 of 37 Journal of Animal Science
by on May 14, 2011. jas.fass.orgDownloaded from

IMPLICATIONS432
This study demonstrates that supplementing crystalline sulfur-containing amino acids 433
to the diet above the requirement for the pig increases odor strength and offensiveness from 434
pig manure. Therefore, to reduce odor from pig manure sulfur-containing amino acids should 435
be formulated very near the requirement for the animal . At the same time, supplementing 436
crystalline phenylalanine, tyrosine, and tryptophan to the diet, above requirement does not 437
increase the odor strength and offensiveness from pig manure. Ammonia emission has a low 438
correlation with odor emission, so strategies that have demonstrated to be successful in 439
reducing ammonia emission may not have a similar impact on odor emission. From this study 440
it is clear that sulfurous compounds contribute significantly to odor nuisance.441
442
443
444
445
446
447
448
449
450
451
452
453
454
455
456
457
Page 18 of 37Journal of Animal Science
by on May 14, 2011. jas.fass.orgDownloaded from

LITERATURE CITED458
Banwart, W. L., and M. J. Bremmer. 1975. Identification of sulfur gases evolved from animal 459
manures. J. Environ. Qual. 4: 363 - 366.460
Beard, W. L., and W. D. Guenzi. 1983. Volatile sulfur compounds from a redox-controled-461
cattle-manure slurry. J. Environ. Qual. 12: 113-116.462
Bonnarme, P., C. Lapadatescu, M. Yvon, and H. E. Spinnler. 2001. L-methionine degradation 463
potentialities of cheese-ripening microorganisms. J. Dairy Res. 68: 663-674.464
Canh, T. T., A. J. A. Aarnink, Z. Mroz, A. W. Jongbloed, J. W. Schrama, and M. W. A. 465
Verstegen. 1998a. Influences of electrolyte balance and acidifying calcium salts in the 466
diet of growing-finishing pigs on urinary pH, slurry pH and ammonia volatilisation 467
from slurry. Livest. Prod. Sci. 56: 1-13.468
Canh, T. T., A. J. A. Aarnink, J. B. Schutte, A. Sutton, D. J. Langhout, and M. W. A. 469
Verstegen. 1998b. Dietary protein affects nitrogen excretion and ammonia emission 470
from slurry of growing–finishing pigs. Livest. Prod. Sci. 56: 181-191.471
CEN standard 13725. 2003. Air quality - Determination of odour concentration by dynamic 472
olfactometry. European Committee for Standardization, Brussels, Belgium.473
Chin, H. W., and R. C. Lindsay. 1994. Ascorbate and transition-metal mediation of 474
methanethiol oxidation to dimethyl disulfide and dimethyl trisulfide. Food Chem. 49: 475
387-392.476
CVB-Centraal Veevoederbureau (Animal feed product board). 2004. Tabellenboek 477
Veevoeding (Feed table) 2004, 8203 AD Lelystad, The Netherlands.478
Derikx, P. J. L., H. C. Willers, and P. J. W. Ten Have. 1994. Effect of pH on behaviour of 479
volatile compounds in organic manures during dry-matter determination. Bioresour. 480
Technol. 49: 41-45.481
Page 19 of 37 Journal of Animal Science
by on May 14, 2011. jas.fass.orgDownloaded from

Gelder, A. H., E. M. van te Brinke, J. W. Cone, H. J. van Lonkhuijsen, Jetten J.M., and W. J. 482
Lichtendonk. 1992. Protocol voor de analyse van niet-zetmeel koolhydraten (Protocol 483
for analysing non-starch polysaccharides).484
GenStat VSN International Ltd. 2004. Genstat user's guide. 7th version, VSN International, 485
Wilkinson House, Jordan Hill Road, Oxford, UK.486
Hammond, E. G., C. Heppner, and R. Smith. 1989. Odors of swine waste lagoons. Agri. 487
Ecosyst. Environ. 25: 103-110.488
Hengemuhle, S. M., and M. T. Yokoyama. 1990. Isolation and characterization of an anaerobe 489
from swine cecal contents which produces 3-methylindole and 4-methylphenol. J. 490
Anim.Sci. 68: 408A.491
Honeyfield, D. C., and J. R. Carlson. 1990. Assay for the enzymatic conversion of indoleacetic 492
acid to 3-methylindole in a ruminal Lactobacillus species. Appl. Environ. Microbiol. 493
56: 724-729.494
Inoue, H., K. Inagaki, M. Sugimoto, N. Esaki, K. Soda, and H. Tanaka. 1995. Structural 495
analysis of the L-methionine gamma-lyase gene from Pseudomonas putida. J. 496
Biochem. 117: 1120-1125.497
Jensen, B. B., and H. Jørgensen. 1994. Effect of dietary fibre on microbial activity and 498
microbial gas production in various regions of the gastrointestinal tract of pigs. Appl. 499
Environ. Microbiol. 60: 1897-1904.500
Kelly, D. P., A. P. Wood, S. L. Jordan, A. N. Padden, V. M. Gorlenko, and G. A. Dubinina. 501
1994. Biological production and consumption of gaseous organic sulphur compounds. 502
Biochem. Soc. Trans. 22: 1011-1015.503
Kerr, B. J., C. J. Ziemer, S. L. Trabue, J. D. Crouse, and T. B. Parkin. 2006. Manure 504
composition of swine as affected by dietary protein and cellulose concentrations. J. 505
Anim. Sci. 84: 1584-1592.506
Page 20 of 37Journal of Animal Science
by on May 14, 2011. jas.fass.orgDownloaded from

Le, P. D., A. J. A. Aarnink, N. W. M. Ogink, P. M. Becker, and M. W. A. Verstegen. 2005a. 507
Odour from animal production facilities: its relation to diet. Nutr. Res. Rev. 18: 3-30.508
Le, P. D., A. J. A. Aarnink, N. W. M. Ogink, and M. W. A. Verstegen. 2005b. Effects of 509
environmental factors on odor emission from pig manure. Trans. ASAE 48: 757-765.510
Liu, Q., D. S. Bundy, and S. J. Hoff. 1993. Utilizing ammonia concentrations as an odour 511
threshold indicator for swine facilities. In: C. Colins and C. Boon (eds.) IVth 512
International Symposium on Livestock Environment. p 678-685. American Society of 513
Agricultural Engineers, 2950 Niles Rd., St. Joseph, Michigan 49085-9659 USA.514
Mackie, R. I., P. G. Stroot, and V. H. Varel. 1998. Biochemical identification and biological 515
origin of key odour components in livestock waste. J. Anim. Sci. 76: 1331-1342.516
Miner, J. R. 1995. A review of the literature on the nature and control of odors from pork 517
production facilities. Bioresource Engineering Department, Oregon State University, 518
USA.519
O'Neill, D. H., and V. R. A. Phillips. 1992. Review of the control of odour nuisance from 520
livestock buildings: Part 3: Properties of the odorous substances which have been 521
identified in livestock wastes or in the air around them. J. Agri. Eng. Res. 53: 23-50.522
Oldenburg, J. 1989. Geruchs- und Ammoniak- Emissionen aus der Tierhaltung (Gass and 523
Ammonia Emissions from Animal Production). KTBL-Schrift 333, Herausgegeben 524
vom, Kuratorium für Technik und Bauwesen in der Landwirtschaft e.V. 6100 525
Darmstadt-Kranichstein.526
Ren, Y. 1999. Is carbonyl sulfide a precursor for carbon disulfide in vegetation and soil? 527
Interconversion of carbonyl sulfide and carbon disulfide in fresh grain tissues in vitro. 528
J. Agric. Food Chem. 47: 2141-2144.529
Sato, H., T. Seino, T. Kobayashi, A. Murai, and Y. Yugari. 1984. Determination of tryptophan 530
content of feed and feedstuffs by ion exchange liquid chromatography. Agric. Biol. 531
Chem. 48: 2961-2969.532
Page 21 of 37 Journal of Animal Science
by on May 14, 2011. jas.fass.orgDownloaded from

Schaefer, J. 1977. Sampling, characterization and analysis of malodours. Agric. Environ. 3: 533
121-127.534
Schiffman, S. S., J. L. Bennett, and J. H. Raymer. 2001. Quantification of odors and odorants535
from swine operations in North Carolina. Agricult. Forest. Meterol. 108: 213-240.536
Schram, E., S. Moore, and E. W. Bigwood. 1954. Chromatographic determination of cystine 537
as cystic acid. Biochem. J. 57: 33-37.538
Schulte, D. D., D. A. Kottwitz, and C. B. Gilbertson. 1985. Nitrogen content of scraped swine 539
manure. In: J. C. Converse (ed.) Vth International Symposium on Agricultural Waste, 540
Chicago. p 321-328. American Society of Agricultural Engineers, 2950 Niles Rd., St. 541
Joseph, Michigan 49085-9659 USA, Chicago.542
Spoelstra, S. F. 1977. Simple phenols and indoles in anaerobically stored piggery wastes. J. 543
Sci. Food Agric. 28: 415-423.544
Spoelstra, S. F. 1980. Origin of objectionable odorous components in piggery wastes and the 545
possibility of applying indicator components for studying odour development. Agric. 546
Environ. 5: 241-260.547
Sutton, A. L., K. B. Kephart, M. W. A. Verstegen, T. T. Canh, and P. J. Hobbs. 1999. 548
Potential for reduction of odorous compounds in swine manure through diet 549
modification. J. Anim. Sci. 77: 430-439.550
Verdoes, N., and N. W. M. Ogink. 1997. Odour emission from pig houses with low ammonia 551
emission. In: J. A. M. Voermans and G. J. Monteny (eds.) International Symposium on 552
Ammonia and Odour Control from Pig Production Facilities No. I. p 252-317. NVTL, 553
Rosmalen, The Netherlands.554
Williams, A. G. 1984. Indicators of piggery slurry odour offensiveness. Agric. Wastes 10: 15-555
36.556
Page 22 of 37Journal of Animal Science
by on May 14, 2011. jas.fass.orgDownloaded from

Yoshimura, M., Y. Nakano, Y. Yamashita, T. Oho, T. Saito, and T. Koga. 2000. Formation of 557
methyl mercaptan from L-methionine by Porphyromonas gingivalis. Infect. Immun. 558
68: 6912-6916.559
560561562
563
564
565
566
567
568
569
570
571
572
573
574
575
576
577
578
579
580
581
582
583
Page 23 of 37 Journal of Animal Science
by on May 14, 2011. jas.fass.orgDownloaded from

Table 1. Formulation of experimental diets, as-fed basis
Diet1
Composition, (%)NOAA SAA TAA
Wheat 50.00 50.00 50.00
Tapioca meal (starch 62.5 to 65.7%) 13.13 12.12 11.99
Wheat gluten meal 4.00 4.00 4.00
Potato protein 2.53 2.53 2.53
Wheat middings 15.00 15.00 15.00
Palm kernel expeller (crude fiber < 22%) 6.60 6.60 6.60
Cane molasses, < 47.5% sugar 3.00 3.00 3.00
Soybean oil 1.69 1.69 1.69
K2CO3 0.93 0.93 0.93
CaCO3 1.15 1.15 1.15
Monocalcium phosphate·H2O 0.68 0.68 0.68
Salt 0.48 0.48 0.48
Premix 2 0.20 0.20 0.20
L-Lysine HCl 0.45 0.45 0.45
DL-Methionine 0.06 1.07 0.06
L-Threonine 0.09 0.09 0.09
L-Tryptophan 0.01 0.01 0.15
L-Phenylalanine 0.00 0.00 0.60
L-Tyrosine 0.00 0.00 0.40
1 SAA = 3 times requirement of sulfur-containing AA; TAA = 2 times requirement of Trp, and
Tyr + Phe; NOAA = supplementation of these AA up to requirement.
2 The vitamin-mineral premix supplied per kg feed: 7,000 IU vitamin A, 1,700 IU vitamin D3,
Page 24 of 37Journal of Animal Science
by on May 14, 2011. jas.fass.orgDownloaded from

20 IU vitamin E, 1.5 mg vitamin K, 1.5 mg vitamin B1, 4 mg vitamin B2, 11 mg d-pantothenic
acid, 18 mg niacin, 18 µg vitamin B12, 0.1 mg folic acid, 1.0 mg vitamin B6, 100 mg choline
chloride, 75 mg Fe, 10 mg Cu, 65 mg Zn, 30 mg Mn, 0.15 mg Co, 0.75 mg I, 0.30 mg Se
584
Page 25 of 37 Journal of Animal Science
by on May 14, 2011. jas.fass.orgDownloaded from

585
Table 2. Nutrient composition of experimental diets, as-fed basis
Diet1
Composition UnitNOAA SAA TAA
Calculated composition
CP % 15.00 15.57 15.60
Digestible CP % 12.18 12.77 12.80
Ileal digestible CP % 12.17 12.74 12.78
NE kcal/kg 2183 2178 2187
NSP2 % 17.99 17.85 17.83
Digestible NSP % 9.00 8.94 8.93
Illeal digestible amino acids
Lys % 0.74 0.74 0.74
Met % 0.27 1.27 0.27
Cys % 0.23 0.23 0.23
Thr % 0.43 0.43 0.43
Trp % 0.14 0.14 0.28
Phe % 0.59 0.59 1.18
Tyr % 0.40 0.40 0.79
Analyzed composition
DM % 86.11 86.68 86.60
CP (N x 6.25) % 14.81 15.36 15.24
Gross energy kcal/kg 3,804 3,901 3,837
Ash % 5.41 5.55 5.59
Total fat % 2.76 3.81 3.88
Page 26 of 37Journal of Animal Science
by on May 14, 2011. jas.fass.orgDownloaded from

Crude fiber % 3.61 3.68 3.86
Starch % 40.14 39.29 39.64
Sugar % 3.89 4.04 4.12
NSP % 19.09 18.63 18.11
Na % 0.19 0.21 0.22
K % 1.15 1.18 1.16
Sulphate % 0.11 0.11 0.11
Cl % 0.45 0.46 0.44
dEB3 meq/kg 251 263 270
dEBS-a4 meq/kg 227 241 246
Amino acids
Ala % 0.56 0.56 0.58
Arg % 0.71 0.74 0.75
Asp % 0.90 0.91 0.92
Cys % 0.25 0.27 0.27
Glu % 3.45 3.48 3.51
Gly % 0.60 0.60 0.61
His % 0.34 0.35 0.36
Ile % 0.51 0.52 0.52
Leu % 0.98 0.99 1.00
Lys % 0.60 0.75 0.76
Met % 0.24 1.15 0.24
Phe % 0.65 0.66 1.20
Pro % 1.19 1.37 1.30
Ser % 0.64 0.64 0.67
Page 27 of 37 Journal of Animal Science
by on May 14, 2011. jas.fass.orgDownloaded from

Thr % 0.54 0.54 0.54
Trp % 0.19 0.20 0.29
Tyr % 0.48 0.48 0.84
Val % 0.65 0.66 0.67
1 SAA = 3 times requirement of sulfur-containing AA; TAA = 2 times requirement of
Trp, and Tyr + Phe; NOAA = supplementation of these AA up to requirement.
2 Non-starch polysaccharides (NSP) were calculated as organic matter – (CP + crude fat
+ starch + sugar).
3 dEB was determined as mEq = Na + K – Cl.
4 dEBS-a was determined as mEq = Na + K – Cl – 2S. dEBS-a does not take into
account S present in AA.
586
Page 28 of 37Journal of Animal Science
by on May 14, 2011. jas.fass.orgDownloaded from

587
Table 3. Effects of amino acid supplementation to the diet on daily gain, daily feed
intake and feed efficiency
Diet1
ItemNOAA SAA TAA
SEM2 P value
Initial BW, kg 41.4 40.8 41.4 0.4 0.40
Final BW, kg 73.7 73.4 74.4 1.1 0.79
ADFI, kg/ d 1.87 1.87 1.87 0.00 0.30
ADG, g/ d 702 708 716 23 0.91
G:F 0.375 0.379 0.383 0.013 0.90
1 SAA = 3 times requirement of sulfur-containing AA; TAA = 2 times requirement of
Trp, and Tyr + Phe; NOAA = supplementation of these AA up to requirement. Pigs
were fed for 46 d.
2 SEM = Standard errors of means with 6 observations/ treatment.
588
Page 29 of 37 Journal of Animal Science
by on May 14, 2011. jas.fass.orgDownloaded from

589
Table 4. Effects of amino acid supplementation to the diet on odor strength (concentration and intensity)
and offensiveness (hedonic tone) from pig manure. Both arithmetic and geometric means are given. The
statistical analyses were conducted on natural logarithmic scale
Diet1
NOAA SAA TAAItems
GM2 AM3 GM AM GM AM
SEM4
Concentration5, ouE m-3 13,224a 16,423 111,302b 118,369 16,318a 21,234 0.26
Emission, ouE s-1m-2 1.88a 2.33 15.48b 16.50 2.23a 2.99 0.26
Concentration at H6 = -1, ouE m-3 3.19a 3.83 1.57b 1.86 3.56a 3.83 0.12
Concentration at H = -2, ouE m-3 9.39a 11.58 5.70b 6.25 11.36a 13.06 0.16
Concentration at I7 = 1, ouE m-3 0.75a 0.90 0.29b 0.36 0.83a 0.91 0.20
Concentration at I = 2, ouE m-3 1.72a 2.00 0.84b 0.96 1.92a 2.06 0.14
Concentration at I = 4, ouE m-3 9.03a 10.08 6.89b 7.24 10.27a 11.24 0.10
1 SAA = 3 times requirement of sulfur-containing AA; TAA = 2 times requirement of Trp, and Tyr + Phe;
NOAA = supplementation of these AA up to requirement. Pigs were fed for 46 d.2 GM = geometric mean. Geometric mean is the antilog of the arithmetic mean of the logarithms of a set
of values.3 AM = arithmetic mean.4 SEM = Standard errors of means with 6 observations/ treatment. The analyses were conducted on natural
logarithmic scale and SEM is on natural logarithmic scale.5 Odor concentration: Odor concentration was expressed in European odor units per cubic meter air (ouE
m-3). One odor unit is defined as the amount of odor-causing gases which, when diluted in 1 m3 of neutral
gas, can just be distinguished from clean air by 50% of the members of an odor panel (CEN, 2003). 6 Hedonic tone: odor hedonic tone is a measure of the unpleasantness or pleasantness of the perceived
odor. H = -1 = mildly unpleasant, and H = -2 = moderately unpleasant.7 Intensity: odor intensity refers to the magnitude of the odor sensation. I = 1 = no odor, I = 2 = very faint
odor; and I = 4 = distinct odor.a, b Means within rows missing a common superscript letter are different (P < 0.05)
590
Page 30 of 37Journal of Animal Science
by on May 14, 2011. jas.fass.orgDownloaded from

Table 5. Effects of amino acid supplementation to the diet on manure characteristics and ammonia
emission from pig manure. Both arithmetic and geometric means are given. The statistical analyses
were conducted on natural logarithmic scale
Diet1
ItemsNOAA SAA TAA
GM2 AM3 GM AM GM AMSEM4
DM, g/kg 114.0a 114.1 116.4 a 116.9 110.2 a 110.6 0.03
Ash, g/kg 30.5 a 30.5 33.4 a 33.5 29.3 a 29.4 0.02
Total VFA5, g/kg 6.27 a 6.38 4.86 a 5.00 5.53 a 5.65 0.08
Acetic acid, g/kg 4.09 a 4.15 3.23 a 3.30 3.74 a 3.82 0.07
Propionic acid, g/kg 1.37 a 1.40 1.01 a 1.03 1.10 a 1.13 0.09
Butanoic acid, g/kg 0.37 a 0.42 0.21 a 0.23 0.26 a 0.30 0.23
Iso-butanoic acid, g/kg 0.11 a 0.12 0.11 a 0.12 0.11 a 0.12 0.13
Iso-pentanoic acid, g/kg 0.29 a 0.30 0.27 a 0.28 0.28 a 0.28 0.10
Total N, g/kg 6.0a 6.0 6.6b 6.6 6.1a 6.2 0.02
Ammonium-N g/kg 2.60a 2.61 3.13b 3.14 2.86b 2.87 0.03
pH - 7.75 a - 7.65 a - 7.93 a 0.09
Ammonia emission, mg/ s/m2 0.013 a 0.014 0.011 a 0.012 0.015 a 0.015 0.09
Phenol, mg/kg 16.07 a 16.15 16.93 a 17.15 19.75 a 20.50 0.10
Cresols, mg/kg 40.13a 40.93 44.39a 44.82 65.56b 67.32 0.08
4-ethyl phenol, mg/kg 0.85ab 0.89 1.02b 1.17 0.47a 0.40 0.42
Indole, mg/kg 9.22a 9.85 3.39b 3.52 9.68a 9.90 0.47
3-methyl indole, mg/kg 5.12 a 5.22 4.38 a 4.45 5.41 a 5.50 0.09
Carbon disulfide, mg/kg 0.50 a 0.53 0.39 a 0.40 0.42 a 0.47 0.16
Methyl sulfide, mg/kg 1.84a 1.22 2.89ab 2.36 4.39b 3.78 0.21
Ethanethiol, mg/kg 77.71 a 80.0 97.61 a 99.6 80.88 a 82.3 0.88
Page 31 of 37 Journal of Animal Science
by on May 14, 2011. jas.fass.orgDownloaded from

1 SAA = 3 times requirement of sulfur-containing AA; TAA= 2 times requirement of Trp, and Tyr +
Phe; NOAA = supplementation of these AA up to requirement. Pigs were fed for 46 d.2 GM = geometric mean. Geometric mean is the antilog of the arithmetic mean of the logarithms of a
set of values.3 AM = arithmetic mean.4 SEM = Standard errors of means with 6 observations/ treatment. The analyses were conducted on
natural logarithmic scale and SEM is on natural logarithmic scale, except manure pH which was
analyzed on the original scale. 5 Total VFA = acetic acid + propinoic acid + butanoic acid + iso-butanoic acid + iso-pentanoic acid.
a, b Means within rows missing a common superscript letter are different (P < 0.05).
Page 32 of 37Journal of Animal Science
by on May 14, 2011. jas.fass.orgDownloaded from

Figure 1. Schematic view of the odor and ammonia sample collection (1 = odor free air 591
pressurized cylinder, 2 = manure pit, 3 = vessel, 4 = impingers, 5 = critical glass capillary, 6 = 592
rigid plastic container, 7 = odor bag, 8 = vacuum pump)593
594
Figure 2: Hedonic tone (H) as a function of odor concentration with regression lines, SAA = 3 595
times requirement of sulfur-containing AA; TAA = 2 times requirement of Trp and Tyr + Phe; 596
NOAA = supplementation of these AA up to requirement. HSAA = -0.62 (0.12) – 0.78 (0.04) ln 597
(odor concentration), indicated by ………▲; HTAA = -0.10 (0.12) – 0.78 (0.04) ln (odor 598
concentration), indicated by _____■; HNOAA = -0.27 (0.11) – 0.78 (0.004) ln (odor 599
concentration), indicated by ___ ___ ●; R2 = 0.66600
601
Figure 3: Odor intensity (I) as a function of odor concentration with regression lines, SAA = 3 602
times requirement of sulfur-containing AA; TAA = 2 times requirement of Trp, and Tyr + 603
Phe; NOAA = supplementation of these AA up to requirement. ISAA = 2.04 (0.13) + 0.99 604
(0.05) ln (odor concentration), indicated by ………▲; ITAA = 1.66 (0.13) + 0.99 (0.05) ln 605
(odor concentration), indicated by _____■; INOAA = 1.78 (0.13) + 0.99 (0.005) ln (odor 606
concentration), indicated by ___ ___ ●; R2 = 0.71607
608
Figure 4: Hedonic tone (H) as a function of odor intensity (I) with regression lines, SAA = 3 609
times requirement of sulfur-containing AA; TAA = 2 times requirement of Trp, and Tyr + 610
Phe; NOAA = supplementation of these AA up to requirement. HSAA = 0.94 (0.09) – 0.77 611
(0.02) I, indicated by ………▲; HTAA = 1.16 (0.09) – 0.77(0.02) I, indicated by _____■; 612
HNOAA = 1.09 (0.09) – 0.77(0.02) I, indicated by ___ ___ ●; R2 = 0.89613
614
615
616
Page 33 of 37 Journal of Animal Science
by on May 14, 2011. jas.fass.orgDownloaded from

Figure 1.617
618
619
620
Page 34 of 37Journal of Animal Science
by on May 14, 2011. jas.fass.orgDownloaded from

Figure 2.621
-4
-3
-2
-1
0
0 1 2 3 4
ln (odor concentration)
Hed
onic
tone SAA
TAA
NOAA
622
623
Page 35 of 37 Journal of Animal Science
by on May 14, 2011. jas.fass.orgDownloaded from

Figure 3.624
0
1
2
3
4
5
6
7
0 1 2 3 4ln (odor concentration)
Inte
nsity
SAA
NOAA
TAA
625
Page 36 of 37Journal of Animal Science
by on May 14, 2011. jas.fass.orgDownloaded from

Figure 4.626
-4
-3
-2
-1
0
1 2 3 4 5 6Intensity
Hed
onic
tone
NOAA
TAA
SAA
627
628
629
630
Page 37 of 37 Journal of Animal Science
by on May 14, 2011. jas.fass.orgDownloaded from

Citations http://jas.fass.org#otherarticles
This article has been cited by 1 HighWire-hosted articles:
by on May 14, 2011. jas.fass.orgDownloaded from