Effects of attraction strength on microchannel flow of colloid–polymer depletion mixtures
9
Effects of attraction strength on microchannel flow of colloid–polymer depletion mixtures† Rahul Pandey a and Jacinta C. Conrad * ab Received 21st April 2012, Accepted 5th July 2012 DOI: 10.1039/c2sm25935d We investigated the effect of the strength of the interparticle attraction on the flow properties and microstructure of colloid–polymer depletion mixtures during microchannel flow. When the strength of the interparticle attraction is increased, the additional elasticity imparted by the formation of interparticle bonds does not modify the magnitude of the flow velocities downstream, but instead leads to changes in the flow profiles near the edges of the microchannel that reflect yielding at the weak bonds between clusters. As a result, increasing the strength of attraction increases the resistance of the suspension to densification and to shear-induced migration. Introduction Adding an interparticle attraction to colloidal particles modifies the bulk rheological properties of the resulting suspension. When particles interact only via a hard-sphere or repulsive interaction, the viscosity of the suspension increases with increasing shear rate (‘‘shear thickening’’). 1–3 As the strength of the interparticle attraction is increased, the formation of bonds between particles reduces the extent of shear thickening. 4 When the strength of the interparticle attraction 5–7 or the volume fraction 8 become suffi- ciently large, the suspension undergoes a fluid-to-solid transition that is driven by the formation of an interconnected network of particles. 9 In non-dilute suspensions (typically when the volume fraction of particles f > 0.1) the network is composed of dense nonfractal clusters of particles 10 whose structure and size depend upon the strength and range of the attraction. 11 Breaking the relatively weak bonds between clusters leads to yielding of the network 12 and hence to flow, 60,61 and thus the clusters control the macroscopic mechanical properties of the suspension. 13,14 In contrast to the bulk rheology of suspensions, which has been extensively reviewed, 15–18 the rheological properties of suspensions confined in one or more dimensions have received comparatively little attention. Nonetheless, understanding how confinement modifies flow properties is paramount for applica- tions that exploit flows of attractive micro- and nanoparticle suspensions in confined geometries. For example, inkjet printing 19,20 and direct ink-writing 21 of metallic nanocolloidal suspensions enable rapid deposition of conductive microscale wires; semisolid flow batteries 22 use conductive colloidal suspensions as flowable electrodes; and the thermal conductivity of nanofluids used as coolants increases with agglomeration. 23,24 As these suspensions are flowed through increasingly fine geometries, the presence of nearby walls and surfaces induces frictional interactions and wall slip 25,26 that lead to non-uniform flows and clogging. 27 Reducing the feature sizes for these appli- cations while maintaining the particle connectivity required for conductivity requires tuning the interparticle interactions to minimize clogging and jamming. In turn, this goal requires investigations that correlate microstructure to flow properties of attractive suspensions in confined geometries. However, mate- rials traditionally used as confining geometries, such as packings of spherical beads, 28,29 exhibit locally disordered structures that complicate both measurement and interpretation of the flow properties on the microscale. In addition, such materials are often opaque, which precludes direct imaging and visualization of the microstructure of the suspension. Microfluidics 30 offers a convenient platform that circumvents the limitations on studies of confined flow imposed by traditional materials. Enabled by advances in microfabrication, well- controlled geometries can be assembled from glass capillaries 31 or fabricated from elastomers using soft lithography. 32 In these transparent geometries, the structure of particles can be directly visualized using optical 33 or confocal 34 microscopy. Indeed, microfluidic techniques have been extensively applied to study the flow properties of concentrated suspensions in which the particles interact via hard-sphere or repulsive interactions. For example, microchannel flows have enabled investigations of shear-induced migration in both monodisperse 35 and bidisperse 36 suspensions, and of intermittent flows in glassy suspensions in which the formation of bridges between particles 37,38 leads to self-constriction. 39 The latter flows are reminiscent of those observed in constricted geometries, 40 in which walls can induce changes in the local ordering of particles. Finally, the local velocity profiles have been quantitatively corre- lated to the rheological properties of the suspension. 41 a Department of Chemical & Biomolecular Engineering, University of Houston, Houston, Texas, USA. E-mail: [email protected] b Petroleum Engineering Program, University of Houston, Houston, Texas, USA † Electronic supplementary information (ESI) available. See DOI: 10.1039/c2sm25935d This journal is ª The Royal Society of Chemistry 2012 Soft Matter , 2012, 8, 10695–10703 | 10695 Dynamic Article Links C < Soft Matter Cite this: Soft Matter , 2012, 8, 10695 www.rsc.org/softmatter PAPER Downloaded by University of Houston on 04 October 2012 Published on 19 July 2012 on http://pubs.rsc.org | doi:10.1039/C2SM25935D View Online / Journal Homepage / Table of Contents for this issue
-
Upload
independent -
Category
Documents
-
view
1 -
download
0
Transcript of Effects of attraction strength on microchannel flow of colloid–polymer depletion mixtures
Dynamic Article LinksC<Soft Matter
Cite this: Soft Matter, 2012, 8, 10695
www.rsc.org/softmatter PAPER
Dow
nloa
ded
by U
nive
rsity
of
Hou
ston
on
04 O
ctob
er 2
012
Publ
ishe
d on
19
July
201
2 on
http
://pu
bs.r
sc.o
rg |
doi:1
0.10
39/C
2SM
2593
5DView Online / Journal Homepage / Table of Contents for this issue
Effects of attraction strength on microchannel flow of colloid–polymerdepletion mixtures†
Rahul Pandeya and Jacinta C. Conrad*ab
Received 21st April 2012, Accepted 5th July 2012
DOI: 10.1039/c2sm25935d
We investigated the effect of the strength of the interparticle attraction on the flow properties and
microstructure of colloid–polymer depletion mixtures during microchannel flow. When the strength of
the interparticle attraction is increased, the additional elasticity imparted by the formation of
interparticle bonds does not modify the magnitude of the flow velocities downstream, but instead leads
to changes in the flow profiles near the edges of the microchannel that reflect yielding at the weak bonds
between clusters. As a result, increasing the strength of attraction increases the resistance of the
suspension to densification and to shear-induced migration.
Introduction
Adding an interparticle attraction to colloidal particles modifies
the bulk rheological properties of the resulting suspension. When
particles interact only via a hard-sphere or repulsive interaction,
the viscosity of the suspension increases with increasing shear
rate (‘‘shear thickening’’).1–3 As the strength of the interparticle
attraction is increased, the formation of bonds between particles
reduces the extent of shear thickening.4 When the strength of the
interparticle attraction5–7 or the volume fraction8 become suffi-
ciently large, the suspension undergoes a fluid-to-solid transition
that is driven by the formation of an interconnected network of
particles.9 In non-dilute suspensions (typically when the volume
fraction of particles f > 0.1) the network is composed of dense
nonfractal clusters of particles10 whose structure and size depend
upon the strength and range of the attraction.11 Breaking the
relatively weak bonds between clusters leads to yielding of the
network12 and hence to flow,60,61 and thus the clusters control the
macroscopic mechanical properties of the suspension.13,14
In contrast to the bulk rheology of suspensions, which has
been extensively reviewed,15–18 the rheological properties of
suspensions confined in one or more dimensions have received
comparatively little attention. Nonetheless, understanding how
confinement modifies flow properties is paramount for applica-
tions that exploit flows of attractive micro- and nanoparticle
suspensions in confined geometries. For example, inkjet
printing19,20 and direct ink-writing21 of metallic nanocolloidal
suspensions enable rapid deposition of conductive microscale
wires; semisolid flow batteries22 use conductive colloidal
aDepartment of Chemical & Biomolecular Engineering, University ofHouston, Houston, Texas, USA. E-mail: [email protected] Engineering Program, University of Houston, Houston, Texas,USA
† Electronic supplementary information (ESI) available. See DOI:10.1039/c2sm25935d
This journal is ª The Royal Society of Chemistry 2012
suspensions as flowable electrodes; and the thermal conductivity
of nanofluids used as coolants increases with agglomeration.23,24
As these suspensions are flowed through increasingly fine
geometries, the presence of nearby walls and surfaces induces
frictional interactions and wall slip25,26 that lead to non-uniform
flows and clogging.27 Reducing the feature sizes for these appli-
cations while maintaining the particle connectivity required for
conductivity requires tuning the interparticle interactions to
minimize clogging and jamming. In turn, this goal requires
investigations that correlate microstructure to flow properties of
attractive suspensions in confined geometries. However, mate-
rials traditionally used as confining geometries, such as packings
of spherical beads,28,29 exhibit locally disordered structures that
complicate both measurement and interpretation of the flow
properties on the microscale. In addition, such materials are
often opaque, which precludes direct imaging and visualization
of the microstructure of the suspension.
Microfluidics30offers a convenient platform that circumvents the
limitations on studies of confined flow imposed by traditional
materials. Enabled by advances in microfabrication, well-
controlled geometries can be assembled from glass capillaries31 or
fabricated from elastomers using soft lithography.32 In these
transparent geometries, the structure of particles can be directly
visualized using optical33 or confocal34 microscopy. Indeed,
microfluidic techniques have been extensively applied to study the
flow properties of concentrated suspensions in which the particles
interact via hard-sphere or repulsive interactions. For example,
microchannel flows have enabled investigations of shear-induced
migration inbothmonodisperse35andbidisperse36 suspensions, and
of intermittent flows inglassy suspensions inwhich the formationof
bridges between particles37,38 leads to self-constriction.39 The latter
flows are reminiscent of those observed in constricted geometries,40
in which walls can induce changes in the local ordering of particles.
Finally, the local velocity profiles have been quantitatively corre-
lated to the rheological properties of the suspension.41
Soft Matter, 2012, 8, 10695–10703 | 10695

Dow
nloa
ded
by U
nive
rsity
of
Hou
ston
on
04 O
ctob
er 2
012
Publ
ishe
d on
19
July
201
2 on
http
://pu
bs.r
sc.o
rg |
doi:1
0.10
39/C
2SM
2593
5D
View Online
In attractive suspensions, interactions between particles and
between particles and walls must modify the confined flow
properties. For example, colloidal suspensions with a strong and
short-ranged hydrophobic attraction flowing in microchannels
exhibited plug-like velocity profiles, in which the velocity at the
center of the channel was nearly constant.42 Similarly, the
velocity profiles of polyelectrolyte-bridged colloidal gels in
microchannels exhibited a transition from plug-like to fluid-
like43,44 as the flow rate was increased. The shear rate at the plug-
to-fluid transition coincided with that for yielding of the bonds
between particles, as determined by bulk rheological measure-
ments.43 However, the attractive suspensions in these studies
have limited applicability as models because of the poor control
over the effective attractions afforded by these mechanisms of
gelation. General insight into the relationship between micro-
structure and confined flow properties in attractive colloidal
suspensions thus requires investigations in which the strength of
the interparticle attraction can be carefully controlled.
Here, we use microfluidics to investigate the effects of attrac-
tion on the structure of colloidal particles during confined flow.
Using confocal microscopy, we image the flow of colloid–poly-
mer depletion mixtures, which serve as models for a variety of
attractive suspensions, during microchannel flow. By changing
the concentration of the depletant polymer, we controllably tune
the strength of the interparticle attraction. The bulk viscosity of
suspensions with either a weak or a strong interparticle attraction
decreases with increasing shear rate, typical of weak viscoelastic
fluids. However, we find that the strength of attraction modifies
the extent of consolidation during microchannel flow. We
measure both velocity and density profiles at multiple positions
along the microchannel and show that the elasticity imparted by
strong attractions suppresses both densification and shear-
induced migration. Our results provide new insight into how
interparticle attractions modify the structure of suspensions
during confined flow in two technologically relevant limits of the
strength of attraction.
Experimental methods
Sample preparation
To create suspensions with controlled interparticle attractions,
we synthesized nearly hard-sphere45 poly(methylmethacrylate)
(PMMA) colloidal particles that are stabilized by short poly-
(12-hydroxysteric acid) (PHSA) polymers.46 During synthesis the
particles were fluorescently labeled with Nile red, which is excited
by light of wavelength l¼ 561 nm. After synthesis, we repeatedly
washed the particles in decahydronaphthalene (DHN) to remove
any excess dye that is not incorporated into the particles. The
diameter of our particles was 2a ¼ 1.546 mm and the poly-
dispersity was 0.0488, as measured using dynamic light scattering
(Brookhaven Instruments, BI-APD). The particles were sus-
pended in a solvent mixture of cyclohexyl bromide (CXB) and
DHN (75.7% and 24.3% by weight, respectively) that very nearly
matches both their density (r z 1.22 g mL�1) and their index of
refraction (nz 1.49). We further minimized the effects of gravity
by adding CXB or DHN dropwise (10 mL) to all samples (6 mL)
and confirmed that the particles remained in suspension after
centrifugation at 800g and 25 �C for 1.25 h; this protocol ensured
10696 | Soft Matter, 2012, 8, 10695–10703
that the buoyancy mismatch between the particles and the
solvent was Dr < 1.4 � 10�3 mg mL�1 at the temperature at
which experiments were performed, 24.7 � 0.7 �C. To mitigate
the slight electrostatic repulsion between the particles in these
solvents, we added 1.5 mM of an organic salt, tetrabutyl-
(ammonium chloride) (TBAC),47 which partially screened the
charges on the particles. To induce an attraction of controlled
range and strength between the particles, we added non-
adsorbing linear polystyrene (PS) of molecular weight Mw ¼295 800 kDa (Bangs Labs). The radius of gyration of the polymer
in the solvent mixture was Rg z 15 nm (ref. 48) and the overlap
concentration was cp* ¼ 3Mw/4pRg3NA z 35 mg mL�1. The
polymer concentration sets the strength of attraction
U(r) ¼ �PpVo (for 2a < r < 2a + 2Rg), where Vo is the over-
lapping volume of the depletion zone between two particles and
the osmotic pressure Pp f n(R)p is linearly proportional to the
number density of polymers in the free volume.49 Here we held
constant the volume fraction of the colloidal particles (fz 0.15)
and varied the strength of attraction by changing the concen-
tration of polymer cp. We investigated two suspensions: one in
which the particles interact via a weak attraction (f ¼ 0.155 and
cp¼ 5 mgmL�1,U� O (1 kT)) and one with a strong interparticle
attraction (f ¼ 0.150 and cp ¼ 25 mg mL�1, U � O (10 kT)).
These two limits model the strengths of the interparticle attrac-
tion in flowable electrolytes22 and in ink feedstocks,21 respec-
tively, allowing us to investigate the relationship between
microstructure and confined flow properties in a range of tech-
nologically relevant conditions.
Bulk rheology
To determine the relationship between viscosity and shear rate,
we measured the nonlinear flow curves for our suspensions using
a controlled-stress rheometer (Anton-Paar, MCR302) equipped
with a double-wall Couette geometry (DG26.7) to maximize the
accessible range of torques. The bob length of this geometry is
40 mm and the gap width is 0.42 mm. Prior to measurements,
samples were sheared at a steady shear rate of 300 s�1 for 60 s to
remove any shear history and allowed to age for 5 min. We
measured the apparent viscosity of the suspension h and the
shear stress s as a function of the shear rate over the range of
10�3 to 103 s�1, which includes the shear rates experienced by the
suspensions during microchannel flow.
Microchannel flow experiment
We acquired images of the colloidal suspensions during flow using
confocalmicroscopy.Our setup consists of aVT-Eye line-scanning
confocal scanhead (Visitech, Sunderland, U.K.) that is mounted
onan invertedLeicaDMR-4000microscope equippedwitha100�oil-immersion objective (NA ¼ 1.40). We fabricated a simple
microfluidic device in which to investigate the confined flow
properties of our suspensions, as shown in the schematic in Fig. 1.
A glass microcapillary of square inner cross-section (side length
L¼ 100 mm) and length 5 cm (Vitrocom,MountainLakes,NJ) was
attached to Teflon tubing of length 160mm (26AWG, 0.016 in ID
� 0.003 in wall, Zeus PTFE Sublite wall tubing, SmallParts.com)
on both ends. One end of the tubing was connected to a syringe
pump (Micromate, Cadence Science, Staunton, VA) that operates
This journal is ª The Royal Society of Chemistry 2012

Dow
nloa
ded
by U
nive
rsity
of
Hou
ston
on
04 O
ctob
er 2
012
Publ
ishe
d on
19
July
201
2 on
http
://pu
bs.r
sc.o
rg |
doi:1
0.10
39/C
2SM
2593
5D
View Online
at constant displacement. For these experiments, we varied the
volumetric flow rate between 8 and 30 mL h�1, which yielded
velocities of the order of magnitude of 100 mm s�1 in the micro-
channel; wewere unable to achieve steady flowat lower volumetric
flow rates, as the suspensions repeatedly clogged and jammed the
microchannel. The high velocities of the particles precluded full
three-dimensional imaging of individual colloids during flow.
Instead, we acquired sequential two-dimensional movies of 500
images at a frame rate of 32 frames per second at ten different
heights in the sample (z¼ 5 to 50 mm above the bottom surface of
the microchannel, corresponding to z/L ¼ 0.05–0.5 channel
diameters) in the sample. This protocol allowed us to simulta-
neously measure the velocity profiles, using image correlation
algorithms, and locate the particle positions, using particle-
tracking algorithms.We acquiredmovies at different positionsx¼5 mm to x ¼ 20 mm downstream along the microchannel, corre-
sponding to x/L ¼ 50–200 channel diameters downstream.
Image analysis
To obtain information about the spatial arrangement of particles
during flow, we used standard algorithms50 implemented in
Matlab51 (MathWorks, Natick, MA) to locate the centroids of
the particles in two dimensions. The resolution of the centroid
finding algorithm for our particles was 40 nm, as determined
from the y-intercept of a plot of the mean-square displacement as
a function of time measured for a quiescent sample. To determine
the number density of particles, we first located the particles in
each image of each movie and then calculated the average
number of particles in horizontal slices of constant height
(constant y as indicated in the schematic in Fig. 1). We report the
mean and standard deviation of the resulting histogram as the
number of particles. We converted the number of particles into a
volume fraction following the protocol of Semwogerere et al.35
We measured the number density at ten fixed heights separated
by a constant spacing Dz ¼ 5 mm, which is greater than the
diameter of the particles. We therefore estimated the bulk volume
fraction as
fbulk ¼
�N
�2a
Dz
�4
3pa3
LxLyLz
(1)
Fig. 1 Schematic of device for microchannel flow experiments, which
consists of a glass microcapillary that is attached to a syringe pump using
Teflon tubing. The schematic as shown is inverted compared to the
experimental setup, which uses an inverted microscope. The coordinate
system is indicated: x is oriented along the direction of flow, y is oriented
along the width of the microchannel, and z is oriented along the vertical
direction.
This journal is ª The Royal Society of Chemistry 2012
where Lx and Ly are the length and width of each image slice and
Lz ¼ nslicesDz is the total height of the image stack. This method
of estimating fbulk was previously reported to agree with the bulk
volume fraction within an error of 5% when compared to that
obtained by full 3-D tracking.35
The colloidal particles in our experiments typically moved
distances that were greater than the interparticle separation
between consecutive frames, and thus standard algorithms for
tracking the positions of the particles could not be used to obtain
the advection velocities. Instead, the advection velocity across
the microchannel was calculated using image correlation algo-
rithms (reviewed in ref. 52) that we implemented in Matlab.
Briefly, we subdivided our image into horizontal slices of
constant height (y) along the direction of flow (x). For two
sequential images I1(x,y) and I2(x,y) we first shifted the latter
image by a factor Dx and then calculated the cross-covariance
between I1(x,y) and I2(x + Dx,y). For each horizontal slice we
determined the shift factor Dx that maximized the cross-covari-
ance between the pair of images, and confirmed that the flow was
steady by measuring the slope of the shift factors over time. We
then calculated the histogram of Dx obtained for all pairs of
consecutive images in a microscopy movie. This histogram
typically exhibited a strongly peaked maximum at a particular
value of the shift factor Dx. We therefore report the mean and
standard deviation of this distribution as the advection velocity
and associated error at each lateral position y.
Results and discussion
We characterize the bulkmechanical properties of suspensions at a
constant volume fraction f ¼ 0.15 by measuring the apparent
viscosity h and shear stress s as a function of the shear rate _g.
Suspensionswith a low concentrationofpolymer (cp¼ 5mgmL�1)
exhibit shear-thinning rheology, as shown by the circles in Fig. 2.
The viscosity decreases with increasing shear rate until it reaches a
final plateau at a shear rate _g z 1; as _g is further increased, the
viscosity remains nearly constant over three orders of magnitude
in shear rate.When the concentrationof the polymer is increased to
cp ¼ 25 mg mL�1 the viscosity of the suspension increases at all
Fig. 2 Viscosity as a function of shear rate for attractive colloidal
suspensions with cp¼ 5 (circles, weak attraction) and 25 (triangles, strong
attraction) mg mL�1. Inset: shear stress versus shear rate; the dashed lines
indicate fits to the Herschel–Bulkley model.53
Soft Matter, 2012, 8, 10695–10703 | 10697

Dow
nloa
ded
by U
nive
rsity
of
Hou
ston
on
04 O
ctob
er 2
012
Publ
ishe
d on
19
July
201
2 on
http
://pu
bs.r
sc.o
rg |
doi:1
0.10
39/C
2SM
2593
5D
View Online
shear rates, as shown by the triangles in Fig. 2, and the shear rate at
which the final Newtonian plateau is reached increases to _gz 10.
At low shear rates, the stress appears to reach a plateau and then
decreases further at the lowest shear rates, indicating that the
suspension undergoes slip.26 We fit the rheological data for both
samples using the Herschel–Bulkley model,53 in which the shear
stress as a functionof the shear rate is given bys¼ sy + k _gn; heresyis the yield stress, k is the consistency index, and n is the shear-
thinning exponent. For the strongly attractive suspension (cp ¼25 mg mL�1) we obtain sy ¼ 3.7 � 10�2 Pa, k ¼ 0.039 Pa s, and
n¼ 0.91; for theweakly attractive suspension (cp¼ 5mgmL�1), we
obtain sy ¼ 6.1� 10�4 Pa, k¼ 7.0� 10�3 Pa s, and nz 0.97. We
note that for the maximum estimated gravitational mismatch
between the solvent mixture and the particles (Dr < 1.4� 10�3 mg
mL�1), the gravitational stress over the diameter of the micro-
capillary used in the flow experiments (Dz z 100 mm), estimated
from Darcy’s law at short times,54 is sz DrgfDzz 2 � 10�4 Pa.
Themagnitude of the gravitational stress is comparable to the yield
stress for the weakly attractive suspension, suggesting that struc-
tures in this suspension cannot withstand even the weak gravita-
tional stresses. The bulk rheologymeasurements thus indicate that
the particles in the strongly attractive suspension form an inter-
connectednetwork that yields athigh stresses,whereas the particles
in the weakly attractive suspension are dispersed.
We confirm these structural predictions from the bulk rheo-
logical measurements by directly imaging the colloidal suspen-
sions in quiescent conditions and during flow in microchannels
using confocal microscopy. Representative micrographs show
that increasing the strength of attraction dramatically modifies
the microstructure of the suspension, as shown in Fig. 3. For the
weakly attractive suspension (Fig. 3(b–d)) flowing at a volu-
metric flow rate of 8 mL h�1, the particles are distributed nearly
Fig. 3 Confocal micrographs of colloidal suspensions with polymer concent
show the quiescent sample; images (b–d) and (f–h) were acquired during flow a
the bottom surface of the microchannel. The edge of the channel is at the left
vertical direction. The scale bar is 10 mm.
10698 | Soft Matter, 2012, 8, 10695–10703
isotropically throughout the channel. By contrast, the strongly
attractive suspension (Fig. 3(f–h)) contains distinct clusters that
are formed when the flow-induced stresses disrupt the gel
network (Fig. 3(e)). We predict that these distinct microstruc-
tures will affect both the flow profiles and the distribution of
particles during microchannel flow.
As a simple demonstration of this prediction, we show that the
strength of the interparticle attraction affects the bulk densification
of our suspensions during microchannel flow. We calculate the
volume fraction at different positions along the channel by first
counting the number of particles in eachmovie and then correcting
for undersampling using eqn (1),35 and report the bulk volume
fraction f normalized by that at the channel entrance, fent.
The colloidal suspension with a weak interparticle attraction (cp ¼5 mg mL�1) densifies as it flows through the microchannel, as
shown in Fig. 4. As the suspension travels from x/L ¼ 50 to 200
channel diameters downstream, the normalized volume fraction
f/fent increases with x/L during flow at a volumetric rate of either
8 mL h�1 (as indicated by the open circles) or 10 mL h�1 (open
triangles). This behavior is in contrast to that observed for dense
suspensions near the colloidal glass transition (f � 0.5), which
dilate during constricted flow and hence becomemore dilute due to
self-filtration.37,38,55 Increasing the strength of attraction suppresses
the consolidation: for a suspension with cp ¼ 25 mg mL�1 (closed
circles), the volume fraction increases slightly after entering the
channel (x/L ¼ 50–80) and then remains nearly constant as the
distance downstream is further increased. These differences in
densification during microchannel flow must result from the
coupling between the local flow profiles and the microstructure of
the suspensions, which in turn reflects differences in the strength of
the interparticle attraction. To capture these differences, we
measure the velocity and local density profiles for each suspension.
ration cp of (a–d) 5 mg mL�1 and (e–h) 25 mg mL�1. Images (a) and (e)
t a height (z) of (b and f) 5 mm, (c and g) 25 mm, and (d and h) 50 mm above
-hand side of each image in (b–d) and (f–h), and flow is in the downward
This journal is ª The Royal Society of Chemistry 2012
Fig. 4 Normalized bulk volume fraction f/fent as a function of the
normalized distance downstream in the microchannel, x/L, for suspen-
sions with fz 0.15 and cp ¼ 5 mg mL�1 (open symbols) or 25 mg mL�1
(closed symbols) flowing at a volumetric rate of 8 (triangles) or 10 (circles)
mL h�1 in a microcapillary with inner diameter 100 mm.
Fig. 5 Normalized velocity profiles as a function of normalized lateral
position across the microchannel y/L for the suspension with a weak
interparticle attraction (volume fraction f ¼ 0.155 and cp ¼ 5 mg mL�1)
flowing at a volumetric rate 8 mL h�1. The downstream position x/L was
(a) 50 or (b) 200. From top to bottom in each panel, velocity profiles were
measured at normalized distances above the bottom surface z/L ¼ 0.05,
0.10, 0.20, and 0.50. The dotted lines indicate fits to the Newtonian flow
profile (eqn (2)).
Fig. 6 Shear zone width normalized by L as a function of normalized
vertical position across the microchannel z/L for suspension with volume
fraction f ¼ 0.15 and cp ¼ 5 mg mL�1, acquired at flow rates of 8 mL h�1
(triangles) and 10 mL h�1 (circles). Filled and open symbols respectively
indicate measurements taken at downstream position x/L ¼ 50 and 200,
respectively.
Dow
nloa
ded
by U
nive
rsity
of
Hou
ston
on
04 O
ctob
er 2
012
Publ
ishe
d on
19
July
201
2 on
http
://pu
bs.r
sc.o
rg |
doi:1
0.10
39/C
2SM
2593
5D
View Online
Weak attraction: shear-induced migration and consolidation
We use image correlation algorithms to obtain the velocity of a
suspension of weakly attractive particles (cp ¼ 5 mg mL�1) as a
function of the lateral distance (y/L) across the microchannel
during flow, shown in a representative movie (Movie S1) in ESI.†
We normalize the measured advection velocity profiles by the
maximum velocity at the midplane of the channel and compare
to the velocity profiles expected for a Newtonian fluid flowing in
a square microchannel,56
Uðy; zÞUmax
¼X
k¼1;3;5:::
ð�1Þðk�1Þ=2�1� cosh ðkpz=LÞ
cosh ðkpz=2LÞ�
cos ðkpy=2LÞk3
(2)
in which z is the distance from the midplane of the microchannel,
L is the width of the channel, h is the microchannel height, and y
is the lateral position across the microchannel measured from the
center. We find that the velocity profiles of the weakly attractive
particles are consistent with Newtonian flow in a microchannel,
as shown in Fig. 5; the dashed lines in the figures indicate fits of
the normalized velocity profile to eqn (2). Within the errors of the
measurement, we observe minimal evolution in the velocity
profiles at different downstream positions, as shown for posi-
tions x/L ¼ 50 and 200 and a volumetric flow rate of 8 mL h�1. In
particular, the maximum value of the velocity in the channel,
vmax z 200 mm s�1, does not change within experimental error
between positions x/L ¼ 50 and x/L ¼ 200. We obtain similar
results for a slightly larger volumetric flow rate of 10 mL h�1.
We further confirm that the flow behavior of this suspension is
consistent with Newtonian flow at these flow rates by estimating
the shear-zone width of the velocity profiles, defined as the
distance from the wall at which the advection velocity is equal to
0.95vmax, where vmax(h) is the maximum advection velocity at a
height h above the bottom surface of the microchannel.42 From
the velocity profiles, we estimate that the shear-zone width
ofz0.80L is nearly constant across the flow rates probed close to
the entrance of the microchannel (x/L ¼ 50), as shown in Fig. 6.
This value is close to the theoretical values calculated for New-
tonian flow in a square microchannel,56 which range from
This journal is ª The Royal Society of Chemistry 2012
z0.75L near the midplane of the microchannel to z0.8L near
the walls; we speculate that the slight increase in shear zone width
observed in the experiment may result from the small interpar-
ticle attraction induced by the polymers, which reduces the
interparticle repulsion and allows the particles to more readily
move past each other. However, at a downstream distance of
x/L ¼ 200, the shear-zone width abruptly decreases to z0.65
near the midplane of the channel (for a flow rate of 8 mL h�1)
or z0.72 (for a flow rate of 10 mL h�1). In earlier experimental
and modeling studies of the microchannel flow of hard-sphere
suspensions, particles migrated in the shear gradient towards the
center of the microchannel; the resultant increase in local density
there reduced the local shear rate and led to a slight blunting of
the flow profiles.35We therefore suggest that the decrease in shear
zone width observed downstream in our experiments similarly
Soft Matter, 2012, 8, 10695–10703 | 10699

Dow
nloa
ded
by U
nive
rsity
of
Hou
ston
on
04 O
ctob
er 2
012
Publ
ishe
d on
19
July
201
2 on
http
://pu
bs.r
sc.o
rg |
doi:1
0.10
39/C
2SM
2593
5D
View Online
indicates an increase in the local concentration of particles due to
shear-induced migration.
The P�eclet number Pe ¼ (a2/D)/(1/ _g) is the ratio of the time-
scale for a particle to diffuse its diameter a2/D to the convection
timescale 1/ _g and thus measures the relative importance of
thermal and shear-driven motion. Particles in the weakly
attractive suspension freely diffuse in a quiescent sample, as
measured by the single-particle mean-square displacement.57 We
therefore estimate the free diffusion coefficient for the particles as
D ¼ kBT/6pha using the viscosity h of a polymer solution at
concentration cp ¼ 5 mg mL�1, hz 0.006 Pa s. For a volumetric
flow rate of 8 mL h�1, the shear rate across the microchannel is
_g z Vmax/(L/2) z 4 s�1 (using a maximum velocity Vmax z200 mm s�1 from Fig. 5). This value of the shear rate is firmly
within the high-shear plateau region of the flow curve shown in
Fig. 2. Finally, we estimate Pe¼ 6pha3 _g/kBTz 50. The previous
work of Semwogerere et al.35 on the shear-induced migration of
hard-sphere colloids predicts that the entrance length at Pez 50
is quite short, of order O (100)L; we assume that the interparticle
attraction is sufficiently small so that the earlier results on nearly
hard-spheres can be applied to our system.
We directly determine the extent of shear-induced migration
by measuring the distribution of particles across the channel (as a
function of the normalized lateral distance y/L) at different
heights (z/L) during flow. The number of particles increases
towards the center of the channel, shown for density profiles
acquired at two different downstream distances (x/L ¼ 50 and
200) for a flow rate of 10 mL h�1 in Fig. 7, and is consistent
with shear-induced migration. Close to the entrance of the
channel (x/L ¼ 50), the increase in particle number from the
lateral edge to the center of the channel is most pronounced near
the midplane of the microchannel, where particles are especially
depleted near the walls of the channel: at z/L ¼ 0.50, the slope of
the density profile is 0.34 particles per mm, whereas at the bottom
of the channel (z/L ¼ 0.05) the slope is 0.04 particles per mm.
Comparison of the density profiles at x/L indicates that that the
number of particles increases downstream at every position
Fig. 7 Number of particles as a function of normalized lateral position
across the microchannel y/L for suspension with volume fraction f¼ 0.15
and cp ¼ 5 mg mL�1 flowing at 10 mL h�1, acquired at downstream
position x/L¼ (a) 50 and (b) 200, for three normalized heights z/L¼ 0.05
(O), 0.30 (B), 0.50 (8). The lines shown are guides to the eye.
10700 | Soft Matter, 2012, 8, 10695–10703
across the microchannel (y/L), and the slopes of the density
profiles are comparable at both positions: for example, the slopes
at x/L ¼ 200 and z/L ¼ 0.05 and 0.50 are 0.06 and 0.22 particles
per mm, respectively. Similar results are obtained at flow rates of
8 and 15 mL h�1. Very local measurements of density, obtained
by averaging the fluorescence intensity of the images at constant
lateral distance across the microchannel (y/L) over time and
along the direction of flow, reveal well-defined and periodic local
maxima near walls consistent with the formation of layers of
particles (as shown for representative data in Fig. S3 in ESI†). By
counting the number of distinct maxima in the average intensity
for the ten different heights at which we acquire movies, we
find that 3–6 layers form near the lateral wall at a flow rate of
8 mL h�1 and 2–9 layers form at a flow rate of 15 mL h�1; within
measurement errors the number of layers is constant at different
downstream positions along the channel. The local density
measurements confirm that suspensions with a weak interparticle
attraction undergo shear-induced migration, as suggested by the
velocity profiles, and densification, as suggested by the bulk
density measurements.
Strong attraction: clustering resists shear-induced changes in
microstructure
The velocity profiles of a suspension of particles that interact via
a strong attraction (cp ¼ 25 mg mL�1) exhibit distinct features
from those of the weakly attractive (cp¼ 5 mgmL�1) suspension.
First, the velocity profiles obtained at a flow rate of 8 mL h�1
exhibit significant deviations from the Newtonian flow profiles
calculated from eqn (2), as shown in Fig. 8. Second, the velocity
profiles for the strongly attractive suspension evolve as they flow
through the microchannel: for example, the maximum velocity
close to the entrance of the microcapillary (at x/L ¼ 50, vmax z240 mm s�1) is significantly larger than that measured further
downstream (at x/L ¼ 200, vmax z 200 mm s�1). These changes
may reflect an increase in entrance effects due to the high P�eclet
Fig. 8 Normalized velocity profiles as a function of normalized lateral
position across the microchannel y/L for suspension with volume fraction
f¼ 0.15 and cp¼ 25mgmL�1, acquired at downstreamposition x/L¼ (a)
50 and (b) 200. From top to bottom in each panel, velocity profiles were
measuredat heights z/L¼ 0.05, 0.10, 0.35, 0.50.Theflowratewas 8mLh�1.
The dotted lines indicate fits to the Newtonian flow profile (eqn (2)).
This journal is ª The Royal Society of Chemistry 2012

Dow
nloa
ded
by U
nive
rsity
of
Hou
ston
on
04 O
ctob
er 2
012
Publ
ishe
d on
19
July
201
2 on
http
://pu
bs.r
sc.o
rg |
doi:1
0.10
39/C
2SM
2593
5D
View Online
number of these flows. In quiescent conditions particles in the
strongly attractive suspension are dynamically arrested and
typically move less than one diameter in ten minutes (based on
quiescent mean-square-displacement measurements). We thus
estimate the maximum diffusion coefficient D ¼ (2a)2/(600 s) z4� 10�3 mm2 s�1 and thereby obtain a lower bound on the P�eclet
number Pe z 720. Comparison to the entrance length data of
Semwogerere et al.35 indicate that the entrance lengths for this
sample are of order � O (1000L) and are independent of P�eclet
number for Pe > 103; these lengths are longer than the length of
the microcapillary used in these experiments. Finally, the
magnitudes of the velocities near the wall exhibit increased
variance when the interparticle attraction is stronger, and are
nonzero at the lateral edge (y/L ¼ 0), indicating slip consistent
with that observed in the bulk rheology measurements (Fig. 2).
The differences in the shape of these profiles with increased
attraction are reflected in the evolution of the shear zone width
across the microchannel, as shown in Fig. 9. The shear-zone
width decreases monotonically towards the midplane of the
microchannel and does not evolve as the suspension flows
downstream through the channel. The value of the shear zone
width near the center of the channel for the strongly attractive
suspension at all flow rates and downstream positions (z0.68 L)
is comparable to that found for the jammed suspension in the
weakly attractive system. Increasing the strength of attraction
increases the strength of the bonds between particles, which resist
the shear forces applied by the flow. In the strongly attractive
suspension the continuous decrease in the shear zone width with
height thus reflects reduced yielding as the shear stress applied by
flow is decreased; by contrast in the weakly attractive suspension
the discontinuous decrease reflects the onset of jammed behavior
once a threshold volume fraction is reached.
To uncover the microstructural origins of the differences in the
flow profiles due to increasing strength of attraction, we first
examine the number density profiles across the microchannel.
The steepest gradient in particle density occurs near the bottom
of the microchannel, at a normalized height of z/L ¼ 0.05 as
shown in Fig. 10; this variation is in contrast to that observed in
Fig. 9 Shear zone width normalized by L as a function of normalized
vertical position across the microchannel z/L for suspension with volume
fraction f¼ 0.15 and cp¼ 25 mgmL�1, acquired at flow rates of 8 mL h�1
(triangles) and 10 mL h�1 (circles). Filled and open symbols respectively
indicate measurements taken at downstream position x/L ¼ 50 and 200,
respectively.
This journal is ª The Royal Society of Chemistry 2012
the weakly attractive suspension, in which the steepest gradient
was observed near the midplane (z/L ¼ 0.50), and is not under-
stood. Away from the bottom surface of the microchannel, the
increase in number density across the microchannel is less than
that in the weakly attractive suspension, as quantified by the
slope of the density profile: for example, at heights of z/L ¼ 0.30
and 0.50, the slopes of the number density profile at a position
x/L¼ 50 are 0.1 and 0.6 particles per mm, respectively (compared
to 0.24 and 0.34 particles per mm for the weakly attractive
suspension). We obtain similar results for flow rates of 8 and
15 mL h�1. These profiles indicate that the stronger attraction
between the particles suppresses the shear-induced migration
seen in more weakly attractive suspensions that leads to
increased concentration near the center of the microchannel.
Moreover, the number density does not increase after a short
entrance distance due to the increase in compressive yield stress
Py, which scales with the shear yield stress as Py z 55sy for
colloidal gels.58 Using this scaling, we estimate that the
compressive yield stress for the strongly attractive suspension is
Py z 2 Pa. The viscous stress at a given flow rate can be esti-
mated using the constitutive model for a Herschel–Bulkley fluid
as sv ¼ k(Vmax/L)n, where Vmax is the maximum advection
velocity in the channel and k and n are the parameters deter-
mined from the viscometry stress data in Fig. 2. Using the
maximum velocity Vmax z 200 mm s�1 at the flow rate of 8 mL
h�1, we estimate sv z 0.14 Pa and therefore the stress imparted
by the flow is insufficient to cause compressive yielding. By
contrast, for the weakly attractive suspension the magnitude of
the viscous stress (sv z 0.02 Pa) is comparable to the estimated
compressive yield stress (Py z 0.03), suggesting that the small
interparticle attraction in the weakly attractive suspension
cannot resist consolidation via compression.
The mechanisms of yielding during flow also evolve as the
strength of attraction is increased: yielding occurs at the low
shear rates studied here by the breaking of bonds between
Fig. 10 Number of particles as a function of normalized lateral position
across the microchannel y/L for suspension with volume fraction f¼ 0.15
and cp ¼ 25 mg mL�1 flowing at 10 mL h�1, acquired at downstream
position x/L ¼ (a) 50 and (b) 200, for three normalized heights above the
bottom of the microchannel z/L¼ 0.05 (O), 0.30 (B), 0.50 (8). The lines
shown are guides to the eye.
Soft Matter, 2012, 8, 10695–10703 | 10701
Dow
nloa
ded
by U
nive
rsity
of
Hou
ston
on
04 O
ctob
er 2
012
Publ
ishe
d on
19
July
201
2 on
http
://pu
bs.r
sc.o
rg |
doi:1
0.10
39/C
2SM
2593
5D
View Online
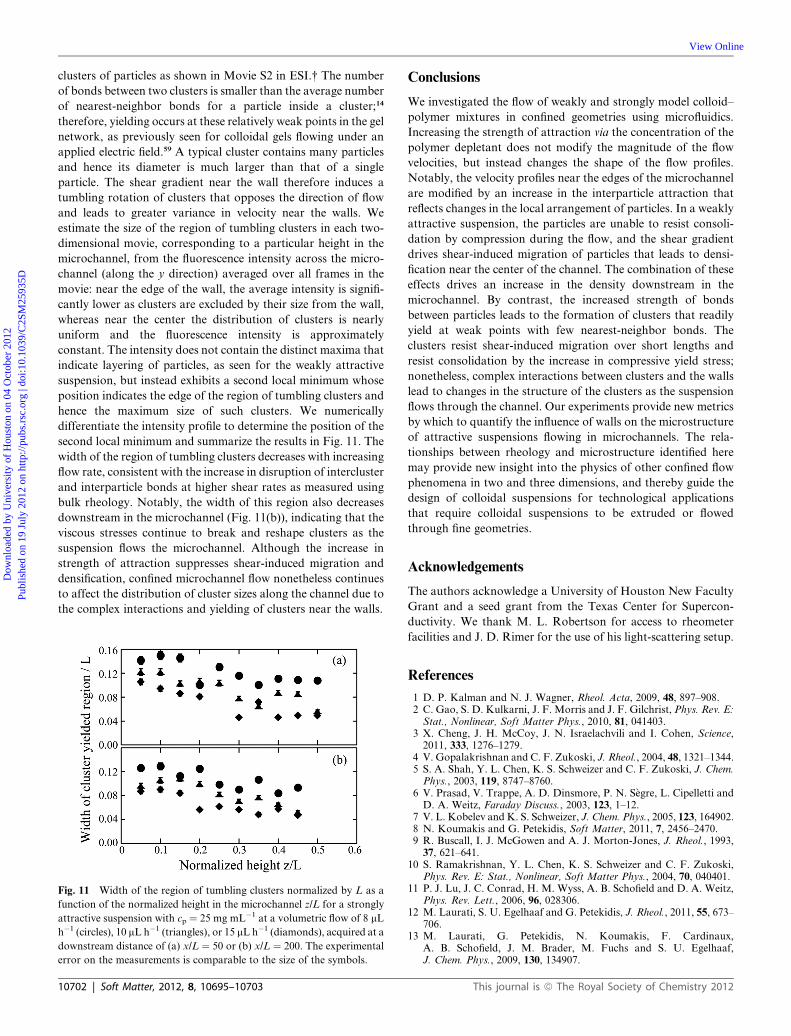
clusters of particles as shown in Movie S2 in ESI.† The number
of bonds between two clusters is smaller than the average number
of nearest-neighbor bonds for a particle inside a cluster;14
therefore, yielding occurs at these relatively weak points in the gel
network, as previously seen for colloidal gels flowing under an
applied electric field.59 A typical cluster contains many particles
and hence its diameter is much larger than that of a single
particle. The shear gradient near the wall therefore induces a
tumbling rotation of clusters that opposes the direction of flow
and leads to greater variance in velocity near the walls. We
estimate the size of the region of tumbling clusters in each two-
dimensional movie, corresponding to a particular height in the
microchannel, from the fluorescence intensity across the micro-
channel (along the y direction) averaged over all frames in the
movie: near the edge of the wall, the average intensity is signifi-
cantly lower as clusters are excluded by their size from the wall,
whereas near the center the distribution of clusters is nearly
uniform and the fluorescence intensity is approximately
constant. The intensity does not contain the distinct maxima that
indicate layering of particles, as seen for the weakly attractive
suspension, but instead exhibits a second local minimum whose
position indicates the edge of the region of tumbling clusters and
hence the maximum size of such clusters. We numerically
differentiate the intensity profile to determine the position of the
second local minimum and summarize the results in Fig. 11. The
width of the region of tumbling clusters decreases with increasing
flow rate, consistent with the increase in disruption of intercluster
and interparticle bonds at higher shear rates as measured using
bulk rheology. Notably, the width of this region also decreases
downstream in the microchannel (Fig. 11(b)), indicating that the
viscous stresses continue to break and reshape clusters as the
suspension flows the microchannel. Although the increase in
strength of attraction suppresses shear-induced migration and
densification, confined microchannel flow nonetheless continues
to affect the distribution of cluster sizes along the channel due to
the complex interactions and yielding of clusters near the walls.
Fig. 11 Width of the region of tumbling clusters normalized by L as a
function of the normalized height in the microchannel z/L for a strongly
attractive suspension with cp ¼ 25 mg mL�1 at a volumetric flow of 8 mL
h�1 (circles), 10 mL h�1 (triangles), or 15 mL h�1 (diamonds), acquired at a
downstream distance of (a) x/L ¼ 50 or (b) x/L ¼ 200. The experimental
error on the measurements is comparable to the size of the symbols.
10702 | Soft Matter, 2012, 8, 10695–10703
Conclusions
We investigated the flow of weakly and strongly model colloid–
polymer mixtures in confined geometries using microfluidics.
Increasing the strength of attraction via the concentration of the
polymer depletant does not modify the magnitude of the flow
velocities, but instead changes the shape of the flow profiles.
Notably, the velocity profiles near the edges of the microchannel
are modified by an increase in the interparticle attraction that
reflects changes in the local arrangement of particles. In a weakly
attractive suspension, the particles are unable to resist consoli-
dation by compression during the flow, and the shear gradient
drives shear-induced migration of particles that leads to densi-
fication near the center of the channel. The combination of these
effects drives an increase in the density downstream in the
microchannel. By contrast, the increased strength of bonds
between particles leads to the formation of clusters that readily
yield at weak points with few nearest-neighbor bonds. The
clusters resist shear-induced migration over short lengths and
resist consolidation by the increase in compressive yield stress;
nonetheless, complex interactions between clusters and the walls
lead to changes in the structure of the clusters as the suspension
flows through the channel. Our experiments provide new metrics
by which to quantify the influence of walls on the microstructure
of attractive suspensions flowing in microchannels. The rela-
tionships between rheology and microstructure identified here
may provide new insight into the physics of other confined flow
phenomena in two and three dimensions, and thereby guide the
design of colloidal suspensions for technological applications
that require colloidal suspensions to be extruded or flowed
through fine geometries.
Acknowledgements
The authors acknowledge a University of Houston New Faculty
Grant and a seed grant from the Texas Center for Supercon-
ductivity. We thank M. L. Robertson for access to rheometer
facilities and J. D. Rimer for the use of his light-scattering setup.
References
1 D. P. Kalman and N. J. Wagner, Rheol. Acta, 2009, 48, 897–908.2 C. Gao, S. D. Kulkarni, J. F. Morris and J. F. Gilchrist, Phys. Rev. E:Stat., Nonlinear, Soft Matter Phys., 2010, 81, 041403.
3 X. Cheng, J. H. McCoy, J. N. Israelachvili and I. Cohen, Science,2011, 333, 1276–1279.
4 V. Gopalakrishnan and C. F. Zukoski, J. Rheol., 2004, 48, 1321–1344.5 S. A. Shah, Y. L. Chen, K. S. Schweizer and C. F. Zukoski, J. Chem.Phys., 2003, 119, 8747–8760.
6 V. Prasad, V. Trappe, A. D. Dinsmore, P. N. S�egre, L. Cipelletti andD. A. Weitz, Faraday Discuss., 2003, 123, 1–12.
7 V. L. Kobelev and K. S. Schweizer, J. Chem. Phys., 2005, 123, 164902.8 N. Koumakis and G. Petekidis, Soft Matter, 2011, 7, 2456–2470.9 R. Buscall, I. J. McGowen and A. J. Morton-Jones, J. Rheol., 1993,37, 621–641.
10 S. Ramakrishnan, Y. L. Chen, K. S. Schweizer and C. F. Zukoski,Phys. Rev. E: Stat., Nonlinear, Soft Matter Phys., 2004, 70, 040401.
11 P. J. Lu, J. C. Conrad, H. M. Wyss, A. B. Schofield and D. A. Weitz,Phys. Rev. Lett., 2006, 96, 028306.
12 M. Laurati, S. U. Egelhaaf and G. Petekidis, J. Rheol., 2011, 55, 673–706.
13 M. Laurati, G. Petekidis, N. Koumakis, F. Cardinaux,A. B. Schofield, J. M. Brader, M. Fuchs and S. U. Egelhaaf,J. Chem. Phys., 2009, 130, 134907.
This journal is ª The Royal Society of Chemistry 2012

Dow
nloa
ded
by U
nive
rsity
of
Hou
ston
on
04 O
ctob
er 2
012
Publ
ishe
d on
19
July
201
2 on
http
://pu
bs.r
sc.o
rg |
doi:1
0.10
39/C
2SM
2593
5D
View Online
14 J. C. Conrad, H. M. Wyss, V. Trappe, S. Manley, K. Miyazaki,L. J. Kaufman, A. B. Schofield, D. R. Reichman and D. A. Weitz,J. Rheol., 2010, 54, 421–438.
15 J. J. Stickel and R. L. Powell, Annu. Rev. Fluid Mech., 2005, 37, 129–149.
16 J. Mewis and N. J. Wagner, J. Non-Newtonian Fluid Mech., 2009, 157,147–150.
17 J. F. Morris, Rheol. Acta, 2009, 48, 909–923.18 J. M. Brader, J. Phys.: Condens. Matter, 2010, 22, 363101.19 S. B. Fuller, E. J. Wilhelm and J. M. Jacobson, J. Microelectromech.
Syst., 2002, 11, 54–60.20 T. H. J. van Osch, J. Perelaer, A. W. M. de Laat and U. S. Schubert,
Adv. Mater., 2008, 20, 343–345.21 B.-Y. Ahn, E. Duoss, M. J. Motala, X. Guo, S. Park, Y. Xiong,
J. Yoon, R. G. Nuzzo, J. A. Rogers and J. A. Lewis, Science, 2009,323, 1590–1593.
22 M. Duduta, B. Ho, V. C. Wood, P. Limthongkul, V. E. Brunini,W. C. Carter and Y.-M. Chiang, Adv. Energy Mater., 2011, 1, 511–516.
23 J. Philip, P. D. Shima and B. Raj, Nanotechnology, 2008, 19,305706.
24 P. Gharagozloo and K. Goodson, J. Appl. Phys., 2010, 108, 074309.25 H. J. Walls, S. B. Caines, A. M. Sanchez and S. A. Khan, J. Rheol.,
2003, 47, 847–868.26 D. M. Kalyon, J. Rheol., 2005, 49, 621–640.27 H. M. Wyss, D. L. Blair, J. F. Morris, H. A. Stone and D. A. Weitz,
Phys. Rev. E: Stat., Nonlinear, Soft Matter Phys., 2006, 74, 061402.28 L. Xu, S. Davies, A. B. Schofield and D. A. Weitz, Phys. Rev. Lett.,
2008, 101, 094502.29 L. Xu, A. Berg�es, P. J. Lu, A. R. Studart, A. B. Schofield, H. Oki,
S. Davies and D. A. Weitz, Phys. Rev. Lett., 2010, 104, 128303.30 T. M. Squires and S. R. Quake, Rev. Mod. Phys., 2005, 77, 977–1026.31 M. Frank, D. Anderson, E. R. Weeks and J. F. Morris, J. Fluid
Mech., 2003, 493, 363–378.32 Y. Xia and G. M. Whitesides, Annu. Rev. Mater. Sci., 1998, 28, 153–
184.33 K. J. Humphry, P. M. Kulkarni, D. A. Weitz, J. F. Morris and
H. A. Stone, Phys. Fluids, 2010, 22, 081703.34 V. Prasad, D. Semwogerere and E. R. Weeks, J. Phys.: Condens.
Matter, 2007, 19, 113102.
This journal is ª The Royal Society of Chemistry 2012
35 D. Semwogerere, J. F. Morris and E. R. Weeks, J. Fluid Mech., 2007,581, 437–451.
36 D. Semwogerere and E. R. Weeks, Phys. Fluids, 2008, 20, 043306.37 M. D. Haw, Phys. Rev. Lett., 2004, 92, 185506.38 A. I. Campbell and M. D. Haw, Soft Matter, 2010, 6, 4688–4693.39 L. Isa, R. Besseling, A.Morozov andW. C. K. Poon, Phys. Rev. Lett.,
2009, 102, 058302.40 D. Genovese and J. Sprakel, Soft Matter, 2011, 7, 3889–3896.41 K. N. Nordstrom, E. Verneuil, P. E. Arratia, A. Basu, Z. Zhang,
A. G. Yodh, J. P. Gollub and D. J. Durian, Phys. Rev. Lett., 2010,105, 175701.
42 M. T. Roberts, A. Mohraz, K. T. Christensen and J. A. Lewis,Langmuir, 2007, 23, 8726–8731.
43 J. C. Conrad and J. A. Lewis, Langmuir, 2008, 24, 7628–7634.44 J. C. Conrad and J. A. Lewis, Langmuir, 2010, 26, 6102–6107.45 P. N. Pusey and W. van Megen, Nature, 1986, 320, 340–342.46 L. Antl, J. W. Goodwin, R. D. Hill, R. H. Ottewill, S. M. Owens,
S. Papworth and J. A. Waters, Colloids Surf., 1986, 17, 67–78.47 A. Yethiraj and A. van Blaaderen, Nature, 2003, 421, 513–517.48 G. C. Berry, J. Chem. Phys., 1966, 44, 4550–4564.49 S. M. Ilett, A. Orrock, W. C. K. Poon and P. N. Pusey, Phys. Rev. E:
Stat. Phys., Plasmas, Fluids, Relat. Interdiscip. Top., 1995, 51, 1344–1352.
50 J. C. Crocker and D. G. Grier, J. Colloid Interface Sci., 1996, 179,298–310.
51 http://physics.georgetown.edu/matlab/.52 R. Besseling, L. Isa, E. R. Weeks and W. C. K. Poon, Adv. Colloid
Interface Sci., 2009, 146, 1–17.53 W. H. Bulkley and A. R. Herschel, Kolloidn. Z., 1926, 39, 291–300.54 S. Manley, J. M. Skotheim, L. Mahadevan and D. A. Weitz, Phys.
Rev. Lett., 2005, 94, 218302.55 S. D. Kulkarni, B. Metzger and J. F. Morris, Phys. Rev. E: Stat.,
Nonlinear, Soft Matter Phys., 2010, 82, 010402.56 F. M. White, Viscous Fluid Flow, McGraw-Hill, 3rd edn, 2006.57 M. Spannuth and J. C. Conrad, Phys. Rev. Lett., 2012, 109, 028301.58 G. M. Channell and C. F. Zukoski, AIChE J., 1997, 43, 1700–1708.59 M. Kogan and M. J. Solomon, Langmuir, 2010, 26, 1207–1213.60 B. Rajaram and A. Mohraz, Soft Matter, 2010, 6, 2246–2259.61 B. Rajaram and A. Mohraz, Phys. Rev. E: Stat., Nonlinear, Soft
Matter Phys., 2011, 84, 011405.
Soft Matter, 2012, 8, 10695–10703 | 10703