Effects of acclimatization on energy expenditure by meat goats
9
Effects of acclimatization on energy expenditure by different goat genotypes A. Helal a , K.M. Youssef a , H.M. El-Shaer a , T.A. Gipson b , A.L. Goetsch b , A.R. Askar a, ⁎ a Animal and Poultry Nutrition Department, Desert Research Center, P. O. Box 11753, El-Matareya, Cairo, Egypt b American Institute for Goat Research, Langston University, P. O. Box 730, Langston, Oklahoma, USA article info abstract Article history: Received 15 November 2008 Received in revised form 31 August 2009 Accepted 31 August 2009 Five Balady and five Shami (Damascus) intact male goats, approximately 1.5 yr of age, were individually housed and used to determine effects of ambient temperature (Ta), relative humidity (RH), and temperature–humidity index (THI) on energy expenditure (EE). Average mean, low, and high values in 2-wk periods throughout the year were 22.5, 14.9, and 28.5 °C for Ta and 61.0, 49.6, and 68.5% for RH, respectively. Animal measurements occurred monthly from December, 2006 through October, 2007. Animals were fed alfalfa hay to meet the maintenance energy requirement. Because BW was relatively constant throughout the experiment, EE was considered equal to metabolizable energy (ME) intake. In January, April, July, and October, the day of measuring heart rate (HR) occurred within a 7-day period when bucks were housed in metabolism crates for total collection of feces and urine. Individual EE to HR ratio was estimated at those times and used to predict EE throughout the year based on HR. EE in kJ/kg BW 0.75 was greater for Shami than for Balady goats in January, July, and October (P < 0.05), for Balady ranked (P < 0.05) July and October < January and April, and for Shami ranked (P < 0.05) January, April, and July > October. EE:HR was greatest among times (P < 0.05) in April and greater (P < 0.05) for Shami vs. Balady. Digestibilities of DM and energy were slightly greater for Shami than for Balady (P < 0.05). For monthly measures, rectal temperature, blood hemoglobin oxygen saturation, and HR were similar between breeds. HR differed among months, with means ranging from 57.0 to 77.6 bpm. There were large differences among months in the difference between EE at particular measurement daily times and the average (EEdiff). No climate measure in the preceding 2 or 4 wk was correlated with EE or EEdiff (P > 0.10). The same was true for correlations based on all data of EEdiff and the full-day measurement of climate conditions in the month preceding HR measurement. However, when correlations were conducted separately for each genotype, some relationships for Balady goats were significant while those for Shami goats were nonsignificant. A regression of EEdiff of Balady goats against mean Ta and THI on the preceding HR measurement day revealed a coefficient of 4.17 or 2.78 kJ/kg BW 0.75 per 1 °C or THI unit, respectively. In conclusion, EE of Balady goats appears sensitive to climate conditions, whereas that of Shami goats is not or at least is relatively less impacted. With hot conditions, Balady goats have an advantage in a decreased ME requirement for maintenance and with low Ta, Balady goats have an increased requirement. © 2009 Elsevier B.V. All rights reserved. Keywords: Shami Balady Energy expenditure Acclimatization Temperature 1. Introduction Goats play an important role in the economic and social life in the world, particularly in the Mediterranean and dry climatic condition areas. Goats are more adaptable to environmental conditions prevailing in arid and semi-arid areas compared with other ruminant species (Silanikove, 2000). There are three main goat breeds in Egypt: Balady, Barki, and Zaraibi. Balady goats are the most numerous and are known for being highly fertile and prolific and non- seasonal breeders (Galal, 1987). Balady goats are well adapted to environmental conditions of the north Sinai, which include a prolonged dry season, extreme climate Livestock Science 127 (2010) 67–75 ⁎ Corresponding author. Tel.: +20 16 9898 566; fax: +20 2 26357858. E-mail address: [email protected] (A.R. Askar). 1871-1413/$ – see front matter © 2009 Elsevier B.V. All rights reserved. doi:10.1016/j.livsci.2009.08.004 Contents lists available at ScienceDirect Livestock Science journal homepage: www.elsevier.com/locate/livsci
Transcript of Effects of acclimatization on energy expenditure by meat goats

Livestock Science 127 (2010) 67–75
Contents lists available at ScienceDirect
Livestock Science
j ourna l homepage: www.e lsev ie r.com/ locate / l ivsc i
Effects of acclimatization on energy expenditure by different goat genotypes
A. Helal a, K.M. Youssef a, H.M. El-Shaer a, T.A. Gipson b, A.L. Goetsch b, A.R. Askar a,⁎a Animal and Poultry Nutrition Department, Desert Research Center, P. O. Box 11753, El-Matareya, Cairo, Egyptb American Institute for Goat Research, Langston University, P. O. Box 730, Langston, Oklahoma, USA
a r t i c l e i n f o
⁎ Corresponding author. Tel.: +20 16 9898 566; faxE-mail address: [email protected] (A.R. As
1871-1413/$ – see front matter © 2009 Elsevier B.V.doi:10.1016/j.livsci.2009.08.004
a b s t r a c t
Article history:Received 15 November 2008Received in revised form 31 August 2009Accepted 31 August 2009
Five Balady and five Shami (Damascus) intact male goats, approximately 1.5 yr of age, wereindividually housed and used to determine effects of ambient temperature (Ta), relativehumidity (RH), and temperature–humidity index (THI) on energy expenditure (EE). Averagemean, low, and high values in 2-wk periods throughout the year were 22.5, 14.9, and 28.5 °C forTa and 61.0, 49.6, and 68.5% for RH, respectively. Animal measurements occurredmonthly fromDecember, 2006 through October, 2007. Animals were fed alfalfa hay to meet the maintenanceenergy requirement. Because BW was relatively constant throughout the experiment, EE wasconsidered equal to metabolizable energy (ME) intake. In January, April, July, and October, theday of measuring heart rate (HR) occurred within a 7-day period when bucks were housed inmetabolism crates for total collection of feces and urine. Individual EE to HR ratio wasestimated at those times and used to predict EE throughout the year based on HR. EE in kJ/kgBW0.75 was greater for Shami than for Balady goats in January, July, and October (P<0.05), forBalady ranked (P<0.05) July and October<January and April, and for Shami ranked (P<0.05)January, April, and July>October. EE:HR was greatest among times (P<0.05) in April andgreater (P<0.05) for Shami vs. Balady. Digestibilities of DM and energy were slightly greaterfor Shami than for Balady (P<0.05). For monthly measures, rectal temperature, bloodhemoglobin oxygen saturation, and HR were similar between breeds. HR differed amongmonths, with means ranging from 57.0 to 77.6 bpm. There were large differences amongmonths in the difference between EE at particular measurement daily times and the average(EEdiff). No climate measure in the preceding 2 or 4 wk was correlated with EE or EEdiff(P>0.10). The same was true for correlations based on all data of EEdiff and the full-daymeasurement of climate conditions in the month preceding HR measurement. However, whencorrelations were conducted separately for each genotype, some relationships for Balady goatswere significant while those for Shami goats were nonsignificant. A regression of EEdiff ofBalady goats against mean Ta and THI on the preceding HR measurement day revealed acoefficient of 4.17 or 2.78 kJ/kg BW0.75 per 1 °C or THI unit, respectively. In conclusion, EE ofBalady goats appears sensitive to climate conditions, whereas that of Shami goats is not or atleast is relatively less impacted. With hot conditions, Balady goats have an advantage in adecreased ME requirement for maintenance and with low Ta, Balady goats have an increasedrequirement.
© 2009 Elsevier B.V. All rights reserved.
Keywords:ShamiBaladyEnergy expenditureAcclimatizationTemperature
1. Introduction
Goats play an important role in the economic and sociallife in the world, particularly in the Mediterranean and dryclimatic condition areas. Goats are more adaptable to
: +20 2 26357858.kar).
All rights reserved.
environmental conditions prevailing in arid and semi-aridareas compared with other ruminant species (Silanikove,2000). There are three main goat breeds in Egypt: Balady,Barki, and Zaraibi. Balady goats are the most numerous andare known for being highly fertile and prolific and non-seasonal breeders (Galal, 1987). Balady goats are welladapted to environmental conditions of the north Sinai,which include a prolonged dry season, extreme climate

68 A. Helal et al. / Livestock Science 127 (2010) 67–75
fluctuations, and water scarcity. However, there have beensome efforts to introduce the Damascus (Shami) breed forcrossbreeding with local breeds or use as straight-breds forgreater milk production.
Energy is the main limiting factor in animal productionand its availability affects adaptation to the environment,animal behavior, and feeding strategies (Lachica and Aguilera,2003). The maintenance energy requirement (MEm) is themost important factor affecting the energy need of ruminantsand is influenced by factors such as genotype, age, physio-logical state, season, level of feeding, feeding management,physical activity, and acclimatization (Corbett and Ball, 2002).Acclimatization describes adaptive response to changes innon-extreme climatic conditions (Bligh and Johnson, 1973).Adaptation includes modifications in heat production anddissipation within the thermo-neutral zone.
NRC (1981a) proposed that for each 10 °C above or below20 °C, the mid-point of the thermo-neutral zone, the netenergy (NE) requirement for maintenance (NEm) of cattledecreases or increases by 9.1% from that determined at 20 °C,which was recommended for beef cattle by NRC (2000). Foxand Tylutki (1998) developed a more complex equation fordairy cattle based on ambient temperature, relative humidity,radiant energy, and wind speed, although NRC (2001)concluded that the equation has not been sufficientlyvalidated. Sahlu et al. (2004) suggested an adjustment ofthe MEm of goats similar to that for beef cattle of NRC (2000),but with consideration of using specific mid-point thermo-neutral zone temperatures most appropriate for particulargoat genotypes rather than 20 °C in all cases. In agreement,CSIRO (1990) reported that the lower critical temperature orthe lower limit of the zone of thermo-neutrality for an animalvaries with its thermal insulation or resistance to heat flow tothe environment and with its rate of heat production inthermo-neutral conditions. Goats appear to be less subject tohigh temperature exposure than other species of domesticlivestock such as wool-producing sheep or many breeds ofcattle and require less water evaporation to control bodytemperature (NRC, 1981b).
There is lack of information about the effects of acclima-tization on energy requirements for goats. A recent study(Patra et al., 2009) dealt with effects of acclimatization onenergy requirements of two meat goat genotypes in the U.S.(i.e., Boer and Spanish). Objectives of the current study wereto determine effects of acclimatization on energy require-ments of two genotypes of goats in Egypt, Balady raised formeat and Shami typically reared for milk production.
2. Materials and methods
2.1. Housing and measures
The experiment was conducted at one of the DesertResearch Center stations in Arish, north Sinai, Egypt. Initially,five Balady and five Shami intact males, approximately 1.5 yrof age, were used. One Balady buck developed a healthproblem mid-way in the experiment and, therefore, wasremoved.
The experiment was 1 yr in length, beginning in Novem-ber, 2006 and ending in October, 2007. Animalmeasurementsoccurred monthly from December through October. At most
times animals were housed individually in 1×1.7 m pens in abarn (3.7×10 m) with concrete walls and a sand floor. Thebarn was closed except for one door allowing access in anopen yard while cleaning for approximately 1 h every otherday.
Alfalfa hay was fed twice (11:00 and 17:00 h) daily basedon BW to meet the MEm requirement according to Kearl(1982); however, hay refusals did occur. Hay was sampled inJanuary, April, July, and after October. On average, haysamples contained (AOAC, 1990) 87.5% DM and 12.9% ash,14.2% crude protein (CP), 30.2% crude fiber (CF), and 3.2%ether extract (EE) on a dry matter (DM) basis.
The ambient temperature (Ta) and relative humidity (RH)inside the barn were measured with a digital Thermo-hygrometer (DT-2; Efkimo, China) on days when heart rate(HR) was measured. A temperature–humidity index (THI)was determined as: 0.8×Ta+(RH×(Ta−14.4)/100)+46.4(Amundson et al., 2006). Ta, RH, and THI were averaged over2-wk periods. Measurements commenced 4 wk before thefirst determination of HR. HR was measured monthly withPolar monitor (S610; Polar, Lake Success, NY) beginning at08:00 h for a 24 h period. Body weight (BW) and rectaltemperature at 08.00 h were determined monthly as well. InJanuary, April, July, and October, the day of measuring HRoccurred within a 7-day period when bucks were housed inmetabolism crates for total collection of feces and urine. Feedoffered and rejected and water consumed also were mea-sured. Feces were analyzed for DM and GE; metabolizableenergy (ME) intake was estimated as 82% of digestible energy(DE) intake.
2.2. Statistical analyses
Data were analyzed with a mixed model containing timeas a repeated measure (Littell et al., 1996). Interaction meansare given in tables and figures regardless of significance of theinteraction. The ratio of EE to HR estimated in January, April,July, and October for each animal was used to predict EEthroughout the year based on HR. To do so, weightedaverages of EE:HR for each animal were estimated based onthe difference in time from nearest EE:HR determinations. Forexample, EE:HR in February was calculated as 67% of EE:HR inJanuary plus 33% of EE:HR in April. The deviation of EE by eachanimal at a particular time from the average for that animaloverall the entire year (EEdiff) was determined. Simplecorrelation coefficients were determined between averagemean daily Ta, RH, and THI in the 2 and 4 wk preceding HRmeasurement and EE and EEdiff, based on stronger relation-ships between EEdiff and climatic measures at 2 and 4 wkthan 6 and 8 wk noted by Patra et al. (2009). The sameprocedures were employed with the full-day measurementof Ta, RH, and THI and day length in the month precedingdetermination of EEdiff. However, because the first mea-sure of EEdiff was in December and a full-day measure-ment of climate conditions was not available for thepreceding month of November, these correlations involved10 EEdiff determinations (January through October) ratherthan 11. Correlations were determined for all data andalso separately for the two genotypes. Moreover, withPROC REG of SAS (1990), EEdiff of Balady goats was regressedagainst Ta.

Fig. 1. Mean temperature, relative humidity, and temperature–humidity index (THI) in 2-wk periods throughout the year that Balady and Shami bucks wereexposed to (Jan= January, Feb= February, Mar=March, Apr= April, Jun= June, Jul = July, Aug= August, Sep= September, Oct= October, Nov=November,Dec = December).
69A. Helal et al. / Livestock Science 127 (2010) 67–75
3. Results
3.1. Climatic conditions
Average mean, low, and high values in 2-wk periodsthroughout the year were 22.5, 14.9, and 28.5 °C for Ta and61.0, 49.6, and 68.5% for RH, respectively. RHwas greater than
Fig. 2.Mean, maximum, and minimum hourly temperature determined on days of hJanuary, Feb = February, Mar = March, Apr = April, Jun = June, Jul = July, Aug =
anticipated and noted in a companion experiment of Patraet al. (2009) (Fig. 1). Apparently, barn conditions preventedanimal exposure to high Ta relatively more than observed byPatra et al. (2009). Figs. 2, 3, and 4 show mean, maximum,and minimum Ta, RH, and THI, respectively, for hourlymeasurements determined on days of HR measurement.Comparisons of these figures with Fig. 1 indicate that the full-
eart rate measurement that Balady and Shami bucks were exposed to (Jan =August, Sep = September, Oct = October, Dec = December).

Fig. 3. Mean, maximum, andminimum hourly relative humidity determined on days of heart ratemeasurement that Balady and Shami bucks were exposed to (Jan=January, Feb = February, Mar = March, Apr = April, Jun = June, Jul = July, Aug = August, Sep = September, Oct = October, Dec = December).
70 A. Helal et al. / Livestock Science 127 (2010) 67–75
day measurement periods on days of determining HRcharacterized climatic conditions well throughout the year,except for early and late in the experiment when mean Tabased on hourly measures on HR determination days was lessthan 2 wk averages. At those times, mean 2 wk Ta was similarto maximum hourly values determined on days of HRmeasurement. Means of hourly determinations on HRmeasurement days may be preferable to 2 wk means to
Fig. 4. Mean, maximum, and minimum hourly temperature–humidity index (THI) dwere exposed to (Jan = January, Feb = February, Mar = March, Apr = April, JunDecember).
evaluate the relationship between HR or EE and weatherconditions because they consider all hours of the day.
3.2. DM intake and digestibility measurement periods
Although Shami bucks consumed more water (4.14 vs.3.08 l/day, SE=0.172) and excreted a greater amount of urine(2.39 vs. 1.72 l/day, SE=0.124) than Balady bucks (P<0.05),
etermined on days of heart rate measurement that Balady and Shami bucks= June, Jul = July, Aug = August, Sep = September, Oct = October, Dec =

Table 1Effects of goat breed and season on urine excretion, water consumption, feed intake and digestion, energy expenditure (EE), and the ratio of EE to heart rate (HR).
Item Season1 SE
Jan Apr Jul Oct
kg BW0.75
Balady b13.06 13.10 12.86 12.75 0.694Shami a18.57 18.53 18.23 18.43
Urine excretion (ml/(day BW0.75))Balady 111.4 143.5 145.1 133.2 7.65Shami 98.30 140.9 152.2 122.4
Water consumption (ml/(day BW0.75))Balady 206.8 272.5 245.8 237.5 14.02Shami 178.2 259.1 244.9 216.3
DM intake (g/(day BW0.75))Balady b57.72b 59.18ab 52.48d 53.18 cd 0.999Shami a58.23b 58.10b 60.42a 55.80c
DM digestibility (%)Balady b61.16 61.60 60.08 60.86 0.804Shami a63.46 64.18 61.96 63.02
Energy intake (MJ/(day BW0.75))Balady b0.93cb 0.98a 0.85f 0.87fd 0.016Shami a0.94cb 0.96ab 0.97a 0.91dc
Energy digestibility (%)Balady b58.52 57.90 57.18 56.67 0.936Shami a62.34 61.94 60.20 59.68
Digestible energy intake (MJ/(day kg BW0.75))Balady b0.55b 0.57a 0.49c 0.49c 0.012Shami a0.59a 0.60a 0.59a 0.55b
EE (MJ/day)Balady b5.84c 6.09c 5.15d 5.18d 0.376Shami a8.93b 9.07b 8.81b 8.28a
EE (kJ/kg BW0.75)Balady b447b 466ab 399c 405c 10.3Shami a481a 490a 483a 449b
EE:HR (kJ/(BW0.75 beat))Balady b6.20 7.88 5.25 6.16 0.615Shami a7.56 8.55 6.86 7.67
EE:HR (kJ/(BW beat))Balady 2.63 3.34 2.22 2.62 0.228Shami 2.85 3.23 2.61 2.88
1Jan = January (Winter); Apr = April (Spring); Jul = July (Summer); Oct = October (fall).a,b,c,dMeans in a row or variable grouping without a common superscript letter differ (P<0.05) for the interaction effect.a,bMeans in the Jan column within variable without a common superscript letter (preceding the mean) differ (P<0.05) for the main effect of breed.
71A. Helal et al. / Livestock Science 127 (2010) 67–75
water intake and urine excretion were similar when they wereexpressed as ml/kg BW0.75 (Table 1). DM and energy intakesweregreater (P<0.05) for Shamivs. Balady (58.1 vs. 55.6 gDM/(day BW0.75), SE=0.78, and 0.95 vs. 0.91 MJ/(day BW0.75),SE=0.013, respectively). Shami goats had similar energyintake (MJ/(day BW0.75)) in April and July but greater(P<0.05) intake in July than in January and October, whileBalady goats had less intake in July and October vs. January andApril. Digestibilities of DM and energy were slightly greater forShami than for Balady (P<0.05). DE intake was markedlygreater for Shami vs. Balady (P<0.05) and ranked (P<0.05)October<July<January<April. EE or ME intake in MJ/day orkJ/kg BW0.75 differed similarly; however, there was aninteraction (P<0.05) between breed and time. EE was greaterfor Shami than for Balady (P<0.05), for Balady ranked(P<0.05) July and October<January<April, and for Shamiranked (P<0.05) January, April, and July>October. EE:HR (kJ/(kg BW0.75 beat)) was greatest among seasons (P<0.05) inApril and greater (P<0.05) for Shami vs. Balady. This differencebetweenbreedswas not significant (P>0.05)when EE (kJ)wasnormalize to BW beat.
3.3. Monthly measures
BWvaried (P<0.05) among the 11monthlymeasurementtimes (Table 2), butmagnitudes of differencewere small (e.g.,lowest mean in May of 38.5 kg compared with the highestvalue of 41.4 kg in December). However, animals were losingvery little BW from December until May (i.e., from the winterto summer season), which was associated with an increase inTa (Figs. 1 and 2) and higher THI (Figs. 1 and 4). Other factorsmay have been involved such as season or day length(Aharoni et al., 1997, 1999). This monthly change in BW didnot affect the EE:HR ratio that was considered only throughthe digestibility trials at January, April, July, and October withno BW changes during those 7-day measurement periods.However, no steady BW increases or decreases with advanc-ing time were evident (Fig. 5).
Rectal temperature (Table 2), blood hemoglobin oxygensaturation, and HR (Table 2 and Fig. 6) were similar betweenbreeds. The correlation between EE and rectal temperaturewassignificant (r=0.20; P<0.05) with combined data of bothbreeds, although correlations between rectal temperature and

Table2
Effectsof
goat
bree
dan
dmon
thon
BW,rectaltem
perature,h
eart
rate
(HR)
,ene
rgyex
pend
iture(E
E),a
ndthedifferen
cein
EEfrom
themea
nof
each
anim
al(E
Ediff).
Item
Bree
dSE
Mon
th1
SE
Balady
Sham
iDec
Jan
Feb
Mar
Apr
May
Jun
Jul
Aug
Sep
Oct
Rectal
tempe
rature
(°C)
38.39
38.56
0.08
738
.05a
b38
.77e
38.81e
38.71d
e38
.68d
e37
.90e
37.73e
38.33b
c38
.28b
c38
.37b
cd38
.60c
de
0.13
Bloo
dhe
mog
lobinox
ygen
Conc
entration(%
)76
.178
.41.15
77.5
b78
.5b
68.4
a77
.7b
67.6
a77
.3b
82.3
b83
.0b
79.8
b77
.0b
80.8
b2.73
HR(b
eats/m
in)
66.3
62.8
3.60
60.1
a68
.3bc
63.2
ab57
.0a
58.2
a57
.6a
74.0
cd77
.6d
67.8
bc
64.3
ab61
.7ab
3.84
EE MJ/da
y5.59
a8.72
b0.41
76.91
7.48
7.32
7.09
7.60
6.83
8.15
7.21
6.65
6.72
6.74
0.43
2kJ/kgBW
0.75
421a
472b
15.6
417
462
458
441
478
435
506
442
421
425
427
21.7
EEdiff(kJ/kg
BW0.75)
0.0
0.0
7.94
-29.5a
15.7
abc
11.8
abc
-5.3
ab31
.0bc
-11.5a
b59
.7c
-5.0
ab-2
5.1a
-21.9a
-19.8a
18.64
1Jan=
Janu
ary;
Feb=
Februa
ry;Mar
=March
;Apr
=April;
Jun=
June
;Jul=
July;Aug
=Aug
ust;
Sep=
Septem
ber;
Oct
=Octob
er;Dec
=Decem
ber.
a,b,c,d,eMea
nsin
arow
orva
riab
legrou
ping
witho
utaco
mmon
supe
rscriptletter
differ
(P<0.05
).
72 A. Helal et al. / Livestock Science 127 (2010) 67–75
HR were not. Blood hemoglobin oxygen saturation was lowestin February and April (P<0.05). HR also differed amongmonths, withmeans ranging from 57.0 to 77.6 bpm. Significantcorrelations existed for combined data and data of each breedbetween HR and climate measures. For combined data,correlations between HR and Ta, RH, THI in the preceding2 wk were 0.33 (P<0.01), 0.21 (P<0.05), 0.34 (P<0.05), andcorrelations for conditions in the previous 4 wk were 0.22(P<0.04), 0.25 (P<0.02), and 0.24 (P<0.02), respectively.There were also significant correlations between climatemeasures on days of HR measurement and HR in thesubsequent month. Relationships were either similar amongmean, maximum, and minimum values or stronger for meanvalues. Correlations between HR and mean Ta, RH, and THIwere 0.19 (P<0.08), −0.23 (P<0.03), and 0.19 (P<0.08),respectively. In addition, correlation between day length of themeasurement HR days and HR were 0.25 (P<0.05) forcombined data. When this correlation was determined foreach breed, it was significant for Shami (0.31; P<0.05) but notfor Balady (0.19; P>0.10).
EE in neither MJ/day nor kJ/kg BW0.75 differed amongmonths (P>0.05); however, values were considerably great-er for Shami than for Balady (P<0.05; Table 2 and Fig. 7).Because the breed by time interaction was nonsignificant(P>0.05), main effect breed means for EEdiff were 0.0. Largedifferences in EEdiff among months existed (Table 2 andFig. 8). It is difficult to discern a clear pattern of change inEEdiff with advancing time, although values were generallyless in the first month of measurement (i.e., December) and inthe last three (August, September, and October) than at othertimes. In accordance with relatively small differences in Ta,RH, and THI and large differences among months in EEdiff, noclimate measure in the preceding 2 or 4 wk was correlatedwith EE or EEdiff (P>0.10). The same was true for correla-tions based on all data of EEdiff and the full-daymeasurementof climate conditions in the month preceding HR measure-ment, including day length. However, when correlationswereconducted separately for each genotype, some relationshipsfor Balady goats were significant while those for Shami goatswere nonsignificant. Correlations for Balady goats betweenEEdiff and Ta, RH, and THI (means of hourly determinationson HR measurement days) were −0.39 (P<0.02), −0.02(P<0.89), and −0.39 (P<0.02), respectively. Relationshipswith minimum and maximum values were similar. Aregression of EEdiff of Balady goats against mean Ta on thepreceding HR measurement day revealed a coefficient of4.17 kJ/(kg BW0.75* 1 °C) (SE=2.054; R2=0.15); a regres-sion against mean THI yielded a coefficient of 2.78 kJ/(BW0.75 *1 THI unit) (SE=1.363; R2=0.15).
4. Discussion
4.1. Intake and digestion
The difference between breeds in digestibility was notexpected. Youssef et al. (2002) and Allam Sabbah et al. (2006)reported a similar digestibility coefficient (65.7 and 65.9) forBalady and Shami goats fed a mixture of alfalfa hay andconcentrate. Slightly lower DM intake relative to BW0.75 byShami than Balady bucks implies a longer digesta residencetime in Shami bucks (Van Soest, 1994).
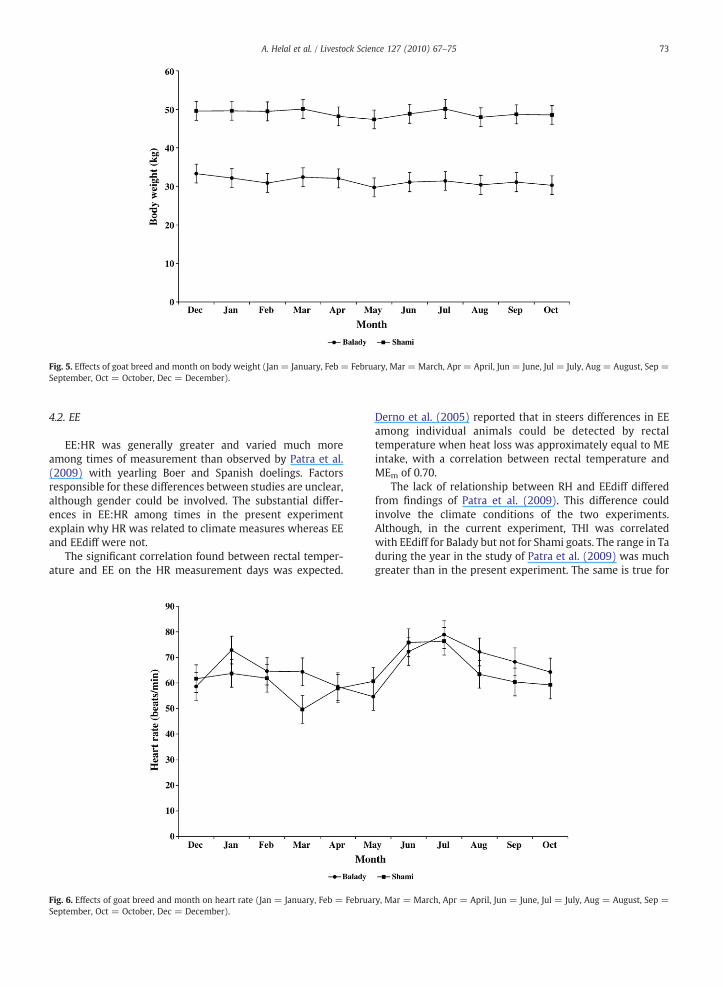
Fig. 5. Effects of goat breed and month on body weight (Jan = January, Feb = February, Mar = March, Apr = April, Jun = June, Jul = July, Aug = August, Sep =September, Oct = October, Dec = December).
73A. Helal et al. / Livestock Science 127 (2010) 67–75
4.2. EE
EE:HR was generally greater and varied much moreamong times of measurement than observed by Patra et al.(2009) with yearling Boer and Spanish doelings. Factorsresponsible for these differences between studies are unclear,although gender could be involved. The substantial differ-ences in EE:HR among times in the present experimentexplain why HR was related to climate measures whereas EEand EEdiff were not.
The significant correlation found between rectal temper-ature and EE on the HR measurement days was expected.
Fig. 6. Effects of goat breed and month on heart rate (Jan = January, Feb = FebruaSeptember, Oct = October, Dec = December).
Derno et al. (2005) reported that in steers differences in EEamong individual animals could be detected by rectaltemperature when heat loss was approximately equal to MEintake, with a correlation between rectal temperature andMEm of 0.70.
The lack of relationship between RH and EEdiff differedfrom findings of Patra et al. (2009). This difference couldinvolve the climate conditions of the two experiments.Although, in the current experiment, THI was correlatedwith EEdiff for Balady but not for Shami goats. The range in Taduring the year in the study of Patra et al. (2009) was muchgreater than in the present experiment. The same is true for
ry, Mar = March, Apr = April, Jun = June, Jul = July, Aug = August, Sep =

Fig. 7. Effects of goat breed and month on energy expenditure (EE; MBW = body weight0.75) (Jan = January, Feb = February, Mar = March, Apr = April, Jun =June, Jul = July, Aug = August, Sep = September, Oct = October, Dec = December).
74 A. Helal et al. / Livestock Science 127 (2010) 67–75
RH, which also was considerably greater than monitored byPatra et al. (2009).
The significant relationship for Balady but not Shami goatsbetween EEdiff andmean Ta and THI on the HRmeasurementday in the preceding month suggests that EE by Balady goatsis sensitive to climate conditions, whereas that of Shami goatsis not or at least is relatively less impacted. Perhaps thisrelates to differences in physiological conditions such asinvolving greater production potential of Shami vs. Baladygoats. This significant correlation with Ta suggests that withhot conditions Balady goats have an advantage in a decreased
Fig. 8. Effects of goat breed andmonth on the difference in energy expenditure (EE) frFebruary, Mar = March, Apr = April, Jun = June, Jul = July, Aug = August, Sep =
MEm requirement, although with low Ta, possibly relating tothe lower BW compared with Shami goats, Balady goats havean increased MEm requirement. The impact of Ta on EEdiff ofBalady goats (i.e., 4.17 kJ/(kg BW0.75 *1 °C)) is very similar tothat proposed for all goats by NRC (2007; i.e., 4.14 kJ/(kgBW0.75 *1 °C)). Likewise, mean Ta on the HR measurementdays in this experiment was 20.4 °C, and the mid-pointthermo-neutral zone temperature of NRC (2007) is 20 °C.However, findings of this experiment imply that suchadjustments of MEm for acclimatization may be appropriatefor some but not all genotypes of goats.
om themean of each animal (MBW=bodyweight0.75) (Jan= January, Feb=September, Oct = October, Dec = December).

75A. Helal et al. / Livestock Science 127 (2010) 67–75
4.3. MEm
It appears that MEm is greater for Shami than for Baladybucks. Laurenz et al. (1991) showed thatMEm is influenced bythe genetic potential for performance traits. This relationshipmay be caused by differences in EE by highly metabolic activeorgans (i.e., gastrointestinal tract and liver) (Derno et al.,2005). Similarly, Luo et al. (2004) found a higher MEm forgrowing animals of breeds selected for milk production,including the Damascus, and this difference was extrapolatedto mature animals (Nsahlai et al., 2004). Lachica and Aguilera(2003) reported a MEm of Granadina goats similar to that ofBalady goats in the current experiment, although valueswere lower than proposed by Sahlu et al. (2004) assuming a15% higher MEm (MJ/day) for intact males vs. females andmale castrates based on BW. However, confinement condi-tions would have minimized the activity energy require-ment. Also, most observations in the database employed byLuo et al. (2004) were with animals consuming diets adlibitum, and level of feed intake can impact MEm (CSIRO,1990). Asmare et al. (2006) concluded that yearling meatgoats can markedly reduce EE when MEI is restricted belowMEm. These findings agree with those mentioned by Broshet al. (1986) and Silanikove (1986)with Bedouin goats of theSinai, but indicate that the ability of goats to reduce MEmwith limited nutritional planes may not be unique toparticular genotypes.
Even though EEdiff varied among months, because EE inMJ/day and kJ/kg BW0.75 and EEdiff were not influenced by abreed×month interaction, this difference in MEm betweenShami and Balady bucks seems fairly consistent regardless ofthe time of the year.
5. Summary and conclusions
With indoor housing and non-extreme climate conditions,the significant relationship for Balady but not Shami goatsbetween EEdiff and Ta and THI on the HRmeasurement day inthe preceding month suggests that EE of Balady goats issensitive to climate conditions, whereas that of Shami goats isnot or at least is relatively less impacted. Ta and THI affectedMEm of Balady goats and RH had little impact. A regression ofEEdiff of Balady goats against Ta and THI on the preceding HRmeasurement day revealed a coefficient of 4.17 or 2.78 kJ/kgBW0.75 per 1 °C or THI unit, respectively. With hot conditions,Balady goats have an advantage in a decreased MEm
requirement, while with low Ta they have an increasedMEm requirement.
Acknowledgment
This work was supported by the United State–Egypt JointScience and Technology Fund Program, Under ProjectNumber BIO11-001-005.
References
Aharoni, Y., Brosh, A., Ezra, E., 1999. Effects of heat load and photoperiod onmilk yield and composition in three dairy herds in Israel. Anim. Sci. 69,37–47.
Aharoni, Y., Brosh, A., Holzer, Z., 1997. Photoperiodic effect on live-weightgain of bull calves. Anim. Sci. 65, 165–171.
Allam Sabbah, M., Youssef, K.M., Ali, M.A., Abo Bakr, S.Y., 2006. Using somefodder shrubs and industrial by-products in different forms for feedinggoats in Sinai. J. Agric. Sci. Mansoura Univ. 31, 1371–1385.
Amundson, J.L., Mader, T.L., Rasby, R.J., Hu, Q.S., 2006. Environmental effectson pregnancy rate in beef cattle. J. Anim. Sci. 84, 3415–3420.
AOAC, 1990. Official Methods of Analysis, 14th edn. Association of OfficialAnalytical Chemists, Washington, DC.
Asmare, A., Puchala, R., Merkel, R.C., Sahlu, T., Goetsch, A.L., 2006. Changes inenergy expenditure by meat goats with varying levels of feed intake nearmaintenance and below. J. Appl. Anim. Res. 29, 81–89.
Bligh, J., Johnson, K.G., 1973. Glossary of terms for thermal physiology. J. Appl.Physiol. 35, 941–961.
Brosh, A., Shkolnik, A., Choshniak, I., 1986. Metabolic effects of infrequentdrinking and low quality feed on Bedouin goats. Ecology 67, 1086–1090.
Corbett, J.L., Ball, A.J., 2002. Nutrition for maintenance. In: Freer, M., Dove, H.(Eds.), Sheep Nutrition. CABI, Wallingford, Oxon, UK, pp. 143–164.
CSIRO, 1990. Feeding Standards for Australian Livestock. Ruminants.Commonwealth Scientific and Industrial Research Organization, EastMelbourne, Victoria, Australia.
Derno, M., Jentsch, W., Schweigel, M., Kuhla, S., Metges, C.C., Matthes, H.D.,2005. Measurements of heat production for estimation of maintenanceenergy requirements of Hereford steers. J. Anim. Sci. 83, 2590–2597.
Fox, D.G., Tylutki, T.P., 1998. Accounting for the effects of environment on thenutrient requirements of dairy cattle. J. Dairy Sci. 81, 3085–3095.
Galal, E.S.E., 1987. Sheep and goats production and research in Egypt. SmallRuminant in the Near East: FAO Animal Production and Health Bulletin,vol. 54, pp. 117–155.
Kearl, I.C., 1982. Nutrient Requirements of Ruminnats in DevelopingCountries. International Feedstuffs Utilization. Utah Agric. Exp. Sta.Utah State University, Logen, UT.
Lachica,M., Aguilera, J.F., 2003. Estimation of energy needs in the free-ranginggoat with particular reference to the assessment of its energy expendi-ture by the 13C-bicarbonate method. Small Rum. Res. 49, 303–318.
Laurenz, J.C., Byers, F.M., Schelling, G.T., Greene, L.W., 1991. Effects of seasonon the maintenance requirements of mature beef cows. J. Anim. Sci. 69,2168–2176.
Littell, R.C., Milliken, G.A., Stroup, W.W., Wolfinger, R.D., 1996. SAS Systemsfor Mixed Models. SAS Inst. Inc., Cary, NC.
Luo, J., Goetsch, A.L., Sahlu, T., Nsahlai, I.V., Johnson, Z.B., Moore, J.E., Galyean,M.L., Owens, F.N., Ferrell, C.L., 2004. Prediction of metabolizable energyrequirements for maintenance and gain of preweaning, growing, andmature goats. Small Rum. Res. 53, 231–252.
NRC, 1981a. Effect of Environment on Nutrient Requirements of DomesticAnimals. National Academy Press, Washington, DC.
NRC, 1981b. Nutrient Requirements of Goats: Angora, Dairy, and MeatGoats in Temperate and Tropical Countries. National Academy Press,Washington, DC.
NRC, 2000. Nutrient Requirements of Beef Cattle (Update 2000). NationalAcademy Press, Washington, DC.
NRC, 2001. Nutrient Requirements of Dairy Cattle (7th Revised edn.).National Academy Press, Washington, DC.
NRC, 2007. Nutrient Requirements of Small Ruminants. Sheep, Goats, Cervids,and New World Camelids. National Academy Press, Washington, DC.
Nsahlai, I.V., Goetsch, A.L., Luo, J., Johnson, Z.B., Moore, J.E., Sahlu, T., Ferrell, C.L.,Galyean, M.L., Owens, F.N., 2004. Energy requirements of lactating goats.Small Rum. Res. 53, 253–274.
Patra, A.K., Puchala, R., Animut, G., Gipson, T.A., Sahlu, T., Goetsch, A.L., 2009.Effects of acclimatization on energy expenditure by meat goats. SmallRum. Res. 81, 42–54.
Sahlu, T., Goetsch, A.L., Luo, J., Nsahlai, I.V., Moore, J.E., Galyean, M.L., Owens,F.N., Ferrell, C.L., Johnson, Z.B., 2004. Energy and protein requirements ofgoats: developed equations, other considerations and future research toimprove them. Small Rum. Res. 53, 191–220.
SAS, 1990. SAS/STAT User's Guide (Version 6, 4th edn., Vol. 2). SAS InstituteInc., Cary, NC.
Silanikove, N., 1986. Interrelationships between feed quality, digestibility,feed consumption and energy requirements in desert (Bedouin) andnon-desert (Saanen) goat. Nutr. Rep. Int. 35, 725–731.
Silanikove, N., 2000. The physiological basis of adaptation in goats to harshenvironments. Small Rum. Res. 35, 181–193.
Van Soest, P.J., 1994. Nutritional Ecology of the Ruminant, 2nd ed. CornellUniversity Press, Ithaca, NY. 337–353 pp.
Youssef, K.M., Khattab, H.M., Kandil, H.M., Abdelmawla, S.M., 2002. Studies onfattening goats fed halophytics shrubs under arid conditions in Sinai. Int.Symp. on Optimum Resources Utilization in Salt-Affected Ecosystems inArid and Semi Arid Regions. Cairo, Egypt, pp. 440–449.