Effectiveness of the membrane bioreactor in the biodegradation of high molecular weight compounds
11
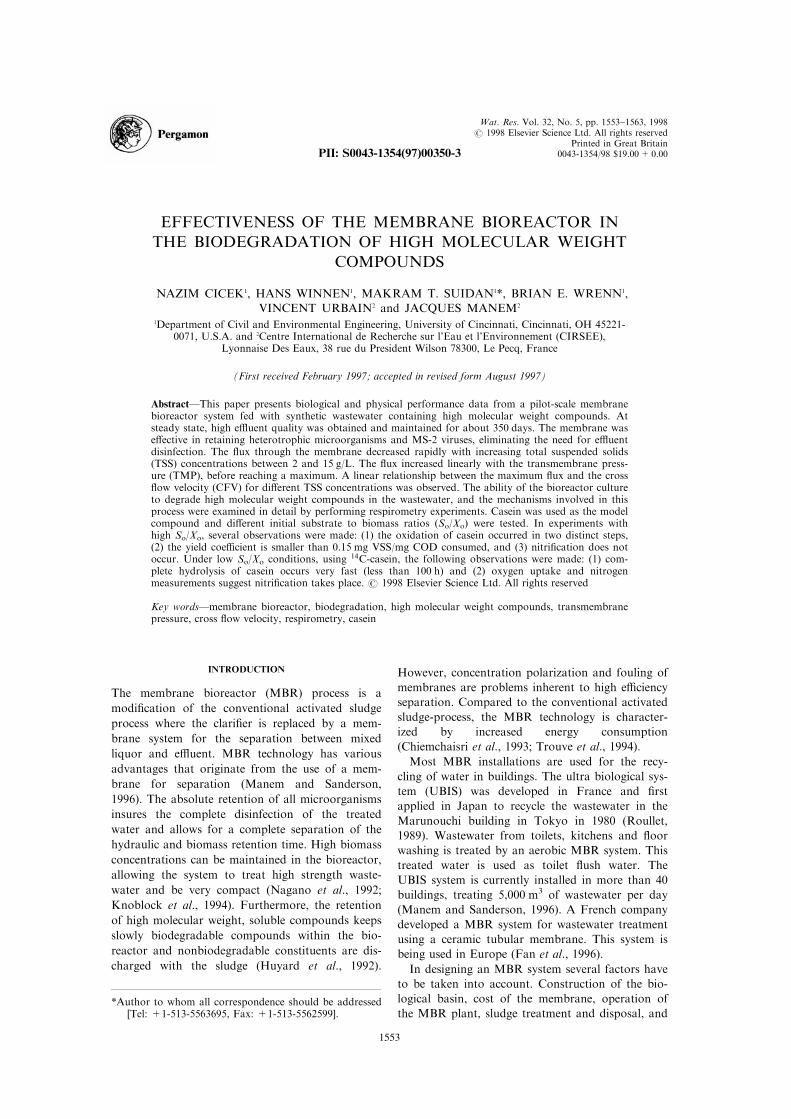
EFFECTIVENESS OF THE MEMBRANE BIOREACTOR IN THE BIODEGRADATION OF HIGH MOLECULAR WEIGHT COMPOUNDS NAZIM CICEK 1 , HANS WINNEN 1 , MAKRAM T. SUIDAN 1 *, BRIAN E. WRENN 1 , VINCENT URBAIN 2 and JACQUES MANEM 2 1 Department of Civil and Environmental Engineering, University of Cincinnati, Cincinnati, OH 45221- 0071, U.S.A. and 2 Centre International de Recherche sur l’Eau et l’Environnement (CIRSEE), Lyonnaise Des Eaux, 38 rue du President Wilson 78300, Le Pecq, France (First received February 1997; accepted in revised form August 1997) Abstract—This paper presents biological and physical performance data from a pilot-scale membrane bioreactor system fed with synthetic wastewater containing high molecular weight compounds. At steady state, high euent quality was obtained and maintained for about 350 days. The membrane was eective in retaining heterotrophic microorganisms and MS-2 viruses, eliminating the need for euent disinfection. The flux through the membrane decreased rapidly with increasing total suspended solids (TSS) concentrations between 2 and 15 g/L. The flux increased linearly with the transmembrane press- ure (TMP), before reaching a maximum. A linear relationship between the maximum flux and the cross flow velocity (CFV) for dierent TSS concentrations was observed. The ability of the bioreactor culture to degrade high molecular weight compounds in the wastewater, and the mechanisms involved in this process were examined in detail by performing respirometry experiments. Casein was used as the model compound and dierent initial substrate to biomass ratios (S o /X o ) were tested. In experiments with high S o /X o , several observations were made: (1) the oxidation of casein occurred in two distinct steps, (2) the yield coecient is smaller than 0.15 mg VSS/mg COD consumed, and (3) nitrification does not occur. Under low S o /X o conditions, using 14 C-casein, the following observations were made: (1) com- plete hydrolysis of casein occurs very fast (less than 100 h) and (2) oxygen uptake and nitrogen measurements suggest nitrification takes place. # 1998 Elsevier Science Ltd. All rights reserved Key words—membrane bioreactor, biodegradation, high molecular weight compounds, transmembrane pressure, cross flow velocity, respirometry, casein INTRODUCTION The membrane bioreactor (MBR) process is a modification of the conventional activated sludge process where the clarifier is replaced by a mem- brane system for the separation between mixed liquor and euent. MBR technology has various advantages that originate from the use of a mem- brane for separation (Manem and Sanderson, 1996). The absolute retention of all microorganisms insures the complete disinfection of the treated water and allows for a complete separation of the hydraulic and biomass retention time. High biomass concentrations can be maintained in the bioreactor, allowing the system to treat high strength waste- water and be very compact (Nagano et al., 1992; Knoblock et al., 1994). Furthermore, the retention of high molecular weight, soluble compounds keeps slowly biodegradable compounds within the bio- reactor and nonbiodegradable constituents are dis- charged with the sludge (Huyard et al., 1992). However, concentration polarization and fouling of membranes are problems inherent to high eciency separation. Compared to the conventional activated sludge-process, the MBR technology is character- ized by increased energy consumption (Chiemchaisri et al., 1993; Trouve et al., 1994). Most MBR installations are used for the recy- cling of water in buildings. The ultra biological sys- tem (UBIS) was developed in France and first applied in Japan to recycle the wastewater in the Marunouchi building in Tokyo in 1980 (Roullet, 1989). Wastewater from toilets, kitchens and floor washing is treated by an aerobic MBR system. This treated water is used as toilet flush water. The UBIS system is currently installed in more than 40 buildings, treating 5,000 m 3 of wastewater per day (Manem and Sanderson, 1996). A French company developed a MBR system for wastewater treatment using a ceramic tubular membrane. This system is being used in Europe (Fan et al., 1996). In designing an MBR system several factors have to be taken into account. Construction of the bio- logical basin, cost of the membrane, operation of the MBR plant, sludge treatment and disposal, and Wat. Res. Vol. 32, No. 5, pp. 1553–1563, 1998 # 1998 Elsevier Science Ltd. All rights reserved Printed in Great Britain 0043-1354/98 $19.00 + 0.00 PII: S0043-1354(97)00350-3 *Author to whom all correspondence should be addressed [Tel: +1-513-5563695, Fax: +1-513-5562599]. 1553
-
Upload
independent -
Category
Documents
-
view
2 -
download
0
Transcript of Effectiveness of the membrane bioreactor in the biodegradation of high molecular weight compounds
EFFECTIVENESS OF THE MEMBRANE BIOREACTOR IN
THE BIODEGRADATION OF HIGH MOLECULAR WEIGHT
COMPOUNDS
NAZIM CICEK1, HANS WINNEN1, MAKRAM T. SUIDAN1*, BRIAN E. WRENN1,VINCENT URBAIN2 and JACQUES MANEM2
1Department of Civil and Environmental Engineering, University of Cincinnati, Cincinnati, OH 45221-0071, U.S.A. and 2Centre International de Recherche sur l'Eau et l'Environnement (CIRSEE),
Lyonnaise Des Eaux, 38 rue du President Wilson 78300, Le Pecq, France
(First received February 1997; accepted in revised form August 1997)
AbstractÐThis paper presents biological and physical performance data from a pilot-scale membranebioreactor system fed with synthetic wastewater containing high molecular weight compounds. Atsteady state, high e�uent quality was obtained and maintained for about 350 days. The membrane wase�ective in retaining heterotrophic microorganisms and MS-2 viruses, eliminating the need for e�uentdisinfection. The ¯ux through the membrane decreased rapidly with increasing total suspended solids(TSS) concentrations between 2 and 15 g/L. The ¯ux increased linearly with the transmembrane press-ure (TMP), before reaching a maximum. A linear relationship between the maximum ¯ux and the cross¯ow velocity (CFV) for di�erent TSS concentrations was observed. The ability of the bioreactor cultureto degrade high molecular weight compounds in the wastewater, and the mechanisms involved in thisprocess were examined in detail by performing respirometry experiments. Casein was used as the modelcompound and di�erent initial substrate to biomass ratios (So/Xo) were tested. In experiments withhigh So/Xo, several observations were made: (1) the oxidation of casein occurred in two distinct steps,(2) the yield coe�cient is smaller than 0.15 mg VSS/mg COD consumed, and (3) nitri®cation does notoccur. Under low So/Xo conditions, using 14C-casein, the following observations were made: (1) com-plete hydrolysis of casein occurs very fast (less than 100 h) and (2) oxygen uptake and nitrogenmeasurements suggest nitri®cation takes place. # 1998 Elsevier Science Ltd. All rights reserved
Key wordsÐmembrane bioreactor, biodegradation, high molecular weight compounds, transmembranepressure, cross ¯ow velocity, respirometry, casein
INTRODUCTION
The membrane bioreactor (MBR) process is a
modi®cation of the conventional activated sludge
process where the clari®er is replaced by a mem-
brane system for the separation between mixed
liquor and e�uent. MBR technology has various
advantages that originate from the use of a mem-
brane for separation (Manem and Sanderson,
1996). The absolute retention of all microorganisms
insures the complete disinfection of the treated
water and allows for a complete separation of the
hydraulic and biomass retention time. High biomass
concentrations can be maintained in the bioreactor,
allowing the system to treat high strength waste-
water and be very compact (Nagano et al., 1992;
Knoblock et al., 1994). Furthermore, the retention
of high molecular weight, soluble compounds keeps
slowly biodegradable compounds within the bio-
reactor and nonbiodegradable constituents are dis-
charged with the sludge (Huyard et al., 1992).
However, concentration polarization and fouling of
membranes are problems inherent to high e�ciency
separation. Compared to the conventional activated
sludge-process, the MBR technology is character-
ized by increased energy consumption
(Chiemchaisri et al., 1993; Trouve et al., 1994).
Most MBR installations are used for the recy-
cling of water in buildings. The ultra biological sys-
tem (UBIS) was developed in France and ®rst
applied in Japan to recycle the wastewater in the
Marunouchi building in Tokyo in 1980 (Roullet,
1989). Wastewater from toilets, kitchens and ¯oor
washing is treated by an aerobic MBR system. This
treated water is used as toilet ¯ush water. The
UBIS system is currently installed in more than 40
buildings, treating 5,000 m3 of wastewater per day
(Manem and Sanderson, 1996). A French company
developed a MBR system for wastewater treatment
using a ceramic tubular membrane. This system is
being used in Europe (Fan et al., 1996).
In designing an MBR system several factors have
to be taken into account. Construction of the bio-
logical basin, cost of the membrane, operation of
the MBR plant, sludge treatment and disposal, and
Wat. Res. Vol. 32, No. 5, pp. 1553±1563, 1998# 1998 Elsevier Science Ltd. All rights reserved
Printed in Great Britain0043-1354/98 $19.00+0.00PII: S0043-1354(97)00350-3
*Author to whom all correspondence should be addressed[Tel: +1-513-5563695, Fax: +1-513-5562599].
1553

energy costs are some of them. In order to optimize
the MBR design, it is very important to know therelationships between the operating parameters and
the biological performance (degradation e�ciency,
yield, biomass activity and viability, etc.) and physi-cal performance (®ltration capability, durability,
fouling of membrane, etc.) of the MBR system.Several factors in¯uence the physical performance
of the membrane: the trans membrane pressure
(TMP), the cross ¯ow velocity (CFV), the total sus-pended solids (TSS), the viscosity of the mixed
liquor and the physiological state of the biomass.
The community structure in the bioreactor in¯u-ences the extend of ¯occulation, charge and struc-
ture of cells and the concentration of exopolymericsubstances (EPS), which lead to formation of a
slimy cake on the membrane surface and cause a
signi®cant drop in ®ltration performance (Ross etal., 1990; Chaize and Huyard, 1991; Magara and
Itoh, 1991; Jeannot et al., 1992).
The biological performance of the MBR can beexamined by studying the mechanisms of biodegra-
dation. Respirometric batch tests, where the oxygen
consumption in response to substrate mineralizationis measured, are valuable tools for investigating bio-
degradation. The choice of the initial substrate tobiomass concentration ratio (So/Xo) is determined
by the scope of the experiment. A high So/Xo ratio
(typically greater than 20:1 on a COD basis) allowsbiomass to adjust its internal constituents to the
level of optimal growth. Kinetics determined under
these conditions are termed intrinsic. Due to thephysiological changes that occur under high So/Xo
conditions, kinetic parameters determined in batchtests over predict the e�uent concentrations of con-
tinuous bioreactors (Rozich and Gaudy, 1985).Tests which employ low So/Xo ratios prevent sub-stantial cell multiplication and growth. Kinetic par-
ameters determined under these conditions aretermed extant, or currently existing. They tend tobe more representative of the conditions in the con-
tinuous culture bioreactor (Grady et al., 1996).The objective of this study was to investigate the
long-term performance of a pilot-scale MBR system
and its e�ectiveness in the degradation of high mol-ecular weight compounds in wastewater. Theimpact of operational parameters such as TMP,CFV, TSS and regeneration procedure on the ®l-
tration performance was determined. The biologicale�ciency and stability of the system was examined.The retention capacity of the membrane for micro-
organisms and viruses was studied. The degradationmechanisms of casein, as a model contaminant, bythe culture in the MBR was investigated by per-
forming respirometry experiments with di�erent So/Xo ratios.
MATERIALS AND METHODS
Reactor design
Figure 1 presents a schematic of the membranebioreactor system. Pump 1 moves the mixed liquor
from the aeration tank towards the membrane(Qr1). Pump 2 is responsible for the high recycle¯ow (cross ¯ow) along the membrane (Qr2).
Fig. 1. Schematic of the pilot-scale MBR system.
Nazim Cicek et al.1554
Flowmeter F1 measures the e�uent ¯ow (Qe�) andcontrols pump 1. The mixed liquor is kept at a con-
stant temperature through heat exchange in theupper part of the recycle loop (shaded area). Thepump responsible for recirculating cooling liquid in
the heat exchanger is controlled by a temperatureprobe placed on the membrane mantel. A constantvolume of mixed liquor is maintained in the aera-
tion tank by a surface sensor which controls thefeed pump (pump 3).The two feed tanks, 220 L each, are continuously
mixed and cooled down to a temperature of 48C toprevent microbial growth. The solids retention timeis maintained at a constant value using an auto-matic waste-system which consists of a graduated
cylinder with a ¯oat assembly. At ®xed time inter-vals, a three-way-valve opens, connecting the aera-tion tank to the graduated cylinder. When the
mixed liquor reaches the ¯oat, the sludge inside thegraduated cylinder is wasted to the sewer. At thesame time, tap water is sprayed into the graduated
cylinder to prevent solids buildup in the three-way-valve. The choice of the time interval and thevolume of mixed liquor wasted per wasting-cycledetermines the solids retention time.
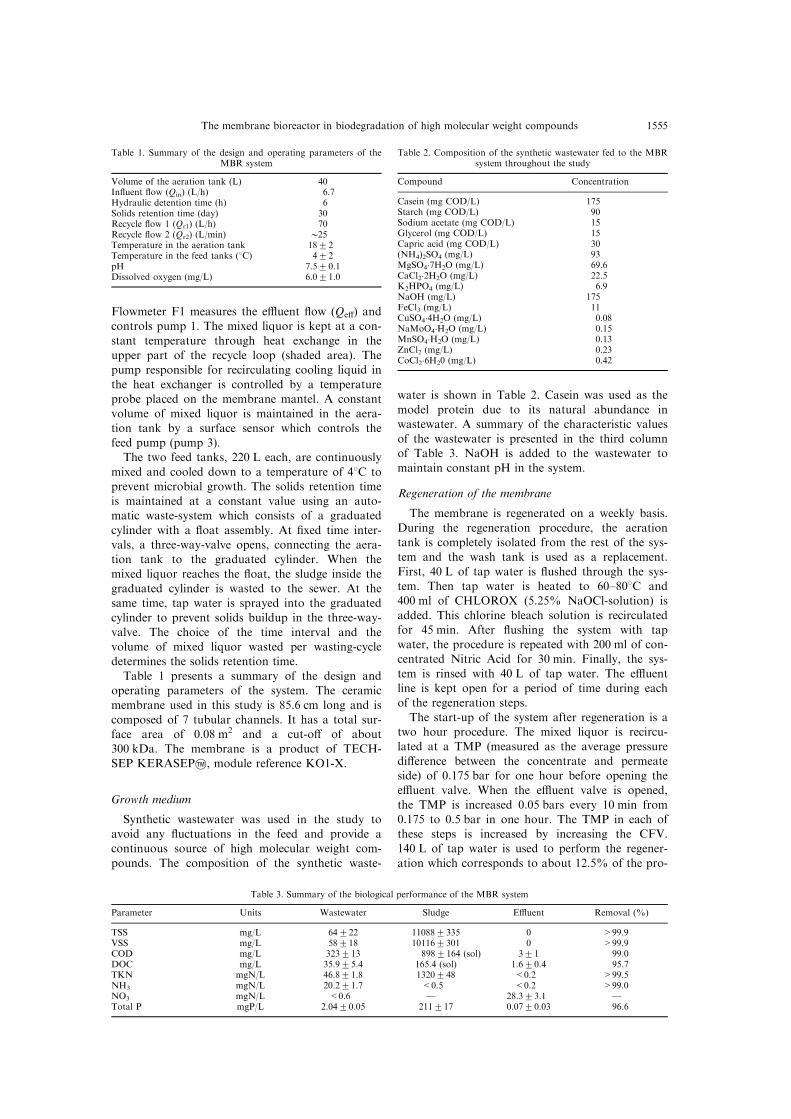
Table 1 presents a summary of the design andoperating parameters of the system. The ceramicmembrane used in this study is 85.6 cm long and is
composed of 7 tubular channels. It has a total sur-face area of 0.08 m2 and a cut-o� of about300 kDa. The membrane is a product of TECH-
SEP KERASEP2, module reference KO1-X.
Growth medium
Synthetic wastewater was used in the study toavoid any ¯uctuations in the feed and provide acontinuous source of high molecular weight com-
pounds. The composition of the synthetic waste-
water is shown in Table 2. Casein was used as the
model protein due to its natural abundance inwastewater. A summary of the characteristic valuesof the wastewater is presented in the third columnof Table 3. NaOH is added to the wastewater to
maintain constant pH in the system.
Regeneration of the membrane
The membrane is regenerated on a weekly basis.
During the regeneration procedure, the aerationtank is completely isolated from the rest of the sys-tem and the wash tank is used as a replacement.
First, 40 L of tap water is ¯ushed through the sys-tem. Then tap water is heated to 60±808C and400 ml of CHLOROX (5.25% NaOCl-solution) is
added. This chlorine bleach solution is recirculatedfor 45 min. After ¯ushing the system with tapwater, the procedure is repeated with 200 ml of con-centrated Nitric Acid for 30 min. Finally, the sys-
tem is rinsed with 40 L of tap water. The e�uentline is kept open for a period of time during eachof the regeneration steps.
The start-up of the system after regeneration is atwo hour procedure. The mixed liquor is recircu-lated at a TMP (measured as the average pressure
di�erence between the concentrate and permeateside) of 0.175 bar for one hour before opening thee�uent valve. When the e�uent valve is opened,
the TMP is increased 0.05 bars every 10 min from0.175 to 0.5 bar in one hour. The TMP in each ofthese steps is increased by increasing the CFV.140 L of tap water is used to perform the regener-
ation which corresponds to about 12.5% of the pro-
Table 2. Composition of the synthetic wastewater fed to the MBRsystem throughout the study
Compound Concentration
Casein (mg COD/L) 175Starch (mg COD/L) 90Sodium acetate (mg COD/L) 15Glycerol (mg COD/L) 15Capric acid (mg COD/L) 30(NH4)2SO4 (mg/L) 93MgSO4�7H2O (mg/L) 69.6CaCl2�2H2O (mg/L) 22.5K2HPO4 (mg/L) 6.9NaOH (mg/L) 175FeCl3 (mg/L) 11CuSO4�4H2O (mg/L) 0.08NaMoO4�H2O (mg/L) 0.15MnSO4�H2O (mg/L) 0.13ZnCl2 (mg/L) 0.23CoCl2�6H20 (mg/L) 0.42
Table 3. Summary of the biological performance of the MBR system
Parameter Units Wastewater Sludge E�uent Removal (%)
TSS mg/L 64222 110882335 0 >99.9VSS mg/L 58218 101162301 0 >99.9COD mg/L 323213 8982164 (sol) 321 99.0DOC mg/L 35.925.4 165.4 (sol) 1.620.4 95.7TKN mgN/L 46.821.8 1320248 <0.2 >99.5NH3 mgN/L 20.221.7 <0.5 <0.2 >99.0NO3 mgN/L <0.6 Ð 28.323.1 ÐTotal P mgP/L 2.0420.05 211217 0.0720.03 96.6
Table 1. Summary of the design and operating parameters of theMBR system
Volume of the aeration tank (L) 40In¯uent ¯ow (Qin) (L/h) 6.7Hydraulic detention time (h) 6Solids retention time (day) 30Recycle ¯ow 1 (Qr1) (L/h) 70Recycle ¯ow 2 (Qr2) (L/min) 025Temperature in the aeration tank 1822Temperature in the feed tanks (8C) 422pH 7.520.1Dissolved oxygen (mg/L) 6.021.0
The membrane bioreactor in biodegradation of high molecular weight compounds 1555
duced e�uent water. The entire regeneration pro-cedure takes 5 h.
Analytical methods
The MBR system was monitored with dailymeasurements of dissolved oxygen, pH, and tem-perature. Chemical oxygen demand (COD), wasanalyzed for in accordance with method 508C of
standard methods (APHA, 1992) dissolved organiccarbon (DOC) was determined using a ShimadzuTC analyzer, model 5000 (Shimadzu Co., Tokyo),
ammonia (NH3), was analyzed for using a model13-620-505 ammonia ion selective electrode (FisherScienti®c, Pittsburgh, PA) and an Orion model
215284-A01 ATC probe, and nitrate (NO3ÿ), was
determined in accordance with standard method418A (APHA, 1992) were measured weekly in the
e�uent. Total suspended solids (TSS) and volatilesuspended solids (VSS), were determined in accord-ance with method 209 of standard methods(APHA, 1992), and soluble (®ltered through 0.45
mm) COD of the mixed liquor in the reactor, wasmeasured weekly. At steady state, the total phos-phorus, determined in accordance with methods
424C#2 and 424E of standard methods (APHA,1992), and the total Kjeldahl nitrogen (TKN) weremeasured in the e�uent and bioreactor. The in¯u-
ent was analyzed for TSS, VSS, total COD, DOC,total TKN, NH3, NO3
ÿ, and P.A study was performed to examine the capability
of the membrane in retaining heterotrophic bac-
teria. The e�uent of the MBR was analyzed forheterotrophic microorganisms in accordance tomethod 907 of standard methods (APHA, 1992). A
proper aliquot of water sample was added andspread out on the surface of the petri dish contain-ing tryptic soy agar. The Petri dishes were incu-
bated at 378C for 24 h, and the colonies werecounted. Each colony is assumed to be the progenyof a single cell.
Retention capacity of the membrane for viruses
Another set of experiments were performed to
determine whether the membrane retains viruses.The test was performed using the MS-2 virus. Thisvirus has a diameter of 25 nm which is similar tothat of the poliovirus. Plaque formation on agar
plates is the method used to enumerate bacterio-phages. Serial dilutions of the sample were added tothe soft agar preparation to determine the concen-
tration of plaque-forming-units (PFU)(Chiemchaisri et al., 1992).The membrane was regenerated before the bac-
teriophage study in order to test the retention capa-bilities of the membrane in the worst case scenario,that is, with a clean membrane. A volume of 3.5 L
of the salt diluent were added to the wash tank andrecirculated around the membrane module for15 min to equilibrate the solution at 188C. One mlof the stock solution of the MS-2 virus (5.25�108
PFU/ml) was added to the wash tank. The systemran for 15 min to allow complete mixing of the
viruses. The e�uent valve was opened allowinge�uent ¯ow. A volume of 400 ml of e�uent waswasted and a 10 ml sample of e�uent was collected.
Simultaneously, a 10 ml sample from the wash tankwas taken. Both samples were analyzed immedi-ately. This test was repeated with a stock-solution
of 4.1�108 PFU/ml.
Respirometry tests
A Comput-OX WB series respirometer (N-CON
Systems, New York, NY) was used in the tests. Thereactor unit consists of a borosilicate glass bottle(500 ml capacity), a NaOH holder underneath the
cap for the absorption of carbon dioxide, the reac-tor cap, and an oxygen tube connection. The con-tents of the reactor are mixed by a magnetic stirrer.
The respirometer contains 12 reactor units, whichare submerged in a constant temperature waterbath. At the beginning and at the end of each ex-
periment respirometry bottles were analyzed forCOD, TKN, NH3, NO3, VSS and pH to examineclosures in oxygen, nitrogen and carbon mass bal-ances.
Experimental conditions for high So/Xo ratio tests.Each respirometer bottle was ®lled with 300 ml ofinorganic feed solution. The composition of this sol-
ution is similar to the feed-solution for the MBR,except that none of the organic components areadded, and ammonia is replaced by NaNO3 to
monitor ammonia production from casein(38 mgN±NO3/L). Furthermore, phosphate bu�er(0.06 M) is added to maintain a constant pH of 7.5throughout the experiment. With the exception of
the blank, 28.1 mg of protein (as casein) was addedto three respirometer bottles. The bottles were stir-red for 4 h in the constant temperature bath to
achieve thermal equilibrium and complete mixingbefore starting the experiment. The inoculum wasprepared by mixing 10 ml of activated sludge with
50 ml of the pyrophosphate bu�ered e�uent. Oneml of this inoculum was added to each bottle andthe test was started. The total biomass added to
each bottle was 5 mg VSS/L. The casein added cor-responds to 131.3 mg COD/L. Since the percentageby weight for nitrogen for casein is about 17%,15 mg TKN/L was added to each bottle.
Experimental conditions for low So/Xo ratio. All respi-rometer bottles were ®lled with 90 ml of inorganic feedsolution. Except for the two blanks, 20 mg of casein wasadded to each of the bottles corresponding to 280 mgCOD/L. Ten ml of the mixed liquor from the bioreactor(10 956 mg VSS/L) was added to all bottles. Five ml of0.2 N NaOH was added to the CO2 traps. These NaOHtraps were changed periodically over the total test time of500 h.In a parallel study, radiolabeled 14C-casein (20.6 mCi/mg
casein, Sigma, St. Louis, MO) was added to respirometrybottles prepared under the same conditions as above(same substrate and biomass concentration). The total ac-
Nazim Cicek et al.1556
tivity in each of the bottles was 4.1*105 disintegrations perminute (dpm).
One ml of the NaOH trap was counted for radioac-tivity, and 4 ml of the same sample was analyzed for totalinorganic carbon (TIC) using a Shimadzu TC analyzer,model 5000 (Shimadzu Co., Tokyo). Three 1 ml sampleswere taken periodically from all respirometer solutionsthroughout the experiment. To 1 ml of the sample onedrop of 10 N NaOH was added to rupture the cells andtrap the CO2 that remained in solution and was countedfor radioactivity. This activity represents the total activityin the solution. To the second sample one drop of 12 NHCl was added to strip the dissolved carbon dioxide. Theactivity counted in this sample represents the total activitypresent in organic form in the solution. The ®nal samplewas ®ltered over a 1 mm glass ®ber ®lter, and washed with1 ml of a 1% pyrophosphate solution (pH = 7.5). The ®l-trate together with the washes were acidi®ed to strip outthe dissolved carbon dioxide. The activity counted in thissample represents the organic bound soluble activity in thesolution. The ®lter was submerged in 1 ml of a 0.1 NNaOH solution for 24 h and then counted for radioac-tivity to determine the insoluble activity in the respirom-eter solution, representing cell incorporated andparticulate bound activity. The radioactivity was countedusing the TRI-CARB 2300TR SPECIAL scintillationcounter (Packard Instruments Co., Downess Grove, IL).At least 20 min before counting the samples, 15 ml ofULTIMA-GOLD scintillation liquid was added to eachsample.
RESULTS AND DISCUSSION
Biological performance of the MBR system
The system was operated approximately 100 days
before steady state was reached and data is pre-sented for the last 350 days. Loading rates wereequal to 0.129 kg COD/kg VSS/day and 0.016 kg
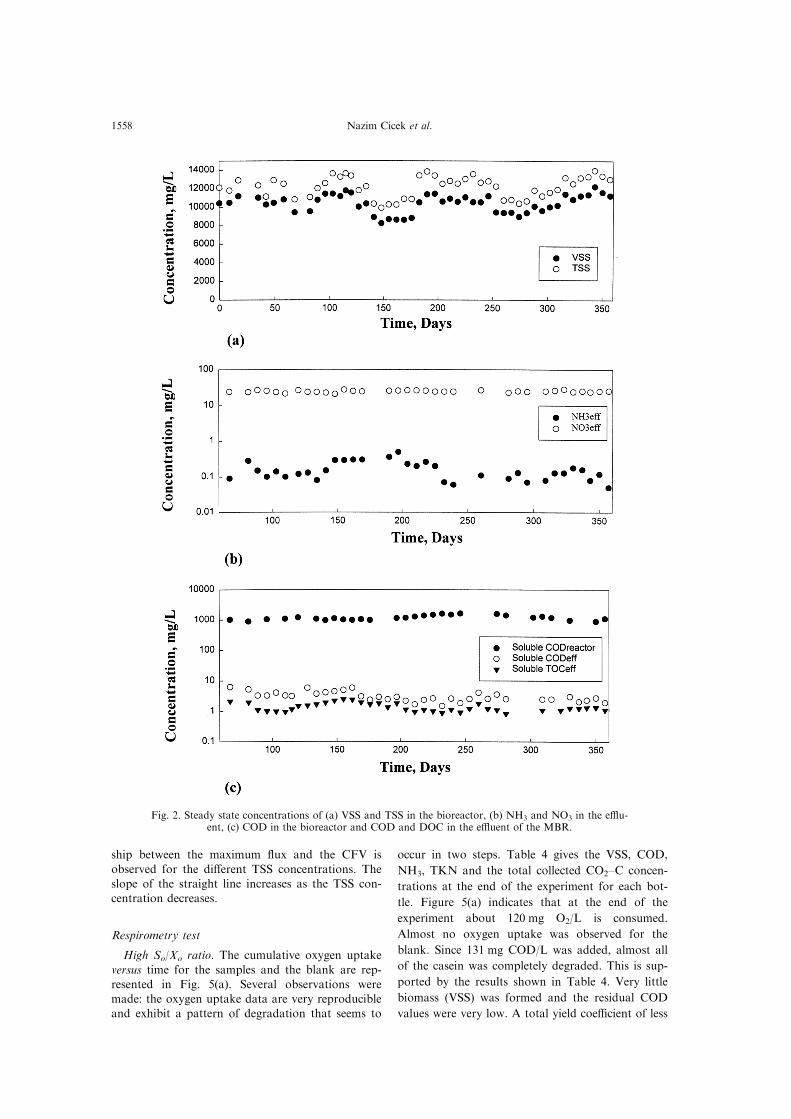
TKN/kg VSS/day. The average VSS and TSS con-centrations in the bioreactor were 10 116 mg/L and11 088 mg/L, respectively. The actual VSS and TSSconcentrations are presented as a function of time
in Fig. 2(a). The average e�uent ammonia concen-tration was less than 0.2 mg N/L, while the averagenitrate concentration was 28.3 mg N/L. The steady
state concentrations over time are presented inFig. 2(b). The average e�uent total COD and TOCconcentrations were 3 mg/L and 1.6 mg C/L, re-
spectively. The average COD in the bioreactor atsteady state was 14 715 mg/L. Figure 2(c) shows thetotal COD and TOC in the e�uent and the solubleCOD in the bioreactor at steady state. Table 3 sum-
marizes the biological performance of the system.This table indicates the excellent quality of the trea-ted water. Removal e�ciencies of 99.0% and 99.5%
of the total COD and total TKN are achieved inthe MBR process. Compared to the conventionalactivated sludge process, the MBR produces an
e�uent free of suspended solids. The membraneplays an important role in the treatment. This isobvious when comparing the soluble COD in the
bioreactor (898 mg COD/L) to the COD in thee�uent (3 mg COD/L). Sludge production calcu-lated from Table 3 is 0.29 kg TSS/kg CODremoved.This value is typical for an MBR at the present
conditions and is in the lower part of the range of0.3 to 0.6 kg TSS/kg CODremoved for the conven-
tional process (Fan et al., 1996).
Physical performance of the MBR system
The e�uent was analyzed for heterotrophicmicroorganisms. None of the plates showed any
colonies. This test was repeated and the same obser-vations were made. In the MS-2 virus experiment,the sample taken from the wash-tank contained
8,200 PFU/ml, while no plaques were observed onthe plates inoculated with the e�uent sample. Thisexperiment indicates that the membrane retains thebacteriophage MS-2. Since the initial concentration
in the wash tank was 1.5�105 PFU/ml only 5.5%of the viruses that were added to the wash tankwere counted. It is possible that due to the stress in
the system many viruses were killed or the virusesmight have adsorbed to impurities in the system.When this experiment was repeated, similar results
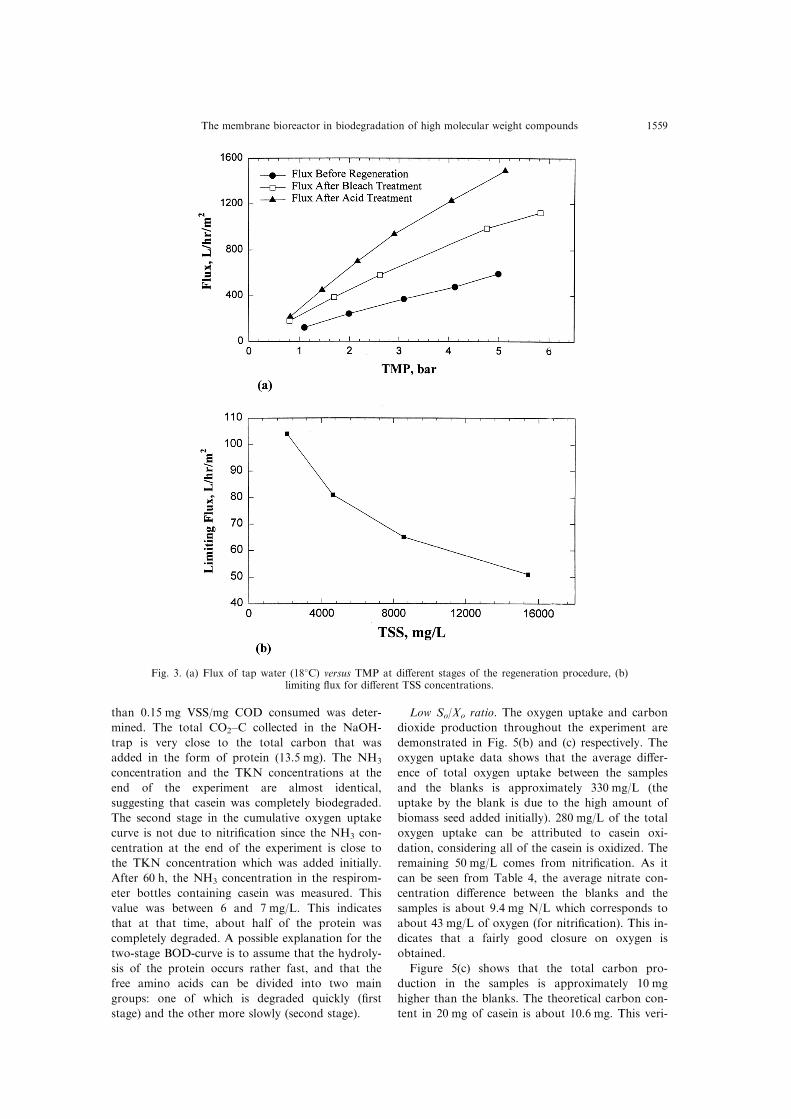
were obtained.Figure 3(a) shows the ¯ux of tap water at 188C
versus transmembrane pressure (TMP) at di�erentstages of the regeneration procedure. The ¯ux
increases linearly with TMP. The permeability ofthe membrane before regeneration, after the ®rststage of the regeneration (bleach treatment), and
after the second stage of the regeneration (acidtreatment) was 117, 214 and 302 L/h/m2/bar, re-spectively. Following its weekly regenerations, the
permeability was usually between 250 and 310 L/h/m2/bar, averaging 290 L/h/m2/bar. After a total op-eration time of 450 days, the permeability of the
regenerated membrane remained constant, indicat-ing that no irreversible fouling occurred.Several parameters, including the transmembrane
pressure (TMP), the cross ¯ow velocity (CFV), and
the total suspended solids concentration (TSS) in¯u-ence the ®ltration performance of the membrane.The limiting ¯ux, de®ned as the ¯ux after 24 h
under constant TMP (0.5 bar) and CFV (3 m/s), isplotted against TSS in Fig. 3(b). TSS concentrationsof 2.1, 4.6, 8.6 and 15.4 g/L were tested. As shown
in the ®gure, the limiting ¯ux decreases withincreasing TSS. The varying TSS concentrationswere obtained by concentrating the sludge in thesystem or by diluting it with e�uent.
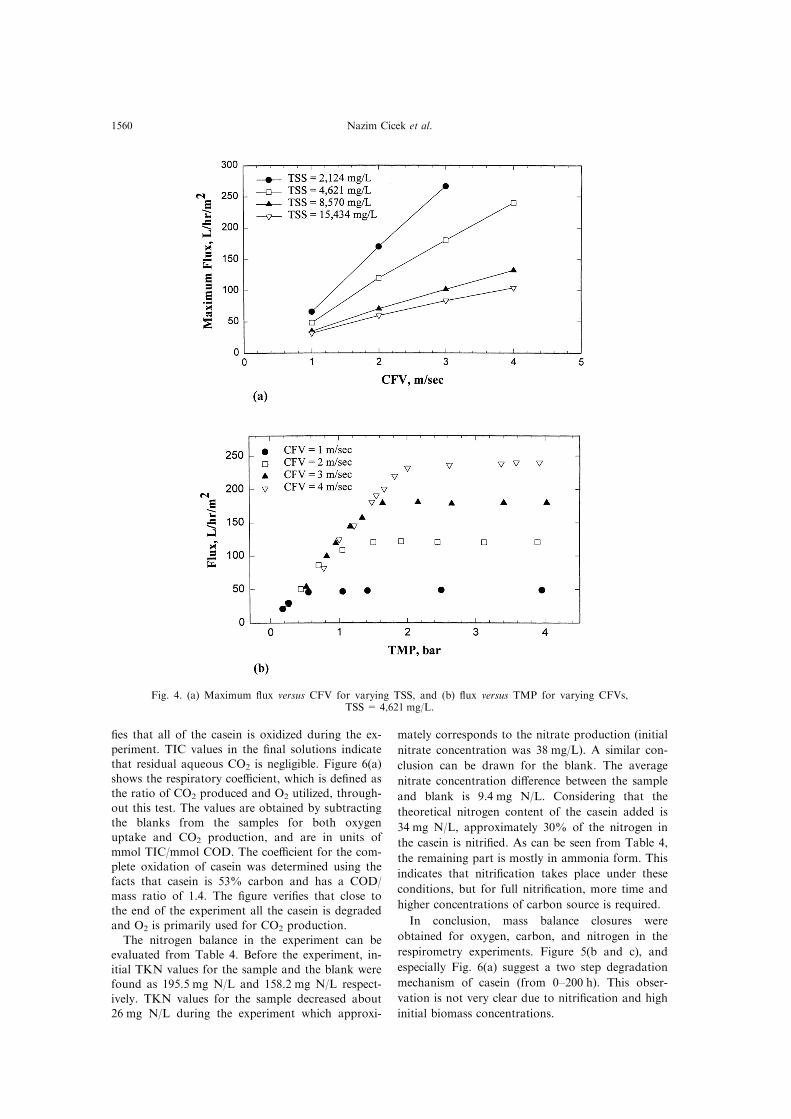
The e�ects of CFV and TMP were evaluated bymeasuring the ¯ux versus the TMP for CFVs of 1,2, 3 and 4 m/s and 4 di�erent TSS concentrations
(2,1, 4,6, 8,6 and 15,4 g/L). Figure 4(b) shows the¯ux versus the TMP for CFVs of 1, 2, 3 and 4 m/sfor a TSS concentration of 4,621 mg/L. The ¯ux
increases with increasing TMP. However, the ¯uxreaches a maximum, at which point increasing theTMP does not result in an increase in ¯ux. Similar
observations were made for the other TSS concen-trations. Figure 4(b) summarizes the results of thesetests. The maximum ¯ux is plotted versus the CFVat di�erent TSS concentrations. A linear relation-
The membrane bioreactor in biodegradation of high molecular weight compounds 1557
ship between the maximum ¯ux and the CFV is
observed for the di�erent TSS concentrations. Theslope of the straight line increases as the TSS con-centration decreases.
Respirometry test
High So/Xo ratio. The cumulative oxygen uptake
versus time for the samples and the blank are rep-resented in Fig. 5(a). Several observations weremade: the oxygen uptake data are very reproducibleand exhibit a pattern of degradation that seems to
occur in two steps. Table 4 gives the VSS, COD,
NH3, TKN and the total collected CO2±C concen-
trations at the end of the experiment for each bot-
tle. Figure 5(a) indicates that at the end of the
experiment about 120 mg O2/L is consumed.
Almost no oxygen uptake was observed for the
blank. Since 131 mg COD/L was added, almost all
of the casein was completely degraded. This is sup-
ported by the results shown in Table 4. Very little
biomass (VSS) was formed and the residual COD
values were very low. A total yield coe�cient of less
Fig. 2. Steady state concentrations of (a) VSS and TSS in the bioreactor, (b) NH3 and NO3 in the e�u-ent, (c) COD in the bioreactor and COD and DOC in the e�uent of the MBR.
Nazim Cicek et al.1558
than 0.15 mg VSS/mg COD consumed was deter-
mined. The total CO2±C collected in the NaOH-
trap is very close to the total carbon that was
added in the form of protein (13.5 mg). The NH3
concentration and the TKN concentrations at the
end of the experiment are almost identical,
suggesting that casein was completely biodegraded.
The second stage in the cumulative oxygen uptake
curve is not due to nitri®cation since the NH3 con-
centration at the end of the experiment is close to
the TKN concentration which was added initially.
After 60 h, the NH3 concentration in the respirom-
eter bottles containing casein was measured. This
value was between 6 and 7 mg/L. This indicates
that at that time, about half of the protein was
completely degraded. A possible explanation for the
two-stage BOD-curve is to assume that the hydroly-
sis of the protein occurs rather fast, and that the
free amino acids can be divided into two main
groups: one of which is degraded quickly (®rst
stage) and the other more slowly (second stage).
Low So/Xo ratio. The oxygen uptake and carbon
dioxide production throughout the experiment are
demonstrated in Fig. 5(b) and (c) respectively. The
oxygen uptake data shows that the average di�er-
ence of total oxygen uptake between the samples
and the blanks is approximately 330 mg/L (the
uptake by the blank is due to the high amount of
biomass seed added initially). 280 mg/L of the total
oxygen uptake can be attributed to casein oxi-
dation, considering all of the casein is oxidized. The
remaining 50 mg/L comes from nitri®cation. As it
can be seen from Table 4, the average nitrate con-
centration di�erence between the blanks and the
samples is about 9.4 mg N/L which corresponds to
about 43 mg/L of oxygen (for nitri®cation). This in-
dicates that a fairly good closure on oxygen is
obtained.
Figure 5(c) shows that the total carbon pro-
duction in the samples is approximately 10 mg
higher than the blanks. The theoretical carbon con-
tent in 20 mg of casein is about 10.6 mg. This veri-
Fig. 3. (a) Flux of tap water (188C) versus TMP at di�erent stages of the regeneration procedure, (b)limiting ¯ux for di�erent TSS concentrations.
The membrane bioreactor in biodegradation of high molecular weight compounds 1559
®es that all of the casein is oxidized during the ex-
periment. TIC values in the ®nal solutions indicate
that residual aqueous CO2 is negligible. Figure 6(a)
shows the respiratory coe�cient, which is de®ned as
the ratio of CO2 produced and O2 utilized, through-
out this test. The values are obtained by subtracting
the blanks from the samples for both oxygen
uptake and CO2 production, and are in units of
mmol TIC/mmol COD. The coe�cient for the com-
plete oxidation of casein was determined using the
facts that casein is 53% carbon and has a COD/
mass ratio of 1.4. The ®gure veri®es that close to
the end of the experiment all the casein is degraded
and O2 is primarily used for CO2 production.
The nitrogen balance in the experiment can be
evaluated from Table 4. Before the experiment, in-
itial TKN values for the sample and the blank were
found as 195.5 mg N/L and 158.2 mg N/L respect-
ively. TKN values for the sample decreased about
26 mg N/L during the experiment which approxi-
mately corresponds to the nitrate production (initial
nitrate concentration was 38 mg/L). A similar con-
clusion can be drawn for the blank. The average
nitrate concentration di�erence between the sample
and blank is 9.4 mg N/L. Considering that the
theoretical nitrogen content of the casein added is
34 mg N/L, approximately 30% of the nitrogen in
the casein is nitri®ed. As can be seen from Table 4,
the remaining part is mostly in ammonia form. This
indicates that nitri®cation takes place under these
conditions, but for full nitri®cation, more time and
higher concentrations of carbon source is required.
In conclusion, mass balance closures were
obtained for oxygen, carbon, and nitrogen in the
respirometry experiments. Figure 5(b and c), and
especially Fig. 6(a) suggest a two step degradation
mechanism of casein (from 0±200 h). This obser-
vation is not very clear due to nitri®cation and high
initial biomass concentrations.
Fig. 4. (a) Maximum ¯ux versus CFV for varying TSS, and (b) ¯ux versus TMP for varying CFVs,TSS = 4,621 mg/L.
Nazim Cicek et al.1560
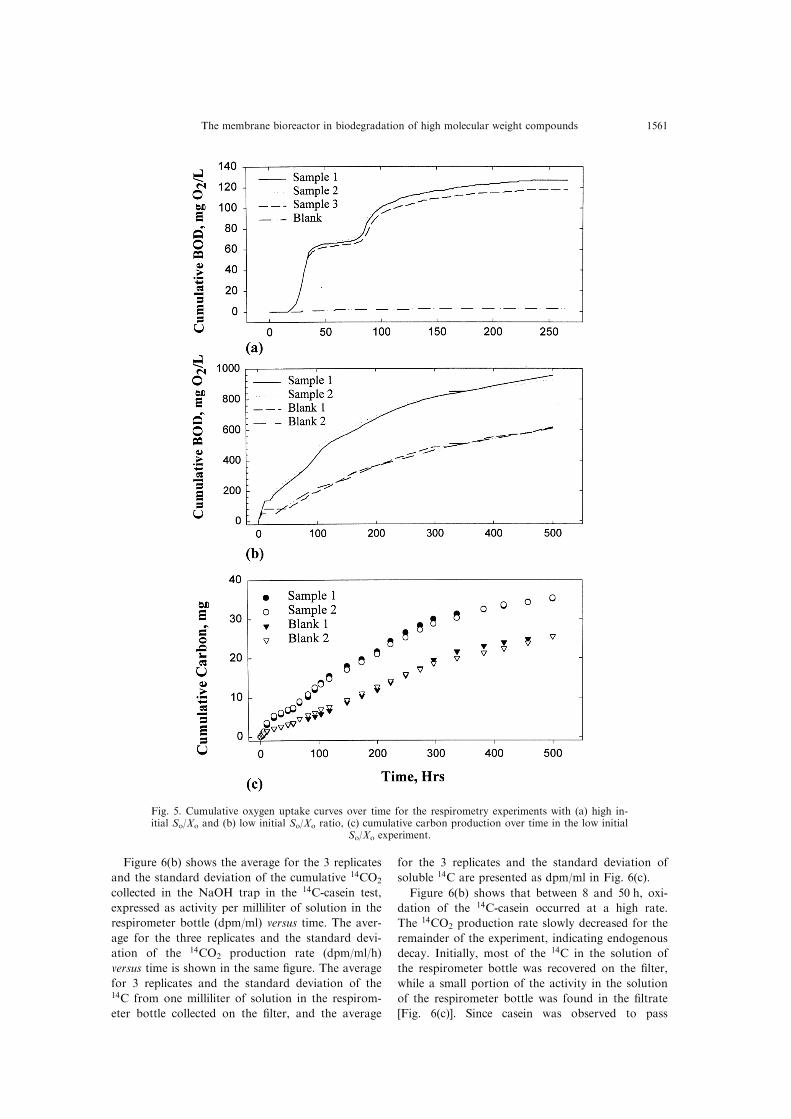
Figure 6(b) shows the average for the 3 replicates
and the standard deviation of the cumulative 14CO2
collected in the NaOH trap in the 14C-casein test,
expressed as activity per milliliter of solution in the
respirometer bottle (dpm/ml) versus time. The aver-
age for the three replicates and the standard devi-
ation of the 14CO2 production rate (dpm/ml/h)
versus time is shown in the same ®gure. The average
for 3 replicates and the standard deviation of the14C from one milliliter of solution in the respirom-
eter bottle collected on the ®lter, and the average
for the 3 replicates and the standard deviation of
soluble 14C are presented as dpm/ml in Fig. 6(c).
Figure 6(b) shows that between 8 and 50 h, oxi-
dation of the 14C-casein occurred at a high rate.
The 14CO2 production rate slowly decreased for the
remainder of the experiment, indicating endogenous
decay. Initially, most of the 14C in the solution of
the respirometer bottle was recovered on the ®lter,
while a small portion of the activity in the solution
of the respirometer bottle was found in the ®ltrate
[Fig. 6(c)]. Since casein was observed to pass
Fig. 5. Cumulative oxygen uptake curves over time for the respirometry experiments with (a) high in-itial So/Xo and (b) low initial So/Xo ratio, (c) cumulative carbon production over time in the low initial
So/Xo experiment.
The membrane bioreactor in biodegradation of high molecular weight compounds 1561
through a 1 mm ®lter, casein was adsorbed to and/
or trapped by the biomass to be ®ltered out. In
about 4 h, the fraction of the 14C recovered on the
®lter decreased rapidly, while the fraction of the 14C
in the ®ltrate increased. This suggests that hydroly-
sis occurred very quickly. Presumably, extracellular
enzymes cleaved the protein into smaller molecular
weight oligo-peptides, which passed through the ®l-
ter. At the same time, the 14CO2 production rate
started to increase. At the time the 14CO2 pro-
duction rate reached its maximum value (after
20 h), the activity recovered on the ®lter reached a
Table 4. Concentration of biological parameters analyzed at the end of the respiratory study with high initial So/Xo and low initial So/Xo
ratio
High initial So/Xo Low initial So/Xo
Parameter blank sample blank sample
VSS (mg/L) <5.0 15.723.5 1030230 945292TIC (mg C) <1.2 13.220.2 1.020.2 0.8520.2COD (mg/L) <5.0 12.521.9 1925228 1925230NH3 (mg N/L) <0.6 13.520.7 52.329.8 39.129.3TKN (mg N/L) <1.0 13.320.5 13725.7 169.420.9NO3 (mg N/L) 38.4 38.2 62.320.3 71.725.4
Fig. 6. For the respirometry experiment with low initial So/Xo ratio, (a) respiratory coe�cient overtime, (b) the cumulative 14C±CO2 production and 14CO2 production rate over time and (c) the soluble
and insoluble 14C over time.
Nazim Cicek et al.1562
second maximum. These observation suggest that ashydrolysis occurred, the peptides were taken up by
the microorganisms. In the cells, some of the pep-tides were oxidized to 14CO2, while the remainderwas incorporated into biomass.
The fraction of 14C carbon incorporated in thebiomass to the total 14C carbon consumed wasfound to be approximately 0.2. Although it is not
possible to compare this value to the observedyields in the bioreactor, it can be used as a refer-ence for future tests. Conditions for this test can be
summarized as 1.46*104 dpm 14C-casein consumed/mg COD-casein and 74.8 dpm 14C-biomass/mgVSS-biomass. Since 14C-casein was only used in theexperiment with low So/Xo conditions, no compari-
son with intrinsic conditions were performed.
CONCLUSIONS
Compared to the conventional activated sludgeprocess, the MBR system o�ers several advantages.
Due to the membrane, the e�uent did not containany suspended solids. Removal e�ciencies of 99.0and 99.5% of the in¯uent COD and TKN were rea-
lized in the MBR process. Sludge production in theMBR system was low. No heterotrophic microor-ganisms were found in the e�uent, indicating thatthe membrane retains all heterotrophic microorgan-
isms. The bacteriophage study shows that the mem-brane also retains the MS-2 virus.After more than 50 regenerations, the per-
meability of the membrane using tap water at 188Cappeared unchanged from its original state, indicat-ing that irreversible fouling does not occur. The
¯ux through the membrane decreased rapidly forTSS concentrations between 2 and 8 g/L, while aslower decrease was observed for TSS concen-trations between 8 and 15 g/L. The e�ect of the
cross ¯ow velocity (CFV) and the transmembranepressure (TMP) for di�erent TSS concentrationswas studied. The ¯ux increased linearly with the
TMP, until it reached a maximum, at which pointincreasing the TMP did not result in an increase in¯ux. A linear relationship between the maximum
¯ux and the CFV for di�erent TSS concentrationswas observed. The slope of the straight lineincreased as the TSS decreased.
Using the MBR mixed liquor in respirometry ex-periments with a high So/Xo ratio, several obser-vations were made: (1) the oxidation of caseinoccurs in two distinct steps, (2) the yield coe�cient
is smaller than 0.15 mg VSS/mg COD consumedand (3) nitri®cation does not occur, all organicnitrogen is converted to ammonia. Under low So/
Xo conditions, using 14C-casein, the following ob-servations were made: (1) hydrolysis of caseinoccurs very fast and (2) oxygen uptake and nitrogen
measurements suggest nitri®cation occurs. Theseresults show that the culture in the bioreactor is
capable of degrading casein under various con-ditions. However, nitri®cation only takes place
under low So/Xo conditions where su�cient amountof nitrifying bacteria are present to slowly convertthe organic nitrogen.
REFERENCES
APHA, AWWA, WEF (1992) Standard Methods for theExamination of Water and Wastewater. APHA,Washington.
Chaize S. and Huyard A. (1991) Membrane bioreactor ondomestic wastewater treatment: Sludge production andmodeling approach. Wat. Sci. Tech. 23, 1591±1600.
Chiemchaisri C., Yamamota K. and Vigneswaran S. (1993)Household membrane bioreactor in domestic wastewatertreatment. Wat. Sci. Tech. 27, 171±178.
Chiemchaisri C., Wong Y. K., Urase T. and YamamotaK. (1992) Organic stabilization and nitrogen removal inmembrane separation bioreactor for domestic waste-water treatment. Wat. Sci. Tech. 25, 231±240.
Fan X., Urbain V., Qian Y. and Manem J. (1996)Nitri®cation and mass balance with a MBR for munici-pal wastewater treatment. Proc. of the 18th IAWQBiennial International Conference and Exhibition,Singapore, June 23±28.
Huyard A., Trouve E. and Manem J. (1992) Recentadvances on bioreactors applications to water andwastewater treatment. Proc. Euromembrane Inter®ltraConf., Paris 6(21), 189±193.
Grady C. P. L. Jr., Smets B. F. and Barbeau D. S. (1996)Variability in kinetic parameter estimates: A review ofpossible causes and a proposed terminology. Wat. Res.30, 742±748.
Jeannot, F., Francoeur E., Manem J. and Beaubien A.(1992) Treatment of industrial e�uents by anaerobicmembrane bioreactors. Proc. of the Enforced Techniquesfor Water and Waste Treatment Symp., pp. 37±47.
Knoblock M. D., Sutton P. M., Mishra P. N., Gupta K.and Janson A. (1994) Membrane biological reactor sys-tem for treatment of oily wastewaters. Wat. Environ.Res. 66, 133±139.
Magara Y. and Itoh M. (1991) The e�ect of operationalfactors on solid/liquid separation by ultra-membrane ®l-tration in a biological denitri®cation system for collectedhuman excreta treatment plants. Wat. Sci. 23, 1583±1590.
Manem, J. and Sanderson R. (1996) Membrane bio-reactors in water treatment processes, ch. 17.AWWARF/Lyonnaise des Eaux/WRC. McGraw Hill(Eds).
Nagano A., Arikawa E. and Kobayashi H. (1992) Thetreatment of liquor wastewater containing high-strengthsuspended solids by membrane bioreactor system. Wat.Sci. Tech. 26, 887±895.
Ross W. R., Barnard J. P., Le Roux J. and Villiers H.A. (1990) Application of ultra®ltration membranes forsolid±liquid separation in anaerobic digestion systems:The ADUF process. Wat. Sci. 16, 85±91.
Roullet, R. (1989). Proceedings of Workshop on SelectedTopics on Clean Technology, pp. 171±179. AsianInstitute of Technology, Bangkok.
Rozich A. F. and Gaudy A. F. (1985) Response of phe-nol-acclimated sludge process to quantitative shockloading. J. Wat. Pollut. Control Fed. 57, 795±804.
Trouve E., Dupont C., Huyard A. and Manem J. (1994)Cost of anaerobic treatment of wastewaters on mem-brane bioreactors: optimal ®ltration device. Proc. of the7th Int. Symp. on Anaerobic Digestion, pp. 567±576.Cape Town, South Africa.
The membrane bioreactor in biodegradation of high molecular weight compounds 1563