introduction of stainless steel production - International ...
Upload
khangminh22Category
view
0download
0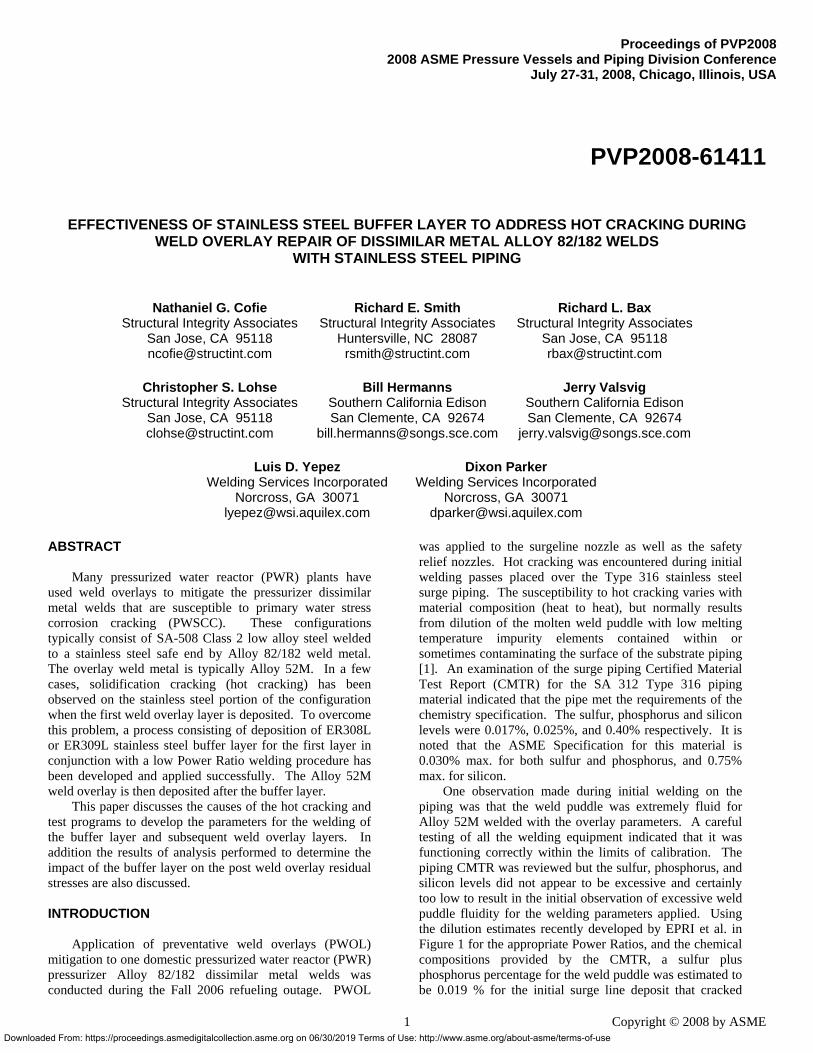
Downloaded F
Proceedings of PVP2008
2008 ASME Pressure Vessels and Piping Division Conference July 27-31, 2008, Chicago, IL
PVP2008-61411
EFFECTIVENESS OF STAINLESS STEEL BUFFER LAYER TO ADDRESS HOT CRACKING DURING WELD OVERLAY REPAIR OF DISSIMILAR METAL ALLOY 82/182 WELDS
WITH STAINLESS STEEL PIPING
Nathaniel G. Cofie Structural Integrity Associates
San Jose, CA 95118 [email protected]
Richard E. Smith Structural Integrity Associates
Huntersville, NC 28087 [email protected]
Richard L. Bax Structural Integrity Associates
San Jose, CA 95118 [email protected]
Christopher S. Lohse Structural Integrity Associates
San Jose, CA 95118 [email protected]
Bill Hermanns Southern California Edison San Clemente, CA 92674
Jerry Valsvig Southern California Edison San Clemente, CA 92674
Luis D. Yepez Welding Services Incorporated
Norcross, GA 30071 [email protected]
Dixon Parker Welding Services Incorporated
Norcross, GA 30071 [email protected]
Proceedings of PVP2008 2008 ASME Pressure Vessels and Piping Division Conference
July 27-31, 2008, Chicago, Illinois, USA
ABSTRACT Many pressurized water reactor (PWR) plants have used weld overlays to mitigate the pressurizer dissimilar metal welds that are susceptible to primary water stress corrosion cracking (PWSCC). These configurations typically consist of SA-508 Class 2 low alloy steel welded to a stainless steel safe end by Alloy 82/182 weld metal. The overlay weld metal is typically Alloy 52M. In a few cases, solidification cracking (hot cracking) has been observed on the stainless steel portion of the configuration when the first weld overlay layer is deposited. To overcome this problem, a process consisting of deposition of ER308L or ER309L stainless steel buffer layer for the first layer in conjunction with a low Power Ratio welding procedure has been developed and applied successfully. The Alloy 52M weld overlay is then deposited after the buffer layer. This paper discusses the causes of the hot cracking and test programs to develop the parameters for the welding of the buffer layer and subsequent weld overlay layers. In addition the results of analysis performed to determine the impact of the buffer layer on the post weld overlay residual stresses are also discussed. INTRODUCTION Application of preventative weld overlays (PWOL) mitigation to one domestic pressurized water reactor (PWR) pressurizer Alloy 82/182 dissimilar metal welds was conducted during the Fall 2006 refueling outage. PWOL
1rom: https://proceedings.asmedigitalcollection.asme.org on 06/30/2019 Terms of Us
was applied to the surgeline nozzle as well as the safety relief nozzles. Hot cracking was encountered during initial welding passes placed over the Type 316 stainless steel surge piping. The susceptibility to hot cracking varies with material composition (heat to heat), but normally results from dilution of the molten weld puddle with low melting temperature impurity elements contained within or sometimes contaminating the surface of the substrate piping [1]. An examination of the surge piping Certified Material Test Report (CMTR) for the SA 312 Type 316 piping material indicated that the pipe met the requirements of the chemistry specification. The sulfur, phosphorus and silicon levels were 0.017%, 0.025%, and 0.40% respectively. It is noted that the ASME Specification for this material is 0.030% max. for both sulfur and phosphorus, and 0.75% max. for silicon. One observation made during initial welding on the piping was that the weld puddle was extremely fluid for Alloy 52M welded with the overlay parameters. A careful testing of all the welding equipment indicated that it was functioning correctly within the limits of calibration. The piping CMTR was reviewed but the sulfur, phosphorus, and silicon levels did not appear to be excessive and certainly too low to result in the initial observation of excessive weld puddle fluidity for the welding parameters applied. Using the dilution estimates recently developed by EPRI et al. in Figure 1 for the appropriate Power Ratios, and the chemical compositions provided by the CMTR, a sulfur plus phosphorus percentage for the weld puddle was estimated to be 0.019 % for the initial surge line deposit that cracked
Copyright © 2008 by ASME e: http://www.asme.org/about-asme/terms-of-use
Downloa
extensively, and 0.013 % for the second test weld that had reduced level of cracking. Therefore it was suggested that surface contamination with harmful impurity elements may have contributed to the cracking.
Dilution vs Power Ratio for Alloy 52M over TP304L Stainless Steel
0.00
10.00
20.00
30.00
40.00
50.00
60.00
70.00
70 80 90 100 110 120 130 140 150 160 170 180 190
Power Ratio (KW/in2)
Dilu
tion
%
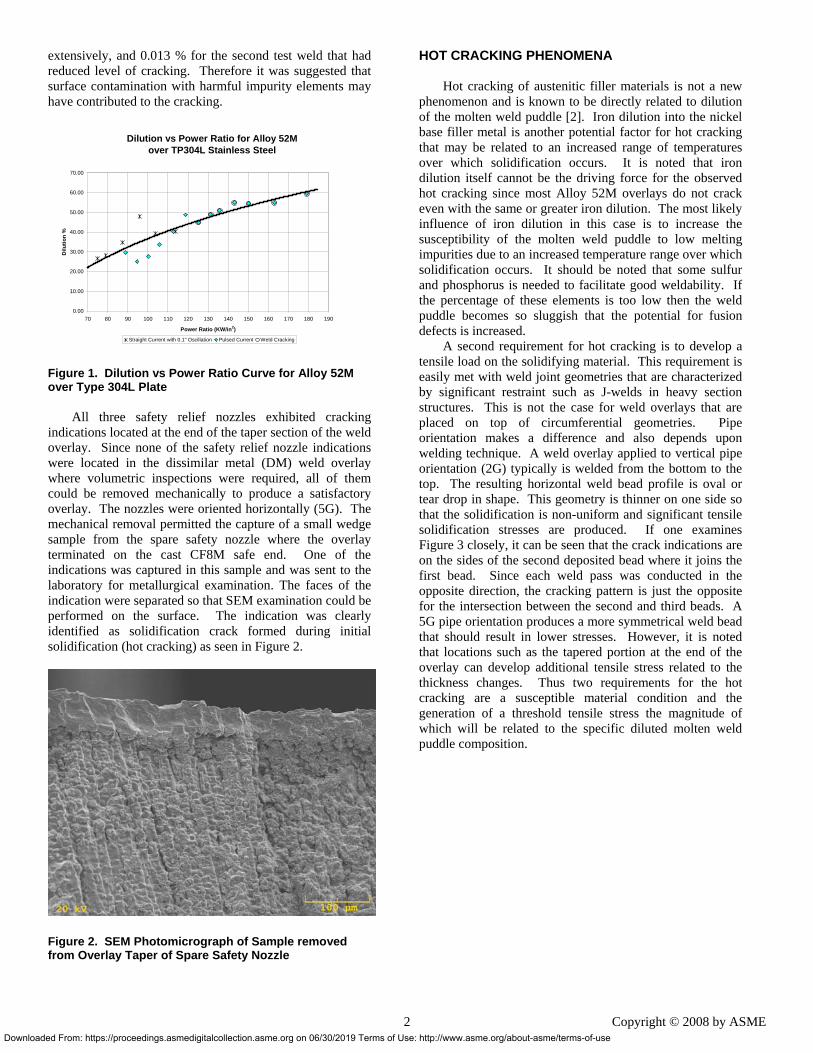
Straight Current with 0.1" Oscillation Pulsed Current Weld Cracking Figure 1. Dilution vs Power Ratio Curve for Alloy 52M over Type 304L Plate All three safety relief nozzles exhibited cracking indications located at the end of the taper section of the weld overlay. Since none of the safety relief nozzle indications were located in the dissimilar metal (DM) weld overlay where volumetric inspections were required, all of them could be removed mechanically to produce a satisfactory overlay. The nozzles were oriented horizontally (5G). The mechanical removal permitted the capture of a small wedge sample from the spare safety nozzle where the overlay terminated on the cast CF8M safe end. One of the indications was captured in this sample and was sent to the laboratory for metallurgical examination. The faces of the indication were separated so that SEM examination could be performed on the surface. The indication was clearly identified as solidification crack formed during initial solidification (hot cracking) as seen in Figure 2.
Figure 2. SEM Photomicrograph of Sample removed from Overlay Taper of Spare Safety Nozzle
2
ded From: https://proceedings.asmedigitalcollection.asme.org on 06/30/2019 Terms of Us
HOT CRACKING PHENOMENA Hot cracking of austenitic filler materials is not a new phenomenon and is known to be directly related to dilution of the molten weld puddle [2]. Iron dilution into the nickel base filler metal is another potential factor for hot cracking that may be related to an increased range of temperatures over which solidification occurs. It is noted that iron dilution itself cannot be the driving force for the observed hot cracking since most Alloy 52M overlays do not crack even with the same or greater iron dilution. The most likely influence of iron dilution in this case is to increase the susceptibility of the molten weld puddle to low melting impurities due to an increased temperature range over which solidification occurs. It should be noted that some sulfur and phosphorus is needed to facilitate good weldability. If the percentage of these elements is too low then the weld puddle becomes so sluggish that the potential for fusion defects is increased. A second requirement for hot cracking is to develop a tensile load on the solidifying material. This requirement is easily met with weld joint geometries that are characterized by significant restraint such as J-welds in heavy section structures. This is not the case for weld overlays that are placed on top of circumferential geometries. Pipe orientation makes a difference and also depends upon welding technique. A weld overlay applied to vertical pipe orientation (2G) typically is welded from the bottom to the top. The resulting horizontal weld bead profile is oval or tear drop in shape. This geometry is thinner on one side so that the solidification is non-uniform and significant tensile solidification stresses are produced. If one examines Figure 3 closely, it can be seen that the crack indications are on the sides of the second deposited bead where it joins the first bead. Since each weld pass was conducted in the opposite direction, the cracking pattern is just the opposite for the intersection between the second and third beads. A 5G pipe orientation produces a more symmetrical weld bead that should result in lower stresses. However, it is noted that locations such as the tapered portion at the end of the overlay can develop additional tensile stress related to the thickness changes. Thus two requirements for the hot cracking are a susceptible material condition and the generation of a threshold tensile stress the magnitude of which will be related to the specific diluted molten weld puddle composition.
Copyright © 2008 by ASME e: http://www.asme.org/about-asme/terms-of-use

Downl
Figure 3. Photograph of the Liquid Dye Penetrant Test showing the Hot Cracking (Note that not all cracking penetrated the surface but were revealed by light grinding) MITIGATION TEST PROGRAMS A three phase test program was initiated to address the hot cracking phenomena and develop mitigating techniques. Initial On-Site Test Program A rapid on-site test program was initiated to see if the problem could be mitigated by modifying the welding procedure and technique. Type 316 stainless steel pipe material was obtained that had a composition similar to the composition of the surge piping. The application of the Alloy 52M overlay using the same welding procedure (Power Ratio of 113 kW/in2) and technique, the same heat of filler material, and the same welding equipment reproduced the hot cracking defects seen in the initial weld beads on the surge piping. The procedure was adjusted to a lower Power Ratio of 82 kW/in2 so that the molten weld puddle dilution would be lowered from 42% dilution to 28% dilution based upon the weld dilution curve in Figure 1. This action reduced the tendency for hot cracking to the extent that hot cracking in the test pipe was not observed using the liquid dye penetrant test. Tests were conducted both with and without water cooling on the inside of the pipe. The overlay deposit surface was lightly ground prior to testing to improve the testing sensitivity. In addition, a cross-section of the test pipe was submitted for testing in a scanning electron microscope so that electron diffraction spectroscopy (EDS) could be performed to determine if a compositional gradient existed in the test piece. It was found that a thin layer on the surface was high in sulfur and silicon although the layer was very thin. Subsequent testing of this material at the EPRI facility by normal spectrographic analysis on the outer surface did not indicate any significant surface concentration of impurities or silicon on the test pipe. These encouraging results led to the application of an additional three bead test layer deposited at a new location on the actual surge pipe just above the initial location but
oaded From: https://proceedings.asmedigitalcollection.asme.org on 06/30/2019 Terms of U
below the stainless steel weld joining the centrifugally cast CF8M safe end and the surge piping. The lower Power Ratio welding parameters were used. Testing by liquid penetrant suggested that the tendency for hot cracking had been significantly reduced with the lower Power Ratio, but unfortunately some cracking still persisted. It was decided to remove all the applied weld beads, including any hot cracking at the surface of the pipe, and abandon the application of the PWOL over the surge nozzle welds until a sure mitigation for the hot cracking could be developed and proven. Additional test programs were developed to examine the validity of using a stainless steel buffer layer over the piping susceptible to avoid hot cracking of the Alloy 52M overlay material. A multitask effort was designed to examine single effects of welding parameters and filler materials, produce a proof of concept mockup, and finally to weld a full scale demonstration mockup of the surge nozzle configuration including the use of similar materials and sizes found in pressurizers at the plant. Intermediate Test Program The objective of this program was to determine the effects of individual parameters on hot cracking (single effects testing) using the test pipe material employed for the on-site testing. Five individual tests were performed and consisted of welding approximately 4” x 6” test pads on the surface of the pipe oriented in the 2G position with water backing to simulate the surge nozzle piping orientation. The weld pads were welded on the Type 316 stainless steel piping in accordance using a mock-up test procedure provided by the utility. The mockup welding provided a reasonable representation of the surge piping considering composition, orientation, welding parameters and ID water cooling. The examination criterion was to perform a liquid dye penetrant examination to examine for surface breaking indications as had been seen on the surge line piping two times and multiple times with the on-site laboratory testing. Finally all of the samples were submitted to the EPRI metallurgical laboratory for examination of the cross-section. The test objectives and results are summarized in Table 1. The results presented in this table indicated that the cracking seen in the initial Alloy 52M weld beads placed on the surge piping could be duplicated on the test pipe using comparable welding conditions. Furthermore, the testing suggested that significantly lowering the weld dilution would improve the resistance to cracking. Finally, the use of a buffer layer of ER308-L stainless steel in between the high impurity piping and the Alloy 52M overlay deposit will effectively eliminate the potential for hot cracking.
3 Copyright © 2008 by ASME se: http://www.asme.org/about-asme/terms-of-use
Downlo
Table 1. Objectives and Results of Intermediate Test Program Sample Objective Results
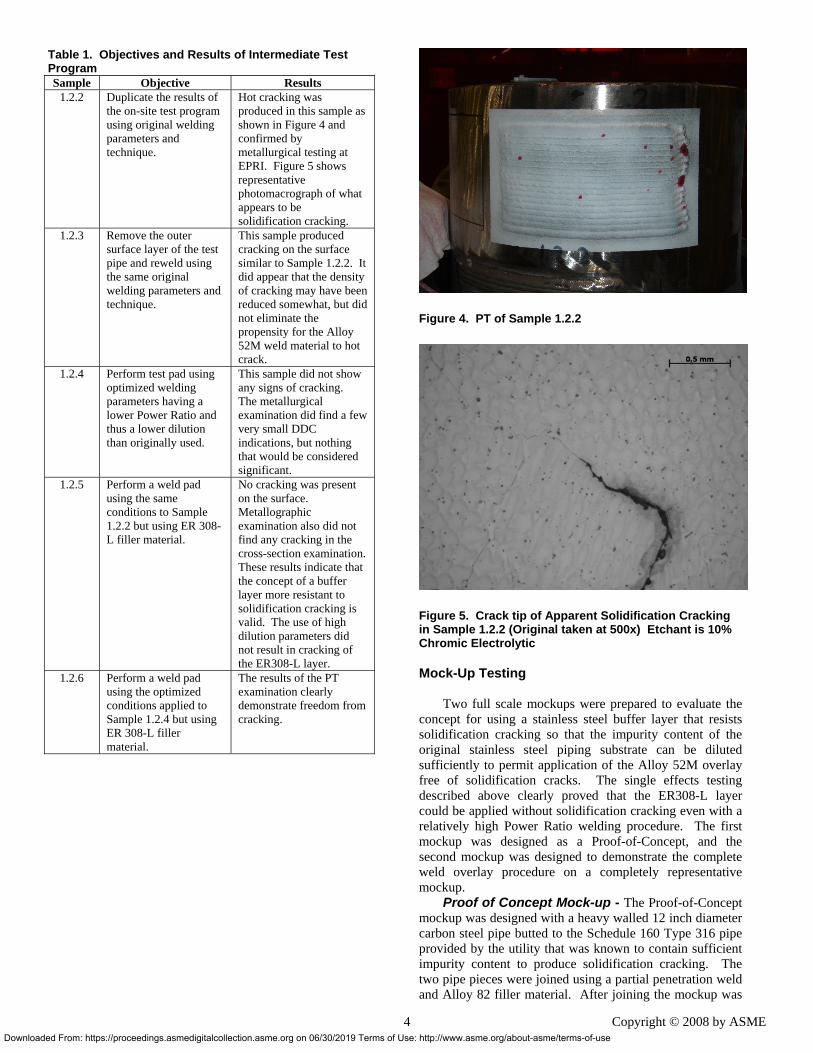
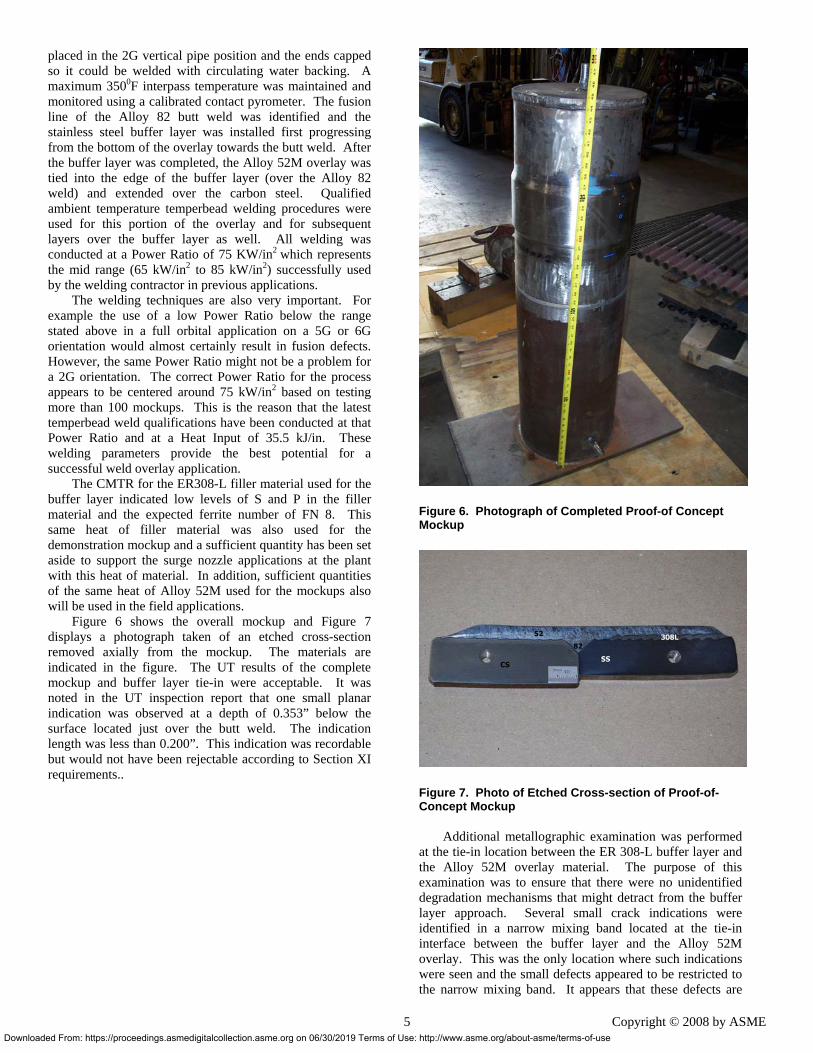
1.2.2 Duplicate the results of the on-site test program using original welding parameters and technique.
Hot cracking was produced in this sample as shown in Figure 4 and confirmed by metallurgical testing at EPRI. Figure 5 shows representative photomacrograph of what appears to be solidification cracking.
1.2.3 Remove the outer surface layer of the test pipe and reweld using the same original welding parameters and technique.
This sample produced cracking on the surface similar to Sample 1.2.2. It did appear that the density of cracking may have been reduced somewhat, but did not eliminate the propensity for the Alloy 52M weld material to hot crack.
1.2.4 Perform test pad using optimized welding parameters having a lower Power Ratio and thus a lower dilution than originally used.
This sample did not show any signs of cracking. The metallurgical examination did find a few very small DDC indications, but nothing that would be considered significant.
1.2.5 Perform a weld pad using the same conditions to Sample 1.2.2 but using ER 308-L filler material.
No cracking was present on the surface. Metallographic examination also did not find any cracking in the cross-section examination. These results indicate that the concept of a buffer layer more resistant to solidification cracking is valid. The use of high dilution parameters did not result in cracking of the ER308-L layer.
1.2.6 Perform a weld pad using the optimized conditions applied to Sample 1.2.4 but using ER 308-L filler material.
The results of the PT examination clearly demonstrate freedom from cracking.
aded From: https://proceedings.asmedigitalcollection.asme.org on 06/30/2019 Terms of U
Figure 4. PT of Sample 1.2.2
Figure 5. Crack tip of Apparent Solidification Cracking in Sample 1.2.2 (Original taken at 500x) Etchant is 10% Chromic Electrolytic Mock-Up Testing Two full scale mockups were prepared to evaluate the concept for using a stainless steel buffer layer that resists solidification cracking so that the impurity content of the original stainless steel piping substrate can be diluted sufficiently to permit application of the Alloy 52M overlay free of solidification cracks. The single effects testing described above clearly proved that the ER308-L layer could be applied without solidification cracking even with a relatively high Power Ratio welding procedure. The first mockup was designed as a Proof-of-Concept, and the second mockup was designed to demonstrate the complete weld overlay procedure on a completely representative mockup.
Proof of Concept Mock-up - The Proof-of-Concept mockup was designed with a heavy walled 12 inch diameter carbon steel pipe butted to the Schedule 160 Type 316 pipe provided by the utility that was known to contain sufficient impurity content to produce solidification cracking. The two pipe pieces were joined using a partial penetration weld and Alloy 82 filler material. After joining the mockup was
4 Copyright © 2008 by ASME se: http://www.asme.org/about-asme/terms-of-use
Downlo
placed in the 2G vertical pipe position and the ends capped so it could be welded with circulating water backing. A maximum 3500F interpass temperature was maintained and monitored using a calibrated contact pyrometer. The fusion line of the Alloy 82 butt weld was identified and the stainless steel buffer layer was installed first progressing from the bottom of the overlay towards the butt weld. After the buffer layer was completed, the Alloy 52M overlay was tied into the edge of the buffer layer (over the Alloy 82 weld) and extended over the carbon steel. Qualified ambient temperature temperbead welding procedures were used for this portion of the overlay and for subsequent layers over the buffer layer as well. All welding was conducted at a Power Ratio of 75 KW/in2
which represents the mid range (65 kW/in2 to 85 kW/in2) successfully used by the welding contractor in previous applications. The welding techniques are also very important. For example the use of a low Power Ratio below the range stated above in a full orbital application on a 5G or 6G orientation would almost certainly result in fusion defects. However, the same Power Ratio might not be a problem for a 2G orientation. The correct Power Ratio for the process appears to be centered around 75 kW/in2 based on testing more than 100 mockups. This is the reason that the latest temperbead weld qualifications have been conducted at that Power Ratio and at a Heat Input of 35.5 kJ/in. These welding parameters provide the best potential for a successful weld overlay application. The CMTR for the ER308-L filler material used for the buffer layer indicated low levels of S and P in the filler material and the expected ferrite number of FN 8. This same heat of filler material was also used for the demonstration mockup and a sufficient quantity has been set aside to support the surge nozzle applications at the plant with this heat of material. In addition, sufficient quantities of the same heat of Alloy 52M used for the mockups also will be used in the field applications. Figure 6 shows the overall mockup and Figure 7 displays a photograph taken of an etched cross-section removed axially from the mockup. The materials are indicated in the figure. The UT results of the complete mockup and buffer layer tie-in were acceptable. It was noted in the UT inspection report that one small planar indication was observed at a depth of 0.353” below the surface located just over the butt weld. The indication length was less than 0.200”. This indication was recordable but would not have been rejectable according to Section XI requirements..
aded From: https://proceedings.asmedigitalcollection.asme.org on 06/30/2019 Terms of
Figure 6. Photograph of Completed Proof-of Concept Mockup
Figure 7. Photo of Etched Cross-section of Proof-of-Concept Mockup Additional metallographic examination was performed at the tie-in location between the ER 308-L buffer layer and the Alloy 52M overlay material. The purpose of this examination was to ensure that there were no unidentified degradation mechanisms that might detract from the buffer layer approach. Several small crack indications were identified in a narrow mixing band located at the tie-in interface between the buffer layer and the Alloy 52M overlay. This was the only location where such indications were seen and the small defects appeared to be restricted to the narrow mixing band. It appears that these defects are
5 Copyright © 2008 by ASME Use: http://www.asme.org/about-asme/terms-of-use
Downlo
ductility dip cracks (DDC) located at grain boundaries that appear to be migrated from the original solidification cell boundaries. Also the very small sizes (less than 0.5 mm) support a DDC mechanism for microfissuring as opposed to solidification cracking. Defects of this size are frequently observed with Alloy 52M deposits but do not degrade the structural or corrosion performance of the overlay function. The indications were so small that they are not detected by the very sensitive LPA UT examination that had been qualified for PDI exams and used many times in field applications. An evaluation of the results from the Proof-of-Concept testing validated the approach and the testing proceeded to a full scale demonstration mockup.
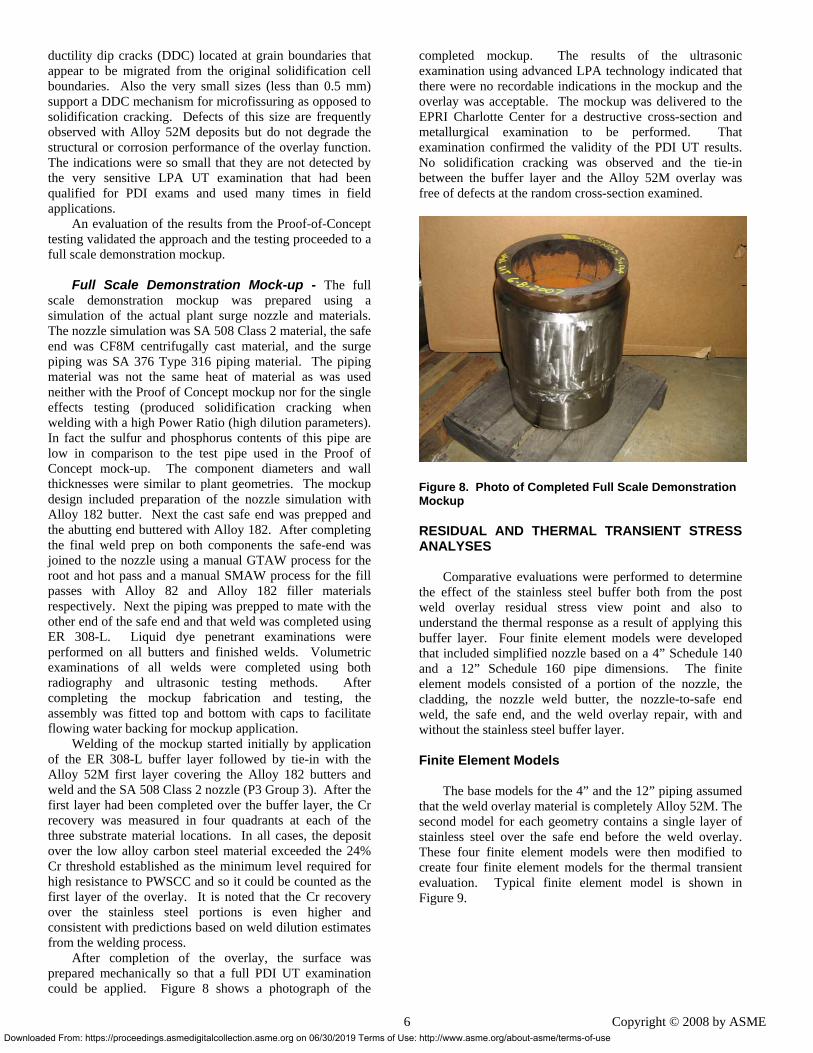
Full Scale Demonstration Mock-up - The full scale demonstration mockup was prepared using a simulation of the actual plant surge nozzle and materials. The nozzle simulation was SA 508 Class 2 material, the safe end was CF8M centrifugally cast material, and the surge piping was SA 376 Type 316 piping material. The piping material was not the same heat of material as was used neither with the Proof of Concept mockup nor for the single effects testing (produced solidification cracking when welding with a high Power Ratio (high dilution parameters). In fact the sulfur and phosphorus contents of this pipe are low in comparison to the test pipe used in the Proof of Concept mock-up. The component diameters and wall thicknesses were similar to plant geometries. The mockup design included preparation of the nozzle simulation with Alloy 182 butter. Next the cast safe end was prepped and the abutting end buttered with Alloy 182. After completing the final weld prep on both components the safe-end was joined to the nozzle using a manual GTAW process for the root and hot pass and a manual SMAW process for the fill passes with Alloy 82 and Alloy 182 filler materials respectively. Next the piping was prepped to mate with the other end of the safe end and that weld was completed using ER 308-L. Liquid dye penetrant examinations were performed on all butters and finished welds. Volumetric examinations of all welds were completed using both radiography and ultrasonic testing methods. After completing the mockup fabrication and testing, the assembly was fitted top and bottom with caps to facilitate flowing water backing for mockup application. Welding of the mockup started initially by application of the ER 308-L buffer layer followed by tie-in with the Alloy 52M first layer covering the Alloy 182 butters and weld and the SA 508 Class 2 nozzle (P3 Group 3). After the first layer had been completed over the buffer layer, the Cr recovery was measured in four quadrants at each of the three substrate material locations. In all cases, the deposit over the low alloy carbon steel material exceeded the 24% Cr threshold established as the minimum level required for high resistance to PWSCC and so it could be counted as the first layer of the overlay. It is noted that the Cr recovery over the stainless steel portions is even higher and consistent with predictions based on weld dilution estimates from the welding process. After completion of the overlay, the surface was prepared mechanically so that a full PDI UT examination could be applied. Figure 8 shows a photograph of the
aded From: https://proceedings.asmedigitalcollection.asme.org on 06/30/2019 Terms of U
completed mockup. The results of the ultrasonic examination using advanced LPA technology indicated that there were no recordable indications in the mockup and the overlay was acceptable. The mockup was delivered to the EPRI Charlotte Center for a destructive cross-section and metallurgical examination to be performed. That examination confirmed the validity of the PDI UT results. No solidification cracking was observed and the tie-in between the buffer layer and the Alloy 52M overlay was free of defects at the random cross-section examined.
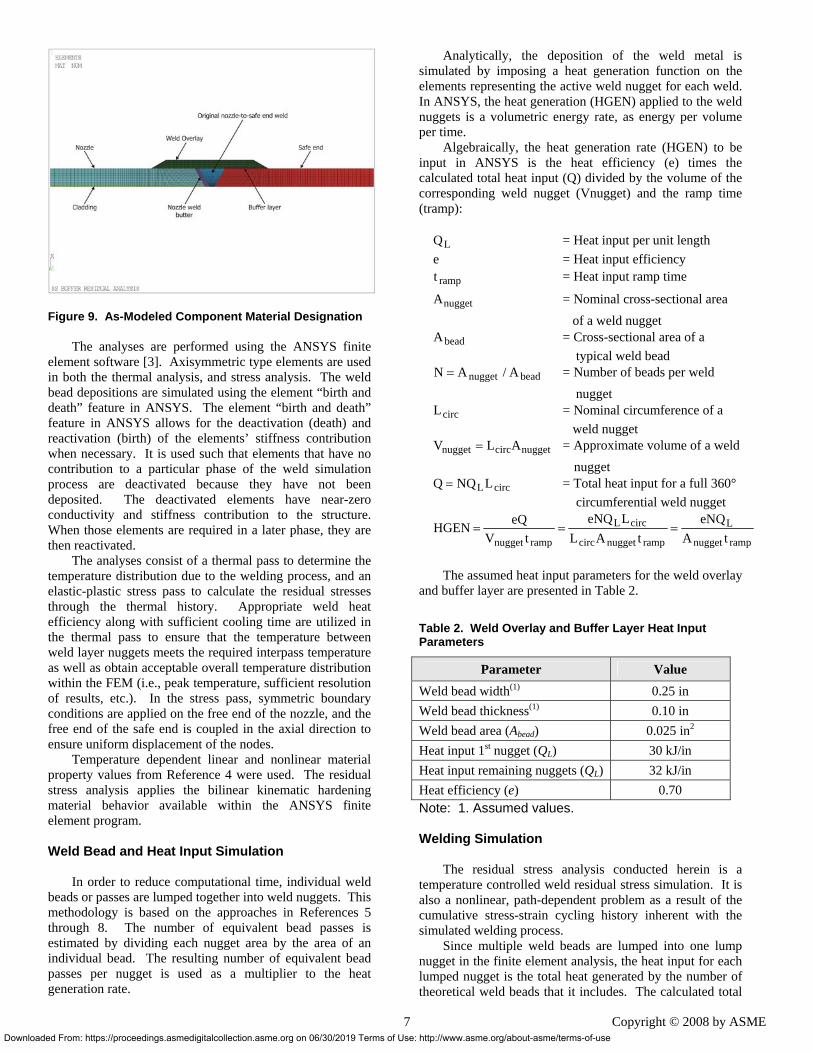
Figure 8. Photo of Completed Full Scale Demonstration Mockup RESIDUAL AND THERMAL TRANSIENT STRESS ANALYSES Comparative evaluations were performed to determine the effect of the stainless steel buffer both from the post weld overlay residual stress view point and also to understand the thermal response as a result of applying this buffer layer. Four finite element models were developed that included simplified nozzle based on a 4” Schedule 140 and a 12” Schedule 160 pipe dimensions. The finite element models consisted of a portion of the nozzle, the cladding, the nozzle weld butter, the nozzle-to-safe end weld, the safe end, and the weld overlay repair, with and without the stainless steel buffer layer. Finite Element Models The base models for the 4” and the 12” piping assumed that the weld overlay material is completely Alloy 52M. The second model for each geometry contains a single layer of stainless steel over the safe end before the weld overlay. These four finite element models were then modified to create four finite element models for the thermal transient evaluation. Typical finite element model is shown in Figure 9.
6 Copyright © 2008 by ASME se: http://www.asme.org/about-asme/terms-of-use
Downl
Figure 9. As-Modeled Component Material Designation The analyses are performed using the ANSYS finite element software [3]. Axisymmetric type elements are used in both the thermal analysis, and stress analysis. The weld bead depositions are simulated using the element “birth and death” feature in ANSYS. The element “birth and death” feature in ANSYS allows for the deactivation (death) and reactivation (birth) of the elements’ stiffness contribution when necessary. It is used such that elements that have no contribution to a particular phase of the weld simulation process are deactivated because they have not been deposited. The deactivated elements have near-zero conductivity and stiffness contribution to the structure. When those elements are required in a later phase, they are then reactivated. The analyses consist of a thermal pass to determine the temperature distribution due to the welding process, and an elastic-plastic stress pass to calculate the residual stresses through the thermal history. Appropriate weld heat efficiency along with sufficient cooling time are utilized in the thermal pass to ensure that the temperature between weld layer nuggets meets the required interpass temperature as well as obtain acceptable overall temperature distribution within the FEM (i.e., peak temperature, sufficient resolution of results, etc.). In the stress pass, symmetric boundary conditions are applied on the free end of the nozzle, and the free end of the safe end is coupled in the axial direction to ensure uniform displacement of the nodes. Temperature dependent linear and nonlinear material property values from Reference 4 were used. The residual stress analysis applies the bilinear kinematic hardening material behavior available within the ANSYS finite element program. Weld Bead and Heat Input Simulation In order to reduce computational time, individual weld beads or passes are lumped together into weld nuggets. This methodology is based on the approaches in References 5 through 8. The number of equivalent bead passes is estimated by dividing each nugget area by the area of an individual bead. The resulting number of equivalent bead passes per nugget is used as a multiplier to the heat generation rate.
7oaded From: https://proceedings.asmedigitalcollection.asme.org on 06/30/2019 Terms of Us
Analytically, the deposition of the weld metal is simulated by imposing a heat generation function on the elements representing the active weld nugget for each weld. In ANSYS, the heat generation (HGEN) applied to the weld nuggets is a volumetric energy rate, as energy per volume per time. Algebraically, the heat generation rate (HGEN) to be input in ANSYS is the heat efficiency (e) times the calculated total heat input (Q) divided by the volume of the corresponding weld nugget (Vnugget) and the ramp time (tramp):
LQ = Heat input per unit length
e = Heat input efficiency rampt = Heat input ramp time
nuggetA = Nominal cross-sectional area of a weld nugget
beadA = Cross-sectional area of a typical weld bead
beadnugget A/AN = = Number of beads per weld nugget
circL = Nominal circumference of a weld nugget
nuggetcircnugget ALV = = Approximate volume of a weld nugget
circLLNQQ = = Total heat input for a full 360° circumferential weld nugget
rampnugget
L
rampnuggetcirc
circL
rampnugget tAeNQ
tALLeNQ
tVeQHGEN ===
The assumed heat input parameters for the weld overlay and buffer layer are presented in Table 2.
Table 2. Weld Overlay and Buffer Layer Heat Input Parameters
Parameter Value Weld bead width(1) 0.25 in Weld bead thickness(1) 0.10 in Weld bead area (Abead) 0.025 in2 Heat input 1st nugget (QL) 30 kJ/in Heat input remaining nuggets (QL) 32 kJ/in Heat efficiency (e) 0.70 Note: 1. Assumed values. Welding Simulation The residual stress analysis conducted herein is a temperature controlled weld residual stress simulation. It is also a nonlinear, path-dependent problem as a result of the cumulative stress-strain cycling history inherent with the simulated welding process. Since multiple weld beads are lumped into one lump nugget in the finite element analysis, the heat input for each lumped nugget is the total heat generated by the number of theoretical weld beads that it includes. The calculated total
Copyright © 2008 by ASME e: http://www.asme.org/about-asme/terms-of-use
Downlo
heat input is imposed onto the active nugget simultaneously, which is conservative and will result in extremely high temperatures (above 3,000°F) at or near the peak of the heat generation period. However, the melting point of the affected material is slightly below 3,000°F. This, in turn, implies that a weld element temperature of 3,000°F and above represents molten material, and no additional heat is necessary. As a result, a temperature control algorithm is implemented into the heat generation application such that it is turned off when the temperatures of all active weld elements have reached 3,000°F during the total 12 seconds HGEN period. Moreover, since temperature results that are beyond 3,000°F are unrealistic, a plateau temperature of 3,000°F is applied to the calculated finite element analysis temperature results. This additional temperature control algorithm essentially restricts the maximum achievable temperatures to 3,000°F when they are transferred to the stress calculation phase of the analysis. After the buffer layer is completed, the model is cooled down to a uniform ambient temperature of 70°F. After the buffer layer is completed, it is followed by the weld overlay simulation. After the weld overlay is completed, the model is cooled down to a uniform ambient temperature of 70°F, and then heated up to a uniform operating temperature of 650°F. An operating pressure of 2235 psi is applied at 650°F in order to obtain the combined residual and pressure/thermal stresses at maximum operating temperature and pressure. Thermal Transient Analysis A single thermal transient was analyzed for each model to determine the effects of the buffer layer on the thermal stresses. Tables 3 and 4 show the transient information that was used in the analysis. Bulk fluid temperatures and heat transfer coefficients are applied to the nodes closest to the region boundaries, as specified in Tables 3 and 4. No heat transfer coefficients or temperatures are applied to the insulated outside surfaces, because the outside is assumed to be perfectly insulated. An additional time of 3,600 seconds is added to the end of the transient to ensure that any lagging peak stresses are captured, followed by a steady state load step (at an arbitrary 10 seconds after the initial 3600 second addition).
aded From: https://proceedings.asmedigitalcollection.asme.org on 06/30/2019 Terms of
Table 3. Thermal Transient Parameters for 12” Model h, Btu/hr-ft2-°F
Description Initial T, °F
Final T, °F Under
TS Else-where
P, psia
Full Flow Water Slug
(Ramp Time = 0 sec)
653 563 158 11080 2250
Table 4. Thermal Transient Parameters for 4” Model
h, Btu/hr-ft2-°F Description Time, sec T, °F Under TS Else-where
Case 2-0 0 670 190 1318 0 40 190 1318 189 40 190 1318 189 670 156 512
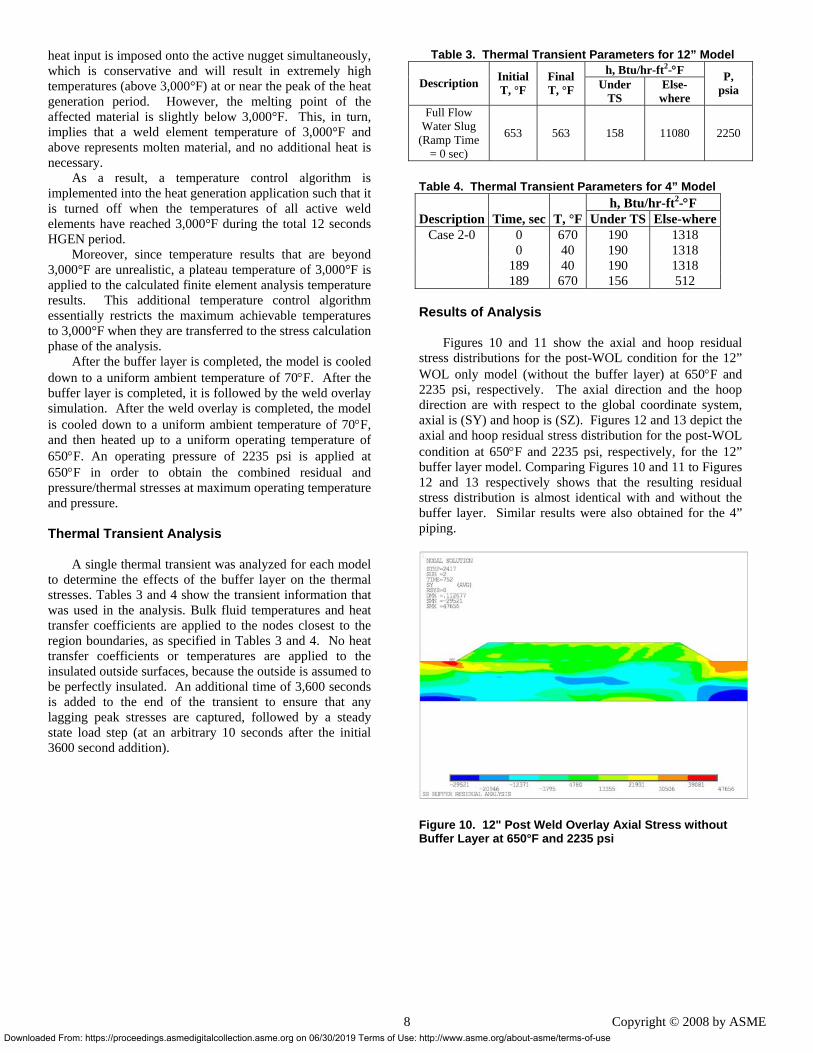
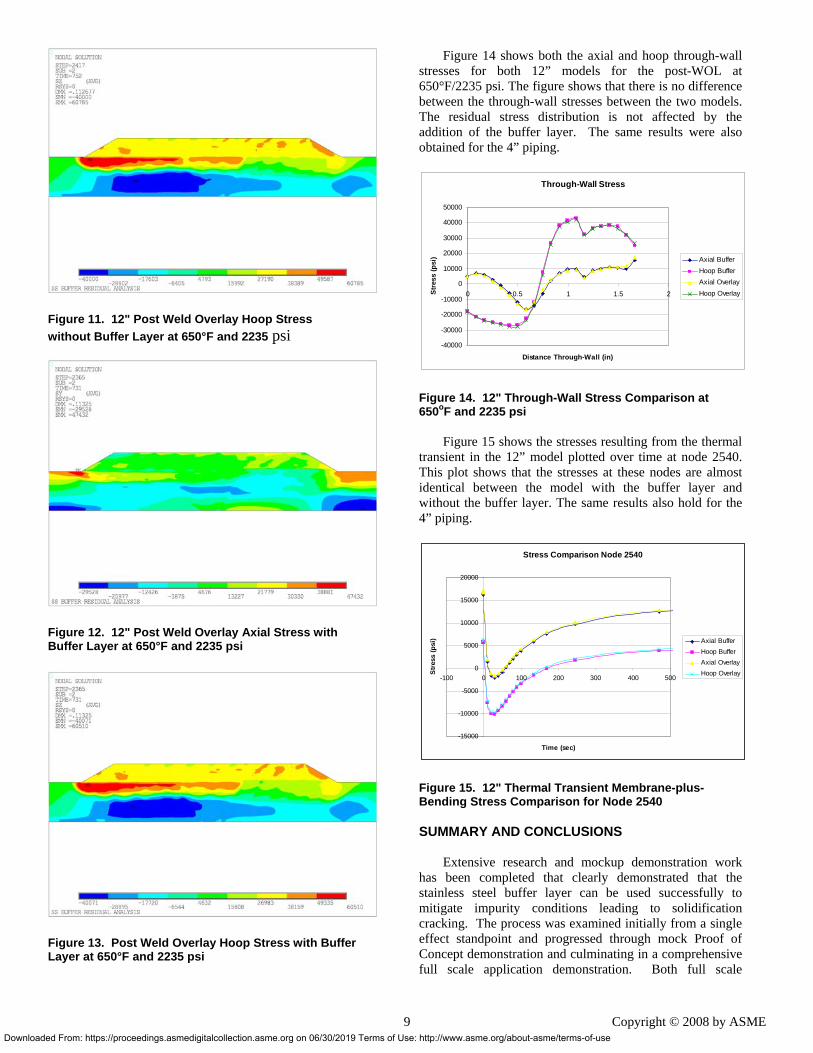
Results of Analysis Figures 10 and 11 show the axial and hoop residual stress distributions for the post-WOL condition for the 12” WOL only model (without the buffer layer) at 650°F and 2235 psi, respectively. The axial direction and the hoop direction are with respect to the global coordinate system, axial is (SY) and hoop is (SZ). Figures 12 and 13 depict the axial and hoop residual stress distribution for the post-WOL condition at 650°F and 2235 psi, respectively, for the 12” buffer layer model. Comparing Figures 10 and 11 to Figures 12 and 13 respectively shows that the resulting residual stress distribution is almost identical with and without the buffer layer. Similar results were also obtained for the 4” piping.
Figure 10. 12" Post Weld Overlay Axial Stress without Buffer Layer at 650°F and 2235 psi
8 Copyright © 2008 by ASME
Use: http://www.asme.org/about-asme/terms-of-use
Downl
Figure 11. 12" Post Weld Overlay Hoop Stress without Buffer Layer at 650°F and 2235 psi
Figure 12. 12" Post Weld Overlay Axial Stress with Buffer Layer at 650°F and 2235 psi
Figure 13. Post Weld Overlay Hoop Stress with Buffer Layer at 650°F and 2235 psi
9oaded From: https://proceedings.asmedigitalcollection.asme.org on 06/30/2019 Terms of Us
Figure 14 shows both the axial and hoop through-wall stresses for both 12” models for the post-WOL at 650°F/2235 psi. The figure shows that there is no difference between the through-wall stresses between the two models. The residual stress distribution is not affected by the addition of the buffer layer. The same results were also obtained for the 4” piping.
Through-Wall Stress
-40000
-30000
-20000
-10000
0
10000
20000
30000
40000
50000
0 0.5 1 1.5 2
Distance Through-Wall (in)
Stre
ss (p
si) Axial Buffer
Hoop BufferAxial OverlayHoop Overlay
Figure 14. 12" Through-Wall Stress Comparison at 650oF and 2235 psi Figure 15 shows the stresses resulting from the thermal transient in the 12” model plotted over time at node 2540. This plot shows that the stresses at these nodes are almost identical between the model with the buffer layer and without the buffer layer. The same results also hold for the 4” piping.
Stress Comparison Node 2540
-15000
-10000
-5000
0
5000
10000
15000
20000
-100 0 100 200 300 400 500
Time (sec)
Stre
ss (p
si) Axial Buffer
Hoop BufferAxial OverlayHoop Overlay
Figure 15. 12" Thermal Transient Membrane-plus-Bending Stress Comparison for Node 2540 SUMMARY AND CONCLUSIONS Extensive research and mockup demonstration work has been completed that clearly demonstrated that the stainless steel buffer layer can be used successfully to mitigate impurity conditions leading to solidification cracking. The process was examined initially from a single effect standpoint and progressed through mock Proof of Concept demonstration and culminating in a comprehensive full scale application demonstration. Both full scale
Copyright © 2008 by ASME e: http://www.asme.org/about-asme/terms-of-use
Downlo
mockup tests were successfully applied and met ultrasonic testing requirements. The process developed has since been applied to the plant that was affected by the hot cracking. Similar approaches have already been applied in the field at two other utility plants. Some of the substrates had higher impurity levels while others were similar to the impurity conditions (CMTRs) in the surge piping considered in the study presented in this paper. Residual stress analyses and thermal transient analysis were performed using finite element analysis which demonstrated that the addition of the stainless steel buffer layer does not create any adverse stress conditions compared with the case in which a buffer layer is not implemented. ACKNOWLEDGEMENTS Most of the testing described in this paper was performed at EPRI, Charlotte facility. The authors will especially like to thank Mr. Greg Frederick and Ms. Mary Kay Havens for their very skillful contributions to the testing and interpretation. REFERENCES 1. Shankar, V., et al., “Solidification Cracking in
Austenitic Stainless Steel Welds, Sadhana Vol. 28, Parts 3 & 4, June/August 2003, pp. 359-382.
2. Cross, C. E., “On the Origin of Weld Solidification Cracking”, Hot Cracking Phenomena in Welds, Bollinghaus, T and Herold, H. editors, Chapter 1, Published by Springer, 2005, pp. 3-18.
3. ANSYS, Revision 8.1 (w/Service Pack 1), ANSYS Inc., June 2004.
4. ASME Boiler and Pressure Vessel Code, Section II, Part D, Material Properties, 2001 Edition with Addenda through 2003.
5. Rybicki, E. F., et al., “Residual Stresses at Girth-Butt Welds in Pipes and Pressure Vessels,” U.S. Nuclear Regulatory Commission Report NUREG-0376, R5, November 1977.
6. Rybicki, E. F., and Stonesifer, R. B., “Computation of Residual Stresses Due to Multipass Welds in Piping Systems,” Journal of Pressure Vessel Technology, Vol. 101, May 1979.
7. Journal of Pressure Vessel Technology: “Residual Stress Analysis of a Multi-Pass Girth Weld: 3-D Special Shell Versus Axisymmetric Models,” May 2001, Vol. 123.
8. Materials Reliability Program: Technical Basis for Preemptive Weld Overlays for Alloy 82/182 Butt Welds in PWRs (MRP-169), EPRI, Palo Alto, CA, and Structural Integrity Associates, Inc., San Jose, CA: 2005. 1012843
10 Copyright © 2008 by ASME
aded From: https://proceedings.asmedigitalcollection.asme.org on 06/30/2019 Terms of Use: http://www.asme.org/about-asme/terms-of-use
Copyright © 2022 FDOKUMEN