Effective Beginning Reading Programs: A Best-Evidence ...
70
The Best Evidence Encyclopedia is a free web site created by the Johns Hopkins University School of Education’s Center for Data- Driven Reform in Education (CDDRE) under funding from the Institute of Education Sciences, U.S. Department of Education. 1 Effective Beginning Reading Programs: A Best-Evidence Synthesis Robert E. Slavin Johns Hopkins University -and- University of York Cynthia Lake Johns Hopkins University Bette Chambers University of York Alan Cheung Johns Hopkins University Susan Davis Success for All Foundation January, 2009 __________________ This research was funded by the Institute of Education Sciences, U.S. Department of Education (Grant No. R305A040082). However, any opinions expressed are those of the authors and do not necessarily represent IES positions or policies. We thank Marilyn Adams, Steven Ross, and Nancy Madden for comments on an earlier draft.
-
Upload
khangminh22 -
Category
Documents
-
view
5 -
download
0
Transcript of Effective Beginning Reading Programs: A Best-Evidence ...
The Best Evidence Encyclopedia is a free web site created by the Johns Hopkins University School of Education’s Center for Data-Driven Reform in Education (CDDRE) under funding from the Institute of Education Sciences, U.S. Department of Education.
1
Effective Beginning Reading
Programs:
A Best-Evidence Synthesis
Robert E. Slavin
Johns Hopkins University
-and-
University of York
Cynthia Lake
Johns Hopkins University
Bette Chambers
University of York
Alan Cheung
Johns Hopkins University
Susan Davis
Success for All Foundation
January, 2009
__________________
This research was funded by the Institute of Education Sciences, U.S. Department
of Education (Grant No. R305A040082). However, any opinions expressed are those of
the authors and do not necessarily represent IES positions or policies.
We thank Marilyn Adams, Steven Ross, and Nancy Madden for comments on an
earlier draft.
The Best Evidence Encyclopedia is a free web site created by the Johns Hopkins University School of Education’s Center for Data-Driven Reform in Education (CDDRE) under funding from the Institute of Education Sciences, U.S. Department of Education.
2
Abstract
This article systematically reviews research on the achievement outcomes of four
types of approaches to improving the beginning reading success of children in
kindergarten and first grade: Reading curricula, instructional technology, instructional
process programs, and combinations of curricula and instructional process. Study
inclusion criteria included use of randomized or matched control groups, a study duration
of at least 12 weeks, valid achievement measures independent of the experimental
treatments, and a final assessment at the end of grade 1 or later. A total of 62 studies met
these criteria. The review concludes that instructional process programs designed to
change daily teaching practices have substantially greater research support than programs
that focus on curriculum or technology alone. In particular, positive achievement effects
were found for Success for All, PALS, phonological awareness training, and other
programs focused on professional development.
The Best Evidence Encyclopedia is a free web site created by the Johns Hopkins University School of Education’s Center for Data-Driven Reform in Education (CDDRE) under funding from the Institute of Education Sciences, U.S. Department of Education.
3
From the first day of kindergarten to the last day of first grade, most children go
through an extraordinary transformation as readers. If all goes well, children at the end of
first grade know the sounds of all the letters and can form them into words, know the
most common sight words, and can read and comprehend simple texts. The K-1 period is
distinct from other stages of reading development because during this stage, children are
learning all the basic skills of turning print into meaning. From second grade on, children
build fluency, comprehension, and vocabulary for reading ever more complex text in
many genres, but the K-1 period is qualitatively different in its focus on basic skills.
Success in beginning reading is a key prerequisite for success in reading in the
later years. Longitudinal studies (e.g., Juel, 1988) have shown that children with poor
reading skills at the end of first grade are unlikely to catch up later on, and are likely to
have difficulties in reading throughout their schooling. It is in the early elementary
grades where the gap in performance between children of different races first appears,
and this gap is perhaps the most important policy issue in education in the U.S. On the
fourth grade National Assessment of Educational Progress (NAEP, 2007), 43% of White
children achieved at the “proficient” level on the National Assessment of Educational
Progress, but only 14% of African American, 17% of Hispanic, and 8% of American
Indian children scored at this level. Effective beginning reading programs are important
for children of all backgrounds, but for disadvantaged and minority children and for
children with learning disabilities, who particularly depend on school to achieve success,
effective beginning reading programs are especially important.
In recent years, there has been a shift in policy and practice toward more of a
focus on phonics and phonemic awareness in beginning reading instruction. Based in
large part on the findings of the National Reading Panel (2000) and earlier research
syntheses, the Bush Administration’s Reading First program strongly favored phonics
and phonemic awareness, and a national study of Reading First by Gamse et al. (2008)
and Moss et al. (2008) found that teachers in Reading First schools were in fact doing
more phonics teaching than were those in similar non-Reading First schools. Yet
outcomes were disappointing, with small effects seen on first grade decoding measures
and no impact on comprehension measures in grades 1-3. Similarly, a large study of
intensive professional development focusing on phonics found no effects on the reading
skills of second graders (Garet et al., 2008). The findings of these large-scale experiments
imply that while the importance of phonics and phonemic awareness in beginning reading
instruction are well established, the addition of phonics to traditional basal instruction is
not sufficient to bring about widespread improvement in children’s reading. Other
factors, especially relating to the quality of instruction, are also consequential.
Because of the great importance of this stage of development, there have been
several reviews of research on beginning reading. Adams (1990) wrote an influential
review, which concluded among other things that systematic phonics should be central to
early reading instruction. Reviews by Snow, Burns, & Griffin (1998), by the National
Reading Panel (NRP, 2000), by Torgeson, Brooks, & Hall (2006), and by the Rose
Report in the U.K. (Rose, 2006) have reinforced the importance of phonics. The National
Reading Panel (2000) pointed to five factors needed for success in early reading:
The Best Evidence Encyclopedia is a free web site created by the Johns Hopkins University School of Education’s Center for Data-Driven Reform in Education (CDDRE) under funding from the Institute of Education Sciences, U.S. Department of Education.
4
phonemic awareness, phonics, fluency, vocabulary, and comprehension. These reviews,
however, focused on variables associated with positive outcomes in beginning reading
rather than on specific reading programs. The What Works Clearinghouse (2008), in its
beginning reading topic report, reviewed research on reading programs evaluated in
grades K-3. However, the WWC only reports program ratings, and does not include
discussion of the findings or draw generalizations about the effects of types of programs.
Further, WWC inclusion standards applied in its beginning reading topic report include
very brief studies (as few as 5 hours of instruction), very small studies (as few as 46
students), and measures of skills taught in experimental but not control groups (see
Slavin, 2008). The Torgeson et al. (2006) review only included 12 randomized
evaluations contrasting phonetic and non-phonetic approaches, but most of these were
also brief (most provided 5 hours or less of instruction), had very small sample sizes,
often used measures of objectives not taught at all in the control group, and were mostly
supplementary rather than core approaches.
The present article reviews research on the achievement outcomes of practical
initial (non-remedial) beginning reading programs for all children, applying consistent
methodological standards to the research. It is intended to provide fair summaries of the
achievement effects of the full range of beginning reading approaches available to
educators and policy makers, and to summarize for researchers the current state of the art
in this area. The scope of the review includes all types of programs that teachers,
principals, or superintendents might consider to improve the success of their children in
beginning reading: curricula, instructional technology, instructional process programs,
and combinations of curricula and instructional process. The review uses a form of best
evidence synthesis (Slavin, 1986), adapted for use in reviewing “what works” literatures
in which there are generally few studies evaluating each of many programs (see Slavin,
2008). It is part of a series, all of which used the same methods, with minor adaptations.
Separate research syntheses review research on remedial, preventive, and special
education programs in elementary reading (Slavin, Lake, Madden, Chambers, Cheung &
Davis, forthcoming), upper-elementary programs (Slavin, Lake, Chambers, Cheung, &
Davis, 2008a), middle and high school reading programs (Slavin, Cheung, Groff, & Lake,
2008b), and reading programs for English language learners (Cheung & Slavin, 2005).
The syntheses of upper-elementary reading programs (Slavin et al., 2008a) and
middle and high school reading programs (Slavin et al., 2008b) provide the closest
background for the present review. The upper-elementary reading review identified 88
studies that met the inclusion standards. These were divided into four categories: reading
curricula (core and supplementary textbooks), instructional technology, instructional
process programs (such as cooperative learning), and combinations of curricula and
instructional process. Effect sizes for curricula (ES=+0.07) and for instructional
technology (ES=+0.06) were very low. Larger effect sizes (ES=+0.23) were found for
instructional process programs, especially cooperative learning programs in which
students help one another master reading comprehension skills in small teams or pairs.
The sample-size weighted mean effect size for cooperative learning methods, specifically
Cooperative Integrated Reading and Composition (CIRC) and Peer Assisted Learning
Strategies (PALS), was +0.21.
The Best Evidence Encyclopedia is a free web site created by the Johns Hopkins University School of Education’s Center for Data-Driven Reform in Education (CDDRE) under funding from the Institute of Education Sciences, U.S. Department of Education.
5
The secondary review covered grades 6-12, with most studies focused on grades
6-9. A total of 36 studies met the same criteria applied in the present review. It also
concluded that programs designed to change daily teaching practices, providing extensive
professional development in specific classroom strategies, had substantially greater
support from rigorous experiments than did programs focusing on curriculum or
technology alone. No studies of reading curricula met the inclusion criteria, and the
sample size-weighted mean effect size for computer-assisted instruction programs was
only +0.10. In contrast, the weighted mean effect size for various forms of cooperative
learning was +0.28. Studies of mixed method programs (especially READ 180) that
combine extensive teacher training and cooperative learning with computer activities also
had relatively positive weighted effect sizes (ES=+0.22). The Cheung & Slavin (2005)
review of research on (mostly elementary) studies of reading programs for ELLs also
found that effective programs were ones that emphasized professional development and
changed classroom practices, such as cooperative learning and comprehensive school
reform. Based on the findings of the earlier reviews, we hypothesized that in beginning
elementary reading, programs focusing on reforming daily instruction would have
stronger impacts on student achievement than would programs focusing on innovative
textbooks or instructional technology alone.
Focus of the Current Review
The present review uses procedures similar to those used in the upper elementary
and secondary reading reviews to examine research on initial (non-remedial) programs
for beginning reading. The purpose of the review is to place all types of initial reading
programs intended to enhance beginning reading achievement on a common scale, to
provide educators and policy makers with meaningful, unbiased information that they can
use to select programs most likely to make a difference with their students. The review
emphasizes practical programs that are or could be used at scale. It therefore emphasizes
large studies done over significant time periods that used standard measures, to maximize
the usefulness of the review to educators. The review also seeks to identify common
characteristics of programs likely to make a difference in beginning reading achievement.
This synthesis was intended to include all kinds of approaches to early reading
instruction, and groups them in four categories: reading curricula, instructional
technology, instructional process programs, and combinations of reading curricula and
instructional process. Reading curricula primarily encompass core reading textbooks and
curricula, such as Reading Street and Open Court Reading. Instructional technology
refers to programs that use technology to enhance reading achievement. This includes
traditional supplementary computer-assisted instruction (CAI) programs, in which
students are sent to computer labs for additional practice. CAI in reading has been
reviewed by Kulik (2003), Murphy et al. (2002), and E. Chambers (2003). Other
instructional technology programs include Reading Reels, which provides embedded
multimedia in daily lessons, and Writing to Read, which combines technology and non-
technology small group activities. Instructional process programs rely primarily on
professional development to give teachers effective strategies for teaching reading. These
include programs focusing on cooperative learning and phonological awareness.
Combinations of curricula and instructional process, specifically Success for All and
The Best Evidence Encyclopedia is a free web site created by the Johns Hopkins University School of Education’s Center for Data-Driven Reform in Education (CDDRE) under funding from the Institute of Education Sciences, U.S. Department of Education.
6
Direct Instruction, provide specific phonetic curricula as well as extensive professional
development focused on instructional strategies. Comprehensive school reform (CSR)
programs were included only if they included specific beginning reading programs; for a
broader review of outcomes of elementary CSR models, see CSRQ (2006) and Borman et
al. (2003).
Methodological Issues Unique to Beginning Reading
While a review of research on beginning reading programs shares methodological
issues common to all systematic reviews, there are also some key issues unique to this
subject and grade level. The thorniest of these relates to measurement. In the early stages
of reading, researchers often use measures such as phonemic awareness that are not
“reading” in any sense, though they are precursors. However, measures of reading
comprehension and reading vocabulary tend to have floor effects at the kindergarten and
first grade level. The present review included measures such as letter-word identification
and word attack, but did not accept measures such as auditory phonemic awareness.
Measures of oral vocabulary, spelling, and language arts were excluded at all grade
levels.
Another problem of early reading measurement is that in kindergarten, it is
possible for a study to find positive effects of programs that introduce skills not ordinarily
taught in kindergarten on measures of those skills. For example, until the late 1990’s it
was not common in U.S. kindergartens for children to be taught phonics or phonemic
awareness. Programs that moved these then first-grade skills into kindergarten might
appear very effective in comparison to control classes receiving little or no instruction on
those skills, but would in fact simply be teaching skills the children would probably have
mastered somewhat later.
Because of the difficulty of defining and measuring early literacy skills, multi-
year evaluations that follow children at least through the end of first or second grade are
of particular value. By the end of second grade, it is certain that control students as well
as experimental students have been seriously taught to read, and it becomes possible to
use measures of reading comprehension and reading vocabulary that more fully represent
the goals of reading instruction, not just precursors. Multi-year studies solve the problem
of early presentation of skills ordinarily taught later. If kindergartners are taught certain
first grade reading skills, end of first grade or second grade measures should be able to
determine if this early teaching was truly beneficial. For example, a study by Hecht &
Close (2002) evaluated the Waterford Early Reading Program in kindergarten classes.
Children in experimental and control classes experienced whole language instruction
focused on language, not reading. Those in the Waterford group, however, also received
15 minutes a day of phonics and phonemic awareness. At the end of kindergarten
posttest, the Waterford group scored much better than controls. But what does this
mean? It may be that early exposure to phonics instruction has a lasting effect, but that
cannot be determined until all children have been taught to read, with measures no earlier
than the end of the first grade. Due to the unique nature of research on kindergarten-only
The Best Evidence Encyclopedia is a free web site created by the Johns Hopkins University School of Education’s Center for Data-Driven Reform in Education (CDDRE) under funding from the Institute of Education Sciences, U.S. Department of Education.
7
programs, studies whose final posttesting took place before spring of first grade are
reviewed in a separate section of this article.
Review Methods
As noted earlier, the review methods used here are similar to those used by
Slavin, Lake, Cheung, & Davis (2008a) and by Slavin, Cheung, Groff, & Lake (2008b),
who adapted a technique called best-evidence synthesis (Slavin, 1986). Best-evidence
syntheses seek to apply consistent, well-justified standards to identify unbiased,
meaningful information from experimental studies, discussing each study in some detail,
and pooling effect sizes across studies in substantively justified categories. The method is
very similar to meta-analysis (Cooper, 1998; Lipsey & Wilson, 2001), adding an
emphasis on narrative description of each study’s contribution. It is similar to the
methods used by the What Works Clearinghouse (2008), with a few important exceptions
noted in the following sections. See Slavin (2008) for an extended discussion and
rationale for the procedures used in all of these reviews.
Literature Search Procedures
A broad literature search was carried out in an attempt to locate every study that
could possibly meet the inclusion requirements. Electronic searches were made of
educational databases (JSTOR, ERIC, EBSCO, Psych INFO, Dissertation Abstracts)
using different combinations of key words (for example, “elementary students,”
“reading,” “achievement”) and the years 1970-2008. Results were then narrowed by
subject area (for example, “reading intervention,” “educational software,” “academic
achievement,” “instructional strategies”). In addition to looking for studies by key terms
and subject area, we conducted searches by program name. Web-based repositories and
education publishers’ websites were also examined. We attempted to contact producers
and developers of reading programs to check whether they knew of studies that we had
missed. Citations were obtained from other reviews of reading programs including the
What Works Clearinghouse (2008) beginning reading topic report, Adams (1990),
National Reading Panel (2000), Snow, Burns & Griffin (1998), Torgerson, Brooks, &
Hall (2006), Rose (2006), and August & Shanahan (2006), or potentially related topics
such as instructional technology (E. Chambers, 2003; Kulik, 2003; Murphy et al., 2002).
We also conducted searches of recent tables of contents of key journals. We searched the
following tables of contents from 2000 to 2008: American Educational Research Journal,
Reading Research Quarterly, Journal of Educational Research, Journal of Educational
Psychology, Reading and Writing Quarterly, British Educational Research Journal, and
Learning and Instruction. Citations of studies appearing in the studies found in the first
wave were also followed up.
Effect Sizes
In general, effect sizes were computed as the difference between experimental and
control individual student posttests after adjustment for pretests and other covariates,
divided by the unadjusted posttest control group standard deviation. If the control group

The Best Evidence Encyclopedia is a free web site created by the Johns Hopkins University School of Education’s Center for Data-Driven Reform in Education (CDDRE) under funding from the Institute of Education Sciences, U.S. Department of Education.
8
SD was not available, a pooled SD was used. Procedures described by Lipsey & Wilson
(2001) and Sedlmeier & Gigerenzor (1989) were used to estimate effect sizes when
unadjusted standard deviations were not available, as when the only standard deviation
presented was already adjusted for covariates or when only gain score SD’s were
available. If pretest and posttest means and SD’s were presented but adjusted means were
not, effect sizes for pretests were subtracted from effect sizes for posttests. In multiyear
studies, effect sizes may be reported for each year but only the final year of treatment is
presented in the tables. However, if there are multiple cohorts (e.g., K-1, K-2, K-3), each
with adequate pretests, all cohorts are included in the tables.
Effect sizes were pooled across studies for each program and for various
categories of programs. This pooling used means weighted by the final sample sizes. The
reason for using weighted means is to maximize the importance of large studies, as the
previous reviews and many others have found that small studies tend to overstate effect
sizes (see Rothstein et al., 2005; Slavin, 2008; Slavin & Smith, 2008).
Effect sizes were broken down for measures of decoding (e.g., word attack, letter-
word identification, and fluency), vocabulary, and comprehension/total reading. In
general, comprehension, which is the ultimate goal of reading instruction, is the most
important outcome measure. Very few studies reported separate vocabulary scores, so the
tables only show separate outcomes for decoding and comprehension (although
vocabulary measures are included in totals).
Criteria for Inclusion
Criteria for inclusion of studies in this review were as follows.
1. The studies evaluated initial (i.e., non-remedial) classroom programs for
beginning reading. Studies of variables, such as use of ability grouping, block
scheduling, or single-sex classrooms, were not reviewed. Studies of tutoring and
remedial programs for struggling readers are reviewed in a separate article (Slavin
et al., in preparation).
2. The studies involved interventions that began when children were in kindergarten
or first grade. Multi-year interventions that began in kindergarten or first grade
were included even if children were in grades 2-5 by the end of the study. As
noted earlier, studies that began and ended in kindergarten are reviewed
separately.
3. The studies compared children taught in classes using a given reading program to
those in control classes using an alternative program or standard methods.
4. Studies could have taken place in any country, but the report had to be available
in English.
The Best Evidence Encyclopedia is a free web site created by the Johns Hopkins University School of Education’s Center for Data-Driven Reform in Education (CDDRE) under funding from the Institute of Education Sciences, U.S. Department of Education.
9
5. Random assignment or matching with appropriate adjustments for any pretest
differences (e.g., analyses of covariance) had to be used. Studies without control
groups, such as pre-post comparisons and comparisons to “expected” scores, were
excluded.
6. Pretest data had to be provided, unless studies used random assignment of at least
30 units (individuals, classes, or schools) and there were no indications of initial
inequality. Studies with pretest differences of more than 50% of a standard
deviation were excluded because, even with analyses of covariance, large pretest
differences cannot be adequately controlled for as underlying distributions may be
fundamentally different (Shadish, Cook, & Campbell, 2002).
7. The dependent measures included quantitative measures of reading performance,
such as standardized reading measures. Experimenter-made measures were
accepted if they were comprehensive measures of reading, which would be fair to
the control groups, but measures of reading objectives inherent to the
experimental program (but unlikely to be emphasized in control groups) were
excluded. Studies using measures inherent to treatments, usually made by the
experimenter or program developer, have been found to be associated with much
larger effect sizes than are measures that are independent of treatments (Slavin &
Madden, 2008), and for this reason, effect sizes from treatment-inherent measures
were excluded. The exclusion of measures inherent to the experimental treatment
is a key difference between the procedures used in the present review and those
used by the What Works Clearinghouse. As noted above, measures of pre-
reading skills such as phonological awareness, as well as related skills such as
oral vocabulary, language arts, and spelling, were not included in this review.
8. A minimum study duration of 12 weeks was required. This requirement is
intended to focus the review on practical programs intended for use for the whole
year, rather than brief investigations. Study duration is measured from the
beginning of the treatments to posttest, so, for example, an intensive 8-week
intervention in the fall of first grade would be considered a year-long study if the
posttest were given in May. The 12-week criterion has been consistently used in
all of the systematic reviews done previously by the current authors. This is
another difference between the current review and the What Works Clearinghouse
(2008) beginning reading topic report, which included very brief studies.
9. Studies had to have at least 15 students and two teachers in each treatment group.
Appendix 1 lists studies that were considered germane but were excluded
according to these criteria, as well as the reasons for exclusion.
Limitations
It is important to note several limitations of the current review. First, the review
focuses on experimental studies using quantitative measures of reading. There is much to
The Best Evidence Encyclopedia is a free web site created by the Johns Hopkins University School of Education’s Center for Data-Driven Reform in Education (CDDRE) under funding from the Institute of Education Sciences, U.S. Department of Education.
10
be learned from qualitative and correlational research that can add depth and insight to
understanding the effects of reading programs, but this research is not reviewed here.
Second, the review focuses on replicable programs used in realistic school settings
expected to have an impact over periods of at least 12 weeks. This emphasis is consistent
with the review’s purpose in providing educators with useful information about the
strength of evidence supporting various practical programs, but it does not attend to
shorter, more theoretically-driven studies that may also provide useful information,
especially to researchers. Finally, the review focuses on traditional measures of reading
performance, primarily individually-administered or group-administered standardized
tests. These are useful in assessing the practical outcomes of various programs and are
fair to control as well as experimental teachers, who are equally likely to be trying to help
their students do well on these assessments. The review does not report on experimenter-
made measures of content taught in the experimental group but not the control group,
even though results on such measures may also be of importance to some researchers or
educators.
Categories of Research Design
Four categories of research designs were identified. Randomized experiments (R)
were those in which students, classes, or schools were randomly assigned to treatments,
and data analyses were at the level of random assignment. When schools or classes were
randomly assigned but there were too few schools or classes to justify analysis at the
level of random assignment, the study was categorized as a randomized quasi-experiment
(RQE) (Slavin, 2008). Matched (M) studies were ones in which experimental and control
groups were matched on key variables at pretest, before posttests were known, while
matched post-hoc (MPH) studies were ones in which groups were matched
retrospectively, after posttests were known. For reasons described by Slavin (2008),
studies using fully randomized designs (R) are preferable to randomized quasi-
experiments (RQE), but all randomized experiments are less subject to bias than matched
studies. Among matched designs, prospective designs (M) were preferred to post-hoc or
matched designs (MPH). In the text and in tables, studies of each type of program are
listed in this order (R, RQE, M, MPH). Within these categories, studies with larger
sample sizes are listed first. Therefore, studies discussed earlier in each section should be
given greater weight than those listed later, all other things being equal.
Research on Reading Curricula
The reading curricula category consists of textbooks for initial (non-remedial)
reading instruction. It includes only 5 qualifying studies of core basal programs and 3 of
supplemental curricula. Some professional development is typically provided with these
textbooks, but far less than would be typical of instructional process approaches. The
Slavin et al. (2008) review of research on upper-elementary textbooks found few effects
on reading measures across 16 qualifying studies, with a weighted mean effect size of
+0.08 for core textbooks and +0.06 for supplementary texts.
The Best Evidence Encyclopedia is a free web site created by the Johns Hopkins University School of Education’s Center for Data-Driven Reform in Education (CDDRE) under funding from the Institute of Education Sciences, U.S. Department of Education.
11
Table 1 summarizes descriptions and outcomes of all studies of textbook
programs for beginning reading.
______________
TABLE 1 HERE
______________
Reading Curricula
Open Court Reading
Open Court Reading, published by SRA/McGraw Hill, is one of the most widely
used basal textbook series in the US. From the 1960’s to the late 1990’s, Open Court
was a phonetically-based alternative to traditional basal textbooks, but in recent years
other texts have also adopted more phonics as well. Still, Open Court remains distinctive
in its use of phonetic readers in the early grades, a focus on direct instruction of specific
skills throughout the program, scripted teacher’s manuals, and more teacher training and
follow up than most texts provide. Teachers in the research sites received 2-3 days of
initial training and extensive on-site follow-up from Open Court consultants. Typically,
Open Court is used in 2.5 hour language arts blocks, meaning that schools using it may
spend significantly more time on reading than would students in other programs, where
90 minutes is typical.
Borman, Dowling, & Schneck (2008) carried out a randomized evaluation of the
2005 version of Open Court Reading. They identified a total of 49 grade 1-5 classrooms
in which Open Court had not been used previously, and randomly assigned classrooms
within schools and grade levels to Open Court or control conditions. Control classes used
a variety of traditional texts. Open Court teachers were asked to teach the program 2 ½
hours a day, while control teachers generally spent 90 minutes a day on reading. Not all
Open Court classes spent the full 2 ½ hours, but most did, so additional time is
confounded with any curricular effects. Also, the Open Court teachers received extensive
training and follow-up beyond that ordinarily provided with the basal text.
At the first grade level, the focus of the present review, there were 9 Open Court
classes (n=165) and 7 control classes (n=139). In light of the numbers of classes
involved in first grade, this was considered a randomized quasi-experiment. The
schools were located in Idaho, Florida, Texas, and Indiana and averaged 61% free lunch
and 57% minority. Open Court and control classes were well matched on Terra Nova
pretests and demographics. On Terra Nova posttests, adjusted for pretests, effect sizes
were +0.06 for Reading Comprehension, +0.22 for Reading Vocabulary, and +0.17 for
Reading Composite. Using HLM, with students nested within classrooms, effects were
significant (p<.05) for the entire grade 1-5 sample, but separate analyses were not
reported for first graders.
A frequently cited evaluation of an earlier version of Open Court did not meet the
standards of this review. Foorman, Fletcher, Francis, Schatschneider, & Mehta (1998)
The Best Evidence Encyclopedia is a free web site created by the Johns Hopkins University School of Education’s Center for Data-Driven Reform in Education (CDDRE) under funding from the Institute of Education Sciences, U.S. Department of Education.
12
compared low-achieving first and second graders in Open Court and “implicit code” (i.e,
non-phonetic) classes. Unfortunately, the initial comparability of the groups was not
adequately established. Posttest analyses combined first and second graders, yet the
proportion of each was quite different in Open Court (76% first) and implicit code (50%
first). Further, there were sizeable pretest differences favoring the Open Court groups
within grades.
Reading Street
Reading Street is a significant revision of the Scott Foresman basal textbook
series, one of the most widely used in the U.S. The revision focused on increasing the
emphasis on phonics and phonemic awareness, in line with requirements of No Child
Left Behind. The publisher contracted with Magnolia Consulting (Wilkerson, Shannon,
& Herman, 2006, 2007) to do two one-year randomized evaluations.
The Wilkerson, Shannon, & Herman (2007) evaluation involved a total of 18 first
grade teachers, randomly assigned to Reading Street (n=220) or control (n=167) within
schools in four sites around the U.S. This sample size made the study a randomized
quasi-experiment. Overall, approximately 86% of students were White, 8% Hispanic, and
3% African American, and 26% received free or reduced price lunches. Control schools
used a variety of textbooks, including Macmillan Spotlight on Literacy, Harcourt
Trophies, Harcourt Signatures, and Scott Foresman’s 2000 and 2002 editions. On Gates
MacGinitie Tests, adjusting for pretests, Reading Street students scored non-significantly
higher than controls (ES=+0.15, n.s.).
A similar study of Reading Street by Wilkerson et al. (2006) involved 16 teachers
of first grades in five schools. Two urban schools and a rural school were middle-class,
non-Title I schools primarily serving White students, with 38-40% of students qualifying
for free lunch. The remaining two schools were Title I schools with 67% of students
qualifying for free lunch, and 80% of students were African American and 11% were
Hispanic. The overall sample was 57% White, 25% African American, and 11%
Hispanic, and 54% of students qualified for free lunch. The teachers were randomly
assigned within schools to use Reading Street or to continue using other basal textbooks.
Adjusting for pretests, individual Gates McGinitie scores were not significantly different
(ES = -0.02, n.s.).
Scholastic Phonics Readers with Literacy Place
Scholastic Phonics Readers is a supplementary phonics instructional program
designed as an optional addition to Literacy Place, Scholastic’s basal reading text.
Scholastic Phonics Readers incorporates phonetic texts to provide intensive phonics
practice in the context of engaging stories, with themes and skills aligned to those in
Literacy Place. The publisher provides a summary of a study by Schultz (1996)
evaluating the combination of Scholastic Phonics Readers and Literacy Place.
Superintendents in four California districts, Los Angeles, San Francisco, Pasadena, and
The Best Evidence Encyclopedia is a free web site created by the Johns Hopkins University School of Education’s Center for Data-Driven Reform in Education (CDDRE) under funding from the Institute of Education Sciences, U.S. Department of Education.
13
San Bernardino, were asked to nominate pairs of similar elementary schools. In each, one
member of each pair was randomly assigned to use the Scholastic materials, and then one
class within each school was randomly selected to participate. With eight classes and 301
first graders (n=162E, 139C), this is a randomized quasi-experiment. The groups were
well-matched on CTBS pretests. On CTBS posttests, effect sizes were +0.07 for reading,
+0.11 for vocabulary, +0.21 for comprehension, and +0.23 for word analysis, for an
overall mean effect size of +0.16.
Lippincott
The Lippincott Basic Reading Series was a phonetic reading series that taught
word attack skills in a systematic way, using step-by-step presentations of letter sounds
and sound blending. Children learned to read using phonetically controlled stories to help
them learn to apply their knowledge of letter-sound correspondence to meaningful text.
Brown & Felton (1990) carried out a small, longitudinal evaluation of Lippincott
as a comparison of code-emphasis and whole language approaches. The 1986 Houghton
Mifflin basal textbook served as the whole language method. First graders were identified
based on extensive testing as being at risk for reading failure, but were not included if
they scored below 80 on the Otis-Lennon Mental Abilities Test. Children were placed in
six groups of eight across five schools and randomly assigned to use either Lippincott or
Houghton Mifflin texts. This random assignment at the group level makes this a
randomized quasi-experiment (RQE). A member of the project team provided instruction
to the eight selected students in each group during daily reading periods in both treatment
conditions, over a two-year period from the beginning of first grade to the end of second
grade. Ns were 23 E, 19 C. At the end of first grade, scores significantly favored
Lippincott students on Woodcock Word Attack (adjusted ES=+1.33, p<.01), but not on
Word Identification (ES=-0.19, n.s.). By second grade, the differences were +0.23 (n.s.)
for Word Attack and +0.30 (n.s.) for Word Identification, for an average of +0.27.
Importantly, 12 Houghton-Mifflin and only 1 Lippincott child was recommended for
retention. However, reading outcomes were modest, with a sample size-weighted mean of
only +0.12.
Supplementary Curricula
Open Court Phonics Kit (as a supplement) and Phonics in Context
Barrett (1995) evaluated the Open Court Phonics Kit used as a supplement to a
literature-based model that used Houghton Mifflin, Wright, and Rigby books as a base.
Open Court Phonics provided teachers with extensive training and materials to teach
phonics skills. This program was compared to a similar district-created Phonics in
Context program and to a control group that just used the literature series without
supplementary phonics. The study took place in the Riverside, California school district,
with mostly middle class first graders. Five classes (n=78) were non-randomly assigned
to Open Court Phonics, seven classes (n=87) to Phonics in Context, and four classes
(n=83) to control, matching on TERA pretests and demographics. Adjusting for the
The Best Evidence Encyclopedia is a free web site created by the Johns Hopkins University School of Education’s Center for Data-Driven Reform in Education (CDDRE) under funding from the Institute of Education Sciences, U.S. Department of Education.
14
TERA pretests, posttests favored the two phonics supplements over the control treatment,
but there were no differences between Open Court Phonics and the district Phonics in
Context program. Adjusting for pretests, respective effect sizes for Open Court Phonics
and Phonics in Context were +0.36 and +0.21 on TERA, +0.53 and +0.33 on SAT
Reading Comprehension, +0.47 and +0.40 for SAT Word Reading, +0.79 and +0.67 for
Word Study Skills, and +0.62 and +0.47 for SAT Total Reading. Averaging SAT Total
Reading and TERA, mean effect sizes were +0.49 for Open Court Phonics and +0.34 for
Phonics in Context.
Elements of Reading: Phonics and Phonemic Awareness
Elements of Reading: Phonics and Phonemic Awareness, published by Harcourt,
is a commercial supplemental resource that provides 48 weekly lessons to help 5-6-year-
olds to master consonant and vowel sounds, vowel patterns, and other phonics skills.
Teachers use the program 20 minutes each day in small groups. Under contract to the
publisher, Apthorp (2005) carried out an evaluation in 16 first-grade classrooms in 6
schools, four of which were high-poverty (93% free lunch), 95% African American
schools and two of which were middle class (22% free lunch) schools in which 78% of
students were White, 13% African American, and 6% Hispanic. Eight classes were
randomly assigned to EOR (n=126) and 8 to control (n=131). Control classes used
standard McGraw-Hill or Literacy Place basals without supplemental phonics instruction.
On three ERDA scales, the mean effect size after adjusting for pretests was -0.09, and the
mean of two Gates MacGinitie scales was -0.29, for a mean of -0.19. Patterns were
similar in the high-poverty and middle-class sites.
Conclusions: Reading Curricula
Beginning reading curricula have been studied in just a few high-quality
evaluations. There were eight studies, six of which used randomized quasi experiments.
These studies evaluated four core basal reading programs, Open Court Reading, Reading
Street, Scholastic Phonics Readers with Literacy Place, and the early Lippincott program,
plus two supplemental programs, the Open Court Phonics Kit, and Elements of Reading:
Phonics and Phonemic Awareness. With the exception of a small study of the Open
Court Phonics Kit, none of the programs had effect sizes in excess of +0.20.The sample
size-weighted mean effect size across all eight was +0.13, with three studies of
supplementary phonics programs reporting a weighted mean effect size of +0.15 and core
programs a weighted mean of +0.12. Effect sizes averaged +0.23 for decoding measures,
but only +0.09 for comprehension/total reading measures.
Research on Instructional Technology
The effectiveness of instructional technology (IT) has been extensively debated
over the past 20 years, and there is a great deal of research on the topic. Kulik (2003)
concluded that research did not support use of IT in elementary or secondary reading,
although E. Chambers (2003) came to a somewhat more positive conclusion.
The Best Evidence Encyclopedia is a free web site created by the Johns Hopkins University School of Education’s Center for Data-Driven Reform in Education (CDDRE) under funding from the Institute of Education Sciences, U.S. Department of Education.
15
Ten studies of instructional technology met the standards for the present review.
These were divided into three categories. Supplemental technology programs, such as
Waterford, WICAT, and Phonics-Based Reading, are programs that provide additional
instruction at students’ assessed levels of need to supplement traditional classroom
instruction. Mixed-method models, represented by Writing to Read, are methods that use
computer-assisted instruction along with non-computer activities as students’ core
reading approach. Embedded multimedia, represented by Reading Reels, provides video
content embedded in teachers’ whole-class lessons.
Descriptions and outcomes of all studies of instructional technology in beginning
reading that met the inclusion criteria appear in Table 2.
================
TABLE 2 HERE
================
Supplemental CAI
Multiple Supplemental CAI Programs
Dynarski, Agodini, Heaviside, Novak, Carey, & Campuzano (2007) evaluated the
use in first grade of five CAI reading programs, Destination Reading, Waterford,
Headsprout, Plato Focus, and Academy of Reading. Outcomes for individual programs
were not reported, so this is an evaluation of modern uses of technology in first grade
reading in general, not of any particular approach. The study involved 43 schools in 11
districts. A total of 158 teachers (89E, 69C) and their 2619 students (1516E, 1103C) were
randomly assigned within schools to CAI or control conditions. CAI students used the
programs 94 minutes per week, on average. Control classes also often had computers, and
used them for purposes such as reading assessment and practice, averaging 18 minutes
per week. Experimental classes also made use of computers for similar purposes beyond
the five programs, averaging 25 minutes per week.
Schools involved in the study were very diverse, and were located throughout the
U.S. However, they were relatively disadvantaged, with 49% of students eligible for free
or reduced-price lunches and 76% of schools receiving Title I. Overall, 44% of students
were White, 31% African American, and 22% Hispanic.
Students were pre- and posttested on the SAT-9 and the TOWRE. There were no
posttest differences on any subscales. Adjusting for pretests, SAT-9 posttest effect sizes
were +0.06 (n.s.) for Sounds and Letters, +0.04 (n.s.) for Word Reading, and -0.01 (n.s.)
for Sentence Reading, for an overall effect size of +0.03. On the TOWRE, effect sizes
were +0.03 (n.s.) for Phonemic Decoding Efficiency, +0.02 (n.s.) for Sight Word
Efficiency, and +0.04 (n.s.) overall. Averaging SAT-9 and TOWRE, the effect size was
+0.04.
Waterford Early Reading Program
The Best Evidence Encyclopedia is a free web site created by the Johns Hopkins University School of Education’s Center for Data-Driven Reform in Education (CDDRE) under funding from the Institute of Education Sciences, U.S. Department of Education.
16
The Waterford Early Reading Program is a supplemental designed to develop
kindergartners’ and first graders emergent literacy skills. Its activities include letter
recognition, phonemic awareness, vocabulary and comprehension. Children play games
and complete fill-in-the-blank writing activities, presented at the child’s level of
functioning.
Cassady & Smith (2005) carried out a small matched evaluation of Waterford in a
rural school in the Midwest. Three first grade teachers used Waterford about 20 minutes a
day during regular reading periods, starting in Fall, 2001. The same teachers’ classes the
previous year served as the control group. The n’s were 46E, 47C. On Terra Nova
Reading, controlling for pretests, the effect size was +0.71. Effects were particularly large
for the children who had the lowest pretest scores.
Phonics-Based Reading
Phonics-Based Reading (PBR), created by Lexia, is computer software designed
to help beginning readers learn word-attack skills. Children work independently at
computer stations through an individualized, structured series of activities that progress
from words in isolation to sentences and paragraphs. When children finish the PBR
sequence, they move to a similar series called Strategies for Older Students (SOS).
Macaruso, Hook, & McCabe (2006) evaluated PBR in ten first-grade classes in
five urban elementary schools in the Boston area. More than 50% of students received
free or reduced-price lunches, and 29% came from homes in which a language other than
English was spoken.
One first grade class in each school was designated to use PBR (N=92) and one
served as a control group (N=87). All classes used the same Scott Foresman or Bradley
basals. PBR was used in a lab setting 2-4 times per week for 20-30 minutes.
Experimental and control students were fairly well matched on Gates MacGinitie pretests
given in November of first grade. On June posttests, adjusted for pretests, PBR students
scored nonsignificantly better (ES=+0.20, n.s.).
The Literacy Center (Grade 1)
The Literacy Center (TLC), developed by LeapFrog, is a supplemental literacy
program that uses technology to teach phonological awareness and phonics. Children use
the program 20-30 minutes daily, in addition to their core reading program. Teachers
receive four days of training on TLC implementation. The publisher commissioned RMC
Research Corporation (2004) to evaluate TLC. Six high-poverty schools in Las Vegas
were randomly assigned to TLC or control conditions, making this a randomized quasi-
experiment. This section reports only on first grades (n=109E, 86C); kindergarten
findings are reported later in this article. Children were pre- and posttested on the Gates
MacGinitie and on four DIBELS scales. Adjusting for pretests, there were no differences
on Gates (ES= -0.04, n.s.) or on DIBELS (ES= -0.01, n.s.), for a mean of -0.02.
The Best Evidence Encyclopedia is a free web site created by the Johns Hopkins University School of Education’s Center for Data-Driven Reform in Education (CDDRE) under funding from the Institute of Education Sciences, U.S. Department of Education.
17
WICAT
WICAT was a traditional supplementary CAI program that provided
individualized reading activities to strengthen students’ skills. It consisted of graphics,
animation, and high-quality audio content and was designed to complement and enhance
in-class instruction in reading skills such as decoding, contextual analysis, and word
identification.
Erdner, Guy, and Bush (1997) carried out a matched evaluation study in two
elementary schools in north central Oklahoma. Participants were 85 first graders. The
experimental group and the control group were well matched on school size, SES,
gender, and pretest scores. Students in the treatment group received 60 minutes per week
of computer-assisted instruction in reading for a full academic year. The control school
used a traditional instruction method without any CAI support. After 1 year, students in
both groups took the standardized CTBS test. Adjusting for pretests, the treatment school
scored significantly better than the control school, with an effect size of +1.05.
The Reading Machine
The Reading Machine was an early phonics drill and practice program. Teachers
could choose specific objectives and the program kept track of student progress. Abram
(1984) conducted a 12-week randomized experiment on the use of the Reading Machine
with 103 first-grade students randomly assigned to use the program for either phonics or
mathematics, with each group serving as the control group for the other. An analysis of
NCE gain scores on the Iowa Test of Basic Skills revealed no significant effects of the
program (ES = +0.19, n.s.).
Average Effect Size—Supplemental CAI
The weighted mean effect size across the 6 qualifying studies of supplemental
CAI was +0.09.
Mixed-Method Model
Writing to Read
Writing to Read (WTR), originally developed by IBM but now distributed by
Bright Blue Software, is a computer-based program created to develop the writing and
reading skills of K-1 children. It is based on the premise that children can learn to read by
first learning to write anything they can say. Instruction is individualized, allowing
students to work at their own pace. Students cycle through computer and non-computer
tasks (such as listening to stories, writing stories, and working with the teacher in small
groups).
Collis, Ollila, & Ollila (1990) carried out a small evaluation of Writing to Read in
first grades in British Columbia, Canada. Children in two schools that used the program
The Best Evidence Encyclopedia is a free web site created by the Johns Hopkins University School of Education’s Center for Data-Driven Reform in Education (CDDRE) under funding from the Institute of Education Sciences, U.S. Department of Education.
18
in 1985-86 (N=53) were compared to those in the same school in 1983-84 (N=44) who
had similar scores on the Canadian Reading Tests. The posttests were Stanford
Achievement Tests. Adjusted for pretests, the Writing to Read children scored higher on
total reading (ES=+0.47); but there were no differences in word study skills (ES=+0.07),
for a mean of +0.27.
Beasley (1989) evaluated Writing to Read with first graders in two middle class
elementary schools in Athens, Alabama. There were 42 children in the Writing to Read
school and 32 in the control school. Overall, 82% of the students were White, 18%
African American. On the Stanford Early School Achievement Test (SESAT-2),
adjusting for pretests, there were no significant differences on Sounds and Letters (ES=
-0.09), Word Reading (ES=+0.15), or Sentence Reading (ES=-0.44). Controlling for
Otis-Lennon School Ability Tests, SESAT posttests nonsignificantly favored the control
group on Reading Comprehension (ES=-0.52) and Total Reading (ES=-0.44), for an
average across the five measures of ES=-0.27. The mean effect size across the two
qualifying studies of Writing to Read was +0.04.
Embedded Multimedia
Reading Reels
Reading Reels is a form of multimedia in which video content is embedded within
teachers’ lessons. It is used only within the Success for All comprehensive reform
program (discussed later in this article). Brief animations, puppet skits, and live-action
video segments, about 5 minutes daily in total, model for children and teachers beginning
reading strategies.
B. Chambers, Cheung, Madden, Slavin, & Gifford (2006) evaluated Reading
Reels in a year-long randomized experiment with 394 first graders in 10 high-poverty
schools in Hartford, Connecticut. The schools served very disadvantaged populations
that were approximately 60% Hispanic and 40% African American. The study compared
first graders who learned to read using the Success for All program either with or without
the embedded video components. In HLM analyses with school as the unit of analysis,
controlling for pretests, the study found positive individual level effect sizes for Word
Identification (ES=+0.15, n.s.), Word Attack (ES=+0.32, p<.05), Passage Comprehension
(ES=+0.08, n.s.), and DIBELS (ES=+0.12, n.s.), for a mean of +0.17.
B. Chambers, Slavin, Madden, Abrami, Tucker, Cheung, & Gifford (2008)
carried out a randomized evaluation of high-poverty Hispanic schools in Los Angeles and
Las Vegas. Both were multi-track, year-round Success for All schools. On entry to first
grade, children were assigned at random to tracks (groups that follow a particular
schedule of attendance and vacations). Then one track was randomly assigned to the
experimental group (N=75) and one to the control group (N=84). Tutoring was provided
in both conditions as part of Success for All, and in the experimental group tutored
children received computer-assisted tutorials as well as Reading Reels. Children were
pretested in September 2004 on the Woodcock Letter-Word Identification Scale, and
The Best Evidence Encyclopedia is a free web site created by the Johns Hopkins University School of Education’s Center for Data-Driven Reform in Education (CDDRE) under funding from the Institute of Education Sciences, U.S. Department of Education.
19
posttested in the May 2005 on the Woodcock Letter-Word and Word-Attack measures
and the Gray Oral Reading Test (GORT) Fluency and Oral Reading scales. Adjusted for
pretests, posttest effect sizes were +0.33 (p< .01) for Letter-Word, +0.28 (p<.05) for
Word Attack, +0.28 (p<.05) for GORT Fluency, and +0.17 for GORT Comprehension,
an average effect size of +0.27. To disentangle effects of the computer-assisted tutoring
intervention, effects were computed for non-tutored students. The mean effect size
across the four measures was +0.23, indicating a positive effect for children who received
only the Reading Reels intervention.
The weighted mean across the two studies of embedded multimedia was +0.20.
Conclusions: Instructional Technology
Across 10 qualifying studies, the weighted mean effect size for all technology
approaches was only +0.11. A large, randomized study by Dynarski et al. (2007) found
no impact of five current supplemental CAI models. This study’s findings greatly
affected the weighted mean of six studies of supplementary CAI, estimated at +0.09. The
weighted mean effect size for decoding measures, also greatly affected by the Dynarski et
al. (2007) findings, was only +0.07, although comprehension/total reading effects
averaged +0.20. Large effect sizes were reported in small, matched studies of Waterford
and WICAT. A very different approach to technology, Reading Reels, had modest
positive effects in two large randomized experiments (weighted mean ES=+0.20).
Reading Reels uses videos embedded in core instruction in Success for All. With these
potentially promising exceptions, research on the use of technology in beginning reading
instruction does not support use of the types of software that have been most commonly
used. This conclusion agrees with findings for computer assisted instruction in the upper
elementary grades (Slavin et al., 2008a) and with the findings of a review of CAI by
Kulik (2003).
Instructional Process Programs
Instructional process programs are methods that focus on providing teachers with
extensive professional development to implement specific instructional methods. These
fell into three categories. Cooperative learning programs (Slavin, 1995, in press) use
methods in which students work in small groups to help one another master academic
content. Phonological awareness training is an approach that gives teachers strategies for
building phonics and phonemic awareness skills. Phonics-focused professional
development models, including Reading and Integrated Literacy Strategies (RAILS),
Sing, Spell, Read, and Write, Ladders to Literacy, and Orton Gillingham, provide training
to teachers to help them effectively incorporate phonics, phonemic awareness, and other
elements in beginning reading lessons. Note that programs combining instructional
process approaches with innovative curricula, such as Success for All and Direct
Instruction, are reviewed in a separate section of this article.
Descriptions and outcomes of all studies of instructional process programs
meeting the inclusion criteria appear in Table 3.
The Best Evidence Encyclopedia is a free web site created by the Johns Hopkins University School of Education’s Center for Data-Driven Reform in Education (CDDRE) under funding from the Institute of Education Sciences, U.S. Department of Education.
20
=================
TABLE 3
=================
Cooperative Learning Programs
Classwide Peer Tutoring
Classwide Peer Tutoring, or CWPT (Greenwood, Delquadri, & Hall, 1989), is a
cooperative learning approach in which children regularly work in pairs. They engage in
structured tutoring activities and frequently reverse roles. The pairs are grouped within
two large teams in each classroom, and tutees earn points for their team by succeeding on
their learning tasks. A winning team is determined each week, and receives recognition.
A remarkable four-year longitudinal study by Greenwood et al. (1989) evaluated
CWPT. In it, six high-poverty schools in Kansas City, Kansas, were randomly assigned to
CWPT or control conditions. Because analysis was at the student level, this was a
randomized quasi-experiment. The children and teachers began in Grade 1 and continued
through Grade 4. A total of 123 students began in the experimental and control schools in
first grade and continued through fourth grade, about half of the initial group.
At posttest, analyses of covariance indicated significantly higher achievement for
the CWPT group on the reading section of the Metropolitan Achievement Test
(ES=+0.57, p<.001). A two-year followup, when children were in sixth grade, found that
CWPT students maintained their advantage over the control students (ES=+0.55, p<.05)
(Greenwood, Terry, Utley, Montagna, & Walker, 1993).
Peer-Assisted Literacy Strategies (PALS)
Peer-Assisted Literacy Strategies, or PALS, is a technique in which children work
in pairs, taking turns as teacher and learner, to learn a structured sequence of literacy
skills, such as phonemic awareness, phonics, sound blending, passage reading, and story
retelling. Children use a simple error-correction strategy with each other, under guidance
from the teacher.
Mathes & Babyak (2001) carried out an evaluation of PALS over a 14-week
period in a medium-sized district in Florida. Two main treatments, PALS and control,
were compared (a third treatment was used for only 6 weeks). The students were 63%
White, 36% African American. Ten first grade classes were randomly assigned to PALS
(n=61) and 10 to control (n=49) in a randomized quasi-experiment. On Woodcock scales,
adjusting for pretests, effect sizes averaged +0.51 for Word Identification, +0.92 for
Word Attack, and +0.41 for Passage Comprehension, for a mean of +0.61. Effects were
more positive for low achievers (ES=+0.61) and for average achievers (ES=+0.98) than
for high achievers (ES=+0.25).
The Best Evidence Encyclopedia is a free web site created by the Johns Hopkins University School of Education’s Center for Data-Driven Reform in Education (CDDRE) under funding from the Institute of Education Sciences, U.S. Department of Education.
21
A small 20-week study by Calhoon, Otaiba, Greenberg, King, & Avalos (2006)
evaluated PALS in three majority-Hispanic schools in a New Mexico border town.
Overall, 68% of first graders were Hispanic and 32% were White; 75% received free
lunches. Six classrooms within 3 Title I schools were randomly assigned to conditions,
making this a randomized quasi-experiment (RQE). Students were pre- and posttested on
the DIBELS. A total of 78 children (n=41 E, 37 C) completed pre- and posttests. Effect
sizes were +0.58 (p<.01) for Nonsense Word Fluency, and 0.00 (n.s.) for Oral Reading
Fluency, for a mean of +0.29. Patterns for Hispanic and non-Hispanic children varied by
subscale, but overall effects were similar.
Calhoon, Al Otaiba, Cihak, King, & Avalos (2007) evaluated PALS in a 16-week
experiment among first graders in 3 schools on the US-Mexico border. 79% were
Hispanic, 28% were English language learners, and 88% received free lunches. The
schools used a two-way bilingual education approach, in which students received roughly
equal amounts of Spanish and English instruction throughout the day. Six classes were
randomly assigned to PALS (n=43) or control (n=33), making this a randomized quasi-
experiment. On DIBELS scales, adjusting for pretest differences, effect sizes were +0.51
(p<.05) for Nonsense Word Fluency, +0.20 (n.s.) for Letter Naming Fluency, and +0.29
(p<.05) for Oral Reading Fluency, for a mean of +0.33. Outcomes were more positive for
ELLs on Nonsense Word Fluency and Letter Naming Fluency, but more positive for
English proficient children on Oral Reading Fluency.
In a 16-week experiment, Mathes, Torgesen, and Allor (2001) evaluated PALS
among first graders in a southeastern district. Three treatments were compared, but one, a
combination of PALS and computerized phonological awareness training, had pretest
differences with the control group of more than 50% of a standard deviation. Students
were 65% White and 32% African American. Twelve classes were assigned to PALS
(n=84) and twelve matched classes were assigned to a control condition (n=56). All
students were pre- and posttested on Woodcock and TERA-2 measures. Total Woodcock
effect sizes were +0.39 for Word Identification, +0.59 for Word Attack, and +0.56 for
Passage Comprehension, and for TERA-2 they were +0.48, for a mean of +0.50. Effects
were larger for low achievers (ES=+0.65) than for average achievers (ES=+0.37) or high
achievers (ES=+0.30).
Mathes, Howard, Allen, & Fuchs (1998) evaluated PALS in a 16-week study in a
southeastern city. Twenty first grade teachers in 6 schools participated. Assignment was
partly random and partly matched, so this was considered a matched study. Three low
achievers and one average and one high achiever were randomly selected within each
class for measurement, so the total sample was 48 children in 10 PALS classes and 48
children in 10 control classes. PALS procedures were used 3 times a week in 35-minute
sessions focusing on sounds and words and partner read-alouds, while control classes
were described as using traditional whole language models. On Woodcock scales,
adjusted for pretests, posttest effect sizes were +0.21 for Word Identification, +0.54 for
Word Attack, and +0.37 for Passage Comprehension, for a mean of +0.37. Effects were
positive for low achievers (mean ES=+0.60) and average achievers (mean ES=+0.44) but
not high achievers (mean ES=+0.08).
The Best Evidence Encyclopedia is a free web site created by the Johns Hopkins University School of Education’s Center for Data-Driven Reform in Education (CDDRE) under funding from the Institute of Education Sciences, U.S. Department of Education.
22
Mathes, Torgesen, Clancy-Menchetti, Sani, Nicholas, Robinson, & Grek (2003)
evaluated PALS with low-achieving first graders in a 16-week study in a southeastern
school district. Teachers were assigned to one of three conditions: PALS (N=7 teachers,
31 students); teacher-directed small-group instruction (TDI), a small group model that
used the same curriculum but no peer activities (N=7 teachers, 30 students); and an
untreated control group (N=8 teachers, 28 students). Although teachers were randomly
assigned to PALS and TDI conditions, and some were randomly assigned to the control
group, other controls were matched, so the overall design is considered matched.
Students in PALS classes experienced three 35-minute sessions each week, while those in
TDI received three 30-minute sessions each week. The students in the PALS condition
gained substantially more than controls on all measures, although not all differences were
statistically significant. Averaging across five subtests, shown in Table 3, PALS students
averaged an effect size of +0.43 in comparison to controls after adjusting for pretests.
However, PALS students scored non-significantly less well than those in the TDI
condition.
Across 6 small studies of PALS, the weighted mean effect size was +0.44, and
adding in the CWPT study, the mean for seven small studies of cooperative learning was
+0.46.
Phonological Awareness Training
Phonological Awareness Training: Norway
In a Norwegian study, Lie (1991) compared two phonological awareness training
approaches in first grade in terms of effects on end of grades 1 and 2 reading. One
treatment, called “sequential analysis,” focused on teaching children to identify
phonemes in a word in sequence, and to blend phonemes. A second treatment, “positional
analysis,” focused on teaching children to identify initial, final, and medial sounds in
spoken words. A control group received no phonological awareness training. Ten first-
grade classes in Halden, Norway were randomly assigned as follows: Sequential (n=3
classes, 52 students), positional (n=3 classes, 60 students), or control (n=4 classes, 96
students). The small number of classes makes this a randomized quasi-experiment. On
standardized Norwegian reading tests, adjusted for pretests, effect sizes for the sequential
group were +0.56 (p<.05) at the end of grade 1 and +0.39 (p<.10) at the end of grade 2.
Corresponding effect sizes for the positional treatment were +0.12 (n.s.) in first grade and
+0.22 (n.s.) in second grade. Averaging across the two phonological awareness
treatments, effect sizes were +0.34 in first grade and +0.30 in second grade.
Phonological Awareness Training: Denmark
Lundberg, Frost, & Petersen (1988) carried out an influential study in which
Danish kindergartners were given a year-long training program in phonemic awareness.
Children received daily 15-20 minute sessions of metalinguistic exercises and games. The
235 children in the experimental group were in 12 classes on a rural island, while 155
The Best Evidence Encyclopedia is a free web site created by the Johns Hopkins University School of Education’s Center for Data-Driven Reform in Education (CDDRE) under funding from the Institute of Education Sciences, U.S. Department of Education.
23
matched control children were in a rural area of the mainland. Control children did not
receive any instruction in reading, as consistent with Danish policies.
At the end of kindergarten, the experimental children of course scored much
better than controls on tests of phonological skills. Of greater interest was that at the end
of Grades 1 and 2, reading scores on a Danish reading test favored the experimental
group. Adjusting for pretest differences, effect sizes were +0.40 (p < .10) in first grade
and +0.48 (p<.05) in second grade, showing a lasting impact of the phonological
awareness training.
Phonological Awareness Training: Germany
Schneider, Küspert, Roth, Visé, & Marx (1997) reported two German studies of
the long-term impact of phonological awareness training in kindergarten, replicating a
study by Lundberg, Frost, & Petersen (1988) involving Danish kindergartners. In the first
of the Schneider et al. studies, 205 children in 11 kindergarten classes in rural Germany
received phonological awareness training 15-20 minutes daily for six months. Control
children (n=166 in 12 classes) were not taught reading at all, as consistent with German
practice at the time. They were matched on pretests and demographics. Not surprisingly,
the experimental group scored substantially better at the end of kindergarten. Of greater
interest, German reading tests showed significant differences at the end of first grade
(ES=+0.29, p<.05) but not at the end of second grade (ES=-0.19, n.s.).
In a replication in a different rural area, 191 children in 11 kindergarten classes
were given phonemic awareness training and compared to 155 control children in 7
control classes, matched on pretests and demographics. Again, there were substantial
phonemic awareness differences at the end of kindergarten, but in this study there were
significant positive effects on a German reading measure at the end of grade 1
(ES=+0.53, p<.05) and at the end of grade 2 (ES=+0.33, p<.05).
Phonological Awareness Training: U.S.
Blachman and her colleagues developed and evaluated a phonological awareness
training program in grades K-1. Children in two high-poverty (85% free lunch) schools in
Syracuse, New York, received the experimental treatment, while two schools matched on
SES, race, free lunch, and pretest scores served as controls. The experimental treatment
began in February of kindergarten, and continued through the end of first grade. In
kindergarten, children in experimental schools participated in heterogeneous groups of 4-
5 taught by teachers and assistants. In first grade, the children in the experimental schools
were divided into 11 homogeneous groups of 6-9, each taught by a different teacher. Both
experimental and control classes received 30-minute lessons each day. The experimental
group received lessons that reviewed phonemic awareness skills, introduced all letter
names and letter sounds, and used phoneme analysis and blending to decode phonetically
regular words. Lessons also introduced high-frequency sight words, as well as reading of
phonetically controlled readers and selected basal stories. In contrast, control classes used
the traditional Scott Foresman basal reading program and students read trade books from
The Best Evidence Encyclopedia is a free web site created by the Johns Hopkins University School of Education’s Center for Data-Driven Reform in Education (CDDRE) under funding from the Institute of Education Sciences, U.S. Department of Education.
24
their school library. Experimental teachers received 13 2-hour in-service sessions over
the first grade year.
The main focus of the evaluation was on end-of-first grade measures (N=66 E, 62
C). The experimental group scored higher on all measures: Woodcock Word
Identification (ES=+0.28), Decoding of Real Words (ES=+0.64), and Decoding of Non-
Words (ES=+0.74), for a mean effect size of +0.55. A follow-up assessment at the end of
second grade (n=58 E, 48 C) found that positive effects maintained. Effect sizes were
+0.31 for Woodcock Word Identification, +0.34 for Decoding of Real Words, and +0.36
for Decoding of Non-Words, for a mean effect size of +0.33.
Across five phonological awareness training studies, weighted mean effect sizes
at the end of first or second grade were +0.22.
Phonics-Focused Professional Development Models
Sing, Spell, Read, and Write
Sing, Spell, Read, and Write (SSRW) is a phonetic approach to beginning reading
and writing instruction that uses songs, phonetic storybooks, and systematic, step-by-step
development of word attack skills. Students’ progress is carefully monitored and
celebrated.
Bond, Ross, Smith, & Nunnery (1995/1996) carried out a large one-year
evaluation of SSRW with children in grades K-1 in Memphis. Eight schools using the
program were matched with eight control schools, based on percent free lunch, state test
scores, and percent African American. Individual classes within SSRW and control
schools were matched on state test scores and class size. A random sample of 252
students across schools was individually pretested, and the two groups did not differ. At
posttest, a 50% random sample was selected for individual assessments in grades K-1
(kindergarten n=75E, 65C; first grade n=137E, 139C).
Outcomes favored SSRW at both grade levels. On Woodcock Letter Word
Identification, ES=+0.44 (p<.01) for kindergarten, ES=+0.22 (p<.01) for first grade.
Woodcock Word Attack effect sizes were +0.66 (p<.001) for kindergarten and +0.64
(p<.001) for first grade. On the Durrell Oral Reading Test, however, effect sizes were not
significant. For kindergarten the effect size was +0.13 (n.s.) and for first grade it was
+0.03 (n.s.). Averaging across the three reading measures, effect sizes were +0.41 for
kindergarten and +0.30 for first grade.
Jones (1995) evaluated Sing, Spell, Read, and Write in a 7-month study in an
Appalachian Mississippi elementary school. The first graders were 78% White and 22%
African American, and 55% received free or reduced-price lunches. The SSRW students
(n=50) were in two classes, and two matched classes (n=47) received a “modified whole
language” approach that incorporated a phonetic Writing Road to Reading text as well as
The Best Evidence Encyclopedia is a free web site created by the Johns Hopkins University School of Education’s Center for Data-Driven Reform in Education (CDDRE) under funding from the Institute of Education Sciences, U.S. Department of Education.
25
big books and writing activities. On Gates MacGinitie Reading Comprehension tests,
adjusting for pretests, the SSRW children scored somewhat higher (ES=+0.21).
Reading and Integrated Literacy Strategies (RAILS)
Reading and Integrated Literacy Strategies (RAILS) is a professional
development approach primarily intended for high-poverty schools with many students at
risk. It provides children in grades K-2 with a second 20-minute reading period each day
to supplement their 60-90 minute regular reading, and provides teachers with extensive
professional development focusing on explicit instruction in phonemic awareness,
phonics, comprehension, and vocabulary. RAILS was evaluated by Stevens, Van Meter,
Garner, Warcholak, Bochna, & Hall (2008) in three low-achieving schools in a small city
in central Pennsylvania. Most students were White (94%), and 71% received free or
reduced-price lunches. Two cohorts were followed over a two-year period, from K to 1 or
1 to 2. Two schools (n=62 K-1, 50 1-2) used RAILS and one matched school (n=67 K-1,
58 1-2) served as a control group. Students were pre- and posttested on the Metropolitan
Achievement Test. Posttest effect sizes adjusted for pretests were +0.39 for the K-1
cohort and +0.43 for the 1-2 cohort, for a mean of +0.41.
Ladders to Literacy
Ladders to Literacy is a professional development program for kindergarten that
focuses on phonics and phonemic awareness, rhyming, and letter sounds. Teachers
receive extensive training and followup. Most Ladders to Literacy studies have taken
place within the kindergarten year, and are described later in this article under
kindergarten-only studies. However, one study, by O’Connor (1999, Study 1) included a
follow-up assessment to the end of first grade and is reviewed here. Two Ladders to
Literacy schools in a large urban district were compared to two schools matched on
pretests, ethnicity, and special education rates. Overall, the schools were approximately
46% African American, 51% White. Analyses were presented for “typical learners” and
“children at risk”, but there were too few “children at risk” in the control group to include
in this review. N’s for typical learners were 64E, 41C. Controlling for Woodcock
pretests, children in the Ladders to Literacy treatment scored higher than controls on
Woodcock Letter Word Identification (ES=+0.92, p<.01). A one year follow-up at the
end of first grade (O’Connor, Notari-Syverson & Vadasy, 1996) found that the
differences were no longer statistically significant, and the effect size on Woodcock
Letter-Word Identification was near zero (ES =+0.02), adjusting for kindergarten
pretests. However, there were non-significant but notable effects on Woodcock Word
Attack (ES =+0.38, n.s.), for a mean effect size of +0.20.
Orton Gillingham
Orton Gillingham is a structured, phonetic reading approach that uses
multisensory teaching, emphasizing visual, auditory, kinesthetic, and tactile teaching
strategies. An adaption of the Orton Gillingham method called Alphabetic Phonics was
evaluated in four inner-city schools in the Southwest by Joshi, Dahlgren, & Boulware-
The Best Evidence Encyclopedia is a free web site created by the Johns Hopkins University School of Education’s Center for Data-Driven Reform in Education (CDDRE) under funding from the Institute of Education Sciences, U.S. Department of Education.
26
Gooden (2002). Two first-grade classes (n=24) used Alphabetic Phonics and two (n=32)
in the other schools used a standard Houghton Mifflin basal. The schools averaged 53%
minority (mostly African American) and 81% free or reduced lunch. Adjusting for
pretests, differences favored the Alphabetic Phonics group on Word Attack (ES=+0.28,
p<.01) and Gates MacGinitie Comprehension (ES=+0.58, p<.02), for an average effect
size of +0.43.
Across five studies of phonics-focused professional development, the weighted
mean effect size was +0.32.
Other Professional Development Models
Four Blocks
The Four Blocks literacy model is a professional development approach in which
teachers in grades 1-3 use nonability-grouped, multi-level instruction. The four “blocks”
of daily lessons are guided reading (comprehension), self-selected reading, writing, and
working with words (decoding). Teachers receive extensive training in effective use of
each of these elements.
A small study of the Four Blocks program was carried out by Scarcelli & Morgan
(1999) in a Title I school in Virginia Beach, Virginia. Two intact classes of first graders
using Four Blocks (n=25) were compared to two using a whole language model (n=30).
The groups were fairly well matched on Gates MacGinitie pretests, but at posttest the
Four Blocks students scored much higher on Gates tests (adjusted ES=+0.56, p< .036).
Particularly positive results were reported for the lowest-achieving third of the classes.
Conclusions: Instructional Process Programs
As was true in the Slavin et al. (2008a) upper elementary reading review and the
Slavin et al. (2008b) secondary reading synthesis, effects for instructional process
programs were very positive. Across 18 studies, the weighted mean effect size for
instructional process approaches in beginning reading was +0.31. The mean was +0.41
for decoding measures and +0.26 for comprehension/total reading measures. In
particular, positive effects were seen on cooperative learning programs such as Peer-
Assisted Learning Strategies (PALS) and Classwide Peer Tutoring (mean ES=+0.46),
phonics-focused professional development programs such as Sing, Spell, Read, and
Write, and RAILS (mean ES=+0.32), and teaching of phonological awareness to
kindergartners (mean ES=+0.22 on tests at the end of first or second grade).
Combined Curriculum and Instructional Process Approaches
Evaluations of programs that provide complete curricula as well as extensive
professional development in classroom instructional processes are summarized in Table
4. These consist of two programs, Success for All and Direct Instruction.
The Best Evidence Encyclopedia is a free web site created by the Johns Hopkins University School of Education’s Center for Data-Driven Reform in Education (CDDRE) under funding from the Institute of Education Sciences, U.S. Department of Education.
27
===============
TABLE 4 HERE
===============
Success for All
Success for All (SFA) is a comprehensive school reform program designed to
ensure success in reading for children in high-poverty schools (Slavin & Madden, 2001).
It provides schools with a K-5 reading curriculum that focuses on phonemic awareness,
phonics, comprehension, and vocabulary development, beginning with phonetically-
controlled mini-books in grades K-1. Cooperative learning is extensively used at all
grade levels. Struggling students, especially first graders, receive one-to-one tutoring.
Children are frequently assessed on curriculum-based measures, and these are used to
regroup children into reading groups according to current reading level, across grade
lines. Extensive professional development and a full-time facilitator help teachers
effectively apply all program elements. A Solutions Team works with parents to help
them support their children’s achievement and to deal with issues such as attendance and
behavior problems.
Evaluations of Success for All have been done by many researchers throughout
the U.S. and elsewhere, but most have used a similar set of measures and procedures.
Usually, kindergarten students in SFA and matched control schools are individually
assessed on PPVT and/or Woodcock Letter-Word scales. They are then individually
tested each spring, usually for multiple years, on the Woodcock Letter-Word, Word
Attack, and Passage Comprehension scales, and (in most studies) the Durrell Oral
Reading Test. Analyses of covariance compare experimental and control schools on each
measure, controlling for pretests.
The largest and most important evaluation of Success for All was a three-year
longitudinal cluster randomized experiment (Borman, Slavin, Cheung, Chamberlain,
Madden, & Chambers, 2007). In this study, 35 Title I schools throughout the U.S. were
randomly assigned to use Success for All either in grades K-2 or 3-5. The 3-5 group
served as a control group for the K-2 schools. A total of 2108 K-2 children (1085 E,
1023 C) remained in the study schools all three years, 63% of those originally tested in
kindergarten. Attrition was equal in the two treatment groups. Among the final sample,
72% of students received free lunches, and 57% of students were African American, 31%
were White, and 10% were Hispanic.
Children were pretested on the PPVT and then individually tested on scales from
the Woodcock Reading Mastery Test each spring for three years. Testers were not aware
of the treatment assignments of each school. Data were analyzed using HLM, with
children nested within schools. Using individual posttests adjusted for pretests, effect
sizes were +0.22 (p<.05) for Word Identification, +0.33 (p<.01) for Word Attack, and
+0.21 (p<.05) for Passage Comprehension, for a mean of +0.25.
The Best Evidence Encyclopedia is a free web site created by the Johns Hopkins University School of Education’s Center for Data-Driven Reform in Education (CDDRE) under funding from the Institute of Education Sciences, U.S. Department of Education.
28
Other than the Borman et al. study, all studies of Success for All have used
matched designs. The largest and longest of these was a longitudinal matched study of
the five original SFA schools in Baltimore (Madden, Slavin, Karweit, Dolan, & Wasik,
1993; Slavin, Madden, Dolan, & Wasik, 1993). In this study, students in five inner-city
Baltimore schools were individually matched with those in similar control schools.
Individual matching was based on spring kindergarten CTBS or CAT scores administered
by the district, and school matching was based on free lunch and historical achievement
levels on district standardized tests. All children were African American, and
approximately 95% of children qualified for free lunches.
Each spring, children in all SFA and control schools who had begun in their
schools by first grade were individually assessed on the Woodcock Word Identification,
Word Attack, and Passage Comprehension tests. Students in grades 1-3 were also given
the Durrell Oral Reading Test, while those in grades 4-5 were given the Gray Oral
Reading Test. Testers were not made aware of the schools’ treatment assignments.
Children were followed and tested as long as they remained in their schools, even if they
were retained or assigned to special education. Each year, an additional cohort was
added.
A major report on the evaluation was published in the American Educational
Research Journal after three years (Madden et al., 1993). At that point, the third grade
cohort had been in SFA or control schools for three years, the second grade for two, and
the first grade for one. Averaging across the four measures, the mean pretest-adjusted
effect size was +0.57 for third graders (n = 205E, 205C), +0.60 for second graders
(n=220E, 220C), and +0.51 for first graders (n=246E, 246C). All comparisons on all
measures were statistically significant (p<.001) in individual-level ANCOVAs. Separate
analyses for children whose kindergarten scores put them in the lowest 25% of their
grades found more positive effect sizes for this subgroup: ES=+0.98 for third graders,
ES=+1.00 for second graders, and ES=+0.82 for first graders.
Data collected two years later, when the oldest cohort was in fifth grade, revealed
similar differences (Slavin et al., 1993). Averaging across the three Woodcock measures,
the two Gray measures, and district-administered CTBS scores, the mean effect size for
fifth graders, who were in their fifth year in SFA, was +0.48 (n=128E, 159C), and
ES=+0.45 for fourth graders (n=151E, 155C). Averaging across three Woodcock scales,
the Durrell, and CTBS, effect sizes were +0.49 for third graders (n=151E, 187C), +0.32
for second graders (n=204E, 233C), and +0.55 for first graders (n=256E, 301C). All
comparisons were statistically significant (p<.001). As in the earlier analyses, effect sizes
were larger for students in the lowest 25% at pretest: ES=+1.03 for fifth graders, +0.80
for fourth graders, +1.32 for third graders, +0.92 for second graders, and +1.18 for first
graders. Averaging across all grades, the mean effect size was +0.46 for all students and
+1.05 for low achievers.
Beyond the achievement effects, Slavin et al. (1993) also reported a substantial
difference in retention rates between SFA and control schools. By fifth grade, 34.9% of
control students but only 11.2% of SFA students had been held back (p<.001). According
The Best Evidence Encyclopedia is a free web site created by the Johns Hopkins University School of Education’s Center for Data-Driven Reform in Education (CDDRE) under funding from the Institute of Education Sciences, U.S. Department of Education.
29
to state data, third grade absences in 1993 were 8.8% in SFA schools and 13.5% in
control, and among fifth graders the rates were 6.4% in SFA, 13.7% in control.
Borman & Hewes (2002) carried out a follow-up assessment of children in the
first four Baltimore cohorts when they were in the eighth grade (if they had been
promoted each year). Since SFA schools only went to the fifth grade, these students
would have been out of the SFA program for at least 3 years. Analyses showed that
former SFA students still scored better on CTBS than controls (ES=+0.29, p<.001).
Effect sizes were similar for the lowest achievers (ES=+0.34). The SFA students were
also significantly less likely to have been retained or assigned to special education.
Nunnery, Slavin, Madden, Ross, Smith, Hunter, & Stubbs (1996) carried out a
large evaluation of Success for All in Houston. Two samples were evaluated: Students
taught in English were in 46 SFA and 18 control schools, and students taught in Spanish
were in 20 SFA and 10 control schools. Approximately 79% of students qualified for free
lunches, and virtually all students were African American (48%) or Hispanic (52%). The
schools were matched on free lunch, ethnicity, and pretest scores, the Language
Assessment Scales (LAS).
Schools using SFA chose one of three levels of implementation: Minimal,
medium, or high. The minimal level provided little tutoring for struggling students, used
part-time facilitators, and did not have Solutions Teams. Full implementers had
extensive tutoring from certified tutors, had full-time facilitators, and had Solutions
Teams. “Medium” schools fell between the other categories. The high implementation
condition represents the full SFA program. Two English cohorts were studied, one that
experienced SFA for two years (to second grade; n=595) and one that participated for one
year (first grade only; n=682). Across three Woodcock measures and the Durrell Oral
Reading Test, effect sizes for second graders (adjusted for pretests) averaged -0.30 for
low implementers, -0.11 for medium implementers, and +0.16 for high implementers, for
a mean of -0.08. For the first grade cohort, respective effect sizes were -0.25, +0.22, and
+0.31, for a mean of +0.09. In the Spanish cohort (n=278), which experienced SFA only
in first grade, effect sizes were +0.15 for low implementers and +0.26 for medium, for a
mean of +0.21. Effects were more positive for African American than for Hispanic
students. Averaging across all three cohorts, the sample size-weighted effect size was
+0.05 across all levels of implementation, although the mean for the full program was
ES=+0.23.
Livingston & Flaherty (1997) carried out a 2-year longitudinal evaluation of
Success for All in multilingual schools in Modesto and Riverside, California. Three SFA
schools were compared to three control schools matched on demographics, prior
achievement, and approach to instruction for ELLs. Overall, the schools were 72% free
lunch, and 43% Hispanic, 34% Anglo, 12% Asian, and 6% African American, and 35%
were considered English Language Learners (ELLs). One SFA school and its matched
control school taught students speaking many languages using a sheltered English
strategy. The other two had many Spanish-dominant ELLs, and used a transitional
bilingual approach. The analyses combined children across schools who fell into four
The Best Evidence Encyclopedia is a free web site created by the Johns Hopkins University School of Education’s Center for Data-Driven Reform in Education (CDDRE) under funding from the Institute of Education Sciences, U.S. Department of Education.
30
categories: English-speaking students, Spanish bilingual students (taught and tested in
Spanish), Spanish ESL students (taught and tested in English), and other ESL students.
Because the numbers of Spanish ESL students was small, the last two categories are
combined in this review. There were three cohorts. One was followed through first
grade, one through second grade, and one through third grade (but ESL and bilingual
cohort data for third graders could not be used because higher-achieving students were
transitioned out of their program in third grade).
Students were pretested on the English or Spanish version of the PPVT in
kindergarten, and this score was used as a covariate in all analyses. The posttests for the
English and ESL cohorts were Woodcock Letter-Word Identification, Word Attack, and
Passage Comprehension, and the Durrell Oral Reading test. For the Spanish bilingual
group, Spanish Woodcock scales were used.
For the English-speaking cohorts (n=272E, 184C), PPVT-adjusted effect sizes
were +0.23, and +0.34 for the second-grade cohorts and +0.27 for the first-grade cohort,
for a mean of +0.28. For the Spanish bilingual students (n= 87E, 93C), effect sizes were
+1.40, +0.72, and +0.19 for the three cohorts, for a mean of +0.77. Means for ESL
students (n=80E, 112C) for the three cohorts were +0.49, +0.47, and +0.32, for a mean of
+0.43. Weighted mean effect sizes across all cohorts and all groups were ES= +0.49
(total n=439E, 389C).
Ross, Nunnery, & Smith (1996) evaluated Success for All in first grades in two
schools in the Amphitheater District near Tucson, Arizona. Each school was matched
with two control schools based on prior achievement, percent free lunch, and ethnicity.
Overall n’s were 169E, 371C. About 23% of children were Spanish-dominant and 13%
were ELLs. Averaging across three Woodcock scales and the Durrell, adjusted for PPVT
pretests, effect sizes averaged ES=+0.47 (p<.05).
Jones, Gottfredson, & Gottfredson (1997) carried out a three-year evaluation of
Success for All in an African-American school in Charleston, South Carolina, in
comparison to a school matched on demographics and pretests. Three cohorts were
followed. Cohort 1 (N=113E, 59C) was pretested in fall of first grade on the CSAB and
then postested in first, second and third grades. Cohort 2 (N=109E, 48C) was pretested
in fall of kindergarten on CSAB and the Metropolitan and then postested in K, 1, and 2.
Cohort 3 (N=117E, 52C) was pretested in fall of K and then postested in K and 1 only.
In each case, individually-administered tests (Woodcock, Merrill, CSAB) as well as
group administered tests (BSAP Reading, SAT Reading) were given as postests, but in
the final year for each cohort, only group-administered tests were given. It is important to
note that Hurricane Hugo substantially damaged the SFA school and caused it to be
closed for several months during Year 1 of the study.
Outcomes on various tests were quite diverse. Controlling for pretests and
averaging across cohorts, kindergarten scores strongly favored the SFA school on the
Woodcock scale (ES = +0.98). First grade scores were positive on two Woodcock and
two Durrell scales (ES= +0.20), but not on group-administered SAT or BSAP scores (ES
The Best Evidence Encyclopedia is a free web site created by the Johns Hopkins University School of Education’s Center for Data-Driven Reform in Education (CDDRE) under funding from the Institute of Education Sciences, U.S. Department of Education.
31
= -0.03), for a mean of +0.07. Second grade means (ES = +0.10) and the Cohort 1 third
grade mean (ES = -0.06) were also small. Averaging across cohorts and grades, the mean
effect size was +0.27. Students in the SFA school were also more likely than controls to
be promoted from first to second grade (ES = +0.35) and from second to third grade (ES
= +0.24).
B. Chambers et al. (2005) evaluated the reading achievement of kindergarten and
first grade children in four Success for All and four matched control schools in mostly
Hispanic minority communities in various locations in the U.S. The Success for All
schools also used Reading Reels, an embedded multimedia approach, as part of daily
instruction. The results indicate that students who experienced Success for All with
Reading Reels (n=311) scored significantly higher than control students (n=144) on
Woodcock Letter-Word, Word Attack, and Passage Comprehension, controlling for
Woodcock Letter-Word Identification pretests, with a mean effect size for kindergarten
of +0.36 and for first grade of +0.20.
Ross, Smith, & Casey (1994) evaluated SFA in a rural school in Caldwell, Idaho,
in comparison to a school using traditional basals with most students supplemented by
Reading Recovery with struggling first graders. Three cohorts (K-1, K-2, and 1-3) were
combined for analysis (n=223E, 147C), with a mean effect size of -0.10 on Woodcock
and Durrell measures, controlling for PPVT.
Ross & Casey (1998b) studied SFA in 8 schools (151E, 205C) in Ft. Wayne,
Indiana that were 75% free lunch and 45% minority (mostly African American). Students
were pretested in kindergarten and posttested at the end of first grade. Mean effect sizes
across Woodcock and Durrell measures were +0.25 (adjusting for pretests).
A three-year longitudinal evaluation of SFA was carried out by the Louisville,
Kentucky school district (Muñoz & Dossett, 2004). Three SFA schools were matched
with three controls on CTBS scores, poverty, mobility, and attendance. Approximately
85% of students received free lunches, and 57% were minorities. Third graders were
compared after three years in SFA on district-administered CTBS-Reading scores.
Sample sizes were 217E, 132C. Controlling for Stanford Diagnostic Reading Tests, SFA
students scored significantly higher than controls (ES=+0.15, p<.05).
Dianda & Flaherty (1995) evaluated Success for All over a two-year period in
three California schools. The schools were matched with similar control schools in their
districts based on ethnicity, percent English language learners, free lunch, and prior state
tests, and Peabody Picture Vocabulary Test scores at the beginning of kindergarten were
nearly identical for SFA and control schools. The overall sample was 42% Hispanic, 34%
Anglo, and 32% ELL, with 72% of students qualifying for free lunch.
A focus of the study was on English language learners. Two of the schools had
many Spanish-dominant ELLs and offered these students bilingual instruction, while the
third school taught only in English and had many ELLs speaking a wide variety of
The Best Evidence Encyclopedia is a free web site created by the Johns Hopkins University School of Education’s Center for Data-Driven Reform in Education (CDDRE) under funding from the Institute of Education Sciences, U.S. Department of Education.
32
languages. Control schools had similar distributions and had the same language policies
as their SFA counterparts.
Overall, adjusting for PPVT pretests, students in the SFA schools (N=131) scored
significantly higher than controls (N=188) on three individually-administered Woodcock
scales: Letter-Word Identification (ES=+0.46), Word Attack (ES=+0.36), and Passage
Comprehension (ES=+0.45). Averaging across the 3 Woodcock measures, effect sizes
were positive for English speakers (ES=+0.55), Spanish bilingual students (ES=+0.84),
Spanish-dominant students in sheltered English classes (ES=+0.82), and speakers of
languages other than English in sheltered English (ES=+0.11). The overall effect size was
+0.42.
Ross & Casey (1998a) evaluated SFA in four middle class schools in a suburb of
Portland, Oregon. The schools were 12% to 17% minority and 11% to 21% free lunch.
Two schools used SFA and were matched based on percent free lunch, ethnicity, and
historical achievement levels with two comparison schools. Students in kindergarten and
first grade were pretested on PPVT and posttested on three Woodcock measures and the
Durrell Oral Reading Test. Sample sizes for kindergarten were 156E, 109C, and for first
grade they were 156E, 160C. On average, adjusted scores showed no differences at
kindergarten (ES=+0.07) or first grade (ES=-0.01).
Ross, Smith, & Casey (1997) evaluated Success for All over a 2-year period in
Clarke County, Georgia. Two SFA schools were matched with one control school based
on student demographics and achievement levels. The schools were lower to lower-
middle class, with 27% to 45% African Americans and 12% Hispanics. Students were
pretested on PPVT then posttested on three Woodcock scales and Durrell Oral Reading.
Two cohorts had been in SFA in K-1 (94E, 41C) or 1-2 (106E, 40C). Adjusted effects on
the four individually administered measures were +0.27 for the K-1 cohort but only +0.03
for the 1-2 cohort, for a mean of +0.15.
Ross, Smith, & Casey (1995) carried out a 3-year evaluation of Success for All in
two Title I schools in Ft. Wayne, Indiana. Three cohorts of students were followed. One
was pretested on the PPVT in fall of kindergarten and posttested in spring of second
grade (N=59T, 47C), one was pretested in K and posttested in third grade (N=54E, 20C),
and one was pretested in fall of first grade and posttested in fourth grade (N=45E, 32C).
Averaging across the Woodcock Word Identification, Word Attack, and Passage
Comprehension and Durrell Oral Reading, effects were near zero for second grade
(ES=+0.10), third grade (ES=-0.10), and fourth grade (ES=0.00), for a mean ES=0.00.
Casey, Smith, & Ross (1994) evaluated Success for All in three high-poverty
African American schools in Memphis. Individual first graders in each school (total
n=116) were matched with those in a single control school (n=73) based on individually
administered Woodcock Letter Identification scores. At posttest, adjusted for the Letter
ID scores, effect sizes averaged ES=+0.52 for Word Identification, ES=+1.03 for Word
Attack, +0.63 for Passage Comprehension, and ES=+0.42 for Durrell Oral Reading, for a
The Best Evidence Encyclopedia is a free web site created by the Johns Hopkins University School of Education’s Center for Data-Driven Reform in Education (CDDRE) under funding from the Institute of Education Sciences, U.S. Department of Education.
33
mean of +0.65. Analyses for children in the lowest 25% of their grade at pretest showed
similar effect sizes (ES=+0.54).
A Montgomery, Alabama study by Ross, Smith, & Bond (1994) compared two
SFA and two matched control schools. Two cohorts (K-1 and 1-2) were followed over 2
years. On Woodcock and Durrell measures, controlling for PPVT, first graders
(ES=+0.39) scored substantially higher than controls, as did second graders (ES=+1.15),
for a mean effect size of +0.62.
The first school to implement Success for All in Memphis was evaluated by
Smith, Ross, & Casey (1994) over a four-year period. Florida Elementary, a high-poverty
African American school, was compared to a matched control school among first to
fourth graders. Students were pretested on the PPVT and then assessed each spring on
three Woodcock scales. Students in grades 1-3 were also tested on the Durrell Oral
Reading Test, and fourth graders were tested on the Gray. Effects for first graders
(n=27E, 36C) were very positive, averaging across the four individually administered
tests adjusted for pretests (ES=+1.15, p<.01). Second graders had an effect size of +0.08,
third graders an effect size of +0.56, and fourth graders +0.04, for a mean of +0.60.
Wasik & Slavin (1993) evaluated SFA in a three-year study in a school in
Charleston, South Carolina. Forty percent of students qualified for free lunch and 60%
were African American. There were 3 cohorts, K-1, K-2, and K-3. On three Woodcock
measures and the Durrell, controlling for PPVT, effect sizes were +0.20 for first graders,
+0.67 for second graders, and +0.30 for third graders, for a mean of +0.39.
A two-year study by Slavin & Madden (1991) compared one SFA school in a
small rural town in Maryland to a matched control school (n=58E, 50C). In second
grade, there were no differences averaging across Woodcock and Durrell scales,
(ES=+0.02) and no differences on CTBS tests (ES=+0.02). The study focused on
reducing special education placements, and in this regard outcomes appeared positive.
The year before SFA was introduced, 22 students in grades K-3 were referred for possible
learning disabilities, and 12 were assigned to special education. In the first year of SFA
only six children were referred and three assigned.
Wang & Ross (1999a) evaluated Success for All in four schools in Little Rock,
Arkansas. First graders in two SFA schools (N=50) were matched on PPVT scores with
those in two control schools (N=47) in a one-year study. Adjusting for pretests, the mean
effect size on three Woodcock and one Durrell measure was +0.30.
A small evaluation in the Alhambra District near Phoenix, Arizona, compared one
SFA and one control school (Wang & Ross, 1999b). First graders (43E, 39C) were
pretested on PPVT, and were posttested on three Woodcock scales plus the Durrell Oral
Reading Test. The SFA students scored non-significantly higher, with a mean adjusted
effect size of +0.15.
The Best Evidence Encyclopedia is a free web site created by the Johns Hopkins University School of Education’s Center for Data-Driven Reform in Education (CDDRE) under funding from the Institute of Education Sciences, U.S. Department of Education.
34
A three-year experiment by Slavin & Madden (1998) compared Spanish-
dominant LEP students in a Philadelphia SFA school to those in a matched control school
(n=21E, 29C). In the third year, when LEP students had transitioned to English, third
graders were tested on the English Woodcock Word Identification, Word Attack, and
Passage Comprehension scales, controlling for kindergarten Spanish PPVT scores. There
were substantial differences on Word Attack (ES=+0.65, p<.001), but no differences on
Word ID (ES=+0.06) or Passage Comprehension (ES=-0.07), for a mean effect size of
+0.22.
Conclusions: Combined Curriculum and Instructional Process Programs
Across 22 studies involving more than 10,000 children, the weighted mean effect
size for Success for All was +0.28. On decoding measures the overall mean was +0.33,
and the mean was +0.24 for comprehension. The findings of positive effects for Success
for All correspond with the conclusions of several previous reviews of comprehensive
school reform models, such as those by Herman (1999), Borman et al. (2003), CSRQ
(2006), and Social Programs that Work (2008).
Direct Instruction
Dating back to the 1960’s, Direct Instruction (DI) is an approach to beginning
reading instruction that emphasizes a step-by-step approach to phonics, decodable texts
that make use of a unique initial teaching alphabet and structured, scripted manuals for
teachers. The DI reading textbook, Reading Mastery, is published by SRA, but the full
model requires much more training for teachers than the publisher provides. This
training, as much as 32 person-days on site per year, is provided by certified trainers
around the U.S., often under the auspices of the National Institute for Direct Instruction
(NIFDI) at the University of Oregon.
Bowers (1972) carried out a small randomized evaluation of DI with culturally
disadvantaged first graders in four classes in Oklahoma. Children scoring below the 25th
percentile on the Metropolitan Reading Readiness Test (MRRT) were randomly assigned
to use DI (n=60) or traditional basal texts (n=63). All children were White. Adjusting for
pretests, DI students scored higher than controls on the Gates McGinitie Comprehension
scale (ES=+0.17, p<.05) and the Vocabulary scale (ES=+0.35, p<.05), for a mean effect
size of +0.26.
The largest evaluation of DI was a 4-year longitudinal study carried out in the
1970’s by Abt Associates as part of Follow Through Planned Variation, a federal
program that provided funding to implement and evaluate various approaches to
improving the education of children in grades K-3 (Kennedy, 1978; Stebbins, St. Pierre,
Proper, Anderson, & Cerva, 1977). DI was one of nine projects evaluated, but is the only
one still in use today.
The Best Evidence Encyclopedia is a free web site created by the Johns Hopkins University School of Education’s Center for Data-Driven Reform in Education (CDDRE) under funding from the Institute of Education Sciences, U.S. Department of Education.
35
The Follow Through evaluation compared schools that chose to use each of the
models to others in the same district matched on demographic variables and historical
achievement levels. The DI evaluation involved ten high-poverty sites ranging from New
York City and Providence, Rhode Island to East St. Louis, Illinois and Tupelo,
Mississippi. Two cohorts were studied. The total number of children in the analytic
sample was 2,216 (1161E, 1055C). Most children were pretested in fall of kindergarten
on a variety of measures including PPVT and WRAT. They were then posttested in
spring of third grade on the MAT.
Averaging across all sites and cohorts and adjusting for pretest and demographic
variables, Kennedy (1978) reported an effect size on MAT Reading Comprehension of
+0.07. Most other programs had negative effects on this measure. Substantial positive
effects were found on MAT-Language, but that is not relevant to the present review.
A four-year longitudinal evaluation of DI was done in high-poverty Baltimore
schools by MacIver, Kemper, & Stringfield (2003). Six schools using DI were matched
based on percent free lunch and historical achievement levels with six control schools.
Approximately 77% of students overall qualified for free lunch at pretest, and almost all
students were African-American. All children were pretested in kindergarten on the
PPVT. District-administered CTBS scores were then obtained at the end of second and
fourth grades. Control schools used a variety of basal textbook in grades K-1, but due to a
district adoption, they used Open Court in grades 2-3. A total of 171 DI and 104 control
students remained in the schools all four years.
There was a notable difference between the DI and control schools in retention
rates. While only 1% of the DI students were held back over the four years, 16% of
control students were retained. Including the retained children (who were in second rather
than third grade at the end of the study), there were non-significant differences on CTBS
Reading Comprehension (ES=+0.13, n.s.) and CTBS Vocabulary (ES=.00, n.s.), for a
mean ES=+0.07.
Grant (1973) carried out a small matched post-hoc evaluation of DI in two inner-
city, African American schools in Wisconsin. Children who had used DI in grades 1-2 in
one school (n=39) were individually matched with those in another school (n=39) in the
same district based on Metropolitan Reading Readiness scores given at the end of
kindergarten. The control school used a Ginn 360 basal text. The DI students scored
higher than controls on three phonics measures, the Wisconsin Tests of Reading Skill
Development Long Vowels (ES=+0.64, p<.001) and Base Words and Endings
(ES=+1.33, p<.001), and the Dale Johnson Word Recognition Test (ES=+0.54, p<.004).
The mean effect size was +0.84.
Another large study of DI in Houston, by Carlson & Francis (2002), did not
qualify for this review because it did not establish that DI and control groups were
equivalent at pretest.
The Best Evidence Encyclopedia is a free web site created by the Johns Hopkins University School of Education’s Center for Data-Driven Reform in Education (CDDRE) under funding from the Institute of Education Sciences, U.S. Department of Education.
36
Across four evaluations of DI, the weighted mean effect size was +0.10.
However, it is important to note that in other reviews that examined effects of DI in all
elementary grades (not just K-1), this program has been rated as among the strongest in
reading outcomes (e.g., Herman, 1999; Borman et al., 2003; CSRQ, 2006).
Average Effect Size: Combined Curricula and Instructional Approaches
Across all studies of programs that combine curriculum and instructional process
approaches (n=26), the weighted mean effect size was +0.24.
Kindergarten–Only Studies
As noted earlier, studies that take place only during kindergarten can pose serious
methodological challenges. Because the goals of kindergarten instruction vary a great
deal from place to place, and have changed dramatically over the past 30 years, it is
always possible that any experimental-control difference on an end-of-kindergarten
reading measure is simply due to the fact that the control group was not being taught to
read at all. Even when reading is being taught, kindergarten classes can vary greatly in
their emphasis on phonics, so measures of word attack and phonological awareness can
be easily inflated by programs that focus on these skills earlier than the control treatment
does. Not until the end of first grade, when it is certain that control children are being
seriously taught to read, can meaningful impacts of kindergarten programs be
determined. Still, it is useful to know about kindergarten-only studies, as they can provide
initial indications of programs worth following through to first grade and beyond.
Twelve studies met the standards of the review but took place only during the
kindergarten year. These are summarized in Table 5 and described in the following
sections.
=============
TABLE 5 HERE
=============
Voyager Universal Literacy System
The Voyager Universal Literacy System is a K-3 reading program that focuses on
systematic instruction in phonics, phonemic awareness, fluency, and vocabulary
(Frechtling, Zhange, & Silverstein, 2006). It includes a progress monitoring system and
provides additional instruction to struggling students, and it also incorporates some
computer-assisted instruction. Three days of professional development is provided to
teachers, and district coaches provide follow up assistance.
Two third-party matched studies have compared kindergarten students in Voyager
to those using alternative approaches. A year-long evaluation of Voyager was carried out
by Frechtling et al. (2006) in eight schools in urban districts. Four (N=202) used Voyager
and four (N=196) used unspecified methods. The schools mostly served African
American students and were fairly well matched on demographic factors and pretests. A
The Best Evidence Encyclopedia is a free web site created by the Johns Hopkins University School of Education’s Center for Data-Driven Reform in Education (CDDRE) under funding from the Institute of Education Sciences, U.S. Department of Education.
37
key problem in the study, however, is that schools implementing Voyager spent much
more time on reading, averaging 90-120 minutes per day in comparison to 60-90 minutes
in the control schools. On Woodcock Word Identification (ES=+0.21, p< .03) and
Woodcock Word Attack (ES=+1.10, p<.001), Voyager students scored higher than
controls, adjusting for pretests, with a mean effect size of +0.67.
Hecht (2003) compared two high-poverty Orlando schools using Voyager
(N=101) to two matched schools using Houghton Mifflin or Success for All (N=112) in a
5-month experiment. Posttest standard deviations were not presented, but the author
provided raw scores and standard deviations to the What Works Clearinghouse (WWC),
and these are reported here. Effect sizes adjusting for pretests were -0.10 for Woodcock
Word Attack, +0.10 for Woodcock Word Analysis, and -0.07 for DIBELS Nonsense
Word Fluency, for a mean of -0.02.
Instructional Technology
Waterford
Paterson et al. (2003) conducted a year-long matched evaluation of Waterford
with 7 kindergarten and 1 first grade experimental classes and 8 kindergarten classes in a
high poverty community in western New York. Students were pretested on the Brigance
and post-tested on the Clay Word Recognition Test. Posttest differences adjusted for
pretests showed no differences (ES=0.00).
Tracey & Young (2006) evaluated Waterford in a study with 265 kindergarten
children (151 E, 114 C) from a high-minority northeastern community. Students in 8
experimental classrooms used the Waterford program for approximately 15 minutes per
day. Students in 7 matched control classrooms had varying amounts of access to older
hardware and software that was not systematically utilized by their teachers. Results
indicated that students in the experimental classrooms performed significantly better than
non-intervention students on the TERA-2 (ES=+0.47).
The Literacy Center (K)
As noted earlier, The Literacy Center is a LeapFrog technology program that
provides 20-30 minutes daily of supplemental instruction in phonological awareness and
phonics beyond core reading instruction. In a study by RMC Research Corporation
(2004), six schools were randomly assigned to experimental or control groups, making
this a randomized quasi-experiment. In the kindergarten component of the study
(n=126E, 132C), children were pretested on four DIBELS measures and posttested on
these plus DIBELS Oral Fluency and Gates-MacGinitie. Adjusting for pretests, effect
sizes were +0.17 (n.s.) for Gates and +0.12 (n.s.) for DIBELS, for a mean of +0.14.
Destination Reading
The Best Evidence Encyclopedia is a free web site created by the Johns Hopkins University School of Education’s Center for Data-Driven Reform in Education (CDDRE) under funding from the Institute of Education Sciences, U.S. Department of Education.
38
Destination Reading is a supplemental integrated learning system (ILS)
developed by Riverdeep. It includes lessons in phonemic awareness, phonics, vocabulary,
fluency, and comprehension for children in grades K-3. Beyond exercises typical of CAI
reading software, children may have stories read to them by the computer. Children may
highlight individual words to hear them read, or they may read the stories independently.
In a matched study of Destination Reading with kindergartners, Barnett (2006)
evaluated the program in a high-poverty, high-minority Florida community. 8
experimental and 7 control classes were compared on the DIBELS, Clay Word
Recognition, and Dolch Word Recognition test that the district regularly administered.
Controlling for pretests, the effect sizes favored the control group on the DIBELS
(ES = -0.56), the Clay (ES=-0.47), and the Dolch (ES = -0.56), for a mean of -0.53.
Writing to Read
Stevenson, Cathey-Pugh, & Kosmidis (1988) evaluated Writing to Read in the
Washington, DC Public Schools. First grade as well as kindergarten students were
studied, but pretest differences among first graders were more than 50% of a standard
deviation. In kindergarten, children in Writing to Read (n=86) were compared to those in
matched control classes (n=155). Adjusting for pretests, Writing to Read children scored
higher on MAT (ES=+0.35, p<.05).
A Baltimore study (Granick & Reid, 1987) compared one school using Writing to
Read to a matched control school. Both were entirely African American schools with
high free lunch participation. Children were pretested at the beginning of kindergarten on
the Metropolitan Achievement Test and then posttested on the MAT in the spring. There
were no differences in gains (ES= +0.02, n.s.).
Instructional Process Programs
K-PALS
PALS (Peer-Assisted Learning Strategies), described earlier, is a method in which
children take turns helping each other through a structured series of reading activities.
The kindergarten adaptation of PALS, called K-PALS, was evaluated in a large
randomized experiment by Stein, Berends, Fuchs, McMaster, Sáenz, Yen, Fuchs, &
Compton (2008). In three regions, Nasvhille, Minnesota, and South Texas, schools were
recruited over a two-year period to participate. A total of 48 schools were recruited in
Year 1 and 49 in Year 2, some of which were the same schools (71 schools participated
for one or two years). A total of 224 teachers were randomly assigned to a control
treatment or to one of three K-PALS variations: One-day workshop only, workshop plus
two booster sessions, and workshop + booster sessions + weekly visits from a graduate
assistant.
Students were pre- and posttested on a one-minute rapid letter sounds test.
Adjusting for pretests, posttest effect sizes were positive for all three K-PALS variations:
The Best Evidence Encyclopedia is a free web site created by the Johns Hopkins University School of Education’s Center for Data-Driven Reform in Education (CDDRE) under funding from the Institute of Education Sciences, U.S. Department of Education.
39
+0.46 for workshop-only, +0.57 for booster, and +0.50 for helper, for a mean effect size
of +0.51.
Ladders to Literacy
As noted earlier, Ladders to Literacy is a professional development program for
kindergarten teachers. The teachers participate in workshops over the course of a school
year, learning activities to build phonemic awareness and phonics skills, rhyming, onset-
rime blending and segmenting, and letter sound practice. They meet with trainers every
three weeks to discuss their experiences and share implementation logs.
Fuchs, Fuchs, Thompson, Otaiba, Yen, Yang, Braun & O’Connor (2001)
evaluated Ladders to Literacy and a combination of Ladders to Literacy and Peer-
Assisted Learning Strategies (PALS) in a randomized experiment. Students were
randomly assigned within four Title I and four non-Title I schools to Ladders + PALS,
Ladders, or control. A total of 33 kindergarten teachers in 8 Nashville elementary
schools were randomly assigned. Sample sizes were 11 teachers and 133 children for
Ladders + PALS, 11 and 136 for Ladders, and 11 and 135 for control. Approximately
38% of students were White. Twelve to 14 children were chosen for testing within each
class. Experimental teachers received 1 to 1½ days of in-service training and were
visited by project staff at least once a week.
Data were analyzed at the teacher level using analyses of variance. Student-level
effect sizes for Ladders, adjusted for pretests, were +0.17 (n.s.) for Woodcock Word
Attack and -0.25 for Woodcock Word Identification, for a mean of -0.04. On a follow up
test in October of first grade, teacher-level differences were still non-significant, but
effect sizes adjusted for prettests were +0.38 for Word Attack and +0.05 for Word
Identification, for a mean of +0.21. Corresponding effect sizes for Ladders + PALS vs.
Control were +0.36 for Word Attack and +0.25 for Word Identification at the end of
Kindergarten, and +0.41 for Word Attack and +0.43 for Word Identification at first grade
follow up. None of these differences were significant at the teacher level.
O’Connor (1999, Study 2) evaluated Ladders to Literacy in 17 classes with 318
children in a large rural Midwestern district. Nine classes (N =192) in several schools
were compared with eight classes (N =89) in a single kindergarten center. Children were
almost all White. Adjusting for pretests, end of kindergarten effect sizes on Woodcock
Letter-Word were +0.33 (p<.01) for typical children and +0.68 (p<.01) for at-risk
children, for a weighted average of +0.43.
Little Books
Little Books is an approach to early literacy in which specially written minibooks
are read by teachers or parents to kindergarten children to build their language and print
concepts. The books are designed to emphasize familiar themes, high-frequency content
words, a close link between pictures and text, and a story with a culminating idea. A
guided participation strategy is used to discuss books with children.
The Best Evidence Encyclopedia is a free web site created by the Johns Hopkins University School of Education’s Center for Data-Driven Reform in Education (CDDRE) under funding from the Institute of Education Sciences, U.S. Department of Education.
40
Phillips, Norris, Mason, & Kerr (1990) evaluated school and home use of Little
Books among kindergarten children in rural and urban schools in Newfoundland, Canada.
A total of 18 classes in 12 schools, with 309 children, were randomly assigned to four
treatment groups: Little Books at home only, Little Books in school only, Little Books in
home and school, and control. In school, Little Books involved a teacher introducing a
book each week, following a schedule of reading to the class, reading and discussing with
small groups, and then asking each child to “read” the book using the pictures and
memory to reconstruct the story line. The home treatment involved an introduction to
parents, suggestions for creating a positive parent-child experience, and a gradual transfer
from parent reading to child reading. Use of random assignment of schools but analysis at
the student level makes this a randomized quasi-experiment (RQE).
Children were pre- and posttested on the Metropolitan Reading Readiness Test
(MET), which assesses auditory memory, letter recognition, language, and listening
skills. All three treatment groups gained more than controls on the MET. Effect sizes
adjusted for pretests were +0.33 for the home/school version, +0.19 for school only, and
+0.14 for home only. Averaging across the three variations, the mean effect size was
+0.22.
Conclusion: Kindergarten-Only Studies
The kindergarten-only studies generally support the conclusions of the studies that
follow children through first grade and beyond. Programs with positive effects during the
kindergarten year are ones that emphasize cooperative learning, as in K-PALS, and ones
that emphasize phonics and phonological awareness, as in Ladders to Literacy and
Voyager. It is important to note that many of the programs cited in the main review,
which tested children at the end of first grade, also reported very positive outcomes
during kindergarten. These are also programs with a strong emphasis on phonics and/or
cooperative learning, including Success for All (e.g., Jones et al., 1997), the phonological
awareness training programs (e.g., Lundberg et al., 1988), and Sing, Spell, Read, and
Write (Bond et al., 1995).
Overall Patterns of Outcomes
Across all categories, there were 62 qualifying studies of beginning reading
programs that posttested children at the end of first grade or later. Seventeen of the
studies used random assignment (6 were fully randomized and 11 were randomized
quasi-experiments). The sample size-weighted mean effect size was +0.22. These studies,
involving more than 20,000 children, were identified from among more than 700 studies
initially reviewed, and represent those that used rigorous experimental procedures.
Overall effects were somewhat stronger for decoding measures (such as Word
Attack and Letter-Word Identification) than for measures of comprehension and total
reading. Across all studies, the weighted mean effect size was +0.27 for decoding
measures and +0.20 for comprehension/total reading. Comprehension measures were
The Best Evidence Encyclopedia is a free web site created by the Johns Hopkins University School of Education’s Center for Data-Driven Reform in Education (CDDRE) under funding from the Institute of Education Sciences, U.S. Department of Education.
41
more likely to show positive effects in multiyear studies that followed children into
second grade or beyond.
The mean effect sizes reported for programs categorized as having strong or
moderate evidence of effectiveness (see below), in the range of +0.20 to +0.35, are
similar to those found in previous reviews of secondary reading as well as elementary and
secondary mathematics programs. Such effects are modest compared to those often
reported for brief experiments or studies with measures closely aligned with treatments,
but they are important in light of the fact that the means are weighted to emphasize large,
realistic studies mostly using the kinds of standardized tests for which schools are held
accountable. Such tests probably underestimate true impacts of experimental treatments,
as they are unlikely to be sensitive to the specific content being taught. To give a sense of
the importance of effect sizes of this magnitude, an effect size of +0.25 represents about
half of the minority-White achievement gap in reading on the fourth grade National
Assessment of Educational Progress (2007). The large, lengthy studies with standard
measures that form the core of this review illustrate what could be accomplished at the
policy level if schools widely adopted and effectively implemented proven programs, not
what could theoretically be gained under ideal, hothouse conditions.
Summarizing Evidence of Effectiveness for Current Programs
For many audiences, it is useful to have summaries of the strength of the evidence
supporting achievement effects for programs educators might select to improve student
outcomes. Slavin (2008) proposed a rating system intended to balance methodological
quality, weighted mean effect sizes, sample sizes, and other factors, and this system was
applied by Slavin et al. (2008 a, b), Slavin & Lake (2008), and Slavin, Lake, & Groff (in
press). Using the same procedures, beginning reading programs were categorized as
follows:
Strong Evidence of Effectiveness
At least two studies, one of which is a large randomized or randomized quasi-
experimental study, or multiple smaller studies, with a sample size-weighted effect size
of at least +0.20, and a collective sample size across all studies of 500 students or 20
classes.
Moderate Evidence of Effectiveness
At least one randomized or two matched studies of any qualifying design, with a
collective sample size of 250 students or 10 classes, and a weighted mean effect size of at
least +0.20.
Limited Evidence of Effectiveness: Strong Evidence of Modest Effects
The Best Evidence Encyclopedia is a free web site created by the Johns Hopkins University School of Education’s Center for Data-Driven Reform in Education (CDDRE) under funding from the Institute of Education Sciences, U.S. Department of Education.
42
Studies meet the criteria for ‘moderate evidence of effectiveness’ except that the
weighted mean effect size is +0.10 to +0.19.
Limited Evidence of Effectiveness: Weak Evidence with Notable Effects
Studies have a weighted mean effect size of at least +0.20, but do not qualify for
‘moderate evidence of effectiveness’ due to insufficient numbers of studies or small
sample sizes.
Insufficient Evidence of Effectiveness
Qualifying studies do not meet the criteria for ‘limited evidence of effectiveness’.
N No Qualifying Studies
Table 6 summarizes currently available programs falling into each of these
categories.
===============
Table 6 Here
===============
Strong Evidence of Effectiveness
Success for All is by far the most extensively evaluated of all beginning reading
programs; 22 of the 62 qualifying studies were of this program, with a combined sample
size of almost 10,000 children, about equal to the samples across studies of all other
programs combined. The weighted mean effect size for SFA was +0.28. A second
program that met the criteria for “strong evidence” was Reading Reels, an embedded
multimedia approach that supplements Success for All, evaluated in two randomized
experiments with a weighted effect size of +0.20.
Like Success for All, Peer Assisted Learning Strategies (PALS) emphasizes
cooperative learning, phonics, and professional development for teachers. There were six
qualifying studies of PALS with a mean effect size of +0.44.
Five studies in Denmark, Norway, Germany, and the U.S. established that
systematic teaching of phonological awareness to kindergartners has positive effects on
reading lasting at least into second grade, with a weighted mean effect size of +0.22. At
the time these studies took place, however, the control kindergartners were receiving little
if any instruction in phonological awareness, and may not have been taught reading at all.
As teaching of phonological awareness has become common in kindergartens in the U.S.
and other countries, it is an open question whether additional emphasis on phonological
awareness would produce similar experimental-control differences today.
The Best Evidence Encyclopedia is a free web site created by the Johns Hopkins University School of Education’s Center for Data-Driven Reform in Education (CDDRE) under funding from the Institute of Education Sciences, U.S. Department of Education.
43
Moderate Evidence of Effectiveness
Two matched experiments evaluating Sing, Spell, Read, and Write found a
weighted mean effect size of +0.28.
Limited Evidence of Effectiveness: Strong Evidence of Modest Effects
Large randomized quasi-experiments and matched studies evaluating Open Court
Reading, Scholastic Phonics Readers with Literacy Place, and Direct Instruction found
effect sizes in the range of +0.10 to +0.19.
Limited Evidence of Effectiveness: Weak Evidence of Notable Effects
Single matched or small randomized experiments found effect sizes of +0.20 or
more for Lippincott Reading, Open Court Phonics Kits, Waterford, Phonics-Based
Reading, WICAT, Classwide Peer Tutoring, Reading and Integrated Literacy Strategies
(RAILS), and Four Blocks.
Insufficient Evidence of Effectiveness
Studies of Reading Street, The Reading Machine, The Literacy Center, and
Writing to Read reported effect sizes less than +0.10.
N No Evidence of Effectiveness
As is always true in reviews of educational programs, the largest number of
programs by far have never been evaluated in experiments that meet the standards of this
review.
Discussion
As in previous reviews, this synthesis found fewer large, high-quality studies of
beginning reading programs than one would wish for. Although 62 studies (involving
more than 20,000 students) did qualify for inclusion, there were small numbers of studies
on most programs, and only 17 studies involved random assignment to conditions.
Further, causal claims cannot be made with confidence in systematic reviews, which can
only review the studies that exist.
Keeping these limitations in mind, there are several important patterns in the
findings that are worthy of note. First, this article finds that successful programs almost
always provide teachers with extensive professional development and followup focused
on specific teaching methods. In particular, most of the programs with strong evidence of
effectiveness have cooperative learning at their core: Success for All, Peer-Assisted
The Best Evidence Encyclopedia is a free web site created by the Johns Hopkins University School of Education’s Center for Data-Driven Reform in Education (CDDRE) under funding from the Institute of Education Sciences, U.S. Department of Education.
44
Learning Strategies, Reading Reels, and Classwide Peer Tutoring all emphasize children
working with other children on structured activities. These are all forms of cooperative
learning in which students work in small groups to help one another master reading skills,
and in which the success of the team depends on the individual learning of each team
member, the elements that previous reviewers (e.g., Rohrbeck et al., 2003; Slavin, 1995,
2009; Webb & Palincsar, 1996) have identified as essential to the effectiveness of
cooperative learning. The finding of positive effects of cooperative learning programs is
consistent with the findings of reviews of upper-elementary reading programs (Slavin et
al., 2008a), secondary reading programs (Slavin et al., 2008b) and elementary and
secondary math programs (Slavin & Lake, 2008; Slavin et al., in press).
Second, all of the programs found to be effective or promising in qualifying
experiments have a strong focus on teaching phonics and phonemic awareness. This is
particularly true of Success for All, PALS, Reading Reels, phonological awareness
training, Open Court Phonics Kits, Scholastic Phonics Readers with Literacy Place,
Reading and Integrated Literacy Strategies (RAILS), Direct Instruction, Phonics-Based
Reading, and Sing, Spell, Read, and Write. It is important to note that studies of all of
these programs found positive effects on comprehension and/or total reading measures,
not just decoding measures that would appear more slanted toward phonetic approaches.
However, an emphasis on phonics did not guarantee positive effects. Phonetic curricular
approaches and computer-assisted instruction models, in particular, had minimal impacts
on student outcomes. It clearly matters a great deal how reading is taught, and an
emphasis on phonics may be necessary but it is not sufficient to ensure meaningful
reading gains.
One key implication of the Gamse et al. (2008) evaluation of Reading First is that
it is not enough to encourage teachers to emphasize phonics, phonemic awareness, and
other elements. The Moss et al. (2008) report that analyzed differences between Reading
First and similar Title I schools that did not receive Reading First funding found that
Reading First teachers were in fact spending more time teaching reading, and specifically
more time on phonics, phonemic awareness, fluency, vocabulary, and comprehension.
The Reading First teachers were significantly more likely to use basal textbooks that
were revisions of traditional basals designed primarily to increase the focus on phonics
and phonemic awareness. In order of popularity in Reading First schools, these were
Harcourt Trophies (22.5% of RF, 15.0% of non-RF), Open Court Reading (15.4% vs.
9.8%), Scott Foresman Reading (13.0% vs. 12.2%), and Houghton Mifflin’s Nation’s
Choice (10.7% vs 2.5%). Yet none of these had ever been evaluated at the beginning of
Reading First, and only Open Court Reading has been adequately evaluated since then, in
a study that found modest impacts (ES=+0.17; Borman et al., 2008). If adopting books
with more phonics and spending a few more minutes each day on the five elements
recommended by the National Reading Panel (2000) were sufficient to improve
beginning reading performance, the Gamse et al. (2008) national evaluation would have
found significant positive effects.
The research summarized in the present review points in a different direction. It
supports the use of well-developed programs that integrate curriculum, pedagogy, and

The Best Evidence Encyclopedia is a free web site created by the Johns Hopkins University School of Education’s Center for Data-Driven Reform in Education (CDDRE) under funding from the Institute of Education Sciences, U.S. Department of Education.
45
extensive professional development. Reading First began as a worthwhile attempt to use
scientifically-based reading research to improve daily reading instruction on a substantial
scale. Yet Reading First emphasized instruction that was based on scientifically-based
instruction, not instructional programs that had themselves been evaluated and found to
be effective. The present review provides several examples of existing programs that can
reliably improve beginning reading achievement, and many more such programs could be
developed and evaluated. The findings suggest that scaling up programs known to be
effective may be a better strategy than disseminating general principles of good practice.
The findings of this review add to a growing body of evidence to the effect that
what matters for student achievement are approaches that fundamentally change what
teachers and students do every day. As in earlier reviews, these strategies had outcomes
that were clearly and consistently more positive than those found for textbooks, curricula,
or technology alone. More research and development of beginning reading programs is
clearly needed, but this review identifies several promising approaches that could be used
today to help students succeed from the beginning in this essential skill.
The Best Evidence Encyclopedia is a free web site created by the Johns Hopkins University School of Education’s Center for Data-Driven Reform in Education (CDDRE) under funding from the Institute of Education Sciences, U.S. Department of Education.
46
References
Abram, S.L. (1984). The effect of computer assisted instruction on first grade phonics
and mathematics achievement computation. Unpublished doctoral dissertation,
Northern Arizona University.
Adams, M.J. (1990). Beginning to read: Thinking and learning about print. Cambridge,
MA: MIT Press.
Apthorp, H. (2005). Elements of Reading: Phonics and Phonemic Awareness. Orlando:
Harcourt.
August, D., & Shanahan, T. (2006). Synthesis: Instruction and professional development.
In D. August & T. Shanahan (Eds.), Developing literacy in second-language
learners (pp. 351-364). Mahwah, NJ: Erlbaum.
Barnett, L. B. (2006). The effect of computer-assisted instruction on the reading skills of
emergent readers. Unpublished doctoral dissertation, Florida Atlantic University.
Barrett, T.J. (1995). A comparison of two approaches to first grade phonics instruction in
the Riverside Unified School District. Paper presented at the annual meeting of
the California Educational Research Association, Lake Tahoe.
Blachman, B.A., Tangel, D., Ball, E., Black, R., & McGraw, C. (1999). Developing
phonological awareness and word recognition skills: A two-year intervention with
low-income, inner-city children. Reading and Writing: An Interdisciplinary
Journal, 11, 239-273.
Bond, C., Ross, S.M., Smith, L.J., & Nunnery, J.A. (1995). The effects of the Sing, Spell,
Read, and Write program on reading achievement of beginning readers. Reading
Research and Instruction, 35, 122-141.
Borman, G., & Hewes, G. (2003). Long-term effects and cost effectiveness of Success
for All. Educational Evaluation and Policy Analysis, 24 (2), 243-266.
Borman, G.D., Hewes, G.M., Overman, L.T., & Brown, S. (2003) Comprehensive
school reform and achievement: A meta-analysis. Review of Educational
Research, 73 (2), 125-230.
Borman, G.D., Slavin, R.E., Cheung, A., Chamberlain, A., Madden, N.A., & Chambers,
B. (2007). Final reading outcomes of the national randomized field trial of
Success for All. American Educational Research Journal, 44 (3), 701-731.
Brown, I.S., & Felton, R.H. (1990). Effects of instruction on beginning reading skills in
children at risk for reading disability. Reading and Writing. An Interdisciplinary
Journal, 2, 223-241.
The Best Evidence Encyclopedia is a free web site created by the Johns Hopkins University School of Education’s Center for Data-Driven Reform in Education (CDDRE) under funding from the Institute of Education Sciences, U.S. Department of Education.
47
Calhoon, M., Al Otaiba, S., Cihak, D., King, A., & Avalos, A. (2007). The effects of a
peer-mediated program on reading skill acquisition for two-way bilingual first-
grade classrooms. Learning Disability Quarterly, 30(3), 169-184.
Calhoon, M., Otaiba, S., Greenberg, D., King, A., & Avalos, A (2006). Improving
reading skills in predominately Hispanic Title I first grade classrooms: The
promise of Peer-Assisted Learning Strategies. Learning Disabilities Research and
Practice, 21 (4), 261-272.
Carlson, C.D., & Francis, D.J. (2002). Increasing the reading achievement of at-risk
children through Direct Instruction: Evaluation of the Rodeo Institute for Teacher
Excellence (RITE). Journal of Education for Students Placed at Risk, 7 (2), 141-
166.
Casey, J., Smith., L., & Ross, S. (1994). Final report: 1993-94 Success for All program
in Memphis, Tennessee: Formative evaluation of new SFA schools. Memphis,
TN: University of Memphis, Center for Research in Educational Policy.
Cassady, J., & Smith, L. (2005). The impact of a structured integrated learning system on
first grade students' reading gains. Reading and Writing Quarterly, 21(4), 361-
376.
Chambers, B., Cheung, A., Madden, N., Slavin, R. E., & Gifford, R., (2006).
Achievement effects of embedded multimedia in a Success for All reading
program. Journal of Educational Psychology, 98 (1), 232-237.
Chambers, B., Slavin, R. E., Madden, N. A., Cheung, A., & Gifford, R. (2005). Effects of
Success for All with embedded video on the beginning reading achievement of
Hispanic children. Technical Report. Center for Research and Reform in
Education, Johns Hopkins University.
Chambers, B., Slavin, R. E., Madden, N. A., Abrami, P.C., Tucker, B. J. Cheung, A., &
Gifford, R. (2008). Technology infusion in success for All: Reading outcomes for
first graders. Elementary School Journal, 109, (1), 1-15.
Chambers, B., Slavin, R.E., Madden, N.A., Cheung, A., & Gifford, R., (2004).
Enhancing Success for All for Hispanic students: Effects on beginning reading
achievement. (Tech.Rep.). Baltimore: Johns Hopkins University, Center for Date-
Driven Reform in Education.
Chambers, E. A. (2003). Efficacy of educational technology in elementary and secondary
classrooms: A meta-analysis of the research literature from 1992-2002.
Unpublished doctoral dissertation, Southern Illinois University at Carbondale.

The Best Evidence Encyclopedia is a free web site created by the Johns Hopkins University School of Education’s Center for Data-Driven Reform in Education (CDDRE) under funding from the Institute of Education Sciences, U.S. Department of Education.
48
Cheung, A., & Slavin, R.E. (2005). Effective reading programs for English language
learners and other language minority students. Bilingual Research Journal, 29 (2),
241-267.
Comprehensive School Reform Quality Center (2006). CSRQ center report on
elementary comprehensive school reform models. Washington, DC: American
Institutes for Research.
Cooper, H. (1998). Synthesizing research (3rd ed.). Thousand Oaks, CA: Sage.
Dianda, M., & Flaherty, J. (1995, April). Effects of Success for All on the reading
achievement of first graders in California bilingual programs. Paper presented at
the annual meeting of the American Educational Research Association, San
Francisco.
Dynarski, M., Agodini, R., Heaviside, S., Novak, T., Carey, N., Campuzano, L., Means,
B., Murphy, R., Penuel, W., Javitz, H., Emery, D., & Sussex, W. (2007).
Effectiveness of reading and mathematics software products: Findings from the
first student cohort. Washington, DC: Institute of Education Sciences.
Erdner, R., Guy, R., & Bush, A. (1997). The impact of a year of computer assisted
instruction on the development of first grade reading skills. Journal of
Educational Computing Research, 18 (4), 369-388.
Foorman, B. R., Francis, D. J., Fletcher, J. M., Schatschneider, C., & Mehta, P. (1998).
The role of instruction in learning to read: Preventing reading failure in at-risk
children. Journal of Educational Psychology, 90, 37-55.
Frechtling, J., Zhang, X., & Silverstein, G. (2006). The Voyager Universal Literacy
System: Results from a study of kindergarten students in inner-city schools.
Journal of Education for Students Placed at Risk, 11(1), 75-95.
Fuchs, D., Fuchs, S., Thompson, A., Al-Otaiba, S., Yen, L., Yang, N., Braun, M., &
O’Connor, R.. (2001). Is reading important in reading-readiness programs? A
randomized field trial with teachers as program implementers. Journal of
Educational Psychology, 93 (2), 251.
Gamse, B.C., Tepper-Jacob, R., Horst, M., Boulay, B., & Unlu, F. (2008). Reading First
impact study: Final report. Washington, DC: Institute for Education Sciences,
U.S. Department of Education.
Garet, M.S. et al. (2008). The impact of two professional development interventions on
early reading instruction and achievement. New York: MDRC.
Granick, L., & Reid, E. (1987). Writing to Read program, FY 87. Baltimore: Baltimore
City Public Schools.
The Best Evidence Encyclopedia is a free web site created by the Johns Hopkins University School of Education’s Center for Data-Driven Reform in Education (CDDRE) under funding from the Institute of Education Sciences, U.S. Department of Education.
49
Grant, E.M. (1973). A study of comparison of two reading programs (Ginn 360 and
DISTAR) upon primary inner city students. Unpublished doctoral dissertation,
University of Washington.
Greenwood, C. R., Terry, B., Utley, C. A., Montagna, D., & Walker, D. (1993).
Achievement, placement, and services: Middle school benefits of Classwide Peer
Tutoring used at the elementary level. School Psychology Review, 22(3), 497–
516.
Greenwood, C.R., Delquadri, J.C., & Hall, R.V. (1989). Longitudinal effects of
Classwide Peer Tutoring. Journal of Educational Psychology, 81 (3), 371-383.
Hecht, S. & Close, L. (2002). Emergent literacy skills and training time uniquely predict
variability in responses to phonemic awareness training in disadvantaged
kindergartners. Journal of Experimental Child Psychology, 82, 93-115.
Hecht, S. (2003). A study between Voyager and control schools in Orange County,
Florida 2002-2003. Davie, FL: Florida Atlantic University.
Herman, R. (1999). An educator’s guide to schoolwide reform. Arlington, VA:
Educational Research Service.
Jones, E.M., Gottfredson, G.D., & Gottfredson, D.C. (1997). Success for some: An
evaluation of the Success for All program. Evaluation Review, 21 (6), 643-670.
Jones, L.R.G. (1995). The effects of an eclectic approach versus a modified whole
language approach on the reading and writing skills of first-grade students.
Unpublished doctoral dissertation, The University of Mississippi.
Joshi, R.M,, Dahlgren, M., & Boulware-Gooden, R. (2002). Teaching reading in an inner
city school through a multisensory teaching approach. Annals of Dyslexia 52 (1),
229
Juel, C. (1988). Learning to read and write: A longitudinal study of 54 children from first
through fourth grades. Journal of Educational Psychology, 80 (4), 437-447.
Kennedy, M. M. (1978). Findings from the Follow Through Planned Variation study.
Educational Researcher, 7(6), 3-11.
Kulik, J. A. (2003). Effects of using instructional technology in elementary and
secondary schools: What controlled evaluation studies say. SRI Project Number
P10446.001. Arlington, VA: SRI International.
Lipsey, M. W., & Wilson, D. B. (2001). Practical meta-analysis. Thousand Oaks, CA:
Sage.
The Best Evidence Encyclopedia is a free web site created by the Johns Hopkins University School of Education’s Center for Data-Driven Reform in Education (CDDRE) under funding from the Institute of Education Sciences, U.S. Department of Education.
50
Livingston, M. & Flaherty, J. (1997). Effects of Success for All on reading achievement
in California schools. Los Alamitos, CA: WestEd.
Mac Iver, M., Kemper, E., & Stringfield, S. (2003). The Baltimore Curriculum Project:
Final report of the four-year evaluation study. Baltimore, MD: Johns Hopkins
University, Center for Social Organization of Schools.
Macaruso, P., Hook, P.E., & McCabe, R. (2006). The efficacy of computer-based
supplementary phonics programs for advancing reading skills in at-risk
elementary students. Journal of Research in Reading, 29, 162-172.
Madden, N.A., Slavin, R.E., Karweit, N.L., Dolan, L.J., & Wasik, B.A. (1993). Success
for All: Longitudinal effects of a restructuring program for inner-city elementary
schools. American Educational Research Journal, 30, 123-148.
Mathes, P., & Babyak, A. (2001). The effects of Peer-Assisted Literacy Strategies for
first-grade readers with and without additional mini-skills lessons. Learning
Disabilities Research & Practice, 16 (1), 28-44.
Mathes, P.G., Howard, J.K., Allen, S.H., & Fuchs, D. (l998). Peer-assisted Learning
Strategies for First-grade Readers: Responding to the Needs of Diverse Learners.
Reading Research Quarterly, 33, 62-94.
Mathes, P. G., Torgesen, J. K., Clancy-Menchetti, J, Santi, K., Nicholas, K, & Robinson,
C., et al. (2003). A comparison of teacher-directed versus peer-assisted instruction
to struggling first-grade readers. The Elementary School Journal, 103(5), 461-
479.
Moss, M., Fountain, A.R., Boulay, B., Horst, M., Rodger, C., & Brown-Lyons, M.
(2008). Reading First implementation evaluation: Final report. Cambridge, MA:
Abt Associates.
Muñoz, M.A. & Dossett, D. (2004). Educating students placed at risk: Evaluating the
impact of Success for All in urban settings. Journal of Education for Students
Placed at Risk, 9(3), 261-277.
Murphy, R., Penuel, W., Means, B., Korbak, C., Whaley, A., & Allen, J. (2002). E-
DESK: A review of recent evidence on discrete educational software. Menlo Park,
CA: SRI International.
National Assessment of Educational Progress (2007). The nation’s report card.
Washington, DC: National Center for Education Statistics.
National Reading Panel (2000). Teaching children to read: An evidence-based
assessment of the scientific research literature on reading and its implications for
The Best Evidence Encyclopedia is a free web site created by the Johns Hopkins University School of Education’s Center for Data-Driven Reform in Education (CDDRE) under funding from the Institute of Education Sciences, U.S. Department of Education.
51
reading instruction. Rockville, MD: National Institute of Child Health and
Human Development.
Nunnery, J., Slavin, R.E., Ross, S.M., Smith, L.J., Hunter, P., & Stubbs, J. (1996, April).
An assessment of Success for All program component configuration effects on the
reading achievement of at-risk first grade students. Paper presented at the annual
meeting of the American Educational Research Association, New York, NY.
O’Connor, R., Notari-Syverson, A., & Vadasy, P. (1996, March). The effect of
kindergarten phonological intervention on the first grade reading and writing of
children with mild disabilities. Paper presented at the annual meeting of the
American Educational Research Association, New York.
O'Connor, R. (1999). Teachers learning Ladders to Literacy. Learning Disabilities
Research & Practice, 14(4), 203-214.
Paterson, W., Henry, J., O'Quin, K., Ceprano, M., & Blue, E. (2003). Investigating the
effectiveness of an integrated learning system on early emergent readers. Reading
Research Quarterly, 38(2), 172-206.
Phillips, L., Norris, S., Mason, J. & Kerr, B. (1990). Effect of early literacy intervention
on kindergarten achievement (Tech. Rep. No. 520). Champaign: University of
Illinois at Urbana-Champaign, Center for the Study of Reading.
Rohrbeck, C.A., Ginsburg-Block, M.D., Fantuzzo, J.W., & Miller, T.R. (2003). Peer-
assisted learning interventions wih elementary school students: A meta-analytic
review. Journal of Educational Psychology, 94 (20), 240-257.
Rose, J. (2006). Independent review of the teaching of early reading. London:
Department for Education and Skills.
Ross, S.M., Smith, L.J., & Casey, J. (1992). Final report: 1991-92 Success for All
program in Caldwell, Idaho. Memphis, TN: Memphis State University.
Ross, S.M., & Casey, J. (1998a). Longitudinal study of student literacy achievement in
different Title I school-wide programs in Ft. Wayne community schools, year 2:
First grade results. Memphis: University of Memphis, Center for Research in
Educational Policy.
Ross, S.M., & Casey, J. (1998b). Success for All evaluation, 1997-98 Tigard-Tualatin
School District. Memphis: University of Memphis, Center for Research on
Educational Policy.
Ross, S.M., Nunnery, J.A., & Smith, L.J. (1996). Evaluation of Title I reading programs:
Amphitheater Public Schools Year 1: 1995-1996. Memphis, TN: University of
Memphis, Center for Research in Educational Policy.
The Best Evidence Encyclopedia is a free web site created by the Johns Hopkins University School of Education’s Center for Data-Driven Reform in Education (CDDRE) under funding from the Institute of Education Sciences, U.S. Department of Education.
52
Ross, S.M., Smith, L., & Casey, J. (1997). Final report: 1996-97 Success for All program
in Clarke County, Georgia. Memphis, TN: University of Memphis, Center for
Research on Educational Policy.
Ross, S.M., Smith, L., & Casey, J. (1997b). Preventing early school failure: Impacts of
Success for all nonstandardized test outcomes, minority group performance, and
school effectiveness. Journal of Education for Students Placed at Risk, 2 (1), 29-
53.
Ross, S.M., Smith, L.J., & Casey, J. (1995). Final Report: 1994-95 Success for All
program in Fort Wayne, Indiana. Memphis: University of Memphis, Center for
Research in Educational Policy.
Rothstein, H.R., Sutton, A.J., & Borenstein, M. (Eds.) (2005). Publication bias in meta-
analysis: Prevention assessment, and adjustments. Chichester, UK: John Wiley.
Rouse, C.E., & Krueger, A.B. (2004). Putting computerized instruction to the test: A
randomized evaluation of a “scientifically-based” reading program. Economics of
Education Review, 23 (4), 323-338.
Scarcelli, S., & Morgan, R. (1999). The efficacy of using a direct reading instruction
approach in literature based classrooms. Reading Improvement, 36 (4), 172-179.
Schultz, L. (1996).Effectiveness study of Scholastic Phonics Readers and a
comprehensive reading program. New York: Scholastic.
Sedlmeier, P., & Gigerenzer, G. (1989). Do studies of statistical power have an effect on
the power of studies? Psychological Bulletin, 105, 309-316.
Shadish, W.R., Cook, T.D., & Campbell, D.T. (2002). Experimental and quasi-
experimental designs for generalized causal inference. Boston: Houghton-Mifflin.
Skindrud, K., & Gersten, R. (2006). An evaluation of two contrasting approaches for
improving reading achievement in a large urban district. The Elementary School
Journal, 106, 389–408.
Slavin, R.E. (1986). Best-evidence synthesis: An alternative to meta-analytic and
traditional reviews. Educational Researcher, 15 (9), 5-11.
Slavin, R.E. (1995). Cooperative learning: Theory, research, and practice (2nd Ed.).
Boston: Allyn & Bacon.
Slavin, R.E. (in press). Cooperative learning. In G. McCulloch & D. Crook (Eds.)
International Encyclopedia of Education. Abington, UK: Routledge.
The Best Evidence Encyclopedia is a free web site created by the Johns Hopkins University School of Education’s Center for Data-Driven Reform in Education (CDDRE) under funding from the Institute of Education Sciences, U.S. Department of Education.
53
Slavin, R. (2008). What works? Issues in synthesizing education program evaluations.
Educational Researcher, 37 (1), 5-14.
Slavin, R.E., Cheung, A., Groff, C., & Lake, C. (2008a). Effective reading programs for
middle and high schools: A best evidence synthesis. Reading Research Quarterly,
43 (3), 290-322.
Slavin, R., & Lake, C. (2008). Effective programs in elementary mathematics; A best-
evidence synthesis. Review of Educational Research, 78 (3), 427-515.
Slavin, R.E., Lake, C., Cheung, A., & Davis, S. (2008b). Beyond the basics: Effective
reading programs for the upper elementary grades. Baltimore, MD: Center for
Research and Reform in Education, Johns Hopkins University.
Slavin, R.E., Lake, C., & Groff, C. (in press). Effective programs in middle and high
school mathematics. Review of Educational Research.
Slavin, R.E., & Madden, N. (1998). Success for All/Exito Para Todos: Effects on the
reading achievement of students acquiring English. Report No. 19. Baltimore,
MD: Center for Research on the Education of Students Placed at Risk.
Slavin, R.E., & Madden, N. A. (2008, March). Understanding bias due to measures
inherent to treatments in systematic reviews in education. Paper presented at the
annual meetings of the Society for Research on Educational Effectiveness, Crystal
City, Virginia.
Slavin, R.E., & Madden, N.A. (1991). Success for All at Buckingham Elementary:
Second year evaluation. Baltimore, MD: Johns Hopkins University, Center for
Research on Effective Schooling for Disadvantaged Students.
Slavin, R.E., & Madden, N.A. (Eds.) (2001). One million children: Success for All.
Thousand Oaks, CA: Corwin.
Slavin, R.E., Madden, N.A., Dolan, L.J., & Wasik, B.A. (1993). Success for All in the
Baltimore City Public Schools: Year 6 report. Baltimore, MD: Johns Hopkins
University, Center for Research on Effective Schooling for Disadvantaged
Students.
Slavin, R.E., & Smith, D. (2008, March). Effects of sample size on effect size in
systematic reviews in education. Paper presented at the annual meetings of the
Society for Research on Educational Effectiveness, Crystal City, Virginia.
Smith, L., & Ross, S. (1992). 1991-1992 Ft Wayne, IN SFA results. Memphis, TN:
Memphis State University, Center for Research in Educational Policy.
The Best Evidence Encyclopedia is a free web site created by the Johns Hopkins University School of Education’s Center for Data-Driven Reform in Education (CDDRE) under funding from the Institute of Education Sciences, U.S. Department of Education.
54
Smith, L.J., Ross, S.M., & Casey, J.P. (1994). Special education analyses for Success
for All in four cities. Memphis: University of Memphis, Center for Research in
Educational Policy
Snow, C.E., Burns, S.M., & Griffin, P. (Eds.) (1998). Preventing reading difficulties in
young children. Washington, DC: National Academy Press.
Social Programs that Work (2008). Success for All. Retrieved 12/12/08 from
www.evidencebasedprograms.org.
Snow, M.F. (1993) The effects of computer-assisted instruction and focused tutorial
services on the achievement of marginal learners. Ed.D. dissertation, University
of Miami. Retrieved September 5, 2007, from ProQuest Digital Dissertations
database. (Publication No. AAT 9401831).
Stebbins, L.B., St. Pierre, R.G., Proper, E.C., Anderson, R.B., & Cerva, T.R. (1976).
Education as experimentation: A planned variation model, Volumes IIIA and IIIB.
Cambridge, MA: Abt Associates. (ERIC No. ED 148489).
Stevens, R., Van Meter, P., Garner, J., Warcholak, N., Bochna, C., & Hall, T. (2008). The
Reading and Integrated Literacy Strategies (RAILS): An integrated approach to
early reading. Journal of Education for Students Placed at Risk, 13 (4), 357-380.
Stein, M., Berends, M. Fuchs, D., McMaster, K., Saenz, L., Yen, L., Fuchs, L., &
Comption, D. (2008). Scaling up an early reading program: Relationships among
teacher support, fidelity of implementation, and student performance across
different sites and years. Educational Evaluation and Policy Analysis, 30 (4), 368-
388.
Torgerson, C. J., Brooks, G., & Hall, J. (2006). A systematic review of the research
literature on the use of phonics in the teaching of reading and spelling. London:
DfES Research Report 711.
Tracey, D. & Young, J. (2006). Technology and early literacy: The impact of an
integrated learning system on high-risk kindergartners' achievement. Pearson
Digital Learning, Inc.
Wang, L.W. & Ross, S.M. (1999a). Evaluation of Success for All program. Little Rock
School District, year 2: 1998-99. Memphis: University of Memphis, Center for
Research in Educational Policy.
Wang, L.W. & Ross, S.M. (1999b). Results for Success for All Program, Alhambra (AZ)
School District. Memphis: University of Memphis, Center for Research in
Educational Policy.
The Best Evidence Encyclopedia is a free web site created by the Johns Hopkins University School of Education’s Center for Data-Driven Reform in Education (CDDRE) under funding from the Institute of Education Sciences, U.S. Department of Education.
55
Wasik, B. A., & Slavin, R. E. (1993). Preventing early reading failure with one-to-one
tutoring: A review of five programs. Reading Research Quarterly, 28(2), 178–
200.
Webb, N.M., & Palincsar, A.S. (1996). Group processes in the classroom. In D.C.
Berliner & R.C. Calfee (Eds.), Handbook of Educational Psychology. New York:
Simon & Schuster Macmillan.
What Works Clearinghouse (2008). Beginning reading. What Works Clearinghouse
Topic Report. Retreived August 10, 2008, from http://ies.ed.gov/NCEE.wwc/.
Wilkerson, S.B., Shannon, L.C., & Herman, T.L. (2006). An efficacy study on Scott
Foresman's Reading Street Program: Year one report. Magnolia Consulting.
Wilkerson, S.B., Shannon, L.C., & Herman, T.L. (2007). An efficacy study on Scott
Foresman's Reading Street Program: Year two report. Magnolia Consulting.
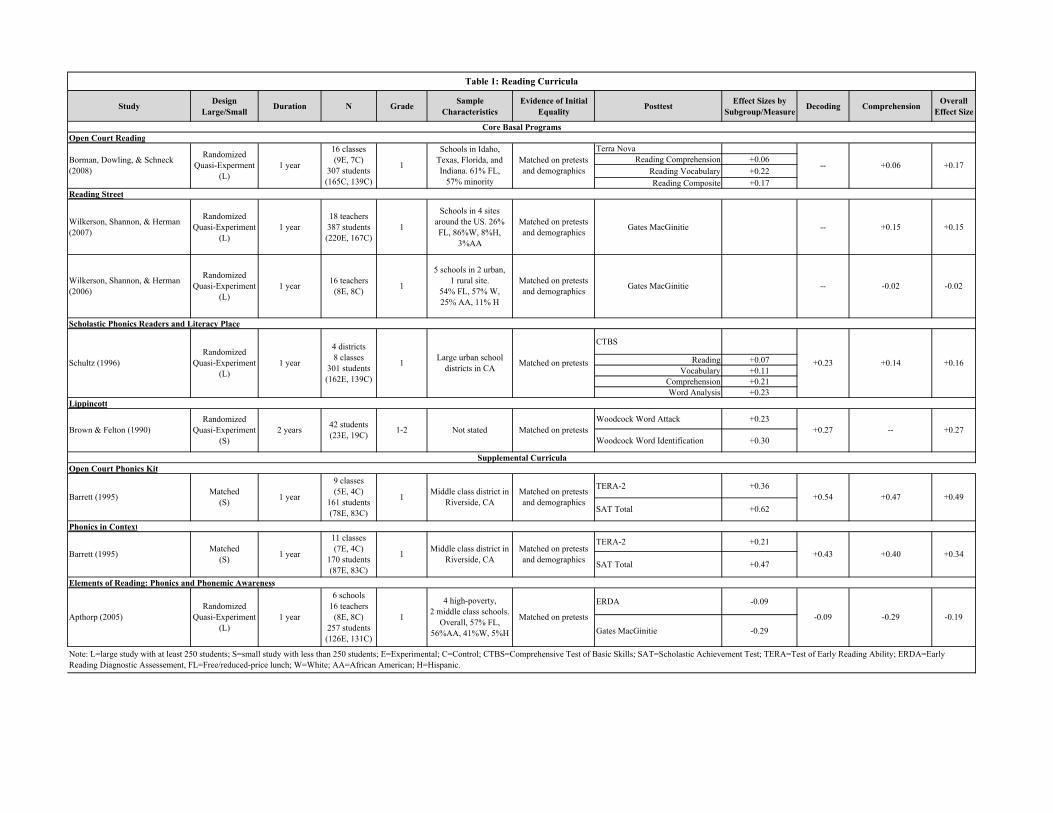
StudyDesign
Large/SmallDuration N Grade
Sample
Characteristics
Evidence of Initial
EqualityPosttest
Effect Sizes by
Subgroup/MeasureDecoding Comprehension
Overall
Effect Size
Open Court Reading
Terra Nova
Reading Comprehension +0.06
Reading Vocabulary +0.22
Reading Composite +0.17
Reading Street
Wilkerson, Shannon, & Herman
(2007)
Randomized
Quasi-Experiment
(L)
1 year
18 teachers
387 students
(220E, 167C)
1
Schools in 4 sites
around the US. 26%
FL, 86%W, 8%H,
3%AA
Matched on pretests
and demographicsGates MacGinitie -- +0.15 +0.15
CTBS
Reading +0.07
Vocabulary +0.11
Comprehension +0.21
Word Analysis +0.23
Lippincott
Woodcock Word Attack +0.23
Woodcock Word Identification +0.30
TERA-2 +0.36
Phonics in Context
TERA-2 +0.21
SAT Total +0.47
ERDA -0.09
Gates MacGinitie -0.29
Table 1: Reading Curricula
-0.19
Core Basal Programs
Supplemental Curricula
Note: L=large study with at least 250 students; S=small study with less than 250 students; E=Experimental; C=Control; CTBS=Comprehensive Test of Basic Skills; SAT=Scholastic Achievement Test; TERA=Test of Early Reading Ability; ERDA=Early
Reading Diagnostic Assessement, FL=Free/reduced-price lunch; W=White; AA=African American; H=Hispanic.
Elements of Reading: Phonics and Phonemic Awareness
Scholastic Phonics Readers and Literacy Place
+0.34+0.43 +0.40
-0.09 -0.29
+0.16
+0.27
+0.49
+0.27 --
+0.47
-- +0.06
Open Court Phonics Kit
+0.23
1
5 schools in 2 urban,
1 rural site.
54% FL, 57% W,
25% AA, 11% H
1 +0.54
9 classes
(5E, 4C)
161 students
(78E, 83C)
1 yearMatched
(S)SAT Total
Matched on pretests
and demographics
Randomized
Quasi-Experiment
(L)
Matched on pretests
and demographics
42 students
(23E, 19C)
4 districts
8 classes
301 students
(162E, 139C)
Randomized
Quasi-Experiment
(S)
Schultz (1996)
Not stated Matched on pretests
Matched on pretestsLarge urban school
districts in CA1
1-2
1 year
Brown & Felton (1990) 2 years
Borman, Dowling, & Schneck
(2008)
Wilkerson, Shannon, & Herman
(2006)
Randomized
Quasi-Experiment
(L)
+0.14
Randomized
Quasi-Experment
(L)
--Gates MacGinitie1 year
Matched on pretests
and demographics
Schools in Idaho,
Texas, Florida, and
Indiana. 61% FL,
57% minority
1
16 classes
(9E, 7C)
307 students
(165C, 139C)
1 year
-0.0216 teachers
(8E, 8C)
+0.17
-0.02
Matched
(S)Barrett (1995)
+0.62
Matched on pretests
and demographics
Middle class district in
Riverside, CA1
11 classes
(7E, 4C)
170 students
(87E, 83C)
1 year
Barrett (1995)Middle class district in
Riverside, CA
Apthorp (2005) Matched on pretests
4 high-poverty,
2 middle class schools.
Overall, 57% FL,
56%AA, 41%W, 5%H
1
6 schools
16 teachers
(8E, 8C)
257 students
(126E, 131C)
1 year
Randomized
Quasi-Experiment
(L)
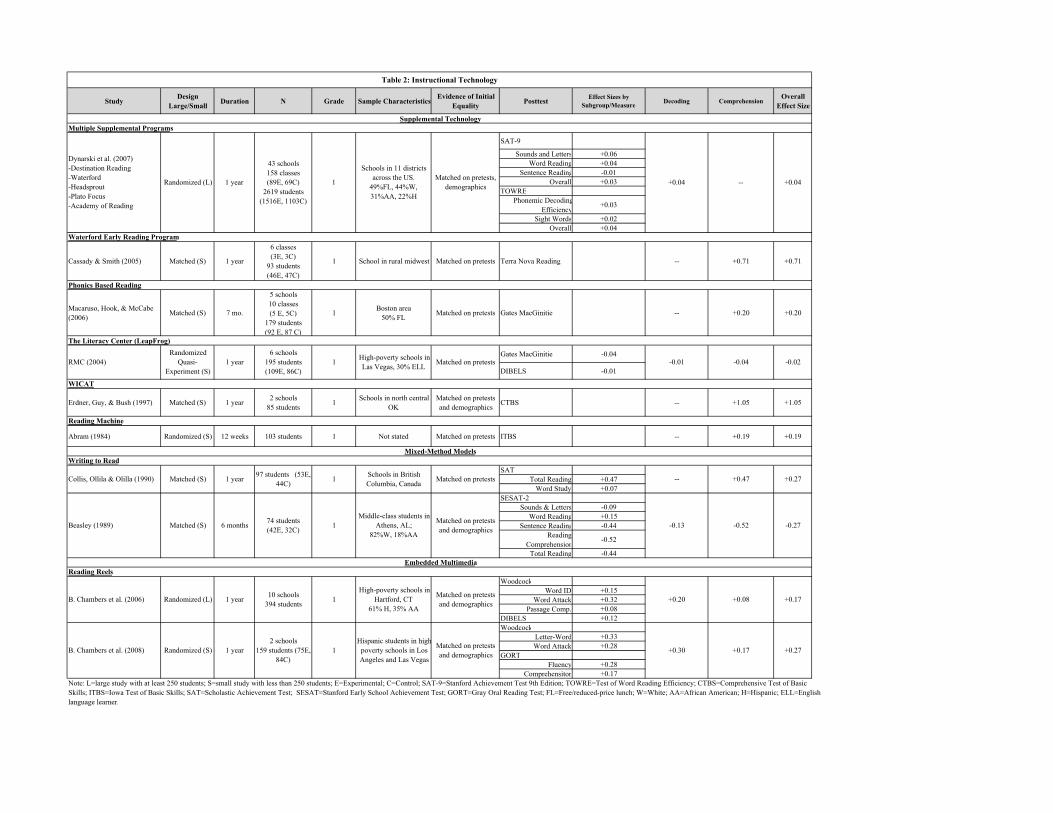
StudyDesign
Large/SmallDuration N Grade Sample Characteristics
Evidence of Initial
EqualityPosttest
Effect Sizes by
Subgroup/MeasureDecoding Comprehension
Overall
Effect Size
SAT-9
Sounds and Letters +0.06
Word Reading +0.04
Sentence Reading -0.01
Overall +0.03
TOWRE
Phonemic Decoding
Efficiency+0.03
Sight Words +0.02
Overall +0.04
Cassady & Smith (2005) Matched (S) 1 year
6 classes
(3E, 3C)
93 students
(46E, 47C)
1 School in rural midwest Matched on pretests Terra Nova Reading -- +0.71 +0.71
Phonics Based Reading
Macaruso, Hook, & McCabe
(2006)Matched (S) 7 mo.
5 schools
10 classes
(5 E, 5C)
179 students
(92 E, 87 C)
1Boston area
50% FLMatched on pretests Gates MacGinitie -- +0.20 +0.20
Gates MacGinitie -0.04
DIBELS -0.01
Erdner, Guy, & Bush (1997) Matched (S) 1 year2 schools
85 students1
Schools in north central
OK
Matched on pretests
and demographicsCTBS -- +1.05 +1.05
Abram (1984) Randomized (S) 12 weeks 103 students 1 Not stated Matched on pretests ITBS -- +0.19 +0.19
SAT
Total Reading +0.47
Word Study +0.07
SESAT-2
Sounds & Letters -0.09
Word Reading +0.15
Sentence Reading -0.44
Reading
Comprehension-0.52
Total Reading -0.44
Woodcock
Word ID +0.15
Word Attack +0.32
Passage Comp. +0.08
DIBELS +0.12
Woodcock
Letter-Word +0.33
Word Attack +0.28
GORT
Fluency +0.28
Comprehensiton +0.17
+0.04Matched on pretests,
demographics
Schools in 11 districts
across the US.
49%FL, 44%W,
31%AA, 22%H
+0.08
-- +0.47
-0.52-0.13
--
-0.01 -0.04
+0.20
Supplemental Technology
Mixed-Method Models
Randomized
Quasi-
Experiment (S)
High-poverty schools in
Las Vegas, 30% ELL1
1 +0.27Matched on pretests
6 schools
195 students
(109E, 86C)
Multiple Supplemental Programs
1
+0.30 +0.17
Matched on pretests
and demographics
Embedded Multimedia
6 months
1 year
1
Middle-class students in
Athens, AL;
82%W, 18%AA
74 students
(42E, 32C)
Table 2: Instructional Technology
Waterford Early Reading Program
WICAT
97 students (53E,
44C) 1 year
High-poverty schools in
Hartford, CT
61% H, 35% AA
Matched (S)
1Randomized (L)
Schools in British
Columbia, Canada
Matched on pretests
and demographics
Hispanic students in high-
poverty schools in Los
Angeles and Las Vegas
Randomized (S)B. Chambers et al. (2008) +0.27
Reading Reels
+0.17
2 schools
159 students (75E,
84C)
Matched on pretests
and demographics
1 year
1
43 schools
158 classes
(89E, 69C)
2619 students
(1516E, 1103C)
Dynarski et al. (2007)
-Destination Reading
-Waterford
-Headsprout
-Plato Focus
-Academy of Reading
1 yearRandomized (L)
1 year
The Literacy Center (LeapFrog)
-0.02Matched on pretests
+0.04
Note: L=large study with at least 250 students; S=small study with less than 250 students; E=Experimental; C=Control; SAT-9=Stanford Achievement Test 9th Edition; TOWRE=Test of Word Reading Efficiency; CTBS=Comprehensive Test of Basic
Skills; ITBS=Iowa Test of Basic Skills; SAT=Scholastic Achievement Test; SESAT=Stanford Early School Achievement Test; GORT=Gray Oral Reading Test; FL=Free/reduced-price lunch; W=White; AA=African American; H=Hispanic; ELL=English
language learner.
RMC (2004)
Matched (S)Collis, Ollila & Olilla (1990)
Writing to Read
Reading Machine
Beasley (1989)
B. Chambers et al. (2006)10 schools
394 students
-0.27
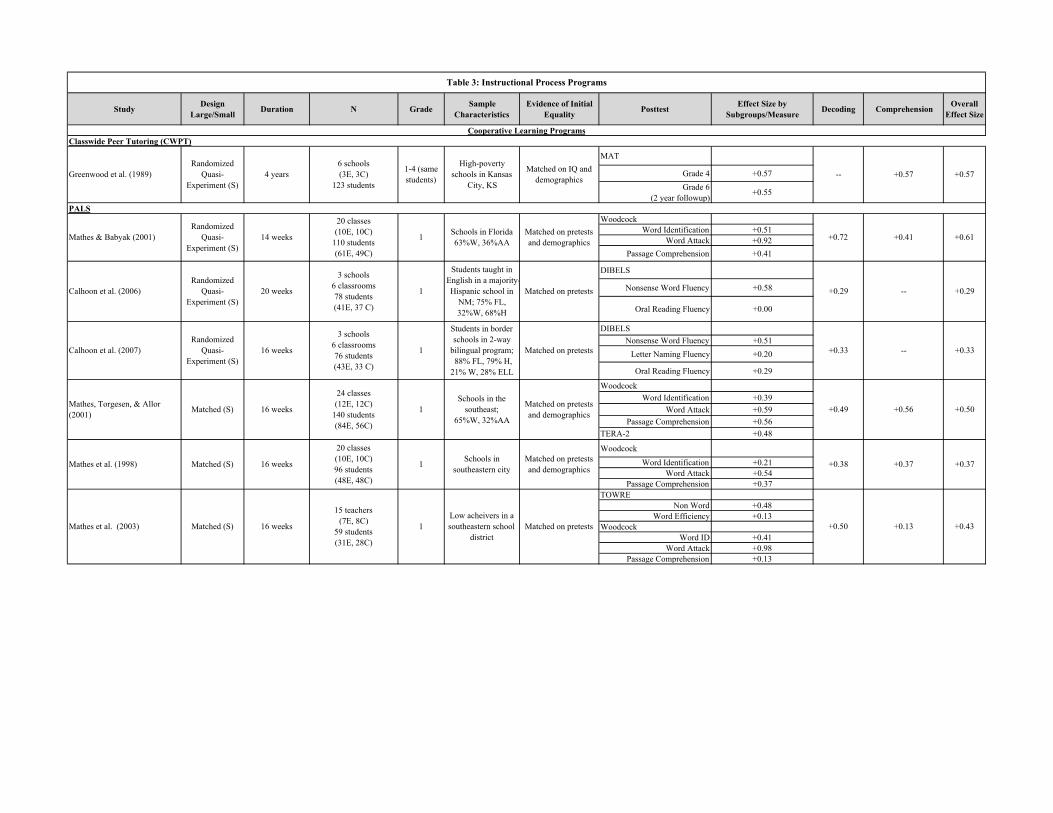
StudyDesign
Large/SmallDuration N Grade
Sample
Characteristics
Evidence of Initial
EqualityPosttest
Effect Size by
Subgroups/MeasureDecoding Comprehension
Overall
Effect Size
MAT
Grade 4 +0.57
Grade 6
(2 year followup)+0.55
Woodcock
Word Identification +0.51
Word Attack +0.92
Passage Comprehension +0.41
DIBELS
Nonsense Word Fluency +0.58
Oral Reading Fluency +0.00
DIBELS
Nonsense Word Fluency +0.51
Letter Naming Fluency +0.20
Oral Reading Fluency +0.29
Woodcock
Word Identification +0.39
Word Attack +0.59
Passage Comprehension +0.56
TERA-2 +0.48
Woodcock
Word Identification +0.21
Word Attack +0.54
Passage Comprehension +0.37
TOWRE
Non Word +0.48
Word Efficiency +0.13
Woodcock
Word ID +0.41
Word Attack +0.98
Passage Comprehension +0.13
+0.13
Table 3: Instructional Process Programs
Cooperative Learning Programs
PALS
--
+0.49 +0.56 +0.50
+0.37Matched on pretests
and demographics+0.37
-- +0.57
+0.41
+0.43
+0.57
+0.61
+0.29
+0.33
--
+0.33
+0.38
20 classes
(10E, 10C)
96 students
(48E, 48C)
Classwide Peer Tutoring (CWPT)
Matched (S)Mathes et al. (1998) 16 weeks
Calhoon et al. (2007)
Randomized
Quasi-
Experiment (S)
Mathes & Babyak (2001)
Mathes, Torgesen, & Allor
(2001)Matched (S) 16 weeks
Mathes et al. (2003)
20 classes
(10E, 10C)
110 students
(61E, 49C)
1
Schools in the
southeast;
65%W, 32%AA
Matched on pretests
and demographics
Matched on pretests
Students in border
schools in 2-way
bilingual program;
88% FL, 79% H,
21% W, 28% ELL
Schools in
southeastern city1
High-poverty
schools in Kansas
City, KS
1-4 (same
students)
6 schools
(3E, 3C)
123 students
4 years
14 weeks +0.72Matched on pretests
and demographics
Schools in Florida
63%W, 36%AA1
Greenwood et al. (1989)
Randomized
Quasi-
Experiment (S)
Calhoon et al. (2006)
Matched on IQ and
demographics
1
Students taught in
English in a majority-
Hispanic school in
NM; 75% FL,
32%W, 68%H
Matched on pretests
Randomized
Quasi-
Experiment (S)
Matched (S) 16 weeks
1
3 schools
6 classrooms
76 students
(43E, 33 C)
16 weeks
24 classes
(12E, 12C)
140 students
(84E, 56C)
15 teachers
(7E, 8C)
59 students
(31E, 28C)
1
Low acheivers in a
southeastern school
district
+0.29
+0.50Matched on pretests
Randomized
Quasi-
Experiment (S)
20 weeks
3 schools
6 classrooms
78 students
(41E, 37 C)
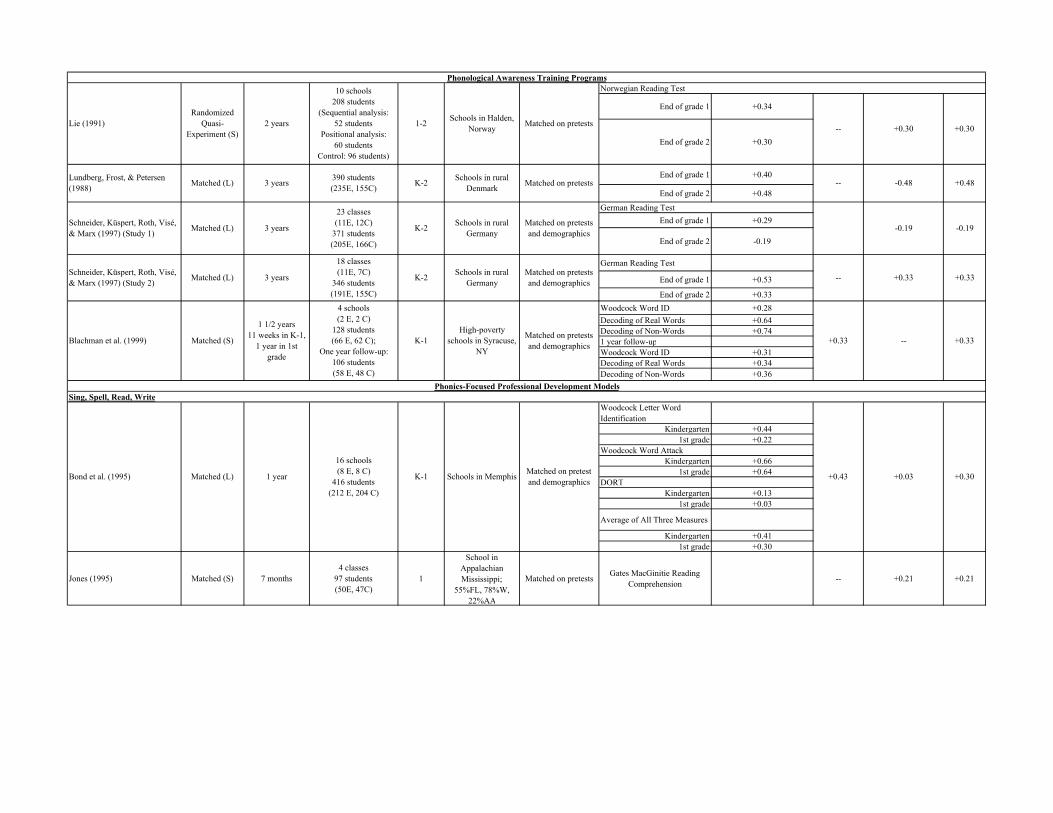
Norwegian Reading Test
End of grade 1 +0.34
End of grade 2 +0.30
End of grade 1 +0.40
End of grade 2 +0.48
German Reading Test
End of grade 1 +0.29
End of grade 2 -0.19
German Reading Test
End of grade 1 +0.53
End of grade 2 +0.33
Woodcock Word ID +0.28
Decoding of Real Words +0.64
Decoding of Non-Words +0.74
1 year follow-up
Woodcock Word ID +0.31
Decoding of Real Words +0.34
Woodcock Letter Word
Identification
Kindergarten +0.44
1st grade +0.22
Woodcock Word Attack
Kindergarten +0.66
1st grade +0.64
DORT
Kindergarten +0.13
1st grade +0.03
Average of All Three Measures
Kindergarten +0.41
1st grade +0.30
Jones (1995) Matched (S) 7 months
4 classes
97 students
(50E, 47C)
1
School in
Appalachian
Mississippi;
55%FL, 78%W,
22%AA
Matched on pretestsGates MacGinitie Reading
Comprehension-- +0.21 +0.21
+0.03
-- +0.33
--
Phonics-Focused Professional Development Models
Sing, Spell, Read, Write
-0.19
-- +0.30
Schools in rural
Germany
-- -0.48
16 schools
(8 E, 8 C)
416 students
(212 E, 204 C)
Bond et al. (1995)
+0.48
-0.19
+0.30
Phonological Awareness Training Programs
Lie (1991)
+0.33
+0.33
+0.30Matched on pretest
and demographics
High-poverty
schools in Syracuse,
NY
Schools in Halden,
Norway1-2
10 schools
208 students
(Sequential analysis:
52 students
Positional analysis:
60 students
Control: 96 students)
K-1
+0.33Blachman et al. (1999) Matched (S)
1 1/2 years
11 weeks in K-1,
1 year in 1st
grade
Matched on pretests
and demographics
4 schools
(2 E, 2 C)
128 students
(66 E, 62 C);
One year follow-up:
106 students
(58 E, 48 C)
K-1
+0.43Schools in MemphisMatched (L) 1 year
Schneider, Küspert, Roth, Visé,
& Marx (1997) (Study 1)
Lundberg, Frost, & Petersen
(1988)
23 classes
(11E, 12C)
371 students
(205E, 166C)
K-2
Randomized
Quasi-
Experiment (S)
Schneider, Küspert, Roth, Visé,
& Marx (1997) (Study 2)
3 years
3 years
Matched on pretests
and demographicsMatched (L)
Matched on pretestsSchools in rural
DenmarkK-2
Schools in rural
Germany
Matched (L)
Matched (L)
Decoding of Non-Words +0.36
Matched on pretests2 years
K-2
390 students
(235E, 155C)
Matched on pretests
and demographics
18 classes
(11E, 7C)
346 students
(191E, 155C)
3 years
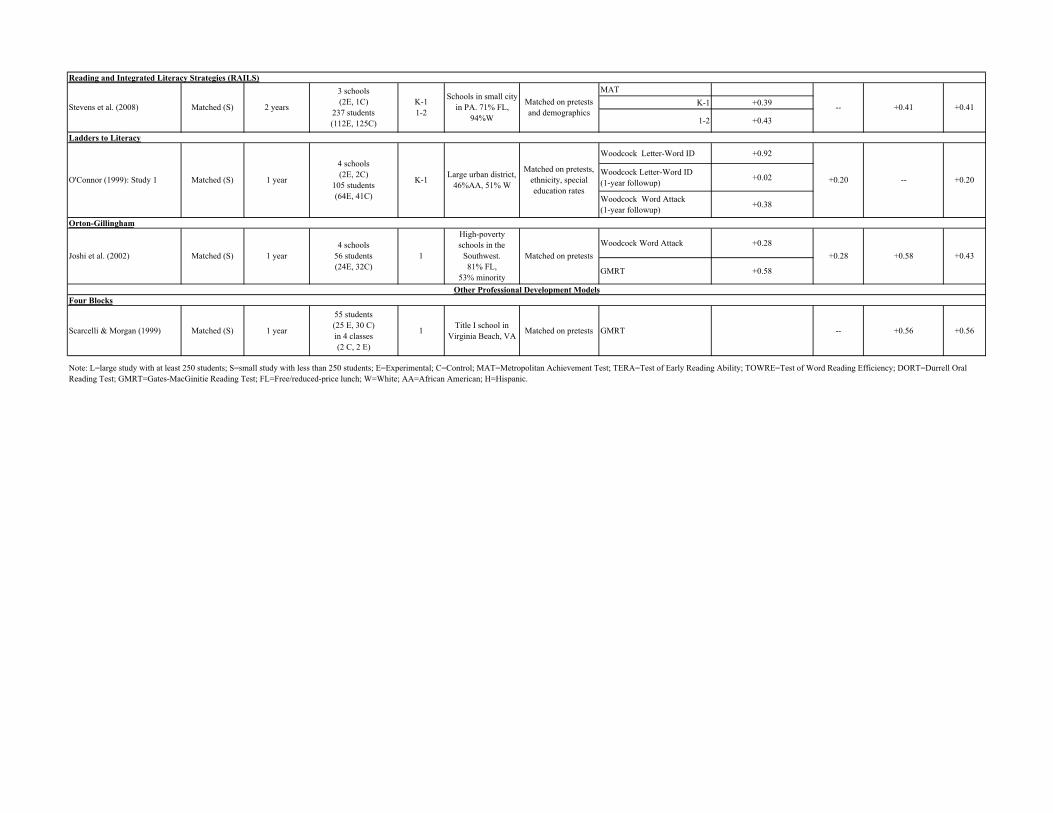
MAT
K-1 +0.39
1-2 +0.43
Woodcock Letter-Word ID +0.92
Woodcock Letter-Word ID
(1-year followup)+0.02
Woodcock Word Attack
(1-year followup)+0.38
Woodcock Word Attack +0.28
GMRT +0.58
Scarcelli & Morgan (1999) Matched (S) 1 year
55 students
(25 E, 30 C)
in 4 classes
(2 C, 2 E)
1Title I school in
Virginia Beach, VAMatched on pretests GMRT -- +0.56 +0.56
+0.581 year
Four Blocks
+0.41
+0.20 --
Joshi et al. (2002)
--K-1
1-2Matched (S)
3 schools
(2E, 1C)
237 students
(112E, 125C)
+0.43+0.28
Other Professional Development Models
Note: L=large study with at least 250 students; S=small study with less than 250 students; E=Experimental; C=Control; MAT=Metropolitan Achievement Test; TERA=Test of Early Reading Ability; TOWRE=Test of Word Reading Efficiency; DORT=Durrell Oral
Reading Test; GMRT=Gates-MacGinitie Reading Test; FL=Free/reduced-price lunch; W=White; AA=African American; H=Hispanic.
+0.20
Stevens et al. (2008) +0.41Matched on pretests
and demographics
Schools in small city
in PA. 71% FL,
94%W
Reading and Integrated Literacy Strategies (RAILS)
High-poverty
schools in the
Southwest.
81% FL,
53% minority
1
4 schools
56 students
(24E, 32C)
Matched on pretests
Ladders to Literacy
Matched (S)
Orton-Gillingham
4 schools
(2E, 2C)
105 students
(64E, 41C)
Matched on pretests,
ethnicity, special
education rates
Large urban district,
46%AA, 51% WK-1
2 years
O'Connor (1999): Study 1 Matched (S) 1 year
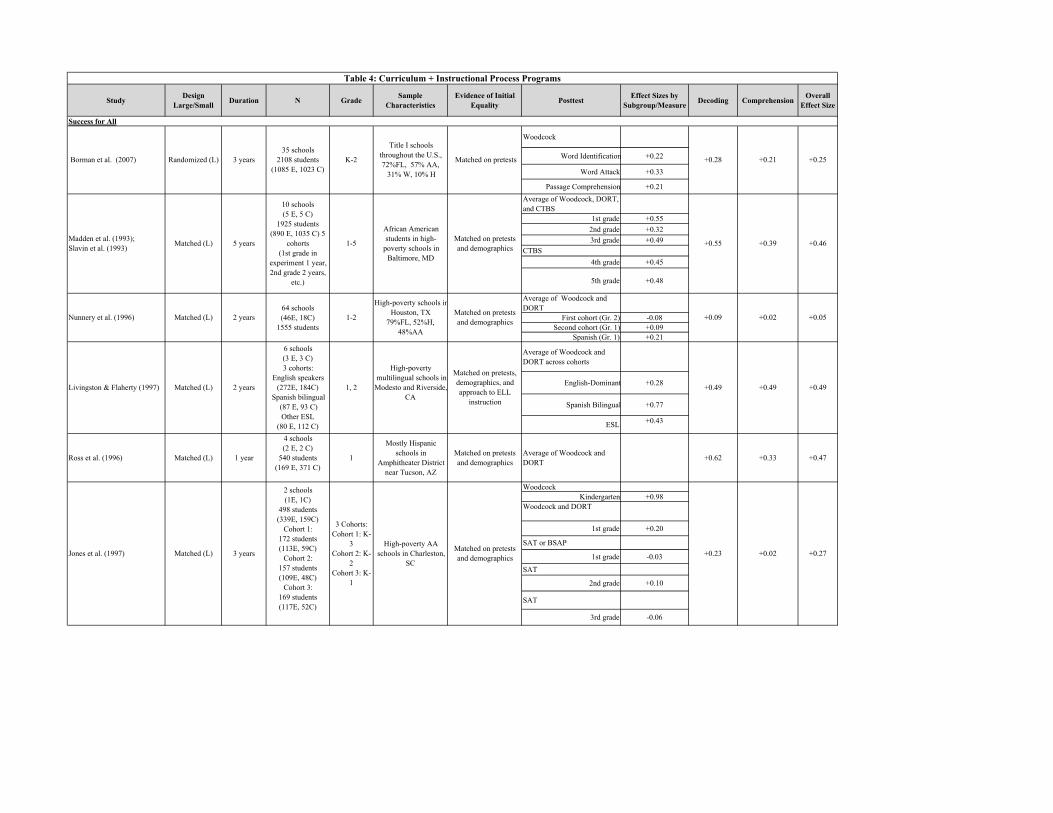
StudyDesign
Large/SmallDuration N Grade
Sample
Characteristics
Evidence of Initial
EqualityPosttest
Effect Sizes by
Subgroup/MeasureDecoding Comprehension
Overall
Effect Size
Woodcock
Word Identification +0.22
Word Attack +0.33
Passage Comprehension +0.21
Average of Woodcock, DORT,
and CTBS
1st grade +0.55
2nd grade +0.32
3rd grade +0.49
CTBS
4th grade +0.45
5th grade +0.48
Average of Woodcock and
DORT
First cohort (Gr. 2) -0.08
Second cohort (Gr. 1) +0.09
Spanish (Gr. 1) +0.21
Average of Woodcock and
DORT across cohorts
English-Dominant +0.28
Spanish Bilingual +0.77
ESL+0.43
Ross et al. (1996) Matched (L) 1 year
4 schools
(2 E, 2 C)
540 students
(169 E, 371 C)
1
Mostly Hispanic
schools in
Amphitheater District
near Tucson, AZ
Matched on pretests
and demographics
Average of Woodcock and
DORT+0.62 +0.33 +0.47
Woodcock
Kindergarten +0.98
Woodcock and DORT
1st grade +0.20
SAT or BSAP
1st grade -0.03
SAT
2nd grade +0.10
SAT
3rd grade -0.06
+0.23 +0.02
3 Cohorts:
Cohort 1: K-
3
Cohort 2: K-
2
Cohort 3: K-
1
High-poverty AA
schools in Charleston,
SC
Success for All
+0.49 +0.49
1-2
64 schools
(46E, 18C)
1555 students
2 years Matched (L)Nunnery et al. (1996)
3 years
2 schools
(1E, 1C)
498 students
(339E, 159C)
Cohort 1:
172 students
(113E, 59C)
Cohort 2:
157 students
(109E, 48C)
Cohort 3:
169 students
(117E, 52C)
Borman et al. (2007) Randomized (L) 3 years
35 schools
2108 students
(1085 E, 1023 C)
K-2 Matched on pretests
Matched (L) 1-5 +0.39
2 years 1, 2
+0.25
Matched on pretests
and demographics
Title I schools
throughout the U.S.,
72%FL, 57% AA,
31% W, 10% H
Matched on pretests
and demographics
High-poverty schools in
Houston, TX
79%FL, 52%H,
48%AA
+0.27
6 schools
(3 E, 3 C)
3 cohorts:
English speakers
(272E, 184C)
Spanish bilingual
(87 E, 93 C)
Other ESL
(80 E, 112 C)
Jones et al. (1997) Matched (L)
African American
students in high-
poverty schools in
Baltimore, MD
Matched on pretests
and demographics
Table 4: Curriculum + Instructional Process Programs
+0.49
+0.28 +0.21
+0.55 +0.46
10 schools
(5 E, 5 C)
1925 students
(890 E, 1035 C) 5
cohorts
(1st grade in
experiment 1 year,
2nd grade 2 years,
etc.)
Matched (L)
Madden et al. (1993);
Slavin et al. (1993)
Livingston & Flaherty (1997)
5 years
+0.05
Matched on pretests,
demographics, and
approach to ELL
instruction
High-poverty
multilingual schools in
Modesto and Riverside,
CA
+0.02+0.09
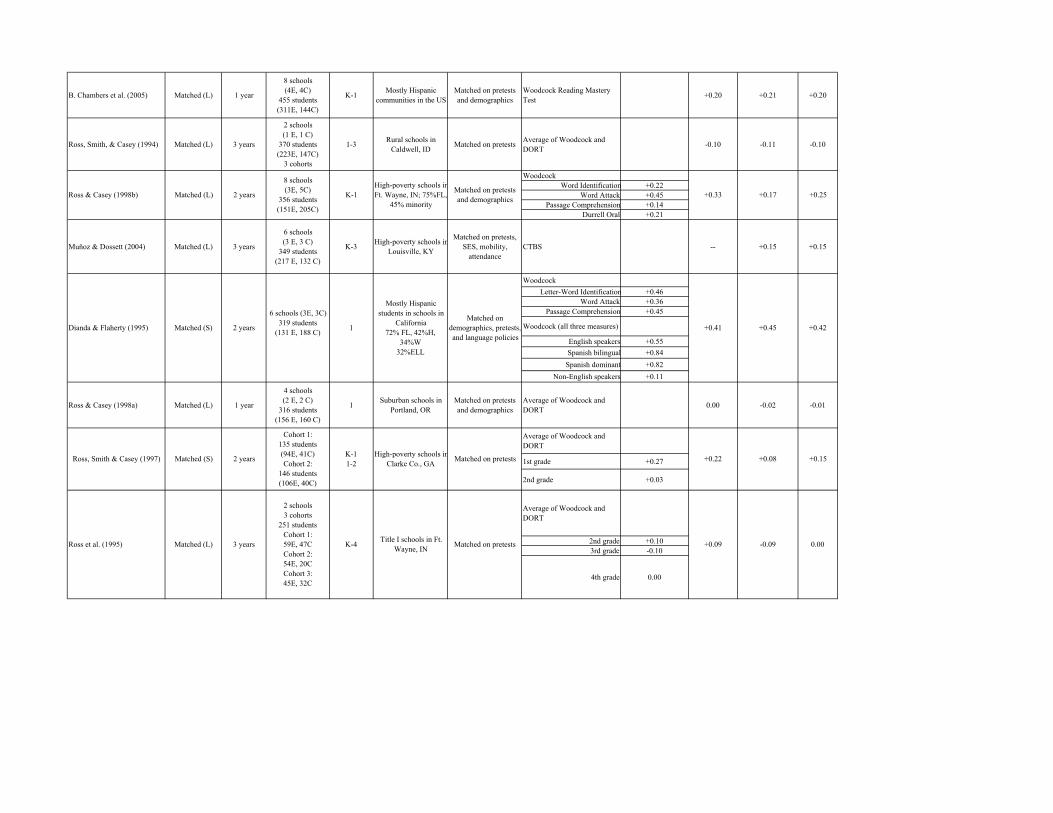
B. Chambers et al. (2005) Matched (L) 1 year
8 schools
(4E, 4C)
455 students
(311E, 144C)
K-1Mostly Hispanic
communities in the US
Matched on pretests
and demographics
Woodcock Reading Mastery
Test+0.20 +0.21 +0.20
Ross, Smith, & Casey (1994) Matched (L) 3 years
2 schools
(1 E, 1 C)
370 students
(223E, 147C)
3 cohorts
1-3Rural schools in
Caldwell, IDMatched on pretests
Average of Woodcock and
DORT-0.10 -0.11 -0.10
Woodcock
Word Identification +0.22
Word Attack +0.45
Passage Comprehension +0.14
Durrell Oral +0.21
Muňoz & Dossett (2004) Matched (L) 3 years
6 schools
(3 E, 3 C)
349 students
(217 E, 132 C)
K-3High-poverty schools in
Louisville, KY
Matched on pretests,
SES, mobility,
attendance
CTBS -- +0.15 +0.15
Woodcock
Letter-Word Identification +0.46
Word Attack +0.36
Passage Comprehension +0.45
Woodcock (all three measures)
English speakers +0.55
Spanish bilingual +0.84
Spanish dominant +0.82
Non-English speakers +0.11
Ross & Casey (1998a) Matched (L) 1 year
4 schools
(2 E, 2 C)
316 students
(156 E, 160 C)
1Suburban schools in
Portland, OR
Matched on pretests
and demographics
Average of Woodcock and
DORT0.00 -0.02 -0.01
Average of Woodcock and
DORT
1st grade +0.27
2nd grade +0.03
Average of Woodcock and
DORT
2nd grade +0.10
3rd grade -0.10
4th grade 0.00
Ross, Smith & Casey (1997)
Cohort 1:
135 students
(94E, 41C)
Cohort 2:
146 students
(106E, 40C)
+0.09
K-1
+0.08
Ross & Casey (1998b) +0.33
Matched (S)
Dianda & Flaherty (1995)
Matched on pretests
and demographics
1
K-1
1-2+0.22Matched on pretests
High-poverty schools in
Clarke Co., GA
High-poverty schools in
Ft. Wayne, IN; 75%FL,
45% minority
2 schools
3 cohorts
251 students
Cohort 1:
59E, 47C
Cohort 2:
54E, 20C
Cohort 3:
45E, 32C
2 years
Mostly Hispanic
students in schools in
California
72% FL, 42%H,
34%W
32%ELL
+0.15
0.00K-4
8 schools
(3E, 5C)
356 students
(151E, 205C)
-0.09
Matched on
demographics, pretests,
and language policies
+0.41 +0.42
+0.17 +0.25
Matched on pretestsRoss et al. (1995) Matched (L) 3 yearsTitle I schools in Ft.
Wayne, IN
2 years
2 yearsMatched (L)
6 schools (3E, 3C)
319 students
(131 E, 188 C)Matched (S) +0.45
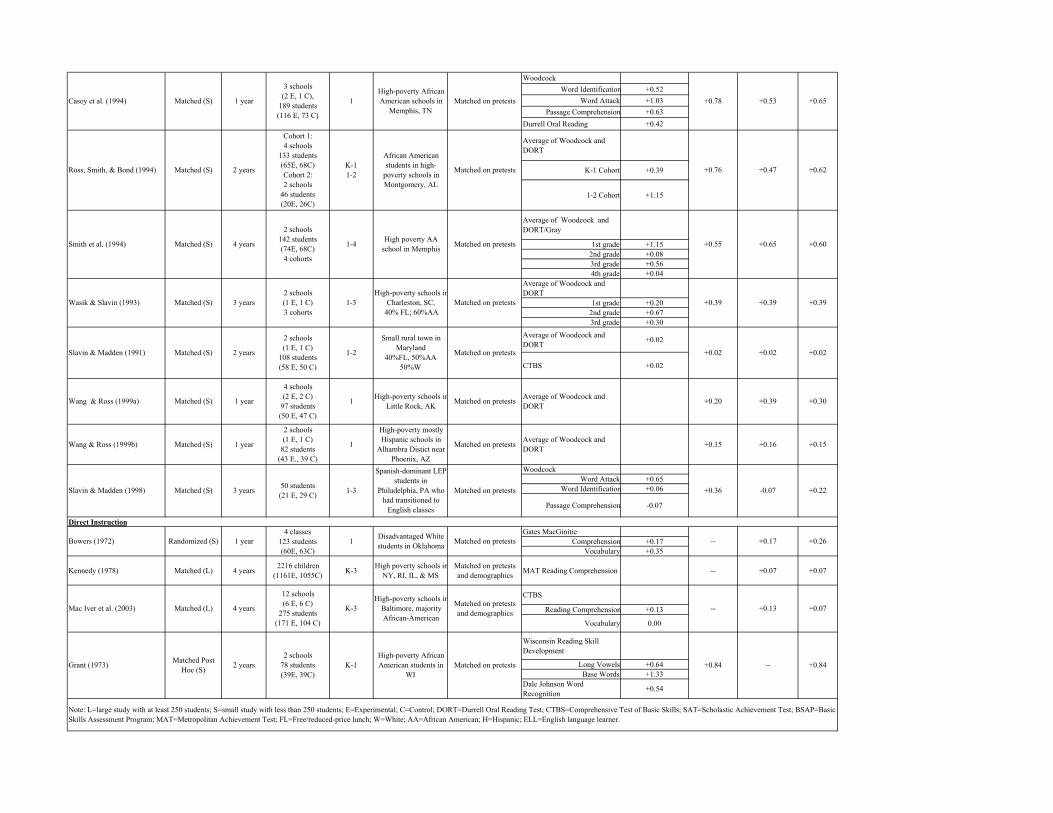
Woodcock
Word Identification +0.52
Word Attack +1.03
Passage Comprehension +0.63
Durrell Oral Reading +0.42
Average of Woodcock and
DORT
K-1 Cohort +0.39
1-2 Cohort +1.15
Average of Woodcock and
DORT/Gray
1st grade +1.15
2nd grade +0.08
3rd grade +0.56
4th grade +0.04
Average of Woodcock and
DORT
1st grade +0.20
2nd grade +0.67
3rd grade +0.30
Average of Woodcock and
DORT+0.02
CTBS +0.02
Wang & Ross (1999b) Matched (S) 1 year
2 schools
(1 E, 1 C)
82 students
(43 E., 39 C)
1
High-poverty mostly
Hispanic schools in
Alhambra Distict near
Phoenix, AZ
Matched on pretestsAverage of Woodcock and
DORT+0.15 +0.16 +0.15
Woodcock
Word Attack +0.65
Word Identification +0.06
Passage Comprehension -0.07
Gates MacGinitie
Comprehension +0.17
Vocabulary +0.35
Kennedy (1978) Matched (L) 4 years2216 children
(1161E, 1055C)K-3
High poverty schools in
NY, RI, IL, & MS
Matched on pretests
and demographics MAT Reading Comprehension -- +0.07 +0.07
CTBS
Reading Comprehension +0.13
Vocabulary 0.00
Wisconsin Reading Skill
Development
Long Vowels +0.64
Base Words +1.33
Dale Johnson Word
Recognition+0.54
+0.84 --
2 schools
142 students
(74E, 68C)
4 cohorts
4 years
High-poverty schools in
Baltimore, majority
African-American
Matched on pretests
and demographics
-- +0.17
+0.55 +0.65
Direct Instruction
-- +0.13
+0.20 +0.39
+0.39 +0.39
Matched (S)Slavin & Madden (1991)
2 schools
(1 E, 1 C)
3 cohorts
2 years
Matched (S)Smith et al. (1994) +0.60Matched on pretestsHigh poverty AA
school in Memphis1-4
+0.02 +0.02 +0.02
+0.62
+0.78
1-2
2 schools
(1 E, 1 C)
108 students
(58 E, 50 C)
Casey et al. (1994) Matched (S)
1-3
Matched on pretests
Small rural town in
Maryland
40%FL, 50%AA
50%W
Matched on pretests
High-poverty schools in
Charleston, SC,
40% FL; 60%AA
African American
students in high-
poverty schools in
Montgomery, AL
Matched on pretests +0.76 +0.47
1 +0.53
Matched on pretests +0.22Slavin & Madden (1998) 1-3
Spanish-dominant LEP
students in
Philadelphia, PA who
had transitioned to
English classes
Matched (S) 3 years50 students
(21 E, 29 C)
Ross, Smith, & Bond (1994) Matched (S) 2 years
Cohort 1:
4 schools
133 students
(65E, 68C)
Cohort 2:
2 schools
46 students
(20E, 26C)
3 schools
(2 E, 1 C),
189 students
(116 E, 73 C)
High-poverty African
American schools in
Memphis, TN
Matched on pretests
12 schools
(6 E, 6 C)
275 students
(171 E, 104 C)
K-3
+0.39
+0.65
+0.07
Wasik & Slavin (1993)
+0.36 -0.07
1High-poverty schools in
Little Rock, AKMatched on pretests
3 yearsMatched (S)
K-1
1-2
Wang & Ross (1999a) Matched (S) 1 year
4 schools
(2 E, 2 C)
97 students
(50 E, 47 C)
1 year
Average of Woodcock and
DORT+0.30
Grant (1973)
+0.26Matched on pretestsDisadvantaged White
students in Oklahoma1
4 classes
123 students
(60E, 63C)
1 year
Mac Iver et al. (2003) Matched (L) 4 years
Note: L=large study with at least 250 students; S=small study with less than 250 students; E=Experimental; C=Control; DORT=Durrell Oral Reading Test; CTBS=Comprehensive Test of Basic Skills; SAT=Scholastic Achievement Test; BSAP=Basic
Skills Assessment Program; MAT=Metropolitan Achievement Test; FL=Free/reduced-price lunch; W=White; AA=African American; H=Hispanic; ELL=English language learner.
Randomized (S)Bowers (1972)
+0.84Matched on pretests
High-poverty African
American students in
WI
K-1
2 schools
78 students
(39E, 39C)
2 yearsMatched Post
Hoc (S)
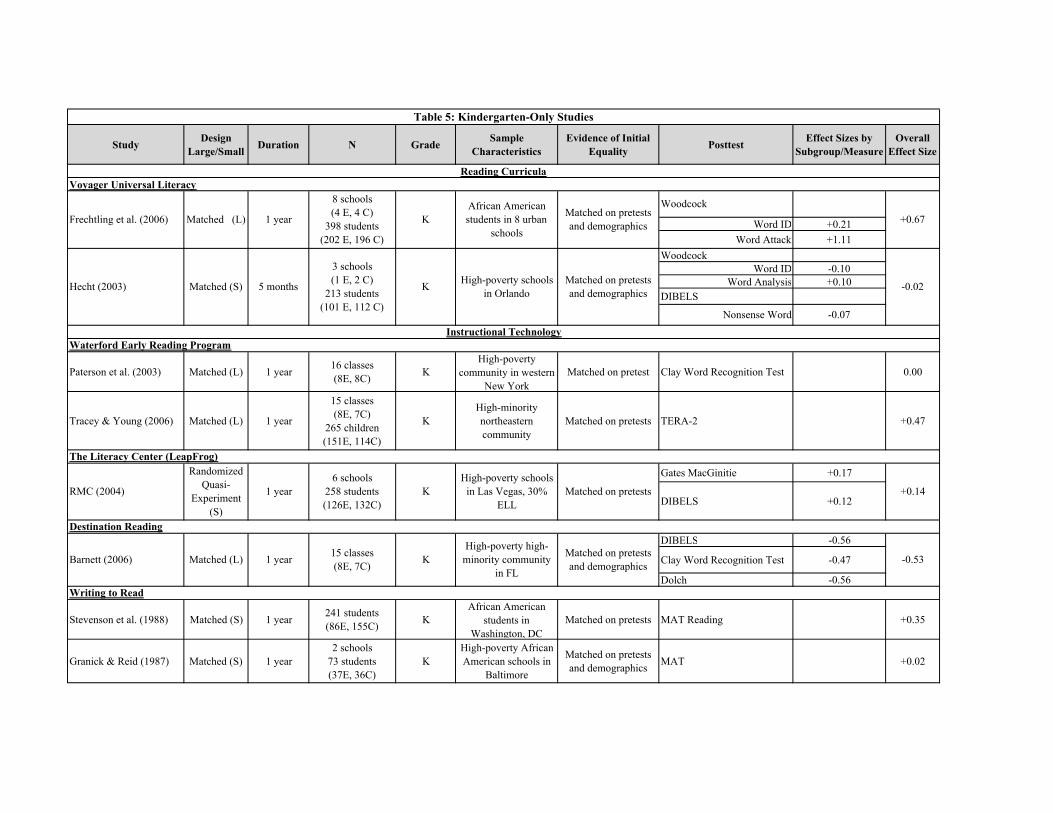
StudyDesign
Large/SmallDuration N Grade
Sample
Characteristics
Evidence of Initial
EqualityPosttest
Effect Sizes by
Subgroup/Measure
Overall
Effect Size
Word ID +0.21
Word Attack +1.11
Woodcock
Word ID -0.10
Word Analysis +0.10
DIBELS
Paterson et al. (2003) Matched (L) 1 year16 classes
(8E, 8C)K
High-poverty
community in western
New York
Matched on pretest Clay Word Recognition Test 0.00
Tracey & Young (2006) Matched (L) 1 year
15 classes
(8E, 7C)
265 children
(151E, 114C)
K
High-minority
northeastern
community
Matched on pretests TERA-2 +0.47
Gates MacGinitie +0.17
DIBELS +0.12
DIBELS -0.56
Clay Word Recognition Test -0.47
Dolch -0.56
Stevenson et al. (1988) Matched (S) 1 year241 students
(86E, 155C)K
African American
students in
Washington, DC
Matched on pretests MAT Reading +0.35
Granick & Reid (1987) Matched (S) 1 year
2 schools
73 students
(37E, 36C)
K
High-poverty African
American schools in
Baltimore
Matched on pretests
and demographicsMAT +0.02
-0.02
Instructional Technology
Waterford Early Reading Program
K15 classes
(8E, 7C)
-0.07Nonsense Word
Matched on pretests
and demographics
High-poverty high-
minority community
in FL
Matched on pretests
1 year
1 year
K
Barnett (2006)
Destination Reading
Matched (L)
Hecht (2003)
The Literacy Center (LeapFrog)
K5 months
-0.53
Writing to Read
+0.14
8 schools
(4 E, 4 C)
398 students
(202 E, 196 C)
African American
students in 8 urban
schools
Matched on pretests
and demographics
Woodcock
K
3 schools
(1 E, 2 C)
213 students
(101 E, 112 C)
High-poverty schools
in Orlando
Matched on pretests
and demographics
RMC (2004)
Table 5: Kindergarten-Only Studies
Reading Curricula
Voyager Universal Literacy
Frechtling et al. (2006) Matched (L) +0.67
Matched (S)
1 year
High-poverty schools
in Las Vegas, 30%
ELL
6 schools
258 students
(126E, 132C)
Randomized
Quasi-
Experiment
(S)
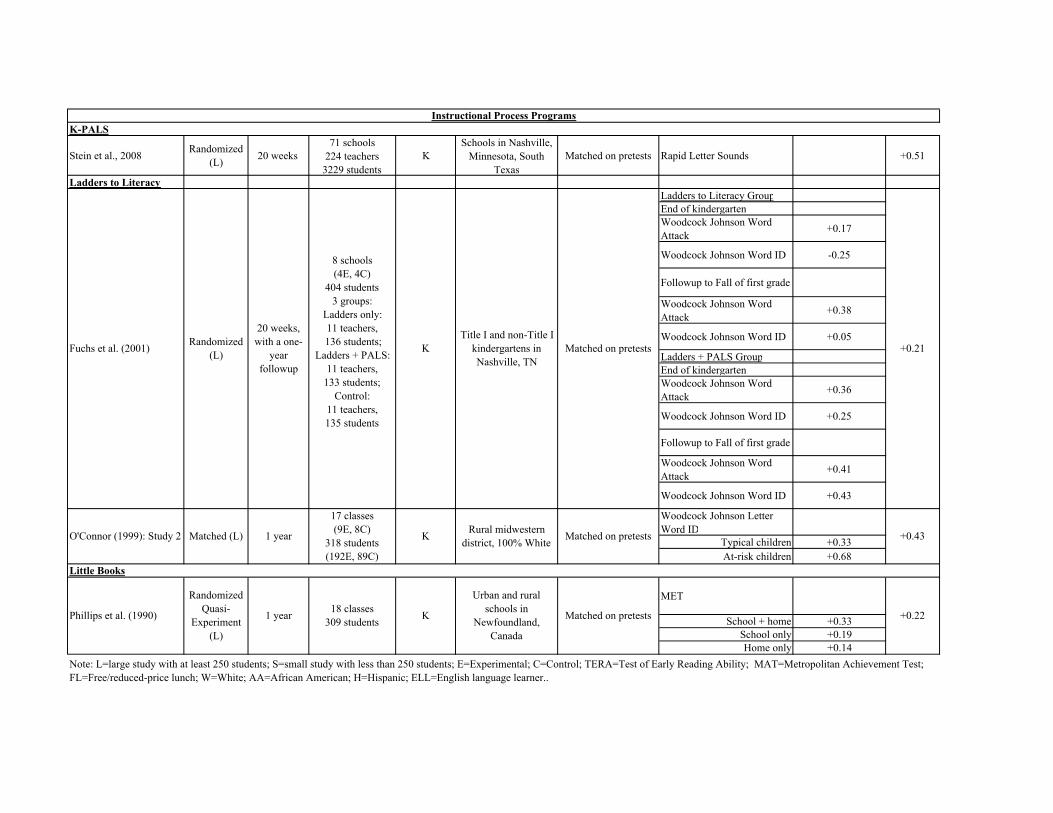
K-PALS
Stein et al., 2008Randomized
(L)20 weeks
71 schools
224 teachers
3229 students
K
Schools in Nashville,
Minnesota, South
Texas
Matched on pretests Rapid Letter Sounds +0.51
Ladders to Literacy
Ladders to Literacy Group
End of kindergarten
Woodcock Johnson Word
Attack+0.17
Woodcock Johnson Word ID -0.25
Followup to Fall of first grade
Woodcock Johnson Word
Attack+0.38
Woodcock Johnson Word ID +0.05
Ladders + PALS Group
End of kindergarten
Woodcock Johnson Word
Attack+0.36
Woodcock Johnson Word ID +0.25
Followup to Fall of first grade
Woodcock Johnson Word
Attack+0.41
Woodcock Johnson Word ID +0.43
Woodcock Johnson Letter
Word ID
Typical children +0.33
At-risk children +0.68
MET
School + home +0.33
School only +0.19
Home only +0.14
Little Books
1 year
8 schools
(4E, 4C)
404 students
3 groups:
Ladders only:
11 teachers,
136 students;
Ladders + PALS:
11 teachers,
133 students;
Control:
11 teachers,
135 students
20 weeks,
with a one-
year
followup
Randomized
(L)
+0.43
Instructional Process Programs
Matched on pretestsRural midwestern
district, 100% White
Matched on pretestsFuchs et al. (2001) +0.21
Title I and non-Title I
kindergartens in
Nashville, TN
K
KMatched (L)O'Connor (1999): Study 2
17 classes
(9E, 8C)
318 students
(192E, 89C)
Urban and rural
schools in
Newfoundland,
Canada
18 classes
309 students
Note: L=large study with at least 250 students; S=small study with less than 250 students; E=Experimental; C=Control; TERA=Test of Early Reading Ability; MAT=Metropolitan Achievement Test;
FL=Free/reduced-price lunch; W=White; AA=African American; H=Hispanic; ELL=English language learner..
Randomized
Quasi-
Experiment
(L)
Phillips et al. (1990) +0.22Matched on pretestsK1 year
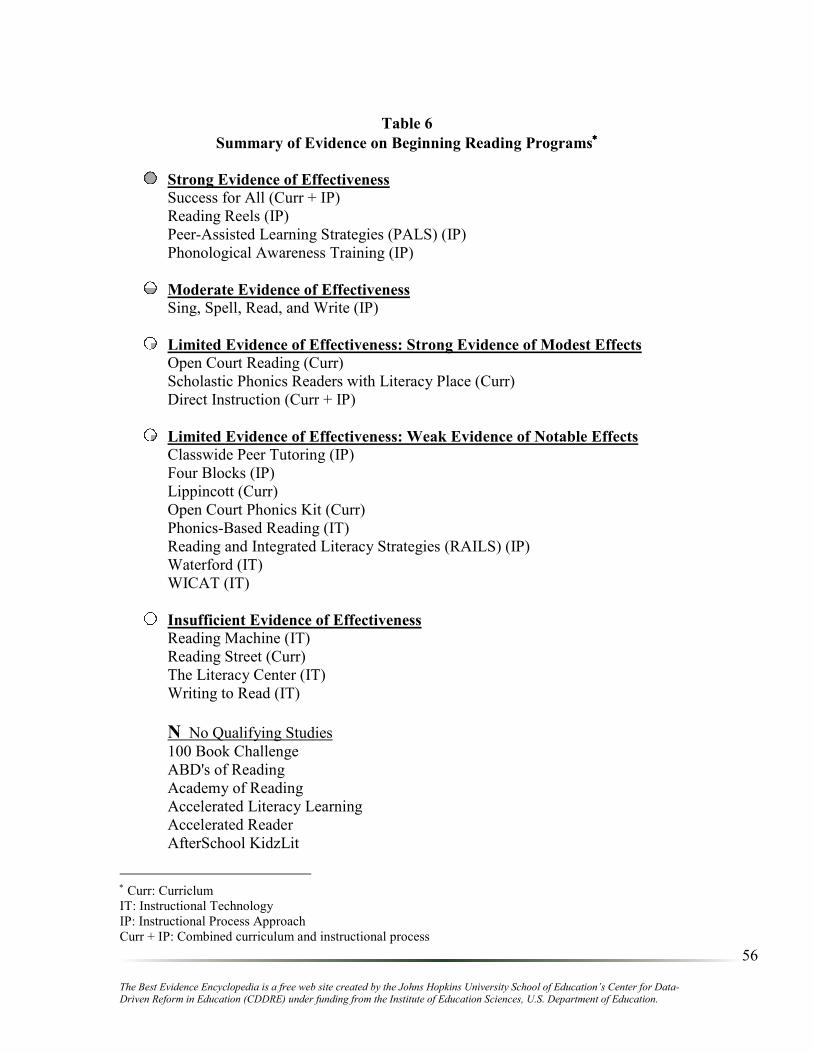
The Best Evidence Encyclopedia is a free web site created by the Johns Hopkins University School of Education’s Center for Data-Driven Reform in Education (CDDRE) under funding from the Institute of Education Sciences, U.S. Department of Education.
56
Table 6
Summary of Evidence on Beginning Reading Programs∗∗∗∗
Strong Evidence of Effectiveness
Success for All (Curr + IP)
Reading Reels (IP)
Peer-Assisted Learning Strategies (PALS) (IP)
Phonological Awareness Training (IP)
Moderate Evidence of Effectiveness
Sing, Spell, Read, and Write (IP)
Limited Evidence of Effectiveness: Strong Evidence of Modest Effects
Open Court Reading (Curr)
Scholastic Phonics Readers with Literacy Place (Curr)
Direct Instruction (Curr + IP)
Limited Evidence of Effectiveness: Weak Evidence of Notable Effects
Classwide Peer Tutoring (IP)
Four Blocks (IP)
Lippincott (Curr)
Open Court Phonics Kit (Curr)
Phonics-Based Reading (IT)
Reading and Integrated Literacy Strategies (RAILS) (IP)
Waterford (IT)
WICAT (IT)
Insufficient Evidence of Effectiveness
Reading Machine (IT)
Reading Street (Curr)
The Literacy Center (IT)
Writing to Read (IT)
N No Qualifying Studies 100 Book Challenge
ABD's of Reading
Academy of Reading
Accelerated Literacy Learning
Accelerated Reader
AfterSchool KidzLit
∗ Curr: Curriclum
IT: Instructional Technology
IP: Instructional Process Approach
Curr + IP: Combined curriculum and instructional process
The Best Evidence Encyclopedia is a free web site created by the Johns Hopkins University School of Education’s Center for Data-Driven Reform in Education (CDDRE) under funding from the Institute of Education Sciences, U.S. Department of Education.
57
Alphabetic Phonics
Barton Reading & Spelling System
Be a Better Reader
Breakthrough to Literacy
Carbo Reading Styles
Caught Reading
CCC
Charlesbridge Reading Fluency
Classworks
Compass Reading
Comprehension Plus
Comprehension Upgrade
Concept-Oriented Reading Instruction (CORI)
Conceptually-Based Strategy Instruction (Curr)
Consistency Management Cooperative Discipline (CMCD)
Cross-Aged Literacy Program
Destination Literacy
Digitexts
Disciplinary Literacy
Discover Intensive Phonics for Yourself
Dolch Reading Program
Early Reading Intervention (ERI)
Early Success
Earobics
EasyTech
Edmark Reading Program
Electronic Bookshelf
Elements of Reading: Comprehension
Elements of Reading: Fluency
Elements of Reading: Vocabulary
Essential Learning System
Failure Free Reading
Fast Track Reading
First Steps
Fluency First
Fluency Formula
Fluent Reader
FOCUS Reading and Language Program
Foundations and Frameworks
Fountas Pinnell Units of Study (Heineman)
Fundations
Funnix Reading Programs
Glass-Analysis method
Great Books
Great Leaps
Harcourt Collections

The Best Evidence Encyclopedia is a free web site created by the Johns Hopkins University School of Education’s Center for Data-Driven Reform in Education (CDDRE) under funding from the Institute of Education Sciences, U.S. Department of Education.
58
Harcourt Signatures
Harcourt Trophies
Houghton Mifflin Nation’s Choice
Houghton Mifflin Reading
Headsprout Early Reading
Heinemann, Literacy World
Heinemann, Rigby Star
Hodder & Stoughton, Fast Forward
Hooked on Phonics®
Horizons
HOSTS
Houghton Mifflin Horizons
Houghton Mifflin Invitations to Literacy
Houghton Mifflin Legacy of Literacy
Imagine It!
IndiVisual Reading
Intensive Reading Strategies Instruction (IRSI) Model
Intensive Supplemental Reading
Invitations to Literacy
Irlen Method
Jacob’s Ladder
Jolly Phonics
Jostens/Compass Learning
Kaleidoscope
Kar2ouche
Kindergarten Works
Knowledge Box
K-W-L strategy
Language Essentials for Teachers of Reading and Spelling
Language First!
Language for Thinking
LANGUAGE!
LeapTrack Assessment & Instruction System
Learning Experience Approach
Learning to Read
Learning Upgrade
Lexia
Lightspan
Like to Read
Lindamood-Bell
LiPS
LitART
Literacy by Design
Literacy Seminar
Little Books
Macmillan/McGraw-Hill Treasures
The Best Evidence Encyclopedia is a free web site created by the Johns Hopkins University School of Education’s Center for Data-Driven Reform in Education (CDDRE) under funding from the Institute of Education Sciences, U.S. Department of Education.
59
Making Connections
McGraw-Hill Reading
McGraw-Hill Spotlight on Literacy
McGraw-Hill Treasures/Triumphs
McRAT
Merit Software
My Reading Coach
Open Book Anywhere
OpenBook to Literacy
Oxford Reading Tree Stage 1 & 2 First Phonics Talking Stories
Oxford University Press Reading Tree
Pathways
Phonetics First-Focus on Sounds
Phonics and Friends
Phonics First Foundations
Phonics for Reading
Phono-Graphix
PLATO
Project Read
Putting Reading First in Your Classroom
Questioning the Author
Quicktionary Reading Pen II
Read Naturally
Read Now
READ RIGHT
Read, Write & Type!
ReadAbout
Reading Apprenticeship
Reading Horizons
Reading in the Content Areas
Reading Plus
Reading Success
Reading to Learn
Reading Triumphs
Reading Upgrade
Read Well
Responsive Classroom
Rigby Reading
Rosetta Stone Literacy
Ruth Miskin Literacy
S.P.I.R.E. and Sounds Sensible
Saxon Phonics
Say Cheese! Early Years and Say Cheese Infants
Scaffolded Reading Experience
Schoolwide Enrichment Reading Model (SEM-R)
Seeing Stars
The Best Evidence Encyclopedia is a free web site created by the Johns Hopkins University School of Education’s Center for Data-Driven Reform in Education (CDDRE) under funding from the Institute of Education Sciences, U.S. Department of Education.
60
SIM-Stategic Instruction Model
Six Minute Solution
Slingerland
Smart Way Reading and Spelling
Sound Sheets
Spalding Method
Spell Read
SRA Reading
START-IN
STEPS (Sequential Teaching of Explicit Phonics and Spelling)
Strategic Literacy Initiative
Success in Reading and Writing
SuccessMaker
Sunshine
TeachFirst
Teaching Reading Essentials
Tell a Tale 2
Text Mapping Strategy
Text Talk
The Imagination Station
Thinking Works
Transactional Strategies Instruction
Tune in to Reading
Visualizing and Verbalizing
Vocabulary Improvement Program
Voices Reading
Voyager Passport
Voyager TimeWarp Plus
Voyager Universal Literacy
Wilson Reading
Wright Group Literacy
WriteToLearn