Taxation of Corporations and Their Impact on Economic Growth: The Case of EU Countries
Upload
khangminh22Category
view
1download
0
i
EFFECT OF TAXATION ON ECONOMIC PERFORMANCE A CASE OF KENYA
BY
JOSHUA KADENGE
ISSUE ON 01/10/2021

ii
DECLARATION
This research proposal is my original work and has not been presented for the purpose of
obtaining a degree or an award in any other university.
iii
DEDICATION
This research study is dedicated to my family members for their prayers, financial support and
their encouragement they gave during the study period. I also dedicate this research to the staff
both for teaching and non-teaching staff for their tireless efforts without whom this success could
not be realized.

iv
ACKNOWLEDGEMENT
I thank God for the good health that He Has given me, my family and friends throughout the
study period and those that provided a great contribution to the success of work . I will also want
to offer my sincere gratitude to my family members for their financial, moral and social support
during this period which has greatly contributed to the success of this research.
May God bless you abundantly.

v
Table of Contents DECLARATION ............................................................................................................................ ii
DEDICATION ............................................................................................................................... iii
ACKNOWLEDGEMENT ............................................................................................................. iv
List of abbreviation ....................................................................................................................... vii
ABSTRACT ................................................................................................................................. viii
CHATPER ONE ............................................................................................................................. 1
INTRODUCTION .......................................................................................................................... 1
1.1 Background of the study ....................................................................................................... 1
1.1.1Taxation ........................................................................................................................... 4
1.1.2 Kenya Economic performance ....................................................................................... 8
1.2 Research problem ................................................................................................................ 17
1.3 Research objectives ............................................................................................................. 18
1.4 Research questions .............................................................................................................. 19
1.5 Significance of the study ..................................................................................................... 19
1.6 Scope of the study ............................................................................................................... 19
1.7 Organization of the paper .................................................................................................... 20
CHAPTER TWO .......................................................................................................................... 21
LITERATURE REVIEW ............................................................................................................. 21
2.1INTRODUCTION ................................................................................................................ 21
2.2THEORITICAL LITERATURE REVIEW ......................................................................... 21
2.2.1 Supply-side Economic Theory ..................................................................................... 21
2.2.2 CLASSICAL THEORIES ON TAXATION ................................................................ 23
2.2.3 Keynesian Theory. ........................................................................................................ 26
2.3EMPIRICAL LITERATURE REVIEW .............................................................................. 28

vi
2.3.1 Income tax and economic performance ........................................................................ 28
2.4CONCEPTUAL FRAME WORK ....................................................................................... 35
CHAPTER THREE ...................................................................................................................... 36
RESEARCH METHODOLOGY.................................................................................................. 36
3.1 INTRODUCTION ............................................................................................................... 36
3.2 RESEARCH DESIGN ........................................................................................................ 36
3.3 POPULATION OF STUDY ............................................................................................... 37
3.4 DATA COLLECTION, SOURCES AND TYPES ............................................................. 37
3.5 DATA ANALYSIS ............................................................................................................. 37
CHAPTER FOUR ......................................................................................................................... 39
4.1 Introduction ......................................................................................................................... 39
4.2 Descriptive statistics ............................................................................................................ 39
4.3 Estimation............................................................................................................................ 41
CHAPTER FIVE .......................................................................................................................... 45
5.1 Introduction ......................................................................................................................... 45
5.2 Summary and Conclusions .................................................................................................. 45
5.3 Policy Implications and Recommendations ........................................................................ 46
5.4 Limitations of the Study ...................................................................................................... 47
5.5 Areas for Further Study ....................................................................................................... 47
References ..................................................................................................................................... 48

vii
List of abbreviation VAT= value added tax GDP = growth domestic performance AFCFTA= African Continental Free Trade Area EAC= East Africa country COMESA = common market for East Anf South Africa GST= goods and services tax

viii
ABSTRACT The purpose of this study was to investigate the casual relationship between income tax, Excise
duty, customs duty and VAT on economic performance. Correlation between taxation and
economic performance exist as the most important issue in economic since independence. The
level of taxation of taxation affects the level of country’s GDP, using regression model ( Y =a+
βx+ β1X1 + β2X2 + β3X3+ ᵦ4X4 + ẹ)
Where y=economic performance
X1=Total Income tax/GDP
X2=Total VAT/GDP
X3=Total Excise duty/GPD
X4= Total Custom Duty/GDP
e= GDP
We also use descriptive statistics to find mean and standard deviation for each variable.
In our view we find out that indirect tax increase consumption and reduce savings in Kenya. The
implication of this is that policy maker should focus more on enhancing international relation.
Income tax revenue has been increasing in recent years at a higher proportion than the other
taxes in Kenya, making it an important factor in economic decision making.

1
CHATPER ONE
INTRODUCTION
1.1 Background of the study Taxes are the most important source of government revenue for most countries in the world.
Taxation refers to imposition of compulsory levies on individuals or entities by government.
From income tax to goods and services tax (GST), taxation applies to all levels. Taxes are levied
in almost every country of the world, primarily to raise revenue for government expenditures,
although they serve other purposes as well (Ojede & Yamarik, 2012). Tax revenue account for
well over 75% of Kenya’s total revenue generation, and this clearly indicates that it is in tax that
the governments’ comparative advantage lies in terms of revenue generation capacity. Taxes
differ from other sources of revenue in that they are compulsory levies and are unrequited_ that
is, they are generally not paid in exchange for some specific thing, such as particular public
service, the sale of public property, or the issuance of public debt. Taxes are commonly
classified as either direct or indirect, an example of the former type being the income tax and f
the later the sales tax. Economic performance refers to economic growth, labor productivity and
welfare of the people (Khramov & Lee , 2013). Economic growth refers to increase in the
inflation adjusted market value of the goods and services produced by an economy over time.
Statisticians conventionally measure such growth as the percentage rate of increase in real gross
domestic product (real GDP). Notably, the performance of an economy is usually assessed in
terms of achievement of economic objectives. These objectives can be long term, such as
sustainable growth and development, or short term such as the stabilization of economy in
response to sudden and unpredictable events called economic shocks. An economy is performing
well when there is high economic growth, high productivity of factors of production, and

2
improved social welfare; Resources were allocated efficiently. GDP per capita can measure how
well an economy is performing. Kenyan GDP has been increasing steadily for the last five years
at an average growth rate of 6%. The economy is expected to continue growth by 5% in future
with many development objectives underway.
Taxation is related to economic growth of a country. The structure and financing of a tax are
critical to achieving economic growth. However, there has been an ongoing theoretical debate on
whether or not taxation stimulates growth. Since independence in Kenya, correlation between
taxation and economic growth has existed as the most important issue in economies. Notably, tax
is a compulsory payment that citizens of Kenya should pay to the authorities to allow the
government to provide public goods, deliver merit goods and services such as education and
healthcare, promote economic growth and broad based development, and to stabilize the
economy. As observed by Musgrave (1997), every country imposes taxes to citizens and
institutions with the aim of achieving long term objectives such as meeting development
activities and promoting economic growth. Tax and country output linkages do exist, and fiscal
authorities have relied on this to spur economic growth and development (Ojede & Yamarik,
2012). Both direct and indirect taxes have been used to realize this goal. The former forms the
backbone of this study. Although direct taxes have been in existence in Kenya since pre-
independence, there have been various reforms to improve productivity of various types of direct
taxes. Despite that direct tax revenue has a direct relation to economic growth; mixed thoughts
exist to this proposition. Some scholars argue that an objective to raise sufficient tax revenue will
bolster the much-needed economic growth and development. Contrary to this, some argue that
tax is a burden on their well-earned fortunes while to others; tax is seen as a necessary evil to
support the state and its activities. Depending on the side one is, this all depends on the benefit
3
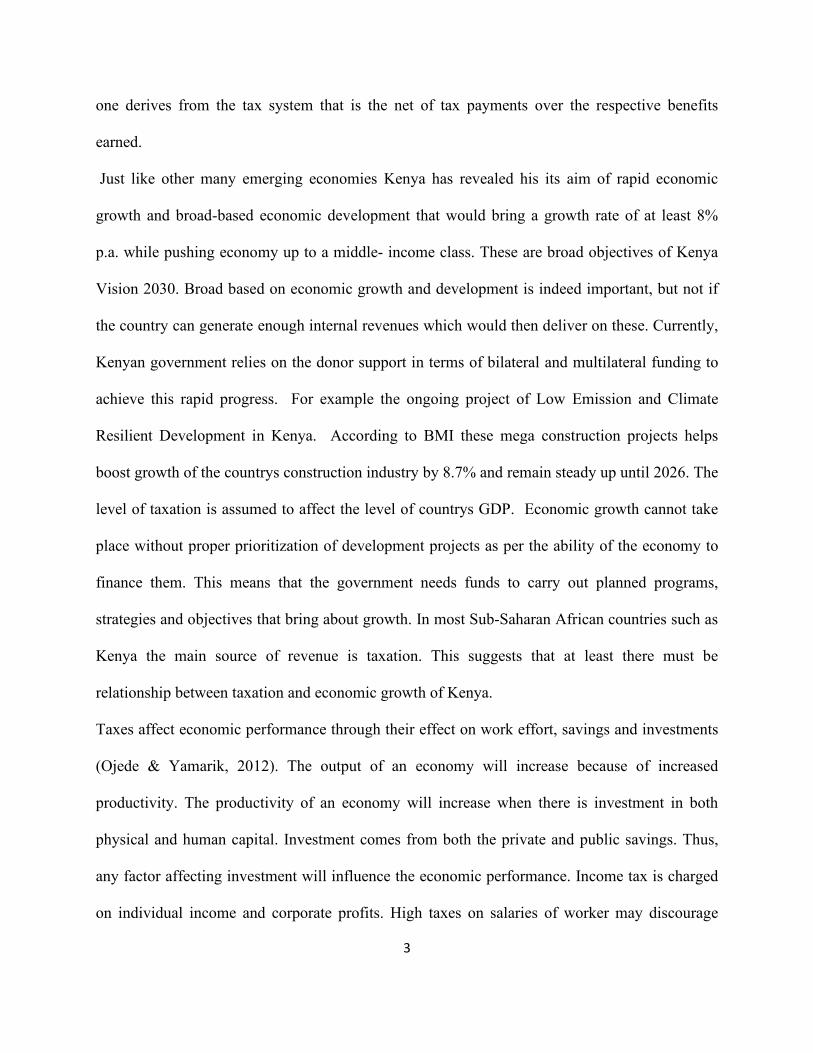
one derives from the tax system that is the net of tax payments over the respective benefits
earned.
Just like other many emerging economies Kenya has revealed his its aim of rapid economic
growth and broad-based economic development that would bring a growth rate of at least 8%
p.a. while pushing economy up to a middle- income class. These are broad objectives of Kenya
Vision 2030. Broad based on economic growth and development is indeed important, but not if
the country can generate enough internal revenues which would then deliver on these. Currently,
Kenyan government relies on the donor support in terms of bilateral and multilateral funding to
achieve this rapid progress. For example the ongoing project of Low Emission and Climate
Resilient Development in Kenya. According to BMI these mega construction projects helps
boost growth of the countrys construction industry by 8.7% and remain steady up until 2026. The
level of taxation is assumed to affect the level of countrys GDP. Economic growth cannot take
place without proper prioritization of development projects as per the ability of the economy to
finance them. This means that the government needs funds to carry out planned programs,
strategies and objectives that bring about growth. In most Sub-Saharan African countries such as
Kenya the main source of revenue is taxation. This suggests that at least there must be
relationship between taxation and economic growth of Kenya.
Taxes affect economic performance through their effect on work effort, savings and investments
(Ojede & Yamarik, 2012). The output of an economy will increase because of increased
productivity. The productivity of an economy will increase when there is investment in both
physical and human capital. Investment comes from both the private and public savings. Thus,
any factor affecting investment will influence the economic performance. Income tax is charged
on individual income and corporate profits. High taxes on salaries of worker may discourage

4
work effort and human capital formation. It is also likely to discourage private savings. High
taxes on profits discourage investments and entrepreneurial spirit hence reducing economic
output. Lower taxes on the other hand may encourage work effort, and increase savings and
investment hence improving overall productivity of the economy.
The motives of conducting this research will be to understand and provide insights of effects of
income tax to the economic growth in Kenya as well as economic growth for the last 10 years.
Today income tax contributes a large percentage of the total revenue in Kenya. On the other
hand, the economy of Kenya keeps on growing every day. Therefore, there is need to conduct a
broad research on income taxes and its effects on the economic growth. Desire to understand
more about income taxes and their effects towards economic performance forms the motive of
this study.
1.1.1Taxation Taxation refers to imposition of compulsory levies on individuals or entities by government to
raise revenue for government expenditure, although they serve other purposes as well. To
streamline the process of taxation and ensure transparency in the country, the state and the
central government have undertaken various policy reforms over the last two years (Ojede &
Yamarik, 2012). The tax structure is commonly composed of direct and indirect taxes. Direct
taxes are assumed to be paid by the factors that produce incomes whereas indirect taxes are
assumed to be paid by households that consume taxed items. Compared to the direct taxes,
indirect taxes contribute to a greater share of overall tax revenue. Direct taxes include; income
tax, capital gains while indirect taxes include value added tax, import duty and excise duty.
These taxes are the major measures of taxation in Kenya and they affect economic performance
as discussed below;

5
Income tax -was introduced in 1937 when the commercial and manufacturing sectors depicted
steady growths. Then in July 1941 two regulations were passed to tax excess profits in addition
to the 10% tax on company profits which was supposed to apply to every trade, business
profession etc. for whatever period of time it was carried out.
Income tax can be defined as a tax charged on all income of a person, for each of income
(income tax act 2010). Income tax forms part of direct tax that is imposed on both individual and
corporate bodies. It also covers corporation tax, pay as you earn etc. The general rate of
corporation tax is 30% for resident persons or while individual rates from as low as 10% and as
high as 30%. The position effects of tax rate cuts on the size of the economy arise because low
tax raise the after tax reward to working, saving and investing (Easterly et al 1992). It is worth
noting that the tax relief introduced by the government effective April 2020 for persons earning a
gross monthly income of up to KES 24,000 per month (currently the lowest tax band for
individuals), as a means of cushioning the low income earners from the impact of the COVID-19
crisis, continues to apply. Generally, income tax in Kenya is used for revenue mobilization and
income redistribution purposes. Income tax is used to achieve equity objectives through
rationalization of tax brackets and rates; in other words, tax brackets could be broadened or the
number of brackets increased and the tax rates could be increased or reduced depending on the
objective
According to Gordon (2005) Income tax policies can influence economic choices and tax rate
cuts will ultimately lead to a larger economy in the long run. While rate cuts would raise after-
tax return to working, saving, and investing, they would also raise the after-tax income people
receive from their current level of activities, which lessens their need to work, save and invest.

6
The first effect normally raises economic activity through the substitution effects while the
second effect normally reduces it through the income effects
Capital gains tax -It is mainly charged on gains upon disposal of capital properties such as
building and other investments. Its a form of direct tax that was initially introduced in 1920
during colonial times through legislation on scale of capital equipment used in business provided
that the sale price was more than the written down cost. It was re-introduced in 1975 and then
suspended in the year 1985 and then re-introduced in 2014.
Capital gains tax reductions are often proposed as a policy that will increase saving and
investment, provide a short term economic stimulus, and boost long-term economic performance.
Capital gains tax rate reductions appear to decrease public saving and may have little or no effect
on private saving.
Value added tax in Kenya -In Kenya, VAT is administered under the VAT act 2015 following
the repeal of the previous VAT act 2010 (cap 476) laws of Kenya. The act guides on how to
operate, administer, collect and enforce the tax. VAT forms part of consumption tax charged on
acquisition of taxation supplies which could either be in goods or services. The VAT rates in
Kenya is 16% being the standard rate in supply of goods and services in Kenya and 0% for the
export of goods and services.
An increase in VAT will inevitably impact on consumption and VAT compliance. The
combined effect will reduce the expected revenue. Beyond the revenue impact, there will be
other unintended consequences including: higher inflation, interest rate hike, more
unemployment and people will generally become poorer (Njogu, 2015). One can argue that the
objectives of introduction of VAT have been achieved since it eases on doing the business as the

7
tax is borne by the final consumer. Also, it has enabled the government to increase revenue
generation
Import duty -This is a tax imposed on goods imported or exported into or out of Kenya based
on pre-determined tariffs contained in the tariffs manual book. It includes any levy, duty etc.
This tax is currently being administered under the East African Community customs.
Import duty may affect the economic performance in that it raises the price of imported goods
and this increase is likely to reduce imports and increase the demand for domestic goods. Import
duty may also enable the domestic industries to have higher production costs and in turn higher
profits. The government of a developing economy will levy tariffs on imported goods on
industries in which it wants to foster growth and this increases the prices of imported goods and
creates a domestic market for domestically produced goods while protecting those industries
from being forced out by more competitive pricing.
Excise duty - forms part of an indirect tax charged on sale and production of specific goods or
services within a country. It is a consumption tax collected at the production point of goods or on
provision of services. Excise duty is a transactional tax in that there must be the occurrence of a
specific activity for it to accrue e.g. manufacture or sale of a good; and it is not related to
profitability. In Kenya, excise duty is imposed on both goods and services including beer &
spirits, soft drinks, cigars & cigarettes, polythene bags (of a particular specification) wine, cars
and mobile telephony services among others. It was administered under the Customs & Excise
Act 2010, however, effectively, 1 December 2015; the tax is administered under the Excise Duty
Act 2015.

8
Excise duty affects the profits and revenues that firms achieve; when governments levy extra or
increased taxes such as excise tax, the manufacturers are forced to raise their prices in order to
remain in business or continue making profit.
A gross effective tax rate for an economy is measured by dividing gross revenues from all levels
of government by gross domestic product (GDP). If the data is not available tax is estimated by
calculating the weighted average of all tax rates.
1.1.2 Kenya Economic performance Economic performance is usually accessed in terms of the achievement of economic objectives.
The objective can be long term such as sustainable growth and development or short term such
as stabilization of the economy in response to sudden and unpredictable events called economic
stocks (Khramov & Lee , 2013). To know how well an economy is performing against those
objectives, economists employ a wide range of economic indicators which measure macro-
economic variables that directly or indirectly economist to judge whether economic performance
has improved or deteriorated.
These indicators include; levels of real national income, output and spending. These are the key
variables that show whether an economy is performing or in recession. These indicators can also
be measured per head. Notably growth is determined by real national income, investment levies
and the relationship between capital investment and national output, level of savings and savings
ratio, price levels and inflation, and competitiveness of exports, levels and types of
unemployment. Besides, the productivity of labor influences other economic variables such as
economic competitiveness in international markets. Other indicators of economic performance
are; the purchasing power of Kenyans currency, debt levels with other countries and trade deficit
and surpluses with other countries (Khramov & Lee , 2013). An increasing GDP is often seen as

9
a measure of welfare and economic success. This indicator estimates the value added in a
country which is the total values of goods and services needed to produce them. It is common to
divide the indicator by country’s population to better gauge how productive and developed an
economy is.
Kenya GDP growth rate (2010-2020) Annual percentage growth rate of GDP at market prices is
based on constant local currency. Aggregates are based on constant 2010 U.S. dollars. GDP is
the sum of gross value added by all resident producers in the economy plus any product taxes
and minus any subsidies not included in the value of the products. It is calculated without
making deductions for depreciation of fabricated assets or for depletion and degradation of
natural resources.
Kenya GDP growth rate for 2019 was 5.37%, a 0.95% decline from 2018.
Kenya GDP growth rate for 2018 was 6.32%, a 1.51% increase from 2017.
Kenya GDP growth rate for 2017 was 4.81%, a 1.07% decline from 2016.
Kenya GDP growth rate for 2016 was 5.88%, a 0.16% increase from
Year GDP growth % Annual change
2019 5.37 % -0.95
2018 6.32 % 1.51
2017 4.81 % -1.07
2016 5.88 % 0.16
2015 5.72 % 0.36
2014 5.36 % -0.52
2013 5.88 % 1.32

10
2012 4.56 % -1.55
2011 6.11 % -2.30
2010 8.41 % 5.10
1.1.3Taxation and economic performance
The question of whether or not taxation stimulates growth has dominated theoretical and
empirical debate for a long period of time. Correlation between taxation and economic
performance exist as the most important issue in economics since independence. The level of
taxation affects the level of country’s GDP, theoretical link between this factors and economic
growth was not clearly established in the standard neoclassical models. Government has become
increasingly in recent years using taxes on consumption such as sales taxes and value added tax
to finance a larger share of their spending taking little attention to form and implement policies
that can wide base and expand international tax competition of different tax rate (Engen &
Skinner, 1996). This makes it more difficult for government to collect corporate and income
taxes from their citizens and a move from taxes on income to taxes on consumption would
improve economic efficiency and increase the rate of growth or improve competitiveness and
protect employment.
The choice of how much revenue to collect from taxes on consumption rather than taxes on
income can be described as a choice of balance between direct and indirect taxation. There are
significant differences in the design and economic effect of different taxes within the general
classes of “taxes on consumption” or “taxes on income”. Taxes on consumption are better for
growth than taxes on income. The main argument related to the way different taxes affect
savings and labor supply decisions. The different treatment of savings between the two types of

11
taxes is a key element: with taxes on income subjecting savings to heavier taxation than taxes on
consumption. Shift from taxes on income to taxes on consumption does not change total tax
revenue and can be expected to encourage savings leading to increased investments and thus
economic performance (Engen & Skinner, 1996). This arises because taxes on income include
both income that is saved and income from saving. Taxes on consumption exclude savings.
Kenyan Tax Regime Structure
In Kenya the taxes regime is comprised of four main tax heads; Income tax, VAT, Excise duty
and custom duty (McNabb & LeMay-Boucher, 2014). The regulations are governed by
independent legislators that govern the taxation system; the main legislator, the KRA has
different sections that deal with the above taxes while also having the authority to undertake
reviews on various companies and corporation with the main goal of limiting corruption as it a
problem in the developing nations such as Kenya.
Comparison of tax levels between Kenya and other countries
Based on OECD report on tax revenue statistics in Africa, the average African tax to GDP ratio
increased by 1.5 percentage points, from 15. 7 percent to 17.2 percent between 2008 and 2017.
This was mainly due to increase from value added taxes (VAT, 0.7 percentage points) and
individual income taxes (0.7 percentage points). The average ratio has plateaued at 17.2 percent
in 2015, as increase in some countries offset decrease in other countries. Tax -to -GDP Ratios
vary significantly among African countries. In 2017, Seychelles (31.5 percent), Tunisia
(31.2 percent), and South Africa (28.4 percent) had the highest tax-to-GDP ratios of the 26
countries covered. Nigeria (5.7 percent), Equatorial Guinea (5.9 percent), and the Democratic
Republic of the Congo (6.6 percent) had the lowest. Kenya between these periods has a tax to

12
GDP ratio of 18.2 percent above African average (17.2%) and below LAC average (22.8%). This
implies that Kenyan Tax-to-GDP is not bad as compared to other African countries

13

14
On average, African countries tax structure is relatively similar to that of LAC countries. Notable
differences are Africas relatively higher reliance on individual taxes and lower reliance on social
insurance taxes. The average OECD tax structure differs quite substantially from that of the
African average, as African countries tend to rely less on individual taxes, social insurance taxes,
and property taxes, and more on corporate taxes and consumption taxes.
Between 2008 and 2017, revenue sources have shifted to VAT (increase of 1.7 percentage points
of total taxes) and individual taxes (increase of 2.6 percentage points of total taxes). While the
share of individual taxes is still lower than the share of corporate taxes, corporate tax revenue has
declined by 1.2 percentage points of total tax revenue during the same time frame. Consumption
taxes other than VAT have declined by 3.4 percentage points of total revenues.
The decline in consumption taxes other than VAT in many African countries is partly due to
lower trade tax revenues. Trade liberalization across the region has led to reduced import tariffs,
a narrower base of goods and services subject to excise taxes, and the elimination of taxes on
exports, lowering overall trade tax revenues. The 2019 launch of the African Continental Free
Trade Area (AFCFTA) will further reduce tariffs and thus decrease trade tax revenues in the
short term. In the longer run, however, this decrease is expected to be offset by additional tax
revenues resulting from economic growth generated by closer integration. On average, non-tax
revenues accounted for 43 percent of the amount of collected tax revenues in 2017. Non-tax
revenue varied substantially among the countries covered, ranging from 18.7 percent of GDP in
Botswana to 0.5 percent of GDP in South Africa. In almost all countries, non-tax revenues were
lower than tax revenues.
Tax Structure in African Countries, 2017

15
Country Individual
Taxes
Corporate
Taxes
Social
Insurance
Taxes
Property
Taxes
Value-
Added
Taxes
(VAT)
Consumption
Taxes Other
than VAT
Other
Botswana 0.0% 0.0% 0.0% 0.3% 34.0% 4.4% 61.3%
Burkina Faso 7.4% 15.7% 9.9% 0.7% 36.9% 27.6% 1.9%
Cape Verde 20.2% 12.1% 0.2% 1.5% 36.3% 29.7% 0.0%
Cameroon 6.8% 13.2% 7.3% 1.1% 36.3% 26.5% 8.7%
Congo 23.4% 18.5% 0.0% 0.8% 29.3% 24.5% 3.4%
Côte dIvoire 0.3% 11.2% 11.5% 2.6% 20.0% 41.9% 12.6%
Democratic
Republic of
the Congo 17.2% 19.6% 7.5% 0.2% 29.5% 22.4% 3.5%
Egypt 9.6% 27.7% 15.0% 0.6% 21.1% 22.9% 3.0%
Equatorial
Guinea 11.6% 66.2% 0.0% 0.0% 12.4% 8.6% 1.1%
Eritrea 30.9% 17.9% 13.3% 2.3% 24.8% 10.7% 0.0%
Ghana 14.3% 17.2% 9.0% 0.0% 28.6% 30.1% 0.8%
Kenya 24.9% 12.9% 2.5% 0.7% 24.0% 27.9% 7.1%
Madagascar 11.1% 12.4% 3.5% 0.6% 48.1% 24.0% 0.4%
Mali 7.7% 16.5% 10.5% 2.2% 29.4% 29.3% 4.5%
Mauritania 12.5% 20.9% 2.0% 0.2% 31.8% 32.5% 0.1%

16
Country Individual
Taxes
Corporate
Taxes
Social
Insurance
Taxes
Property
Taxes
Value-
Added
Taxes
(VAT)
Consumption
Taxes Other
than VAT
Other
Mauritius 9.8% 14.7% 4.1% 5.5% 34.1% 29.5% 2.2%
Morocco 13.9% 17.6% 19.3% 5.7% 27.8% 14.6% 1.2%
Niger 8.9% 18.1% 6.1% 0.4% 30.9% 29.3% 6.3%
Nigeria 15.9% 44.9% 10.9% 0.0% 14.9% 12.6% 0.8%
Rwanda 22.9% 17.3% 6.2% 0.1% 28.9% 24.5% 0.0%
Senegal 15.5% 9.6% 7.2% 2.5% 34.8% 26.5% 3.9%
Seychelles 14.0% 21.2% 0.0% 1.4% 33.1% 30.4% 0.0%
South Africa 34.4% 16.2% 1.4% 5.6% 22.2% 16.5% 3.7%
Togo 7.0% 10.1% 0.0% 0.7% 43.3% 35.2% 3.7%
Tunisia 20.5% 7.7% 30.7% 1.0% 20.2% 16.4% 3.6%
Uganda 24.7% 6.1% 0.0% 0.0% 31.6% 33.2% 4.3%
Africa
Average 15.4% 18.6% 8.1% 1.6% 29.4% 24.3% 2.6%
LAC Average 9.5% 15.5% 16.9% 3.4% 27.9% 21.8% 4.9%
OECD
Average 23.9% 9.2% 26.2% 5.7% 20.2% 12.2% 2.7%

17
Tax burden- refers to the amount of tax borne by an individual or business. Tax burden vary
depending on a number of factors including income level, jurisdiction and current tax rates. It is
worth noting that tax burden may not be the same as the tax actually paid because of the
possibility of passing a tax on. It is helps to explain who has the legal liability of tax, that is
“statutory burden” and who actually bears the ultimate burden of the tax- who has the tax burden
i.e. bears the economic incidence of the tax.
1.2 Research problem Taxation has been identified as a major problem to the economic performance in most
developing countries but also developed countries (Burko and Jamal, 2004). For example in third
world countries, income taxes are direct analysis of employment income, rent income, pension
and investment taxation in general increases the cost of operating small and medium enterprises.
To compensate for the increased cost of operation, prices on goods are raised thus lowering the
amount of sales. The effects of reduced sales are lower profit, slow creation of employment thus
resulting to low economic performance (Thuronvi, 2009). At the same time effective taxation
reduces excessive reliance on aid and offers a pathway from unsustainable revenue streams for
economic performance, this leads to flourished economic growth.
In Kenya, the situation is not different and such as the government has been changing tax
structure where the existing one has not yielded the much targeted amount of tax revenue. This
ends up resulting in skewed economic performance. Due to the dynamic tax structure in Kenya,
there is lack of an optimum taxation model or structure for the government to rely upon when
considering taxation policy changes and also comparing taxation and performance of the
economy.
18
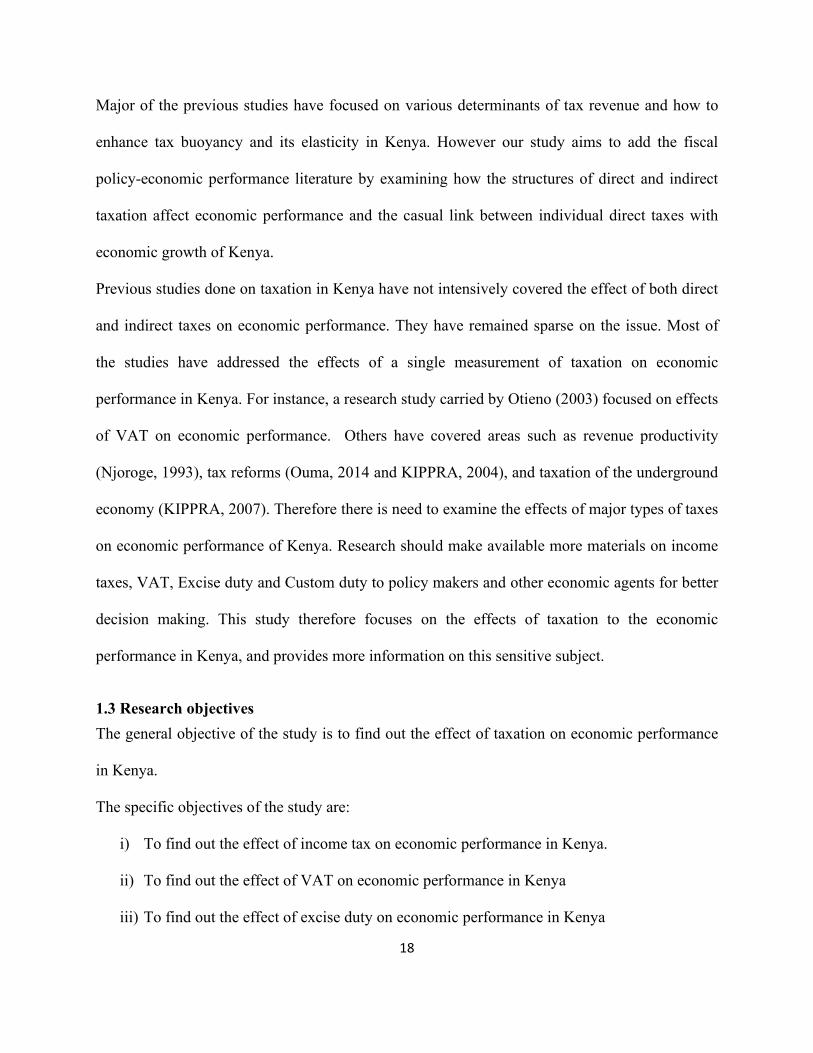
Major of the previous studies have focused on various determinants of tax revenue and how to
enhance tax buoyancy and its elasticity in Kenya. However our study aims to add the fiscal
policy-economic performance literature by examining how the structures of direct and indirect
taxation affect economic performance and the casual link between individual direct taxes with
economic growth of Kenya.
Previous studies done on taxation in Kenya have not intensively covered the effect of both direct
and indirect taxes on economic performance. They have remained sparse on the issue. Most of
the studies have addressed the effects of a single measurement of taxation on economic
performance in Kenya. For instance, a research study carried by Otieno (2003) focused on effects
of VAT on economic performance. Others have covered areas such as revenue productivity
(Njoroge, 1993), tax reforms (Ouma, 2014 and KIPPRA, 2004), and taxation of the underground
economy (KIPPRA, 2007). Therefore there is need to examine the effects of major types of taxes
on economic performance of Kenya. Research should make available more materials on income
taxes, VAT, Excise duty and Custom duty to policy makers and other economic agents for better
decision making. This study therefore focuses on the effects of taxation to the economic
performance in Kenya, and provides more information on this sensitive subject.
1.3 Research objectives The general objective of the study is to find out the effect of taxation on economic performance
in Kenya.
The specific objectives of the study are:
i) To find out the effect of income tax on economic performance in Kenya.
ii) To find out the effect of VAT on economic performance in Kenya
iii) To find out the effect of excise duty on economic performance in Kenya

19
iv) To find out the effect of Import duty on economic performance in Kenya
1.4 Research questions The research will be guided by the following questions;
i) Does income tax affect the economic performance in Kenya?
ii) Does VAT affect the economic performance in Kenya?
iii) Does Import duty affect the economic performance in Kenya?
iv) Does Excise duty affect the economic performance in Kenya?
1.5 Significance of the study Direct taxes and economic performance information is important to the government, tax
collection agencies such as Kenya revenue authority (KRA) and other organizations and so the
study provides the required information.
Secondly, citizens i.e. Accountants, will know how tax rules will impact their companies or
clients and how to work within those laws for the best benefit.
Thirdly, policy makers will benefit in analyzing the nature of relationship between the direct
taxes and economic performance.
Fourthly, other researchers would build on the findings on this study to carry further research in
same area to expound, improve, update or enrich the findings of this study.
Finally, the study will also add to the much needed economic literature on taxation and its
growth linkages.
1.6 Scope of the study The paper covers period of 10 years, starting from 2010 to 2020. The variables are measured at a
national level. The period carried is extensive and therefore more likely to give accurate results.

20
1.7 Organization of the paper The next chapter covers literature review that has been done on the topic; it gives theoretical and
empirical literature review followed by an overview of the same. Chapter Three gives the
conceptual framework and the methodology used to achieve the research objective. Chapter Four
gives the findings after running the regression model. Chapter five has the conclusion, policy
recommendations and suggests areas for future research.

21
CHAPTER TWO
LITERATURE REVIEW
2.1INTRODUCTION This chapter reviews literature on taxation, income tax and economic performance and attempts
to relate this study to available literature .It traces the theoretical development in economic
analysis of the relationship income taxes on economic performance in Kenya .It starts with the
theoretical then empirical literature and conceptual framework.
2.2THEORITICAL LITERATURE REVIEW
2.2.1 Supply-side Economic Theory Supply-side economics is a macroeconomic theory that postulates economic growth can be most
effectively fostered by lowering taxes and decreasing regulation (Lucas, 1990). According to
supply-side economics, consumers will benefit from greater supplies of goods and services at
lower prices, and employment will increase. Demand-side economics opposes this theory.
A basis of supply-side economics is the Laffer curve, a theoretical relationship between rates of
taxation and government revenue. The Laffer curve suggests that when the tax level is too high,
lower tax rates will boost government revenue through higher economic growth.
The term "supply-side economics" was thought for some time to have been coined by journalist
Jude Wanniski in 1975, but according to Robert D. Atkinson the term "supply side" was first
used in 1976 by Herbert Stein (a former economic adviser to President Richard Nixon) and only
later that year was this term repeated by Jude Wanniski. The term alludes to ideas of economists
Robert Mundell and Arthur Laffer.
Supply-side economics proposed that production or supply is the key to economic prosperity and
that consumption or demand is merely a secondary consequence (Lucas, 1990). Early on, this

22
idea had been summarized in Say's Law of economics, which states: "A product is no sooner
created, than it, from that instant, affords a market for other products to the full extent of its own
value." Supply-side economics rose in popularity among Republican Party politicians from 1977
onwards. Prior to 1977, Republicans were more split on tax reduction, with some worrying that
tax cuts would fuel inflation and exacerbate deficits.
In 1978, Jude Wanniski published The Way the World Works in which he laid out the central
thesis of supply-side economics and detailed the failure of high tax rate progressive income tax
systems and United States monetary policy under Richard Nixon and Jimmy Carter in the 1970s.
Wanniski advocated lower tax rates and a return to some kind of gold standard, similar to the
1944–1971 Bretton Woods System that Nixon abandoned.
The Laffer curve
T*
Tax
Revenue

23
Tax rate %
It is necessarily true, where tax revenue is positive, it must reach a maximum point (T*).to the
left of T*an increase in tax rate raises more revenue than is lost in offsetting worker and investor
behavior .Increase in rates past T*could cause people not work thereby reducing tax revenue .At
any tax rate to the right of T*,a reduction in tax rate will actually increase total revenue (Laffer ,
2004).The location of T* is dependent on worker and investor preference to work, technology
and other economic factors. Government would like to be at point T*because at this point it
collects maximum amount of tax revenue while people continue working hard. In the event the
tax rate is on the right side of T*, then lowering tax rate will stimulate the growth by increasing
the incentives to work and investments means at larger tax base. .
2.2.2 CLASSICAL THEORIES ON TAXATION Adam Smith was the first economicist to spell out the qualities of an optimal tax system. He
stated that the good tax system should posses the following qualities;
Canon of equity-this principle stipulate that people should pay tax in context with their ability
and not the same amount of tax that is those who earn income should pay higher taxes than those
of lower income in other word they should have a quality of taxes.
Canon of economy- the cost of collecting taxes should not exceed the amount of tax revenue
collected. This will not be economical similarly the tax payer should be left with sufficient fund
for investment and consumption after paying taxes. Every taxes would discourage consumption
and investment this will affect the economic adversely.
24
Canon of convenience- the time of paying the tax and the manner in which is paid should be
convenient to the tax payers for instance V.A.T is considered to be a convent tax because the tax
because the tax payer pays only when they have the means to buy on item.
Canon of certainty- the amount of tax to be paid by a tax payer should be certain about the
amount of the expected revenue this is important for planning purposes both for the government
business and individual.
Adam Smith theory on production -This theory is based on the principle of `Laissez —Faire`
which requires that the state should not impose any restriction on freedom of an individual. The
theory of economic development is based on pillars of saving, division of labor and wide extent
of market (Wood, 1993). Laissez principle allows producers to produce as much as they like,
earn as much as they can and save as much as they like .Adam smith believed that economy
should be propelled by invisible hand; forces of competition motivated by self-interest be
allowed to play their role in minimizing the volume of savings for development.
PRODUCTION FUNCTION; Adam Smith recognized three factors of production namely labor,
capital, and land. Y=f (K, L, N)
K=stock of capital
L=labor force
N=land
He emphasizes that labor is an important factor of production along with other factors.
Division of labor -Rate of economic growth is determined by the size of productive labor and
productivity of the labor. The productivity of labor depends upon technological progress of a
country and which in turn depends upon division of labor (Wood, 1993). Division of labor brings
increases workers efficiency as he can focus on his attention carefully.

25
Benefits of division of labor include; Increase of dexterity of workers, Saving time required to
produce a commodity and Invention of machines and equipment
Division of labor leads to exchange of goods which, in turn, promotes trade and widens the
extent of market .Wide extent of market is an essential pre-requisite for economic development.
Capital accumulation -It is the pivot around which the theory of economic development revolves
.According to Smith, ”any increase in capital stock in a country generally leads to more than
proportionate increase in output on account of continually growing division of labor .Adam
Smith stated that non capital goods refer to those which are useful directly and immediately to
their owner. Fixed capital refers to those goods which are directly used in production processes,
without changing hands (Wood, 1993). Classical economist also believed in existence of wage
fund. The idea is wages tend to equal to the amount necessary for the subsistence of laborers. If
total wages at any time become higher than subsistence level ,the labor force increases
,competition for employment become keener and wages come down to the subsistence level.
Adam Smith believed that under stationary conditions, wage rate falls to the subsistence level,
whereas in periods of rapid capital accumulation, they rise above this level. The extent to which
they rise depends on population growth .This can be concluded that wage fund could be raised
by increasing the rate of investment.
Agents of growth -Adam Smith observed that farmers, producers and businessmen are important
agents of economic growth. It was the free trade, enterprise and competition that led farmers,
producers and businessmen to expand the market and which, in turn, made the economic
development interrelated. Development of agriculture leads to increase in construction works and
commerce .when agricultural surplus arises as a result of economic development, the demand for
commercial services and manufactured articles arises (Wood, 1993).This leads to commercial

26
progress and establishment of manufacturing industries .On the other hand ,their development
leads to increase in agricultural production when farmers use advanced techniques .Thus ,capital
accumulation and economic development take place due to the emergence of the farmer, the
producer and the businessman.
Process of growth - The process of growth is cumulative. Division of labor made possible by
accumulation of capital and expansion of market, increase national income and output, which in
turn, facilitates saving and further investment and in this way, economic development rises
higher and higher.
Scarcity of natural resources stops the process of growth. A stationary economy is characterized
by unchanged population, constant total income, and subsistence wage, elimination of profit in
excess of the minimum consistent with the risk and absence of net investment (Wood, 1993). In
his opinion, an economy in stationary state finds itself at the highest level of prosperity with its
natural resources and environment.
The competition for employment reduces wage to subsistence level and competition among the
businessmen brings profits as low as possible. Investments also start declining and in this way,
the end result of capitalist is stationary. When this happens, capital accumulation stops,
population becomes stationary, profits are minimum, wages are at a subsistence level, there is no
change in per capita income and production and the economy reaches the state of stagnation.
2.2.3 Keynesian Theory. Keynesian Economics is considered a demand side theory that focuses on changes in the
economy over a short run. Keynes advocated for increased government expenditures and lower
taxes to stimulate demand and pull the global economy out of depression (Crotty, 1980).
Keynesian economics was used to refer to the concept that optimal economic performance could

27
be achieved and economic slumps prevented by influencing aggregate demand through activist
stabilization and economic intervention policies by the government. If aggregate demand in the
economy fell, the resulting weakness in production and jobs could precipitate a decline in prices
and wages. A lower level of inflation and wages would induce employers to make capital
investment sand employ more people, stimulating employment and restoring economic growth.
Poor business conditions may cause companies to reduce capital investment rather than take
advantage of lower prices to invest in new plants and equipment.
Keynesian Economics and the great Depression, other economist argued that in the wake of any
widespread downturn in the economy, business take advantage of low lower input prices in
pursuit of their own self-interest would return output and prices to a state of equilibrium (Crotty,
1980). Keynesian believed Great Depression to counter this theory, he believed that once
economic downturn sets in, for whatever reason, the fear and gloom that it engenders among
investors and business will tend to become self-fulfilling and can lead to a sustained period of
depressed economic activity and unemployment. Due to this reason Keynesian advocated a
countercyclical fiscal policy in which during periods of economic woe, the government should
undertake deficit spending to make up for decline in investment and boost customer spending in
order to stabilize aggregate demand .

28
2.3EMPIRICAL LITERATURE REVIEW
2.3.1 Income tax and economic performance Wanyagathi (2012) carried out a research to determine the relationship between income taxes
and economic growth. This study focused on trend and analysis, the relationship between income
tax and economic performance hence recommending income tax policy that will improve
economic performance in Kenya. The study depended heavily on secondary data .its sources
include statistical abstracts (Kenya Bureau Of Statistics), World Development Indicators from
the World bank database and data from Kenya Revenue Authority. Classical Linear Regression
Model is used .The researcher used a time series data .A number of test was conducted on the
model to check whether the model was correctly specified and reliable. The researcher ran a
regression with economic performance as the dependent variable and the independent variables
were income tax, foreign trade ,government consumption ,and population growth rate .Economic
performance was measured by the GDP per capita growth rate ,while income tax, consumption
tax, foreign trade, government consumption were measured as ratios of GDP. It was established
that, income tax has a negative effect on economic performance though this effect is not
significant. Government consumption was found to have a significant positive correlation with
economic performance. Population growth was found to have a positive effect on economic
performance though the effect wasn’t significant.
The regression was also fitted in VECM .Johasen cointergration test revealed presence of long
run relationship among the variables. In the VECM, it appears there is a long run relationship
among the variables used, but no significant relationship between income and GDP per capita
growth rate. Income tax influence economic performance negatively, but this relationship is
weak and not statistically significant .The VECM and OLS gave as similar result of a negative

29
correlation that was not significant .This means there is no significant relationship between
income tax and economic performance in Kenya.
Gachanja (2012) did a study on economic growth and taxes in Kenya, using time series data for
the period 1971-2010. The study reveals a positive relationship between the economic growth
and taxes. All the taxes (income tax, import duty, excise duty, sales tax and VAT) show a
positive correlation to GDP, with income tax having the highest effect. Gachanja (2012) also
tests for the direction of causation of the variables using Granger Causality test, and finds
reversal causality between economic growth and excise tax, and a unidirectional relationship
between income taxes and economic growth, and economic growth and VAT. Gachanja (2012)
points out that different uses of tax revenue affect growth differently. The model however fails to
capture variables other than taxes that influence GDP, such as government expenditure and
investment.
Carrying out a research study using a simple endogenous model to show the effect of income
taxes on growth, Wawire (1990), found that an increase in income tax by 10 percent causes a
drop in economic growth by 2 percent. High income taxes will lower the rate of return, which
reduce the rate of capital accumulation thus lowering long run growth rates. Furthermore, Engen
and Skinner (1992) using data for 107 countries for the period 1970-1985, find that fiscal policy
can be both good and bad for growth. The distortionary effects of taxes hurt economic growth,
while public goods and infrastructure promote economic development. Their empirical results
reveal a significant and negative impact of fiscal policy on output growth rates in the short-term
and the long-term. They also point out that taxes on labor income may impact output growth
differently from corporate, interest and trade taxes. The effect of labor tax on output growth
depends on labor supply elasticity in the short term; in the long run the effect is ambiguous.

30
Engen and Skinner (1996) have suggested that replacing the income tax with a consumption tax,
can increase work effort, savings and investment, thus boosting economic growth. They show
that increase in taxes rates in the US are accompanied by a decline in economic growth rate.
Their empirical estimation reveals a negative relationship between taxes and growth, which is
not very strong.
Rosen and others (2001) analyzed the personal income tax returns of a large number of sole
proprietors before and after the tax reforms act of 1986 and determined how the substantial
reductions in marginal tax rates associated with that law affected the growth of their firms as
measured by gross receipts. They found that individual income taxes exerted a statistically and
quantitatively significant influence on firm growth rates. The results showed that raising the sole
proprietors tax price by 10%, increased receipts by about 8.4%. This finding is consistent with
the view that raising income tax rates discourages growth of small businesses.
2.3.1 Excise duty and economic performance
Wachuka (2016) examined the impact of excise tax on the Kenya government revenues and
consumption of alcohol and/ or cigarettes and their consumption patterns using an empirical
cause and effect study design established no relationship between the consumption of alcohol
and cigarettes and excise tax changes; however, there was a linear relationship between excise
taxes and contribution to revenue for government. The study established that excise tax
increments do not affect consumption of cigarettes and alcohol, and that other methods should be
found to lower their consumption. The contributing factors to no changes in consumption are
because of the demand in-elasticity of cigarettes and alcohol to price changes (Wachuka, 2016).
The research is empirical and designed appropriately for the objectives and helps guide how this
research is undertaken and expected outcomes.

31
Okello, (2001) analyzed the excise taxation system in Kenya to establish the extent to which they
meet their intended objectives, which are to discourage and therefore reduce the consumption of
some products such as alcohol, promote equity, and raise government revenue. Using several
empirical equations and data, it was established that there was additional scope to generate extra
revenue for the government from excise duties. The study also established that the excise tax
system in Kenya as presently set (at that time) was effective for the purposes of raising revenues;
excise taxes on cigarettes in Kenya results in significant additional revenues for government and
its income elasticity is close to 1 (one); excise tax in general contributes to 4.5% of Kenya’s
GDP (Okello, 2001). The research design, equations, analytical methods and findings are done
professionally in the context of the study and provide a background to the impact of excise taxes
in Kenya for cigarettes and alcohol before the introduction of the excise taxes in 2010.
A research study by Mwiti (2006), showed that excise taxes on cigarettes are highly regressive
because the result is usually that instead of the low-income population quitting, they become
more burdened by higher cigarette prices. This effectively means that poor people use a larger
proportion of their incomes in paying tax than do the rich because excise taxes are usually shifted
by manufacturers to the consumer. The poor smoke much more than the rich, so they pay more
taxes when they keep smoking at the same rate when cigarette prices rise as a result of excise
taxes. In addition to price elasticity of demand, people respond differently to increases in taxes,
and therefore cigarette price increases; some cut back on their consumption, others do not change
their habits, while others may quit smoking all together due to rises in cigarette prices.
Governments use sin taxes to raise revenues, manage consumption, and promote public health.
For this research, manufacturers shift the burden of sin taxes to the consumers, sometimes by a
factor exceeding the sin tax rate to maintain, or in most cases, actually increase their profits.

32
2.3.3 Value Added Tax and economic performance
According to Wasylenko (2007) the rate of economic performance can be affected by policy
through the effect that taxation has upon economic decisions. An increase in taxation reduces the
returns to investment (in both physical and human capital) and research and development. Lower
returns mean less accumulation and innovation and hence a lower growth rate. This is the
negative aspect of taxation. Taxation however also has a positive aspect whereby, for instance,
some public expenditure can enhance productivity, such as the provision of infrastructure, public
education, and health care. Taxation provides the means to finance these expenditures and
indirectly can contribute to an increase in the growth rate. Value added tax is charged on the
supply of taxable goods or services made or provided in Kenya by a taxable person in the course
of or in furtherance of any business carried on by that person and on the importation of goods
and services in Kenya (VAT Act, Sec.2).
Wawire (2011) explored the determinants of Value added tax revenue and established that
growth elasticities for VAT were significant. The study findings showed that VAT revenues
respond with significant lags to variations in its determinants and that VAT revenues are
sensitive to unusual circumstances. This study concluded that Kenya’s VAT revenue is very
responsive to changes in its determinants especially international trade. Wawire used average
GDP to capture the fact that taxes are collected in a fiscal year (July to June) as opposed to a
calendar year which is the time period of GDP data.
Mbithi (2013) carried out a research on the factors that affect VAT productivity in Kenya.
The productivity was measured through an autoregressive model whereas the factors affecting
VAT productivity were sourced from both taxpayers and the tax administration by use of

33
questionnaires. It was found that VAT is responsive to changes in GDP, a contradiction with
previous studies done in Kenya. The research also showed that VAT was rigid to changes in
GDP upto the financial year 2004/2005 and the years that brought about the shift in
responsiveness were the last seven years running from 2005/06 to 2011/012.The study also found
that taxpayers faced challenging compliance costs and that there was a neglect of the medium
and small taxpayers because of the computational difficulties and lack of audit. From the above
KRA needs to shift focus from revenue collection to coming up with systems that are more
taxpayer oriented so as to enhance their compliance with VAT laws.
2.3.4 Custom Duty and Economic performance in Kenya
John (2018) carried out a research study to determine the effects of custom duty on economic
performance in Kenya. The research used correlation research design. In his study, he focused on
the performance of EPZ firms in Kenya only, thus a sample size of all 86 registered EPZ firms
was used. Primary data was obtained using questionnaires. Secondary data from the registered
firms was collected on; ROA, number and value of jobs and the length of stay of the firms. The
study used both descriptive and inferential statistics to conduct data analysis. The results of study
revealed that at 5% significance level, custom duty incentives had a significant relationship with
performance of EPZ firms measured using ROA. The results further revealed that at 5%
significance level, custom duty incentives were found to have a significant relationship with
performance of EPZ firms measured using the total number of workers in Kenya. The results
also revealed that at 5% significance level, custom duty incentives were found to have positive

34
and significant relationship with performance of EPZ firms measured using the number of years
in operation. Based on the study findings, the study recommended that the government should
offer increased excise duty incentives in order to cut down on imports and in that way promoting
the growth of demand for domestic products in the country. The government could pursue this
strategy in order to curb smuggling and also to promote the growth of the tourism industry. The
study further recommends that policy makers should adopt strategic incentive plans or targeted
incentive scheme that targets specific industry or a strategic tax incentive that add value or
contribute positively to the economy and are in line with the country’s vision 2030.
According to Owino (2019), the fiscal crisis occasioned by the international oil shock in early
1970s, motivated the Kenyan government to shift the tax policy towards greater reliance on
indirect taxes. Consequently, the level of revenue from custom and excise taxes has risen steadily
in the period 1973-2010; however, this was coupled with a persistent decline in economic
growth. Such significant increases in custom and excise tax revenue raise pertinent questions
about the effect they have had upon economic growth. Therefore, Owino (2019) carried a study
to analyze the effect of custom duty on economic growth in Kenya for the period 1973 to 2010.
This study is motivated by two developments. First, by the inconsistency in existing empirics and
secondly by the wide knowledge gap occasioned by the paucity of empirical literature on Kenya.
Therefore, this study attempts to reconcile the different positions and also close the knowledge
gap. The study adopted a correlation research design based on its ability determine the strength
and direction of relationships between variables while the theoretical framework was anchored
on endogenous growth model. The empirical results indicate that custom duty is positively
correlated with economic growth in Kenya.

35
2.4CONCEPTUAL FRAME WORK INDEPENDENT VARIABLE DEPENDENT VARIABLE
tttaxatabffhfegj WORK WORl
TAXATION Income tax(Gross income tax revenue/GDP Custom Duty (total custom duty revenue)/GDP Excise duty (total excise duty revenue/GDP VAT (total value added revenue/GDP
ECONOMIC PERFORMANCE
GDP

36
CHAPTER THREE
RESEARCH METHODOLOGY
3.1 INTRODUCTION This chapter provides the theoretical and methodological framework used to analyze the
relationship between income taxes and economic performance by giving ways in achieving
objectives of the study. The study utilizes economic theory and models to define this
relationship. This chapter lays out the research design, the type of data, the statistical methods
used and limitations of the study.
3.2 RESEARCH DESIGN Research design refers to an arrangement of conditions for collection and analysis of data in a
way that combines their relationship with the purpose of the research to the economy of state
(Leavy, 2017). It concerned about several considerations a researcher should think about and
adhere when carrying out a research problem. The choice of a research design is determined by
the research purpose categories of data needed, data sources and cost factors among others.
Research design adopted in this study is descriptive correlational research design. In descriptive
correlational research design the problem under investigation is structured; the aim being to
describe relationship among variables. This research design aims at examining the effect of
taxation on economic performance in Kenya and if there is any correlation between taxation and
economic performance in Kenya. Statistical analysis included pearson, t-test and multiple
regression analysis.
The reason why we've chosen descriptive correlational research design study is to provide
explanation and specify the nature of functional correlation between two or more variables. This
study identified effect of taxation on economic performance in Kenya.

37
3.3 POPULATION OF STUDY The research was a case study of Kenya. The study examined both indirect and direct taxes such
as VAT, Income tax, Import duty and Excise duty. The period for the study was from 2010 to
2020. The research involved different methods of collecting income tax, VAT, excise duty and
import duty as used by the Kenya Revenue Authority (KRA), to get an exact figure of income
tax every year. Furthermore, the study examined economic developments in Kenya within that
period. This provided a clear understanding of effects of tax revenue, especially income tax, to
economic growth in Kenya.
3.4 DATA COLLECTION, SOURCES AND TYPES For this research secondary data was used, secondary data is the data that has already been
collected through primary sources and made readily available for researchers to use for their
research purposes. These data were collected using document analysis approach which involves
a systematic procedure of analyzing documentary evidence. this documentary evidence is
obtained from various sources which include the Kenya National Bureau of Statics and Kenya
Revenue Authority. The reason why data was collected was to compare GDP of different year
and also compare taxation of different type.
3.5 DATA ANALYSIS Descriptive measures of control tendency using mean and standard deviation were used in data
analysis. Mean locate the centre of the relation frequency while standard deviation measures the
spread of a set of observations. GDP was taken as dependent variable while income tax, VAT,
excise duty and import duty were taken as independent variables. Also, during data analysis,
inferential statistic was used. Inferential statistic uses a random sample of data taken from a

38
population to describe and make inferences about population. Inferential statistics bring about
model to be used.
In our study the model that we use is regression model.
Y =a+ βx+ β1X1 + β2X2 + β3X3+ ᵦ4X4 + ẹ
Where y=economic performance
X1=Total Income tax/GDP
X2=Total VAT/GDP
X3=Total Excise duty/GPD
X4= Total Custom Duty/
39
CHAPTER FOUR
4.1 Introduction This chapter presents an analysis of the data. The chapter presents descriptive statistics of the
data, report on regression results as well as hypothesis testing. The analysis dwells on the
assessment of the link that exists between Income Tax, VAT, Excise Duty, Custom Duty and
economic growth.
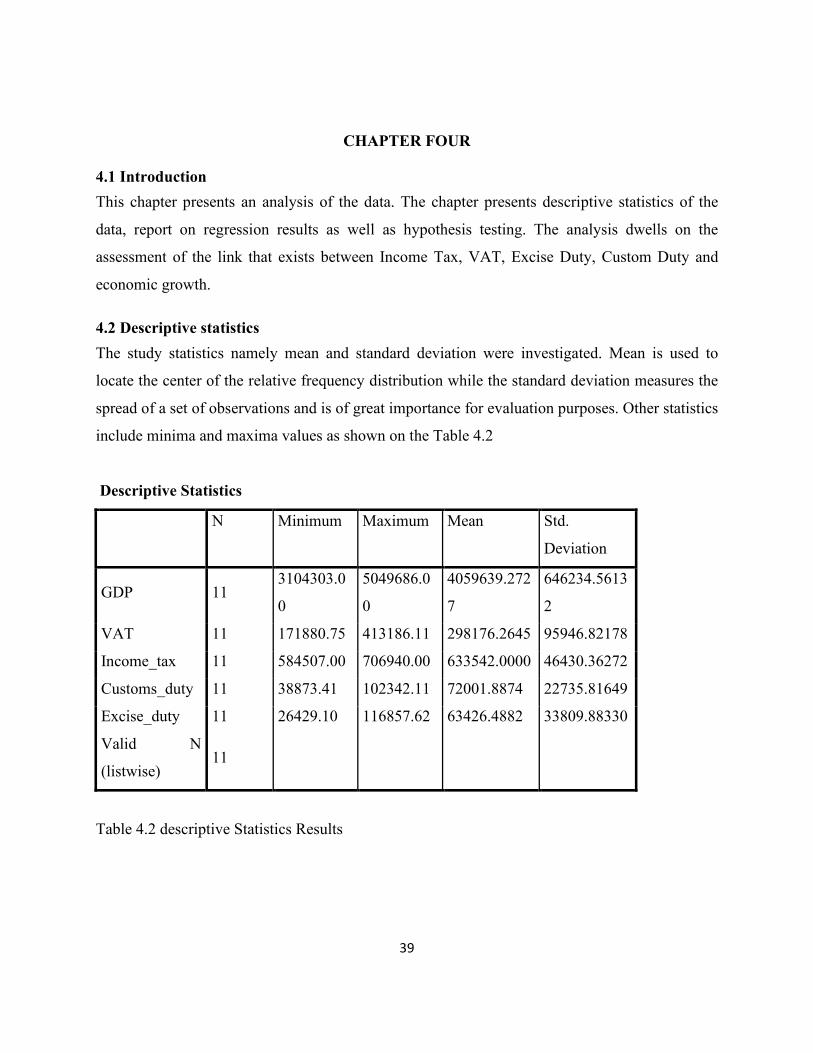
4.2 Descriptive statistics The study statistics namely mean and standard deviation were investigated. Mean is used to
locate the center of the relative frequency distribution while the standard deviation measures the
spread of a set of observations and is of great importance for evaluation purposes. Other statistics
include minima and maxima values as shown on the Table 4.2
Descriptive Statistics
N Minimum Maximum Mean Std.
Deviation
GDP 11 3104303.0
0
5049686.0
0
4059639.272
7
646234.5613
2
VAT 11 171880.75 413186.11 298176.2645 95946.82178
Income_tax 11 584507.00 706940.00 633542.0000 46430.36272
Customs_duty 11 38873.41 102342.11 72001.8874 22735.81649
Excise_duty 11 26429.10 116857.62 63426.4882 33809.88330
Valid N
(listwise) 11
Table 4.2 descriptive Statistics Results

40
The total observations considered in this study were 11 with five variables (one dependent and
four independent variables). GDP is the dependent variable and the independent variables are;
Value Added Tax (VAT), Income Tax, Custom Duty and Excise Duty.
From table 4.2, it is clear that there is high spread of data among variables. From its nature it was
so anticipated since time series data especially those, which aggregates follows a random or
stochastic process. The GDP had an average of 4059639.2727, the least value of 3104303, the
maximum value of 5049686 and standard deviation of 646234.56132. VAT had an average value
of 298176.2645, the least value of 171880.75, the maximum value of 413186.11 and standard
deviation of 95946.82178. Income Tax had an average value of 633542, the least value of
584507, the maximum value of 706940 and standard deviation of 46430.36272. Custom Duty
had ana average of 72001.8874, the least value of 38873.41, the maximum value of 102342.11
and standard deviation of 22735.81649. Excise Duty had the average value of 63426.4882, the
least value of 26429.10, the maximum value of 63426.4882 and standard deviation of
33809.88330. All these values are in Kenyan Million Pounds.
From table 4.2, data for GDP was widely spread than other variables 646234.56132 Kenyan
Million Pounds. It also has large mean indication of the fact that the economy of Kenya has
grown rapidly over the past ten years. Among the independent variables, data for VAT was
widely spread than other variables 95946.82178 Kenyan million pounds. This is due to
fluctuations in the manufacture of taxable goods and services caused by the unfavourable
conditions in the economy such as corruption, politics among others. Besides it is caused by
excessive VAT refunds to the registered Traders. Income Tax has a large value of the mean
because of the large population of the tax payers. This has been contributed by the growth of
population for the last 10 years. The large mean in the Income Tax indicate that the economy
revolve around income tax. The range of the data that is the difference between the maximum
value and minimum value was huge gap which demonstrates different economic conditions that
the Kenyan economy have been going through within the period of this study.

41
4.3 Estimation
Correlations
GDP VAT Income_tax Customs_duty Excise_duty
Pearson
Correlation
GDP 1.000 .980 .943 .983 .966
VAT .980 1.000 .945 .990 .950
Income_tax .943 .945 1.000 .969 .970
Customs_dut
y .983 .990 .969 1.000 .970
Excise_duty .966 .950 .970 .970 1.000
Sig. (1-tailed)
GDP . .000 .000 .000 .000
VAT .000 . .000 .000 .000
Income_tax .000 .000 . .000 .000
Customs_dut
y .000 .000 .000 . .000
Excise_duty .000 .000 .000 .000 .
N
GDP 11 11 11 11 11
VAT 11 11 11 11 11
Income_tax 11 11 11 11 11
Customs_dut
y 11 11 11 11 11
Excise_duty 11 11 11 11 11
Table 4.3.1 Correlation

42
Model Summary
Model R R
Square
Adjusted
R Square
Std. Error of
the Estimate
Change Statistics
R Square
Change
F
Change
df1 df2 Sig. F
Change
1 .988a .976 .961 127971.13685 .976 62.252 4 6 .000
Table 4.3.2 Model Summary
a. Predictors: (Constant), Excise_duty, VAT, Income_tax, Customs_duty
ANOVAa
Model Sum of
Squares
df Mean Square F Sig.
1
Regression 4077931411
281.750 4
1019482852
820.438 62.252 .000b
Residual 9825967119
8.432 6
1637661186
6.405
Total 4176191082
480.182 10
Table 4.3.3 ANOVA
a. Dependent Variable: GDP
b. Predictors: (Constant), Excise_duty, VAT, Income_tax, Customs_duty

43
Coefficientsa
Model Unstandardized
Coefficients
Standardized
Coefficients
t Sig.
B Std. Error Beta
1
(Constant) 4234237.57
3
2205310.59
1
1.920 .103
VAT 2.426 3.237 .360 .750 .482
Income_tax -3.783 4.259 -.272 -.888 .409
Customs_dut
y 13.787 18.837 .485 .732 .492
Excise_duty 7.974 5.684 .417 1.403 .210
Table 4.3.4 Coefficients
a. Dependent Variable: GDP
The coefficient shows that the impact of income tax is not significant at 5% significance level
because the p value is 0.409 which is above 0.05.it has a t value of - 0.888 which means there is
negative relationship between income tax and economic performance in kenya. The results show
that an increase proxed by GDP by - 0.272 Kenyan million. This phenomenon indicates that the
increase in income tax on business may be harmful to the economy in the long run. The Kenya
Revenue Authority should exercise due care in levying income tax and levy income tax that
doesn't act as an incentive to doing business. The results are different from what was predicted in
Chapter Three. We expected an adverse significant relationship between the main variables
(Poulson and Kaplan, 2008, Lee and Gordon, 2005). From the literature, income tax reduces
capital formation and productivity hence adversely affecting the economy (Musgrave and
Musgrave, 1989). The results of a non-significant negative relationship between income tax and
economic performance can be attributed to how the economic performance was measured.
Different studies measure variables differently. This study chose to measure economic
performance through GDP per capita growth rate, different from most studies which have used

44
GDP (Gachanja, 2012),, GDP per capita (Goode, 1984), and GDP growth rate (Engen and
Skinner, 1996) among others. The findings of weak negative correlation between income tax and
economic performance concur with those of a few other studies ( Manas-Anton ,1986; Easterly
and Rebelo,1993a). Easterly and Rebelo (1993a) attribute the weak correlation to the fact that it
is difficult to isolate the effect of tax policy on growth. The results are similar to those of
Harbeger (1964) who concluded that tax policy is not strong enough to influence performance
For VAT, Excise Duty and Custom Duty, the relationship with GDP is positive (.360 ,.480,
.417) respectively. For this it is going to favour the economic performance.
Fig 1: Relationship between GDP, Excise Duty, Income Tax, Custom Duty and VAT

45
CHAPTER FIVE
5.1 Introduction This chapter presents a summary of the study and policy recommendation based on the findings
of the study. The chapter is comprised of four sections namely, summary and conclusions of the
study, policy implications and recommendations, limitations of the study and recommendation of
areas for future research.
5.2 Summary and Conclusions Tax revenue is important for any country since it enables the country’s government to cater for
the welfare of her people. In addition, a country that mobilizes adequate tax revenue reduces her
budget deficit which translates into reduced external borrowing. Reduced external borrowing is
good for economic growth since the amount of country’s revenue which could be used in paying
the external debt can be employed in other productive sectors of the economy. This in turn will
assist the country to reduce the level of unemployment as well as attracting foreign direct
investment. Higher tax revenue occurs as a result of high tax rates and a large tax base. However,
according to Laffer curve, tax revenue increases as tax rates increase up to a certain level beyond
which it starts to decline. Kenya has embraced many tax reforms in indirect taxes for instance,
moving from sales tax to VAT. However, these reforms are not based on a robust analysis of the
effect of each form of tax on Kenya’s economic growth. This is because understanding of the
weight each tax head on country’s economic growth will guide the tax policy makers on where to
focus much. Based on this, study sought to investigate the effect of each of the tax head on
Kenya’s economic growth for the period running from 2010 to 2020. We made a careful
selection of the control variables in addition to income tax, VAT, Excise Duty and custom duty
as guided by empirical studies in this line of study. For example income tax have negative effect
on economic performance. The objective was achieved by running a regression with economic
performance as the dependent variable and the independent variables were income tax,,.
Economic performance was measured by the GDP per capita growth rate, while income tax were
measured as ratios of GDP. From the results, income tax has a ngative effect on economic
performance. For VAT, Custom Duty and Excise Duty they have positive effect on economic
performance.

46
The income tax ratio to total revenue has been increasing at a higher rate compared to other taxes
. The regression results show a negative effect of income taxes on the Kenyan economy, though
not significant. VAT, Excise Duty and custom duty has a positive effect on the economy that is
not one significant. Taxes are an important element of the economy, and governments cannot run
without them. This study however, shows that the effect of taxes on the economy.
Foreign trade and population growth rate are not significant determinants of the how well the
economy is doing. Government consumption was the only variable with a significant positive
effect on economic performance. This was attributed to the fact that, expenditure by government
on public investment increases productivity and leads to improved economic performance.
Government spending also has a multiplier effect on the national income, thereby improving
economic performance. The Kenyan government has been investing heavily in infrastructure
such as construction of roads and rail transport. This is likely to help improve the economic
performance of the country.
5.3 Policy Implications and Recommendations The findings of this study have important policy implication for economic growth in Kenya. The
study has revealed presence of long run relationship between income taxes, excise duty, customs
duty and VAT on Kenya’s economic growth as measured by GDP. Based on the study findings,
the government of Kenya, when considering change of a tax ,
The government should expand the tax bracket of Income Tax in order collect more revenue for
funding its expenditure instead of borrowing. This is because Income Tax positively impacts
economic growth. Minimal borrowing encourages economic growth because huge debts can
signal the possibility of a fiscal crisis and future economic policy reversals hence discouraging
foreign direct investment inflows. ly, a combination of both fiscal and monetary policies aimed
at raising the aggregate .demand such as narrowing of tax base or increasing government
expenditure should be pursued. For example a narrow tax base for corporate Income Tax attracts
both foreign and local investment which leads to creation of employment. This leads to increased
Personal Income taxation because more people would be employed. This will lead to higher
absorption of readily available skilled and semi-skilled labour, besides creating a platform for
quality labour fermentation via adequate and quality education, and relevant training In addition,

47
the government should enter into trade agreements which favour free trade as opposed to
protectionism. With less controls put in place the degree of openness of the economy to
international trade will increase hence more foreign capital inflows. This will attract more
corporate taxation that contributes to economic growth as corporate Income Tax positively
impact economic growth.
Additionally, indirect taxes such as VAT and excise duty should be streamlined to make them
progress such that they are applied discriminatively in that goods and services used by affluent
segments of the population attract relatively higher taxes. Also international trade as represented
by net exports has a positive correlation with economic growth. To improve cross-border trade,
prohibitive restrictions such as high tariffs and general control over mobility of resources would
have to be removed. In view of this, the Government must fully and actively participate in the
regional economic blocks such as COMESA and EAC.
5.4 Limitations of the Study A major limitation of the study is the problem of data reliability. Different data sources give
different data for the same variable.
5.5 Areas for Further Study Future researchers ought to investigate the effect of omitted variables on economic growth. For
instance, there is need to investigate the effect of tax evasion and avoidance, tax compliance
levels and tax literacy on economic growth.

48
References Croilty (1980)Incicase Govt Explanation and Lower Taxes to Stimulate Demand and Pull
the Global Economy Out of Depression.
Crotty, J. R. (1980). Post-Keynesian economic theory: An overview and evaluation. The
American Economic Review, 70(2), 20-25.
Customs And Exercise Duty Act 2010
Easterly, W. R., Rebelo, S., & Mundial, B. (1992). Marginal income tax rates and
economic growth in developing countries (Vol. 1050). Country Economics Department, World
Bank. Lee, Y., & Gordon, R. H. (2005). Tax structure and economic growth. Journal of
public economics, 89(5-6), 1027-1043.
Engen, E. M., & Skinner, J. (1996). Taxation and economic growth (No. w5826).
National Bureau of Economic Research.
Engon &Skinner, (1996)-Saving Lead to Increased Investment.
Gale, W. G., & Samwick, A. A. (2014). Effects of income tax changes on economic
growth.EconomicStudies,https://www.brookings.edu/wpcontent/uploads/2016/06/09_Effects_Inc
ome_Tax_Changes_Economic_Growth_Gale_Sa mwick. pdf.
Gastely El Al (1992), Size of The Economy Arise Because Low Tax Raise the Effect Tax
Rewaed Working.
Gochanjo(2012) Economic Growth And Taxes.
Gordon (2005), Income Tax Policies Can Influence Economic Choices and Enforcement
of The Tax Rase
John (2018) Motivated the Kenyan Govt to Shift the Tax Policy Towards Greater Income
on Indirect Tax Carried a Study to Analyze the Effect of Custom Duty Bon Economic Growth in
Kenya for The Period 1973 To 2010.

49
John. (2018). The Effect of Custom Duty on Economic Performance in Kenya.
Kenya Bureau of Statistics
Khramour &Lee (2013), The Objective Can Be Long Term Such as Sustentation Growth
and Development or Short Term Such Stabilization of The Economy.
Khramov, M. V., & Lee, M. J. R. (2013). The Economic Performance Index (EPI): an
intuitive indicator for assessing a country's economic performance dynamics in an historical
perspective. International Monetary Fund.
Laffer, A. B. (2004). The Laffer curve: Past, present, and future. Backgrounder, 1765(1),
1-16.
Leavy (2017) Research Design
Leavy, P. (2017). Research design: Quantitative, qualitative, mixed methods, arts-based,
and community-based participatory research approaches.
Lucas ,1990
Lucas Jr, R. E. (1990). Supply-side economics: An analytical review. Oxford economic
papers, 42(2), 293-316.
Manans ,Anton(1986)Castery And Rebelo(1993) Correltion Between Variative.
Mbithi (2013) Factors That Affect VAT
Mcabb & Lemay-Boucher (2014) Tax Regime is Compromised of Income Tax, VAT,
Excise Duty and Custom Duty.
McNabb, K., & LeMay-Boucher, P. (2014). Tax structures, economic growth and
development.
Mesgrur (1997), Every Country Impose Tax to Its Citizens.

50
Musgrave, R. A. (1997). Reconsidering the fiscal role of government. The American
economic review, 87(2), 156-159.
Mwiti (2006) Excise Taxes on Cigarettes.
Njogu (2015) High Inflation, Interest Rate Hike, More Unemployment and People Will
Generally Become Poorer.
Njogu, L. K. (2015). The effect of value added tax on economic growth in Kenya.
International Academic Journal of Economics and Finance, 1(5), 10-30.
Njoroge (1993)-Tax Reforms
Ojede, A., & Yamarik, S. (2012). Tax policy and state economic growth: The long-run
and short-run of it. Economics Letters, 116(2), 161-165.
Okello, (2001) Analyzed the Excise Taxation System.
Otieno (2003)Effect of VAT On Economic Performance .
Ouma (2014) And Kipra(2004) And Kippra(2004) Taxastion Of The Undegrounds Economy
(KIPPRA,2007)
Owino (2019).The Effect of Custom and Excise Duties On Economic Growth in Kenya
Department of Economics, School of Business and Economics. University of Kabianga
Povison &Kaplan 2008 Lee and Cordon (2005) Relationship Between Variative.
Rosen And Others (2001) Analyze the Personal Income Tax
VAT Act 2010(Cap 476) Laws of Kenya, Operation ,Administration ,Collection And
Enforcement Of The Tax.
VAT,Act Sec 2
Wachoka (2016) Impact of Excise Duty on Economic Performance.

51
Wanyagothi (2012) Determine the Relationship Between Income Tax and Economic
Growth.
Wasylenleo (2007), The Rate of Economic Performance Can Be Attacked by Policy
Through the Effect That Taxation Has Upon Economic Decision.
Wawire (1990) Using Simple Endogenous Model to Show the Effect of Income Taxes on
Growth.
Wawire (2011) Explored the Determinant of VAT Revenue
Wood ,(1993)-Economic Development Is Based on Pillas of Savings ,Division of Labour
And Wide Extent of Market.
Wood, J. C. (Ed.). (1993). Adam Smith: critical assessments (Vol. 3). Taylor & Francis.
Copyright © 2022 FDOKUMEN