Preparation and characterization of porous silica templated by a nonionic fluorinated systems
Upload
teknologimalaysiaCategory
view
2download
0
P L A T F O R M
VO
LUM
E TW
O N
UM
BER
ON
E JA
NU
AR
Y - J
UN
E 2
001
VOLUME TWO NUMBER ONE JANUARY - JUNE 2001
Review of Global Positioning System (GPS)
Selective Availability (SA) And Its Benefits
by Dr Abdul Nasir Matori
Assessing Students’ Performance In Engineering Mathematics:
An Experience In Universiti Teknologi PETRONAS
by Afza Shafie and Wan Fatimah Wan Ahmad
Optimization Of Learning Methods For Face Recognition
Using Multilayer Perceptrons
by Dr M H Ahmad Fadzil Dr D J Evans and Dr Z Zainuddin
An Emissions And Power Comparison Of Port And Direct Injection
Bi-Fuel (Gasoline and Compressed Natural Gas) Engines
by Elizabeth Durell, Dr Don Law and Dr Jeff Allen
Controlled Auto-Ignition (CAI) Using
A Fully Variable Valve Train (FVVT)
by Dr Don Law, Dan Kemp, Dr Jeff Allen and Dr Simon Wood
Effect Of Solvents On Radiation-Induced Grafting
Of Styrene Onto Fluorinated Polymer Films
by Mohamed Mahmoud Nasef
Exergy Lost As A Decision Making Criteria In
The Selection Of Utility Design Options
by M Shuhaimi, A R Razali and A Ismail
Catalytic Removal Of Volatile Organic Compounds (VOC)
by Dr Noor Asmawati Mohd Zabidi, Chuah Won Ching
and Ng Siew Kiam
A Single Cylinder Optical Access Engine For
Combustion Analysis Using Laser Based Diagnostics
by Peter Williams, Graham Pitcher, Dr Don Law,
Dr Jeff Allen, Dr Simon Wood and Dr Graham Wigley
Application Of Fracture Surface Analysis In Dispersion Studies
Of A Particulate Filler In An Elastomer During Mixing
by Dr Puteri S M Megat-Yusoff
Volume 2 Number 1 Jan - Jun 2001
2
7
14
21
26
34
45
49
53
58

NOTES FOR CONTRIBUTORS
Instructions to Authors
Authors of articles that fit the aims,scopes and policies of this journal areinvited to submit soft and hard copiesto the editor. Paper should be writtenin English. Authors are encouragedto obtain assistance in the writing andediting of their papers prior tosubmission. For papers presented orpublished elsewhere, also include thedetails of the conference or seminar.
Manuscript should be prepared inaccordance with the following:1. The text should be preceded by
a short abstract of 50-100 wordsand four or so keywords.
2. The manuscript must be typedon one side of the paper, double-spaced throughout with widemargins not exceeding 3,500words although exceptions willbe made.
3. Figures and tables have to belabelled and should be includedin the text. Authors are advisedto refer to recent issues of thejournals to obtain the format forreferences.
4. Footnotes should be kept to aminimum and be as brief aspossible; they must benumbered consecutively.
5. Special care should be given tothe preparation of the drawingsfor the figures and diagrams.Except for a reduction in size,they will appear in the finalprinting in exactly the sameform as submitted by the author.
6. Reference should be indicatedby the authors’ last names andyear of publications.
Publisher
Universiti Teknologi PETRONAS
Bandar Seri Iskandar
31750 Tronoh
Perak Darul Ridzuan
MALAYSIA
Univers i t i Teknologi Petronas • http://www.utp.edu.my
1PLATFORM • Volume 2 Number 1 • January – June 2001
PlatformPlatformContentsAdvisors
Dr Rosti Saruwono
Ir Dr Ahmad Fadzil Mohamad Hani
Editor-in-Chief
Dr Puteri Sri Melor Megat Yusoff
Co-Editors
Suziah Sulaiman
Zulqarnain Abu Bakar
Yap Vooi Voon
Editorial Board
Dr Mohammed Halib
Dr Abas Md Said
Dr Mohamed Ibrahim Abdul Mutalib
Dr Abd Rashid Abd Aziz
Dr Mohd Noh Karsiti
Ir Dr Ibrahim Kamaruddin
Dr Nasiman Sapari
Dr Azmi Mohd Shariff
Azrai Abdullah
Address
Editor-in-Chief
PLATFORM
Universiti Teknologi PETRONAS
Bandar Seri Iskandar
31750 Tronoh
Perak Darul Ridzuan
Malaysia
ht tp: / /www.utp .edu.my
puter [email protected]
Telephone +(60)5 367 8018
+(60)5 367 8019
+(60)5 367 8055
Facsimile +(60)5 367 8252
PLATFORM is a biannual, peer-reviewed journal of Universiti Teknologi PETRONAS. It serves
as a medium for faculty members, students and industry professionals to share their
knowledge, views, experiences and discoveries in their areas of interest and expertise.
It comprises as collection of, but not limited to, papers presented by the academic staff
of the university at various local and international conferences, conventions and seminars.
The entries range from opinions and views on engineering, technology and social issues
to deliberations on the progress and outcomes of academic research.
Opinions expressed in this journal need not necessarily reflect the official views of the
university.
All materials is copyright of Universiti Teknologi PETRONAS. Reproduction in whole or in
part is not permitted without the written permission of the publisher.
I S S N 1 5 1 1 - 6 7 9 4
Review of Global Positioning System (GPS) Selective Availability
(SA) And Its Benefits by Dr Abdul Nasir Matori
Assessing Students’ Performance In Engineering Mathematics:
An Experience In Universiti Teknologi PETRONAS
by Afza Shafie and Wan Fatimah Wan Ahmad
Optimization Of Learning Methods For Face Recognition Using
Multilayer Perceptrons by Dr M H Ahmad Fadzil, Dr D J Evansand Dr Z Zainuddin
An Emissions And Power Comparison Of Port And Direct
Injection Bi-Fuel (Gasoline and Compressed Natural Gas)
Engines by Elizabeth Durell, Dr Don Law and Dr Jeff Allen
Controlled Auto-Ignition (CAI) Using A Fully Variable Valve Train
(FVVT) by Dr Don Law, Dan Kemp, Dr Jeff Allen and Dr Simon Wood
Effect Of Solvents On Radiation-Induced Grafting Of Styrene
Onto Fluorinated Polymer Films by Dr Mohamed Mahmoud Nasef
Exergy Lost As A Decision Making Criteria In The Selection Of
Utility Design Options by M Shuhaimi, A R Razali and A Ismail
Catalytic Removal Of Volatile Organic Compounds (VOC)
by Dr Noor Asmawati Mohd Zabidi, Chuah Won Ching and Ng Siew Kiam
A Single Cylinder Optical Access Engine For Combustion
Analysis Using Laser Based Diagnostics by Peter Williams, GrahamPitcher, Dr Don Law, Dr Jeff Allen, Dr Simon Wood and Dr Graham Wigley
Application Of Fracture Surface Analysis In Dispersion Studies
Of A Particulate Filler In An Elastomer During Mixing
by Dr Puteri S M Megat-Yusoff
2
7
14
21
26
34
45
49
53
58
PLATFORM • Volume 2 Number 1 • January – June 2001
2 Univers i t i Teknologi Petronas • http://www.utp.edu.my
INTRODUCTION
Superior positioning accuracydemonstrated by GPS StandardPositioning Service (SPS)1 test raisedsome concerns for the GPS operatorover its use by the parties adversarialto the US Government and her allies.Tests on GPS SPS have shown thatthe intended civilian positioningaccuracy was 300% better than whatit was planned. The mortar attack on10 Downing Street sometime in 1988could well have been successful shouldthe shell be guided with GPSpositioning accuracy. Thereforeanticipating further threat from the
abuse of GPS positioning accuracy bythe parties adversarial to the US (andher allies), the concept of accuracydenial was evolved and laterimplemented in March 1990 knownas Selective Availability (SA) (Matori,1996). The threat from this abuse ofGPS positioning accuracy is the maindrive behind the SA implementation,since the concept of Accuracy Denial/SA was not in the original plan ofGPS, when it was initiated in the early70s.
WHAT IS SA?
SA is the deprivation of GPS real-timepositioning accuracy to the
unauthorised GPS users (most of uscivilian). It is in the form of thedithering of the satellite clock (SAdither) or/and the falsification of theorbital parameter (SA epsilon). Thedithering of the satellite clock causesthe designated chip-length of theCoarse Acquisition (CA) code to beno longer equal to 300 metres, thusmaking the pseudorangemeasurement in error (Anon, 1995).On the other hand SA epsilon causesthe satellite to appear in the wrongposition as observed by the users.These intentional errors cause theposition derived using GPS byunauthorised users to be in error also.
Review Of Global Positioning System (GPS)
Selective Availability (SA) And Its Benefits
Dr Abdul Nasir Matori
Universiti Teknologi PETRONAS
31750 Bandar Seri Iskandar, Tronoh, Perak, Malaysia.
ABSTRACT
Global Positioning System (GPS) was conceived in the early 70s by the US military for positioning and timing purposesand achieved its Full Operational Capacity (FOC) in July ‘95. Even long before its FOC it had shown positioningaccuracy far better than the other positioning tools available; so superior was GPS that they may face redundancy. Theavailability of GPS to all users however meant it was available to the parties, adversarial to the US government. Realisingthat GPS may be used for hostile activities (against the US and her allies), a concept of ‘Accuracy Denial’ was evolved inJune 1983, which was later known as ‘Selective Availability’ (SA) and officially implemented in March 1990. SA is amechanism whereby any unauthorised GPS user will be deprived of GPS true (accuracy) potential in real time usage.Under SA the positioning accuracy for the unauthorised users was reduced by more than 100% and the cost for GPScivilian uses also increased substantially since GPS had to be operated under Differential mode or Differential GPS(DGPS) to regain the required accuracy. So successful was DGPS that it led to gradual SA removal beginning 1996, andon 2nd May 2000, SA was finally ‘set to zero’. On one hand, the SA removal opens the full opportunity of civilian usesof GPS, on the other hand GPS is still fully owned and operated by the US government. Accuracy Denial may bereintroduced albeit in other forms (such as ‘regional denial’) should her safety be felt threatened again. Are we betterprepared to face this denial then?
Keywords: accuracy denial, global positioning system, regional denial, selective availability (SA).
This paper was presented at GEOINFORMATION 2000, Universiti Pertanian Malaysia, Serdang, 6 - 7 November 2000.

Univers i t i Teknologi Petronas • http://www.utp.edu.my
3PLATFORM • Volume 2 Number 1 • January – June 2001
HOW DOES SA CAUSE
POSITIONING ERROR?
Recall that the mechanism ofpositioning of users/object (in space)using GPS requires the knowledge ofthe pseudorange of the users/object tothe satellite and the satellite positionas described in the following equation:
Pseudorange between user/objectto the satellite + satellite position= user/object position
Hence errors in the pseudorange andthe satellite position will be translatedto the user position.
EFFECT OF SA ON GPS
POSITIONING
SA at its pinnacle contributes thebiggest error source to the positioningaccuracy which is almost 62 %, whereit degrades the (point) positioningaccuracy from 20 metres to 100metres, 95% of the time (note:compare positioning accuracy inFigures 3 and 4). Table 1 presents theGPS error budget when SA was at itspinnacle.
Table 1: GPS (Point) Positioning Error
Budget (Adopted from Matori,
1996).
Error Source Error (m)
SA (dither)2 65
Ionosphere
Low elevation satellite 5 (night)
High elevation satellite 30 (day)
Troposhere 2.0
Multipath 2.0
Receiver noise 0.5
With SA ‘on’, GPS positioningaccuracy suddenly could not meet theaccuracy requirement for many
civilian users, such as harbour toharbour approach, vehicle tracking,fleet management and seismic survey,tail-buoy positioning, dredging andrig positioning. Such activities requirepositioning accuracy in the order of20 metres. It will require almost£300,000 to £700,000, (Westwood,1992) to regain the accuracy requiredfor the above activities since GPS hasto be operated in Differential mode,i.e. Differential GPS (DGPS)3.DGPS scenario can be referred to inFigure 2. This slows down the marketof GPS receiver by as much as 75%and also the growth of the whole GPSindustries will be slowed down by asmuch as 33% to 60% between theyears 1994 and 2005.
HOW TO GO AROUND THE SA
Even though SA was not well receivedby the civilian users, in the early 90sit appeared that SA would be ‘on’indefinitely. Like it or not the civilian
users have to find some means tocounter SA and to regain the requiredGPS positioning accuracy for theirpositioning activities. Top in the listwas the setting up of DGPS systemin many parts of the globe in the early90s.
DGPS has been proven very successfulin countering SA and hence regainingthe required accuracy, albeit at higheroperation costs. So successful wasDGPS that even with SA fully ‘on’, atleast 42% of offshore surfacepositioning was executed usingDGPS.
Figure 2: DGPS Scenario
Figure 1:
Positioning Error due to SA
Error Source GPS Positioning DGPS Positioning
Error (m) Error (m)
SA 65 0.1
Ionosphere
Low Elevation Satellite 5 (night) 0.2
30 (day) 1.0
High Elevation Satellite 5 0.2
Troposphere 2 0.5
Multipath 2 2.8
Receiver Noise 0.5 0.7
Table 2: GPS and DGPS error budget (Adopted from Matori, 1996).

PLATFORM • Volume 2 Number 1 • January – June 2001
4 Univers i t i Teknologi Petronas • http://www.utp.edu.my
By the end of the 90s it was clearerthat SA had failed as a denialmechanism to the unauthorised useof GPS positioning accuracy, was verycostly and yet had no military value(Bennet, 1991). Therefore in a specialreport ‘GPS – Charting the Future,1996’ chaired by the former USSecretary of Defence, JamesSchlesinger, it was announced that SAwould be removed graduallybeginning from the year 1996, and fullSA discontinuation will be in 2006(Anon, 1996). On 1st May 2000however, the US President made astatement that the SA was set to zerolevel beginning 2nd May 2000.Replacing SA is the ‘Regional DenialCapabilities in lieu of GlobalDegradation’.
Hence, DGPS and the ability to denyGPS signal regionally must haveplayed a very contributory role inremoving SA.
As expected the positioning accuracyachieved for post SA GPS positioningis almost ten times better. This isshown in the Positioning errors timesseries and plan plot of position errorfor the GPS positioning after 2nd May2000. No trace of SA was visible, thepositioning accuracy is within 10 maccuracy, at 95% of the time, as shownin Figure 3.
BENEFIT FOR CIVILIAN GPS
USERS FROM SA
DISCONTINUATION
In the declaration of the SA removalit was mentioned that there is nointention to reintroduce SA. Nodoubt GPS without SA will boostGPS use in the following areas (thatwas before it was hindered by theinsufficient accuracy required).
Transportation Benefits
Car Navigation: Previously, a GPS-
based car navigation system could driftoff course by one or two blocks,leading to erroneous guidance anddirections. In areas where multiplehighways are parallel, SA made itdifficult to determine which highwaythe car was on. Discontinuing SA willeliminate such problems, leading togreater consumer confidence in thetechnology and higher adoption rates.It will also simplify the design of manyvalue-added systems, lowering theirretail costs.
Fleet Management: Companiesmanaging fleets of vehicles such astaxicabs, buses, forwarding trucks, andrental cars will enjoy increases inefficiency as their ability to track androute individual vehicles improves.This will be especially important incrowded parking lots and railroadyard, where SA previously made itimpossible to identify specific vehicles,tractor-trailers, or boxcars using GPSalone.
Figure 3:
Plan plot of GPS positioning without SA
Figure 4:
Plan Plot of GPS positioning under SA

Univers i t i Teknologi Petronas • http://www.utp.edu.my
5PLATFORM • Volume 2 Number 1 • January – June 2001
Package Delivery: Message courierservices and package and cargocompanies will also benefit frombetter real-time tracking andmanagement of assets. Basic GPS willgive couriers and even pizza deliveryservices the ability to navigate all theway to a person’s door on a buildingwith multiple entrances.
Aviation: The removal of SA willimprove navigational accuracy forgeneral aviation (non-commercial)pilots using unaugmented GPSreceivers. This increased accuracyimproves safety by aligning pilotsmore closely with the runway duringinstrument approaches, andimproving the accuracy of terrainawareness and warning systems andmoving map displays that providesituational awareness to the pilot.
Fisheries Enforcement. The improvedbasic GPS will provide commercialfishermen with better repeatableaccuracy over an unlimited area. Inaddition, both fishermen and lawenforcement agencies will share acommon, higher accuracy navigationsystem, possibly leading to reducedviolations of fisheries boundaries,exclusive economic zone issues,customs, etc.
Highway/Waterway Maintenance: Forthe first time highway/waterwayauthorities will have access to high-accuracy, cost-effective basic GPSreceivers for highway and waterwaymaintenance and management.
Nationwide DGPS: In remotelocations where establishing DGPSservices is neither required nor costeffective, the improved performanceof basic GPS may serve many usersfunctions that would otherwise needDGPS coverage. This flexibilityallows for a more cost-effectivenetwork for the government and thenation.
Emergency Response
Benefits
Firefighter/Police/Ambulance Dispatch:Reducing the positioning error from100 metres to nearly 10 metres willsignificantly improve the ability topinpoint the location of fires, crimescenes, and accident victims and routeemergency crews to the scene. In suchlife-threatening situations, everysecond saved counts.
E-911/999: All new cellular phoneswill soon be required to be equippedwith location determinationtechnology to facilitate ‘911/999’ callresponses. With the removal of SA,GPS may become the method ofchoice for implementing the E-911/999 requirement. A GPS-basedsolution might be simpler and moreeconomical than alternativetechniques such as radio towertriangulation, leading to lowerconsumer costs.
Search and Rescue: With SA turned off,GPS will become a more powerful andcompelling tool that will help rescueteams search individuals lost at sea, onmountains or ski slopes, in deserts,and in wilderness environments.
Roadside Assistance: Disabled carsequipped with integrated GPS systemswill be able to more accuratelytransmit their location, speedingresponse times for tow trucks andother services. With SA zeroed, thecar’s GPS signal will identify whichside of the road the car is on – anextremely important distinctionespecially when the local road, orfreeway is divided by a concretedivider.
Emergency Preparedness: Reliefagencies such as the FederalEmergency Management Agency(FEMA) will be able to use basic,
stand-alone GPS receivers to map outgeographical features such as floodplain boundaries, levees and drainageditches – a task that previouslyrequired expensive and labour-intensive GPS augmentationtechniques.
Land Benefits
Mineral and Resource Exploration: Inmany cases, removal of SA willeliminate the need for costlydifferential correction equipment andservices as companies explore remote,uncharted geographic regions forminerals, oil, coal and other naturalresources.
Resource Management: Agencies suchas Land Department and the ForestService will be able to apply GPS tothe management of wetlands, forests,and other natural resources withoutthe use of costly augmentationsystems, or in some cases, tightlycontrolled, highly burdensomemilitary receivers. This should reducegovernment costs and increaseproductivity. Similarly, paper andlumber companies may be able to usebasic GPS to identify and manageindividual trees in a forest withoutcostly differential correctionequipment and services.
Wildlife Tracking: Scientists and otherindividuals seeking to observe and/orto tag animals in the wild will have amore powerful positioning andtracking tool at their disposal. Theseinclude zoologists, ecologists, marinebiologists and birdwatchers.
Space Benefits
Satellite Tracking: Satellites using GPSreceivers will be able to determinetheir orbit positions more accurately.Without SA, a satellite using GPS SPSwill be able to determine its orbit
PLATFORM • Volume 2 Number 1 • January – June 2001
6 Univers i t i Teknologi Petronas • http://www.utp.edu.my
position to about 10 metres accuracyin near real time. This will improvescientific observations and satelliteoperations.
Satellite Data Processing: Theprocessing of science data usingDGPS techniques, such as is done inthe rapid production of El Ninoweather maps, can be accomplishedmore economically. The increasedaccuracy of the signals will allowreduction in the rate of data collectionthus reducing communication costsfor data used to generate scienceresults from satellites such as TOPEX/Poseidon.
Future Space Station Operations:Among the many benefits that maybe realised by space users of GPS inthe future will be simplification ofsystems supporting critical rendezvousoperations and navigation of free fliersnear the International Space Station.The elimination of SA may enable theperformance of early satelliterendezvous operations to be greatlysimplified and many may significantlyenhance the performance of relativeGPS during close in maneuveringoperations.
Recreation Benefits
Hiking, Camping and Hunting: Withup to 10 metres accuracy, hikers,campers and hunters will be able tonavigate their way through unmarkedwilderness terrain with greaterconfidence and safety.
Boating and Fishing: Recreationalboaters with DGPS will enjoy safer,more accurate navigation aroundsandbars, rocks and other obstacles.Fishermen will be able to moreprecisely locate their favourite spot inthe lake, river or sea.
Timing Benefits
Increased Adoption of GPS Time: Inaddition to position and navigationinformation, the accuracy of the timedata broadcast by GPS will improveto within 20 – 30 billionths of asecond. This increased level ofprecision may encourage continuedadoption of GPS time as a preferredmeans of acquiring UniversalCoordinated Time (UTC) and forsynchronizing everything fromelectrical power grids and cellularphone towers to telecommunicationsnetworks and the Internet. UsingGPS as a time source is far less costlythan purchasing and maintaining highprecision atomic clocks.
CONCLUDING REMARKS
Without SA, GPS has finally exposedits true potential. Its application (forcivilian) has suddenly increased almostsix folds. Such was the wastage of thistechnology when it was concealed bySA.
Nevertheless, GPS remains theproperty of the US and their militarysystem and is operated by theirmilitary. Even though the ‘GlobalAccuracy Denial’ in the form of SAor the like is a very unlikely scenario,civilian GPS users should anticipatethe inconvenience and impact of the‘Regional Denial’ should the need forits application arise. As for the caseof SA before, effort and studies shouldbe initiated in order to acquaintourselves with the ‘Regional Denial’and how to cope with it. Meanwhile,with GPS positioning superiority fullyat our disposal, let us utilise fully thislife-time opportunity.
REFERENCES
A N Matori. The Impact of SelectiveAvailability on Offshore DGPS Positioning.PhD Thesis, University of Newcastle uponTyne, UK, 1996.
Anon. Charting the Future, National Academyof Public Administration & National ResearchCouncil, 1995.
Anon. Global Positioning System StandardPositioning Service Signal Specification, 1995.
V Bennet. No Need for Peacetime SelectiveAvailability. GPS World: 3pp, 1991.
National Geodetic Survey Homepage at http://www.ngs.noaa.gov/
J Westwood. DGPS and Offshore IndustryMarket, 1992.
ENDNOTES
1 SPS – positioning accuracy available to theunauthorised GPS users
2 SA was predominantly caused by thedithering of satellite clock.
3 DGPS – a technique whereby data from areceiver at a known location is used tocorrect the data from a receiver at anunknown location.
Univers i t i Teknologi Petronas • http://www.utp.edu.my
7PLATFORM • Volume 2 Number 1 • January – June 2001
Assessing Students’ Performance In
Engineering Mathematics: An Experience In
Universiti Teknologi Petronas
Afza Shafie
Wan Fatimah Wan Ahmad
Universiti Teknologi PETRONAS
31750 Bandar Seri Iskandar, Tronoh, Perak, Malaysia.
[email protected] & [email protected]
ABSTRACT
Assessment is one of the methods where an instructor can collect feedback on students’ learning as well as what is beingtaught. Traditional ways of mathematics assessment generally provide a method for assigning numerical scores at the endof the semester to determine letter grades. These form of assessments rarely reveal information about students’ actualunderstanding of the course. The assessment needs to be carried out throughout the semester and also at the end of thesemester to ensure the true understanding of the course.
These assessments should test students’ understanding of the concepts and skills. A study has been done in UniversitiTeknologi PETRONAS (UTP) to assess students understanding in the learning of foundation engineering mathematics.This paper focuses on the students’ understanding of mathematical concepts and identifies certain weaknesses amongststudents. An example of an attempt is given with respect to some key concepts and abilities on calculus taken from theend of course examination. The result shows that the students are weak in understanding the concepts of differentiationas a rate of change and integration as area under the curves.
A correlation study has also been done between the mathematics result of the secondary school and the university end-of-semester examination. This is to determine the relationship between their performance in mathematics during these twostages. The results show that UTP students are weak in understanding the underlying concepts of differentiation andintegration. Students who do well in mathematics during their secondary school may not perform as well as in theuniversity.
INTRODUCTION
Assessment has always been a matterof great concern to anyone involvedin education. For most instructors,an assessment has always been in termsof testing and grading. Typically, anassessment is a way to inform studentsabout how well they did in a particularcourse. Assessment is defined as theprocess of gathering evidence aboutstudent’s knowledge of, ability to use,
and disposition toward, mathematicsand of making inferences from thatevidence for a variety of purposes [1].
In general, learning mathematics hasoften been viewed as mastering a setof skills, procedures and concepts.Ridgway and Passey [2] in their studyon mathematical needs in engineeringapprentices concluded thatmathematics education shouldencourage the development of a broad
range of skills and successfulapplication of techniques in a rangeof contexts. Research has shown thatsome students who produce thecorrect solutions on a test item maynot even understand this solution orthe underlying question behind it [3].Garfield [4] stressed that theappropriate assessment methods andmaterials were needed to measurestudents’ understanding of probabilityand statistics and their ability to
This paper was presented at the 9th International Congress On Mathematical Education, Tokyo, 30 July - 7 August, 2000.

PLATFORM • Volume 2 Number 1 • January – June 2001
8 Univers i t i Teknologi Petronas • http://www.utp.edu.my
explore data, to think critically usingstatistical reasoning. A research hasbeen done on the improvement ofassessment by improving the questions[5].
The main purpose of the assessmentis to enhance students’ learning,develop an understanding ofimportant concepts and be able toapply this knowledge in variousengineering disciplines. From theevidence and information collectedfrom the assessment, the instructorwill be able to describe the students’learning and performance.
BACKGROUND INFORMATION
Students entering the university havecompleted eleven years of schoolingat primary and secondary level. Thereare three public examinations forschools in Malaysia and Sijil PelajaranMalaysia (SPM) is one of them. Thereare two mathematics papers in theSPM; Modern Mathematics andAdditional Mathematics. ModernMathematics is an elementarymathematics paper that is compulsorywhile Additional Mathematics is forstudents who intend to major insciences and engineering. The SPMgrading scheme for both papers are asfollows:
Table1: SPM Grading Scheme
GRADE SPM
A1 and A2 distinction
C3, C4, C5, C6 pass with credit
P7 and P8 pass
F9 fail
The university decided that studentsentering this university should haveat least a pass in the SPM AdditionalMathematics examination. Uponenrolling at the university, they willhave to take six courses of
mathematics during theirundergraduate years. These studentsare examined every semester. Theassessment of the mathematics coursesconsists of ongoing coursework andend of semester examination.Quizzes, tests and assignments/projects make up the ongoingcoursework, while the end-of-semesterpaper is a comprehensive 3-hourpaper. The university’s gradingscheme is as follows:
Table 2: UTP’s Grading Scheme
PERCENTAGE GRADE
80 - 100 A
75 - 79.9 B+
65 - 74.9 B
55 - 64.9 C+
50 - 54.9 C
40 - 49.9 D
below 40 F
A study was carried out on thefoundation engineering mathematicscourse in UTP with the followingobjectives:
i. to identify the areas students areweak in learning calculus,
ii. to look at the relationshipbetween the results of SPMAdditional Mathematics and theend-of-semester examination.
METHODOLOGY
One hundred and sixty students wereinvolved in this study. Fifty-onestudents scored distinction, onehundred and eight obtained credit andone managed a pass in the SPMAdditional Mathematics examination.They majored in Mechanical,Chemical or Electrical Engineering.These students have completed a two-semester course in calculus. Among
the topics covered in the course werefunctions, differentiation andintegration. This examinationconsists of two sections, section A andsection B. Section A consists of tenstraight forward questions. Thesequestions are of the knowledge andcomprehension level of the Bloom’staxonomy [6] (question cues:differentiate, describe, etc). Thestudents are also required to answerall the four questions in Section B.These questions test the students’ability to apply their knowledge andanalyze the problems given. The datacollected were from their responses toquestions in Section B of the end-of-semester examination.
An analysis of the questions in SectionA has shown that everybodyattempted all the questions. Out ofthese, eighty percent of the studentsanswered correctly. Most of errorswere due to carelessness.
The data collected were reported in afew categories. The categories are“attempted and correct”, “attemptedand incorrect” and “not attempted”.The categories are only meant as a cuethat indicates a certain aspect of theresponse but which cannot substitutethe real answers. Thus, to make thecategories more informative, they areillustrated with examples of students’responses.
LIMITATIONS OF STUDY
This study is limited to responses toonly four questions that must beanswered, the same instructor and onebatch of students (1998) only. Thequestions selected include not onlycomputational goals but also higherorder goals concerning theunderstanding of basic functions andcalculus. The four questions wereselected in order to show the students’ability to solve problems, to use the
Univers i t i Teknologi Petronas • http://www.utp.edu.my
9PLATFORM • Volume 2 Number 1 • January – June 2001
language of mathematics, to reasonand analyze, to comprehend the keyconcepts and procedures. We wouldalso like to examine the extent towhich the students have integratedand made sense of mathematicalconcepts and procedures and whetherthey can apply these concepts andprocedures to situations that requirecreative and critical thinking.
OBJECTIVES OF THE
ASSESSMENT
In order to assess the objectives, wehave selected four questions. They are,
Case 1
Solve
0)}8.02{sin(01.0 =−− xe x
Case 2
Differentiate
2
2
4)(
x
xxf
−=
Case 3
Ship A is sailing due south at24 km/h and ship B is 48 km southof A, is sailing due east at 18 km/h.a) At what rate are they approaching
or separating at the end of 1 hour?b) At the end of 2 hours?c) When do they cease to approach
each other and how far apart arethey at that time?
Case 4
a) Find ∫−
4
4
2cos
π
π
xdx .
b) Sketch the graph of
xy 2cos= for –π ≤ x ≤ π.
c) Hence evaluate dxx∫−
π
π
2cos .
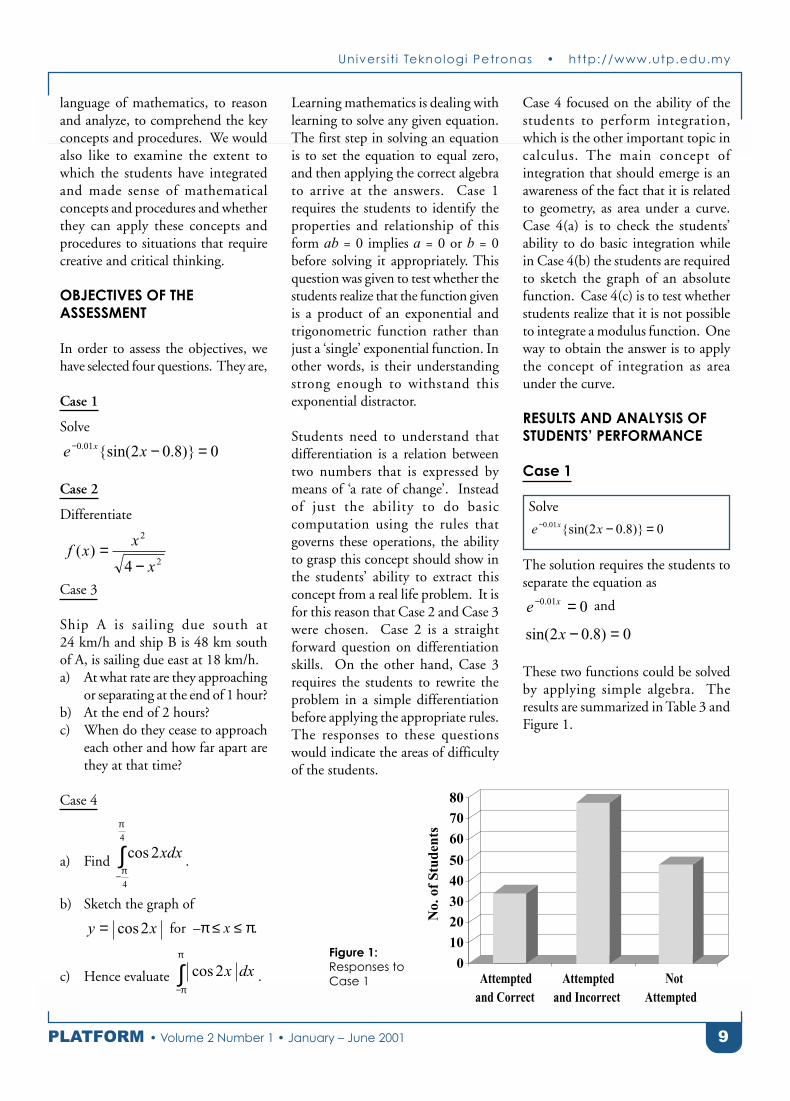
Learning mathematics is dealing withlearning to solve any given equation.The first step in solving an equationis to set the equation to equal zero,and then applying the correct algebrato arrive at the answers. Case 1requires the students to identify theproperties and relationship of thisform ab = 0 implies a = 0 or b = 0before solving it appropriately. Thisquestion was given to test whether thestudents realize that the function givenis a product of an exponential andtrigonometric function rather thanjust a ‘single’ exponential function. Inother words, is their understandingstrong enough to withstand thisexponential distractor.
Students need to understand thatdifferentiation is a relation betweentwo numbers that is expressed bymeans of ‘a rate of change’. Insteadof just the ability to do basiccomputation using the rules thatgoverns these operations, the abilityto grasp this concept should show inthe students’ ability to extract thisconcept from a real life problem. It isfor this reason that Case 2 and Case 3were chosen. Case 2 is a straightforward question on differentiationskills. On the other hand, Case 3requires the students to rewrite theproblem in a simple differentiationbefore applying the appropriate rules.The responses to these questionswould indicate the areas of difficultyof the students.
Case 4 focused on the ability of thestudents to perform integration,which is the other important topic incalculus. The main concept ofintegration that should emerge is anawareness of the fact that it is relatedto geometry, as area under a curve.Case 4(a) is to check the students’ability to do basic integration whilein Case 4(b) the students are requiredto sketch the graph of an absolutefunction. Case 4(c) is to test whetherstudents realize that it is not possibleto integrate a modulus function. Oneway to obtain the answer is to applythe concept of integration as areaunder the curve.
RESULTS AND ANALYSIS OF
STUDENTS’ PERFORMANCE
Case 1
Solve
0)}8.02{sin(01.0 =−− xe x
The solution requires the students toseparate the equation as
001.0 =− xe and
0)8.02sin( =−x
These two functions could be solvedby applying simple algebra. Theresults are summarized in Table 3 andFigure 1.
0
10
20
30
40
50
60
70
80
No.
of
Stud
ents
Attemptedand Correct
Attemptedand Incorrect
NotAttempted
Figure 1:
Responses to
Case 1

PLATFORM • Volume 2 Number 1 • January – June 2001
10 Univers i t i Teknologi Petronas • http://www.utp.edu.my
One hundred and twelve studentsattempted the question. Forty-ninestudents were able to separate theequations as required. Out of this,thirty-four students solved it correctly.Twenty-one of them in the thirdcategory gave the solutions as in Table3, part c (iii), indicating that theexponential proved to be a distractor.The other forty-two did computationsthat made no real sense.
Observations of the solutions given bythe students who incorrectlyattempted the question showed thatthey were only able to reach the firsttwo levels of the Bloom’s taxonomy.One of the skills demonstrated at theselevels is recalling of information.These students knew that they neededto use logarithm to solve anyexponential problem.
Case 2
Differentiate
2
2
4)(
x
xxf
−=
To solve this question the students canapply the quotient rule. Although thequotient rule is the most commonlyused rule, there are other methods aswell. The detailed results are shownin Table 4 and Figure 2.
Everybody attempted this questionand eighty percent of them answeredit correctly. Thirty-two were able toapply the rule but incorrectlydifferentiated the function. Four ofthem demonstrated their lack ofunderstanding of basic mathematicalconcepts. The rest of them madecareless mistakes while answering thequestion.
Table 3: Summary of Case 1
No. of
Answering Categories students Example of Responses
a) Ability to separate 34 001.0 =− xe , x is undefined
the 2 equations and 0)8.02sin( =−x , x = 0.4 rad or 1.9 rad
and correctly
solved both.
b) Ability to separate 15 i) 001.0 =− xe x = ?
the two equations ii) 001.0 =− xe x = 0
and correctly solve iii) 001.0 =− xe x = ln 1
one
c) Inability to separate 63 i) 0)}8.02{sin(99.0 =−xx
the two equations and ii) 0)8.02sin(lnln01.0 =−+− xex
incorrectly solved iii) 0log)}8.02{sin(log 01.0e
x xe =−−
iv) 02cos01.02sin 01.001.0 =− −− xx xexe
d) Not attempted 48
Table 4: Summary of Case 2
No. of
Answering Categories students Example of Responses
a) Ability to apply the 128
rule and correctly Rule: 2
)(v
dx
dvu
dx
duv
xf−
=′differentiated
Answer: 22
3
4)4(
8)(
xx
xxxf
−−
−=′
b) Ability to apply the rule 32 i) x
x
x
xxf
−=
−=
24)(
2
2
2
but incorrectly
differentiated ii) 2122 )4()( xxxf −=′
d) Not attempted 0
0
20
40
60
80
100
120
140
No.
of
Stud
ents
Attemptedand Correct
Attemptedand Incorrect
NotAttempted
Figure 2:
Responses to
Case 2
Univers i t i Teknologi Petronas • http://www.utp.edu.my
11PLATFORM • Volume 2 Number 1 • January – June 2001
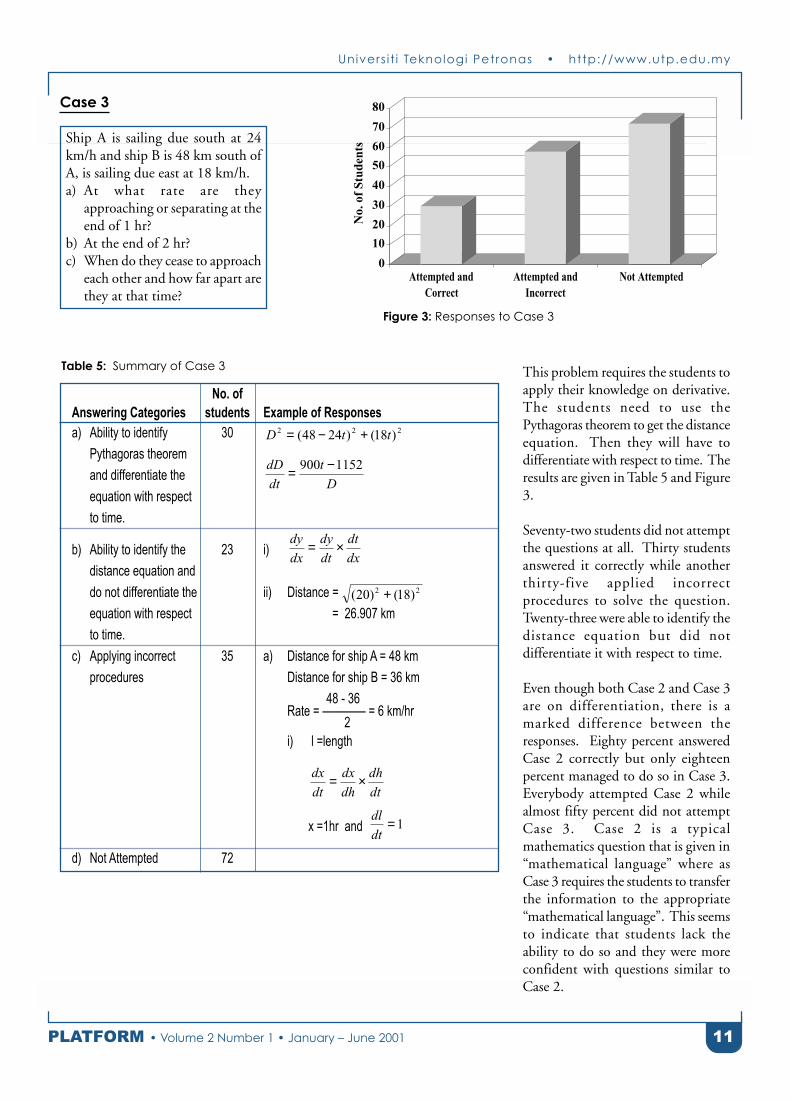
Case 3
Ship A is sailing due south at 24km/h and ship B is 48 km south ofA, is sailing due east at 18 km/h.a) At what rate are they
approaching or separating at theend of 1 hr?
b) At the end of 2 hr?c) When do they cease to approach
each other and how far apart arethey at that time?
This problem requires the students toapply their knowledge on derivative.The students need to use thePythagoras theorem to get the distanceequation. Then they will have todifferentiate with respect to time. Theresults are given in Table 5 and Figure3.
Seventy-two students did not attemptthe questions at all. Thirty studentsanswered it correctly while anotherthirty-five applied incorrectprocedures to solve the question.Twenty-three were able to identify thedistance equation but did notdifferentiate it with respect to time.
Even though both Case 2 and Case 3are on differentiation, there is amarked difference between theresponses. Eighty percent answeredCase 2 correctly but only eighteenpercent managed to do so in Case 3.Everybody attempted Case 2 whilealmost fifty percent did not attemptCase 3. Case 2 is a typicalmathematics question that is given in“mathematical language” where asCase 3 requires the students to transferthe information to the appropriate“mathematical language”. This seemsto indicate that students lack theability to do so and they were moreconfident with questions similar toCase 2.
0
10
20
30
40
50
60
70
80
No.
of
Stud
ents
Attempted andCorrect
Attempted andIncorrect
Not Attempted
Figure 3: Responses to Case 3
No. of
Answering Categories students Example of Responses
a) Ability to identify 30 222 )18()2448( ttD +−=Pythagoras theorem
and differentiate theD
t
dt
dD 1152900 −=
equation with respect
to time.
b) Ability to identify the 23 i)dx
dt
dt
dy
dx
dy ×=
distance equation and
do not differentiate the ii) Distance = 22 )18()20( +equation with respect ii) Distance = 26.907 km
to time.
c) Applying incorrect 35 a) Distance for ship A = 48 km
procedures Distance for ship B = 36 km
48 - 36Rate = ———— = 6 km/hr 2
i) l =length
dt
dh
dh
dx
dt
dx ×=
x =1hr and 1=dt
dl
d) Not Attempted 72
Table 5: Summary of Case 3

PLATFORM • Volume 2 Number 1 • January – June 2001
12 Univers i t i Teknologi Petronas • http://www.utp.edu.my
Case 4
a) Find ∫−
4
4
2cos
π
π
xdx
b) Sketch the graph of
xy 2cos=for –π ≤ x ≤ π.
c) Hence evaluate dxx∫−
π
π
2cos
This question should show the abilityto relate integration with geometry.The results are summarized in theTable 6 and Figure 4.
One hundred and two students wereable to do integration of trigonometricfunction. Out of this, seventy-sevenfailed to integrate a modulus function.They also lacked the ability to sketchthe given graph. Even though theywere able to integrate the function, itseems that they were not able tounderstand the concept of integrationas area under the curve.
CONCLUSIONS
A study has been carried out on thefoundation engineering mathematicscourse. One hundred and sixtystudents (batch 1998) were involvedin this study. There were twoobjectives in the study.
The first objective of the studypresented in this paper was to identifythe areas students are weak in learningcalculus. The study comprised ofresponses to four questions (cases)selected from the end-of-semesterexamination. The results from Case1 showed that forty-four percentstudents were able to identify a givenfunction of ab = 0 implies a = 0 orb = 0. The exponential function was
Table 6: Summary of Case 4
No. of
Answering Categories students Example of Responses
a) Ability to integrate 26
trigonometry
function, sketch12cos
4
4
=∫−
π
π
xdx
the graph and finding
area under the curve Area = 4
b) Ability to integrate 25 Able to integrate and sketch the right graph.
and sketch the graph. dxx∫−
π
π
2cos = 0
c) Ability to integrate . 51 Sketch the wrong the graph and
only. dxx∫−
π
π
2cos = 0
d) Incorrect method 26 i)1
22sin
2cos4
4
4
4
−=−=−−
∫π
π
π
π
xxdx
ii) Sketch the wrong graph.
iii) 0cos2cos 2 ==−
−∫
π
π
π
π
xdxx
e) Not attempted 32
0
20
40
60
80
100
120
No.
of
Stud
ents
Attemptedand Correct
Attemptedand Incorrect
NotAttempted
Figure 4: Responses to Case 4

Univers i t i Teknologi Petronas • http://www.utp.edu.my
13PLATFORM • Volume 2 Number 1 • January – June 2001
also a distractor for fifty-six percentof students, hence they were not ableto solve the question. In handlingquestions on differentiation (Case 2),eighty percent of students prefer toanswer questions that are given in‘mathematical language’. On theother hand, only thirty-four percentwere able to answer the question thatrequires them to transfer theinformation to the appropriate‘mathematical language’ as seen inCase 3. From Case 4, sixty percent ofstudents lacked the ability to sketchthe given graph and were not able tounderstand the concept of integrationas area under the curve. Therefore theresults of this study suggest that thestudents are weak in understandingthe concepts of differentiation as a rateof change and integration as areaunder the curves.
The second objective of this study wasto look at the relationship between theresults of SPM AdditionalMathematics and the end-of-semesterresult examination. A correlation
analysis between the SPM AdditionalMathematics (all grades) and end-of-semester result is significant withcorrelation coefficient, r = 0.486(confidence level = 0). Anothercorrelation analysis betweenAdditional Mathematics result of Passwith credit and end-of-semester resultwas also carried out. The result issignificant with r = 0.612 (confidencelevel = 0). Although there is asignificant relationship between theAdditional Mathematics result of Passwith credit and end-of-semester result,it is not strong enough to show thatstudents who perform well in schoolmay perform as well as in university.
Ever since 1999, the university hasdecided that the students entering theuniversity should have at least a C4credit in the SPM AdditionalMathematics. Since the course is thefoundation for advance calculus, thisissue needs to be addressed. Furtherresearch on new techniques ofassessment methods should be carriedout.
REFERENCES
[1] National Council of Teachers ofMathematics. Assessment Standards forSchool Mathematics, 1995.
[2] J Ridgway & D Passey. When BasicMathematics Skills Predict Nothing:Implications for Education and Training.Educational Psychology, Vol. 15 Issue 1,pp 35- 44, 1995.
[3] F Jolliffe. Assessment of Understandingof Statistical Concepts, in Proceedings ofthe Third International Conference onTeaching Statistics, Vol.1, ed. D. Vere-Jones, Otago, NZ: Otago UniversityPress, pp 461-466, 1991.
[4] J B Garfield. Beyond Testing andGrading: Using Assessment to ImproveStudent Learning, Journal of StatisticsEducation, V2N1 [online], 1994.
[5] A Hawkins, F Jolliffe, & L Glickman.Teaching Statistical Concepts, Harlow,Essex, England: Longman Group UKLimited, 1992.
[6] B S Bloom, (ed.) Taxonomy ofEducational Objectives: TheClassification of Educational Goals:Handbook I, Cognitive Domain. NewYork; Toronto: Longmans, Green, 1992.

PLATFORM • Volume 2 Number 1 • January – June 2001
14 Univers i t i Teknologi Petronas • http://www.utp.edu.my
1. INTRODUCTION
The application of neural networks(NN) in face recognition problem hasaddressed several issues: genderclassification, face recognition, andclassification of facial expressions asdiscussed by Ahmad Fadzil et al [1, 2,3]. The widely known learningalgorithm for neural networks is theback-propagation procedure.However, the back-propagationlearning is too slow for manyapplications and it scales up poorly astasks become larger and morecomplex.
The results presented in this paperrepresent an extension of to the workconducted by the authors as discussed
in [4, 6]. The objectives of the workare, to evaluate the performance ofnew acceleration methods namely,DLR (Methods 1 and 2) and DMFschemes on face recognition problemas an example of practical applicationusing continuous-valued trainingdata. These acceleration methods arecompared with the conventional backpropagation (BP) and two othergradient-based optimisation methodsnamely, conjugate gradient (CG) andsteepest descent (SD). Numericalresults on convergence andgeneralisation capabilities areinvestigated. The performance of thenetwork on noisy face images is alsoinvestigated.
The above investigations are
accomplished by training a 460-12-5MLP (Multi-layer perceptron)consisting of 460 input nodes, 12hidden layer nodes and 5 outputnodes. After being trained, thenetworks are tested on generalisationand rejection capabilities based on atest set consisting of images outsidethe training set. The data set and theimage database for this human faceproblem are discussed in Section 2.The Dynamic Learning Rate (DLR)and Dynamic Momentum Factor(DMF) methods are discussed inSection 3. The simulation results onthe learning progression,generalization and rejection of theresultant networks are presented inSection 4. The performance of thenetwork on noisy images is alsoinvestigated in Section 5.
Optimization Of Learning Methods For Face Recognition
Using Multilayer Perceptrons
Dr M H Ahmad Fadzil
Universiti Teknologi PETRONAS,
31750 Bandar Seri Iskandar, Tronoh, Perak, Malaysia.
Dr D J Evans
Nottingham Trent University, United Kingdom.
Dr Z Zainuddin
Universiti Sains Malaysia, Malaysia.
ABSTRACT
This paper discusses accelerated learning methods in the application of neural networks to the human-face recognitionproblem. New acceleration methods such as the Dynamic Learning Rate (DLR) Methods 1 and 2 and the DynamicMomentum Factor (DMF), are introduced to optimize learning. These acceleration methods are evaluated against theconventional backpropagation (BP) and two other gradient-based optimization methods namely, conjugate gradient(CG) and steepest descent (SD). Numerical results clearly show that the convergence capability of these accelerationmethods is superior to BP method. Although comparable to the CG and SD methods, the DLR and DMF methods areless complex and demand lesser computation time. The generalisation, rejection and noise capabilities of the resultantnetworks are also investigated and it is shown that these capabilities can be enhanced.
Keywords: accelerated learning, dynamic learning rate (DLR), dynamic momentum factor (DMF), face recognition.
This paper was presented at IASTED International Conference on Signal and Image Processing (SIP2001), Hawaii, USA, 13-16 August 2001.
Univers i t i Teknologi Petronas • http://www.utp.edu.my
15PLATFORM • Volume 2 Number 1 • January – June 2001
2. DATA SET
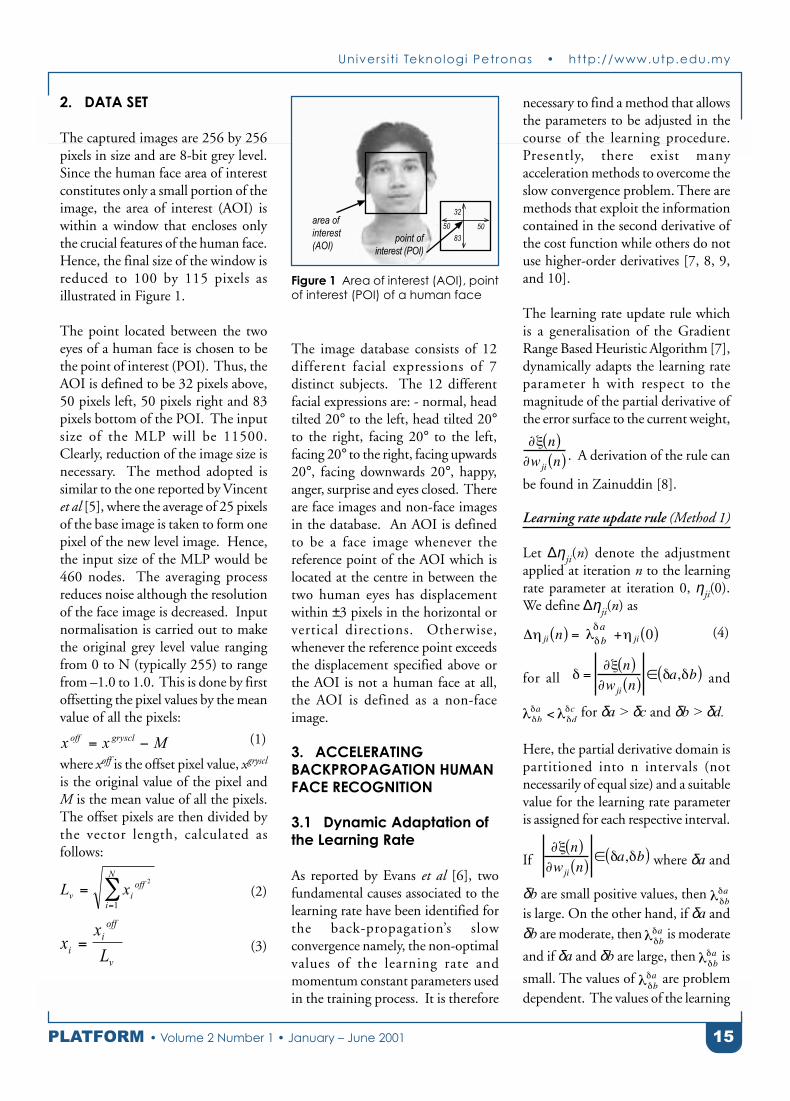
The captured images are 256 by 256pixels in size and are 8-bit grey level.Since the human face area of interestconstitutes only a small portion of theimage, the area of interest (AOI) iswithin a window that encloses onlythe crucial features of the human face.Hence, the final size of the window isreduced to 100 by 115 pixels asillustrated in Figure 1.
The point located between the twoeyes of a human face is chosen to bethe point of interest (POI). Thus, theAOI is defined to be 32 pixels above,50 pixels left, 50 pixels right and 83pixels bottom of the POI. The inputsize of the MLP will be 11500.Clearly, reduction of the image size isnecessary. The method adopted issimilar to the one reported by Vincentet al [5], where the average of 25 pixelsof the base image is taken to form onepixel of the new level image. Hence,the input size of the MLP would be460 nodes. The averaging processreduces noise although the resolutionof the face image is decreased. Inputnormalisation is carried out to makethe original grey level value rangingfrom 0 to N (typically 255) to rangefrom –1.0 to 1.0. This is done by firstoffsetting the pixel values by the meanvalue of all the pixels:
(1)
where xoff is the offset pixel value, xgryscl
is the original value of the pixel andM is the mean value of all the pixels.The offset pixels are then divided bythe vector length, calculated asfollows:
(2)
(3)
The image database consists of 12different facial expressions of 7distinct subjects. The 12 differentfacial expressions are: - normal, headtilted 20° to the left, head tilted 20°to the right, facing 20° to the left,facing 20° to the right, facing upwards20°, facing downwards 20°, happy,anger, surprise and eyes closed. Thereare face images and non-face imagesin the database. An AOI is definedto be a face image whenever thereference point of the AOI which islocated at the centre in between thetwo human eyes has displacementwithin ±3 pixels in the horizontal orvertical directions. Otherwise,whenever the reference point exceedsthe displacement specified above orthe AOI is not a human face at all,the AOI is defined as a non-faceimage.
3. ACCELERATING
BACKPROPAGATION HUMAN
FACE RECOGNITION
3.1 Dynamic Adaptation of
the Learning Rate
As reported by Evans et al [6], twofundamental causes associated to thelearning rate have been identified forthe back-propagation’s slowconvergence namely, the non-optimalvalues of the learning rate andmomentum constant parameters usedin the training process. It is therefore
necessary to find a method that allowsthe parameters to be adjusted in thecourse of the learning procedure.Presently, there exist manyacceleration methods to overcome theslow convergence problem. There aremethods that exploit the informationcontained in the second derivative ofthe cost function while others do notuse higher-order derivatives [7, 8, 9,and 10].
The learning rate update rule whichis a generalisation of the GradientRange Based Heuristic Algorithm [7],dynamically adapts the learning rateparameter h with respect to themagnitude of the partial derivative ofthe error surface to the current weight,
. A derivation of the rule can
be found in Zainuddin [8].
Learning rate update rule (Method 1)
Let ∆η ji(n) denote the adjustmentapplied at iteration n to the learningrate parameter at iteration 0, ηji(0).We define ∆ηji(n) as
(4)
for all and
for δa > δc and δb > δd.
Here, the partial derivative domain ispartitioned into n intervals (notnecessarily of equal size) and a suitablevalue for the learning rate parameteris assigned for each respective interval.
If where δa and
δb are small positive values, then is large. On the other hand, if δa andδb are moderate, then is moderate
and if δa and δb are large, then is
small. The values of are problemdependent. The values of the learning
area of
interest
(AOI)point of
interest (POI)
32
50
83
50
Figure 1 Area of interest (AOI), point
of interest (POI) of a human face

PLATFORM • Volume 2 Number 1 • January – June 2001
16 Univers i t i Teknologi Petronas • http://www.utp.edu.my
rate for each interval are assigned atthe beginning of the learningprocedure and they are kept fixed forthe whole training process. Thelearning rate for each connectionweight is adapted by determiningwhich interval the gradient belongs.
This method has the followingcharacteristics:1. The gradient of each weight
varies with every
iteration ηji(n), hence the learningrate,varies from one iteration tothe next.
2. Every weight has a differentgradient, hence every weight hasits own learning-rate.
It is worth pointing out that small
values of are obtained at a
later stage of the training process(iteration number n is large) when thenetwork is characterising a stabilisingbehaviour. On the other hand, large
values of are obtained at an
earlier stage of the training process(iteration number n is small) when thenetwork is characterising an oscillatorybehaviour. Because of these twobehaviours, we developed the secondlearning rate update rule. A derivationof the second method of learning rateupdate rule can also be found inZainuddin [12].
Learning rate update rule (Method 2)
Let ∆η ji(n,0) denote the positiveadjustment applied at iteration n tothe learning rate parameter at iteration0, ηji(0,0). We define ∆ηji(n,0) as
(5)
for all n ∈ [a,b] where and for a > c and b > d.
The initial value of η, ηji(0,0) can beany small value in the interval [0,1].
Simulation Set-up
The data set for training consists offive different faces with the normalexpression. A 460-12-5 MLP wasused where the output nodescorrespond to the five classificationclasses. We have chosen the batchmode weight updating because resultsby other researchers [13,14], suggeststhat in tasks where generalisation isimportant, the pattern mode shouldbe avoided, despite their faster trainingtimes. The weights were initialised torandom values uniformly distributedin the range (–0.4/Inj, 0.4/Inj) whereInj is the total number of inputs toneuron j, based on a weightinitialisation procedure [15]. Thelearning process was terminated whenthe sum of squares of the error reached1*10-3. The value of the learning rateparameter was η=0.5 in the firstsimulation. For Method 1, thepartition of the gradient domain andtheir respective η values chosen foreach interval are shown in Table 1. Asfor the learning rate update rule ofMethod 2, the partition of theiteration number domain and therespective η values are shown in Table
2. For both schemes, the trainingprocess for a network was repeatedwith larger η values by multiplying theoriginal η values with a constantmultiplier, k. The process was stoppedwhen a multiplier that caused thenetwork to diverge or oscillate wasfound.
3.2 Dynamic Adaptation of
the Momentum Factor
The momentum factor update ruleadapts the momentum factor withrespect to the iteration number. TheDMF has proved to be very effectivewhen applied to this problem.
An analysis of the momentum and aderivation of the rule can be found in[16]. The incorporation of themomentum term in the update ruletends to accelerate descent in steadydownhill regions and has a stabilisingeffect in directions that oscillate insign. However, despite its benefits,there are also limitations to themomentum term’s capabilities. Theproblems as discussed in [16] suggestthe need for a dynamic adaptation ofthe momentum constant. An instanceof this is the dynamic adaptation ofthe learning rate or momentumconstant proposed by Salomon [10].
Table 2: Chosen values of η for face
recognition problem using DLR
Method 2.
Table 1: Chosen values of η for the
face recognition problem DLR
Method 1.
Iteration Value
Number (n) of η(n)1 ≤ n < 100 0.5
100 ≤ n < 500 1
500 ≤ n < 1 000 2
1 000 ≤ n < 5 000 4
5 000 ≤ n < 10 000 8
10 000 ≤ n 16
Gradient |∂ξ/∂w| η
10-2 ≤ δ 0 0.5
5x10⁻³ ≤ δ < 10-2 0.5 1
10-3 ≤ δ < 5x10⁻³ 1 1.5
5x10⁻⁴ ≤ δ < 10-3 1.5 2
10-4 ≤ δ < 5x10⁻⁴ 2.5 3
10-5 ≤ δ < 10-4 3.5 4
10-6 ≤ δ < 10-5 7.5 8
δ < 10-6 15.5 16

Univers i t i Teknologi Petronas • http://www.utp.edu.my
17PLATFORM • Volume 2 Number 1 • January – June 2001
The advantage is up to four orders ofmagnitude. However, this methodrequires two experiments withdifferent learning rates or momentumconstants to be conducted todetermine the better variation at eachiteration loop. We present below amomentum update rule thatdynamically adapts the momentumwith respect to the iteration number.
Momentum Constant Update Rule
Let ∆α ji(n,0) denote the positiveadjustment applied at iteration n tothe momentum constant at iteration0, α ji(0,0). We define ∆αji(n,0) as
(6)
for all n ∈ [a,b] where and
for a > c and b > d.
The constraint is imposed to ensure that0 < α ji(n) ≤ 1 as the momentumconstant α has to be in the range0 ≤ |α| ≤ 1 to ensure convergence ofthe learning algorithm.
The initial value of α, α ji(0,0) can bechosen to be any small value in theinterval [0,1]. Note that without lossof generality, we define ∆α ji(n,0) as apositive adjustment. If α is negative,then we will consider a negativeadjustment but it is unlikely that anegative α would be used in practice.
The iteration number domain ispartitioned into n intervals and asuitable value for the momentumconstant is assigned for each respectiveinterval. As n gets large, themomentum constant is incrementedgradually making sure that αji(n) is lessthat or equals to 1. This method onlyrequires n comparisons, where n is thenumber of iterations and no storagerequirement is demanded at all.
Simulation Set-up
The network consists of 460 input,12 hidden and 5 output nodescorresponding to the 5 classificationclasses. The values chosen for theparameters were η=0.5 and α=0.9.The weights were initialised accordingto the weights initialisation procedure[15], where they were initialised torandom values uniformly distributedin the range (–0.4/Inj, 0.4/Inj) whereInj is the total number of inputs toneuron j.
The architecture of the network, theweight initialisation procedure and thetermination value were the same as inSection 3.1. The value of the learningrate was η=0.5 and the momentumfactor were chosen to be α=0.9 in thefirst simulation and the momentumfactor update rule was used for thesecond simulation. The partition ofthe iteration number domain and theα values for each interval is shown isTable 3.
4. SIMULATION RESULTS
In this section, the ability of the MLPto generalise to new images will beimproved by including differentexpressions of face images, new faceimages and non-face images. The datafor training consisted of 5 differentimage classes with 5 differentexpressions per class: normal, facing20o to the left and to the right, facingupward 20° and downward 20°.Hence, there were 25 imagesaltogether trained to produce positiveoutput at their corresponding outputclass. There were also face images ofdifferent classes and non-face imagesadded in the training set. The totalnumber of images that were trainedto respond negative at all the outputnodes of the MLP is 20.
4.1 Learning Progression of
MLP
Table 4 shows the results of theseexperiments averaged over 5 trials.
A speedup of 96.7 % was obtained forthe DMF method while a speedup ofup to 96.5 % was obtained for theDLR methods. A constant multiplierof k= 30 for the DLR Method 1 andk = 20 for the DLR Method 2 did notgive convergence. This is due to thelarge η values yielding large weightadjustments and this makes the weightvector overshoot the minimum of theerror.
A clear insight into the behaviour ofthe learning algorithms is provided inFigure 2, in which both the horizontaland vertical scales are logarithmic. Itcan be observed that the DMFalgorithm outperforms the BPalgorithm right at the beginning of thelearning where the error sum decreasessharply until it reaches the thresholdvalue of ξav ≤ 0.001 at 653 iterations.The accelerated performance is due toits ability to assign an optimal valueto the momentum factor for everyiteration. From simulations it wasfound that the convergence rates ofboth the DLR methods increase as thevalue of k is increased. It was observedthat the best performance for the DLRMethods 1 and 2 occurred at valuesof k = 20 and k = 10 respectively.
Although the conjugate gradientmethod is able to provide a slightlybetter convergence rate than all theother methods, it nevertheless,requires much more complexity andcomputation per iteration than theother methods.
As for the DLR methods, it was foundthat the η values change considerablyduring the learning process, providingthe best progress in the reduction ofthe error function. The learning

PLATFORM • Volume 2 Number 1 • January – June 2001
18 Univers i t i Teknologi Petronas • http://www.utp.edu.my
curves of the DMF and DLRalgorithms exhibit an exponentialdecrease in the error as the number ofiteration increases. The learning curveof DLR Method 2 tends to slow afteran error sum of 0.04. The aboveobservations support the fact thatweight specific and iteration specificη values (DLR Method 1) is muchmore effective than only iterationspecific η values. (DLR Method 2).The CG method has a much fasterconvergence rate than the SD methodsince it uses second order informationto calculate the new direction, henceentails more complexity andcomputation.
4.2 Generalisation and
Rejection Capabilities of MLP
on Face and Non-Face
Images
The MLPs were tested for theirgeneralisation and rejectioncapabilities using test images, whichwere divided into two groups. The
Table 4: Simulation results using DLR of Methods
1 and 2 and the DMF.
Avg. No. % No. ofof improvement cases not
Algorithm iterations over BP converged
Batch BP 20045 - -
DLR (Method 2)
η*1 12656 36.89 -
η*5 4862 75.76 -
η*10 3228 83.90 3
η*20 - - 5(All)
DLR (Method 1)
η*1 9218 54.03 -
η*10 793 96.05 -
η*20 698 96.52 -
η*30 - - 5(All)
CG 355 98.23
SD 1955 90.25
DMF 653 96.74
Table 3: Chosen values of
the momentum factor α(n)
for each interval of the
iteration number domain
Iteration Value
Number (n) of α(n)
1 ≤ n < 100 0.5
100 ≤ n < 200 0.6
200 ≤ n < 300 0.7
300 ≤ n < 400 0.8
400 ≤ n < 500 0.9
500 ≤ n 1
Table 5: Recognition rates of
images in the testing sets
Algorithm Recognition Rate
of Testing Sets (%)
DB1 DB2
BP 97.2 94
DLR (Method 1)
η*1 96.4 96
η*5 98 98
η*10 95 100
DLR (Method 2)
η*1 97.2 95
η*10 96.8 90
η*20 96.6 98
DMF 96.8 92
CG 97.2 96
SD 97.4 96
Batch BP
Dynamic MF
Dynamic LR (Method 1)
Dynamic LR (Method 2)
Conjugate Gradient
Steepest Descent
0.001
0.01
0.1
1
10
100
10 100 1000 10000 100000
Number of Iterations
Su
m o
f S
qu
are
d E
rro
rs
Figure 2. Learning progression curves for DLR Methods 1 and 2, DMF, BP, SD
and CG algorithms (45 images)
Univers i t i Teknologi Petronas • http://www.utp.edu.my
19PLATFORM • Volume 2 Number 1 • January – June 2001
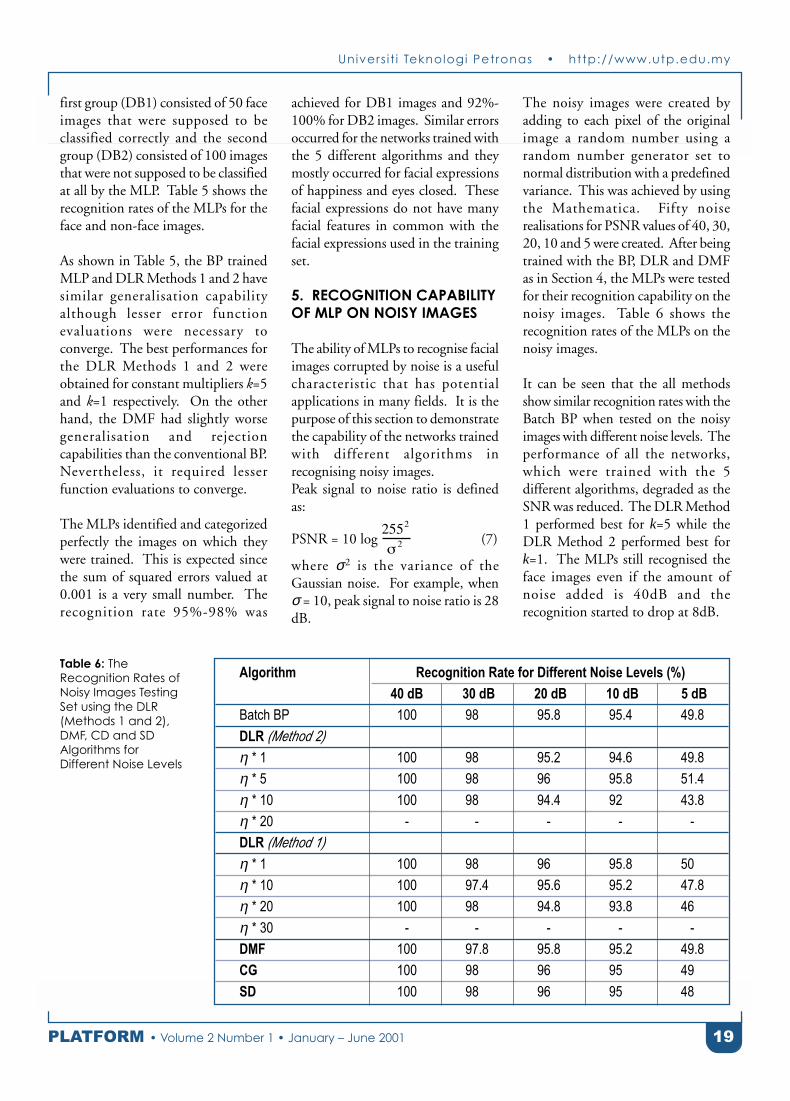
first group (DB1) consisted of 50 faceimages that were supposed to beclassified correctly and the secondgroup (DB2) consisted of 100 imagesthat were not supposed to be classifiedat all by the MLP. Table 5 shows therecognition rates of the MLPs for theface and non-face images.
As shown in Table 5, the BP trainedMLP and DLR Methods 1 and 2 havesimilar generalisation capabilityalthough lesser error functionevaluations were necessary toconverge. The best performances forthe DLR Methods 1 and 2 wereobtained for constant multipliers k=5and k=1 respectively. On the otherhand, the DMF had slightly worsegeneralisation and rejectioncapabilities than the conventional BP.Nevertheless, it required lesserfunction evaluations to converge.
The MLPs identified and categorizedperfectly the images on which theywere trained. This is expected sincethe sum of squared errors valued at0.001 is a very small number. Therecognition rate 95%-98% was
achieved for DB1 images and 92%-100% for DB2 images. Similar errorsoccurred for the networks trained withthe 5 different algorithms and theymostly occurred for facial expressionsof happiness and eyes closed. Thesefacial expressions do not have manyfacial features in common with thefacial expressions used in the trainingset.
5. RECOGNITION CAPABILITY
OF MLP ON NOISY IMAGES
The ability of MLPs to recognise facialimages corrupted by noise is a usefulcharacteristic that has potentialapplications in many fields. It is thepurpose of this section to demonstratethe capability of the networks trainedwith different algorithms inrecognising noisy images.Peak signal to noise ratio is definedas:
PSNR = 10 log (7)
where σ2 is the variance of theGaussian noise. For example, whenσ = 10, peak signal to noise ratio is 28dB.
The noisy images were created byadding to each pixel of the originalimage a random number using arandom number generator set tonormal distribution with a predefinedvariance. This was achieved by usingthe Mathematica. Fifty noiserealisations for PSNR values of 40, 30,20, 10 and 5 were created. After beingtrained with the BP, DLR and DMFas in Section 4, the MLPs were testedfor their recognition capability on thenoisy images. Table 6 shows therecognition rates of the MLPs on thenoisy images.
It can be seen that the all methodsshow similar recognition rates with theBatch BP when tested on the noisyimages with different noise levels. Theperformance of all the networks,which were trained with the 5different algorithms, degraded as theSNR was reduced. The DLR Method1 performed best for k=5 while theDLR Method 2 performed best fork=1. The MLPs still recognised theface images even if the amount ofnoise added is 40dB and therecognition started to drop at 8dB.
Table 6: The
Recognition Rates of
Noisy Images Testing
Set using the DLR
(Methods 1 and 2),
DMF, CD and SD
Algorithms for
Different Noise Levels
Algorithm Recognition Rate for Different Noise Levels (%)
40 dB 30 dB 20 dB 10 dB 5 dB
Batch BP 100 98 95.8 95.4 49.8
DLR (Method 2)
η * 1 100 98 95.2 94.6 49.8
η * 5 100 98 96 95.8 51.4
η * 10 100 98 94.4 92 43.8
η * 20 - - - - -
DLR (Method 1)
η * 1 100 98 96 95.8 50
η * 10 100 97.4 95.6 95.2 47.8
η * 20 100 98 94.8 93.8 46
η * 30 - - - - -
DMF 100 97.8 95.8 95.2 49.8
CG 100 98 96 95 49
SD 100 98 96 95 48

PLATFORM • Volume 2 Number 1 • January – June 2001
20 Univers i t i Teknologi Petronas • http://www.utp.edu.my
6. CONCLUSIONS
The acceleration methods namely,DLR and DMF are proven effectiveand superior in terms of convergencewhen tested and compared with theBatch BP on the face recognitionproblem. Based a training set thatconsists of 45 images, a speed up ofup to 96.5% and 96.7% was obtainedfor the DLR and DMF methodsrespectively.
In terms of generalisation capability,the DLR (Methods 1 and 2) showsimilar generalisation capabilityalthough lesser function evaluationsare necessary to converge. Thecapability of the networks to rejectnon-class images is also not impairedby the employment of theseacceleration methods. Nevertheless,it is important to note that the choiceof the appropriate size of η values iscrucial in ensuring the robustness ofthe networks in their recognition andrejection capabilities. The optimalconstant multiplier for the DLRMethods 1 and 2 was found to be k=5and k=1 respectively. The DMFmethod had a slightly worsegeneralisation capability than theBatch BP on the 45 images trainingset. This shows that the internalrepresentation that the networkstrained with DMF method was notable to provide sufficient informationto identify and categorise the images.In this respect, DLR methods 1 and2 are more promising in practicalapplications where generalisation isimportant.
The generalisation capability of theMLPs can be greatly enhanced byincluding multiple face images of thesame class with various orientationsand expressions in the training set.Inclusion of non-face images in thetraining set enables the networks to
reject images that do not belong to anyof the MLP output classes. This iscrucial since the networks must notonly be able to perform correctrecognition but also be able to rejectthe non-class images. When a newface is presented to a system, it is oftenvery important to be able to determinewhether the face is known or is astranger’s. This property could be veryuseful for practical applications tosecurity systems.
The MLPs trained with all the 5algorithms have similar capability torecognise the noisy images even whentraining has only been performed onnoise-free images and no imageenhancement has been carried outbefore classification. The MLPs areable to act as content-addressablememories; that is, they are able toreconstruct a face when a noisy imageof the face is given as input.
REFERENCES
[1] M H Ahmad Fadzil & H Abu Bakar.Human Face Recognition Using NeuralNetworks, Telekom Journal 1996; (8)1:20.
[2] M H Ahmad Fadzil & C C Lim. Feature-based Human Face Recognition Systems,Proc 2nd International Conference onNeural Networks and Expert Systems inMedicine and Healthcare (NNESMED),Plymouth, UK, 1996.
[3] M H Ahmad Fadzil & C C Lim. FaceRecognition Systems Based on NeuralNetworks and Fuzzy Logic, ProceedingsIEEE Int. Conference on NeuralNetworks, IEEE Press, 1997.
[4] M H Ahmad Fadzil & Zarita Zainuddin.Face Recognition Using Feed-ForwardNeural Networks (FNN), WorldEngineering Congress, July 19-22, KualaLumpur, Malaysia, 1999.
[5] J M Vincent, D J Myers & AHutchinson. Image Feature Location inMulti-Resolution Images Using aHierarchy of Multilayer Perceptron, InNeural Networks for Vision, Speech andNatural Language, Chapman & Hall,UK, 1992.
[6] D J Evans, M H Ahmad Fadzil &Z Zainuddin. Accelerating BackPropagation in Human FaceRecognition, Proc. IEEE Int. Conf. onNeural Networks, IEEE Press, 1997, pp.1347-1352.
[7] D J Evans & H Y Y Sanossian. AGradient Range Based HeuristicAlgorithm for Back Propagation, Journalof Microcomputer Applications, 1993;16, pp. 179-188.
[8] D R Hush & J M Salas. Improving theLearning Rate of Back-Propagation withthe Gradient Reuse Algorithm, Proc.IEEE Int. Conf. on Neural Networks,IEEE Press, 1988, pp. 441-447.
[9] R A Jacobs. Increased Rates ofConvergence Through Learning RateAdaptation, Neural Networks, 1988;(1)4: pp 295-308.
[10] R Salomon. Accelerating Back-propagation Through Dynamic Self-Adaptation, Neural Networks; 1996, (9)4: pp. 589-602.
[11] P P Van Der Smagt. MinimisationMethods for Training FeedforwardNeural Networks, Neural Networks,1994, (7)1: pp.1-11.
[12] Z Zainuddin & D J Evans. Accelerationof the Back Propagation ThroughDynamic Adaptation of the LearningRate, International Journal of ComputerMathematics, 1997, 334, 1-17.
[13] D M Alpsan, Towsey, O Ozdamar, A Tsoi& D N Ghista. Determining HearingThreshold From Brain Stem EvokedPotentials, IEEE Engineering inMedicine and Biology, 1994, pp. 465-471.
[14] D Cohn & G Tesauro. How Tight arethe Vapnik-Chervonenkis Bounds?Neural Computation. 4, 1994, pp. 249-269.
[15] Z Zainuddin. An Initialisation ofWeights Procedure to Improve theConvergence of the Back PropagationNeural Network Learning Algorithm,Proceedings of Research & Developmentin Computer Science & its Applications,Serdang, Malaysia, 1996, pp. 24-25.
[16] D J Evans & Z Zainuddin. Accelerationof the Back Propagation ThroughDynamic Adaptation of the Momentum,Neural, Parallel & ScientificComputations, 1997; (5) 3: pp 297-308.
Univers i t i Teknologi Petronas • http://www.utp.edu.my
21PLATFORM • Volume 2 Number 1 • January – June 2001
Elizabeth Durell, Dr Don Law and Dr Jeff Allen
Group Lotus, Hethel, Norwich, Norfolk, NR14 8EZ, UK.
ABSTRACT
The importance of natural gas as an alternative fuel has led Lotus to develop two new bi-fuelled gasoline and compressednatural gas (CNG) engines. The port injected (PI) engine has two sets of port injectors located in the inlet manifold. Inaddition, a direct injection (DI) engine was developed with a unique injection system able to run with either gasoline orcompressed natural gas (CNG), injecting directly into the combustion chamber. Both engines use the Lotus enginecontrol module (ECM) as a single controller for both fuels to allow full control of the calibration of both fuel systems.This paper presents emissions data demonstrating considerably reduced emissions and improved fuel economy fromboth engines.
Keywords: direct injection, natural gas, port injection.
An Emissions and Power Comparison
of Port and Direct Injection Bi-Fuel
(Gasoline and Compressed Natural Gas) Engines
This paper was presented at the International Conference on 21st Century Emissions Technologies (C588), London, 4 - 6 December 2000.
INTRODUCTION
Increasingly aggressive emissionslimits have led to the use of alternativefuels such as natural gas in internalcombustion engines. Natural gas hasmany advantages including lowemissions, abundant resources andlow costs. There are over 1 millionNGV vehicles on the road today,which include bi-fuel (gasoline andCNG), dual fuel (diesel and CNG)and dedicated (CNG only) vehicleseither as after-market conversions orOEM conversions. The CNG fuelsystems have developed from simplesingle-point injection to moreadvanced multi-point port injectionsystems. The disadvantages of presentCNG vehicles are the on-boardstorage problems, loss of powercompared to gasoline and a lack of anextensive refuelling infrastructure.Lotus has managed to overcome twoof these problems with the bi-fuel
Lotus Elise. The Lotus port injectedengine has two sets of injectors (onefor gasoline and one for CNG) in theinlet manifold. The gas storagecylinder is located within the chassisof the vehicle, hence no loss of luggageor passenger space. The use of theLotus ECM as a single controllerfacilitates automatic switchingbetween fuel systems and means theengine will switch to run on gasolinewhen full load is demanded, hence noloss of power. Recently, Lotus hastaken the technology one step furtherby investigating the use of CNG witha direct injection (DI) engine. Byfollowing the direction that gasolineinjection is taking, the sameadvantages of improved fuel economyand reduced emissions can be achievedwith CNG, therefore making the DI-CNG vehicle an even more attractivealternative. Emissions, fuel economyand performance results have beenobtained from these two unique
engines and the installation of theseengines in vehicles enable thedemonstration of this new technology.
EXPERIMENTAL AND RESULTS
Port Injection (PI) Engine
Objectives
The main objective of the portinjection programme was to developa fully operational bi-fueldemonstrator vehicle with anadvanced integrated gas storagecylinder and fuel control system. Thiswould utilise control of both fuels andmaintain fully flexible automaticswitching between the fuels with asingle engine management system(EMS). The vehicle was developed tobe fully refined with seamlessswitching and to be fully emissionscompliant on both fuels.

PLATFORM • Volume 2 Number 1 • January – June 2001
22 Univers i t i Teknologi Petronas • http://www.utp.edu.my
PI Gas Engine Configurationand Emissions Results
An additional fuel system was installedon the Elise consisting of a 40 litregas cylinder, pressure regulator, fuelrail and gas port injectors [1,2]. Theoriginal ECM was replaced with theLotus unit with which both fuelsystems are controlled. All work wascarried out in-vehicle using a standardchassis dynamometer and Horibaemissions analysers. After re-calibration of the Lotus ECM toprovide a baseline calibration,emissions tests were carried out whichcompared directly gasoline and CNGand this has been reported elsewhere[2]. Table 1 shows emissions resultstaken from the bi-fuel Elise. EuropeanStage 2 (EC96) emissions tests wereconducted, comparing gasoline vsCNG emissions achievable on theElise. It can be seen that emissionsresults from CNG fuelling are reducedby 70% HC+NOx, and 50% CO.CO2 emissions were reduced by 30%,which is also an indicator of fueleconomy improvement. Currentwork is focussing on Stage 3(EC2000) and Stage 4 (EC2005)emissions standards.
Direct Injection (DI)
Gas Engine
Objectives
Following on from the success of theport injected bi-fuel Elise, ourobjectives for the DI engineprogramme were to advance CNGtechnology in line with currentadvances in gasoline DI, to furtherimprove emissions and increase fueleconomy and performance. Data wasobtained from the engine andcompared to the port injection CNGand DI gasoline engines.
DI Gas Engine Configuration andTest Results
An existing 1.8 litre cylinder head wasmodified to accept a set of directinjectors. The injectors used wereprototype in nature and consisted of
air-assist gasoline direct injectors.These consist of two injectors in series;the first meters the fuel through to thesecond, which propels it into thecombustion chamber with the airsupply. By disconnecting the gasolinesupply and running CNG through theair rail and injectors, the engine couldeffectively be run as a DI CNG. Theinjectors are mounted under theintake ports at an angle ofapproximately 20o due to spaceconstraints, see Figure 1, as opposedto a more conventional downwardcentral injection geometry. Theinjectors are not fully designed for usewith CNG and hence the 6.5 bar fueldelivery pressure limit does not allowthe engine to be run across the entirespeed and load range. It is importantto note that the engine is also confinedto homogeneous operation. Fuelpressure delivery limitations togetherwith a conventional piston crown (ornon-assymetric piston crown)prohibited any stratified operation ofthe engine. It is envisaged that thiswork will happen in the near futureand will be reported elsewhere.
Initial testing was carried out on anengine dynamometer to investigatesteady state homogeneous conditions.Among others the following tests werecarried out: (1) investigation ofemissions and stability at varying airfuel ratio (AFR) values, (2) effects ofexhaust gas recirculation (EGR) and(3) engine powercurves. In parallelthrough collaborative efforts withLoughborough University, laserdiagnostic techniques (PDA and
Table 1: Emissions results comparing conventional (PI) gasoline results with
port injected gas results. These are in turn compared to current (Euro 2)
legislative standards.
Euro 2 (g/km) Gasoline (g/km) PI-Gas (g/km)
HC + NOx 0.5 0.17 0.05
CO 2.2 0.87 0.43
Figure 1: Diagram illustrating the injector to combustion chamber
and piston crown geometries for the direct CNG injector fitted to
the 1.8 litre engine.
Spark
plug
Injector
Combustion chamber
Piston
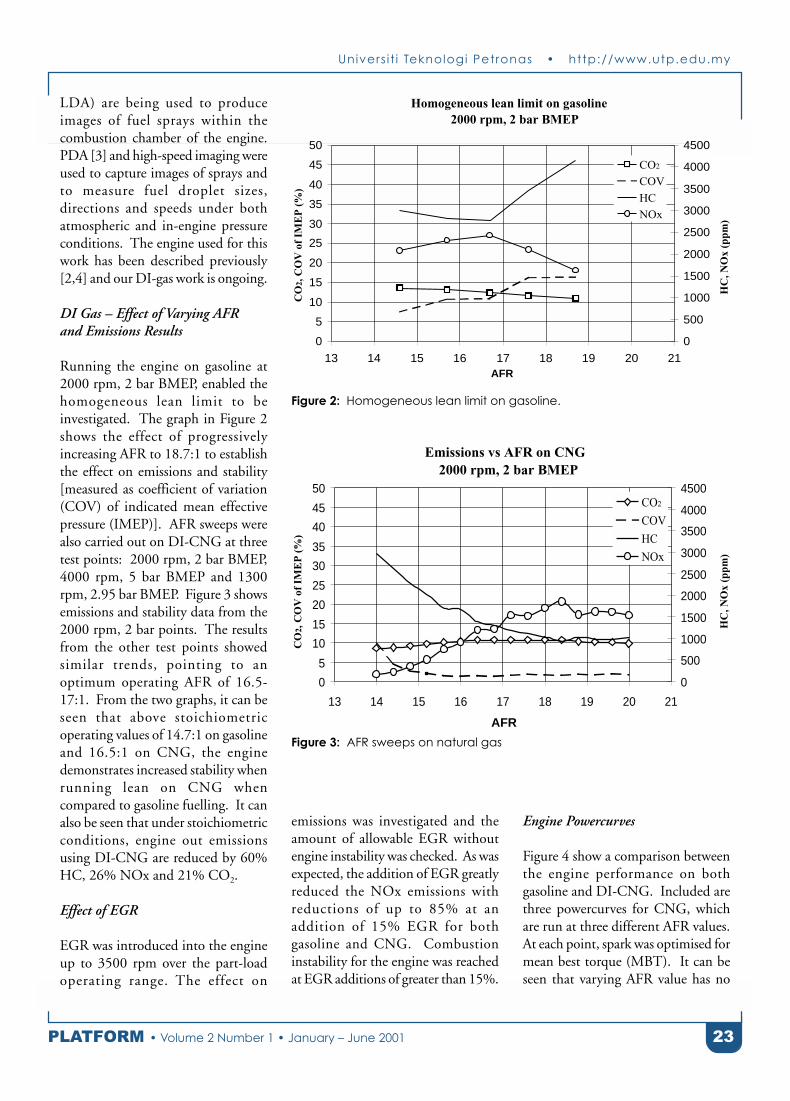
Univers i t i Teknologi Petronas • http://www.utp.edu.my
23PLATFORM • Volume 2 Number 1 • January – June 2001
LDA) are being used to produceimages of fuel sprays within thecombustion chamber of the engine.PDA [3] and high-speed imaging wereused to capture images of sprays andto measure fuel droplet sizes,directions and speeds under bothatmospheric and in-engine pressureconditions. The engine used for thiswork has been described previously[2,4] and our DI-gas work is ongoing.
DI Gas – Effect of Varying AFRand Emissions Results
Running the engine on gasoline at2000 rpm, 2 bar BMEP, enabled thehomogeneous lean limit to beinvestigated. The graph in Figure 2shows the effect of progressivelyincreasing AFR to 18.7:1 to establishthe effect on emissions and stability[measured as coefficient of variation(COV) of indicated mean effectivepressure (IMEP)]. AFR sweeps werealso carried out on DI-CNG at threetest points: 2000 rpm, 2 bar BMEP,4000 rpm, 5 bar BMEP and 1300rpm, 2.95 bar BMEP. Figure 3 showsemissions and stability data from the2000 rpm, 2 bar points. The resultsfrom the other test points showedsimilar trends, pointing to anoptimum operating AFR of 16.5-17:1. From the two graphs, it can beseen that above stoichiometricoperating values of 14.7:1 on gasolineand 16.5:1 on CNG, the enginedemonstrates increased stability whenrunning lean on CNG whencompared to gasoline fuelling. It canalso be seen that under stoichiometricconditions, engine out emissionsusing DI-CNG are reduced by 60%HC, 26% NOx and 21% CO2.
Effect of EGR
EGR was introduced into the engineup to 3500 rpm over the part-loadoperating range. The effect on
Homogeneous lean limit on gasoline 2000 rpm, 2 bar BMEP
0
5
10
15
20
25
30
35
40
45
50
13 14 15 16 17 18 19 20 21AFR
CO
2, C
OV
of
IME
P (
%)
0
500
1000
1500
2000
2500
3000
3500
4000
4500
HC
, NO
x (p
pm)
CO2
COV
HC
NOx
Figure 2: Homogeneous lean limit on gasoline.
Emissions vs AFR on CNG2000 rpm, 2 bar BMEP
0
5
10
15
20
25
30
35
40
45
50
13 14 15 16 17 18 19 20 21
AFR
CO
2, C
OV
of
IME
P (
%)
0
500
1000
1500
2000
2500
3000
3500
4000
4500
HC
, NO
x (p
pm)
CO2
COV
HC
NOx
Figure 3: AFR sweeps on natural gas
emissions was investigated and theamount of allowable EGR withoutengine instability was checked. As wasexpected, the addition of EGR greatlyreduced the NOx emissions withreductions of up to 85% at anaddition of 15% EGR for bothgasoline and CNG. Combustioninstability for the engine was reachedat EGR additions of greater than 15%.
Engine Powercurves
Figure 4 show a comparison betweenthe engine performance on bothgasoline and DI-CNG. Included arethree powercurves for CNG, whichare run at three different AFR values.At each point, spark was optimised formean best torque (MBT). It can beseen that varying AFR value has no
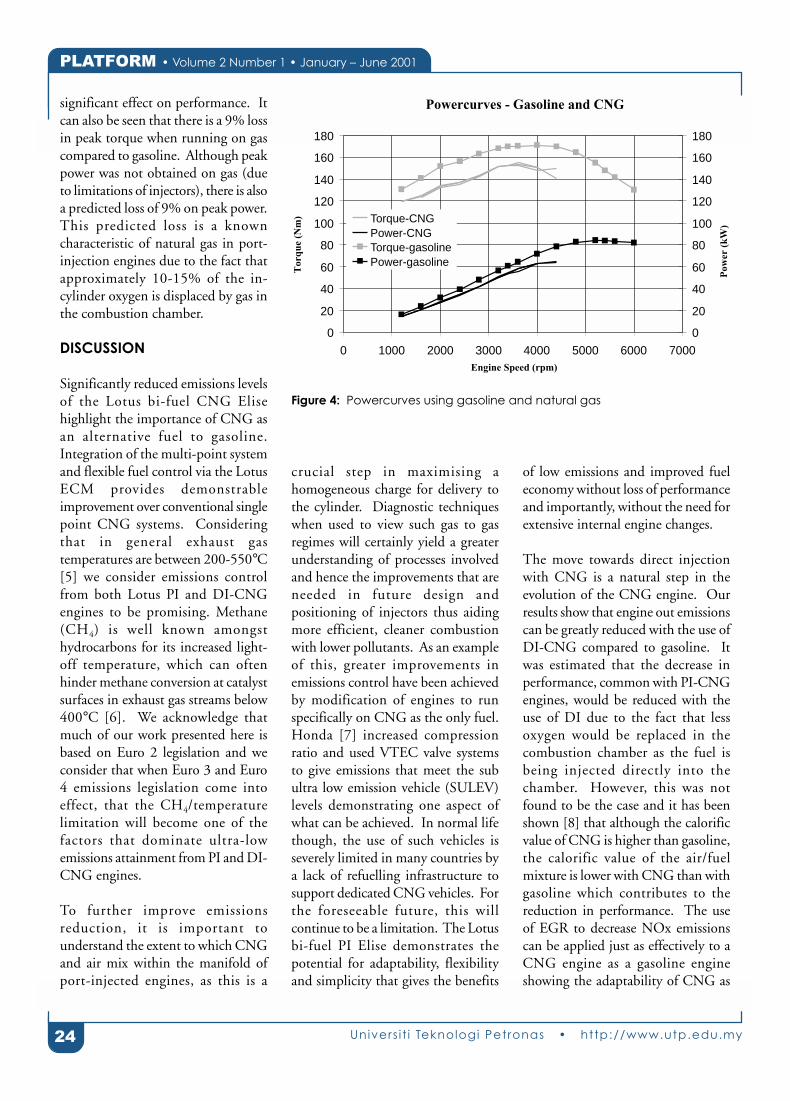
PLATFORM • Volume 2 Number 1 • January – June 2001
24 Univers i t i Teknologi Petronas • http://www.utp.edu.my
significant effect on performance. Itcan also be seen that there is a 9% lossin peak torque when running on gascompared to gasoline. Although peakpower was not obtained on gas (dueto limitations of injectors), there is alsoa predicted loss of 9% on peak power.This predicted loss is a knowncharacteristic of natural gas in port-injection engines due to the fact thatapproximately 10-15% of the in-cylinder oxygen is displaced by gas inthe combustion chamber.
DISCUSSION
Significantly reduced emissions levelsof the Lotus bi-fuel CNG Elisehighlight the importance of CNG asan alternative fuel to gasoline.Integration of the multi-point systemand flexible fuel control via the LotusECM provides demonstrableimprovement over conventional singlepoint CNG systems. Consideringthat in general exhaust gastemperatures are between 200-550°C[5] we consider emissions controlfrom both Lotus PI and DI-CNGengines to be promising. Methane(CH4) is well known amongsthydrocarbons for its increased light-off temperature, which can oftenhinder methane conversion at catalystsurfaces in exhaust gas streams below400°C [6]. We acknowledge thatmuch of our work presented here isbased on Euro 2 legislation and weconsider that when Euro 3 and Euro4 emissions legislation come intoeffect, that the CH4/temperaturelimitation will become one of thefactors that dominate ultra-lowemissions attainment from PI and DI-CNG engines.
To further improve emissionsreduction, it is important tounderstand the extent to which CNGand air mix within the manifold ofport-injected engines, as this is a
crucial step in maximising ahomogeneous charge for delivery tothe cylinder. Diagnostic techniqueswhen used to view such gas to gasregimes will certainly yield a greaterunderstanding of processes involvedand hence the improvements that areneeded in future design andpositioning of injectors thus aidingmore efficient, cleaner combustionwith lower pollutants. As an exampleof this, greater improvements inemissions control have been achievedby modification of engines to runspecifically on CNG as the only fuel.Honda [7] increased compressionratio and used VTEC valve systemsto give emissions that meet the subultra low emission vehicle (SULEV)levels demonstrating one aspect ofwhat can be achieved. In normal lifethough, the use of such vehicles isseverely limited in many countries bya lack of refuelling infrastructure tosupport dedicated CNG vehicles. Forthe foreseeable future, this willcontinue to be a limitation. The Lotusbi-fuel PI Elise demonstrates thepotential for adaptability, flexibilityand simplicity that gives the benefits
of low emissions and improved fueleconomy without loss of performanceand importantly, without the need forextensive internal engine changes.
The move towards direct injectionwith CNG is a natural step in theevolution of the CNG engine. Ourresults show that engine out emissionscan be greatly reduced with the use ofDI-CNG compared to gasoline. Itwas estimated that the decrease inperformance, common with PI-CNGengines, would be reduced with theuse of DI due to the fact that lessoxygen would be replaced in thecombustion chamber as the fuel isbeing injected directly into thechamber. However, this was notfound to be the case and it has beenshown [8] that although the calorificvalue of CNG is higher than gasoline,the calorific value of the air/fuelmixture is lower with CNG than withgasoline which contributes to thereduction in performance. The useof EGR to decrease NOx emissionscan be applied just as effectively to aCNG engine as a gasoline engineshowing the adaptability of CNG as
Powercurves - Gasoline and CNG
0
20
40
60
80
100
120
140
160
180
0 1000 2000 3000 4000 5000 6000 7000Engine Speed (rpm)
Tor
que
(Nm
)
0
20
40
60
80
100
120
140
160
180
Pow
er (
kW)
Torque-CNGPower-CNGTorque-gasolinePower-gasoline
Figure 4: Powercurves using gasoline and natural gas

Univers i t i Teknologi Petronas • http://www.utp.edu.my
25PLATFORM • Volume 2 Number 1 • January – June 2001
a fuel that is responsive to emissionsreduction techniques alreadyimplemented with gasoline. Onceagain, an understanding of the gas togas interaction formation and fuel/airmixing in the combustion chamber isvital to refining the combustionprocess (both on gasoline and CNG)and further aiding emissions and fuelconsumption reduction.
More recently, a specially designedoptical access engine has been built[4], based on a 0.45 litre singlecylinder, with the same internalspecifications as the DI-CNG engine.This has an un-paralleled degree ofoptical access and is able to run atspeeds up to 5000 rpm and pressuresup to 60 bar. This engine is being beused for detailed analysis of CNGinjector events (using Schlierenimaging) and fuel mixing, enablingthe design and development of CNGspecific direct injectors with the aimof improving the combustion processand hence reducing emissions.
FURTHER WORK
Further work will be carried out onthe port injection bi-fuel Elise toinvestigate the use of CNG-specificequipment such as oxygen sensors orcatalysts. This will show the extent towhich the fuel control and emissionscan be controlled on after marketconversions. The GDI engine ispresently being installed in a vehicleto produce a technologydemonstrator. This will be used forback to back comparisons of vehicleemissions and fuel economy betweengasoline and CNG.
Lotus will continue detailed fuel andgas mixing and combustion analysis.The use of laser diagnostics techniquesand a single cylinder optical accessengine will improve theunderstanding of the fundamentalcombustion events taking place withCNG direct injection. This will leadto an understanding of therequirements needed for successfulDI-CNG and the development of aspecialised CNG direct injector,allowing further improvements inemissions and fuel economy.
CONCLUSIONS
The development of the bi-fuel LotusElise has highlighted theimprovements to emissions overgasoline, improved by the integrationof the system in the vehicle andimproved fuel control using the singleLotus ECM. The benefits of usingCNG have been further investigatedby the development of a directinjection CNG engine showingengine out emissions reductions of60% HC, 26% NOx and 21% CO2.
Lotus bi-fueled Elise, with a gas rangeof 90 miles and petrol (gasoline) rangeof 150 miles. Switching between thefuels is automatic using the Lotusengine management system.
ACKNOWLEDGEMENTS
We wish to thank Chris Knight, Dave Taitt,Clive Dopson and Simon Wood (Directors ofGroup Lotus plc) for their support andfunding of this research project.
REFERENCES
[1] E Durell. Installation and Developmentof CNG System for a Bi-Fuel Gasolineand CNG Vehicle, Engine ExpoHamburg, 1999.
[2] J Allen, & E Durell. JSAE 9935482,Proc. 15th Int. Comb. Eng. Symp.,Seoul, Korea, July 13th-16th, 1999.
[3] G Wigley, G Hargrave, & J Heath. AHigh Power, High Resolution LDA/PDASystem Applied to Dense Gasoline DirectInjection Sprays, ILASS 1998.
[4] J Allen, D Law, G Pitcher & P Williams.ISATA 00POW004, Dublin, 25th-27thSeptember 2000.
[5] H Yamamoto, S Satokawa, M Yahagi, KYamaseki, F Hoshi, H Uchida & HYokota. Proc. 21st World GasConference, Nice, 6-9th June 2000.
[6] R Burch, F J Urbano & P K Loader.Proceedings of the Catalysis Congress,Pisa, 1995, p159-162.
[7] T Suga, T Muraishi, T Brachmann & FYatabe. SAE 2000-01-1863.
[8] C R F Barbosa, M R da Silva & S WCelere. SAE 982991.

PLATFORM • Volume 2 Number 1 • January – June 2001
26 Univers i t i Teknologi Petronas • http://www.utp.edu.my
FVVT BASED CAI
COMBUSTION
It is well recognised that for some timenow, innovative work in the field offully variable valve trains (FVVTs) hascentred on the Lotus active valve train(AVT) system [1-3]. AVT isrecognised specifically for (1) anadvanced combustion strategy, (2)valve operating strategy research and(3) cam profiling development. Basedon the versatility and flexibility of thissystem many other approaches arebeing investigated. Increasingdevelopment and prototype activityhas been observed with electro-mechanically (and magnetically)actuated and electro-hydraulicallyactuated valve systems. Others [4]have reported preliminary results oftheir development work, thoughmuch of this work centres on the valveactuation processes itself, rather thanfocussing on advanced valve timings
and hence combustionmethodologies. Such methodologiesare contained within complex anddynamic valve strategies. The workpresented here represents one suchstrategy using advanced combustionmethodologies. The principle hasbeen described elsewhere [5, 20]. Itis logical to infer, therefore, that it willnot be too long before modular,production ready, electricallycontrolled and actuated valves becomeavailable and commonplace ininternal combustion (IC) engines.This in itself will extend the usefulnessand life of internal combustionengines. AVT has given us the abilityto probe mechanical cam-less horizonsand to be able to experiment withinnovative combustionmethodologies. Controlled auto-ignition (CAI) is a term that has beenused to describe this form ofcombustion and there are manyothers, such as HCCI, ATAC, PCCI
etc. It is not the intention of this paperto open a debate over the correct namefor the precise type of combustiondemonstrated here, rather todemonstrate that internal EGR can beachieved using AVTs. Fully flexiblevalve trains (FVVTs) are thus key tocontrolling and exploiting thesequencing, valve timings, gas mixingand exchange in dynamic combustioncontrol. CAI is well recognised in the2-stroke world [6-17] but reportedattempts in the 4-stroke world [18-19] are limited and found to befundamentally limited by (1) lack ofcontrol of the valve events using fixedprofile cams; and (2) the clearlydominant need for intake air:fuelmixtures to be pre-heated (in someinstances quite drastically). This needis alleviated entirely using the AVTcombustion process [20]. Our initialdata shows that the combustionprocess reduces NOx and COemissions compared to conventional
Controlled Auto-Ignition (CAI)
Using A Fully Variable Valve Train (FVVT)
Dr Don Law, Dan Kemp, Dr Jeff Allen and Dr Simon Wood
Group Lotus Ltd, Hethel, Norwich, Norfolk, NR15 1SG, UK
ABSTRACT
Two methods have been achieved of facilitating controlled auto-ignition (CAI) combustion in a 4-stroke engine. Thishas been accomplished without the need to pre-heat intake air and was made possible through the use of the Active ValveTrain (AVT) system. AVT was used to vary the amount of trapped exhaust gasses (otherwise known as exhaust residuals)inside the cylinder prior to the compression stroke. Both methods represent examples of internal exhaust gas recirculation(EGR). It was observed that the amount of internal EGR determined the combustion initiation point as a function ofcrank angle, thus demonstrating that both methods are controllable reproducible processes. Initial results (taken at2000 rpm and 3.5 bar IMEP) show that this combustion significantly reduces fuel consumption and CO/HC/NOxemissions compared to conventional spark ignition combustion. Data presented here represents published results of ourinternal EGR methodologies.
Keywords: Controlled auto-ignition, combustion, fully flexible valve trains.
This paper was presented at the Society of Automotive Engineers, 5 March 2001.
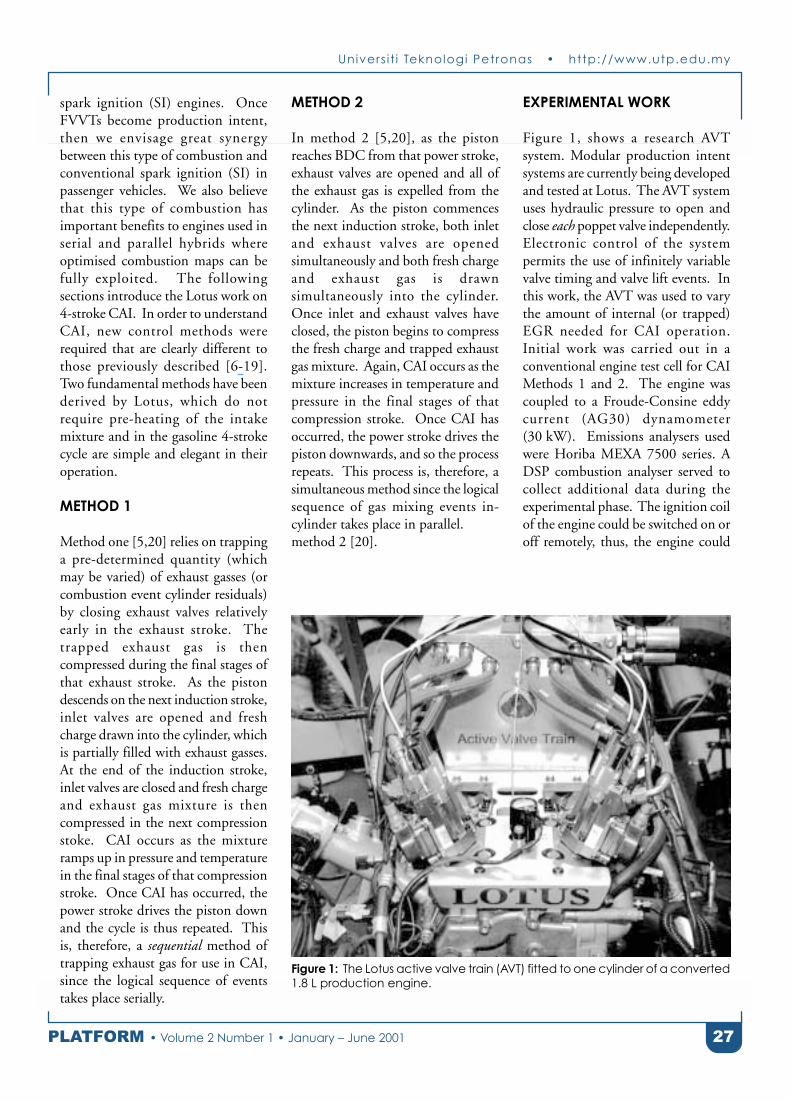
Univers i t i Teknologi Petronas • http://www.utp.edu.my
27PLATFORM • Volume 2 Number 1 • January – June 2001
spark ignition (SI) engines. OnceFVVTs become production intent,then we envisage great synergybetween this type of combustion andconventional spark ignition (SI) inpassenger vehicles. We also believethat this type of combustion hasimportant benefits to engines used inserial and parallel hybrids whereoptimised combustion maps can befully exploited. The followingsections introduce the Lotus work on4-stroke CAI. In order to understandCAI, new control methods wererequired that are clearly different tothose previously described [6-19].Two fundamental methods have beenderived by Lotus, which do notrequire pre-heating of the intakemixture and in the gasoline 4-strokecycle are simple and elegant in theiroperation.
METHOD 1
Method one [5,20] relies on trappinga pre-determined quantity (whichmay be varied) of exhaust gasses (orcombustion event cylinder residuals)by closing exhaust valves relativelyearly in the exhaust stroke. Thetrapped exhaust gas is thencompressed during the final stages ofthat exhaust stroke. As the pistondescends on the next induction stroke,inlet valves are opened and freshcharge drawn into the cylinder, whichis partially filled with exhaust gasses.At the end of the induction stroke,inlet valves are closed and fresh chargeand exhaust gas mixture is thencompressed in the next compressionstoke. CAI occurs as the mixtureramps up in pressure and temperaturein the final stages of that compressionstroke. Once CAI has occurred, thepower stroke drives the piston downand the cycle is thus repeated. Thisis, therefore, a sequential method oftrapping exhaust gas for use in CAI,since the logical sequence of eventstakes place serially.
METHOD 2
In method 2 [5,20], as the pistonreaches BDC from that power stroke,exhaust valves are opened and all ofthe exhaust gas is expelled from thecylinder. As the piston commencesthe next induction stroke, both inletand exhaust valves are openedsimultaneously and both fresh chargeand exhaust gas is drawnsimultaneously into the cylinder.Once inlet and exhaust valves haveclosed, the piston begins to compressthe fresh charge and trapped exhaustgas mixture. Again, CAI occurs as themixture increases in temperature andpressure in the final stages of thatcompression stroke. Once CAI hasoccurred, the power stroke drives thepiston downwards, and so the processrepeats. This process is, therefore, asimultaneous method since the logicalsequence of gas mixing events in-cylinder takes place in parallel.method 2 [20].
EXPERIMENTAL WORK
Figure 1, shows a research AVTsystem. Modular production intentsystems are currently being developedand tested at Lotus. The AVT systemuses hydraulic pressure to open andclose each poppet valve independently.Electronic control of the systempermits the use of infinitely variablevalve timing and valve lift events. Inthis work, the AVT was used to varythe amount of internal (or trapped)EGR needed for CAI operation.Initial work was carried out in aconventional engine test cell for CAIMethods 1 and 2. The engine wascoupled to a Froude-Consine eddycurrent (AG30) dynamometer(30 kW). Emissions analysers usedwere Horiba MEXA 7500 series. ADSP combustion analyser served tocollect additional data during theexperimental phase. The ignition coilof the engine could be switched on oroff remotely, thus, the engine could
Figure 1: The Lotus active valve train (AVT) fitted to one cylinder of a converted
1.8 L production engine.
PLATFORM • Volume 2 Number 1 • January – June 2001
28 Univers i t i Teknologi Petronas • http://www.utp.edu.my
be operated in SI mode, pure CAImode (no spark) or in a hybrid CAI-SI spark-assisted mode (CAI with aretarded spark event). Tests wereconducted to investigate the effect ofinternal EGR and air-fuel-ratio (AFR)on indicated specific fuelconsumption (ISFC) and emissionsfor CAI in order to compare how ourCAI results compared to conventionalspark ignition modes. The effect ofspark itself was investigated to see ifthere were additional benefits on fuelconsumption and emissions reductionto be gained from running in spark-assisted CAI mode. The baselinecondition was spark ignition withmean best torque (MBT) ignitiontiming at 2000 rpm, 3.5 bar indicatedmean effective pressure (IMEP) withconventional valve timing events.Throughout all the tests, coolant-outtemperature and peak valve lifts werekept constant and intake airtemperature was fixed at 25°C.
RESULTS
In a previous paper [20], we describedinitial observations of our CAI workand proposed a number of potentialmechanistic paths detailing keycombinations of pressure (P),temperature (T) and chemical species(CS). CS may be either (1) trapped
in the residual exhaust gases or (2)newly formed in-cylinder as a functionof P and T. Through our partnershipwith Loughborough University (UK),our work is ongoing into investigatingthe importance of such CS inpromoting or moderating CAIcombustion events. This will bereported elsewhere. Currently,experimental work is focussing onmapping engine speeds (1000 - 4500rpm) and load ranges (2.0 - 10.0 bar,IMEP) in order to gain insight intothe full range through which anengine can be operated in CAIcombustion using methods 1 and 2.In our opinion, we believe it is notvalid to compare brake specificparameters when comparing baselineSI combustion modes with CAIcombustion modes of operationbecause of the greater pumping workassociated with running conventionalthrottled SI combustion. In CAImodes, the engine was run un-throttled and so the load wascontrolled entirely using the AVTsystem. For this important reason, allof our engine parameter comparisonswill be discussed in terms of in-cylinder or indicated parameters. Wehave included a breakdown of ouractual calculation methods to assistclarity and this is detailed at the endof the paper.
CYLINDER PRESSURE TRACES
Figure 2, shows the resultant pressureprofiles (compression and expansionstrokes only) for methods 1 and 2compared with a pressure profileobtained for a conventional SIcombustion event at a constant speed,load and AFR. In Figure 2, thebaseline SI condition was throttledwhilst the CAI mode was un-throttled(i.e. load controlled through valvetiming events and by varying theamount of internal EGR). In CAIcombustion method 1, there is somepumping work associated with thecompression and expansion of thetrapped residual gas when the exhaustvalve is closed early in the exhauststroke during CAI modes ofoperation, however, this is relativelysmall. In Figure 2, there are twoimportant observations regardingcombustion derived from CAI usinginternal EGR or residual gasrecirculation. Namely, (1) despitefundamental differences between CAImethods 1 and 2 (sequential vs.simultaneous trapping of exhaust gas),both produce remarkably similarpressure profiles and (2) the pressureprofiles for CAI methods 1 and 2 showa rising profile due to compressionfollowed by a clear and distinct delayperiod before CAI combustion isinitiated. Figure 3, presents moreevidence to support this distinct delayphenomenon. It is clear that byvarying the valve timing events inorder to progressively increase thequantity of trapped exhaust gasesusing method 1, that the initiation ofCAI combustion can be progressivelyadvanced toward cylinder top-dead-centre (TDC). Figure 3, thusdemonstrates that CAI using internalEGR is a controllable combustionprocess and is thus completelydifferent to detonation (oruncontrolled auto-ignition) in 4-stroke engines.
Engine Type Single Cylinder with Active Valve Train
Bore x Stroke (mm) 80.5 x 88.2
Swept Volume (cm3) 450
Compression Ratio, Geometric 10.5:1
No. of Valves per Cylinder 4
Valve Control Electro-Hydraulic Active Valve Train (AVT)
Cylinder Pressure Measurement Kistler Type 6125A Pressure Transducer
Intake Air Temperature Controlled to 25°C
Speed/Load Range Investigated 2000 rpm, 2-5 bar IMEP
Fuel Type Used 95 RON
Ignition Control Switchable coil on plug (On or Off)
Table 1: Information describing the engine

Univers i t i Teknologi Petronas • http://www.utp.edu.my
29PLATFORM • Volume 2 Number 1 • January – June 2001
COMBUSTION
STABILITY
Figure 4, illustrates theincreased combustionstability obtained with CAI.In the upper of the twoframes, conventional SIengine pressure traces can beseen which a noticeablevariation in the combustionevent and this can becompared directly to thelower of the two framesdepicting CAI Method 1. Itis clear that the CAI processis very reproducible andconsistent.
By far the most significantbenefit to be seen from CAIto date is the improvementin specific NOx emissions(Figure 5). In percentageterms, the reduction in NOxemissions from pure CAI isgreater than 90% across thewhole range of air:fuel ratiosinvestigated. It is alsoevident that spark-assistedCAI offers no further benefitto NOx reduction than pureCAI. The reduction in NOxis believed to be primarilydue to dilution from thehigh levels of residualexhaust gas (approx. 41%internal EGR in this case).The dilution effect of theinternal EGR reduces the O2
concentration, slowingdown the combustion rate,and therefore, lowering peakcylinder pressures andtemperatures. Thisultimately results in lowerNOx formation.
Figure 2: Cylinder pressure trace comparisons of conventional spark ignition with CAI
methods 1 and 2 at 2000rpm, 4.2bar IMEP.
Figure 3: Cylinder Pressure trace data for CAI method 1 for different quantities of internal
EGR.
0
5
10
15
20
25
30
35
40
45
50
-90 -80 -70 -60 -50 -40 -30 -20 -10 0 10 20 30 40 50 60 70 80 90
Crank Angle Degrees (Degs ATDC)
Cyl
inde
r P
ress
ure
(Bar
)
Spark Ignition, 14.6:1 AFR, MBTIgnition, Throttled
CAI Method 1, 14.7:1 AFR,Unthrottled
CAI Method 2, 14.8:1 AFR,Unthrottled
Cylinder Pressure Comparisons for Spark Ignition andControlled Auto-Ignition Methods 1 and 2 @ 2000 rpm 4.2 Bar IMEP
Controlled Auto-Ignition Method 1:Cylinder Pressure vs. Crank Angle Degrees
59% Internal EGR
55% Internal EGR
50% Internal EGR
46% Internal EGR
41% Internal EGR
36% Internal EGR
0
5
10
15
20
25
30
35
40
Crank Angle Degrees (Degs ATDC)
-90 -80 -70 -60 -50 -40 -30 -20 -10 0 10 20 30 40 50 60 70 80 90
Cyl
inde
r P
ress
ure
(Bar
)

PLATFORM • Volume 2 Number 1 • January – June 2001
30 Univers i t i Teknologi Petronas • http://www.utp.edu.my
DISCUSSION
It is clear, that by using fully flexiblevalve trains (FVVTs), and therebyinternal EGR or residual exhaust gasrecirculation [21] CAI can befacilitated without the need to pre-heat either the intake air or intakeair:fuel charge fed into the cylinder.FFVT are key to this process and othervariations of advanced 2-stroke and 4-stroke combustion methodologies.Najt and Foster [22] in theircompression ignited homogeneouscharge (CIHC) combustion worklooked specifically at detailed chemicalkinetics. Their work examined themechanisms governing thecombustion process and the effect ofvarious engine parameters, specifically,how the ignition event and subsequentenergy release processes are controlledor affected by such parameters. Najtand Foster point out that the amountof EGR added (through externalEGR), will determine whether or notthe initial charge gas temperature issufficient for successful combustion.In addition, Najt and Foster commentthat the elementary reaction kineticsthat control the ignition process arequite temperature sensitive, with theeffect of advancing the ignition andthat furthermore, despite the
Figure 5: Effect of air:fuel ratio on specific NOx emissions for conventional S.I.;
CAI and Spark-Assisted CAI at 2000 rpm and 3.5 bar IMEP.
temperature sensitivity, the rate ofenergy release is only slightly increasedby increases in the amount of EGR.These observations differfundamentally from the workreported in this paper, where cleardifferences are seen. Najt and Fosterconclude that it is unlikely that anychemical species present in the exhaustalter the CIHC ignition process andpoint out that EGR primarily controlsthe combustion process by regulatingtemperature. Thring [23] in a paperon HCCI combustion with an enginecompression ratio of 8:1, 13-33%
EGR and inlet temperaturesapproaching 370°C, again states thattiming of the commencement ofcombustion is regulated by theamount of EGR and the temperatureof the charge (achieved via externalEGR). At 315°C, engine knock isencountered and then as thetemperature is increased to 370°C,HCCI combustion took place and theengine was then mapped according toEGR input. Thring calculated thatbefore HCCI could be made practicalit would be necessary to find ways ofoperating engines in HCCI mode
0
1
2
3
4
5
6
7
8
9
10
11
12
13 13.5 14 14.5 15 15.5 16 16.5 17 17.5 18 18.5 19 19.5 20
AFR_Spindt (:1)
ISN
Ox
Em
issi
ons
(g/k
W.h
)
Baseline SI
Spark Assisted AC 41% Internal EGR
AC (IGN OFF) 41% Internal EGR
Figure 4: Combustion stability for conventional S.I. (left) and CAI (right) at 2000 rpm and 3.5 bar IMEP, 14.6:1 AFR.
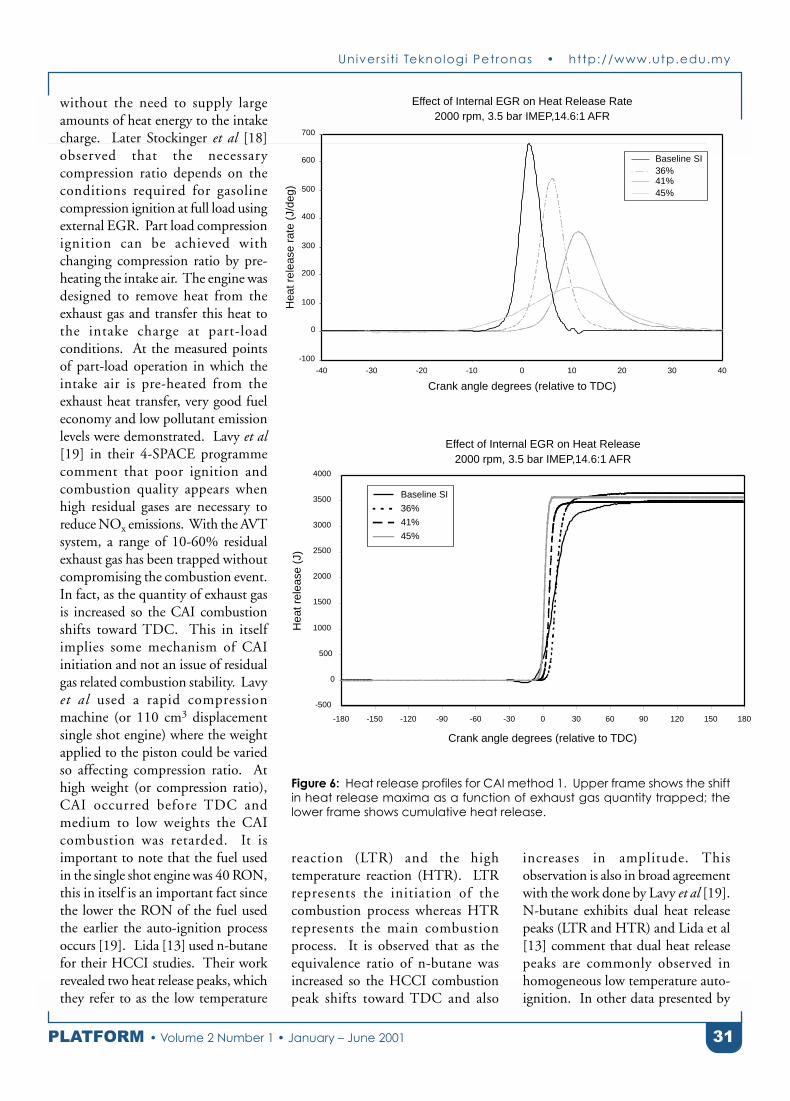
Univers i t i Teknologi Petronas • http://www.utp.edu.my
31PLATFORM • Volume 2 Number 1 • January – June 2001
without the need to supply largeamounts of heat energy to the intakecharge. Later Stockinger et al [18]observed that the necessarycompression ratio depends on theconditions required for gasolinecompression ignition at full load usingexternal EGR. Part load compressionignition can be achieved withchanging compression ratio by pre-heating the intake air. The engine wasdesigned to remove heat from theexhaust gas and transfer this heat tothe intake charge at part-loadconditions. At the measured pointsof part-load operation in which theintake air is pre-heated from theexhaust heat transfer, very good fueleconomy and low pollutant emissionlevels were demonstrated. Lavy et al[19] in their 4-SPACE programmecomment that poor ignition andcombustion quality appears whenhigh residual gases are necessary toreduce NOx emissions. With the AVTsystem, a range of 10-60% residualexhaust gas has been trapped withoutcompromising the combustion event.In fact, as the quantity of exhaust gasis increased so the CAI combustionshifts toward TDC. This in itselfimplies some mechanism of CAIinitiation and not an issue of residualgas related combustion stability. Lavyet al used a rapid compressionmachine (or 110 cm3 displacementsingle shot engine) where the weightapplied to the piston could be variedso affecting compression ratio. Athigh weight (or compression ratio),CAI occurred before TDC andmedium to low weights the CAIcombustion was retarded. It isimportant to note that the fuel usedin the single shot engine was 40 RON,this in itself is an important fact sincethe lower the RON of the fuel usedthe earlier the auto-ignition processoccurs [19]. Lida [13] used n-butanefor their HCCI studies. Their workrevealed two heat release peaks, whichthey refer to as the low temperature
increases in amplitude. Thisobservation is also in broad agreementwith the work done by Lavy et al [19].N-butane exhibits dual heat releasepeaks (LTR and HTR) and Lida et al[13] comment that dual heat releasepeaks are commonly observed inhomogeneous low temperature auto-ignition. In other data presented by
Figure 6: Heat release profiles for CAI method 1. Upper frame shows the shift
in heat release maxima as a function of exhaust gas quantity trapped; the
lower frame shows cumulative heat release.
-100
0
100
200
300
400
500
600
700
-40 -30 -20 -10 0 10 20 30 40
Effect of Internal EGR on Heat Release Rate2000 rpm, 3.5 bar IMEP,14.6:1 AFR
Crank angle degrees (relative to TDC)
Hea
t rel
ease
rat
e (J
/deg
)
Baseline SI36%41%45%
Effect of Internal EGR on Heat Release2000 rpm, 3.5 bar IMEP,14.6:1 AFR
-500
0
500
1000
1500
2000
2500
3000
3500
4000
-180 -150 -120 -90 -60 -30 0 30 60 90 120 150 180
Crank angle degrees (relative to TDC)
Hea
t rel
ease
(J)
Baseline SI
36%
41%
45%
reaction (LTR) and the hightemperature reaction (HTR). LTRrepresents the initiation of thecombustion process whereas HTRrepresents the main combustionprocess. It is observed that as theequivalence ratio of n-butane wasincreased so the HCCI combustionpeak shifts toward TDC and also
PLATFORM • Volume 2 Number 1 • January – June 2001
32 Univers i t i Teknologi Petronas • http://www.utp.edu.my
Lida et al, it is clear that bothstoichiometry and inlet temperatureboth increase the HTR peak rate ofheat release and shift the maximatoward TDC. In short, in HCCI ofN-butane, temperature increases theHTR and shifts the peaks towardTDC whilst increasing theequivalence ratio increases the HTRbut causes no shift toward TDC. Thedistance between the LTR and HTRheat release peaks with increasingequivalence ratio decreases. Webelieve that in view of the previousstudies we have to attempt to be clearabout what type of combustion we areexperimenting with. Important inunderstanding and thusdifferentiating internal EGR CAIfrom that of HCCI, CIHC and PCCIare the characteristic heat releaseprofiles. Figure 6, shows the heatrelease profiles calculated (using theRassweiler-Withrow approximation[24]) from the work presented here.The figure compares a conventionalstoichiometric combustion event withthat of CAI, method 1. First, it canbe seen that a single heat release profileis obtained for internal EGRquantities of 36, 41 and 45%. TheCAI method using internal EGR thusdiffers from HCCI in that all reportedHCCI work and that of diesel showcharacteristic double profiles in theirheat release profiles. In HCCI (anddiesel), these double profiles have beenattributed to a low temperaturereaction (or combustion initiation)followed by a high temperaturereaction (or main combustion event).CAI methods 1 and 2, clearly show asingle peak and therefore we believethat we have distinguished the workhere from that of HCCI. Second, itis interesting to note that as thequantity of exhaust gas trapped orinternally recirculated is increased, sothe CAI combustion peak is shiftedtoward TDC. The area under thecurves remains largely constant as canbe seen in the lower frame of Figure
6, where the cumulative heat releasetraces are plotted. Aoyama et al [25]experimented with pre-mixed chargecompression ignition (PCCI) using anengine with a compression ratio of17.4:1 and intake air temperatures of129-170°C. This was achieved usingelectrical heaters. It is noticeable thatthe heat release profiles obtained byAoyama et al are quite similar to thoseobtained in our experiments, i.e., thereis a single heat release profile and nota double profile as found in HCCIstudies. Aoyama et al observed thatas the inlet temperature was increasedfrom 29°C to 172°C, the PCCIcombustion peak shifted fromapproximately +20° ATDC, to-5° BTDC. Also, as the chargingefficiency is increased, so thecompression pressure is increased andthe spontaneous ignition is advanced(from +20° ATDC to ~TDC). It isclear then that the work presentedhere, shows some similarity toprevious 2-stroke studies in thattrapped or residual exhaust gases leadto controlled auto-ignition in a95 RON fuelled 4-stroke engine.Again there is agreement with this typeof combustion when comparingcylinder pressure traces. We believethat there is a difference when wecompare the results obtained hereusing a purely internal EGRmethodology with that of all previous4-stroke CAI experiments. It is clearfrom previous work that HCCI anddiesel phenomena yield characteristicdouble heat release profiles during thecombustion event. In ourexperimentation, we observe only asingle heat release profile, therebyclearly differentiating the internalEGR combustion process to that ofHCCI (and diesel). In our opinion,the closest similar form of combustionto the work presented here is that ofAoyama et al in their PCCIexperiments. Although, it must bepointed out that Aoyama et al onlymanaged to achieve their PCCI
combustion with pre-heated air. Thuswe share similarities with their workand fundamental differences too.Differentiating the combustionprocess will form the basis of the nextpaper once our single cylinder enginemapping experiments are complete.This will be reported shortly.Recently, Oppenheim et al commentthat, spark (Otto) or compression(Diesel) ignition engines, both wellover one hundred years old havechanged relatively little and that anexplosive growth of technologies,micro-electronic controls and MEMS(Micro-Electro-Mechanical Systems)has arrived so that a modern approachto the ICE combustion task is in order[21]. We believe that fully flexiblevalve trains (FVVTs) are a crucial partin achieving 21st century combustionprocesses in 4-stroke engines. Webelieve that such an approach will leadprimarily to benefits in low fuelconsumption and ultra-low pollutantemissions.
CONCLUSIONS
Two distinct methods of controlledauto-ignition (CAI) have beensuccessfully implemented anddemonstrated in a 4-stroke internalcombustion engine without the needfor pre-heating the intake air and byusing for the first time internal EGR.This was possible through the use ofthe active valve train (AVT) system.The principle findings from our initialinvestigations are as follows: (1) Thetwo methods which although distinctin their methodologies produce verysimilar cylinder pressure profiles andheat release profiles, (2) CAI is acontrollable process, the amount ofinternal EGR determines thecombustion initiation point, (3)significant improved combustionstability is obtained, (4) indicatedspecific NOx emissions at 2000 rpmand 3.5 bar IMEP were much reducedusing CAI (by 90% at 14.6:1 AFR)

Univers i t i Teknologi Petronas • http://www.utp.edu.my
33PLATFORM • Volume 2 Number 1 • January – June 2001
compared to SI and that (5) it isbelieved with optimisation of the CAIcombustion process that CAI hasapplicability to many 4-strokeengines.
ACKNOWLEDGEMENTS
We wish to thank Chris Knight (CEO), CliveDopson (Commercial Director) and DaveTaitt (Engineering Director) for funding andsupporting the research at Lotus.
REFERENCES
[1] N Wilson, J Allen & G Muddel. FutureValve Train Systems to Reduce EnginePerformance Compromises, FISITAConference 1992.
[2] N Wilson, J Allen & G Muddel. LotusVariable Valve Train Systems, Haus derTechnik, Essen, 1992.
[3] J Allen, N Wilson. I. Mech. E. PaperC462/34/178, 1993.
[4] P Langden, R Cosfeld, A Grundno, KReif. Electromechanical Valve Actuation:A Basis for Future Gasoline EngineConcepts, BMW Group, InternationalesWeiner Motorsymposium 2000.
[5] J Allen, D Law & D Kemp. CAIInternational Patent, 9930380.2, 1999.
[6] M Noguchi, Y Tanaka, T Tanaka and YTakeuchi. A Study on Gasoline EngineCombustion by Observation ofIntermediate Reactive Products DuringCombustion, JSAE790840.
[7] S Onishi, S H Jo, K Shoda, P D Jo & SKato. Active Thermo AtmosphereCombustion (ATAC) – A NewCombustion Process for InternalCombustion Engines, SAE790501.
[8] M Noguchi, Y Tanaka, T Tanaka & YTakeuchi, A Study on Gasoline EngineCombustion by Observation ofIntermediate Reactive Products DuringCombustion, SAE790840.
[9] Y Ishibashi and Y sishima. A NewGeneration of Engines for the Future, PDuret (editor) and Editions Technip,Paris 1993, p113-124.
[10] Y Ishibashi. Basic Understanding ofActivated Radical Combustion and its 2-Stroke Engine Application and Benefits,SAE 2000-01-1836.
[11] N Iida. Combustion Analysis ofMethanol Fuelled Active ThermoAtmosphere Combustion (ATAC)Engine Using SpectroscopicObservation, SAE940684.
[12] P Duret & S Venturi. AutomotiveCalibration of the IAPAC FluidDynamically Controlled 2-StrokeCombustion Process, SAE960363.
[13] N Iida & T Igarashi. Auto-ignition andCombustion of n-Butane and DNE/AirMixtures in a Homogeneous ChargeCompression Ignition Engine, SAE200-01-1832.
[14] E Esterlingot, P Guibert, J Lavy and SRaux. Thermodynamical and OpticalAnalyses of Controlled Auto IgnitionCombustion in 2-Stroke Engines,SAE972098.
[15] M Kumada, H Shimodaira, K Yoshida,H Shoji and A Saima. Proc. 15th Int.Comb. Eng. Symp., Seoul Korea, July 13-16th, 1999, p395-400.
[16] P Duret, J-C Dabadie, J Lavy, J Allen, DBlundell, J Oscarsson, G Emanuelsson,M Perotti, R Kenny & G Cunningham.SAE Fuels and Lubes, SAE FL487.
[17] P Duret, J-C Dabadie, J Lavy, J Allen, DBlundell, J Oscarsson, G Emanuelsson,M Perotti, R Kenny & G Cunningham.Accepted for SAE Fuels and Lubes, Paris,2000.
[18] M Stockinger, H Schapertons & PKuhlman. MTZ 53(1992)2, p80-85 (inGerman).
[19] Lavy et al. (14 authors). Innovative UltraLow NOx Controlled Auto IgnitionCombustion Process for GasolineEngines: the 4-SPACE Project, SAE2000-01-1837
[20] D Law, J Allen, D Kemp & P Williams.4-Stroke Controlled Auto IgnitionInvestigations Using a Single CylinderEngine with Lotus Active Valve Train(AVT), Proceedings of the 21st CenturyEmissions Technology Conference, I.Mech. E., London, 4-6th December2000.
[21] A K Oppenheim & T-H J Sum, KGebert, W P Johnson & A L Kuhl.Influence of Dilution on the DynamicStage of Combustion in a Diesel Engine,SAE pre-print 01P-445, September2000.
[22] P M Najt & D E Foster. CompressionIgnited Homogeneous ChargeCombustion, SAE 830264.
[23] R H Thring. Homogeneous ChargeCompression Ignition (HCCI) Engines,SAE 892068.
[24] Rassweiler-Withrow. SAE Vol. 42, No.5, pp.185-204.
[25] T Aoyama, Y Hattori, J Mzuta and YSato. An Experimental Study onPremixed Charge Compression IgnitionGasoline Engine, SAE 960081.

PLATFORM • Volume 2 Number 1 • January – June 2001
34 Univers i t i Teknologi Petronas • http://www.utp.edu.my
INTRODUCTION
Radiation-induced gafting of vinylmonomers onto hydrophobicpolymers has been frequently used toproduce permselective membraneswith specificially desired properties[1-4]. Styrene is commonly graftedonto polymer films to producestrongly acidic cation exchangemembranes. This must be followedby activation of the chemicallyinactive (neutral) polystyrene graftcopolymers by subsequent sulfonationto introduce sulfonic acid groups. Forstability reasons, fluorinated polymersare very often used as base polymersdue to their outstanding thermal,chemical and mechanical resistance.
Grafting conditions are playing acrucial role in the determination ofnot only the degree of grafting but alsothe structure built up inside thegrafted polymer. Among graftingconditions, the solvent to be used formonomer dilution is of special interestas it is one of the essential elementstowards a successful radiation-inducedgrafting process [5-8]. A solvent isbasically used during grafting to bringabout swelling of the base polymerand hence enhance the monomeraccessibility to the grafting sites. Theuse of a poor-swelling solvent is mostlikely to lead to surface grafting dueto the reduction in monomerdiffusibility and, eventually, lowdegrees of grafting are obtained.
However, the use of good-swellingsolvent results in bulk andhomogeneous grafting. Increasing theswelling enhances the diffusion ofmonomer into the internal layers ofthe polymer substrate, and thereforethe interactions between the internalactive sites and the monomermolecules increase, leading to higherdegrees of grafting [9].
Many workers have reported thegrafting of styrene onto variousfluorinated polymer films usingradiation-induced grafting techniques[10-18]. The effects of graftingconditions on the degree of styrenegrafting such as monomerconcentration, irradiation dose,
Effect of solvents on radiation-induced grafting of
styrene onto fluorinated polymer films
Dr Mohamed Mahmoud Nasef
Membrane Research Unit, Universiti Teknologi Malaysia,
Jalan Semarak, 54100 Kuala Lumpur, Malaysia
(currently at Universiti Teknologi PETRONAS,
31750 Bandar Seri Iskandar, Tronoh, Perak, Malaysia.)
ABSTRACT
The effect of solvents on radiation-induced grafting of styrene onto commercial fluorinated polymer films such as poly(tetrafluoroethylene) (PTFE), poly (tetrafluoroethylene-co-hexafluoropropylene) (FEP) and poly (tetrafluoroethylene-co-perfluorovinyl ether) (PFA) was investigated by a simultaneous irradiation technique, Three solvents, ie methanol,benzene and dichloromethane, were used to dilute styrene under various irradiation doses, dose rates and monomerconcentrations. The effect of addition of mineral and organic acids on the degree of grafting in the presence of thethree solvents was also studied. The degree of grafting was found to be strongly dependent upon the type of solvent andcomposition of the monomer/solvent mixture. Dilution of styrene with dichloromethane in various grafting conditionswas found to enhance dramatically the degree of grafting compared with other solvents, and the maximum degree ofgrafting was achieved at a monomer/solvent mixture having a composition of 60:40 (v/v). The formation of polystyrenegrafts in the three fluorinated films was verified using FTIR spectrometry.
2001 Society of Chemical Industry ©
Keywords: radiation-induced grafting; styrene; fluorinated films
Reproduced with permission from Polymer International, 50:338-346 (2001).
Univers i t i Teknologi Petronas • http://www.utp.edu.my
35PLATFORM • Volume 2 Number 1 • January – June 2001
temperature and crosslinker as well asaddition of an inhibitor have beenwidely studied. So far, only limitedattention has been paid to the effectof solvents in these grfating systems.
This work aims to study the effect ofsolvents on the grafting of styrene ontocommercially available fluorinatedpolymer films such as poly(tetrafluoroethylene) (PTFE), poly( t e t r a f l u o r o e t h y l e n e - c o -hexafluoropropylene) (FEP) and poly( t e t r a f l u o r o e t h y l e n e - c o -perfluorovinyl-ether) (PFA) using asimultaneous irradiation technique.The effects of grafting conditions suchas irradiation dose, dose rate,monomer concentration and acidaddition on the degree of grafting areinvestigated with respect to the typeof solvent. The grafting is checkedand the grafted films are characterizedusing FTIR spectral analysis.
EXPERIMENTAL
Materials
Films of PTFE, FEP and PFA havingthicknesses of 90, 120 and 120 µm,respectively, were purchased fromPorghof (USA). Styrene (Fluka,Switzerland) having a purity higherthan 99% was used without furtherpurification. Reagent gradedichloromethane, benzene andmethanol were used as received.Other chemicals such as mineral(sulfuric, hydrochloric and nitricacids) and organic acids (formic andacetic) were also research grade andused as received.
Sorption measurements
Sorption measurement were carriedout at room temperature byimmersing the polymer film instyrene/solvent mixture (60:40 v/v) ina glass ampoule. The ampoule was
flushed with pure nitrogen for 8minutes and then sealed. After aspecific time, the film was removed,and the excess liquid adhering to itssurface was wiped with blotting paper,and the film was then weighed todetermine the change in its weightduring the period of immersion. Acorrelation between the percentageweight increase of the film and thetime of immersion was established.The amount of sorbed liquid for eachmonomer/solvent mixture wasobtained from the extrapolated weightat zero time.
Grafting procedure
The polymer film was cut into stripsof known weight, washed withacetone and then dried in a vacuumoven (10 mbar, 60°C and 1 h). Thedried film was placed in a glassampoule containing the desiredmonomer/solvent mixture. Thegrafting mixture was flushed withnitrogen for 8 minutes to remove theair, and the ampoule was sealed. Theampoule was subjected to γ-radiationfrom a 60Co source (Bhabha AtomicResearch Centre, Bombay, India)located at the Malaysian Institute ofNuclear Technology Research at doserates ranging from 1.32 to 15.00kGyh-1. The grafted film wassubsequently washed with toluene andsoaked therein overnight to removeunreacted monomer andhomopolymer occluded in the filmsurface. The grafted film was thendried in a vacuum oven at 80 °C untila constant weight was obtained. Thedegree of grafting (G%) wasgravimetrically determined using thefollowing equation:
Wg – WoG(%) = ––––––– x 100 (1) Wo
where, Wg and Wo are the weights of
the grafted and original films,respectively.
FTIR measurements
FTIR measurements of original andgrafted films were carried out usingan FTIR spectrometer (Mattson,6020 – Galaxy Series) in transmittancemode in the frequency range of 4000 -500 cm-1. The spectra of the filmswere obtained through an ATRaccessory equipped with a KRS5crystal at face angle of 45°.
RESULTS AND DISCUSSION
Sorption behaviour
In a previous study [18], therelationship between the amount ofsorbed liquid in PTFE film and thestyrene concentration in the initialgrafting solution diluted withdichloromethane showed that the filmswelling increases with the increase inthe monomer concentration until itreaches a maximum value in a styrene/dichloromethane mixture having acomposition of 60:40 (v/v).Therefore, grafting mixtures withsimilar composition were used tostudy the sorption behaviour in thepresent work.
Figure 1 shows the relationshipbetween the amount of sorbed liquidin PTFE films expressed as percentageswelling and the time of immersionin various solvents. The variousmonomer/solvent mixtures had acomposition of 60:40 (v/v). It can beseen that the swelling rate as well asswelling equilibrium depends uponthe solvent type, despite the smallvalue of weight increase because PTFEfilms scarcely swell in these monomersand solvents. Furthermore, thestyrene/dichloromethane mixture wasfound to produce the greatest weightincrease in PTFE films, followed by
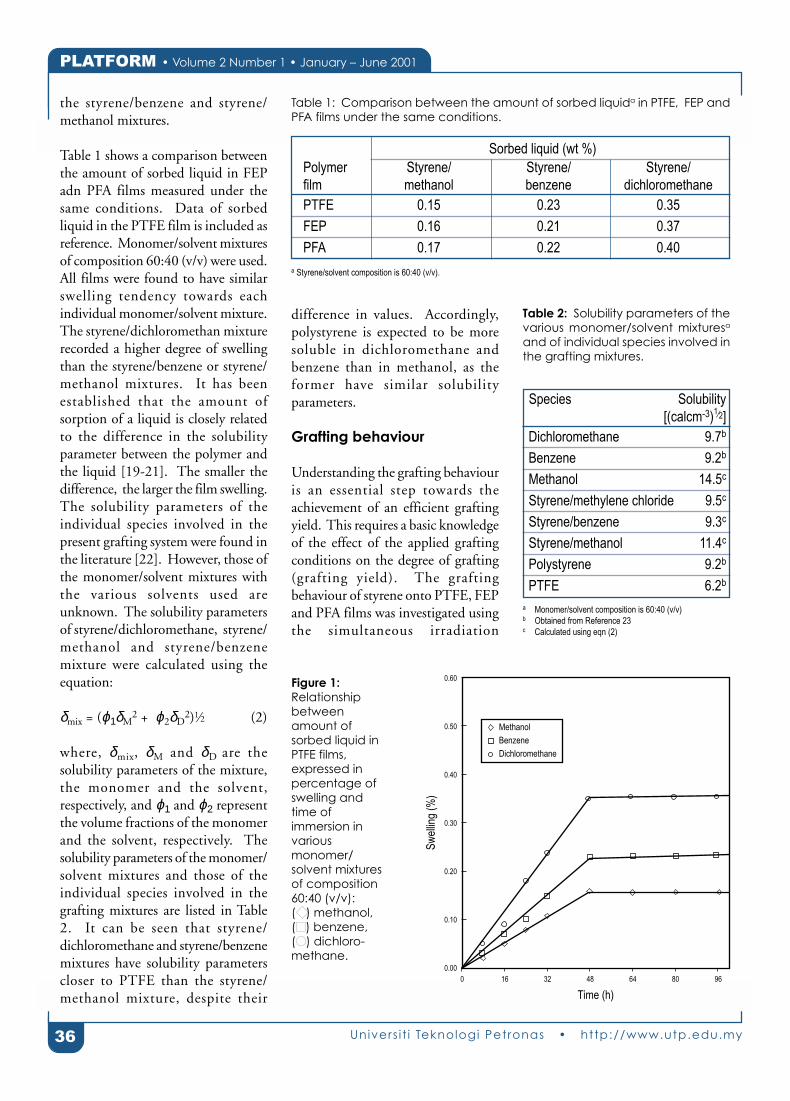
PLATFORM • Volume 2 Number 1 • January – June 2001
36 Univers i t i Teknologi Petronas • http://www.utp.edu.my
the styrene/benzene and styrene/methanol mixtures.
Table 1 shows a comparison betweenthe amount of sorbed liquid in FEPadn PFA films measured under thesame conditions. Data of sorbedliquid in the PTFE film is included asreference. Monomer/solvent mixturesof composition 60:40 (v/v) were used.All films were found to have similarswelling tendency towards eachindividual monomer/solvent mixture.The styrene/dichloromethan mixturerecorded a higher degree of swellingthan the styrene/benzene or styrene/methanol mixtures. It has beenestablished that the amount ofsorption of a liquid is closely relatedto the difference in the solubilityparameter between the polymer andthe liquid [19-21]. The smaller thedifference, the larger the film swelling.The solubility parameters of theindividual species involved in thepresent grafting system were found inthe literature [22]. However, those ofthe monomer/solvent mixtures withthe various solvents used areunknown. The solubility parametersof styrene/dichloromethane, styrene/methanol and styrene/benzenemixture were calculated using theequation:
δmix = (ϕ1δM2 + ϕ2δD
2)1⁄2 (2)
where, δmix, δM and δD are thesolubility parameters of the mixture,the monomer and the solvent,respectively, and ϕ1 and ϕ2 representthe volume fractions of the monomerand the solvent, respectively. Thesolubility parameters of the monomer/solvent mixtures and those of theindividual species involved in thegrafting mixtures are listed in Table2. It can be seen that styrene/dichloromethane and styrene/benzenemixtures have solubility parameterscloser to PTFE than the styrene/methanol mixture, despite their
difference in values. Accordingly,polystyrene is expected to be moresoluble in dichloromethane andbenzene than in methanol, as theformer have similar solubilityparameters.
Grafting behaviour
Understanding the grafting behaviouris an essential step towards theachievement of an efficient graftingyield. This requires a basic knowledgeof the effect of the applied graftingconditions on the degree of grafting(grafting yield). The graftingbehaviour of styrene onto PTFE, FEPand PFA films was investigated usingthe simultaneous irradiation
Sorbed liquid (wt %)
Polymer Styrene/ Styrene/ Styrene/
film methanol benzene dichloromethane
PTFE 0.15 0.23 0.35
FEP 0.16 0.21 0.37
PFA 0.17 0.22 0.40
a Styrene/solvent composition is 60:40 (v/v).
Table 1: Comparison between the amount of sorbed liquida in PTFE, FEP and
PFA films under the same conditions.
Species Solubility
[(calcm-3)1⁄2]
Dichloromethane 9.7b
Benzene 9.2b
Methanol 14.5c
Styrene/methylene chloride 9.5c
Styrene/benzene 9.3c
Styrene/methanol 11.4c
Polystyrene 9.2b
PTFE 6.2b
a Monomer/solvent composition is 60:40 (v/v)b Obtained from Reference 23c Calculated using eqn (2)
Table 2: Solubility parameters of the
various monomer/solvent mixturesa
and of individual species involved in
the grafting mixtures.
Figure 1:
Relationship
between
amount of
sorbed liquid in
PTFE films,
expressed in
percentage of
swelling and
time of
immersion in
various
monomer/
solvent mixtures
of composition
60:40 (v/v):
(◆◆ ) methanol,
(■■ ) benzene,
(●● ) dichloro-
methane.
96644832160
0.00
0.10
0.20
0.30
0.40
0.50
0.60
Time (h)
Sw
ellin
g (%
)
Methanol
Benzene
Dichloromethane
80
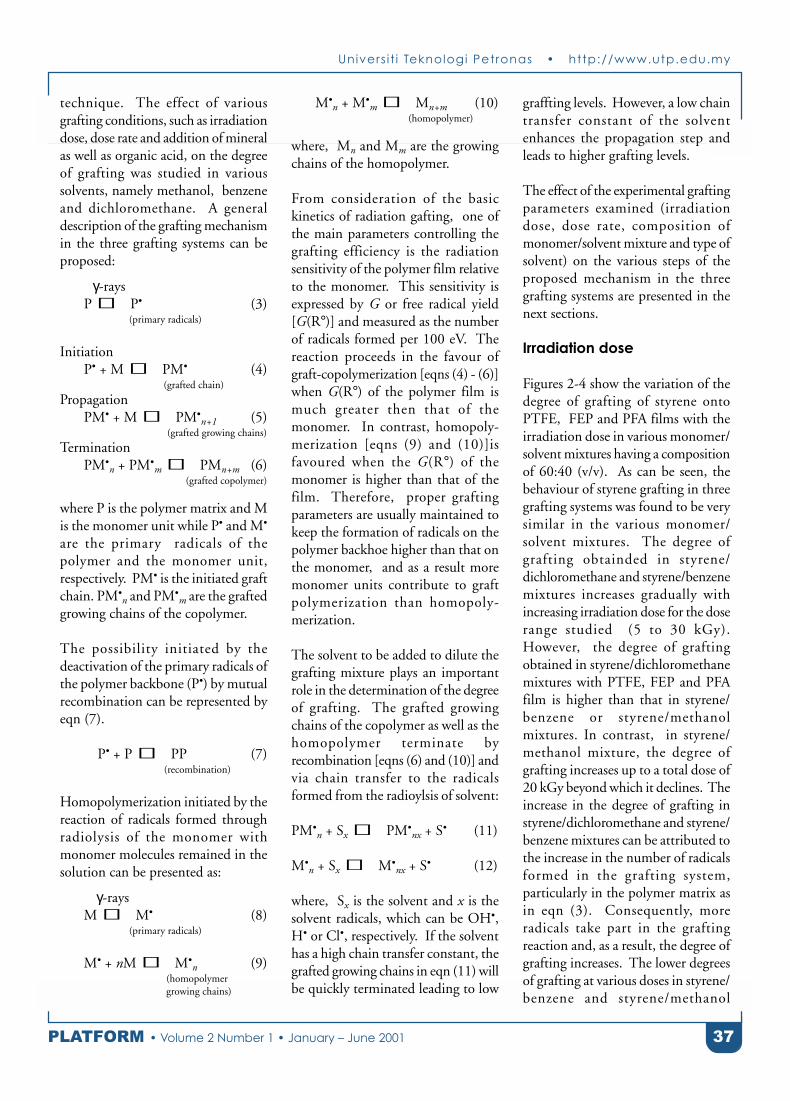
Univers i t i Teknologi Petronas • http://www.utp.edu.my
37PLATFORM • Volume 2 Number 1 • January – June 2001
technique. The effect of variousgrafting conditions, such as irradiationdose, dose rate and addition of mineralas well as organic acid, on the degreeof grafting was studied in varioussolvents, namely methanol, benzeneand dichloromethane. A generaldescription of the grafting mechanismin the three grafting systems can beproposed:
γ-raysP → P• (3) (primary radicals)
InitiationP• + M → PM• (4) (grafted chain)
PropagationPM• + M → PM•
n+1 (5) (grafted growing chains)
TerminationPM•
n + PM•m → PMn+m (6)
(grafted copolymer)
where P is the polymer matrix and Mis the monomer unit while P• and M•
are the primary radicals of thepolymer and the monomer unit,respectively. PM• is the initiated graftchain. PM•
n and PM•m are the grafted
growing chains of the copolymer.
The possibility initiated by thedeactivation of the primary radicals ofthe polymer backbone (P•) by mutualrecombination can be represented byeqn (7).
P• + P → PP (7) (recombination)
Homopolymerization initiated by thereaction of radicals formed throughradiolysis of the monomer withmonomer molecules remained in thesolution can be presented as:
γ-raysM → M• (8) (primary radicals)
M• + nM → M•n (9)
(homopolymer growing chains)
M•n + M•
m → Mn+m (10) (homopolymer)
where, Mn and Mm are the growingchains of the homopolymer.
From consideration of the basickinetics of radiation gafting, one ofthe main parameters controlling thegrafting efficiency is the radiationsensitivity of the polymer film relativeto the monomer. This sensitivity isexpressed by G or free radical yield[G(R°)] and measured as the numberof radicals formed per 100 eV. Thereaction proceeds in the favour ofgraft-copolymerization [eqns (4) - (6)]when G(R°) of the polymer film ismuch greater then that of themonomer. In contrast, homopoly-merization [eqns (9) and (10)]isfavoured when the G(R°) of themonomer is higher than that of thefilm. Therefore, proper graftingparameters are usually maintained tokeep the formation of radicals on thepolymer backhoe higher than that onthe monomer, and as a result moremonomer units contribute to graftpolymerization than homopoly-merization.
The solvent to be added to dilute thegrafting mixture plays an importantrole in the determination of the degreeof grafting. The grafted growingchains of the copolymer as well as thehomopolymer terminate byrecombination [eqns (6) and (10)] andvia chain transfer to the radicalsformed from the radioylsis of solvent:
PM•n + Sx → PM•
nx + S• (11)
M•n + Sx → M•
nx + S• (12)
where, Sx is the solvent and x is thesolvent radicals, which can be OH•,H• or Cl•, respectively. If the solventhas a high chain transfer constant, thegrafted growing chains in eqn (11) willbe quickly terminated leading to low
graffting levels. However, a low chaintransfer constant of the solventenhances the propagation step andleads to higher grafting levels.
The effect of the experimental graftingparameters examined (irradiationdose, dose rate, composition ofmonomer/solvent mixture and type ofsolvent) on the various steps of theproposed mechanism in the threegrafting systems are presented in thenext sections.
Irradiation dose
Figures 2-4 show the variation of thedegree of grafting of styrene ontoPTFE, FEP and PFA films with theirradiation dose in various monomer/solvent mixtures having a compositionof 60:40 (v/v). As can be seen, thebehaviour of styrene grafting in threegrafting systems was found to be verysimilar in the various monomer/solvent mixtures. The degree ofgrafting obtainded in styrene/dichloromethane and styrene/benzenemixtures increases gradually withincreasing irradiation dose for the doserange studied (5 to 30 kGy).However, the degree of graftingobtained in styrene/dichloromethanemixtures with PTFE, FEP and PFAfilm is higher than that in styrene/benzene or styrene/methanolmixtures. In contrast, in styrene/methanol mixture, the degree ofgrafting increases up to a total dose of20 kGy beyond which it declines. Theincrease in the degree of grafting instyrene/dichloromethane and styrene/benzene mixtures can be attributed tothe increase in the number of radicalsformed in the grafting system,particularly in the polymer matrix asin eqn (3). Consequently, moreradicals take part in the graftingreaction and, as a result, the degree ofgrafting increases. The lower degreesof grafting at various doses in styrene/benzene and styrene/methanol

PLATFORM • Volume 2 Number 1 • January – June 2001
38 Univers i t i Teknologi Petronas • http://www.utp.edu.my
mixtures are due to the initiation ofhomopolymerization as a result of thereaction of monomer primary radicalswith monomer molecules present inthe grafting solution [eqns (8) - (10)]and the differences in the solventradicals’ reactivity. However, instyrene/methanol mixture, the degreeof grafting is further lowered with theincrease in the irradiation doseparticularly at doses higher than 20kGy. This is most likely due to anincrease of the homopolymerization,which is significantly enhanced by theinsolubility of polystyrenehomopolymer in methanol and itsaccumulation in the grafting mediumas well as on the film surface.
The higher degrees of graftingobtained upon grafting styrene ontoPFA films, compared with that ofstyrene grafting onto PTFE and FEPfilms under the same graftingconditions, suggests that the freeradicals formed on PFA films are more
stable and utilized more efficientlythan in PTFE and FEP films.
Dose Rate
Figures 5-7 show the variation of thedegree of grafting of styrene ontoPTFE, FEP and PFA films with thedose rate at a total irradiation dose of20 kGy in various monomer/solventmixtures. The composition ofmonomer/solvent mixtures wasmaintained at 60:40 (v/v). It canclearly be seen that the degree ofgrafting in the three gafting systemsshows similar trends regardless of thesolvent type. It decreases with theincrease in the dose rate and vice versa.However, the degree of grafting instyrene/dichlorormethane is higherthan that in styrene/benzene andstyrene/methanol mixtures.
The high degree of grafting obtainedat low dose rates can be attributed to
the formation of efficient radicals,which have enough time to surviveand react with the monomermolecules. This is accompanied byfacile monomer diffusion due to lowviscosity of the grafting solution and,as a result, long chain grafts areformed. As the dose rate increases,the formed radicals tend to decay byrecombination as in eqn (7) leadingto fast termination of the graftedgrowing chains [PM•
n+1 in eqn (5)].This results in a high chance forhomopolymer formation leading to anincrease in the viscosity of the graftingsolution and, as a result, hindrance ofmonomer diffusion through thegrafted layers. Moreover, thetermination by combination of twografted growing chains [eqn (6)] ishindered and hence short side-chaingrafts are formed. However, thedegree of grafting is controlled byother factors such as occurrence ofchain transfer, the concentration in
Figure 2. Variation of the degree of grafting of styrene
onto PTFE films with the irradiation dose in various
monomer/solvent mixtures of composition 60:40 (v/v). (◆◆ )
methanol, (■■ ) benzene,(●● ) dichloromethane. Grafting
condition: dose rate, 1.32 kGy h-1; atmosphere, N2;
temperature, 30°C.
30252015105
0
10
20
30
40
50
60
70
Irradiation dose (kGy)
Deg
ree
of g
rafti
ng (
%)
Methanol
Benzene
Dichloromethane
30252015105
0
10
20
30
40
50
60
80
Irradiation dose (kGy)D
egre
e of
gra
fting
(%
)
Methanol
Benzene
Dichloromethane
70
Figure 3. Variation of the degree of grafting of styrene
onto FEP films with the irradiation dose in various
monomer/solvent mixtures of composition 60:40 (v/v). (◆◆ )
methanol, (■■ ) benzene, (●● ) dichloromethane. Grafting
conditions are similar to those in Fig 2.
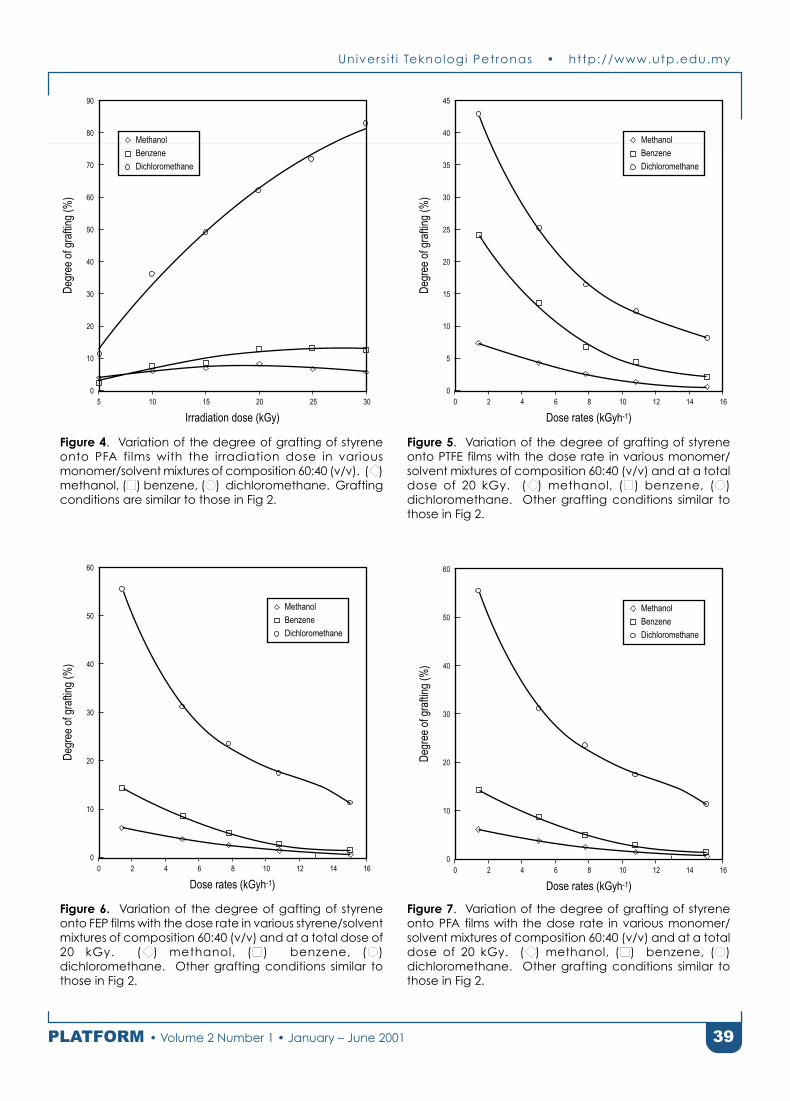
Univers i t i Teknologi Petronas • http://www.utp.edu.my
39PLATFORM • Volume 2 Number 1 • January – June 2001
Figure 5. Variation of the degree of grafting of styrene
onto PTFE films with the dose rate in various monomer/
solvent mixtures of composition 60:40 (v/v) and at a total
dose of 20 kGy. (◆◆ ) methanol, (■■ ) benzene, (●● )
dichloromethane. Other grafting conditions similar to
those in Fig 2.
30252015105
0
10
20
30
40
50
60
90
Irradiation dose (kGy)
Deg
ree
of g
rafti
ng (
%)
Methanol
Benzene
Dichloromethane70
80
1614121080
0
5
10
15
20
25
30
45
Dose rates (kGyh-1)D
egre
e of
gra
fting
(%
)
Methanol
Benzene
Dichloromethane35
40
642
Figure 6. Variation of the degree of gafting of styrene
onto FEP films with the dose rate in various styrene/solvent
mixtures of composition 60:40 (v/v) and at a total dose of
20 kGy. (◆◆ ) methanol, (■■ ) benzene, (●● )
dichloromethane. Other grafting conditions similar to
those in Fig 2.
1614121080
0
10
20
30
60
Dose rates (kGyh-1)
Deg
ree
of g
rafti
ng (
%)
Methanol
Benzene
Dichloromethane
40
50
642 1614121080
0
10
20
30
60
Dose rates (kGyh-1)
Deg
ree
of g
rafti
ng (
%)
Methanol
Benzene
Dichloromethane
40
50
642
Figure 7. Variation of the degree of grafting of styrene
onto PFA films with the dose rate in various monomer/
solvent mixtures of composition 60:40 (v/v) and at a total
dose of 20 kGy. (◆◆ ) methanol, (■■ ) benzene, (●● )
dichloromethane. Other grafting conditions similar to
those in Fig 2.
Figure 4. Variation of the degree of grafting of styrene
onto PFA films with the irradiation dose in various
monomer/solvent mixtures of composition 60:40 (v/v). (◆◆ )
methanol, (■■ ) benzene, (●● ) dichloromethane. Grafting
conditions are similar to those in Fig 2.

PLATFORM • Volume 2 Number 1 • January – June 2001
40 Univers i t i Teknologi Petronas • http://www.utp.edu.my
monomer and temperature. Since,the monomer concentration (60:40v/v) and the temperature are constantin these experiments, it is suggestedthat chain transfer to solvent radicals[eqn (11)] has a strong influence onthe degree of grafting in the threestyrene/solvent mixtures under similargrafting conditions. More details arepresented and discussed concerningthe influence of the type of solventbelow. Finally, it can be concludedthat a lower irradiation dose isfavourable for obtaining higherdegrees of grafting in the simultaneousirradiation of styrene on fluorinatedpolymers.
Composition of monomer/
solvent mixture
Figure 8 shows the relationshipbetween the degree of grafting and thecomposition of the monomer/solventmixtures upon their grafting ontoPTFE, FEP and PFA films at a totaldose of 20 kGy. The degree of graftingof styrene onto TFE, FEP and PFAwas found to increase dramaticallywith the increase in styreneconcentration in the grafting mixture
until it reached a maximum value at astyrene/dichloromethane mixture ofcomposition 60:40 (v/v). As theconcentration further increased thedegree of grafting fell sharply.Grafting of styrene onto PTFE, FEPand PFA films by simultaneousirradiation was found to be a diffusioncontrolled process [16-18]. Therefore,the grafting behaviour in the presentsystems can reasonably be attributedto the increase in the styrene diffusionand its concentration in the graftinglayers. As the styrene concentrationin the grafting mixtures furtherincreases, homopolymer formation isenhanced and diffusion of styrene ishindered. As a result, the final degreeof grafting falls sharply. However, thedegree of grafting was found to becontrolled by the number and thesurvival of the radicals formed. Thus,it can be concluded that the degree ofgrafting of styrene in the presentsystems not only depends on thenumber and the survival of the radicalsformed (efficiency) but also on thediffusion of styrene through matrix,as well as its concentration in thegrafting layers. Since the threefluorinated polymer films used in this
work were found to be hardly swollenin styrene or solvents, grafting issuggested to proceed by a frontmechanism. Grafting starts at thesurface of the film and proceedsinternally toward the middle of thefilm by continuous diffusion ofstyrene through already grafted layers.
Type of solvent
It is well known that a polymerswollen in a solvent represents amedium of high viscosity and that itis the viscosity of the grafted layers thatdetermines the diffusion of themonomer (styrene) to the graftingsites. Moreover, the maximumgrafting is the result of optimizing thehigh concentration of absorbedmonomer and low viscosity of poorlyswollen polymer matrix. Table 3shows the effect of solvent onradiation grafting of styrene ontoPTFE, FEP and PFA films. Thecomposition of the various monomer/solvent mixtures was kept at 60:40(v/v). The degree of grafting instyrene/dichloromethane mixture wasfound to be considerably higher thanthat in styrene/benzene or styrene/methanol with the three films. Thisindicates that dilution of styrene withdichloromethane drastically enhancesthe degree of grafting compared withthe dilution with methanol andbenzene. Moreover, no significanthomopolymer was noticed in thegrafting residue containingdichloromethane, unlike thosecontaining methanol and benzenewhich show a remarkable amount ofhomopolymer.
This behaviour can be explained bytaking into account the solubilityparameters of the various monomer/solvent mixtures and the nature of thethree solvents used to dilute themonomer. The former strongly affectsthe degree of film swelling, whereasthe latter have an impact on the
Figure 8.
Relationship
between the
degree of
grafting and
the
composition of
monomer/
solvent mixtures
upon their
grafting (◆◆ )
PTFE, (■■ ) FEP
and (●● ) PFA
film. Grafting
conditions are:
total dose of 20
kGy; solvent,
dichloromethane.
Other grafting
condition
similar to those
in Fig 2.100806040200
0
10
20
30
40
50
60
70
Monomer/solvent composition (v/v)
Deg
ree
of g
rafti
ng (
%)
PTFE
FEP
PFA
020406080100
styrene
dichloromethane

Univers i t i Teknologi Petronas • http://www.utp.edu.my
41PLATFORM • Volume 2 Number 1 • January – June 2001
termination step of the grafted hadgrowing chains.
It was found that PTFE, FEP and PFAfilms recorded maximum values ofsorption of styrene/dichloromethanemixture (swelling) as shown in Table1. Moreover, the solubility parameterof dichloromethane is very close tothat of the polystyrene homopolymerthat might be formed and thereforeno homopolymer accumulated on thefilm surface or in the grafting mixture.Consequently, the swelling of graftedlayers and diffusion of styrene as wellas the concentration of styrene wasenhanced. In addition, the low chaintransfer constant of dichloromethane(0.15) [23], caused a delay in thetermination of polystyrene growingchains and so the grafting yield wasconsiderably enhanced. However, thehigh chain transfer constant of theelectron donor methanol (0.296) [23]caused a fast termination in
polystyrene growing chains. This wasaccompanied by insolubility of thepolystyrene homopolymer formed inmethanol, which led to an increase inthe viscosity of the grafting mixture,and therefore styrene diffusion washindered, leading to surface grafting.The low degree of grafting obtainedupon dilution of styrene with benzene,despite the fact that benzene is a goodsolvent for styrene, is due the presenceof a resonance stabilization effect inthe benzene ring, which acts as anenergy transfer agent. As a result, thereactivity of the benzene radicals wasreduced and a low degree of graftingwas obtained.
It should be pointed out that the freeradical yield [G(R°)] in the differentmonomer/solvent mixtures alsocontributes to the variation in thedegree of grafting in the three systems.The G(R°) of styrene indichloromethane seems to be lower
than that of the fluorinated films, andas a result, the grafting reactionproceeds in the favour of styrenecopolymerization. However, thelower degree of grafting obtained withstyrene in methanol and styrene inbenzene mixtures is due to thedifference in the G(R°) of the polymerfilms and the monomer in thesemixtures. The monomer primaryradicals [eqn (8)] tend to recombine,leading to homopolymer formation atthe expense of graft copolymerization.
The behaviour of the three solventsand their effect on the grafting yieldin the present systems is similar to thatobserved upon grafting styrene withthe same solvents onto poly(ethyleneterephthalate) (PET) films [24]However, the effect of dilution ofstyrene with methanol investigated inthe present study contrasts with thatreported for grafting styrene inmethanol onto low density
Degree of grafting (%)Solvent chain ––––––––––––––––––––––––––––
Grafting mixture transfer constant PTFE FEP PFA Remarks
Styrene/methanol 0.296 7 6 7 Much homopolymer
Styrene/benzene 0.200 19 14 12 Considerable homopolymer
Styrene/dichloromethane 0.150 43 52 60 No homopolymer
a Grafting conditions are: monomer/solvent composition, 60:40 (v/v); total dose, 20 kGy; dose rate, 1.32 kGyh-1; atmosphere, N2; temperature, 30°C.
Degree of grafting (%)––––––––––––––––––––––––––––––––––––––––––––––––––––––––––––––––––––––––––––––
Styrene/methanol Styrene/benzene Styrene/dichloromethane–––––––––––––––––––––––– –––––––––––––––––––––––– ––––––––––––––––––––––––
Acid PTFE FEP PFA PTFE FEP PFA PTFE FEP PFA
Sulfuric 7 6 9 18 14 13 42 52 60
Hydrochloric 7 7 9 19 15 15 40 53 61
Nitric 8 6 8 20 16 14 43 51 62
Formic 6 8 7 18 14 14 40 52 60
Acetic 8 6 8 19 13 13 41 53 59
a Grafting conditions are: acid concentration, 0.1 mol l-1. Other grafting conditions as in Table 3.
Table 3. Effect of solvent on radiation grafting of styrenea onto PTFE, FEP and PFA films.
Table 4: Effect of mineral and organic acids on grafting of styrenea in various monomer/solvent mixtures onto PTFE,
FEP and PFA films in presence of various solvents.

PLATFORM • Volume 2 Number 1 • January – June 2001
42 Univers i t i Teknologi Petronas • http://www.utp.edu.my
polyethlene (PE). Dilution of styrenewith methanol was found to enhanceconsiderably the degree of graftingwhen compared with dilution withbenzene and toluene [25].
Machi et al [26] observed that thedegree of grafting styrene onto PEfilms varied with the type of solventused (methanol and n-octane) andmonomer solvent composition. Intheir system the degree of grafting wasfound to be at a maximum when thecontent of methanol in the styrene/methanol mixture was 70%.However, the degree of grafting wasfound to be decrease continuouslywith increasing n-octane content inthe styrene/n-octane mixture. Wilson[27] reported that the solvents thatswell the polymer matrix, such aswater or methanol, could enhance thegrafting of styrene onto nylon.
On the basis of our results,dichloromethane is likely to be themost suitable solvent for dilution ofstyrene during its grafting ontofluorinated films under our gaftingconditions. It can be concluded thesolvent is a significant factor incontrolling not only the swelling butalso the degree of grafting of inactivemonomers, such as styrene, ontofluorinated polymer films, such asPTFE, FEP and PFA.
Addition of various acids
Acids are usually added to graftingmixtures to enhance the degree ofgrafting and consequently improve theeconomy of the grafting process[25,28]. The effect of various acidson grafting styrene onto fluorinatedpolymer films was investigated. Table4 shows the results of the effect ofmineral and organic acids on thegrafting of styrene in monomer/solvent mixture having a composition60:40 (v/v) onto PTFE, FEP and PFA
films. The irradiation dose wasmaintained at 20 kGy at a dose rateof 1.32 kGyh-1. It can be seen thatthe addition of mineral or organicacids has almost no effect on thedegree of grafting for styrene dilutedwith methanol, benzene anddichloromethane. This can beattributed to the high chemicalresistance of the fluorinated filmswhich causes the shielding of thecarbon chains by the tightly heldelectron cloud around the fluorineatoms and the low swelling tendencyin the solvents, monomers andmonomer/solvent mixtures used.These results are in contrasts withthose reported for grafting styreneonto PE films in the presence ofsimilar mineral and organic acidadditives [25]. It was found thataddition of a small amount of mineralor organic acids enhanced the degreeof grafting of styrene onto LDPE filmsusing the simultaneous irradiationtechnique. A similar observation was
first reported by Garnett et al whofound that addition of a small amountof sulfuric acid accelerated the graftingof styrene in methanol onto PE films[29]. This behaviour was explainedon the assumption that the presenceof acid facilitates, hydrogenabstraction from adjacent polymermolecules by monomer-solventradicals during the grafting reaction[30]. Later it was found that acidmodifies the partition coefficient ofstyrene between the polymer film andthe external liquid phase, leading toan increase in the local styreneconcentration around the growingchains [30,31].
Grafting Confirmation
Grafting of styrene onto PTFE, FEPand PFA films was verified throughIR spectra and physical changes takingplace in the grafted films. Figures 9-11 show typical FTIR-ATR spectra oforiginal and grafted PTFE, FEP and
50015002000250035004000
Wavenumbers
Tra
nsm
ittan
ce
1000
E
D
C
B
AFigure 9: Typical
FTIR-ATR spectra
of (A) original
and grafted PTFE
films having
various degrees
of grafting: (B)
5%; (C) 18.5%;
(D) 24%; (E) 36%

Univers i t i Teknologi Petronas • http://www.utp.edu.my
43PLATFORM • Volume 2 Number 1 • January – June 2001
PFA films having various degrees ofgrafting. The broad bands at 1150-1250 cm-1 in the spectra of the threeoriginal films (spectrum A in eachfigure) are characteristic for thestretching vibration of CF2 present inthe structure of the three fluorinatedfilms. The original FEP film is furtherdistinguished by the persence of asharp band around 980 cm-1 due tothe stretching vibration of CF in theCF3 group, as shown inspectrum A(Fig 10). The original PFA film is alsodifferentiated by the sharp peak at1000 cm-1 representing the stretchingvibration of C–O groups of alkoxyvinyl ether, as depicted from spectrumA in Fig. 11. The presence of thebenzene ring in all grafted films(spectra B-E in Figs 9-11) of the
various types is established by the= C – H stretching vibration at 3050cm-1 and the skeletal C = C in-planestretching vibration at 1500 cm-1 and1600 cm-1, respectively. Mono-substitution of the benzene ring isconfirmed by the aromatic out-of-plane C – H deformation band at 860cm-1, C – H out-of-plane bendingovertone and combination bandpatterns in the region of 1660-2000cm-1. The absorption bands at 2800-2900 cm-1 and 2900-3000 cm-1 areassigned to symmetric and asymmetricstretching of aliphatic CH2 groups,respectively.
The variation in the intensity ofpolystyrene characteristic bands(spectra B-E in Figs 9-11) reflects
50015002000250035004000
Wavenumbers
Tra
nsm
ittan
ce
1000
E
D
C
B
A
50015002000250035004000
Wavenumbers
Tra
nsm
ittan
ce
1000
E
D
C
B
A
Figure 10: Typical FTIR-ATR spectra of (A) original and
grafted FEP films having various degrees of grafting:
(B) 6%; (C) 21%; (D) 41%; (E) 52%.
Figure 11: Typical FTIR-ATR spectra of (A) original and
grafted PFA films having various degrees of grafting:
(B) 5%; (C) 16%; (D) 35%; (E) 49%.
differences in the degree of grafting.In addition, the grafted films werefound to be translucent compared tothe original films, which were initiallytransparent except for original PTFEfilm, which is opaque with a whitecolour. Moreover, the dimensions ofthe grafted films were found to belarger then those of the original films.From the physical changes and thefeatures of the spectra of the graftedfilms, it can be concluded that styrenewas succeddfully grafted onto PTFE,FEP and PFA films.
ACKNOWLEDGEMENTS
The author wishes to thank the MalaysianInstitute for Nuclear Technology Research(MINT) for the access to the 60Co source.Thanks are also due to Prof. Hamdani Saidifor his continuous support.
PLATFORM • Volume 2 Number 1 • January – June 2001
44 Univers i t i Teknologi Petronas • http://www.utp.edu.my
REFERENCES
[1] G Bex, A Chapiro, M Huglin, A MJendrychowska-Bonamour & T O’Neill.Polym Sci C 22:493 (1968)
[2] I Ishigaki, N Kamiya, T Sugo & S Machi.Polym 10:513 (1978)
[3] A Niemoller, H Scholz, B & GEllinghorst. Memb Sci 36:385 (1988)
[4] Y Gen. Desalination 62:265 (1987)
[5] J L Garnett. Am Chem Symp Series48:334 (1977)
[6] S Dilli, J L Garnett and D H Phuoc.Polym Sci Polym Lett Edn 11:711(1973)
[7] J L Garnett & Nt Yen. Polym Sci PolmLett Edn 12:225 (1974)
[8] Y Kabanov, R E Aliew & L P Sidorova.Polym Sci Polym Chem Edn 18:791(1980)
[9] V Stanner. Radiant Phys Chem 35:82(1981)
[10] J Dobo, A Somogyi & TCzvikovszky.Polym Sci C 4:1173 (1964)
[11] S Munari, F Vigo, G Tealdo & C Rossi.Appl Polym Sci 11:1563 (1967)
[12] F Vigo, G Capannelli & S Munari.Desalination 37:313 (1981)
[13] X Zhi-li, W Gen-hua, W Han-ing, GGyn & N Min-hua. Radiat Phys Chem22:939 (1983)
[14] M V Rouilly, E R Kotz, O Haas, G GScherer & A Chapiro. Memb Sci 81:89(1993)
[15] B Gupta, F N Buchi & G G Scherer.Polym Sci A, Polym Chem 32:1931(1994)
[16] M M Nasef, H Saidi, H M Nor, K MDahlan & K Hashim. Appl Polym Sci73:2095 (1999)
[17] M M Nasef , H Saidi and H M Nor. ApplPolym Sci 76:220 (2000)
[18] M M Nasef, H Saidi, A M Dessouki &E M El-Nesr. Polym Int 49:339 (2000)
[19] H Omichi and K Araki. Polym Sci PolymSymp 66:1195 (1979)
[20] H Omichi & J Okamoto. Appl PolymSci 20:1559 (1982)
[21] H Omichi & V Stannett. Appl PolymSci 30:3059 (1985)
[22] J A Brydson. Plastics Materials, Chapter5, p77 Butterworths: London (1989)
[23] J Brandrup & E H Immergut (eds).Polymer Handbook, Wiley IntersciencePublications, New York, USA, chapter 2,p81 (1989)
[24] M M Nasef. Appl Polym Sci 77:1003(2000)
[25] N El-Assy. J Appl Polym Sci 42:885(1991)
[26] S Machi, I Kamel & J Silverman J. PolymSci A1 :3329 (1970)
[27] J E Wilson. Macromol Sci Chem 8:733(1974)
[28] J L Garnett, R S Kenyon, R Levot, M ALong & N T Yen. Macromol Sci Chem8: A-14:87 (1980)
[29] J L Garnett & N T Yen. Polym Sci PolymLett Edn 12:225 (1974)
[30] C H Ang, J L Garnett, R Levot & M ALong. Polym Sci Polm Lett Edn 21:257(1983)
[31] J L Garnett, S V Jankiewics & M A Long.Polym Sci Polym Lett Edn 23:563(1985)

Univers i t i Teknologi Petronas • http://www.utp.edu.my
45PLATFORM • Volume 2 Number 1 • January – June 2001
EXERGY LOST AS A DECISION MAKING CRITERIA IN THE
SELECTION OF UTILITY DESIGN OPTIONS
M Shuhaimi, A R Razali and A Ismail
Universiti Teknologi PETRONAS, 31750 Bandar Seri Iskandar, Tronoh, Perak, Malaysia.
e-mail: [email protected]
ABSTRACT
This paper presents the application of exergy lost, a thermodynamics concept, as an alternative method to aid the decision-making process in the selection of utility design options. Two literature-based case studies comprising the steam generationsystem and the cooling water system were analyzed. The steam generation system considered two design options toimprove an existing system with the deaerator operating at 3.0 barg pressure. The design options were whether to reducethe deaerator pressure to atmospheric level or to maintain the pressure at 3.0 barg but with an addition of an influentpreheater to recover excess of low potential energy source. For the cooling water system, the design options were whetherto have a cool or hot blowdown. Each design options was simulated on HYSIS process simulation software at steady-stateoperations. Stream data consisting of mass, energy and thermodynamics properties were extracted from the simulatedsystems. Exergy balance was then conducted to determine the best design options. The criteria of selection were based onsystems which exhibit the lowest quantity of exergy lost. From this study, it was found that the steam generation systemwith deaerator operating at 3.0 barg with an additional influent preheater was the most efficient. For the cooling watersystem, the option with cool blowdown turned out to be the more efficient system. These results were in agreement withthe published result. Exergy lost has, therefore, been demonstrated as a capable tool to aiding decision-making process inthe selection of utility design options.
Keywords: cooling water system, steam generation system, thermodynamics.
1. Introduction
Engineers involved in processsynthesis and optimization are oftenfaced with the acicular task of selectingbest scheme from a number of designoptions. The number of options toscope and screen is normally large,leading to costly time and effort spentin the selection process. In addition,the criteria of selection are also widerange – which include safety,environmental, reliability andeconomics consideration – leading tocomplex decision making model. Thecomplexity can be somewhatattenuated by reducing the number ofobjective functions involved thoughat the expense of limiting theirapplications in real systems.
Economics has always been theunderlying criteria on the viability ofmost investments. Objective functionin the form of minimization of totalcost or maximization of profit hasbeen widely applied throughoutprocess design and optimizationstudies [1]. However, cost of materialsand equipment are subjected to supplyand demand fluctuations. Withcurrency becoming a target of moneyspeculators, decision making criteriacan be sensitive to the time domainin which the calculations wereperformed [2]. In some cases of designoptions, the structural or parametricvariations are so slight that economicanalysis is incapable of supporting thedecision making process[3].
One alternative to the economics-based decision criteria is to comparethe thermodynamics performance ofthe competing design options. Withthe current inflation in oil prices, bestthermodynamics options alsoimplicate minimum energy cost. Inaddition, as industrial energy resourcesare widely based on the burning ofhydrocarbon fuel, minimization offuel is also benevolent to theenvironment [4].
This work demonstrates theapplication of exergy lost, athermodynamic concept, as a decisionmaking criteria in the selection ofutility design options involving thesteam generation systems and thecooling water system.
This paper was presented at 2nd International Seminar On Numerical Analysis In Engineering, Batam Island, Indonesia, 14 - 15 March 2001.
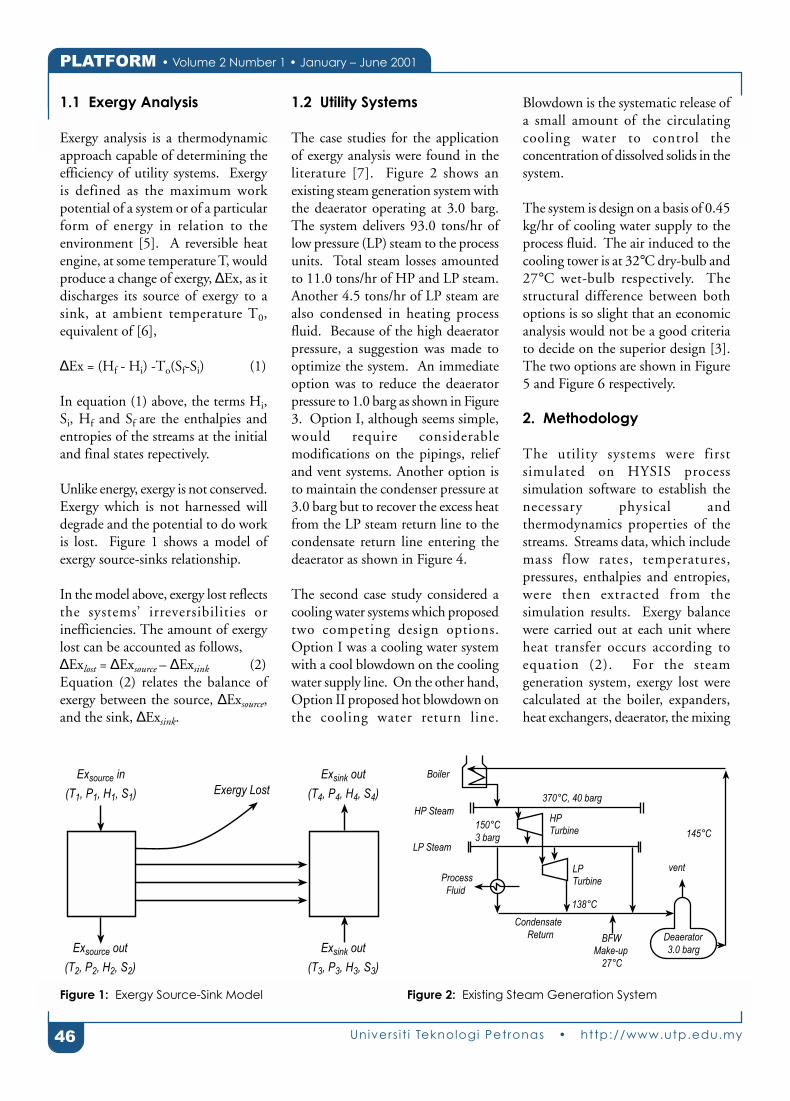
PLATFORM • Volume 2 Number 1 • January – June 2001
46 Univers i t i Teknologi Petronas • http://www.utp.edu.my
1.1 Exergy Analysis
Exergy analysis is a thermodynamicapproach capable of determining theefficiency of utility systems. Exergyis defined as the maximum workpotential of a system or of a particularform of energy in relation to theenvironment [5]. A reversible heatengine, at some temperature T, wouldproduce a change of exergy, ∆Ex, as itdischarges its source of exergy to asink, at ambient temperature T0,equivalent of [6],
∆Ex = (Hf - Hi) -To(Sf-Si) (1)
In equation (1) above, the terms Hi,Si, Hf and Sf are the enthalpies andentropies of the streams at the initialand final states repectively.
Unlike energy, exergy is not conserved.Exergy which is not harnessed willdegrade and the potential to do workis lost. Figure 1 shows a model ofexergy source-sinks relationship.
In the model above, exergy lost reflectsthe systems’ irreversibilities orinefficiencies. The amount of exergylost can be accounted as follows,∆Exlost = ∆Exsource – ∆Exsink (2)Equation (2) relates the balance ofexergy between the source, ∆Exsource,and the sink, ∆Exsink.
1.2 Utility Systems
The case studies for the applicationof exergy analysis were found in theliterature [7]. Figure 2 shows anexisting steam generation system withthe deaerator operating at 3.0 barg.The system delivers 93.0 tons/hr oflow pressure (LP) steam to the processunits. Total steam losses amountedto 11.0 tons/hr of HP and LP steam.Another 4.5 tons/hr of LP steam arealso condensed in heating processfluid. Because of the high deaeratorpressure, a suggestion was made tooptimize the system. An immediateoption was to reduce the deaeratorpressure to 1.0 barg as shown in Figure3. Option I, although seems simple,would require considerablemodifications on the pipings, reliefand vent systems. Another option isto maintain the condenser pressure at3.0 barg but to recover the excess heatfrom the LP steam return line to thecondensate return line entering thedeaerator as shown in Figure 4.
The second case study considered acooling water systems which proposedtwo competing design options.Option I was a cooling water systemwith a cool blowdown on the coolingwater supply line. On the other hand,Option II proposed hot blowdown onthe cooling water return line.
Blowdown is the systematic release ofa small amount of the circulatingcooling water to control theconcentration of dissolved solids in thesystem.
The system is design on a basis of 0.45kg/hr of cooling water supply to theprocess fluid. The air induced to thecooling tower is at 32°C dry-bulb and27°C wet-bulb respectively. Thestructural difference between bothoptions is so slight that an economicanalysis would not be a good criteriato decide on the superior design [3].The two options are shown in Figure5 and Figure 6 respectively.
2. Methodology
The utility systems were firstsimulated on HYSIS processsimulation software to establish thenecessary physical andthermodynamics properties of thestreams. Streams data, which includemass flow rates, temperatures,pressures, enthalpies and entropies,were then extracted from thesimulation results. Exergy balancewere carried out at each unit whereheat transfer occurs according toequation (2). For the steamgeneration system, exergy lost werecalculated at the boiler, expanders,heat exchangers, deaerator, the mixing
Figure 2: Existing Steam Generation SystemFigure 1: Exergy Source-Sink Model
Exsource in
(T1, P1, H1, S1) Exergy Lost
Exsink out
(T4, P4, H4, S4)
Exsink out
(T3, P3, H3, S3)
Exsource out
(T2, P2, H2, S2)
Boiler
HP Steam
LP Steam
Process
Fluid
LPTurbine
vent
Deaerator
3.0 barg
145°C
370°C, 40 barg
HPTurbine
150°C
3 barg
Condensate
Return BFWMake-up
138°C
27°C

Univers i t i Teknologi Petronas • http://www.utp.edu.my
47PLATFORM • Volume 2 Number 1 • January – June 2001
points, preheater and the process.Heat transfer units for the coolingwater system were the cooling tower,the mixing points and the process.Exergy balance calculations wereperformed on MS Excel spreadsheetsoftware. All calculations werereferenced to the environment at 1atm and 27oC.
3. Results and Discussion
Table 1 shows the result of exergyanalysis for the two competing optionsof steam generation system. Changingthe condenser pressure from 3.0 to 1.0barg resulted in an 78% reduction ofexergy lost in the deaerator. Thus the
option of operating the deaerator atlower pressure seems inevitablyenticing. However, one can easily bemisled by making a judgment basedsolely on a single component of thesystem. The overall exergy lostexhibited by Option I is actually 2.8%higher than the base case. This is dueto the lower boiler feedwater (BFW)supply temperature at boiler inlet andhigher lost due to mixing at differenttemperature. The second option tomaintain the deaerator pressure at 3.0barg and adding an influent preheatershowed an overall reduction of exergylost by 3.5%. Although the additionalpreheater contributed to 0.6%additional exergy lost in the system,
the utilization of LP steam – whichwould otherwise be lost in the mixingpoints – for regenerative feed heatinghad reduced the overall irreversibilityof the steam generation system.
The result for the cooling water systemis further shown in Table 2 above. Thelocation of blowdown was found toaffect the overall performance of thesystem. Exergy lost for the coolblowdown was almost 8% lower thanthat of the hot blowdown. This resultis not surprising since hot blowdown,as with windage effect, leads toevaporation lost resulting in theenergy potential being dissipated intothe environment.
Figure 3: Proposed Steam System Modification with 1.0
barg Deaerator Pressure.
Figure 4: Proposed Steam System Modification with 3.0
barg Deaerator Pressure and Influent Preheat.
Figure 5: Cooling Water System with Cool Blowdown Figure 6: Cooling Water System with Hot Blowdown
Boiler
HP Steam
LP Steam
Process
Fluid
LPTurbine
vent
Deaerator
1.0 barg
121°C
370°C, 40 barg
HPTurbine
150°C
3 barg
Condensate
Return BFWMake-up
138°C
27°C
Boiler
HP Steam
LP Steam
Process
Fluid
LPTurbine
vent
Deaerator
3.0 barg
145°C
370°C, 40 barg
HPTurbine
150°C
3 barg
Condensate
Return BFWMake-up
138°C
27°C
116°C
5%
Wind LossAir
37.8°C
Sat.37.0°C
Process
Fluid
43°C
29°C
10%
Blowdown
32°C dry
27°C wetAir
Make-Up 27°C
5%
Wind LossAir
37.8°C
Sat.37.0°C
Process
Fluid
43°C
29°C
10%
Blowdown
32°C dry bulb
27°C wet bulbAir
Make-Up 27°C
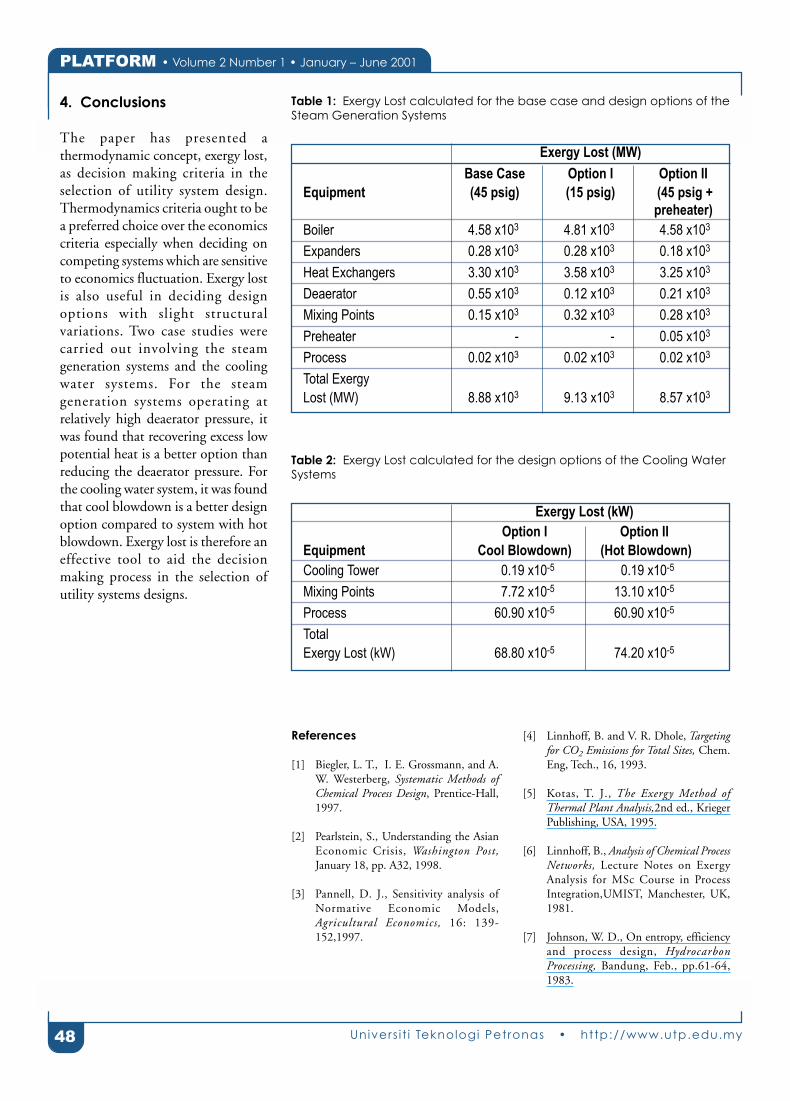
PLATFORM • Volume 2 Number 1 • January – June 2001
48 Univers i t i Teknologi Petronas • http://www.utp.edu.my
4. Conclusions
The paper has presented athermodynamic concept, exergy lost,as decision making criteria in theselection of utility system design.Thermodynamics criteria ought to bea preferred choice over the economicscriteria especially when deciding oncompeting systems which are sensitiveto economics fluctuation. Exergy lostis also useful in deciding designoptions with slight structuralvariations. Two case studies werecarried out involving the steamgeneration systems and the coolingwater systems. For the steamgeneration systems operating atrelatively high deaerator pressure, itwas found that recovering excess lowpotential heat is a better option thanreducing the deaerator pressure. Forthe cooling water system, it was foundthat cool blowdown is a better designoption compared to system with hotblowdown. Exergy lost is therefore aneffective tool to aid the decisionmaking process in the selection ofutility systems designs.
Table 1: Exergy Lost calculated for the base case and design options of the
Steam Generation Systems
Exergy Lost (MW)
Base Case Option I Option II
Equipment (45 psig) (15 psig) (45 psig +
preheater)
Boiler 4.58 x10³ 4.81 x10³ 4.58 x10³
Expanders 0.28 x10³ 0.28 x10³ 0.18 x10³
Heat Exchangers 3.30 x10³ 3.58 x10³ 3.25 x10³
Deaerator 0.55 x10³ 0.12 x10³ 0.21 x10³
Mixing Points 0.15 x10³ 0.32 x10³ 0.28 x10³
Preheater - - 0.05 x10³
Process 0.02 x10³ 0.02 x10³ 0.02 x10³
Total Exergy
Lost (MW) 8.88 x10³ 9.13 x10³ 8.57 x10³
Table 2: Exergy Lost calculated for the design options of the Cooling Water
Systems
Exergy Lost (kW)
Option I Option II
Equipment Cool Blowdown) (Hot Blowdown)
Cooling Tower 0.19 x10⁻⁵ 0.19 x10⁻⁵
Mixing Points 7.72 x10⁻⁵ 13.10 x10⁻⁵
Process 60.90 x10⁻⁵ 60.90 x10⁻⁵
Total
Exergy Lost (kW) 68.80 x10⁻⁵ 74.20 x10⁻⁵
References
[1] Biegler, L. T., I. E. Grossmann, and A.W. Westerberg, Systematic Methods ofChemical Process Design, Prentice-Hall,1997.
[2] Pearlstein, S., Understanding the AsianEconomic Crisis, Washington Post,January 18, pp. A32, 1998.
[3] Pannell, D. J., Sensitivity analysis ofNormative Economic Models,Agricultural Economics, 16: 139-152,1997.
[4] Linnhoff, B. and V. R. Dhole, Targetingfor CO2 Emissions for Total Sites, Chem.Eng, Tech., 16, 1993.
[5] Kotas, T. J., The Exergy Method ofThermal Plant Analysis,2nd ed., KriegerPublishing, USA, 1995.
[6] Linnhoff, B., Analysis of Chemical ProcessNetworks, Lecture Notes on ExergyAnalysis for MSc Course in ProcessIntegration,UMIST, Manchester, UK,1981.
[7] Johnson, W. D., On entropy, efficiencyand process design, HydrocarbonProcessing, Bandung, Feb., pp.61-64,1983.

Univers i t i Teknologi Petronas • http://www.utp.edu.my
49PLATFORM • Volume 2 Number 1 • January – June 2001
ABSTRACT
The catalytic oxidatiom of benzene, a volatile organic compound (VOC), was carried out in a U-shaped glass reactor attemperatures between 100 °C to 200 °C in the presence of TiO2, tungsten-doped TiO2 and platinum-supported TiO2
powders. The existence of platinum and tungsten on the TiO2 were verified by x-ray photoelectron spectroscopy (XPS).In the presence of bare TiO2, benzene conversion was 52% at 180 °C and increased to 65% when the TiO2 was dopedwith 0.4% tungsten. Platinum loading on TiO2 also improved its catalytic activity towards conversion of benzene. At180 °C, the conversion was 64% over 0.1 wt% Pt/TiO2 and increased slightly to 69% over the 0.3 wt% Pt/TiO2 catalyst.Based on these findings, a different catalyst formulation was carried out in which platinum was supported on a tungsten-doped TiO2. At 180 °C, benzene conversion reached 85% in the presence of 0.3 wt% Pt/TiO2 (0.4%W6+). Among thecatalysts tested, the 0.3 wt% Pt/TiO2 (0.4% W6+) showed the highest activity in which the conversion of benzeneincreased from 31% at 100 °C to 88% at 200 °C.
Keywords: benzene, catalysts, oxidation, TiO2, VOC.
Catalytic Removal of Volatile Organic Compounds (VOC)
Dr Noor Asmawati Mohd Zabidi, Chuah Won Ching and Ng Siew Kiam
Universiti Sains Malaysia (Perak Branch Campus),
31750 Bandar Seri Iskandar, Tronoh, Perak, Malaysia
e-mail: [email protected].
1. INTRODUCTION
Volatile organic compounds (VOC)are liquids that contain organic carbon(with the exception of elementalcarbon, carbon monoxide and carbondioxide) that vaporize at significantrates. The emission of VOC fromvehicles and various industrial sitessuch as plants manufacturing organicchemicals and polymers is ofconsiderable concern due to theirharmful effects. Due to their toxicityand malodorous nature, there is animmediate need to reduce thepresence of VOCs.
Several methods have been developedfor their destruction such asincineration, absorption, adsorption,condensation, biodegradation andphotocatalytic oxidation [1]. Thesemethods are not entirely satisfactory.
Secondary pollutants would begenerated via the adsorption andabsorption methods, whereas theefficiency of condensation,biodegradation and photocatalyticoxidation are limited. Catalyticoxidation of the VOC is the mostpromising method for the reductionof VOC as it can be conducted at alower temperature compared tothermal incineration method, whichrequires temperature greater than1000°C [2]. Destruction of VOCsfrom air stream using catalytictechnology has attained a great dealof attention by a number of researchworkers [3 - 6]. Studies on destructionof VOCs employed either a supportednoble metal, metal oxides, mixture ofnoble metals and metal oxides as wellas zeolites [7]. Noble metals such asplatinum and palladium have beenwidely applied and the most commonsupport used is Al2O3.
This paper deals with the oxidationof benzene over TiO2 catalysts in thetemperature range of 120°C to 200°C.The effects of platinum loading andtungsten doping on the efficiency ofthe TiO2 catalysts are also presented.
2. EXPERIMENTAL
Powdered TiO2 (>99%) and WO3
(99.9%) were purchased from Flukaand were used as received. TheW6+-doped TiO2 was prepared bymixing desired amounts of TiO2 andWO3 in distilled water. The water wasevaporated under continuous stirringand then the residue was dried at100°C for 24 hours. The dried residuewas calcined at 900°C for 5 hours.Colloidal platinum was obtained byreducing chloroplatinic acid withsodium citrate using the proceduredescribed by Mills and Porter [8]. The
This paper was presented at SEMINAR PERSEKITARAN 2000, Universiti Sains Malaysia, Serdang, 20 - 21 November 2000.

PLATFORM • Volume 2 Number 1 • January – June 2001
50 Univers i t i Teknologi Petronas • http://www.utp.edu.my
platinum/citrate sol was prepared byrefluxing a solution containing 15 mgof chloroplatinic acid (BDH), 30 mLof 1 w/w% sodium citrate (Merck)and 120 mL of distilled water. Theamount of chloroplatinic acid wasincreased proportionately for thepreparation of catalysts at higher Ptloading. The color of the solution wasclear yellow and changed to blackupon refluxing. After 4 hours ofrefluxing, the solution was allowed tocool to room temperature. Fifty mLof the resultant sol was stirred with 5grams of the powder and 5.8 gramsof sodium chloride. After stirring forabout 20 minutes, the platinizedpowder (0.1 wt % Pt ) suspension wasfiltered and then dried at 120°C for16 hours. The dried powder was thencalcined at 450°C for 8 hours.
The BET surface area of the catalystswas determined using nitrogenadsorption with a Chembet 3000instrument (Quantachrome). Thesurface composition of selectedsamples was analyzed using the x-rayphotoelectron spectrometer (VGScientific, ESCALAB 250). X-rayphotoelectron spectra were obtainedusing a monochromatic x-ray beamwith spot size of 500 µm.
Reactions were carried out in a U-shaped Pyrex reactor (15 mm i.d.)under atmospheric pressure. Thereactor was packed with 1 gram ofcatalyst and placed in a Technefluidized bath (model SBL-1). Thereactor temperature was measured bya thermocouple inserted in the sandof the fluidized bath. Liquid benzenewas placed in a water bath maintainedat 11°C. Compressed air (Gas PantaiTimur, Malaysia) was passed througha saturator containing liquid benzeneand the flow rate was set at 77 mL/min. The feed and reacted vaporswere analyzed using a gaschromatograph (HP 5890 Series II)
equipped with a thermal conductivitydetector and a flame ionizationdetector. Sample was collected in a250 mL gas bulb ( Supelco) and it wasanalyzed using a stainless steel PorapakQ column (6 ft x 1/8 in).
3. RESULTS AND DISCUSSION
X-ray photoelectron spectroscopy(XPS) was used to analyze the surfacecomposition of the catalysts. Figure1 shows the XPS spectra of the TiO2
samples for the Ti3p and W4f region(top) and the Ti3s and Pt4f region(bottom). There is an overlap betweenthe W4f peak and the Ti3p peak.Comparison and subtraction of thespectrum with that from pure TiO2
clearly shows the presence of tungsten.The XPS confirmed the presence of0.48 atomic % tungsten in the +6oxidation state. Detection of Pt iscomplicated by the presence of anenergy loss peak from the Ti3s regionwhich overlaps the Pt4f region.However, use of high-energyresolution spectra together withspectrum subtraction allowed thepresence of platinum to be confirmed.Using the Pt4f peak, the existence ofPt was confirmed to be at 0.048atomic % for the 0.3 wt% Pt/TiO2.The spectrum indicates that there aretwo different chemical states of Pt,thus not all of the platinum wasconverted to the zero valence state.
Table 1 shows the specific surface areasand the corresponding activities of the
catalysts towards benzene oxidation.The surface area of the untreated TiO2
was 7.12 m2/g and this value decreasedto 4.28 when the TiO2 was dopedwith 0.4 % W6+. The surface area didnot affect the performance of thecatalyst significantly. The surface areaof bare TiO2 and 0.1 % Pt/TiO2 isvery similar, however the 0.1 % Pt/TiO2 showed a higher activity towardsbenzene oxidation compared to thatof bare TiO2.
The conversion of benzene in thepresence of TiO2 was only 52.1% andincreased to 65.3% over the tungsten-doped TiO2 whereas dispersion of 0.1wt% Pt onto TiO2 increased theconversion to 63.6%. Experiment wasalso conducted using a 0.3 wt%Pt/TiO2 and the conversion increasedby 5% as compared to that obtainedfrom the 0.1 wt% Pt/TiO2. Theseresults suggested that both platinumand tungsten increase the catalyticactivity of TiO2. Following theseobservations another catalystformulation was prepared in which Ptwas loaded on the tungsten-dopedTiO2. The conversion increasedsignificantly to 84.8% as compared to52.1% over the untreated TiO2.Papefthimiou and coworkers [6] havemeasured the oxygen uptake oftungsten-doped TiO2 powder andfound that this support adsorbedoxygen significantly. Theenhancement of the catalytic activityof the Pt/TiO2 (0.4% W6+) is
Table 1: Specific surface areas of the catalysts and catalytic activities
Catalyst Surface area % conversion
(m2/g) at 180 °C
TiO2 7.12 52.1
TiO2 (0.4% W6+) 4.28 65.3
0.1% Pt/TiO2 7.34 63.6
0.3% Pt/TiO2 5.75 78.8
0.3% Pt/TiO2 (0.4% W6+) 3.05 84.8

Univers i t i Teknologi Petronas • http://www.utp.edu.my
51PLATFORM • Volume 2 Number 1 • January – June 2001
6500
6000
5500
5000
4500
4000
3500
3000
2500
2000
1500
1000
500
040 38 36 34 32 30 28 26
CP
S
Binding Energy (eV)
Difference Spectrum
TiO2
TiO2 0 .3% Pt , 0 .4% W6+
6400
6200
6000
5800
5600
5400
5200
5000
4800
4600
4400
4200
40 38 36 34 32 30 28 26
CP
S
Binding Energy (eV)
TiO2
TiO2 0 .3% Pt , 0 .4% W6+
3034
TiO2 0 .3% Pt
Pt4f
P t 4 f
Ti 3s
energy loss
Figure 1:
X-ray photoelectron
spectra of TiO2
samples for the Ti3p
and W4f region (top)
and the Ti3s and Pt
4f
region (bottom).
100 120 140 160 180 200 220
0
20
40
60
80
100
Temperature (°C)
Con
vers
ion
%
Figure 2:
Benzene conversion as a function
of temperature in the presence of
(▲▲)ATiO2,
(●● )ATiO2 (0.4%AW6+),
(■■ )A0.3%APt/TiO2 and
(◆ )A0.3% Pt/TiO2A(0.4%AW6+).
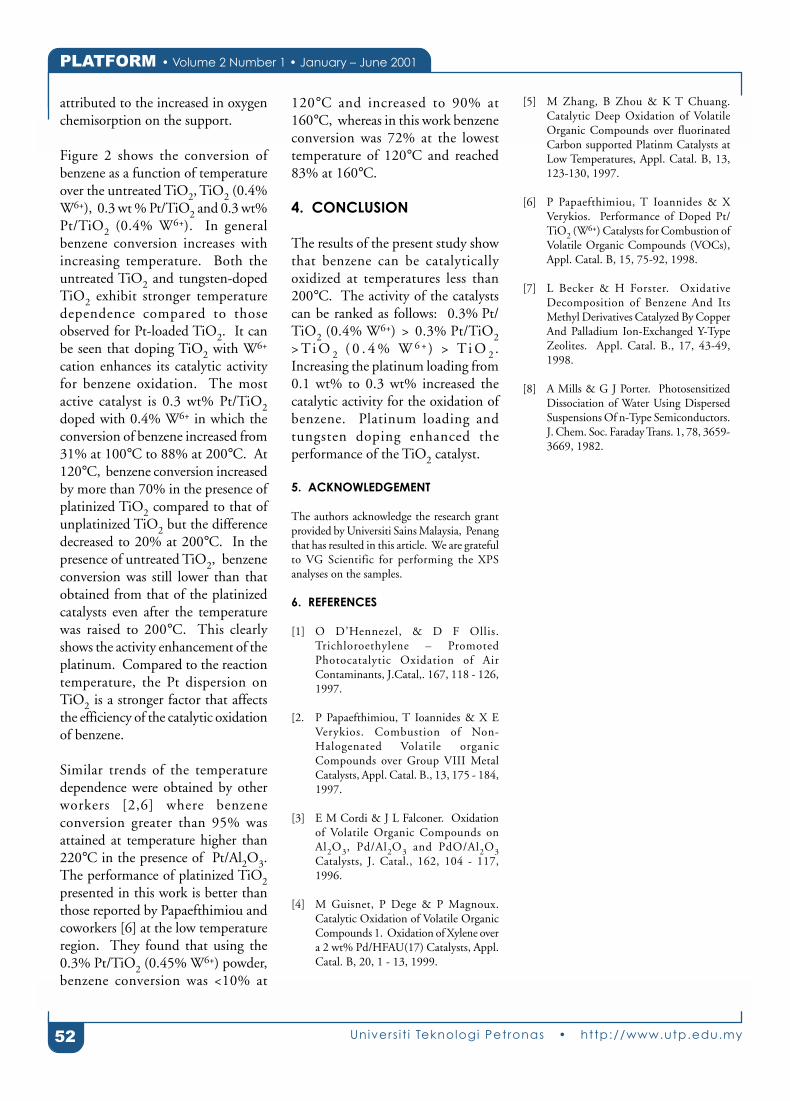
PLATFORM • Volume 2 Number 1 • January – June 2001
52 Univers i t i Teknologi Petronas • http://www.utp.edu.my
attributed to the increased in oxygenchemisorption on the support.
Figure 2 shows the conversion ofbenzene as a function of temperatureover the untreated TiO2, TiO2 (0.4%W6+), 0.3 wt % Pt/TiO2 and 0.3 wt%Pt/TiO2 (0.4% W6+). In generalbenzene conversion increases withincreasing temperature. Both theuntreated TiO2 and tungsten-dopedTiO2 exhibit stronger temperaturedependence compared to thoseobserved for Pt-loaded TiO2. It canbe seen that doping TiO2 with W6+
cation enhances its catalytic activityfor benzene oxidation. The mostactive catalyst is 0.3 wt% Pt/TiO2doped with 0.4% W6+ in which theconversion of benzene increased from31% at 100°C to 88% at 200°C. At120°C, benzene conversion increasedby more than 70% in the presence ofplatinized TiO2 compared to that ofunplatinized TiO2 but the differencedecreased to 20% at 200°C. In thepresence of untreated TiO2, benzeneconversion was still lower than thatobtained from that of the platinizedcatalysts even after the temperaturewas raised to 200°C. This clearlyshows the activity enhancement of theplatinum. Compared to the reactiontemperature, the Pt dispersion onTiO2 is a stronger factor that affectsthe efficiency of the catalytic oxidationof benzene.
Similar trends of the temperaturedependence were obtained by otherworkers [2,6] where benzeneconversion greater than 95% wasattained at temperature higher than220°C in the presence of Pt/Al2O3.The performance of platinized TiO2presented in this work is better thanthose reported by Papaefthimiou andcoworkers [6] at the low temperatureregion. They found that using the0.3% Pt/TiO2 (0.45% W6+) powder,benzene conversion was <10% at
120°C and increased to 90% at160°C, whereas in this work benzeneconversion was 72% at the lowesttemperature of 120°C and reached83% at 160°C.
4. CONCLUSION
The results of the present study showthat benzene can be catalyticallyoxidized at temperatures less than200°C. The activity of the catalystscan be ranked as follows: 0.3% Pt/TiO2 (0.4% W6+) > 0.3% Pt/TiO2> Ti O 2 ( 0 . 4 % W 6 + ) > Ti O 2 .Increasing the platinum loading from0.1 wt% to 0.3 wt% increased thecatalytic activity for the oxidation ofbenzene. Platinum loading andtungsten doping enhanced theperformance of the TiO2 catalyst.
5. ACKNOWLEDGEMENT
The authors acknowledge the research grantprovided by Universiti Sains Malaysia, Penangthat has resulted in this article. We are gratefulto VG Scientific for performing the XPSanalyses on the samples.
6. REFERENCES
[1] O D’Hennezel, & D F Ollis.Trichloroethylene – PromotedPhotocatalytic Oxidation of AirContaminants, J.Catal,. 167, 118 - 126,1997.
[2. P Papaefthimiou, T Ioannides & X EVerykios. Combustion of Non-Halogenated Volatile organicCompounds over Group VIII MetalCatalysts, Appl. Catal. B., 13, 175 - 184,1997.
[3] E M Cordi & J L Falconer. Oxidationof Volatile Organic Compounds onAl2O3, Pd/Al2O3 and PdO/Al2O3Catalysts, J. Catal., 162, 104 - 117,1996.
[4] M Guisnet, P Dege & P Magnoux.Catalytic Oxidation of Volatile OrganicCompounds 1. Oxidation of Xylene overa 2 wt% Pd/HFAU(17) Catalysts, Appl.Catal. B, 20, 1 - 13, 1999.
[5] M Zhang, B Zhou & K T Chuang.Catalytic Deep Oxidation of VolatileOrganic Compounds over fluorinatedCarbon supported Platinm Catalysts atLow Temperatures, Appl. Catal. B, 13,123-130, 1997.
[6] P Papaefthimiou, T Ioannides & XVerykios. Performance of Doped Pt/TiO2 (W
6+) Catalysts for Combustion ofVolatile Organic Compounds (VOCs),Appl. Catal. B, 15, 75-92, 1998.
[7] L Becker & H Forster. OxidativeDecomposition of Benzene And ItsMethyl Derivatives Catalyzed By CopperAnd Palladium Ion-Exchanged Y-TypeZeolites. Appl. Catal. B., 17, 43-49,1998.
[8] A Mills & G J Porter. PhotosensitizedDissociation of Water Using DispersedSuspensions Of n-Type Semiconductors.J. Chem. Soc. Faraday Trans. 1, 78, 3659-3669, 1982.

Univers i t i Teknologi Petronas • http://www.utp.edu.my
53PLATFORM • Volume 2 Number 1 • January – June 2001
ABSTRACT
Constant legislative, emissions, fuel economy and consumer pressure are driving manufacturers toward producing moreefficient engines with complex control. Many of these new engines have benefited from optical research engines todevelop advanced fuelling and combustion strategies. Existing optical research engines have been shown to be limited byspeed, degree of optical access, robustness or ease of use. Lotus Engineering has designed, developed and validated a newoptical access single cylinder research engine. The optical access is achieved via a combination of (1) fused silica cylinder,(2) pent roof combustion chamber and (3) optical piston crown (sapphire). The optical techniques to be used with thenew engine are (1) phase Doppler anemometry, (2) high-speed imaging and (3) laser induced fluorescence (LIF). Theengine is now fully commissioned and is capable of being motored or fired to speeds greater than 5000 rpm and pressuresof 60 bar.
Keywords: optical access, single cylinder engine.
A Single Cylinder Optical Access Engine For
Combustion Analysis Using Laser Based Diagnostics
Peter Williams, Graham Pitcher, Dr Don Law,
Dr Jeff Allen and Dr Simon Wood
Group Lotus plc, Hethel, Norwich, Norfolk, UK
Dr Graham Wigley
Department of Aero and Auto Engineering,
Loughborough University, Loughborough, UK
INTRODUCTION
Legislation, environmental andconsumer pressures continually pushmanufacturers to produce increasinglyefficient engines throughimprovements in fuelling andcombustion processes [1]. In recentyears, Lotus has been active indeveloping and productionisingseveral new technologies such ascylinder de-activation (CDA)controlled auto ignition (AI) andvariable valve actuation (VVA). Inaddition and external to the Lotuswork, the automotive industry hasseen gasoline direct injection (GDI)enter the market place. All these newtechnologies claim distinct benefitsand all address a fundamental need,that of accurate control (metering) of
(1) fuelling, (2) in-cylinder motionand (3) combustion processes,yielding engines with increasedefficiency and lower emissions. Inorder to understand (1-3) above,Lotus have designed, developed andvalidated a new highly opticallyaccessible research single cylinderresearch engine. Whilst single cylinderengines have been used for some time,it is our belief that the Lotus enginedemonstrates a distinct step forwardin terms of optical access andoperational running speed overpreceding optical engines. Manycurrently available optically engines[2, 3, 4] are known to be restricted intheir use due to (1) speed limitations,(2) fragile parts, (3) limited opticalaccess and by being (4) timeconsuming to use. If such factors are
further compounded by (5)unrepresentative engine geometries,then the data generated from earlieroptical engines often provokes morequestions than provides answers. Thispaper presents an overview of the newLotus engine and details the featuresthat we believe support its innovativedesign.
LOTUS ENGINE CONCEPT
The specification of the engine led toa design concept comprising of thefollowing: (1) A full-length removableglass cylinder that forms both theworking cylinder and an optical bore,(2) An extended (bifurcated design)piston containing a slot to position astationary 45° mirror and a largeremovable piston crown window, (3)
This paper was presented at the International Symposium on Automotive, Testing and Automation (ISATA), Dublin-Ireland, September 2001.

PLATFORM • Volume 2 Number 1 • January – June 2001
54 Univers i t i Teknologi Petronas • http://www.utp.edu.my
A cylinder head mounted above the optical section allowingmaximum access from all geometries, (4) Camshaft drivebelt routed to minimise obstruction of view to opticalsection, (5) Upper crankcase containing a hydraulicplatform, providing rapid load/unload mounting of thecylinder, (6) Robust lower crankcase containing crankshaftand both primary and secondary balance shafts, and (7)Production-representative head porting and valvegeometries.
Table 2: Lotus single cylinder optical engine working
specifications
Cylinder capacity: 448.9 cm3
Bore × Stroke: 80.5 mm ×88.2 mm
Valve gear 2 camshafts,4 valves
Compression ratio: 10:1
Max. rpm: ≈ 5000
Max cyl. pressure: 60 bar
Thus it can be seen that the criteria placed many demandson the design. Un-obscured optical access through thecylinder, piston crown and pent roof cylinder head of theengine permits a wide range of photographic and laser basedoptical techniques to be employed. This was achieved byhaving the complete optical cylinder made of fused silica.Immediate intention was focussed toward using (1) phaseDoppler anemometry, (2) high-speed imaging and (3) laserinduced fluorescence (LIF). These techniques are powerful[5, 6, 7, 8, 9, 10] in that they provide valuable dataconcerning (1) in-cylinder airflow, (2) fuel-air mixing, (3)fundamental ignition events, (4) flame kernel growth andpropagation, (5) flame structure and (6) wall quenching.The most basic engine design criteria must satisfy opticalaccess demands of laser diagnostic and imaging andmeasurement techniques. Lotus’ additional requirementwas for unequivocal access to the entire combustionchamber and facilitated the inclusion of a pent-roof cylinderhead design where the optical liner has been sculptured tocontain two raised contours which integrate with the pent-roof head (see object B in Figure 2). Access was also requiredthrough the base of the piston crown and in order to effectthis an optical window (made of sapphire) was designedinto the top of the piston. Laser (diagnostic) light couldthen be directed upward into the combustion chamber viaa static 45o mirror situated between the two limbs of thebifurcated piston. Thus, by using the (1) fused silica
Figure 1: Representation of the engine showing
the crank case extension as seen from above
and mapping the extent of the optical access.
Figure 2: (A) Hydraulic cylinder liner support/quick release platform
for the cylinder, (B) fused silica cylinder, (C) sapphire piston crown
and (D) bifurcated piston (to permit laser access from below the
piston crown via a static mirror placed at 45o relative to the piston
crown) with titanium retaining ring to hold (C) in position.
A
B
D
C
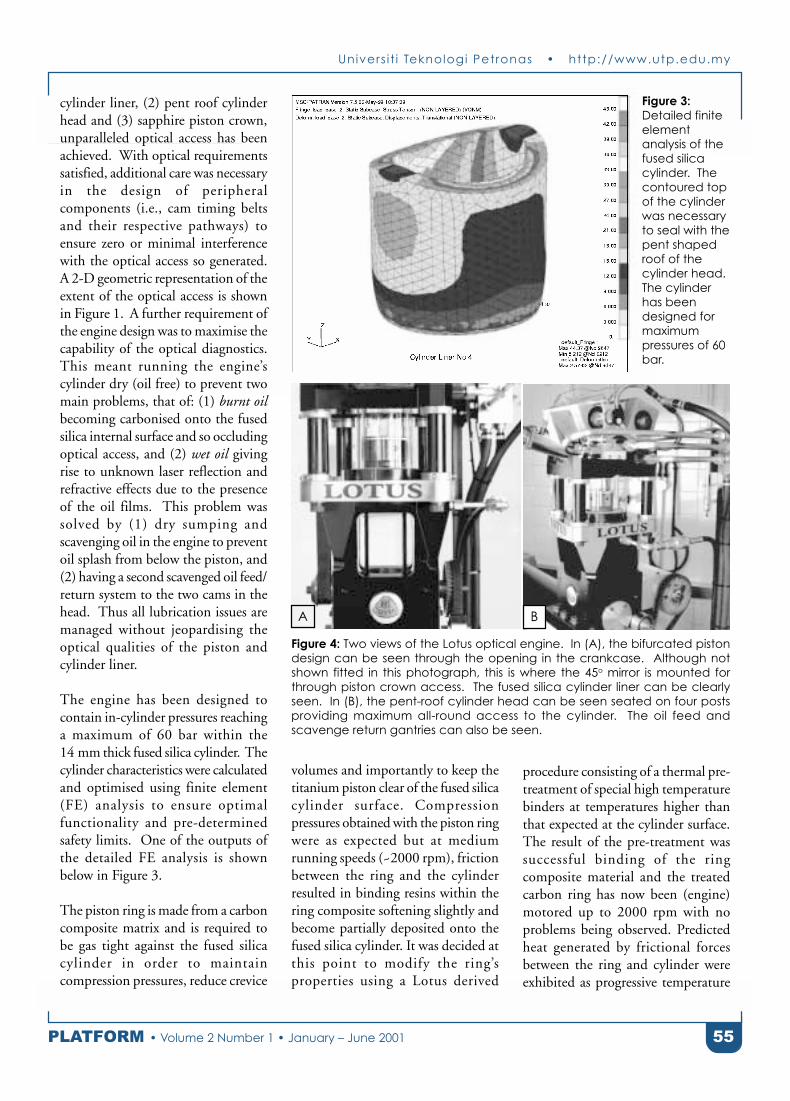
Univers i t i Teknologi Petronas • http://www.utp.edu.my
55PLATFORM • Volume 2 Number 1 • January – June 2001
cylinder liner, (2) pent roof cylinderhead and (3) sapphire piston crown,unparalleled optical access has beenachieved. With optical requirementssatisfied, additional care was necessaryin the design of peripheralcomponents (i.e., cam timing beltsand their respective pathways) toensure zero or minimal interferencewith the optical access so generated.A 2-D geometric representation of theextent of the optical access is shownin Figure 1. A further requirement ofthe engine design was to maximise thecapability of the optical diagnostics.This meant running the engine’scylinder dry (oil free) to prevent twomain problems, that of: (1) burnt oilbecoming carbonised onto the fusedsilica internal surface and so occludingoptical access, and (2) wet oil givingrise to unknown laser reflection andrefractive effects due to the presenceof the oil films. This problem wassolved by (1) dry sumping andscavenging oil in the engine to preventoil splash from below the piston, and(2) having a second scavenged oil feed/return system to the two cams in thehead. Thus all lubrication issues aremanaged without jeopardising theoptical qualities of the piston andcylinder liner.
The engine has been designed tocontain in-cylinder pressures reachinga maximum of 60 bar within the14 mm thick fused silica cylinder. Thecylinder characteristics were calculatedand optimised using finite element(FE) analysis to ensure optimalfunctionality and pre-determinedsafety limits. One of the outputs ofthe detailed FE analysis is shownbelow in Figure 3.
The piston ring is made from a carboncomposite matrix and is required tobe gas tight against the fused silicacylinder in order to maintaincompression pressures, reduce crevice
volumes and importantly to keep thetitanium piston clear of the fused silicacylinder surface. Compressionpressures obtained with the piston ringwere as expected but at mediumrunning speeds (~2000 rpm), frictionbetween the ring and the cylinderresulted in binding resins within thering composite softening slightly andbecome partially deposited onto thefused silica cylinder. It was decided atthis point to modify the ring’sproperties using a Lotus derived
Figure 4: Two views of the Lotus optical engine. In (A), the bifurcated piston
design can be seen through the opening in the crankcase. Although not
shown fitted in this photograph, this is where the 45o mirror is mounted for
through piston crown access. The fused silica cylinder liner can be clearly
seen. In (B), the pent-roof cylinder head can be seen seated on four posts
providing maximum all-round access to the cylinder. The oil feed and
scavenge return gantries can also be seen.
A B
Figure 3:
Detailed finite
element
analysis of the
fused silica
cylinder. The
contoured top
of the cylinder
was necessary
to seal with the
pent shaped
roof of the
cylinder head.
The cylinder
has been
designed for
maximum
pressures of 60
bar.
procedure consisting of a thermal pre-treatment of special high temperaturebinders at temperatures higher thanthat expected at the cylinder surface.The result of the pre-treatment wassuccessful binding of the ringcomposite material and the treatedcarbon ring has now been (engine)motored up to 2000 rpm with noproblems being observed. Predictedheat generated by frictional forcesbetween the ring and cylinder wereexhibited as progressive temperature
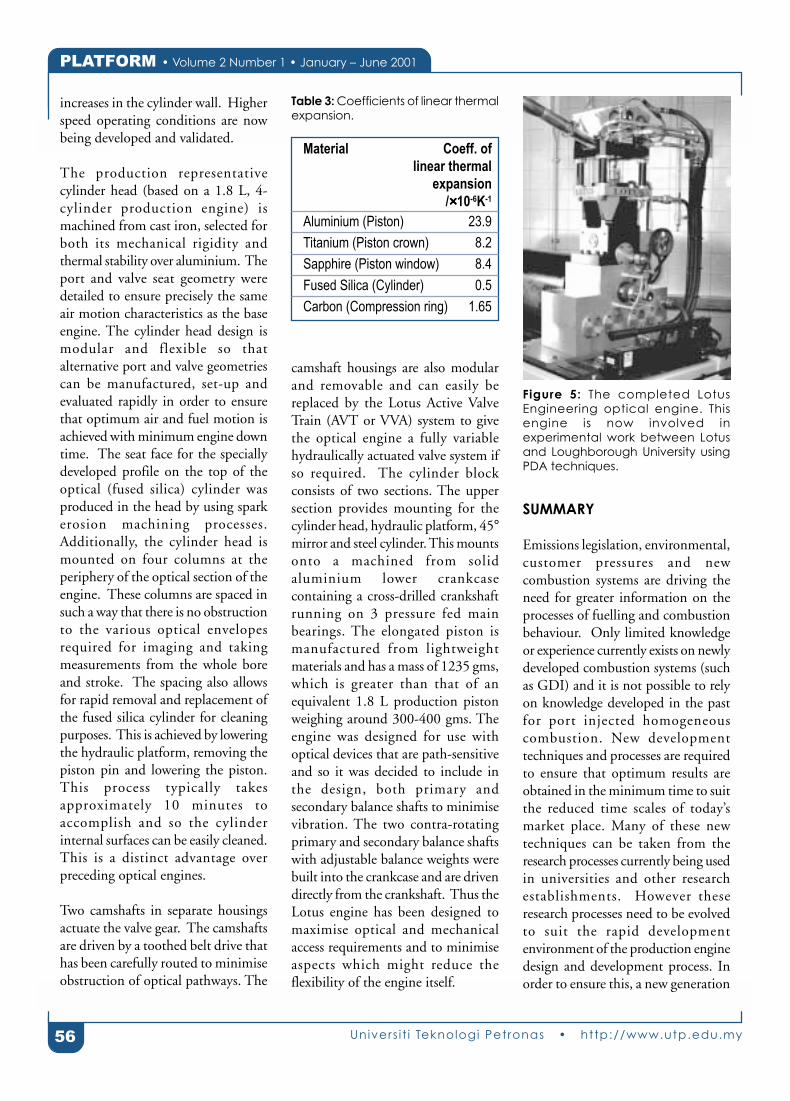
PLATFORM • Volume 2 Number 1 • January – June 2001
56 Univers i t i Teknologi Petronas • http://www.utp.edu.my
increases in the cylinder wall. Higherspeed operating conditions are nowbeing developed and validated.
The production representativecylinder head (based on a 1.8 L, 4-cylinder production engine) ismachined from cast iron, selected forboth its mechanical rigidity andthermal stability over aluminium. Theport and valve seat geometry weredetailed to ensure precisely the sameair motion characteristics as the baseengine. The cylinder head design ismodular and flexible so thatalternative port and valve geometriescan be manufactured, set-up andevaluated rapidly in order to ensurethat optimum air and fuel motion isachieved with minimum engine downtime. The seat face for the speciallydeveloped profile on the top of theoptical (fused silica) cylinder wasproduced in the head by using sparkerosion machining processes.Additionally, the cylinder head ismounted on four columns at theperiphery of the optical section of theengine. These columns are spaced insuch a way that there is no obstructionto the various optical envelopesrequired for imaging and takingmeasurements from the whole boreand stroke. The spacing also allowsfor rapid removal and replacement ofthe fused silica cylinder for cleaningpurposes. This is achieved by loweringthe hydraulic platform, removing thepiston pin and lowering the piston.This process typically takesapproximately 10 minutes toaccomplish and so the cylinderinternal surfaces can be easily cleaned.This is a distinct advantage overpreceding optical engines.
Two camshafts in separate housingsactuate the valve gear. The camshaftsare driven by a toothed belt drive thathas been carefully routed to minimiseobstruction of optical pathways. The
camshaft housings are also modularand removable and can easily bereplaced by the Lotus Active ValveTrain (AVT or VVA) system to givethe optical engine a fully variablehydraulically actuated valve system ifso required. The cylinder blockconsists of two sections. The uppersection provides mounting for thecylinder head, hydraulic platform, 45°mirror and steel cylinder. This mountsonto a machined from solidaluminium lower crankcasecontaining a cross-drilled crankshaftrunning on 3 pressure fed mainbearings. The elongated piston ismanufactured from lightweightmaterials and has a mass of 1235 gms,which is greater than that of anequivalent 1.8 L production pistonweighing around 300-400 gms. Theengine was designed for use withoptical devices that are path-sensitiveand so it was decided to include inthe design, both primary andsecondary balance shafts to minimisevibration. The two contra-rotatingprimary and secondary balance shaftswith adjustable balance weights werebuilt into the crankcase and are drivendirectly from the crankshaft. Thus theLotus engine has been designed tomaximise optical and mechanicalaccess requirements and to minimiseaspects which might reduce theflexibility of the engine itself.
SUMMARY
Emissions legislation, environmental,customer pressures and newcombustion systems are driving theneed for greater information on theprocesses of fuelling and combustionbehaviour. Only limited knowledgeor experience currently exists on newlydeveloped combustion systems (suchas GDI) and it is not possible to relyon knowledge developed in the pastfor port injected homogeneouscombustion. New developmenttechniques and processes are requiredto ensure that optimum results areobtained in the minimum time to suitthe reduced time scales of today’smarket place. Many of these newtechniques can be taken from theresearch processes currently being usedin universities and other researchestablishments. However theseresearch processes need to be evolvedto suit the rapid developmentenvironment of the production enginedesign and development process. Inorder to ensure this, a new generation
Table 3: Coefficients of linear thermal
expansion.
Material Coeff. of
linear thermal
expansion
/×××××10-6K-1
Aluminium (Piston) 23.9
Titanium (Piston crown) 8.2
Sapphire (Piston window) 8.4
Fused Silica (Cylinder) 0.5
Carbon (Compression ring) 1.65
Figure 5: The completed Lotus
Engineering optical engine. This
engine is now involved in
experimental work between Lotus
and Loughborough University using
PDA techniques.
Univers i t i Teknologi Petronas • http://www.utp.edu.my
57PLATFORM • Volume 2 Number 1 • January – June 2001
of optical access engines is requiredthat have the following abilities:
1. Full optical access for the use ofall diagnostic techniques.
2. Operation of the optical engineat real engine speeds and loads.
3. Accurately replicate internalgeometries of real engines.
4. Can be used extensively witheasy and rapid maintenance.
5. Easy adaptation to new enginegeometries.
Lotus has designed and produced anew optically accessible single cylinderengine that has addressed the aboveissues and offers the opportunity tomove the combustion diagnostics andcalibration from a research to a rapiddevelopment environment. Theengine has been built andcommissioned (Figure 5) and the nextstage is to motor the engine tospecified speeds and also to fire theengine under full load conditions.This work is currently in progressthrough Lotus-LoughboroughUniversity collaboration.
ACKNOWLEDGEMENTS
The authors wish to thank Chris Knight, CliveDopson, and Dave Taitt (Group LotusDirectors) for funding the research into thisunique engine.
REFERENCES
[1] J Allen, T Evans, D Law, J Martin, DRobinson & D Taitt. Proceedings of theInstitute of Petroleum, Conference onThe Future of Transportation in Europe,Institute of Physics, London, 11-12thNovember 1998.
[2] R R Maly. Progress in CombustionResearch. I Mech E CombustionEngines Group Prestige Lecture 8/10/1998.
[3] K Kuwahara et al. SAE980158.
[4] K Kuwahara et al. Proc.VSJ-SPIE98 6-9th December 1998.
[5] J Allen, A Simms, P Williams, G KHargrave & G Wigley. JSAE9936102,Seoul, Korea.
[6] J Allen, J Heath, G K Hargrave & GWigley. JSAE 9935086, Seoul, Korea.
[7] J Allen, A Bacon, G Hargrave & GWigley. I Mech E, Combustion Enginesand Hybrid Vehicles, C529/030/98.
[8] G Wigley, G K Hargrave, J Allen & JHeath. ILASS-Europe ‘99 (Institute ofLiquid Atomisation and Spray Systems-Europe), Toulouse, 5-7th July 1999.
[9] J Heath & G Wigley. Engine Expo 1999,Hamburg. 8-10th June 1999.
[10] G K Hargrave, G Wigley, J Allen & ABacon. Proceedings of the VisualisationSociety of Japan, Yokohama, 6-9thDecember 1998.
PLATFORM • Volume 2 Number 1 • January – June 2001
58 Univers i t i Teknologi Petronas • http://www.utp.edu.my
ABSTRACT
The assessment of precipitated calcium carbonate filler dispersion in a synthetic elastomer, styrene butadiene rubber(SBR 1502), has been studied as the mixing time and rotor speed of the Brabender“ plastograph were varied. Anexperimental technique based on fracture surface analysis was developed in order to assess the degree of filler dispersionin the rubber matrix. The technique involved direct microscopic examination using scanning electron microscopy andthe use of image processing and analysis. Dispersion index as introduced by Suetsugu was employed to quantitativelyassess the degree of dispersion. The results showed that longer mixing time and/or rotor speed improved the fillerdispersity throughout the rubber matrix as observed from the decreasing average particle size and the increasing dispersionindices. For instance, specimens mixed at 15 rpm for 1, 2 and 3 min have average particle size of 22.1, 19.6 and 16.8 mmand dispersion index of 0.53, 0.73 and 0.83 respectively. However, one weakness in the indexing method employed wasrealised as it ignored the aspect of filler distribution. This was examplified by specimens mixed at 30 rpm for 0.5 and 1min with dispersion index of 0.72 and 0.62 respectively, while that mixed for 1.5 and 2 min have dispersion index of 0.58and 0.66 respectively. When analysed at 45 rpm for 0.5 and 1 min, the expected increase in the dispersion index wasagain observed, 0.63 and 0.65 respectively.
Keywords: dispersion, elastomer, filler distribution, fracture analysis, mixing.
APPLICATION OF FRACTURE SURFACE ANALYSIS IN
DISPERSION STUDIES OF A PARTICULATE FILLER IN AN
ELASTOMER DURING MIXING
Dr Puteri S M Megat-Yusoff
Universiti Teknologi PETRONAS,
31750 Bandar Seri Iskandar, Tronoh, Perak, Malaysia
e-mail: [email protected]
1. Introduction
Before an elastomer can be used tomake products, it is necessary tocompound it with additives such asfillers. The addition of fillers isintended to improve the physicalproperties of rubber products, itsprocessing properties and to reduce itsproduction costs. However, thesedepend significantly on the success ofdispersing the solid particles (fillers)uniformly in the elastomer matrix [1].The assessment of filler dispersionprimarily involve two areas. One isdirect microscopic examination of thestate of dispersion. The other is the
indirect characterisation of theprogress of dispersion, for example, byrheological measurements [2, 3].
Several methods have been employedin assessing the degree of dispersionof filler in rubber. Stumpe andRailsback [4] used cut surfaceexamination whereby a simplephotographic technique for rating thedispersion of carbon black in rubberwas used. Very poor to excellentdispersion was depicted in a set ofstandards provided. However, thistechnique did not have any basis toquantitatively characterise the degreeof dispersion.
In 1977 Boonstra [5] used electricalresistivity to study the quality of fillerdispersion whereby the resistivity wasseen to increase with improveddispersity. This technique has oneadvantage because the resistivity notonly depends on degree of dispersionbut also on the chemical nature of thefiller’s surface [6]. Following this fact,Cotton did a study on dispersity basedon density measurement of rubberbatches. He found that as the degreeof dispersion increases the density alsoincreases.
Hess et al [7] has used surfaceroughness procedure for analysing
This paper was presented at 2nd International Seminar On Numerical Analysis In Engineering, Batam Island, Indonesia, 14 - 15 March 2001.

Univers i t i Teknologi Petronas • http://www.utp.edu.my
59PLATFORM • Volume 2 Number 1 • January – June 2001
carbon black dispersion directed atmeasuring the level of agglomerates.Surface roughness measurements werefound to be directly proportional tothe number and size of agglomeratespresent in the rubber compound.Higher levels of agglomeration wouldindicate lower degree of dispersion.This method requires specificequipment to measure roughnesswhich otherwise would be difficult toquantify.
In the present study, fracture surfaceanalysis technique was employed toassess the precipitated calciumcarboante (CaCO3) filler dispersion ina synthetic elastomer, styrenebutadiene rubber (SBR). Thetechnique was developed and usedprimarily due to its simplicity yetcapable of quantitativelycharacterising the degree of dispersion.The primary aim of this study was toassess the degree of filler dispersionwith mixing efficiency.
2. METHODOLOGY
Batches of 400 g of SBR 1502 weremixed with 2 pphr of a crosslinkingagent, 98% dicumyl peroxide(DICUP), on a laboratory two-rollmill. The mixtures were masticateduntil homogenous. Small quantitiesof the masterbatch prepared on thetwo-roll mill were furthercompounded with 25 pphr ofprecipitated whiting (CaCO3) filler ina Brabender® Plasti-Corder PL 2000,equipped with mixing head type2000-6 W 50 E.
Mixing torque was plottedcontinously as the mixing progressedin the Brabender®. Energy of mixingwas then evaluated by integrating thearea under the torque-time curve. Themixing was done under various rotorspeeds and various mixing cycles. Therotor speed used was 15 rpm, 30 rpmand 45 rpm while the mixing cycle ran
from 0.5 min to 20 minutes.Producing batches with varyingmixing cycles means varying theenergy input. This allowed a range offiller dispersions to be obtained forcharacterisation. By varying the rotorspeed, the correlation in energy inputwas also observed.
After the compound was mixed withfiller, curing was carried out at 153°Cfor about 50 minutes using a hot press.Curing or vulcanisation employed wasa high temperature process wherebythe crosslinking agent incorporateddecomposed into free radicals topromote crosslinking.
In order to quantitatively assess thequality of filler dispersion in therubber mix, a technique wasdeveloped based on fracture surfaceanalysis. Moulded sample was cutinto a 50 x 10 mm rectangularspecimen. A notch, measuring 2 mmin depth and 2 mm in width, wasmade, approximately at the mid pointof the specimen length.
Prior to fracture, the specimen wasconditioned in liquid nitrogen forabout 10 minutes. The specimen wasthen placed onto a Zwick impacttesting machine. The fracturedsurface was then cut out, placed ontoa SEM mounting stub and sputtercoated with a layer of gold-paladiumalloy, for subsequent microscopicanalysis using scanning electron
microscopy, SEM Stereoscan 250.Polaroid pictures of the micrographswere obtained and scanned for imageprocessing and analyses. A digitalimage processing software, Image1.35, was then used to measure thequantity and size of the filleragglomerates or particles.
3. RESULTS AND DISCUSSION
3.1 Brabender Plastograph
The following curves in Figure 1 showthe Brabender® torque-time curvefrom which mixing energies wereobtained for different rotor speeds andmixing times.
The energies of mixing of SBR withfiller at each rotor speed and cycle timeare tabulated in Table 1. The energyof mixing was obtained by integrationof the area under the torque-timecurve. While the initial temperaturefor all mixing was 30°C, the finaltemperature after each run wasrecorded in sub-column four in Table1.
Referring to Figure 1, the maximumtorque at each rotor speed wasobserved as the ram was insertedimmediately after all the rubber andfiller were loaded into the mixingchamber. However, no particularrelationship could be establishedbetween the maximum torque androtor speed. Maximum torque for 15
Figure 1:
Brabender®
mixing
curves for
rotor
speeds of
15, 30 and
45 rpm.
0
10
20
30
40
50
60
70
80
90
0 2 4 6 8 10 12
Time (minutes)
Torq
ue
(N
m)
15 rpm30 rpm45 rpm

PLATFORM • Volume 2 Number 1 • January – June 2001
60 Univers i t i Teknologi Petronas • http://www.utp.edu.my
rpm was 84.9 Nm occurring at 32 swhile for 30 rpm the maximumtorque was 95.9 Nm at 16 s and 92.6Nm at 12 s for 45 rpm. One wouldexpect that the higher the rotor speed,the higher the maximum torquewould be. This trend was onlyobserved for 15 and 30 rpm but notat 45 rpm. The unexpected resultcould due to the time variability inloading the compound, besides thatdue to the variation in level ofmastication of the rubber duringmilling.
As the mixing process progressed, thetorque value decreased continuouslywith time at all rotor speeds employed.In terms of the dispersion process, thetorque level should remain constantonce all the filler had disperseduniformly throughout the matrix. Inother words, equilibrium torque wasexpected to be reached indicating theultimate or ideal dispersion of filler.In fact, this behaviour would havebeen observed if the temperature inthe chamber could be held constant.In the study, no cooling system wasused to keep the mix temperatureconstant. The temperaturecontinuously increased during themixing cycle at each rotor speed. Thetemperature increase was due to shearheating generated within the mix bythe rotors of the Brabender©. Thistemperature increase leads to aninevitable decrease in rubber viscositywith time, and consequently themeasured torque decreases with time.However, equilibrium will be reachedeventually when the rate of heatgeneration (constant) equals the rateof heat loss (which will increase withincreasing temperature).
From Figure 1, it can be seen thathigher rotor speeds generally producelower torque values. This can be easilyunderstood as higher rotor speedsresults in more shear heating which
reduces the viscosity and hence lowertorque values.
The single most importantinformation obtained from theBrabender® plastograph is that thelonger the mixing time, the higher thework input received by the rubbercompound. For instance, at 30 rpm,14.2 Nm energy was consumed at 1min of mixing and 27.5 Nm energyat 2 min. The similar trend wasobserved at 15 and 45 rpm. Likewise,for the same mixing duration, higherenergy input was observed for higherrotor speed used. For instance, for 1min of mixing, the energy input werefound to be 5.7, 14.2 and 21.9 Nmat 15, 30 and 45 rpm respectively.Hence, it could be expected that betterdispersion would be achieved thelonger the mixing time or the higherthe energy input consumed by therubber compound. This in fact hasbeen observed throughout the study,and is discussed later. However, tworubber compounds with equivalentwork input need not show the samedegree of filler dispersion.
It is interesting to note that there is acorrelation between the energy ofmixing at 15, 30 and 45 rpm. Table2 shows that for the same mixing time,the energy at 30 rpm is twice theenergy at 15 rpm i.e. 2.0±0.2.Likewise, the energy at 45 rpm is threetimes greater than that at 15 rpm withstandard deviation of 0.1 i.e. 3.0±0.3.This correlation indicates that arubber compound mixed at 15 rpmfor 6 minutes received the same workinput to that mixed at 30 rpm for 3minutes or that mixed at 45 rpm for2 minutes, within less than 10% error.
3.2 SEM Studies
Pictures of each specimen were takenat two different magnification levels.A magnification of 110x provided a
Total Final
Time Torque Energy Temp.
(min) (Nm) (J) (°C)
1
2
3
4
5
6
7
8
9
10
81.1
76.3
72.4
69.7
67.5
67.0
66.5
66.0
65.4
65.0
5.7
12.3
18.5
24.5
30.3
36.0
41.6
47.2
52.7
58.2
33
36
40
42
43
44
45
46
47
48
15 rpm
1
2
3
4
5
6
7
8
9
10
30 rpm
78.5
71.7
67.9
65.2
63.7
63.7
61.9
60.2
59.3
57.9
14.2
27.5
40.1
52.1
63.7
75.2
86.5
97.5
108.3
118.9
38
45
53
55
57
59
63
65
67
69
1
2
3
4
5
6
7
8
9
10
73.5
68.6
64.0
62.5
61.7
58.4
57.0
56.0
55.0
53.7
21.9
42.0
60.7
78.5
96.1
113.1
129.5
145.5
161.2
176.6
43
49
55
58
62
69
74
76
77
78
45 rpm
Table 1: Torque, work input and final
temperature recorded during mixing
for 15, 30 and 45 rpm.
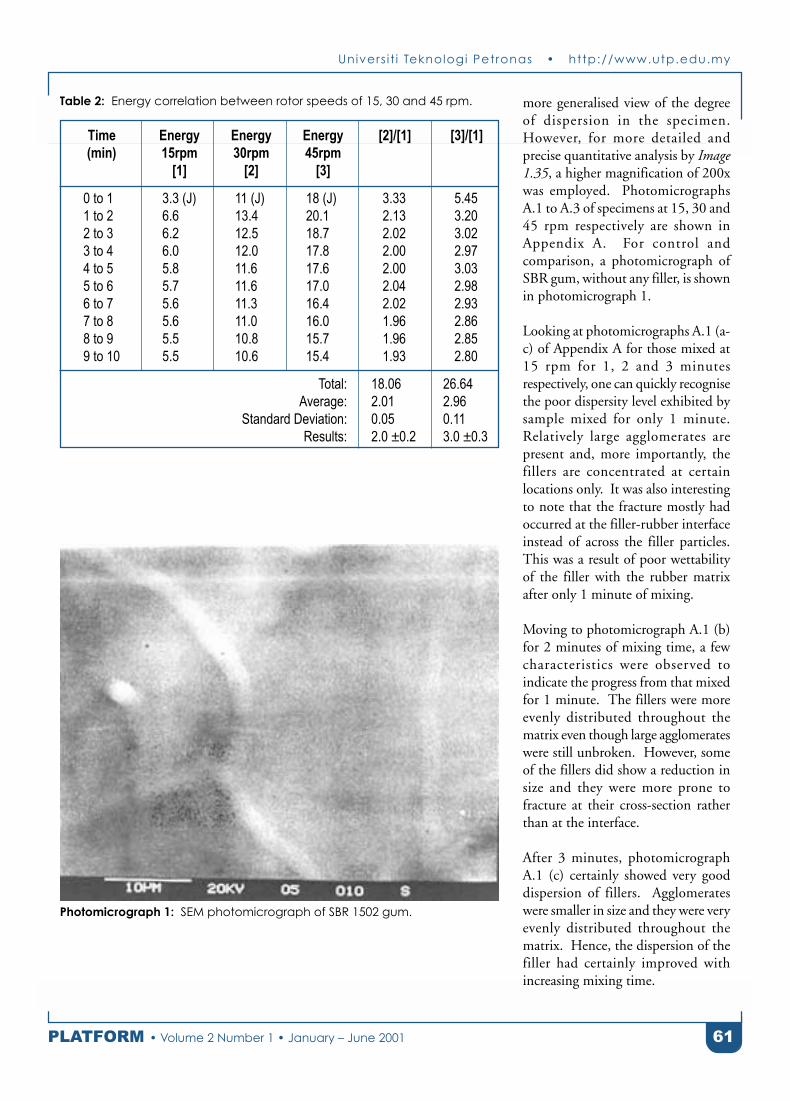
Univers i t i Teknologi Petronas • http://www.utp.edu.my
61PLATFORM • Volume 2 Number 1 • January – June 2001
more generalised view of the degreeof dispersion in the specimen.However, for more detailed andprecise quantitative analysis by Image1.35, a higher magnification of 200xwas employed. PhotomicrographsA.1 to A.3 of specimens at 15, 30 and45 rpm respectively are shown inAppendix A. For control andcomparison, a photomicrograph ofSBR gum, without any filler, is shownin photomicrograph 1.
Looking at photomicrographs A.1 (a-c) of Appendix A for those mixed at15 rpm for 1, 2 and 3 minutesrespectively, one can quickly recognisethe poor dispersity level exhibited bysample mixed for only 1 minute.Relatively large agglomerates arepresent and, more importantly, thefillers are concentrated at certainlocations only. It was also interestingto note that the fracture mostly hadoccurred at the filler-rubber interfaceinstead of across the filler particles.This was a result of poor wettabilityof the filler with the rubber matrixafter only 1 minute of mixing.
Moving to photomicrograph A.1 (b)for 2 minutes of mixing time, a fewcharacteristics were observed toindicate the progress from that mixedfor 1 minute. The fillers were moreevenly distributed throughout thematrix even though large agglomerateswere still unbroken. However, someof the fillers did show a reduction insize and they were more prone tofracture at their cross-section ratherthan at the interface.
After 3 minutes, photomicrographA.1 (c) certainly showed very gooddispersion of fillers. Agglomerateswere smaller in size and they were veryevenly distributed throughout thematrix. Hence, the dispersion of thefiller had certainly improved withincreasing mixing time.
Table 2: Energy correlation between rotor speeds of 15, 30 and 45 rpm.
Photomicrograph 1: SEM photomicrograph of SBR 1502 gum.
0 to 1
1 to 2
2 to 3
3 to 4
4 to 5
5 to 6
6 to 7
7 to 8
8 to 9
9 to 10
Time Energy Energy Energy [2]/[1] [3]/[1]
(min) 15rpm 30rpm 45rpm
[1] [2] [3]
3.3 (J)
6.6
6.2
6.0
5.8
5.7
5.6
5.6
5.5
5.5
11 (J)
13.4
12.5
12.0
11.6
11.6
11.3
11.0
10.8
10.6
18 (J)
20.1
18.7
17.8
17.6
17.0
16.4
16.0
15.7
15.4
3.33
2.13
2.02
2.00
2.00
2.04
2.02
1.96
1.96
1.93
5.45
3.20
3.02
2.97
3.03
2.98
2.93
2.86
2.85
2.80
Total:
Average:
Standard Deviation:
Results:
18.06 26.64
2.01 2.96
0.05 0.11
2.0 ±0.2 3.0 ±0.3

PLATFORM • Volume 2 Number 1 • January – June 2001
62 Univers i t i Teknologi Petronas • http://www.utp.edu.my
The same trend was also observed forspecimens mixed at 30 and 45 rpm.Gradual improvement in degree ofdispersion was achieved from 0.5, 1.0,1.5, 2.0 to 60 minutes (mixed at30 rpm) as demonstrated inphotomicrographs A.2 (a-e). It wasof interest to observe how thedispersion of filler at very long mixingtimes. Hence, mixing was carried outfor 60 minutes at 30 rpm andanalysed. One obvious characteristicwas that most of the agglomerateswere broken down to very smallparticulates of size 0.1 µm in diameter,the ultimate particle size for fine,precipitated calcium carbonate [8].Obtaining discrete elements ofultimate particle size is definitely a signof ideal dispersion.
Image 1.35 measured the frequencyand the particles/agglomerates sizes ofeach specimen. From this data,particle size distribution histogramswere constructed at each rotor speed.From these histograms, particle sizedistribution curves were derived aspresented in Figures 2, 3, and 4.
The data obtained from image analysiswas used to calculate the averageparticle size variations for differentrotor speeds as tabulated in Table 3.The average was calculated as sum ofall particle size measured divided bytotal number of particles detected.One would expect a gradual decreasein average particle size as the mixingtime increased. In general, this hasbeen observed during the study.
Suetsugu in 1990 [9] has introducedan index which correlates the degreeof dispersity of fillers in a polymermatrix. The index, known asdispersion index (D.I.), is given byequation (1).
Dispersion Index = 1 –Φa (1)
(D.I.)
6050403020100
0
20
40
60
80
Particle Size (micron)
Fre
qu
ency
1 minute
2 minutes
3 minutes
6050403020100
0
50
100
Particle Size (micron)
Fre
qu
ency
0.5 minute
1.5 minutes
2 minutes
6050403020100
0
100
150
Particle Size (micron)
Fre
qu
ency
0.5 minute
1.5 minutes
50
Figure 2:
Particle size distribution curves for specimens mixed at 15 rpm.
Figure 3:
Particle size distribution curves for specimens mixed at 30 rpm.
Figure 4:
Particle size distribution curves for specimens mixed at 45 rpm.
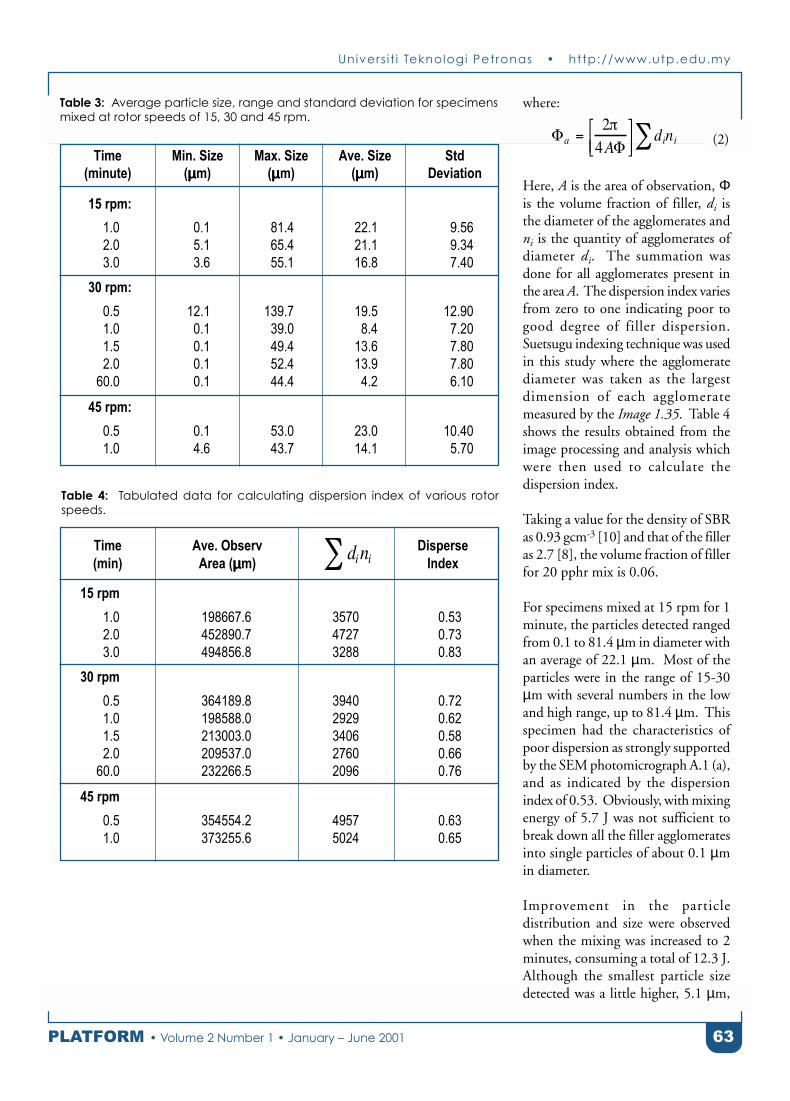
Univers i t i Teknologi Petronas • http://www.utp.edu.my
63PLATFORM • Volume 2 Number 1 • January – June 2001
where:
(2)
Here, A is the area of observation, Φis the volume fraction of filler, di isthe diameter of the agglomerates andni is the quantity of agglomerates ofdiameter di. The summation wasdone for all agglomerates present inthe area A. The dispersion index variesfrom zero to one indicating poor togood degree of filler dispersion.Suetsugu indexing technique was usedin this study where the agglomeratediameter was taken as the largestdimension of each agglomeratemeasured by the Image 1.35. Table 4shows the results obtained from theimage processing and analysis whichwere then used to calculate thedispersion index.
Taking a value for the density of SBRas 0.93 gcm-3 [10] and that of the filleras 2.7 [8], the volume fraction of fillerfor 20 pphr mix is 0.06.
For specimens mixed at 15 rpm for 1minute, the particles detected rangedfrom 0.1 to 81.4 µm in diameter withan average of 22.1 µm. Most of theparticles were in the range of 15-30µm with several numbers in the lowand high range, up to 81.4 µm. Thisspecimen had the characteristics ofpoor dispersion as strongly supportedby the SEM photomicrograph A.1 (a),and as indicated by the dispersionindex of 0.53. Obviously, with mixingenergy of 5.7 J was not sufficient tobreak down all the filler agglomeratesinto single particles of about 0.1 µmin diameter.
Improvement in the particledistribution and size were observedwhen the mixing was increased to 2minutes, consuming a total of 12.3 J.Although the smallest particle sizedetected was a little higher, 5.1 µm,
Time Min. Size Max. Size Ave. Size Std
(minute) (µµµµµm) (µµµµµm) (µµµµµm) Deviation
1.0
2.0
3.0
15 rpm:
0.1
5.1
3.6
81.4
65.4
55.1
22.1
21.1
16.8
9.56
9.34
7.40
30 rpm:
0.5
1.0
1.5
2.0
60.0
12.1
0.1
0.1
0.1
0.1
139.7
39.0
49.4
52.4
44.4
19.5
8.4
13.6
13.9
4.2
12.90
7.20
7.80
7.80
6.10
45 rpm:
0.5
1.0
0.1
4.6
53.0
43.7
23.0
14.1
10.40
5.70
Table 3: Average particle size, range and standard deviation for specimens
mixed at rotor speeds of 15, 30 and 45 rpm.
Table 4: Tabulated data for calculating dispersion index of various rotor
speeds.
1.0
2.0
3.0
Time Ave. Observ Disperse
(min) Area (µµµµµm) Index
15 rpm
198667.6
452890.7
494856.8
3570
4727
3288
0.53
0.73
0.83
30 rpm
0.5
1.0
1.5
2.0
60.0
364189.8
198588.0
213003.0
209537.0
232266.5
3940
2929
3406
2760
2096
0.72
0.62
0.58
0.66
0.76
45 rpm
0.5
1.0
354554.2
373255.6
4957
5024
0.63
0.65
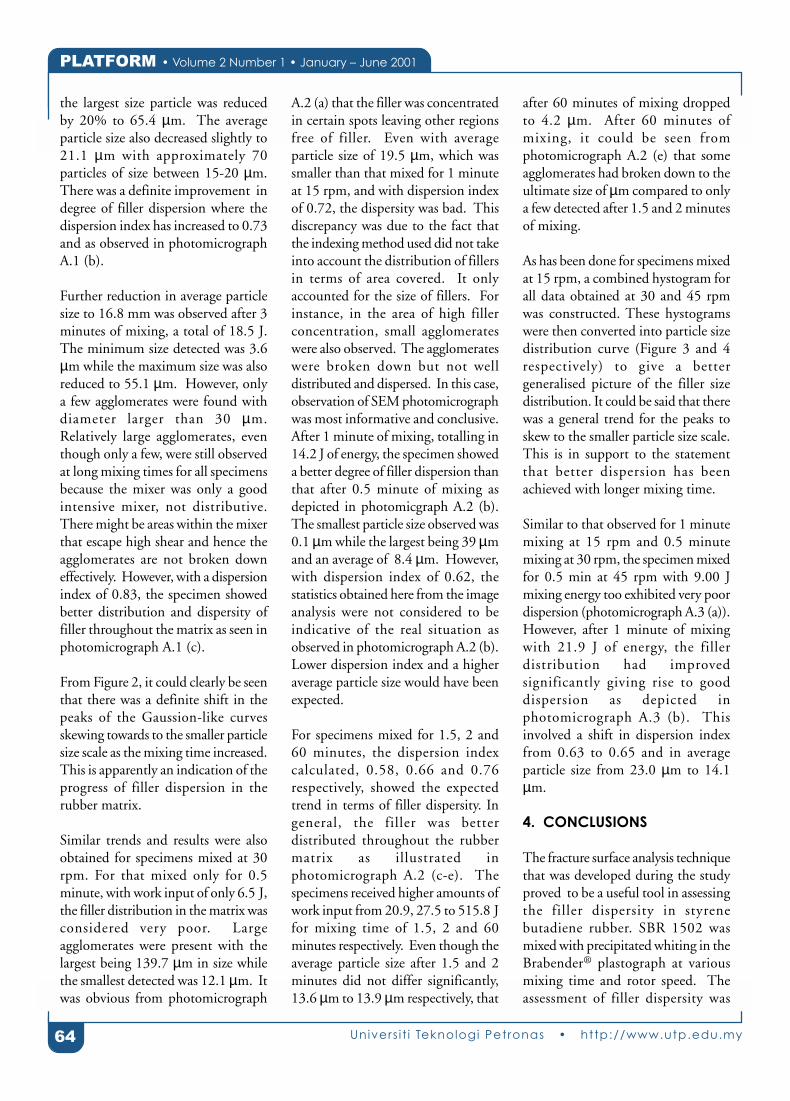
PLATFORM • Volume 2 Number 1 • January – June 2001
64 Univers i t i Teknologi Petronas • http://www.utp.edu.my
the largest size particle was reducedby 20% to 65.4 µm. The averageparticle size also decreased slightly to21.1 µm with approximately 70particles of size between 15-20 µm.There was a definite improvement indegree of filler dispersion where thedispersion index has increased to 0.73and as observed in photomicrographA.1 (b).
Further reduction in average particlesize to 16.8 mm was observed after 3minutes of mixing, a total of 18.5 J.The minimum size detected was 3.6µm while the maximum size was alsoreduced to 55.1 µm. However, onlya few agglomerates were found withdiameter larger than 30 µm.Relatively large agglomerates, eventhough only a few, were still observedat long mixing times for all specimensbecause the mixer was only a goodintensive mixer, not distributive.There might be areas within the mixerthat escape high shear and hence theagglomerates are not broken downeffectively. However, with a dispersionindex of 0.83, the specimen showedbetter distribution and dispersity offiller throughout the matrix as seen inphotomicrograph A.1 (c).
From Figure 2, it could clearly be seenthat there was a definite shift in thepeaks of the Gaussion-like curvesskewing towards to the smaller particlesize scale as the mixing time increased.This is apparently an indication of theprogress of filler dispersion in therubber matrix.
Similar trends and results were alsoobtained for specimens mixed at 30rpm. For that mixed only for 0.5minute, with work input of only 6.5 J,the filler distribution in the matrix wasconsidered very poor. Largeagglomerates were present with thelargest being 139.7 µm in size whilethe smallest detected was 12.1 µm. Itwas obvious from photomicrograph
A.2 (a) that the filler was concentratedin certain spots leaving other regionsfree of filler. Even with averageparticle size of 19.5 µm, which wassmaller than that mixed for 1 minuteat 15 rpm, and with dispersion indexof 0.72, the dispersity was bad. Thisdiscrepancy was due to the fact thatthe indexing method used did not takeinto account the distribution of fillersin terms of area covered. It onlyaccounted for the size of fillers. Forinstance, in the area of high fillerconcentration, small agglomerateswere also observed. The agglomerateswere broken down but not welldistributed and dispersed. In this case,observation of SEM photomicrographwas most informative and conclusive.After 1 minute of mixing, totalling in14.2 J of energy, the specimen showeda better degree of filler dispersion thanthat after 0.5 minute of mixing asdepicted in photomicgraph A.2 (b).The smallest particle size observed was0.1 µm while the largest being 39 µmand an average of 8.4 µm. However,with dispersion index of 0.62, thestatistics obtained here from the imageanalysis were not considered to beindicative of the real situation asobserved in photomicrograph A.2 (b).Lower dispersion index and a higheraverage particle size would have beenexpected.
For specimens mixed for 1.5, 2 and60 minutes, the dispersion indexcalculated, 0.58, 0.66 and 0.76respectively, showed the expectedtrend in terms of filler dispersity. Ingeneral, the filler was betterdistributed throughout the rubbermatrix as illustrated inphotomicrograph A.2 (c-e). Thespecimens received higher amounts ofwork input from 20.9, 27.5 to 515.8 Jfor mixing time of 1.5, 2 and 60minutes respectively. Even though theaverage particle size after 1.5 and 2minutes did not differ significantly,13.6 µm to 13.9 µm respectively, that
after 60 minutes of mixing droppedto 4.2 µm. After 60 minutes ofmixing, it could be seen fromphotomicrograph A.2 (e) that someagglomerates had broken down to theultimate size of µm compared to onlya few detected after 1.5 and 2 minutesof mixing.
As has been done for specimens mixedat 15 rpm, a combined hystogram forall data obtained at 30 and 45 rpmwas constructed. These hystogramswere then converted into particle sizedistribution curve (Figure 3 and 4respectively) to give a bettergeneralised picture of the filler sizedistribution. It could be said that therewas a general trend for the peaks toskew to the smaller particle size scale.This is in support to the statementthat better dispersion has beenachieved with longer mixing time.
Similar to that observed for 1 minutemixing at 15 rpm and 0.5 minutemixing at 30 rpm, the specimen mixedfor 0.5 min at 45 rpm with 9.00 Jmixing energy too exhibited very poordispersion (photomicrograph A.3 (a)).However, after 1 minute of mixingwith 21.9 J of energy, the fillerdistribution had improvedsignificantly giving rise to gooddispersion as depicted inphotomicrograph A.3 (b). Thisinvolved a shift in dispersion indexfrom 0.63 to 0.65 and in averageparticle size from 23.0 µm to 14.1µm.
4. CONCLUSIONS
The fracture surface analysis techniquethat was developed during the studyproved to be a useful tool in assessingthe filler dispersity in styrenebutadiene rubber. SBR 1502 wasmixed with precipitated whiting in theBrabender® plastograph at variousmixing time and rotor speed. Theassessment of filler dispersity was

Univers i t i Teknologi Petronas • http://www.utp.edu.my
65PLATFORM • Volume 2 Number 1 • January – June 2001
made possible with direct microscopicexamination of SEMphotomicrographs of fractured surfaceof the rubber specimens. In order tomeasure the degree of dispersionquantitatively, image analysis of theSEM photomicrographs was carriedout.
During the Brabender® mixing, adecrease in torque was observed as themixing progressed. More significantly,a longer mixing time and/or a higherrotor speed meant a higher work inputinto the rubber mixes. Additionally,work input was found to be correlatedto the rotor speed used during mixing.In other words, specimens mixed for6 minutes at 15 rpm, 3 minutes at 30rpm and 2 minutes at 45 rpm allreceived the same amount of energyinput within less than 10% error.
Obvious gradual improvement indegree of dispersion was realised fromthe SEM photomicrographs obtainedas the mixing time was increased ateach rotor speed of 15, 30 and 45 rpm.Specimens were analysed at 1, 2 and3 minutes at 15 rpm, 0.5, 1, 1.5, 2,and 60 minutes at 30 rpm and 0.5,and 1 minute at 45 rpm. At very shorttime of mixing, filler dispersion wasfound to be very poor. Largeagglomerates were present and fillerswere segregated and not welldistributed throughout the matrix.The situation improved as the mixingtime was prolonged i.e. higher workinput into the specimens. Good fillerdispersion was characterised by thebreakdown of large filler agglomeratesinto smaller filler particles of 0.1 to10 µm size and by the homogenousdistribution of fillers throughout thespecimen. In order words, fillers needto be well dispersed and distributedin order to achieve good degree ofdispersion.
From the image processing andanalysis carried out for each specimen,
histograms were generated andGaussion-like particle size distributioncurves were obtained. The averageparticle size of each specimen asobtained from the distribution curvesat 15, 30 and 45 rpm decreased as themixing time increased. An indexingmethod, as introduced by Suetsugu,was used to characterise the degree ofdispersion quantitatively. And, asexpected, gradual increase indispersion index was observed at eachrotor speed as the mixing time wasincreased, except for specimens mixedfor 0.5 minute and 1 minute at 30rpm. This is perhaps due to theweakness in the indexing methodemployed. Hence, longer mixing timeresulted in higher work input andincreased in the dispersion index valueindicating better degree of fillerdispersion as depicted in a decrease inaverage particle size. All these aresummarised in Table 5.
To overcome the disadvantage sufferedby the indexing method used in thisstudy, one could use the dispersionrating calculated according to therevised calculation procedure ofMedalia [11]. This is based on the
formula as in (3).
Dispersion Rating
(3)
where A is the swelling factor of theagglomerates, s is the areal swellingfactor of the stock, U is the totalnumber of squares covered byagglomerates, L is the percent byvolume of filler and v is the averagevolume fraction of filler in theagglomeration.
In addition, the technique developedin this study could be used to measurethe degree of dispersion for variouswork inputs. From here, a capillaryrheometer could be used to assess therheological behaviour of the uncuredelastomers. Perhaps the rheometercould be used to study the effect ofpressure on volume as a function oftemperature and the stress relaxationbehaviour. Hence, one can determinewhether a capillary rheometer iscapable of the accurate andreproducible assessment of fillerdispersion in an elastomer mix.
Table 5: Work input, average particle size and dispersion index as obtained
in the study.
1.0
2.0
3.0
Time Work Average Dispersion
(min) input (J) Size (µµµµµm) Index
15 rpm
5.70
12.30
18.50
22.10
21.10
16.80
0.53
0.73
0.83
30 rpm
0.5
1.0
1.5
2.0
6.50
14.20
20.90
27.50
19.50
8.4
13.60
13.90
0.72
0.62
0.58
0.66
45 rpm
0.5
1.0
9.00
21.90
23.00
14.1
0.63
0.65

PLATFORM • Volume 2 Number 1 • January – June 2001
66 Univers i t i Teknologi Petronas • http://www.utp.edu.my
REFERENCES
[1] CABOT Business Information, Impactof Carbon Black Morphology andDispersion on the Weatherability, CabotTechnical Papers & Notes, 2000.
[2] N Nakajima & E R Harrell.Contributions of Elastomer Behavior toMechanisms of Carbon BlackDispersion, Rubber Chemistry &Technology, Vol. 57, pp. 153-167, 1984.
[3] M S Fulmer. Compounding andProcessing Additives for Woodfiber-Plastic Composites, presented at the 5thInternational Conference on Woodfiber-Plastic Composites, Madison, 1999.
[4] N A Stumpe Jr & H E Railsback. CarbonBlack Dispersion – PhotographicTechnique and Rating System, RubberWorld, Vol. 151, p. 41, 1964.
[5] B B Boonstra. Rubber Chemistry &Technology, Vol. 50, p. 194, 1977.
[6] G R Cotten. Mixing of Carbon Blackwith Rubber I. Measurement ofDispersion Rate by Changes in MixingTorque, Rubber Chemistry &Technology, Vol. 57, pp. 118-133, 1984.
[7] W M Hess et al. Rubber Chemistry &Technology, Vol. 57, p. 959, 1983.
[8] M Morton. Rubber Technology, VanNostrand Reinhold, New York, 1987.
[9] Y Suetsugu. State of Dispersion –Mechanical Properties Correlation inSmall Particle Filled PolymerComposites, International PolymerProcessing, Vol. 184, pp. 184-190, 1990.
[10] J Brandrup & E H Immergut. PolymerHandbook, John Wiley & Sons, NewYork, 1989.
[11] A I Medalia. Dispersion of Carbon Blackin Rubber: Revised CalculationProcedure, Rubber Chemistry &Technology, Vol. 34, pp. 1134-1140,1961.
a)
b)
c)
Photomicrograph A.1: SEM photomicrograph at 110x
magnification of specimens mixed at 15 rpm for
(a) 1 minute, (b) 2 minutes, and (c) 3 minutes.
APPENDIX
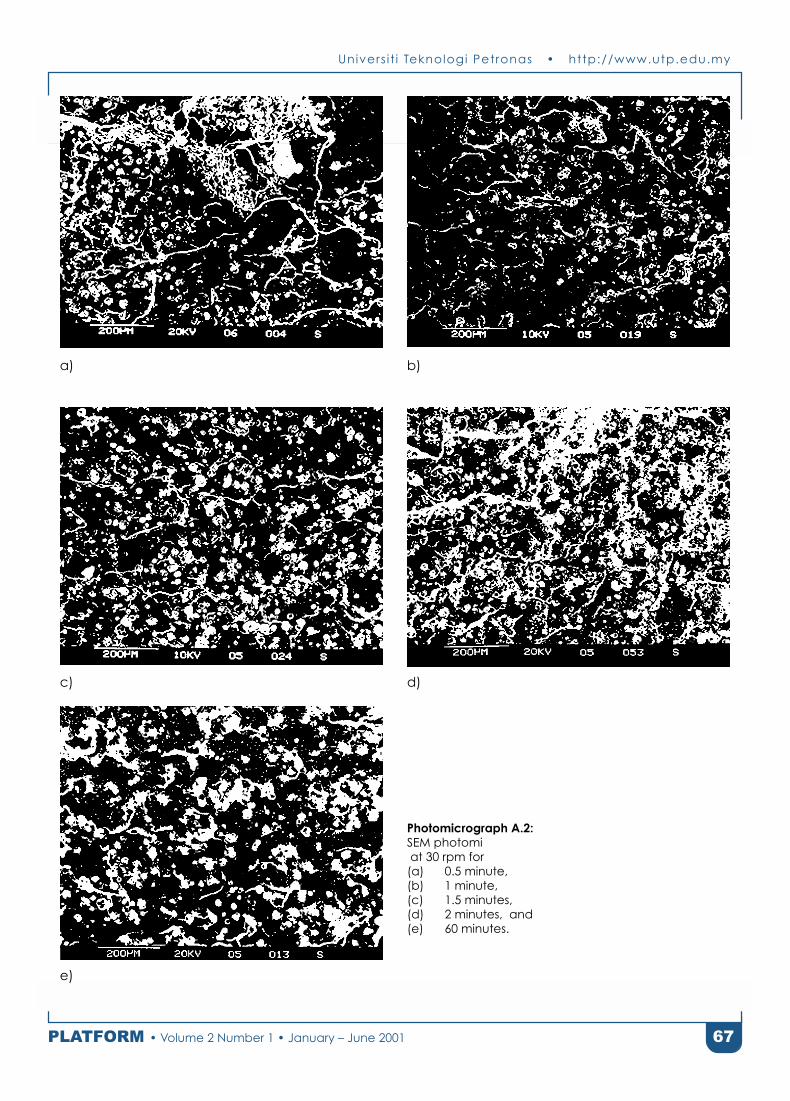
Univers i t i Teknologi Petronas • http://www.utp.edu.my
67PLATFORM • Volume 2 Number 1 • January – June 2001
a) b)
c) d)
e)
Photomicrograph A.2:
SEM photomi
at 30 rpm for
(a) 0.5 minute,
(b) 1 minute,
(c) 1.5 minutes,
(d) 2 minutes, and
(e) 60 minutes.

PLATFORM • Volume 2 Number 1 • January – June 2001
68 Univers i t i Teknologi Petronas • http://www.utp.edu.my
a) b)
Photomicrograph A.3:
SEM photomicrograph at 110x magnification of specimens mixed at 45 rpm for
(a) 0.5 minute, and
(b) 1 minute.

NOTES FOR CONTRIBUTORS
Instructions to Authors
Authors of articles that fit the aims,scopes and policies of this journal areinvited to submit soft and hard copiesto the editor. Paper should be writtenin English. Authors are encouragedto obtain assistance in the writing andediting of their papers prior tosubmission. For papers presented orpublished elsewhere, also include thedetails of the conference or seminar.
Manuscript should be prepared inaccordance with the following:1. The text should be preceded by
a short abstract of 50-100 wordsand four or so keywords.
2. The manuscript must be typedon one side of the paper, double-spaced throughout with widemargins not exceeding 3,500words although exceptions willbe made.
3. Figures and tables have to belabelled and should be includedin the text. Authors are advisedto refer to recent issues of thejournals to obtain the format forreferences.
4. Footnotes should be kept to aminimum and be as brief aspossible; they must benumbered consecutively.
5. Special care should be given tothe preparation of the drawingsfor the figures and diagrams.Except for a reduction in size,they will appear in the finalprinting in exactly the sameform as submitted by the author.
6. Reference should be indicatedby the authors’ last names andyear of publications.
Publisher
Universiti Teknologi PETRONAS
Bandar Seri Iskandar
31750 Tronoh
Perak Darul Ridzuan
MALAYSIA

P L A T F O R M
VO
LUM
E TW
O N
UM
BER
ON
E JA
NU
AR
Y - J
UN
E 2
001
VOLUME TWO NUMBER ONE JANUARY - JUNE 2001
Review of Global Positioning System (GPS)
Selective Availability (SA) And Its Benefits
by Dr Abdul Nasir Matori
Assessing Students’ Performance In Engineering Mathematics:
An Experience In Universiti Teknologi PETRONAS
by Afza Shafie and Wan Fatimah Wan Ahmad
Optimization Of Learning Methods For Face Recognition
Using Multilayer Perceptrons
by Dr M H Ahmad Fadzil Dr D J Evans and Dr Z Zainuddin
An Emissions And Power Comparison Of Port And Direct Injection
Bi-Fuel (Gasoline and Compressed Natural Gas) Engines
by Elizabeth Durell, Dr Don Law and Dr Jeff Allen
Controlled Auto-Ignition (CAI) Using
A Fully Variable Valve Train (FVVT)
by Dr Don Law, Dan Kemp, Dr Jeff Allen and Dr Simon Wood
Effect Of Solvents On Radiation-Induced Grafting
Of Styrene Onto Fluorinated Polymer Films
by Mohamed Mahmoud Nasef
Exergy Lost As A Decision Making Criteria In
The Selection Of Utility Design Options
by M Shuhaimi, A R Razali and A Ismail
Catalytic Removal Of Volatile Organic Compounds (VOC)
by Dr Noor Asmawati Mohd Zabidi, Chuah Won Ching
and Ng Siew Kiam
A Single Cylinder Optical Access Engine For
Combustion Analysis Using Laser Based Diagnostics
by Peter Williams, Graham Pitcher, Dr Don Law,
Dr Jeff Allen, Dr Simon Wood and Dr Graham Wigley
Application Of Fracture Surface Analysis In Dispersion Studies
Of A Particulate Filler In An Elastomer During Mixing
by Dr Puteri S M Megat-Yusoff
Volume 2 Number 1 Jan - Jun 2001
2
7
14
21
26
34
45
49
53
58
Copyright © 2022 FDOKUMEN