Effect of selective consumption on voluntary intake and ...
116
\VA GZO\ Cpo^ NN08201,807 G. Zemmelink Effect of selective consumption on voluntary intake and digestibility of tropical forages
-
Upload
khangminh22 -
Category
Documents
-
view
1 -
download
0
Transcript of Effect of selective consumption on voluntary intake and ...

\VA GZO\ Cpo^
NN08201,807 G. Zemmelink
Effect of selective consumption on voluntary intake and digestibility of tropical forages

Effect of selective consumption on voluntary intake and digestibility of tropical forages

Promotor: ir. M. L. 't Hart, hoogleraar in de leer van de landbouwplantenteelt en het grasland

G. Zemmelink
Effect of selective consumption on voluntary intake and digestibility of tropical forages
Proefschrift ter verkrijging van de graad van doctor in de landbouwwetenschappen, op gezag van de rector magnificus, dr. H. C. van der Plas, hoogleraar in de organische scheikunde, in het openbaar te verdedigen op vrijdag 30 mei 1980 des namiddags te vier uur in de aula van de Landbouwhogeschool te Wageningen
Centre for Agricultural Publishing and Documentation
Wageningen— 1980

Abstract
Zemmelink, G., 1980. Effect of selective consumption on voluntary intake and digestibility of tropical forages. Agric. Res. Rep. (V'ersl. landhouvvk. Onderz.) 896. ISBN 90 220 0729 4, (xi)+ 100 p., 26 fig., 15 tables, 151 refs, English. Spanish and Dutch summaries. Also: Doctoral thesis, Wageningen.
A review of the literature showed that levels of excess feed in intake and digestibility trials were quite variable. Nineteen forages of the species Stylosanthes guianensis, Desmodium distortum, Centrosema pubescens, Brachiaria mutica and B. decumbens were offered in diverse amounts to study the effect of level of excess feed on intake, and digestibility and digestible crude protein content of the consumed dry matter. Also intake of morphological components was measured. A discussion of statistical methods showed that the effect of level of excess feed on intake was underestimated by direct regression of intake on excess. To arrive at a correct estimate, intake should be related to the amount offered. A number of restrictions were imposed on the regression model for this relationship. For most forages, large effects were found of level of excess feed on intake. The response curves for various forages intersected so that the ranking order of forages varied with the level of excess feed. This behaviour was largely explained by selection between morphological components and stem parts. The pattern of selection was similar to that by grazing animals. It is recommended that intake of tropical forages should be measured not at one but at various levels of excess feed.
Free descriptors: Stylosanthes guianensis, Desmodium distortum, Centrosema pubescens, Brachiaria mutica, Brachiaria decumbens, sheep, stall feeding, leaf, stem, inflorescence, protein, excess feed, regression models.
This thesis will also be published as Agricultural Research Reports 896.
© Centre for Agricultural Publishing and Documentation, Wageningen, 1980.
No part of this book may be reproduced or published in any form, by print, photoprint, microfilm or any other means without written permission from the publishers.

Abstract
Zemmelink, G., 1980. Effect of selective consumption on voluntary intake and digestibility of tropical forages. Agric. Res. Rep. (Versl. landhouwk. Onderz.) 896. ISBN 90 220 07294, (xi)+ loi) p., 26 fig.. 15 tables, 151 refs. English. Spanish and Dutch summaries. Also: Doctoral thesis. Wageningen.
A review of the literature showed that levels of excess feed in intake and digestibility trials were quite variable. Nineteen forages of the species Stylosanthes guianensis, Desmodium distorlum, Centrosema pubescens, Brachiaria muticci and B. decumbens were offered in diverse amounts to study the effect of level of excess feed on intake, and digestibility and digestible crude protein content of the consumed dry matter. Also intake of morphological components was measured. A discussion of statistical methods showed that the effect of level of excess feed on intake was underestimated by direct regression of intake on excess. To arrive at a correct estimate, intake should be related to the amount offered. A number of restrictions were imposed on the regression model for this relationship. For most forages, large effects were found of level of excess feed on intake. The response curves for various forages intersected so that the ranking order of forages varied with the level of excess feed. This behaviour was largely explained by selection between morphological components and stem parts. The pattern of selection was similar to that by grazing animals. It is recommended that intake of tropical forages should be measured not at one but at various levels of excess feed.
Free descriptors: Stylosanthes guiunensis, Desmodium disiortum, Centrosema pubescens, Brachiaria mulicu, Brachiaria decumbens, sheep, stall feeding, leaf, stem, inflorescence, protein, excess feed, regression models.
This thesis will also be published as Agricultural Research Reports 896.
© Centre for Agricultural Publishing and Documentation, Wageningen, 1980.
No part of this book may be reproduced or published in any form, by print, photoprint, microfilm or any other means without written permission from the publishers.

'STELLINGEN
1 . De i n d e l i n g van de Wes t -Af r ikaanse "GUINEEN"-okra b i j Abelmoschus
manihot (L. ) Medikus i s , op b a s i s van de b e s t a a n d e t axonomische
s l e u t e l s , b e g r i j p e l i j k maar o n j u i s t .
DIT PROEFSCHRIFT CHEVALIER, A. (1940). Rev.Bot.Appl. 20: 319-328, 402-419. ARUMUGAM, R. e t a l . (1975). Madras Ag r i c . J . 62 (5) : 310-312.
2. Hibiscus sabdariffa L. d i e n t , op grond van z i j n b e l a ng a l s b l a d -
g r o en t e i n Wes t -Af r ika , i n de p r i o r i t e i t e n l i j s t van de " I n t e r
n a t i o n a l Board fo r P l a n t Gene t i c Resources (Vege tab le S e c t i o n ) "
t e worden opgenomen.
DIT PROEFSCHRIFT SLOTEN, D.H. VAN, (1980). Chron.Hort. 20 (3) : 49-52.
3 . De kans dat okra-zaad een toekomst heef t a l s bron van e iw i t en o l i e i s ge r ing .
MARTIN, F.W. & R. RUBERTE (1978). Vegetables for the hot humid t r o p i c s . Par t 2 . Okra, Abelmoschus e s cu l en tu s . MITA, Puerto Rico.
4 . Door he t verschi jnen van d i t p r o e f s ch r i f t s t a a t de West-Afrikaanse "GUINEEN"-okra b loo t aan een verhoogd gevaar van ^'genetic e ros ion" .
5. Het g rote aan ta l onvolledige auteursvermeldingen achter wetenschappel i jke insektennamen wordt g rotendeels veroorzaakt door he t f e i t da t de "Zoological Code" voor deze vermeldingen meerdere mogelijkheden t o e s t a a t .
INTERNATIONAL CODE OF ZOOLOGICAL NOMENCLATURE ( 1 9 6 1 ) .
6. De grote Europese gemeenschap in Ivoorkust i s een be langr i jke rem op de ontwikkeling van de commerciële t e e l t van inheemse groenten.

7. De introductie van soja als handelsgewas in de bevolkingscul-
tuur in Ivoorkust berust op zinvolle overwegingen.
GRUBBEN, G.J.H. (1975). Proefschrift LH, Stelling 6.
8. Genenbanken en Herbaria dienen te fuseren tot "Fhytotheken".
WESTPHAL, E. (1975). Proefschrift LH, Stelling 1. JANSEN, P.C.M. (1981). Proefschrift LH, Stelling 11.
9. Het ontbreken van strenge eisen ten aanzien van de kennis van
de Franse taal bij de aanstellingsprocedure van de beheerder
van het "Centre Néerlandais" getuigt van een onderschatting
van het belang van deze functie.
10. Fervente rokers dienen hun huis niet te isoleren.
11. "Lady's finger" mag, als alternatieve naam voor okra, alleen
gebruikt worden voor cultivars met vruchten zonder irritante
beharing.
Proefschrift J.S. Siemonsma
"La culture du gombo (Abelmoschus spp.), légume-fruit tropical
(avec référence spéciale à la Côte d'Ivoire)"
Wageningen, 17 september 1982

Acknowledgments
The experimental work described in this report would not have been carried out without the faithful help of Jesus Chilitu, Aldemar Ramirez, Baudillo Hernandez and Alfredo Hernandez. I wish to express my most sincere thanks to all of them. Muchisimas gracias!
I express my gratitude to Dr O. Paladines of CIAT and Professor Ir M. L. 't Hart of the Agricultural University for their constructive criticism at various stages of this study. And to Mr W. J. Koops who, upon my return to Wageningen, not only helped in the routines of the statistical analysis but also made a major contribution by translating my thoughts about the characteristics of some relationships into a suitable regression model.
Sincere thanks are due to Professor Dr Ir L. C. A. Corsten and Mr M. Keuls for their helpful comments on Chapter 4, and to Professor Ir M. L. 't Hart, Ir G. Hof and Dr Ir A. J. H. van Es for valuable comments on the whole manuscript.
I thank Mr W. Heye for his excellent work on the figures, Miss Willie van Wijde for typing the manuscript, Mr J. C. Rigg for checking the English and Dr G. Gómez for correcting the Spanish summary.
Finally I wish to thank CIAT for permission to publish this report and Pudoc for including it in the series Agricultural Research Reports.

Curriculum vitae
De auteur werd geboren op 14 november 1938 te Hengelo (G). Na het behalen van het diploma Mulo-B in 1954 en het diploma van de Rijks Middelbare Landbouwschool te Groningen in 1957 begon hij in datzelfde jaar de studie aan de Landbouwhogeschool. Hij studeerde met lof af in september 1965 in de studierichting Veeteelt, met als hoofdvak de Veevoeding en als keuzevakken de Fysiologie der huisdieren, de Gezondheids- en ziekteleer der huisdieren en de Tropische veeteelt. Van oktober 1965 tot april 1966 was hij in tijdelijke dienst bij de Landbouwhogeschool. Hij werkte vervolgens gedurende 4 jaar bij de Ahmadu Bello University te Zaria, Nigeria, en keerde in 1970 terug naar de Landbouwhogeschool. Van juni 1971 tot juli 1975 was hij gedetacheerd bij het Centro Internacional de Agricultura Tropical (CIAT) te Cali, Colombia. Sindsdien werkt hij als Wetenschappelijk hoofdmedewerker bij de Sectie Tropische veehouderij van de Landbouwhogeschool. Het in dit proefschrift beschreven onderzoek werd uitgevoerd op het CIAT. Professor ir. M. L. 't Hart begeleidde het uitwerken en rapporteren van de gegevens.
Het huidige adres van de auteur is Burgemeester Lewe van Aduardstraat 16, 6671 ZG, Zetten.

Foreword
The experimental work that is described in this report was carried out during the period 1971-1975, when I was seconded from the Agricultural University, Wageningen, the Netherlands, to the Centro Internacional de Agricultura Tropical (CIAT), Cali, Colombia.
My thanks are due to the Agricultural University for letting me do this work in Colombia and to CIAT, especially Dr N. S. Raun and his staff, for their great hospitality and for providing all that was needed for this work, including labour, experimental animals, animal housing and laboratory services.
Even before I arrived in Colombia, it was suggested that I could contribute to the work of CIAT by measuring the nutritive value of forages. There were, however, two problems. First, the pastures and forages programme of CIAT had only just started. As a result, there were few forages to be tested at that stage. Second, I did not know of a satisfactory technique to measure the voluntary intake of tropical forages. I was acquainted with numerous papers in which these techniques were described but the techniques appeared to be extremely variable and open to criticism. My criticism centred on various aspects of the traditional methods and stemmed from both practical and theoretical considerations. One of the major concerns was, however, that some workers assumed that sheep in metabolism cages eat forages unselectively and other workers attempted to minimize selection by chopping the forages or giving small amounts of excess feed. CIAT was mainly concerned with forages that are used in extensive grazing. It seemed to me that data on intake and digestibility of these forages would be of questionable value if they were determined under conditions where selection was either entirely avoided or depressed to an unknown extent. Therefore the emphasis was shifted from routine testing of many forages to a more critical study on methods, with special attention to the effects of varying degrees of selection.
Besides discussing the results of the work at CIAT, this report reviews traditional methods for measuring intake and digestibility of forages, both in the tropics and elsewhere. I have had to be rather critical of published work but, in criticizing methods, I intend no criticism of the scientists who have done the groundwork.
I hope that the results presented in this report will prove useful to further development of methods for evaluation of tropical forages.

Contents
1 Introduction 1
2 Literature 4 2.1 Levels of excess feed in assay for nutritive value 4 2.1.1 Introduction 4 2.1.2 Levels of excess feed reported in the literature 5 2.1.2.1 Temperate areas 5 2.1.2.2 Australia 8 2.1.2.3 Southern United States (Florida) 10 2.1.2.4 Tropics and sub-tropics outside Australia and the United
States 11 2.1.3 Summary and discussion 13 2.2 Intended and actual levels of excess feed 14 2.2.1 Comparisons reported in the literature 15 2.2.2 Summary and discussion 15 2.3 Effect of varying levels of excess feed on the results of assay
for nutritive value 16 2.3.1 Effects reported in the literature 16 2.3.2 Summary and discussion 17
3 Materials and methods 19 3.1 Forages 19 3.2 Experimental animals 20 3.3 Animal-house procedure 20 3.4 Additional data 22 3.5 Statistical methods 22
4 Statistical analysis 23 4.1 Choice of explanatory variables 23 4.1.1 Introduction 23 4.1.2 Comparative effectiveness of feeding level and level of excess
feed in explaining the experimental data 23 4.1.2.1 Methods of comparison 24 4.1.2.2 Results 24 4.1.3 Interrelation between level of feeding, dry matter intake and
percentage refusal, and the effect of variation on the results of regression analysis 26
4.1.4 Summary and discussion 30 4.2 Regression models 31

4.2.1 Dry matter intake 31 4.2.1.1 Introduction 31 4.2A.2 Required characteristics of regression models 33 4.2.1.3 Example of an unsuitable model reported in the literature 35 4.2.1.4 A suitable regression model 35 4.2.1.5 Effect of limited range of data 37 4.2.1.6 Goodness of fit of the suggested regression model 37 4.2.2 Intake of morphological components of the forages 37 4.2.3 Intake of digestible dry matter 38 4.2.4 Other data 38 4.3 Introduction of weightings 38
5 Results 40 5.1 Stylosanthes guianensis - 1 973 series 41 5.2 Stylosanthes guianensis - 1 974 series 45 5.3 Stylosanthes guianensis - 1974 series (chopped forages) 49 5.4 Dried tops of Stylosanthes guianensis 51 5.5 Desmodium distortum 54 5.6 Centrosema pubescens 58 5.7 Brachiaria mutica and B. decumbens 61 5.8 Data from the literature 63
6 Discussion 71 6.1 Importance of differences in response curves and standardiza
tion of feeding levels 71 6.2 Factors causing differences in response curves 74 6.2.1 Introduction 74 6.2.2 Selection for diet of higher digestibility 74 6.2.3 Presence of an inedible fraction 75 6.2.4 Rate of passage of morphological components 75 6.2.5 Rate of passage of stem parts 77 6.2.6 Effectiveness of selection between morphological components 78 6.3 Interpreting some of the data in terms of factors causing
differences in response curves 79 6.3.1 Proportion of fully acceptable stem in Desmodium distortum,
Centrosema pubescens and 1973 Stylosanthes guianensis. 79 6.3.2 Response curves for older and younger cuts of Desmodium
distortum and 1973 Stylosanthes guianensis 81 6.3.3 Response curves for 1974 Stylosanthes guianensis, threshed
tops of S. guianensis and Brachiaria spp. 82 6.4 Intake and digestibility trials in relation to the grazing animal 83
Summary 86 Resumen 88 Samenvatting 91 References 94

Symbols and names of quantities
Units of Symbol Name of quantity measurement.
W bodyweight of experimental animal kg
t time d ( = day)
O T rate of offering total forage dry matter: mass of dry gd" 1 k g - 0 7 5
matter offered divided by time and W 0 7 5 (in the text referred to as amount of dry matter offered or level of feeding)
Note: dry matter was estimated by drying to constant weight at 65 °C
IT rate of ingestion of total dry matter: mass of dry mat- gd ' kg"07S
ter ingested divided by time and W° 7S (in the text referred to as dry matter intake)
DT rate of digestion of dry matter: mass of dry matter g d~' kg"0 7 5
digested divided by time and W° 75 (in the text referred to as intake of digestible dry matter)
rT mass fraction of the offered dry matter refused (in the % text referred to as percentage refusal, percentage residue or level of excess feed)
Note: rT/% = 100(OT - IT ) /OT
dT mass fraction of ingested dry matter that was appar- % ently digested (in the text referred to as dry matter digestibility)
Note: dT/% = 100(DT/IT)
O F rate of offering dry matter of a certain morphological gd" 1 kg~075
component of the forage (in the text referred to as amount of component offered)
IF rate of ingestion of dry matter from a certain mor- gd" 1 kg"0 7 5
phological component (in the text referred to as intake of component)
iF mass fraction of dry matter of component that was % ingested (in the text referred to as relative intake of component)
Note: iF/% = 100(IF/OF)

The general subscript F is replaced by the following subscripts to identify the morphological components:
L leaf (for legumes including petiole; for grasses leaf blade only)
Ls leaf sheath LI leaf + inflorescence S stem
Other symbols and abbreviations
CP crude protein DCP apparently digestible crude protein SD standard deviation SE standard error RSD residual standard deviation from regression RCV residual coefficient of variation ASE asymptotic standard error P probability df degrees of freedom x independent (explanatory) variable in regression equa
tion y dependent variable in regression equation y' first derivative of y (dy/dx) a intercept of y b, c regression coefficients p, m, h parameters in regression model 3 (pages 35-36) r linear correlation coefficient r2 determination coefficient of linear correlation of y with
x R2 determination coefficient defined as
{ £ ( y - y ) 2 - X ( y - y ) 2 } / I ( y - y ) 2 ; also used for nonlinear regression
Note: Axes of graphs are labelled according to the convention physical quantity = numerical value x unit, or numerical value = physical quantity/unit


1 Introduction
Animals grazing tropical pastures generally produce less meat and milk per year than similar animals grazing temperate pastures. Many factors contribute to this lower productivity of livestock in the tropics (e.g. McDowell, 1972; Smith, 1976). One important factor is, however, the lower nutritive value of tropical pasture plants than temperate pastures. This is well illustrated by Minson & McLeod (1970), who studied the frequency distribution of digestibility for 543 samples of tropical grasses and 592 samples of temperate grasses. In both groups, a wide range of values was found but the mean value for tropical grasses was 12.8 percentage units less than that for temperate grasses. Moreover, only 28% of the tropical pasture samples had a digestibility of 60% or more against 75% of the temperate pasture samples. Tropical forages are often not only low in digestibility but also in content of protein and minerals. In extreme situations, which are far from rare, protein is indeed the major limiting nutrient (van Niekerk, 1975).
Where protein and other specific nutrients are not deficient, the level of animal production is largely determined by the daily intake of digestible energy. When, as for grazing animals, forages are given ad libitum, the intake of digestible energy depends on the digestible energy content in forage dry matter and on voluntary intake. In the earlier work on tropical forages reviewed by Butterworth (1967), only the approximate composition and digestibility were measured, but not the voluntary intake.
More than 20 years ago, workers at the MacDonald College in Canada formulated the hypothesis that differences in the intake of digestible energy from various forages were largely a consequence of the relative amounts in which these were voluntarily consumed (Crampton, 1957; Crampton et al., 1957). The significance of voluntary intake was confirmed by their finding that differences in dry matter intake explained 70% of the variation in intake of digestible energy while differences in the digestibility of energy explained only 30% (Crampton et al., 1960). Milford (1960a, b), who was the first to measure the intake of (sub)tropical forages according to Minson (1971a), concluded that the seasonal variation in voluntary intake of subtropical Australian forages was twice as large as the variation in dry matter digestibility and Ingalls et al. (1965) obtained similar results while comparing the voluntary intake and dry matter digestibility of United States forages. Also the results of these authors, comprising data on 90 and 15 forages respectively, indicate that differences in voluntary intake of dry matter explain much more of the variation in intake of digestible dry matter, and therefore digestible energy, than differences in digestibility.
The importance of voluntary intake is now generally recognized by workers evaluating forages. Crampton and his coworkers used the term feeding value of
1

forages when referring to the combined effects of digestibility and voluntary intake. Others (e.g. Milford, 1964; Raymond, 1969 p. 3; Minson et al., 1976 p. 314) use also the term nutritional or nutritive value for that, thereby adding an extra dimension to a term which by tradition was and by many authors still is used to refer only to the nutrient content1.
Since about 1960, numerous authors have measured the dry matter intake of forages and combined this with a measure of digestible energy content in dry matter to arrive at the Nutritive Value Index (Crampton et al., 1960), the Dry Matter Nutritive Value Index (Ingalls et al., 1965), intake of digestible energy (e.g. Heaney et al., 1966), intake of digestible organic matter (e.g. Minson, 1972) or intake of digestible dry matter (e.g. Milford & Minson, 1968a). Most workers in the (sub)tropics measure digestibility and voluntary intake simultaneously in one trial, considering that any discrepancy caused in the digestibility data by unstandardized levels of intake are more than offset by the additional data on voluntary intake (Milford, 1964; Minson et al., 1976).
All the above measures of the feeding value of forages are essentially the same: they measure the voluntary intake of digestible energy or an approximation of it in terms of digestible organic matter or digestible dry matter. The energy content in dry matter or in organic matter of forages varies to some degree, as well as the relationship between the digestibility of energy and the digestibility of organic matter or dry matter (Heaney et al., 1966; Minson & Milford, 1966; Jeffery, 1971b). So one could argue that, wherever possible, the intake of digestible energy should be determined and not the approximations. The major problem is, however, that all those measures are affected by the large experimental variability in dry matter intake (Donefer, 1966; Barnes, 1968; Heaney et al., 1968; Heaney, 1970, 1973). All these authors stress that methods of measuring voluntary intake of forages should be examined critically to reduce this variability, both between and within laboratories. Heaney et al. (1968) even suggest that it might be less than fully justified to continue the routine measurement of voluntary intake of forages until this variability can be reduced.
Voluntary intake of forages is affected by many factors. Raymond (1966, 1968, 1969) proposed that these could be usefully divided into two classes: intrinsic and extrinsic factors. When experiments are designed to establish differences in the voluntary intake of various forages, extrinsic factors may be defined as those related to the experimental animal (species, breed, age, size, sex, physiological state, health), the environment (climate, housing conditions), the way of processing the forage before feeding, and the methods used in the experiments (e.g. method and frequency of presentation, and frequency of removing refused feed). Intrinsic factors may then be defined as those inherent to the forage. In order to obtain comparable data on the voluntary intake of different
1. In this report, no distinction will be made between these terms. Also the term nutritive value of forages will be used to refer to the combined effects of intake and the digestible nutrient content of forage.

forages, the extrinsic factors must be controlled so that unbiased estimates of the intake as an inherent characteristic of the forages are obtained. Raymond (1969) stressed the need for rigid standardization of the conditions under which intake measurements were made, i.e. the total complex of extrinsic factors, especially with a view to the comparison of data from different centres.
The voluntary intake of forages can only be measured if the forages are offered ad libitum. Raymond (1969, p. 27-28) included this requirement in his definition of the intrinsic factors that affect intake of forages as those which are inherent to the forage, or those which determine how much of a forage an animal could eat under ad libitum conditions.
The meaning of the term ad libitum is, at first sight, clear: the amount of feed offered is larger than the amount eaten, i.e. an excess of feed is offered. The matter is however complicated by the fact that many forages, especially those grown in the tropics, are eaten selectively, so that the leaving of some part of the offered feed uneaten could still mean that the animals would consume more if more were offered, i.e. if more opportunity for selection were given. This may be true for grazing and stall-fed animals, and for cattle as well as sheep (Zemmelink et al., 1972). Greater opportunity for selection may also increase digestibility of the consumed part of the forage so that the measured nutritive value in terms of voluntary intake of digestible energy could be affected by an increase in both the voluntary intake and digestibility. The same may occur for the intake of single digestible nutrients such as digestible crude protein.
While a larger excess of feed can increase the selection, chopping of forage would be expected to depress it. Thus the degree of selective consumption allowed in assay of nutritive value can be varied in at least two ways. This report deals primarily with the question how various levels of excess feed may affect the results of nutritive value assay experiments.
The review of the literature (Chapter 2) indicates that the level of excess feed has not been standardized and that few studies have been conducted to analyse the possible effects of that. Special attention was given to this aspect in a number of trials with tropical forages at the Centro Internacional de Agricultura Tropical (CIAT) at Cali, Colombia (Chapter 3). Analysis of the results of those experiments indicated that the conclusions would be strongly affected by the choice of explanatory variable and regression models used to explain the variation in intake (Chapter 4). Chapter 5 presents the results of the CIAT trials with tropical forages (mainly long and unchopped) and of a repeated analysis of data from the literature on chopped forages from the tropics and temperate regions. In the CIAT trials the intake of various morphological fractions was estimated as well as the intake of total dry matter. These data, which are also presented in Chapter 5, form the basis for a further discussion of the observed effects in Chapter 6.

2 Literature
2.1 Levels of excess feed in assay for nutritive value
2.1.1 Introduction
The literature includes many papers on ad libitum or voluntary intake of forages. Many other papers have appeared on nutritive value of forages and deal with voluntary or ad libitum intake, together with digestibility, as an important component of the nutritive value. The two terms, ad libitum and voluntary intake, are in this context usually treated as synonyms, although some authors seem to prefer to use ad libitum while others prefer the alternative term.
In a comprehensive review on the nutritive value of forage crops, Raymond (1969, p. 28) states: "Voluntary intake is generally defined as the amount animals will eat when an excess of 15% is offered (Blaxter et al., 1961)." While this statement suggests that the term ad libitum intake has been well defined, it is in fact a questionable interpretation of the paper of Blaxter et al. (1961) and a mis-statement of facts on a generally accepted standardization of methods.
The following, slightly abridged quotation from the paper of Blaxter et al. (1961) clarifies the first issue.
"In order to avoid subjective bias in assessing the voluntary intake, it was thought of particular importance to ensure that the same excess of food was given to each animal and that the feed refusals should be adjusted to be of large magnitude. To do this, a sequential method of feeding was first developed and tested. The method consisted in feeding each sheep 1.15 times its mean consumption on the previous two days. This method was expected to provide a 15% excess of food at all times to each animal. It was found, however, that the method was not suitable. On occasions the food intake of an individual would fall considerably, to as low as 70% of its previous mean daily intake. As a consequence of sequential feeding, the food offered was reduced. It was invariably found that the whole of this allowance was consumed the following day suggesting that the low intake was a sporadic happening. The sequential method accentuated the duration of these falls in food intake by limiting the food offered subsequent to the refusal. A second method was therefore devised in which adjustments of food offered were made if and only if the amount of food refused was less than 15% of that offered. Then the food offered was increased to 1.15 times that consumed during the previous day."
So Blaxter and his co-workers indeed attempted to offer their forages at a level providing an excess of 15% for each animal, but found it impossible to achieve this intended level of excess feed. The description of the method they finally used

suggests that all animals were fed at a level leading to a residue of 15% or more of the offered feed or an excess of 17.6% or more over the amount consumed. How much higher this excess would be would depend on the amount offered during the first days of the experiment, the daily variation in feed intake by the individual animals, and the question how strictly was adhered to the 'if and only if' statement in the description of the method. The description of the method certainly leaves a wide margin for variation because it only requires that the amount of excess feed be at least 15% of that offered. No restriction is made about the maximum percentage feed refused. In other words, if in a feeding trial a residue of 20 or 25% of the offered feed were measured, it could not be said that a method was used different from that described by Blaxter et al. (1961).
Also Jeffery (1976) suggests that after the work of Blaxter et al. (1961) it was accepted that voluntary intake could be measured by offering 15% above appetite. However very few other authors cite Blaxter et al. (1961) or Raymond (1969) in the description of their methods and the reported methods differ considerably in many trials from both the method used by Blaxter et al. (1961) and that suggested by Raymond (1969).
The following sections summarize methods described in the literature. Because this report is primarily concerned with the effects of selective consumption in tropical forages, it was not considered necessary to cover all the literature or to discuss all the aspects of the methods employed by the various authors. Especially the review of methods employed by workers in temperate areas is therefore limited. Even so, it may serve as illustration of the degree of standardization in those regions and as comparison of methods used with the one used by Blaxter et al. (1961) or the one suggested by Raymond (1969). A more comprehensive review of methods used by workers in the tropics and sub-tropics is given, subdivided according to three areas: Australia, Florida, and the tropics and sub-tropics outside Australia and the United States. Most studies on the voluntary intake and digestibility of forages are on sheep. The following review is also restricted to reports on experiments with sheep, with only a few exceptions which are mentioned explicitly.
2.1.2 Levels of excess feed reported in the literature
2.1.2.1 Temperate areas
A survey (Technical Committee, 1966) shows that methods in trials on nutritive value of forages varied in a number of respects, including the frequency of feeding and removal of residues, and the level of feeding. Table 1 gives the answers of 36 workers, mainly from the USA, to the question how much feed was offered in intake assays in their laboratories. Most of them aimed at residues of 10% of the amount consumed. Some, however, mentioned a residue of 10% as the maximum of a range which, on the lower side, also included values as low as 2% or even less. So in most of the earlier work in Northern America, a lower percentage refusal was allowed than in the experiments of Blaxter et al. (1961). However

Table 1. Levels of feeding in assays for voluntary intake on forages, according to the results of a survey of methods in the USA and Canada (Technical Committee, 1966).
Number of respondents
1 1
17 2 1 2 2 1 1 1 1 2 2 1 1
Amount of forage offered (Description by respondent)
100% of consumption 100% plus of consumption 110% of consumption 115% of consumption 120% of consumption 102-110% of consumption 105-110% of consumption 110-115% of consumption 110-120% of consumption 110-125% of consumption 110-130% of consumption 2 -3% of body weight ad libitum maximum maintenance plus
some workers in the same area accepted residues of 30% of the amount consumed or 23% of the amount offered. Thus there was a considerable variation in the amounts of excess feed in the earlier work in Northern America. The term ad libitum or voluntary intake met with a variable interpretation, even within this limited area.
A brief review of the recent issues of the Journal of Animal Science indicates that most workers in the temperate areas of Northern America have continued to allow less than 15% excess feed. The amounts of excess feed are as a rule expressed as a percentage of intake and the authors often indicated that the amount of forage offered was adjusted each day to arrive at the desired level of excess feed. The following percentages of excess feed were reported:
5-10% (Colovos et al., 1970; Harmon et al., 1975) 10% (Ademosun et al., 1968; Jones et al., 1972)
10-20% (Brown et al., 1968).
Other authors only report that the forages were offered ad libitum without further specification (Hawkins et al., 1970; Jones et al., 1971; Muller et al., 1972; Koes & Pfander, 1973) or that "conventional methods" were used (McCampbell & Thomas, 1972).
Amongst all the papers in the last ten volumes of the Journal of Animal Science, I found only one (Forbes, 1970) in which sheep were fed to "at least 15% in excess of the intake on the previous day", as implied by Blaxter et al. (1961). It described studies on the intake of hay and silage by pregnant ewes at the University of Leeds, England. Hutchinson & Wilkins (1971), working at the

Grassland Research Institute Hurley in England, offered silage at about 20% above consumption to sheep, but in a following trial silage was offered at about 15% above consumption (Hutchinson et al., 1971). Terry et al. (1975), working at the same institute, offered silage and a mixture of silage and alkali-treated straw to sheep at 15% above the previous day's intake. When the intake of similar rations by calves was measured, however, the silage was offered at 15% above the previous day's intake, but the mixtures of silage and straw at 10% above the previous day's intake.
This choice between two distinct levels of excess feed (10 or 15%) is also found in a recent guide on methods used at Hurley (Cammell, 1977). This guide does however not state when the percentage excess feed should be 10 and when 15. This guide, which was written with a view to frequent requests for information from overseas, recommends a method of arriving at the chosen level of excess feed which was not found in any other paper: "Animals are offered the same quantity of feed on days 1 and 2, at levels below the expected maximum. The feed refused from day 1 is collected prior to offering feed on day 2. The weight of feed consumed on day 1 is calculated and 10 or 15% of this figure is added. This weight of feed is offered to the animal on day 3. Similarly, the feed consumption figure from day 2 is used to calculate the weight of feed offered on day 4. This system is continued on succeeding days throughout the preliminary feeding period . . . and during the measurement period." This technique, according to the guide, "minimizes daily fluctuations in intake and enables the amount of feed offered to be kept to a minimum whilst feeding to appetite."
A large number of forage evaluation studies, including the measurement of voluntary intake and digestibility and using sheep as the experimental animal, were performed at the National Agronomy Research Institute (INRA) in France. The workers there too allowed smaller amounts of excess feed than 15%. However also in the work from this centre, there was no consistency in the levels of feeding. The following amounts of excess feed, again expressed as a percentage of intake, are reported in the work from INRA:
5-10% (Demarquilly, 1970b, c; Demarquilly & Andrieu, 1972; Andrieu & Demarquilly, 1974b)
10% (Demarquilly, 1969, 1970a, 1973; Dulphy & Demarquilly, 1973; Andrieu & Demarquilly, 1974a; Dulphy & Michalet, 1975)
10-15% (Demarquilly & Journet, 1967; Dulphy, 1972; Dulphy & Demarquilly, 1972; Geoffroy, 1974).
Demarquilly & Jarrige (1970) state in a review covering the data of many earlier studies that the forages were offered at 10% above intake. In one of the earlier papers, however, it is indicated that the 10% target was in fact the mean of a 5 to 15% range (Demarquilly & Jarrige, 1964). It is not entirely clear, therefore, how the narrower ranges of 5-10 and 10-15% which were mentioned in the later studies should be interpreted.

2.1.2.2 Australia
In the early studies at the Division of Tropical Pastures of CSIRO, Milford (1960a, b) did not provide his chopped forage (grasses) for a certain percentage residue but for a certain absolute amount of refusal: the appetite of each animal was estimated during a preliminary period and during the collection period 200 to 300 g in excess of this amount was offered. A comparison of these figures with the intake data (Milford, 1960b) shows that the excess feed, when expressed as a percentage of the amount offered, could have varied from 15 to 60%. The same method of standardization was also used in a following study on the nutritive value of tropical legumes (Milford. 1967).
Later the method at the same laboratory was altered. Minson (1967) gave the first description of the later method. Minson and Milford (1967) added a number of further specifications to the description, which were, in a slightly different wording repeated by Minson & Milford (1968): "Ad libitum feeding conditions were ensured by feeding, on the first day of both the preliminary and measurement periods, approximately 250 g of feed in excess of anticipated intake, and this level of excess feed was maintained in the feed container throughout each trial. Feed residues were only collected at the end of the preliminary and measurement period, thus avoiding excessive feed selection."
This later method apparently originated from experience in Canada (Heaney et al., 1963), where it was recognized that comparison between chopped and pelleted feeds could be biased by the effect of selective consumption of the chopped feeds if larger amounts of residues were allowed. In Australia, it was also first used in trials in which the voluntary intake and digestibility of chopped and pelleted feeds were compared (Minson, 1967; Minson & Milford, 1968) or in which the effect was measured of a legume supplement on the intake of grasses with a low protein content (Minson & Milford, 1967). Although the first following paper (Milford & Minson, 1968a) only states that the forages - chopped legumes-were offered ad libitum, all subsequent papers dealing with the voluntary intake and digestibility of chopped forages mention the later method (Milford & Minson, 1968b; Minson, 1971b, 1972, 1973; Rees et al., 1974).
This change of method indicates that the CSIRO workers recognized that the opening statement of Milford (1960a) was invalid: feeding in pens did not eliminate selection, even when forages were chopped.
With reference to the statement of Raymond (1969) about generally adopted methods for assay of dry matter intake, the CSIRO workers in their effort to prevent selective consumption disregarded another element which was important according to Raymond (1969), namely that feed refusals should be removed before new feed was offered in order to avoid soiling the new feed. The need to remove refused feed was also stressed by Milford (1964, p. 152), in what may be regarded as an official guide to methods at CSIRO. Although the same text was reprinted in 1968, the methods in use at the CSIRO laboratory had by that time been drastically changed.
In a more recent guide of CSIRO, Minson et al. (1976, p. 318) no longer mention the importance of removing feed refusals. Instead they state that "feed
8
selection can be reduced if excess feed is given on the first day and this level of excess feed maintained in the feed box throughout the trial" but, expanding on this: "Feed refusals are not collected until the end of the ten-day measurement period and then usually only equal 5-7% of the total feed offered." This suggests to me that the amount of uneaten feed in the trough at the end of the ten-day measurement period is 50 to 70% of the amount offered per day, in other words that instead of maintaining a relatively small amount of refused food in the trough, the refusals are allowed to build up to quite high levels at the end of the experiment.
Few other Australian workers adhered to one of the methods as described by Blaxter et al. (1961), Milford (1960a), Minson (1967) or Minson et al. (1976).
Only Williams & Miller (1965) quote Blaxter et al. (1961) for the methods used in a study on the voluntary intake of three mixtures of chopped cereal hay, lucerne hay and cereal straw by sheep. And only Robinson & Sagemen (1967) used the method of Milford (1960a), with a constant absolute amount of excess feed that was removed daily, in a study on the nutritive value of rice straw and five mature grasses from north-western Australia. Instead of quoting Milford (1960a), who suggested that chopping would exclude selection, they justified the method in a different way: "The chopped grasses were fed ad libitum at first, but it was immediately evident that the sheep selected the more palatable parts. A technique was therefore adopted whereby the voluntary intake of the animal was established during the run-in period and a quantity of 200 g a day in excess of this was allowed. Some material was consistently deemed inedible by the sheep
Newman (1968), in a study on the nutritive value of chopped Stylosanthes humilis, a mixture of this with Pennisetutn polystachion, Stylosanthes guianensis and two cuts of Brachiaria nuttica state that "The daily ration was arrived at during the pre-feed periods and ad libitum feeding was aimed at thereafter with 10% in excess of the previous day's consumption being offered." Thus Newman used precisely the method that Blaxter et al. (1961) had found unsuitable, with the difference that he aimed at a percentage of refusal which was considered inadequate by Blaxter et al. (1961) and that he used the previous day's consumption as basis of reference rather than the mean consumption on the two preceding days. In a following paper on the nutritive value of 14 native pasture species from central Australia, including grasses, shrubs and forbs, Newman (1969) reported only that the chopped forages were fed ad libitum, without further specification. Also Jeffery (1971a) only states that he offered the forages - freshly cut and chopped P. clandestinum and mixtures of this with several legumes - ad libitum, again without reference or further specification.
Michell (1973), in a study on the nutritive value of chopped hay of Tasmanian pasture species, also reports feeding ad libitum but adds that the refusals were removed once a week. Whether he took over the method of Minson (1967) and Minson & Milford (1967) is not clear.
Playne (1969a, b), in a study on the effect of mineral and protein supplements on the intake and digestibility of chopped Stylosanthes humilis and Heteropogon contortus or a mixture of these, reports that the sheep were fed at a level about

15% above their expected intake (Playne, 1969a) or approximately 15% more than their previous day's intake (Playne, 1969b). According to the two papers rejected feed was allowed to accumulate in the feed bin for eleven and seven days, respectively. If the method was indeed as described, the sheep should have had an amount of rejected feed in the trough that reached more than 1-1.5 times their daily intake by the end of the trial.
In later work (Playne & Haydock, 1972; Playne, 1972a, b) chopped forages were offered either at 15-25% more than their previous day's intake or "14-23% above actual intake", and rejected feed was removed daily.
Siebert & Kennedy (1972) and Kennedy & Siebert (1972), in studies on the utilization of Heteropogon contortus, did not report to have chopped the forage. They offered the forage at 110% of the previous day's consumption. Nath et al. (1971), however, fed Indigofera enneaphylla and J. cordifolia at 25% above expected intake. Romberg et al. (1969), in a study on the effect of chemical curing with paraquat on the intake and digestibility of mature pasture forage, report that "conventional digestibility trial techniques" were used. This description hardly lends itself for interpretation, even within the limited context of Australia.
In conclusion the methods employed in dry matter intake and digestibility trials in Australia are extremely variable. Certainly the remark of Jeffery (1976) that after the work of Blaxter et al. (1961) it was accepted that voluntary intake could be measured by offering feed at 15% above appetite, may not be interpreted as meaning that this has been an accepted standard in Australia at any time.
2.1.2.3 Southern United States (Florida)
The work in the Southern United States is of special interest in the context of this paper because it often related to the nutritive value of forage species used also in Australia and other parts of the (sub)tropics. However the workers in Florida would have close liaison with colleagues in other parts of Northern America, who work with temperate forages.
Ammerman et al. (1972) studied the voluntary intake of low-quality Digitaria decumbens with and without supplementary nitrogen. The amount of forage offered was "at least 10-15% more than the previous day's consumption." In a similar study by Fick et al. (1973) the amount of hay offered was reported as 10-15% more than the previous day's consumption. Whether omission of "at least" in this second study is supposed to indicate a difference in the level of feeding from the earlier trials is not clear.
Ventura et al. (1975) studied the effect of maturity and protein supplementation on the voluntary intake and digestibility of Digitaria decumbens. Instead of feeding for a constant percentage of residue, they fed for a constant absolute amount of excess feed: 100-200 gram per day. Similar methods were used by Baldwin et al. (1975) in a study on the nutritive value of ensiled Digitaria decumbens and water hyacinth (Eichhomia crassipes). They reported the excess feed to be 300 gram per day. Whether this was on a dry matter basis is not stated. In an earlier paper from Florida (Moore et al., 1970), two distinct levels of excess
10

feed, 15% of intake and 200-300 gram per day, are reported for the methods in two closely related series of experiments on the nutritive value of Paspalutn notatum, Cynodon dactylon and Digitaria decumbens.
J. E. Moore (Department of Animal Science, University of Florida, Gainesville, Florida 32611, USA) told me in a personal letter (1977) that at the University of Florida, the procedure is now designed to give about 200 gram excess feed per animal per day for all diets, so that the level of excess feed expressed as a percentage of intake, is higher for forages with low intakes than for forages with high intakes, and a greater opportunity for selection is allowed for the poorer forages.
An earlier description of the methods used at the University of Florida (Moore & Waller, 1971) suggests that the amount of excess feed may in practice vary to some degree: "Voluntary intake measurement is achieved by adjusting the quantity offered to each sheep daily to provide between 100 and 200 g of orts (refused hay) each day . . . . If a sheep leaves less than 100 g on any given day, the amount offered is increased by 100 g, but if no orts are left, the amount offered is increased 200 g over the amount offered the day before. If more than 200 g are left for three consecutive days, the amount offered is reduced by 100 g each day until 100-200 g are left. The amount offered is increased on any day when it is necessary but the amount offered is decreased only after a sheep leaves more than 200 g for three consecutive days."
2.1.2.4 Tropics and sub-tropics outside Australia and the United States
Methods employed by workers elsewhere in the tropics of sub-tropics are as variable as those described above, or even more so.
Miller & Blair Rains (1963) studied the voluntary intake of 24 freshly harvested forages by cattle or sheep in Northern Nigeria. After the animals had been accustomed to the metabolism crates "the forages were fed ad libitum for a period of seven days, during which intake was measured. During the following ten-day collection period an amount of herbage equal to that consumed by the animal with the largest intake plus about 10% was offered to each animal in the trial." The same methods were used in experiments with silages, and hays and crop residues (Miller et al., 1963; 1964). Thus, Miller and his coworkers offered the same amount to individual animals, rather than aiming at the same amount or percentage residue per animal. The silages in these studies were from chopped materials, but no mention is made whether the fresh and dried forages were chopped. In later studies at the same station on the voluntary intake and digestibility of long Andropogon gayanus by sheep, Haggar & Ahmed (1970) used a constant residue equal to 25% of the amount offered, and called this "feeding to appetite." In a study on the effect of various supplements on the voluntary intake and digestibility of mature Andropogon gayanus, Haggar (1972) offered approximately 130 g dry matter per kgU7S bodyweight of this forage and called this a "restricted level of feeding", even though 50-60% of the offered feed was rejected. Brinckman (1975) at the same station, examined the nutritive value of long Chloris gayana, Andropogon gayanus, Stylosanthes guianensis, Stylosanthes
11

humilis and groundnut haulms (Arachis hypogaea) and calculated the ration to be 25% in excess of the previous day's intake.
Smith (1962a) determined the intake by cattle of unchopped mature veld and veld hay in Rhodesia by offering 33% in excess of the voluntary intake, and used the same level of excess feed in a study on the nutritive value of Chloris guyana, a mixture of this with Stylosanthes guianensis, and Dolichos lablab (Smith, 1962b), remarking that this method allowed a measure of selective intake and therefore approximated to field conditions. Also in Rhodesia, Elliott (1967a, b) studied the voluntary intake of chopped low-protein Chloris gayana hay by sheep and cattle, which also received various amounts of concentrates. He offered the hay in amounts approximately 50% above intake and stated explicitly that this large amount of excess feed was found necessary to ensure that the hay was available ad libitum.
Chenost (1972b) performed a similar study in Guadaloupe on Digitaria decum-bens. He did not report whether the forage was chopped. Neither did he state the level of feeding. But in other studies on the nutritive value of D. decumbens at the same laboratory, he offered the forage for a residue of 10%, even though the freshly harvested forage sometimes included up to 20% dead material (Chenost, 1972a, 1975).
Grieve & Osbourn (1965), studying the nutritive value of five grasses in Trinidad (Cynodon dactylon, Setaria sphacelata, Cynodon plectostachyus, Brachiaria decumbens, Digitaria pentzii, and Brachiaria ruziziensis), did not report whether the forages were chopped but stated that refused feed varied between 10 and 30% of that offered, or 11 to 43% of consumption, and described this as "feeding to appetite."
Butterworth (1965) studied the nutritive value of chopped Pennisetum purpureum in Venezuela and reported that residues of up to a third of the material offered were necessary to attain "maximum" intake. The grass was finely chopped but even so, "selection was practised to a considerable degree." Similar methods were used at the same centre to study the nutritive value of Digitaria decumbens and Cynodon dactylon (Butterworth & Butterworth, 1965).
Combellas et al. (1972a) and Combellas & Gonzalez (1972a, b; 1973a, b) at the University of Maracay in Venezuela measured the nutritive value of Cynodon dactylon, Cenchrus ciliaris, Panicum maximum, Echinochloa polystachya and Brachiaria mutica, all at various stages of growth. Although all these studies were at the same centre, the selectivity permitted varied enormously. The first three papers do not mention whether the forages were chopped. The Echinochloa polystachya, however, was chopped and in the study on Brachiaria mutica forage grown under irrigation in the dry season was offered as long forage, whereas that grown in the rainy season was chopped before feeding. The residue varied at least from 21 to 53% of the offered forage. In the studies on Cenchrus ciliaris, Echinochloa polystachya and Brachiaria mutica, the percentage excess feed is stated for each of the forage samples so that they can be taken into account in comparison of data between trials. However the comparison of the data remains problematic because of the magnitude of the differences in the percentages excess feed. The study on the nutritive value of Cynodon dactylon mentions only that the
12

amount of excess feed was 26.6% of the intake with a very large standard error or standard deviation (it is not clear which is meant) of 10.4 percentage units. It is not clear whether the percentage residue or excess feed was greater for the older forages than for the younger forages. Similarly, the percentage refusal in the study on Panicum maximum is reported to have varied from 25.1 to 75.7 (whether this is a percentage of the amount offered or the amount consumed is not clear) and again it is not clear whether this variation was random or in some way correlated with the maturity of the forage.
In a study by Combellas et al. (1972b) on the nutritive value of hay made of the aerial parts of Arachis hypogaea, the amount of forage offered was 20% above the measured consumption during the previous week. In a study on similar material by Velasquez & Gonzalez (1972), the level of feeding is not stated. Also in Venezuela, Garcia et al. (1972) measured the intake of Indigofera sp., chopped and offered in amounts giving less than 10% refusal.
Johnson et al. (1967) measured the nutritive value of unchopped Panicum maximum in the Phillipines, using cattle and buffaloes, and state: "All feeding was ad lib., the adjustment period being used to ensure that all animals expressed their maximum voluntary intake levels. Presence of leafy material in the remaining orts was taken as an indication of satiety, with the stipulation that the weight of orts be at least 10% of the feed offered."
Devendra (1975), reporting on the intake and digestibility of unchopped Pennisetum purpureum by goats and sheep in Trinidad, only states that the forage was offered ad libitum, without defining this term. Similarly Djafar & Yuen (1972) report only that "conventional methods" were used in a study on the nutritive value of chopped forages of Pennisetum purpureum, P. merkeri and Themada villosa for goats.
2.1.3 Summary and discussion
Methods of measuring the nutritive value of forages have not been standardized to any extent but are, on the contrary, extremely variable. Most authors who report on the voluntary intake and digestibility of forages state that the forages were fed ad libitum but the further description of this term is so variable, that the term without further description becomes almost meaningless.
The statement of Raymond (1969), that voluntary intake is defined as the amount animals will eat when an excess of 15% is offered, must perhaps be interpreted as meaning that the residue should be at least 15%, as implied by Blaxter et al. (1961). All of the results based on trials in which 15% or more residue was allowed would then be covered by this definition. However, even then we would still find many exceptions. Not only in the temperate areas, where the percentage refusal is in many cases much lower than 15%, but also, for instance, in CSIRO in Australia where the methods are now also designed to give a low percentage refusal. Moreover, the forages are in many cases chopped and at CSIRO the refusals are not removed from the feeding troughs before the new feed is offered. All these practices are designed to prevent selection as far as possible.
13
Many workers in the tropics, however, encourage selection by feeding long forages and allowing large amounts of excess feed. And several authors suggest that large amounts of excess feed were necessary to obtain valid estimates of maximum intake for their forages. In other words, those authors indicate that a residue of 15 or even 25% did not necessarily mean maximum intake, even when the forages were chopped (Butterworth, 1965). If so, the comparison of data on the voluntary intake of forages might often be biased.
Methods vary between centres and even within centres. Clear examples of this are the various amounts of excess feed allowed at INRA in France, CSIRO in Australia, the University of Florida and the Faculty of Agronomy of the University of Maracay.
The methods used at CSIRO and at the University of Florida show some modification with time. However, the changes in the methods at these two centres went in opposite directions. The CSIRO workers first used a constant absolute amount of residue which was removed daily but discarded this method about 1966, whereas at the University of Florida this method came into use as a standard procedure in the early seventies. The more recent methods at CSIRO are designed to prevent selection as much as possible without the need to pellet the feeds; those at Florida are designed to provide "limited" selection but a constant absolute amount of residue is used, so that there is a larger percentage residue of forages whose intake is lower, thus allowing more selection in the poorer forages (J. E. Moore, 1977 personal communication). The recent guide on methods used at Hurley (Cammell, 1977) leaves a choice between 10 or 15% excess feed, without specifying when the lower and when the higher figure should be used, so adding to the confusion.
Investigators may modify procedures according to newly gained information and the specific objectives of their experiments (Chalupa & McCullough, 1967). Some of the large differences in the methods used by different workers may be explained against this background. In experiments on the nutritive value of forages produced in intensive systems for example, one may want to avoid selection as far as possible because the forages are so used in practice, whereas in evaluating forages used for extensive grazing more selection is allowed. In many reports, however, I could not relate the observed differences in methods to differences in the practical way the forages were used or to differences in the objectives of the experiments. In a large proportion of the published reports, only a vague description of the method is given, including the allowance for selective consumption. The choice of a particular level of feeding often seems arbitrary.
2.2 Intended and actual levels of excess feed
In almost all papers, the level of excess feed is only mentioned in the section on materials and methods, i.e. it nearly always reflects an intended level of excess feed. Some authors, e.g. Combellas & Gonzalez (1972a; 1973a, b), reported the achieved and not the intended levels of excess feed, and only very few authors stated both so that a comparison between intended and actual levels of excess feed can be made.
14

2.2.1 Comparisons reported in the literature
Newman (1968) offered five forages at an intended level of 10% excess feed, by offering each day 10% in excess of the previous day's consumption. The percentages residue per forage (average of two animals) which were calculated at the end of the experiment were however 17, 10, 10, 26 and 20%, respectively. Jeffery (1976) offered two hays to 18 and 19 animals, aiming at an amount of excess feed equal to 15% of the intake, again by offering each day 1.15 times the previous day's consumption. The average actual percentages of residue were 20 and 15, respectively, with a range for individual animals of 14 to 33% and 6 to 20%, respectively. Heaney (1973) provided five forages at four levels intended to give 0, 10, 20 and 30% of excess (relative to the amount offered; Heaney, personal communication, 1977). Heaney used 16 to 24 animals per forage, or four to six animals per level of excess feed in each case. The actual percentage refusal often differed so much from those intended that it cannot be seen from the plotted data in his scatter diagrams to which of the four intended treatments the points belong. Also in this study the actual levels of excess feed often deviated at least 5 percentage units from the intended levels. The scatter diagrams of Heaney (1973) demonstrate that not only data of individual animals differed that much from the intended level but also the means of groups of four to six animals at each intended level of excess feed.
2.2.2 Summary and discussion
The data of Newman (1968), Jeffery (1976) and Heaney (1973) indicate the same problems that Blaxter et al. (1961) encountered when they tried to give 15% excess feed. With the daily variation in feed intake, Blaxter et al. (1961), could not maintain a fixed percentage of excess feed and the data from the other authors confirm this. Most authors who aimed at an intended level of excess feed did not report the actual levels, but the available data suggest that the actual levels could differ considerably from the intended. Therefore even comparison of data from experiments with the same intended level of excess feed might be biased.
Not only the daily fluctuations in intake may cause discrepancies between intended and actual levels of excess feed. When the amount of feed offered is based on the previous day's consumption there is no time to determine the dry matter content of the refusal, which is necessary to calculate the amount of dry matter consumed on the previous day. For dried forages, one may perhaps assume that the refusal has the same dry matter content as the offered feed but not for fresh forages. The problem of establishing the amount of feed to be offered on the basis of the consumption on preceding days may perhaps be overcome by the method recommended by Cammell (1977; Section 2.1.2.1), because this allows time to determine the dry matter content of refusals. The practice of feeding for an intended level of excess feed remains, however, cumbersome. If the consumption fluctuates from day to day, frequent changes are necessary in the amount of feed offered with all the complications of keeping records on the amount of feed
15

offered day by day, and risk of mistakes increases. Even if this is all done accurately, one is still regulating the level of feeding from past data and actual amounts of excess feed are likely to differ from those intended.
2.3 Effect of varying levels of excess feed on the results of assay for nutritive value
2.3.1 Effects reported in the literature
Playne (1968) offered chopped Urochloa mosambicensis to sheep at 115 and 140% of the previously determined intake and measured a statistically significant increase in dry matter intake from 49.4 to 55.0 g d"1 kg " 7 \ Dry matter digestibility did not change with the greater amount of excess feed. In a later study on the intake and digestibility of chopped Heteropogon contortus, Playne (1972a) found a statistically significant increase in dry matter intake from 38.0 to 42.0 g d ' kg -"'75 when he increased the amount of excess feed from 14 to 46% of the intake. However, the digestibility tended to decrease and the resulting increase of 6% in the intake of digestible dry matter was not statistically significant. No effect on voluntary intake or digestibility was found when fine-stemmed Stylosanthes humilis was offered at 22, 38, 50 and 72% above intake respectively (Playne & Haydock, 1972).
Myles (1970) offered Digitaria decumbens hay at eight different levels aiming at levels of excess feed varying from 5 to 12(K)gd '. Neither the voluntary intake nor the digestibility were affected by the large differences in levels of excess feed.
Heaney (1973), in a study on the intake and digestibility of five chopped Canadian forages (hay made from red clover, timothy and two cuts of lucerne, and oat straw), aimed at four levels of excess feed, 0, 10, 20 and 30% of the offered feed. Because he found it impossible to maintain these levels of excess feed because of day-to-day fluctuation in intake (Section 2.2.1), he analysed the results on the basis of data from individual animals by regression of dry matter intake and digestibility on the actual percentage residue. He concluded from the analysis that there was a slight increase in dry matter intake as the opportunity for selection increased, due to a slightly lower intake at low levels of excess feed and higher intakes when the excess feed approached 30%. No effect of opportunity for selection on intake was measurable when the extreme treatments were excluded and the residue varied only from 5 to 25%. Similarly no significant effects of opportunity for selection on dry matter digestibility and on intake of digestible energy were found with percentages residue varying from 5 to 20 or 25%. Jeffery (1976) made a similar study with chopped Pennisetum clandestimim and correlated intake and digestibility of dry matter with the residue expressed in percentage of intake, which varied from 1 to 60%. The results suggest that digestibility increased in a linear fashion from 71 to nearly 75% with the percentage residue. Dry matter intake, however, was only depressed at residues below 15% and remained constant when the residue rose from 15 to 60%.
Methods similar to those of Heaney (1973) were used by Brinckman & Dimka (Shika Research Station, P.O. Box 116, Zaria, Nigeria; unpublished data) in
16

experiments on the voluntary intake and digestibility of coarsely chopped mature Chloris gay ana and Digitaria smutsii. Both forages were fed to 24 sheep with residues ranging from 2.6 to 70.8 and 7.3 to 53.5% of the offered dry matter, respectively. For both forages, dry matter digestibility was positively correlated with the percentage residue (P<().()1). Dry matter intake was not affected by the percentage excess feed for Chloris gay ana (b = -0 .02, P>0.50) . For Digitaria smutsii, however, there was a significant correlation between voluntary intake and percentage residue (P<0.05). Voluntary intake of dry matter increased by 0.39 g d"1 k g " " for every unit increase in the percentage residue.
Haggar & Ahmed (1970) found large increases in dry matter intake (8-15 gd ' k g " " ) of unchopped Andropogon gayanus when they offered this at a lower level leading to a residue of about 25% of the offered forage and at a second level in which the amount of offered forage was increased by 50%. Here also dry matter digestibility was increased by about 10 percentage units at the higher level of feeding. Haggar (1972) confirmed these results in a second study, again with Andropogon gayanus. He also found that dry matter intake and dry matter digestibility decreased when the forage was chopped and that the effect of level of feeding on voluntary intake was much smaller when the forage was chopped than when long forage was offered: 3.3 and 8.7 g d~' k g " 7 5 , respectively. Zemmelink et al. (1972) also found large increases in the voluntary intake by cattle of long A. gayanus hay, with higher levels of feeding: five cuts of A. gayanus were offered at 69, 93 and 116g (dry matter) d"1 k g " 7 1 and average intakes of 47.7, 59.3 and 68.3 g d 1 kg""'7"1, respectively, were measured at these levels of feeding. On all levels of feeding, including the lowest, considerable amounts of leaves were left in the refusals. Johnson et al. (1967; Section 2.1.2.4) considered the presence of leafy material in the refusals an indication of satiety. The above data, however, demonstrate that even this does not guarantee that maximum feed intake was measured, as confirmed at CI AT (1972) in a trial using sheep and chopped, mature Para grass hay (Brachiaria mutica): when 68 g d ' kg " " was offered, the sheep left 23 g (34%), containing 22% leafy material. Nevertheless, intake increased from 45 to 56 g d - ' k g " " when the amount offered was increased to 136 g d ' kg " 7 \
2.3.2 Summary and discussion
The reported effects of level of excess feed on the results of nutritive value assay experiments are variable. Several factors may be responsible. With fine forages, selection between different fractions will be more difficult than with coarser forages. It may therefore also be expected that the effect of level of excess feed will be smaller with a fine forage, like Stylosanthes humilis, than with a coarser material, like most tropical grasses. The differences in the effect of level of excess feed as obtained by Playne (1968, 1972a) and Playne & Haydock (1972) may be explained that way. Also chopping the forages may be expected to render selection more difficult, and therefore decrease the effect of level of excess feed as was in fact shown by Haggar (1972). This may also explain why most authors who worked with chopped forages (Playne, 1972a; Playne & Haydock, 1972; Myles,
17

1970; Heaney, 1973; Jeffery, 1976) found small effects, while others (Haggar & Ahmed, 1970; Haggar, 1972; Zemmelink et al., 1972) who worked with long and coarse tropical grasses found very much larger effects.
The latter comparison is, however, confounded by another factor. Zemmelink et al. (1972) related the voluntary intake to the amount of forage offered. Haggar & Ahmed (1970) and Haggar (1972) did essentially the same because they compared intake and digestibility by one group of animals fed for a residue of 25% with those by a second group for which the amount of offered feed was increased by 50%. All the other authors, however, compared the intake and digestibility by animals given a large excess of feed with those by animals on a smaller excess. They either compared groups of animals fed for distinct levels of excess feed or analysed for individual animals by regression of intake and digestibility on the actual excess, i.e. the refusal.
Chapter 4 will show that the conclusions may indeed be affected by the method of analysis and that the effect of level of excess feed on intake of dry matter and on intake of digestible dry matter is likely to be seriously underestimated when this is studied by direct regression of intake data on refusal.
18

3 Materials and methods
3.1 Forages
The forages are listed under Code A-S in Table 2. They include three cuts of Stylosanthes guianensis (Aubl.) Sw. (Skerman, 1977; Schultze-Kraft & Giacometti, 1977) harvested in 1973; four cuts of the same species harvested in 1974, and three samples of threshed tops of S. guianensis grown for seed production. Furthermore two cuts of Desmodium distortion (Aubl.) MacBr. and
Table 2. List of trials and forages.
Code* Date of trials"
A B C
D E F G
H I J
K L M
Stylosanthes guianensis (1973) Stylosanthes guianensis (1973) Stylosanthes guianensis (1973)
Stylosanthes guianensis (1974) Stylosanthes guianensis (1974) Stylosanthes guianensis (1974) Stylosanthes guianensis (1974)
Same as D but chopped Same as E but chopped Same as F but chopped
Threshed tops of Stylosanthes guianensis, 1st sample Threshed tops of Stylosanthes guianensis, 2nd sample Threshed tops of Sryiosanfhes guianensis, 3rd sample
3 months regrowth 5 months first growth 8 months first growth
2 months regrowth 5 months first growth 7 months first growth 9 months first growth
N Desmodium distortum, cut at 90 cm (2 months first growth) O Desmodium distortum, cut at 180 cm (4 months first growth)
P Centrosema pubescens, 1st sample Q Centrosema pubescens, 2nd sample
R Brachiaria mutica, mature, hay S Brachiaria decumbens, mature, hay
T Pennisetum clandestinum, chopped Data from Jefferey (1976)
U Red clover hay, chopped V Timothy hay, chopped W Alfalfa hay, chopped (1st cut) X Alfalfa hay, chopped (2nd cut) Y Oat straw, chopped
Data from Heaney (1973) Data from Heaney (1973) Data from Heaney (1973) Data from Heaney (1973) Data from Heaney (1973)
1973-08-09 1973-07-23 1973-10-09
1974-10-11 1974-08-11 1974-10-11 1974-12-13
1974-10-11 1974-08-11 1974-10-11
1975-01-09 1975-02-20 1975-05-26
1974-09-09 1974-11-01
1973-11-26 1975-04-15
1975-02-04 1975-06-11
a. These codes will be used in this report to identify the forages or trials. b. First day of the measurement period of the trial (Section 3.3).
19

two samples of Centrosema pubescens Benth. (Skerman, 1977; Schultze-Kraft & Giacometti, 1979), and mature stands of Brachiaria mutica (Forsk.) Stapf, and B. decumbens Stapf. (Bogdan, 1977) were included. All samples of S. guianensis (stylo) were of the variety La Libertad (CIAT accession No 18; CIAT, 1972, 1973).
The B. decumbens and one sample of threshed tops of S. guianensis were grown on poor acid Oxisols at the experimental station Carimagua in the Llanos Orientalis of Colombia. All other forages were grown on fertile Mollisols at the CIAT headquarters, Palmira, Columbia. All feeding trials were conducted at CIAT, Palmira.
The two grasses and the threshed tops of S. guianensis were offered as hay. The other forages were harvested daily and offered as fresh forage. Further data on the forages will be given in Chapter 5 (Tables 4-9).
To encourage selection, the forages were as a rule not chopped before feeding. All forages were offered in diverse amounts so that animals on the lower levels of feeding would have little or no excess feed and thus would be expected to eat unselectively, whereas animals on the higher levels of feeding were given considerable room for selection by a great amount of excess feed (Section 3.3). Three cuts of S. guianensis of the 1974 series were offered chopped as well as unchopped.
3.2 Experimental animals
The experimental animals were male sheep, either wethers or rams, of a local breed called "Africander" but not related to the South African breed. The mature weight of these animals is 40 to 50 kg. In the experiments, however, only growing animals of 20 to 35 kg were used. Within experiments, the range of liveweight was kept to a minimum, usually not more than 5 kg. On two occasions, a change from older to younger animals was made so that the mean liveweight of the animals differed between experiments. To check upon a possible effect of that, a double set of animals, including a younger and an older group was used in Trials G and L (Table 2). The results in the two trials with these two groups of animals were so nearly the same that the data could be treated as one set.
Between trials, the sheep were maintained on pasture of a quality that usually allowed for a moderate weight gain. Animals selected for a trial were taken from the pasture at about 16h00, placed in individual metabolism crates with feeding troughs large enough to accommodate unchopped forages (floor surface 70 cm x 45 cm), kept without feed and water for about 18 h, weighed and treated for intestinal parasites. After that, faeces collection harnesses with a canvas bag were put on. A plastic bag marked with the date and the number of the animal was placed inside the canvas bag for easy handling of the faeces.
3.3 Animal-house procedure
In the trials, no attempt was made to feed to a certain level of excess feed. Instead a level of feeding - amount of dry matter offered divided by 'metabolic
20

weight' (W0-75) - for each animal was decided upon before the trial. This level was maintained throughout the trial and no adjustments were made when the amount of refused (excess) feed was either more or less than expected. The amount of dry matter offered thus varied between animals. In most trials, the lowest level was about 50gd - 1 kg~075 while the highest level was mostly between 120 and 150gd - 1 kg -075 . In the first trials (Table 2, A, B, C and P) three animals were assigned to each of four levels of feeding, including the lowest, the highest and two intermediate levels, but in the other trials each animal was assigned to a different level of feeding, covering the whole range approximately equally spaced. The number of animals per forage ranged from 6 to 23, depending on the amount of forage and the number of metabolism crates available.
The amount of fresh feed to be offered in order to arrive at a certain amount of dry matter was estimated from estimation of dry matter during the first days of the adjustment period of the trials. Only on a few occasions were adjustments made in the amount of fresh feed offered to allow for the higher moisture content of the fresh forages after rain.
The forages were offered once a day at about 09h00. Refused feed was removed from the troughs every morning before the new feed was offered.
In all trials, an adjustment period of 7 to 9 days preceded a measurement period of 9 days. Dry matter intake was estimated from feed offered on day 1 to 7 of the measurement period and feed refusals measured on days 2 to 8. Digestibility was estimated from the faeces produced from about lOhOO on day 2 of the measurement period until exactly the same time on day 9.
Four to six samples of the offered forage were taken daily to estimate dry matter. Similarly daily samples of feed refused by individual animals were analysed for dry matter. After drying, these samples were stored in plastic bags, separately for the offered forage and the refusals of individual animals. At the end of the experiments subsamples were taken from these bags to estimate morphological composition and crude protein and ash content.
The marked plastic bags with faeces were collected once or twice a day and stored in a freezer. At the end of the trial, all faeces from each animal were weighed, mixed and sampled for estimation of dry matter and crude protein.
Dry matter was estimated in all samples by drying to constant weight at 65 °C in a forced-air drying oven. Crude protein and ash were estimated by AOAC (1971) procedures.
Daily fluctuations in the dry matter content of the forages caused differences, usually slight, in the amount of dry matter offered from that intended. All data on the -voluntary intake of dry matter (IT), intake of digestible dry matter (DT) and dry matter digestibility (dT) were based on the real amounts of dry matter offered (OT ) as calculated from dry matter content during the measurement period. Similarly, all calculations on the analysis of the data were based on actual levels of feeding.
The numerical values for 0T , IT and DT were all expressed in g d"1 kg-0-75. The level of excess feed (rT) was expressed as a percentage of the amount of dry matter offered.
21

3.4 Additional data
In addition to data collected in the CIAT trials, data on the voluntary intake of chopped Pennisetum clandestinum published by Jeffery (1976) and the intake of five chopped Canadian forages published by Heaney (1973) will be discussed in this report. These trials are coded T-Y in Table 2.
Heaney (1973) and Jeffery (1976) did not state the numerical values for O T and IT in their reports, but both IT and the percentage excess feed (expressed by Heaney as a percentage of O T , personal communication, 1977; and by Jeffery, 1976, as a percentage of IT) could be read with sufficient accuracy from their diagrams. The O r and for Jeffery (1976) also rT could be calculated from these data. Jeffery (1976) expressed IT in gd"1, but I converted to gd - 1kg~075 by dividing by metabolic liveweight derived from the average liveweight for all his experimental animals, so that all data were comparable.
3.5 Statistical methods
The data were studied by regression analysis, using multiple linear regression models and non-linear models. Linear models were fitted by using the subprogram REGRESSION from the SPSS package (Nie et al., 1975). To fit non-linear models, the computer program BMDX 85 (Dixon, 1973) was used. In the final analysis of all intake data the variance was weighted in such a way that the residual variance was proportional to the expected value (Section 4.3).
22

4 Statistical analysis
4.1 Choice of explanatory variables
4.1.1 Introduction
As discussed in Section 2.3.1, several authors have studied the effect of different levels of feeding on the results of nutritive value assays of forages and most of them did this by relating both voluntary intake and digestibility to the amount of excess feed provided in their trials.
In the CIAT trials levels of feeding were also varied to produce different levels of excess feed but, as stated in Section 3.3, no attempt was made to adjust feeding levels to obtain any particular level of residue. In the analysis of the data, however, the data on voluntary intake (IT) and digestibility (dT) of dry matter could still be related to the levels of excess feed (refusals) for each animal. By expressing the latter as a percentage (rT) of the amount of dry matter offered (O T ) , I could then follow the same procedures as were used by Heaney (1973) (Section 2.3.1). Jeffery (1976) followed a similar procedure, except that he expressed the refusals as a percentage of intake.
An alternative approach to the analysis of the data would be to relate voluntary intake and digestibility to the amount of dry matter offered. This would reflect the fact that O T and not rT was used as an instrumental variable. Relating the nutritive value to rT has, however, the advantage that it provides an immediate measure of the proportion of the feed to which the data are related. The relation between IT and O T can be transformed into a corresponding relationship between IT and rT (Section 4.1.3). By establishing the relationships between intake of digestible dry matter (DT) and O r , and between digestibility of dry matter (dT) and O T in addition to that between I r and 0T , also the relationships of DT and dT
to rT can be determined. This indirect approach requires, however, an extra step in the analysis and would also mean a deviation from the methods commonly used. This chapter further compares advantages and disadvantages of the two approaches.
4.1.2 Comparative effectiveness of feeding level and level of excess feed in explaining the experimental data
One criterion for the choice between two parameters as explanatory variables is their effectiveness as such. Therefore the comparative effectiveness of O T and rT
in explaining the variation in IT, DT and dT data in each trial was evaluated by comparing the residual standard deviations from regression (RSD), which were obtained by regressing these variables on O T or rT.
23

4.1.2.1 Methods of comparison
For the regression of IT(y) on rT(x), two models were tested for the data of each trial. The first model was of the form
y = a-(a-y0)e-k x , with k>0 (1)
in which a is the asymptotic value of y as x goes to infinity and y0 the intercept of y. This model, which was also used by Jeffery (1976), assumes that the relationship between IT and rT has the form of a simple asymptotic curve with decreasing slope over the whole range of x. Some of the data, however, pointed to a curve with increasing slope at higher values of rT. To allow for a wide range of response patterns, we used also a more flexible regression model:
y = f{ln(x+l),V(xTÏ),x,x2} (2)
to relate IT to rT. (For the logarithmic and square root transformations the value x+ 1 instead of x was used to avoid problems with rT values of 0 or -0) . Model 2 was fitted by stepwise multiple regression: after selecting the best single transformation of x for the first step, others were added until the RSD did not decrease any more. The RSD obtained with Model 2 was then compared with that obtained with Model 1 and the smallest one of these two was selected for comparison with the RSD obtained by regression of IT on O T as described below.
For regression of IT(y) on OT(X), the model
y = m{l-e-(px/m)h}1/h with m>0, h>0 , 0 < p ^ l (3)
was used for the data of all trials. The characteristics of this regression model are discussed in Section 4.2.1.4. At this point, suffice it to say that this model, though flexible enough to describe a variety of response patterns, has also a number of inherent restrictions that provide protection against erratic behaviour. Because such restrictions were not imposed for the regression of IT on rT biases in the comparison should generally favour the RSD from regression on rT.
The effectiveness of O T and rT in explaining the variation in DT and dT was studied in the same way as described above for IT. For DT the same regression models were used too. For regression of dT on O T and on rT, the model y = a+bx + cx2 was used. This model was also fitted by stepwise multiple regression, entering the linear term first and then adding the quadratic term if this was significant at the 10% level.
In some trials, the dependent variable was not at all related to O T or rT, or both, so that SD from the mean was smaller than RSD from regression. This happened especially with dT. The SD was then recorded instead of RSD from regression.
4.1.2.2 Results
Table 3 gives for each trial, including those of Jeffery (1976) and Heaney (1973), the extreme levels of O T and rT, and the results of regressing IT, DT and dT on rT and O T . In Trials U-Y only the results obtained with dry matter intake
24

£ Z.
£ a
1> ©
^
CM os o
©
Os
Os
( S
sO
CM
0>
O
en
X
co
o "t
CM
v> o
c X
^
CN
^ X -O X o
V, v, os
o CM
s©
*~
O
o
CM
X
Os
•" CN X
"-1
O
se o
X V i
Os
"* »Tl CM
sC
o
r-
v i 'O
^
so
~ o Os v j
©
X r -
en v i CM
en o en
m
so o
V )
t
CM
CM
-«o O o o
o
m
^ £
m • "
o o c
m o o
CM
*̂ V)
O
m X un
CM
m TT CM
CM
m
c
s© CM m
)£ CM
sO O CM
X os CM
O
O
èn
CM
"* en v .
n
C
m o
Os
CM
CM
* • "
m
*-* CM
c
o
so Os
un CM
£ SO O
*<t
m
se o
m m o
CM
TT
£
CM
«t
Os m o o
Os CM O
O
m
£
m
o
o
m o
o o o c o c o c o o o c o o o o o o o
Û
X
o' X
"B?
N
* CS
o en
es
o
en CN
f •Q
' t
O
f ,
„ vC
vO
» 00
o
X CN
<-O
00
m
en
ON
o
en X
,̂ es
r> ^0
" t
o
es X
o»
* * t
-m CM X
c
v, X CM
O
un
X
r-
sO
O
c CM
CM
CM
X
CM
O se Os
o
CM
Os
t
CM
X
\D
CM Os O
O en
O
m
ir,
«f
O
Os
O
m CM p -
X
CM
** V )
" t
X
O
V> sC CM
CM
CM
X
m
o V ( Os o
Os ' t X
en m
X
t
V ) CM
O
p» CM
V )
CM
' ^ •
sO
X
Os
o
Os
5
C in
X
r̂
sO *r,
o
CM
m
CM
CM
Os
' t
X X
o
Os
m
r-sO
£
1 ^
m m o
o X o
T t m
en en
£
** o en * *
en ir,
o o
^ - Os X t
m o o o o © o o c c c o o c c o o o
*r • *
r^ t
o X
o
Tl
m
^ r-̂
v0
O
m X
Tf
^ 0<
o
— V.
v°t
X
o
>o m
o o
o i n
O
»-X
X
1^1
o
» \ C
\ C
o
X
o
T f
r<
n • > »
c
o Wi
o
= m CM X
o
X
en
en r-
c Os
o
( S
f
CM
Os
ir, X
o
p-rM
CM
r-
Os
Os
o
*-* r̂
Os
Os
X TT ir,
O
r-CM
m Os
CM i r , Os
C
sO
r-
p-
o
ir,
o
o r-en o
£ t - O O CM
i n m
Os fM
c o
X i r ,
CM
CM
C r» X
o
Os
t
>o Os
X
o
t
f
r̂ X
CM en X c
tr,
ir,
en X
CM i r , s©
C
sO CM
O Os
CM CM Os
O
—• ^ so o m r - o s o e n r -oo vO ^ x > - < e n o s — m e 00 sO (S r - ^ O C M O O s r - X © o d o © © ' © © © ©
^ c M s O » X ^ ^M O s T t x ' CM os' r> x os' p-' un' en' , . _ . . . . . , . . . ^ t ^ ft r<i *t m r f i n ^ " e n e n i r i es so en r - -
© © sO OCIV) ^ CM •— o ' © r^ en' CM' X'
V j s C t - ; ^ - «c x r - ; » - ; © v i fM —• - ^ S C ' O S ' C M ' T - I i r l ^ fM — ^ « t ^ r c M C M T t - r f e n
f N X ( N
O
„ n
5 X o
CS
o
CS
c
r-CM
-o r-c^
o
X
X
CS
o
• »
o
i n
c
X X
i n
o o
CS
m
CS X X
o
o >c
o o
•o
—
X X
c
X
r̂
CS
o
' t CS
CS en o
o X
en CS en o
CS X
2 CS o
^ 3<
2 S
o<
—
VO
m
t
»
a o
CS
r̂
CN
=
OV ir-,
en CN
X i r ,
a
CS
a >o
X en
a \ 0
X
r-
o X
o o
vC X
r̂ o CN
^ t en
en CM CM CM en
O O rt; en - t o ó ö -^ -^
•^ sq en r-; esj - j VÏ Os - - CM O V i T f TJ- T f w - IT)
t o ^ i S ï a
c
E Os Os sO
t O Tfr tr,
en ^ os X ' t N O N ^ « ^ t t
V ) -<t X en CM X T T v i m
s£>
r-t -
CM en
r r v i
o r* X \C r r V j
CM r-o r-V , V )
V , ©
~ vs 1- t
CN Os — f sO
CMCMfN C » »O t > C O s C r- ~- —
< C 0 U O U i i i . 0 ï P-. ^ ^ J S 2 0 o, O Û : « H D > ^ X > -
c
0
« b c
V )
c
F F ? Q </5
25
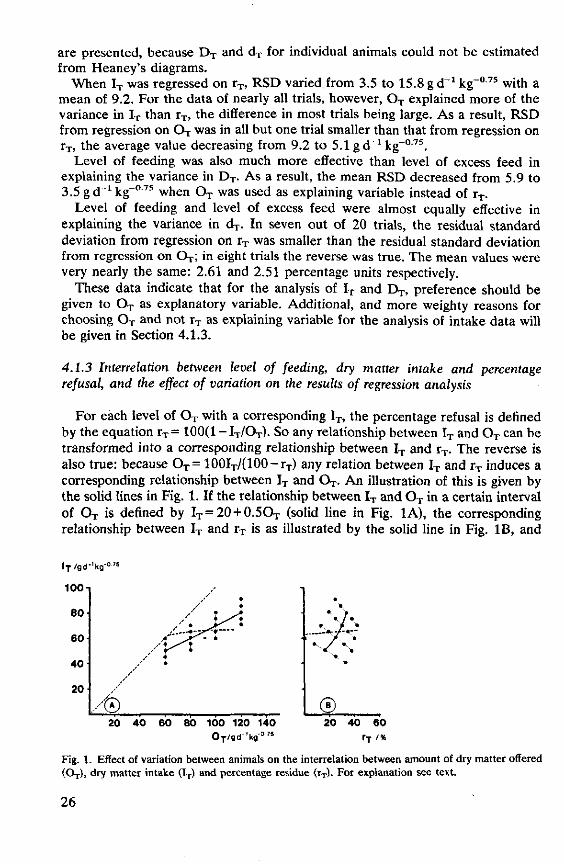
are presented, because D T and dT for individual animals could not be estimated from Heaney's diagrams.
When IT was regressed on rT, RSD varied.from 3.5 to 15.8 g d_1 kg - 0 75 with a mean of 9.2. For the data of nearly all trials, however, O T explained more of the variance in IT than rT, the difference in most trials being large. As a result, RSD from regression on O T was in all but one trial smaller than that from regression on rT, the average value decreasing from 9.2 to 5.1 g d - 1 kg"075 .
Level of feeding was also much more effective than level of excess feed in explaining the variance in DT . As a result, the mean RSD decreased from 5.9 to 3.5 gd~* kg"0 7 5 when O T was used as explaining variable instead of rT.
Level of feeding and level of excess feed were almost equally effective in explaining the variance in dT. In seven out of 20 trials, the residual standard deviation from regression on rT was smaller than the residual standard deviation from regression on O T ; in eight trials the reverse was true. The mean values were very nearly the same: 2.61 and 2.51 percentage units respectively.
These data indicate that for the analysis of IT and DT , preference should be given to O T as explanatory variable. Additional, and more weighty reasons for choosing O T and not rT as explaining variable for the analysis of intake data will be given in Section 4.1.3.
4.1.3 Interrelation between level of feeding, dry matter intake and percentage refusal, and the effect of variation on the results of regression analysis
For each level of O T with a corresponding IT, the percentage refusal is denned by the equation r T = 100 (1 - I T /O T ) . So any relationship between IT and O T can be transformed into a corresponding relationship between IT and rT. The reverse is also true: because O T = 100IT/(100-rT) any relation between IT and rT induces a corresponding relationship between IT and O T . An illustration of this is given by the solid lines in Fig. 1. If the relationship between IT and O T in a certain interval of O T is defined by IT = 20 + 0.5OT (solid line in Fig. 1A), the corresponding relationship between IT and rT is as illustrated by the solid line in Fig. IB, and
l T / 8 d 'kg"0'»
1 0 0 T
8 0
60
40
20
A) 20
,.'
40
• *
60
/ z ' •
è
80 100 120 O-r/gd-'ks
,
140 • 0 . »
• « ft f * / * * / * A - - / - « —
' r * '"*'••• y '"•• ' *.. •
" • ' • .
® 20 40 60
r-r i%
Fig. 1. Effect of variation between animals on the interrelation between amount of dry matter offered (O T ) , dry matter intake (IT) and percentage residue (rT). For explanation see text.
26

vice versa. There is no essential difference between these two curves. Both provide the same information.
If there is no variation in IT within separate levels of O T , i.e. if all the points in Fig. 1A lie on the solid line, they lie also on the solid line in Fig. IB. If so, the same results are obtained by regression of IT on rT, as by regressing IT on O T and transforming the relationship of IT with O T into the corresponding relationship of IT with rT provided that for both an exactly fitting regression model is used. These two approaches do not, however, lead to the same result when IT varies within levels of O T . This may be demonstrated by the following hypothetical example, which is illustrated by the individual points in Fig. 1. If four groups of five animals are offered dry matter at 60, 80, 100 and 120 g d"1 kg -0 '75 and the respective mean consumption per group is 50, 60, 70 and 80gd" 1 kg - 0 7 5 , with individual animals at each level of feeding showing deviations of +10, +5, 0, - 5 and - l O g d " 1 k g - 0 7 5 from the mean, the regression of IT on O T leads to the same relationship as mentioned above: I T =20 + 0.5OT with r = 0.845, and the corresponding relationship of IT to rT is again the solid line in Fig. IB. A different relationship of IT to rT however, is found by regression of IT on rT because at each level of feeding the animal with the higher intake has by definition the lower percentage refusal. This results into a negative correlation between IT and rT
within each level of O T , as indicated by the dotted lines in Fig. IB. So regression of IT on rT no longer leads to a relation similar to that indicated by the solid line in Fig. IB but to the relation IT = 62.9 + 0.082rT with r = 0.066, which is represented by the broken line in Fig. IB. Transformation of this line into the corresponding relationship of IT to O T gives in turn the broken line in Fig. 1A. Thus the regression of IT on rT not only explains much less of the variation in IT
than regression on O T but also suggests that there is hardly any increase in IT with increasing rT or increasing levels of O T . This latter conclusion is not correct because the actual relationship between expected IT and O T is not changed by the variation in IT between individual animals.
The difference in results between the two methods of analysis is entirely due to the variation in IT within each level of O T . Regressing on rT would have led to the same results as regressing on O T if there had been no variation in IT within levels of O T . On the other hand a still greater difference in results would have been obtained if the variation in IT had been greater or if one or two of the extreme levels of O T had been excluded, i.e. when the ratio of residual variation from regression on O T to variation in O T had been greater. When this ratio is large enough, the negative relationship between IT and rT within feeding levels more than offsets the positive relationship between IT and O T and, by transformation of the relationship of IT to rT obtained by direct regression of IT on rT, a negative relation between IT and O T emerges.
Such negative slopes are more likely if the coefficient of regression of IT on O T
is lower. In several of the CIAT trials, IT reached an asymptotic value at higher levels of O T , i.e. the slope of the regression line relating IT to O T was zero. The effect of variation in IT at the same level of O T for this situation is illustrated by Fig. 2: if at each of four levels of O T (70, 90, 110 and 130gd" 1 kg - 0 7 5 ) , there is the same mean IT of 60 gd _ 1 kg"075 , with values for individual animals deviating
27

lT/Bd-'kg-°'s
100-1
80
60
4 0
20
A , 20 40
•]
i' • • •
.' • • ï » — . . • .
60 80 100 120 140 0T /gd-'kg-0 '5
• • •
• • • •
® 20 40 60
tf/%
Fig. 2. Effect of variation between animals on the interrelation between amount of dry matter offered (OT ) , dry matter intake (IT) and percentage residue (rT): a special case. For explanation see text.
from the mean as described above (Fig. 2A), the relationship between IT and O T
is represented by the line IT = 60gd_1 kg - 075 (b = 0, r = 0) which by transformation into the corresponding relationship of IT to rT again gives a horizontal line at IT= 60 gd - 1 kg - 075 with rT ranging from 14 to 54% (solid line in Fig. 2B). The regression of IT on rT, however, gives a line with a negative slope for the relationship of IT to rT and by transformation also for the relationship of IT to O T
(broken lines in Fig. 2). Again both approaches, regression on rT and on OT , lead to the same line if there is no variation in IT at each level of O T but even a small positive variation in IT will lead to a negative relation between IT and rT and by transformation also to a negative relation between IT and O T .
It may be argued that common sense will lead any worker to reject such negative slopes so that he will still arrive at the correct conclusion that there was no effect of varying levels of excess feed on IT. The point is, however, that these negative slopes are not due to random deviations from a horizontal line in Fig. 2B but to systematic effects of random variation within levels of feeding. This random variation has the same effect if the relation between IT and rT is, in fact, positive and the real effect of varying levels of excess feed is then systematically underestimated by the regression of IT on rT without the investigator being aware of it.
That analysis by regression of IT on rT is indeed fatuous may further be demonstrated by the following. In most of the CIAT trials O T explained much more than rT of the variation in IT (Section 4.1.2). This does not mean that the reverse cannot occur. Obviously rT explains more if IT does not change with O T
(Fig. 2). And even if there is a positive relationship between IT and O T as illustrated in Fig. 1, rT explains more if the range of feeding levels is short. In the most extreme case, namely when all animals are offered the same amount of feed, O T explains nothing of the variation in IT but there is a perfect negative relation between IT and rT, i.e. 100% of the variation is explained by rT. This is, however, entirely meaningless because IT is by definition a function of rT within levels of feeding.
28

Differences in IT at the same level of feeding are not only due to real differences in dry matter intake among individual animals but also to errors of measurement. These can be divided into two components: actual weighing errors of feed and refusals, and daily fluctuations in the intake of the individual animal. Dry matter intake is usually expressed in gd_1 or gd"1 kg"075 but it is generally agreed that it should be measured over a period of at least several days because of these daily fluctuations (e.g. Blaxter et al., 1961). Thus, the final figure is the average of a number of different data and it is subject to errors of estimation, even if errors in weighing can be avoided. By regressing IT measured at one level of feeding on rT this variation is fully 'explained' too, and the variation due to this source of error affects the regression of IT on rT in a similar way, as was indicated for the effect of real variation between animals in Figs. 1 and 2.
In discussing the examples of Figs. 1 and 2, I stated that the differences between the results of regression on O T and rT become larger if the variation in IT
within levels of O T increases. The trial of Heaney (1973) on voluntary intake of oat straw (Y in Table 2) demonstrates that regression on rT may also result into entirely misleading conclusions if this variation is small.
By linear regression of IT on rT (the latter ranging from 1 to 32%, with a mean of 14%), Heaney arrived at the conclusion that for oat straw IT was related to rT
by the equation IT=24 + 0.23rT 0^ = 0.05). Very nearly the same relation was found when the data estimated from his diagrams were reanalysed: IT = 24.9 + 0.250rT ( r ^ 0.055). When these IT data were related to 0T , however, all but two points proved to be very close to the line IT= 0.87OT (Fig. 3A). Only the intake of the two animals on the highest level of feeding ( 0 T >47gd _ 1 kg-075) tended to deviate from this line.
According to Heaney's analysis, the voluntary intake of this feed could be estimated at 28gd - 1 kg - 075 with only a very slight effect of the level of excess feed (broken line in Fig. 3B). The above relation between IT and O T means, however, that at all levels of feeding between 17 and 47 g d"1 kg_07S an average of 13% of the offered feed was refused. This leads by transformation not to a nearly horizontal line in Fig. 3B but instead to a perfectly vertical line at
l -T /Sd- 'kg - 0 7 5
y.0.87x
40
20
* • r ^ * *
* - i * ' . * * *
. * *
20 40 60 10 20 30
0 T / g d - ' k g 0 7 5 rT /
Fig. 3. Relationship between dry matter intake (IT) and amount of dry matter offered (OT ) , and the corresponding relationship between IT and the percentage refusal (rT) of oat straw. Solid lines based on regression of IT on O T ; broken lines on the regression of IT on rT. Data from Heaney, 1973.
29

rT= 13%, indicating that IT varied from 15 to 41 gd_1 kg - 075 without any change in rT. With O T ranging from 17 to 47gd - 1 kg"075, some animals refused as little as 1% and others as much as 23% of the offered feed. This variation was, however, entirely due to scatter of IT from the expected mean of 0.87OT and not at all to changes in level of feeding: O T explained only 2.6% of the total variance in rT. So apart from two observations at feeding levels higher than 47 g d_1 kg-0'75
no information was obtained about IT at levels of O T that led to an average percentage refusal of more than 13. The plotted data indicate clearly that with this forage an average of more than 13% refusal will only be found at levels of feeding higher than 47gd_1kg~075 and that IT will then be at least 40gd_ 1 kg - 075 and perhaps considerably more than that (Fig. 3A).
The conclusion that at feeding levels below 47 g d -1 kg~° 75 IT was related to O T
by a straight line through the origin is noteworthy because it indicates that a certain fraction (13%) of the forage was completely unacceptable. The regression of IT on rT did not even suggest that. Regression on OT , however, not only indicated clearly that a certain fraction of the forage was unacceptable but also provided a means of estimating the size of this fraction.
4.1.4 Summary and discussion
Dry matter intake data should be analysed by regression on O T and not by regression on rT. Since O T as a rule explains much more of the variation in IT than does r r, O T should be taken as the explanatory variable. A more weighty reason for choosing O T is the fact that no valid estimate can be obtained for the effect of level of excess feed on IT by direct regression of IT on rT. The least-squares approximation of IT on rT does not lend itself to a meaningful interpretation because the real effect of level of feeding and consequently of level of excess feed on IT is confounded with the variation in IT within feeding levels. So the actual effects are systematically underestimated. Only the degree to which this occurs varies with the ratio of residual variation from regression on O T to variation in O T . When IT is related to O T by a straight line through the origin, even small random deviations from that line lead to entirely false conclusions. By modifying the same examples, it can easily be shown that the discrepancy between the results of regressing IT on O T and those of regressing IT on the level of excess feed is even larger if the latter is expressed as a percentage of intake. If the level of excess feed is expressed as an absolute amount (gd_1 kg -075), the discrepancy between the two methods of analysis is generally smaller but the effect of varying levels of excess feed on IT is still systematically underestimated due to the same effects of variation in IT within levels of O T as were shown in Figs. 1 and 2.
Also when DT was the variable to be explained, O T proved to be much more effective in doing so than rT. This was to be expected because DT is defined by subtracting the dry matter in the faeces (FT) from IT: DT = I T -F T . The amount of faecal dry matter may, to some extent, vary independently of variations in IT but the plotted data (Chapter 5) demonstrate that a higher than expected DT at a certain level of O T is in most cases accompanied by a higher than expected IT, i.e. the higher than expected DT is found if rT is lower than expected. This means that
30

random variations in IT within levels of O T not only cause a negative relationship between IT and rT, but also between DT and rT, although in the latter case less than perfect. So direct regression on rT will also result in a systematic underestimation of the effect of level of excess feed on DT. The same is to be expected for all other measures that include IT as a factor such as intake of crude protein and intake of various morphological components of the forage. Hence, all these data should be analysed by regression on O T and not by direct regression on rT.
It is thus evident that regression of IT and DT on O T is sensible whereas regression on rT is not, but this is not necessarily true for dT and other variables related to the quality or composition of ingested material. On average, higher levels of O T lead to higher percentages refusal and therefore to greater possibilities of selection. Consequently the quality of the ingested material may be expected to increase with O T . But if no selection for material of higher digestibility occurs, dT may instead decrease at the higher levels of O T as a result of higher intake. Thus if IT is related to 0T , it is of interest to study also the effect of O T on dT. On the other hand, if two animals are offered the same amount of feed and the one eats 75% of it and the other 90%, it may be expected that the first animal selects a diet of better quality. Therefore also the regression of dT on rT is of interest. Dry matter digestibility is defined as 100(IT-FT)/IT. Any variation in IT
at one level of O T affects both the numerator and the denominator in the same direction. Therefore, systematic effects of this variation are less likely to influence the relationship of dT to rT. Also, the results of regression of dT on O T and on rT
did not indicate any comparative advantage of either of these explanatory variables. So little, if anything, can be gained by establishing the relationship between dT and rT in the indirect way necessary when IT or DT are the variables to be explained.
4.2 Regression models
4.2.1 Dry matter intake
4.2.1.1 Introduction
In the initial analysis of the data, a number of strictly empirical regression models, e.g. of the form y = a + bx + ex2 and y = a + blnx, were used to study the relationship between IT(y) and OT(X). No difficulties were experienced in finding for each set of data a model which gave an apparently good description of the relationship. In several trials, however, the best-fitting model led by further interpretation to conclusions that were unacceptable. Fig. 4 shows the results of a feeding trial with Stylosanthes guianensis (I in Table 2) as an example. The regression line with the equation y = -37.5 + 1.99x-0.0087x2 (R2 = 0.927; RSD = 3.4gd_1kg"07S) gives at first sight a good description of the data. One immediately apparent shortcoming of this line is, however, that it reaches a maximum somewhere within the range of the data and thereafter decreases, suggesting that the intake of this forage decreases when more than 114gd_1 kg - 075 is offered. A second shortcoming of this curve is less obvious
31

iT/gd-'kg-0'5
80-1
6 0
4 0
20
20 40 6 0 80 100 120 140 160 O j / g d - V 0 ' 4
Fig. 4. Relationship between dry matter intake (I,) and amount of dry matter offered ( O T ) of Slylosanthes guianenis (Forage I): example of apparently well fitting curve that must, however, be rejected because of erratic behaviour.
80-J
60
4 0
20
Ix/gd'kg'1
80
60
40
20
® 20 40 60 80 100 120 140
0T /9<l ' 'kg'0 '5 20 4 0 60
Fig. 5. Relationship between percentage residue (rT) and amount of dry matter offered ( O T ) , and between dry matter intake (IT) and rT, corresponding to the relationship between IT and O T in Fig. 4.
from Fig. 4, but just as important: its behaviour at the lower ranges of O T . As was noted before, any line describing the relationship between IT and O T establishes a corresponding relationship between IT and rT. Similarly it induces a relationship between rT and O T . Lines describing these relationships derived from the above relationship between IT and O T are given in Fig. 5. Fig. 5A suggests that at a feeding level (OT ) of 55 gd - 1 kg"075 a higher percentage of this feed is rejected than at a feeding level of 70 g d_1 kg -0 75. And Fig. 5B suggests that at rT between 16 and 19% two estimates of IT can be obtained: at 19% residue, of 42 and 66gd_ I kg -075 , respectively. Obviously, such results are unacceptable as a descriptive characteristic of any forage. And because the lines in Fig. 5 are the only relationships of rT to O T and IT to rT corresponding with the relationship of IT to O T given in Fig. 4, the latter must itself be rejected.
The erratic behaviour of the curve in Fig. 4 may in part be attributed to experimental error and to using different animals to estimate IT at various levels of O T , so that variation in voluntary intake between animals and other sources of experimental error could obscure the real relationship of IT to O T for the forage.
32

The disturbing effect of these sources of variation can be reduced by using a larger number of animals so that a more precise estimate of expected intake at each level of feeding is obtained. However, even when a precise estimate of the expected intake at all levels of feeding is obtained erratic behaviour of regression lines will occur if the regression model itself is not of a suitable type. To avoid erratic behaviour of regression lines, I attempted to formulate the requirements for a suitable family of models. Such models should be flexible enough to describe the relationship of IT to O T for a wide range of feeds and at the same time have the necessary inherent restrictions to protect against erratic behaviour.
4.2.1.2 Required characteristics of regression models
The required flexibility is illustrated in Fig. 6. If one offers an animal a homogeneous feed, i.e. a feed from which it cannot select, in ever-increasing amounts starting from zero, one may expect that the animal eats all that is offered until the amount offered exceeds the maximum intake (m) of that particular feed. From that point on, consumption may be assumed to be maintained at that level. The expected relationship between IT(y) and OT(X) for such a situation is given by the solid line in Fig. 6A. It is defined by y = x for x=ïm and y = m for x>m. If a group of animals is used to measure the intake at various levels of feeding, the abrupt change from the y = x response to y = m at x = m will be smoothed off because animals that would consume more than the average (m) at high levels of feeding cannot express this higher consumption when the amount of feed offered is at this level or only slightly higher. And only if feeding levels are so much below this critical value that individuals with the lowest voluntary intake will consume all
x . m / p
Fig. 6. Possible relationships between dry matter intake (IT) and amount of dry matter offered (OT ) . A: relationship for homogeneous feed. B, C and D: possible relationships if animals can select between different components of the feed. For explanation see text.
33
will the response line indeed be y = x (Justesen & Kuiper, 1962; Curnow, 1973). It is, nevertheless, evident that a regression model describing the relation between IT and O T must be of such a nature that it can follow the y = x line over a wide range of x and then change rather abruptly, but smoothly, to a horizontal line.
Many forages are eaten selectively. As will be shown in Chapter 5, sheep select effectively between leaves and stems and if sufficient forage is offered the animals often tend to eat leaves only. The maximum intake (m) at high levels of feeding is then determined by the characteristics of the leaves rather than of the whole forage. At lower levels of feeding, however, the amount of leaves will not be sufficient to cover this maximum intake and stems will have to be eaten in addition to the leaves. As a result total feed intake may be less than m even though the total amount of feed offered is not. At feeding levels well below m, however, the whole amount offered may be eaten again. (Possible reasons for this pattern of response will be discussed in Section 6.2.) In such situations, the relationship between IT and O T may be as illustrated in Fig. 6B: again y = x for low levels of feeding and y = m for high levels of feeding. But rather than an abrupt change from the y = x line to the y = m line, the transition is smooth because IT is less than O T at levels of feeding somewhat below m and is also less than m at a range of feeding levels above m. Thus, even though no part of the feed is entirely unacceptable, IT is depressed at 0 T = m. The extent of this depression may vary, as is illustrated by the three lines a, b and c in Fig. 6B.
A different type of relationship between IT and O T may again be expected if only a fraction p < l of the feed is acceptable and the remainder completely unacceptable. Assuming that the consumption of the acceptable part is not affected by the presence of the unacceptable fraction and that the acceptable part itself is eaten unselectively the relationship of IT to O T would be expected to be as illustrated in Fig. 6C: y = px for xs£m/p and y = m for x>m/p, with the same effects as above due to variation between animals at the critical level of feeding, in this case x = m/p. To describe this pattern of response the regression model must follow the y = px line over a long interval of x and change rather abruptly to a horizontal m at x = m/p.
A fourth type of response pattern is illustrated in Fig. 6D. It represents the situation where the acceptable part p of the feed is eaten selectively so that the intake is again to a smaller or larger extent depressed at the critical level of feeding (x = m/p).
While considering the necessary restrictions for a regression model describing the relationship between IT(y) and OT(X), both expressed in the same units, let us assume that the domain includes all values equal to or larger than zero: xS^O. Dry matter intake can never be negative, so a first restriction is that also the range can only include values equal to or larger than zero, i.e. y>0 for all xs*0. However a number of further restrictions must be made. One of these is immediately evident: when no feed is offered, intake must be zero; therefore the regression line must pass through the origin: y = 0 if x = 0. Secondly, it is obvious that IT can never be larger than 0T , or than pOT (p< 1) if only the fraction p of the feed is acceptable: y^px. When starting from zero, ever increasing amounts of feed are offered, IT
34

can be expected to rise but only until it reaches a certain maximum, i.e. the regression model should be of a monotone increasing type, which approaches a plateau at higher values of x. Moreover, the response in IT for a given increase in O T can as a rule be expected to decrease at successive increments in OT . Only as an extreme could it be expected to remain constant over a certain interval of O T . That means that the first derivative of the function (y') should be monotone decreasing and approach a minimum of zero at higher values of x. This, in combination with the requirements that y=£px and y = 0 if x = 0 leads to the requirement that y' should have a maximum p at x = 0. A last requirement follows from the observation that it would not be logical to expect that if more feed were offered the fraction that was eaten would increase. It would rather be expected to decrease or at most remain the same. This may be stated in another way, namely that if at an arbitrary feeding level x an amount y be consumed so that the fraction which is consumed is equal to y/x, the proportion of any additional amount offered that is consumed will be either equal to y/x or smaller than that. So the first derivative of the function describing the relationship between IT and O T must at any value of x be equal to or smaller than y/x: y's£y/x.
4.2.1.3 Example of an unsuitable model reported in the literature
Gibb & Treacher (1976) used the function y = ea~b/x in a study on the relationship between forage intake (y) and amount of forage available (x) for grazing animals. This equation implies a monotone increasing function through the origin and an asymptote y = ea. When y and x are expressed in different units such as kgd~' and kg ha"1, as is often done in studies on grazing animals, these are indeed the only restrictions that must be imposed and this function might then be suitable. However Gibb & Treacher (1976) also expressed both variables in the same units (gd_1 kg-1). If that is done, the above function is no longer suitable. Though it leads to the logical fact that y = 0 when x = 0, it can lead to entirely unacceptable conclusions in a rather wide interval of x, because it does not have the restriction y=£x and y'*sy/x for x>0. The first derivative of this equation equals by/x2, which will be larger than y/x for all values of x<b. When x approaches zero, the first derivative will approach infinity, i.e. the regression line will at that point be vertical, rather than have a maximum slope of 1. So estimates for y might be larger than x for a considerable interval of positive values of x. In the study of Gibb & Treacher (1976), estimates of y were sometimes larger than x even within the range of experimental data.
4.2.1.4 A suitable regression model
The regression model finally chosen to describe the relationship between IT(y) and OT(X) is of the form
y = m{l-e-(px/m)h}1/h with m>0, h > 0 , 0 < p « l (3)
in which
35

m is the upper limit (asymptote) for y p is the fraction of the forage which may be considered edible or acceptable h is a shape parameter, such that y at the critical level of feeding x = m/p
equals m( l -e _ 1 ) , / h .
Low values of h correspond to a large depression of y at x = m/p, in other words, they indicate that there is a large difference between different components of the feed and that the animal can distinguish between these. High values of h indicate only a slight depression of IT at the critical level of feeding; in other words, they indicate that as far as can be judged from the relationship of IT to 0T , the feed, or the acceptable fraction p of it, can be considered homogeneous.
With X = (px/m)h and Y = (y/m)h Equation 3 may be rewritten as
Y = l - e x
so that
Y<X if X>0
or
y<px if x>0 (3.1)
and
Y goes to X when X goes to zero
or
y goes to px when x goes to zero. (3.2)
Moreover, Equation 3 satisfies
y' = {X/(eX-l)}(y/x)
so that
y'<y/x if X>0
or
y'<y/x if x>0 (3.3)
and
y' goes to y/x when x goes to zero (3.4)
In summary, the following relationships between x, and y, y' and y'liy/x) prevail:
y y' y'/(y/x)
x-*0 x>0 X-»oo
— px <px —»m
-*P <P — 0
-*1 < 1 ->0
36

Thus, Equation 3 has the necessary flexibility to describe the various types of relationships illustrated in Fig. 6, and satisfies the restrictions described in Section 4.2.1.2.
4.2.1.5 Effect of limited range of data
Each of the three parameters in Equation 3 has a clear interpretation of its own (Section 4.2.1.4). Thus, although three parameters are needed to establish the relationship between IT and OT , differences between the curves for various forages may be caused by differences in maximum intake at high levels of feeding (different m), differences in the size of the acceptable fraction (different p) or differences in what I referred to as homogeneity of the acceptable fraction (different h), or any combination of these.
In the majority of the CIAT trials, however, IT did not reach an asymptote within the range of the data but continued to rise until the highest level of feeding. In some trials, the response was even linear over the whole range of data. Regression Model 3 could even then be fitted to the data but the resulting value of the parameter m is of course highly inaccurate, although that inaccuracy is not necessarily reflected in a large standard error of estimate. The estimate of the parameter h becomes inaccurate too under such conditions. All the same, Regression Model 3 remains attractive because it still satisfies the required restrictions.
4.2.1.6 Goodness of fit of the suggested regression model
Though Regression Model 3 has considerable flexibility, only one parameter (h) remains to describe the shape of the curve at the intermediate levels of feeding when both the maximum intake (m) and the size of the acceptable fraction of the forage (p) are defined. One may therefore ask whether the suggested model is perhaps too stringent. To answer this question, a comparison was made between estimates of RSD from regression obtained with this model and those with logarithmic and polynomial models (Model 2 in Section 4.1.2.1). The mean RSD obtained with Model 3 was 5.1 g d -1 kg -01S, which is only slightly larger than that obtained with Model 2: 4.8gd"1 kg"075. Moreover, for 14 out of 25 sets of data Model 2 showed erratic behaviour within the range of the data as described in Section 4.2.1.1, so that the RSD obtained with this model must be an underestimate of the actual variance. This comparison of RSD supports the conclusion that Equation 3 is a suitable model for the relationship of IT to O T .
4.2.2 Intake of morphological components of the forages
With most feeds, the animals distinguished only between two morphological components: (1) stems; (2) leaves (including petioles) or leaves + inflorescence (or seed heads). The consumption of leaves and inflorescence tended to follow a straight line through the origin at lower levels of feeding and level off at higher levels of feeding, in some trials approaching an asymptote. Thus, the intake of
37

these fractions could in most trials be described with the same Model 3 as was used for IT, with p set at a value equal to the proportion of leaves + inflorescence in the forage. In one trial, the relationship was linear. The relationship of intake of stems with O T was more variable. Because intake of stems by definition equals IT minus the intake of leaves and inflorescence no attempt was made to fit curves to stem consumption by least squares. Curves representing the difference between those for total dry matter intake and intake of leaves + inflorescence were used instead.
With some forages, especially grasses, the situation was slightly more complicated because animals apparently distinguished between three rather than two components in the feed. Where this occurred, curves of, for instance, intake of leaf blades and leaf sheaths were fitted by least squares and again the curve for stem consumption was established by taking differences.
4.2.3 Intake of digestible dry matter
Data on the intake of digestible dry matter (DT) were also analysed with Regression Model 3. Although a linear or nearly linear response of IT to O T
together with a rise in dry matter digestibility could theoretically lead to a convex downward relationship between DT and O T the data did not in any trial suggest such a relationship. Visual inspection of the plotted data revealed that these corresponded in all trials to a concave downward curve.
On logical grounds also for the relationship of DT to 0T , y can never be larger than x, so that again the parameter p should not be greater than 1. In fact, DT will always be a fraction of 0T , so that an upper limit smaller than 1 for the parameter p may be suggested. However, the choice of this limit would be rather arbitrary. As setting narrower limits to the parameters leads to less flexibility of the model as a whole, the upper limit of p was also for DT maintained at 1. No strict physical meaning can be attached to the parameters p and h when Equation 3 is used to describe the relationship of DT to O T . The parameter m can be considered as an estimate of the maximum intake of digestible dry matter, but again the estimate is only reliable if the asymptote is in fact approached within the range of the data.
4.2.4 Other data
Though a number of restrictions can be imposed on regression models describing the relationship between IT and O T on logical grounds, no such restrictions can be defined for relationships such as that between dry matter digestibility (dT) and O T or rT. For these and other similar relationships, polynomial regression models were therefore used, starting with a linear model and adding higher degree terms only when these were found to be statistically significant (P<0.05).
4.3 Introduction of weightings
Variation in IT between animals will be noticeable when large amounts of feed are offered but is suppressed at low levels of feeding where all animals tend to eat
38

the full amount of feed offered (Section 4.2.1.2). So the variation in the data is not constant but increases with the level of feeding. In most trials all individual animals were at different feeding levels. So no exact data on the variation between animals could be obtained. However, an approximation could be obtained by studying the differences (residuals) between observed intakes of dry matter and expected values estimated by regression analysis. These data supported the suggestion that variation increased with feeding levels. However, once a level of feeding is reached where intake equals the plateau value, the variation between animals is likely to be constant: no further increase in variation can be expected when the feeding level rises beyond that level. For this reason, the data were weighted proportionally to the reciprocal of the squared dependent variable as estimated from regression analysis. To do this an iterative procedure was used in fitting the curves. In the first round, all values were given the same weight. In the second round a weight proportional to the squared reciprocal of the estimate based on the first analysis was given to each value of y, and so on, until the process stabilized. This method of weighting was used for the final analysis of data on IT, DT and intake of morphological components of the forages. As a result, all residuals of intake data are expressed as a fraction of the estimated intake, rather than as absolute figures. These weighted residuals will be referred to as residual coefficient of variation (RCV).
For data on the quality or composition of the consumed material, such as digestibility and crude protein content, no such weighting of errors was introduced and residuals are reported in absolute values (residual standard deviation, RSD).
39

5 Results
This chapter summarizes the results of the trials for each group of related forages. The following groups are distinguished:
A-C: Styhsanthes guianensis, 1973 series D-G: Stylosanthes guianensis, 1974 series H-J: The same as forages D-F but chopped K-M: Threshed tops of Stylosanthes guianensis N-O: Desmodium distortum P-Q: Centrosema pubescens R-S: Grasses (Brachiaria tnutica and Brachiaria decumbens) T-X: Data from the literature
After providing information on the morphological and chemical composition of the forages, the results of the feeding trials are presented in the form of scatter diagrams and regression lines.
In a first block of diagrams (e.g. Fig. 7), the effect of level of feeding (OT ) on the following variables is shown:
Diagram 1: total dry matter intake (IT) and intake of dry matter from two or more morphological components (IF)
Diagram 2: for each of the morphological components, the relative intake, i.e. the amount consumed as a fraction of the amount offered (iF)
Diagram 3: intake of digestible dry matter (Dr) Diagram 4: apparent digestibility of dry matter (dT). The left column of diagrams in Fig. 7 (marked A1-A4) presents these results
for Forage A, the middle column (B1-B4) for Forage B, and so forth. Similarly, the same data for Forages D-G are presented in Fig. 9. Individual diagrams within these blocks will be referred to as, for instance, Fig. 7A1, whole columns as Fig. 7A1-4 and rows, showing the same data for different forages within a group as Fig. 7A1-C1.
Curves relating IT, DT and the intake of one morphological fraction as well as dT, to O T are based on least squares while others have been constructed by taking differences (Section 4.2.2) or, in the case of iF, by taking fractions. In the blocks of diagrams the least squares curves are drawn as solid lines, the others as broken lines. Statistical details of the curves relating IT, IF and DT to O T are, for all forages, given in Tables 10, 11 and 12, respectively, at the end of this chapter (p. 65-67). Similarly, statistical details of the curves relating dT to O T are given in Table 13 (p. 68).
A second figure for each group of forages (e.g. Fig. 8) shows the effect of level
40

of excess feed on IT and DT. For reasons explained in Section 4.1 these curves were not established by direct regression of IT and DT on rT but indirectly by transformation of the relationships of IT to O T and DT to OT .
The relation between dT and rT is not shown in the figures but regression equations for all forages are given in Table 14 (p. 69). Regression equations relating the DCP content of the consumed dry matter to rT are given in Table 15 (p. 70).
5.1 Stylosanthes guianensis -1973 series
A first series of trials with green unchopped S. guianensis was run in 1973. The stylo had been sown in February 1973 and forages of three stages of maturity were used for the feeding trials: 3-months regrowth (A), 5-months first growth (B) and 8-months first growth (C). The contents of morphological components, CP and ash in the whole plant and of CP and ash in the morphological components are given in Table 4. The 3-months regrowth and 5-months first growth contained 48.9 and 39.6% leaves, respectively, the remainder being stems. The 8-months first growth contained nearly the same content of stems as the 5-months first
Table 4. Morphological composition, and crude protein and ash content of Stylosanthes guianensis used in the 1973 trials. All data in percent of dry matter, ±SE.
Forage
Stage of maturity
Morphological composition leaves inflorescence stems
Crude protein in leaves in inflorescence in stems in whole plant* in whole plantb
Ash in leaves in inflorescence in stems in whole plant* in whole plantb
A
3 months regrowth
48.9e
— 51.1e
19.4d
9.1d
14.2±0.4 14.1
10.8d
7.5d
9.2±0.1 9.1
B
5 months first growth
39.6±0.9 —
60.4 ±0.9
19.2d
9.6d
10.8d
13.4
10.3d
7.0d
9.0d
8.3
C
8 months first growth
25.3±0.1 16.0±1.6 58.7±1.7
17.2±0.2 16.9±0.3 8.0±0.2
11.1±0.3 11.7
9.2±0.2 7.8±0.1 6.4±0.1 7.5±0.2 7.3
a. Estimated in separate sample. b. Calculated from data on morphological components. c. Mean of three samples; only the mean was recorded. d. One sample only.
41

growth but the remainder was divided between 25.3% leaves and 16.0% inflorescence. The data on content of CP and ash must be interpreted with some reserve because sometimes only one sample was taken and analysed. The data indicate, however, that the CP and ash contents of the leaves were not very different for the older and the younger material (for all forages CP 17.2-19.4% and ash 9.2-10.8%). Content of CP in inflorescence of forage C was nearly as high as in leaves, but at all stages of maturity it was much lower in stems than in leaves. Differences in the CP content of the whole plant were largely due to differences in the morphological composition, especially the content of stems in the plant, rather than to differences in the CP content of any fraction.
Detailed results of the feeding trials are shown in Fig. 7. When Equation 3 was fitted to the IT data and the parameter p allowed to assume all values =sl, the estimates 0.996, 1 and 1 were obtained for Forages A, B and C, respectively. With all three forages, the smallest RCV was obtained when p was fixed at 1 because the same or only slightly higher sum of squares was then divided by the degrees of freedom of n - 2 instead of n - 3 . This indicates that at low levels of feeding, animals would accept 100% of all three forages: no part of these forages was entirely unacceptable.
The upper limit (m) of the IT curve was estimated at 72.4, 69.4 and 71.7 g d~' kg -075, respectively, for Forages A, B and C. The curves for Forages B and C did not reach their maximum within the range of the data but the discrepancies were small (Table 10, compare Columns 5 and 11) and the values actually reached support the conclusion that the maximum intake of the older stylo (C) was as high as of the younger forages. The curves for Forages A and B approached their maximum, however, at a lower level of feeding than the curve for Forage C. In other words, intake of Forage C was lower than that of Forages A and B at intermediate levels of feeding. This is reflected in the parameter h (Table 10), which indicates that, at 0 T = m/p, IT of Forages A and B reached 90 and 87%, respectively, of their maximum (Table 10, Column 12) whereas that of Forage C reached 75% of its maximum. In other words, the animals refused 10, 13 and 25%, respectively, of Forages A, B and C when O T was just high enough to cover maximum IT. At OT = 70 gd_1 kg - 075 (for all forages about equal to m/p), the animals on all three forages ate 100% of the offered leaves or, for Forage C, leaves and inflorescence. Thus the refusals at that level of O T corresponded to 20,21 and 43% of the offered stem. Forage B contained as much stem as Forage C but the animals were apparently more reluctant to eat the more mature stems of the older forage. At high levels of feeding, intake of Forage C could rise to the same levels as that of the other forages because the higher intake could then be covered by a much larger amount of leaves and inflorescence.
The selection against stems is clearly demonstrated by Fig. 7. Fig. 7A1 shows that the animals on Forage A at the lower levels of feeding consumed about equal amounts of leaves and stems, in the proportion of the mass fractions in the offered forage, 48.9 and 51.1%, respectively. With increasing levels of 0T , intake of leaves (IL) increased linearly until O T equalled 100 gd_1 kg - 075 and above that deviated only slightly from linearity. Intake of stems (Is), however, increased only
42

• a
I F / %
100
80
60
40
20
0
3j*-~-—-y °«
la
o \ o o 's o
- -Kr-»»-••"-*-•
e
B2
._ . . . *
8».. *. o »-. e
C2
D T / Q d - ' k g 0 7 5
60
40
20 (A3)
o Ba
dT/%
701
60
50-I
40 © O
50 100 1 r-
150 0 50 100 150 0 50 100 O-r/gd-'kg'0
- 1 150
Fig. 7. Effect of level of feeding (C4.) on the results of intake and digestibility trials with Stylosanthes guianensis (Forages A-C). IT, dry matter intake (total); IF, intake of dry matter of morphological components; iF, relative intake of morphological components; DT> intake of digestible dry matter; dT, dry matter digestibility. F is the general symbol for morphological components as defined in list of symbols.
slightly with O T until it reached a maximum at a level of feeding of about 70 g d_1 kg -075, and thereafter decreased. A similar pattern for selection between leaves, or leaves plus inflorescence, and stems is evident for Forages B and C. For Forage C, no evidence was found for selection between leaves and inflorescence so that the consumption of the two components could be described by one line (Iu). Thus with increasing O T , a large decrease in the content of stems in the consumed dry matter was found although the lines tended to level off at the
43

highest levels of feeding. With a large difference in content of CP and digestibility of leaves + inflorescence and stems, the reduced percentage stem in IT at higher levels of O T could account for a considerable increase in the quality of the ingested material with increase in level of feeding. A further contribution to this may be expected from the sharp decrease in the relative intake of stems (is) from 80 to 100% on the lowest levels of feeding to only about 25% at the highest levels of feeding (Figs. 7A2-C2). Thus selection between stem fractions could have added to the effect of selection between leaves and inflorescence on the one hand and stems on the other hand. That selection between stems did indeed occur is demonstrated by the lower CP content in the refused feed by all but one of the 36 animals, not only than in the offered feed as a whole, but also than in the stems of the offered feed. Fig. 7A1 shows that while I r of Forage A reached its asymptote at a level of feeding of approximately lOOgd-1 kg -075, the replacement of stems by leaves continued beyond that level of feeding. The same was observed for Forage B, and to a lesser extent for Forage C. Thus the level of feeding at which I r reached its maximum was not necessarily the level of feeding at which the digestibility and CP or DCP content of consumed dry matter stabilized. Fig. 7A4-C4 shows that dT of all three forages increased with O r , despite a likely negative effect of the higher intake of dry matter at the higher levels of feeding. The increases in dT of all three forages were statistically significant (P<0.01) (Table 13) and of large magnitude: about 8-10 percentage units.
The curves describing the relation between IT and O r intersect the line
I t * D T /gd 'kg ° ' 5
100T
80
60
40
20 7 /
0 20 40 60 rT /%
Fig. 8. Effect of level of excess feed (rT) on intake of dry matter (IT) and on intake of digestible dry matter (DT) of Stylosanthes guianensis (Forages A-C). Solid lines, I
44
y = 0.85x at O T = 81, 73 and 48, respectively, for Forages A, B and C, indicating that at these levels of feeding 15% of the offered dry matter was refused. The corresponding IT is 69, 62 and 41 gd_1 kg-0'75, respectively. For Forages A and B, this is 95 and 89% of the highest estimate of IT within the range of the data and for Forage C only 59%. The DT (Fig. 7A3-C3 and Table 12) reached 42, 35 and 23 gd"1 kg"075, respectively, at the same levels of O T or 89, 79 and 53% of the highest estimate within the range of the data. Thus, levels of feeding giving a residue of 15% always gave values for IT and DT below maximum, the differences being larger for the more mature forage and larger for DT than for IT for all forages.
Fig. 8 gives the relationship of IT and DT to rT over the whole range of data. The IT for Forage A levelled off at about rT= 15% but DT increased with rT until this reached a value of more than 20%. For Forage B, DT increased until rT
exceeded 30% and both IT and DT of Forage C were still increasing at rT = 50%. Regression equations relating dT to rT are given in Table 14. Increases in dT
with rT were for all three forages statistically significant. Content of DCP in the consumed dry matter of Forage A increased linearly from 9.9% at rT = 0 to 13.4% at rT = 45%. For Forage C, it increased linearly from about 10.2% at rT = 30 to 13.4% at rT=60% (regression equations in Table 15). The relative increases in DCP content were larger than those in dT. Thus the effect of level of excess feed on intake of DCP was even larger than the effect of rT on DT.
5.2 Stylosanthes guianensis - 197'4 series
In 1974, some more trials were run with S. guianensis. The forage was harvested from a field sown in March 1974. Three cuts were of similar maturity to the stylo used in 1973: 2-months regrowth (D), 5-months first growth (E), and 7-months first growth (F). Also a more mature cut of 9-months first growth (G) was included. Data on morphological and chemical composition are given in Table 5. Forage G was not analysed for CP and ash in the morphological fractions but data were available for material harvested at 8 months. The 2-months regrowth had a higher content of CP in both the leaves and the stems than the other forages. The leaves of the first growth cut at 7 and 8 months contained however as much or even slightly more CP than the first growth cut at 5 months. The major difference between these three forages was the changing morphological composition with stage of maturity.
Forages D, E and F were offered as long forage or chopped. The results of feeding trials with the chopped materials will be discussed in Section 5.3.
The parameters in Equation 3 relating IT to O T are given in Table 10. With none of the four forages was there any evidence that the offered dry matter would not be entirely consumed at low levels of feeding (p = 1 for all forages) and a low value for the parameter h was found together with high estimates for the parameter m, which had large errors of estimate. These data indicate that feeding levels had not been high enough to attain maximum IT. Further evidence for this is that IT did not reach the asymptote within the range of the data and that the
45

l T » l F / g d ' k g - 0 7 s
1001
80
60
40
201
0 / E t )
lp /%
100-
80
60
40 1
20
0
* - - 0 i , Ô"»-,
©
D j ' g d ' k Q " '
60
40
20
0
6ji\
70
60
50
40 D4
50 100 150 0
E. \ ® 50 100 150 0 50 100 150
Fig. 9. Effect of level of feeding (OT ) on the results of intake and digestibility trials with Stylosanthes guianensis (Forages D-G). For explanation of symbols see Fig. 7.
discrepancies were large. The same was observed for DT (Table 12) except for Forage G, for which the curve levelled off within the range of the data. This may, however, also be due to the scatter of the data at the higher levels of O T (Fig. 9G3).
The plotted data in Fig. 9D2-G2 show that also in these trials animals sharply selected between leaves or leaves + inflorescence and stems and for Forages D, E and F the CP content of the refused dry matter was again for all individual animals lower than that of the offered stem, indicating that all animals had also selected between stem parts. In this series of trials too, dT increased at the higher levels of feeding (Fig. 9D4-G4; Table 13), although this increase was not
46

-•*-
• * , 0 * . p
©
100 150 O-r/ad-'kg'0'5
statistically significant for Forage F, for which only 5 observations on DT and dT
were available. Fig. 10 shows that IT and DT of all four forages responded sharply to level of
excess feed, even more so than in the 1973 trials. It is quite evident that both IT
and DT of these forages lend themselves only for a meaningful interpretation when the level of feeding or excess feed is well defined.
The effect of increasing rT on dT was more variable than in the 1973 trials and only statistically significant for Forages D and E (Table 14). However the regression equations show that, within the range of the data, dT of Forages D, E and G increased by 8-10 percentage units and that of Forage F by 5%. Increases in the DCP content of the consumed dry matter were in all cases statistically
47

Table 5. Morphological composition, and crude protein and ash content of Stylosanthes guianensis used in the 1974 trials. All data in percent of dry matter, ±SE.
Forage
Stage of maturity
Morphological composition leaves inflorescence stems
Crude protein in leaves in inflorescence in stems in whole plant" in whole plantb
Ash in leaves in inflorescence in stems in whole plant* in whole plantb
D & H
2 months regrowth
39.7±1.07 2.2±0.33
58.1 ±0.90
20.7 ±0.48 17.1±0.15 9.1
12.6±0.31 13.9
9.9±0.04 8.6±0.20 8.4 9.7±0.11 9.0
a. Estimated in separate sample. b. Calculated from data on morphological
E & I
5 months first growth
38.1±2.18 —
61.9±2.18
16.7±0.26
7.9±0.16 11.2±0.16 11.3
9.8±0.07
6.7±0.35 8.6±0.21 7.9
components.
F & J
7 months first growth
25.8±0.86 6.3±0.33
67.9 ±0.94
17.5±0.36 16.2±0.21 7.5
10.3±0.26 10.6
9.7±0.09 9.1 ±0.62 6.6 7.7±0.10 7.6
G
9 months first growth
16.1±1.17 12.7±0.85 71.2±1.00
10.1±0.32
6.9±0.15
8 months first growth
17.3±0.89 14.4±1.63 68.3±1.77
18.7±0.36 17.3±0.30 7.4±0.37
10.1±0.29 10.8
10.6±0.14 8.0±0.08 6.3±0.08 7.1±0.11 7.3
I T * D T / 0 d ' k g 0 '
1 0 0 T
80
60
4 0
20-
—'T———-T—
0 20 i i i
40 60 rT /%
Fig. 10. Effect of level of excess feed (rT) on intake of dry matter (IT) and on intake of digestible dry matter (DT) of Stylosanthes guianensis (Forages D -G). Solid lines, IT; broken lines, DT .
48

ip/%
100
80 H
60
40
20
0 £U
T — - , * -
" • • - *
>ö 's
©
O - .9
o--.» ,
©
Dx/gd'ks'1
60
40
20 4
O © © * ^ ^ + *
©'
70
60
50
40 H © © © » » » ®
®
O 50 100 150 O 50 100 150 O 50 100 150 O-r'Bd-'kg-0'5
Fig. 11. Effect of level of feeding (O,-) on the results of intake and digestibility trials with Stylosanthes guianensis (Forages H-J). For explanation of symbols see Fig. 7.
significant (P<0.01) (Table 15). Within the range of the data, there were absolute increases of 2.0-2.7 percentage units or increases relative to the value at the lowest level of excess feed of 26-51%.
5.3 Stylosanthes guianensis -1974 series (chopped forages)
Three of the 1974 stylo's described in Section 5.2 (D, E and F) were also offered chopped. The chopped forages are referred to as H, I and J. For morphological and chemical composition see Table 5.
49

The results of the trials with chopped forages are shown in Fig. 11. The IT
almost reached its asymptote for Forages H and I but not for Forage J. When the parameter p for the IT curve of Forage I was left free to assume values < 1, it was estimated at 0.835 with a SD of estimate of 0.047, suggesting so that about 16% of that forage was completely unacceptable. Fig. 1111 shows, however, that this low estimate for p was entirely due to the low IT of one animal on the lowest level of feeding. Since all other trials with fresh stylo, including those with even more mature material (Forages F, G and J), indicate that all of this forage is consumed at very low levels of feeding the value of 0.835 for p may be considered an underestimate. The further analysis was, therefore, based on the IT curve with p = l (Table 10).
Comparison of Fig. 11H2-J2 with Fig. 9D2-F2 shows that at levels of feeding higher than about 70gd - 1 kg"075 animals on chopped stylo left a larger fraction of the leaves and inflorescence uneaten than animals on long forage. As a result, animals on chopped forages had a higher mass fraction of stems in the consumed dry matter. The differences in the content of stem in the consumed dry matter were, however, not large, always 5% or less. Chopping of the stylo did not prevent animals on higher levels of feeding from selecting against stems.
However at the same levels of feeding, digestibility was lower with the chopped forages than with the long forages (compare Fig. 11H4-J4 with Fig. 9D4-F4). The difference in dT varied from 2 to 10 percentage units, depending on the forage and level of feeding. Increases in dT with O T were not statistically significant for Forage J (P>0.05) but were significant at the 1% level for Forage
lT»0T / f l(J''kg0 '»
100-
80
60
40
20-
0 20 40 60
Fig. 12. Effect of level of excess feed (rT) on intake of dry matter (IT) and on intake of digestible dry matter (DT) of Stylosanthes guianensis (Forages H-J). Solid lines IT: broken lines, Dy.
50

I, for which it rose from slightly above 50% on the lowest level of feeding to 60% on the highest level of feeding (Fig. 1114; Table 13). Thus chopping decreased the degree of selection for material of higher digestibility but did not prevent it.
Fig. 12 shows the relation of IT and DT with rT. Both IT and DT were strongly affected by the level of excess feed, and IT and DT measured at 15% excess feed were by no means a good indication of the IT and DT obtained at the higher levels of excess feed.
Dry matter digestibility increased significantly with rT for Forages H and I but not for Forage J (Table 14). The DCP content of the consumed dry matter was related to rT only for Forage I (Table 15). It may not be concluded from this that animals on Forages H and J did not select for protein: the CP content of the refused dry matter was for all but one of the 22 animals on Forages H-J lower than the CP content of the offered feed. Absolute differences between CP content of the consumed and refused dry matter were for most animals 4% or more. Intake of DCP was at least as strongly affected by the level of excess feed as was IT-
5.4 Dried tops of Stylosanthes guianensis
In this section the results of feeding trials with three forages will be presented:
K: threshed tops of mature S. guianensis grown for seed production on the experimental farm of CIAT, at Palmira, Colombia
Table 6. Morphological composition, and crude protein and ash content of threshed tops of Sty/osanlhes guianensis. All data in percent of dry matter, ±SE.
Forage
Morphological composition leaves inflorescence stems
Crude protein in leaves in inflorescence in stems in whole plant* in whole plantb
Ash in leaves in inflorescence in stems in whole plant* in whole plantb
a. Estimated in separate sample b. Calculated from data on
K
45.8± 1.50 14.3±0.81 39.9±1.67
18.2±0.18 14.4±0.04 10.1±0.20 13.6±0.30 14.5
11.6±0.03 8.5±0.97 7.1 ±0.36
10.9±0.23 9.3
L
37.3±1.10 19.7±0.82 43.0±1.76
15.9±0.06 14.2±0.18 8.2±0.15
12.5±0.34 12.3
11.5±0.64 10.4±0.45 6.4±0.10
10.5 ±0.42 9.1
morphological components.
M
30.9±1.22 38.2±1.49 30.9±1.10
13.0±0.22
6.7 ±0.48
51

I T * iF'ad'kg"0 '5
100 -
8 0 -
6 0 -
4 0 -
2 0 -
0 •€)
• ' • * { > * ' u
«<a («U U
ip /%
100
80
60
40
20 H
0 ©
... • • : iu
# V ~ . - » 4 > • " ' * ' LI
©
8. o
à -%..•
' • • • • i .
D T / g d ' k g 0
6 0 -
4 0 -
"Le *tH^
©
70-
60-
40-
50- © 50 100 150 0 50 100 150 0 50 100 150
O-r/fld-'kg0'5
Fig. 13. Effect of level of feeding (OT ) on the results of intake and digestibility trials with threshed tops of Stylosanthes guianensis (Forages K-M). For explanation of symbols see Fig. 7.
L: similar material grown on the same farm M: similar material grown in the eastern plains of Colombia on poor acid soils.
The morphological composition and CP and ash content, as far as known, are given in Table 6.
The parameter p for the IT curve for Forage K (Table 10) was estimated at 0.908 but differed not significantly from 1 (ASE 0.084). With Forage L, a similar material, however, the same estimate (0.898) with a smaller ASE was obtained and in this case it differed significantly from 1 (P< 0.025). The larger ASE for Forage K may result from the fact that the feeding levels did not include values below 78 g d"1 kg-0-75 whereas for Forage L feeding levels as low as
52

44 g cT1 kg-0 7S were used. So about 10% of these two forages may be unacceptable, as assumed while constructing the curves. For Forage M, no evidence was found for a value of p smaller than 1 for the IT curve.
The curves relating IT, ILI and Is to O T are given in Fig. 13K1-M1. The curve for ILI and those derived from that for Forage K are based on observations on 14 animals out of 23 (Table 11). The morphological composition of the residues left by nine animals was not determined. I checked whether the IT curve for these two groups of animals differed but they were very nearly the same.
With Forages K and L, dry matter intake increased strongly with OT , and this increase was almost entirely due to increased consumption of leaf and inflorescence (Fig. 13K1-L1). The relative intake of leaves and inflorescence deviated more from the 100% line than for the long green stylo (Fig. 13K2-M2). Nevertheless the data indicate a strong selection against stems. Intake of stems of Forage M by animals on the higher levels of feeding was less than 10 gd_1 kg -075, less than 25% of the amount of stems offered (Fig. 13M2) as compared to 60 g of leaf and inflorescence (65-90% of the amount offered).
DT increased with O T , in a similar way to IT (Fig. 13K3-M3). No evidence was found for substantial increases in dT (Fig. 13K4-M4; Table 13). Only dT for Forage L showed a slight tendency for a curvilinear response, but mainly in two values at the lowest level of feeding. From a feeding level of 60gd_1kg~°75
onwards, no increase in dT was observed. The measured dT of all three forages was relatively low, 56% or less. Due to high levels of IT for Forages K and L DT for these forages was still relatively high at the higher levels of feeding.
I T * DT / ( jd 'kg°7 S
1001
80
60
4 0
20
0 20 40 60 rT/%
Fig. 14. Effect of level of excess feed (rT) on intake of dry matter (Ir) and on intake of digestible dry matter (DT) of threshed tops of Stylosanthes guianensis (Forages K-M). Solid lines, IT; broken lines, DT.
53

Fig. 14 shows the relation of IT and DT with rT. At 15% residue, IT was the same for Forages L and M. At 35% residue however, IT of Forage M was 64gd"1 kg""0-75 and that of Forage L 86 g d"1 kg-075: 34% higher. Also IT of Forage K responded strongly to changes in the percentage excess feed. Dry matter digestibility seemed to be related to rT for Forage L (Table 14) but the curvilinear relationship was again largely due to two or three animals on extreme levels of rT. For Forages K and M, no relation was found of dT with rT. The DCP content followed a similar trend: no relation with rT for Forages K and M, and an increase with rT for Forage L (Table 15).
The fact that the DCP content of the consumed dry matter of Forages K and M did not increase with rT should not be interpreted as meaning that the animals did not select for CP in these forages. The CP content in the residues left by individual animals was always less than in the offered dry matter, the differences with both forages being larger when the residues were small. With Forage K, 12 out of 23 animals left residues with a CP content even less than the offered stem. For Forage L, 11 out of 14 residues had a lower CP content than the offered stem. Thus also animals on these forages had not only selected between leaves + inflorescence and stems but also within stems. Moreover the CP content in the consumed dry matter (%CP = y) of Forage K was related to rT (x): y = 13.9 + 0.029 x(r = 0.761, P<0.01). That no significant correlation between the DCP content and rT was found may be attributed to the overshadowing of a small but probably real effect of rT on the DCP content by extra random variation caused by experimental error. But changes in CP and therefore DCP content of the consumed dry matter were small for Forages K and M within the range of data and of no practical consequence. If the levels of excess feed had been lower than in the present trials, however, the CP and DCP content of the consumed dry matter would certainly have been depressed, thereby accentuating the effect of a lower IT on the intake of digestible crude protein.
5.5 Desmodium distortion
D. distortum was cut when the crop had reached a height of 90 cm (N) and two months later when it had reached a height of 180 cm (O). The composition of these forages is given in Table 7. Leaves constituted nearly half of the dry matter of the younger forage but only a fifth of the older material. Also the proportion of petioles and inflorescence decreased. Stems comprised slightly more than a third of the younger material but two thirds of the older forage. The leaves of the younger D. distortum contained 27.5% CP and the leaves of the older forage only slightly less. Also the inflorescence was rich in protein in both forages (23.0 and 21.4% respectively) but petioles contained much less protein (10-11%). Stem had the lowest CP content (7.7 and 5.5%). In the whole plant, forage harvested at 180 cm contained 10.5% CP as compared to 17.7% in the material harvested at 90 cm. The data indicate that about 75% of this difference was due to the difference in morphological composition, especially the decreased leaf/stem ratio in the older material and only 25% by the decrease in CP content of the various
54

Table 7. Morphological composition, and crude protein and ash content of Desmodium distortum. All data in percent of dry matter, ±SE.
Forage
Height at harvest
Morphological composition leaves petioles inflorescence stems
Crude protein in leaves in petioles in leaves + petioles in inflorescence in stem in whole plant* in whole plantb
Ash in leaves in petioles in leaves + petioles in inflorescence in stem in whole plant" in whole plantb
N
90 cm
48.9 ±2.0 11.5±0.7 3.1±0.2
36.5±2.5
27.5±1.4 11.0C
23.4±0.9 23.0C
7.7±0.2 17.8±0.3 17.7
10.9±0.3 10.3e
11.2±0.2 10.3e
8.0±0.2 10.0±0.3 10.0
O
180 cm
20.9±0.7 8.4±0.9 2.8±1.3
67.9±1.2 j
25.5±0.2 -10.2±0.4 I
21.4e
5.5±0.2
10.5
10.8±0.1 .' 10.3±0.6 '
' 12.4e
6.2±0.1
7.7 !
a. Estimated in separate sample. b. Calculated from data on morphological components. c. One sample only.
morphological components. The relative decrease in CP content with age was greater for stems (28.6%) than for the other three components (7.0-7.3%). The ash content of the various components differed less, but again stem had least ash.
The estimates for the parameters in Equation 3 relating IT to O T are given in Table 10. For the younger forage, p was estimated at 0.934. This value differed significantly from 1 (P< 0.025) and indicated that 6.6% of this forage was found unacceptable. On the other hand, the parameter.h (10.98) was very high, indicating that IT at O T = m/p was depressed by only 4%. In other words, it was not found necessary to allow selection within the acceptable part (93.4%) of this forage to reach maximum intake. For the older forage, p was estimated at 0.778, indicating that 22.2% of this forage was unacceptable. However, a large ASE was attached to this value so that it did not differ significantly from 1 (P>0.10). Although this implies a large degree of uncertainty about the value of p for Forage O, the lack of statistically significant difference between the estimate for p and 1 does not justify the conclusion that it is equal to 1, especially since there is
55

ITA lF /gd W 0 ' 5
1 0 0 T
80
60
4 0
2 0 -
0
i F / %
OO-i
8 0
6 0
4 0
20
0 ©
- •
O
O
•.»-'LI
« *
% I.
' 1
° .• -•-.• o«) _ & • > _
Dy/Bd-'kg-1
6 0
4 0
20
0
S* ©
« ^ « * « -f—*~ * *
70 -
60 -
5 0
4 0 Uü 04
50 100 150 0 50 100 150 2 0 0
OT/gd-'k0 'O7s
Fig. 15. Effect of level of feeding (O,-) on the results of intake and digestibility trials with Desmodium distortum (Forages N-O). For explanation of symbols see Fig. 7.
strong evidence that for the younger forage the value of 1 is not included in the confidence limit, and since for both forages the older stems were rejected. Therefore the equation with p = 0.778 for the IT curve for Forage O has been used in the further analysis. The estimate for the parameter h was much lower in this case (2.36) so that feed intake was 18% below its maximum at 0 T = m/p.
No selection between leaves (including petioles) and inflorescences was observed but animals selected very sharply between these components on the one hand and stems on the other hand (Fig. 15N2-02). All but one animal on the older forage ate 100% of the leaves and inflorescence. The one animal which left
56

some of the finer fractions only confirms that selection was 100% effective, because it ate no stems at all: with the high level of feeding, the amount of offered leaves, petioles and inflorescence were more than sufficient to cover the whole voluntary intake of this animal. Data for both forages indicate a very low intake of stems at the higher levels of feeding and there is no tendency for the curves to level off. The curves rather indicate that Is would have fallen to zero if still higher feeding levels had been used. This tendency differs from that found with Stylosanthes guianensis. The reason may well be that with stylo it is simply impossible, even for sheep, to avoid eating some stems with the leaves while with D. distortum separation is much easier. Also in these trials it was found that the refused forage for all but three animals contained less CP than the offered stem, indicating that the animals had also selected between stem parts. The high h for Forage N indicates, however, that, even though animals clearly preferred leaves and inflorescences, they accepted also a considerable proportion of the stems of this forage without decreasing thv.'.r intake.
Fig. 16 gives the relation of IT and DT with rT. The IT curve for Forage N reached a maximum at rT= 15%. So the younger D. distortum is the only example in the CIAT trials where a level of feeding giving 15% residue provides an unbiased estimate of maximum voluntary intake. Even there, 15% residue did not give maximum DT, since digestibility increased with rT (Table 14). It is quite apparent that for older D. distortum much higher levels of excess feed must be allowed to obtain unbiased estimates of maximum IT and DT.
Changes in the DCP content of the consumed dry matter with differences in
lT » D T /gd 'kg'0 '5
1 0 0 1
80
60
40
20
20 40 60 rT/%
Fig. 16. Effect of level of excess feed (rT) on intake of dry matter (IT) and on intake of digestible dry matter (EX,.) of Desmodium distortum (Forages N-O). Solid lines, IT; broken lines, DT.
57

level of excess feed were larger for D. distortion than for any other feed tested (Table 15).
5.6 Centrosema pubescens
Two trials were conducted with C. pubescens. One in 1973 (Forage P) and one in 1975 (Forage Q). Both forages had been grown at the CIAT farm in Palmira. The results do not provide meaningful data on the nutritive value of C. pubescens, since the forages were poorly described, but they constituted another example of some part of the feed being entirely unacceptable and that part could be well defined.
Table 8 gives data on the composition of the forages. Forage P was cut and used during a very rainy period. So the offered feed was contaminated with soil. As in all other trials, daily samples of the offered feed were dried and stored for later analysis, in which an average of 5.3% dirt was found in this feed. The ash content of that component (77.1%) confirmed that it consisted largely of soil. The CP content in dry matter (6.6%) shows that the organic matter contained 29% CP, indicating that the dirt was a mixture of soil and finely broken leaves.
The parameter p for the IT curve of Forage P (Table 10) was estimated at 0.906*0.030, significantly less than 1 (P<0.01) and indicating that 9.4% of the feed was unacceptable, considerably more than the 5.3% dirt in the offered
Table 8. Morphological composition, and crude protein and ash content of Centrosema pubescens. All data in percent of dry matter, ±SE.
Forage
Morphological composition leaves stems dirt
Crude protein in leaves in stems in dirt in whole forage* in whole forage"
Ash in leaves in stems in dirt in whole forage* in whole forage"
a. Estimated in separate sa b. Calculated from data on
mplt
P
35.8±1.07 58.9±1.67 5.3±0.94
26.9±0.11 14.9±0.38 6.6 ±0.60
18.8
16.5±0.29 8.7±0.16
7 7 . l i l . 7 7
15.0
Q
55 .7 i2 .47 44.3 ±2.47
—
20 .8 i0 .40
8.9 ± 0.09. _ _ . Od
morphological components!
58

I j * I F ' K I 'kg'"'1
100
- * - - » "
•ffl—®- IT
-«JO
ip/%
100
80
60
40
20
0
0 * x !
©
DT/ed"kg°'6
60
40 H
20
0
» — * • * - « -
o3
70
60-
50
40 - 0 4 )
50 100 150 0 50 100 150 200
OT/ f l dV 0 7 5
Fig. 17. Effect of level of feeding ( O T ) on the results of intake and digestibility trials with Centrosema pubescens (Forages P-Q). For explanation of symbols see Fig. 7.
material. Analysis of the residues, however, indicated that the 5.3% dirt was an underestimate. Especially for animals on the higher levels of feeding, a larger absolute amount of dirt was found in the residues than was offered, according to the assumption that the offered dry matter contained 5.3% of dirt. On the basis of the residues, the offered material contained about 6-8% dirt. The stems in residues left by animals on the lower levels of feeding contained no green stems but only stem portions that had apparently been in close contact with the soil. Thus a well defined part of the offered feed comprised the 9-10% which was indicated as unacceptable by the estimate for the parameter p. The value of 5.79
59

for the parameter h indicates that animals ate all the rest of this forage, including the green stems without any large depression in IT. Fig. 17P2 shows however that the animals selected effectively between leaves and stems. Nevertheless a lower dT
was measured at the higher levels of feeding than at the lower levels (Fig. 17P4). In this respect, the 1973 C. pubescens was unique amongst the forages used in the CIAT trials.
The 1975 forage (Q) showed much more variable data. No data are available on the morphological composition of the residues but there too the animals selected sharply for leaves. Digestibility of this forage increased until O T = 110gd-1kg-°-75 and then decreased (Fig. 17Q4).
Fig. 18 shows the relation of IT and DT with rT. The curve of IT against rT for the 1973 forage was similar to that for the younger Desmodium distortutn (Forage N). Digestibility of Forage Q was not related to rT (Table 14), that of Forage P decreased with rT (P<0.05). This does not necessarily mean that animals selected for a less digestible diet at higher levels of excess feed. The higher intake at higher levels of excess feed may cause a greater rate of passage through the digestive tract and thereby a decreased digestibility. As a result, the effect of rT on DT was slightly less pronounced than the effect on IT.
The DCP content of the consumed dry matter of Forage Q increased significantly with rT (P<0.01), even though the data were rather variable (Table 15). No DCP data are available for Forage P but since animals selected sharply for leaves the CP and thus the DCP content of the consumed dry matter would have increased at higher levels of excess feed.
l T s D T / 9 d ' k a 0 ' 5
1001
80
60
40
20
- Q
/ X
0 20 40 60 rT /%
Fig. 18. Effect of level of excess feed (rT) on intake of dry matter (IT) and on intake of digestible dry matter (DT) of Centrosema pubescens (Forages P-Q). Solid lines, IT; broken lines, DT.
60

5.7 Brachiaria mutica and B. decumbens
This section discusses the results of feeding trials with two grasses:
R: Brachiaria mutica S: Brachiaria decumbens.
Forage R was grown on the CIAT farm in Palmira, Colombia; Forage S on a poor acid soil in the Eastern Llanos of Colombia.
Data on morphological components, protein and ash are given in Table 9. Especially the B. mutica was of advanced maturity and was extremely low in CP.
The parameter p for the IT curves was estimated to be 1 for both forages but only for Forage R did the data really support the suggestion that all would be consumed at low levels of feeding. For Forage S, this remains a matter of conjecture because feeding levels had not been low enough to provide evidence (Fig. 19R1-S1). The IT curves appear to approach their asymptote within the range of the data but close inspection of the data in Fig. 19R1 indicates that the response of IT to O T was in fact linear for Forage R.
Fig. 19R1-2 shows that the animals resisted not only the consumption of stems but also the consumption of leaf sheathes of B. mutica. The relative intake of leaf sheathes was as low as that of stems. Animals consumed very little of the stems of B. decumbens (Fig. 19S1-2). The relative intake of leaf sheathes (i^) was higher
Table 9. Morphological composition, and crude protein and ash content of Brachiaria mutica (Forage R) and B. decumbens (Forage S). All data in percent of dry matter, ±SE.
Forage
Morphological composition leaf blades leaf sheathes stems
Crude protein in leaf blades in leaf sheathes in stems in whole plant" in whole plantb
Ash in leaf blades in leaf sheathes in stems in whole plant* in whole plantb
R
19.8 ±1.47 16.5±0.65 6 3 . 7 i l . 6 1
5.3±0.15 2.5±0.09 2.1±0.09 2.5 ±0.20 2.8
12.8±0.44 10.6±0.08 5.4±0.07 8.2±0.23 7.7
a. Estimated in separate sample. b. Calculated from data on
S
36.8±1.29 21.0 ±0.49 42.2±0.89
7.1±0.16 4.5±0.14 6.2±0.22 6.8±0.26 6.2
7.0±0.59 7.0±0.10 2.2±0.08 4.1±0.50 5.0
morphological components.
61

i T ï l F ' O f ' k s - 0 ' 5
100
^ %r*v^,^k'n;-
* «-..
* — * *
S2
« -, * * o »-..O - o
-- - - • . o o e ------- is , ft.
70-
60-
50-
40- _® .-• ® » ®
50 "ÏOO 150 Ó 100 150 0 T /gd ' kg 0 ' 5
Fig. 19. Effect of level of feeding (OT) on the results of intake and digestibility trials with Brachiaria mutica and B. decumbens (Forages R-S). For explanation of symbols see Fig. 7.
than of stems (is) but again considerably lower than the relative intake of leaves. Thus, for both forages selection between leaves and leaf sheathes accentuates the possible effects of selection between leaves and stems. Table 9 shows that for both forages the CP content of the leaf sheathes was much lower than that of the leaves, so that selection between leaves and leaf sheathes may be important in determining the CP content of consumed dry matter. For Forage R, the dry matter refused by six out of seven animals had less CP (1.5 to 1.8%) than the offered stems (2.1 ±0.09%). Since all of these residues contained some leaves and leaf sheathes that were richer in CP than were stems, these animals must have selected
62

IT& Dy/gd'kg ° 's
1001
80
60
40
20
0
S
20 40 60 80 rT /%
Fig. 20. Effect of level of excess feed (rT) of intake of dry matter (IT) and on intake of digestible dry matter (Dr) of Brachiaria mutica and B. decumbens (Forages R-S). Solid lines, IT; broken lines, DT.
among stems as well. This could not be confirmed for Forage S. The refusals of this forage had CP contents ranging from 5.1 to 6.6%. Eight of these residues had a CP content lower than that of the offered stem but this could well be explained by the fact that the residues contained also leaf sheathes that had the lowest CP content of all fractions.
In neither of the forages did dT increase at the higher levels of feeding (Fig. 19R4-S4; Table 13).
Fig. 20 shows the effect of level of excess feed on IT and DT. Again level of excess feed may affect the comparison of both IT and DT data.
No significant correlation was found between dT and rT (Table 14). The effect of rT on DCP content of the consumed dry matter was significant for Forage S (P<0.05) (Table 15). For animals on Forage R, a small but statistically significant effect of rT (x) on content of CP in the consumed dry matter (%CP = y) was found: y = 2.5 + 0.013x, r = 0.815, 6 df). The effect of rT on content of DCP was, however, not significant (Table 15).
5.8 Data from the literature
As mentioned in Section 2.3.1, Jeffery (1976) studied the effect of level of excess feed on voluntary intake of chopped fresh Pennisetum clandestinum (Forage T) and Heaney (1973) made a similar study on the intake of chopped hay made from red clover (U), timothy (V) and two cuts of lucerne (W and X) as well as oat straw (Y). The study on oat straw was discussed in Section 4.1.3.
63
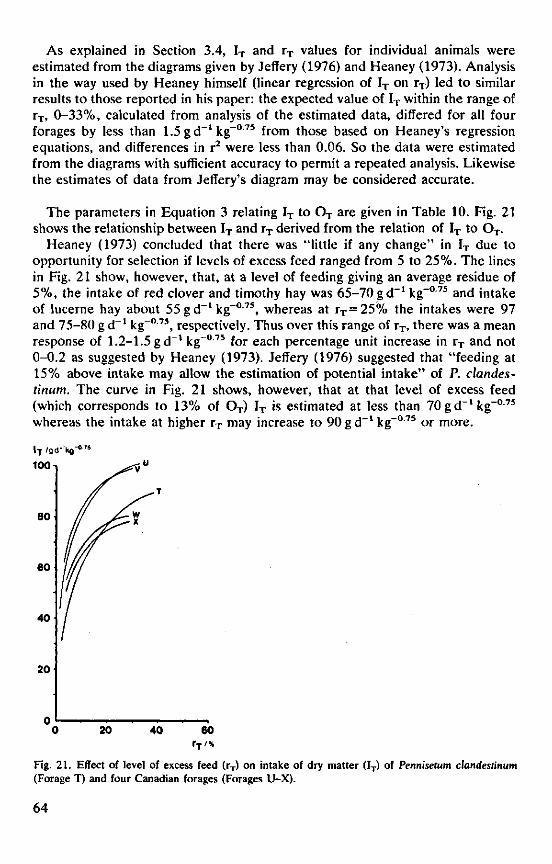
As explained in Section 3.4, IT and rT values for individual animals were estimated from the diagrams given by Jeffery (1976) and Heaney (1973). Analysis in the way used by Heaney himself (linear regression of IT on rT) led to similar results to those reported in his paper: the expected value of IT within the range of rT, 0-33%, calculated from analysis of the estimated data, differed for all four forages by less than 1.5 gd~' kg - 075 from those based on Heaney's regression equations, and differences in r2 were less than 0.06. So the data were estimated from the diagrams with sufficient accuracy to permit a repeated analysis. Likewise the estimates of data from Jeffery's diagram may be considered accurate.
The parameters in Equation 3 relating IT to O T are given in Table 10. Fig. 21 shows the relationship between IT and rT derived from the relation of IT to O T .
Heaney (1973) concluded that there was "little if any change" in IT due to opportunity for selection if levels of excess feed ranged from 5 to 25%. The lines in Fig. 21 show, however, that, at a level of feeding giving an average residue of 5%, the intake of red clover and timothy hay was 65-70gd_1 kg - 075 and intake of lucerne hay about 55 gd_ I kg -075, whereas at rT = 25% the intakes were 97 and 75-80 g d -1 kg-0'75, respectively. Thus over this range of rT, there was a mean response of 1.2-1.5 g d -1 kg - 075 for each percentage unit increase in rT and not 0-0.2 as suggested by Heaney (1973). Jeffery (1976) suggested that "feeding at 15% above intake may allow the estimation of potential intake" of P. clandes-tinutn. The curve in Fig. 21 shows, however, that at that level of excess feed (which corresponds to 13% of OT ) IT is estimated at less than 70 gd - 1 kg - 075
whereas the intake at higher rT may increase to 90gd_1 kg - 075 or more.
lT 'a<J-V"s
100 T
80
60
40
20
0 20 40 60 rT/%
Fig. 21. Effect of level of excess feed (rT) on intake of dry matter (IT) of Pennisetum clandestinum (Forage T) and four Canadian forages (Forages U-X).
64

Table 10. Estimates of parameters p, m and h in Equation 3 for the relationship of dry matter intake (IT) to level of feeding (O,.). Range of O T as in Table 3.
Forage
A B C
D E F G
H I J
K L M
N O
P O
R S
T U V W X
Number of observations
12 12 12
6 9 6
14
6 10 6
23 16 7
11 11
12 12
8 11
10 24 24 24 23
P
0.908 0.898 1
0.934 0.778
0.906 1
S p "
— —
— — —
— — 0.084 0.039
— 0.023 0.187
0.030
—
—
— — — —
m
72.4 69.4 71.7
88.5 133.3 88.0 70.6
74.4 73.5 81.8
99.4 94.1 67.0
75.2 70.4
79.5 62.3
66.4 47.0
92.4 102.4 99.9 81.4 79.5
sm '
2.00 2.28 8.76
13.39 43.98 44.23 18.95
2.05 3.96
17.66
10.25 8.14 6.86
1.36 4.98
2.17 7.53
5.26 7.36
7.49 7.38 4.75 4.16 6.29
h
4.23 3.31 1.58
1.78 0.95 1.16 1.06
2.59 2.45 1.37
3.37 2.31 2.14
10.98 2.36
5.79 1.59
1.82 1.07
2.20 2.94 3.43 3.45 3.27
s„"
1.32 0.73 0.49
0.60 0.22 0.66 0.33
0.39 0.70 0.45
2.62 0.76 0.99
10.93 2.20
3.28 0.71
0.43 0.35
0.55 0.64 0.67 0.75 0.98
df
10 10 10
4 7 4
12
4 8 4
20 13 5
8 8
9 10
6 9
8 22 22 22 21
RCV
0.061 0.056 0.137
0.083 0.059 0.154 0.133
0.034 0.087 0.089
0.051 0.035 0.114
0.040 0.115
0.050 0.192
0.077 0.170
0.064 0.069 0.058 0.063 0.077
y—"
IIA 69.3 69.3
83.5 86.7 71.8 59.4
74.2 73.3 72.6
96.2 87.5 66.7
75.2 70.3
79.5 61.8
65.1 45.4
89.5 100.8 98.8 80.3 78.2
y/m at x = m/p
0.897 0.871 0.748
0.773 0.617 0.673 0.649
0.838 0.829 0.715
0.873 0.820 0.807
0.959 0.823
0.924 0.749
0.777 0.651
0.812 0.856 0.875 0.876 0.869
Figure1
7A1 7B1 7C1
9D1 9E1 9F1 9G1
11H1 1111 I U I
13K1 13L1 13M1
15N1 1501
17P1 17Q1
19R1 19S1
Asymptotic standard error of parameter denoted by subscript. Highest estimate of IT within range of data. Figure in which individual data and curve are shown.
65

Table 11. Estimates of parameters p, m and h in Equation 3 for the relationship of intake of morphological components (IF) to level of feeding (O,-). Range of O T as in Table 3.
Forage
A B C
D E F G
H I J
K L M
N O
P
R
S
Number of Component observations
L L LI
LI L LI LI
LI L LI
LI LI LI
LI LI
L
L L+Ls
L L+Ls
12 12 12
6 9 6
14
6 10 6
14 16 7
11 11
12
8 8
11 11
P
0.489 0.396 0.413
0.419 0.381 0.321 0.288
0.419 0.381 0.321
0.601 0.570 0.691
0.635 0.321
0.358
0.198 0.363
0.368 0.578
m
56.8 46.6 51.3
56.2 405.4
36.2 33.3
. 42.2 42.0 49.0
73.4 70.4 60.2
(linear 91.7
132.1
20.8 32.2
30.1 43.7
Si,"
0.4 3.4 3.2
4.6 1488.6
6.1 2.0
1.0 0.9
17.2
6.2 4.4 4.2
relation y 74.3
241.2
2.5 3.2
4.3 9.8
h
19.41 9.22 6.61
4.58 1.67 4.41 5.37
6.25 6.30 2.07
4.09 4.63 3.95
s*"
5.11 3.72 4.21
1.44 2.17 3.53 1.40
2.24 1.64 0.87
1.19 1.24 2.24
= 0.635x) 4.72
1.94
3.57 2.13
2.56 1.45
5.82
2.06
1.67 0.52
1.65 0.63
df
10 10 10
4 7 4
12
4 8 4
12 14 5
9 9
10
6 6
9 9
RCV
0.010 0.006 0.051
0.017 0.009 0.060 0.019
0.029 0.028 0.036
0.035 0.029 0.093
0.000 0.013
0.026
0.058 0.056
0.198 0.179
y™. b
56.8 43.1 50.5
52.3 55.1 34.8 31.5
42.2 41.9 35.6
68.7 67.2 60.2
67.2 62.1
44.0
20.0 30.5
29.9 41.2
Figure"
7A1 7B1 7C1
9D1 9E1 9F1 9G1
11H1 1111 I U I
13K1 13L1 13M1
15N1 1501
17P1
19R1
19S1
a. Asymptotic standard error of parameter denoted by subscript. b. Highest estimate of IF within range of data. c. Figure in which individual data and curve are shown.
66

Table 12. Estimates of parameters p, m and h in Equation 3 for the relationship of intake of digestible dry matter (DT) to level of feeding (Or). Range of O T as in Table 3.
Forage
A B C
D E F G
H I J
K L M
N O
P 0 R S
T
Number of observations
12 12 12
6 9 5
14
6 10 6
23 16 7
11 11
12 12
8 11
10
P
0.570 0.526 1
1 0.522 1 0.315
0.614 0.440 1
0.550 0.397 0.628
0.625 0.427
0.427 0.367
1 1
0.716
S p "
0.023 0.032 —
0.211 — 0.022
0.134
— 0.146 0.010 0.549
0.035 0.057
0.027 0.105
— 0.049
m
47.4 45.5
103.3
265.7 135.2 199.6 32.7
47.9 41.4 78.2
60.8 42.2 39.8
53.3 46.4
34.9 32.9
36.1 26.3
72.2
sm*
1.43 4.52
91.52
263.78 381.35 566.92
3.49
7.63 1.40
53.20
19.34 1.57
11.10
4.90 3.24
1.39 3.69
2.42 12.66
11.58
h
5.01 3.29 0.44
0.40 1.00 0.37
21.20
1.51 25.00
0.46
2.05 6.59 1.39
4.87 3.96
4.57 4.42
0.65 0.45
1.97
sha
2.95 2.11 0.15
0.11 2.37 0.28
77.58
1.04 12.20 0.13
2.73 3.93 2.57
4.52 4.67
3.30 11.41
0.00 0.16
1.01
df
9 9 9
3 6 2
11
3 7 3
20 13 4
8 8
9 9
5 8
7
RCV
0.056 0.061 0.155
0.066 0.052 0.202 0.189
0.052 0.078 0.102
0.059 0.057 0.099
0.055 0.134
0.075 0.238
0.118 0.198
0.066
V b
J max
47.4 44.2 43.5
56.8 58.2 44.1 32.7
45.1 41.4 37.7
54.5 42.1 38.2
52.7 46.4
34.9 32.9
30.5 20.0
67.3
Figure0
7A3 7B3 7C3
9D3 9E3 9F3 9G3
11H3 1113 11J3
13K3 13L3 13M3
15N3 1503
17P3 1703
19R3 19S3
a. Asymptotic standard error of parameter denoted by subscript. b. Highest estimate of DT within range of data. c. Figure in which individual data and curve are shown.
67
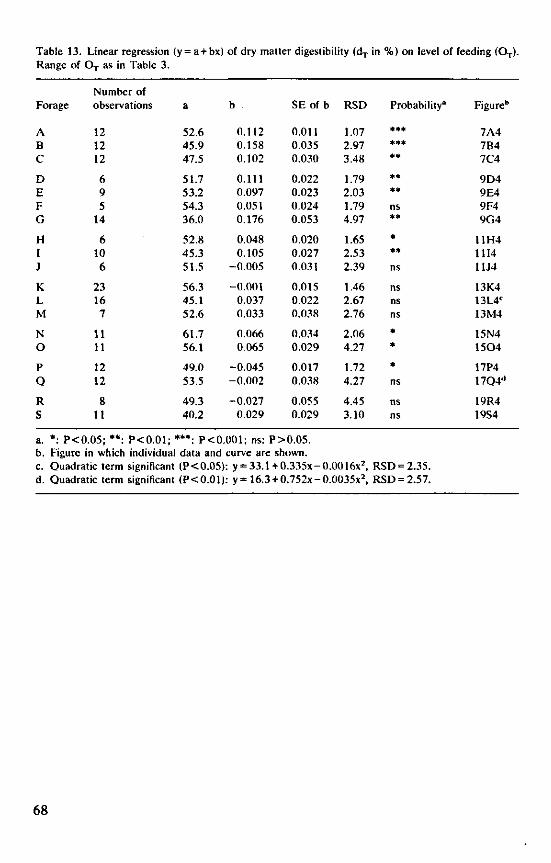
Table 13. Linear regression (y = a + bx) of dry matter digestibility (dT in %) on level of feeding (0,0. Range of O T as in Table 3.
Forage
A B C
D E F G
H I J
K L M
N O
P O
R S
Number of observations
12 12 12
6 9 5
14
6 10 6
23 16 7
11 11
12 12
8 11
a
52.6 45.9 47.5
51.7 53.2 54.3 36.0
52.8 45.3 51.5
56.3 45.1 52.6
61.7 56.1
49.0 53.5
49.3 40.2
b
0.112 0.158 0.102
0.111 0.097 0.051 0.176
0.048 0.105
-0 .005
-0 .001 0.037 0.033
0.066 0.065
-0 .045 -0 .002
-0 .027 0.029
SE of b
0.011 0.035 0.030
0.022 0.023 0.024 0.053
0.020 0.027 0.031
0.015 0.022 0.038
0.034 0.029
0.017 0.038
0.055 0.029
RSD
1.07 2.97 3.48
1.79 2.03 1.79 4.97
1.65 2.53 2.39
1.46 2.67 2.76
2.06 4.27
1.72 4.27
4.45 3.10
Probability*
*** *** ** ** ** ns ** * ** ns
ns ns ns
* • * ns
ns ns
Figureb
7A4 7B4 7C4
9D4 9E4 9F4 9G4
11H4 1114 11J4
13K4 13L4C
13M4
15N4 1504
17P4 17Q4d
19R4 19S4
a. *: P<0.05; **: P<0.01; ***: P<0.001; ns: P>0.05. b. Figure in which individual data and curve are shown. c. Quadratic term significant (P<0.05): y = 33.1 + 0.335x-0.0016x2, RSD = 2.35. d. Quadratic term significant (P<0.01): y = 16.3 + 0.752x-0.0035x2, RSD=2.57.
68

Table 14. Linear regression (y-(rT). Range of rT as in Table 3.
= a + bx) of dry matter digestibility (dT in %) on level of excess feed
Forage
A B C
D E F G
H I J
K L M
N O
P O
R S
Number of observations
12 12 12
6 9 5
14
6 10 6
23 16 7
11 11
12 12
8 11
a
58.0 52.5 51.4
56.0 51.5 55.4 41.9
54.5 49.7 51.1
56.3 45.5 52.5
64.8 55.4
47.3 55.4
48.3 40.9
b
0.202 0.298 0.174
0.251" 0.371 0.107 0.227
0.103 0.200
-0 .003
-0 .012 0.130c
0.100
0.146 0.193
-0 .111 -0 .046
-0 .043 0.038
SE of b
0.019 0.057 0.070
0.064 0.070 0.052 0.144
0.044 0.070 0.071
0.044 0.083 0.064
0.074 0.103
0.043 0.079
0.103 0.070
RSD
1.04 2.67 4.05
2.22 1.67 1.82 6.25
1.67 3.03 2.40
1.46 2.70 2.43
2.06 4.53
1.73 4.19
4.48 3.22
Probability»
*** *** * ** *** ns ns
* * ns
ns ns ns
* * * ns
ns ns
a. *: P<0.05; **: P<0.01; ***: P<0.()01; ns: P>0.05. b. Quadratic term significant (P<0.05): y = 58.4-0.321x + 0.0146x2, RSD= 1.21. c. Quadratic term significant (P<0.01): y = 31.2 + 1.445x-0.0268x2, RSD= 1.96.
a.
69

Table 15. Linear regression (y = a + bx) of digestible crude protein content of consumed forage (% DCP in dry matter) on level of excess feed (rT). Range of rT as in Table 3.
Forage
A B C
D E F G
H I J
K L M
N O
P Q
R S
Number of observations
12
9 b
6 9 5
14
6 10 6
23 14 7
OC
11
11
8 11
9.9
7.0
14.0
0.2 1.8
0.078
0.107
0.096
0.005 0.052
SE of b
0.003
0.027
0.029
0.009 0.019
RSD
0.19
0.68
1.51
0.40 0.89
Probability"
8.2 6.8 5.9 4.1
8.3 6.4 5.7
8.2 6.3 8.7
13.7 5.3
0.073 0.077 0.057 0.069
-0 .007 0.042 0.019
0.003 0.053 0.006
0.137 0.139
0.012 0.009 0.009 0.016
0.019 0.009 0.015
0.011 0.019 0.019
0.014 0.017
0.42 0.22 0.32 0.70
0.73 0.37 0.50
0.36 0.56 0.71
0.30 0.76
** *** ** ***
ns *** ns
ns ** ns
*** ***
a. *: P<0.05; **: P<0.01; ***: P<0.001; ns: P>0.05. b. Range of rT: 32.3-59.6%. c. Range of rT: 5.8-28.8%.
70

6 Discussion
6.1 Importance of differences in response curves and standardization of feeding levels
The results demonstrate that level of excess feed can have very large effects on the results of intake and digestibility trials with unchopped tropical forages, and that with many forages feeding levels providing an average of 10 or 15% excess feed do not lead to maximum intake of dry matter and digestible dry matter. One of the most striking examples is that of the 1974 series of trials with Stylosanthes guianensis (Forages D-G; Section 5.2; Fig. 10). Within this series of trials, only five animals (one or two for each forage) out of a total of 35 refused less than 20% of the offered feed. Estimates for dry matter intake at a feeding level providing 20% excess feed were 65, 45, 41 and 30 gd_1 kg - 075 for Forages D, E, F and G, respectively. At feeding levels providing 35% residue, IT was 80, 76, 62 and 45 g d_1 kg-0 75, respectively. In other words, increases of 15-31 g d -1 kg-0 75
or 1.0-2.1 g per percentage unit increase in rT. In the same range of rT, the intake of digestible dry matter increased with 0.6-1.5 gd - 1 kg - 075 per percentage unit increase in rT. As may be seen in Fig. 10, these responses were almost linear over an even wider range of rT for Forages D and F. The responses of IT and DT to level of excess feed in about the same range of rT were equally strong for some other forages, e.g. C (Fig. 8), K and L (Fig. 14), O (Fig. 16), and Q (Fig. 18). As a result, the comparison of IT and DT of different forages may be seriously biased if they are offered in amounts that do not provide the same level of excess feed. The seriousness of this bias is well illustrated by the results of the trials with threshed tops of S. guianensis (Forages K-L, Section 5.4). If IT of Forage K were measured at rT=15 and that of Forage L at rT = 30%, values of 73 and 82gd~ lkg"075
would be obtained, respectively, suggesting that the intake of Forage L is higher than that of Forage K, thus reversing the facts.
Not all forages showed strong responses in IT between rT 20 and 35%. For instance, the IT curves of Forages A and B showed only a slight response to rT
higher than 20 (Fig. 8). The same holds for the IT curve for the first sample of Centrosema pubescens (Forage P, Fig. 18). The curve for the younger cut of Desmodium distortum (N, Fig. 16) had indeed reached its maximum at rT= 15%. These curves showed, however, a very sharp response to rT at the lower levels of excess feed.
Fig. 12 demonstrates that also when the forage (S. guianensis) was chopped, both IT and DT may respond strongly to level of excess feed. That chopping does not prevent the effects of level of excess feed is further demonstrated by the analysis of data from Heaney (1973) and Jeffery (1976). Large effects of level of
71

excess feed on the voluntary intake of temperate forages were also found in trials with unchopped Westerwolds ryegrass (Lolium multiflorum var. Westerwoldicwn) at Wageningen. So even the comparison of intake data on temperate forages may be affected by level of excess feed.
These observations demonstrate that the levels of excess feed must be well defined if biases in the comparison of the results of intake and digestibility trials are to be avoided. The magnitude of the effects and the observed variation in the levels of excess feed reported in the literature (Section 2.1) indicate that many of the published data cannot be compared without danger of serious biases, unless they can be corrected for the effect of level of excess feed. Such a correction is, however, not possible for two reasons. First, the reported level of excess feed is in most papers only an intended value and actual values may differ considerably (Section 2.2). Secondly, even if it were known with certainty that, for instance, one forage was offered at a level resulting in 10% residue and another at a level resulting in 30% residue, it would be impossible to correct them both to the same level, for instance 20%, because the magnitude of the effect of a different level of excess feed is extremely variable between forages.
One could suggest that to avoid such problems with future trials on intake and digestibility research workers should first respond to the plea of Raymond (1969) and standardize their methods, especially the level of excess feed.
If we consider the data for each group of forages in Chapter 5 separately, we may observe that a long interval of rT can be defined where the lines relating IT
and D T to rT do not intersect one another, i.e. where the individual forages are always ranked in the same order. In Fig. 8, for example, the line for Forage B is always below that for Forage A and that for Forage C below that for Forage B, if we exclude the levels of excess feed higher than 40%. The same holds for the curves for individual forages of other groups over long ranges of rT. Thus one may suggest that it is possible to decide on a certain level of excess feed and compare all forages at that level. The magnitude of the differences may vary with the level chosen but the poorer forage will be recognized as poorer, irrespective of the chosen level of excess feed if this is the same for all forages. However, it is impossible to feed precisely for a chosen level of excess feed (Section 2.2) and, as explained above, corrections cannot be made for deviations from the intended value.
A further argument against trying to feed for a certain level of excess feed is that the choice of level may affect not only the magnitude of differences between forages but also the order of ranking individual forages when we include a larger range of forages than within the individual groups described in the former chapter. To illustrate this, Fig. 22A depicts the curves for the relation between IT
and O T for six forages. Comparison of the residual variance of one line describing the data of two forages with the pooled variance obtained when the same data were described by separate lines for each forage showed that the six curves were all significantly different from one another (probability of F < 0.05 for the
72

lT/gd-'kg-°75
100
80
60
4 0
20
0 50 100
>jlQä' kg'
150 0 75
20 40 60
Fig. 22. Relationship between dry matter intake (IT) and level of feeding (O,-), and the corresponding relationship between IT and the level of excess feed (rT), for Forages K, L, E, P, A and R.
difference between Forages P and A and <0.01 for the difference between all other forages). Nevertheless each curve has a point in common with at least one of the other curves, i.e. they intersect one another. This means that when IT of, for instance C. pubescens (P) and S. guianensis (A) are compared a lower value is found for C. pubescens than for S. guianensis at levels of feeding below 78gd~ l k g - 0 7 5 . The reverse is however true at levels of feeding above 78 g d~l kg"075 . At O T = 7 8 , IT= 67 gd" 1 kg"0 7 5 for both forages. When these curves for the relationship between IT and O T are transformed into those for the relationship between IT and rT the point of intersection is found at r T = 14% (Fig. 22B). Other curves in Fig. 22 demonstrate quite clearly that the points of intersection may be either at low Oj- or rT, or at much higher levels.
Thus, even if a chosen level of excess feed could be achieved in practice, one would still be confronted with the question of what level of excess feed should be used for comparisons. A norm of 10 or 15% excess feed has been used by many workers and may be acceptable as a standard in trials on fine homogeneous forages or when the forages are used in intensive farming systems where larger refusals are not accepted. It is, however, evident that such a norm is quite arbitrary when applied in work on heterogeneous tropical forages. The response lines in Fig. 22 and the others shown in Chapter 5 indicate that any fixed standard for the level of excess feed in work on tropical forages must be considered as arbitrary and potentially misleading when comparisons are made between forages.
The methods used to measure the voluntary intake and digestibility of forages, especially those grown in the tropics should be modified. Intake and digestibility should not be measured at one but at a range of levels of excess feed. Besides, the relationship between intake and level of excess feed should not be determined by direct regression but should be derived from the relationship between intake and amount of dry matter offered (Chapter 4).
As yet this recommendation is based only on the statistical analysis of results (Chapter 5) which showed that measurements at more than one level of excess
73

feed are needed to avoid biases. Sections 6.2 and 6.3 attempt to relate the types of response curves to known characteristics of the feeds and to factors that play an important role in the regulation of feed intake by ruminants.
6.2 Factors causing differences in response curves
6.2.1 Introduction
In Chapter 5, it was established that animals may leave a considerable part of the offered forage at a certain level of feeding, suggesting that they reach satiety at that level, while similar animals eat considerably more of the same forage when a larger amount is offered. When a younger and older cut of the same forage are offered, the intake of the older material may be almost as large as that of the younger material at low levels of feeding, considerably less at medium levels, and again as large as that of the younger material at high levels of feeding. Moreover, the IT curves for different forages may intercept one another. This section and Section 6.3 attempt to explain some of these findings.
6.2.2 Selection for diet of higher digestibility
Feed intake by ruminants is controlled by a large complex of factors, which are not yet fully understood. See Baile & Forbes (1974), van der Honing (1975) and Rohr (1977) for recent reviews and further references. It is, however, generally accepted that - although deficiencies of specific nutrients, in particular protein, may considerably modify intake-intake of rations of low digestibility is primarily limited by physical factors related to the capacity of the reticulo-rumen and the rate of disappearance of digesta from that organ. Only when rations with a digestibility higher than a critical value are offered can the animal eat enough to meet its demand for energy. Feed intake is then controlled by physiological factors related to energy homoeostasis. Below the critical level of digestibility, voluntary intake increases with digestibility. A large number of authors have confirmed this positive relationship between voluntary intake and digestibility, either as such or as a related quantity such as content of digestible energy in dry matter or organic matter (e.g. Blaxter et al., 1961; Blaxter & Wilson, 1962; Conrad et al., 1964; Baumgardt, 1970). The digestibility above which this positive relation ceases is not constant but depends on the physiological state of the animal (Conrad et al., 1964; Baumgardt, 1970; Rohr, 1977) and on other characteristics of the ration, which may vary independently of digestibility, e.g. energy density and physical treatment like milling or pelleting (Baumgardt, 1970). For young growing sheep, the critical digestible energy content in dry matter was estimated by Dinius & Baumgardt (1970) and Baumgardt & Peterson (1971) at 10.5-ll.3M.Ikg~1, which corresponds to a dry matter digestibility of about 60-65% (Minson & Milford, 1966). The estimates of Baumgardt and his colleagues were based on trials with pelleted rations. For rations consisting of long or chopped forages, the critical digestibility may be even higher. Thornton & Minson (1972) suggest 65-70%.
74

Of the 203 measurements of digestibility in the CIAT trials, 148 (73%) were lower than 60 and only 26 (13%) were higher than 65%. In the trials with Desmodium distortion and in most trials with green Stylosanthes guianensis, dT
increased with the level of feeding so that this could at least in part explain the increase in IT. In several other trials, however, IT increased considerably with O T
without any apparent increase in dT. Most remarkable were the trials with the dried tops of S. guianensis and the Brachiaria spp. For the first batch of Centrosema pubescens, a sharp increase in IT and a decrease in dT with O T was observed. So changes in voluntary intake of some forages were correlated with differences in digestibility of the ingested material but, for many forages, changes in voluntary intake could not be related to differences in digestibility.
6.2.3 Presence of an inedible fraction
Analysis of the data for the first batch of Centrosema pubescens, both cuts of Desmodium distortum and two batches of threshed tops of Stylosanthes guianensis showed that a fraction varying from 6 to 22% of the total feed dry matter was completely unacceptable.
For C. pubescens, the unacceptable part of the feed was identified as soil and deteriorated stems. For the other forages, especially D. distortum, it was observed that animals at the lower levels of feeding ate all the leaves and other fine fractions and refused only stems. Besides, the animals selected also between stem material, so that only the poorer stems were refused. A plausible interpretation is that animals at the lower levels of feeding stopped eating, even though neither maximum fill of the reticulo-rumen nor maximum intake of digestible or metabolizable energy had been reached. In other words, IT could have been limited by the unattractive nature of the remaining forage, rather than by characteristics of the ingested forage. At the lower levels of feeding, IT was probably depressed by the amount of edible feed offered being less than maximum intake. The presence of an inedible fraction in the feed has a direct measurable effect on voluntary intake at low levels of feeding (Section 4.2).
6.2.4 Rate of passage of morphological components
For several forages, e.g. threshed tops of S. guianensis and Brachiaria mutica, IT was depressed at the lower levels of feeding even though there was still sufficient edible material to allow a larger intake and even though dT was not depressed. For these forages too, most of the leaves and other fine components were consumed at those intermediate levels of feeding and only stems were available for further intake. So one may suggest that, also at the intermediate levels of feeding of these forages, intake was depressed by the unattractive nature of the remaining stem even though at least parts of that stem were eaten at still lower levels of feeding.
Another explanation for the lower intake at intermediate levels of feeding of these and most other forages may, however, be found in a different rate of passage through the reticulo-rumen of the various morphological components of
75

the plant. Some of the earlier studies on intake of forages (e.g. Blaxter et al., 1961; Blaxter & Wilson, 1962; Conrad et al., 1964) suggest that the rate of passage of feed through the digestive tract is closely related to digestibility. Laredo & Minson (1973) and Thornton & Minson (1973) showed, however, that there may be large differences in rate of passage independent of digestibility. Laredo & Minson (1973) measured the voluntary intake and digestibility of the leaf and stem fractions of five tropical grasses, each harvested at three stages of maturity. They also estimated how long leaf and stem were retained in the rumen. The mean digestibility of leaf (52.6%) was significantly lower than of stem (55.8%). Nevertheless animals ate far more leaf than stem (means of 57.8 and 39.6 g d_1 kg -075, respectively). Laredo & Minson explained this by a much shorter time of retention in the reticulo-rumen (means of 23.5 h for leaf and 31.8 h for stem). They used a linear regression model to relate IT to the retention time but their data can equally well be described by a model of the form IT = c/R in which c is a constant reflecting the mass of dry matter in the rumen and R the retention time. Thus their animals ate less stem than leaf but not because they found stems less attractive and therefore stopped eating them at a lower fill of the reticulo-rumen (expressed as mass of dry matter). Stems had a greater filling effect because they were retained longer in the reticulo-rumen. Though the fill of the reticulo-rumen itself may vary, differences in retention time of leaves and stems are probably the dominant factor in intake of leaves and stems.
The study of Laredo & Minson (1973) provides data on the retention time of leaves and stems of grasses only. One would expect that for legumes too leaves would pass through the rumen quicker than stems. This assumption, together with the observed preference for leaves may also explain the depression of IT at the medium and lower levels of feeding in many of the CIAT trials. Fig. 23 illustrates expected IT at different levels of feeding of a forage with 50% leaves and 50% stems, if one assumes (1) that the animals can select 100% effectively between leaves and stems, (2) that intake of leaves alone does not exceed 70 gd_1 kg - 075
because of maximum fill of the reticulo-rumen, (3) that when a mixture of leaves
l T /Qd- 'kg - 0 7 5
100 RELATIVE FILL/%
100
50
J 0 0 20 40 60 80 100 120 140 160
0T /Bd- 'kg- 0 7 5
Fig. 23. Expected intake of leaves, stems and total dry matter of a forage containing 50% leaves and 50% stems with the four assumptions mentioned in the text.
76

and stems is eaten the rumen contains the same mass of dry matter as when leaves alone are eaten and (4) that stems are retained in the reticulo-rumen twice as long as leaves and therefore have twice the filling effect of leaf. With these assumptions, intake of dry matter would be 70gd_1 kg - 075 consisting only of leaves at feeding levels of 140 gd - 1 kg -075 or more. At a level of feeding of lOOgd-1 kg-0'75, the animals would eat all the available leaf (50 g). This would not be sufficient for maximum fill. So the animals can eat stem as well as the leaf, but not enough to bring total intake to the maximum intake of leaf (70 - 50 = 20), but only half of that. Thus at that level of feeding, IT would be depressed even though the total amount of available dry matter is not limiting. At a feeding level of 60gd"1 kg"075, the animal would eat 30 g d"1 kg"075 of leaf and £(70-30) = 20 of stem and thus 50 g d -1 kg -075 of total dry matter. At a level of feeding of 47gd_ 1 kg -075, intake of leaf would be 23.5 and the possible intake of stems 1(70-23.5) = 23.25. Total dry matter intake (46.75 gd"1 kg-0-75) would then be almost equal the amount offered. Even at that level of feeding, gut fill would still be maximum (Fig. 23). Only at levels of feeding of 46.7 g d_1 kg-0'75 or less would all the offered dry matter, including stems, be consumed, and the amount of dry matter in the reticulo-rumen be below its maximum. So the line relating IT to O T
depends on mass fraction of leaf in the offered forage, retention time of leaf (which determines maximum IT) and retention time of stem relative to that of leaf.
6.2.5 Rate of passage of stem parts
In the hypothetical example of Fig. 23, the relation between IT and O r was described by three straight lines, because the animals selected only between leaf and stem. However in most trials, the animals selected also between parts of stem. Visual observation and analysis for CP indicate that the animals, if fed on green unchopped legumes, eat first the tender tops of the stem and leave the harder lignified bottom parts till last. This pattern of selection would mean also a selection for stem fractions with a lower retention time in the rumen. As a result, the middle part of the line relating IT to O T in Fig. 23 can be expected to deviate from linearity. Fig. 24 gives the curves expected if the stem of the forage in Fig. 23 consisted of five parts with following retention times (multiples of the retention time of leaves):
part of stem
retention time
1
2 1.6 1.2 1.1
2
2 1.8 1.6 1.3
3
2 2.0 2.0 1.6
4
2 2.2 2.4 2.1
5
2 2.4 2.8 3.9
Mean
2 2 2 2
Curve in Fig. 24
a b c d
If the retention times of the different stem parts differ little from the mean of 2, the resulting Curve b deviates little from a straight line (a). Large differences in
77

If/gd-'kg-075
801
0 20 40 60 80 100 120 140 160 O f / g o - V 0 ' 5
Fig. 24. Expected relationship between dry matter intake (IT) and level of feeding (OT) of a forage containing 50% leaves, and 50% stems with a mean retention time twice that of leaves with the assumption that animals select between leaves and stems and distinguish five parts within the stem, a, no difference in retention time of different stem parts; b-d, retention time of stem parts differing as mentioned in the text.
retention time of different parts and the same mean of 2 can be achieved only if the best fractions have a retention time only slightly larger than that of leaves. The resulting Curve d deviates clearly from the straight line (a), but very nearly the same result would have been obtained if the first part of the stem had been included with the leaves and a slightly larger mean retention time than twice that for leaves had been assumed for the other stem parts.
6.2.6 Effectiveness of selection between morphological components
Animals on all forages selected sharply for leaf or leaf plus another non-stem component like inflorescence or petioles. If this selection had been 100% effective, all of these components would have been consumed at levels of feeding where the offered amount of that component did not exceed maximum IT. This was however, observed only with the two cuts of D. distortum (Fig. 15N2-02) and in one trial with long S. guianensis (Fig. 9E2). In all other trials, animals left some leaf and inflorescence at feeding levels higher than 100gd"1 kg -075.
Fig. 25 shows the lines relating the relative intake of leaves and inflorescence to the level of feeding for the different classes of forage. Each line was arrived at by averaging the lines for each class of forage: D. distortum, C. pubescens, long green S. guianensis, dried tops of S. guianensis, chopped green S. guianensis, B. mutica and B. decumbens. For dried tops of S. guianensis, the results with Forage M (Fig. 13) were not included in the average because of great differences from the other two forages of that group. The differences are in part explained by the fact that the amount of offered leaves and inflorescence exceeded the total IT of Forage M even at low levels of feeding.
Within each class of forages, there was some variation in these curves, so that the averaged lines in Fig. 25 must be treated with caution. Some valid differences can, nevertheless, be observed and an explanation for these differences may be suggested. The ranking of the lines in Fig. 25 probably reflects difficulties for the
78
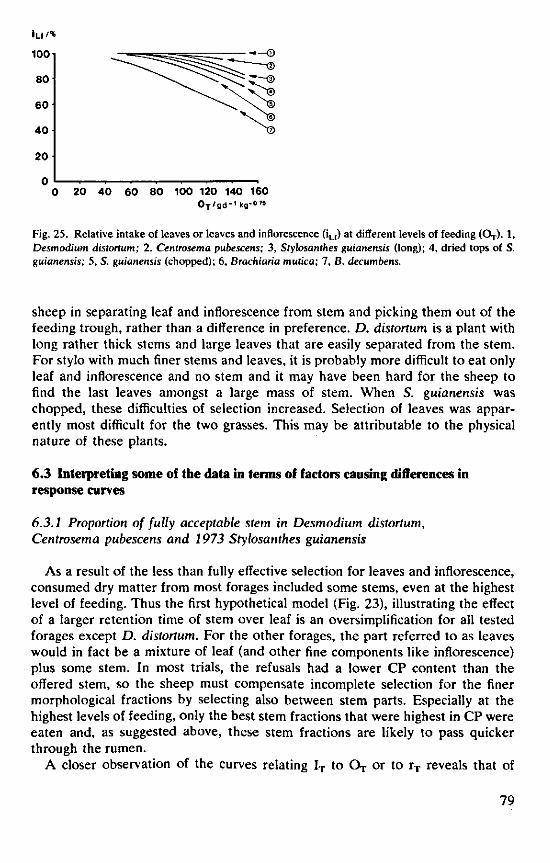
100
80
60
40
20
0 20 40 60 80 100 120 140 160 0T/gd-' kg-«78
Fig. 25. Relative intake of leaves or leaves and inflorescence (iLI) at different levels of feeding (OT ) . 1, Desmodium distortum; 2. Centrosema pubescens; 3, Stylosanthes guianensis (long); 4, dried tops of S. guianensis; 5, S. guianensis (chopped); 6, Brachiaria mutica; 7, B. decumbens.
sheep in separating leaf and inflorescence from stem and picking them out of the feeding trough, rather than a difference in preference. D. distortum is a plant with long rather thick stems and large leaves that are easily separated from the stem. For stylo with much finer stems and leaves, it is probably more difficult to eat only leaf and inflorescence and no stem and it may have been hard for the sheep to find the last leaves amongst a large mass of stem. When S. guianensis was chopped, these difficulties of selection increased. Selection of leaves was apparently most difficult for the two grasses. This may be attributable to the physical nature of these plants.
6.3 Interpreting some of the data in terms of factors causing differences in response curves
6.3.1 Proportion of fully acceptable stem in Desmodium distortum, Centrosema pubescens and 1973 Stylosanthes guianensis
As a result of the less than fully effective selection for leaves and inflorescence, consumed dry matter from most forages included some stems, even at the highest level of feeding. Thus the first hypothetical model (Fig. 23), illustrating the effect of a larger retention time of stem over leaf is an oversimplification for all tested forages except D. distortum. For the other forages, the part referred to as leaves would in fact be a mixture of leaf (and other fine components like inflorescence) plus some stem. In most trials, the refusals had a lower CP content than the offered stem, so the sheep must compensate incomplete selection for the finer morphological fractions by selecting also between stem parts. Especially at the highest levels of feeding, only the best stem fractions that were highest in CP were eaten and, as suggested above, these stem fractions are likely to pass quicker through the rumen.
A closer observation of the curves relating IT to O T or to rT reveals that of
79

several forages animals ate a considerable part of the stem in addition to their first choice of leaves and inflorescence plus some stems, without a measurable decrease in IT. Turning back to Fig. 24, one may consider that most IT curves correspond to Line d rather than to Line a. So when forages are sorted into morphological fractions to give a first estimate of the percentage readily acceptable material, part of the stem may have to be included with leaf or leaf plus inflorescence.
That this may be a considerable but varying part of the stem is illustrated by the data for D. distortum. Figs. 15 and 16 show that the IT of the younger D. distortum (Forage N) was only depressed at levels of feeding below about 85 g d"1 kg -075 or refusals below about 12%. So besides leaf, petiole and inflorescence, the animals ate nearly 70% of the stems without a decrease in intake. Only when, by offering less total dry matter than 85 g d~' kg"075, the animals were forced to accept also the last 12% of the total forage or the last 33% of the stems, was total IT depressed. Analysis of the data in Section 5.5 even suggests that the last 6.6% of dry matter or the last 18% of stem were not eaten at all. This could either reflect a very slow rate of passage of that stem or a situation where some part of the feed was refused because of its unattractive nature. The suggestion that animals on the younger D. distortum made a clear distinction between the first 70% of the stem and the last 30% is confirmed by the CP content of the residues. Because the residues of the younger D. distortum contained only stem, a comparison of CP content in the consumed and refused stem could be made. The data are presented in Fig. 26. The content of CP in dry matter of the refused stem was only a little less than in the offered stem when refused stem accounted for 50% or more of that offered; the difference was larger when the refused stem was 40% or less of that offered. After considering several explanations, I found that, to describe the content of CP in the refused and consumed stem in one consistent model, this could best be formulated as follows.
The animals distinguished effectively between two parts in the stem fraction, the first comprising about 70% of the total with a mean CP content of about 8.3% and the second comprising 30% of the total with a mean CP content of
CP content i%
9 i
8
7
6
0 20 40 60 80 100 Fraction of stem dry matter refused /%
Fig. 26. Effect of selection on the crude protein (CP) content of the refused and consumed dry matter of stem of Desmodium distortum. +, data on refused stems; O, data on consumed stems; , calculation on the basis of assumptions mentioned in the text.
80

about 6.3%. After eating the leaves, petioles and inflorescences, they ate the first part of the stem without measurable selection but distinguished that part effectively from the second part, which was only eaten after the first part was finished. No further selection was exercised within this second part.
The lines in Fig. 26 are based on these assumptions. Similar comparisons of the CP content of refused and consumed stem of the older D. distortum suggests that the animals showed a similar pattern of selection among stem parts of that forage except that the animals included in their first selection only 40% of the stem with a mean CP content of 7%, and left 60% with a mean CP content of 4.5%. These estimates are in agreement with the shape of the IT curves, which started to decrease significantly only at feeding levels below 130 g d_1 kg~° 75 or residues less than about 50%. The older D. distortum contained 68% stems. Thus some 30 to 35% of the stems were accepted without a depression in IT.
Similar observations apply to the first trial with C. pubescens (Forage P), where IT fell only below its maximum of 79.5 gd~* kg"075 at feeding levels below 100gd_1kg"0-75 or where rT was less than 21% (Figs. 17 and 18). That forage contained 35.8% leaf. Thus animals on that forage accepted nearly 75% of the offered stems without a decrease in IT.
The data for S. guianensis support the suggestion that animals accepted part of the stems of this forage without a decrease in IT. Quantitative estimates can only be made for the first series of trials with this forage because no asymptote of the IT curve was reached in the second (1974) series with long stylo. If the IT curves for the 1973 stylo are viewed alongside the mass fraction of stems in these forages, it may be estimated that about 70% of the stems of the 3-months regrowth and the 5-months first growth (Forages A and B, Section 5.1) were accepted before IT decreased but only some 20% of the stems of the older material (Forage C). That this small part of stems of the older stylo was accepted and some leaf and inflorescence was left uneaten may be due to the inability of the animals to avoid eating some stem along with the finer fractions. Estimates of the CP content of refused and consumed stems of this forage suggests, however, that the animals on the highest levels of feeding consumed stem of a high quality, with a CP content approaching that of leaves (CIAT, 1973). Analysis for CP and digestibility in vitro of different stem parts of mature and young S. guianensis (to be published) confirms that the quality of the youngest stem parts in older S. guianensis may be almost as high as in younger S. guianensis.
6.3.2 Response curves for older and younger cuts of Desmodium distortum and 1973 Stylosanthes guianensis
The leaves of old and young S. guianensis (Section 5.1) and of old and young D. distortum (Section 5.5) were of a similar chemical composition. Differences in the mean quality of the whole plant were mainly caused by a lower mass fraction of leaf and young stem and a higher mass fraction of mature stem in the older materials. When relatively small amounts of feed are offered, animals are forced
81

to eat those poor parts, the rate of passage of which through the digestive tract would be slow, and intake would be more depressed for old forage even when animals have the same gut fill. If large amounts of feed are offered, the animals eat only the better parts, which are of similar quality in young and old forage. Maximum intake of the older forage can, therefore, be as high as of the younger forage but this maximum will be reached only at a higher level of feeding. This may explain the shape of the IT curves for the older and younger stylo of 1973 (Fig. 7) and the two cuts of D. distortum (Fig. 15).
6.3.3 Response curves for 1974 Stylosanthes guianensis, threshed tops of S. guianensis and Brachiaria spp.
The curves for the 1974 stylo intercept those for the stylo of similar maturity of the 1973 series. IT of the 1974 stylo was lower at low levels of feeding and as large or larger at high levels of feeding. The lower intake at lower levels of feeding of the youngest material of the 1974 harvest (Forage D) than of the 1973 series (Forage A) may be related to the higher mass fraction of stem in the former (58.1 and 51.1%, respectively). The same was true for the first growth of 7-8 months (67.9 and 58.7% stems) but not for the 5-months regrowth (61.9 and 60.4% stems for the 1974 and 1973 harvests, respectively). Nevertheless, in material of this stage of growth, the difference in the IT curves for the 1973 and 1974 harvests was most apparent (P<0.01). No explanation was found. It can only be observed that at the lower levels of feeding the animals on the 1974 material ate as much leaf as those on the 1973 forage but less stem and that the IT
curve for the 1973 material levelled off at a plateau of 69 g d"1 kg~075 whereas the curve for the 1974 material continued to increase, almost straight, to 87 gd_1 kg -075 . Similarly, high intakes were measured for the 2-months regrowth of 1974 whereas they levelled off at 72gd - 1 kg -075 for the 3-months regrowth harvested in 1973. One possible explanation is that in 1974 animals with a higher demand for energy were used. In the 1973 trials, the DT curves showed a strong tendency to level off between 45 and 50 gd_1 kg - 075 (Fig. 7A3 and B3) whereas in 1974 they did not (Fig. 9D3 and E3). For all these four forages, dT reached 65% or more at the higher levels of feeding so that energy demand may regulate intake at the highest levels of feeding rather than physical factors related to gut fill.
The IT of the first two batches of threshed tops of S. guianensis (Forages K and L, Section 5.4) at the higher levels of feeding was as high or higher than that of any other forage tested. IT of the first batch was at all levels of feeding higher than that of Forage L but also IT of the latter rose to more than 85 g d -1 kg-0 7S. The higher intake of Forage K than of L may be related to the slightly higher stem content and lower digestibility of the latter. The digestibility of both forages was relatively low (56% for Forage K and 45-50% for Forage L), so that physical regulation is likely to have played the major role in determining intake. The large intakes at the higher levels of feeding indicate that the rate of passage of leaf and seedheads of these forages must have been quite high, despite the low digestibil-
82

ity. The strong depression of intakes at the lower levels of feeding may have been due to a very slow rate of passage of stems or the unattractive nature of the remaining stems causing the animals to cease eating at a lower gut fill.
Intake of the third forage in this class (M) levelled off at a much lower maximum, despite the lower stem content. Again the data do not provide a clear explanation. The lower intake of this forage was mainly due to a lower intake of stems, also relative to the amount of stem offered. This does not however, explain the low IT at the high levels of feeding where also more than 30% of the leaf and inflorescence were left uneaten.
The results of the trials with the two grasses confirm the significance of selection for leaves. The most striking difference between the two grasses was the extremely low intake of B. decumbens stems. The data suggest that, in estimating the edible yield of this grass, the stems must be almost completely disregarded. On the other hand, stems of B. mutica contributed to a considerable degree to the amount of edible material, so that the lower mass fraction of leaves was more than compensated. The extreme aversion to stems of B. decumbens was all the more striking because of their higher CP content (6.2%) than for B. mutica (2.1%). The comparison between the two grasses should be taken with considerable reserve because the stage of maturity and the soil on which they were grown differed. Nevertheless, it would seem justified to conclude that the pattern of selection is quite different for these two grasses and that this should be taken into account when measuring nutritive value.
6.4 Intake and digestibility trials in relation to the grazing animal
Most forages are used by grazing animals, so the final stage of forage selection must be the evaluation of these forages in grazing trials in which animal performance and persistence of the forage under grazing can be measured. Hutton & Henzell (1976) point out that detailed research on basic aspects of pasture plants and animal nutrition should be held back until persistent legumes and grasses have been selected and the problems of their use in pastures have been defined. It serves no purpose to make a detailed study of the nutritive value of a pasture plant if there is reason to suspect that its multiplication and persistence under grazing will hinder its use by the farmer. Grazing trials require, however, large areas of land and should be of long duration. They are, therefore, expensive and must be limited to a few pasture species. In most forage selection programmes, a need will, therefore, be felt for a means of preliminary screening a larger number of species and varieties. The first stage may include chemical analysis and the determination of digestibility in vitro in the laboratory. Only small amounts of forage are needed for this and many samples can be tested. This analysis does not, however, provide reliable information on voluntary intake by the animal. Although voluntary intake is correlated with several characteristics that can be determined in the laboratory, these correlations are generally far from perfect so that more direct information on intake as a major determinant of nutritive value and animal production is highly desirable. The measurement of voluntary intake
83

and digestibility in vivo with stall-fed animals requires more material than laboratory analysis but still far less than a grazing trial. Assays can, therefore, still include a relatively large number of samples. Such measurement may therefore be helpful as an intermediate stage in forage selection. Moreover, conditions under which such intake and digestibility trials are conducted can be more strictly controlled than in the field, so that the effect of a larger number of single factors can be studied.
If the tested forage is meant to be utilized by grazing animals, however, data on voluntary intake and digestibility as determined with stall-fed animals are only useful if they reflect what might be expected with grazing. Trials in which little or no selection is allowed often fail to do this ('t Mannetje, 1974).
Numerous scientific papers confirm what the observant herdsman, especially the herdsman in the tropics, must have known for centuries, namely that grazing animals eat forages selectively. The exact nature of this selection may not always have been apparent to the herdsman, but he can hardly have failed to notice that animals first eat leaves and tend to leave stems. Recent work in Australia has shown that feed intake by grazing cattle is largely determined by the leafiness and canopy structure of the sward, in particular leaf 'bulk density' (mass of leaf dry matter divided by area and height of sward) (Stobbs, 1973a, b; Stobbs & Hutton, 1974; Chacon & Stobbs, 1976; Chacon et al., 1978). The preference for leaves is so strong that when leaf concentration is low, bite size may decrease to such an extent that it cannot be compensated by the rate of biting so that daily intake decreases. Chacon et al. (1978) concluded that spatial distribution (mainly leaf concentration and mass ratio of leaf to stem) and nutritive value (mainly digestibility and nitrogen content) of herbage, particularly in the tops of the swards, influence the performance of animals. They add that greater consideration of the leafiness and nutrient content of herbage in the upper layer of the sward is required rather than of characteristics of the whole sward.
When intake and digestibility of forages are studied with stall-fed animals, the canopy structure of the sward is destroyed. This must be clearly recognized because it lowers the value of the resulting data. However if the forage is not chopped and is offered in a wide range of amounts, useful data may be obtained on the nutritive value of various fractions of the forage. The pattern of selection evident in all the CIAT trials with long forage legumes (first leaves and inflorescence or seedheads, together with the young tips of the stems, then the better part of the remaining stem, and finally the poorest part of the stem) would appear to be very much the same as the pattern of selection by the grazing animal as indicated by the observations of Stobbs and his colleagues for cattle and by Arnold (1960) for sheep. The ability of sheep to select in this way in metabolism cages may be exploited to arrive at more meaningful data on the nutritive value of pasture plants. When the forages are offered unchopped and in a wide range of amounts, intake, digestibility and nutrient composition of the consumed material at any level of excess feed can still be calculated by regression analysis. If desired, digestibility relative to the whole plant (without selection) can be derived too from the results of such trials. With the traditional methods of measuring voluntary intake, more than 10 animals are needed for each forage to detect real differences
84

of about 10 gcT1 kg"075 (Heaney et al., 1968). The value so obtained may still be open to question. The trials reported in this paper demonstrate that much more information can be collected with the same number of animals and without additional work other than regression analysis, instead of calculation of a simple mean. In fact, the method which was used in the CIAT trials is not only better from a theoretical point of view (Chapter 4); it also simplifies the experimental procedures by avoiding daily adjustments in the amount of feed offered. Further research, preferably with simultaneous measurements on grazing animals and sheep in metabolism cages should establish exactly how far the data can be used in evaluation of pasture plants.
85

Summary
The level of production by grazing animals is largely determined by the intake of digestible energy of pasture plants. Differences in intake of digestible energy from various forages may be due to differences in digestibility and in voluntary intake of dry matter. There is considerable evidence to show that differences in intake are at least as important as differences in digestibility. So the measurement of voluntary intake is an important aspect of the nutritive evaluation of forage crops.
To measure the voluntary intake of forages, these must be offered ad libitum, i.e. the amount offered should be in excess of the consumption. The review of the literature (Chapter 2) shows that the amount of excess feed offered is quite variable, especially in work on tropical forages. Some workers give as little as 5 or 10% more than the expected intake while others go as high as 50% or more, i.e. accept a refusal of 30% or more of the amount offered. This may cause large differences in the degree of selection between different morphological components of the feed especially when sheep are used as experimental animal. The degree of selection may be further varied by either chopping the forages or not.
The literature provides only limited data on the effects of level of excess feed on the results of intake and digestibility trials. To study these effects, a series of experiments was conducted at the Centro Internacional de Agricultura Tropical (CIAT), Cali, Colombia (Chapter 3). The following forages were used: Stylosanthes guianensis (three cuts harvested in 1973; four cuts harvested in 1974; three samples of threshed tops), Desmodium distortum (two cuts), Cen-trosema pubescens (two samples), Brachiaria mutica and B. decumbens (one sample of each). All forages were offered long. Three of the 1974 cuts of S. guianensis were, however, also offered after chopping. All forages were offered to 6-23 sheep. Every animal within a trial received a different amount of forage. For each forage, the largest amount offered was at least 58gd~'kg (liveweight)-0'75 higher than the smallest amount. The following data were collected: voluntary intake of dry matter, intake of various morphological components such as leaves and stems, digestibility and content of digestible crude protein in ingested dry matter.
Chapter 4 shows that variation in intake between animals causes a systematic underestimate of the effect of level of excess feed on voluntary intake of dry matter, if this effect is estimated by direct regression of intake on the level of excess feed (refusal) by individual animals. To arrive at correct estimates, the intake data must be analysed by relating them to the amount of dry matter offered and subsequent transformation of this relationship into that between intake and level of excess feed. Similar procedures should be followed when studying the
86

effect of level of excess feed, for instance on intake of digestible dry matter or intake of digestible crude protein. On the other hand, data on the quality of the ingested material such as digestibility and digestible crude protein content may be directly related to the level of excess feed.
The second part of Chapter 4 shows that a number of restrictions must be imposed on regression models relating intake of dry matter to the amount of dry matter offered. The regression model used for analysis of the data describes this relationship in terms of three parameters: p, the mass fraction of the feed that is edible; m, maximum intake at high levels of feeding; and h, a shape parameter indicating the depression of intake at intermediate levels of feeding.
Analysis of the data (Chapter 5) showed that only with one forage (D. distortum harvested at an early stage of maturity) was maximum intake of dry matter obtained at a level of excess feed equal to 15% of the amount offered. With some other feeds, increases of intake with the level of excess feed beyond 15% were relatively small. With the majority of the feeds, dry matter intake measured at 15% residue was far below maximum. In several tests, intake continued to increase until levels of feeding providing 40% excess or more. Moreover, in 9 out of 19 trials a significant increase in dry matter digestibility was found with increasing levels of excess feed. Even more pronounced increases in the content of digestible crude protein in the consumed dry matter were found. When the stylo was chopped, these effects were smaller but by no means absent. A repeated analysis of data from the literature showed also pronounced effects of varying levels of excess feed on the intake of chopped Canadian forages.
These results lead to the conclusion that many of the published data on voluntary intake of dry matter or digestible dry matter from tropical forages are not mutually comparable because of the large variation in the level of excess feed in the various trials. Even if the same level of excess feed were reported for trials on two forages, the data may not be comparable: the few papers that provide the necessary information show that the actual levels of excess feed may deviate considerably from the intended values (Chapter 2).
The response curves for various forages (Section 6.1) intersected one another so that the ranking order of the forages varied with the level of excess feed. The points of intersection may be either at low levels or at much higher level of excess feed. So any standard for the level of excess feed in experimental work on tropical forages is largely arbitrary because the degree of selection allowed by the practical farmer may vary considerably.
In all trials with long forages, there was a sharp selection between leaves and stems, and for most types of forage even between different parts of stem (Chapter 5). This pattern of selection, in combination with factors assumed to play an important role in the regulation of feed intake by ruminants, helps to clarify the differences between the response curves for younger and older cuts of the same forage species (Sections 6.2 and 6.3). For some forages, a large part of the stems is accepted in addition to the leaves without a decrease in voluntary intake while this is not so for other forages. The pattern of selection observed in the trials seems similar to that by grazing animals. Research should exploit this characteristic of stall-fed sheep in order to arrive at more meaningful data on tropical forages intended for grazing.
87

Resumen
El nivel de producción de los animales en pastoreo es determinado, en gran parte, por el consumo diario de energfa digerible de los forrajes. Las diferencias en el consumo de energïa digerible de distintos forrajes pueden ser debidas a diferencias en la digestibilidad y en el consumo voluntario de materia seca. Existe considerable información que sugiere que las diferencias en el consumo voluntario pueden ser tan importantes como las diferencias en la digestibilidad. Esto implica que la determinación del consumo voluntario es un aspecto importante en la evaluación nutritiva de los forrajes.
Para medir el consumo voluntario de forrajes hay que suministrarlos a volun-tad. En el resumen de la literatura (Capïtulo 2) se muestra que el exceso que se suministra es muy variable, especialmente en investigaciones con forrajes tropicales. Algunos investigadores of reeen solo 5 ó 10% mâs que el consumo anticipado, mientras que otros ofrecen un exceso tan alto como 50% ó mâs, es decir, aceptan un rechazo de 30% ó mâs de la cantidad ofrecida. Esto puede causar diferencias considerables en el grado de selección entre varias fracciones morfológicas de los forrajes, especialmente cuando se usan ovinos como animales expérimentales. Ademâs, el grado de selección puede variar dependiendo de que los forrajes sean picados ó no.
La literatura provee datos muy limitados sobre el efecto de rechazos variables en los resultados de pruebas de consumo y digestibilidad. Con el fin de estudiar estos efectos se realizaron una serie de pruebas en el Centro Internacional de Agricultura Tropical (CIAT), Cali, Colombia (Capïtulo 3). Se usaron los siguientes forrajes: Stylosanthes guianensis (tres cortes cosechados en 1973; cuatro cortes cosechados en 1974; tres lotes de pasto trillado - partes superiores de la planta-); Desmodium distortum (dos cortes); Centrosema pubescens (dos lotes); Brachiaria mutica y B. decumbens (un lote de cada uno). Todos los forrajes se suministraron sin ser picados. Tres de los cortes de S. guianensis de 1974 fueron suministrados picados y no picados. Se suministraron todos los forrajes a 6-23 animales, cada uno de los animales recibiendo una cantidad distinta y para todos los forrajes cubriendo un rango de 58 g de materia seca por kg de peso metabólico por dia, pudiendo ser ese rango aûn mayor. Se determina-ron los siguientos datos: consumo voluntario de materia seca, consumo de varias componentes morfológicos como tallos y hojas, digestibilidad y contenido de proteïna cruda digerible de la materia seca ingerida.
En el Capïtulo 4 se muestra que la variación en el consumo entre los animales causa una subestimación del efecto del nivel del sobrante sobre el consumo voluntario de materia seca, si este efecto se estima por regresión directa de los datos del consumo y del rechazo por parte de los animales. Para Ilegar a una
88

estimación correcta hay que determinar la relación entre consumo y cantidad ofrecida y luego transformarlo en una relación entre consumo y sobrante. Métodos similares se deben usar para la determinación del efecto del nivel del sobrante sobre el consumo de la materia seca digerible, consumo de proteïna cruda digerible, etc. Por otro lado, el efecto del nivel del sobrante sobre datos relacionados a la calidad del material ingerido, como digestibilidad y contenido de proteïna cruda digerible se puede determinar por regresión directa.
En la segunda parte del Capïtulo 4 se muestra la necesidad de imponer algunas restricciones sobre los modelos de regresión entre el consumo voluntario y la cantidad de materia seca ofrecida. El modelo usado por el presente estudio permite caracterizar los forrajes en términos de tres paramètres: p, el tamano de la fracción comestible; m, el consumo mäximo en altos nivelés de suministro; y h, un indicador de la depresión del consumo a nivelés de suministro intermedios.
El anâlisis de los datos (Capitulo 5) muestra que sólamente con un forraje (D. distortum cosechado en un estado de madurez temprana) se llegó al mâximo consumo con un nivel de exceso del 15% de la cantidad suministrada. Con la mayorîa de los forrajes el consumo voluntario en este nivel de exceso fue muy inferior al consumo mâximo. En varios casos el consumo siguió subiendo hasta nivelés de exceso de 40% ó mâs. En nueve de las 19 pruebas se encontraron aumentos significativos en la digestibilidad con el nivel del exceso. Se encontraron aumentos aûn mâs marcados en el contenido de proteïna cruda digerible. En el caso de forrajes picados estos efectos fueron menos marcados pero de ningûn modo ausentes. La aplicación del anâlisis empleado con los datos reportados en la literatura mostró igualmente un efecto muy marcado del nivel del exceso sobre el consumo voluntario de forrajes Canadienses picados.
Las observaciones susodichas permiten concluir que muchos de los datos publicados sobre consumo voluntario de materia seca total o digerible de forrajes tropicales no son comparables entre si, debido a la gran variación en el nivel del sobrante en las pruebas. Aûn cuando se mencione el mismo nivel de exceso en pruebas con dos forrajes es posible que los datos no sean comparables: los pocos artîculos que proveen la información necesaria indican que los nivelés de exceso empleados pueden desviarse considerablemente de los nivelés intencionales (Capitulo 2).
Comparando las curvas de respuesta para varios forrajes se observe que ellas se intersectan, de tal manera que la clasificación de los forrajes se varia con el nivel del exceso. Los puntos de intersección pueden observarse con nivelés de exceso bajos o altos, lo cual implica que cualquier norma para un determinado nivel de exceso en trabajos expérimentales con forrajes tropicales puede ser arbitrario por la elevada variabilidad en el grado de selección que se permite en el uso prâctico de los forrajes.
En todas las pruebas en que se suministro forrajes enteros se observé una selección bastante efectiva entre hojas y tallos, y en la mayorîa de los casos, aûn dentro de las fracciones de los tallos (Capitulo 5). Este tipo de selección, junto con factores importantes en la regulación del consumo por los rumiantes puede ayudar a entender las diferencias en las curvas de respuestas entre cortes jóvenes y viejos de una misma especie de forraje (Secciôn 6.2 y 6.3). En algunos forrajes los
89

animales, después de ingerir las hojas, ingieren gran parte de los tallos sin disminuir el consumo total esperado, pero esto no ocurre con otros forrajes. El tipo de selección por ovinos en establo observado en las pruebas parece ser similar a lo de los animales en pastoreo. Por lo tanto se sugiere que investigadores podrian aprovechar esa cualidad de ovinos para llegar a una evaluación mas précisa de forrajes tropicales.
90

Samenvatting
De produktiviteit van grazende dieren wordt hoofdzakelijk bepaald door de opname van verteerbare energie van weideplanten. Verschillen in opname van verteerbare energie uit verschillende ruwvoeders kunnen het gevolg zijn van verschillen in verteerbaarheid en verschillen in opname van droge stof. Er zijn sterke aanwijzingen dat verschillen in opname minstens even belangrijk zijn als verschillen in verteerbaarheid. Het meten van de ad libitum opname van droge stof is daarom een belangrijk onderdeel van het bepalen van de voederwaarde van ruwvoeders.
Om de ad libitum opname van een voeder te meten moet men een overmaat aanbieden. Dat wil zeggen dat de aangeboden hoeveelheid groter moet zijn dan de opname. Uit het overzicht van de literatuur (hoofdstuk 2) blijkt dat de grootte van de verstrekte overmaat zeer variabel is, vooral in proeven waarin de opname van tropische ruwvoeders wordt gemeten. Sommige onderzoekers geven slechts 5 of 10% meer dan de verwachte opname terwijl anderen een overmaat van 50% of meer geven, met andere woorden, accepteren dat 30% of meer van het aangeboden voer wordt geweigerd. Dit kan grote verschillen veroorzaken in de mate van selectie tussen verschillende morfologische componenten van de voeders, vooral indien de proeven worden gedaan met schapen. De mate van selectie kan verder worden beïnvloed door de voeders al of niet te hakselen.
De literatuur bevat slechts beperkte gegevens over de invloed van de verstrekte overmaat op de resultaten van opname- en verteringsproeven. Om deze effecten te meten werd een aantal proeven uitgevoerd op het Centro Internacional de Agricultura Tropical (CIAT), Cali, Colombia (hoofdstuk 3). De volgende voeders werden gebruikt: Stylosanthes guianensis (3 sneden geoogst in 1973; 4 sneden geoogst in 1974; 3 partijen gedorste toppen), Desmodium distortum (2 sneden), Centrosema pubescens (2 partijen), Brachiaria mutica en B. decumbens (van beide 1 snede). Alle voeders werden verstrekt als lang ruwvoeder. Drie van de in 1974 geoogste sneden van S. guianensis werden echter ook verstrekt na te zijn gehakseld. Elk voeder werd, in variërende hoeveelheden, verstrekt aan 6 tot 23 hamels. Voor elk voeder was de hoogste gift ten minste 58gd~'kg (levend gewicht)-0,75 hoger dan de laagste gift. Van elk dier werden de volgende gegevens verzameld: opname van droge stof, opname van verschillende morfologische componenten zoals blad en stengel, verteerbaarheid en gehalte aan voeder-normruweiwit van de opgenomen droge stof.
In hoofdstuk 4 wordt aangetoond dat variatie in opname tussen dieren leidt tot een onderschatting van het effect van overmaat op opname van droge stof indien men dit effect schat door regressie van opname op overmaat per dier. Om tot een juiste schatting van dit effect te komen, moet men eerst de relatie tussen opname
91

en aanbod vaststellen en uit deze de relatie tussen opname en overmaat afleiden. Soortgelijke methoden dient men te volgen voor het bepalen van het effect van overmaat op bijvoorbeeld opname van verteerbare droge stof en opname van voedernormruweiwit. Het effect van overmaat op de kwaliteit van de opgenomen droge stof, zoals de verteerbaarheid en het gehalte aan voedernormruweiwit, kan worden geschat door regressie van deze gegevens op overmaat.
Het tweede deel van hoofdstuk 4 toont aan dat ten aanzien van regressiemodellen voor de beschrijving van de relatie tussen opname en aanbod een aantal beperkingen moeten worden opgelegd. Het model dat werd gebruikt voor de analyse van de proefuitkomsten beschrijft deze relatie door middel van drie parameters: p, de grootte van de eetbare fractie; m, de maximale opname bij een groot aanbod; en h, een maat voor de daling van de opname bij een middelmatig hoog aanbod.
Bij de analyse van de proefuitkomsten bleek dat de maximale opname van slechts een van de voeders (D. distortum geoogst in een vroeg groeistadium) was bereikt bij een overmaat van 15% van het aanbod. Bij sommige andere voeders was de verdere stijging van de opname bij meer overmaat betrekkelijk gering. Bij de meerderheid van de voeders was de opname gemeten bij 15% overmaat ver beneden de maximale opname. Bij verschillende voeders bleef de opname stijgen tot 40% of meer overmaat. Bovendien werd bij 9 van de 19 proeven bij toenemende overmaat een statistisch significante stijging van de verteerbaarheid waargenomen. Stijgingen in gehalte aan voedernormruweiwit in de opgenomen droge stof waren nog sterker. Bij de gehakselde S. guianensis waren deze effecten minder groot maar zeker niet afwezig. Bij bewerking van gegevens uit de literatuur werd ook een grote invloed van het percentage overmaat op de opname van gehakselde Canadese ruwvoeders gevonden.
Deze uitkomsten leiden tot de conclusie dat veel van de gepubliceerde cijfers over de opname van tropische ruwvoeders onderling niet vergelijkbaar zijn omdat de verstrekte overmaat bij opnameproeven sterk varieert. Zelfs indien de beschrijving van de methoden dezelfde overmaat aangeeft kan vergelijking van de resultaten misleidend zijn: uit de weinige artikelen die de daarvoor nodige informatie geven, blijkt dat de overmaat die in werkelijkheid werd gegeven sterk kan afwijken van de voorgenomen overmaat (hoofdstuk 2).
De responsiecurves voor een aantal voeders kruisten elkaar (paragraaf 6.1), zodat de rangorde van de voeders verschilde al naar gelang het percentage overmaat waarbij deze werd vastgesteld. De kruispunten lagen in sommige gevallen bij een geringe overmaat, in andere gevallen bij een veel grotere overmaat. Elke vaste norm voor de overmaat waarbij de opname van tropische ruwvoeders wordt gemeten is in hoge mate arbitrair omdat de mate van selectie die bij het praktisch gebruik van deze voeders wordt toegestaan sterk kan variëren.
In alle proeven met ongehakselde voeders werd een scherpe selectie tussen blad en stengel waargenomen en bij de meeste voeders ook selectie tussen stengeldelen (hoofdstuk 5). Deze wijze van selectie, gecombineerd met factoren waarvan verondersteld mag worden dat zij een belangrijke rol spelen bij de regulatie van voederopname door herkauwers, leidt tot een mogelijke verklaring van de
92

verschillen in responsiecurves voor jongere en oudere sneden van hetzelfde gewas (paragraaf 6.2 en 6.3). Van sommige voeders wordt naast het blad ook een groot gedeelte van de stengel gegeten zonder dat dit leidt tot een lagere totale opname. Bij andere voeders is dit niet het geval.
De wijze van selectie die werd waargenomen in de proeven, lijkt sterk op de wijze van selectie door het grazende dier. Onderzoekers zouden gebruik moeten maken van dit vermogen van op stal gevoederde schapen om op die wijze te komen tot meer realistische cijfers over de voederwaarde van tropische ruwvoeders.
93

References
Ademosum, A. A., B. R. Baumgardt & J. M. Scholl, 1968. Evaluation of a sorghum-sudangrass hybrid at varying stages of maturity on the basis of intake, digestibility and chemical composition. Journal of Animal Science 27: 818-823.
Ammerman, C. B., G. J. Verde, J. E. Moore, W. C. Burns & C. F. Chicco, 1972. Biuret, urea and natural proteins as nitrogen supplements for low quality roughage for sheep. Journal of Animal Science 35: 121-127.
Andrieu, J. & C. Demarquilly, 1974a. Valeur alimentaire du maïs fourrage II. Influence du stade de végétation, de la variété, du peuplement, de l'enrichissement en épis et de l'addition d'urée sur la digestibilité et l'ingestibilité de l'ensilage de maïs. Annales de Zootechnie 23: 1-25.
Andrieu, J. & C. Demarquilly, 1974b. Composition chimique, digestibilité et ingestibilité d'un maïs mâle-stérile, sur pied et après ensilage. Annales de Zootechnie 23: 423-434.
Arnold, G. W., 1960. Selective grazing by sheep of two forage species at different stages of growth. Australian Journal of Agricultural Research 11: 1026-1033.
Baile, C. A. & J. M. Forbes, 1974. Control of feed intake and regulation of energy balance in ruminants. Physiological Reviews 54: 160-214.
Baldwin, J. A., J. F. Hentges, L. O. Bagnall & R. L. Shirley, 1975. Comparison of pangolagrass and water hyacinth silages as diets for sheep. Journal of Animal Science 40: 968-971.
Barnes, R. F., 1968. Variability within and among experiment stations in the determination of in vivo digestibility and intake of alfalfa. Journal of Animal Science 27: 519-524.
Baumgardt, B. R., 1970. Control of feed intake in the regulation of energy balance. In: A. T. Philipson (editor): Physiology of digestion and metabolism in the ruminant. Oriel Press Ltd., Newcastle upon Tyne, England.
Baumgardt, B. R. & A. D. Peterson, 1971. Regulation of food intake in ruminants 8. Caloric density of diets for young growing lambs. Journal of Dairy Science 54: 1191-1194.
Blaxter, K. L. & R. S. Wilson, 1962. The voluntary intake of roughages by steers. Animal Production 4: 351-358.
Blaxter, K. L., F. W. Wainman & R. S. Wilson, 1961. The regulation of food intake by sheep. Animal Production 3: 51-61.
Bogdan, A. V., 1977. Tropical pasture and fodder plants; grasses and legumes. Longman, London. Brinckman, W. L., 1975. The feeding value of five different hays as fed to sheep. Nigerian Journal of
Animal Production 1: 225-230. Brown, R. H., R. E. Blaser & J. P. Fontenot, 1968. Effect of spring harvest data on nutritive value of
orchardgrass and timothy. Journal of Animal Science 27: 562-567. Butterworth, M. H., 1965. Some aspects of the utilization of tropical forages I. Green elephant grass
at various stages of growth. The Journal of Agricultural Science, Cambridge 65: 233-239. Butterworth, M. H., 1967. The digestibility of tropical grasses. Nutrition Abstracts and Reviews 37:
349-368. Butterworth, M. H. & J. P. Butterworth, 1965. Some aspects of the utilization of tropical forages 2.
Pangola and coastal Bermuda hays. The Journal of Agricultural Science, Cambridge 65: 389-395. Cammell, S. B., 1977. Equipment and techniques used for research into the intake and digestion of
forages by sheep and calves. Grassland Research Institute, Hurley. Technical Report No. 24. Chacon, E. & T. H. Stobbs, 1976. Influence of progressive defoliation of a grass sward on the eating
behaviour of cattle. Australian Journal of Agricultural Research 27: 709-727. Chacon, E. A., T. H. Stobbs & M. B. Dale, 1978. Influence of sward characteristics on grazing
behaviour and growth of Hereford steers grazing tropical grass pastures. Australian Journal of Agricultural Research 29: 89-102.
94

Chalupa, W. & M. E. McCullough, 1967. Nutritional evaluation of forage crops regional research project S-45. Journal of Animal Science 26: 1135-1143.
Chenost, M., 1972a. Observations préliminaires sur la comparaison du potential digestif et de l'appétit des caprins et des ovins en zone tropicale et en zone tempérée. Annales de Zootechnie 21: 107-111.
Chenost, M., 1972b. Observations préliminaires sur les variations saisonnières de la quantité d'aliment ingérée par les caprins en milieu tropical humide. Annales de Zootechnie 21: 113-120.
Chenost, M., 1975. La valeur alimentaire du pangola (Digitaria decumbens STENT.) et ses facteurs de variation, en zone tropicale humide. Annales de Zootechnie 24: 327-349.
CIAT, 1972. Annual report of the Centra Internacional de Agricultura Tropical (CIAT), Cali, Colombia.
CIAT, 1973. Annual report of the Centra Internacional de Agricultura Tropical (CIAT), Cali, Colombia.
Colovos, N. F., J. B. Hoher, R. M. Koes, W. E. Urban & H. A. Davis, 1970. Digestibility, nutritive value and intake of ensiled corn plant (Zea mays) in cattle and sheep. Journal of Animal Science 30: 819-824.
Combellas, J. & E. Gonzalez J., 1972a. Rendimiento y valor nutritivo de forrajes tropicales 2. Cenchrus ciliaris L. cv. Biloela. Agronomîa Tropical, Revista del Centra de Investigaciones Agronómicas, Maracay 22: 623-634.
Combellas, J. & E. Gonzalez J., 1972b. Rendimiento y valor nutritivo de forrajes tropicales 3. Panicum maximum var. trichoglume. Agronomîa Tropical, Revista del Centro de Investigaciones Agronómicas, Maracay 22: 635-641.
Combellas, J. & E. Gonzalez J., 1973a. Rendimiento y valor nutritivo de forrajes tropicales 4. Pasto alemân (Echinochloa polystachya (H.B.K.) Hitchc). Agronomîa Tropical, Revista del Centro de Investigaciones Agronómicas, Maracay 23: 269-275.
Combellas, J. & E. Gonzalez J., 1973b. Rendimiento y valor nutritivo de forrajes tropicales 5. Pasto para {Brachiaria mulica stapf). Agronomîa Tropical, Revista del Centro de Investigaciones Agronómicas, Maracay 23: 277-286.
Combellas, J., E. Gonzalez J. & A. Trujillo, 1972a. Rendimiento y valor nutritivo de forrajes tropicales 1. Bermuda cv. Coastal (Cynodon dactylon) (L) Pers.). Agronomîa Tropical, Revista del Centro de Investigaciones Agronómicas, Maracay 22: 231-238.
Combellas, J., A. Centeno, B. Mazzani & J. Combellas, 1972b. Aprovechamiento de la parte aérea del mam 2. Henificación, consumo y digestibilidad in vivo. Agronomîa Tropical, Revista del Centro de Investigaciones Agronómicas, Maracay 22: 281-285.
Conrad, H. R., A. D. Pratt & J. W. Hibbs, 1964. Regulation of feed intake in dairy cows. 1. Change in importance of physical and physiological factors with increasing digestibility. Journal of Dairy Science 47: 54-62.
Crampton, E. W., 1957. Interrelations between digestible nutrient and energy content, voluntary dry matter intake, and the overall feeding value of forages. Journal of Animal Science 16: 546-552.
Crampton, E. W., E. E. Lister & L. E. Lloyd, 1957. Voluntary intake of forage as a measure of its feeding value. Journal of Animal Science 16: 1056 (Abstract).
Crampton, E. W., E. Donefer & L. E. Lloyd, 1960. A nutritive value index for forages. Journal of Animal Science 19: 538-544.
Curnow, R. N., 1973. A smooth population response curve based on an abrupt threshold and plateau model for individuals. Biometrics 29: 1-10.
Demarquilly, C , 1969. Valeur alimentaire du maïs fourrage I. Composition chimique et digestibilité du maïs sur pied. Annales de Zootechnie 18: 17-32.
Demarquilly, C , 1970a. Influence de la déshydratation a basse température sur la valeur alimentaire des fourrages. Annales de Zootechnie 19: 45-51.
Demarquilly, C , 1970b. Évolution de la digestibilité et de la quantité ingérée des plantes entières d'avoine, de blé et d'orge entre la floraison et la maturation du grain. Annales de Zootechnie 19: 413-422.
Demarquilly, C , 1970c. Influence de la fertilisation azotée sur la valeur alimentaire des fourrages verts. Annales de Zootechnie 19: 423-437.
95

Demarquilly, C , 1973. Composition chimique, caractéristiques fermentaires, digestibilité et quantité ingérée des ensilages de fourrages: modifications par rapport au fourrage vert initial. Annales de Zootechnie 22: 1-35.
Demarquilly, C. & J. Andrieu, 1972. Composition chimique, digestibilité et ingestibilité de la plante de tournesol sur pied et après ensilage. Annales de Zootechnie 21 : 147-162.
Demarquilly, C. & R. Jarrige, 1964. Valeur alimentaire de l'herbe des prairies temporaires aux stades d'exploitation pour le pâturage I. Composition chimique et digestibilité. Annales de Zootechnie 13: 301-340.
Demarquilly, C. & R. Jarrige, 1970. The effect of method of forage conservation on digestibility and voluntary intake. Proceedings of the 11th International Grassland Congress, Surfers Paradise, Queensland, Australia, 13-23 April 1970: 733-737.
Demarquilly, C. & M. Journet, 1967. Valeur alimentaire des foins condensés I. Influence de la nature du foin et de la finesse de broyage sur la digestibilité et la quantité ingérée. Annales de Zootechnie 16: 123-150.
Devendra, C , 1975. The intake and digestibility of Napier grass (Pennisetwn purpureum) at four, five and six weeks of growth by goats and sheep in Trinidad. Turrialba 25: 226-231.
Dinius, D. A. & B. R. Baumgardt, 1970. Regulation of food intake in ruminants. 6. Influence of caloric density of pelleted rations. Journal of Dairy Science 53: 311-316.
Dixon, W. J. (editor), 1973. Biomedical computer programs (BMD). University of California Press, Berkeley, U.S.A. (3rd edition).
Djafar, M. I. & C. F. Yuen, 1972. Nutritive values of four grasses grown in Malaysia. Malaysian Agricultural Research 1: 110-117.
Donefer, E., 1966. Collaborative in vivo studies on alfalfa hay. Journal of Animal Science 25: 1227-1231.
Dulphy, J. P., 1972. Étude de quelques relations entre le mode de conservation du fourrage ingéré et le comportement alimentaire et mérycique des moutons. Annales de Zootechnie 21: 429-441.
Dulphy, J. P. & C. Demarquilly, 1972. Influence de la finesse de hachage des ensilages de graminées sur le comportement alimentaire de moutons. Annales de Zootechnie 21 : 443-449.
Dulphy, J. P. & C. Demarquilly, 1973. Influence de la machine de récolte et de la finesse de hachage sur la valeur alimentaire des ensilages. Annales de Zootechnie 22: 199-217.
Dulphy, J. P. & B. Michalet, 1975. Influence comparée de la machine de récolte sur les quantités d'ensilage ingérées par des génisses et des moutons. Annales de Zootechnie 24: 757-763.
Elliott, R. C , 1967a. Voluntary intake of low-protein diets by ruminants I. Intake of food by cattle. The Journal of Agricultural Science, Cambridge 69: 375-382.
Elliott, R. C , 1967b. Voluntary intake of low-protein diets by ruminants II. Intake of food by sheep. The Journal of Agricultural Science, Cambridge 69: 383-390.
Fick, K. R., C. B. Ammerman, C. H. McGowan, P. E. Loggins & J. A. Cornell, 1973. Influence of supplemental energy and biuret nitrogen on the utilization of low quality roughage by sheep. Journal of Animal Science 36: 137-143.
Forbes, J. M., 1970. Voluntary food intake of pregnant ewes. Journal of Animal Science 31: 1222-1227.
Garcia, I. A., J. J. Montilla & L. E. Mathison, 1972. Evaluation nutritiva de la alfalfita (Indigofera sp) en rumiantes. Agronomia Tropical, Revista del Centro de Investigaciones Agronómicas, Maracay 22: 299-303.
Geoffroy, F., 1974. Étude comparée du comportement alimentaire et mérycique de deux petits ruminants: la chèvre et le mouton. Annales de Zootechnie 23: 63-73.
Gibb, M. J. & T. T. Treacher, 1976. The effect of herbage allowance on herbage intake and performance of lambs grazing perennial ryegrass and red clover swards. The Journal of Agricultural Science, Cambridge 86: 355-365.
Grieve, C. M. & D. F. Osbourn, 1965. The nutritional value of some tropical grasses. The Journal of Agricultural Science, Cambridge 65: 411-417.
Haggar, R. J., 1972. The intake and digestibility of low quality Andropogon gayanus hay, supplemented with various nitrogenous feeds, as recorded by sheep. Nigerian Agricultural Journal 7: 70-75.
96

Haggar, R. J. & M. B. Ahmed, 1970. Seasonal production of Andropogon gayanus II. Seasonal changes in digestibility and feed intake. The Journal of Agricultural Science, Cambridge 75: 369-373.
Harmon, B. W., J. P. Fontenot & K. E. Webb, 1975. Ensiled broiler litter and corn forage. II. Digestibility, nitrogen utilization and palatability by sheep. Journal of Animal Science 40: 156-160.
Hawkins, D. R., H. E. Henderson & D. B. Purser, 1970. Effect of dry matter levels of alfalfa silage on intake and metabolism in the ruminant. Journal of Animal Science 31: 617-625.
Heaney, D. P., 1970. Voluntary intake as a component of an index to forage quality. In: Proceedings of the National Conference on Forage Quality Evaluation and Utilization, Nebraska, September 3-4, 1969: C1-C10.
Heaney, D. P., 1973. Effects of the degree of selective feeding allowed on forage voluntary intake and digestibility assay results using sheep. Canadian Journal of Animal Science 53: 431-438.
Heaney, D. P., W. J. Pigden, D. J. Minson & G. I. Pritchard, 1963. Effect of pelleting on energy intake of sheep from forages cut at three stages of maturity. Journal of Animal Science 22: 752-757.
Heaney, D. P., W. J. Pigden & G. I. Pritchard, 1966. Comparative energy availability for lambs of four timothy varieties at progressive growth stages. Journal of Animal Science 25: 142-149.
Heaney, D. P., G. I. Pritchard & W. J. Pigden, 1968. Variability in ad libitum forage intakes by sheep. Journal of Animal Science 27: 159-164.
Honing, Y. van der, 1975. Intake and utilization of energy of rations with pelleted forages by dairy cows. Agricultural Research Reports 836. Centre for Agricultural Publishing and Documentation, Wageningen, the Netherlands.
Hutchinson, K. J. & R. J. Wilkins, 1971. The voluntary intake of silage by sheep II. The effects of acetate on silage intake. The Journal of Agricultural Science, Cambridge 77: 539-543.
Hutchinson, K. J., R. J. Wilkins & D. F. Osbourn, 1971. The voluntary intake of silage by sheep III. The effects of post-ruminal infusions of casein on the intake and nitrogen retention of sheep given silage ad libitum. The Journal of Agricultural Science, Cambridge 77: 545-547.
Hutton, E. M. & E. F. Henzell, 1976. Planning and organizing pasture research. In: N. H. Shaw and W. W. Bryan (editors): Tropical pasture research, principles and methods. Commonwealth Bureau of Pastures and Field Crops, Hurley, Berkshire, England. Bulletin 51: 1-17.
Ingalls, J. R., J. W. Thomas, E. J. Benne & M. Tesar, 1965. Comparative response of wether lambs to several cuttings of alfalfa, birdsfoot trefoil, bromegrass and reed canarygrass. Journal of Animal Science 24: 1159-1164.
Jeffery, H., 1971a. Nutritive value of Pennisetum clandestinum based pastures in a sub-tropical environment. Australian Journal of Experimental Agriculture and Animal Husbandry 11: 173-177.
Jeffery, H., 1971b. The relation between various energy parameters, chemical composition and digestibility of some pasture swards in a subtropical environment. Australian Journal of Experimental Agriculture and Animal Husbandry 11: 397-402.
Jeffery, H., 1976. Effect of the liveweight of caged sheep and the amount of feed on offer on estimates of digestibility and ad libitum intake. Australian Journal of Experimental Agriculture and Animal Husbandry 16: 656-660.
Johnson, W. L., A. L. Ordoveza, W. A. Hardison & L. S. Castillo, 1967. The nutritive value of Panicum maximum (Guinea grass) II. Digestibility by cattle and water buffaloes, related to season and herbage growth stage. The Journal of Agricultural Science, Cambridge 69: 161-170.
Jones, G. M , E. Donefer, A. H. Javed & J. M. Gaudreau, 1971. Intake and digestibility by sheep of wilted alfalfa-timothy or corn silages ensiled at low and high dry matter levels. Journal of Animal Science 33: 1315-1320.
Jones, G. M., R. E. Larsen, A. H. Javed, E. Donefer & J. M. Gaudreau, 1972. Voluntary intake and nutrient digestibility of forages by goats and sheep. Journal of Animal Science 34: 830-838.
Justesen, S. H. & N. H. Kuiper, 1962. Eine statistische Bemerkung über das Gesetz des Minimums. Biometrische Zeitschrift 4: 97-99.
Kennedy, P. M. & B. D. Siebert, 1972. The utilization of spear grass (Heteropogon contortus) II. The influence of sulphur on energy intake and rumen and blood parameters in cattle and sheep. Australian Journal of Agricultural Research 23: 45-56.
97

Koes, R. M. & W. H. Pfander, 1973. Intake and digestibility by lambs of low-quality sudan-grass hay supplemented with mineral mixtures having different acid-alkali ash values. Journal of Animal Science 37: 1018-1021.
Laredo, M. A. & D. J. Minson, 1973. The voluntary intake, digestibility, and retention time by sheep of leaf and stem fractions of five grasses. Australian Journal of Agricultural Research 24: 875-888.
't Mannetje, L., 1974. Relations between pasture attributes and liveweight gains on a sub-tropical pasture. Proceedings of the 12th International Grassland Congress held at Moscow, USSR, June 11-20, 1974. Volume III: 299-304.
McCampbell, J. L. & J. W. Thomas, 1972. Use of ultraviolet spectra values plus phenol and quaiacal to predict forage nutritive value. Journal of Animal Science 35: 133-138.
McDowell, R. E., 1972. Improvement of livestock production in warm climates. W. H. Freeman and Company, San Francisco.
Michell, P. J., 1973. Digestibility and voluntary intake measurements on regrowths of six Tasmanian pasture species. Australian Journal of Experimental Agriculture and Animal Husbandry 13: 158-164.
Milford, R., 1960a. Criteria for expressing nutritional values of subtropical grasses. Australian Journal of Agricultural Research 11: 121-137.
Milford, R., 1960b. Nutritional values for 17 subtropical grasses. Australian Journal of Agricultural Research 11: 138-148.
Milford, R., 1964. The nutritive value of pasture plants. In: Some concepts and methods in sub-tropical pasture research. Commonwealth Bureau of Pastures and Field Crops, Hurley, Berkshire, England, Bulletin 47.
Milford, R., 1967. Nutritive values and chemical composition of seven tropical legumes and lucerne grown in subtropical south-eastern Queensland. Australian Journal of Experimental Agriculture and Animal Husbandry 7: 540-545.
Milford, R. & D. J. Minson, 1968a. The effect of age and method of haymaking on the digestibility and voluntary intake of the forage legumes Dolichos lablab and Vigna sinensis. Australian Journal of Experimental Agriculture and Animal Husbandry 8: 409-412.
Milford, R. & D. J. Minson, 1968b. The digestibility and intake of six varieties of Rhodes grass (Chloris gayana). Australian Journal of Experimental Agriculture and Animal Husbandry 8: 413-418.
Miller, T. B. & A. Blair Rains, 1963. The nutritive value and agronomic aspects of some fodders in northern Nigeria I. Fresh herbage. Journal of the British Grassland Society 18: 158-167.
Miller, T. B., A. Blair Rains & R. J. Thorpe, 1963. The nutritive value and agronomic aspects of some fodders in northern Nigeria II. Silages. Journal of the British Grassland Society 18: 223-229.
Miller, T. B., A. Blair Rains & R. J. Thorpe, 1964. The nutritive value and agronomic aspects of some fodders in northern Nigeria III. Hays and dried crop residues. Journal of the British Grassland Society 19: 77-80.
Minson, D. J., 1967. The voluntary intake and digestibility, in sheep, of chopped and pelleted Digitaria decumbens (pangola grass) following a late application of fertilizer nitrogen. The British Journal of Nutrition 21: 587-597.
Minson, D. J., 1971a. The nutritive value of tropical pastures. The Journal of the Australian Institute of Agricultural Science 37: 255-263.
Minson, D. J., 1971b. The digestibility and voluntary intake of six varieties of Panicum. Australian Journal of Experimental Agriculture and Animal Husbandry 11: 18-25.
Minson, D. J., 1972. The digestibility and voluntary intake by sheep of six tropical grasses. Australian Journal of Experimental Agriculture and Animal Husbandry 12: 21-27.
Minson, D. J., 1973. Effect of fertilizer nitrogen on digestibility and voluntary intake of Chloris gayana, Digitaria decumbens and Pennisetum clandestinum. Australian Journal of Experimental Agriculture and Animal Husbandry 13: 153-157.
Minson, D. J. & M. N. McLeod, 1970. The digestibility of temperate and tropical grasses. Proceedings of the 11th International Grassland Congress, Surfers Paradise, Queensland, Australia, 13-23 April 1970: 719-722.
Minson, D. J. & R. Milford, 1966. The energy values and nutritive value indices of Digitaria decumbens. Sorghum almum, and Phaseolus atropurpureus. Australian Journal of Agricultural Research 17: 411-423.
98

Minson, D. J. & R. Milford, 1967. The voluntary intake and digestibility of diets containing different proportions of legume and mature Pangola grass (Digitaria decumbens). Australian Journal of Experimental Agriculture and Animal Husbandry 7: 546-551.
Minson, D. J. & R. Milford, 1968. The nutritional value of four tropical grasses when fed as chaff and pellets to sheep. Australian Journal of Experimental Agriculture and Animal Husbandry 8: 270-276.
Minson, D. J., T. H. Stobbs, M. P. Hegarty & M. J. Playne, 1976. Measuring the nutritive value of pasture plants. In: N. H. Shaw & W. W. Bryan (editors): Tropical pasture research, principles and methods. Commonwealth Bureau of Pastures and Field Crops, Hurley, Berkshire, England, Bulletin 51: 308-337.
Moore, J. E. & J. C. Waller (Nutrition Laboratory, Department of Animal Science, University of Florida, Gainesville, Florida 32611, USA), 1971. Procedure for Determining Voluntary Intake and Nutrient Digestibility of Hay with Sheep (Revised). (Not published).
Moore, J. E., O. C. Ruelke, C. E. Rios & D. E. Franke, 1970. Nutritive evaluation of Pensacola Bahiagrass hays. Proceedings Soil and Crop Science Society of Florida 30: 211-221.
Muller, L. D., V. L. Lechtenberg, L. F. Bauman, R. F. Barnes & C. L. Rhykerd, 1972. In vivo evaluation of a brown midrib mutant of Zea mays L. Journal of Animal Science 35: 883-889.
Myles, A. J., 1970. The effect of level of feeding upon the nutritive evaluation of pangolagrass hay in vivo. MSc-Thesis, University of Florida (not published).
Nath, K., N. S. Malik & O. N. Singh, 1971. Chemical composition and nutritive value of Indigofera enneaphylla and 7. cordifolia as sheep feeds. Australian Journal of Experimental Agriculture and Animal Husbandry 11: 178-180.
Newman, D. M. R., 1968. A comparison of the nutritional value of Stylosanthes humilis, Stylosanthes guyanensis and introduced grasses in northern Australia. Australian Journal of Experimental Agriculture and Animal Husbandry 8: 172-176.
Newman, D. M. R., 1969. The chemical composition, digestibility and intake of some native pasture species in central Australia during winter. Australian Journal of Experimental Agriculture and Animal Husbandry 9: 599-602.
Nie, N. H., C. H. Hull, J. G. Jenkins, K. Steinbrenner & D. H. Bent, 1975. Statistical package for the social sciences (SPSS). McGraw-Hill, New York (2nd edition).
Niekerk, B. D. H. van, 1975. Supplementation of grazing cattle. In: Proceedings of the Seminar on Potential to increase Beef Production in Tropical America, CI AT, Cali, Colombia, February 18-21, 1974. CI AT Series CE-10: 83-97.
Playne, M. J., 1968. The effect of level of feeding on the intake and digestibility of a tropical grass by sheep. The Journal of the Australian Institute of Agricultural Science 34: 167-168.
Playne, M. J., 1969a. The effect of dicalcium phosphate supplements on the intake and digestibility of Townsville lucerne and spear grass by sheep. Australian Journal of Experimental Agriculture and Animal Husbandry 9: 192-195.
Playne, M. J., 1969b. Effects of sodium sulphate and gluten supplements on the intake and digestibility of a mixture of spear grass and Townsville lucerne hay by sheep. Australian Journal of Experimental Agriculture and Animal Husbandry 9: 393-399.
Playne, M. J., 1972a. Nutritional value of Townsville stylo (Stylosanthes humilis) and of spear grass (Heteropogon conlorrus)-dominant pastures fed to sheep 2. The effect of superphosphate fertilizer. Australian Journal of Experimental Agriculture and Animal Husbandry 12: 373-377.
Playne, M. J., 1972b. A comparison of the nutritional value of spear grass {Heteropogon conlortus)-dominant pastures and Urochloa grass (Urochloa mosambicensis). Australian Journal of Experimental Agriculture and Animal Husbandry 12: 378-384.
Playne, M. J. & K. P. Haydock, 1972. Nutritional value of Townsville stylo (Stylosanthes humilis) and of spear grass (Heteropogon contortus(-dominant pastures fed to sheep 1. The effect of plant maturity. Australian Journal of Experimental Agriculture and Animal Husbandry 12: 365-372.
Raymond, W. F., 1966. The nutritive value of herbage. In: J. T. Abrams (editor): Recent advances in animal nutrition. J. & A. Churchill Ltd., London: 81-118.
Raymond, W. F., 1968. Grassland research and practice. Journal of the Royal Agricultural Society of England 129: 85-105.
Raymond, W. F., 1969. The nutritive value of forage crops. Advances in Agronomy 21 : 1-108.
99

Rees, M. C , D. J. Minson & F. W. Smith, 1974. The effect of supplementary and fertilizer sulphur on voluntary intake, digestibility, retention time in the rumen, and site of digestion of pangola grass in sheep. The Journal of Agricultural Science, Cambridge 82: 419-422.
Robinson, D. W. & R. Sageman, 1967. The nutritive value of some pasture species in north-western Australia during the late dry season. Australian Journal of Experimental Agriculture and Animal Husbandry 7: 533-539.
Rohr, K., 1977. Die Verzehrleistung des Wiederkäuers in Abhängigkeit von verschiedenen Einfluszfaktoren. Übersichten zur Tierernährung 5: 75-102.
Romberg, B., G. R. Pearce & D. L. Tribe, 1969. The effect of chemical curing with paraquat on the intake and digestibility of phalaris pasture. Australian Journal of Experimental Agriculture and Animal Husbandry 9: 71-73.
Schultze-Kraft, R. & D. C. Giacometti, 1979. Genetic resources of forage legumes for the acid, infertile savannas of tropical America. In: P. A. Sanchez & L. E. Tergas (editors): Pasture production in acid soils of the tropics. Proceedings of a seminar held at CIAT, Cali, Colombia, 17-21 April, 1978, CIAT series 03 EG-5: 55-64.
Siebert, B. D. & P. M. Kennedy, 1972. The utilization of spear grass (Heteropogon contortus) I. Factors limiting intake and utilization by cattle and sheep. Australian Journal of Agricultural Research 23: 35-44.
Skerman, P. J., 1977. Tropical forage legumes. FAO Plant Production and Protection Series No. 2. FAO, Rome.
Smith, A. J. (editor), 1976. Beef cattle production in developing countries. Proceedings of the Conference held in Edinburgh, September 1-6, 1974. University of Edinburgh, Centre for Tropical Veterinary Medicine.
Smith, C. A., 1962a. The utilization of Hyparrhenia veld for the nutrition of cattle in the dry season III. Studies on the digestibility of the produce of mature veld and veld hay, and the effect of feeding supplementary protein and urea. The Journal of Agricultural Science, Cambridge 58: 173-178.
Smith, C. A., 1962b. Tropical grass/legume pastures in Northern Rhodesia. The Journal of Agricultural Science, Cambridge 59: 111-118.
Stobbs, T. H., 1973a. The effect of plant structure on the intake of tropical pastures I. Variation in the bite size of grazing cattle. Australian Journal of Agricultural Research 24: 809-819.
Stobbs, T. H., 1973b. The effect of plant structure on the intake of tropical pastures II. Differences in sward structure, nutritive value, and bite size of animals grazing Setaria anceps and Chloris gayana at various stages of growth. Australian Journal of Agricultural Research 24: 821-829.
Stobbs, T. H. & E. M. Hutton, 1974. Variations in canopy structures of tropical pastures and their effects on the grazing behaviour of cattle. Proceedings of the 12th International Grassland Congress held at Moscow, USSR, June 11-20, 1974. Volume III: 510-517.
Technical Committee for Regional Research Project S-45, 1966. Summary. Survey of Forage Voluntary Intake and Nutrient Digestibility Methods. Obtained from: John E. Moore, Department of Animal Science, Nutrition Laboratory, University of Florida, Gainesville, Florida 32611, USA.
Terry, R. A., M. C. Spooner & D. F. Osbourn, 1975. The feeding value of mixtures of alkali-treated straw and grass silage. The Journal of Agricultural Science, Cambridge 84: 373-376.
Thornton, R. F. & D. J. Minson, 1972. The relationship between voluntary intake and mean apparent retention time in the rumen. Australian Journal of Agricultural Research 23: 871-877.
Thornton, R. F. & D. J. Minson, 1973. The relationship between apparent retention time in the rumen, voluntary intake, and apparent digestibility of legume and grass diets in sheep. Australian Journal of Agricultural Research 24: 889-898.
Velasquez G., J. A. & E. Gonzalez J., 1972. El valor nutritivo de la paja de mam' (Arachis hipogea). Agronomîa Tropical, Revista del Centra de Investigaciones Agronómicas, Maracay 22: 287-290.
Ventura, M., J. E. Moore, O. C. Ruelke & D. E. Franke, 1975. Effect of maturity and protein supplementation on voluntary intake and nutrient digestibility of Pangola Digitgrass hays. Journal of Animal Science 40: 769-774.
Willians, A. J. & H. P. Miller, 1965. The voluntary feed intake of sheep genetically different in wool production. Australian Journal of Experimental Agriculture and Animal Husbandry 5: 385-389.
Zemmelink, G., R. J. Haggar & J. H. Davies, 1972. A note on the voluntary intake of Andropogon gayanus hay by cattle, as affected by level of feeding. Animal Production 15: 85-88.
100