Effect of policy-induced measures on suspended sediments and total phosphorus concentrations from...
14
Effect of policy-induced measures on suspended sediments and total phosphorus concentrations from three Norwegian agricultural catchments Marianne Bechmann a, T , Per Sta ˚lnacke b a Jordforsk-Norwegian Centre for Soil and Environmental Research, FA. Dahls vei 20, 1432 A ˚ s, Norway b NIVA-Norwegian Institute for Water Research, PO Box. 173, 0411 Oslo, Norway Available online 17 March 2005 Abstract In Norway, agricultural subsidies have, since the late 1980s, been targeted to reduce soil erosion, transfer of soil particles and phosphorus (P) losses. The subsidies led to, e.g., a fourfold increase in the area not ploughed from 1991 to 2001 and a reduced P fertiliser consumption by 60%, especially in areas with high livestock density. Moreover, in the late 1980s agricultural point sources of P from storage facilities of manure and fodder were reduced. In this paper, we evaluate the effect of these policy- induced measures and changed agricultural practices on suspended sediment (SS) and total P (TP) concentrations in three agricultural catchments (1, 3 and 87 km 2 ). Results from the statistical trend analyses for the study period (14–17 years) showed weak, but statistically significant ( p b0.05), downward trends in concentrations of TP and SS in the two streams with a high initial TP or SS concentration. In the stream with low initial concentrations of TP and SS, however, no statistically significant trends were shown. The stream with the highest initial concentration of SS showed a statistically significant downward trend in both TP and SS concentrations. The catchment with low initial concentration of SS and medium livestock density showed no detectable trends, while the catchment with high livestock density and low concentrations of SS in the stream showed a statistically significant downward trend in TP concentrations. The results from this study suggest that subsidies and mitigation measures can reduce concentrations of TP and SS in streamwater in highly polluted catchments, although the reduction is small compared to the variations between catchments. D 2005 Elsevier B.V. All rights reserved. Keywords: Phosphorus; Suspended sediments; Autumn tillage; Livestock density; Subsidies; Catchments; Norway 1. Introduction In Norway, mitigation of soil erosion, transfer of soil particles and phosphorus (P) transfer have been in focus since the early 1980s because of the adverse effects on water quality in inland surface waters. In 0048-9697/$ - see front matter D 2005 Elsevier B.V. All rights reserved. doi:10.1016/j.scitotenv.2005.02.013 T Corresponding author. Tel.: +47 64948100; fax: +47 64948110. E-mail address: [email protected] (M. Bechmann). Science of the Total Environment 344 (2005) 129– 142 www.elsevier.com/locate/scitotenv
-
Upload
independent -
Category
Documents
-
view
4 -
download
0
Transcript of Effect of policy-induced measures on suspended sediments and total phosphorus concentrations from...

www.elsevier.com/locate/scitotenv
Science of the Total Environm
Effect of policy-induced measures on suspended sediments
and total phosphorus concentrations from three
Norwegian agricultural catchments
Marianne Bechmanna,T, Per Stalnackeb
aJordforsk-Norwegian Centre for Soil and Environmental Research, FA. Dahls vei 20, 1432 As, NorwaybNIVA-Norwegian Institute for Water Research, PO Box. 173, 0411 Oslo, Norway
Available online 17 March 2005
Abstract
In Norway, agricultural subsidies have, since the late 1980s, been targeted to reduce soil erosion, transfer of soil particles and
phosphorus (P) losses. The subsidies led to, e.g., a fourfold increase in the area not ploughed from 1991 to 2001 and a reduced P
fertiliser consumption by 60%, especially in areas with high livestock density. Moreover, in the late 1980s agricultural point
sources of P from storage facilities of manure and fodder were reduced. In this paper, we evaluate the effect of these policy-
induced measures and changed agricultural practices on suspended sediment (SS) and total P (TP) concentrations in three
agricultural catchments (1, 3 and 87 km2). Results from the statistical trend analyses for the study period (14–17 years) showed
weak, but statistically significant ( pb0.05), downward trends in concentrations of TP and SS in the two streams with a high
initial TP or SS concentration. In the stream with low initial concentrations of TP and SS, however, no statistically significant
trends were shown. The stream with the highest initial concentration of SS showed a statistically significant downward trend in
both TP and SS concentrations. The catchment with low initial concentration of SS and medium livestock density showed no
detectable trends, while the catchment with high livestock density and low concentrations of SS in the stream showed a
statistically significant downward trend in TP concentrations. The results from this study suggest that subsidies and mitigation
measures can reduce concentrations of TP and SS in streamwater in highly polluted catchments, although the reduction is small
compared to the variations between catchments.
D 2005 Elsevier B.V. All rights reserved.
Keywords: Phosphorus; Suspended sediments; Autumn tillage; Livestock density; Subsidies; Catchments; Norway
0048-9697/$ - see front matter D 2005 Elsevier B.V. All rights reserved.
doi:10.1016/j.scitotenv.2005.02.013
T Corresponding author. Tel.: +47 64948100; fax: +47 64948110.
E-mail address: [email protected]
(M. Bechmann).
1. Introduction
In Norway, mitigation of soil erosion, transfer of
soil particles and phosphorus (P) transfer have been in
focus since the early 1980s because of the adverse
effects on water quality in inland surface waters. In
ent 344 (2005) 129–142

M. Bechmann, P. Stalnacke / Science of the Total Environment 344 (2005) 129–142130
large parts of the agricultural areas in Norway, soil
erosion is the main process of P losses from arable
land. Because of the agricultural policy, these areas
are mainly used for cereal production with a relatively
low livestock density. In other areas, dairy production
was stimulated during the 1960–1970s, resulting in
higher P surplus in agricultural production (Haraldsen
et al., 1995). High P application rate, resulting in
increased risk of P losses, was here a main challenge
to the environment. In 1985, the national authorities
introduced the National Action Plan against Agricul-
tural Pollution (1985–1988), which in the late 1980s
resulted in practical measures and increased political
interest (Lundekvam et al., 2003). Priority was first
given to the establishment and improvement of
municipal wastewater treatment facilities to mitigate
point sources of P. To mitigate sources of diffuse P,
during the late 1980s and 1990s, several economic
incentives (e.g., subsidies and direct payment) were
introduced to stimulate the farmers to implement
measures to reduce soil and P losses. Measures were
separated into addressing P source and P transport
factors, and included measures like reduced autumn
tillage, nutrient management planning and increased
area of vegetated buffer zones and grassed waterways
(Lundekvam et al., 2003) (Table 1). Agricultural
legislation was also changed, i.e., (i) the maximum
livestock density on each farm was set to 2.5 livestock
units (LU) ha�1 and, (ii) the time and method of
manure application were regulated, e.g., on arable
land manure must be incorporated within 18 h after
application; as well as seasonal regulations (Table 1).
As a result, the proportion of manure spread during
Table 1
Agricultural policy measures for mitigating phosphorus (P) losses
from agriculture in Norway (Norwegian Ministry of Agriculture,
2003)
Source measures Transport measures
Livestock density;
2.5 AMU ha�1
Reduced autumn tillage
Capacity for manure
storage for 8 months
Contour ploughing
No manure application November
1st to February 15th
Vegetated buffer strips
Incorporation of manure
within 18 h on arable land
Hydrological measures
(e.g., inlet for surface water
to the drainage system)
Nutrient management plan Grassed waterways
spring and the growing season increased in Norway
during the 1990s, and constituted 80% of the total
amount of manure spread on agricultural fields in
2002 (Bye et al., 2003). In addition, the new
regulations also required the farmers to establish an
annual nutrient management plan, based on analyses
of soil P status every 5th to 8th year. Moreover, in the
late 1980s, authorities inspected the farms in order to
identify sources of loss from manure and fodder
storage facilities.
In order to gauge the effectiveness of policy
changes, it is essential to determine if and how
successful these environmental measures are, and
how long it may take to detect the response in
agricultural streams. The effects of various measures
on water quality are mainly reported by results
obtained from plot and field experiments (Eltun et
al., 1996; Sharpley and Rekolainen, 1997; Øygarden,
2000). Studies on the effect of measures are however
often limited in time and space. This normally limits
general conclusions and extrapolations beyond the
considered study period and area. Investigation of
long-term time series at the catchment scale can be
used to evaluate mitigation strategies. In the wider
Nordic–Baltic region, the effect of agri-environmental
measures has been studied by the use of long-term
monitoring data in agriculturally impacted rivers and
streams. The results from these studies are not
conclusive. For example, Mander et al. (2000)
showed decreased P loads in some Estonian streams
and related these to the dramatic changes in land
management, i.e., an increased area of abandoned
land, while another similar study of 22 Estonian
rivers and streams only detected significant down-
ward trends in P concentration in 2 sites and even
reported increased concentrations at 2 sites (Iital et
al., 2005). Significant downward trends in P concen-
trations have been reported in Latvian rivers (Stal-
nacke et al., 2003) and small agricultural catchments
in Denmark (Larsen et al., 1999). These decreases
were, however, attributed to a reduction in point
sources from municipal wastewater treatment plants
(Latvia) and a reduction in loss of P from scattered
dwellings (Denmark). The contribution of P from
agriculture was evaluated in Finnish rivers over a 25-
year period and Raike et al. (2003) found no clear
effects of decreasing non-point source loading. In
Sweden, field scale monitoring showed no obvious

M. Bechmann, P. Stalnacke / Science of the Total Environment 344 (2005) 129–142 131
trends in P losses as a result of negative P balance in
agricultural production during the 1970s and 1980s
(Ulen et al., 2001). Historically high P surplus on
these fields may explain the missing trends. During
the 1990s, trends in losses of suspended sediment (SS)
and total phosphorus (TP) were difficult to detect in
Norwegian streams dominated by agricultural contri-
butions, since the most efficient measures were
implemented before this period (Stalnacke and Bech-
mann, 2002). To summarise, only few studies describe
changes in agricultural management within the catch-
ments, which could account for significantly decreas-
ing trends in SS and TP.
The aim of this study is to evaluate the effect of
measures implemented to reduce losses of SS and TP
from agricultural areas. We analysed three long-term
time series (14–17 years) of data on SS and TP
concentrations in agricultural streams representing
areas with i) cereal production, high erosion risk and
low livestock density, ii) cereal production, low
erosion risk and medium livestock density and iii)
Fig. 1. Map of Norway and the Rbmua (8710 ha), K
grass production and high livestock density. The
relationship between implemented measures within
the catchments and the stream concentrations was
evaluated.
2. Materials and methods
2.1. Site description
The studied catchments are located in south-east-
ern (Rbmua and Kolstad) and south-western (Time)
Norway (Fig. 1). They represent three common
production systems in Norwegian agriculture (Table
2). In the Rbmua catchment, plant production is
dominated by cereals, and livestock density is low
(0.3 livestock units (LU) ha�1). In the Kolstad
catchment, plant production is also dominated by
cereals, while livestock density, mainly consisting of
pigs, is higher (1.0 LU ha�1) than in Rbmua. The
Time catchment has the highest livestock density (2.0
olstad (308 ha) and Time (114 ha) catchments.
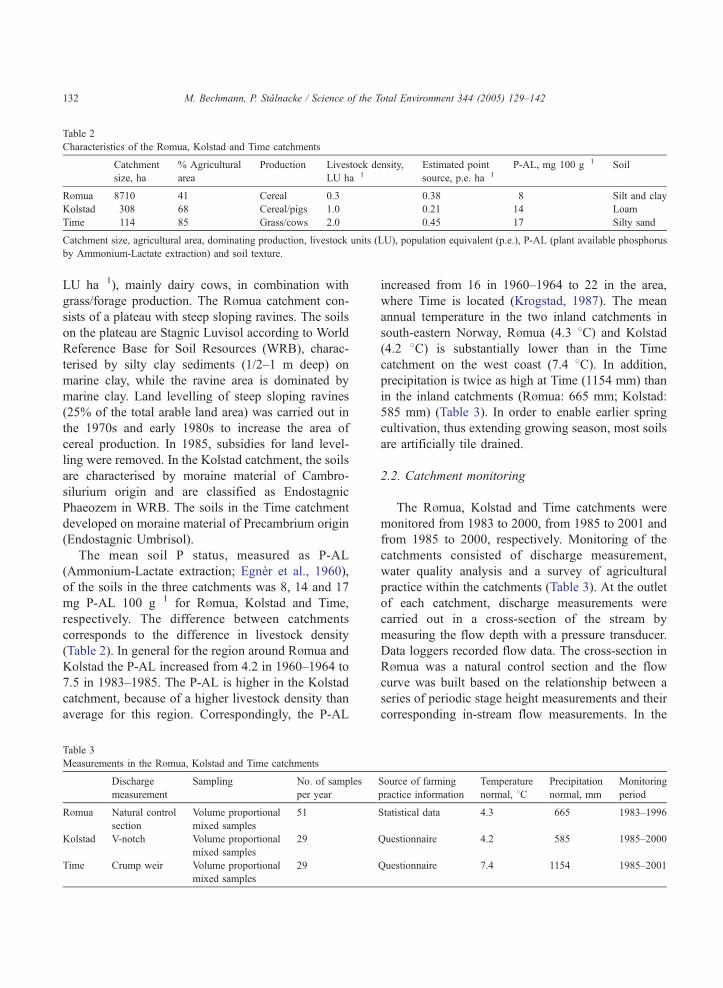
Table 2
Characteristics of the Rbmua, Kolstad and Time catchments
Catchment
size, ha
% Agricultural
area
Production Livestock density,
LU ha�1
Estimated point
source, p.e. ha�1
P-AL, mg 100 g�1 Soil
Rbmua 8710 41 Cereal 0.3 0.38 8 Silt and clay
Kolstad 308 68 Cereal/pigs 1.0 0.21 14 Loam
Time 114 85 Grass/cows 2.0 0.45 17 Silty sand
Catchment size, agricultural area, dominating production, livestock units (LU), population equivalent (p.e.), P-AL (plant available phosphorus
by Ammonium-Lactate extraction) and soil texture.
M. Bechmann, P. Stalnacke / Science of the Total Environment 344 (2005) 129–142132
LU ha�1), mainly dairy cows, in combination with
grass/forage production. The Rbmua catchment con-
sists of a plateau with steep sloping ravines. The soils
on the plateau are Stagnic Luvisol according to World
Reference Base for Soil Resources (WRB), charac-
terised by silty clay sediments (1/2–1 m deep) on
marine clay, while the ravine area is dominated by
marine clay. Land levelling of steep sloping ravines
(25% of the total arable land area) was carried out in
the 1970s and early 1980s to increase the area of
cereal production. In 1985, subsidies for land level-
ling were removed. In the Kolstad catchment, the soils
are characterised by moraine material of Cambro-
silurium origin and are classified as Endostagnic
Phaeozem in WRB. The soils in the Time catchment
developed on moraine material of Precambrium origin
(Endostagnic Umbrisol).
The mean soil P status, measured as P-AL
(Ammonium-Lactate extraction; Egner et al., 1960),
of the soils in the three catchments was 8, 14 and 17
mg P-AL 100 g�1 for Rbmua, Kolstad and Time,
respectively. The difference between catchments
corresponds to the difference in livestock density
(Table 2). In general for the region around Rbmua and
Kolstad the P-AL increased from 4.2 in 1960–1964 to
7.5 in 1983–1985. The P-AL is higher in the Kolstad
catchment, because of a higher livestock density than
average for this region. Correspondingly, the P-AL
Table 3
Measurements in the Rbmua, Kolstad and Time catchments
Discharge
measurement
Sampling No. of samples
per year
Rbmua Natural control
section
Volume proportional
mixed samples
51
Kolstad V-notch Volume proportional
mixed samples
29
Time Crump weir Volume proportional
mixed samples
29
increased from 16 in 1960–1964 to 22 in the area,
where Time is located (Krogstad, 1987). The mean
annual temperature in the two inland catchments in
south-eastern Norway, Rbmua (4.3 8C) and Kolstad
(4.2 8C) is substantially lower than in the Time
catchment on the west coast (7.4 8C). In addition,
precipitation is twice as high at Time (1154 mm) than
in the inland catchments (Rbmua: 665 mm; Kolstad:
585 mm) (Table 3). In order to enable earlier spring
cultivation, thus extending growing season, most soils
are artificially tile drained.
2.2. Catchment monitoring
The Rbmua, Kolstad and Time catchments were
monitored from 1983 to 2000, from 1985 to 2001 and
from 1985 to 2000, respectively. Monitoring of the
catchments consisted of discharge measurement,
water quality analysis and a survey of agricultural
practice within the catchments (Table 3). At the outlet
of each catchment, discharge measurements were
carried out in a cross-section of the stream by
measuring the flow depth with a pressure transducer.
Data loggers recorded flow data. The cross-section in
Rbmua was a natural control section and the flow
curve was built based on the relationship between a
series of periodic stage height measurements and their
corresponding in-stream flow measurements. In the
Source of farming
practice information
Temperature
normal, 8CPrecipitation
normal, mm
Monitoring
period
Statistical data 4.3 665 1983–1996
Questionnaire 4.2 585 1985–2000
Questionnaire 7.4 1154 1985–2001

M. Bechmann, P. Stalnacke / Science of the Total Environment 344 (2005) 129–142 133
streams of Kolstad and Time a V-notch and a Crump
weir, respectively, were used (Table 3). The discharge
measurements during summer in the Time stream are
inaccurate because of plant growth in the stream,
which raised the water level in the Crump weir. Hence
flow data in the Time stream is not presented in this
paper. In Rbmua, flow proportional (1983–1996) and
time equidistant (1996–2000) water quality samples
were collected to form composite samples. The
different sampling strategy in different periods may
cause a systematic underestimation in the latter period
(Haraldsen and Stalnacke, 2002). Hence, for Rbmua
only the period 1983–1996 is included in this
analysis. In the Kolstad and Time streams, flow
proportional composite samples were collected
throughout the respective monitoring periods (Table
3). In all three streams flow proportional subsamples
were taken automatically and collected in a bucket,
from which a representative sample was taken after
thorough mixing about once every 2 weeks. Hence,
continuous data are available for all three steams.
Unfiltered samples were used to determine TP by
digestion with potassium persulphate and they were
analysed spectrophotometrically by the ammonium
molybdate method of Murphy and Riley (1962), with
ascorbic acid as a reducing agent. Suspended sedi-
ment was determined by filtering an exact sample
volume of 25 to 250 ml after thorough mixing
(containing at least 5 mg SS) through a pre-weighed
fibreglass filter (Whatman GF/A). Annual loads were
calculated as the cumulative sum of hourly loads
derived from hourly flow values and fortnightly
concentration values.
Information on management practice within the
catchments was derived from different sources. For the
Rbmua catchment, the source of information on
agricultural practices consists of data from Statistics
Norway for the two main municipalities in the catch-
ment. Data from Statistics Norway contain information
on soil cultivation from 1990 and onwards. In the
Kolstad and Time catchments, annual questionnaires
to farmers provided information on management
practice on each field within the catchments.
2.3. Statistical methods
The Mann–Kendall test is a standard and well-
known non-parametric method used to detect mono-
tone trends in time series of water quality data (Dietz
and Kileen, 1981). It was further developed to account
for seasonal variation, ties, missing values and
autocorrelation (Hirsch et al., 1982; Hirsch and Slack,
1984). More precisely, for a time series observed
throughout the various seasons during the study years,
the Mann–Kendall statistic for each season is defined
as the sum of all signs of differences. The seasonal
Mann–Kendall test is subsequently defined as the sum
of the Mann–Kendall statistics for all seasons. In our
study a modified version of the Mann–Kendall test
was in our study used to statistically analyse long-
term changes in SS and TP concentrations in the three
streams. Weather conditions often cause natural
fluctuation in the nutrient concentration time series,
which may impede the detection of a human induced
trend (Stalnacke and Grimvall, 2001). To account for
such fluctuations, it is essential to include explanatory
(i.e., meteorological or hydrological) variables in the
analysis if available (only for Rbmua and Kolstad).
This is accomplished by computing the conditional
distribution of the Hirsch–Slack statistic for the
response variable, given the statistic for the explan-
atory variable (Libiseller and Grimvall, 2002). Here,
this test is referred to as the Partial Hirsch–Slack
(PHS) test. This procedure can be generalised to allow
for more than one explanatory variable. In our study,
however, we only used water discharge as the
explanatory variable. Moreover, since seasonal trends
were of particular interest in our study and the fact
that the temporal behaviour may shift between years
due to the prevailing hydro meteorological situation,
we aggregated the nutrient concentrations into tertiary
data; e.g., snowmelt may occur in January or in March
depending on the hydro meteorological conditions in
a particular year. Thus, we divided the year into the
following three seasons: January–April (winter and
early spring season), May–August (growing season)
and September–December (autumn period). For each
tertiary season, flow-weighted tertiary concentrations
and water flow were calculated. Finally, the tertiary
data were used to statistically analyse time trends
using the PHS statistic (one sided test). The PHS
statistic has been shown to be powerful in situations
with monthly and quarterly data, provided there are at
least ten years of data (Libiseller and Grimvall, 2002).
Thus, it was assumed that our dataset, with tertiary
data over a 14–17 year period, was of sufficient length

Rømua
3000
3500(a)
M. Bechmann, P. Stalnacke / Science of the Total Environment 344 (2005) 129–142134
and temporal resolution for a robust statistical analysis
of trends.
R2 = 0.9
0
500
1000
1500
2000
2500
0 1000 2000 3000 4000
SS, mg l-1
TP
, µg
l-1
Kolstad
R2 = 0.35
0
100
200
300
400
500
600
700
0 100 200 300 400
SS, mg l-1
TP
, µg
l-1
(b)
Time
R2 = 0.55
0
1000
2000
3000
4000
5000
0 50 100 150 200
SS, mg l-1
TP
, µg
l-1
(c)
µµ
µ
Fig. 2. Relationship between concentrations of total phosphorus
(TP) and suspended sediments (SS) for Rbmua (a), Kolstad (b) and
Time (c) streams. Note different scales.
3. Results and discussion
3.1. Annual concentrations of suspended sediments
and total phosphorus
Summary data on mean annual concentrations of
SS and TP for the respective monitoring periods are
given in Table 4. The Rbmua is a large scale
catchment, and hence, may show a lower connectivity
for this catchment compared to the other, smaller
catchments in this study. However, among the three
streams, the highest annual mean concentration of SS
was observed in the Rbmua stream (91 mg l�1).
Annual mean concentration of TP in the Rbmua
stream was 147 Ag l�1, although instantaneous
concentrations were much higher. The temporal
variability in SS and TP concentrations in Rbmua
showed a close relationship (r2=0.9; pb0.001) (Fig.
2a), which indicates that erosion was probably the
main process of TP transfer. Moreover, Krogstad and
Løvstad (1987) found TP contents of about 0.1% in
Norwegian cultivated soils (0–20 cm depth) and up to
0.2–0.3% after years of intensive application of P in
fertilizer. The mean annual TP/SS value (0.16%) in
Rbmua is within the range of these values, which may
also support the conclusion that agricultural soil is the
main source of SS and TP in the Rbmua stream. The
enrichment of P, described by, e.g., Øygarden (2000),
in eroded material was not reflected here. One
explanation for this could be that erosion on frozen
soil does not cause enrichment of P (Bechmann et al.,
2003). In Rbmua, the highest SS concentrations are
Table 4
Mean annual flow-weighted concentrations and loads of suspended
sediments (SS) and total phosphorus (TP) from the Rbmua, Kolstad
and Time catchments
Catchment Period Concentration Load
SS,
mg l�1
TP,
Ag l�1
SS,
kg ha�1
TP,
g ha�1
Rbmua 1983–1996 91 147 406 657
Kolstad 1985–2000 32 108 112 360
Time 1985–2001 12 195 n.d. n.d.
n.d.: no data available.
mostly observed during the winter and early spring,
i.e., January to April (Fig. 3). The TP/SS ratio,
however, showed a high temporal variability, espe-
cially at low SS concentrations, and was found to be
inversely correlated to the SS concentrations (Fig. 3).
Decreased TP/SS ratios at high SS concentration have
also been observed in other Norwegian studies
(Øygarden, 2000; Bechmann et al., 2003). This
relationship can be explained by the fact that high
SS concentrations represent erosion events with more
particles from deeper soil layers containing less P
(Øygarden, 2000). Point sources from scattered
dwellings may contribute to relatively high TP/SS
ratios in low flow/low SS situations, e.g., during

Rømua
0
2
4
6
8
10
12
14
16
1 10 100 1000
SS concentration, mg l-1
TP
/SS
rat
io
Jan.-Apr.
May-Aug.
Sept.-Dec.
Fig. 3. The enrichment of total phosphorus (TP) in relation to suspended sediments (SS) in composite samples from the Rbmua catchment.
M. Bechmann, P. Stalnacke / Science of the Total Environment 344 (2005) 129–142 135
summer. In an earlier study in Rbmua, Wivestad
(1996) estimated that point sources of TP accounted
for only 19% of the total annual TP stream load.
Stream bank erosion is another process of TP and SS
transfer and may compensate for the elevated TP/SS
ratio by point sources, by contributing soils low in P,
resulting in TP/SS ratios in the stream similar to the
TP/SS of the soil (Krogstad and Løvstad, 1987). The
catchments, which were studied by Øygarden (2000)
in the region of Rbmua, comprised field scale studies.
These fields were neither influenced by point sources
nor stream bank erosion. They had, however, about
the same TP/SS ratio as for Rbmua (0.08–1.0%).
Thus, erosion seems to be the main process of P
transfer in the Rbmua catchment, though also point
sources may contribute to P losses.
Mean concentrations of SS (32 mg l�1) in the
Kolstad stream were low compared to the Rbmua
catchment (Table 4), despite the great differences in
size of the catchments. The correlation between TP
and SS concentrations in the Kolstad stream was
statistically significant but substantially weaker
(r2=0.35; pb0.001) than in Rbmua, suggesting that
erosion is not the dominating process causing P loss
(Fig. 2b). The homogeneous light textured and well-
structured moraine soils in the Kolstad catchment
cause high infiltration capacity and may partly explain
the relative low erosion rate. The TP mean concen-
tration in Kolstad was 108 Ag l�1, which was 2/3 of
the Rbmua concentration. The TP concentration was
relatively higher than the SS concentration in the
Kolstad stream and was 0.34% of SS. The higher
livestock density (Table 2) and use of pig slurry in the
Kolstad catchment most likely explains this differ-
ence. This is further supported by the difference in P
content of soils between the catchments (14 mg P-AL
100 g�1 soil in Kolstad and 8 mg P-AL 100 g�1 soil
in Rbmua). The process of P transfer in the Kolstad
catchment probably includes erosion, dissolution and
incidental losses.
In the Time stream, the mean concentration of SS
was 12 mg l�1, which is only 13% of the observed SS
concentration in the Rbmua stream (Table 4). The
Time catchment is dominated by grassland and gently
sloping fields with a low erosion risk. Mean concen-
tration of TP was 195 Ag l�1, which included one
event in 1993, when TP concentration of 4400 Ag l�1
and a SS concentration of 160 mg l�1 were observed.
These high concentrations were observed after spread-
ing of silage effluent on a 2 ha area followed by 19
mm of rain and may be related to either runoff from
the field or spreading very near to the stream. This
event was, however, not further investigated in field.
Generally, there is a weak relationship, though
significant, (r2=0.55, pb0.001) between TP and SS
concentrations for Time (both with and without the
outlier), indicating that erosion may not be the
dominating process of TP transfer within the catch-
ment (Fig. 2c). In the Time stream, the TP/SS was
1.6%, which is 10 times the TP/SS in Rbmua.
Correspondingly, the Time catchment also had the
highest soil P content (17 mg P-AL 100 g�1)
compared to the other two catchments (8 and 14 mg
P-AL 100 g�1) (Table 2). Data from the Time stream
showed a rather diluted influence of incidental P
losses on TP concentrations after manure application

M. Bechmann, P. Stalnacke / Science of the Total Environment 344 (2005) 129–142136
(Withers et al., 2003). Withers et al. (2003) found,
however, obvious influence of incidental P losses at
field scale. Incidental P losses, desorption of P from
soil and erosion of soil particles with a high P content
are probably contributing to the P transfer in the Time
catchment.
3.2. Losses of suspended sediments and total
phosphorus
Losses of SS and TP were only calculated for
Rbmua and Kolstad (Table 4). Annual losses of SS
and TP (1983–1996) from the Rbmua catchment
were 406 kg ha�1 and 0.66 kg ha�1, respectively.
According to Vagstad et al. (2001), this is higher
than the losses measured in similar agricultural
catchments in Denmark and Sweden, but approx-
imately at the same level as in Finland. In the same
region as Rbmua, even higher losses of SS and TP
were reported at field scale by Øygarden (2000),
who measured SS losses up to 1892 kg ha�1 yr�1
and TP up to 1.7 kg ha�1 yr�1 in a 6-year study.
Catchment size and percentage of agricultural area
are shown to be important factors explaining P losses
(Kronvang et al., 1995; Johnes et al., 1996; Ekholm
et al., 2000), though in a study by Kronvang et al.
(2003) on 108 European catchments only 37% of the
variance was explained by runoff, percentage of
agricultural land and catchment size. Notwithstand-
ing, the size of the Rbmua catchment and the
relatively low (41%) share of agricultural land
reduce the annual losses of SS and TP compared
to losses from field scale and 100% agricultural land.
The mean annual loads from the Kolstad catchment
are 112 kg SS ha�1 and 0.36 kg TP ha�1 (Table 4),
and thus similar to the loads in Denmark and Sweden
(Vagstad et al., 2001). Low precipitation and hence
low runoff partly explain the low losses in Kolstad.
However, considering the size of catchment and share
of agricultural land the loads from Rbmua would be
expected to be lower than for Kolstad. This contrast is
mainly explained by differences in soil type between
the two catchments, giving rise to much higher
erosion risk in Rbmua than in Kolstad. The difference
in scale of these catchments also influences the
importance of point sources. While waste water
contributed to 4% of the P losses in Kolstad, the
point source contribution in Rbmua in 1994 con-
stituted 19% (Wivestad, 1996). Hence, point sources,
in addition to agricultural sources, have played a role
in the Rbmua catchment.
3.3. Annual variations in concentration and losses
Mean annual concentrations of SS and TP for the
three streams showed great variability (Fig. 4). In
Rbmua, the mean annual flow-weighted SS concen-
tration varied from 22 mg l�1 in 1996 to 232 mg l�1 in
1990. Correspondingly, the TP concentration was
lowest in 1996, with an annual mean of 56 Ag l�1, and
highest in 1986 when the concentration was 330 Agl�1. Mean annual concentrations of SS and TP were
closely related (r2=0.9; pb0.001). Weather conditions,
including the combination of temperature and precip-
itation, cause natural fluctuations in concentrations of
SS and TP (Øygarden, 2000; Ulen, 1998). However,
yearly water discharge alone did not explain the
variations in annual mean concentrations in Rbmua.
Øygarden (2000) showed that seasonal differences in
temperature have an important influence on erosion
processes, with the period of snowmelt contributing
most to erosion, and accordingly P losses, in this
region. Fig. 5 shows the annual variations in P losses
from the Rbmua catchment in winter (January–April),
spring/summer (May–August) and autumn (Septem-
ber–December). The highest P losses were measured
in winter 1990 and 1999. High P losses during
summer were found in the 1980s, while they were
relatively low during the 1990s (Fig. 5). Losses of P in
autumn were highest in 1985, 1998 and 2000, though
they were low compared to the winter.
In the Kolstad stream, highest annual flow-
weighted concentrations of SS and TP occurred in
2001, because of adverse hydro meteorological
conditions during snowmelt in April causing high
erosion. Concentrations in 1986 were also relatively
high for both SS and TP (Fig. 4c and d). In 1996,
however, the annual concentration of SS was low
while the TP concentration was high due to a very
high concentration during snowmelt. The high TP
concentration in during snowmelt could not be
explained by the known agricultural activity, hence
point sources, e.g., leakage from manure storage, may
have caused this elevated concentration of TP. The SS
concentration in Time showed low interannual vari-
ability. Similarly for the mean annual TP concen-

Rømua
0
0.2
0.4
0.6
0.8
1
1.2
1.4
1.6
1983
1984
1985
1986
1987
1988
1989
1990
1991
1992
1993
1994
1995
1996
P lo
sses
, kg
ha-1
Jan-AprMay-AugSep-Dec
Fig. 5. Losses of total phosphorus (P) from the Rbmua catchment in
tertial seasons.
Rømua Rømua
0
50
100
150
200
250
1983
1984
1985
1986
1987
1988
1989
1990
1991
1992
1993
1994
1995
1996
1997
1998
1999
2000
2001
1983
1984
1985
1986
1987
1988
1989
1990
1991
1992
1993
1994
1995
1996
1997
1998
1999
2000
2001
1983
1984
1985
1986
1987
1988
1989
1990
1991
1992
1993
1994
1995
1996
1997
1998
1999
2000
2001
1983
1984
1985
1986
1987
1988
1989
1990
1991
1992
1993
1994
1995
1996
1997
1998
1999
2000
2001
1983
1984
1985
1986
1987
1988
1989
1990
1991
1992
1993
1994
1995
1996
1997
1998
1999
2000
2001
1983
1984
1985
1986
1987
1988
1989
1990
1991
1992
1993
1994
1995
1996
1997
1998
1999
2000
2001
SS
con
cent
ratio
n, m
g l-1
SS
con
cent
ratio
n, m
g l-1
SS
con
cent
ratio
n, m
g l-1
050
100150200250300350400450500
050
100150200250300350400450500
050
100150200250300350400450500
TP c
once
ntra
tion,
µg
l-1TP
con
cent
ratio
n, µ
g l-1
TP c
once
ntra
tion,
µg
l-1
Kolstad Kolstad
0
50
100
150
200
250
0
50
100
150
200
250Time Time
(a) (b)
(c) (d)
(e) (f)
µµ
µ
Fig. 4. Mean annual concentrations of suspended sediments (SS) and total phosphorus (TP) from the Rbmua (a and b) (flow-weighted), Kolstad
(c and d) (flow-weighted) and Time catchments (e and f) (arithmetical mean).
M. Bechmann, P. Stalnacke / Science of the Total Environment 344 (2005) 129–142 137
trations, the interannual variability is low (Fig. 4). The
extreme events and outliers are included in the
presented data to illustrate the variability, but in the
statistical trend analysis they have only very little
influence on the results.
3.4. Mitigation measures for phosphorus losses
The results and discussion presented in the sections
above demonstrate that appropriate measures to
reduce concentrations of SS and TP in agricultural
streams depend on the agricultural production system
as well as geological properties. For example the
reduced tillage is only an efficient measure where
erosion risk is high. Additionally, at the landscape

M. Bechmann, P. Stalnacke / Science of the Total Environment 344 (2005) 129–142138
scale, in Rbmua catchment, the reduction in P losses
from point sources could also be of importance. Only
sparse data are, however, available on reductions in
point sources within this catchment. There has been a
generally high focus on point sources in this region
and Borgvang et al. (2002) estimated a 55% reduction
in P losses form municipal waste water and scattered
dwellings from 1985 to 1996 from the south-eastern
region of Norway.
In the early 1990s, diffuse agricultural sources
were included in the mitigation strategies. Different
cultivation systems, aimed at reducing soil erosion,
were introduced in Norway (Lundekvam et al., 2003).
The traditional practice of autumn tillage, which
dominated the agricultural management until the
mid-1980s, was changed. From 1990 and onwards
from 25% to 36% of the agricultural area in the
Rbmua catchment was not ploughed in the autumn
(Fig. 6). From 1993, agricultural subsidies were
targeted to areas with a high erosion risk (Lundekvam
et al., 2003) to obtain a more cost-efficient use of
subsidies. Moreover, artificial levelling in the Rbmua
catchment was carried out in 1971–1986 on an
estimated 25% of the agricultural land (Wivestad,
1996). In the years after levelling operations, high
erosion occurs through soil cracks and tile drains due
to the destabilisation of surface soils (Øygarden et al.,
1997). It may be assumed, however, that the erosion
will decrease in such areas as soil stability increases.
The removal of subsidies for land levelling reduced
these activities to zero in the late 1980s.
Rø
0
10
20
30
40
50
60
70
80
90
100
1983 1984 1985 1986 1987 1988 198
No
au
tum
n t
illag
e, %
are
a
Fig. 6. Percentage of agricultural areas in the Rbmua catchment with no ti
based on estimates by Bbrresen, personal communication.
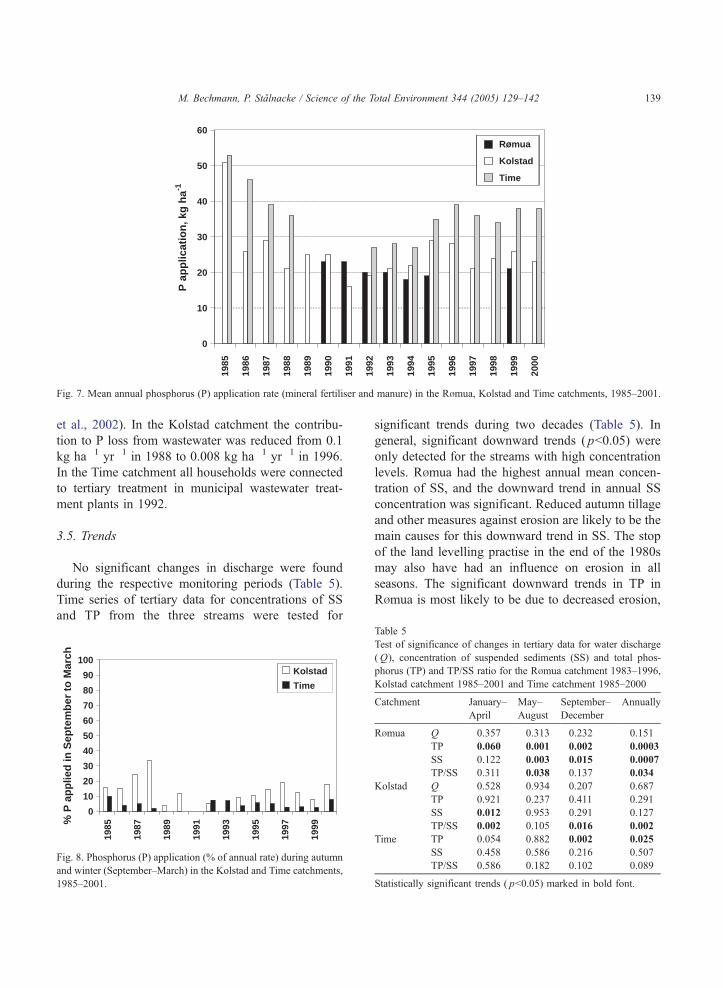
In the areas dominated by livestock production, a
surplus of nutrients was available (Kolstad and Time)
(Fig. 7). The high P application rate (53 kg P ha�1
yr�1 in mineral fertilizer and manure) registered in
1985 in the Time catchment decreased in the
following years and then levelled off to less than 30
kg ha�1 yr�1 with minor increase in recent years (Fig.
7). The P application rate was higher in all years for
the Time catchment than for the Kolstad catchment. In
the Time catchment, however, a higher share (90–
98%) of the P was applied in the growing season
throughout the study period, whereas in the Kolstad
catchment more than 30% of the P was applied in
autumn and winter in 1988 (Fig. 8). Manure was
spread during winter in the late 1980s as well as in the
late 1990s in the Kolstad catchment, whereas in the
Time catchment manure were never spread between
1st of November and 15th of February in the study
period. The rather sparse information on P application
in the Rbmua catchment shows no trends in the use of
P (Fig. 8). No changes in number of livestock were
registered during 1985–2000 in the three catchments.
The point sources, mainly scattered dwellings,
constituted 19% of the P sources in Rbmua in 1994,
while in Kolstad and Time point sources contributed
to only 2% and 3% of P losses, respectively. No
specific data on improved wastewater treatment in
Rbmua are available, although decreases in point
source emissions are likely. For all of Norway, it has
been estimated that human point sources of P have
been reduced by 61% from 1985 to 2001 (Borgvang
mua
9 1990 1991 1992 1993 1994 1995 1996
llage in autumn. Data for 1980s are not available. Data for 1983 are
0
10
20
30
40
50
60
1985
1986
1987
1988
1989
1990
1991
1992
1993
1994
1995
1996
1997
1998
1999
2000
P a
pp
licat
ion
, kg
ha-1
Rømua
Kolstad
Time
Fig. 7. Mean annual phosphorus (P) application rate (mineral fertiliser and manure) in the Rbmua, Kolstad and Time catchments, 1985–2001.
M. Bechmann, P. Stalnacke / Science of the Total Environment 344 (2005) 129–142 139
et al., 2002). In the Kolstad catchment the contribu-
tion to P loss from wastewater was reduced from 0.1
kg ha�1 yr�1 in 1988 to 0.008 kg ha�1 yr�1 in 1996.
In the Time catchment all households were connected
to tertiary treatment in municipal wastewater treat-
ment plants in 1992.
3.5. Trends
No significant changes in discharge were found
during the respective monitoring periods (Table 5).
Time series of tertiary data for concentrations of SS
and TP from the three streams were tested for
0
10
20
30
40
50
60
70
80
90
100
1985
1987
1989
1991
1993
1995
1997
1999%
P a
pp
lied
in S
epte
mb
er t
o M
arch
Kolstad
Time
Fig. 8. Phosphorus (P) application (% of annual rate) during autumn
and winter (September–March) in the Kolstad and Time catchments,
1985–2001.
significant trends during two decades (Table 5). In
general, significant downward trends ( pb0.05) were
only detected for the streams with high concentration
levels. Rbmua had the highest annual mean concen-
tration of SS, and the downward trend in annual SS
concentration was significant. Reduced autumn tillage
and other measures against erosion are likely to be the
main causes for this downward trend in SS. The stop
of the land levelling practise in the end of the 1980s
may also have had an influence on erosion in all
seasons. The significant downward trends in TP in
Rbmua is most likely to be due to decreased erosion,
Table 5
Test of significance of changes in tertiary data for water discharge
(Q), concentration of suspended sediments (SS) and total phos-
phorus (TP) and TP/SS ratio for the Rbmua catchment 1983–1996,
Kolstad catchment 1985–2001 and Time catchment 1985–2000
Catchment January–
April
May–
August
September–
December
Annually
Rbmua Q �0.357 �0.313 �0.232 �0.151
TP �0.060 �0.001 �0.002 �0.0003
SS �0.122 �0.003 �0.015 �0.0007
TP/SS 0.311 0.038 0.137 0.034
Kolstad Q �0.528 0.934 0.207 0.687
TP �0.921 �0.237 �0.411 �0.291
SS 0.012 0.953 0.291 0.127
TP/SS �0.002 �0.105 �0.016 �0.002
Time TP �0.054 0.882 �0.002 �0.025
SS �0.458 0.586 �0.216 �0.507
TP/SS �0.586 �0.182 �0.102 �0.089
Statistically significant trends ( pb0.05) marked in bold font.
M. Bechmann, P. Stalnacke / Science of the Total Environment 344 (2005) 129–142140
since erosion is the main P transport mechanism in
this catchment. However, the trends were significant
for TP for all seasons, which may suggest that
additional factors are important. Improved wastewater
treatment may explain the reduction in P concen-
trations during summer and low flow winter periods.
The relative point source contribution has been
estimated to be around 20% in the Rbmua catchment
in 1996 (Wivestad, 1996). Using the general reduction
in TP contribution from point sources (55%) esti-
mated by Borgvang et al. (2002), this indicates that
the point source reductions can only explain a minor
part of the observed improvements in the water
quality. This is underlined by the significant reduc-
tions in SS concentration.
Trends for the Kolstad stream were difficult to
detect statistically. For the annual data, only the TP/
SS ratio showed a statistically significant trend
(Table 5). The decrease in TP/SS is a result of the
increasing SS concentration, which was significant
for the winter period. The statistical method used
here accounted for fluctuations in water discharge.
Although it cannot be ruled out whether other types
of hydro meteorological conditions have influenced
the trend test results, such as changes in snowmelt
pattern. Øygarden (2000) found that the highest
losses of SS in the Rbmua region occurred during
snowmelt. Changing climate in the Kolstad region
from stable winters to a climate with more frequent
freeze–thaw cycles may increase the number of
serious snowmelt and erosion events (Skaugen,
T.E., http://www.met.no, personal communication).
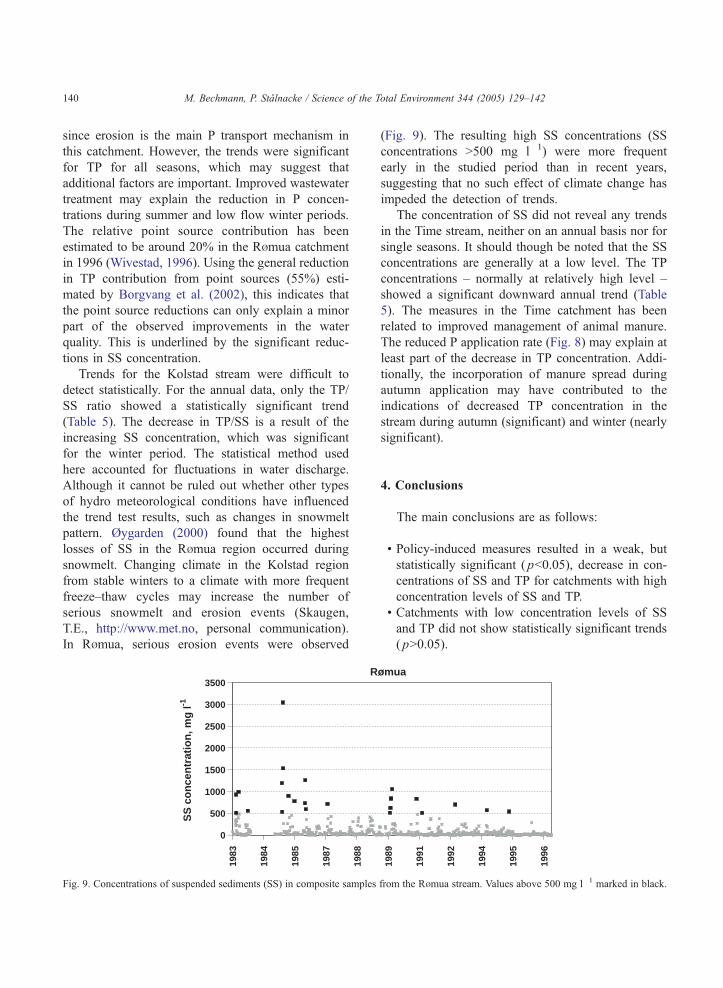
In Rbmua, serious erosion events were observed
R
0
500
1000
1500
2000
2500
3000
3500
1983
1984
1985
1987
1988
SS
co
nce
ntr
atio
n, m
g l-1
Fig. 9. Concentrations of suspended sediments (SS) in composite samples
(Fig. 9). The resulting high SS concentrations (SS
concentrations N500 mg l�1) were more frequent
early in the studied period than in recent years,
suggesting that no such effect of climate change has
impeded the detection of trends.
The concentration of SS did not reveal any trends
in the Time stream, neither on an annual basis nor for
single seasons. It should though be noted that the SS
concentrations are generally at a low level. The TP
concentrations – normally at relatively high level –
showed a significant downward annual trend (Table
5). The measures in the Time catchment has been
related to improved management of animal manure.
The reduced P application rate (Fig. 8) may explain at
least part of the decrease in TP concentration. Addi-
tionally, the incorporation of manure spread during
autumn application may have contributed to the
indications of decreased TP concentration in the
stream during autumn (significant) and winter (nearly
significant).
4. Conclusions
The main conclusions are as follows:
! Policy-induced measures resulted in a weak, but
statistically significant ( pb0.05), decrease in con-
centrations of SS and TP for catchments with high
concentration levels of SS and TP.
! Catchments with low concentration levels of SS
and TP did not show statistically significant trends
( pN0.05).
ømua
1989
1991
1992
1994
1995
1996
from the Rbmua stream. Values above 500 mg l�1 marked in black.

M. Bechmann, P. Stalnacke / Science of the Total Environment 344 (2005) 129–142 141
! The difference in concentration levels between
catchments reflected varying agricultural manage-
ment practice and geological conditions.
! The political strategies in the agricultural sector
resulted in changed management practices within
the catchments during the 1980s and 1990s.
Though changes in agricultural management prac-
tice were followed by significant decreasing trends in
concentrations of SS and TP in the streams with the
highest concentrations, improvement of measures may
be needed to further improve water quality. Focusing
measures on high-risk areas within the catchments
may improve the cost-efficiency of subsidies used to
implement measures in agricultural management
practice.
Acknowledgements
We thank the Norwegian Crop Research Institute
(Apelsvoll avd. Kise and S&rheim) and ANa(Avlbpssambandet Nordre Øyern) for providing data
from the monitoring stations, and Karl Kerner (Agro
Lingua) for careful revision of the language. In
addition, we gratefully acknowledge financial support
from SLF (Norwegian Agricultural Authority) and
SFT (Norwegian Pollution Control Authority) to the
Agricultural Environmental Monitoring Programme.
References
Bechmann M, Krogstad T, Sharpley AN. A phosphorus index for
Norway: justification of factors. Proceedings of the 7th IWA
International Conference on Diffuse Pollution and Basin
Management, vol. 3, p. 163–9.
Borgvang S, Selvik JR, Tjomsland T. Input of nutrients to
Norwegian coastal areas, calculated with the input-model.
TEOTIL. Norwegian Institute for Water Research. ISBN: 82-
577-4308-9; 2002. p. 46 [In Norwegian].
Bye AS, Gundersen GI. Undelstvedt, J.K. Resultatkontroll jordbruk.
Statistics Norway 2003 Report 2003/16. p 95.
Dietz EJ, Kileen A. A nonparametric multivariate test for monotone
trend with pharmaceutical applications. J Am Stat Assoc 1981;
76:169–74.
Egner H, Riehm H, Domingo WR. Untersuchungen qber die
chemische bodenanalyse als grundlage fqr die beurteilung des
n7rstoffzustandes der bfden: II. Chemische extractionsmetho-
den zur phosphor- und kaliumbestimmung. Ann Landw
Hochsch Schwedens 1960;26:199–215.
Ekholm P, Kallio K, Salo S, Pietil7inen OP, Rekolainen S, Laine Y,
et al. Relationships between catchment characteristics and
nutrient concentrations in an agricultural river system. Water
Res 2000;34:3709–16.
Eltun R, Fugleberg O, Nordheim O. The Apelsvoll cropping system
experiment VII runoff losses of soil particles, phosphorus,
potassium, magnesium, calcium and sulphur. Norw Agric Sci
1996;10:371–84.
Haraldsen TK, Stalnacke P, 2002. Monitoring of Agricultural
Catchments in the Nordic Countries, vol. 749. TemaNord7
Nordic Council of Ministers; 2002. 65 pp.
Haraldsen TK, Øygarden L, Rognerud B, Aastveit AH. Correlations
between concentrations of plant nutrients in runoff from small
catchments in Norway. Nord Hydrol 1995;26:91–110.
Hirsch RM, Slack JR. A nonparametric trend test for seasonal data
with serial dependence. Water Resour Res 1984;20:727–32.
Hirsch RM, Slack JR, Smith RA. Techniques of trend analysis for
monthly water quality data. Water Resour Res 1982;18:107–21.
Iital A, Stalnacke P, Deelstra J, Loigu E, Pihlak M. Effects of
large-scale changes in emissions on nutrients concentrations
in Estonian rivers in the lake Peipsi drainage basin. J Hydrol
2005 (in press).
Johnes P, Moss B, Phillips G. The determination of total nitrogen
and total phosphorus concentrations in freshwaters from land
use, stock headage and population data: testing of a model for
use in conservation and water quality management. Freshw Biol
1996;36:451–73.
Krogstad T. Utvikling og vurdering av fosfortilstand i dyrka jord i
perioden 1960–85 med hovedvekt pa Romerike og J&ren(trends and evaluation of phosphorus status in soils in the
period 1960–85 with focus on Romerike and J&ren). Jord og
Myr 1987;5:153–63 [In Norwegian].
Krogstad T, Lbvstad a. Fosfor i jord og vann [(Phosphorus in soil
and water)]. Jord og Myr 1987;11:189–208 [In Norwegian].
Kronvang B, Grant R, Larsen SE, Svendsen LM, Kristensen P.
Non-point source nutrient losses to the aquatic environment in
Denmark Impact of agriculture. Mar Freshw Res 1995;46:
167–77.
Kronvang B, Bechmann M, Pedersen ML, Flynn N. Phosphorus
dynamic and export in streams draining micro-catchments:
development of empirical models. J Plant Nutr Soil Sci 2003;
166:469–74.
Larsen SE, Kronvang B, Windolf J, Svendson LM. Trends in diffuse
nutrient concentrations and loading in Denmark: statistical trend
analysis of stream monitoring data 1999;39:197–205.
Libiseller C, Grimvall A. Performance of partial Mann–Kendall
tests for trend detection in the presence of covariates. Environ-
metrics 2002;13(1);71–84.
Lundekvam H, Romstad E, Øygarden L. Agricultural policies in
Norway and effects on soil erosion. Environ Sci Policy 2003;6:
57–67.
Mander U, Kull A, Tamm T. Nutrient runoff dynamics in a rural
catchment: influence of land-use changes, climatic fluctuations
and ecotechnological measures 2000;14:405–17.
Murphy J, Riley JP. A modified single solution method for
determination of phosphate in natural waters. Anal Chim Acta
1962;27:31–6.

M. Bechmann, P. Stalnacke / Science of the Total Environment 344 (2005) 129–142142
Øygarden L. Monitoring of soil erosion in small agricultural
catchments, south-eastern Norway. Doctor Scientiarum Theses
2000;8. 167 pp.
Øygarden L, Kv&rner J, Jenssen PD. Soil erosion via preferential
flow to drainage systems in clay soils. Geoderma 1997;76:
65–86.
Raike A, Pietilainen OP, Rekolainen S, Kauppila P, Pitkanen H,
Niemi J, et al. Trends of phosphorus, nitrogen and chlorophyll a
concentrations in Finnish rivers and lakes in 1975–2000. Sci
Total Environ 2003;310:47–59.
Sharpley AN, Rekolainen S. Phosphorus in agriculture and its
environmental implications. In: Tunney H, Carton OT, Brookes
AE, Johnston AE, editors. Phosphorus Loss from Soil to Water.
Cab International; 1997. p. 1–54.
Stalnacke P, Bechmann M. Trends in nutrient runoff from
agricultural basins in Norway. In: Steenvoorden J, Claessen F,
Willems J, editors. IAHS Publ, vol. 273; 2002. p. 267–71.
Stalnacke P, Grimvall A. Semiparametric approaches to flow-
normalisation and source apportionment of substance transports
in rivers. Environmetrics 2001;12:233–50.
Stalnacke P, Grimvall A, Libiseller C, Laznik, M, Kokorite, I.,
Trends in nutrient concentrations in Latvian rivers and the
response to the dramatic change in agriculture. J Hydrol
2003;283:184 – 205.
Ulen B. Nutrient exports from two agriculture-dominated water-
sheds in southern Sweden. Nord Hydrol 1998;29:41–56.
Ulen B, Johansson G, Kyllmar K. Model predictions and long-term
trends in phosphorus transport from arable lands in Sweden.
Agric Water Manag 2001;49:197–210.
Vagstad N, Stalnacke P, Deelstra J, Andersen HE, Gustafson A,
Kyllmar K, et al, 2001. Nutrient Losses from Agriculture in
Nordic and Baltic Countries, vol. 591. TemaNord7 Nordic
Council of Ministers; 2001. 74 pp.
Withers PJA, Ulen B, Stamm C, Bechmann M. Incidental
phosphorus losses—are they significant and can they be
predicted? J Plant Nutr Soil Sci 2003;166:459–68.
Wivestad TM. Rbmua Environmental pollution and loads. ISBN:
82-7473-041-0; 1996. p. 33 [In Norwegian].