Land suitability assessment of short rotation coppice plantations in Italy
Upload
scionresearchCategory
view
2download
0
RESEARCH ARTICLE
Effect of phosphate rock and triple superphosphateon soil phosphorus fractions and their plant-availabilityand downward movement in two volcanic ash soilsunder Pinus radiata plantations in New Zealand
A. A. Rivaie Æ P. Loganathan Æ J. D. Graham ÆR. W. Tillman Æ T. W. Payn
Received: 15 October 2007 / Accepted: 1 February 2008 / Published online: 23 February 2008
� Springer Science+Business Media B.V. 2008
Abstract Changes in phosphorus (P) fractions and
their plant-availability and downward movement in
two strongly P fixing acidic Andosols (Allophanic
and Pumice Soils) under Pinus radiata plantations in
New Zealand were studied 2 years after triple
superphosphate (TSP) and a phosphate rock (BGPR,
origin Ben Guerir, Morocco) application, each at four
rates, to determine the fate and plant availability of
fertilizer-derived P in these soils. The rate of increase
of the concentrations of the P fractions was highest
for NaOH-Pi (inorganic P associated with Fe and Al
oxides and allophane) when TSP was applied and
highest for H2SO4-Pi (predominantly calcium phos-
phates or apatite-type P minerals) when BGPR was
applied. The largest pool of soil P, the NaOH-Po
(labile organic P), was unaffected by the P fertilizer
applications. The rate of NaOH-Pi concentration
increase was higher in the higher P fixing Allophanic
Soil than in the Pumice Soil. Both types of fertilizers
increased resin-Pi (Inorganic P freely available to the
plant) and Bray-2 P concentrations but only the TSP
application increased Olsen P concentration. Phos-
phorus derived from TSP and BGPR applications
moved down to 10–20 cm soil depth within 2 years
of application in the Pumice Soil, but did not move
below 10 cm depth in the higher P fixing and less
porous Allophanic Soil. The fertilizers significantly
increased needle P concentrations 2, 3 and 4 years
after fertilizer application, but did not have any
significant effect on tree growth.
Keywords Fertilizer � Pinus radiata �Phosphorus � Soil phosphorus fractions �Phosphorus availability � Phosphate rock
Introduction
Phosphorus (P) is an important nutrient in New
Zealand Pinus radiata D. Don (P. radiata) planta-
tions as most of the soils are P deficient or marginally
deficient, and this element has been routinely applied
since the 1960s where appropriate (Hunter et al.
1991; Payn et al. 1998). Both soluble and less soluble
P fertilizers can be used in forest production. Many
field trials have shown that direct application of the
less soluble reactive phosphate rocks (RPRs) to
permanent pastures and crops, which have a long
growing season and do not have short-term require-
ments for high levels of P, can be as effective as the
soluble single superphosphate (SSP) or triple super-
phosphate (TSP) in acidic soils (Chien et al. 1987;
Bolan et al. 1990; Indiati et al. 2002; Szilas et al.
A. A. Rivaie � P. Loganathan (&) � R. W. Tillman
Soil and Earth Sciences, Institute of Natural Resources,
Massey University, Palmerston North, New Zealand
e-mail: [email protected]
J. D. Graham � T. W. Payn
Forest Research, 49 Sala St., Private Bag 3020 Rotorua,
New Zealand
123
Nutr Cycl Agroecosyst (2008) 82:75–88
DOI 10.1007/s10705-008-9170-6
2007). Unlike with pastures and crops, only a few
studies have been conducted into the direct applica-
tion of RPRs to P. radiata plantations, especially on
Allophanic and Pumice Soils (Mead and Gadgil
1978; Hunter and Hunter 1991) where P. radiata is
commonly planted in New Zealand.
Readily soluble P fertilizers have the potential to
supply P to plants immediately after application but
the P-availability to plants generally decreases with
time due to the conversion of soluble P to less soluble
forms as a result of reaction with soil constituents,
especially in strongly P-fixing soils of volcanic origin.
In comparison, the plant-availability of P from less
soluble fertilizers such as RPRs is generally low at the
start but may increase with time due to the increased
dissolution of the fertilizer. The P dissolved from these
fertilizers undergoes various reactions with the inor-
ganic and organic constituents of the soil resulting in
products of varying solubility. The rates of transfor-
mation of fertilizer-derived P into the various soil
P fractions can provide information on the plant-
availability of soil P at various times after P applica-
tion. In a recent laboratory incubation study
investigating the changes in soil P fractions following
a soluble P fertilizer (mono-calcium phosphate
(MCP)) application to a Brown Kandosol soil from a
Eucalyptus forest in Australia, Short et al. (2007)
reported that much of the P applied was converted
rapidly to forms with reduced availability; by the time
of the first measurement (4 weeks) only approximately
10% of the added P remained as readily available
resin-extractable P. For the surface soil, much of this
added P was initially converted to the NaOH-extract-
able organic P fraction, before progressively moving
into the NaOH-extractable inorganic P fraction
(P associated with Al and Fe oxide surfaces). For the
mixture of surface and subsoil, the added P was rapidly
converted directly to the NaOH-extractable inorganic
P fraction. Only a few studies have been reported on
determining the effect of P fertilizer application on
P fractions in forest soils under field conditions (Chen
et al. 2003; Liu et al. 2005). Some of these studies
focused mainly on determining the total organic and
inorganic P pools without further separating the
P fractions in each of these pools.
Phosphorus moving downwards in soils has the
potential to reach drainage waters, and can have
adverse environmental effects if it reaches surface
waters. Suggestions have been made that subsoil
sampling should be considered for P prognosis if
significant quantities of P derived from fertilizers or
animal manures applied to surface soils move deeper
in soils (Hountin et al. 2000; Wang et al. 2007).
The objective of the study reported in this paper was
to examine the changes in P fractions and the plant-
availability and downward movement of P, 2 years
following the application of two forms of P fertilizer
with different solubility to an Allophanic Soil (Cryands
and Udands) and a Pumice Soil (Cryand) under second-
rotation P. radiata plantations.
Materials and methods
Site description
Two experiments, one at the Kaweka forest, 50 km
NW of Hastings, New Zealand, located at 740 m
altitude, the other at the Kinleith forest, 15 km NE of
Tokoroa, New Zealand located at 520 m altitude, were
installed in September 2000 by New Zealand Forest
Research Ltd. The soils are classified as Orthic
Allophanic Soil (Cryands and Udands, US Soil Tax-
onomy) at the Kaweka forest and Orthic Pumice Soil
(Vitricryands, U S Soil Taxonomy) at the Kinleith
forest (Hewitt 1998; Soil Survey Staff 1998). Selected
properties of the soils are presented in Table 1.
The climate at the Kinleith forest is cool and humid
(mean annual RH 82%), with a mean annual rainfall of
approximately 1600 mm, and without a pronounced
dry period. Mean annual temperature is 12.2�C, with a
February maximum monthly mean of 17.4�C and a
July minimum of 6.9�C. The climate at the Kaweka
forest is also cool and humid (mean annual RH 70%),
but mean annual rainfall is approximately 1400 mm,
and the area also has no pronounced dry period. Mean
annual temperature is 12.6�C, with a February maxi-
mum monthly mean of 16.3�C and a July minimum of
5.5�C. During the experimental period (2001 and
2002), the total rainfall for 2001 and 2002 was 1285
and 1280 mm at the Kaweka forest and 1491 and
1702 mm at Tokoroa (the closest station to the Kinleith
forest), respectively (National Institute of Water and
Atmospheric Research, personal communication).
At Kaweka forest, the trees were 4- to 5-year-old
second-rotation radiata pines. They were planted
in 1995–1996 at a nominal stocking rate of 1000
76 Nutr Cycl Agroecosyst (2008) 82:75–88
123

stems ha-1. At the Kinleith forest the 3-year-old
second rotation trees were planted in 1997 at a nominal
stocking rate of 670 stems ha-1. Fertilizer had not at
any time been applied to either the first-rotation or to
the second-rotation trees. The predominant understo-
rey species at the Kaweka forest were bracken fern
(Pteridium esculentum), some manuka (Leptospermum
scoparium), and brown top (Agrostis capillaris), while
at the Kinleith forest they were Himalayan honeysuckle
(Leycesteria formosa), buddleia (Buddleja davidii
Franchet), and some toetoe (Cortaderia toetoe).
Experimental design and treatments
The experiments tested the effects of four rates (0, 50,
100, and 200 kg P ha-1) of P applied in two forms of
P fertilizer, a soluble form (triple superphosphate
(TSP)) and a less soluble form (‘‘as received’’ Ben
Guerir phosphate rock (BGPR), mined in Morocco),
in combination with weed control (weed and weed-
free). The water and 2% citric acid soluble
P concentrations of the fertilizers and the particle
size distribution of BGPR are presented in Table 2.
The 2% citric acid solubility of the BGPR in the
as-received state is 28% of the total P content
(Table 2). This value is close to the 30% value above
which PRs are commonly classified as reactive PRs
(White et al. 1989). The treatments were replicated
four times at each site. Each P rate constituted a plot.
Plot sizes were 15 9 15 m plus a treated buffer 5 m
wide. The fertilized buffer was extended to 10 m on
one side of each plot to contain a weed control
treatment. Soil samples were taken from the
15 9 15 m internal plots but no comparisons were
made with the weed control areas as the control had
not been fully effective. The P fertilizers were applied
by hand to the entire surface of the experimental plots
in both forests in October 2000.
Soil sampling
Soil samples were collected in November 2001
and December 2002 at the Kaweka forest, and in
December 2002 at Kinleith forest, using a 2-cm-
diameter soil corer. Twenty soil cores per plot were
taken (spaced uniformly throughout the plot and each
one 1.5 m from the stem of a measurement tree) at soil
depths of 0–10, 10–20, and 20–30 cm, and the cores at
each depth for each treatment were combined. All soil
samples were air-dried and passed through a 2-mm
sieve to remove debris (obvious root and foliage), and
the sieved samples were stored for chemical analyses.
Samples of soils had also been collected from the 4
blocks at each site before the experiment started and
were analysed to determine the soil P status and soil
properties before starting the trials.
Chemical analysis
Soil pH was measured in a water suspension (using a
soil:solution weight ratio of 1:2.5) after the suspensions
were shaken for 24 hours on a reciprocal shaker. The
organic matter content of the soils (expressed as
Table 1 Selected properties of the soils (0–10 cm depth
below the litter layer) at the Kaweka (Allophanic Soil) and
Kinleith (Pumice Soil) forests
Parameter Kaweka Kinleith
pH (1:2.5 H2O) 5.7 5.1
K (cmolc kg-1) 0.29 0.94
Ca (cmolc kg-1) 2.90 9.20
Mg (cmolc kg-1) 0.58 1.36
Na (cmolc kg-1) 0.12 0.10
C (%) 5.6 7.0
CEC (cmolc kg-1) 14 24
P retention (%) 92 83
Bray-2 P (lg g-1) 4 13
Olsen P(lg g-1) 3 6
Resin-Pi (lg g-1) 1 9
NaOH-Pi (lg g-1) 39 43
NaOH-Po (lg g-1) 130 161
H2SO4-Pi (lg g-1) 17 7
Residual-P (lg g-1) 61 45
Total P* (lg g-1) 248 265
* Sum of resin-Pi, NaOH-Pi, NaOH-Po, H2SO4-Pi and resid-
ual-P
Table 2 Chemical characteristics of the P fertilizers used for
the trials
Fertiliser Total Pa (%) 2% Citric acid
soluble Pa (%)
Water soluble
Pa (%)
TSP 20.5 100 93
BGPRb 13.2 28 \1
a Rajan (1985)b Ben Guerir phosphate rock
Nutr Cycl Agroecosyst (2008) 82:75–88 77
123
percentage carbon) was determined by heating the
samples in a stream of high purity oxygen in a Leco
furnace to produce CO2. The CO2 was measured with an
infrared detector (Leco Co. 1996) and the quantity of
that gas used to determine the total organic carbon.
Cation exchange capacity (CEC) and exchangeable
cations were determined by ammonium acetate leaching
at pH 7 (Blakemore et al. 1987). The concentrations of
K, Ca, Mg, and Na in the leachates were determined by
atomic absorption spectrometry (AAS), and the ammo-
nium concentration was determined using an Autoana-
lyser (Blakemore et al. 1987). Phosphorus retention (an
index of P fixation) was determined by measuring the
P concentration in soil solution after 5 g soil was shaken
with 25 ml solution containing 1000 lg P ml-1 for
16 h. Bray-2 P was determined by shaking 2.5 g of air
dry soil for one minute in 25 ml of a solution containing
0.3 M NH4F and 0.1 M HCl and measuring the
P concentration in the solution by the colorimetric
technique of Murphy and Riley (1962) (Blakemore
et al. 1987). Olsen P was determined by shaking 1 g of
air dry soil in 20 ml of 0.5 M NaHCO3 (pH 8.5) for
30 minutes in an end-over-end shaker (Olsen et al.
1954; Blackmore et al. 1987) followed by measuring
the P concentration in the solution by the colorimetric
technique of Murphy and Riley (1962).
Soil P was fractionated using the method of
Hedley et al. (1994) (Table 3) by first extracting
0.5 g air-dried soil with a cation (Na+-form) and
anion (HCO3- form) exchange resin membrane to
determine resin-P, followed by 0.1 M NaOH extrac-
tion and determining inorganic P (NaOH-Pi) and
labile organic P (NaOH-Po) in the extract. The soil
residue was further extracted with 0.5 M H2SO4
(H2SO4-Pi) followed by digestion of the residue with
concentrated H2SO4 and H2O2 to determine the
residual-P. The P concentrations in all the above
extracts and digests were measured by the colorimet-
ric technique of Murphy and Riley (1962).
Plant uptake of Pi from the soil has been shown to
be mainly from the resin-Pi fraction, but 0.1 M
NaOH-Pi fraction can also supply P to plants in the
long-term (Trolove et al. 2003). These two fractions
can be grouped together and called labile-Pi.
Tree growth
At both trial sites, height and diameter at breast
height (DBH) were measured on the 15–22 trees per
plot in September 2002 (24 months after fertilizer
treatments), September 2003, and July 2004. DBH
was measured at 1.4 m above ground and basal area
(BA) was calculated as the sum of the sectional areas
of all stems (1000 stems ha-1 at Kaweka forest and
670 stems ha-1 at Kinleith forest) at breast height,
expressed in square metres ha-1 (MacLaren 1993).
Foliage sampling and chemical analysis
Foliage samples were collected from both trials in
March 2003 (29 months after fertilizer treatments),
March 2004 and March 2005. The needles from
secondary branches in the upper third of the crown
were randomly sampled from 10 trees per plot.
Samples were oven dried at 70�C to constant weight
and then ground to\1 mm before chemical analysis.
Five ml of concentrated HNO3 (99%) was added to
0.25 g dried and ground foliage in a Pyrex tube and
digested at 150�C for about 20 minutes (until the
digest was clear). After cooling, 1.5 ml of 30% H2O2
was added and the digestion continued for 1 hour.
After further cooling, the sample was diluted with
25 ml of deionised water and the P concentration was
determined using inductively coupled plasma (ICP)
spectrometry. All results were corrected to oven dry
weights at 100�C (Leco Co. 1996).
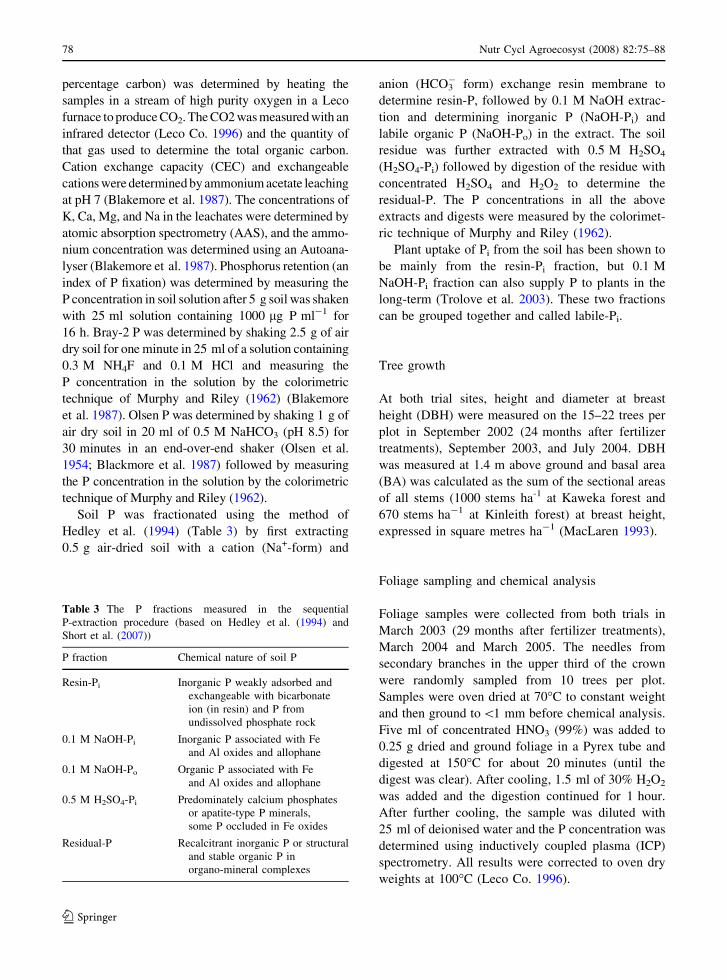
Table 3 The P fractions measured in the sequential
P-extraction procedure (based on Hedley et al. (1994) and
Short et al. (2007))
P fraction Chemical nature of soil P
Resin-Pi Inorganic P weakly adsorbed and
exchangeable with bicarbonate
ion (in resin) and P from
undissolved phosphate rock
0.1 M NaOH-Pi Inorganic P associated with Fe
and Al oxides and allophane
0.1 M NaOH-Po Organic P associated with Fe
and Al oxides and allophane
0.5 M H2SO4-Pi Predominately calcium phosphates
or apatite-type P minerals,
some P occluded in Fe oxides
Residual-P Recalcitrant inorganic P or structural
and stable organic P in
organo-mineral complexes
78 Nutr Cycl Agroecosyst (2008) 82:75–88
123
Statistical analysis
Analysis of variance (ANOVA) for a split-plot design
was performed using SAS (SAS Institute 2001). The
least significant difference (LSD) test at P = 0.05,
unless otherwise stated, was used to separate the
means when analysis of variance (ANOVA) results
indicated there were significant treatment effects
(Steel et al. 1997). For the Kaweka forest, resin-Pi
data were square root transformed and NaOH-Pi and
H2SO4-Pi data were loge transformed; while for the
Kinleith forest resin-Pi and H2SO4-Pi data were loge
transformed and NaOH-Pi data were square root
transformed. The data were square root transformed
when the spreads (or standard deviation) were
proportional to the square root of the mean; and the
data were loge transformed when the spreads (or
standard deviation) were proportional to the treat-
ment mean. Unlike the data for soil P concentrations,
the data for foliage P concentrations and tree growth
conformed to the assumptions (in particular, the
homogeneity of variance and normality) underlying
the ANOVA. Therefore, no transformations of those
data were made.
Results and discussion
Needle P concentration and tree growth
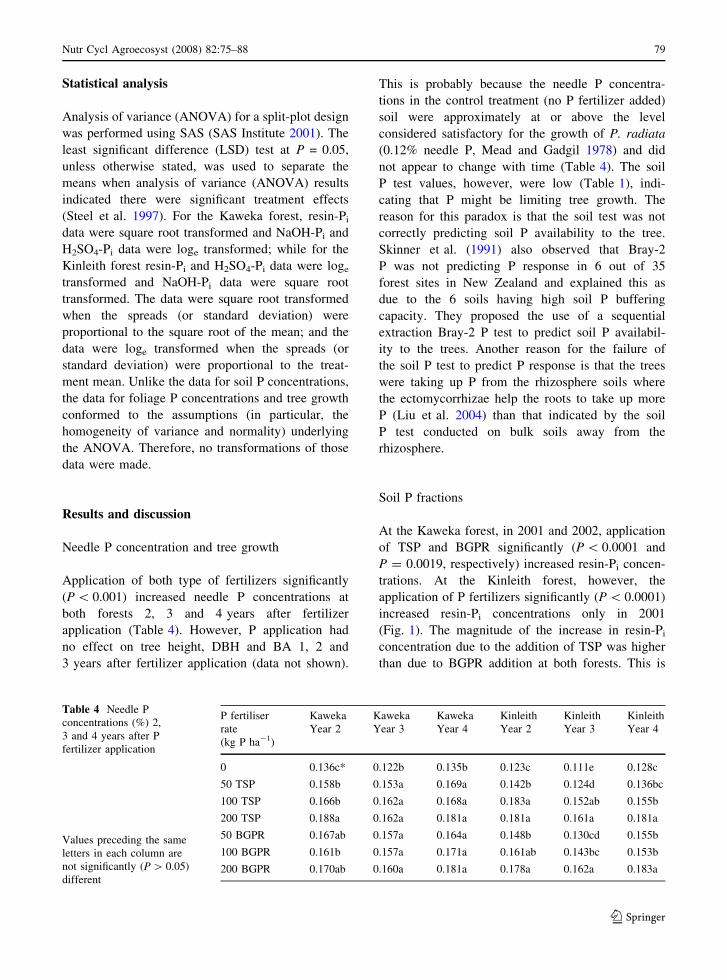
Application of both type of fertilizers significantly
(P \ 0.001) increased needle P concentrations at
both forests 2, 3 and 4 years after fertilizer
application (Table 4). However, P application had
no effect on tree height, DBH and BA 1, 2 and
3 years after fertilizer application (data not shown).
This is probably because the needle P concentra-
tions in the control treatment (no P fertilizer added)
soil were approximately at or above the level
considered satisfactory for the growth of P. radiata
(0.12% needle P, Mead and Gadgil 1978) and did
not appear to change with time (Table 4). The soil
P test values, however, were low (Table 1), indi-
cating that P might be limiting tree growth. The
reason for this paradox is that the soil test was not
correctly predicting soil P availability to the tree.
Skinner et al. (1991) also observed that Bray-2
P was not predicting P response in 6 out of 35
forest sites in New Zealand and explained this as
due to the 6 soils having high soil P buffering
capacity. They proposed the use of a sequential
extraction Bray-2 P test to predict soil P availabil-
ity to the trees. Another reason for the failure of
the soil P test to predict P response is that the trees
were taking up P from the rhizosphere soils where
the ectomycorrhizae help the roots to take up more
P (Liu et al. 2004) than that indicated by the soil
P test conducted on bulk soils away from the
rhizosphere.
Soil P fractions
At the Kaweka forest, in 2001 and 2002, application
of TSP and BGPR significantly (P \ 0.0001 and
P = 0.0019, respectively) increased resin-Pi concen-
trations. At the Kinleith forest, however, the
application of P fertilizers significantly (P \ 0.0001)
increased resin-Pi concentrations only in 2001
(Fig. 1). The magnitude of the increase in resin-Pi
concentration due to the addition of TSP was higher
than due to BGPR addition at both forests. This is
Table 4 Needle P
concentrations (%) 2,
3 and 4 years after P
fertilizer application
Values preceding the same
letters in each column are
not significantly (P [ 0.05)
different
P fertiliser
rate
(kg P ha-1)
Kaweka
Year 2
Kaweka
Year 3
Kaweka
Year 4
Kinleith
Year 2
Kinleith
Year 3
Kinleith
Year 4
0 0.136c* 0.122b 0.135b 0.123c 0.111e 0.128c
50 TSP 0.158b 0.153a 0.169a 0.142b 0.124d 0.136bc
100 TSP 0.166b 0.162a 0.168a 0.183a 0.152ab 0.155b
200 TSP 0.188a 0.162a 0.181a 0.181a 0.161a 0.181a
50 BGPR 0.167ab 0.157a 0.164a 0.148b 0.130cd 0.155b
100 BGPR 0.161b 0.157a 0.171a 0.161ab 0.143bc 0.153b
200 BGPR 0.170ab 0.160a 0.181a 0.178a 0.162a 0.183a
Nutr Cycl Agroecosyst (2008) 82:75–88 79
123
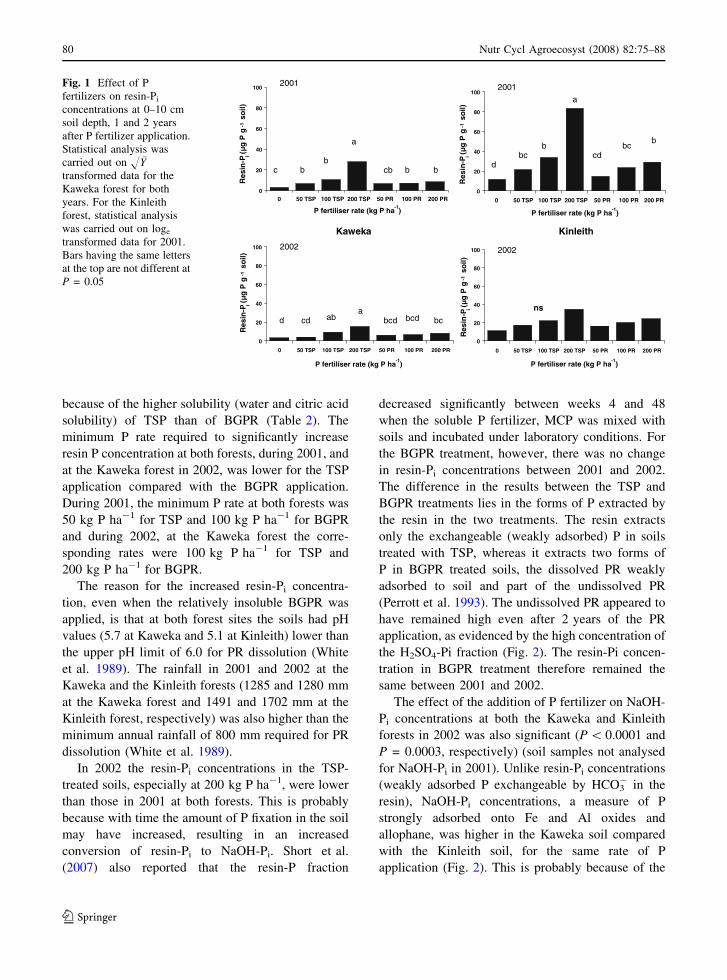
because of the higher solubility (water and citric acid
solubility) of TSP than of BGPR (Table 2). The
minimum P rate required to significantly increase
resin P concentration at both forests, during 2001, and
at the Kaweka forest in 2002, was lower for the TSP
application compared with the BGPR application.
During 2001, the minimum P rate at both forests was
50 kg P ha-1 for TSP and 100 kg P ha-1 for BGPR
and during 2002, at the Kaweka forest the corre-
sponding rates were 100 kg P ha-1 for TSP and
200 kg P ha-1 for BGPR.
The reason for the increased resin-Pi concentra-
tion, even when the relatively insoluble BGPR was
applied, is that at both forest sites the soils had pH
values (5.7 at Kaweka and 5.1 at Kinleith) lower than
the upper pH limit of 6.0 for PR dissolution (White
et al. 1989). The rainfall in 2001 and 2002 at the
Kaweka and the Kinleith forests (1285 and 1280 mm
at the Kaweka forest and 1491 and 1702 mm at the
Kinleith forest, respectively) was also higher than the
minimum annual rainfall of 800 mm required for PR
dissolution (White et al. 1989).
In 2002 the resin-Pi concentrations in the TSP-
treated soils, especially at 200 kg P ha-1, were lower
than those in 2001 at both forests. This is probably
because with time the amount of P fixation in the soil
may have increased, resulting in an increased
conversion of resin-Pi to NaOH-Pi. Short et al.
(2007) also reported that the resin-P fraction
decreased significantly between weeks 4 and 48
when the soluble P fertilizer, MCP was mixed with
soils and incubated under laboratory conditions. For
the BGPR treatment, however, there was no change
in resin-Pi concentrations between 2001 and 2002.
The difference in the results between the TSP and
BGPR treatments lies in the forms of P extracted by
the resin in the two treatments. The resin extracts
only the exchangeable (weakly adsorbed) P in soils
treated with TSP, whereas it extracts two forms of
P in BGPR treated soils, the dissolved PR weakly
adsorbed to soil and part of the undissolved PR
(Perrott et al. 1993). The undissolved PR appeared to
have remained high even after 2 years of the PR
application, as evidenced by the high concentration of
the H2SO4-Pi fraction (Fig. 2). The resin-Pi concen-
tration in BGPR treatment therefore remained the
same between 2001 and 2002.
The effect of the addition of P fertilizer on NaOH-
Pi concentrations at both the Kaweka and Kinleith
forests in 2002 was also significant (P \ 0.0001 and
P = 0.0003, respectively) (soil samples not analysed
for NaOH-Pi in 2001). Unlike resin-Pi concentrations
(weakly adsorbed P exchangeable by HCO3- in the
resin), NaOH-Pi concentrations, a measure of P
strongly adsorbed onto Fe and Al oxides and
allophane, was higher in the Kaweka soil compared
with the Kinleith soil, for the same rate of P
application (Fig. 2). This is probably because of the
0
20
40
60
80
100
0 50 TSP 100 TSP 200 TSP 50 PR 100 PR 200 PR
P fertiliser rate (kg P ha-1
)
0
20
40
60
80
100
0 50 TSP 100 TSP 200 TSP 50 PR 100 PR 200 PR
P fertiliser rate (kg P ha-1
)
0
20
40
60
80
100
P fertiliser rate (kg P ha-1
)
0
20
40
60
80
100
P fertiliser rate (kg P ha-1
)
ns ad cd ab bcd bcd bc
c bb
a
cb b b d
bc b
a
cd bc
b
Kinleith
2001 2001
2002 2002
Kaweka
0 50 TSP 100 TSP 200 TSP 50 PR 100 PR 200 PR 0 50 TSP 100 TSP 200 TSP 50 PR 100 PR 200 PR
Res
in-P
i (μg
P g
-1 s
oil)
Res
in-P
i (μg
P g
-1 s
oil)
Res
in-P
i (μg
P g
-1 s
oil)
Res
in-P
i (μg
P g
-1 s
oil)
Fig. 1 Effect of P
fertilizers on resin-Pi
concentrations at 0–10 cm
soil depth, 1 and 2 years
after P fertilizer application.
Statistical analysis was
carried out on H �Ytransformed data for the
Kaweka forest for both
years. For the Kinleith
forest, statistical analysis
was carried out on loge
transformed data for 2001.
Bars having the same letters
at the top are not different at
P = 0.05
80 Nutr Cycl Agroecosyst (2008) 82:75–88
123

higher P fixation in the Allophanic Soil at the
Kaweka forest compared with the Pumice Soil at
Kinleith forest (Table 1).
The NaOH-Pi concentrations significantly
increased with the increase in the application rates
of TSP and BGPR at both sites, but the rate of
increase was higher for the TSP treatment than for
the BGPR treatment. The higher rate of increase for
the TSP treatment is probably due to the higher
water solubility of TSP compared with BGPR
(Table 2). When fertilizer P became soluble it might
have quickly mobilized and then transformed mainly
into the NaOH-Pi pool in these high P fixing soils.
Zoysa et al. (2001) also reported that the rate of
increase in NaOH-Pi concentration in a high P fixing
Ultisol was higher when the soils were treated with
TSP compared with when the soils were treated with
a PR.
The application of P fertilizer had significant
effects on H2SO4-Pi concentrations in the soils at
both forests (P \ 0.0001 and P \ 0.0001, respec-
tively). The H2SO4-Pi concentrations were higher for
the BGPR treatment than for the TSP treatment for
each of the rates of P application at both trial sites
(Fig. 2). All rates of BGPR application significantly
increased the H2SO4-Pi concentration in both the
soils. This is due to the high concentration of
undissolved PR (P associated with Ca) remaining in
the soils, which was extracted by H2SO4. In com-
parison, the addition of TSP significantly, but only
slightly, increased the H2SO4-Pi concentrations only
at 100 and 200 kg P ha-1 in the Kaweka soil and at
200 kg P ha-1 in the Kinleith soil. Trolove et al.
(1996) also reported that the application of North
Carolina Phosphate Rock (NCPR) to a Typic Dyst-
rocrept in a glasshouse trial increased the H2SO4-Pi
concentrations, while application of MCP, which is
the main P component of TSP, did not increase the
concentration of the H2SO4-Pi fraction. While the
increase in H2SO4-Pi concentrations resulting from
the increase in BGPR rates of application is due to an
increase in the concentration of undissolved PR, the
increase in H2SO4-Pi with an increase in TSP rates
observed in the current study is due to the increase in
concentrations of di-calcium phosphate (DCP) result-
ing from the conversion of MCP in TSP to DCP
(Hedley et al. 1994).
In general, the magnitude of the increase in
H2SO4-Pi concentrations per unit weight of BGPR
addition at the Kaweka forest was greater than that at
the Kinleith forest. This may be due to the higher rate
of dissolution of BGPR in the Kinleith soil than in the
Kaweka soil, as the former was more acidic than the
latter (pH 5.1 and pH 5.7, respectively, Table 1). The
supply of H+ is a driving force for the dissolution of
PR, along with the removal of the dissolution reaction
products Ca2+, H2PO4- and F- from the site of
dissolution (Khasawneh and Doll 1978). Increases
in PR dissolution in allophanic soils in New Zealand,
from 29.3 to 83.5%, 18.2 to 78.9, and 12.5 to 60.3%,
were reported for North Carolina phosphate rock,
Jordan phosphate rock and Nauru phosphate rock,
respectively, when the soil pH decreased from 6.5 to
3.9 (Bolan and Hedley 1990).
Rainfall at the Kinleith forest during the trial
period was higher than at the Kaweka forest
0
50
100
150
200
250
300
350
0 50 TSP 100 TSP 200 TSP 50 PR 100 PR 200 PR
P fertiliser rate (kg P ha -1 )
H 2
O
S
4 g
P
g
µ
( i
P
- 1 -
) l i o
s
0
50
100
150
200
250
300
350
0 50 TSP 100 TSP 200 TSP 50 PR 100 PR 200 PR
P fertiliser rate (kg P ha -1 )
H 2
O
S
4 P
-
i g
P
g
µ
(
1 - ) l i
o
s
0
50
100
150
200
250
300
350
0 50 TSP 100 TSP 200 TSP 50 PR 100 PR 200 PR
P fertiliser rate (kg P ha -1 )
P
- H
O
a
N
i g
P
g
µ
(
1 - ) l i
o
s
0
50
100
150
200
250
300
350
0 50 TSP 100 TSP 200 TSP 50 PR 100 PR 200 PR
P fertiliser rate (kg P ha -1 )
P
- H
O
a
N
i g
P
g
µ
(
1 - ) l i
o
s
Kaweka Kinleith
e* c b
a
e de cd
d bc b
a
cd bc bc
e de cd c c
b
a
d cd c c
b
a
cd
Kinleith Kaweka
Fig. 2 Effect of P fertilizer
rates on NaOH-Pi and
H2SO4-Pi concentrations at
0–10 cm soil depth, 2 years
after P application (2002).
Statistical analysis was
carried out on loge
transformed data. *Bars
having the same letters at
the top are not different at
P \ 0.05
Nutr Cycl Agroecosyst (2008) 82:75–88 81
123

(annual rainfall for 2001 at Kinleith was 1491 mm
and at Kaweka was 1285 mm; for 2002 they were
1702 and 1280 mm, respectively). It is possible that
this would have resulted in a higher soil moisture
regime at the Kinleith forest, promoting the further
dissolution of BGPR. But the Kaweka soil had
lower exchangeable Ca and resin-Pi concentrations
and higher P fixing capacity compared with the
Kinleith soil, and based on these properties PR
dissolution would have been expected to be higher
at Kaweka (Mackay and Syers 1986). The fact that
the rate of PR dissolution based on the H2SO4-Pi
was lower in the Kaweka soil (higher H2SO4-Pi
concentration) indicates that the effect of the higher
acidity and moisture content in the Kinleith soil
overrides the influences of the P fixing capacity, P
concentration and exchangeable Ca in the soils in
promoting a higher rate of BGPR dissolution in the
Kinleith soil.
An attempt was made to calculate the rate of
BGPR dissolution in the field using the difference in
H2SO4-Pi concentrations in soils between the BGPR
treatment and the control treatment and soil bulk
density (Zoysa et al. 2001), but the results showed
extremely high variability and no meaningful infor-
mation on BGPR dissolution in the field soils was
therefore derived. This high variability in BGPR
dissolution is probably due to the high soil variability
in the field and errors associated with using low
levels of PR dissolution in the dissolution calculation.
Comparison of the fertilizer P contribution
to the different soil P fractions
The data on the concentrations of the various soil
P fractions 2 years after application of P fertilizer
showed that for the TSP treated soils and for the
natural soil (no P added) the P concentration in the
different P fractions, in general, decreased in
the order of NaOH-Po[ residual-P [ NaOH-Pi [H2SO4-Pi C resin-Pi at both sites (Fig. 3). For the
addition of BGPR, the trend was similar to that of
TSP but at the rates of 100 and 200 kg P ha-1 the
concentrations of H2SO4-Pi were higher than the
concentrations of NaOH-Pi at both sites. Further-
more, at the BGPR addition rate of 200 kg P ha-1 at
the Kaweka forest, the concentration for the H2SO4-
Pi fraction was the highest, and at Kinleith forest it is
second highest after NaOH-Po.
The pattern of the rate of change in P concentra-
tion in the different P fractions due to the additions of
TSP was different from that due to the additions of
BGPR. When increased rates of TSP were applied,
the NaOH-Pi fraction increased at a faster rate than
the other P fractions and the rate of increase was
more marked at the Kaweka forest than at the
Kinleith forest (Fig. 3). This suggested that the
proportion of P applied in TSP to the soil that was
adsorbed to allophane and Fe + Al oxides was more
than that converted to any of the other P fractions.
The higher rate of increase of NaOH-Pi
0
50
100
150
200
250
300
350
400
0 50 TSP 100 TSP 200 TSP
P fertiliser rate (kg P ha-1)
gP
gµ(
noitart
necn
ocP
1-)li
os NaOH-Po
Residual P
NaOH-Pi
H2SO4-Pi
Resin-Pi
0
50
100
150
200
250
300
350
400
0 50 TSP 100 TSP 200 TSP
P fertiliser rate (kg P ha-1)
gP
gµ(
noitart
necn
ocP
1-)li
os
0
50
100
150
200
250
300
350
400
0 50 BGPR 100 BGPR 200 BGPR
P fertiliser rate (kg P ha-1)
gP
gµ(
noitart
necn
ocP
1-)li
os
0
50
100
150
200
250
300
350
400
0 50 BGPR 100 BGPR 200 BGPR
P fertiliser rate (kg P ha-1)
gP
gµ(
noitart
necn
ocP
1-)li
os
Kinleith PR
Kaweka PR
TSP TSP Fig. 3 Comparison of the
changes in P concentrations
in different soil P fractions
at 0–10 cm soil depth with
increase in TSP and BGPR
rates 2 years after P
application (2002)
82 Nutr Cycl Agroecosyst (2008) 82:75–88
123
concentrations at the Kaweka forest than at the
Kinleith forest is due to the higher P fixation capacity
of the Kaweka soil compared with that of the Kinleith
soil (Table 1). Meanwhile, when increased rates of
BGPR were added, the H2SO4-Pi fraction increased at
a faster rate compared with the other P fractions and
the rate of increase was also more marked at the
Kaweka forest than at the Kinleith forest because of
the presence of a higher proportion of undissolved
BGPR in the higher pH of the Kaweka soil.
At both forests, increased rates of BGPR and TSP
had no effect on the concentrations of NaOH-Po and
residual-P in the 2 years after fertilizers were applied.
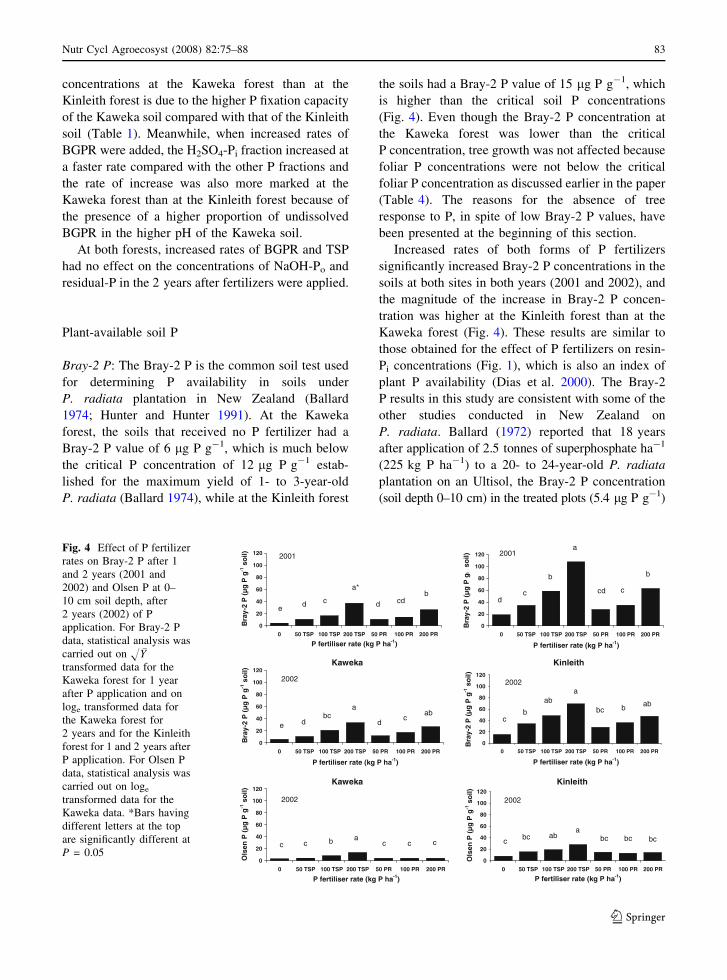
Plant-available soil P
Bray-2 P: The Bray-2 P is the common soil test used
for determining P availability in soils under
P. radiata plantation in New Zealand (Ballard
1974; Hunter and Hunter 1991). At the Kaweka
forest, the soils that received no P fertilizer had a
Bray-2 P value of 6 lg P g-1, which is much below
the critical P concentration of 12 lg P g-1 estab-
lished for the maximum yield of 1- to 3-year-old
P. radiata (Ballard 1974), while at the Kinleith forest
the soils had a Bray-2 P value of 15 lg P g-1, which
is higher than the critical soil P concentrations
(Fig. 4). Even though the Bray-2 P concentration at
the Kaweka forest was lower than the critical
P concentration, tree growth was not affected because
foliar P concentrations were not below the critical
foliar P concentration as discussed earlier in the paper
(Table 4). The reasons for the absence of tree
response to P, in spite of low Bray-2 P values, have
been presented at the beginning of this section.
Increased rates of both forms of P fertilizers
significantly increased Bray-2 P concentrations in the
soils at both sites in both years (2001 and 2002), and
the magnitude of the increase in Bray-2 P concen-
tration was higher at the Kinleith forest than at the
Kaweka forest (Fig. 4). These results are similar to
those obtained for the effect of P fertilizers on resin-
Pi concentrations (Fig. 1), which is also an index of
plant P availability (Dias et al. 2000). The Bray-2
P results in this study are consistent with some of the
other studies conducted in New Zealand on
P. radiata. Ballard (1972) reported that 18 years
after application of 2.5 tonnes of superphosphate ha-1
(225 kg P ha-1) to a 20- to 24-year-old P. radiata
plantation on an Ultisol, the Bray-2 P concentration
(soil depth 0–10 cm) in the treated plots (5.4 lg P g-1)
0
20
40
60
80
100
120
0 50 TSP 100 TSP 200 TSP 50 PR 100 PR 200 PR
P fertiliser rate (kg P ha -1 )
g
P
g
µ
( P
2 - y a r
B
1 - ) l i
o
s
0
20
40
60
80
100
120
0 50 TSP 100 TSP 200 TSP 50 PR 100 PR 200 PR
P fertiliser rate (kg P ha -1 )
g
P
g
µ
( P
2 - y a r
B
1 - ) l i
o
s
0
20
40
60
80
100
120
0 50 TSP 100 TSP 200 TSP 50 PR 100 PR 200 PR
P fertiliser rate (kg P ha -1 )
g
P
g
µ
( P
2 - y a r
B
1 - ) l i
o
s
0
20
40
60
80
100
120
0 50 TSP 100 TSP 200 TSP 50 PR 100 PR 200 PR
P fertiliser rate (kg P ha -1 )
g
P
g
µ
( P
2 - y a r
B
1 - ) l i
o
s
0
20
40
60
80
100
120
0 50 TSP 100 TSP 200 TSP 50 PR 100 PR 200 PR
P fertiliser rate (kg P ha -1 )
g
P
g
µ
( P
n
e s l
O
1 - ) l i
o
s
0
20
40
60
80
100
120
0 50 TSP 100 TSP 200 TSP 50 PR 100 PR 200 PR
P fertiliser rate (kg P ha -1 )
g
P
g
µ
( P
n
e s l
O
1 - ) l i
o
s
Kaweka
Kaweka
Kinleith
Kinleith
2001 2001
2002 2002
2002 2002
e d c
a*
d cd b
d c
b
a
cd c
b
e d bc
a
d c
ab
ab ab
c b
a
b bc
c c b a c c c c bc ab
a bc bc bc
Fig. 4 Effect of P fertilizer
rates on Bray-2 P after 1
and 2 years (2001 and
2002) and Olsen P at 0–
10 cm soil depth, after
2 years (2002) of P
application. For Bray-2 P
data, statistical analysis was
carried out on H �Ytransformed data for the
Kaweka forest for 1 year
after P application and on
loge transformed data for
the Kaweka forest for
2 years and for the Kinleith
forest for 1 and 2 years after
P application. For Olsen P
data, statistical analysis was
carried out on loge
transformed data for the
Kaweka data. *Bars having
different letters at the top
are significantly different at
P = 0.05
Nutr Cycl Agroecosyst (2008) 82:75–88 83
123

was significantly greater than that in the untreated
plots (2.3 lg P g-1). In another trial, Hunter and
Hunter (1991) reported that 7 years after the appli-
cation of superphosphate or phosphate rock to three
soils of different P retention capacities (P retention of
93%, 48%, and 0%), there were marked increases in
the Bray-2 P concentration in all the three soils.
The Bray-2 P concentrations had a very strong
relationship with resin-Pi, NaOH-Pi and H2SO4-Pi
concentrations (Table 5). This is consistent with the
findings of many others that Bray-2 extractant
solubilises P associated with Fe and Al (NaOH-Pi),
Ca (H2SO4-Pi) (Hahne et al. 1988; Bationo et al.
1991; Saggar et al. 1992) and labile P (resin-Pi)
(Saggar et al. 1992). Because of the strong relation-
ship of Bray-2 P concentrations with resin-Pi, NaOH-
Pi, and H2SO4-Pi concentrations, the effect of
increased P rates on Bray-2 P concentrations was
similar to that observed for these soil P fractions
(discussed previously).
The correlation between the Bray-2 P and NaOH-
Pi concentrations was higher for the TSP treatment
than the BGPR treatment (Table 5). This is because
in the BGPR treatment, the Bray-2 P test not only
extracts P associated with Fe and Al oxides (NaOH-
Pi) but also extracts part of the undissolved BGPR
(H2SO4-Pi), whereas in the TSP treatment, the Bray-2
P extracts only the NaOH-Pi fraction (Perrot et al.
1993). For the same reason, it is expected that the
correlation between the Bray-2 P and H2SO4-Pi
concentrations will be higher for the BGPR treatment
than for the TSP treatment. But correlation results
show that this is only marginally true, probably
because part of the MCP in TSP was converted to
DCP, which was also extracted by H2SO4 as with the
extraction of undissolved PR in the BGPR treatment
(Hedley et al. 1994).
Olsen P: While the Olsen P test is not commonly
used for determining soil P availability to forest trees
in New Zealand, it is commonly used on other crops
(Sinclair et al. 1997) in New Zealand and other
countries (Schoenau and Karamanos 2000; Szilas
et al. 2007). This test was therefore also used in the
current study, but only for the soil samples collected
in 2002.
The main effect of P fertilizer rates on Olsen
P concentrations in the soil at the Kaweka and
Kinleith forests was significant (P \ 0.0001 and
P = 0.0473, respectively). Although increased rates
of TSP application increased Olsen P concentrations,
increased rates of BGPR application had no effect on
Olsen P concentrations at both sites (Fig. 4). Unlike
the acidic Bray test, which extracts resin-Pi, NaOH-Pi
and H2SO4-Pi, the alkaline Olsen test (NaHCO3 pH
8.5) extracts only resin-Pi, NaOH-Pi and some
NaOH-Po (Kumar et al. 1991; Perrott et al. 1992;
Saggar et al. 1992). The Olsen test does not extract
H2SO4-Pi. The reason for BGPR increasing Bray-2
P but not Olsen P is that the addition of BGPR mainly
increases H2SO4-Pi (Fig. 2), which was extracted by
the Bray test but not by the Olsen test. This is
consistent with the absence of any correlation
between Olsen P concentrations and H2SO4-Pi con-
centration when BGPR was applied, as opposed to
significant correlation when TSP was applied
(Table 5). Bray-2 P concentrations, on the other
Table 5 Correlation of Bray-2 P and Olsen P concentrations with soil P fraction coconcentrations (numbers in the table are
correlation coefficients)
Fertilizer Soil Soil test Soil P fractions
Resin-Pi NaOH-Pi NaOH-Po H2SO4-Pi Residual-P
TSP Allophanic Soil Bray-2 0.97*** 0.95*** 0.78* 0.92** 0.44
TSP Allophanic Soil Olsen 0.97*** 0.94*** 0.78* 0.93** 0.47
TSP Pumice Soil Bray-2 0.87** 0.99*** 0.30 0.91** -0.24
TSP Pumice Soil Olsen 0.98*** 0.79* 0.27 0.75* -0.25
BGPR Allophanic Soil Bray-2 0.90** 0.87** -0.05 0.97*** 0.78*
BGPR Allophanic Soil Olsen 0.87** 0.42 0.48 0.49 0.40
BGPR Pumice Soil Bray-2 0.92** 0.76* 0.23 0.92** 0.70
BGPR Pumice Soil Olsen 0.83* 0.34 -0.25 0.45 0.70
Correlation coefficient significant at P \ 0.05; ** P \ 0.01; *** P \ 0.001
84 Nutr Cycl Agroecosyst (2008) 82:75–88
123
hand, had a significant correlation with H2SO4-Pi
concentrations for both TSP and BGPR treatments
(Table 5).
The results of this study are consistent with the
findings of many others. For example, Saggar et al.
(1992) reported that the incubation of a range of PRs
and MCP (constituent of TSP) with four New Zealand
soils increased Bray-1 P concentrations in all soils,
whereas Olsen P concentrations increased only in the
MCP treated soils. Mackay et al. (1984) also found that
when different rates of superphosphate or Chatham
Rise phosphorite (CRP) were added to soils at four sites
in the Central North Island of New Zealand, Olsen P
concentrations in the soils did not increase with the
increasing rates of CRP added in three of the four soils,
but Bray P concentrations increased with increasing
CRP rates in all four soils.
The fact that Olsen P did not increase with
increasing PR rate suggests that little PR dissolution
took place to form Fe and Al phosphate (NaOH-Pi) and
the resin-Pi was derived from the undissolved PR. This
confirms previous findings that Olsen extraction is not
a good test to measure PR availability to perennial
crops (Perrott et al. 1993; Saggar et al. 1992) since this
test does not extract undissolved PR, which provides a
significant, if not the main portion of available
P directly to plants compared with P associated with
Fe and Al oxides and allophone.
Downward movement of fertilizer P
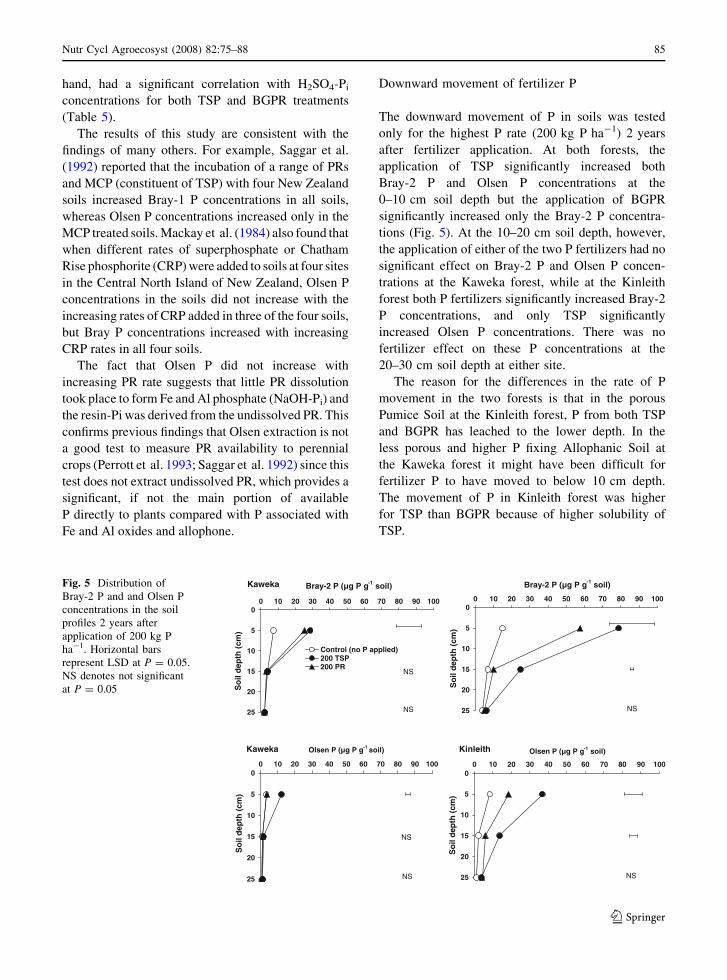
The downward movement of P in soils was tested
only for the highest P rate (200 kg P ha-1) 2 years
after fertilizer application. At both forests, the
application of TSP significantly increased both
Bray-2 P and Olsen P concentrations at the
0–10 cm soil depth but the application of BGPR
significantly increased only the Bray-2 P concentra-
tions (Fig. 5). At the 10–20 cm soil depth, however,
the application of either of the two P fertilizers had no
significant effect on Bray-2 P and Olsen P concen-
trations at the Kaweka forest, while at the Kinleith
forest both P fertilizers significantly increased Bray-2
P concentrations, and only TSP significantly
increased Olsen P concentrations. There was no
fertilizer effect on these P concentrations at the
20–30 cm soil depth at either site.
The reason for the differences in the rate of P
movement in the two forests is that in the porous
Pumice Soil at the Kinleith forest, P from both TSP
and BGPR has leached to the lower depth. In the
less porous and higher P fixing Allophanic Soil at
the Kaweka forest it might have been difficult for
fertilizer P to have moved to below 10 cm depth.
The movement of P in Kinleith forest was higher
for TSP than BGPR because of higher solubility of
TSP.
0
5
10
15
20
25
0 10 20 30 40 50 60 70 80 90 100
Bray-2 P (µg P g -1 soil)
) m
c (
h
t p
e
d
l i o
S
Control (no P applied) 200 TSP 200 PR
0
5
10
15
20
25
0 10 20 30 40 50 60 70 80 90 100
Bray-2 P (µg P g -1 soil)
) m
c (
h
t p
e
d
l i o
S
0
5
10
15
20
25
0 10 20 30 40 50 60 70 80 90 100
Olsen P (µg P g -1 soil)
) m
c (
h
t p
e
d
l i o
S
0
5
10
15
20
25
0 10 20 30 40 50 60 70 80 90 100
Olsen P (µg P g -1 soil)
) m
c (
h
t p
e
d
l i o
S
Kaweka
Kaweka Kinleith
NS
NS
NS
NS
NS
NS
Fig. 5 Distribution of
Bray-2 P and and Olsen P
concentrations in the soil
profiles 2 years after
application of 200 kg P
ha-1. Horizontal bars
represent LSD at P = 0.05.
NS denotes not significant
at P = 0.05
Nutr Cycl Agroecosyst (2008) 82:75–88 85
123
As the soils from treatments receiving lower rates of
P fertilizer were not analysed it is not known whether
P would have moved below 10 cm depth at lower rates
of P application. The results in the current study are
consistent with the findings from other studies. For
example, Hunter and Hunter (1991) studied the
P movement in soils having different P retention
capacities (0, 48, and 93%) treated with phosphate rock
and superphosphate at the rate of 150 kg P ha-1 and
reported that 7 years after fertilizer application, at the
site with 0% P retention, plant-available P, as measured
by Bray-2 P, was higher in the fertilizer-treated soils
than in the untreated soils and this extended down to
60 cm. This suggests that P from the fertilizer had
moved to 60 cm depth. This P movement was greater
for the superphosphate treatment than for the phos-
phate rock treatment. At the site with 48% P retention,
fertilizer P moved down to only 30 cm, while at the site
with very high P retention (93%) there was no evidence
of P movement below 10 cm. Humphreys and Pritchett
(1971) studied the P movement in some sandy soils
under slash pine (Pinus elliottii Engelm. var. elliottii)
treated with superphosphate and Florida phosphate
rock and reported that 7–11 years after fertilizer
application, P from superphosphate was completely
leached from the top 20 cm of soils with no P sorption
or buffering capacity (Ground water Podzols), while in
a soil with a high P sorption or buffering capacity
(a Low Humic Gley) most of the P added was retained
in the top 20 cm. In contrast, most of the P derived from
phosphate rock was still retained in the top 20 cm even
in soil with no P sorption capacity.
Conclusions
Application of a phosphate rock and triple super-
phosphate, each at four rates (maximum 200 kg
P ha-1) to two second-rotation P. radiata forests, one
each in a Pumice Soil (Cryands) and Allophanic Soil
(Udands), significantly increased needle P concentra-
tions 2, 3 and 4 years after fertilizer application.
However, the fertilizers had no effect on tree growth
1, 2 and 3 years after application. This is probably
because the needle P concentrations in the control
treatment (no P fertilizer added) soil were approxi-
mately at or above the level considered satisfactory
for the growth of P. radiata and did not appear to
change with time.
The labile organic fraction (NaOH-Po) in the
surface soils contained the largest percentage of P.
Therefore, the long-term P supplying power of the
soils largely depends on the mineralisation of this
organic P. Changes in the concentration of the
various P fractions 2 years after P fertilizer applica-
tion depended on the P fertilizer type. The rate of
increase of the concentrations of the P fractions was
highest for NaOH-Pi when TSP was applied and
highest for H2SO4-Pi when BGPR was applied. The
NaOH-Po concentration was unaffected by the
P fertilizer application. The NaOH-Pi concentration
increase was higher in the Allophanic Soil than in the
Pumice Soil, probably because of the higher
P fixation in the Allophanic Soil. Both types of
fertilizers increased plant-available soil P concentra-
tion as measured by resin-Pi and Bray-2 P but only
TSP application increased Olsen P concentration. The
Bray-2 P concentration had a significant relationship
with resin-Pi, NaOH-Pi and H2SO4-Pi concentrations
but the Olsen P concentration was significantly
related to all these soil P fractions only in TSP
treated soils; in BGPR treated soils Olsen P concen-
tration was related only to resin-Pi concentration.
Phosphorus derived from TSP and BGPR application
can move down to 10–20 cm soil depth within
2 years of application in the Pumice Soil, but it did
not move below 10 cm depth in the higher P fixing
and less porous Allophanic Soil.
Acknowledgements The senior author thanks the NZAID for
awarding a scholarship for the PhD study and the Centre for
Sustainable Forest Management at Forest Research Institute,
New Zealand for partial funding of the research. Field and
laboratory assistance by Bob Toes, Ian Furkert, Ross Wallace
and Iynka Loganathan of Massey University is also gratefully
acknowledged.
References
Ballard R (1972) Influence of a heavy phosphate dressing and
subsequent radiata pine response on the properties of a
Riverhead clay soil. N Z J For Sci 2:202–216
Ballard R (1974) Use of soil testing for predicting phosphate
fertiliser requirements of radiata pine at time of planting.
N Z J For Sci 4:27–34
Bationo A, Baethgen WE, Christianson CB, Mokwunye AU
(1991) Comparison of five soil testing methods to estab-
lish phosphorus sufficiency levels in soil fertilised with
86 Nutr Cycl Agroecosyst (2008) 82:75–88
123
water-soluble and sparingly soluble-P sources. Fert Res
28:271–279
Blakemore LC, Searle PL, Day BK (1987) Methods for
chemical analysis of soils. New Zealand Soil Bureau,
Scientific report 80, NZ Soil Bureau, Lower Hutt, New
Zealand
Bolan NS, Hedley MJ (1990) Dissolution of phosphate rocks in
soils. 2. Effect of pH on the dissolution and plant avail-
ability of phosphate rocks in soil with pH dependent
charge. Fert Res 24:125–134
Bolan NS, White RE, Hedley MJ (1990) A review of the use of
phosphate rock as fertiliser for direct application in Aus-
tralia and New Zealand. Aust J Exp Agric 30:297–313
Chen CR, Condron LM, Sinaj S, Davis MR, Sherlock RR,
Frossard E (2003) Effects of plant species on phosphorus
availability in a range of grassland soils. Plant Soil
256:115–130
Chien SH, Hammond LL, Leon LA (1987) Long-term reac-
tions of phosphate rocks with an oxisol in Columbia. Soil
Sci 144:257–265
Dias LE, Fernandez JQP, de Barros NF, de Novais RF, de
Moraes EJ, Lee W (2000) Availability of phosphorus in a
Brazalian Oxisol cultivated with eucalyptus after nine
years as influenced by phosphorus-fertiliser source, rate,
and placement. Comm Soil Sci Plant Anal 31:837–847
Hahne HCH, van der Merwe AJ, Loock AH (1988) Review of
phosphorus extraction methods and functional component
of the Bray 2 and ISFEI/AMBIC extractants. In: Pro-
ceedings of Phosphorus Symposium 1988, SIRI, Pretoria
0001, Republic of South Africa, pp 93–100
Hedley MJ, Kirk GJD, Santos MB (1994) Phosphorus effi-
ciency and the forms of soil phosphorus utilised by upland
rice cultivars. Plant Soil 158:53–62
Hewitt AE (1998) New Zealand soil classification. Landcare
Research Science Series No. 1. Manaaki Whenua Press,
Landcare Research New Zealand Ltd, Lincoln, New Zealand
Hountin JA, Karam A, Couillard D, Cescas MP (2000) Use of a
fractionation procedure to assess the potential for P
movement in a soil profile after 14 years of liquid pig
manure fertilization. Agric Ecosyst Environ 78:77–84
Humphreys FR, Pritchett WL (1971) Phosphorus adsorption
and movement in some sandy forest soils. Soil Sci Soc
Am Proc 35:495–500
Hunter IR, Hunter JAC (1991) Apparent phosphorus uptake
and change in nitrogen content of Pinus radiata growing
on soils of different phosphorus retention, treated with
superphosphate and A-grade rock phosphate. N Z J For
Sci 21:50–61
Hunter IR, Rodgers BE, Dunningham A, Prince JM, Thorn AJ
(1991) An atlas of radiata pine nutrition in New Zealand.
New Zealand Ministry of Forestry. FRI Bulletin No.165,
Forest Research, Rotorua, New Zealand
Indiati R, Neri U, Magyar M, Csatho P (2002) Effect of time,
fertilizer phosphorus sources, and fertilization systems on
phosphorus extractability of two soils from Hungary.
Comm Soil Sci Plant Anal 33:545–560
Khasawneh FE, Doll EC (1978) The use of phosphate rock for
direct application to soils. Adv Agron 30:159–206
Kumar V, Gilkes RJ, Bolland MDA (1991) Residual phosphate
fertiliser compounds in soils. II. Their influence on soil
tests for available phosphate. Fert Res 30:31–38
Leco Corporation (1996) CNS-2000 elemental analyser
instruction manual. Leco Corp., St. Joseph, MI
Liu Q, Loganathan P, Hedley MJ, Skinner MF (2004) The
mobilisation and fate of soil and rock phosphate in the
rhizosphere of ectomycorrhizal Pinus radiata seedlings in
an Allophanic soil. Plant Soil 264:219–229
Liu Q, Loganathan P, Hedley MJ (2005) Influence of ecto-
mycorrhizal hyphae on phosphate fractions and
dissolution of a phosphate rock in the rhizosphere soils of
Pinus radiata. J Plant Nutr 28:1525–1540
Mackay AD, Syers JK (1986) Effect of phosphate, calcium and
pH on the dissolution of a phosphate rock in soil. Fert Res
10:175–184
Mackay AD, Syers JK, Gregg PEH, Tillman RW (1984) A com-
parison of 3 soil-testing procedures for estimating the plant
availability of phosphorus in soils receiving either super-
phosphate or phosphate rock. N Z J Agric Res 27:231–245
MacLaren JP (1993) Radiata pine growers’ manual. New
Zealand Forest Research Institute, Rotorua, New Zealand.
FRI Bulletin No.184, Forest Research, Rotorua, New
Zealand
Mead DJ, Gadgil RL (1978) Fertiliser use in established radiata
pine stands in New Zealand. N Z J For Sci 8:105–134
Murphy J, Riley JP (1962) A modified single solution method
for the determination of phosphate in natural waters. Anal
Chim Acta 27:31–36
Olsen SR, Cole CV, Watanabe FS, Dean LA (1954) Estimation
of available phosphorus in soils by extraction with sodium
carbonate. USDA Department circular 939. Government
Printing Office, Washington DC
Payn TW, Skinner MF, Clinton PW (1998) Future nutrient
requirements of New Zealand plantation forests. In: Long-
term Nutrient Needs for New Zealand’s Primary Indus-
tries. Occasional Report No. 11. (eds) LD Currie and P
Loganathan. Fertiliser and Lime Research Centre, Massey
University, New Zealand, pp 97–110
Perrott KW, Roberts AHC, Saggar S, Shannon PW, O’Connors
MB, Nguyen L, Risk WH (1992) Pasture production and
soil phosphorus fractions resulting from six previous
annual applications of triple superphosphate or Sechura
phosphate rock. N Z J Agric Res 35:307–319
Perrott KW, Saggar S, Menon RG (1993) Evaluation of soil
phosphate status where phosphate rock based fertilizers
have been used. Fert Res 35:67–82
Rajan SSS (1985) Partial acidulation of an unground phosphate
rock 1. Preparation and characteristics. Fert Res 8:147–155
Saggar S, Hedley MJ, White RE (1992) Development and
evaluation of an improved soil test for phosphorus: 1. The
influence of phosphorus fertiliser solubility and soil prop-
erties on the extractability of soil P. Fert Res 33:81–91
SAS Institute (2001) SAS Institute Inc., Cary, NC, USA
Schoenau JJ, Karamanos RE (2000) Sodium bicarbonate-
extractable P, K, and N. In: Carter MR (eds) Soil sampling
and methods of analysis. Lewis Publishers, London, pp
75–86
Short TA, Kopittke PM, Mulligan DR, Menzies NW (2007)
Growth of Eucalyptus species in a Brown Kandosol, and
changes in soil phosphorus fractionation following fertil-
isation. Aust J Soil Res 45:190–198
Sinclair AG, Johnstone PD, Smith LC, Roberts AHC,
O’Connor MB, Morton JD (1997) Relationship between
Nutr Cycl Agroecosyst (2008) 82:75–88 87
123
pasture dry matter yield and soil Olsen P from a series of
long-term field trials. N Z J Agric Res 40:559–567
Skinner MF, Lowe AT, Nicholson GM, Prince J (1991)
Availability of phosphorus in New Zealand forest soils: a
new approach with the Bray reagent. In: Soil and Plant
Testing for Nutrient Deficiencies and Toxicities. Occa-
sional Report No. 5. (eds) RE White and LD Currie.
Fertiliser and Lime Research Centre, Massey University,
New Zealand, pp 143–147
Soil Survey Staff (1998) Keys to soil taxonomy, 8th edn.
USDA Natural Resources Conservation Service, Wash-
ington, DC
Steel RGD, Torrie JH, Dickey DA (1997) Analysis of variance
IV. Split-plot design and analysis. Principle and proce-
dures of statistics: a biometrical approach, 3rd edn. The
McGraw-Hill Companies, Inc., New York
Szilas C, Semoka JMR, Borggaard OK (2007) Can local
Minjingu phosphate rock replace superphosphate on acid
soils in Tanzania? Nutr Cycl Agroecosyst 77:257–268
Trolove SN, Hedley MJ, Caradus JR, Mackay AD (1996)
Uptake of phosphorus from different sources by Lotus
pedunculatus and three genotypes of Trifolium repens. 2.
Forms of phosphate utilised and acidification in the rhi-
zosphere. Aust J Soil Res 34:1027–1040
Trolove SN, Hedley MJ, Kirk GJD, Bolan NS, Loganathan P
(2003) Progress in selected areas of rhizosphere research
on P acquisition. Aust J Soil Res 41:471–499
Wang J, Lester DW, Guppy CN, Lockwood PV, Tang C (2007)
Changes in phosphorus fractions at various soil depths
following long-term P fertiliser application on a Black
Vertosol from south-eastern Queensland. Aust J Soil Res
45:524–532
White RE, Hedley MJ, Bolan NS, Gregg PEH (1989) Recent
developments in the use of phosphate fertiliser on New
Zealand pastures. J Aust Inst Agric Sci 2:25–32
Zoysa AKN, Loganathan P, Hedley MJ (2001) Comparison of
agronomic effectiveness of a phosphate rock and triple
superphosphate as phosphate fertilisers for tea (Cameliasinensis L.) on a strongly acidic Ultisol. Nut Cycl Agro-
ecosyst 59:95–105
88 Nutr Cycl Agroecosyst (2008) 82:75–88
123
Copyright © 2022 FDOKUMEN