Single Technology Appraisal Tafamidis for treating ... - NICE
Upload
independentCategory
view
1download
0
Bioresource Technology 96 (2005) 335–344
Effect of organic loading rate on the stability, operationalparameters and performance of a secondary upflow anaerobic
sludge bed reactor treating piggery waste
E. S�anchez a, R. Borja a,*, L. Travieso a, A. Mart�ın b, M.F. Colmenarejo c
a Instituto de la Grasa (C.S.I.C.), Avda. Padre, Garc�ıa Tejero 4, E-41012 Sevilla, Spainb Departamento de Ingenier�ıa Qu�ımica, Facultad de Ciencias, Campus Universitario de Rabanales, Ctra. Madrid-C�adiz,
Km. 396, E-14071 C�ordoba, Spainc Centro de Ciencias Medioambientales (C.S.I.C.), Serrano 115-duplicado, 28006 Madrid, Spain
Received in revised form 25 March 2004; accepted 2 April 2004
Available online 14 May 2004
Abstract
A study of anaerobic digestion of piggery wastewater was carried out in a laboratory-scale sludge bed reactor as a secondary
treatment. The effect of organic volumetric loading rates (BV) in the range of 1.0–8.1 gTCOD/l d on the process performance was
evaluated. The best results were obtained at BV equal to or lower than 4 gTCOD/l d. At higher BV values, the removal efficiency of
the process decreased suddenly. A linear relationship was found between the effluent SCOD and the TVFA/alkalinity ratio (P ). Arelationship was found among the different operational variables (BV, removal efficiency, effluent soluble COD, soluble COD re-
moval rate (R), retention factor (/), specific microbial growth rate (l), methane production rate per volume of reactor and per
volume of waste treated––QM and qM, respectively) and the corresponding regression equations were obtained. An increase of BV
determined a decrease of removal efficiency, / and qM and an increase of effluent soluble COD, l, R and QM. The value of the
maximum specific microbial growth rate (lM) determined through the equation that correlated BV and l was found to be 0.19 d�1.
This value was of the same magnitude as those reported in other works of anaerobic digestion of piggery waste.
� 2004 Elsevier Ltd. All rights reserved.
Keywords: Piggery waste; Upflow anaerobic sludge bed reactor; Organic volumetric loading rate (BV); Operational parameters; Correlation
1. Introduction
Piggery waste is characterized by a high content of
organic matter and pathogenic organisms. The disposal
of piggery waste without adequate treatment can cause a
drastic effect on the environment and human health.
This waste is formed by a mixture of manure (feces and
urine) and food wastage such as swill and sugar canemolasses (S�anchez et al., 2001). According to the most
common characteristics of this waste, anaerobic diges-
tion could be considered one of the most promising
treatment alternatives (Kimchie et al., 1988; Hobson
and Shaw, 1973; Hobson, 1981, 1985, 1992; S�anchez
*Corresponding author. Tel.: +34-95-4689654; fax: +34-95-
4691262.
E-mail address: [email protected] (R. Borja).
0960-8524/$ - see front matter � 2004 Elsevier Ltd. All rights reserved.
doi:10.1016/j.biortech.2004.04.003
et al., 1995; Baader, 1990; Yang and Gan, 1998; Parkin
and Owen, 1986; S�anchez and Travieso, 1994).
Piggery waste treatment by anaerobic digestion has
several advantages, the most important are as follows:
1. The process destroys pathogenic and parasitic organ-
isms.
2. Methane as a valuable by-product can be used as a
source of energy, and liquid and sludge effluents
can be used as a soil conditioner.
3. The low biomass production determines smaller vol-
umes of sludge than in the aerobic processes, thuslowering the cost of sludge management.
4. Capacity to stabilize large volumes of diluted organic
slurries at low costs.
5. This process is more economical than the aerobic
process, especially at strengths higher than 4 g/l of
COD.
336 E. S�anchez et al. / Bioresource Technology 96 (2005) 335–344
Hobson and Shaw (1973, 1974) studied the mecha-
nism and flora of the anaerobic digestion of piggery
waste in a complete mixed digester. They observed that
Enterobacteria streptococci made up about 50% of the
total content of digester organisms. The predominant
groups of organisms were identified as Clostridium bu-
tyricum, Bacteroides and gram negative Coccobacilli, and
the strict anaerobic ones did not predominate over thefacultative ones. Stevens and Schulte (1979) studied the
effect of the temperature at solids retention times of be-
tween 6 and 55 days at organic volumetric loading rates
of between 0.61 and 4.81 kgVS/m3 d, in a complete
mixed anaerobic digester. They concluded that at or-
ganic rates in the range of 0.61–1.80 kgVS/m3 d and
temperatures lower than 25 �C, the operation proceeded
satisfactorily. Low temperature digestion was found torequire twice as long a retention time with satisfactory
production and composition of gas. A previous study
(S�anchez et al., 2001) looked at the influence of tem-
perature and substrate concentration on the anaerobic
batch digestion of piggery wastewater. This study com-
pared the process at mesophilic temperature (35 �C) withtemperatures in the range of 16.8–29.5 �C, and influent
concentrations in the range of 3.3–26.3 gTCOD/l. Theprocess at mesophilic temperature was more stable than
at ambient temperature, obtaining higher values of re-
moval efficiency. Batch or intermittent feeding, plug-
flow, completely-mixed fixed bed and upflow bed
anaerobic digesters have been used for piggery waste
treatment at laboratory, pilot and full-scale plants with
good results (Baader, 1990; Chen, 1983; Hobson, 1992;
I~niguez et al., 1994; Kimchie et al., 1988; Lapp et al.,1995; Lomas, 1999; Montalvo, 1995; Rodr�ıguez and
Lomas, 1999; S�anchez and Travieso, 1994; S�anchez et al.,1995, 2001, 2002; Yang and Gan, 1998). The effect of
different parameters such as temperature, hydraulic
retention time, organic volumetric loading rate, mixing
and other factors have been previously studied. How-
ever, the upflow anaerobic sludge bed (UASB) reactor
has seldom been used for piggery waste treatment be-cause the composition of this waste, rich in nitrogenous
compounds, makes the active biomass densification, the
granulation process, and therefore the microorganisms
retention in the reactor difficult. UASB reactors have
Table 1
Characteristics of the raw supernatant piggery waste after a settling period o
Parameter Average value
Total COD (mg/l) 10,189
Total organic carbon (TOC) (mg/l) 4100
Total solids (TS) (mg/l) 7210
Total volatile solids (TVS) (mg/l) 5122
Total suspended solids (TSS) (mg/l) 1637
Volatile suspended solids (VSS) (mg/l) 1166
Total nitrogen (TN) (mg/l) 341
Phosphates (P) (mg/l) 419
pH 6.0
been applied mainly to carbohydrate type wastewaters
with success and limited work has been done on the
application of this reactor configuration for piggery
waste stabilization. Moreover, pigs in Cuba are fed with
a mixture of swill and molasses (S�anchez et al., 2001).
This could determine different behaviour and perfor-
mance patterns in Anaerobic Sludge Bed Reactors.
Montalvo (1995) studied the separate anaerobic diges-tion of liquid and solid fractions of piggery waste,
respectively, and compared this system to the digestion
of the whole waste in a single sludge bed reactor. He
found that separate digestion was more effective than
that carried out using the single stage reactor. S�anchezet al. (1995) compared the performance of sludge bed
and anaerobic fixed bed reactors treating piggery
wastewaters. The best results were obtained in the latter.The aim of the present work was to evaluate the
behaviour and performance of a UASB reactor treating
piggery wastewater (rich in carbohydrate) after a pre-
liminary screening and primary sedimentation. A study
of the variations of the operational parameters with
organic volumetric loading rates and their interrelations
by means of different equations was also carried out.
2. Methods
2.1. Piggery waste
The piggery waste used in the experiment was ob-
tained from a farm situated 20 km west of Havana City,
Cuba. The waste was screened through a 2 mm sieve.
After screening, the waste settled for 1 h. The average
characteristics and range of the supernatants obtained in
primary sedimentation are presented in Table 1. The
supernatant after settling was diluted to a TCOD
around 8 g/l, value within the range of primary sedi-mentation supernatant effluents, and this final settled
effluent was used to feed the reactor.
2.2. Equipment
The experiments were carried out in a laboratory-
scale upflow anaerobic sludge bed (UASB) reactor,
f 60 min
Standard deviation Number of samples
4911 44
1748 44
2430 70
2178 70
886 70
813 70
135 41
228 41
0.7 60

E. S�anchez et al. / Bioresource Technology 96 (2005) 335–344 337
consisting essentially of a 5 l cylindrical glass flask 15 cm
in diameter and 30 cm tall. The flask was hermetically
sealed at the top by a rubber cap with two holes 5 mm in
diameter required for biogas outlet and effluent collec-
tion, respectively. The biogas was collected in a gas
holder submerged in a saturated solution of water and
sodium chloride to prevent the absorption of CO2. The
lower part of the reactor was fed by means of a pipe 10mm in diameter connected to the centre of the reactor
allowing the influent to be introduced by using a peri-
staltic pump.
2.3. Inoculum
The upflow anaerobic sludge reactor (UASB) was
inoculated with 1 l of anaerobic sludge obtained from a
batch piggery sludge digester after 40 days of digestion
time. The characteristics of the inoculum are summa-
rized in Table 2.
2.4. Experimental procedure
Once the inoculum was added to the UASB reactor,
the operational volume was completed with distilled
water to obtain 5 l of working volume. After this step,
the influent was continuously fed by a peristaltic pump
at a flow-rate of 0.625 l/d (hydraulic retention time––
HRT––of eight days) until steady-state conditions wereobtained. Steady-state was considered after a period
equivalent to three times the HRT (24 days). Continu-
ous-mode experiments were carried out at influent flow-
rates of: 0.625, 0.833, 1.00, 1.25, 1.66, 2.50 and 5.00 l/d,
which corresponded to HRT values of 8, 6, 5, 4, 3, 2 and
1 days, respectively, and organic volumetric loading
rates (BV) of 1.0, 1.4, 1.6, 2.0, 2.7, 4.1 and 8.1 gTCOD/
l d, respectively.The experiment was performed by increasing the
influent flow-rate and consequently, reducing the HRT
at a constant influent concentration.
A total of 20 samples were taken for each operational
condition and average values were determined for each
parameter analysed. Biogas production was determined
daily. The gas accumulated in the measurement flask
Table 2
Characteristics of the inoculum useda
Parameter Value
TCOD (g/l) 47.5
TS (g/l) 50.0
TSS 41.0
VS (g/l) 26.1
VSS (g/l) 21.4
TOC 15.7
pH 7.3
aValues are averages of five determinations. There was virtually no
variation (<3%) among these analyses.
was analysed by an Orsat analyser to determine the
concentration of CO2. The temperature was maintained
at a range of 30–35 �C during the experimental period.
2.5. Analyses
Samples of effluent were taken and analysed three
times a week and influent once a week. Hence, each runhad a duration of seven weeks at steady-state condi-
tions. Analytical determinations of total and soluble
chemical oxygen demand (TCOD and SCOD, respec-
tively), total and soluble organic carbon (TOC and
SOC, respectively), total suspended solids (TSS), volatile
suspended solids (VSS), total volatile fatty acids
(TVFA), alkalinity and pH were carried out according
to Standard Methods for the Examination of Water andWastewater (APHA, 1989).
3. Results and discussion
Table 3 shows the steady-state results obtained under
the different experimental conditions studied. The in-
crease of BV at fixed value of influent TCOD caused a
decrease in the removal efficiency expressed in TCOD,
TOC, SCOD, SOC, TSS and VSS. A sudden decrease in
removal efficiencies was observed at a BV of 4.1
g TCOD/l d (HRT of two days). The reduction of re-moval efficiencies was a consequence of the increase in
total volatile fatty acids (TVFA) and a simultaneous
decrease in the alkalinity causing an increase in the
TVFA/alkalinity ratio (P ) and a reduction in the pH
value. This situation had a strong influence on the bio-
gas quality, increasing the CO2 concentration on all the
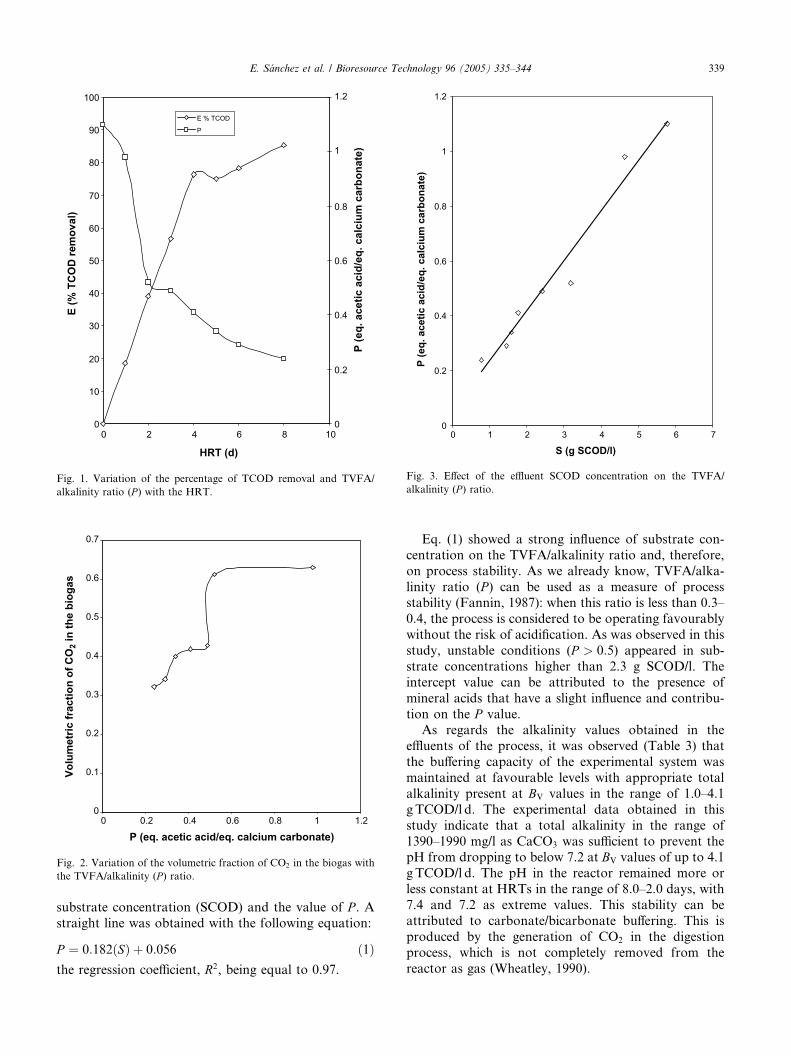
range of BV studied. Fig. 1 shows the strong effect of the
HRT on the TVFA/alkalinity ratio and, therefore, onthe process stability. An increase in the HRT value
caused a decrease in P , favouring the process stability.
At hydraulic retention times in the range of 4–8 days the
process was well balanced and removal efficiencies
higher than 70% were obtained in most cases. However,
when the HRT was lower than or equal to two days, the
removal efficiencies suddenly decreased and values of Pincreased over 0.5, producing unbalanced conditions.Fig. 2 illustrates the variation of the CO2 concentration
as a function of the values of P . The concentration of
CO2 increased when the value of P increased from 0.2 to
0.6 and was practically constant at higher P values.
Similar behaviour was observed in the acidogenesis of
dairy and gelatin-rich wastewaters using upflow anaer-
obic reactors (Yu and Fang, 2002, 2003). A decrease in
the HRT produced an increase in the effluent concen-tration because the anaerobic waste stabilization was
less complete and TVFA concentration and P increased.
Fig. 3 illustrates the relationship between the soluble
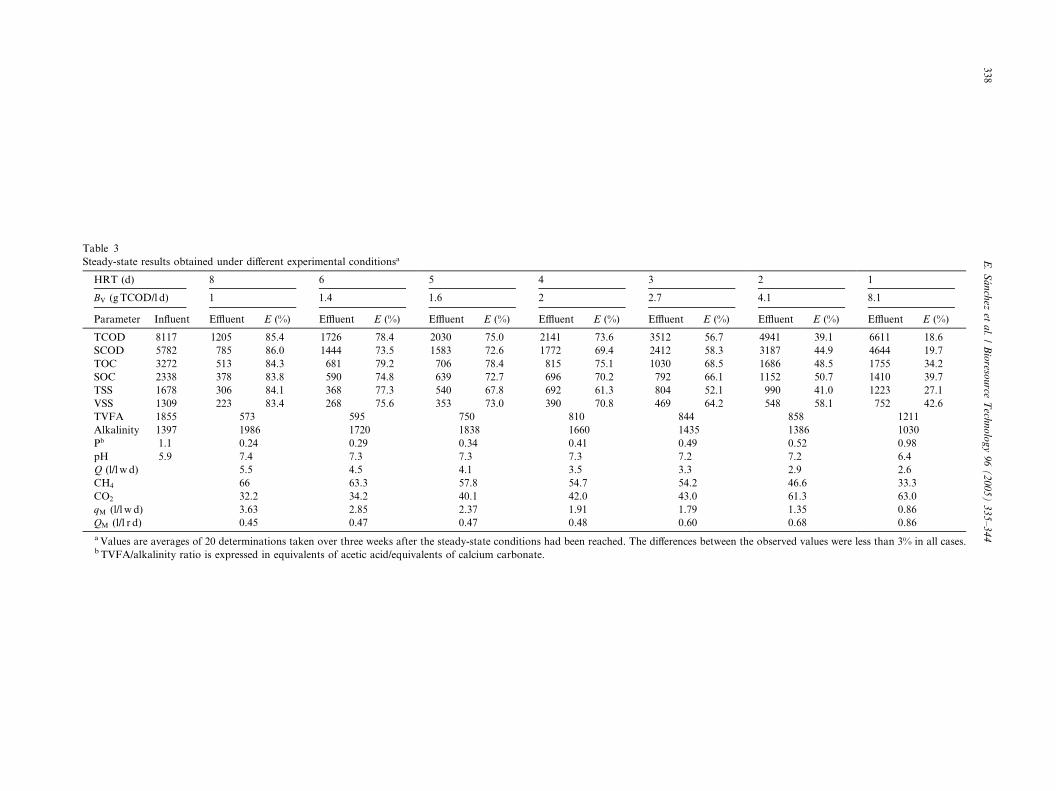
Table 3
Steady-state results obtained under different experimental conditionsa
HRT (d) 8 6 5 4 3 2 1
BV (gTCOD/l d) 1 1.4 1.6 2 2.7 4.1 8.1
Parameter Influent Effluent E (%) Effluent E (%) Effluent E (%) Effluent E (%) Effluent E (%) Effluent E (%) Effluent E (%)
TCOD 8117 1205 85.4 1726 78.4 2030 75.0 2141 73.6 3512 56.7 4941 39.1 6611 18.6
SCOD 5782 785 86.0 1444 73.5 1583 72.6 1772 69.4 2412 58.3 3187 44.9 4644 19.7
TOC 3272 513 84.3 681 79.2 706 78.4 815 75.1 1030 68.5 1686 48.5 1755 34.2
SOC 2338 378 83.8 590 74.8 639 72.7 696 70.2 792 66.1 1152 50.7 1410 39.7
TSS 1678 306 84.1 368 77.3 540 67.8 692 61.3 804 52.1 990 41.0 1223 27.1
VSS 1309 223 83.4 268 75.6 353 73.0 390 70.8 469 64.2 548 58.1 752 42.6
TVFA 1855 573 595 750 810 844 858 1211
Alkalinity 1397 1986 1720 1838 1660 1435 1386 1030
Pb 1.1 0.24 0.29 0.34 0.41 0.49 0.52 0.98
pH 5.9 7.4 7.3 7.3 7.3 7.2 7.2 6.4
Q (l/l w d) 5.5 4.5 4.1 3.5 3.3 2.9 2.6
CH4 66 63.3 57.8 54.7 54.2 46.6 33.3
CO2 32.2 34.2 40.1 42.0 43.0 61.3 63.0
qM (l/l w d) 3.63 2.85 2.37 1.91 1.79 1.35 0.86
QM (l/l r d) 0.45 0.47 0.47 0.48 0.60 0.68 0.86
aValues are averages of 20 determinations taken over three weeks after the steady-state conditions had been reached. The differences between the observed values were less than 3% in all cases.b TVFA/alkalinity ratio is expressed in equivalents of acetic acid/equivalents of calcium carbonate.
338
E.S�anchez
etal./Bioreso
urce
Tech
nology96(2005)335–344
0
10
20
30
40
50
60
70
80
90
100
0 2 4 6 8 10
HRT (d)
E (%
TC
OD
rem
oval
)
0
0.2
0.4
0.6
0.8
1
1.2
P (e
q. a
cetic
aci
d/eq
. cal
cium
car
bona
te)
E % TCOD
P
Fig. 1. Variation of the percentage of TCOD removal and TVFA/
alkalinity ratio (P ) with the HRT.
0
0.1
0.2
0.3
0.4
0.5
0.6
0.7
0 0.2 0.4 0.6 0.8 1 1.2
P (eq. acetic acid/eq. calcium carbonate)
Volu
met
ric fr
actio
n of
CO
2 in
the
biog
as
Fig. 2. Variation of the volumetric fraction of CO2 in the biogas with
the TVFA/alkalinity (P ) ratio.
0
0.2
0.4
0.6
0.8
1
1.2
0 1 2 3 4 5 6 7
S (g SCOD/l)
P (e
q. a
cetic
aci
d/eq
. cal
cium
car
bona
te)
Fig. 3. Effect of the effluent SCOD concentration on the TVFA/
alkalinity (P ) ratio.
E. S�anchez et al. / Bioresource Technology 96 (2005) 335–344 339
substrate concentration (SCOD) and the value of P . Astraight line was obtained with the following equation:
P ¼ 0:182ðSÞ þ 0:056 ð1Þthe regression coefficient, R2, being equal to 0.97.
Eq. (1) showed a strong influence of substrate con-
centration on the TVFA/alkalinity ratio and, therefore,
on process stability. As we already know, TVFA/alka-
linity ratio (P ) can be used as a measure of processstability (Fannin, 1987): when this ratio is less than 0.3–
0.4, the process is considered to be operating favourably
without the risk of acidification. As was observed in this
study, unstable conditions (P > 0:5) appeared in sub-
strate concentrations higher than 2.3 g SCOD/l. The
intercept value can be attributed to the presence of
mineral acids that have a slight influence and contribu-
tion on the P value.As regards the alkalinity values obtained in the
effluents of the process, it was observed (Table 3) that
the buffering capacity of the experimental system was
maintained at favourable levels with appropriate total
alkalinity present at BV values in the range of 1.0–4.1
g TCOD/l d. The experimental data obtained in this
study indicate that a total alkalinity in the range of
1390–1990 mg/l as CaCO3 was sufficient to prevent thepH from dropping to below 7.2 at BV values of up to 4.1
g TCOD/l d. The pH in the reactor remained more or
less constant at HRTs in the range of 8.0–2.0 days, with
7.4 and 7.2 as extreme values. This stability can be
attributed to carbonate/bicarbonate buffering. This is
produced by the generation of CO2 in the digestion
process, which is not completely removed from the
reactor as gas (Wheatley, 1990).
0
0.1
0.2
0.3
0.4
0.5
0.6
0.7
0.8
0.9
1
0 2 4 6 8 10
Bv (g TCOD/l d)
Frac
tiona
l rem
oval
effi
cien
cy
TCODSCODTOCSOC
Fig. 4. Variation of the fractional removal efficiency with the organic
volumetric loading rate (BV).
0
1
2
3
4
5
6
0 2 4 6 8 10Bv (g TCOD/l d)
S (g
SC
OD
/l)
Fig. 5. Effect of the organic volumetric loading rate (BV) on the
experimental effluent SCOD values and those theoretical ones pre-
dicted by Eq. (3).
340 E. S�anchez et al. / Bioresource Technology 96 (2005) 335–344
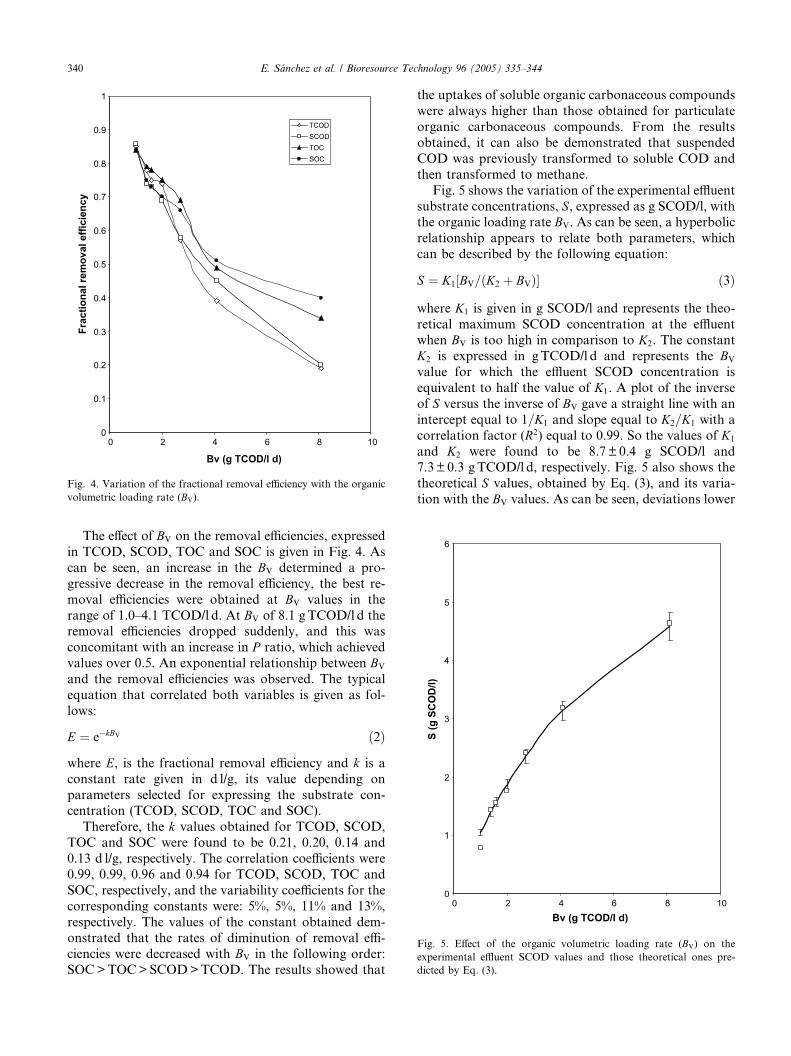
The effect of BV on the removal efficiencies, expressed
in TCOD, SCOD, TOC and SOC is given in Fig. 4. As
can be seen, an increase in the BV determined a pro-
gressive decrease in the removal efficiency, the best re-
moval efficiencies were obtained at BV values in the
range of 1.0–4.1 TCOD/l d. At BV of 8.1 g TCOD/l d theremoval efficiencies dropped suddenly, and this was
concomitant with an increase in P ratio, which achieved
values over 0.5. An exponential relationship between BV
and the removal efficiencies was observed. The typical
equation that correlated both variables is given as fol-
lows:
E ¼ e�kBV ð2Þ
where E, is the fractional removal efficiency and k is a
constant rate given in d l/g, its value depending on
parameters selected for expressing the substrate con-centration (TCOD, SCOD, TOC and SOC).
Therefore, the k values obtained for TCOD, SCOD,
TOC and SOC were found to be 0.21, 0.20, 0.14 and
0.13 d l/g, respectively. The correlation coefficients were
0.99, 0.99, 0.96 and 0.94 for TCOD, SCOD, TOC and
SOC, respectively, and the variability coefficients for the
corresponding constants were: 5%, 5%, 11% and 13%,
respectively. The values of the constant obtained dem-onstrated that the rates of diminution of removal effi-
ciencies were decreased with BV in the following order:
SOC>TOC>SCOD>TCOD. The results showed that
the uptakes of soluble organic carbonaceous compounds
were always higher than those obtained for particulate
organic carbonaceous compounds. From the results
obtained, it can also be demonstrated that suspended
COD was previously transformed to soluble COD and
then transformed to methane.
Fig. 5 shows the variation of the experimental effluent
substrate concentrations, S, expressed as g SCOD/l, withthe organic loading rate BV. As can be seen, a hyperbolic
relationship appears to relate both parameters, which
can be described by the following equation:
S ¼ K1½BV=ðK2 þ BVÞ� ð3Þ
where K1 is given in g SCOD/l and represents the theo-
retical maximum SCOD concentration at the effluentwhen BV is too high in comparison to K2. The constant
K2 is expressed in gTCOD/l d and represents the BV
value for which the effluent SCOD concentration is
equivalent to half the value of K1. A plot of the inverse
of S versus the inverse of BV gave a straight line with an
intercept equal to 1=K1 and slope equal to K2=K1 with a
correlation factor (R2) equal to 0.99. So the values of K1
and K2 were found to be 8.7 ± 0.4 g SCOD/l and7.3 ± 0.3 gTCOD/l d, respectively. Fig. 5 also shows the
theoretical S values, obtained by Eq. (3), and its varia-
tion with the BV values. As can be seen, deviations lower
0
0.5
1
1.5
2
2.5
3
3.5
4
0 2 4 6 8 10
Bv (g TCOD/l d)qm
(l/l
w.d
)0
0.2
0.4
0.6
0.8
1
QM
(l/l
r.d)
qm (l/l w.d) QM (l/l r.d)
Fig. 7. Effect of the organic volumetric loading rate (BV) on methane
gas production per litre of influent (qM) and per litre of reactor (QM).
E. S�anchez et al. / Bioresource Technology 96 (2005) 335–344 341
than 5% between the experimental and theoretical values
of S were always observed. For low BV values the second
term of the denominator of this expression can be ne-
glected and Eq. (3) can be transformed into a linear
equation, as follows: S ¼ 1:20BV.
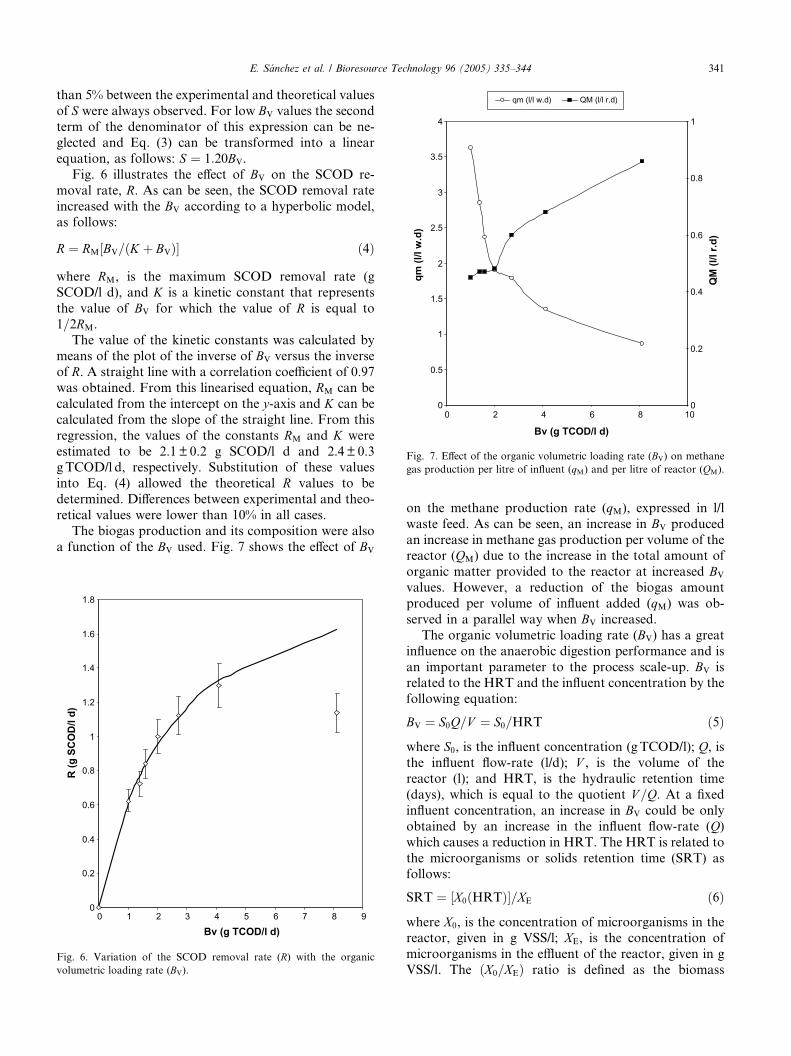
Fig. 6 illustrates the effect of BV on the SCOD re-
moval rate, R. As can be seen, the SCOD removal rate
increased with the BV according to a hyperbolic model,as follows:
R ¼ RM½BV=ðK þ BVÞ� ð4Þ
where RM, is the maximum SCOD removal rate (g
SCOD/l d), and K is a kinetic constant that represents
the value of BV for which the value of R is equal to
1=2RM.The value of the kinetic constants was calculated by
means of the plot of the inverse of BV versus the inverse
of R. A straight line with a correlation coefficient of 0.97
was obtained. From this linearised equation, RM can be
calculated from the intercept on the y-axis and K can be
calculated from the slope of the straight line. From this
regression, the values of the constants RM and K were
estimated to be 2.1 ± 0.2 g SCOD/l d and 2.4 ± 0.3gTCOD/l d, respectively. Substitution of these values
into Eq. (4) allowed the theoretical R values to be
determined. Differences between experimental and theo-
retical values were lower than 10% in all cases.
The biogas production and its composition were also
a function of the BV used. Fig. 7 shows the effect of BV
0
0.2
0.4
0.6
0.8
1
1.2
1.4
1.6
1.8
0 1 2 3 4 5 6 7 8 9
Bv (g TCOD/l d)
R (g
SC
OD
/l d)
Fig. 6. Variation of the SCOD removal rate (R) with the organic
volumetric loading rate (BV).
on the methane production rate (qM), expressed in l/l
waste feed. As can be seen, an increase in BV produced
an increase in methane gas production per volume of thereactor (QM) due to the increase in the total amount of
organic matter provided to the reactor at increased BV
values. However, a reduction of the biogas amount
produced per volume of influent added (qM) was ob-
served in a parallel way when BV increased.
The organic volumetric loading rate (BV) has a great
influence on the anaerobic digestion performance and is
an important parameter to the process scale-up. BV isrelated to the HRT and the influent concentration by the
following equation:
BV ¼ S0Q=V ¼ S0=HRT ð5Þ
where S0, is the influent concentration (gTCOD/l); Q, isthe influent flow-rate (l/d); V , is the volume of the
reactor (l); and HRT, is the hydraulic retention time
(days), which is equal to the quotient V =Q. At a fixed
influent concentration, an increase in BV could be only
obtained by an increase in the influent flow-rate (Q)which causes a reduction in HRT. The HRT is related to
the microorganisms or solids retention time (SRT) asfollows:
SRT ¼ ½X0ðHRTÞ�=XE ð6Þ
where X0, is the concentration of microorganisms in thereactor, given in g VSS/l; XE, is the concentration of
microorganisms in the effluent of the reactor, given in g
VSS/l. The ðX0=XEÞ ratio is defined as the biomass
R ¼ 2:99½l=ð0:016þ lÞ� ð14Þ
0
5
10
15
20
25
0 1 2 3 4 5 6 7 8 9
Bv (g TCOD/l d) R
eten
tion
fact
or (φ
)
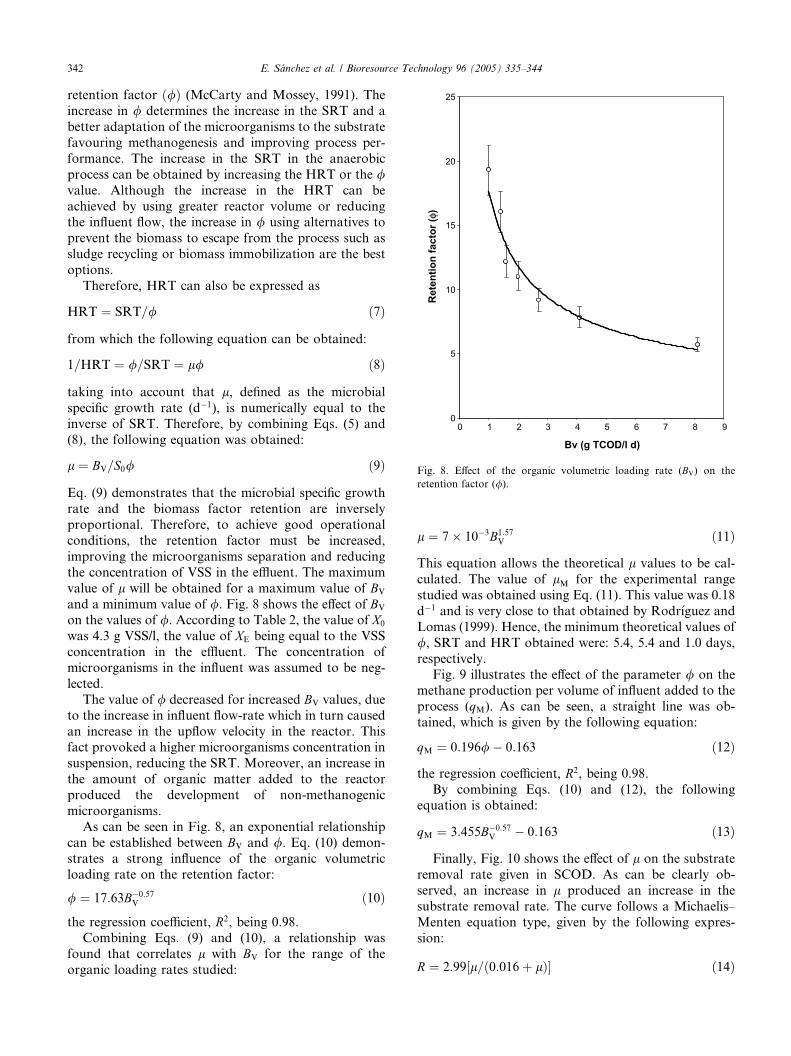
Fig. 8. Effect of the organic volumetric loading rate (BV) on the
retention factor (/).
342 E. S�anchez et al. / Bioresource Technology 96 (2005) 335–344
retention factor ð/Þ (McCarty and Mossey, 1991). The
increase in / determines the increase in the SRT and a
better adaptation of the microorganisms to the substrate
favouring methanogenesis and improving process per-
formance. The increase in the SRT in the anaerobic
process can be obtained by increasing the HRT or the /value. Although the increase in the HRT can be
achieved by using greater reactor volume or reducingthe influent flow, the increase in / using alternatives to
prevent the biomass to escape from the process such as
sludge recycling or biomass immobilization are the best
options.
Therefore, HRT can also be expressed as
HRT ¼ SRT=/ ð7Þ
from which the following equation can be obtained:
1=HRT ¼ /=SRT ¼ l/ ð8Þ
taking into account that l, defined as the microbial
specific growth rate (d�1), is numerically equal to the
inverse of SRT. Therefore, by combining Eqs. (5) and
(8), the following equation was obtained:
l ¼ BV=S0/ ð9Þ
Eq. (9) demonstrates that the microbial specific growth
rate and the biomass factor retention are inversely
proportional. Therefore, to achieve good operational
conditions, the retention factor must be increased,
improving the microorganisms separation and reducing
the concentration of VSS in the effluent. The maximum
value of l will be obtained for a maximum value of BV
and a minimum value of /. Fig. 8 shows the effect of BV
on the values of /. According to Table 2, the value of X0
was 4.3 g VSS/l, the value of XE being equal to the VSS
concentration in the effluent. The concentration of
microorganisms in the influent was assumed to be neg-
lected.
The value of / decreased for increased BV values, due
to the increase in influent flow-rate which in turn caused
an increase in the upflow velocity in the reactor. Thisfact provoked a higher microorganisms concentration in
suspension, reducing the SRT. Moreover, an increase in
the amount of organic matter added to the reactor
produced the development of non-methanogenic
microorganisms.
As can be seen in Fig. 8, an exponential relationship
can be established between BV and /. Eq. (10) demon-
strates a strong influence of the organic volumetricloading rate on the retention factor:
/ ¼ 17:63B�0:57V ð10Þ
the regression coefficient, R2, being 0.98.Combining Eqs. (9) and (10), a relationship was
found that correlates l with BV for the range of the
organic loading rates studied:
l ¼ 7� 10�3B1:57V ð11Þ
This equation allows the theoretical l values to be cal-
culated. The value of lM for the experimental range
studied was obtained using Eq. (11). This value was 0.18
d�1 and is very close to that obtained by Rodr�ıguez andLomas (1999). Hence, the minimum theoretical values of
/, SRT and HRT obtained were: 5.4, 5.4 and 1.0 days,
respectively.
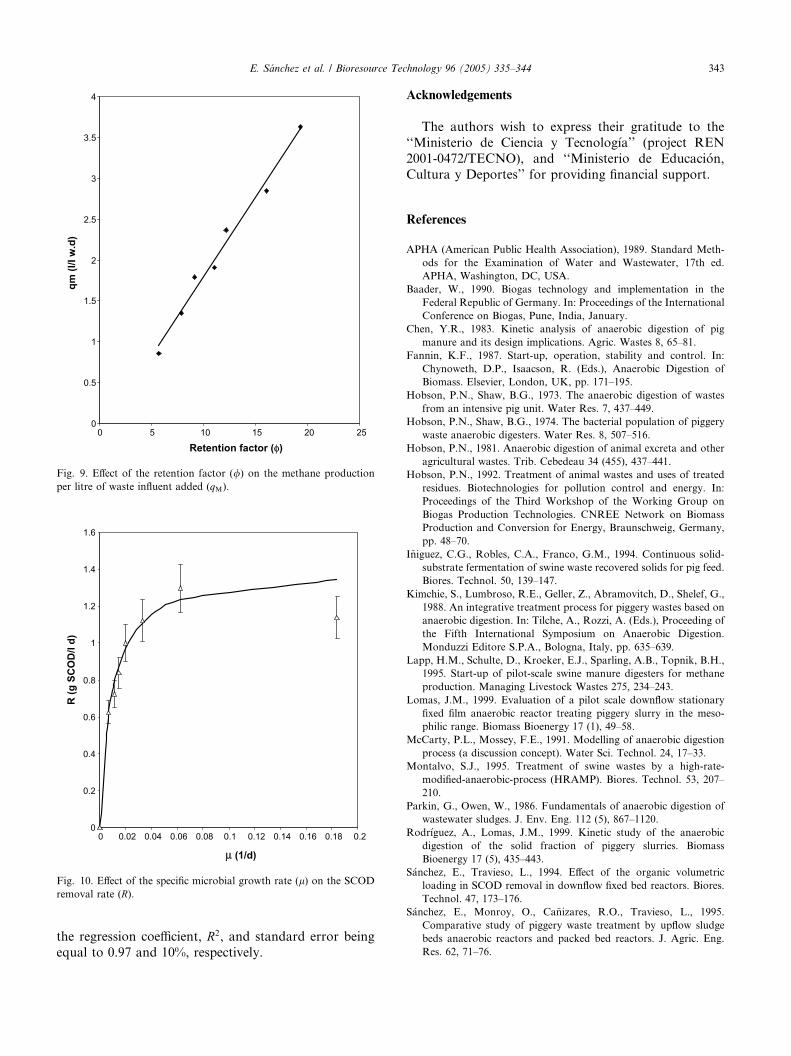
Fig. 9 illustrates the effect of the parameter / on themethane production per volume of influent added to the
process (qM). As can be seen, a straight line was ob-
tained, which is given by the following equation:
qM ¼ 0:196/� 0:163 ð12Þ
the regression coefficient, R2, being 0.98.
By combining Eqs. (10) and (12), the following
equation is obtained:
qM ¼ 3:455B�0:57V � 0:163 ð13Þ
Finally, Fig. 10 shows the effect of l on the substrate
removal rate given in SCOD. As can be clearly ob-
served, an increase in l produced an increase in the
substrate removal rate. The curve follows a Michaelis–
Menten equation type, given by the following expres-
sion:
0
0.5
1
1.5
2
2.5
3
3.5
4
0 5 10 15 20 25
Retention factor (φ)
qm (l
/l w
.d)
Fig. 9. Effect of the retention factor (/) on the methane production
per litre of waste influent added (qM).
0
0.2
0.4
0.6
0.8
1
1.2
1.4
1.6
0 0.02 0.04 0.06 0.08 0.1 0.12 0.14 0.16 0.18 0.2
µ (1/d)
R (g
SC
OD
/l d)
Fig. 10. Effect of the specific microbial growth rate (l) on the SCOD
removal rate (R).
E. S�anchez et al. / Bioresource Technology 96 (2005) 335–344 343
the regression coefficient, R2, and standard error being
equal to 0.97 and 10%, respectively.
Acknowledgements
The authors wish to express their gratitude to the
‘‘Ministerio de Ciencia y Tecnolog�ıa’’ (project REN
2001-0472/TECNO), and ‘‘Ministerio de Educaci�on,Cultura y Deportes’’ for providing financial support.
References
APHA (American Public Health Association), 1989. Standard Meth-
ods for the Examination of Water and Wastewater, 17th ed.
APHA, Washington, DC, USA.
Baader, W., 1990. Biogas technology and implementation in the
Federal Republic of Germany. In: Proceedings of the International
Conference on Biogas, Pune, India, January.
Chen, Y.R., 1983. Kinetic analysis of anaerobic digestion of pig
manure and its design implications. Agric. Wastes 8, 65–81.
Fannin, K.F., 1987. Start-up, operation, stability and control. In:
Chynoweth, D.P., Isaacson, R. (Eds.), Anaerobic Digestion of
Biomass. Elsevier, London, UK, pp. 171–195.
Hobson, P.N., Shaw, B.G., 1973. The anaerobic digestion of wastes
from an intensive pig unit. Water Res. 7, 437–449.
Hobson, P.N., Shaw, B.G., 1974. The bacterial population of piggery
waste anaerobic digesters. Water Res. 8, 507–516.
Hobson, P.N., 1981. Anaerobic digestion of animal excreta and other
agricultural wastes. Trib. Cebedeau 34 (455), 437–441.
Hobson, P.N., 1992. Treatment of animal wastes and uses of treated
residues. Biotechnologies for pollution control and energy. In:
Proceedings of the Third Workshop of the Working Group on
Biogas Production Technologies. CNREE Network on Biomass
Production and Conversion for Energy, Braunschweig, Germany,
pp. 48–70.
I~niguez, C.G., Robles, C.A., Franco, G.M., 1994. Continuous solid-
substrate fermentation of swine waste recovered solids for pig feed.
Biores. Technol. 50, 139–147.
Kimchie, S., Lumbroso, R.E., Geller, Z., Abramovitch, D., Shelef, G.,
1988. An integrative treatment process for piggery wastes based on
anaerobic digestion. In: Tilche, A., Rozzi, A. (Eds.), Proceeding of
the Fifth International Symposium on Anaerobic Digestion.
Monduzzi Editore S.P.A., Bologna, Italy, pp. 635–639.
Lapp, H.M., Schulte, D., Kroeker, E.J., Sparling, A.B., Topnik, B.H.,
1995. Start-up of pilot-scale swine manure digesters for methane
production. Managing Livestock Wastes 275, 234–243.
Lomas, J.M., 1999. Evaluation of a pilot scale downflow stationary
fixed film anaerobic reactor treating piggery slurry in the meso-
philic range. Biomass Bioenergy 17 (1), 49–58.
McCarty, P.L., Mossey, F.E., 1991. Modelling of anaerobic digestion
process (a discussion concept). Water Sci. Technol. 24, 17–33.
Montalvo, S.J., 1995. Treatment of swine wastes by a high-rate-
modified-anaerobic-process (HRAMP). Biores. Technol. 53, 207–
210.
Parkin, G., Owen, W., 1986. Fundamentals of anaerobic digestion of
wastewater sludges. J. Env. Eng. 112 (5), 867–1120.
Rodr�ıguez, A., Lomas, J.M., 1999. Kinetic study of the anaerobic
digestion of the solid fraction of piggery slurries. Biomass
Bioenergy 17 (5), 435–443.
S�anchez, E., Travieso, L., 1994. Effect of the organic volumetric
loading in SCOD removal in downflow fixed bed reactors. Biores.
Technol. 47, 173–176.
S�anchez, E., Monroy, O., Ca~nizares, R.O., Travieso, L., 1995.
Comparative study of piggery waste treatment by upflow sludge
beds anaerobic reactors and packed bed reactors. J. Agric. Eng.
Res. 62, 71–76.

344 E. S�anchez et al. / Bioresource Technology 96 (2005) 335–344
S�anchez, E., Borja, R., Weiland, P., Travieso, L., 2001. Effect of
substrate concentration and temperature on the anaerobic diges-
tion of piggery waste in tropical climates. Process Biochem. 37,
483–489.
S�anchez, E., Travieso, L., Weiland, P., Borja, R., Nikolaeva, S., 2002.
Effect of influent strength changes on the performance of a down-
flow anaerobic fixed bed reactor treating piggery waste. Resour.,
Conserv. Recycl. 36, 73–82.
Stevens, M.A., Schulte, D.D., 1979. Low temperature digestion of
swine manure. Journal of Environmental Engineering Division
ASCE 105 (EE1), 33–42.
Wheatley, A., 1990. Anaerobic digestion: a waste treatment technol-
ogy. SCI, Elsevier, London, UK.
Yu, H.Q., Fang, H.H.P., 2002. Acidogenesis of dairy wastewaters at
various pH levels. Water Sci. Technol. 43 (10), 201–206.
Yu, H.Q., Fang, H.H.P., 2003. Acidogenesis of gelatin-rich wastewa-
ters in an up-flow anaerobic reactor: influence of pH and
temperature. Water Res. 37, 55–66, Water Sci. Technol. 43 (10)
201–206.
Yang, P.Y., Gan, C., 1998. An on-farm swine waste treatment system
in Hawaii. Biores. Technol. 65, 21–27.
Copyright © 2022 FDOKUMEN


![[Treating frostbite injuries]](https://static.fdokumen.com/doc/165x107/633ff39332b09e4bae09a1b5/treating-frostbite-injuries.jpg)