Effect of menopause on gene expression pattern in bone tissue of nonosteoporotic women
11
Copyright @ 2009 The North American Menopause Society. Unauthorized reproduction of this article is prohibited. Menopause: The Journal of The North American Menopause Society Vol. 16, No. 2, pp. 367/377 DOI: 10.1097/gme.0b013e318188b260 * 2009 by The North American Menopause Society Effect of menopause on gene expression pattern in bone tissue of nonosteoporotic women Ja ´nos P. Ko ´sa, MSc, 1, * Bernadett Balla, MSc, 1, * Ga ´bor Speer, PhD, MD, 1 Ja ´nos Kiss, MD, 2 Adrienn Borsy, MSc, 3,4 Ja ´nos Podani, DSc, 5 Istva ´n Taka ´cs, PhD, MD, 1 A ´ ron Laza ´ry, MD, 1 Zsolt Nagy, MD, 1 Krisztia ´n Ba ´csi, MD, 1 La ´szlo ´ Orosz, DSc, 3,4 and Pe ´ter Lakatos, DSc, MD 1 Abstract Objective: Menopausal changes influence the growth, differentiation, and metabolism of bone tissue. Hormonal deficiency at the time of menopause results in marked increases in bone resorption and formation, leading to rapid bone loss. The aim of our investigation was to determine genes characterized by significantly changed mRNA expression rates in postmenopausal versus premenopausal nonosteoporotic bone tissue and to describe the interrelationships among these genes using multivariate data analysis. Methods: Ten bone tissue samples from postmenopausal nonosteoporotic women and seven bone tissue samples from premenopausal nonosteoporotic women were examined. The expression differences of 118 selected genes were analyzed in a TaqMan probeYbased quantitative reverse transcriptase-polymerase chain reaction system. Results: The Mann-Whitney U test indicated significant differences in the expression of 29 genes of postmenopausal and premenopausal nonosteoporotic women. Twenty-eight genes, including extracellular matrix molecules and digesting enzymes, genes belonging to the transforming growth factor-A/bone morphogenic protein pathway, transcription factors, growth factors, and other candidate genes, were significantly up-regulated in postmenopausal women compared with premenopausal women. Only one gene (ENO1) showed down-regulation after menopause. Based on the multiple mRNA expression profiles of 118 genes, postmenopausal and premenopausal states could be differentiated by enhanced postmenopausal gene expression levels using principal components analysis. Canonical variates analysis demonstrated that postmenopausal and premenopausal nonosteoporotic bone tissues can be distinguished by expression analysis of genes controlled via estrogen receptor-> and genes coding for extracellular matrix molecules. Conclusions: The menopausal state of bone tissue has been unambiguously defined by its complex gene transcription pattern. Significant differences observed in the gene expression profiles of estrogen-deficient human bone tissue provide further insight into the process of postmenopausal changes of bone metabolism. Key Words: Human subjects Y Bone biopsies Y Transcriptional profiling Y Menopause Y Principal components analysis Y Canonical variates analysis. M enopausal changes in the production of estro- gen play an important multifunctional role in the maintenance of bone mass and regulation of the remodeling balance between osteoblastic and osteoclastic activity. It has been well established that the hormones playing a role in menopausal changes can strongly support physiological skeletal homeostasis via numerous pathways. Nevertheless, several different cytokines and local and sys- temic factors have been suggested to be involved in these estrogen-dependent biological processes. 1<3 Transcriptional changes in the activity of the major bone cellYspecific genes are attributed to estrogenic hormones. These genes include receptor activator of nuclear factor-JB (RANK), receptor activator of nuclear factor-JB ligand (RANKL), osteoprotegerin (OPG), vitamin D receptor (VDR), alkaline phosphatase (ALP), growth factors (IGF1, VEGF, PDGFA, TGFA1, FGFR), cytokines (IL-1A, IL-6, GM-CSF, TNF), and extracellular matrix (ECM) proteins (COL1, BGLAP, BGN, BSP, DCN, and SPARC). 3,4 Estrogen has a direct suppressive influence on the synthesis of bone- resorbing pro-inflammatory cytokines (IL-1A, IL-6, and Received June 16, 2008; revised and accepted July 31, 2008. From 1 1st Department of Internal Medicine, and 2 Department of Orthopaedics, Semmelweis University, Budapest, Hungary; 3 Institute of Genetics, Agricultural Biotechnology Center, Go ¨do ¨llj, Hungary; and Departments of 4 Genetics, and 5 Plant Taxonomy and Ecology, Eo ¨tvo ¨s Lora ´nd University, Budapest, Hungary. *These authors equally contributed to this work. Funding/support: This work was supported by grants NKFP-1A/007/ 2004 and NKFP-1A/002/2004 from the National Research and Technological Office (NKTH) of Hungary, as well as by research grant ETT 022/2006 from the Ministry of Health, Hungary. J. Podani was supported by Hungarian Scientific Research Fund (OTKA) grant NI 68218. Financial disclosure: None reported. Address correspondence to: Ja ´nos P. Ko ´sa, PhD, 1st Department of Internal Medicine, Semmelweis University, Koranyi 2/a, Budapest, H-1083, Hungary. E-mail: [email protected] Menopause, Vol. 16, No. 2, 2009 367
-
Upload
independent -
Category
Documents
-
view
2 -
download
0
Transcript of Effect of menopause on gene expression pattern in bone tissue of nonosteoporotic women

Copyright @ 2009 The North American Menopause Society. Unauthorized reproduction of this article is prohibited.
Menopause: The Journal of The North American Menopause SocietyVol. 16, No. 2, pp. 367/377DOI: 10.1097/gme.0b013e318188b260* 2009 by The North American Menopause Society
Effect of menopause on gene expression pattern in bone tissueof nonosteoporotic women
Janos P. Kosa, MSc,1,* Bernadett Balla, MSc,1,* Gabor Speer, PhD, MD,1 Janos Kiss, MD,2
Adrienn Borsy, MSc,3,4 Janos Podani, DSc,5 Istvan Takacs, PhD, MD,1 Aron Lazary, MD,1
Zsolt Nagy, MD,1 Krisztian Bacsi, MD,1 Laszlo Orosz, DSc,3,4 and Peter Lakatos, DSc, MD1
AbstractObjective: Menopausal changes influence the growth, differentiation, and metabolism of bone tissue. Hormonal
deficiency at the time of menopause results in marked increases in bone resorption and formation, leading to rapidbone loss. The aim of our investigation was to determine genes characterized by significantly changed mRNAexpression rates in postmenopausal versus premenopausal nonosteoporotic bone tissue and to describe theinterrelationships among these genes using multivariate data analysis.
Methods: Ten bone tissue samples from postmenopausal nonosteoporotic women and seven bone tissue samplesfrom premenopausal nonosteoporotic women were examined. The expression differences of 118 selected geneswere analyzed in a TaqMan probeYbased quantitative reverse transcriptase-polymerase chain reaction system.
Results: The Mann-Whitney U test indicated significant differences in the expression of 29 genes ofpostmenopausal and premenopausal nonosteoporotic women. Twenty-eight genes, including extracellular matrixmolecules and digesting enzymes, genes belonging to the transforming growth factor-A/bone morphogenic proteinpathway, transcription factors, growth factors, and other candidate genes, were significantly up-regulated inpostmenopausal women compared with premenopausal women. Only one gene (ENO1) showed down-regulationafter menopause. Based on the multiple mRNA expression profiles of 118 genes, postmenopausal andpremenopausal states could be differentiated by enhanced postmenopausal gene expression levels using principalcomponents analysis. Canonical variates analysis demonstrated that postmenopausal and premenopausalnonosteoporotic bone tissues can be distinguished by expression analysis of genes controlled via estrogenreceptor-> and genes coding for extracellular matrix molecules.
Conclusions: The menopausal state of bone tissue has been unambiguously defined by its complex genetranscription pattern. Significant differences observed in the gene expression profiles of estrogen-deficient humanbone tissue provide further insight into the process of postmenopausal changes of bone metabolism.
Key Words: Human subjects Y Bone biopsies Y Transcriptional profiling Y Menopause Y Principal componentsanalysis Y Canonical variates analysis.
Menopausal changes in the production of estro-gen play an important multifunctional role in themaintenance of bone mass and regulation of the
remodeling balance between osteoblastic and osteoclasticactivity. It has been well established that the hormonesplaying a role in menopausal changes can strongly supportphysiological skeletal homeostasis via numerous pathways.Nevertheless, several different cytokines and local and sys-temic factors have been suggested to be involved in theseestrogen-dependent biological processes.1<3
Transcriptional changes in the activity of the major bonecellYspecific genes are attributed to estrogenic hormones.These genes include receptor activator of nuclear factor-JB(RANK), receptor activator of nuclear factor-JB ligand(RANKL), osteoprotegerin (OPG), vitamin D receptor(VDR), alkaline phosphatase (ALP), growth factors (IGF1,VEGF, PDGFA, TGFA1, FGFR), cytokines (IL-1A, IL-6,GM-CSF, TNF), and extracellular matrix (ECM) proteins(COL1, BGLAP, BGN, BSP, DCN, and SPARC).3,4 Estrogenhas a direct suppressive influence on the synthesis of bone-resorbing pro-inflammatory cytokines (IL-1A, IL-6, and
Received June 16, 2008; revised and accepted July 31, 2008.
From 11st Department of Internal Medicine, and 2Department ofOrthopaedics, Semmelweis University, Budapest, Hungary; 3Instituteof Genetics, Agricultural Biotechnology Center, Godollj, Hungary; andDepartments of 4Genetics, and 5Plant Taxonomy and Ecology, EotvosLorand University, Budapest, Hungary.
*These authors equally contributed to this work.
Funding/support: This work was supported by grants NKFP-1A/007/2004 and NKFP-1A/002/2004 from the National Research andTechnological Office (NKTH) of Hungary, as well as by research grantETT 022/2006 from the Ministry of Health, Hungary. J. Podani wassupported by Hungarian Scientific Research Fund (OTKA) grant NI68218.
Financial disclosure: None reported.
Address correspondence to: Janos P. Kosa, PhD, 1st Department ofInternal Medicine, Semmelweis University, Koranyi 2/a, Budapest,H-1083, Hungary. E-mail: [email protected]
Menopause, Vol. 16, No. 2, 2009 367

Copyright @ 2009 The North American Menopause Society. Unauthorized reproduction of this article is prohibited.
TNF->) and lysosomal enzymes (lyzozyme and cathepsin Band D), which promote osteoclastgenesis and osteoclastactivity.3 In addition, these inflammatory cytokines have aninhibitory action on bone formation and osteoblast function.5
Estrogen exerts an antiapoptotic effect on osteoblasts and os-teocytes, whereas it stimulates apoptosis in osteoclasts via thesrc/shc/erk signaling pathway.6 A large number of studieshave demonstrated that osteoblast proliferation and differ-entiation are attenuated in the presence of estrogen, thus en-suring healthy bone formation.7
Estrogen deficiency after menopause causes 0.5% to 2%bone loss yearly as a net result of increased resorption andreduced formation. These changes lead to osteoporosis andincreased osteoporotic fracture risk in 25% of postmen-opausal women.8<10 Besides the genes above mentioned,many other regulatory genes are involved in the maintenanceof bone homeostasis. Recently, the importance of the activin/inhibin/follistatin system has been emphasized.11,12
The development of menopausal bone metabolism ismediated through the aforementioned genes. The aim of thepresent study was to explore the complex expression patternsof menopause-affected genes in human bone tissue ofpostmenopausal as well as premenopausal nonosteoporoticwomen.
METHODS
Human bone tissue samplesGene expression profiles in bone samples were determined
in 10 postmenopausal, unrelated, consecutive, Hungarian,white nonosteoporotic women (POST group) who did notreceive hormone therapy. Menopause was defined accordingto the recent World Health Organization criteria (at least 1 y ofamenorrhea, retrospectively) and serum estradiol level lessthan 30 pg/mL. The control group included seven bone tissuesamples from premenopausal nonosteoporotic women (PREgroup). Bone mineral density (BMD) was measured at the totalfemur and at the lumbar spine (L1-L4) by dual x-rayabsorptiometry (DPX-L, Lunar Corp, Madison, WI) severaldays before they underwent surgery. All women participatingin the study had undergone surgery because of primaryosteoarthritis. Bone tissue samples were collected from thespongious substance of the femoral head during total hiparthroplasty before resection. The disease did not affect thespongious bone substance of the femoral head, and there wasno difference in the degree of arthrosis among women byradiograph examination. Osteoarthritic women were classifiedas grade III, according to the American Academy ofOrthopaedic Surgeons using the Kellgren-Lawrence gradingsystem for osteoarthritis.13 Surgically removed bone sampleswere extensively washed in phosphate-buffered saline forelimination of blood, fat, and marrow contamination andplaced immediately into liquid nitrogen. The study was ap-proved by the Regional Committee of Science and ResearchEthics, Semmelweis University (6392-1/2004-1018EKU),and all women gave written informed consent.
mRNA isolation, quantitative real-time reversetranscriptase-polymerase chain reaction
Human bone samples (approximately 500 mg) were cryo-grinded under liquid nitrogen using a freezer-mill 6750(SPEX Certiprep Inc, Metuchen, NJ). Direct mRNA isolationusing a Dynabeads Oligo(dt)25 kit (Dynal Biotech ASA,Oslo, Norway), DNase treatment, quality controlling, andfirst-strand cDNA synthesis was performed according to ourpreviously published method.14
For quantitative real-time reverse transcriptase-polymerasechain reaction (RT-PCR) comparison of the gene expressionpatterns of candidate genes in the bone tissue of postmen-opausal and premenopausal nonosteoporotic women, weselected 118 genes based on recent literature, the OnlineMendelian Inheritance in Man database, and our dataconcerning genetic pathway analysis.14 Twenty-one genesfrom the transforming growth factor-A (TGFA)/bone mor-phogenic protein (BMP) pathway and 6 genes from thewingless (WNT) cascade were selected for these studies, aswell as 23 genes of ECM components, 8 genes involved inECM degradation, 10 genes coding growth factors, 4 genescoding cell adhesion molecules, 13 genes coding transcrip-tional factors, and 6 genes affecting lipid metabolism. Anadditional 27 genes completed our list, 12 of which areknown to be controlled by estrogen, 7 show polymorphismslinked to variations in BMD, and the remaining 8 genes wereassorted by our unpublished analyses.
Predesigned and validated gene-specific TaqMan GeneExpression Assays from Applied Biosystems (Foster City,CA) were used in triplicate for quantitative real-time PCRaccording to the manufacturer’s protocol.14 The sensitivity ofthis method is one copy in 10 to 100 cells. The reproducibil-ity is 99.4%, and the method has a very large dynamic range(106). Relative quantification (RQ) studies were made fromcollected data (threshold cycle numbers, referred to as Ct)with 7500 System SDS software 1.3 (Applied Biosystems).The level of GAPDH was used as endogenous control fordata normalization because the expression of several cyto-skeletal genes including ACTB might be affected by estrogenin osteoblasts.15
Data analysisFor univariate statistical analysis, we selected a nonpara-
metric (ie, distribution-free) method, the Mann-Whitney Utest. Results with a P value of e0.05 were considered sta-tistically significant. Computations were performed usingSPSS for Windows, release 15.1 (SPSS Inc).
Because each of the 17 women was described in terms of118 gene expression values, the Mann-Whitney U test cannotfully recover the information hidden in the data, and moreexhaustive multivariate procedures were called for. We usedstandardized principal components analysis (PCA) (ie,analysis from a correlation matrix between genes) becausethere were still excessive differences in the variance ofvariables. In the biplot graphic drawn for two components ata time, the observations (in this case, the women) appear
368 Menopause, Vol. 16, No. 2, 2009 * 2009 The North American Menopause Society
KOSA ET AL

Copyright @ 2009 The North American Menopause Society. Unauthorized reproduction of this article is prohibited.
as points, whereas the variables (in this case, the genes) areemphasized by lines pointing to their positions. Thissimultaneous representation allows for the evaluation of thegrouping of women and of the relative importance andcorrelations of genes in influencing this configuration.Groups may be further illuminated by superimposing convexhulls on the ordination plane.
Whereas PCA explores the total variance in the data,canonical variates analysis (CVA, alias discriminant functionanalysis) maximizes separation of a prioriYdefined groups ofobservations. The results of CVA are canonical scoresobtained from the canonical functions derived througheigenanalysis, which serve as coordinates of observations inthe canonical space. Because the number of canonical axes isone less than the number of groups, in our case, CVAproduced only one variate. Computations were performed bythe SYNTAX 2000 program package.16
RESULTS
Study populationThe clinical and biochemical parameters of the postmen-
opausal and premenopausal nonosteoporotic women areshown in Table 1. There were no significant differences be-tween the premenopausal and postmenopausal nonosteopo-rotic groups in age, BMD, smoking habits, calcium intake,alcohol, caffeine consumption, and physical activity, andthey have not received any steroid or biological therapieseither. Remarkable differences were observed in the level ofserum estradiol (P = 0.0006) and in the markers of boneturnover, that is, osteocalcin (P = 0.01) and A-crosslaps (P =0.002) plasma levels, between the two study groups.
Comparison of gene expression in 10 postmenopausalversus 7 premenopausal nonosteoporotic women byMann-Whitney U test
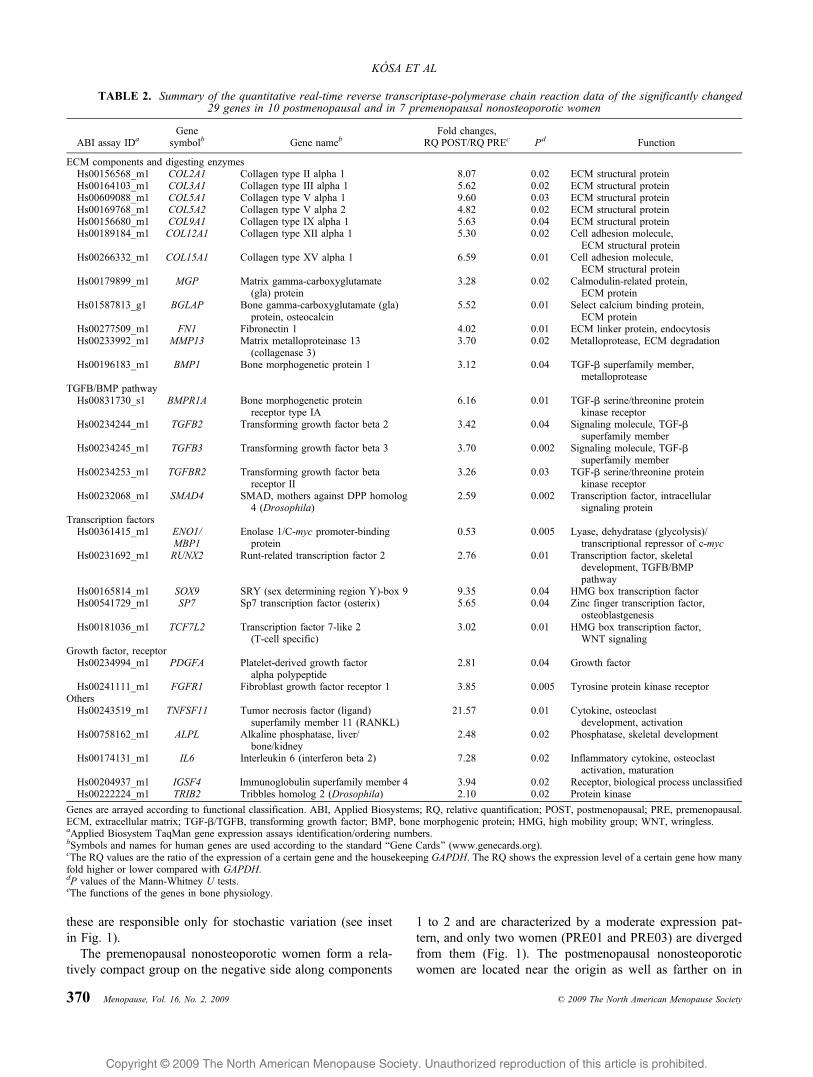
Table 2 summarizes data for the expression rate of the 29significantly altered genes (P e 0.05) in 17 examined women.
The genes are arranged in Table 2 according to functionalclassification. In postmenopausal nonosteoporotic women,seven collagen molecules (COL2A1, COL3A1, COL5A1,COL5A2, COL9A1, COL12A1, and COL15A1), three non-collagen type ECM molecules (MGP, BGLAP, and FN1), andtwo matrix degrading enzymes (MMP13 and BMP1) showedsignificantly up-regulated expression patterns. Five genesbelonging to the common TGFB/BMP signal transductionnetwork (BMPR1A, TGFB2, TGFB3, TGFBR2, and SMAD4)have been characterized by enhanced gene transcription ratesin estrogen-deficient women.
The two indispensable transcription factors of osteoblasts(RUNX2 and SP7) and the remaining transcription factorsinvolved in the WNT pathway (TCF7L2) and a chondrocytematuration gene (SOX9) showed increased expressionin postmenopausal women compared with premenopausalwomen. Two growth factors involved in mitogen-activatedprotein kinase (MAPK) signaling (PDGFA and FGFR1) alsoexerted overexpression in the absence of estrogen. Twoosteoclast stimulating factors (TNFSF11/RANKL and IL6)and a main marker of differentiated osteoblasts (ALPL) hadincreased expression activity in postmenopausal nonosteo-porotic women.
IGSF4 and TRIB2 were detected in nonosteoporotic hu-man bone tissue for the first time. These genes were foundto be overexpressed in menopause. In the case of ENO1/MBP1, diminished expression levels were observed. The quan-titative real-time RT-PCR data of the additional nonsignifi-cantly altered 89 genes are listed in Supplementary Table 1.
Multivariate analysesPrincipal Components Analysis
The first two components derived by standardizedPCA account for 32% (eigenvalue = 36.60) and 20%(eigenvalue = 22.18) of the total variation, respectively. Thesubsequent components (starting at 11%) were ignored inthis evaluation because the scree test suggests clearly that
TABLE 1. Clinical and biochemical characteristics of postmenopausal and premenopausal nonosteoporotic women
Postmenopausal nonosteoporotic (n = 10) Premenopausal nonosteoporotic (n = 7) P
Age, y 55 (47 to 57) 52 (50 to 57) 0.13T score L1-L4, SD j0.6 (j1.5 to 3.9) 0.2 (j0.9 to 1.7) 0.47Z score L1-L4, SD 0.5 (j1.3 to 3.5) 0.0 (j1.1 to 2.0) 0.81BMD L1-L4, g/cm2 1.113 (1.025 to 1.652) 1.298 (1.073 to 1.380) 0.23T score total femur, SD 0.05 (j1.5 to 1.8) 0.0 (j1.0 to 0.8) 0.74Z score total femur, SD 0.7 (j1.0 to 3.3) 0.4 (j0.7 to 0.9) 0.42BMD total femur, g/cm2 1.052 (0.760 to 1.221) 0.952 (0.788 to 1.208) 0.54Weight, kg 72.50 (65 to 82) 65 (58 to 88) 0.06Height, cm 162 (150 to 165) 160 (151 to 164) 0.36Body mass index, kg/m2 28.29 (24.77 to 32.03) 26.03 (22.14 to 38.59) 0.07Systolic blood pressure, mm Hg 130 (110 to 140) 120 (110 to 130) 0.07Diastolic blood pressure, mm Hg 80 (70 to 90) 80 (80 to 80) 0.74Pulse, beats/min 68 (60 to 76) 68 (64 to 72) 0.89Estradiol, pg/mL 9.55 (5.0 to 24.3) 67.10 (47.2 to 245.1) 0.0006Beta-crosslaps, pg/mL 335 (166 to 626) 218.20 (149 to 295) 0.01Osteocalcin, ng/mL 17.15 (12.43 to 29.96) 11.94 (7.99 to 15.21) 0.002Parathyroid hormone, pg/mL 26.50 (19 to 55) 32.40 (15 to 51) 0.54TSH, KIU/L 1.35 (0.40 to 6.50) 2.02 (0.64 to 4.22) 0.81
Probabilities in the right column refer to the results of the Mann-Whitney U test for comparing the two samples. Values are presented as median (range).SD, standard deviation; BMD, bone mineral density; THS, thyroid-stimulating hormone.
Menopause, Vol. 16, No. 2, 2009 369
MENOPAUSAL GENE EXPRESSION CHANGES IN BONE
Copyright @ 2009 The North American Menopause Society. Unauthorized reproduction of this article is prohibited.
these are responsible only for stochastic variation (see insetin Fig. 1).
The premenopausal nonosteoporotic women form a rela-tively compact group on the negative side along components
1 to 2 and are characterized by a moderate expression pat-tern, and only two women (PRE01 and PRE03) are divergedfrom them (Fig. 1). The postmenopausal nonosteoporoticwomen are located near the origin as well as farther on in
TABLE 2. Summary of the quantitative real-time reverse transcriptase-polymerase chain reaction data of the significantly changed29 genes in 10 postmenopausal and in 7 premenopausal nonosteoporotic women
ABI assay IDaGene
symbolb Gene namebFold changes,
RQ POST/RQ PREc Pd Function
ECM components and digesting enzymesHs00156568_m1 COL2A1 Collagen type II alpha 1 8.07 0.02 ECM structural proteinHs00164103_m1 COL3A1 Collagen type III alpha 1 5.62 0.02 ECM structural proteinHs00609088_m1 COL5A1 Collagen type V alpha 1 9.60 0.03 ECM structural proteinHs00169768_m1 COL5A2 Collagen type V alpha 2 4.82 0.02 ECM structural proteinHs00156680_m1 COL9A1 Collagen type IX alpha 1 5.63 0.04 ECM structural proteinHs00189184_m1 COL12A1 Collagen type XII alpha 1 5.30 0.02 Cell adhesion molecule,
ECM structural proteinHs00266332_m1 COL15A1 Collagen type XV alpha 1 6.59 0.01 Cell adhesion molecule,
ECM structural proteinHs00179899_m1 MGP Matrix gamma-carboxyglutamate
(gla) protein3.28 0.02 Calmodulin-related protein,
ECM proteinHs01587813_g1 BGLAP Bone gamma-carboxyglutamate (gla)
protein, osteocalcin5.52 0.01 Select calcium binding protein,
ECM proteinHs00277509_m1 FN1 Fibronectin 1 4.02 0.01 ECM linker protein, endocytosisHs00233992_m1 MMP13 Matrix metalloproteinase 13
(collagenase 3)3.70 0.02 Metalloprotease, ECM degradation
Hs00196183_m1 BMP1 Bone morphogenetic protein 1 3.12 0.04 TGF-A superfamily member,metalloprotease
TGFB/BMP pathwayHs00831730_s1 BMPR1A Bone morphogenetic protein
receptor type IA6.16 0.01 TGF-A serine/threonine protein
kinase receptorHs00234244_m1 TGFB2 Transforming growth factor beta 2 3.42 0.04 Signaling molecule, TGF-A
superfamily memberHs00234245_m1 TGFB3 Transforming growth factor beta 3 3.70 0.002 Signaling molecule, TGF-A
superfamily memberHs00234253_m1 TGFBR2 Transforming growth factor beta
receptor II3.26 0.03 TGF-A serine/threonine protein
kinase receptorHs00232068_m1 SMAD4 SMAD, mothers against DPP homolog
4 (Drosophila)2.59 0.002 Transcription factor, intracellular
signaling proteinTranscription factorsHs00361415_m1 ENO1/
MBP1Enolase 1/C-myc promoter-binding
protein0.53 0.005 Lyase, dehydratase (glycolysis)/
transcriptional repressor of c-mycHs00231692_m1 RUNX2 Runt-related transcription factor 2 2.76 0.01 Transcription factor, skeletal
development, TGFB/BMPpathway
Hs00165814_m1 SOX9 SRY (sex determining region Y)-box 9 9.35 0.04 HMG box transcription factorHs00541729_m1 SP7 Sp7 transcription factor (osterix) 5.65 0.04 Zinc finger transcription factor,
osteoblastgenesisHs00181036_m1 TCF7L2 Transcription factor 7-like 2
(T-cell specific)3.02 0.01 HMG box transcription factor,
WNT signalingGrowth factor, receptorHs00234994_m1 PDGFA Platelet-derived growth factor
alpha polypeptide2.81 0.04 Growth factor
Hs00241111_m1 FGFR1 Fibroblast growth factor receptor 1 3.85 0.005 Tyrosine protein kinase receptorOthersHs00243519_m1 TNFSF11 Tumor necrosis factor (ligand)
superfamily member 11 (RANKL)21.57 0.01 Cytokine, osteoclast
development, activationHs00758162_m1 ALPL Alkaline phosphatase, liver/
bone/kidney2.48 0.02 Phosphatase, skeletal development
Hs00174131_m1 IL6 Interleukin 6 (interferon beta 2) 7.28 0.02 Inflammatory cytokine, osteoclastactivation, maturation
Hs00204937_m1 IGSF4 Immunoglobulin superfamily member 4 3.94 0.02 Receptor, biological process unclassifiedHs00222224_m1 TRIB2 Tribbles homolog 2 (Drosophila) 2.10 0.02 Protein kinase
Genes are arrayed according to functional classification. ABI, Applied Biosystems; RQ, relative quantification; POST, postmenopausal; PRE, premenopausal.ECM, extracellular matrix; TGF-A/TGFB, transforming growth factor; BMP, bone morphogenic protein; HMG, high mobility group; WNT, wringless.aApplied Biosystem TaqMan gene expression assays identification/ordering numbers.bSymbols and names for human genes are used according to the standard BGene Cards[ (www.genecards.org).cThe RQ values are the ratio of the expression of a certain gene and the housekeeping GAPDH. The RQ shows the expression level of a certain gene how manyfold higher or lower compared with GAPDH.dP values of the Mann-Whitney U tests.eThe functions of the genes in bone physiology.
370 Menopause, Vol. 16, No. 2, 2009 * 2009 The North American Menopause Society
KOSA ET AL

Copyright @ 2009 The North American Menopause Society. Unauthorized reproduction of this article is prohibited.
(Continued on next page)
SUPPLEMENTARY TABLE 1. Summary of the quantitative real-time RT-PCR data of the additional 89 examined genes
ABI Assay IDa Gene Symbolb Gene nameb Fold changec Pd
Hs00356261_m1 ACP5 acid phosphatase 5, tartrate resistant 1.59 0.19Hs00153836_m1 ACVR1 activin A receptor, type I 3.80 0.06Hs00155658_m1 ACVR2 activin A receptor, type II 2.30 0.42Hs00609608_m1 ALOX15 arachidonate 15-lipoxygenase 9.32 0.36Hs00167549_m1 ANXA1 annexin A1 0.70 1.00Hs00743063_s1 ANXA2 annexin A2 1.85 0.06Hs00155794_m1 APOD apolipoprotein D 1.61 0.31Hs00171168_m1 APOE apolipoprotein E 0.68 0.27Hs00155939_m1 ATP2A2 ATPase, Ca++ transporting, cardiac muscle, slow twitch 2 4.33 0.31Hs00156076_m1 BGN biglycan 1.55 0.23Hs00154192_m1 BMP2 bone morphogenetic protein 2 5.58 0.23Hs00609638_m1 BMP3 bone morphogenetic protein 3 3.12 0.07Hs00370078_m1 BMP4 bone morphogenetic protein 4 1.35 0.42Hs01629138_s1 BMP8A bone morphogenetic protein 8a 1.24 0.23Hs00236942_m1 BMP8B bone morphogenetic protein 8b 0.17 0.96Hs00176148_m1 BMPR2 bone morphogenetic protein receptor, type II 2.01 0.81Hs00173436_m1 CASR calcium-sensing receptor ND -Hs00169627_m1 CD36 CD36 antigen (thrombospondin receptor) 0.54 0.19Hs00176484_m1 CKB creatine kinase, brain 4.68 0.09Hs00166657_m1 COL10A1 collagen, type X, alpha 1 1.51 0.19Hs00266273_m1 COL11A1 collagen, type XI, alpha 1 2.84 0.23Hs00385388_m1 COL14A1 collagen, type XIV, alpha 1 9.64 0.11Hs00164004_m1 COL1A1 collagen, type I, alpha 1 2.13 0.11Hs00164099_m1 COL1A2 collagen, type I, alpha 2 4.59 0.09Hs00164150_m1 COL4A4 collagen, type IV, alpha 4 2.88 0.54Hs00164310_m1 COL7A1 collagen, type VII, alpha 1 0.86 0.60Hs00171266_m1 CSF2 colony stimulating factor 2 (granulocyte-macrophage) ND -Hs00236884_m1 CSF3 colony stimulating factor 3 (granulocyte) ND -Hs00170025_m1 CTNNB1 catenin (cadherin-associated protein), beta 1 1.30 0.31Hs00166156_m1 CTSK cathepsin K 2.21 0.11Hs00266491_m1 DCN decorin 1.68 0.36Hs00171962_m1 DSPP dentin sialophosphoprotein ND -Hs00154830_m1 DUSP9 dual specificity phosphatase 9 ND -Hs00153181_m1 EGF epidermal growth factor ND -Hs00193306_m1 EGFR epidermal growth factor receptor 3.30 0.07Hs00186772_m1 EIF3S4 eukaryotic translation initiation factor 3, subunit 4 delta 1.23 0.19Hs00174860_m1 ESR1 estrogen receptor 1 (ER alpha) 1.02 0.54Hs00230957_m1 ESR2 estrogen receptor 2 (ER beta) 3.42 0.19Hs00269758_m1 FABP3 fatty acid binding protein 3, muscle and heart 0.73 0.89Hs00609791_m1 FABP4 fatty acid binding protein 4, adipocyte 1.54 0.54Hs00265254_m1 FGF1 fibroblast growth factor 1 (acidic) 5.42 0.06Hs00266645_m1 FGF2 fibroblast growth factor 2 (basic) 2.62 0.07Hs00234404_m1 FKBP2 FK506 binding protein 2 1.00 0.74Hs00164932_m1 ICAM1 intercellular adhesion molecule 1 (CD54) 0.27 0.81Hs00153126_m1 IGF1 insulin-like growth factor 1 (somatomedin C) 0.79 0.16Hs00181385_m1 IGF1R insulin-like growth factor 1 receptor 1.24 0.74Hs00174092_m1 IL-1A interleukin 1, alpha ND -Hs00174097_m1 IL-1B interleukin 1, beta 2.31 0.96Hs00158057_m1 IL-1RAP interleukin 1 receptor accessory protein 1.62 0.27Hs00171410_m1 INHA inhibin, alpha 1.63 0.42Hs00170103_m1 INHBA inhibin, beta A 1.60 0.19Hs00235006_m1 ITGA1 integrin, alpha 1 (CD49A) 3.05 0.09Hs00158127_m1 ITGA2 integrin, alpha 2 (CD49B) 0.95 0.96Hs00183100_m1 KL klotho 5.07 0.23Hs00391006_m1 LPR4 low density lipoprotein receptor-related protein 4 2.76 0.07Hs00182031_m1 LRP5 low density lipoprotein receptor-related protein 5 1.36 0.36Hs00233987_m1 MMP10 matrix metalloproteinase 10 (stromelysin 2) ND -Hs00234422_m1 MMP2 matrix metalloproteinase 2 (gelatinase A) 1.07 0.47Hs00233972_m1 MMP8 matrix metalloproteinase 8 (neutrophil collagenase) 0.51 0.09Hs00234579_m1 MMP9 matrix metalloproteinase 9 (gelatinase B) 0.60 0.23Hs00427183_m1 MSX1 msh homeo box homolog 1 1.36 0.16Hs00751239_s1 MSX2 msh homeo box homolog 2 4.48 0.36Hs00231653_m1 NFKB1 nuclear factor of kappa light polypeptide gene enhancer in B-cells 1 1.96 0.07Hs00212076_m1 NLK nemo like kinase 2.19 0.07Hs00273458_m1 OSTF1 osteoclast stimulating factor 1 0.56 0.11Hs00428481_m1 SERF2 small EDRK-rich factor 2 0.76 0.23Hs00196708_m1 SFRS7 splicing factor, arginine/serine-rich 7 0.84 0.74Hs00195432_m1 SMAD1 SMAD, mothers against DPP homolog 1 1.30 0.13Hs00183425_m1 SMAD2 SMAD, mothers against DPP homolog 2 1.49 0.16Hs00232219_m1 SMAD3 SMAD, mothers against DPP homolog 3 0.89 0.31
Menopause, Vol. 16, No. 2, 2009 371
MENOPAUSAL GENE EXPRESSION CHANGES IN BONE

Copyright @ 2009 The North American Menopause Society. Unauthorized reproduction of this article is prohibited.
the positive direction and show a consistently enhanced geneexpression pattern (Fig. 1). On component 1, POST05 andon component 2 POST07 are separated from the postmen-
opausal cluster by their very high gene transcription activity.POST06 and, to a lesser extent, POST11 are intermingledwith the premenopausal group and have opposite positions.
SUPPLEMENTARY TABLE 1. (Continued)
FIG. 1. Principal components ordination representing the positions of 17 women along the first two dimensions. Convex polygons superimposedenhance discrimination between groups. Inset shows the scree diagram for the components extracted. On the basis of the 118 genes expression pattern,the premenopausal and postmenopausal nonosteoporotic phenotype sharply separated from each other. The premenopausal women (white PRE)created a discrete cluster by their same gene expression rates, which characterize their phenotype. The postmenopausal nonosteoporotic women (blackPOST) constituted an extensive group that clearly separates from the premenopausal ones.
ABI Assay IDa Gene Symbolb Gene nameb Fold changec Pd
Hs00228830_m1 SOST sclerosteosis 1.45 0.36Hs00268388_s1 SOX4 SRY (sex determining region Y)-box 4 0.40 0.47Hs00234160_m1 SPARC secreted protein, acidic, cysteine-rich (osteonectin) 2.27 0.09Hs00167093_m1 SPP1 secreted phosphoprotein 1 (osteopontin, bone sialoprotein I) 3.00 0.09Hs00171257_m1 TGFB1 transforming growth factor, beta 1 1.37 0.60Hs00610319_m1 TGFBR1 transforming growth factor, beta receptor I 1.58 0.11Hs00234278_m1 TIMP2 tissue inhibitor of metalloproteinase 2 1.44 0.27Hs00363670_m1 TMSB10 thymosin, beta 10 0.71 0.81Hs00864161_g1 TMSB4X thymosin, beta 4, X chromosome 0.72 0.31Hs00233648_m1 TNC tenascin C 2.57 0.11Hs00174128_m1 TNF tumor necrosis factor (TNF superfamily, member 2) 1.27 0.23Hs00200178_m1 TNFAIP6 tumor necrosis factor, alpha-induced protein 6 2.22 0.09Hs00171068_m1 TNFRSF11 tumor necrosis factor receptor superfamily, member 11b (OPG) 2.99 0.07Hs00361186_m1 TWIST1 twist homolog 1 2.47 0.07Hs02379973_s1 TWIST2 twist homolog 2 1.24 0.89Hs00174239_m1 VCAM1 vascular cell adhesion molecule 1 0.84 0.27Hs00172113_m1 VDR vitamin D (1,25- dihydroxyvitamin D3) receptor 0.23 0.54Hs00173626_m1 VEGF vascular endothelial growth factor 1.08 0.36Hs00183662_m1 WIF1 WNT inhibitory factor 1 3.32 0.06aApplied Biosystem TaqMan Gene Expression Assays Identification / Ordering Numbers.bSymbols and names for human genes are used according to the standard BGene Cards[ (www.genecards.org).cFold changes (RQ POST /RQ PRE). ND: PCR signal was not detected.dP values of the Mann-Whitney U tests.
372 Menopause, Vol. 16, No. 2, 2009 * 2009 The North American Menopause Society
KOSA ET AL

Copyright @ 2009 The North American Menopause Society. Unauthorized reproduction of this article is prohibited.
The directions and relative lengths of the lines rep-resenting genes in the biplot diagram (Fig. 2) clearly showthat in addition to the genes that exhibited significant dif-ferences among the two samples of women, many others alsohave great explanatory power. COL3A1, COL5A1, COL5A2,COL9A1, COL12A1, COL15A1, BGLAP, FN1, MMP13, andat least 20 other genes (mainly signal transducer moleculesbelonging to TGFB/BMP pathways, eg, BMPR1A, BMPR2,BMP1, BMP2, ACVR1, and ACVR2) are responsible for theseparation of POST07, POST04, POST01, and, to a lesserextent, POST08, whereas TGFB2, TGFBR2, RUNX2, SP7,ALPL, SMAD4, and COL2A1 plus numerous other genes(eg, nonYcollagen matrix molecules: MGP, SPARC, SPP1,and BGN) separate POST03 and POST10. APOE, LRP5,FABP4, and FABP3 genes are affected in lipid metabolismwith ESR1 and ESR2 pointing toward POST05 and PRE03and best explain their position. OSTF1, MMP8, ENO1,ICAM1, TMSB4X, and CD36 are orthogonal to or negativelycorrelated with most of the collagen genes.
Canonical Variates AnalysisCVA was used to check whether the groups of post-
menopausal and premenopausal women are separable in themultidimensional space spanned by the genetic variables and,if so, which gene subsets have the best discriminatory power.Nine gene subsets have been evaluated by CVA (Fig. 3 andSupplementary Table 2). The selection of two gene subsets,namely, ECM molecules (12 genes, Table 2) and the TGFB/BMP family (5 genes, Table 2), was based on the results ofthe Mann-Whitney U test and contained significantlychanged (P e 0.05) genes. Some of the gene subsets werecreated on similar signal transduction basis: TGFB/activin/nodal pathway (12 genes: TGFB1, TGFB2, TGFB3,TGFBR1, TGFBR2, SMAD2, SMAD3, SMAD4, ACVR1,ACVR2, INHA, and INHBA),17 BMP cascade (9 genes:BMP2, BMP4, BMP3, BMP8A, BMP8B, BMPR1A, BMPR2,SMAD1, and SMAD4),18 WNT signaling network (6 genes:TCF7L2, WIF1, NLK, LRP5, LRP4, and CTNNB1),19<21
growth factors regulated through the MAPK signaling
FIG. 2. PCA biplot simultaneously showing the positions of 118 genes and 17 women. The premenopausal nonosteoporotic phenotype (white PRE)is described by lower transcription level of almost every gene examined; however, CD36, OSTF1, MMP8, ENO1, and ICAM1 showing increasedexpression in premenopausal women are oriented toward the premenopausal cluster. The postmenopausal nonosteoporotic phenotype (black POST) ischaracterized by consistently enhanced gene transcription network to a different extent. Several collagens along component 2 (COL1A2, COL5A1,COL5A2, COL11A1, COL12A1, and COL14A1) and some growth factors (TGFB2, TGFBR2, PDGFA, FGFR1, and EGFR) along component 1exhibited very high gene expression activity, whereas the transcription levels of MSX2, IL6, SOX4, and KL were remarkably low and near the origin.
Menopause, Vol. 16, No. 2, 2009 373
MENOPAUSAL GENE EXPRESSION CHANGES IN BONE

Copyright @ 2009 The North American Menopause Society. Unauthorized reproduction of this article is prohibited.
pathway (9 genes: IGF1, IGF1R, FGF1, FGF2, FGFR1,VEGF, PDGFA, EGFR, and NFKB1), and genes controlledvia estrogen receptor (ER>) (13 genes:> MMP9, MMP13,IGF1, VEGF, PDGFA, BMP4, BMP2, TGFB1, TGFB2,TGFB3, CTNNB1, TNFRSF11, and RUNX2)4,22<32 or ER-A(16 genes: COL7A1, COL11A1, SPP1, VEGF, FGF1,PDGFA, TGFB1, TGFB2, TGFBR2, BMP3, BMP4, TNF,ALPL, RUNX2, TWIST1, and SOX9).4,22,23,26,27,33<35 Theremaining gene set included seven genes that are involvedin lipid metabolism (FABP3, FABP4, APOD, APOE,LRP5, ALOX15, and CD36).
Genes controlled via ER-A exhibited the best discrimi-natory power, which separates the postmenopausal and pre-menopausal nonosteoporotic women unambiguously. Genescoding ECM proteins and genes belonging to the TGFB/activin/nodal pathway also showed strong correlation withthe single canonical variate, hence achieving clear separationof the two groups of the nonosteoporotic women examined.The subsets of growth factors and BMP cascade had weakerdiscriminatory power (Fig. 3).
DISCUSSION
In the present study, we have shown differences in thegene transcription profiles of human premenopausal and
postmenopausal nonosteoporotic bone tissue for the firsttime. We could sharply separate the premenopausal and post-menopausal phenotypes by genetic information. We haveselected the time- and laboratory-consuming, but robust andhighly reproducible, quantitative real-time PCR approach be-cause of the low level of gene expression changes connectedto the very slowly emerging changes in bone tissue in re-sponse to menopause that are difficult to detect reliably bymicroarrays.
Recently, bone-related gene (eg, BGLAP, ALPL, IL6, andRANKL) expression differences have been recognized inovariectomized animal models or cell cultures.36<38 Thesechanges have been validated in human samples in our study.In addition, we have identified genes showing marked al-terations in their expression levels in human bone tissue,which have not yet been related to menopause (see Table 2and Supplementary Table 1). Numerous studies have re-ported that deficiency of ovarian hormones after menopausecauses increased bone remodeling and stimulates osteoblasticand osteoclastic activity as a consequence of genetic up-regulation.8<10 All together, we have demonstrated theexpression changes of 29 genes, including the only down-regulated expression of ENO1/MBP1. This fact may reflectthe general metabolic effect of estrogens on bone cells andreflects the clinically certified accelerated bone turnover
FIG. 3. Canonical variates analysis of gene expression patterns of bone tissue in 10 postmenopausal (POST, black bars) and 7 premenopausal (PRE,white bars) nonosteoporotic women. The most perfect discrimination is seen in case of ER-A regulated genes. Furthermore, very clear separation wasdemonstrated based on ECM (P e 0.05), TGFB/activin/nodal, and growth factor/MAPK genes subsets in postmenopausal and premenopausal women.ECM, extracellular matrix; ER-alpha, estrogen receptor->; ER-beta, estrogen receptor-A; WNT, wingless; MAPK, mitogen-activated protein kinase;BMP, bone morphogenic protein.
374 Menopause, Vol. 16, No. 2, 2009 * 2009 The North American Menopause Society
KOSA ET AL

Copyright @ 2009 The North American Menopause Society. Unauthorized reproduction of this article is prohibited.
in postmenopausal women. In addition, we determined up-regulation of two novel genes, human homologue ofDrosophila tribbles 2 (TRIB2) and IGSF4, in postmenopausalwomen. The increased TRIB2 expression might be one ofthe reasons for the increased inflammatory signal transduc-tion through the MAPK pathway in human bone tissue aftermenopause.39,40 IGSF4 is a novel immunoglobulin-like inter-cellular adhesion molecule that mediates cell-cell interactionsindependently of Ca2+. Lin et al41 have found that IGSF4 isa putative ER-> target gene in breast tumor cells. IGSF4overexpression may cause more pronounced bone cell ad-hesion and migration in the postmenopausal state.
Multivariate statistical analyses (PCA and CVA), however,provided a more profound evaluation of the relationshipamong the genes studied. By using PCA, we identified alarger number of genes that can distinguish postmenopausalfrom premenopausal bone tissue. The difference between theresults obtained by the Mann-Whitney U test and the PCAcould be explained by the differing characteristics of the twomethods. The univariate test takes the groups as they are,based on one variable at a time, whereas PCA is able to re-veal within-group differences as well and its performancedepends greatly on correlations among the variables. Thissimultaneous representation of patients and genes allows forthe evaluation of the grouping of patients and the relativeimportance and correlations of genes influencing this config-uration. The overall picture provided by PCA is also usefulin selecting genes that best reflect trends and differencesamong patient groups. On the basis of the transcriptionalpattern of the tested genes, the postmenopausal and premen-opausal phenotypes could be separated from each other(Fig. 1). The postmenopausal state is described by consis-tently up-regulated genes in the bone tissue (Fig. 2). Thesefindings suggest, at least in part, a possible transcriptional basisfor the changes in postmenopausal bone metabolism we noted.
CVA is useful especially when the genes best discrimi-nating between the groups of participants are to be identified.A partial limitation of this method is that the number ofvariables (selected genes) cannot exceed the number of ob-servations (participants). CVA revealed an important genesubset containing ER-AYregulated genes with strongly alteredexpression in estrogen deficiency that sharply separate post-menopausal and premenopausal bone tissues (Fig. 3). Theuncoupled bone remodeling in menopause must be the resultof the impaired signaling as well as the uncontrolled genetranscription through ER-A by the lack of the ovarianhormone. The gene subsets of many different ECM proteinsand TGFB/activin/nodal signaling molecules may also dis-tinguish the two groups with great discriminatory power.These factors are essential in bone metabolism, and theirpower to separate postmenopausal and premenopausal statesmight be useful in the future.
Limitations of our study include the fact that the measure-ment of gene expression was not carried out on a homoge-nous bone cell population because, occasionally, other bonemarrow cells (eg, immune cell progenitors, mesenchymal
SUPPLEMENTARY
TABLE
2.Genesymbo
lsan
dcorrelations
ofgeneswithcano
nicalvariate(CV)aresummarized
ofnine
gene
subsets
ECM
(Pe0.05
)TGFB/BMP
(Pe0.05)
ER-alpha
ER-beta
Lipid
metabolism
Growth
factors/
MAPK
TGFB/activin/nodal
WNTpathway
BMPpathway
Gene
name
Corr. with
CV
Gene
name
Corr. with
CV
Gene
name
Corr. with
CV
Gene
name
Corr. with
CV
Gene
name
Corr. with
CV
Gene
name
Corr. with
CV
Gene
name
Corr. with
CV
Gene
name
Corr. with
CV
Gene
name
Corr. with
CV
BGLAP
0.720
TGFB3
0.981
MMP9
0.250
COL7A
10.04
1FABP4
0.384
IGF1
0.082
TGFB3
0.731
TCF7L
20.878
SMAD4
0.71
7MGP
0.624
TGFB2
0.723
IGF1
0.079
VEGF
j0.040
APOD
0.296
VEGF
j0.044
SMAD4
0.638
LRP4
0.615
BMPR1A
0.57
0COL15A1
0.520
SMAD4
0.711
VEGF
j0.04
2BMP4
j0.154
ALOX15
0.275
IGF1R
j0.132
TGFB2
0.536
NLK
0.591
BMP3
0.48
1FN1
0.482
TGFBR2
0.702
BMP4
j0.16
2TNF
j0.175
LRP5
0.222
FGF2
j0.303
TGFBR2
0.523
WIF1
0.502
BMP2
0.42
5COL2A
10.476
BMPR1A
0.678
TGFB1
j0.18
8TGFB1
j0.179
FABP3
j0.183
NFKB1
j0.376
TGFBR1
0.383
CTNNB1
0.252
BMPR2
0.29
2MMP13
0.452
VV
CTNNB1
j0.19
2COL11A1
j0.309
APOE
j0.377
EGFR
j0.424
INHBA
0.375
LRP5
0.219
BMP4
0.17
9COL12A1
0.412
VV
BMP2
j0.38
4TWIST1
j0.371
CD36
j0.472
PDGFA
j0.480
ACVR1
0.363
VV
SMAD1
0.16
0COL5A
10.408
VV
OPG
j0.38
5SPP’
j0.412
VV
FGF1
j0.523
ACVR2
0.281
VV
BMP8A
0.08
2COL3A
10.381
VV
MMP13
j0.45
9BMP3
j0.426
VV
FGFR1
j0.621
SMAD2
0.237
VV
BMP8B
j0.437
COL5A
20.339
VV
PDGFA
j0.46
1PDGFA
j0.439
VV
VV
TGFB1
0.186
VV
VV
COL9A
10.276
VV
TGFB2
j0.54
5SOX9
j0.448
VV
VV
INHA
0.136
VV
VV
BMP1
0.238
VV
RUNX2
j0.63
1FGF1
j0.480
VV
VV
SMAD3
j0.04
4V
VV
VV
VV
VTGFB3
j0.74
0TGFBR2
j0.504
VV
VV
VV
VV
VV
VV
VV
VV
ALPL
j0.513
VV
VV
VV
VV
VV
VV
VV
VV
TGFB2
j0.525
VV
VV
VV
VV
VV
VV
VV
VV
RUNX2
j0.601
VV
VV
VV
VV
VV
Sym
bolsandnames
forhu
man
genesbelong
ingto
thenine
subsetsareused
accordingto
thestandard
BGeneCards[(w
ww.genecards.org).
Menopause, Vol. 16, No. 2, 2009 375
MENOPAUSAL GENE EXPRESSION CHANGES IN BONE

Copyright @ 2009 The North American Menopause Society. Unauthorized reproduction of this article is prohibited.
cells, stromal cells, and fibroblasts) might have remained inthe samples despite the extensive washing procedure. How-ever, this experimental strategy is widely accepted at present.Another limitation of our work is that the examined controland osteoporotic groups consisted of osteoarthritic women,who are thus not totally healthy. This could introduce a bias;however, removing bone tissue from an otherwise healthyperson raises irresolvable difficulties from an ethical point ofview. Also, osteoarthritis is one of the most frequent diseasesin menopause. Sample number could be increased in thefuture, which may also offset the limitations caused by themultiple testing.
Our study suggests that different phenotypes can beseparated by using a handful of carefully selected genes.However, physiological and pathological processes arelongitudinal events in time; therefore, a cross-sectionalgenetic analysis provides only a momentary reflection ofthe underlying mechanisms. Menopause is also a long-termprocess stretching out for about 10 years. The genetic patternwe observed could be characteristic of the beginning ofevents, considering the relatively young age of our women.Nevertheless, both premenopausal and postmenopausalwomen were very close in age, separated only by the onsetof menopause, and our results should mostly reflect changeselicited by estrogen deficiency. The whole genome approachcould have resulted in the identification of other genes;however, because of methodical flaws, microarray systemsmight have missed the small changes accompanying estrogendeficiency, making impossible a firm distinction betweenthe two groups. The appropriate selection of genes in thestudy was supported by the successful separation of pheno-types on their basis.
CONCLUSIONS
In conclusion, we have found significant differences in thegene expression profiles of the bone tissue of postmeno-pausal and premenopausal nonosteoporotic women, includinggenes that have not yet been associated with menopausalchanges. The separation of the two groups by the multi-parametric statistical methods applied suggests the involve-ment of new candidate gene subsets as well as geneticpathways (canonical TGFB cascade, MAPK, and ER signal-ing) that might be useful for the development of futurediagnostic tools. Our findings may provide further insightinto the process of postmenopausal changes in bonemetabolism and can contribute to the development of newstatistical methods for the evaluation of batched genetic data.
REFERENCES
1. Syed F, Khosla S. Mechanisms of sex steroid effects on bone. BiochemBiophys Res Commun 2005;328:688-696.
2. Riggs BL. The mechanisms of estrogen regulation of bone resorption.J Clin Invest 2000;106:1203-1204.
3. Turner RT, Riggs BL, Spelsberg TC. Skeletal effects of estrogen.Endocr Rev 1994;15:275-300.
4. Lindberg MK, Moverare S, Eriksson AL, et al. Identification ofestrogen-regulated genes of potential importance for the regula-tion of trabecular bone mineral density. J Bone Miner Res 2002;17:2183-2195.
5. Kuroki T, Shingu M, Koshihara Y, Nobunaga M. Effects of cytokineson alkaline phosphatase and osteocalcin production, calcification andcalcium release by human osteoblastic cells. Br J Rheumatol 1994;33:224-230.
6. Chen JR, Plotkin LI, Aguirre JI, et al. Transient versus sustainedphosphorylation and nuclear accumulation of ERKs underlie anti-versus pro-apoptotic effects of estrogens. J Biol Chem 2005;280:4632-4638.
7. Robinson JA, Harris SA, Riggs BL, Spelsberg TC. Estrogen regula-tion of human osteoblastic cell proliferation and differentiation.Endocrinology 1997;138:2919-2927.
8. Abrahamsen B, Shalhoub V, Larson EK, Eriksen EF, Beck-Nielsen H,Marks SC Jr. Cytokine RNA levels in transiliac bone biopsies fromhealthy early postmenopausal women. Bone 2000;26:137-145.
9. Gorai I, Taguchi Y, Chaki O, Nakayama M, Minaguchi H. Specificchanges of urinary excretion of cross-linked N-telopeptides of type Icollagen in pre- and postmenopausal women: correlation with othermarkers of bone turnover. Calcif Tissue Int 1997;60:317-322.
10. Takahashi M, Kushida K, Hoshino H, Ohishi T, Inoue T. Biochemicalmarkers of bone turnover do not decline after menopause in healthywomen. Br J Obstet Gynaecol 1999;106:427-431.
11. Eijken M, Swagemakers S, Koedam M, et al. The activin A-follistatinsystem: potent regulator of human extracellular matrix mineralization.FASEB J 2007;21:2949-2960.
12. Liang M, Liao EY, Xu X, Luo XH, Xiao XH. Effects of progesteroneand 18-methyl levonorgestrel on osteoblastic cells. Endocr Res 2003;29:483-501.
13. Kellgren JH, Lawrence JS. Radiological assessment of osteo-arthrosis.Ann Rheum Dis 1957;16:494-502.
14. Balla B, Kosa JP, Kiss J, et al. Different gene expression patterns in thebone tissue of aging postmenopausal osteoporotic and non-osteoporoticwomen. Calcif Tissue Int 2008;82:12-26.
15. Benayahu D. Estrogen effects on protein expressed by marrow stromalosteoblasts. Biochem Biophys Res Commun 1997;233:30-35.
16. Podani J. SYN-TAX 2000. User’s Manual. Budapest, Hungary: Scientia,2001.
17. Itoh S, Itoh F, Goumans MJ, Ten Dijke P. Signaling of transforminggrowth factor-A family members through SMAD proteins. Eur JBiochem 2000;267:6954-6967.
18. Kawabata M, Imamura T, Miyazono K. Signal transduction by bonemorphogenetic proteins. Cytokine Growth Factor Rev 1998;9:49-61.
19. Krishnan V, Bryant HU, Macdougald OA. Regulation of bone mass byWnt signaling. J Clin Invest 2006;116:1202-1209.
20. Koay MA, Brown MA. Genetic disorders of the LRP5-Wnt signallingpathway affecting the skeleton. Trends Mol Med 2005;11:129-137.
21. Reya T, Clevers H. Wnt signalling in stem cells and cancer. Nature2005;434:843-850.
22. Wang J, Jarrett J, Huang CC, Satcher RL Jr, Levenson AS. Identificationof estrogen-responsive genes involved in breast cancer metastases to thebone. Clin Exp Met 2007;24:411-422.
23. Kian Tee M, Rogatsky I, Tzagarakis-Foster C, et al. Estradiol andselective estrogen receptor modulators differentially regulate targetgenes with estrogen receptors > and A. Mol Biol Cell 2004;15:1262-1272.
24. Viereck V, Grundker C, Blaschke S, Siggelkow H, Emons G, HofbauerLC. Phytoestrogen genistein stimulates the production of osteo-protegerin by human trabecular osteoblasts. J Cell Biochem 2002;84:725-735.
25. Fournier B, Gutzwiller S, Dittmar T, Matthias G, Steenbergh P, MatthiasP. Estrogen receptor (ER)->, but not ER-A, mediates regulation of theinsulin-like growth factor I gene by antiestrogens. J Biol Chem2001;276:35444-35449.
26. Mueller MD, Vigne JL, Minchenko A, Lebovic DI, Leitman DC, TaylorRN. Regulation of vascular endothelial growth factor (VEGF) genetranscription by estrogen receptors > and A. Proc Natl Acad Sci U S A2000;97:10972-10977.
27. Tou L, Quibria N, Alexander JM. Regulation of human cbfa1 genetranscription in osteoblasts by selective estrogen receptor modulators(SERMs). Mol Cell Endocrinol 2001;183:71-79.
28. Kouzmenko AP, Takeyama K, Ito S, et al. Wnt/A-catenin and estrogensignaling converge in vivo. J Biol Chem 2004;279:40255-40258.
376 Menopause, Vol. 16, No. 2, 2009 * 2009 The North American Menopause Society
KOSA ET AL

Copyright @ 2009 The North American Menopause Society. Unauthorized reproduction of this article is prohibited.
29. van den Wijngaard A, Mulder WR, Dijkema R, et al. Antiestrogensspecifically up-regulate bone morphogenetic protein-4 promoter activityin human osteoblastic cells. Mol Endocrinol 2000;14:623-633.
30. Lu T, Achari Y, Sciore P, Hart DA. Estrogen receptor > regulatesmatrix metalloproteinase-13 promoter activity primarily through theAP-1 transcriptional regulatory site. Biochim Biophys Acta 2006;1762:719-731.
31. Zhou S, Turgeman G, Harris SE, et al. Estrogens activate bonemorphogenetic protein-2 gene transcription in mouse mesenchymalstem cells. Mol Endocrinol 2003;17:56-66.
32. Brama M, Gnessi L, Basciani S, et al. Cadmium induces mitogenicsignaling in breast cancer cell by an ER>-dependent mechanism. MolCell Endocrinol 2007;264:102-108.
33. Monroe DG, Getz BJ, Johnsen SA, Riggs BL, Khosla S, Spelsberg TC.Estrogen receptor isoform-specific regulation of endogenous geneexpression in human osteoblastic cell lines expressing either ER> orERA. J Cell Biochem 2003;90:315-326.
34. Srivastava S, Weitzmann MN, Cenci S, Ross FP, Adler S, Pacifici R.Estrogen decreases TNF gene expression by blocking JNK activity andthe resulting production of c-Jun and JunD. J Clin Invest 1999;104:503-513.
35. Cao L, Bu R, Oakley JI, Kalla SE, Blair HC. Estrogen receptor-Amodulates synthesis of bone matrix proteins in human osteoblast-likeMG63 cells. J Cell Biochem 2003;89:152-164.
36. Yokose S, Ishizuya T, Ikeda T, et al. An estrogen deficiency caused byovariectomy increases plasma levels of systemic factors that stimulateproliferation and differentiation of osteoblasts in rats. Endocrinology1996;137:469-478.
37. Ikeda T, Yamaguchi A, Yokose S, et al. Changes in biological activityof bone cells in ovariectomized rats revealed by in situ hybridization.J Bone Miner Res 1996;11:780-788.
38. Davey RA, Hahn CN, May BK, Morris HA. Osteoblast gene expressionin rat long bones: effects of ovariectomy and dihydrotestosterone onmRNA levels. Calcif Tissue Int 2000;67:75-79.
39. Hegedus Z, Czibula A, Kiss-Toth E. Tribbles: novel regulators of cellfunction; evolutionary aspects. Cell Mol Life Sci 2006;63:1632-1641.
40. Sung HY, Francis SE, Crossman DC, Kiss-Toth E. Regulation ofexpression and signalling modulator function of mammalian tribbles iscell-type specific. Immunol Lett 2006;104:171-177.
41. Lin CY, Strom A, Vega VB, et al. Discovery of estrogen receptor >target genes and response elements in breast tumor cells. Genome Biol2004;5:R66.
Menopause, Vol. 16, No. 2, 2009 377
MENOPAUSAL GENE EXPRESSION CHANGES IN BONE