
Effect of ethanol–gasoline blend on NOx emission in SI engine
14
Effect of ethanol–gasoline blend on NOx emission in SI engine B.M. Masum n , H.H. Masjuki, M.A. Kalam, I.M. Rizwanul Fattah, S.M. Palash, M.J. Abedin Centre for Energy Sciences, Faculty of Engineering, University of Malaya, 50603 Kuala Lumpur, Malaysia article info Article history: Received 25 July 2012 Received in revised form 10 March 2013 Accepted 15 March 2013 Available online 16 April 2013 Keywords: Ethanol Nitrogen oxide SI engine Renewable energy Emission abstract The stricter worldwide emission legislation and growing demands for lower fuel consumption and anthropogenic CO 2 emission require significant efforts to improve combustion efficiency while satisfying the emission quality demands. Ethanol fuel combined with gasoline provides a particularly promising and, at the same time, a challenging approach. Ethanol is widely used as an alternative fuel or an effective additive of gasoline due to the advantage of its high octane number and its self-sustaining concept, which can be supplied regardless of the fossil fuel. As a result, vast study has been carried out to study its effects on engine performance and emission. The first part of this article discusses prospect of fuel ethanol as a gasoline substitute. Then it discusses comparative physicochemical properties of ethanol and gasoline. The slight differences in properties between ethanol and gasoline fuels are enough to create considerable change to combustion system as well as behaviors of SI engines. These effects lead to several complex and interacting mechanisms, which make it difficult to identify the fundamentals of how ethanol affects NOx emission. After that, general NOx forming mechanisms are discussed to create a fundamental basis for further discussion. Finally, the article discusses different fuel composition, engine parameter and engine modification effects on NOx formation as well as mathematical approach for NOx prediction using ethanol. & 2013 Elsevier Ltd. All rights reserved. Contents 1. Introduction ........................................................................................................ 210 2. Ethanol fuel as a gasoline substitute .................................................................................... 210 3. Comparison of physicochemical properties ............................................................................... 212 4. Formation of NOx ................................................................................................... 212 4.1. Thermal NOx ................................................................................................. 213 4.2. Prompt NOx .................................................................................................. 213 4.3. Intermediate N 2 O.............................................................................................. 213 4.4. Fuel NOx .................................................................................................... 213 5. Effect of ethanol–gasoline blend on NOx emission ......................................................................... 213 5.1. Effect of fuel composition ....................................................................................... 213 5.1.1. Effect of blend concentration ............................................................................. 213 5.1.2. Effect of hydrous ethanol ................................................................................ 215 5.2. Effect of engine parameters ..................................................................................... 215 5.2.1. Effect of compression ratio ............................................................................... 215 5.2.2. Effect of engine load .................................................................................... 216 5.2.3. Effect of equivalence ratio ................................................................................ 216 5.2.4. Effect of speed ......................................................................................... 216 5.2.5. Effect of cold-start ...................................................................................... 216 Contents lists available at SciVerse ScienceDirect journal homepage: www.elsevier.com/locate/rser Renewable and Sustainable Energy Reviews 1364-0321/$ - see front matter & 2013 Elsevier Ltd. All rights reserved. http://dx.doi.org/10.1016/j.rser.2013.03.046 n Correspondance to: Department of Mechanical Engineering, University of Malaya, 50603, Kuala Lumpur, Malaysia. Tel.: þ603 79674448; fax: þ603 79675317. E-mail addresses: [email protected], [email protected] (B.M. Masum). Renewable and Sustainable Energy Reviews 24 (2013) 209–222
Transcript of Effect of ethanol–gasoline blend on NOx emission in SI engine
Renewable and Sustainable Energy Reviews 24 (2013) 209–222
Contents lists available at SciVerse ScienceDirect
Renewable and Sustainable Energy Reviews
1364-03http://d
n Corr50603, K
E-mmasum0
journal homepage: www.elsevier.com/locate/rser
Effect of ethanol–gasoline blend on NOx emission in SI engine
B.M. Masum n, H.H. Masjuki, M.A. Kalam, I.M. Rizwanul Fattah,S.M. Palash, M.J. AbedinCentre for Energy Sciences, Faculty of Engineering, University of Malaya, 50603 Kuala Lumpur, Malaysia
a r t i c l e i n f o
Article history:Received 25 July 2012Received in revised form10 March 2013Accepted 15 March 2013Available online 16 April 2013
Keywords:EthanolNitrogen oxideSI engineRenewable energyEmission
21/$ - see front matter & 2013 Elsevier Ltd. Ax.doi.org/10.1016/j.rser.2013.03.046
espondance to: Department of Mechanical Enguala Lumpur, Malaysia. Tel.: þ603 79674448;ail addresses: [email protected],[email protected] (B.M. Masum).
a b s t r a c t
The stricter worldwide emission legislation and growing demands for lower fuel consumption andanthropogenic CO2 emission require significant efforts to improve combustion efficiency while satisfyingthe emission quality demands. Ethanol fuel combined with gasoline provides a particularly promisingand, at the same time, a challenging approach. Ethanol is widely used as an alternative fuel or an effectiveadditive of gasoline due to the advantage of its high octane number and its self-sustaining concept,which can be supplied regardless of the fossil fuel. As a result, vast study has been carried out to study itseffects on engine performance and emission.
The first part of this article discusses prospect of fuel ethanol as a gasoline substitute. Then itdiscusses comparative physicochemical properties of ethanol and gasoline. The slight differences inproperties between ethanol and gasoline fuels are enough to create considerable change to combustionsystem as well as behaviors of SI engines. These effects lead to several complex and interactingmechanisms, which make it difficult to identify the fundamentals of how ethanol affects NOx emission.After that, general NOx forming mechanisms are discussed to create a fundamental basis for furtherdiscussion. Finally, the article discusses different fuel composition, engine parameter and enginemodification effects on NOx formation as well as mathematical approach for NOx prediction usingethanol.
& 2013 Elsevier Ltd. All rights reserved.
Contents
1. Introduction . . . . . . . . . . . . . . . . . . . . . . . . . . . . . . . . . . . . . . . . . . . . . . . . . . . . . . . . . . . . . . . . . . . . . . . . . . . . . . . . . . . . . . . . . . . . . . . . . . . . . . . . 2102. Ethanol fuel as a gasoline substitute . . . . . . . . . . . . . . . . . . . . . . . . . . . . . . . . . . . . . . . . . . . . . . . . . . . . . . . . . . . . . . . . . . . . . . . . . . . . . . . . . . . . 2103. Comparison of physicochemical properties . . . . . . . . . . . . . . . . . . . . . . . . . . . . . . . . . . . . . . . . . . . . . . . . . . . . . . . . . . . . . . . . . . . . . . . . . . . . . . . 2124. Formation of NOx . . . . . . . . . . . . . . . . . . . . . . . . . . . . . . . . . . . . . . . . . . . . . . . . . . . . . . . . . . . . . . . . . . . . . . . . . . . . . . . . . . . . . . . . . . . . . . . . . . . 212
4.1. Thermal NOx . . . . . . . . . . . . . . . . . . . . . . . . . . . . . . . . . . . . . . . . . . . . . . . . . . . . . . . . . . . . . . . . . . . . . . . . . . . . . . . . . . . . . . . . . . . . . . . . . 2134.2. Prompt NOx . . . . . . . . . . . . . . . . . . . . . . . . . . . . . . . . . . . . . . . . . . . . . . . . . . . . . . . . . . . . . . . . . . . . . . . . . . . . . . . . . . . . . . . . . . . . . . . . . . 2134.3. Intermediate N2O. . . . . . . . . . . . . . . . . . . . . . . . . . . . . . . . . . . . . . . . . . . . . . . . . . . . . . . . . . . . . . . . . . . . . . . . . . . . . . . . . . . . . . . . . . . . . . 2134.4. Fuel NOx . . . . . . . . . . . . . . . . . . . . . . . . . . . . . . . . . . . . . . . . . . . . . . . . . . . . . . . . . . . . . . . . . . . . . . . . . . . . . . . . . . . . . . . . . . . . . . . . . . . . 213
5. Effect of ethanol–gasoline blend on NOx emission . . . . . . . . . . . . . . . . . . . . . . . . . . . . . . . . . . . . . . . . . . . . . . . . . . . . . . . . . . . . . . . . . . . . . . . . . 2135.1. Effect of fuel composition . . . . . . . . . . . . . . . . . . . . . . . . . . . . . . . . . . . . . . . . . . . . . . . . . . . . . . . . . . . . . . . . . . . . . . . . . . . . . . . . . . . . . . . 213
5.1.1. Effect of blend concentration . . . . . . . . . . . . . . . . . . . . . . . . . . . . . . . . . . . . . . . . . . . . . . . . . . . . . . . . . . . . . . . . . . . . . . . . . . . . . 2135.1.2. Effect of hydrous ethanol . . . . . . . . . . . . . . . . . . . . . . . . . . . . . . . . . . . . . . . . . . . . . . . . . . . . . . . . . . . . . . . . . . . . . . . . . . . . . . . . 215
5.2. Effect of engine parameters . . . . . . . . . . . . . . . . . . . . . . . . . . . . . . . . . . . . . . . . . . . . . . . . . . . . . . . . . . . . . . . . . . . . . . . . . . . . . . . . . . . . . 215
5.2.1. Effect of compression ratio . . . . . . . . . . . . . . . . . . . . . . . . . . . . . . . . . . . . . . . . . . . . . . . . . . . . . . . . . . . . . . . . . . . . . . . . . . . . . . . 2155.2.2. Effect of engine load . . . . . . . . . . . . . . . . . . . . . . . . . . . . . . . . . . . . . . . . . . . . . . . . . . . . . . . . . . . . . . . . . . . . . . . . . . . . . . . . . . . . 2165.2.3. Effect of equivalence ratio . . . . . . . . . . . . . . . . . . . . . . . . . . . . . . . . . . . . . . . . . . . . . . . . . . . . . . . . . . . . . . . . . . . . . . . . . . . . . . . . 2165.2.4. Effect of speed . . . . . . . . . . . . . . . . . . . . . . . . . . . . . . . . . . . . . . . . . . . . . . . . . . . . . . . . . . . . . . . . . . . . . . . . . . . . . . . . . . . . . . . . . 2165.2.5. Effect of cold-start . . . . . . . . . . . . . . . . . . . . . . . . . . . . . . . . . . . . . . . . . . . . . . . . . . . . . . . . . . . . . . . . . . . . . . . . . . . . . . . . . . . . . . 216ll rights reserved.
ineering, University of Malaya,fax: þ603 79675317.
B.M. Masum et al. / Renewable and Sustainable Energy Reviews 24 (2013) 209–222210
5.3. Engine modification. . . . . . . . . . . . . . . . . . . . . . . . . . . . . . . . . . . . . . . . . . . . . . . . . . . . . . . . . . . . . . . . . . . . . . . . . . . . . . . . . . . . . . . . . . . . 217
5.3.1. Application of thermal barrier coating . . . . . . . . . . . . . . . . . . . . . . . . . . . . . . . . . . . . . . . . . . . . . . . . . . . . . . . . . . . . . . . . . . . . . . 2175.3.2. Effect of separate aqueous ethanol injection . . . . . . . . . . . . . . . . . . . . . . . . . . . . . . . . . . . . . . . . . . . . . . . . . . . . . . . . . . . . . . . . . 2185.4. Effect of different vehicles. . . . . . . . . . . . . . . . . . . . . . . . . . . . . . . . . . . . . . . . . . . . . . . . . . . . . . . . . . . . . . . . . . . . . . . . . . . . . . . . . . . . . . . 2186. Prediction of NOx emission by Artificial Neural Networks . . . . . . . . . . . . . . . . . . . . . . . . . . . . . . . . . . . . . . . . . . . . . . . . . . . . . . . . . . . . . . . . . . . 2197. Conclusion . . . . . . . . . . . . . . . . . . . . . . . . . . . . . . . . . . . . . . . . . . . . . . . . . . . . . . . . . . . . . . . . . . . . . . . . . . . . . . . . . . . . . . . . . . . . . . . . . . . . . . . . . 219Acknowledgment . . . . . . . . . . . . . . . . . . . . . . . . . . . . . . . . . . . . . . . . . . . . . . . . . . . . . . . . . . . . . . . . . . . . . . . . . . . . . . . . . . . . . . . . . . . . . . . . . . . . . . . 220References . . . . . . . . . . . . . . . . . . . . . . . . . . . . . . . . . . . . . . . . . . . . . . . . . . . . . . . . . . . . . . . . . . . . . . . . . . . . . . . . . . . . . . . . . . . . . . . . . . . . . . . . . . . . . 220
1. Introduction
The consumption of energy has ever-increasing trend mainly dueto two reasons: (1) changes in lifestyles and (2) the significantgrowth of the population. Petroleum-based fossil fuels presentlyprovide the major portion of the energy supply; however, theirsources are limited on this Earth. In the twentieth century, theresearch emphasis was on the development of fossil crude oil, coal,and natural gas based refinery to exploit the cheaply available fossilfeedstock to meet the growing demand of the population [1]. In the21st century, the adverse effect of greenhouse gas emissions on theenvironment, together with declining petroleum reserves and futureenergy security, is pronounced well. The combustion of fossil fuels isa big contributor to carbon dioxide (CO2) emission, which is a directcontributor to global warming. Every year about 25 billion ton ofCO2 are generated worldwide by anthropogenic activities [2]. There-fore, the present research is focused on alternative energy sourcesfor sustainable development of the economy and society [1]. Fossilfuels still represent 80% of total energy supply whereas biofuelcontribute only 1% [3].
The main alternative fuels utilized so far are oxygenates(alcohol, ether etc.), vegetable oils and their esters, gaseous fuel(hydrogen, liquefied petroleum gas etc.), gas to liquids (GTL) andcoal derivatives. Ethanol has attracted attention worldwidebecause of its potential use as an alternative automotive fuel [4].Use of ethanol as a fuel is not a new concept. In 1826, SamuelMorey developed an engine that ran on ethanol [5]. The use ofethanol blended with diesel was a subject of research in the 1980s.At that time, it was shown that ethanol blends were technicallyacceptable as a fuel for existing engines. However, the relativelyhigh production cost of ethanol at that time hindered its regularuse and made it a backup fuel in cases of fuel shortages. However,the economics have become much more favorable for the produc-tion of ethanol and it is now able to compete with standardpetroleum-based fuel [6].
Ethanol is a green fuel because the growing sugarcane cropsfunction as a CO2 sink, thereby contributing to the reduction ofgreenhouse gases (GHG) [7]. Recently, ethanol has been used exten-sively as a fuel additive or an alternative fuel in spark ignition (SI)engines as well as in diesel engines as it is a high octane, clean-burning fuel [8,9]. Burning of ethanol in SI engines also reducesemissions of carbon monoxide (CO), hydrocarbon (HC), and so on, butthere are some inconsistencies in NOx emissions as shown by manyresearchers. The Environmental Protection Agency (EPA) listed NOx asone of the critical pollutants that can affect the respiratory system. Asthe use of ethanol has increased enormously, NOx emission couldbecome a significant barrier to its market expansion.
The objective of this report is to provide a thorough literaturereview on the current state of ethanol combustion in SI engines andto guide the continuing study of NOx emissions reduction techniquesusing ethanol. Previously many researchers worked with ethanolproduction [3,4,10–12] and its use in a gasoline engine [13–15]. Manyreview articles are also available on the effect NOx emission fordifferent biofuels [16–20]. This article exclusively focuses on the issue
of NOx emissions related to use of ethanol in gasoline engine. Thereare many published studies on ethanol use as an alternative fuel in SIengines, as will be summarized next, to explain the potential changein NOx emissions with ethanol fuels. However, there are considerableinconsistencies in the explanations, which make fundamental under-standing incomplete.
2. Ethanol fuel as a gasoline substitute
Ethanol (C2H5OH) is an ecological fuel, as it is obtained fromrenewable energy sources. It is a colorless, transparent, neutral,volatile, flammable, oxygenated liquid hydrocarbon, which has apungent odor and a sharp burning taste [4]. At present, however,blends of bioethanol and gasoline are more common in vehicleswith fuel injection engines. Bioethanol and ethanol is practicallythe same product. They have the same molecular and structuralformula, and are the same substance. In other words, bioethanol isjust plain ethanol, which is produced from sugar derived fromplants. Usually, it is produced from various feed stocks such assugar cane, sugar beet, sorghum, grain, switch grass, barley, hemp,kenaf, potatoes, sweet potatoes, cassava, sunflower, fruit, molasses,corn, stover, grain, wheat, straw, cotton, and other biomass, as wellas many types of cellulose wastes and harvests.
Generally, ethanol or bioethanol is more reactive than hydro-carbon fuels, such as gasoline [21]. It contains hydroxyl radicals asthe polar fraction and carbon chains as the non-polar fraction;hence it can be easily dissolved in both non-polar (e.g. gasoline)and polar (e.g. water) substances [21]. Because of the regenerativeand biodegradable characteristics of ethanol, it is widely usedas an alternative fuel at present. The use of gasoline containing3–10 vol% bioethanol is being promoted in many parts of theworld for last few years [22]. The use of pure ethanol requiressome modifications to SI engines; thus low concentration blendsof ethanol are usually used without any modification of the SIengine [23]. Tables 1 and 2 show the advantages and disadvan-tages of using ethanol over gasoline.
Worldwide ethanol production in terms of feedstock can becategorized into three major groups [23]:
1.
Ethanol from sucrose-containing biomass such as sugar cane,sugar beet, sweet sorghum and fruits.2.
Ethanol from starchy biomass such as corn, milo, wheat, rice,potato, cassava, sweet potatoes, and barley.3.
Ethanol from lignocellulosic biomass such as wood, straw, andgrasses.Ethanol produced from above-mentioned feedstocks is classi-fied into two groups [23,24]:
1.
First generation bioethanol that consists of both ethanol fromsucrose-containing biomass and ethanol from starchy biomass.2.
Second generation bioethanol or ethanol from lignocellulosicbiomass.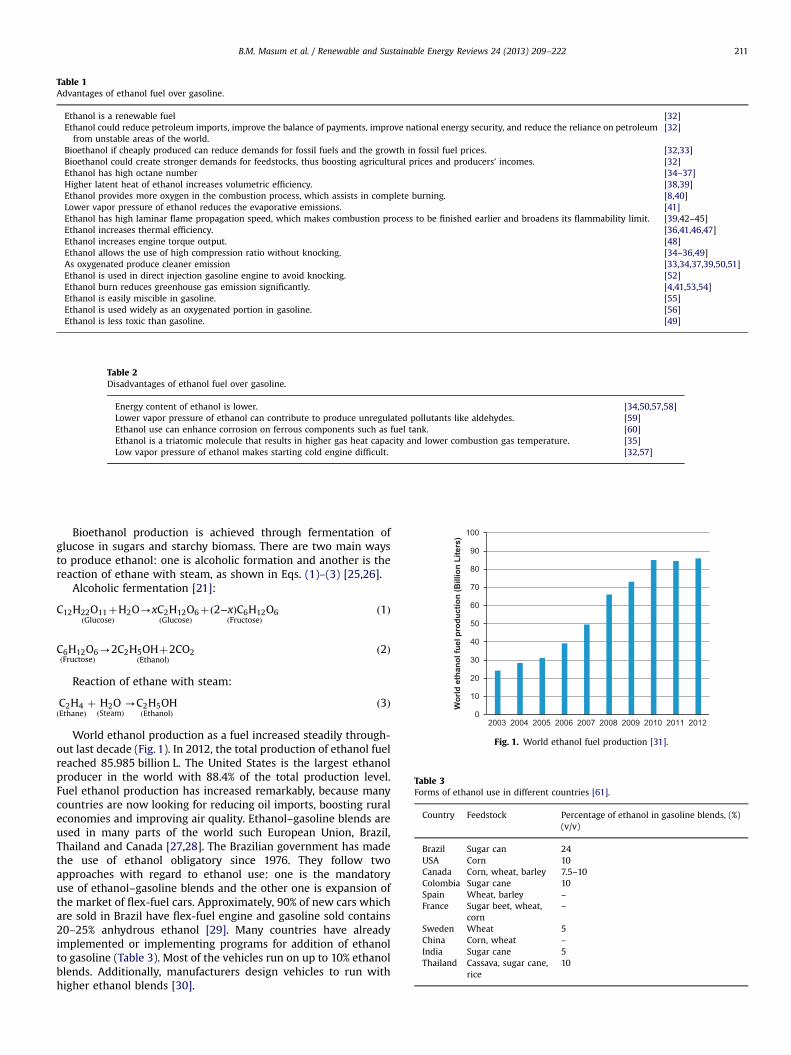
0
10
20
30
40
50
60
70
80
90
100
2003 2004 2005 2006 2007 2008 2009 2010 2011 2012
Wor
ld e
than
ol fu
el p
rodu
ctio
n (B
illio
n Li
ters
)
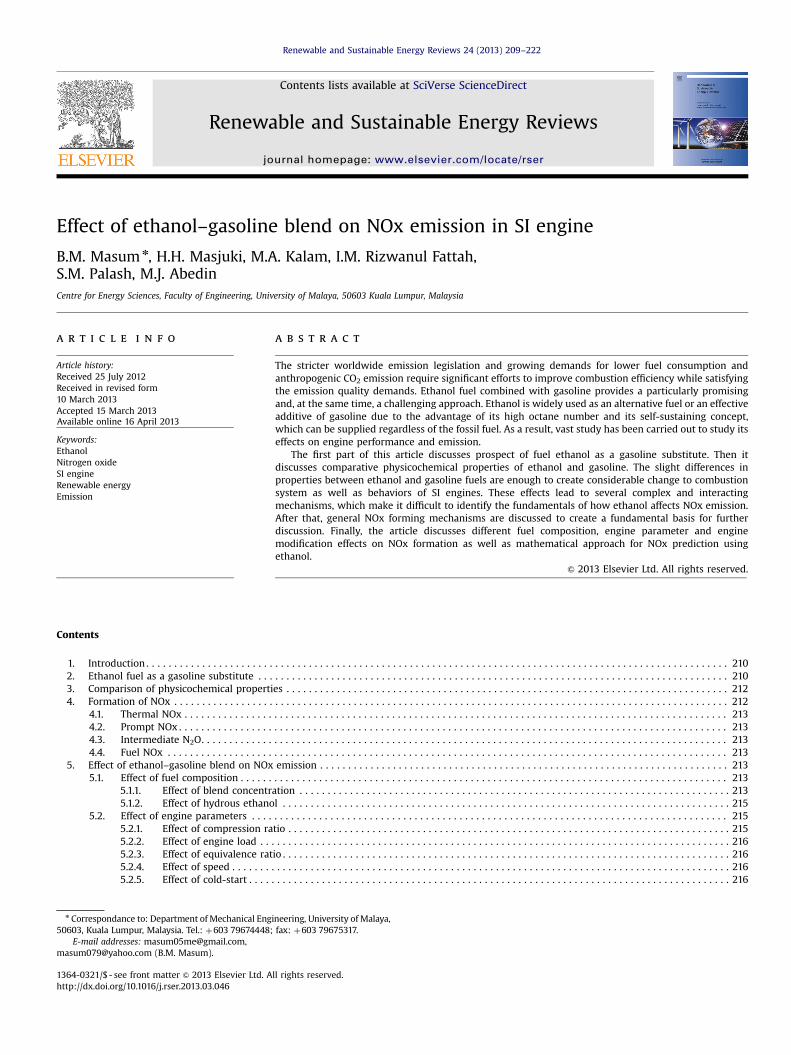
Fig. 1. World ethanol fuel production [31].
Table 2Disadvantages of ethanol fuel over gasoline.
Energy content of ethanol is lower. [34,50,57,58]Lower vapor pressure of ethanol can contribute to produce unregulated pollutants like aldehydes. [59]Ethanol use can enhance corrosion on ferrous components such as fuel tank. [60]Ethanol is a triatomic molecule that results in higher gas heat capacity and lower combustion gas temperature. [35]Low vapor pressure of ethanol makes starting cold engine difficult. [32,57]
Table 1Advantages of ethanol fuel over gasoline.
Ethanol is a renewable fuel [32]Ethanol could reduce petroleum imports, improve the balance of payments, improve national energy security, and reduce the reliance on petroleumfrom unstable areas of the world.
[32]
Bioethanol if cheaply produced can reduce demands for fossil fuels and the growth in fossil fuel prices. [32,33]Bioethanol could create stronger demands for feedstocks, thus boosting agricultural prices and producers’ incomes. [32]Ethanol has high octane number [34–37]Higher latent heat of ethanol increases volumetric efficiency. [38,39]Ethanol provides more oxygen in the combustion process, which assists in complete burning. [8,40]Lower vapor pressure of ethanol reduces the evaporative emissions. [41]Ethanol has high laminar flame propagation speed, which makes combustion process to be finished earlier and broadens its flammability limit. [39,42–45]Ethanol increases thermal efficiency. [36,41,46,47]Ethanol increases engine torque output. [48]Ethanol allows the use of high compression ratio without knocking. [34–36,49]As oxygenated produce cleaner emission [33,34,37,39,50,51]Ethanol is used in direct injection gasoline engine to avoid knocking. [52]Ethanol burn reduces greenhouse gas emission significantly. [4,41,53,54]Ethanol is easily miscible in gasoline. [55]Ethanol is used widely as an oxygenated portion in gasoline. [56]Ethanol is less toxic than gasoline. [49]
Table 3Forms of ethanol use in different countries [61].
Country Feedstock Percentage of ethanol in gasoline blends, (%)(v/v)
Brazil Sugar can 24USA Corn 10Canada Corn, wheat, barley 7.5–10Colombia Sugar cane 10Spain Wheat, barley –
France Sugar beet, wheat,corn
–
Sweden Wheat 5China Corn, wheat –
India Sugar cane 5Thailand Cassava, sugar cane,
rice10
B.M. Masum et al. / Renewable and Sustainable Energy Reviews 24 (2013) 209–222 211
Bioethanol production is achieved through fermentation ofglucose in sugars and starchy biomass. There are two main waysto produce ethanol: one is alcoholic formation and another is thereaction of ethane with steam, as shown in Eqs. (1)–(3) [25,26].
Alcoholic fermentation [21]:
C12H22O11þH2OðGlucoseÞ
-xC2H12O6ðGlucoseÞ
þð2−xÞC6H12O6ðFructoseÞ
ð1Þ
C6H12O6ðFructoseÞ
-2C2H5OHþ2CO2ðEthanolÞ
ð2Þ
Reaction of ethane with steam:
C2H4ðEthaneÞ
þ H2OðSteamÞ
-C2H5OHðEthanolÞ
ð3Þ
World ethanol production as a fuel increased steadily through-out last decade (Fig. 1). In 2012, the total production of ethanol fuelreached 85.985 billion L. The United States is the largest ethanolproducer in the world with 88.4% of the total production level.Fuel ethanol production has increased remarkably, because manycountries are now looking for reducing oil imports, boosting ruraleconomies and improving air quality. Ethanol–gasoline blends areused in many parts of the world such European Union, Brazil,Thailand and Canada [27,28]. The Brazilian government has madethe use of ethanol obligatory since 1976. They follow twoapproaches with regard to ethanol use: one is the mandatoryuse of ethanol–gasoline blends and the other one is expansion ofthe market of flex-fuel cars. Approximately, 90% of new cars whichare sold in Brazil have flex-fuel engine and gasoline sold contains20–25% anhydrous ethanol [29]. Many countries have alreadyimplemented or implementing programs for addition of ethanolto gasoline (Table 3). Most of the vehicles run on up to 10% ethanolblends. Additionally, manufacturers design vehicles to run withhigher ethanol blends [30].
B.M. Masum et al. / Renewable and Sustainable Energy Reviews 24 (2013) 209–222212
3. Comparison of physicochemical properties
The physical and chemical properties indicate the quality offuel to be combusted in an engine. Engine combustion quality,performance and emission characteristics are dependent on them.Some of the properties related to combustion of gasoline as well asethanol are compared in Table 4. The comparative features ofethanol and gasoline are presented below:
1.
TabCom
P
CMCOHHOSDSKRRMCE
HLoLHLaS
FrBFlAVLaD
WAVSCC
Heating value of ethanol is approximately 1/3 times lower thanthat of gasoline. Thus, to achieve same engine power outputmore amount fuel is required for ethanol.
2.
An oxygen content of 34.7 wt% in ethanol promotes combus-tion efficiency as well as high combustion temperature.3.
Heat of vaporization of ethanol is higher than gasoline. Thus,charge requires more heat to evaporate which is taken up fromin-cylinder environment. This in turn increases the volumetricefficiency of the engine.4.
Ethanol has slightly lower density than gasoline, thusvolumetric-operating fuel pumps inject lower mass of alcoholthan gasoline fuel.5.
Ethanol has no mono-aromatic or poly-aromatic hydrocarbons. 6. Lower C/H atom ratio of ethanol reduces the adiabatic flametemperature.
le 4parison of gasoline and ethanol fuel properties [8,49,50,56,62–66].
roperty Unit
hemical formula –
olecular weight kg kmol−1
-fraction mass %-fraction mass %-fraction mass %/C atom ratio/C atom ratiopecific gravity –
ensity (at 15 1C) kg m−3
toichiometric air–fuel ratio w/winematic viscosity mm2/seid vapor pressure at 37.8 1C kPaesearch octane number –
otor octane number –
etane number –
nthalpy of formation(a)Liquid kJmol−1
(b)Gas kJmol−1
igher Heating Value MJ kg−1
wer Heating Value MJ kg−1
V at stoichiometric mixture MJ kg−1
tent of vaporization kJ kg−1
pecific heat(a)Liquid kJ/kgK(b)Vapor kJ/kgKeezing Point 1Coiling Point 1Cash point 1Cuto ignition temperature 1Capor Flammability Limits vol%minar flame speed at 100 kPa, 325 K cm/sistillation(a)Initial boiling point %(b)10 %(c)50 %(d)90 %(e)End boiling point %ater solubility %romatics volume %apor toxicity –
moke character –
onductivity –
olor –
7.
Ethanol has higher octane number (ON) than gasoline. Thehigher the octane number, the more compression the fuel canwithstand before detonating. Premature fuel ignition candamage engine, which is a common phenomenon for lowerON fuel.8.
Ethanol has a higher laminar flame propagation speed thangasoline, which makes combustion process finish earlier andthus improving the engine thermal efficiency.9.
Using ethanol with gasoline can reduce costs of petroleumrefineries as they can produce low-grade gasoline with lower ON.4. Formation of NOx
NOx is a mixture of such compounds: nitric oxide (NO),nitrogen dioxide (NO2), nitrous oxide (N2O), dinitrogen trioxide(N2O3), dinitrogen tetroxide (N2O4), and dinitrogen pentoxide(N2O5) [67]. Among them, nitric oxide (NO) and nitrogen dioxide(NO2) are most prominent [68]. The other five nitrogen oxides areknown to exist, but in very small quantities. Nitric oxide is acolorless, odorless gas. Its ambient concentration is usually far lessthan 0.5 ppm. Nitrogen dioxide is a corrosive, toxic, and reddish-brown gas. It is quite visible in sufficient amounts [69,70].Oxidation of nitrogen molecules at high temperature inside the
Gasoline Ethanol
C5–C12 C2H5OH114.15 46.0787.4 52.20 34.712.6 13.01.795 30 0.50.7–0.78 0.794750–765 785–809.914.2–15.1 8.970.5–0.6 1.2–1.553–60 1791–100 108.61–11082–92 928 5–20
−259.28 −224.1−277 −234.647.3 29.744.0 26.92.77 2.70380–400 900–920
2.4 1.72.5 1.93−40 −11427–225 78−45 to −13 12–20257 4250.6–8 3.5–15~33 ~39
45 7854 7896 78168 79207 790 10027.6 0Moderate irritant Toxic in large dosesBlack Slight to noneNone YesColorless to light amber glass Colorless
B.M. Masum et al. / Renewable and Sustainable Energy Reviews 24 (2013) 209–222 213
cylinder is the cause of NOx formation as a byproduct [71]. Thepathways of formation of oxides of nitrogen such as Thermal,Prompt, Fuel NOx and N2O intermediate mechanisms arediscussed here.
4.1. Thermal NOx
During combustion, at temperatures above 1800 K, atmo-spheric nitrogen reacts with oxygen through a series of chemicalsteps known as the Zeldovich mechanism [72]. This mechanism ofthermal NOx formation is believed to be the predominant con-tributor of total NOx [73]. The Eqs. (4)–(6) are the basic kineticequations for thermal NOx formation.
OþN2↔NOþN (4)
NþO2↔NOþO (5)
NþOH↔NOþH (6)
The first step determines the NOx formation as it requires hightemperatures to proceed due to its high activation energy (314 KJ/mole). NO production by thermal mechanism proceeds at a slowerrate than the oxidation of hydrocarbons. The NO formation ratecan be written using Eq. (7) [74].
d½NO�dt
¼ k e−K=T N2½ �½O2�1=2t−1=2 ð7Þ
Here k and K is reaction constants, t is time and T is absolutetemperature [75]. Eq. (7) represents a strong dependence of NOformation rate on temperature. High temperatures, high oxygenconcentrations, and longer residence time results in high NOformation rate.
4.2. Prompt NOx
The presence of a second mechanism leading to NOx formationwas first identified by Fenimore [76] and was termed “promptNOx”. During combustion of hydrocarbon fuels, some NOx isquickly formed before formation of thermal NOx, in the laminarpremixed flame zone, which is known as prompt NOx [77]. Thereis a good evidence that prompt NOx can be formed in a significantquantity in some combustion environments; such as in low-temperature, fuel rich conditions and where residence time isshort. Prompt NOx is most prevalent in rich flames. The actualformation involves a complex series of reactions and manypossible intermediate species. Generally, in low temperature(below 750 1C) and fuel rich condition, nitrogen molecules reactwith hydrocarbon radicals to form amines or cyano compound.After that, these nitrogen-containing fragments react with atmo-spheric nitrogen to form NO. The prompt NOx is generally formedthrough the following reactions (8)–(12).
CHþN2↔HCNþN (8)
CH2þN2↔HCNþNH (9)
NþO2↔NOþO (10)
HCNþOH↔CNþH2O (11)
CNþO2↔NOþCO (12)
Here, CH and CH2 are the significant contributors to formprompt NOx (Eqs. (8) and (9)). Prompt NOx is more sensitive tofuel chemistry than thermal NOx because of the dependence onhydrocarbon fragments. The amount of HCN increases withincreasing the concentration of hydrocarbon radicals, whichenhances with increasing equivalence ratio. Prompt NOx forma-tion increases with an increasing equivalence ratio and then
reaches a peak and decreases because of a shortage of oxygen.Compared to thermal NOx formation, the contribution of promptNOx is less in entire combustion system. However, in combustionmodeling studies, without considering prompt NOx mechanism,total NOx is underestimated [78].
4.3. Intermediate N2O
The NOx formation by this pathway is another essentialmechanism in a combustion process under high pressure and leanair–fuel ratio or low temperature condition compared to FenimoreNO, and a minor contribution to the formation of NOx related tothe thermal NO mechanism [79]. Three steps of this NOx forma-tion mechanism are shown in Eqs. (13)–(15).
OþN2þM↔N2OþM (13)
HþN2O↔NOþNH (14)
OþN2O↔NOþNO (15)
Here, M is a general third body that is required to complete thisreaction [73]. Reaction rates strongly depend on O, OH and Hradial concentrations, which makes the mechanism favored foroxygen-rich conditions or lean condition [80].
4.4. Fuel NOx
When nitrogen-containing fuel compound are oxidized to NOxduring combustion process, fuel NOx is formed [81]. Fuel NOxincrease with the amount of nitrogen content of the fuel. More-over, it is co-related with oxidation of the hydrocarbon and itschemical kinetics. However, the nitrogen level in the gasoline orethanol fuel is extremely low; hence, fuel NOx formation isnegligible.
5. Effect of ethanol–gasoline blend on NOx emission
Many studies have been done on SI engines as well as flex-fuelvehicles using either pure ethanol or ethanol–gasoline blends as afuel. Section 3 shows some dissimilarity in properties betweenethanol and gasoline. These properties may affect in fuel con-sumption, combustion speed, combustion temperature, mass burnfraction etc. as well as NOx emission. Many literatures [56,82–87]have shown increase in NOx emission for ethanol. Opposite trendwas also observed by many researchers [29,88–90] as well. Fewliteratures [91,92] also found irregularity in NOx emission withethanol. In this section, NOx emission causes will be discussed forethanol–gasoline blends, emphasizing on different fuel blends,different engine parameters and engine modifications as well asdifferent vehicle conditions.
5.1. Effect of fuel composition
5.1.1. Effect of blend concentrationResearchers have tested ethanol–gasoline blends from 5 vol%
ethanol to as high as 100 vol% i.e. pure ethanol in SI engines. Thephysicochemical properties of different ethanol–gasoline blendsare summarized in Table 5. These results presented have beenobtained by different test methods as done by the researchers.From Table 5 it can be seen that the addition of ethanol to gasolinesimultaneously increases the octane number, density, and latentheat of vaporization and decreases the heating value of theethanol–gasoline blend. Many investigations have been carriedout to identify the effect of these changes on emission character-istics especially on NOx emission due to variation in ethanolcontents.

Table 5Properties of different ethanol–gasoline blended fuels [36,40,50,56,62,82,93–96].
Property E0 E5 E10 E15 E20 E25 E30 E40 E50 E60 E85
Density (kg/m3) 757.5 759.1 760.8 776 764.5 775 768.2 780.6 751 789.5RVP (kPa) 53.7 59.3 59.6 58.8 58.3 56.8 63 45.3 57.4 37.85RON 95.4 96.7 98.1 98.5 100.7 100 102.4 90.9 101.2 92.7 101.7Sulfur (wt%) 0.0061 0.0059 0.0055 0.0063 0.0049 0.0246 0.0045 0.026 o0.001 0.032 o0.001Distillation temperature (1C)
(a) Initial boiling point 35.5–38.8 36.5 37.8 37.9 36.7–38.6 37.2–39.5 39.6 328.3(b) 10 vol% 54.5–56.1 49.7 50.8–52.9 51.7 51.3–52.8 58.1 52.1–54.8 53.4 73.9(c) 50 vol% 94.4–109.6 88 71.1–95.8 72.6 70.3–73.8 71.7 72.4–74.6 72.5 521 78.0(d) 90 vol% 167.3–206.3 167.7 157–166.4 165.3 165.2–163 154.6–159.3 152.7 547 78.7(e) End point 197.0 202.5 197.5–208.4 198.1 198.6–203.6 177.9 198.3–205.1 204.1 79.9
Heating value (MJ/kg) 42.58–42.7 40.55–41.78 39.79–41 41.61 38.98–39.5 38.2 36.32–37.8 33.34–36.2 33.34 26.74 29.2
RVP¼Reid vapor pressure, RON¼Research Octane Number.
150
200
250
300
350
400
0
500
1000
1500
2000
2500
5 10 20 40 60 80
NO
x (P
PM)
% of ethanol blend
NOxHC
HC
(PP
M)
Fig. 2. Correlation of NOx and HC emission with ethanol percentage at 2000 rpm[97].
B.M. Masum et al. / Renewable and Sustainable Energy Reviews 24 (2013) 209–222214
Many literatures have showed that, NOx emission decreaseswith the increase in content of ethanol. Turner et al. [66]investigated NOx emission in a direct injection spark ignition(DISI) engine on a 1500 rpm and 3.4 bar indicated mean effectivepressure (IMEP) with ethanol–gasoline blends. When the ethanolportion increased up to 85% in the blend, NOx emission wasreduced. They attributed this reduction to reduction in flametemperature, which was corroborated by a reduction in exhausttemperature. The NOx level then increased slightly for pureethanol because combustion was advanced, leading to a higherin-cylinder pressure and temperature compared to those of 85%ethanol. Here the maximum in-cylinder pressure was reducedwith an ethanol blend of up to 85% and then increased for pureethanol. Bielaczyc et al. [62] also found decreased NOx for 10–85%ethanol blends. They evaluated the possibility of using gasoline–ethanol blends in a modern Euro 4 vehicle without substantialengine modification. NOx emission from the engine was found togive a perfect linear fit with the ethanol content of the blend overthe range 10–85%. Oh et al. [65] studied a DISI engine with 25%,50% and 85% ethanol–gasoline blends. They found that HC emis-sions increased and NOx emissions decreased with increase ofethanol percentage in blend due to the decreased peak in-cylindertemperature resulting from the combustion retardation.
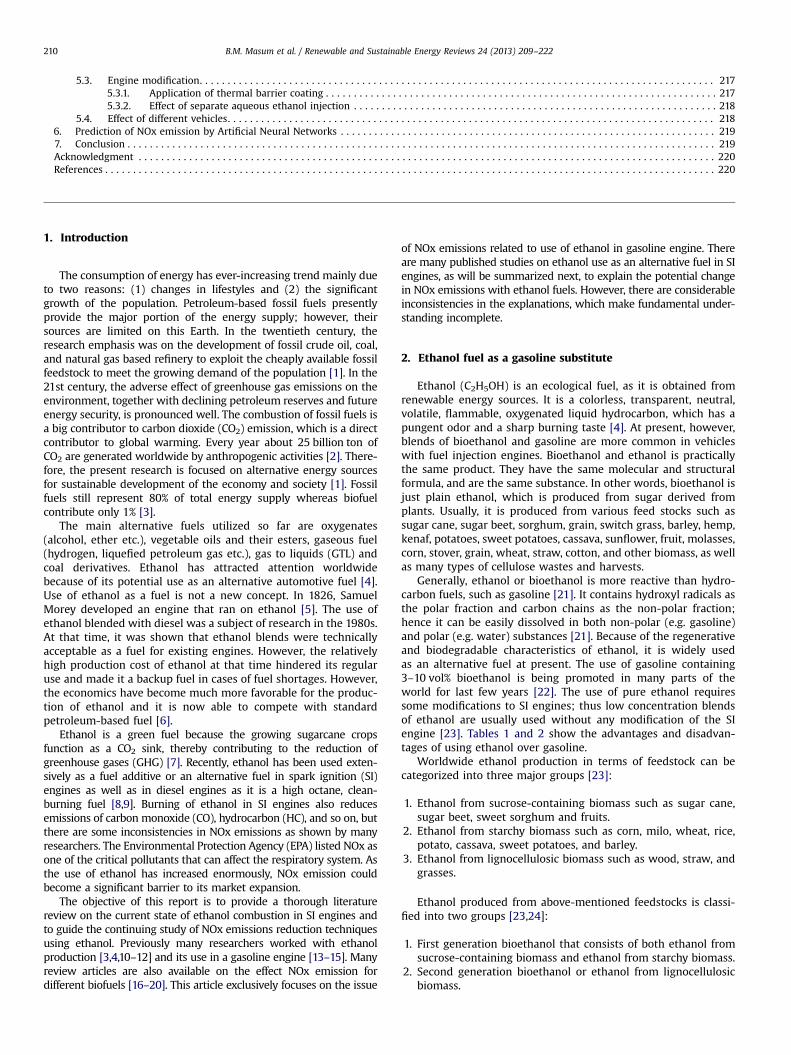
Ioannis et al. [97] investigated NOx emission with differentblends at 2000 rpm in wide open throttle (WOT) condition. FromFig. 2, it is seen that, NOx emission decreased with increasingethanol concentration. Because of the higher heat of vaporizationof ethanol compared to gasoline, the combustion temperature ofthe blend decreases. In case of HC emission, up to certain conc. ofethanol, HC emission is reduced as the oxygen content of ethanolcauses the reaction to move towards complete combustion. How-ever, a greater concentration of ethanol in the gasoline reduces theflame temperature, which increases HC emission. It is seen thatE40 is a good option for reduced HC emission and E80 is suitablefor lower NOx emission.
In a four-cylinder, multi-port injection system engine, Canakciet al. [50] found that NOx emission decreased as the ethanolpercentage of the blend increased. With the use of alcohol ingasoline, the combustion temperature decreased due to the highlatent heat and lower heating value, which led to the reduction ofNOx emission. When comparing the exhaust emission of gasolinewith pure ethanol, Balki et al. [98] found lower NOx emission forethanol than gasoline. They attributed this reduction to the higherheat of vaporization of ethanol, which reduces the combustiontemperature. However oxygenated fuel ethanol enhances combus-tion efficiency, which results in lower CO2 emission and higher HCand CO emission for ethanol than gasoline. Using a lower percen-tage of ethanol, Yao et al. [99] found similar results. They ascribedthis to lower flame temperature because of the higher latent heatof evaporation of ethanol.
Considering a DISI engine, Storey et al. [100] analyzed the effectof ethanol addition and concluded that NOx emission decreasedwith increased ethanol concentration because of the lower energydensity of the ethanol blend. Lin et al. [101] experimented on asmall engine generator to observe the effect of ethanol–gasolineblend on exhaust emission and efficiency. Ethanol–gasoline blendled to a significant reduction in NOx emissions by approximately35%, 86% and 77% on average with E3, E6, and E9 fuels respectively.The best results were obtained with E6 fuel in term of exhaustemissions and E9 fuel for engine performance.
Wu et al. [63] explained that NOx emission decreased withincreases in the H/C atom ratio of fuel. From Table 4, it is seen thatH/C atom ratio is higher for ethanol than for gasoline. In hisexperimental results, NOx emission was lower for ethanol than forgasoline. Broustail et al. [102] found a slight reduction in NOxusing ethanol with gasoline than compared to pure gasoline.
Using a motorcycle engine Chen et al. [103] investigated theeffect on emission of ethanol–gasoline blends (E3, E5, E10, E15,E20, E25 and E30). With an increase in the ethanol concentration,the particle diameter of the accumulation mode becomes smaller.The aerosol number concentration decreases with increases inethanol concentration which causes combustion to become com-plete. For this reason, CO and NOx emissions decreased withincreases in ethanol concentration. The emission reduction ratewas high in low ethanol concentration blend (oE15) compared tohigh ethanol concentration blend (4E20). Using E3 fuel, Yanget al. [104] also found a 5.22% increase in NOx compared togasoline.
In contrast, some researchers have found increased NOx emis-sion. Using a single cylinder SI engine, Schifter et al. [105]investigated the effect of using gasoline–ethanol mid-level blends(0–20% ethanol) on engine performance and exhausts emissions. Itis seen that NOx emission increased with the addition of ethanolto gasoline compared to gasoline. With the addition of ethanol,NOx emission is higher for a higher heat release of ethanol
B.M. Masum et al. / Renewable and Sustainable Energy Reviews 24 (2013) 209–222 215
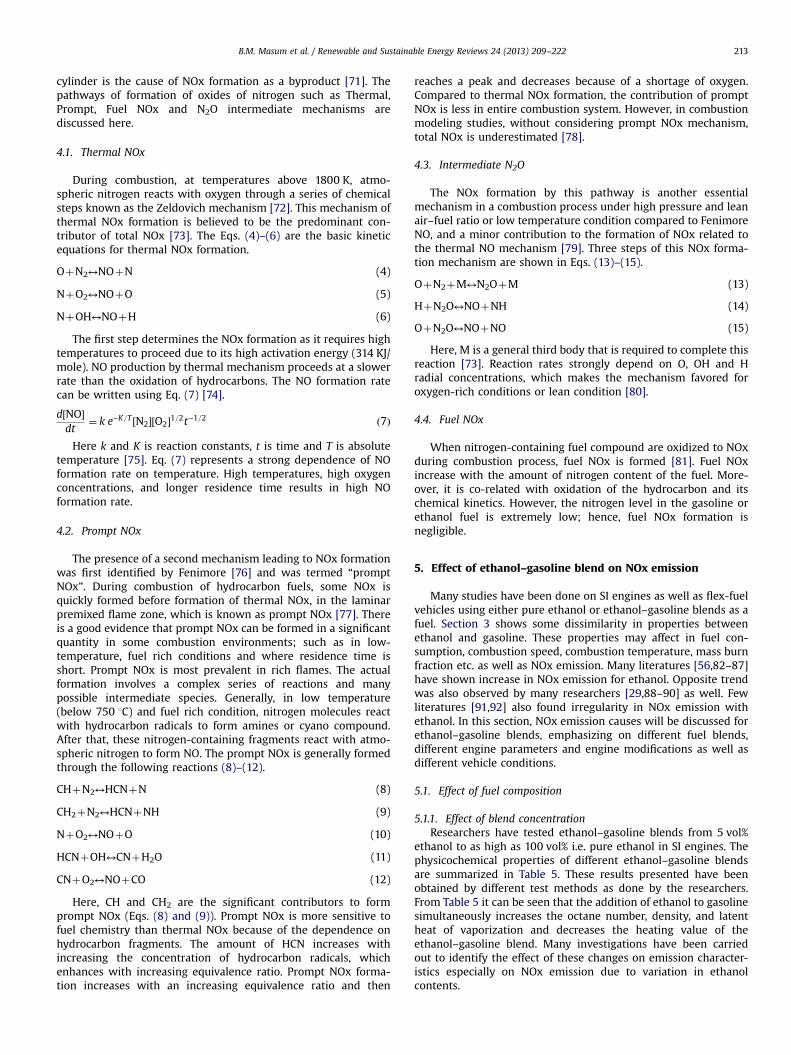
compared to gasoline. However, HC emission increased for shorterburn durations with ethanol addition in blend compared to puregasoline. The performance and the pollutant emissions of a four-stroke SI engine operating on ethanol–gasoline blends of 0%, 5%,10%, 15% and 20% were investigated by Najafi et al. [82]. They alsofound a higher NOx concentration when the ethanol percentageincreased, as shown in Fig. 3. Another significant reason for thisincrease is that the oxygen content in the ethanol blended fuelsincreased the oxygen-to-fuel ratio in the fuel-rich regions. Themost significant parameter affecting NOx concentration is therelative air–fuel ratio. The actual air–fuel ratio approaches tostoichiometric as the ethanol content of the blended fuelincreases, and consequently combustion becomes complete. Thiscomplete combustion increases the in-cylinder temperature aswell as NOx emission while the HC emission decreases. With ahigher oxygen concentration in ethanol, Keskin and Guru [106]also found higher NOx emission with the addition of ethanol.
Zhuang et al. [35] varied the ethanol/gasoline energy ratio from0% to 60.1%. NOx emission increased with the addition of up to24.3% ethanol to gasoline after which it decreased with increasingethanol percentage. With regard to increasing NOx, they reportedthat, ethanol improved the combustion inside the cylinder result-ing in an increased in-cylinder temperature. In the case of reducedNOx they explained that a higher percentage of ethanol in gasolinereduces the in-cylinder temperature. They attributed this reduc-tion to two factors. One is the high latent heat of vaporization ofthe ethanol fuel, which decreases the in-cylinder temperaturewhen it vaporizes. The other factor is that there are more triatomicmolecules in the combustion products of ethanol fuel than inthose of the gasoline fuel. The more triatomic molecules areproduced, the higher the gas heat capacity and the lower thecombustion gas temperature will be. However the low in-cylindertemperature can also lead to an increment in the unburnedcombustion product.
5.1.2. Effect of hydrous ethanolThe water absorbs heat and lowers the pressure as the charge is
compressed reducing the compression stroke work. Additionally,during the combustion itself, water absorbs heat as it vaporizesreducing the peak temperatures and then reducing NOx emissions.This peak temperature reduction diminishes the heat flux to thecylinder wall [95]. As a result of the reduced intake air temperaturesand the effects on the combustion process itself, fuel blends ofgasoline with hydrated ethanol present slightly lower exhaust gastemperatures. As distillation of hydrous ethanol to get anhydrousethanol is costly, there is scope for hydrous ethanol. Also, fewresearches have dealt with hydrous ethanol so far [14,21,107–111].
Schifter et al. [95] compared mid-level (0–40% volume water)hydrous ethanol–gasoline blend with anhydrous gasoline blend.They found 2% lower NOx emission for hydrous ethanol–gasolineblends than for anhydrous ethanol–gasoline blend. Water in thehydrated ethanol decreases the temperature, combustion speed,
40
75
110
145
180
215
200
600
1000
1400
1800
2200
0 5 10 15 20
NO
x (P
PM)
% of ethanol in blend
NOxHC
HC
(PPM
)
Fig. 3. Correlation of NOx and HC with the percentage of ethanol at 3500 rpm [82].
and peak pressure compared to the anhydrous ethanol, thereforeimproving the NOx emission, especially for 30% and 40% ethanolcontents. Water slows the combustion process but keeps thequantity of energy produced per cycle constant, the amount ofwork obtained is therefore the same and the same amount of heatis released, but more efficiently. Kyriakides et al. [112] also getlower NOx for 40% hydrous ethanol blend compared to 40%anhydrous ethanol. They explained, water content of hydrousethanol lowered the peak temperature and slowed the combustionrate that resulted lowers NOx emission.
Costa and Sodre [21] compared the performance and emissionsof E22 with hydrous ethanol (6.8% water content in ethanol). TheNOx emission of hydrous ethanol was more than those of E22. Forhigher NOx of hydrous ethanol, they explained, a faster flamespeed of hydrous ethanol favors the production of higher peakpressure and, therefore a higher peak temperature in the combus-tion chamber.
Considering a small SI engine, Munsen et al. [111] studied theeffect of hydrous ethanol (up to 40% water in ethanol) onperformance and emission. The addition of 20–40% water toethanol resulted in incomplete combustion, which increased COand HC emission and reduced NOx emission. They determined thecombustion temperature by measuring the spark plug tempera-ture. The spark plug temperature was found to decrease withincreases in the water content in ethanol. The lower combustiontemperatures of hydrous ethanol affect the thermal NOxformation.
5.2. Effect of engine parameters
5.2.1. Effect of compression ratioA high compression ratio (CR) is desirable because it allows an
engine to extract more energy from a given mass of air–fuelmixture due to its higher thermal efficiency. Higher CRs permit thesame combustion temperature to be reached with less fuel whilegiving a longer expansion cycle. The detonation increases, when alower octane number fuel is used a high compression ratio engine[93]. The octane number of ethanol is 108.6 (mentioned inTable 4), which is higher than that of gasoline. The high octanenumber offers a high compression ratio without knocking andimproves the knock tolerance. It was also found that a high CR canincrease the efficiency of ethanol fuel blends, and as a result, thefuel economy penalty associated with the lower energy content ofE85 can be reduced by about 20% [113]. High combustion tem-peratures lead to higher NOx emissions, and thus forced inductioncan give higher NOx fractions. Especially at high engine load, NOxemission increase with increases in CR. The relatively high burningrate of the overall rich mixture combustion and a high-temperature environment contribute to the increase in the NOxemissions with increasing CR at high engine loads [114].
To improve engine power, Al-Baghdadi [96] used the highuseful compression ratio (HUCR), which is a variable compressionratio that is directly proportional to the ethanol percentage in theblend. The compression ratio varies from 8 to 9.25 as the ethanolpercentage increases from 0% to 30%. The NOx emission decreasedwith increases in ethanol although the CR was increased. It is alsoobserved that thermal efficiency, power, HC, and CO emissionswere better for ethanol with HUCR than for gasoline with constantCR 8:1. Celik et al.[34] increased the compression ratio from 6:1 to10:1 by adding 50% ethanol to gasoline. When running with E50 ata high compression ratio (10:1), NOx decreases by 19% comparedto the case of E0 fuel at a compression ratio of 6:1. NOx emission isreduced here owing to the fact that the heating value of ethanol islower than that of gasoline. Koc et al. [38] used 0%, 50% and 85%ethanol with gasoline on compression ratios of 10:1 and 11:1. NOxemission decreased with the increase of ethanol. NOx emission of
B.M. Masum et al. / Renewable and Sustainable Energy Reviews 24 (2013) 209–222216
gasoline at CR 10:1 is also higher than those of ethanol–gasolineblend at a CR of 11:1. The high latent heat of vaporization ofethanol lowers the flame temperature, which results in lower NOxemissions. However, the NOx emission may change depending onthe percentage of ethanol in the blend and operating conditions.The oxygen concentration and combustion temperature and com-bustion duration are the main parameters affecting the NOxemissions. However, for the same blend, NOx was higher for ahigher CR.
5.2.2. Effect of engine loadEngine load plays a very important role in NOx formation. More
fuel or a richer mixture is needed to increase the engine load,which results in a higher in-cylinder temperature as well as higherNOx formation. The flame speed of fuel is an important factor forcomplete combustion in rich-mixture conditions as well as highengine load.
Using a 1.4 L flex-fuel engine, Melo et al. [108] tested 0–100%hydrous ethanol with gasoline at two different loads. At a low load(60 Nm), NOx emission decreased with ethanol addition. But at thesame speed with a higher load (105 Nm), NOx increased with theaddition of ethanol. They explained that the higher flame speed ofethanol compared to gasoline was the cause of the NOx emissionincrease when using ethanol at high load. A higher flame speedassists in complete combustion. It is also seen that the CO emissionreduction with the addition of ethanol at high loads is higher thanthat at low loads. At a high load, Keskin and Guru [106] also foundhigher NOx emission for adding ethanol. They did experimentwith 0%, 4%, 8%, 12%, 16%, and 20% ethanol in gasoline at differentloads (800, 1600, 2400 kW). At lower load conditions, NOx emis-sions were the same for all blends. But at higher loads, NOxemissions were higher for ethanol blended fuel.
Gomes et al. [115] focused on the operation of ethanol blendsup to E100 at high loads of up to 30 bar IMEP. At comparativelylower loads, NOx emissions were lower for high ethanol contentblends. They explained that ethanol lowered the peak temperatureslightly, which reduces NOx at lower loads. However, at compara-tively higher loads, NOx emissions were the same for all of theblends as high flame speed of ethanol fuel results in similar peaktemperatures. No significant change in NOx emissions wasobserved at different engine loads (3–161 Nm torque) by Panget al. [9], when they compared gasoline and 10% ethanol blendedgasoline. However, for lower heating values, fuel consumption wasgreater for ethanol blended fuel.
5.2.3. Effect of equivalence ratioThe stoichiometric air–fuel-ratio of gasoline is 1.6 times higher
than that of ethanol (as in Table 4). Since at fixed throttle openingand a fixed engine speed, the amount of air intake is a constant; toobtain the same λ, more volume flow rate of ethanol–gasolineblend is required than base gasoline which produces the leaningeffect. Leaning of fuel/air ratio causes the flame temperature to below enough to reduce NOx as well as other emissions [14].Theoretically, the hottest flame comes from stoichiometric air/fuelmixtures; however, NOx peaks at slightly leaner fuel/air ratios.Leaning of fuel/air ratio causes the flame temperature to be lowenough to reduce NOx as well as other emissions.
Najafi et al. [82] reported that the oxygen content of ethanolproduces a leaner effect in fuel-rich conditions. This leaner effectshifts the air–fuel ratio to stoichiometric condition and helps incompleting combustion hence increasing NOx emission. Hsiehet al. [56] also found higher NOx emission in stoichiometric air–fuel ratio as complete combustion leaded to a high combustiontemperature. However, at an equivalence ratio lower than 1.0, theeffect of addition of ethanol on NOx emissions was insignificant.
They concluded that NOx emissions depend on the engine operat-ing conditions rather than on the ethanol content. Using a six-cylinder test engine, Al-Farayedhi [116] found maximum NOxemission in the equivalence ratio of 0.9 for using gasoline, E10,E15, and E20 as fuel. NOx emissions increased as the ethanolconcentration of the blend increased except at the equivalenceratio of 0.8. The availability of oxygen and high combustiontemperature were the cause of these NOx emissions. However,for very lean mixtures, NOx concentration decreased for highercontent of ethanol.
Zervas et al. [117] investigated the effect of different equiva-lence ratios (λ¼0.83–1.25) on exhaust emissions. They found, thedifference in equivalence ratios did not lead to a large change inNOx emissions. With different values of λ, NOx varied from 15% to30%. In stoichiometric and lean conditions, emissions of COdecreased. The addition of an oxygenated compound is moreimportant than the percentage of oxygen in the fuel, which meansthat CO emissions decreased because the oxygen concentrationwas higher. However, for E5 fuel, HC emissions are almostindependent of λ. For E20 there are two zones: a 9–28% decreasein HC emissions in the lean condition and a 46–48% decrease in HCemissions in the stoichiometric and rich conditions.
5.2.4. Effect of speedEngine speed also affects NOx emissions. Some authors [82,116]
have reported that NOx increases with engine speed as more fuelis burnt resulting in high in-cylinder temperature at high speeds.Few authors [38,99] have also reported low NOx emission becauseof less available time for combustion at high speeds.
At higher speeds, lower combustion time is available forburning higher amount of fuel than lower speeds. Flame speed isan important factor to complete the combustion in short time. Asflame speed of ethanol is higher than that of gasoline, it assists incompleting the combustion at high speeds, which results in higherNOx emission for ethanol. Costa and Sodré [21] found higher NOxemission for 100% hydrous ethanol than E22 at high speeds as ithas more ethanol content than E22. However, at low speeds(2500–3000 rpm) there was no significant change for these fuels.Koç et al. [38] found different results for ethanol blended fuel athigh speeds. They found 42%, 41% and 11% NOx increase for E0,E50 and E85 respectively within speed range of 1500–5000 rpm.Increase in NOx emission with speed was relatively lower for E85than E0. Lower heating value combined with low combustion timecan be the reason of lower NOx for ethanol in high speeds.
5.2.5. Effect of cold-startThe properties of ethanol cause difficult cold start and warm-
up operations, which impact on engine emissions. The RVP (ReidVapor Pressure) of ethanol is 17 kPa, far lower than that ofgasoline, which is 53.7 kPa. But their mixture does not have anRVP value linearly proportional to the volume fraction. A volumefraction of 5–10% ethanol can achieve the maximal RVP and thusfacilitate cold-start [118]. The vaporization temperature of ethanolis 78 1C, while that of gasoline is 40 1C. On the other hand, ethanolvaporization requires twice the energy required by gasoline.Therefore, ethanol-fueled engines do not start at temperaturesbelow 13 1C, while gasoline-fueled engines can start at tempera-tures as low as −40 1C [119].
The effects of ethanol–gasoline blended fuel on cold-startemissions were studied by Chen et al. [120] using an ECU(electronic control unit) controlled SI engine. They compared theemissions of different ethanol–gasoline blends (E0, E5, E10, E20,E30, E40), keeping the intake air temperature around 20 1C. Atcold start, E5 and E10 performed indistinguishably, while E20–E40clearly had lower HC, CO, and NOx emissions. In the open-loop
B.M. Masum et al. / Renewable and Sustainable Energy Reviews 24 (2013) 209–222 217
control, the fuel injection is roughly the same for all fuels (E0–E40). However, the stoichiometric air–fuel ratios for ethanol andgasoline are 9 and 14.7 respectively. The amount of air required tocreate a stoichiometric air–fuel mixture for gasoline (E0) would beexcessive for ethanol–gasoline blended fuels, which helps inreducing HC and CO emissions. NOx decreases for lower flametemperatures produced by excess air. In the case of E40, theoperation was unstable because the constant amount air supplymakes the air–fuel mixture very thin. Liao et al. [121] also foundlower HC, CO and NOX emission for ethanol blended fuel thanthose of gasoline in cold start.
Sales and Sodré [119] used a flexible fuel engine with heatedintake air–fuel and compared the results with that of a conven-tional cold start system. Using hydrous ethanol, they found lowerHC, CO, and NOx emissions for heated intake air–fuel than for aconventional cold start. Heating of ethanol and intake air improvesfuel vaporization, thus reducing the formation of emissions in thefirst engine cycles.
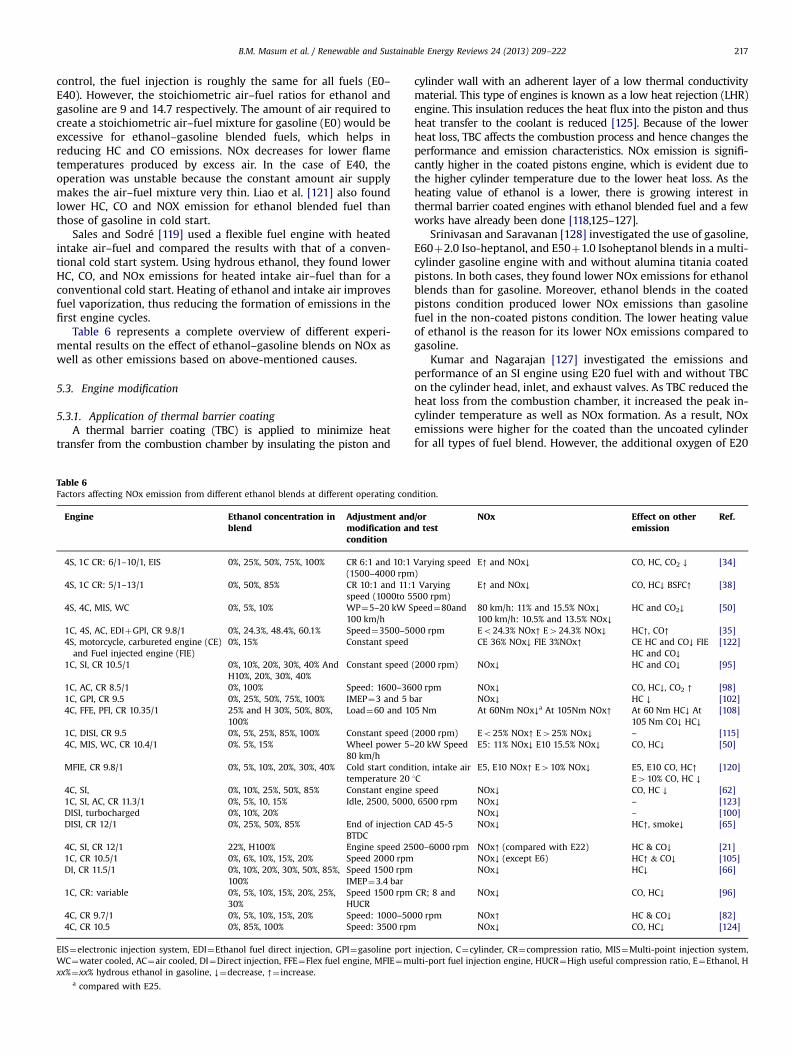
Table 6 represents a complete overview of different experi-mental results on the effect of ethanol–gasoline blends on NOx aswell as other emissions based on above-mentioned causes.
5.3. Engine modification
5.3.1. Application of thermal barrier coatingA thermal barrier coating (TBC) is applied to minimize heat
transfer from the combustion chamber by insulating the piston and
Table 6Factors affecting NOx emission from different ethanol blends at different operating con
Engine Ethanol concentration inblend
Adjustment andmodification ancondition
4S, 1C CR: 6/1–10/1, EIS 0%, 25%, 50%, 75%, 100% CR 6:1 and 10:1(1500–4000 rpm
4S, 1C CR: 5/1–13/1 0%, 50%, 85% CR 10:1 and 11:1speed (1000to 5
4S, 4C, MIS, WC 0%, 5%, 10% WP¼5–20 kW S100 km/h
1C, 4S, AC, EDIþGPI, CR 9.8/1 0%, 24.3%, 48.4%, 60.1% Speed¼3500–504S, motorcycle, carbureted engine (CE)and Fuel injected engine (FIE)
0%, 15% Constant speed
1C, SI, CR 10.5/1 0%, 10%, 20%, 30%, 40% AndH10%, 20%, 30%, 40%
Constant speed
1C, AC, CR 8.5/1 0%, 100% Speed: 1600–361C, GPI, CR 9.5 0%, 25%, 50%, 75%, 100% IMEP¼3 and 5 b4C, FFE, PFI, CR 10.35/1 25% and H 30%, 50%, 80%,
100%Load¼60 and 10
1C, DISI, CR 9.5 0%, 5%, 25%, 85%, 100% Constant speed4C, MIS, WC, CR 10.4/1 0%. 5%, 15% Wheel power 5–
80 km/hMFIE, CR 9.8/1 0%, 5%, 10%, 20%, 30%, 40% Cold start condit
temperature 204C, SI, 0%, 10%, 25%, 50%, 85% Constant engine1C, SI, AC, CR 11.3/1 0%, 5%, 10, 15% Idle, 2500, 5000DISI, turbocharged 0%, 10%, 20%DISI, CR 12/1 0%, 25%, 50%, 85% End of injection
BTDC4C, SI, CR 12/1 22%, H100% Engine speed 251C, CR 10.5/1 0%, 6%, 10%, 15%, 20% Speed 2000 rpmDI, CR 11.5/1 0%, 10%, 20%, 30%, 50%, 85%,
100%Speed 1500 rpmIMEP¼3.4 bar
1C, CR: variable 0%, 5%, 10%, 15%, 20%, 25%,30%
Speed 1500 rpmHUCR
4C, CR 9.7/1 0%, 5%, 10%, 15%, 20% Speed: 1000–504C, CR 10.5 0%, 85%, 100% Speed: 3500 rpm
EIS¼electronic injection system, EDI¼Ethanol fuel direct injection, GPI¼gasoline portWC¼water cooled, AC¼air cooled, DI¼Direct injection, FFE¼Flex fuel engine, MFIE¼mxx%¼xx% hydrous ethanol in gasoline, ↓¼decrease, ↑¼ increase.
a compared with E25.
cylinder wall with an adherent layer of a low thermal conductivitymaterial. This type of engines is known as a low heat rejection (LHR)engine. This insulation reduces the heat flux into the piston and thusheat transfer to the coolant is reduced [125]. Because of the lowerheat loss, TBC affects the combustion process and hence changes theperformance and emission characteristics. NOx emission is signifi-cantly higher in the coated pistons engine, which is evident due tothe higher cylinder temperature due to the lower heat loss. As theheating value of ethanol is a lower, there is growing interest inthermal barrier coated engines with ethanol blended fuel and a fewworks have already been done [118,125–127].
Srinivasan and Saravanan [128] investigated the use of gasoline,E60þ2.0 Iso-heptanol, and E50þ1.0 Isoheptanol blends in a multi-cylinder gasoline engine with and without alumina titania coatedpistons. In both cases, they found lower NOx emissions for ethanolblends than for gasoline. Moreover, ethanol blends in the coatedpistons condition produced lower NOx emissions than gasolinefuel in the non-coated pistons condition. The lower heating valueof ethanol is the reason for its lower NOx emissions compared togasoline.
Kumar and Nagarajan [127] investigated the emissions andperformance of an SI engine using E20 fuel with and without TBCon the cylinder head, inlet, and exhaust valves. As TBC reduced theheat loss from the combustion chamber, it increased the peak in-cylinder temperature as well as NOx formation. As a result, NOxemissions were higher for the coated than the uncoated cylinderfor all types of fuel blend. However, the additional oxygen of E20
dition.
/ord test
NOx Effect on otheremission
Ref.
Varying speed)
E↑ and NOx↓ CO, HC, CO2 ↓ [34]
Varying500 rpm)
E↑ and NOx↓ CO, HC↓ BSFC↑ [38]
peed¼80and 80 km/h: 11% and 15.5% NOx↓100 km/h: 10.5% and 13.5% NOx↓
HC and CO2↓ [50]
00 rpm Eo24.3% NOx↑ E424.3% NOx↓ HC↑, CO↑ [35]CE 36% NOx↓ FIE 3%NOx↑ CE HC and CO↓ FIE
HC and CO↓[122]
(2000 rpm) NOx↓ HC and CO↓ [95]
00 rpm NOx↓ CO, HC↓, CO2 ↑ [98]ar NOx↓ HC ↓ [102]5 Nm At 60Nm NOx↓a At 105Nm NOx↑ At 60 Nm HC↓ At
105 Nm CO↓ HC↓[108]
(2000 rpm) Eo25% NOx↑ E425% NOx↓ – [115]20 kW Speed E5: 11% NOx↓ E10 15.5% NOx↓ CO, HC↓ [50]
ion, intake air1C
E5, E10 NOx↑ E410% NOx↓ E5, E10 CO, HC↑E410% CO, HC ↓
[120]
speed NOx↓ CO, HC ↓ [62], 6500 rpm NOx↓ – [123]
NOx↓ – [100]CAD 45-5 NOx↓ HC↑, smoke↓ [65]
00–6000 rpm NOx↑ (compared with E22) HC & CO↓ [21]NOx↓ (except E6) HC↑ & CO↓ [105]NOx↓ HC↓ [66]
CR; 8 and NOx↓ CO, HC↓ [96]
00 rpm NOx↑ HC & CO↓ [82]NOx↓ CO, HC↓ [124]
injection, C¼cylinder, CR¼compression ratio, MIS¼Multi-point injection system,ulti-port fuel injection engine, HUCR¼High useful compression ratio, E¼Ethanol, H
B.M. Masum et al. / Renewable and Sustainable Energy Reviews 24 (2013) 209–222218
fuel accelerates NOx formation with higher in-cylinder tempera-ture for thermal coating. Therefore, they found a 46% increase inNOx emission for E20 than for gasoline.
5.3.2. Effect of separate aqueous ethanol injectionIt was hypothesized that the primary effect of the water was to
reduce flame temperatures, thereby obstructing the thermal for-mation of NOx. From previous literature, it was seen that avoidingthe phase separation of ethanol–gasoline blend requires highpurity ethanol so it is costly, and better performance of the enginedepends on the best ethanol–gasoline ratio, which varies fordifferent engine speeds and torques. To solve this problem, anindependently controlled separate set of aqueous alcohol injectorwas used. Chen et al. [64] installed a set of independentlycontrolled separate aqueous alcohol injectors alongside the gaso-line injector at the manifold. Aqueous ethanol with a high watercontent (ethanol purity: 99.7%, 75% and 50%) was injected as a fuelsubstitute through them. They selected two operating regimes:highway running and high load running. During highway running,engine control unit cut down the flow of gasoline when aqueousethanol was injected by receiving feedback from the exhaustoxygen sensor, but in high load running, nothing happened.Aqueous alcohol reduced the combustion temperature and thusreduced NOx formation. They concluded that the water content inthe fuel mixture dominated the NOx reduction rather than theethanol content. With a 16% water content in the fuel mixture,NOx emission can be reduced by 30% with little adverse effect onthe torque compared to gasoline.
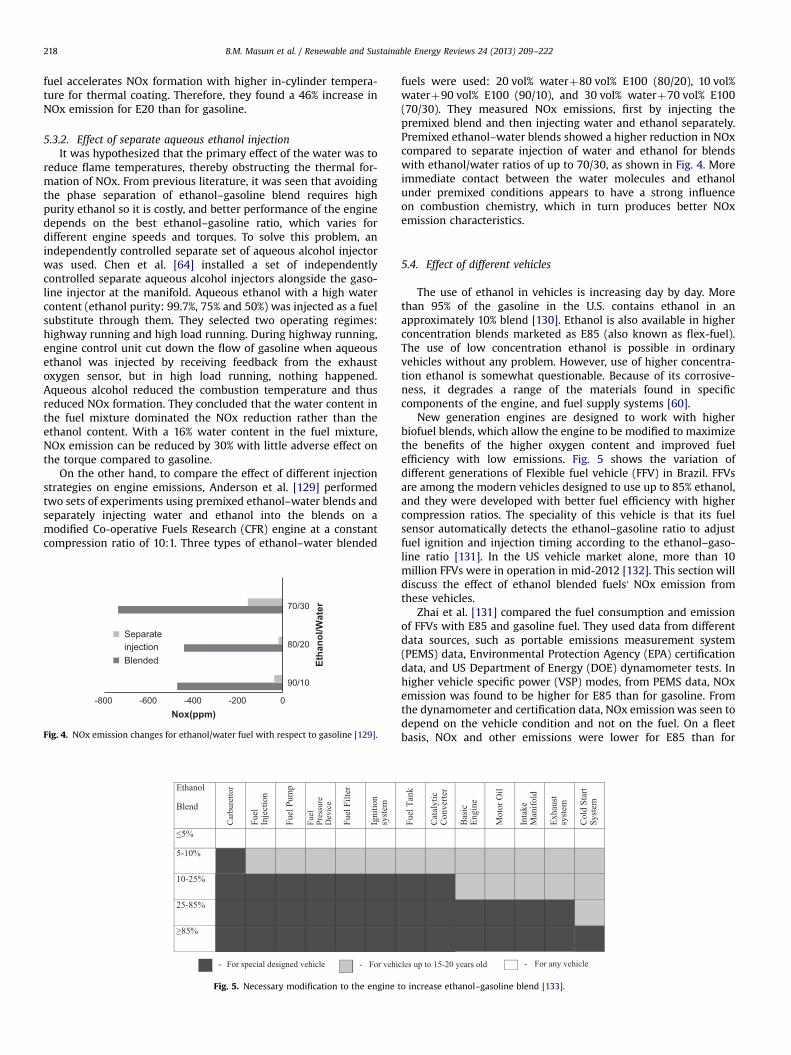
On the other hand, to compare the effect of different injectionstrategies on engine emissions, Anderson et al. [129] performedtwo sets of experiments using premixed ethanol–water blends andseparately injecting water and ethanol into the blends on amodified Co-operative Fuels Research (CFR) engine at a constantcompression ratio of 10:1. Three types of ethanol–water blended
Ethanol
Blend
Car
bure
ttor
Fuel
In
ject
ion
Fuel
Pum
p
Fuel
Pr
essu
re
Dev
ice
Fuel
Filt
er
Igni
tion
syst
em
≤5%
5-10%
10-25%
25-85%
≥85%
- For special designed vehicle - For vehi
Fig. 5. Necessary modification to the engine t
-800 -600 -400 -200 0
90/10
80/20
70/30
Nox(ppm)
Separate injectionBlended Et
hano
l/Wat
er
Fig. 4. NOx emission changes for ethanol/water fuel with respect to gasoline [129].
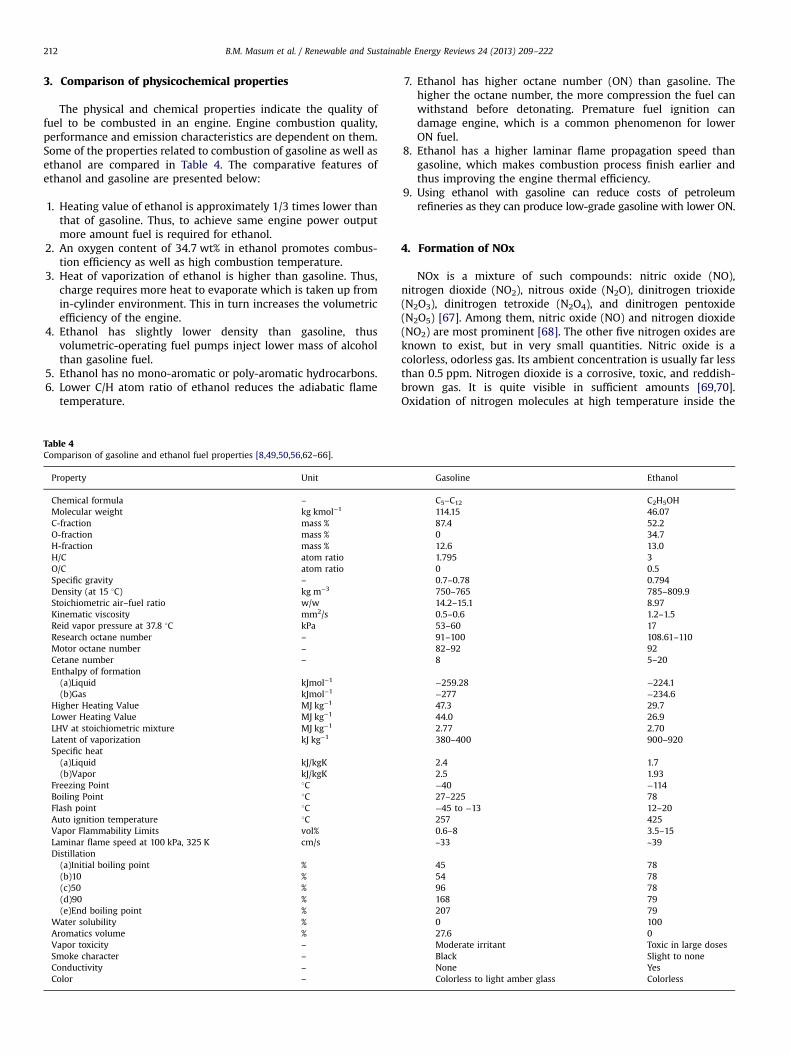
fuels were used: 20 vol% waterþ80 vol% E100 (80/20), 10 vol%waterþ90 vol% E100 (90/10), and 30 vol% waterþ70 vol% E100(70/30). They measured NOx emissions, first by injecting thepremixed blend and then injecting water and ethanol separately.Premixed ethanol–water blends showed a higher reduction in NOxcompared to separate injection of water and ethanol for blendswith ethanol/water ratios of up to 70/30, as shown in Fig. 4. Moreimmediate contact between the water molecules and ethanolunder premixed conditions appears to have a strong influenceon combustion chemistry, which in turn produces better NOxemission characteristics.
5.4. Effect of different vehicles
The use of ethanol in vehicles is increasing day by day. Morethan 95% of the gasoline in the U.S. contains ethanol in anapproximately 10% blend [130]. Ethanol is also available in higherconcentration blends marketed as E85 (also known as flex-fuel).The use of low concentration ethanol is possible in ordinaryvehicles without any problem. However, use of higher concentra-tion ethanol is somewhat questionable. Because of its corrosive-ness, it degrades a range of the materials found in specificcomponents of the engine, and fuel supply systems [60].
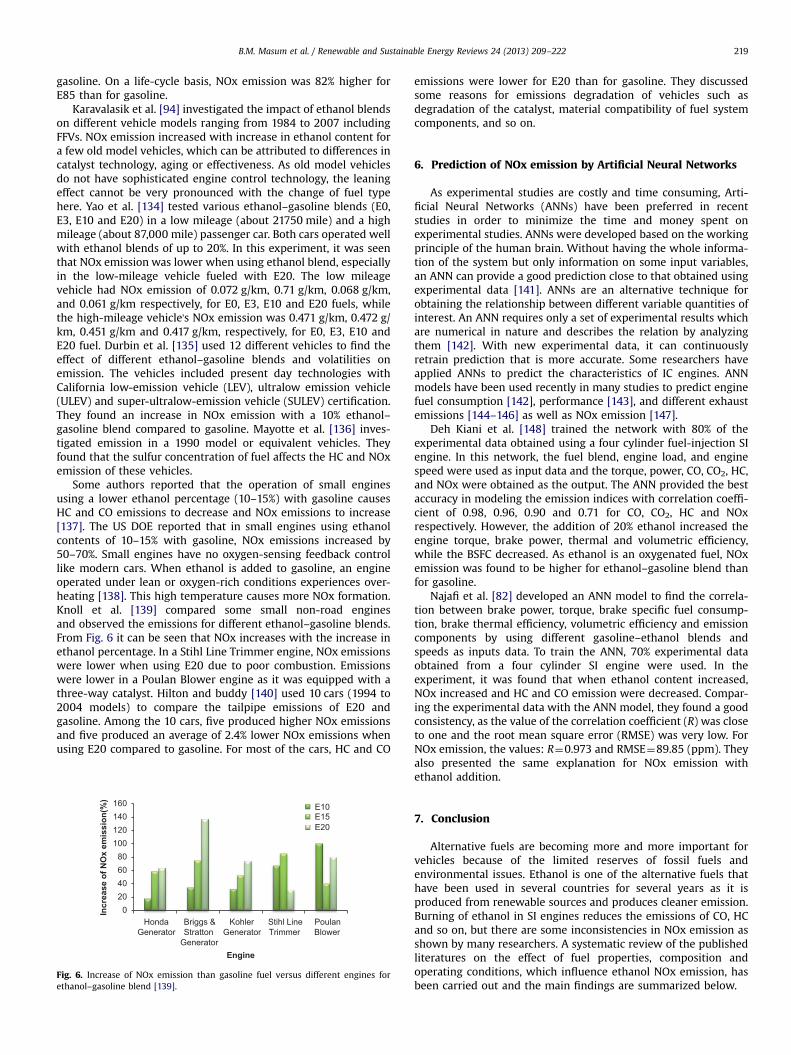
New generation engines are designed to work with higherbiofuel blends, which allow the engine to be modified to maximizethe benefits of the higher oxygen content and improved fuelefficiency with low emissions. Fig. 5 shows the variation ofdifferent generations of Flexible fuel vehicle (FFV) in Brazil. FFVsare among the modern vehicles designed to use up to 85% ethanol,and they were developed with better fuel efficiency with highercompression ratios. The speciality of this vehicle is that its fuelsensor automatically detects the ethanol–gasoline ratio to adjustfuel ignition and injection timing according to the ethanol–gaso-line ratio [131]. In the US vehicle market alone, more than 10million FFVs were in operation in mid-2012 [132]. This section willdiscuss the effect of ethanol blended fuels' NOx emission fromthese vehicles.
Zhai et al. [131] compared the fuel consumption and emissionof FFVs with E85 and gasoline fuel. They used data from differentdata sources, such as portable emissions measurement system(PEMS) data, Environmental Protection Agency (EPA) certificationdata, and US Department of Energy (DOE) dynamometer tests. Inhigher vehicle specific power (VSP) modes, from PEMS data, NOxemission was found to be higher for E85 than for gasoline. Fromthe dynamometer and certification data, NOx emission was seen todepend on the vehicle condition and not on the fuel. On a fleetbasis, NOx and other emissions were lower for E85 than for
Fuel
Tan
k
Cat
alyt
ic
Con
verte
r
Bas
ic
Engi
ne
Mot
or O
il
Inta
ke
Man
ifold
Exha
ust
syst
em
Col
d St
art
Syst
em
cles up to 15-20 years old - For any vehicle
o increase ethanol–gasoline blend [133].
B.M. Masum et al. / Renewable and Sustainable Energy Reviews 24 (2013) 209–222 219
gasoline. On a life-cycle basis, NOx emission was 82% higher forE85 than for gasoline.
Karavalasik et al. [94] investigated the impact of ethanol blendson different vehicle models ranging from 1984 to 2007 includingFFVs. NOx emission increased with increase in ethanol content fora few old model vehicles, which can be attributed to differences incatalyst technology, aging or effectiveness. As old model vehiclesdo not have sophisticated engine control technology, the leaningeffect cannot be very pronounced with the change of fuel typehere. Yao et al. [134] tested various ethanol–gasoline blends (E0,E3, E10 and E20) in a low mileage (about 21750 mile) and a highmileage (about 87,000 mile) passenger car. Both cars operated wellwith ethanol blends of up to 20%. In this experiment, it was seenthat NOx emission was lower when using ethanol blend, especiallyin the low-mileage vehicle fueled with E20. The low mileagevehicle had NOx emission of 0.072 g/km, 0.71 g/km, 0.068 g/km,and 0.061 g/km respectively, for E0, E3, E10 and E20 fuels, whilethe high-mileage vehicle's NOx emission was 0.471 g/km, 0.472 g/km, 0.451 g/km and 0.417 g/km, respectively, for E0, E3, E10 andE20 fuel. Durbin et al. [135] used 12 different vehicles to find theeffect of different ethanol–gasoline blends and volatilities onemission. The vehicles included present day technologies withCalifornia low-emission vehicle (LEV), ultralow emission vehicle(ULEV) and super-ultralow-emission vehicle (SULEV) certification.They found an increase in NOx emission with a 10% ethanol–gasoline blend compared to gasoline. Mayotte et al. [136] inves-tigated emission in a 1990 model or equivalent vehicles. Theyfound that the sulfur concentration of fuel affects the HC and NOxemission of these vehicles.
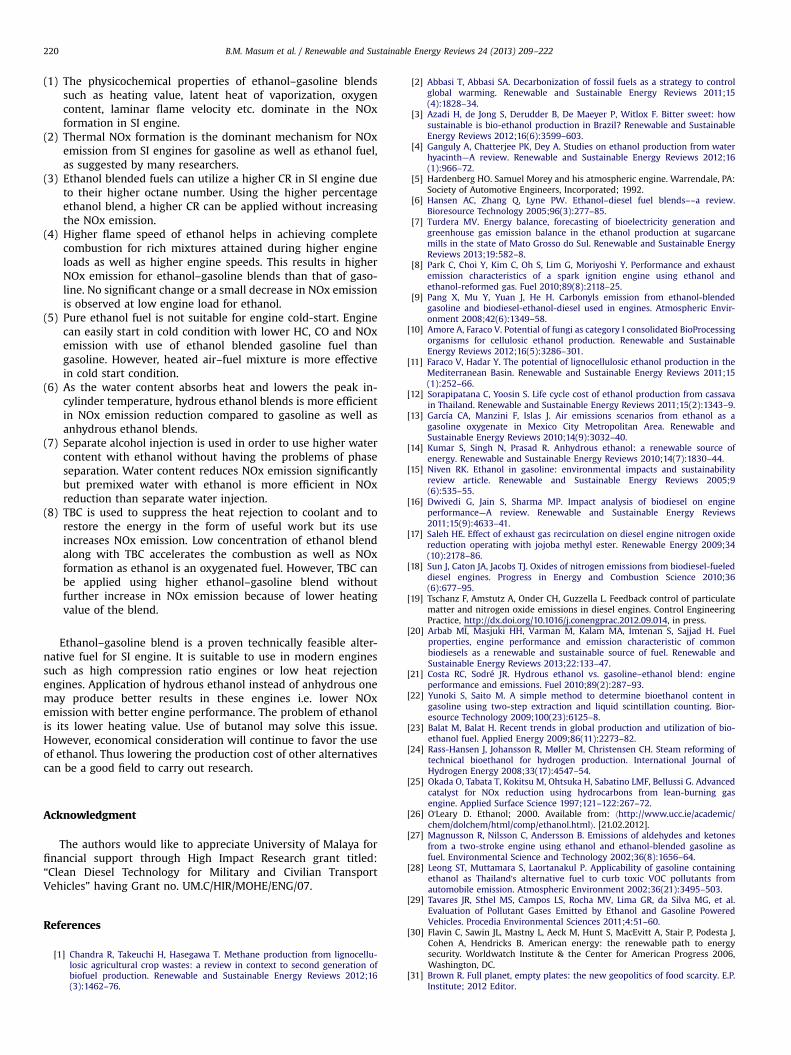
Some authors reported that the operation of small enginesusing a lower ethanol percentage (10–15%) with gasoline causesHC and CO emissions to decrease and NOx emissions to increase[137]. The US DOE reported that in small engines using ethanolcontents of 10–15% with gasoline, NOx emissions increased by50–70%. Small engines have no oxygen-sensing feedback controllike modern cars. When ethanol is added to gasoline, an engineoperated under lean or oxygen-rich conditions experiences over-heating [138]. This high temperature causes more NOx formation.Knoll et al. [139] compared some small non-road enginesand observed the emissions for different ethanol–gasoline blends.From Fig. 6 it can be seen that NOx increases with the increase inethanol percentage. In a Stihl Line Trimmer engine, NOx emissionswere lower when using E20 due to poor combustion. Emissionswere lower in a Poulan Blower engine as it was equipped with athree-way catalyst. Hilton and buddy [140] used 10 cars (1994 to2004 models) to compare the tailpipe emissions of E20 andgasoline. Among the 10 cars, five produced higher NOx emissionsand five produced an average of 2.4% lower NOx emissions whenusing E20 compared to gasoline. For most of the cars, HC and CO
Honda Generator
Briggs & Stratton
Generator
Kohler Generator
Stihl Line Trimmer
Poulan Blower
020406080
100120140160
Engine
Incr
ease
of N
Ox
emis
sion
(%)
E10E15E20
Fig. 6. Increase of NOx emission than gasoline fuel versus different engines forethanol–gasoline blend [139].
emissions were lower for E20 than for gasoline. They discussedsome reasons for emissions degradation of vehicles such asdegradation of the catalyst, material compatibility of fuel systemcomponents, and so on.
6. Prediction of NOx emission by Artificial Neural Networks
As experimental studies are costly and time consuming, Arti-ficial Neural Networks (ANNs) have been preferred in recentstudies in order to minimize the time and money spent onexperimental studies. ANNs were developed based on the workingprinciple of the human brain. Without having the whole informa-tion of the system but only information on some input variables,an ANN can provide a good prediction close to that obtained usingexperimental data [141]. ANNs are an alternative technique forobtaining the relationship between different variable quantities ofinterest. An ANN requires only a set of experimental results whichare numerical in nature and describes the relation by analyzingthem [142]. With new experimental data, it can continuouslyretrain prediction that is more accurate. Some researchers haveapplied ANNs to predict the characteristics of IC engines. ANNmodels have been used recently in many studies to predict enginefuel consumption [142], performance [143], and different exhaustemissions [144–146] as well as NOx emission [147].
Deh Kiani et al. [148] trained the network with 80% of theexperimental data obtained using a four cylinder fuel-injection SIengine. In this network, the fuel blend, engine load, and enginespeed were used as input data and the torque, power, CO, CO2, HC,and NOx were obtained as the output. The ANN provided the bestaccuracy in modeling the emission indices with correlation coeffi-cient of 0.98, 0.96, 0.90 and 0.71 for CO, CO2, HC and NOxrespectively. However, the addition of 20% ethanol increased theengine torque, brake power, thermal and volumetric efficiency,while the BSFC decreased. As ethanol is an oxygenated fuel, NOxemission was found to be higher for ethanol–gasoline blend thanfor gasoline.
Najafi et al. [82] developed an ANN model to find the correla-tion between brake power, torque, brake specific fuel consump-tion, brake thermal efficiency, volumetric efficiency and emissioncomponents by using different gasoline–ethanol blends andspeeds as inputs data. To train the ANN, 70% experimental dataobtained from a four cylinder SI engine were used. In theexperiment, it was found that when ethanol content increased,NOx increased and HC and CO emission were decreased. Compar-ing the experimental data with the ANN model, they found a goodconsistency, as the value of the correlation coefficient (R) was closeto one and the root mean square error (RMSE) was very low. ForNOx emission, the values: R¼0.973 and RMSE¼89.85 (ppm). Theyalso presented the same explanation for NOx emission withethanol addition.
7. Conclusion
Alternative fuels are becoming more and more important forvehicles because of the limited reserves of fossil fuels andenvironmental issues. Ethanol is one of the alternative fuels thathave been used in several countries for several years as it isproduced from renewable sources and produces cleaner emission.Burning of ethanol in SI engines reduces the emissions of CO, HCand so on, but there are some inconsistencies in NOx emission asshown by many researchers. A systematic review of the publishedliteratures on the effect of fuel properties, composition andoperating conditions, which influence ethanol NOx emission, hasbeen carried out and the main findings are summarized below.
B.M. Masum et al. / Renewable and Sustainable Energy Reviews 24 (2013) 209–222220
(1)
The physicochemical properties of ethanol–gasoline blendssuch as heating value, latent heat of vaporization, oxygencontent, laminar flame velocity etc. dominate in the NOxformation in SI engine.(2)
Thermal NOx formation is the dominant mechanism for NOxemission from SI engines for gasoline as well as ethanol fuel,as suggested by many researchers.(3)
Ethanol blended fuels can utilize a higher CR in SI engine dueto their higher octane number. Using the higher percentageethanol blend, a higher CR can be applied without increasingthe NOx emission.(4)
Higher flame speed of ethanol helps in achieving completecombustion for rich mixtures attained during higher engineloads as well as higher engine speeds. This results in higherNOx emission for ethanol–gasoline blends than that of gaso-line. No significant change or a small decrease in NOx emissionis observed at low engine load for ethanol.(5)
Pure ethanol fuel is not suitable for engine cold-start. Enginecan easily start in cold condition with lower HC, CO and NOxemission with use of ethanol blended gasoline fuel thangasoline. However, heated air–fuel mixture is more effectivein cold start condition.(6)
As the water content absorbs heat and lowers the peak in-cylinder temperature, hydrous ethanol blends is more efficientin NOx emission reduction compared to gasoline as well asanhydrous ethanol blends.(7)
Separate alcohol injection is used in order to use higher watercontent with ethanol without having the problems of phaseseparation. Water content reduces NOx emission significantlybut premixed water with ethanol is more efficient in NOxreduction than separate water injection.(8)
TBC is used to suppress the heat rejection to coolant and torestore the energy in the form of useful work but its useincreases NOx emission. Low concentration of ethanol blendalong with TBC accelerates the combustion as well as NOxformation as ethanol is an oxygenated fuel. However, TBC canbe applied using higher ethanol–gasoline blend withoutfurther increase in NOx emission because of lower heatingvalue of the blend.Ethanol–gasoline blend is a proven technically feasible alter-native fuel for SI engine. It is suitable to use in modern enginessuch as high compression ratio engines or low heat rejectionengines. Application of hydrous ethanol instead of anhydrous onemay produce better results in these engines i.e. lower NOxemission with better engine performance. The problem of ethanolis its lower heating value. Use of butanol may solve this issue.However, economical consideration will continue to favor the useof ethanol. Thus lowering the production cost of other alternativescan be a good field to carry out research.
Acknowledgment
The authors would like to appreciate University of Malaya forfinancial support through High Impact Research grant titled:“Clean Diesel Technology for Military and Civilian TransportVehicles” having Grant no. UM.C/HIR/MOHE/ENG/07.
References
[1] Chandra R, Takeuchi H, Hasegawa T. Methane production from lignocellu-losic agricultural crop wastes: a review in context to second generation ofbiofuel production. Renewable and Sustainable Energy Reviews 2012;16(3):1462–76.
[2] Abbasi T, Abbasi SA. Decarbonization of fossil fuels as a strategy to controlglobal warming. Renewable and Sustainable Energy Reviews 2011;15(4):1828–34.
[3] Azadi H, de Jong S, Derudder B, De Maeyer P, Witlox F. Bitter sweet: howsustainable is bio-ethanol production in Brazil? Renewable and SustainableEnergy Reviews 2012;16(6):3599–603.
[4] Ganguly A, Chatterjee PK, Dey A. Studies on ethanol production from waterhyacinth—A review. Renewable and Sustainable Energy Reviews 2012;16(1):966–72.
[5] Hardenberg HO. Samuel Morey and his atmospheric engine. Warrendale, PA:Society of Automotive Engineers, Incorporated; 1992.
[6] Hansen AC, Zhang Q, Lyne PW. Ethanol–diesel fuel blends––a review.Bioresource Technology 2005;96(3):277–85.
[7] Turdera MV. Energy balance, forecasting of bioelectricity generation andgreenhouse gas emission balance in the ethanol production at sugarcanemills in the state of Mato Grosso do Sul. Renewable and Sustainable EnergyReviews 2013;19:582–8.
[8] Park C, Choi Y, Kim C, Oh S, Lim G, Moriyoshi Y. Performance and exhaustemission characteristics of a spark ignition engine using ethanol andethanol-reformed gas. Fuel 2010;89(8):2118–25.
[9] Pang X, Mu Y, Yuan J, He H. Carbonyls emission from ethanol-blendedgasoline and biodiesel-ethanol-diesel used in engines. Atmospheric Envir-onment 2008;42(6):1349–58.
[10] Amore A, Faraco V. Potential of fungi as category I consolidated BioProcessingorganisms for cellulosic ethanol production. Renewable and SustainableEnergy Reviews 2012;16(5):3286–301.
[11] Faraco V, Hadar Y. The potential of lignocellulosic ethanol production in theMediterranean Basin. Renewable and Sustainable Energy Reviews 2011;15(1):252–66.
[12] Sorapipatana C, Yoosin S. Life cycle cost of ethanol production from cassavain Thailand. Renewable and Sustainable Energy Reviews 2011;15(2):1343–9.
[13] García CA, Manzini F, Islas J. Air emissions scenarios from ethanol as agasoline oxygenate in Mexico City Metropolitan Area. Renewable andSustainable Energy Reviews 2010;14(9):3032–40.
[14] Kumar S, Singh N, Prasad R. Anhydrous ethanol: a renewable source ofenergy. Renewable and Sustainable Energy Reviews 2010;14(7):1830–44.
[15] Niven RK. Ethanol in gasoline: environmental impacts and sustainabilityreview article. Renewable and Sustainable Energy Reviews 2005;9(6):535–55.
[16] Dwivedi G, Jain S, Sharma MP. Impact analysis of biodiesel on engineperformance—A review. Renewable and Sustainable Energy Reviews2011;15(9):4633–41.
[17] Saleh HE. Effect of exhaust gas recirculation on diesel engine nitrogen oxidereduction operating with jojoba methyl ester. Renewable Energy 2009;34(10):2178–86.
[18] Sun J, Caton JA, Jacobs TJ. Oxides of nitrogen emissions from biodiesel-fueleddiesel engines. Progress in Energy and Combustion Science 2010;36(6):677–95.
[19] Tschanz F, Amstutz A, Onder CH, Guzzella L. Feedback control of particulatematter and nitrogen oxide emissions in diesel engines. Control EngineeringPractice, http://dx.doi.org/10.1016/j.conengprac.2012.09.014, in press.
[20] Arbab MI, Masjuki HH, Varman M, Kalam MA, Imtenan S, Sajjad H. Fuelproperties, engine performance and emission characteristic of commonbiodiesels as a renewable and sustainable source of fuel. Renewable andSustainable Energy Reviews 2013;22:133–47.
[21] Costa RC, Sodré JR. Hydrous ethanol vs. gasoline–ethanol blend: engineperformance and emissions. Fuel 2010;89(2):287–93.
[22] Yunoki S, Saito M. A simple method to determine bioethanol content ingasoline using two-step extraction and liquid scintillation counting. Bior-esource Technology 2009;100(23):6125–8.
[23] Balat M, Balat H. Recent trends in global production and utilization of bio-ethanol fuel. Applied Energy 2009;86(11):2273–82.
[24] Rass-Hansen J, Johansson R, Møller M, Christensen CH. Steam reforming oftechnical bioethanol for hydrogen production. International Journal ofHydrogen Energy 2008;33(17):4547–54.
[25] Okada O, Tabata T, Kokitsu M, Ohtsuka H, Sabatino LMF, Bellussi G. Advancedcatalyst for NOx reduction using hydrocarbons from lean-burning gasengine. Applied Surface Science 1997;121–122:267–72.
[26] O'Leary D. Ethanol; 2000. Available from: ⟨http://www.ucc.ie/academic/chem/dolchem/html/comp/ethanol.html⟩. [21.02.2012].
[27] Magnusson R, Nilsson C, Andersson B. Emissions of aldehydes and ketonesfrom a two-stroke engine using ethanol and ethanol-blended gasoline asfuel. Environmental Science and Technology 2002;36(8):1656–64.
[28] Leong ST, Muttamara S, Laortanakul P. Applicability of gasoline containingethanol as Thailand's alternative fuel to curb toxic VOC pollutants fromautomobile emission. Atmospheric Environment 2002;36(21):3495–503.
[29] Tavares JR, Sthel MS, Campos LS, Rocha MV, Lima GR, da Silva MG, et al.Evaluation of Pollutant Gases Emitted by Ethanol and Gasoline PoweredVehicles. Procedia Environmental Sciences 2011;4:51–60.
[30] Flavin C, Sawin JL, Mastny L, Aeck M, Hunt S, MacEvitt A, Stair P, Podesta J,Cohen A, Hendricks B. American energy: the renewable path to energysecurity. Worldwatch Institute & the Center for American Progress 2006,Washington, DC.
[31] Brown R. Full planet, empty plates: the new geopolitics of food scarcity. E.P.Institute; 2012 Editor.
B.M. Masum et al. / Renewable and Sustainable Energy Reviews 24 (2013) 209–222 221
[32] Szulczyk KR, McCarl BA, Cornforth G. Market penetration of ethanol. Renew-able and Sustainable Energy Reviews 2010;14(1):394–403.
[33] Maurya RK, Agarwal AK. Experimental study of combustion and emissioncharacteristics of ethanol fueled port injected homogeneous charge com-pression ignition (HCCI) combustion engine. Applied Energy 2011;88(4):1169–80.
[34] Celik MB. Experimental determination of suitable ethanol–gasoline blendrate at high compression ratio for gasoline engine. Applied ThermalEngineering 2008;28(5–6):396–404.
[35] Zhuang Y, Hong G. Primary investigation to leveraging effect of using ethanolfuel on reducing gasoline fuel consumption. Fuel 2013;105:425–31.
[36] Eyidogan M, Ozsezen AN, Canakci M, Turkcan A. Impact of alcohol–gasolinefuel blends on the performance and combustion characteristics of an SIengine. Fuel 2010;89(10):2713–20.
[37] Çelik MB, Özdalyan B, Alkan F. The use of pure methanol as fuel at highcompression ratio in a single cylinder gasoline engine. Fuel 2011;90(4):1591–8.
[38] Koç M, Sekmen Y, Topgül T, Yücesu HS. The effects of ethanol–unleadedgasoline blends on engine performance and exhaust emissions in a spark-ignition engine. Renewable Energy 2009;34(10):2101–6.
[39] Sayin C. Engine performance and exhaust gas emissions of methanol andethanol–diesel blends. Fuel 2010;89(11):3410–5.
[40] Keskin A. The Influence of ethanol–gasoline blends on spark ignition enginevibration characteristics and noise emissions. Energy Sources, Part A:Recovery, Utilization, and Environmental Effects 2010;32(20):1851–60.
[41] Harijan K, Memon M, Uqaili MA, Mirza UK. Potential contribution of ethanolfuel to the transport sector of Pakistan. Renewable and Sustainable EnergyReviews 2009;13(1):291–5.
[42] Beeckmann JRO, Peters N. Numerical and experimental investigation oflaminar burning velocities of iso-octane, ethanol and n-butanol. SAE paper2009-01-2784; 2009.
[43] Farrell JTJR, Androulakis IP. Molecular structure effects on laminar burningvelocities at elevated temperature and pressure. SAE paper 2004-01-2936,2004.
[44] Hara TTK. Laminar flame speed of ethanol, n-heptane, iso-octane airmixtures. SAE paper no. 2006-05-0409; 2006.
[45] Broustail G, Seers P, Halter F, Moréac G, Mounaim-Rousselle C. Experimentaldetermination of laminar burning velocity for butanol and ethanol iso-octane blends. Fuel 2011;90(1):1–6.
[46] Latha KM, Badarinath KVS. Correlation between black carbon aerosols,carbon monoxide and tropospheric ozone over a tropical urban site. Atmo-spheric Research 2004;71(4):265–74.
[47] James Szybist, Matthew Foster, Wayne R.Moore, Keith Confer, Adam Young-quist, and Robert Wagner, Investigation of Knock Limited Compression Ratioof Ethanol Gasoline Blends. SAE Technical Paper 2010-01-0619; 2010.
[48] Wu C-W, Chen R-H, Pu J-Y, Lin T-H. The influence of air–fuel ratio on engineperformance and pollutant emission of an SI engine using ethanol–gasoline-blended fuels. Atmospheric Environment 2004;38(40):7093–100.
[49] Kumar S, Cho JH, Park J, Moon I. Advances in diesel–alcohol blends and theireffects on the performance and emissions of diesel engines. Renewable andSustainable Energy Reviews 2013;22:46–72.
[50] Canakci M, Ozsezen AN, Alptekin E, Eyidogan M. Impact of alcohol–gasolinefuel blends on the exhaust emission of an SI engine. Renewable Energy2013;52:111–7.
[51] Pourkhesalian AM, Shamekhi AH, Salimi F. Alternative fuel and gasoline in anSI engine: a comparative study of performance and emissions characteristics.Fuel 2010;89(5):1056–63.
[52] Blumberg PN, Bromberg L, Kang H, Tai C. Simulation of high efficiency heavyduty SI engines using direct injection of alcohol for knock avoidance. SAEInternational Journal of Engines 2009;1(1):1186–95.
[53] Huang J, Crookes RJ. Assessment of simulated biogas as a fuel for the sparkignition engine. Fuel 1998;77(15):1793–801.
[54] Bai Y, Luo L, van der Voet E. Life cycle assessment of switchgrass-derivedethanol as transport fuel. The International Journal of Life Cycle Assessment2010;15(5):468–77.
[55] Rehnlund B, AB AE. Blending of ethanol in gasoline for spark ignitionengines. In: Proceedings of ISAF XV, San Diego, CA; Sept. 2005. p. 26–8.
[56] Hsieh WD, Chen RH, Wu TL, Lin TH. Engine performance and pollutantemission of an SI engine using ethanol–gasoline blended fuels. AtmosphericEnvironment 2002;36(3):403–10.
[57] Aydin H, İlkılıç C. Effect of ethanol blending with biodiesel on engineperformance and exhaust emissions in a CI engine. Applied ThermalEngineering 2010;30(10):1199–204.
[58] Lemaire R, Therssen E, Desgroux P. Effect of ethanol addition in gasoline andgasoline–surrogate on soot formation in turbulent spray flames. Fuel2010;89(12):3952–9.
[59] Williams PRD, Cushing CA, Sheehan PJ. Data available for evaluating the risksand benefits of MTBE and ethanol as alternative fuel oxygenates. RiskAnalysis 2003;23(5):1085–115.
[60] Wu TN, Chang CP, Wu TS, Shen YH. Emission characteristics of ethanolblending fuels from a laboratory gasoline engine. Applied Mechanics andMaterials 2013;253:2227–30.
[61] Sánchez ÓJ, Cardona CA. Trends in biotechnological production of fuelethanol from different feedstocks. Bioresource Technology 2008;99(13):5270–95.
[62] Bielaczyc P, Szczotka A, Woodburn J. The effect of various petrol–ethanolblends on exhaust emissions and fuel consumption of an unmodified light-duty si vehicle. SAE Technical Paper 2011:24–0177.
[63] Wu X, Daniel R, Tian G, Xu H, Huang Z, Richardson D. Dual-injection: theflexible, bi-fuel concept for spark-ignition engines fueled with variousgasoline and biofuel blends. Applied Energy 2011;88(7):2305–14.
[64] Chen RH, Chiang LB, Wu MH, Lin TH. Gasoline displacement and NOx reductionin an SI engine by aqueous alcohol injection. Fuel 2010;89(3):604–10.
[65] Oh H, Bae C, Min K. Spray and combustion characteristics of ethanol blendedgasoline in a spray guided DISI engine under lean stratified operation. SAEInternational Journal of Engines 2010;3(2):213–22.
[66] Turner D, Xu H, Cracknell RF, Natarajan V, Chen X. Combustion performanceof bio-ethanol at various blend ratios in a gasoline direct injection engine.Fuel 2011;90(5):1999–2006.
[67] Cooper C, Alley F. Air pollution control: a design approach 1994. Boston: PWSInc; 1986.
[68] Normann F, Andersson K, Leckner B, Johnsson F. Emission control of nitrogenoxides in the oxy-fuel process. Progress in Energy and Combustion Science2009;35(5):385–97.
[69] Lefebvre AH. The role of fuel preparation in low-emission combustion. ASMEJournal of Engineering for Gas Turbines and Power 1995;117:617–54.
[70] Alasfour FN. NOx Emission from a spark ignition engine using 30% Iso-butanol–gasoline blend: Part 1—Preheating inlet air. Applied ThermalEngineering 1998;18(5):245–56.
[71] Chong JJ, Tsolakis A, Gill SS, Theinnoi K, Golunski SE. Enhancing the NO2/NOxratio in compression ignition engines by hydrogen and reformate combus-tion, for improved aftertreatment performance. International Journal ofHydrogen Energy 2010;35(16):8723–32.
[72] Rizwanul Fattah IM, Masjuki HH, Liaquat AM, Ramli R, Kalam MA, RiazuddinVN. Impact of various biodiesel fuels obtained from edible and non-edibleoils on engine exhaust gas and noise emissions. Renewable and SustainableEnergy Reviews 2013;18:552–67.
[73] Varatharajan K, Cheralathan M. Influence of fuel properties and compositionon NOx emissions from biodiesel powered diesel engines: a review. Renew-able and Sustainable Energy Reviews 2012;16(6):3702–10.
[74] Heywood JB. Internal combustion engine fundamentals. New York: McGraw-Hill Book Co; 1988.
[75] Bowman CT. Kinetics of pollutant formation and destruction in combustion.Progress in Energy and Combustion Science 1975;1(1):33–45.
[76] Fenimore CP, Formation of nitric oxide in premixed hydrocarbon flames. In:Proceedings of the 13th international symposium on combustion. TheCombustion Institute; 1971. p. 373–80.
[77] Fluent Inc. Prompt NOx formation; 2001. Available from: ⟨http://combust.hit.edu.cn:8080/fluent/Fluent60_help/html/ug/node582.htm⟩.
[78] Miller JA, Bowman CT. Mechanism and modeling of nitrogen chemistry incombustion. Progress in Energy and Combustion Science 1989;15(4):287–338.
[79] Gardiner WC. Gas-Phase Combustion Chemistry. 175, Fifth Avenue, NewYork, NY 10010, USA: Springer-Verlag New York, Inc.; 2000.
[80] Yang W, Blasiak W. Mathematical modelling of NO emissions from high-temperature air combustion with nitrous oxide mechanism. Fuel ProcessingTechnology 2005;86(9):943–57.
[81] Galbiati MA, Cavigiolo A, Effuggi A, Gelosa D, Rota R. Mild Combustion ForFuel-Nox Reduction. Combustion Science and Technology 2004;176(7):1035–54.
[82] Najafi G, Ghobadian B, Tavakoli T, Buttsworth DR, Yusaf TF, Faizollahnejad M.Performance and exhaust emissions of a gasoline engine with ethanolblended gasoline fuels using artificial neural network. Applied Energy2009;86(5):630–9.
[83] Song CL, Zhou YC, Huang RJ, Wang YQ, Huang QF, Lü G, et al. Influence ofethanol-diesel blended fuels on diesel exhaust emissions and mutagenic andgenotoxic activities of particulate extracts. Journal of Hazardous Materials2007;149(2):355–63.
[84] Reuter R, Benson J, Burns V, Gorse R, et al. Effects of oxygenated fuels andRVP on automotive emissions—auto/oil air quality improvement program.SAE Technical Paper 1992;920326.
[85] Board CAR. Comparison of the effects of a fully-complying gasoline blendand a high rvp ethanol gasoline blend on exhaust and evaporative emis-sions: CEPA; November 1998.
[86] Naman TMA, JR. Exhaust and evaporative emissions from alcohol and etherfuel blends. SAE paper 800858; 1980.
[87] Stump FDK KT, Ray WD. Influence of ethanol-blended fuels on the emissionsfrom three pre-1985 light-duty passenger vehicles. 19961149–61Journal ofthe Air and Waste Management Association 1996;46:1149–61.
[88] Furey RLK JB. Evaporative and exhaust emissions from cars fueled with gasolinecontaining ethanol or methyl tert-butyl ether. SAE Paper 1980;800261.
[89] Rajan S. Water–ethanol–gasoline blends physical properties, power, andpollution characteristics. Journal of Engineering for Gas Turbines and Power1984;106:841–8.
[90] Rice RWS AK, Elrod AC, Bata RM. Exhaust gas emissions of butanol, ethanol,and methanol–gasoline blends. Journal of Engineering for Gas turbines andPower 1991:113.
[91] Lapuerta M, Armas O, Ballesteros R, Fernández J. Diesel emissions from biofuelsderived from Spanish potential vegetable oils. Fuel 2005;84(6):773–80.
[92] Lapuerta M, Armas O, Herreros JM. Emissions from a diesel–bioethanol blendin an automotive diesel engine. Fuel 2008;87(1):25–31.
B.M. Masum et al. / Renewable and Sustainable Energy Reviews 24 (2013) 209–222222
[93] Yücesu HS, Topgül T, Çinar C, Okur M. Effect of ethanol–gasoline blends onengine performance and exhaust emissions in different compression ratios.Applied Thermal Engineering 2006;26(17–18):2272–8.
[94] Karavalakis G, Durbin TD, Shrivastava M, Zheng Z, Villela M, Jung H. Impactsof ethanol fuel level on emissions of regulated and unregulated pollutantsfrom a fleet of gasoline light-duty vehicles. Fuel 2012;93:549–58.
[95] Schifter I, Diaz L, Gómez JP, Gonzalez U. Combustion characterization in asingle cylinder engine with mid-level hydrated ethanol–gasoline blendedfuels. Fuel 2013;103:292–8.
[96] Al-Baghdadi M. Measurement and prediction study of the effect of ethanolblending on the performance and pollutants emission of a four-stroke sparkignition engine. Proceedings of the Institution of Mechanical Engineers, PartD: Journal of Automobile Engineering 2008;222(5):859–73.
[97] Gravalos I, Moshou D, Gialamas T, Xyradakis P, Kateris D, Tsiropoulos Z.Performance and Emission Characteristics of Spark Ignition Engine Fuelledwith Ethanol and Methanol Gasoline Blended Fuels. Alternative Fuel 2011.
[98] Balki MK, Sayin C, Canakci M. The effect of different alcohol fuels on theperformance, emission and combustion characteristics of a gasoline engine.Fuel 2012.
[99] Yao Y-C, Tsai J-H, Chiang H-L. Effects of ethanol-blended gasoline on airpollutant emissions from motorcycle. Science of The Total Environment2009;407(19):5257–62.
[100] Storey JM, Barone T, Norman K, Lewis S. Ethanol blend effects on directinjection spark-ignition gasoline vehicle particulate matter emissions. SAEInternational Journal of Fuels and Lubricants 2010;3(2):650–9.
[101] Lin WY, Chang YY, Hsieh YR. Effect of ethanol–gasoline blends on smallengine generator energy efficiency and exhaust emission. Journal of the Airand Waste Management Association 2010;60(2):142–8.
[102] Broustail G, Halter F, Seers P, Moréac G, Mounaim-Rousselle C. Comparison ofregulated and non-regulated pollutants with iso-octane/butanol and iso-octane/ethanol blends in a port-fuel injection Spark-Ignition engine. Fuel2012;94:251–61.
[103] Chen YL, Chen S, Tsai CY, Sun RH, Tsai JM, Liu SY, et al. Effects of ethanol–gasoline blends on engine performance and exhaust emissions in motorcycle.In: Proceedings of the 5th international symposium on machinery andmechatronics for agriculture and biosystems engineering. Fukuoka, Japan; 2010.
[104] Yang H-H, Liu T-C, Chang C-F, Lee E. Effects of ethanol-blended gasoline onemissions of regulated air pollutants and carbonyls from motorcycles.Applied Energy 2012;89(1):281–6.
[105] Schifter I, Diaz L, Rodriguez R, Gómez JP, Gonzalez U. Combustion andemissions behavior for ethanol–gasoline blends in a single cylinder engine.Fuel 2011;90(12):3586–92.
[106] Keskin A, Gürü M. The effects of ethanol and propanol additions intounleaded gasoline on exhaust and noise emissions of a spark ignition engine.Energy Sources, Part A: Recovery, Utilization, and Environmental Effects2011;33(23):2194–205.
[107] Costa RC, Sodré JR. Compression ratio effects on an ethanol/gasoline fueledengine performance. Applied Thermal Engineering 2011;31(2–3):278–83.
[108] TCCd Melo, Machado GB, Belchior CRP, Colaço MJ, Barros JEM, de Oliveira EJ,et al. Hydrous ethanol–gasoline blends—Combustion and emission investi-gations on a Flex-Fuel engine. Fuel 2012;97:796–804.
[109] de Doz MBG, Bonatti CM, Solimo HN. Liquid–liquid equilibria of water plusethanol plus reformate. Fluid Phase Equilibria 2005;230(1–2):45–50.
[110] Alzate CAC, Toro OJS. Energy consumption analysis of integrated flowsheetsfor production of fuel ethanol from lignocellulosic biomass. Energy 2006;31(13):2447–59.
[111] Munsin R, Laoonual Y, Jugjai S, Imai Y. An experimental study on perfor-mance and emissions of a small SI engine generator set fueled by hydrousethanol with high water contents up to 40%. Fuel 2013;106:586–92.
[112] Kyriakides A, Dimas V, Lymperopoulou E, Karonis D, Lois E. Evaluation ofgasoline–ethanol–water ternary mixtures used as a fuel for an Otto engine. Fuel2013;108:208–15.
[113] Szybist J, Foster M, Moore WConfer K, Youngquist A, and Wagner R,Investigation of knock limited compression ratio of ethanol gasoline blends.SAE Technical Paper; 2010. p. 01–0619.
[114] Zheng J, Wang J, Wang B, Huang Z. Effect of the compression ratio on theperformance and combustion of a natural-gas direct-injection engine. Pro-ceedings of the Institution of Mechanical Engineers, Part D: Journal ofAutomobile Engineering 2009;223(1):85–98.
[115] Gomes P, Ecker R, Kulzer A, Kufferath A. Study on boosted direct injection sicombustion with ethanol blends and the influence on the ignition system.SAE Technical Paper; 2011. p. 36–0196.
[116] Al-Farayedhi A, Al-Dawood, A., Gandhidasan, P. Effects of blending crudeethanol with unleaded gasoline on exhaust emissions of SI engine. SAETechnical Paper 2000-01-2857; 2000.
[117] Zervas E, Montagne X, Lahaye J. Emissions of regulated pollutants from aspark ignition engine. Influence of fuel and air/fuel equivalence ratio.Environmental Science and Technology 2003;37(14):3232–8.
[118] Lawrence P, Mathews PK, Deepanraj B. Experimental investigation onZirconia coated high compression spark ignition engine with ethanol as fuel.Journal of Scientific and Industrial Research 2011;70:789–94.
[119] Sales LCM, Sodré JR. Cold start emissions of an ethanol-fueled engine withheated intake air and fuel. Fuel 2012;95:122–5.
[120] Chen R-H, Chiang L-B, Chen C-N, Lin T-H. Cold-start emissions of an SI engineusing ethanol–gasoline blended fuel. Applied Thermal Engineering 2011;31(8–9):1463–7.
[121] Liao S, Jiang D, Cheng Q, Huang Z, Wei Q. Investigation of the cold-startcombustion characteristics of ethanol–gasoline blends in a constant-volumechamber. Energy and Fuels 2005;19(3):813–9.
[122] Yao Y-C, Tsai J-H, Wang IT. Emissions of gaseous pollutant from motorcyclepowered by ethanol–gasoline blend. Applied Energy 2013;102:93–100.
[123] Wen L-b, Xin C-Y, Yang S-C. The effect of adding dimethyl carbonate (DMC)and ethanol to unleaded gasoline on exhaust emission. Applied Energy2010;87(1):115–21.
[124] Yoon S, Ha S, Roh H, Lee C. Effect of bioethanol as an alternative fuel on theemissions reduction characteristics and combustion stability in a sparkignition engine. Proceedings of the Institution of Mechanical Engineers, PartD: Journal of Automobile Engineering 2009;223(7):941–51.
[125] Velliangiri M, Krishnan A. An experimental investigation of performance andemission in ethanol fueled direct injection internal combustion engines withzirconia coating. Journal of Energy Technologies and Policy 2012;2(2):42–53.
[126] Murali Krishna M, Kishor K, Murthy P, Gupta A, Narasimha Kumar S.Comparative studies on Performance evaluation of a two stroke coppercoated spark ignition engine with alcohols with catalytic converter. Renew-able and Sustainable Energy Reviews 2012;16(8):6333–9.
[127] Ramesh Kumar C, Nagarajan G. Performance and emission characteristics of alow heat rejection spark ignited engine fueled with E20. Journal of Mechan-ical Science and Technology 2012;26(4):1241–50.
[128] Srinivasan CA, Saravanan C. Emission reduction in SI engine using ethanol–gasoline blends on thermal barrier coated pistons. International Journal ofEnergy and Environment 2010;1:715–26.
[129] Anderson E., Cyr J., Cordon D, Steciak J, Beyerlein S, and Budwig R, Compres-sion ratio and catalyst aging effects on aqueous ethanol ignition (Year 2): Part1. Compression Ratio Effects on Aqueous Ethanol Ignition; 2009.
[130] Yanowitz J, Knoll K, Kemper J, Luecke J, McCormick RL. The impact ofadaption on flex-fuel vehicle emissions when fueled with E40. Environmen-tal Science and Technology 2013;47(6):2990–7.
[131] Zhai H, Frey HC, Rouphail NM, Goncalves GA, Farias TL. Comparison of flexiblefuel vehicle and life-cycle fuel consumption and emissions of selectedpollutants and greenhouse gases for ethanol 85 versus gasoline. Journal ofthe Air and Waste Management Association 2009;59:8.
[132] Motavalli J. Flex-fuel amendment makes for strange bedfellows; 2012.Available from: ⟨http://wheels.blogs.nytimes.com/2012/03/01/flex-fuel-amendment-makes-for-strange-bedfellows/⟩ [20.02.13].
[133] Pickett J. Sustainable biofuels: prospects and challenges. Policy 2008:1–90.[134] Yao YC, Tsai JH, Chou HH. Air pollutant emission abatement using application
of various ethanol-gasoline blends in high-mileage vehicles. Aerosol and AirQuality Research 2011;11(5):547–59.
[135] Durbin TD, Miller JW, Younglove T, Huai T, Cocker K. Effects of fuel ethanolcontent and volatility on regulated and unregulated exhaust emissions forthe latest technology gasoline vehicles. Environmental Science and Technol-ogy 2007;41(11):4059–64.
[136] Mayotte S, Lindhjem C, Rao V, Sklar M. Reformulated gasoline effects onexhaust emissions: phase i: initial investigation of oxygenate, volatility,distillation and sulfur effects. SAE Technical Paper 1994;941973:1994,http://dx.doi.org/10.4271/941973.
[137] Association AL. Testimony of A. Blakeman early presented on behalf of theAmerican Lung Association before the Senate Environment and Public WorksCommittee Subcommittee on Clean Air and Nuclear Safety; 2009.
[138] Naidenko OV. Ethanol–gasoline fuel blends may cause human health risksand engine issues. Environmental Working Group; 2009: Washington, DC.
[139] Knoll K, West B, Clark W, Graves R, Orban J, Przesmitzki S, Theiss T. Effects ofintermediate ethanol blends on legacy vehicles and small non-road engines,Report 1—Updated. Oak Ridge, TN: National Renewable Energy Laboratory; 2009.
[140] Hilton B, Duddy B. The effect of E20 ethanol fuel on vehicle emissions.Proceedings of the Institution of Mechanical Engineers. Part D: Journal ofAutomobile Engineering 2009;223(12):1577–86.
[141] Özgören YÖ, Çetinkaya S, Sarıdemir S, Çiçek A, Kara F. Predictive modeling ofperformance of a helium charged Stirling engine using an artificial neuralnetwork. Energy Conversion and Management 2013;67:357–68.
[142] Kara Togun N, Baysec S. Prediction of torque and specific fuel consumption ofa gasoline engine by using artificial neural networks. Applied Energy 2010;87(1):349–55.
[143] Oğuz H, Sarıtas I, Baydan HE. Prediction of diesel engine performance usingbiofuels with artificial neural network. Expert Systems with Applications2010;37(9):6579–86.
[144] Yusaf TF, Buttsworth DR, Saleh KH, Yousif B. CNG-diesel engine performanceand exhaust emission analysis with the aid of artificial neural network.Applied Energy 2010;87(5):1661–9.
[145] Tütüncü K and Allahverdi N Modeling the performance and emissioncharacteristics of diesel engine and petrol-driven engine by ANN. In:Proceedings of the International Conference on Computer Systems andTechnologies and Workshop for PhD Students in Computing, ACM; 2009.
[146] Yap WK, Ho T, Karri V. Exhaust emissions control and engine parametersoptimization using artificial neural network virtual sensors for a hydrogen-powered vehicle. International Journal of Hydrogen Energy 2012.
[147] Obodeh O, Ajuwa C. Evaluation of artificial neural network performance inpredicting diesel engine NOx emissions. European Journal of ScientificResearch 2009;33(4):642–53.
[148] Deh Kiani MK, Ghobadian B, Tavakoli T, Nikbakht AM, Najafi G. Application ofartificial neural networks for the prediction of performance and exhaust emis-sions in SI engine using ethanol- gasoline blends. Energy 2010;35(1):65–9.