Effect of Electric Field on Growth Kinetics of Yogurt Starter ...
85
Effect of Electric Field on Growth Kinetics of Yogurt Starter Cultures, Lactobacillus bulgaricus and Streptococcus thermophilus THESIS Presented in Partial Fulfillment of the Requirements for the Degree Master of Science in the Graduate School of The Ohio State University By Seth Robert Costello, B.S. Graduate Program in Food Science and Technology The Ohio State University 2012 Master's Examination Committee: Ahmed Yousef, Advisor Sudhir Sastry Luis Rodriguez-Saona
-
Upload
khangminh22 -
Category
Documents
-
view
2 -
download
0
Transcript of Effect of Electric Field on Growth Kinetics of Yogurt Starter ...

Effect of Electric Field on Growth Kinetics
of Yogurt Starter Cultures,
Lactobacillus bulgaricus and Streptococcus thermophilus
THESIS
Presented in Partial Fulfillment of the Requirements for the Degree Master of Science in
the Graduate School of The Ohio State University
By
Seth Robert Costello, B.S.
Graduate Program in Food Science and Technology
The Ohio State University
2012
Master's Examination Committee:
Ahmed Yousef, Advisor
Sudhir Sastry
Luis Rodriguez-Saona

Copyrighted by
Seth Robert Costello
2012

ii
Abstract
The effect of electric field on microorganisms has been a topic of research since the late
1800's. The vast majority of research relating to electric field since then has been on the
inactivation of microorganisms. Although there were many claims to the lethal effects of
electricity, it wasn't until the 1960's, when pulsed electric field was first used to inactivate
microorganisms, that these claims were validated. With most of the attention on
inactivating microorganisms, how electric field interacts with cells as well as the
possibility of stimulation of growth was overlooked. It has only been in the past 30 years
or so that valid, verifiable research has been conducted in the area of stimulating
microbial growth through the application of electric fields. Fully understanding how
electric fields stimulate microbial growth could have huge implications in the food
industry, especially the fermented food industry. More research is needed to determine
how electric fields interact with microorganisms and what conditions cause a stimulating
effect.
The objective of this research was to evaluate the effects of various electric fields,
including moderate electric field (MEF) and pulsed electric field (PEF), on the growth
kinetics of various lactic acid bacteria in order to expand upon research that was
previously limited to only Lactobacillus acidophilus.

iii
Common yogurt starter cultures, Lactobacillus bulgaricus and Streptococcus
thermophilus, were subjected to MEF during fermentation in de Man Rogosa Sharpe
(MRS) broth. The electric field strength remained constant throughout all experiments at
1 V/cm. Two vessels were created to allow for side by side fermentation comparison.
One vessel was ohmically heated by passing a current through the MRS broth and the
other vessel was heated conventionally using a heated water jacket. Fractions of the
fermentation over time were collected for microbial enumeration as well pH
measurement. Fermentation by S. thermophilus at 35°C with 45Hz MEF showed a
reduced lag time of 2 hours 6 minutes as compared to the control which had a lag time of
2 hours 45 minutes. Increasing the temperature or frequency resulted in loss of the
reduced lag time for S. thermophilus. L. bulgaricus showed no significant difference in
growth or pH between the control and all treatments.
The effect of pulsed electric field on the growth kinetics of various strains of
lactic acid bacteria (LAB) was also investigated. Two fermentation vessels (for treatment
and control) were filled with MRS broth and held at either 25°C or 35°C. The broth was
inoculated with L. bulgaricus, S. thermophilus, or Lactococcus lactis (L. lactis) and was
exposed to PEF at strengths ranging from 2-10 kV/cm during fermentation. Fractions of
the fermentation collected over time were plated for microbial enumeration, tested for
pH, and in the case of L. lactis, assayed for bacteriocin production. There was no growth
stimulation effect observed for any culture at the conditions tested in these experiments.
A general trend of reduced growth was seen as electric field was increased for both S.
thermophilus and L. bulgaricus. It was hypothesized that L. lactis may produce the

iv
bacteriocin nisin at an increased rate due to cell stress and self induction from pore
formation caused by the PEF treatments, but the opposite was found. The control
produced nisin slightly faster showing the first clearing zone (200 arbitrary units) at 10
hours with the treated showing the first clearing zone (200 arbitrary units) at 11 hours.
Although a stimulation effect was not observed in these experiments, further research
utilizing differing treatment parameters would be needed in order to claim that mild PEF
does not cause the stimulation of bacterial growth.

v
Acknowledgments
I would like to offer my deepest gratitude to my advisor, Dr. Ahmed Yousef, for
believing in me and taking me on as student in his lab at The Ohio State University. You
always offered your knowledge and wisdom not only in the area of academia but also in
life. You have taught me how to be a better scientist, teacher and person and for that I
will be forever grateful. To my committee members; Dr. Sudhir Sastry and Dr. Luis
Rodriguez-Saona, thank you for all your suggestions and help.
I would also like to thank the members of Dr. Yousef's lab that I had the pleasure
of knowing and working with; Dr. Jennifer Perry, Dr. Joy Waite, Dr. Yuan yan, Dr. Jin-
Gab Kim, Joe Jones, En Huang, Amrish Chawla, Yaoqui Guo, Marilia Pena, Goksel
Tirpanci, David Kasler and Mustafa Yesil. I also wanted to give a special thanks to Dr.
Jennifer Perry for her guidance and patience with me in the lab. I would have not
accomplished what I have today if it wasn't for your desire to help others and your ability
to lead. I also wanted to specifically thank David Kasler for helping me build the
fermentors as well as troubleshooting any problems that I ran into. Your knowledge and
patience saved me many hours.
Lastly I would like to thank my wife who put up with many long nights apart
from me while I was in the lab. I would never have been able to complete this without
your encouragement and patience. Thank you.

vi
Vita
November 1986 ........................................... Maple Hts, Ohio
2009 ............................................................ B.S. Biology, The Ohio State University
2010 to present ........................................... Graduate Research and Teaching Associate,
Food Science and Technology, The Ohio
State University
Fields of Study
Major Field: Food Science and Technology
vii
Table of Contents
Abstract .......................................................................................................................... ii
Acknowledgments ...........................................................................................................v
Vita ............................................................................................................................... vi
List of Tables............................................................................................................... viii
List of Figures ........................................................................................................... viiix
Chapter 1: Literature Review ...........................................................................................1
Chapter 2: Growth Kinetics of Lactobacillus bulgaricus and Streptococcus thermophilus
Under Moderate electric field............................................................................................29
Chapter 3: Growth Kinetics of Lactobacillus bulgaricus, Streptococcus thermophilus, and
Lactococcus lactis Treated With Pulsed Electric Field.....................................................49

viii
List of Tables
Table 1.1 Differences between Bacteriocins and Antibiotics............................................11
Table 1.2 Various Pulsed Electric Field Parameters..........................................................18
Table 2.1 Treatment Conditions........................................................................................37
Table 2.2 Growth Parameters and pH Change for Different Treatments of Streptococcus
thermophilus......................................................................................................................39
Table 2.3 Growth Parameters of Lactobacillus bulgaricus under Different Treatments
Conditions..........................................................................................................................40
Table 3.1 Various Electric Field Strength Treatments Applied to Various LAB during
Fermentation......................................................................................................................61
Table 3.2 Growth Parameters and pH Change for Different PEF Treatments of
Streptococcus thermophilus at 35°C..................................................................................63
Table 3.3 Growth Parameters and pH Change for Different PEF Treatments of
Lactobacillus bulgaricus at 35°C......................................................................................64
Table 3.4 Growth Parameters and pH Change for Different PEF Treatments of
Lactococcus lactis at 25°C.................................................................................................65

ix
List of Figures
Figure 1.1 Streptococcus salivarius subsp. thermophilus....................................................3
Figure 1.2 Lactobacillus delbrueckii subsp. thermophilus..................................................4
Figure 1.3 Homofermentation and Heterofermentation Pathways......................................6
Figure 1.4 Scanning Electron Microscope Picture of Lactococcus lactis subsp. lactis.....10
Figure 1.5 Electric Field (arrows) Surrounding a Positive and Negative Charge.............12
Figure 1.6 Sine Wave with Parameters..............................................................................14
Figure 1.7 Various Wave Shape Possibilities....................................................................14
Figure 1.8 Theorized Method of Inactivation of Vegetative Cells via Pulsed Electric
Field...................................................................................................................................16
Figure 1.9 Relationship Between Field Strength and Microbial Inactivation...................19
Figure 2.1 Confirmed Lactobacillus bulgaricus from Blast Results of 16s Sequence......32
Figure 2.2 Real Picture of Fermentation Vessel Schematic of Fermentation Vessel........34
Figure 2.3 Schematic of MEF Treated and Control Fermentation Vessels......................35
Figure 2.4 Sine Wave of Voltage at 45 Hz and 60 Hz.......................................................35
Figure 2.5 Log CFU and pH over Time of S. thermophilus Treated with 45 Hz MEF at
44°C...................................................................................................................................43

x
Figure 2.6 Log CFU and pH over Time of S. thermophilus Treated with 60 Hz MEF at
35°C...................................................................................................................................43
Figure 2.7 Log CFU and pH over Time of S. thermophilus Treated with 45 Hz MEF at
35°C...................................................................................................................................44
Figure 2.8 Log CFU and pH over Time of L. bulgaricus Treated with 60 Hz MEF at
35°C...................................................................................................................................45
Figure 2.9 Log CFU and pH over Time of L. bulgaricus Treated with 60 Hz MEF at
35°C...................................................................................................................................45
Figure 3.1 Schematic of Pulsed Electric Field Experimental Setup..................................53
Figure 3.2 Top View of Pulsed Electric Field System.......................................................54
Figure 3.3 Treatment Chamber Teflon Insulation with Drilled Holes to Create Isolated
Treatment Chambers..........................................................................................................55
Figure 3.4 Vertical Cross Section of the Teflon Insulation...............................................56
Figure 3.5 PEF Treatment Area with four Treatment Chambers in use............................56
Figure 3.6 Bi-polar Square Wave......................................................................................57
Figure 3.7 Activity of Nisin on Tryptic Soy Agar Seeded with L. cellobiosis..................63
Figure 3.8 Log CFU and pH over Time of S. thermophilus Treated with 10 kV PEF at
35°C...................................................................................................................................69
Figure 3.9 Log CFU and pH over Time of S. thermophilus Treated with 8 kV PEF at
35°C...................................................................................................................................69

xi
Figure 3.10 Log CFU and pH over Time of S. thermophilus Treated with 7 kV PEF at
35°C...................................................................................................................................70
Figure 3.11 Log CFU and pH over Time of S. thermophilus Treated with 5 kV PEF at
35°C...................................................................................................................................70
Figure 3.12 Log CFU and pH over Time of L. bulgaricus Treated with 10 kV PEF at
35°C...................................................................................................................................71
Figure 3.13 Log CFU and pH over Time of L. bulgaricus Treated with 5 kV PEF at
35°C...................................................................................................................................71
Figure 3.14 Log CFU and pH over Time of L. bulgaricus Treated with 2 kV PEF at
35°C...................................................................................................................................72
Figure 3.15 Log CFU and pH over Time of L. lactis Treated with 7 kV PEF at
35°C...................................................................................................................................72

1
Chapter 1
Literature Review
Lactic Acid Bacteria
Lactic acid bacteria (LAB) are a clade of bacterial species that exhibit similar phenotypic
properties. The following are typical phenotypic traits expressed amongst LAB: Gram-
positive, non-spore-forming, catalase-negative, devoid of cytochromes, fermentative with
aerotolerance, fastidious, acid tolerance, and lactic acid is the major end product during
sugar fermentation. (Salminen and others 2004). Although these are the typical traits
expressed by LAB, there are exceptions to all of these rules, except for Gram reaction.
LAB have been thoroughly studied due to their common presence in nutrient rich food
like milk and meat as well as their presence in the mouth, intestinal tract, and vagina of
mammals (Wood and Holzapfel 1995).
In the food industry, LAB are of particular interest due to their ability to ferment
milk into yogurt or cheese, meat into sausage, cabbage into sauerkraut, and others. In the
last couple of decades, LAB probiotics have become a point of interest. Some of the
species within the LAB clade that are reported to have probiotic effects include
Lactobacillus spp. and Lactococcus spp. Some of the probiotic effects of LAB include
the treatment and prevention of diarrhea, irritable bowel syndrome (Halpern and others
1996), inflammatory bowel disease (Saarela and others 2002), as well as the possible

2
reduction of cancerous colon tumors (Reddy 1999). The fermentation of food with LAB
has been done for over 8,000 years (Yildez 2009). LAB are common contaminates of
milk due to their ubiquitous nature as well as their ability to ferment lactose (the main
sugar in milk) and were unknowingly used to make fermented food products. One of the
most common fermented food products around the world is yogurt. While many different
kinds of LAB can ferment milk, in the United States and Europe, a fermented milk
product can only be called yogurt if it is fermented with Streptococcus thermophilus and
Lactobacillus bulgaricus (US-FDA 2011a).
Streptococcus salivarius subsp. thermophilus
Streptococcus salivarius subsp. thermophilus (S. thermophilus) was not always classified
under salivarius species. Originally it was only classified as Streptococcus thermophilus.
With the rise of genotyping in the 1980's, the Streptococcus genus was split into three
genera, Streptococcus, Enterococcus, and Lactococcus (Stiles and Holzapfel 1997).
Streptococcus is farther divided into three general groups: pathogenic, oral, and other.
The oral group is then divided into five phylogenetic subgroups: salivarius, mitis,
anginosus, bovis, mutans (Salminen and others 2004). While currently thermophilus is a
sub-species, there are some who believe it deserves to be a species of Streptococcus
(Stiles and Holzapfel 1997). S. thermophilus is a Gram-positive, facultative anaerobic
coccus that arranges in chain patterns. This microorganism was first described by Orla-
Jensen (Sherman and Stark 1931). It was named thermophilus due to its ability to grow
at elevated temperatures, 45ºC to 50ºC, and its dislike for lower temperatures (4ºC).

3
Although it can grow at higher temperatures, S. thermophilus' optimal temperature is
37ºC (Sherman and Stark 1931). Currently S. thermophilus is the only Streptococcus
isolate that is used in food technology. It is used predominantly as a yogurt starter
culture and is inoculated along with Lactobacillus bulgaricus due to their synergistic
effect (Yildez 2009).
Figure 1.1 Streptococcus salivarius subsp. thermophilus
(http://www2.unibas.it/parente/Risorsepersonale/Stherm.jpg)
Lactobacillus delbrueckii subsp. bulgaricus
Lactobacillus delbrueckii subsp. bulgaricus (L. bulgaricus) is a Gram-positive, non-
motile, anaerobic, non spore-forming rod, that has an optimal growth temperature of 44ºC
(Germond and others 2003). It was named bulgaricus after the Bulgarians whose known
longevity and healthy lives were attributed to the consumption of large amounts of yogurt
(Yildez 2009). Today, Lactobacillus is divided into three groups based on the most
common fermentation pathway utilized by each isolate; obligate homofermenter, obligate
heterofermenter, or facultative heterofermenter. L. bulgaricus falls under the category

4
obligate homofermenter (Yildez 2009). L. bulgaricus is one of three subspecies of L.
delbrueckii. The others are L. delbrueckii subsp. lactis and L. delbrueckii subsp.
delbrueckii. While the others are used in fermentations, L. bulgaricus is one of the two
cultures used in the production of yogurt and is considered the flavor producing strain
(Tribby 2009). L. bulgaricus is inoculated alongside S. thermophilus due to their
synergistic effects.
Figure 1.2 Lactobacillus delbrueckii subsp. thermophilus (Yildez 2009)
Synergy between L. bulgaricus and S. thermophilus
Synergy in biology is when two or more organisms work together to achieve an enhanced
effect that would not be produced singly (Biology-online.org 2011). In the case of
synergy between L. bulgaricus and S. thermophilus in milk, the two grow faster in the
presence of each other then they do separately. When fermented together, S.
thermophilus grows the fastest in the beginning due to its aerotolerance. S. thermophilus
has greater peptidase activity while L. bulgaricus has a greater proteolytic ability

5
(Chandan 2006). The combination of these enzymes allows for faster acquisition of
nutrients that would not be available if milk was fermented with each organism
separately. S. thermophilus also acidifies the environment which creates better growing
conditions for L. bulgaricus. Lastly, S. thermophilus produces carbon dioxide which has
also been found to stimulate L. bulgaricus growth (Driessen and others 1982). Today,
this synergistic effect is utilized in the lactofermentation of yogurt.
Lactofermentation
Fermentation is an anaerobic process microorganisms utilize to get energy from various
carbon sources. In lactofermentation, there are two fermentation pathways:
heterofermentation (heterolactic), homofermentation (homolactic). Homolactic bacteria
(e.g., L. bulgaricus, S. thermophilus) use the Embden-Meyerhof (EM) pathway
(Mehrotra, R.S., Sumbali, G. 2009).
Glucose + 2ADP + 2Pi → 2 Lactic acid + 2ATP
This is considered a homolactic fermentation due to the fact that there is only one
byproduct, lactic acid. Heterolactic bacteria use the pentose phosphate pathway.
Glucose +ADP + Pi → Lactic acid + ethanol + CO2 + ATP
This pathway yields less energy per glucose molecule as compared to the EM pathway
but includes the production of ethanol and CO2. In both pathways lactose is the
beginning carbon source. It is a disaccharide made of galactose and glucose. The lactose
is hydrolyzed by splitting the β-linked glucose/galactose. The galactose is then converted
into glucose, the starting sugar of the EM and pentose phosphate pathways (Figure

6
1.3). Some of the more common food fermentations carried out by LAB today include
yogurt (Streptococcus spp. and Lactobacillus spp.), certain cheeses (e.g., Lactococcus
spp.), sauerkraut (e.g., Leuconostoc spp.), sausage (e.g., Pediococcus spp.), and kimchi
(variety of LAB).
Figure 1.3 Homofermentation and Heterofermentation pathways (Caplice 1999)

7
Yogurt
Yogurt is produced through the fermentation of milk with S. thermophilus and L.
bulgaricus. The bacteria consume the lactose present in the milk and through
fermentative pathways, excrete lactic acid. This lactic acid, along with other excreted
acids (i.e., formic acid), reduce the pH of milk (approx. 6.5) to about a pH of 4.5. At this
lower pH, milk proteins, especially casein, with the help of proteolytic enzymes, denature
and coagulate to form curds (Yildez 2009). The temperature used for fermentation is
43ºC. The optimal growth temperature of S. thermophilus is about 39ºC while for L.
bulgaricus it is 45ºC. Traditionally the ratio of the inocula of S. thermophilus to L.
bulgaricus is 1:1 but inoculation at higher levels of thermophilus to bulgaricus is also
used (Chandan 2006). This is due to the fact that S. thermophilus is considered the main
pH decreaser while L. bulgaricus is considered the main flavor producer. Varying these
ratios changes fermentation time as well as flavor and yogurt gel structure.
There are two methods of fermentation that are used in the yogurt industry today;
stirred style and set style. Stirred style is a batch fermentation where large fermentors are
used to make yogurt in large quantities. The resulting product is then stirred and
dispensed into smaller packages. Set style fermentation is where the inoculated milk with
all of the added ingredients is put into the final package before the fermentation begins.
Set style can be done in batch or can be done continuously. The cups are then incubated
for approximately 4-6 hours before being cooled and shipped. In the food industry today,
having a continuous process is highly efficient and desired. Considering that stirred style
yogurt batch fermentation cannot be a continuous workflow, decreasing the fermentation

8
time while maintaining yogurt quality has been a point of interest. The fermentation is
considered complete when the pH reaches 4.2-4.3 (Yildez 2009). Changing the standard
conditions to favor for a faster fermentation normally leads to undesired effects.
Soukoulis and others (2007) shortened the incubation period by adding whey powder but
found this produced a consistency of yogurt that was undesirable. Aguirre-Ezkauriatza
and others (2008) decreased the fermentation period by agitating during fermentation but
also reported a decrease in viscosity as well as whey retention. Milk pre-treated with
proteolytic enzymes before fermentation showed a reduced fermentation period but the
resulting product had poor water retention and different physical properties than standard
yogurt (Gassem and Frank 1991).
Lactococcus lactis subsp. lactis
Lactococcus lactis subsp. lactis (L. lactis) is a LAB of great importance to dairy
fermentation. This species is very common in the food industry today and is typically a
cheese starter culture. It is a Gram-positive, nonpathogenic, which is facultatively
anaerobic, with a main fermantative end product of L-lactic acid (Teuber M. 2009). This
microorganism used to be categorized under Streptococcus lactis but further investigation
of DNA showed that a group of the previous Streptococcus genus showed significant
similarities that were different from the rest of the genus, thus warranting a new genus
(Schleifer and others 1985). L. lactis is a natural contaminant of milk and today the
culture is used in the production of cheeses that are cooked around the temperature of
40ºC (Fox and McSweeney 2004). L. lactis is also used in the food industry for its

9
production of a class I bacteriocin, nisin. This bacteriocin is known to have antimicrobial
properties against a wide range of Gram-positive bacteria (Teuber M. 2009; Ramasamy
and others 2006). L. lactis is not only used in the food industry but also in the medical
sciences and is considered to be the most fully sequenced lactic acid bacterium (Bolotin
and others 2001).
Current medical research regarding the use of L. lactis has been in the area of
using the bacterium in vaccination. The bacteria are genetically engineered to produce
proteins of a specific pathogen and inoculated in the nasal mucosa (Norton and others
1997). An immunological response is elicited and the appropriate antibodies are created
without there ever being a threat of infection. This has been shown to be effective in
mice for various pathogens including Helicobacter pylori (Lee and others 2001), Brucella
abortus (Ribeiro and others 2002), Streptococcus pneumoniae (Hanniffy and others
2007), as well as non-bacterial diseases such as HIV (Xin and others 2003), malaria
(Ramasamy and others 2006), and human papillomavirus (Bermudez-Humaran and
others 2005).
Bacteriocin
Bacteriocins are antimicrobial peptides that express activity against other Gram-
positive bacteria with a ranging effectiveness. They are categorized into the following
groups; lantibiotics (Class I); small non-lantibiotics (class II); large non-lantibiotics (class
III) (Cintas and others 2001). The larger (>30 kDa) non-lantibiotics are heat sensitive
while the smaller (<10 kDa) are heat stable (Cintas and others 2001). The bacteriocins

10
mode of inactivation vary depending on the specific bacteriocin but the most common
modes of inactivation are increased permeability of the membrane through pore
formation and dissipation of the proton motive force (PMF) (Héchard and Sahl 2002).
Figure 1.4 Scanning electron microscope picture of Lactococcus lactis subsp. lactis
(Teuber M. 2009).
While some bacteriocins act slowly through inhibiting biosynthesis of the cell wall,
others, like nisin, rapidly kill cells by pore formation and the leaking of intracellular
materials (Héchard and Sahl 2002). The producing strains themselves are protected from
their own bacteriocin through the expression of immunity proteins (Cintas and others
2001). Although there are similarities between bacteriocins and antibiotics, they are
considered different for several reasons including toxicity and activity (Table 1.2).
The most studied and commercially used bacteriocin is nisin (class I) (Cintas and
others 2001). Nisin is produced by the species Lactococcus lactis and is known for
having very strong activity against a wide range of Gram-positive bacteria including

11
Staphylococcus aureus, Listeria monocytogenes and Clostridium botulinum (Hurst 1981;
Cintas and others 1998). Nisin is also unique in that it is stable at low pH. This makes it
a great bacteriocin to be used as a food additive and is currently the only bacteriocin
approved by FDA (US-FDA 2011b).
Due to bacteriocins antibacterial activity and the wide range of food products they
can be used in, many studies have been completed in the area of increasing the
production of bacteriocins (Hirsch 1951; Jozala and others 2005; De Vuyst and others
1996) including the use of electric fields (Loghavi and others 2007)
Table 1.1 Differences between bacteriocins and antibiotics (Cleveland and others 2001)
Characteristics Bacteriocins Antibiotics Application Food Clinical
Synthesis Ribosomal Secondary metabolite
Activity Narrow spectrum Varying spectrum
Host cell
immunity
Yes No
Mechanism of
target cell
resistance or
tolerance
Usually adaptation
affecting cell membrane
composition
Usually a genetically transferable
determinant affecting different sites
depending the mode of action
Interaction
requirements
Sometimes docking
molecules
Specific target
Mode of action Mostly pore formation, but
in a few cases possibly cell
wall biosynthesis
Cell membrane or intracellular targets
Toxicity/side
effects
None known Yes

12
Electric Field
Electric fields were first defined by physicist Michael Faraday. Electric fields are maps
of the force that is exerted on electrically charged objects (test charge) in the vicinity of
an electrically charged object (Figure 1.5). This force is described in Newtons per
coulomb (N C -1
) or volts per centimeter (V/cm). The relationship of the object’s charge
(test charge) and its position within the electric field in relation to force is described as
follows: F = q* E (Pender 1910); where “F” is the force experienced by the particle, “q”
is the charge of the particle, and “E” is the position of the charge within the electric field.
Electric field strength can be defined as the force exerted on a positive test charge of 1
coulomb. In the case of using two electrodes, electric field strength can be defined as the
voltage divided by distance.
Figure 1.5 Electric field (arrows) surrounding a positive and negative charge
13
Electricity
Electricity is a phenomenon where charged particles (e.g., electrons) interact with the
atoms of a substance. For simple physics, electricity can be defined by these three
parameters: resistance, current, and voltage. Resistance is a property of a substance
which resists the flow of an electrical charge. Insulators have very high resistance while
conductors have low resistance. This property is measured in Ohms (Ω). Current is the
measurement of the flow of the electrical charge and is measured in amps (A). One
ampere is the flow of 6 x 10¹⁸
electrons per second through a substance (Anderson 2008).
Voltage (V) is the measure of the potential or the ability to move an electrical charge
through a resistance. These three parameters of electricity are related by the following
equation: V = I*R (voltage = current * resistance).
Current can be further defined as alternating current (AC) or direct current (DC).
Alternating current periodically reverses the flow of electrons. This change in current
typically takes the form of a sine wave (Figure 1.6). One period is the time it takes for
the signal of the sine wave to complete one cycle (the distance it takes before the sine
wave repeats itself). The number of cycles completed in 1 second is called a Hertz (Hz).
The electricity most common in households today is alternating current at 50 or 60 Hz
depending on the country. The wave form of alternating current does not necessarily
have to be a sine wave. With the proper equipment (i.e. wave generator) you can
generate waves in the form of pulses, saw-tooth, triangle, etc. (Figure 1.7).

14
Figure 1.6 Sine wave with parameters
Figure 1.7 Various wave shape possibilities

15
Electroporation
The use of electric field to create pores in membranes of prokaryotic and eukaryotic cells
has been studied since the 1970's. Electroporation is the formation of a pore across the
membrane due to electromechanical compression and electric field-induced tension
(Wouters and others 2001b). Electropermeabilization is the term used to describe the
phenomenon in which there is a significant increase in membrane permeability due to
electric fields (Ohshima and others 1995; Wouters and others 2001a; Wouters and others
2001b). The degree of electric field required in order for the breakdown of the membrane
is in the range of 200-1,000 mV across the membrane (Sale and Hamilton 1967; Chassy
1988). This critical membrane potential varies due to different membrane composition,
cell diameter, and cell-wall characteristics (Chassy 1988). Two theories have been
proposed as the cause of death from high electric fields. The first is that pores are formed
across the membrane and that the uncontrolled flow of water in, and intracellular fluids
out due to osmotic pressure, causes the cell to swell and eventually rupture (Figure 1.8)
(Vega-Mercado and others 1996). The second theory suggests cell death from chemical
stress associated with molecular transport (Wouters and others 2001a; Wouters and
others 2001a). Today, electroporation is primarily used in transformation of
microorganisms. Strong electric fields are generated and pulsed across a suspension of
target cells and DNA. DNA, which is normally unable to cross the cell membrane, is
now able to do so due to pore formation.

16
Figure 1.8 Theorized method of inactivation of vegetative cells via Pulsed Electric Field
(Vega-Mercado and others 1996)
Pulsed Electric Field
Pulsed electric field (PEF) is an emerging non-thermal processing technology. It uses
electric fields, in the 20-80 kV range, that are pulsed to inactivate microorganisms
without the application of heat. This can allow for a better retention of the food product
structure/flavor and overall "freshness" as compared to thermal processing (Evrendilek
and others 2000; Rivas and others 2006). While heat is not the mode of inactivation,
there is some heat generated due to Joule's Law: Q = I2 *R * t. Where Q = heat expressed
(in Joules), I = current (in amperes), R = resistance (in ohms), and t = time (in seconds).
The increase in heat of the food product is minimal due to the short time exposed to
electric fields (in the range of microseconds) and varies depending on the conductivity of

17
the food sample, electric field strength, and pulse duration. PEF is suitable for the
pasteurization of liquid or semi-liquid food including milk, juices, yogurt, soups, and
liquid eggs (Raghupathy and others 2005). Currently, Genesis Juice Corp. is the only
known company in America approved by the FDA to processes juice via PEF.
Although PEF is a promising new technology, there are limitations for its
application in food. Products with high conductivity or bubbles can cause arcing which
will drastically increase local temperature and cause the formation of unwanted radicals.
It has also been found that when food products of lower conductivity are exposed to PEF,
there is greater inactivation as compared to those of higher conductivity (Wouters and
others 2001b). The effect of product pH on inactivation varies dependent on the
microorganism (Wouters and others 2001a). Lower water activity has been shown to
reduce inactivation of target microorganisms (Mi and others 2002). Another limitation is
that PEF is only effective against vegetative cells and not spores (Grahl and Märkl 1996).
The effectiveness against vegetative cells varies depending on species and strain (Figure
1.9). It has been suggested that efficiency of PEF treatment depends on cell size and
shape (Kekez and others 1996; Wouters and others 2001b). Lastly, there is a limitation in
how research completed in this area can be compared. All of the variables in Table 1.1
need to be taken into consideration when comparing results of various PEF research
designs. While some processing variables can be accounted for easily (e.g., pulse length
and electric field strength), others, including gap, volume and chamber configuration are
difficult to assess their contribution to process lethality. It is also important to note what
growth phase the microorganisms are in when subjected to PEF. It has been shown that

18
cells in exponential phase are more sensitive to PEF treatment then lag and stationary
phases (Pothakamury and others 1996). While PEF is intentionally used in the
processing of food samples there are also lower electric fields that occur unintentionally
as a result of electrically heating (ohmic heating) food.
Table 1.2 Various Pulsed Electric Field parameters (Wouters and others 2001b)
Process parameters Microbial characteristics Product
parameters
Electric field strength Growth conditions: Initial inoculum Composition
Pulse length Medium composition Conductivity
Number of pulses Temperature Ionic strength
Start temperature Oxygen concentration pH
End temperature Growth phase: Time of incubation Aw
Pulse shape Recovery conditions: Medium
composition
Treatment chamber:
Configuration
Temperature
Volume Recovery time
Gap Oxygen concentration
Flow ratea
Frequency
Specific energy
Residence timea
a For continuous process

19
Figure 1.9 Relationship between field strength and microbial inactivation. Ten pulses of
20 µs; S.C., Saccharomyces cerevisiae; C.U., Candida ufilis; E.C., Escherichia coli;
M.P., motile pseudomonad; C.W., Closfridium welchii; M.L., Micrococcus lysodeikficus
(Sale and Hamilton 1967).
Moderate Electric Field
Moderate electric field is a relative term used to describe the electric field strengths that
occur during ohmic heating. Sastry describes it as "electric fields less than or equal to
1000 V/cm" (Sastry 2008). While ohmic heating is used primarily for inactivation of
microorganisms through thermal processing, recent studies have shown an interaction
between MEF and membranes of prokaryotic and eukaryotic cells. When MEF was used
as a pretreatment, it has been shown to improve the drying rate of vegetable tissue (Wang
and Sastry 2000). Extraction of juices from apples and potatoes increases with MEF
treatment (Praporscic and others 2006). During blanching, mushrooms showed a greater
shrinkage under ohmic heating as compared to conventional heating (Sensoy and Sastry

20
2004). Fermentation by L. acidophilus exhibits a reduced lag time as well as increased
metabolite production under MEF conditions, as compared to conventional heating (Cho
and others 1996). Further tests were conducted and demonstrated an increased uptake of
a fluorescent dye by L. acidophilus from media when under MEF conditions (Loghavi
and others 2009). All of these tests show that interactions of electric fields and
membranes can and do occur at moderate electric field conditions.
Ohmic heating
Ohmic heating has gone by many different names throughout the years including joule
heating, electrical resistance heating, direct electrical resistance heating, electro-heating
and electroconductive heating (Mitelut and others 2011). Ohmic heating is the process of
applying alternating current (ac) to an electrically conductive liquid/semi-liquid that has a
resistance. When an electric current is applied to anything with resistance, energy is
given off in the form of heat. This conversion of energy to heat is very efficient and can
be as high as 90% (Ghnimi and others 2007). The uniqueness of ohmic heating comes
from the ability to heat from within the food system instead of heating from the outside
in, which is considered the conventional method (Richardson 2004). This is especially
important for liquids with small particulates. With ohmic heating, it is possible to heat
the inside of particulates faster than the surrounding fluid, which is impossible with
conventional methods. This allows for a faster come up time, which in turn reduces the
amount of energy needed to achieve uniform heating. This reduced time of processing
also allows for greater retention of the original structure/flavor of the food system as well

21
as a greater retention of vitamins and nutrients when compared to conventional methods
(Raghupathy and others 2005).
Ohmic heating was first developed and implemented in the processing of milk
around 1919 (Arthur K. Anderson, Rubin Finkelstein 1919). The process was called the
Electropure Process. The electrodes were set up so that the milk would have to flow
continuously in order to complete the electrical circuit. If the milk stopped flowing, the
circuit would be broken and no electric current would be applied to the milk. Many
researchers of the time claimed that there was a lethal, non-thermal effect on
microorganisms caused by the electricity. An in-depth review of the effects of electric
field on microorganisms by Palaniappan et al. concluded just the opposite. They found
that none of the early studies were able to appropriately separate the electrical and
thermal effects on bacteria thus making the claims of non-thermal lethal electrical effects
unfounded. Another issue of that time was the problems with using electrodes that would
corrode. The rate of this corrosion is dependent upon the type of material that makes up
the electrode. Ohmic heating fell out of favor as a method of thermal processing around
the 1950’s due to the lack of technology to provide inert electrode materials (Richardson
2004).
In the food industry today, ohmic heating is used as a unique way of thermally
processing liquids/semi-liquids. Due to consumer demands for minimally processed, safe
food, a revived interest has occurred starting in the 1990's. New advancement in ohmic
systems allows for particulate foods to be processed at the rate of a high temperature
short time (HTST) processes without the problems of uneven heat transfer (Richardson

22
2004). The price and availability of industrial grade inert electrodes was also a factor in
the revisiting of ohmic technology. Currently products such as fruit in sauces and syrups,
liquid egg, and low-acid particulate products in a can have been processed using ohmic
technology (Raghupathy and others 2005) . While bacterial inactivation is normally the
focus of ohmic heating, there are other applications including blanching, starch
gelatinization, thawing, peeling of fruits, dehydration, extraction, fermentation and
inactivation of proteins (Anderson 2008).

24
References
21CFR131.200 (2011) - Yogurt.
21CFR184.1538 (2011) - Nisin preparation.
Aguirre-Ezkauriatza EJ, Galarza-Gonzalez MG, Uribe-Bujanda AI, Rios-Licea M,
Lopez-Pacheco F, Hernandez-Brenes CM, Alvarez MM. 2008. Effect of mixing
during fermentation in yogurt manufacturing J.Dairy Sci. 91(12):4454-65.
Anderson R. 2008. Ohmic Heating as an alternative food processing technology.
[dissertation]. Kansas State: Food Science Institute.
Arthur K. Anderson, Rubin Finkelstein. 1919. A Study of the Electro-Pure Process of
Treating Milk. J. Dairy Sci. 2374.
Bermudez-Humaran LG, Cortes-Perez NG, Lefevre F, Guimaraes V, Rabot S,
Alcocer-Gonzalez JM, Gratadoux JJ, Rodriguez-Padilla C, Tamez-Guerra RS,
Corthier G, Gruss A, Langella P. 2005. A novel mucosal vaccine based on live
Lactococci expressing E7 antigen and IL-12 induces systemic and mucosal immune
responses and protects mice against human papillomavirus type 16-induced tumors
J.Immunol. 175(11):7297-302.
Synergy - definition [Internet]. ; 2011 [Accessed 2012 4/27/2012]. Available from:
http://www.biology-online.org/dictionary/Synergy
Bolotin A, Wincker P, Mauger S, Jaillon O, Malarme K, Weissenbach J, Ehrlich
SD, Sorokin A. 2001. The complete genome sequence of the lactic acid bacterium
Lactococcus lactis ssp. lactis IL1403 Genome Res. 11(5):731-53.
Caplice E. 1999. Food fermentations: role of microorganisms in food production and
preservation Int.J.Food Microbiol. 50(1-2):131-49.
Chandan RC. 2006. Manufacturing yogurt and fermented milks Ames, Iowa: Blackwell
Pub. 364 p.
Chassy B. 1988. Transformation of bacteria by electroporation. Trends Biotechnol.
6(12):303-309.
Cho HY, Yousef AE, Sastry SK. 1996. Growth kinetics of Lactobacillus acidophilus
under ohmic heating Biotechnol.Bioeng. 49(3):334-40.

25
Cintas LM, Casaus P, Fernández MF, Hernández PE. 1998. Comparative
antimicrobial activity of enterocin L50, pediocin PA-1, nisin A and lactocin S against
spoilage and foodborne pathogenic bacteria. Food Microbiol. 15(3):289-98.
Cintas LM, Casaus MP, Herranz C, Nes IF, Hernández PE. 2001. Review:
Bacteriocins of Lactic Acid Bacteria. Food Sci. Technol. Int. 7(4):281-305.
Cleveland J, Montville TJ, Nes IF, Chikindas ML. 2001. Bacteriocins: safe, natural
antimicrobials for food preservation. Int.J.Food Microbiol. 71(1):1-20.
De Vuyst L, Callewaert R, Crabbé K. 1996. Primary metabolite kinetics of bacteriocin
biosynthesis by Lactobacillus amylovorus and evidence for stimulation of bacteriocin
production under unfavourable growth conditions. Microbiology 142(4):817-27.
Driessen FM, Kingma F, Stadhouders, J. 1982. Evidence that Lactobacillus bulgaricus
in yogurt is stimulated by carbon dioxide produced by Streptococcus thermophilus. Neth.
Milk Dairy J. 36(2):135-144.
Evrendilek GA, Jin ZT, Ruhlman KT, Qiu X, Zhang QH, Richter ER. 2000.
Microbial safety and shelf-life of apple juice and cider processed by bench and pilot scale
PEF systems Innovative Food Sci. Emerg. Technol. 1(1):77-86.
Fox PJ, McSweeney P. 2004. Cheese: An Overview. In: Anonymous Amsterdam ;
Elsevier, 2004.
Gassem MA, Frank JF. 1991. Physical Properties of Yogurt Made from Milk Treated
with Proteolytic Enzymes J.Dairy Sci. 74(5):1503-11.
Germond J-, Lapierre L, Delley M, Mollet B, Felis GE, Dellaglio F. 2003. Evolution
of the Bacterial Species Lactobacillus delbrueckii: A Partial Genomic Study with
Reflections on Prokaryotic Species Concept Mol.Biol.Evol. 20(1):93-104.
Energy efficiency of an Ohmic heating technology by fluid jet in food industrial process
[Internet]. ; 2007 [Accessed 2012 3/22/2012]. Available from:
http://www.eceee.org/conference_proceedings/eceee/2007/Panel_7/7.236
Grahl T, Märkl H. 1996. Killing of microorganisms by pulsed electric fields
Appl.Microbiol.Biotechnol. 45(1-2):148-57.
Halpern G, Prindiville T, Blankenburg M, Hsia T, Gershwin M. 1996. Treatment of
irritable bowel syndrome with Lacteol Fort: a randomized, double-blind, cross-over trial.
Am.J.Gastroenterol. 91(8):1579-85.
26
Hanniffy SB, Carter AT, Hitchin E, Wells JM. 2007. Mucosal Delivery of a
Pneumococcal Vaccine UsingLactococcus lactisAffords Protection against Respiratory
Infection J.Infect.Dis. 195(2):185-93.
Héchard Y, Sahl H. 2002. Mode of action of modified and unmodified bacteriocins from
Gram-positive bacteria. Biochimie 84(5–6):545-57.
Hirsch A. 1951. Growth and Nisin Production of a Strain of Streptococcus lactis. J. Gen.
Microbiol. 5(1):208-21.
Hurst A. 1981. Nisin. Adv. Appl. Microbiol. Volume 2785-123.
Jozala AF, Celia de Lencastre Novaes, L, Cholewa O, Moraes D, Penna T. 2005.
Increase of nisin production by lactococcus lactis in different media. Afr J Biotechnol
4(3):262-5.
Kekez MM, Savic P, Johnson BF. 1996. Contribution to the biophysics of the lethal
effects of electric field on microorganisms Biochimica et Biophysica Acta (BBA) -
Biomembranes 1278(1):79-88.
Lee MH, Roussel Y, Wilks M, Tabaqchali S. 2001. Expression of Helicobacter pylori
urease subunit B gene in Lactococcus lactis MG1363 and its use as a vaccine delivery
system against H. pylori infection in mice. Vaccine 19(28–29):3927-35.
Loghavi L, Sastry SK, Yousef AE. 2007. Effect of moderate electric field on the
metabolic activity and growth kinetics of Lactobacillus acidophilus Biotechnol.Bioeng.
98(4):872-81.
Loghavi L, Sastry SK, Yousef AE. 2009. Effect of moderate electric field frequency
and growth stage on the cell membrane permeability of Lactobacillus acidophilus.
Biotechnol.Prog. 25(1):85-94.
Mehrotra, R.S., Sumbali, G. 2009. Principles Of Microbiology:M&S Tata McGraw-
Hill Education. 927 p.
Mi S, Reina L, Zhang QH. 2002. Water Activity and The Inactivation of Enterobacter
Cloacae Inoculated in Chocolate Liquor and a Model System by Pulsed Electric Field
Treatment. J.Food Process.Preserv. 26(5):323-37.
Mitelut, A., M. Popa, M. Geicu, P. Niculita, D. Vatuiu, I. Vatuiu, B. Gilea, R. Balint,
R. Cramariuc. 2011. Ohmic treatment for microbial inhibition in meat and meat
products. Rom. Biotechnol. Lett. 16(1):1.
27
Norton PM, Wells JM, Brown HWG, Macpherson AM, Le Page RWF. 1997.
Protection against tetanus toxin in mice nasally immunized with recombinant
Lactococcus lactis expressing tetanus toxin fragment C. Vaccine 15(6–7):616-9.
Ohshima T, Sato M, Saito M. 1995. Selective release of intracellular protein using
pulsed electric field J.Electrostatics 35(1):103-12.
Pender H. 1910. Principles of electrical engineering. Preliminary ed. New York:
McGraw-Hill Book Company. 340 p.
Pothakamury UR, Vega H, Zhang Q, Barbosa-Canovas GV, Swanson BG. 1996.
Effect of growth stage and processing temperature on the inactivation of E. coli by pulsed
electric fields. J.Food Prot. 59(11):1167-71.
Praporscic I, Lebovka NI, Ghnimi S, Vorobiev E. 2006. Ohmically Heated, Enhanced
Expression of Juice from Apple and Potato Tissues Biosystems Engineering 93(2):199-
204.
Pulsed Electric Field Processing: Fact Sheet for Food Processors [Internet]. ; 2005
[Accessed 2012 4/29/2012]. Available from: http://ohioline.osu.edu/fse-fact/0002.html
Ohmic Heating of Foods [Internet]. [Accessed 2012 4/27/2012]. Available from:
http://ohioline.osu.edu/fse-fact/0004.html
Ramasamy R, Yasawardena S, Zomer A, Venema G, Kok J, Leenhouts K. 2006.
Immunogenicity of a malaria parasite antigen displayed by Lactococcus lactis in oral
immunisations. Vaccine 24(18):3900-8.
Reddy BS. 1999. Possible mechanisms by which pro- and prebiotics influence colon
carcinogenesis and tumor growth J.Nutr. 129(7 Suppl):1478S-82S.
Ribeiro LA, Azevedo V, Le Loir Y, Oliveira SC, Dieye Y, Piard J, Gruss A, Langella
P. 2002. Production and Targeting of the Brucella abortus Antigen L7/L12 in
Lactococcus lactis: a First Step towards Food-Grade Live Vaccines against Brucellosis.
Appl. Environ. Microbiol. 68(2):910-6.
Richardson P. 2004. Improving the thermal processing of foods Boca Raton : CRC Press
; 2004. 507 p.
Rivas A, Rodrigo D, Martínez A, Barbosa-Cánovas GV, Rodrigo M. 2006. Effect of
PEF and heat pasteurization on the physical–chemical characteristics of blended orange
and carrot juice LWT - Food Science and Technology 39(10):1163 <last_page> 1170.

28
Saarela M, Lähteenmäki L, Crittenden R, Salminen S, Mattila-Sandholm T. 2002.
Gut bacteria and health foods—the European perspective. Int.J.Food Microbiol. 78(1–
2):99-117.
Sale A, Hamilton W. 1967. Effects of high electric fields on microorganismsI. Killing of
bacteria and yeasts. Biochimica et Biophysica Acta (BBA) - General Subjects
148(3):781-8.
Salminen S, Wright Av, Arthur Ouwehand. 2004. Lactic acid bacteria: microbiology
and functional aspects New York: Marcel Dekker. 633 p.
Sastry S. 2008. Ohmic Heating and Moderate Electric Field Processing Food
Sci.Technol.Int. 14(5):419-22.
Schleifer KH, Kraus J, Dvorak C, Kilpper-Bälz R, Collins MD, Fischer W. 1985.
Transfer of Streptococcus lactis and Related Streptococci to the Genus Lactococcus gen.
nov. Syst.Appl.Microbiol. 6(2):183-95.
Sensoy I, Sastry SK. 2004. Ohmic Blanching of Mushrooms. J.Food Process Eng.
27(1):1-15.
Sherman JM, Stark P. 1931. Streptococci which Grow at High Temperatures
J.Bacteriol. 22(4):275-85.
Stiles ME, Holzapfel WH. 1997. Lactic acid bacteria of foods and their current
taxonomy Int.J.Food Microbiol. 36(1):1-29.
Teuber M. 2009. Bergey's manual of systematic bacteriology In: Anonymous New York
: Springer, 2001-. p 711,711-718.
Tribby D. 2009. Yogurt. In: Anonymous New York, NY: Springer. p 573.
Vega-Mercado H, Pothakamury UR, Chang F, Barbosa-Cánovas GV, Swanson BG.
1996. Inactivation of Escherichia coli by combining pH, ionic strength and pulsed electric
fields hurdles Food Res.Int. 29(2):117-21.
Wang W, Sastry SK. 2000. Effects of Thermal and Electrothermal Pretreatments on Hot
Air Drying Rate of Vegetable Tissue. J.Food Process Eng. 23(4):299-319.
Wood BJB, Holzapfel WH. 1995. The Genera of lactic acid bacteria London: Blackie
Academic & Professional. 398 p.

29
Wouters PC, Bos AP, Ueckert J. 2001a. Membrane permeabilization in relation to
inactivation kinetics of Lactobacillus species due to pulsed electric fields
Appl.Environ.Microbiol. 67(7):3092-101.
Wouters PC, Alvarez I, Raso J. 2001b. Critical factors determining inactivation kinetics
by pulsed electric field food processing Trends Food Sci.Technol. 12(3-4):112-21.
Xin KQ, Hoshino Y, Toda Y, Igimi S, Kojima Y, Jounai N, Ohba K, Kushiro A,
Kiwaki M, Hamajima K, Klinman D, Okuda K. 2003. Immunogenicity and protective
efficacy of orally administered recombinant Lactococcus lactis expressing surface-bound
HIV Env Blood 102(1):223-8.
Yildez F. 2009. Development and Manufacture of Yogurt and Other Functional Dairy
Products CRC. 451 p.

29
Chapter 2
Growth Kinetics of Lactobacillus bulgaricus and Streptococcus thermophilus Under
Moderate electric field
Abstract
Common yogurt starter cultures, Lactobacillus bulgaricus and Streptococcus
thermophilus, were subjected to moderate electric field (MEF) during fermentation. The
electric field strength remained constant throughout all experiments at 1 V/cm. A
fermentation vessel that was heated conventionally (control) and another that was heated
ohmically (treatment) via platinized titanium electrodes, were filled with 1.5 L of MRS
broth and inoculated side by side. Treatment variables were frequency (45 Hz or 60 Hz),
temperature (35°C or 44°C), and microorganism (L. bulgaricus or S. thermophilus).
Fractions of the fermentation over time where collected and plated (for microbial
enumeration), pH was determined in each fraction. Fermentation by S. thermophilus at
35°C with 45 Hz MEF showed a reduced lag time (p < .05) as compared to the control.
Increasing the temperature or frequency resulted in the loss of significant difference
between the lag times of the control and the treated. L. bulgaricus showed no significant
difference in growth or fermentate pH between the control and all treatments. Results
indicate that reaction of microorganisms to MEF may be species specific as well as
temperature and frequency specific.

30
Introduction
Recent technological strides in electric field setups combined with consumer demands for
high quality, minimally processed food products has increased interest in electrical
processing such as ohmic heating and pulsed electric field (PEF). The effect of electric
field on prokaryotic cells has been an area of research since 1909 with George E. Stone
looking at the effects of electric field on Pseudomonas spp. and Bacillus spp. in water
and milk (Stone 1909). The majority of the studies following Stone’s work looked at the
lethal effect electric fields against microorganisms and the feasibility of implementing
this technology in the industry. A review of these studies concluded that no non-thermal
lethality occurs at low electric fields commonly produced during ohmic heating and while
there are benefits to ohmic heating, microbial lethality was not one of them (Palaniappan
and others 1990). While lethality does not occur at moderate electric fields, (field
strengths lower than 1,000 V/cm) recent research has shown a relationship between MEF
and increased diffusion across cell membranes of eukaryotes (Wang and Sastry 2000;
Wang and Sastry 2002; Sensoy and Sastry 2004; Praporscic and others 2006) as well as
prokaryotes (Cho and others 1996; Loghavi and others 2007; Loghavi and others 2008;
Loghavi and others 2009). MEF has been shown to increase inactivation of spores as
compared to conventional heating under similar heating profiles (Cho and others 1999;
Somavat and others 2012). Sub-lethal pretreatment of Escherichia coli with MEF led to
increased inactivation when followed with conventional heating (Palaniappan and others
1992).

31
MEF has been shown to reduce lag time as well as increase the production of the
bacteriocin lacidin A in Lactobacillus acidophilus in MRS at an electric field of 1 V/cm
under sub-optimal temperatures (Cho and others 1996; Loghavi and others 2008). The
effects of electric fields and the amount required to achieve various effects differs
between species (Chassy 1988). Decreasing the fermentation time of food products
without sacrificing quality has been a point of interest in the food industry. Yogurt
fermentation takes about 4-6 hours and in most cases any attempt to reduce the
fermentation time results in unwanted changes in traditional yogurt properties.
In the present study, our objective was to investigate the effects of MEF at various
frequencies on lag time and acid production of common yogurt starters, S. thermophilus
and L. bulgaricus. Further, we investigate the effect of increasing the fermentation
temperature above the optimum for Streptococcus thermophilus.
Materials and Methods
Bacterial Strains
Lactobacillus bulgaricus subsp. delbruekii ATCC 11842 and Streptococcus salivarius
subsp. thermophilus ATCC 19258 were acquired from the Food Safety Laboratory
culture collection at The Ohio State University (Columbus) and were tested in this study.
Stock cultures were suspended in De Man, Rogosa and Sharp broth (MRS; Difco,
Franklin Lakes, NJ) + 40% (vol/vol) glycerol, and kept at -80%C. Twenty four hours
before experiments, a loop-full of the appropriate frozen culture was transferred to MRS
32
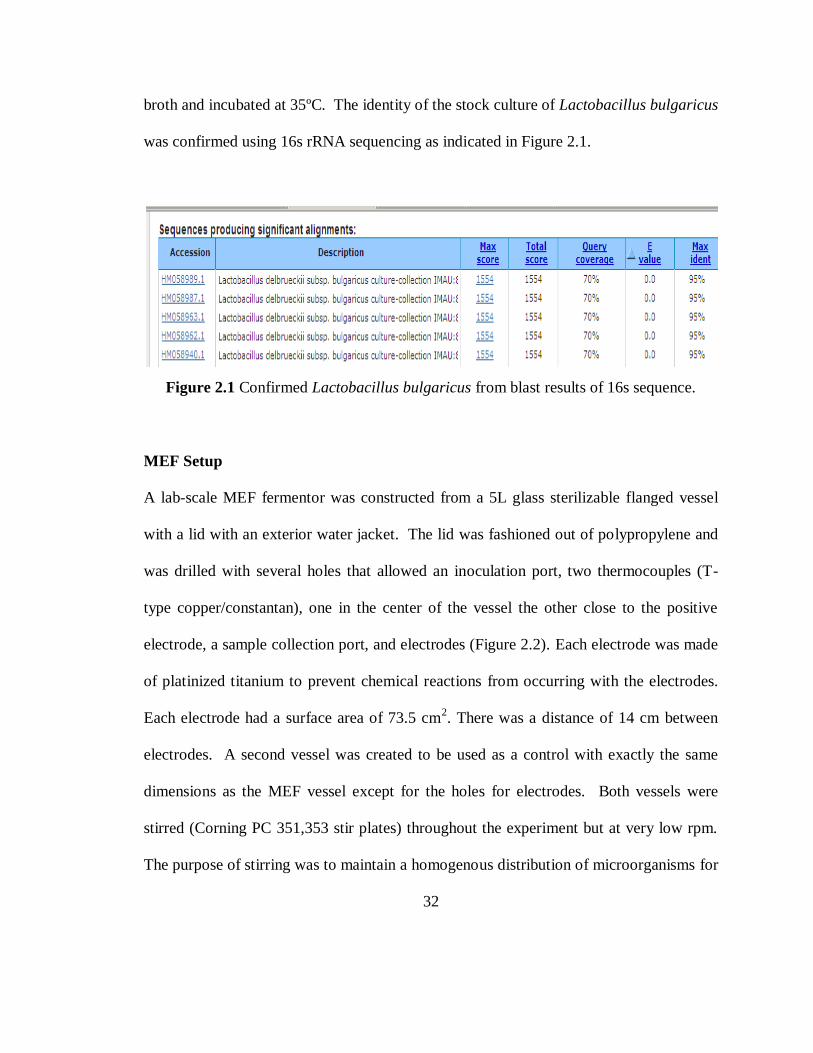
broth and incubated at 35ºC. The identity of the stock culture of Lactobacillus bulgaricus
was confirmed using 16s rRNA sequencing as indicated in Figure 2.1.
Figure 2.1 Confirmed Lactobacillus bulgaricus from blast results of 16s sequence.
MEF Setup
A lab-scale MEF fermentor was constructed from a 5L glass sterilizable flanged vessel
with a lid with an exterior water jacket. The lid was fashioned out of polypropylene and
was drilled with several holes that allowed an inoculation port, two thermocouples (T-
type copper/constantan), one in the center of the vessel the other close to the positive
electrode, a sample collection port, and electrodes (Figure 2.2). Each electrode was made
of platinized titanium to prevent chemical reactions from occurring with the electrodes.
Each electrode had a surface area of 73.5 cm2. There was a distance of 14 cm between
electrodes. A second vessel was created to be used as a control with exactly the same
dimensions as the MEF vessel except for the holes for electrodes. Both vessels were
stirred (Corning PC 351,353 stir plates) throughout the experiment but at very low rpm.
The purpose of stirring was to maintain a homogenous distribution of microorganisms for

33
sampling as well as to avoid any hot spots that could be created due to the nature of
electrically heating the media. Temperature was maintained for each vessel by two
separate water baths (Haake G, Fisher Scientific 133, Waltham, MA) and temperature
controllers (Haake DC 30, Fisher scientific isotemp 2100, Waltham, MA) and pumping
water through the water jackets (Figure 2.3). For the treatment vessel, the temperature of
the water was approximately 3ºC less than the desired temperature of the MEF vessel.
The water jacket was used to cool the slight heating of the media due to heat being
produced from the passing of current through a resistance (the media). The opposite was
true of the conventional vessel; water bath temperature was approximately 2ºC higher
than the desired temperature.
Wave form
Alternating current at 60 Hz or 45 Hz pure sine wave was applied to the treated vessel at
14 volts via AC power source (ELGAR, San Diego, CA) and a function generator (GW
instek, Chino, CA) (Figure 2.3). The amperage remained constant at 1 amp,
approximately, throughout all experiments. The electric field strength was 1 V/cm due to
the distance of the electrodes.

34
Figure 2.2 Real picture of fermentation vessel (Left) Schematic of fermentation vessel (not drawn to scale; Right)
Thermocouple
s
Inoculation
port
Water into
jacket
Water out
of jacket
Fermentate to
fraction
collector Electrode
s
Stir bar

35
Figure 2.3 Schematic of MEF treated and control fermentation vessels. Data was
collected via data logger. T= Temperature, V= Volts, A = Amps. Arrows denote flow of
water.
Figure 2.4 Sine wave of voltage at 45 Hz and 60 Hz
-20
-15
-10
-5
0
5
10
15
20
0 0.01 0.02 0.03 0.04 0.05
Vo
lts
Time
45Hz
60Hz

36
Experimental Procedure
A culture of either S. thermophilus or L. bulgaricus was prepared 24 hours in advance of
the experiment. Both fermentor vessels were filled with 1.5 L (just enough to submerge
both electrodes) of MRS broth and autoclaved for 20 minutes at 121ºC. The vessels were
then placed into the respective water jacket and cooled down to running temperature
(35ºC or 44 ºC ± .5ºC). The MRS broth was then inoculated with the appropriate culture
at 0.1% (v/v). Temperature, voltage, and amperage were all recorded via a data logger
at one minute intervals over the entire course of the fermentation to verify consistent
temperature and application of electric field. Samples were treated at frequencies of 45
Hz or 60 Hz at 35ºC as well as 45 Hz at 44ºC (Table 2.1). Samples were pumped out of
the vessels via a peristaltic pump (Masterflex, Cole-Parmer, Vernon Hills, Il) to a fraction
collector that was refrigerated at 4ºC. Fractions were approximately 4 mL and were
taken every 30 minutes. Fractions were then plated on M 17 +10% Lactose agar (Oxiod,
Hampshire, UK) and incubated aerobically for S. thermophilus or on MRS agar incubated
in anaerobic jars with three oxygen consuming, CO2 producing sachets (GasPak EZ
Anaerobe Container System; BD, Franklin Lakes, NJ ) for L. bulgaricus at 35ºC for 48
hours. Colony forming units were counted and used to determine the amount of bacteria
present at a given time. Overall metabolic activity was measured by the changes in pH
over time.
37
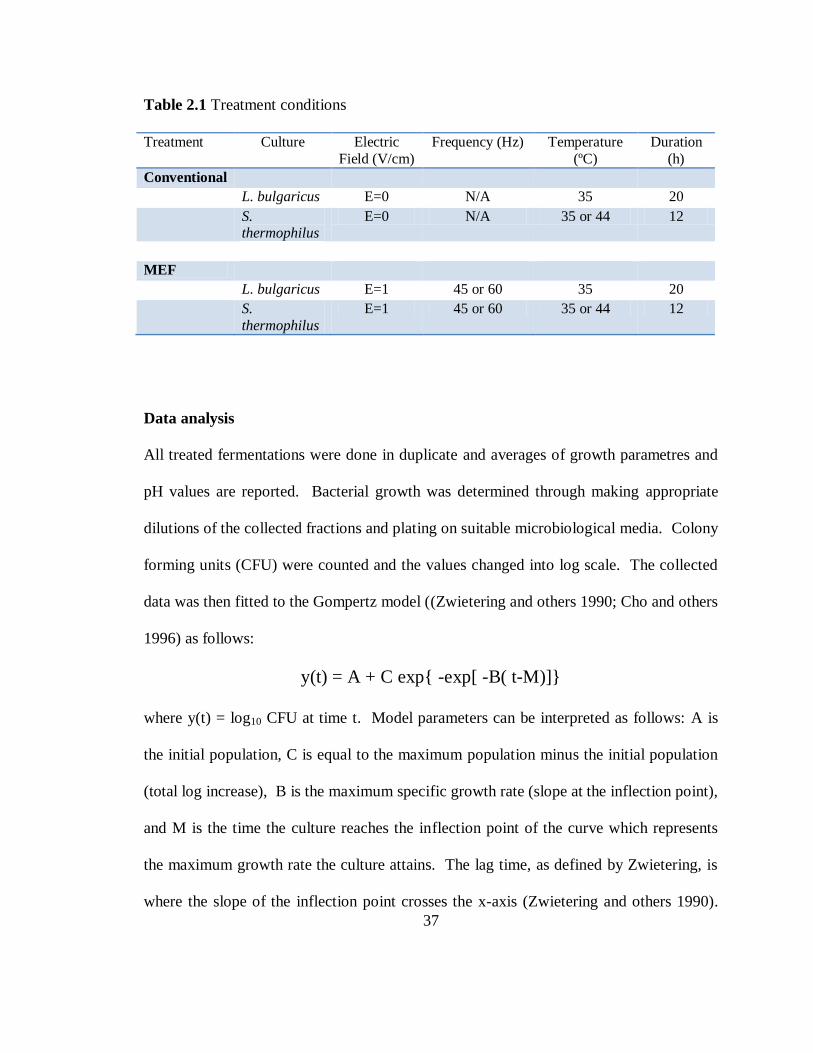
Table 2.1 Treatment conditions
Treatment Culture Electric
Field (V/cm)
Frequency (Hz) Temperature
(ºC)
Duration
(h)
Conventional
L. bulgaricus E=0 N/A 35 20
S. thermophilus
E=0 N/A 35 or 44 12
MEF
L. bulgaricus E=1 45 or 60 35 20
S.
thermophilus
E=1 45 or 60 35 or 44 12
Data analysis
All treated fermentations were done in duplicate and averages of growth parametres and
pH values are reported. Bacterial growth was determined through making appropriate
dilutions of the collected fractions and plating on suitable microbiological media. Colony
forming units (CFU) were counted and the values changed into log scale. The collected
data was then fitted to the Gompertz model ((Zwietering and others 1990; Cho and others
1996) as follows:
y(t) = A + C exp -exp[ -B( t-M)]
where y(t) = log10 CFU at time t. Model parameters can be interpreted as follows: A is
the initial population, C is equal to the maximum population minus the initial population
(total log increase), B is the maximum specific growth rate (slope at the inflection point),
and M is the time the culture reaches the inflection point of the curve which represents
the maximum growth rate the culture attains. The lag time, as defined by Zwietering, is
where the slope of the inflection point crosses the x-axis (Zwietering and others 1990).

38
In order to determine the inflection point without bias, the growth data were fitted to the
nonlinear Gompertz 4P model in the statistical program JMP version 10.0 (SAS Institute,
Cary, NC). The modeled parameters were then used to calculate lag period, final log
count, and minimum generation time. Lag period (hours) = M - (1/B); final log count =
A+C ; minimum generation time (hours) = (log102)*(e/(B*C)).
The change in pH was recorded (accumet model 15, Waltham, MA) with a pH
probe (Inlab Semi Micro, Columbus, OH) by measuring the fractions at one hour
intervals. The curve of pH is different than that of bacterial growth and is best fitted to
the logisitc model (Cho and others 1996):
where Yh = 14-pH, X = time (in hours), A1, B1, C1, and M1 are model parameters. M1 is
the time (in hours) it takes the pH to reach the inflection point. To eliminate bias, data
were fitted to the Logistics model 4P of the statistical program JMP. All collected data
regarding growth curve or pH were analyzed in SAS version 9.2 (SAS Institute, Cary,
NC).
Results
Streptococcus thermophilus
The differences in growth parameters of Streptococcus thermophilus, in response to the
electric treatment, can be seen in Table 2.2. There was a significant (P < 0.05) difference
in lag time between the treated and control of the 45 Hz treatment at 35°C but not at

39
44°C. The lag time was reduced, on average, by 39 minutes when S. thermophilus was
treated with an electric field of 1 V/cm at 45 Hz, as compared to the control. There was
no difference in lag time between cells treated with 60 Hz and control. The pH inflection
point of the 45 Hz, 35°C treatment was significantly different than the control. The
maximum growth at 45 Hz, 44°C treatment was significantly less than that at 45 Hz
35°C.
Lactobacillus Bulgaricus
The changes in growth parameters of Lactobacillus bulgaricus, due to the electric
treatment, can be observed in Table 2.3. There was no significant difference in the
growth parameters of the treatments and their controls. There was also no significant
difference between treatments. The pH changes were not included in Table 2.3.
Table 2.2 Growth parameters and pH change for different treatments of Streptococcus
thermophilus
Treatment
Frequency
Lag
time
(min)
Maximum
specific
growth
Minimum
generation
time (h)
maximum
growth
Total
pH
decline
pH
inflection
point (h)
Con 35°C 0 137.9a 0.41 0.42 9.26a 1.74 7.69a
MEF 35°C 60 138.5a
0.43 0.42 9.16a
1.64 7.72a
Con 35°C 0 165.1b 0.47 0.37 9.18a 1.76 8.12b
MEF 35°C 45 126.1c 0.45 0.38 9.36a 1.88 7.35c
Con 44ºC 0 146.9a 0.51 0.44 8.24b 1.63 8.50d
MEF 44ºC 45 150.8a 0.49 0.45 8.31b 1.67 8.24d
abcdDenotes significant difference (P<0.05) within column

40
Table 2.3 Growth parameters of Lactobacillus bulgaricus under different treatments
conditions
Treatment
Frequency
Lag
time
(min)
Maximum
specific
growth
Minimum
generation
time (h)
maximum
growth
Con 35°C 0 5.533 0.225 0.969 7.607
MEF 35°C 60 5.550 0.226 1.011 7.445
Con 35°C 0 4.315 0.199 1.078 7.548
MEF 35°C 45 4.245 0.219 1.042 7.343
Discussion
The first documented use of moderate electric field (MEF) in order to stimulate growth of
microorganisms was reported by George Stone (Stone 1909). He studied the growth of
microorganisms in milk and water under MEF using copper and zinc electrodes and
found a 1 to 2 log increase in bacteria of the treated compared to the control. Since then,
the little research that has been conducted in this area has shown varying results. Rowley
concluded that alternating current in the range of 1-60 Hz did not affect microorganisms
but that direct current increased generation time (Rowley 1972). Shimada and
Shimarahara (1997) showed that alternating current of 50 Hz influenced the growth of
Escherichia coli but results were dependent on various variables including medium,
inoculum size, and shaking during incubation. A review of these and other research
relating to MEF stated that conclusions about MEF could not be drawn due to the lack of
experimental details (Palaniappan and others 1990).
In recent years, MEF research has been conducted on Lactobacillus acidophilus
at the Ohio State University (Cho and others 1996; Loghavi and others 2007; Loghavi

41
and others 2008; Loghavi and others 2009). Researchers concluded that MEF reduced
the lag time and increased the production of lacidin A, a bacteriocin of L. acidophilus.
These effects were found to differ depending on the frequency and the temperature.
Our results show that MEF at 45 Hz significantly reduces the lag time of S.
thermophilus when incubated at 35°C (Figure 2.6). Increased permeabilization of the cell
membrane leads to the uptake of the surrounding nutrients without the expenditure of
energy leading to the shortened lag time. The exact means of increased permeabilization
are unknown but theorized to be either caused through the electrical formation of pores
(electropermeabilization) in the cell membrane or through the alteration of cell membrane
protein conformation (Loghavi and others 2007; Loghavi and others 2009).
The reduction of lag time was lost when the fermentation temperature was
increased to 44°C (typical yogurt fermentation temperature). This shows that
temperature affects whether or not the reduced lag time caused by MEF can be seen.
These findings are in agreement with the findings of Cho et al. (Cho and others 1996).
They showed that the reduction in lag time of Lactobacillus acidophilus observed during
MEF treatment was only apparent at sub-optimal temperatures (30°C). Once
temperatures were increased in the range of 35-40°C the differences in lag time were not
significant. Loghavi tested at the increased uptake of propidium iodide (PI), a florescent
molecule to which cell membranes are impermeable, in varying growth stages of L.
acidophilus under MEF (Loghavi and others 2009). She concluded that cells in the lag
phase had the greatest uptake of PI and therefore were the most permeable of all the cells.
Considering lag phase cells are the most permeable to MEF treatment, it would seem
42
reasonable to say that the longer the lag phase occurred the greater the stimulation effect
of MEF would be observed. While this explanation seems to fit, the lag time at 44°C was
similar to that of the control lag time at 35°C, suggesting that other interactions between
MEF and temperature must be occurring. The critical membrane potential was found to
be dependent on temperature (Coster and Zimmermann 1975) and could be a factor in the
permeability of cell membranes.
The reduction in lag time of S. thermophilus at 45 Hz was significantly greater
than that at 60 Hz. This is consistent with the findings of Loghavi where lower frequency
electric fields generated the greatest reduction in lag time for L. acidophilus (Loghavi and
others 2007; Loghavi and others 2009). Loghavi and co-workers proposed a theory as to
why lower frequencies generated greater permeabilization, stating that at lower
frequencies the charges building up around the cell membrane remain there longer as
compared to higher frequencies due to the nature of alternating current. The increase in
time may allow enough charges to build up to cause increased membrane permeability
(Loghavi and others 2007).
The changes in metabolic activity of the LAB during MEF fermentation were
deduced by monitoring lactic acid production via a pH probe. The decrease in pH was
most likely related to the biomass and not an increase in acid production. Considering
that in industry, yogurt fermentations are stopped once the pH reaches approx. 4.2-4.3
(Yildez 2009), decreasing the time it takes to reach the final pH could be advantageous.

43
Figure 2.5 Changes in log CFUb and pH over time of S. thermophilus treated with 45 Hz
MEF at 44°C aFitted with the Gompertz model
bColony forming unit
4
4.5
5
5.5
6
6.5
7
4
5
6
7
8
9
10
0 2 4 6 8 10 12
pH
S. th
erm
ophi
lus
Log(
CFU/
mL)
a
Hours
60Hz
control
60Hz pH
Control pH
Figure 2.6 Changes in log CFUb and pH over time of S. thermophilus treated with 60 Hz
MEF at 35°C aFitted with the gompertz model
bColony forming unit
4.00
4.50
5.00
5.50
6.00
6.50
7.00
4
5
6
7
8
9
10
0 2 4 6 8 10 12
pH
S. t
her
mo
ph
ilus
Log(
CFU
/mL)
a
Hours
44°C at 45Hz
Control
44°C at 45Hz
Control pH

44
4
4.5
5
5.5
6
6.5
7
4
5
6
7
8
9
10
0 2 4 6 8 10 12
pH
S. th
erm
ophi
lus L
og(C
FU/m
L)a
Hours
45Hz
Control
45Hz
Control pH
Figure 2.7 Changes in log CFU and pH over time of S. thermophilus treated with 45 Hz
MEF at 35°C aFitted with the Gompertz model
bColony forming unit
There was no significant difference in any of the growth parameters of L.
bulgaricus for all treatment conditions (Table 2.3). The cause for the difference in
reaction to the 45 Hz MEF between S. thermophilus and L. bulgaricus is uncertain.
While it is known that S. thermophilus is a Gram-positive coccus and L. bulgaricus is a
Gram-positive rod, these differences alone do not explain why their reactions to MEF
were so different. Loghavi et al. treated L. acidophilus, which is a Gram-positive rod,
with MEF and saw significant reduction in lag time of the treated vs. the control (Loghavi
and others 2007). It is known that some strains of L. bulgaricus are extremely sensitive
to electric fields as compared to S. thermophilus (Chassy 1988) but as to why and how
this plays a role in membrane response to MEF is still an area that needs further research.

45
4
5
6
7
3
4
5
6
7
8
0 5 10 15 20
pH
L. b
ulga
ricus
Log
(CFU
/mL)
a
Hours
60Hz
Control
pH 60Hz
pH control
Figure 2.8 Changes in log CFUb and pH over time of L. bulgaricus treated with 60 Hz
MEF at 35°C aFitted with the Gompertz model
bColony forming unit
4
5
6
7
3
4
5
6
7
8
0 5 10 15 20
pH
L. b
ulga
ricu
s Lo
g (C
FU/m
L)a
Hours
45Hz
Control
pH 45Hz
pH control
Figure 2.9 Changes in log CFUb and pH over time of L. bulgaricus treated with 60 Hz
MEF at 35°C aFitted with the Gompertz model
bColony forming unit

46
Conclusion
This study has shown that the application of moderate electric field (1 V/cm) on S.
thermophilus during fermentation at near optimum temperature (35°C) can reduce the lag
time. Reducing the lag time could decrease the overall fermentation time which could be
very useful in the production of yogurt or other fermented foods utilizing S. thermophilus
as a starter culture. However, increasing the temperature as well as the frequency of the
alternating current has shown to reduce this effect. L. bulgaricus did not respond to the
electric fields the same way as S. thermophilus suggesting that the stimulation of growth
under moderate electric field could be strain dependent.

47
References
Chassy B. 1988. Transformation of bacteria by electroporation. Trends Biotechnol.
6(12):303-309.
Cho HY, Yousef AE, Sastry SK. 1996. Growth kinetics of Lactobacillus acidophilus
under ohmic heating Biotechnol.Bioeng. 49(3):334-40.
Cho H, Yousef AE, Sastry SK. 1999. Kinetics of inactivation of Bacillus subtilis spores
by continuous or intermittent ohmic and conventional heating. Biotechnol.Bioeng.
62(3):368-72.
Coster HGL, Zimmermann U. 1975. The mechanism of electrical breakdown in the
membranes ofValonia utricularis J.Membr.Biol. 22(1):73-90.
Loghavi L, Sastry SK, Yousef AE. 2008. Effect of moderate electric field frequency on
growth kinetics and metabolic activity of Lactobacillus acidophilus Biotechnol.Prog.
24(1):148-53.
Loghavi L, Sastry SK, Yousef AE. 2007. Effect of moderate electric field on the
metabolic activity and growth kinetics of Lactobacillus acidophilus Biotechnol.Bioeng.
98(4):872-81.
Loghavi L, Sastry SK, Yousef AE. 2009. Effect of moderate electric field frequency
and growth stage on the cell membrane permeability of Lactobacillus acidophilus.
Biotechnol.Prog. 25(1):85-94.
Palaniappan S, Sastry SK, Richter ER. 1992. Effects of electroconductive heat
treatment and electrical pretreatment on thermal death kinetics of selected
microorganisms. Biotechnol.Bioeng. 39(2):225-32.
Palaniappan S, Sastry Sk, Richter ER. 1990. Effects of Electricity on Microorganisms:
A Review. J.Food Process.Preserv. 14(5):393-414.
Praporscic I, Lebovka NI, Ghnimi S, Vorobiev E. 2006. Ohmically Heated, Enhanced
Expression of Juice from Apple and Potato Tissues Biosystems Engineering 93(2):199-
204.

48
Rowley BA. 1972. Electrical Current Effects on E. coil Growth Rates. Proceedings of the
Society for Experimental Biology and Medicine.Society for Experimental Biology and
Medicine (New York, N.Y.) 139(3):929-34.
Sensoy I, Sastry SK. 2004. Ohmic Blanching of Mushrooms. J.Food Process Eng.
27(1):1-15.
Somavat R, Mohamed HMH, Chung Y, Yousef AE, Sastry SK. 2012. Accelerated
inactivation of Geobacillus stearothermophilus spores by ohmic heating. J.Food Eng.
108(1):69-76.
Stone EG. Nov., 1909. Influence of Electricity on Micro-Organisms. Botanical Gazette
Vol. 48(No. 5):359-379,Article Stable URL: http://www.jstor.org/stable/2467456.
Wang W, Sastry SK. 2002. Effects of moderate electrothermal treatments on juice yield
from cellular tissue Innovative Food Sci. Emerg. Technol. 3(4):371-7.
Wang W, Sastry SK. 2000. Effects of Thermal and Electrothermal Pretreatments on Hot
Air Drying Rate of Vegetable Tissue. J.Food Process Eng. 23(4):299-319.
Yildez F. 2009. Development and Manufacture of Yogurt and Other Functional Dairy
Products CRC. 451 p.
Zwietering MH, Jongenburger I, Rombouts FM, van 't Riet K. 1990. Modeling of the
bacterial growth curve Appl.Environ.Microbiol. 56(6):1875-81.

49
Chapter 3
Growth Kinetics of Lactobacillus bulgaricus, Streptococcus thermophilus, and
Lactococcus lactis Treated With Pulsed Electric Field
Abstract
Various strains of lactic acid bacteria (LAB) were subjected to continuous pulsed electric
field (PEF) during fermentation. Two fermentation vessels (one for PEF-treated, and the
other for the control) were filled with MRS broth and held at either 25°C or 35°C. The
MRS was then inoculated with Lactobacillus bulgaricus, Streptococcus thermophilus, or
Lactococcus lactis and fermentor contents were exposed to PEF at strengths ranging
from 2-10 kV/cm. During fermentation, fractions where collected over time and
microbial population was determined by plating on microbiological media. The fractions
also were tested for pH, and in the case of L. lactis, assayed for bacteriocin production.
Under these experimental conditions, exposure to PEF did not stimulate the growth of
any culture or bacteriocin production. A general trend of reduced growth was seen as
electric field was increased for both S. thermophilus and L. bulgaricus. It was
hypothesized that L. lactis may produce the bacteriocin, nisin, at an increased rate due to
cell stress and self induction from pore formation caused by the PEF treatments, but the
opposite was found. The control produced nisin slightly faster showing the first clearing
zone (200 arbitrary units) at 10 hours with the treated showing the first clearing zone
(200 arbitrary units) at 11 hours. Although a stimulation effect was not observed in these

50
experiments, further research utilizing differing treatment parameters would be needed in
order to claim that mild PEF does not cause the stimulation of bacterial growth.
Introduction
Pulsed electric field (PEF) is a non-thermal treatment of food products where high
voltage is discharged across electrodes while the food product passes through leading to
inactivation of various microorganisms. Microbial inactivation via PEF was first
demonstrated by Sale and Hamilton in 1967. They reported electric fields in the range of
25 kV/cm having lethal effects on Escherichia coli (Sale and Hamilton 1967). They
concluded that irreversible structural changes of the membrane led to the loss of selective
permeability due to the formation of pores. Studies have shown that permeability
increases with increased field strength and time exposed to the electric fields (Castro and
others 1993; Zhang and others 1995; Wouters and others 2001a). Permeability of cell
membranes were found to be reversible depending on pulse strength and duration (Coster
and Zimmermann 1975). When electric field is applied, charged particles accumulate on
both sides of the cell membrane. When a critical membrane potential is reached,
approximately 1 V for bimolecular lipid membranes, dielectric breakdown occurs
(Zimmermann and others 1974). This critical membrane potential was found to be
inversely dependent on temperature (Coster and Zimmermann 1975).
Although the majority of research done in this area has addressed the lethality of
PEF and the mode of inactivation (Wouters and others 2001b), some research was done
in the area of sub-lethal PEF and membrane permeability. Wouters investigated

51
membrane permeabilization of Lactobacillus spp. subjected to PEF (Wouters and others
2001a). The researcher measured the uptake of a fluorescent dye by L. plantarum treated
with 10-12 kV/cm PEF and found very little uptake of the dye as well as very little death.
Once increased to 15-25 kV/cm, a linear relationship of dye uptake and cell death was
found. Ohshima et al. applied sub-lethal electric field to Saccharomyces cerevisiae in the
range of 0-10 kV/cm and found the release of intracellular proteins without cell death
(Ohshima and others 1995).
Moderate electric fields in the form of sinusoidal waves of approximately 1 V/cm
have been shown to increase membrane permeability and enhance cell growth during
fermentation (Cho and others 1996; Loghavi and others 2007; Loghavi and others 2008;
Loghavi and others 2009). It was also found that frequency and wave form affected
permeability (Loghavi and others 2008). Loghavi et al. hypothesize that at lower
frequencies, there is longer time for charges to build up on the cell membrane leading to
an increase in electroporation.
To our knowledge, there has been no research done with continuous sub-lethal
PEF treatment during a fermentation. Our goal is to investigate the effects of continuous
sub-lethal PEF treatment on growth kinetics of various lactic acid bacteria as well as
bacteriocin production by Lactococcus lactis.
Bacterial Strains
Lactobacillus bulgaricus subsp. delbruekii (ATCC 11842), Streptococcus salivarius
subsp. thermophilus (ATCC 19258), Lactococcus lactis subsp. lactis (ATCC 11454), and

52
Lactobacillus cellobiosus (OSU 919) were acquired from the Food Safety Laboratory
culture collection at The Ohio State University (Columbus) and were tested in this study.
Stock cultures were suspended in De Man, Rogosa and Sharp broth (MRS; Difco,
Franklin Lakes, NJ) + 40% (vol/vol) glycerol, and kept at -80%C. A working liquid
stock of L. bulgaricus and S. thermophilus was prepared by transferring frozen culture to
MRS broth and incubating at 35ºC for twenty four hours, then transferring and incubating
at same conditions. Twenty four hours before experiments, 10 µL of liquid stock of the
appropriate culture was inoculated into 10 mL of MRS broth and incubated at 35ºC. A
loop-full of frozen culture of L. lactis was transferred to MRS broth and incubated for 24
hours at 35ºC. Two more successive overnight transfers were done before each
experiment. L. cellobiosis was used as an indicator for nisin activity and was grown
overnight at 35ºC before testing.
PEF Setup
Fermentor
The PEF fermentor was constructed from a 5-L glass sterilizable flanged vessel with a lid
that was sealed by a rubber gasket and C-clamps. The lid was fashioned out of
polypropylene and was drilled with several holes that allowed an inoculation port, one
thermocouple (T-type copper/constantan), two tubes for the drawing and return of media
to and from the treatment chamber and one tube to collect fractions. A second vessel was
assembled with exactly the same dimensions except for the drawing and returning tubes
and was run side by side as a control.

53
PEF System
Inoculated MRS was pumped from the vessel via a digital gear pump (Cole Parmer,
Vernon Hills, Il), with a p23 fitting, to the PEF system (OSU-4ERRC) at 60 mL/min.
The PEF system was designed for The Ohio State University by Dr. Howard Q. Zhang,
Andrew Bigley, and Timothy Schurmann at the Eastern Regional Research Center
(Wyndmoor, PA) (Figure 3.1). The PEF system had a voltage output range of .1 - 16 kV
and a frequency maximum of 500 Hz.
Figure 3.1 Schematic of Pulsed Electric field experimental setup
A cooling water bath (Isotemp 10135, Fisher Scientific, Waltham, MA), was
used to chill the electrical parts used to generate the high voltages. The treatment
chamber consisted of two stainless steel electrodes with a Teflon insulator (rated approx.
Pulsed
Electric
Field
Treatme
nt
Incubator set at
25°C or 35°C
Refrigerator
Duel Fraction collector
Stir Plates

54
140ºC). Eight holes were drilled in the Teflon (Figure 3.2) allowing for multiple
electrode gaps to be created. Four of the eight holes were used in order to make four
treatment chambers. The electrode gap was 0.5 cm and the diameter of the hole was 0.29
cm (Figure 3.4). The flowing media first entered a cooling water bath then was PEF-
treated twice before returning to the water bath and being treated two more times,
returning one last time to the water bath before going back to the vessel (Figure 3.5).
Figure 3.2 Top view of pulsed electric field system. Programmable logic controller
touch screen on the left. Syringe pumping was bypassed by digital gear pump (not shown
in photo)

55
Figure 3.3 Treatment chamber Teflon insulation with drilled holes to create isolated
treatment chambers (only four chambers were used out of the eight)
This water bath insured that the desired fermentation temperature remained constant as
well as negating any increase in temperature from PEF treatment (1ºC increase at the
highest voltage and conductivity).
Wave Form
The wave form used in these experiments was a bi-polar square wave with a square pulse
(Figure 3.5). Each positive and negative pulse duration was 3 µs long with a 4 µs gap
between them. The distance from the beginning of the first pulse to the end of the second
pulse was one period. The frequency (periods/second) used in all experiments was 30
Hz. The amplitude of the pulse relates to the voltage across the electrode gap by a form

56
factor of 1V = 22.8 kV for voltage and 1V = 10 A for amperage. The voltages used
ranged from 2 kV-10 kV
Figure 3.4 Vertical cross section of the Teflon insulation.
Figure 3.5 PEF treatment area with four treatment chambers in use.
Electrode
gap
Cell diameter
Teflon
insulator
Electrod
e

57
Figure 3.6 Bi-polar square wave. Channel 1 = voltage. Channel 2 = amperage. Y-axis
is 5 µS per square. X-axis per square is 100 mV for voltage and 200 mV for amperage.
The amplitude was determined by averaging the peak (as indicated by red line)
PEF Treatment Exposure
The total amount of exposure to electric fields is calculated through the following
equation.
58
The same treatment exposure was used in all experiments. Pulse duration (both positive
and negative pulse) was 6 µS. Frequency: 30 Hz. Number of chambers: 4. Electrode gap:
0.5cm. Cross sectional area: 0.066 cm2. Product flow rate: 60 mL per min. The resulting
treatment exposure to PEF was 23.8 µS. It is important to note that this treatment time is
per time running through the PEF. PEF was run continually throughout fermentation and
theoretically the entire fermentation medium (1 L of MRS broth) has passed through the
PEF chamber once every 16.7 minutes. The total amount of treatment time per cell is
difficult to calculate due to the fact the cells are growing and multiplying but the entirety
of the MRS broth was treated for a total of 1028 µs.
Experimental Procedure
A culture of either S. thermophilus, L. bulgaricus, or L. lactis was prepared as described
in bacterial strains section. Both fermentor vessels were filled with 1 L of MRS broth
and autoclaved for 20 minutes at 121ºC. The vessels were then placed into a large
incubator set at 35°C. The MRS broth was then inoculated with the appropriate culture at
0.1% (v/v) for S. thermophilus and L. lactis and 1% (v/v) for L. bulgaricus. Temperature
and electric field strength was monitored. Samples were treated with electric fields
ranging from 2-10 kV/cm at 30 Hz. Samples were pumped out of the vessels via a
peristaltic pump (Masterflex, Cole-Parmer, Vernon Hills, Il) to a fraction collector that
was refrigerated at 4ºC. Fractions were approximately 4 mL and were taken every 30
minutes. Fractions were then plated on M 17 +10% Lactose agar (Oxiod, Hampshire,
UK) and incubated aerobically for S. thermophilus or on MRS agar incubated in

59
anaerobic jars with three oxygen consuming, CO2 producing sachets (GasPak EZ
Anaerobe Container System; BD, Franklin Lakes, NJ ) for L. bulgaricus at 35ºC for 48
hours. L. lactis was also plated on MRS but was incubated aerobically at 35°C for 48
hours. Colony forming units were counted and used to determine the amount of bacteria
present at a given time. Overall metabolic activity was measured by the changes in pH
over time.
The amount nisin produced during fermentation was measured using the critical
dilution assay (Yousef and Carlstrom 2002). Dilutions of the supernatant from the
collected fractions were made and 5 µL of each dilution were plated on soft agar seeded
with Lactobacillus cellobiosis (indicator microorganism). Clearings were observed and
the highest dilution that still produced a clear inhibition zone was used in the following
equation to calculate the arbitrary units (AU). AU/mL culture = (1/DFi)(1000/ volume
spotted in µL). DFi is the inverse of the highest dilution factor that produced a clear zone
of inhibition.
Data Analysis
All treated fermentations were done in duplicate and averages of growth parameters and
pH values were reported. Bacterial growth was determined through making appropriate
dilutions and plating the collected fractions. Colony forming units (CFU) were counted
and the values were transformed into a log scale. The collected data were fitted to the
Gompertz model (Zwietering and others 1990; Cho and others 1996).
y(t) = A + C exp -exp[ -B( t-M)]

60
where y(t) = log10 CFU at time t, A is the initial population, C is equal to the maximum
population minus the initial population (total log increase), B is the maximum specific
growth rate (slope at the inflection point), and M is the time the culture reaches the
inflection point of the curve and is the maximum growth rate the culture attains. The lag
time, as defined by Zwietering, is where the slope of the inflection point crosses the x-
axis (Zwietering and others 1990). In order to determine the inflection point without
bias, the growth data were fitted to the nonlinear Gompertz 4P model in the statistical
program JMP (SAS Institute (version 10.0) Cary, NC). The modeled parameters were
then used to calculate lag period, final log count, and minimum generation time. Lag
period (hours) = M - (1/B); final log count = A+C ; minimum generation time (hours) =
(log102)*(e/(B*C)).
A pH meter (Fisher Scientific, accumet model 15) equipped with a pH probe
(Mettler Toledo, Inlab Semi Micro) was used to measure pH of the fermentation
fractions, at 1 hour intervals. The curve of pH is different than that of bacterial growth
and is best fitted to the logisitc model (Cho and others 1996)
where Yh = 14-pH, X = time (in hours), A1, B1, C1, and M1 are model parameters. M1 is
the time (in hours) it takes the pH to reach the inflection point. To minimize bias, the
data were fitted to the Logistics model 4P of the statistical program JMP. All collected
data regarding growth curve or pH was analyzed in SAS (SAS Institute (version 9.2)
Cary, NC).
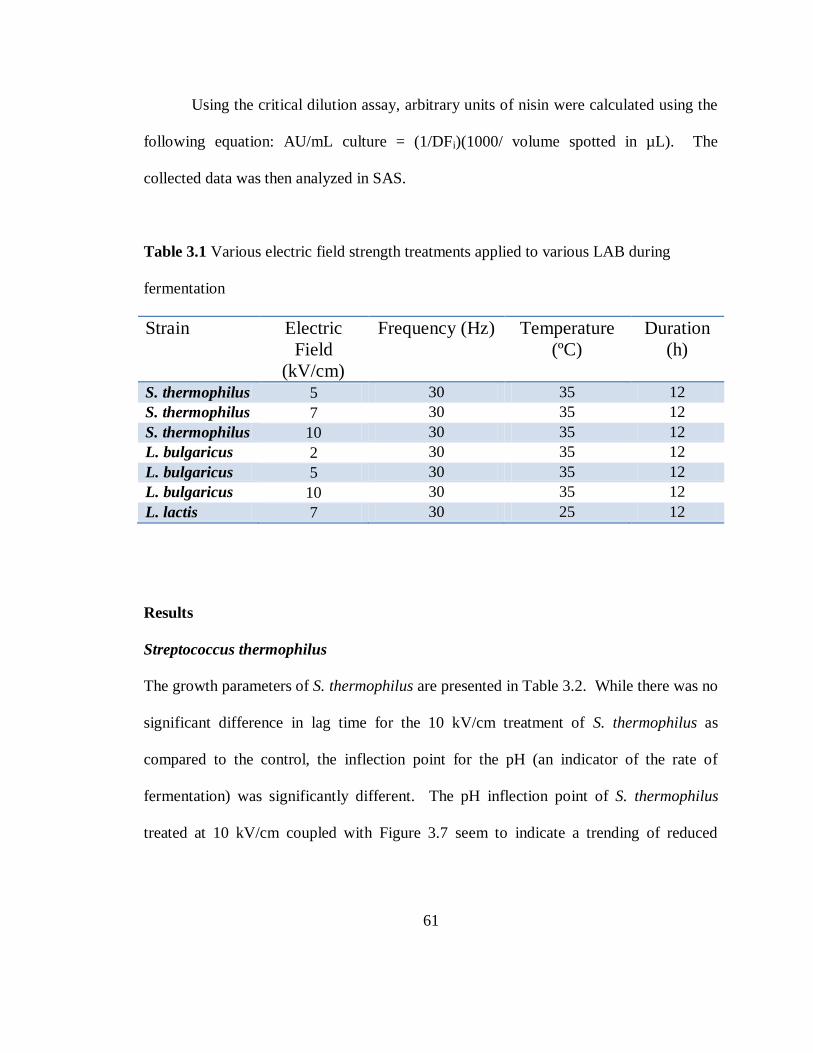
61
Using the critical dilution assay, arbitrary units of nisin were calculated using the
following equation: AU/mL culture = (1/DFi)(1000/ volume spotted in µL). The
collected data was then analyzed in SAS.
Table 3.1 Various electric field strength treatments applied to various LAB during
fermentation
Strain Electric
Field
(kV/cm)
Frequency (Hz) Temperature
(ºC)
Duration
(h)
S. thermophilus 5 30 35 12
S. thermophilus 7 30 35 12
S. thermophilus 10 30 35 12
L. bulgaricus 2 30 35 12
L. bulgaricus 5 30 35 12
L. bulgaricus 10 30 35 12
L. lactis 7 30 25 12
Results
Streptococcus thermophilus
The growth parameters of S. thermophilus are presented in Table 3.2. While there was no
significant difference in lag time for the 10 kV/cm treatment of S. thermophilus as
compared to the control, the inflection point for the pH (an indicator of the rate of
fermentation) was significantly different. The pH inflection point of S. thermophilus
treated at 10 kV/cm coupled with Figure 3.7 seem to indicate a trending of reduced

62
growth as compared to the control. All the other growth parameters from Table 3.2 were
not significantly different from each other.
Lactobacillus bulgaricus
The growth parameters of L. bulgaricus are shown in Table 3.3. PEF at 5 and 10 kV/cm
significantly increased the lag time of L. bulgaricus as compared to the controls. At 10
kV/cm, growth parameters of L. bulgaricus were not modeled due to a growth curve not
being formed because a death curve was observed. (Figure 3.11). The treatment of L.
bulgaricus with 2 kV/cm did not significantly change any of the growth parameters
(Table 3.3). All treatments of L. bulgaricus were different from each other with a trend
of increased lag time as kV/cm increased.
Lactococcus lactis
The growth parameters of L. lactis are presented in Table 3.4. There were no significant
differences in growth parameters of L. lactis between the control and the 7 kV/cm PEF
treatment. The production of the bacteriocin nisin was delayed when treated with PEF.
The control showed the first clearing at 10 hours (200 AU) while the treated showed the
first clearing at 11 hours (200 AU). Both the treated and the control finished with the
same maximum activity at 12 hours (400 AU).
Table 3.2 Growth parameters and pH change for different PEF treatments of
Streptococcus thermophilus at 35°C

63
Treatment
Frequency
Lag
time
(min)
Maximum
specific
growth
Minimum
generation
time (h)
maximum
growth
Total
pH
decline
pH
inflection
point (h)
Cona 30
100.84 0.43 0.39 9.33 1.71 8.20
5 kV/cm 30
102.54 0.43 0.40 9.36 1.75 7.88
Con 30
92.04 0.43 0.43 9.08 1.75 7.36
7 kV/cm 30
118.67 0.52 0.38 9.01 1.75 7.00
Con 30
106.73 0.46 0.40 9.04 1.73 7.57
8 kV/cm 30
111.38 0.49 0.39 8.90 1.74 7.32
Con 30
108.10 0.38 0.48 9.49 1.49 6.81
10 kV/cm 30
117.61 0.56 0.36 9.11 1.80 8.12
aControls were done for each experiment individually
Figure 3.7 Activity of nisin on tryptic soy agar seeded with L. cellobiosis at 10 hours
(left) and 12 hours (right). Fractions taken from the control (top 2) and from the PEF-
treated at 7 kV/cm (bottom 2).

64
Table 3.3 Growth parameters and pH change for different PEF treatments of
Lactobacillus bulgaricus at 35°C
Treatment
Frequency
Lag time
(min)
Maximum
specific
growth
Minimum
generation
time (h)
maximum
growth
Total
pH
decline
pH
inflection
point (h)
Con 30 205.46a 0.55 0.55 8.13 2.33 11.06
2 kV/cm 30 209.01a 0.51 0.57 8.25 2.28 11.33
Con 30 246.95b 0.47 0.61 8.39 2.92 12.17
5 kV/cm 30 305.60c 0.45 0.62 8.44 6.62 40.96
Con 30 220.24a 0.48 0.65 8.12 2.89 12.15
10 kV/cm 30 N/Ad
aControls were done for each experiment individually abcDenotes significant difference (P<0.05) within column dN/A: Growth was inhibited at 10 kV (figure 3.11) therefore no growth parameters were generated
Table 3.4 Growth parameters and pH change for different PEF treatments of Lactococcus
lactis at 25°C
Treatment
Frequency
Lag
time
(min)
Maximum
specific
growth
Minimum
generation
time (h)
maximum
growth
Total
pH
decli
ne
pH
inflectio
n point
(h)
Nisin
(Arbitra
ry
Unitsa
Conb 30 95.96 0.42 0.52 9.46 2.14 4.40 400c
7 kV/cm 30 100.51 0.40 0.53 9.42 2.43 3.80 400c
aArbitrary units values are unique to the test conditions and the indicator microorganism (L.
cellobiosis) bControls were done for each experiment individually
cValues represent arbritray units of nisin after 12 hours of fermentation.

65
Discussion
Traditionally, pulsed electric field is used in one of two ways. The first way is for the
inactivation of microorganisms through pulsing of high electric fields in the range around
20-80 kV/cm (Raghupathy and others 2005). The second way PEF is used is for
extraction of intracellular material from fruits and vegetables (Lebovka and others 2003).
Both of these uses rely on PEF's unique ability to destabilize cell membranes and cause
the formation of irreversible pores which leads to microbial inactivation as well as
enhanced extraction. To our current knowledge, there have been no attempts to carry out
fermentation under the presence of continual pulsed electric field.
Previous research by done by Cho (Cho and others 1996) and Loghavi (Loghavi
and others 2007; Loghavi and others 2008; Loghavi and others 2009) on Lactobacillus
acidophilus and research done by Costello (Chapter 2) on Streptococcus thermophilus
suggested that growth of these microorganisms may be stimulated using moderate
electric field (MEF). The suggested hypothesis for stimulated growth was the formation
of small reversible pores which allowed the unmediated passing of nutrients across the
cell membrane (Loghavi and others 2007). While the effects of changing temperature
and frequency were investigated, changing of the wave form was not. Pulsed electric
field can be found in many different wave forms but for the experiments that we
conducted, a bi-polar square wave was chosen to mimic that of the alternating current
that was used in the previously mentioned research.
Since PEF is known to have lethal effects if the electric field is high enough, and
our intent was to create reversible pores, a range of electric fields (2-10 kV/cm) were

66
tested in order to find the highest electric field each strain could be subjected to without
delaying growth. Subjectively, this electric field strength was around 7 kV/cm for S.
thermophilus and around 2 kV/cm for L. bulgaricus. At these field strengths there were
no significant differences in any of the growth parameters between the control and the
treated cells. While this is helpful in understanding the tolerance of these
microorganisms to PEF, the hypothesized stimulation effect was not observed under
experimental conditions. It is possible that the square wave form or the duration of the
pulses were not conducive to eliciting the desired effects. In comparison, the growth
increase of S. thermophilus in response to MEF treatment resulted from continual
treatment with electric field for 12 hours as compared to PEF which was treated for a
total of 1028.16 µs. This could have been a factor in not seeing growth stimulation.
L. bulgaricus was more sensitive to electric fields as compared to S. thermophilus
due to size and shape differences (Chassy 1988). A general trend of reduced growth as
electric field increased was observed as expected.
Since the parameters tested for PEF did lead to growth stimulation of S.
thermophilus or L. bulgaricus, Lactococcus lactis (a nisin producing strain) was tested in
order to look at the production of bacteriocin during fermentation under continuous PEF.
It was hypothesized that since the production of nisin is a self-inducing mechanism, the
creation of temporary pores could enhance nisin production by allowing earlier release of
the bacteriocin (de Ruyter and others 1996). It was also hypothesized that stress caused
by the pulsed electric field could increase the production of defensive molecules such as
bacteriocins (Verluyten and others 2003).

67
We chose to treat L. lactis with 7 kV/cm PEF due to the fact that it was a Gram-
positive coccus which we believed would respond similarly to PEF treatment as S.
thermophilus did, thus making 7 kV/cm the highest electric field that could be endured
without reduced growth. The maximum amount of nisin produced was observed at 12
hours and was the same for both the treated and the control. The rate of production was
slightly faster with the control as compared to the treated and was probably due to slight
reduced growth due to PEF. A potential reason for the lack of difference between the
treated and control could be due to the fact that nisin production was not found in
detectable levels until 10 hours of fermentation (near stationary phase). It is known that
bacterial cells are more resistant to PEF treatment when in stationary phase (Pothakamury
and others 1996) and this could have been a factor in not seeing increased nisin
production.
Conclusion
Sublethal PEF treatments (2-10 kV/cm, and approximately 1028 µs total
treatment time) did not stimulate the growth of S. thermophilus, L. bulgaricus, or L.
lactis. As electric field was increased past a specific point (2 kV/cm for L. bulgaricus,
and 8 kV/cm for S. thermophilus) growth inhibition was observed. Although no
stimulatory effects were observed under the experimental conditions tested, more
research in the area of sub-lethal pulsed electric field is required before any definitive
conclusions can be made.

68
4
4.5
5
5.5
6
6.5
7
4
5
6
7
8
9
10
0 5 10
pH
S. th
erm
ophi
lus
Log
(CFU
/mL)
a
Hours
10 kV
Control
pH 10 kV
pH Control
Figure 3.8 Log CFU and pH over time of S. thermophilus treated with 10 kV PEF at
35°C aFitted with the gompertz model
bColony forming unit
4
4.5
5
5.5
6
6.5
7
4
5
6
7
8
9
10
0 5 10
pH
S. th
erm
ophi
lus
Log
(CFU
/mL)
a
Hours
8 kV
Control
pH 8 kV
pH Control
Figure 3.9 Changes in log CFU and pH over time of S. thermophilus treated with 8 kV
PEF at 35°C aFitted with the Gompertz model

69
bColony forming unit
4
4.5
5
5.5
6
6.5
7
4
5
6
7
8
9
10
0 5 10
pH
S. th
erm
ophi
lus
Log
(CFU
/mL)
a
Hours
7 kV
Control
pH 7 kV
pH Control
Figure 3.10 Changes in log CFU and pH over time of S. thermophilus treated with 7 kV
PEF at 35°C aFitted with the Gompertz model
bColony forming unit
4
4.5
5
5.5
6
6.5
7
4
5
6
7
8
9
10
0 5 10
pH
S. th
erm
ophi
lus
Log
(CFU
/mL)
a
Hours
5 kV
Control
pH 5 kV
pH Control
Figure 3.11 Changes in log CFU and pH over time of S. thermophilus treated with 5 kV
PEF at 35°C aFitted with the Gompertz model
bColony forming unit

70
4
4.5
5
5.5
6
6.5
7
4
4.5
5
5.5
6
6.5
7
7.5
8
8.5
0 5 10
pH
L. b
ulga
ricus
Log
(CFU
/mL)
a
Hours
10 kV
Control
pH 10kV
pH Control
Figure 3.12 Changes in log CFUb and pH over time of L. bulgaricus treated with 10 kV
PEF at 35°C aFitted with the Gompertz model
bColony forming unit
4
4.5
5
5.5
6
6.5
7
5
5.5
6
6.5
7
7.5
8
8.5
0 5 10
pH
L. b
ulga
ricus
Log
(CFU
/mL)
a
Hours
5 kV
Control
pH 5 kV
pH Control
Figure 3.13 Changes in log CFUb and pH over time of L. bulgaricus treated with 5 kV
PEF at 35°C aFitted with the Gompertz model
bColony forming unit

71
4
4.5
5
5.5
6
6.5
7
5
5.5
6
6.5
7
7.5
8
8.5
0 5 10
pH
L. b
ulga
ricus
Log
(CFU
/mL)
a
Hours
2 kV
Control
pH 2 kV
pH Control
Figure 3.14 Changes in log CFUb and pH over time of L. bulgaricus treated with 2 kV
PEF at 35°C aFitted with the gompertz model
bColony forming unit
4
4.5
5
5.5
6
6.5
7
4
5
6
7
8
9
10
0 5 10
pH
L. la
ctis
Log
(CFU
/mL)
a
Hours
7 kV
Control
pH 7 kV
pH Control
Figure 3.15 Changes in log CFU and pH over time of L. lactis treated with 7 kV PEF at
35°C aFitted with the Gompertz model
bColony forming unit

72
References
Castro AJ, Barbosa-Canovas GV, Swanson BG. 1993. Microbial Inactivation of Foods
by Pulsed Electric Fields. J.Food Process Preserv 17(1):47-73.
Chassy B. 1988. Transformation of bacteria by electroporation. Trends Biotechnol.
6(12):303-309.
Cho HY, Yousef AE, Sastry SK. 1996. Growth kinetics of Lactobacillus acidophilus
under ohmic heating Biotechnol.Bioeng. 49(3):334-40.
Coster HGL, Zimmermann U. 1975. The mechanism of electrical breakdown in the
membranes ofValonia utricularis J.Membr.Biol. 22(1):73-90.
de Ruyter PG, Kuipers OP, de Vos WM. 1996. Controlled gene expression systems for
Lactococcus lactis with the food-grade inducer nisin. Applied and Environmental
Microbiology 62(10):3662-7.
Lebovka NI, Praporscic I, Vorobiev E. 2003. Enhanced expression of juice from soft
vegetable tissues by pulsed electric fields: consolidation stages analysis J.Food Eng.
59(2-3):309-17.
Loghavi L, Sastry SK, Yousef AE. 2008. Effect of moderate electric field frequency on
growth kinetics and metabolic activity of Lactobacillus acidophilus Biotechnol.Prog.
24(1):148-53.
Loghavi L, Sastry SK, Yousef AE. 2007. Effect of moderate electric field on the
metabolic activity and growth kinetics of Lactobacillus acidophilus Biotechnol.Bioeng.
98(4):872-81.
Loghavi L, Sastry SK, Yousef AE. 2009. Effect of moderate electric field frequency
and growth stage on the cell membrane permeability of Lactobacillus acidophilus.
Biotechnol.Prog. 25(1):85-94.
Ohshima T, Sato M, Saito M. 1995. Selective release of intracellular protein using
pulsed electric field J.Electrostatics 35(1):103-12.
Pothakamury UR, Vega H, Zhang Q, Barbosa-Canovas GV, Swanson BG. 1996.
Effect of growth stage and processing temperature on the inactivation of E. coli by pulsed
electric fields. J.Food Prot. 59(11):1167-71.

73
Pulsed Electric Field Processing: Fact Sheet for Food Processors [Internet]. ; 2005
[Accessed 2012 4/29/2012]. Available from: http://ohioline.osu.edu/fse-fact/0002.html
Sale A, Hamilton W. 1967. Effects of high electric fields on microorganismsI. Killing of
bacteria and yeasts Biochimica et Biophysica Acta (BBA) - General Subjects 148(3):781-
8.
Verluyten J, Messens W, De Vuyst L. 2003. The Curing Agent Sodium Nitrite, Used in
the Production of Fermented Sausages, Is Less Inhibiting to the Bacteriocin-Producing
Meat Starter Culture Lactobacillus curvatus LTH 1174 under Anaerobic Conditions.
Appl.Environ.Microbiol. 69(7):3833-9.
Wouters PC, Bos AP, Ueckert J. 2001a. Membrane permeabilization in relation to
inactivation kinetics of Lactobacillus species due to pulsed electric fields
Appl.Environ.Microbiol. 67(7):3092-101.
Wouters PC, Alvarez I, Raso J. 2001b. Critical factors determining inactivation kinetics
by pulsed electric field food processing Trends Food Sci.Technol. 12(3-4):112-21.
Yousef AE, Carlstrom C. 2002. Lactic Acid Fermentation and Bacteriocin Production.
In: Anonymous Food Microbiology: A Laboratory Manual. p 1.
Zhang Q, Qin B, Barbosa-Canovas GV, Swanson BG. 1995. Inactivation of E. coli for
Food Pasteurization by High-Strength Pulsed Electric Fields
. J.Food Process.Preserv. 19(2):103-18.
Zimmermann U, Pilwat G, Riemann F. 1974. Dielectric Breakdown of Cell
Membranes. Biophys.J. 14(11):881-99.
Zwietering MH, Jongenburger I, Rombouts FM, van 't Riet K. 1990. Modeling of the
bacterial growth curve Appl.Environ.Microbiol. 56(6):1875-81.