Supercontinuum generation with 200 pJ laser pulses in an extruded SF6 fiber at 1560 nm
Journal of Food Research; Vol. 3, No. 6; 2014 ISSN 1927-0887 E-ISSN 1927-0895
Published by Canadian Center of Science and Education
107
Effect of Different Extrusion Processing Parameters on Physical Properties of Soy White Flakes and High Protein Distillers Dried
Grains-Based Extruded Aquafeeds
Sushil K. Singh1 & K. Muthukumarappan1 1 Department of Agricultural & Biosystems Engineering, South Dakota State University, Brookings, SD, USA
Correspondence: Sushil K. Singh, Department of Agricultural and Biosystems Engineering, South Dakota State University, Brookings, SD, USA. E-mail: [email protected]
Received: February 11, 2014 Accepted: August 13, 2014 Online Published: August 18, 2014
doi:10.5539/jfr.v3n6p107 URL: http://dx.doi.org/10.5539/jfr.v3n6p107
Abstract
Nutritionally balanced ingredient blends for catla (Catla catla), belonging to the family Cyprinidae, were extruded using single screw extruder. The extrusion was carried out at five levels of soy white flakes content (21%, 29%, 40%, 52%, and 59% db), five levels of moisture content (15, 19, 25, 31, and 35% db) and five levels of barrel temperature (100, 110, 125, 140, and 150 ºC) using three different die nozzles (having L/D ratios 3.33, 5.83, and 7.25). Blends with net protein content of 32.5% contains soy white flakes, along with high protein distillers dried grains (HP-DDG), corn flour, corn gluten meal, fish meal, vitamin, and mineral mix. A central composite rotatable design (CCRD) and response surface methodology (RSM) was used to investigate the significance of independent and interaction effects of the extrusion process variables on the extrudates physical properties namely pellet durability index, bulk density, water absorption and solubility indices and expansion ratio. Quadratic polynomial regression equations were developed to correlate the product responses and process variables as well as to obtain the response surfaces plots. The independent variables had significant (P < 0.05) effects on physical properties of extrudates: (i) higher soy white flakes content increased the pellet durability index and water absorption index, but decreased the water solubility index, (ii) higher temperature decreased pellet durability index, bulk density and water solubility index, (iii) increased L/D ratio from 3.33 to 7.25 increased the pellet durability index, expansion ratio but decreased the bulk density of the extrudates.
Keywords: bulk density, die, extrusion, pellet durability index, unit density, soy white flakes
1. Introduction
In the food producing industries, aquaculture is one of the fastest growing sectors (FAO, 2012) and plays a pivotal role for the maintenance of commercial fishery markets (O’Mahoney et al., 2011). In aquaculture, diet is often the single largest operating cost item and can represent over 50% of the operating costs in intensive aquaculture (El-Sayed, 1999, 2004). Protein is the most important nutrient of the fish feed. The main protein source used in aquafeed production is primarily fish meal which is supplied through the consumption of wild fish stocks. Indubitably, with the increasing rate of farmed fish production (FAO, 2008) and consequently rising prices of fishmeal (Hardy, 2010), the continued use of fishmeal as the main protein source of the feed will no longer be ecologically and economically sustainable in the long run. Therefore, aquaculture industry now is focusing on alternative protein sources such as plant proteins as inexpensive source of protein to minimize production cost.
Soy white flakes and High Protein - Distiller Dried Grains (HP-DDG) contain significant amount of protein and are thus a possible alternative source of protein for aquaculture feeds (Chin et al., 1989; Wu et al., 1994, 1996). Use of soy products like full fatted soybean meal, defatted toasted soybean meal (SBM) and defatted untoasted soybean meal or soy white flakes is becoming common (Fallahi et al., 2012). Romarheim et al. (2005) found that extrusion of soy white flakes diet increased the digestibility of protein and all amino acids compared to the unextruded soy white flakes diet probably due to the reduction in trypsin inhibitor activity. Dersjant-Li, (2002) reported that soy protein isolate can be used to replace 40-100% fish meal without negative impact on growth performance of shrimp. Distillers Dried Grains (DDG) and Distillers Dried Grains with Solubles (DDGS), a co-product from corn-based dry grind fuel ethanol manufacturing, is also a viable protein source. Research
www.ccsenet.org/jfr Journal of Food Research Vol. 3, No. 6; 2014
108
carried out by Wu et al. (1994, 1996a) indicated that tilapia fish can be grown with DDGS, and can improve the economic viability of aquaculture farms.
Extrusion cooking is widely used in the food and feed industries because of versatility during processing and the ability to produce various final textural properties (Mercier et al., 1989). Extruded aquafeed are designed to floater sink based on the fish species requirement. One of the important quality parameters for fish feed is floatability (Bandyopadhyay & Ranjan 2001; Rolfe et al., 2001) which depends on the unit density of extrudates. During extrusion cooking, the extent of expansion affects the unit density of the extrudates. Expansion can be monitored by changing the nature and type of ingredients used and the extruder process parameters. In the food industry, puffed products are often produced by using starch based ingredients, while texturized products are often produced by using protein based ingredients (Kokini et al., 1992a, 1992b). Extrudate properties of starch based products depend on the extent of gelatinization occurring inside the extruder barrel. The formation of elastic melt inside the barrel depends on the extent of gelatinization. (Case et al., 1992; Lin et al., 2000; Ilo et al., 1996; Ibanoglu et al., 1996; Sokhey et al., 1994). Expansion occurs due to the flashing of water vapor when the elastic melt exits through the die nozzle. (Lam & Flores, 2003; Alves et al., 1999). On the other hand, ingredients with higher protein content shows limited degree of expansion due to plastic melt formation and protein denaturation inside the extruder barrel. The material is in plastic and homogeneous state and when it exits through the die nozzle there is a sudden pressure drop resulting in the formation of voids. Due to this void formation the final product becomes more porous and fibrous textured (Singh et al., 1991; Gwiazda et al., 1987; Sandra & Jose, 1993). Depending on the type of species, aquaculture feed requires 26 to 50% protein content. (Lovell, 1988).
Extrusion process depends on many factors which includes the pressure developed inside the die and the degree to which the screw is filled. These variables in combination with the type and composition of raw ingredients used, affects operational capabilities (Mercier et al., 1989). Extruder die too have an impact on the processing conditions. For example, in case of circular dies, nozzle dimensions (i.e., nozzle diameter and length) will affect process conditions and performance (Chinnaswamy et al., 1987).
The objective of thisstudy was to examine the effect of varying level of soy white flakesas the fish meal replacer, barrel temperature, die aspect ratio, and moisture content on physical properties of soy white flakesand HP-DDG based extrudates.
2. Materials and Methods
2.1 Blends Preparation
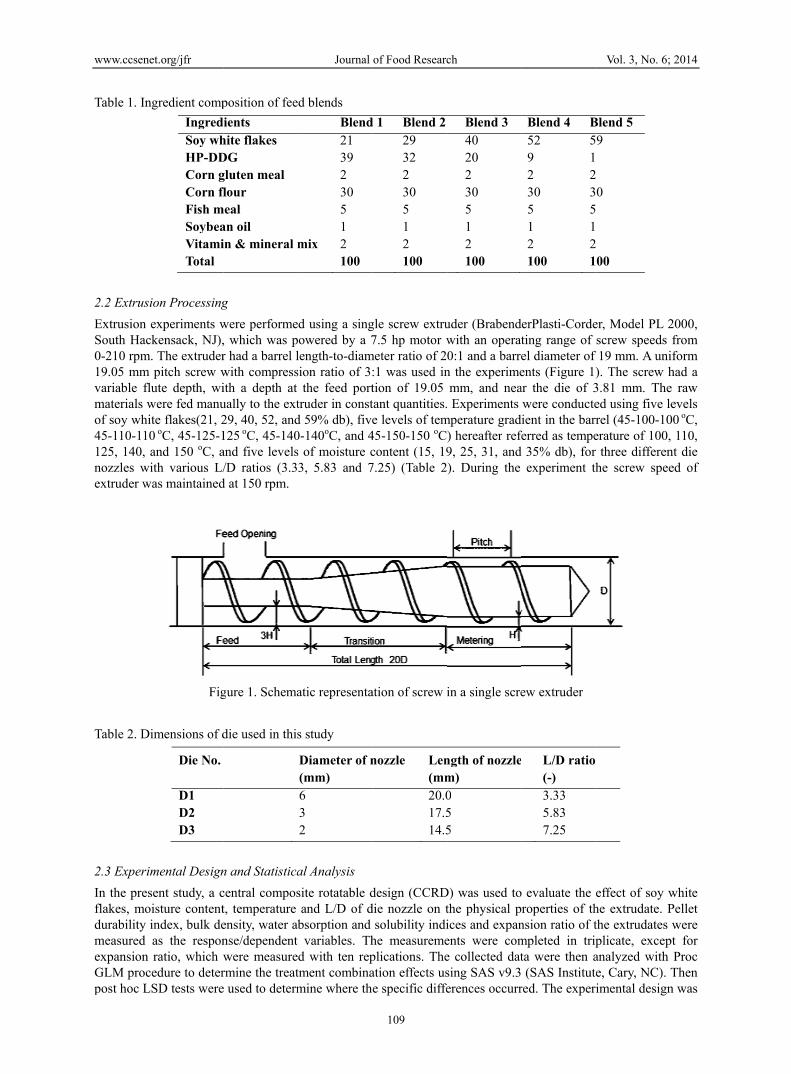
Five isocaloric (302 kcal/100g) different blends were adjusted to a target protein content of ~ 32.5% db and a target fat content of ~ 3.5%. The total energy content for each blend was determined based on the fraction of protein, lipid and carbohydrate contributing to the dietary energy. The total energy content was calculated based on the energy content of fractions namely, 4.5 kcal/g for protein, 9.1 kcal/g for lipid and 4.1 kcal/g for carbohydrate. The ingredient components of the feed blends are provided in Table 1. Soy white flakes was kindly donated by South Dakota Soybean Processors, Volga, SD. HP-DDG was obtained from the Dakota Ethanol LLC (Wentworth, SD). Corn gluten meal and fishmeal were purchased from Consumer Supply Distributing Co. (Sioux City, IA). Corn flour was from Cargill Dry Ingredients (Paris, IL). Vitamin and mineral premix was obtained from Lortscher Agri Service, Inc. (Bern, Kansas, USA). Soybean oil was provided from USDA (Brookings, SD). The different ingredients were mixed in a laboratory model Hobart mixer (Hobart Corporation, Troy, Ohio, USA) for 10 minutes; the moisture content of the ingredient mix was adjusted by adding required quantities of water during mixing. The resulting blends were then stored at ambient temperature overnight until processing.
www.ccsen
Table 1. In
2.2 Extrus
Extrusion South Hac0-210 rpm19.05 mmvariable flmaterials wof soy whi45-110-11125, 140, nozzles wextruder w
Table 2. D
2.3 Experi
In the presflakes, modurability measured expansion GLM procpost hoc L
et.org/jfr
ngredient comp
IngredSoy whHP-DDCorn gCorn flFish mSoybeaVitamiTotal
ion Processing
experiments wckensack, NJ),
m. The extruderm pitch screw w
lute depth, wiwere fed manuite flakes(21, 20 oC, 45-125-1and 150 oC, a
with various L/was maintained
Fig
Dimensions of d
Die No. D1 D2 D3
imental Design
sent study, a coisture contentindex, bulk deas the responratio, which w
cedure to deterLSD tests were
position of fee
ients hite flakes DGgluten meal flour
mealan oil in & mineral m
g
were performe, which was pr had a barrel lwith compressith a depth at ually to the ext29, 40, 52, and125 oC, 45-140and five levels/D ratios (3.3
d at 150 rpm.
gure 1. Schema
die used in this
n and Statistica
central compost, temperature ensity, water abnse/dependent were measurermine the treate used to determ
Journal
d blends
Blend213923051
mix 2100
d using a singowered by a 7length-to-diamsion ratio of 3:
the feed porttruder in constd 59% db), five0-140oC, and 4s of moisture c3, 5.83 and 7
atic representa
s study
Diameter of n(mm)6 3 2
al Analysis
site rotatable dand L/D of dbsorption and variables. Th
d with ten reptment combinamine where th
of Food Researc
109
d 1 Blend 22932230512100
gle screw extru7.5 hp motor w
meter ratio of 2:1 was used intion of 19.05 tant quantities.e levels of tem
45-150-150 oC)content (15, 197.25) (Table 2
ation of screw i
nozzle Len(mm20.017.514.5
design (CCRDdie nozzle on t
solubility indihe measuremeplications. Theation effects use specific diffe
ch
Blend 34020230512100
uder (Brabendwith an operat0:1 and a barren the experimemm, and nea Experiments
mperature gradi) hereafter refe9, 25, 31, and ). During the
in a single scre
ngth of nozzlem)055
D) was used tothe physical pices and expanents were come collected datsing SAS v9.3erences occurr
Blend 4 B52 59 12 230 35 51 12 2100 1
erPlasti-Cordeting range of el diameter of ents (Figure 1)ar the die of 3were conducteient in the barr
ferred as tempe35% db), for experiment th
ew extruder
L/D ratio (-)3.33 5.83 7.25
evaluate the eroperties of th
nsion ratio of tmpleted in tripta were then a(SAS Institute
red. The experi
Vol. 3, No. 6;
Blend 5 9 0 00
er, Model PL 2screw speeds 19 mm. A uni). The screw h3.81 mm. Theed using five lerel (45-100-10erature of 100,
three differenhe screw spee
effect of soy whe extrudate. Pthe extrudates plicate, excepanalyzed with e, Cary, NC). Timental design
2014
2000, from
iform had a e raw evels
00 oC, 110,
nt die ed of
white Pellet were
pt for Proc Then
n was
www.ccsenet.org/jfr Journal of Food Research Vol. 3, No. 6; 2014
110
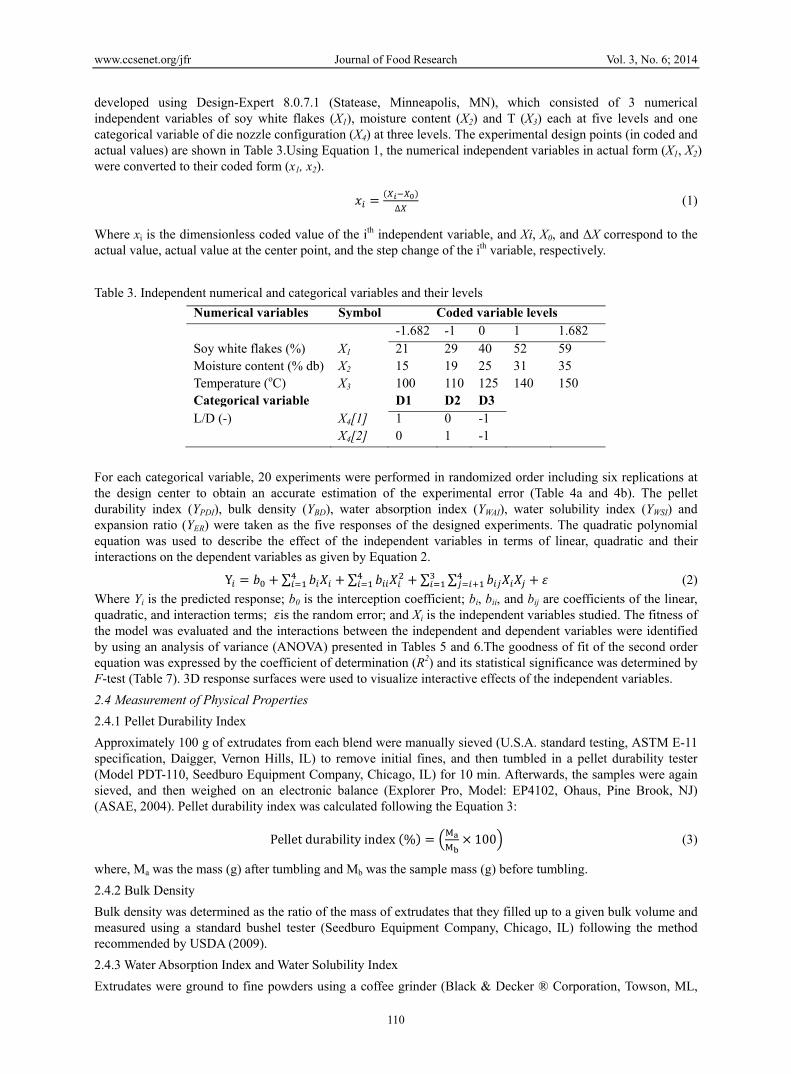
developed using Design-Expert 8.0.7.1 (Statease, Minneapolis, MN), which consisted of 3 numerical independent variables of soy white flakes (X1), moisture content (X2) and T (X3) each at five levels and one categorical variable of die nozzle configuration (X4) at three levels. The experimental design points (in coded and actual values) are shown in Table 3.Using Equation 1, the numerical independent variables in actual form (X1, X2) were converted to their coded form (x1, x2).
∆
(1)
Where xi is the dimensionless coded value of the ith independent variable, and Xi, X0, and ΔX correspond to the actual value, actual value at the center point, and the step change of the ith variable, respectively.
Table 3. Independent numerical and categorical variables and their levels
Numerical variables Symbol Coded variable levels -1.682 -1 0 1 1.682 Soy white flakes (%) X1 21 29 40 52 59 Moisture content (% db) X2 15 19 25 31 35 Temperature (oC) X3 100 110 125 140 150 Categorical variable D1 D2 D3L/D (-) X4[1] 1 0 -1 X4[2] 0 1 -1
For each categorical variable, 20 experiments were performed in randomized order including six replications at the design center to obtain an accurate estimation of the experimental error (Table 4a and 4b). The pellet durability index (YPDI), bulk density (YBD), water absorption index (YWAI), water solubility index (YWSI) and expansion ratio (YER) were taken as the five responses of the designed experiments. The quadratic polynomial equation was used to describe the effect of the independent variables in terms of linear, quadratic and their interactions on the dependent variables as given by Equation 2.
Y ∑ ∑ ∑ ∑ (2)
Where Yi is the predicted response; b0 is the interception coefficient; bi, bii, and bij are coefficients of the linear, quadratic, and interaction terms; is the random error; and Xi is the independent variables studied. The fitness of the model was evaluated and the interactions between the independent and dependent variables were identified by using an analysis of variance (ANOVA) presented in Tables 5 and 6.The goodness of fit of the second order equation was expressed by the coefficient of determination (R2) and its statistical significance was determined by F-test (Table 7). 3D response surfaces were used to visualize interactive effects of the independent variables.
2.4 Measurement of Physical Properties
2.4.1 Pellet Durability Index
Approximately 100 g of extrudates from each blend were manually sieved (U.S.A. standard testing, ASTM E-11 specification, Daigger, Vernon Hills, IL) to remove initial fines, and then tumbled in a pellet durability tester (Model PDT-110, Seedburo Equipment Company, Chicago, IL) for 10 min. Afterwards, the samples were again sieved, and then weighed on an electronic balance (Explorer Pro, Model: EP4102, Ohaus, Pine Brook, NJ) (ASAE, 2004). Pellet durability index was calculated following the Equation 3:
Pellet durability index %M
M100 (3)
where, Ma was the mass (g) after tumbling and Mb was the sample mass (g) before tumbling.
2.4.2 Bulk Density
Bulk density was determined as the ratio of the mass of extrudates that they filled up to a given bulk volume and measured using a standard bushel tester (Seedburo Equipment Company, Chicago, IL) following the method recommended by USDA (2009).
2.4.3 Water Absorption Index and Water Solubility Index
Extrudates were ground to fine powders using a coffee grinder (Black & Decker ® Corporation, Towson, ML,

www.ccsenet.org/jfr Journal of Food Research Vol. 3, No. 6; 2014
111
USA). The ground extrudates (2.5 g) was suspended in distilled water (30 mL) in a tarred 60 mL centrifuge tube. The suspension was stirred intermittently and centrifuged at 3000g for 10 min. The supernatant was decanted into a tarred aluminums cup and dried at 135 ºC for 2 h (AACC, 2000). The weight of the gel remaining in the centrifuge tube was measured. The water absorption index and water solubility index were calculated by Equation 4 and 5, respectively:
Water absorption index unitlessW
W (4)
where Wg is the weight of gel (g), and Wds is the weight of dry sample (g).
Water solubility index %W
W100 (5)
where Wss is the weight of dry solids of supernatant (g), and Wds is the weight of dry sample (g).
2.4.4 Expansion Ratio
The radial expansion ratio of the extrudates was measured as the ratio of the diameter of the extrudates to the diameter of the die orifice.
Table 4a. Experimental design layout
Run Coded variables Actual variables
x1 x2 x3 x4 X1 X2 X3 X4
x4[1] x4[2] (%) (% db) (oC) (-)
1 0 0 -1.682 1 0 40 25 100 D1
2 0 0 0 0 1 40 25 125 D2
3 -1 -1 1 1 0 29 19 140 D1
4 1.682 0 0 1 0 59 25 125 D1
5 1 -1 -1 0 1 52 19 110 D2
6 0 0 0 1 0 40 25 125 D1
7 1 1 -1 0 1 52 31 110 D2
8 1 -1 1 0 1 52 19 140 D2
9 0 0 0 -1 -1 40 25 125 D3
10 1 -1 1 1 0 52 19 140 D1
11 -1 1 -1 0 1 29 31 110 D2
12 1 1 1 1 0 52 31 140 D1
13 0 0 1.682 0 1 40 25 150 D2
14 -1 -1 -1 0 1 29 19 110 D2
15 0 0 0 -1 -1 40 25 125 D3
16 1 -1 1 -1 -1 52 19 140 D3
17 -1 1 -1 1 0 29 31 110 D1
18 0 0 0 -1 -1 40 25 125 D3
19 -1.682 0 0 1 0 21 25 125 D1
20 -1 -1 -1 -1 -1 29 19 110 D3
21 0 0 0 1 0 40 25 125 D1
22 0 -1.682 0 0 1 40 15 125 D2
23 0 0 -1.682 -1 -1 40 25 100 D3
24 -1 -1 -1 1 0 29 19 110 D1
25 1.682 0 0 0 1 59 25 125 D2
26 0 0 0 -1 -1 40 25 125 D3
27 1 1 -1 1 0 52 31 110 D1
28 0 0 0 -1 -1 40 25 125 D3
29 -1.682 0 0 0 1 21 25 125 D2
30 0 0 0 0 1 40 25 125 D2
www.ccsenet.org/jfr Journal of Food Research Vol. 3, No. 6; 2014
112
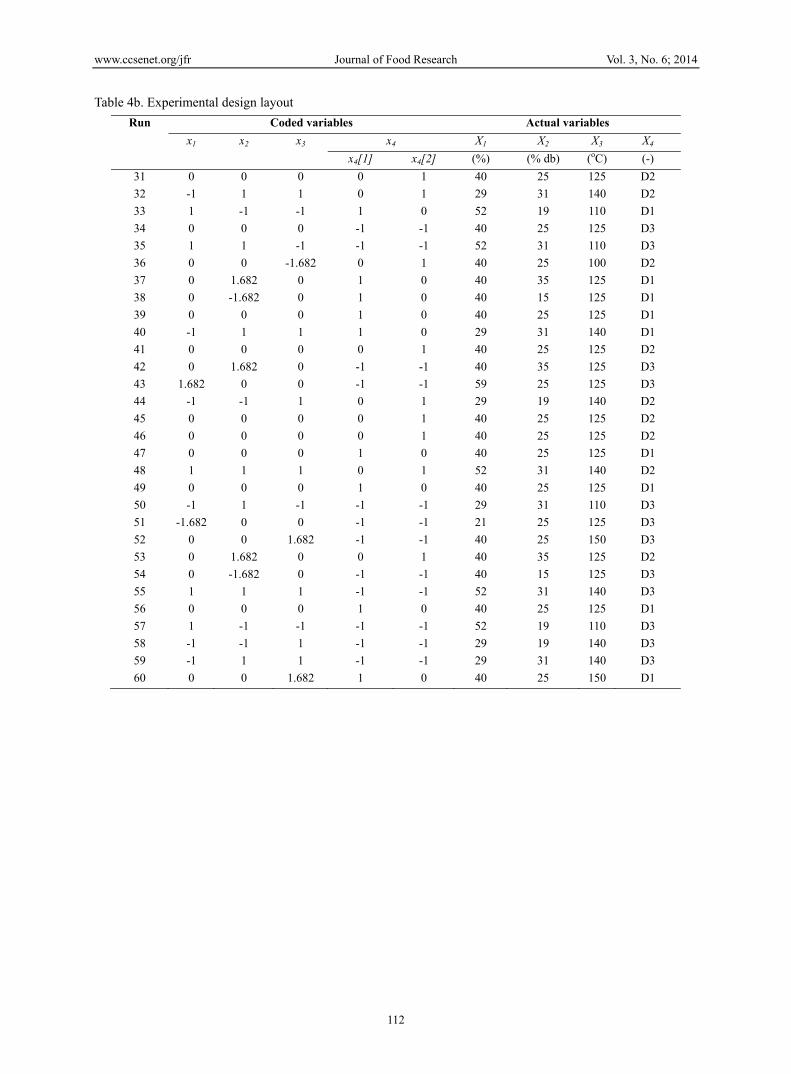
Table 4b. Experimental design layout
Run Coded variables Actual variables
x1 x2 x3 x4 X1 X2 X3 X4
x4[1] x4[2] (%) (% db) (oC) (-)
31 0 0 0 0 1 40 25 125 D2
32 -1 1 1 0 1 29 31 140 D2
33 1 -1 -1 1 0 52 19 110 D1
34 0 0 0 -1 -1 40 25 125 D3
35 1 1 -1 -1 -1 52 31 110 D3
36 0 0 -1.682 0 1 40 25 100 D2
37 0 1.682 0 1 0 40 35 125 D1
38 0 -1.682 0 1 0 40 15 125 D1
39 0 0 0 1 0 40 25 125 D1
40 -1 1 1 1 0 29 31 140 D1
41 0 0 0 0 1 40 25 125 D2
42 0 1.682 0 -1 -1 40 35 125 D3
43 1.682 0 0 -1 -1 59 25 125 D3
44 -1 -1 1 0 1 29 19 140 D2
45 0 0 0 0 1 40 25 125 D2
46 0 0 0 0 1 40 25 125 D2
47 0 0 0 1 0 40 25 125 D1
48 1 1 1 0 1 52 31 140 D2
49 0 0 0 1 0 40 25 125 D1
50 -1 1 -1 -1 -1 29 31 110 D3
51 -1.682 0 0 -1 -1 21 25 125 D3
52 0 0 1.682 -1 -1 40 25 150 D3
53 0 1.682 0 0 1 40 35 125 D2
54 0 -1.682 0 -1 -1 40 15 125 D3
55 1 1 1 -1 -1 52 31 140 D3
56 0 0 0 1 0 40 25 125 D1
57 1 -1 -1 -1 -1 52 19 110 D3
58 -1 -1 1 -1 -1 29 19 140 D3
59 -1 1 1 -1 -1 29 31 140 D3
60 0 0 1.682 1 0 40 25 150 D1
www.ccsenet.org/jfr Journal of Food Research Vol. 3, No. 6; 2014
113
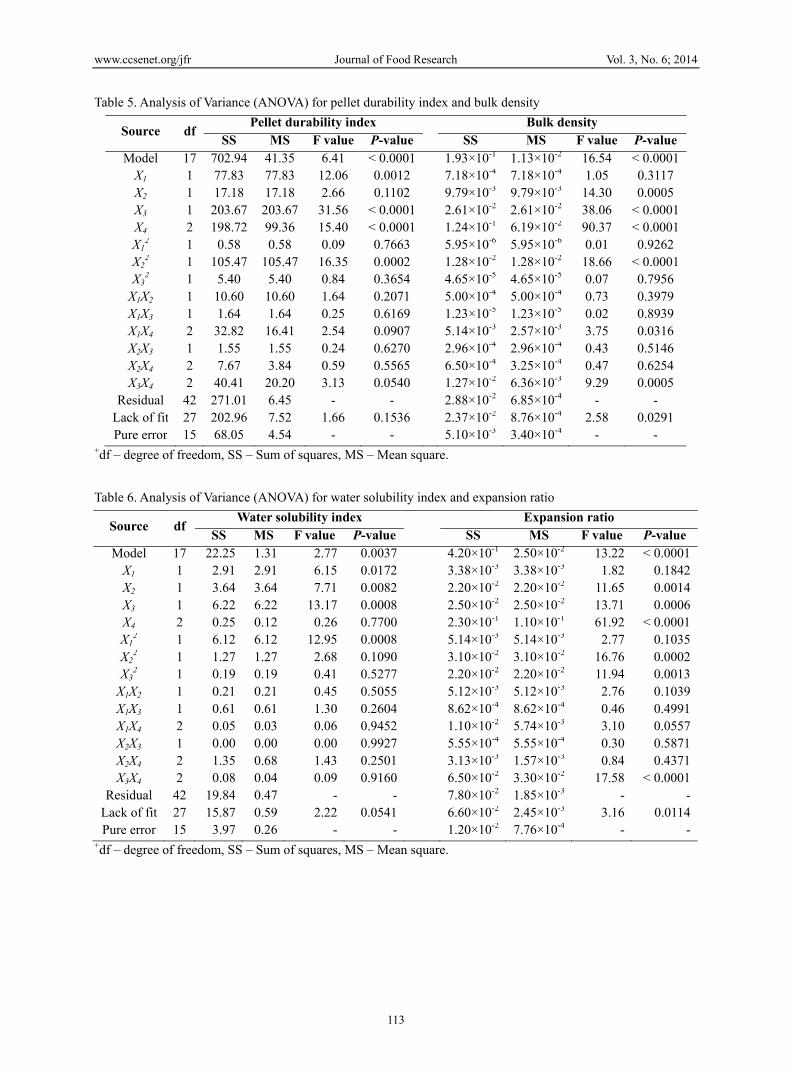
Table 5. Analysis of Variance (ANOVA) for pellet durability index and bulk density
Source df Pellet durability index Bulk density
SS MS F value P-value SS MS F value P-valueModel 17 702.94 41.35 6.41 < 0.0001 1.93×10⁻¹ 1.13×10⁻² 16.54 < 0.0001
X1 1 77.83 77.83 12.06 0.0012 7.18×10⁻⁴ 7.18×10⁻⁴ 1.05 0.3117X2 1 17.18 17.18 2.66 0.1102 9.79×10⁻³ 9.79×10⁻³ 14.30 0.0005X3 1 203.67 203.67 31.56 < 0.0001 2.61×10⁻² 2.61×10⁻² 38.06 < 0.0001X4 2 198.72 99.36 15.40 < 0.0001 1.24×10⁻¹ 6.19×10⁻² 90.37 < 0.0001X1
2 1 0.58 0.58 0.09 0.7663 5.95×10⁻⁶ 5.95×10⁻⁶ 0.01 0.9262X2
2 1 105.47 105.47 16.35 0.0002 1.28×10⁻² 1.28×10⁻² 18.66 < 0.0001X3
2 1 5.40 5.40 0.84 0.3654 4.65×10⁻⁵ 4.65×10⁻⁵ 0.07 0.7956X1X2 1 10.60 10.60 1.64 0.2071 5.00×10⁻⁴ 5.00×10⁻⁴ 0.73 0.3979X1X3 1 1.64 1.64 0.25 0.6169 1.23×10⁻⁵ 1.23×10⁻⁵ 0.02 0.8939X1X4 2 32.82 16.41 2.54 0.0907 5.14×10⁻³ 2.57×10⁻³ 3.75 0.0316X2X3 1 1.55 1.55 0.24 0.6270 2.96×10⁻⁴ 2.96×10⁻⁴ 0.43 0.5146X2X4 2 7.67 3.84 0.59 0.5565 6.50×10⁻⁴ 3.25×10⁻⁴ 0.47 0.6254X3X4 2 40.41 20.20 3.13 0.0540 1.27×10⁻² 6.36×10⁻³ 9.29 0.0005
Residual 42 271.01 6.45 - - 2.88×10⁻² 6.85×10⁻⁴ - -Lack of fit 27 202.96 7.52 1.66 0.1536 2.37×10⁻² 8.76×10⁻⁴ 2.58 0.0291Pure error 15 68.05 4.54 - - 5.10×10⁻³ 3.40×10⁻⁴ - -
+df – degree of freedom, SS – Sum of squares, MS – Mean square.
Table 6. Analysis of Variance (ANOVA) for water solubility index and expansion ratio
Source df Water solubility index Expansion ratio
SS MS F value P-value SS MS F value P-valueModel 17 22.25 1.31 2.77 0.0037 4.20×10⁻¹ 2.50×10⁻² 13.22 < 0.0001
X1 1 2.91 2.91 6.15 0.0172 3.38×10⁻³ 3.38×10⁻³ 1.82 0.1842X2 1 3.64 3.64 7.71 0.0082 2.20×10⁻² 2.20×10⁻² 11.65 0.0014X3 1 6.22 6.22 13.17 0.0008 2.50×10⁻² 2.50×10⁻² 13.71 0.0006X4 2 0.25 0.12 0.26 0.7700 2.30×10⁻¹ 1.10×10⁻¹ 61.92 < 0.0001X1
2 1 6.12 6.12 12.95 0.0008 5.14×10⁻³ 5.14×10⁻³ 2.77 0.1035X2
2 1 1.27 1.27 2.68 0.1090 3.10×10⁻² 3.10×10⁻² 16.76 0.0002X3
2 1 0.19 0.19 0.41 0.5277 2.20×10⁻² 2.20×10⁻² 11.94 0.0013X1X2 1 0.21 0.21 0.45 0.5055 5.12×10⁻³ 5.12×10⁻³ 2.76 0.1039X1X3 1 0.61 0.61 1.30 0.2604 8.62×10⁻⁴ 8.62×10⁻⁴ 0.46 0.4991X1X4 2 0.05 0.03 0.06 0.9452 1.10×10⁻² 5.74×10⁻³ 3.10 0.0557X2X3 1 0.00 0.00 0.00 0.9927 5.55×10⁻⁴ 5.55×10⁻⁴ 0.30 0.5871X2X4 2 1.35 0.68 1.43 0.2501 3.13×10⁻³ 1.57×10⁻³ 0.84 0.4371X3X4 2 0.08 0.04 0.09 0.9160 6.50×10⁻² 3.30×10⁻² 17.58 < 0.0001
Residual 42 19.84 0.47 - - 7.80×10⁻² 1.85×10⁻³ - -Lack of fit 27 15.87 0.59 2.22 0.0541 6.60×10⁻² 2.45×10⁻³ 3.16 0.0114Pure error 15 3.97 0.26 - - 1.20×10⁻² 7.76×10⁻⁴ - -
+df – degree of freedom, SS – Sum of squares, MS – Mean square.
www.ccsenet.org/jfr Journal of Food Research Vol. 3, No. 6; 2014
114
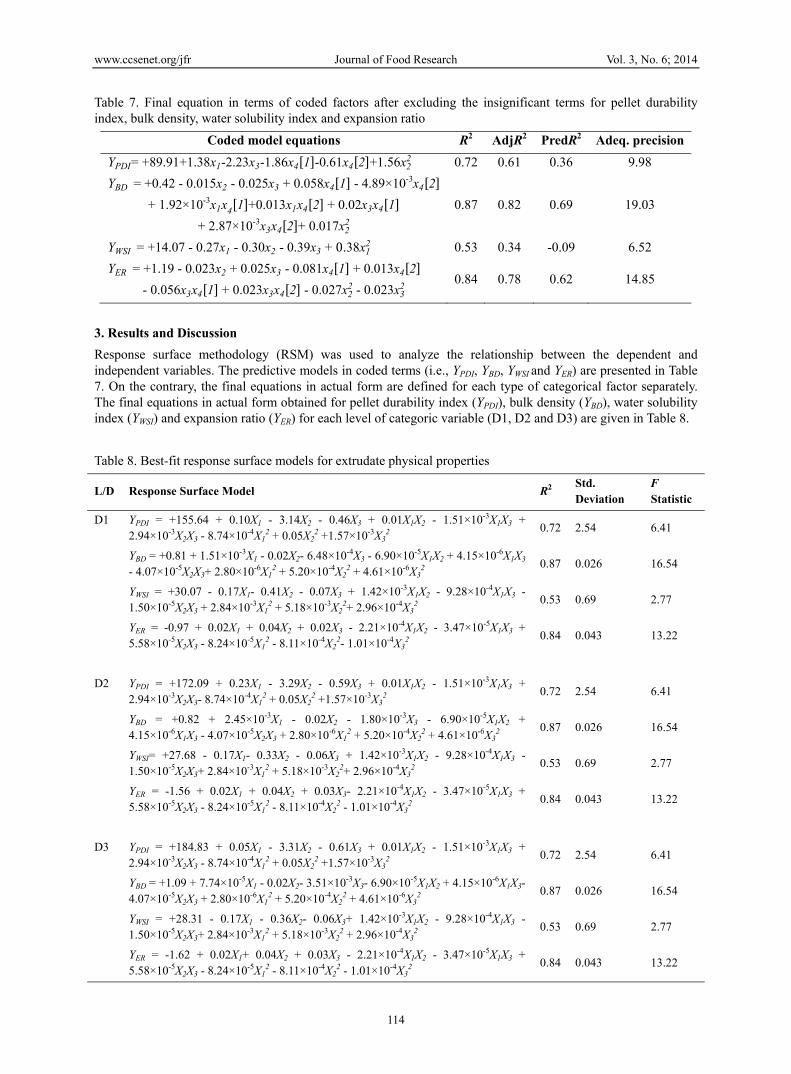
Table 7. Final equation in terms of coded factors after excluding the insignificant terms for pellet durability index, bulk density, water solubility index and expansion ratio
Coded model equations R2 AdjR2 PredR2 Adeq. precision
YPDI= +89.91+1.38x1-2.23x3-1.86x4 1 -0.61x4 2 +1.56x22 0.72 0.61 0.36 9.98
YBD = +0.42 - 0.015x2 - 0.025x3 + 0.058x4 1 - 4.89×10-3x4 2
+ 1.92×10-3x1x4 1 +0.013x1x4 2 + 0.02x3x4 1
+ 2.87×10-3x3x4 2 + 0.017x22
0.87 0.82 0.69 19.03
YWSI = +14.07 - 0.27x1 - 0.30x2 - 0.39x3 + 0.38x12 0.53 0.34 -0.09 6.52
YER = +1.19 - 0.023x2 + 0.025x3 - 0.081x4 1 + 0.013x4 2
- 0.056x3x4 1 + 0.023x3x4 2 - 0.027x22 - 0.023x3
2 0.84 0.78 0.62 14.85
3. Results and Discussion
Response surface methodology (RSM) was used to analyze the relationship between the dependent and independent variables. The predictive models in coded terms (i.e., YPDI, YBD, YWSI and YER) are presented in Table 7. On the contrary, the final equations in actual form are defined for each type of categorical factor separately. The final equations in actual form obtained for pellet durability index (YPDI), bulk density (YBD), water solubility index (YWSI) and expansion ratio (YER) for each level of categoric variable (D1, D2 and D3) are given in Table 8.
Table 8. Best-fit response surface models for extrudate physical properties
L/D Response Surface Model R2 Std. Deviation
F Statistic
D1 YPDI = +155.64 + 0.10X1 - 3.14X2 - 0.46X3 + 0.01X1X2 - 1.51×10-3X1X3 + 2.94×10-3X2X3 - 8.74×10-4X1
2 + 0.05X22 +1.57×10-3X3
2 0.72 2.54 6.41
YBD = +0.81 + 1.51×10-3X1 - 0.02X2- 6.48×10-4X3 - 6.90×10-5X1X2 + 4.15×10-6X1X3 - 4.07×10-5X2X3+ 2.80×10-6X1
2 + 5.20×10-4X22 + 4.61×10-6X3
2 0.87 0.026 16.54
YWSI = +30.07 - 0.17X1- 0.41X2 - 0.07X3 + 1.42×10-3X1X2 - 9.28×10-4X1X3 - 1.50×10-5X2X3 + 2.84×10-3X1
2 + 5.18×10-3X22+ 2.96×10-4X3
2 0.53 0.69 2.77
YER = -0.97 + 0.02X1 + 0.04X2 + 0.02X3 - 2.21×10-4X1X2 - 3.47×10-5X1X3 + 5.58×10-5X2X3 - 8.24×10-5X1
2 - 8.11×10-4X22- 1.01×10-4X3
2 0.84 0.043 13.22
D2 YPDI = +172.09 + 0.23X1 - 3.29X2 - 0.59X3 + 0.01X1X2 - 1.51×10-3X1X3 + 2.94×10-3X2X3- 8.74×10-4X1
2 + 0.05X22 +1.57×10-3X3
2 0.72 2.54 6.41
YBD = +0.82 + 2.45×10-3X1 - 0.02X2 - 1.80×10-3X3 - 6.90×10-5X1X2 + 4.15×10-6X1X3 - 4.07×10-5X2X3 + 2.80×10-6X1
2 + 5.20×10-4X22 + 4.61×10-6X3
2 0.87 0.026 16.54
YWSI= +27.68 - 0.17X1- 0.33X2 - 0.06X3 + 1.42×10-3X1X2 - 9.28×10-4X1X3 - 1.50×10-5X2X3+ 2.84×10-3X1
2 + 5.18×10-3X22+ 2.96×10-4X3
2 0.53 0.69 2.77
YER = -1.56 + 0.02X1 + 0.04X2 + 0.03X3- 2.21×10-4X1X2 - 3.47×10-5X1X3 + 5.58×10-5X2X3 - 8.24×10-5X1
2 - 8.11×10-4X22 - 1.01×10-4X3
2 0.84 0.043 13.22
D3 YPDI = +184.83 + 0.05X1 - 3.31X2 - 0.61X3 + 0.01X1X2 - 1.51×10-3X1X3 + 2.94×10-3X2X3 - 8.74×10-4X1
2 + 0.05X22 +1.57×10-3X3
2 0.72 2.54 6.41
YBD = +1.09 + 7.74×10-5X1 - 0.02X2- 3.51×10-3X3- 6.90×10-5X1X2 + 4.15×10-6X1X3- 4.07×10-5X2X3 + 2.80×10-6X1
2 + 5.20×10-4X22 + 4.61×10-6X3
2 0.87 0.026 16.54
YWSI = +28.31 - 0.17X1 - 0.36X2- 0.06X3+ 1.42×10-3X1X2 - 9.28×10-4X1X3 - 1.50×10-5X2X3+ 2.84×10-3X1
2 + 5.18×10-3X22 + 2.96×10-4X3
2 0.53 0.69 2.77
YER = -1.62 + 0.02X1+ 0.04X2 + 0.03X3 - 2.21×10-4X1X2 - 3.47×10-5X1X3 + 5.58×10-5X2X3 - 8.24×10-5X1
2 - 8.11×10-4X22 - 1.01×10-4X3
2 0.84 0.043 13.22
www.ccsen
Overall, cproperties.properties (P<0.05) pfor the trea
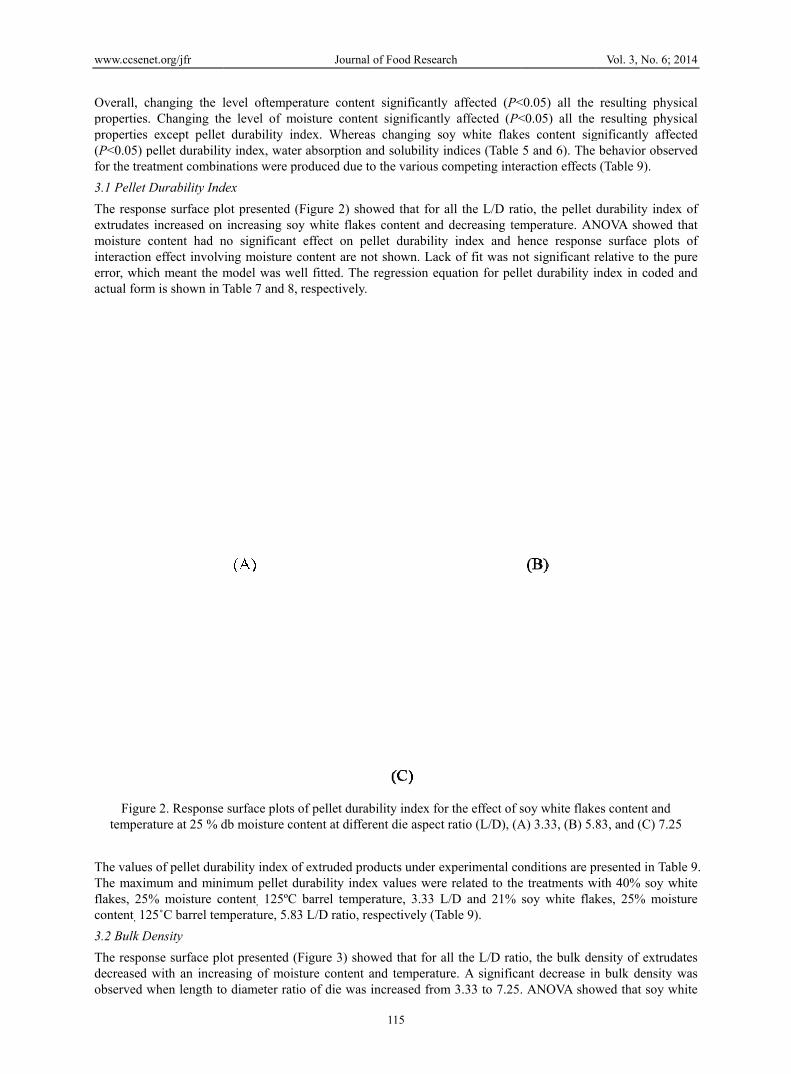
3.1 Pellet D
The responextrudates moisture cinteractionerror, whicactual form
Figurtempera
The valuesThe maximflakes, 25%content, 12
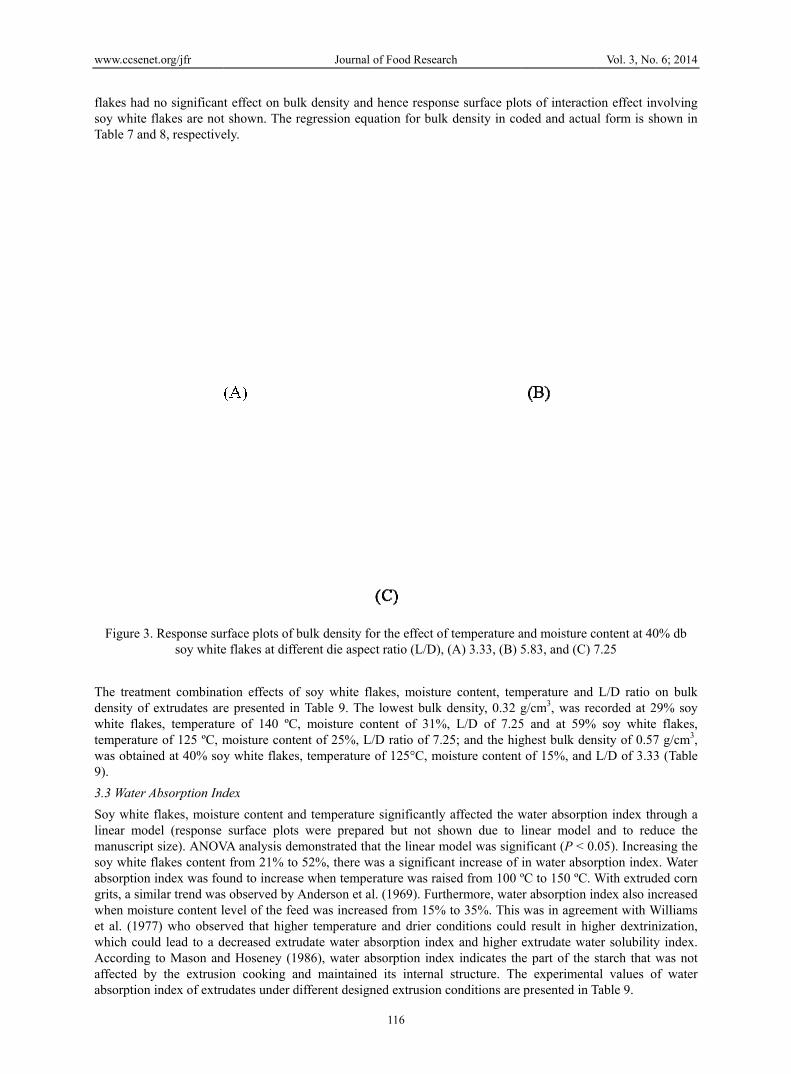
3.2 Bulk D
The respondecreased observed w
et.org/jfr
changing the l. Changing thexcept pellet
pellet durabilitatment combin
Durability Ind
nse surface plincreased on
content had nn effect involvch meant the mm is shown in T
re 2. Response ature at 25 % d
s of pellet duramum and mini% moisture co25˚C barrel tem
Density
nse surface plowith an incre
when length to
level oftempehe level of mot durability inty index, waternations were pr
dex
lot presented (increasing so
no significant ving moisture cmodel was weTable 7 and 8,
surface plots db moisture co
ability index oimum pellet dontent, 125ºC mperature, 5.83
ot presented (Feasing of moiso diameter rati
Journal
rature contentoisture contenndex. Whereasr absorption anroduced due to
(Figure 2) showy white flakeseffect on pe
content are noell fitted. The respectively.
of pellet durabontent at differe
f extruded produrability index
barrel temper3 L/D ratio, re
Figure 3) showsture content aio of die was i
of Food Researc
115
t significantlynt significantlys changing sond solubility ino the various c
wed that for as content and llet durability
ot shown. Lackregression equ
bility index forent die aspect
oducts under exx values were rature, 3.33 Lspectively (Ta
wed that for aland temperaturincreased from
ch
y affected (P<y affected (P<oy white flakendices (Table ompeting inter
all the L/D ratdecreasing tem
y index and hk of fit was nouation for pell
r the effect of sratio (L/D), (A
xperimental corelated to the
L/D and 21% able 9).
ll the L/D ratire. A significa
m 3.33 to 7.25.
<0.05) all the <0.05) all the es content sig5 and 6). The raction effects
tio, the pellet mperature. ANhence responsot significant rlet durability i
soy white flakeA) 3.33, (B) 5.8
onditions are pe treatments wsoy white flak
io, the bulk deant decrease in. ANOVA show
Vol. 3, No. 6;
resulting phyresulting phy
gnificantly affebehavior obse (Table 9).
durability indeNOVA showede surface plorelative to the index in coded
es content and 83, and (C) 7.2
resented in Tawith 40% soy wkes, 25% moi
ensity of extrudn bulk densitywed that soy w
2014
ysical ysical fected erved
ex of d that ts of pure
d and
25
able 9. white isture
dates y was white
www.ccsen
flakes hadsoy white Table 7 an
Figure 3
The treatmdensity of white flaktemperaturwas obtain9).
3.3 Water A
Soy white linear modmanuscripsoy white absorptiongrits, a simwhen moiset al. (197which couAccordingaffected babsorption
et.org/jfr
d no significanflakes are not
nd 8, respective
. Response sursoy white
ment combinatf extrudates arekes, temperature of 125 ºC, mned at 40% soy
Absorption Ind
flakes, moistudel (response
pt size). ANOVflakes content
n index was foumilar trend wassture content l77) who obseruld lead to a dg to Mason anby the extrusion index of extru
nt effect on bult shown. The rely.
rface plots of be flakes at diffe
tion effects ofe presented in
ure of 140 ºCmoisture contey white flakes
dex
ure content ansurface plots
VA analysis det from 21% to und to increass observed by Alevel of the feerved that highedecreased extrund Hoseney (19on cooking anudates under d
Journal
lk density andregression equ
bulk density foerent die aspec
f soy white fln Table 9. The, moisture conent of 25%, L/s, temperature
nd temperatures were preparemonstrated tha52%, there w
e when temperAnderson et aled was increaser temperatureudate water ab986), water abnd maintained
different design
of Food Researc
116
d hence responuation for bulk
or the effect ofct ratio (L/D),
akes, moisturee lowest bulk dntent of 31%/D ratio of 7.2of 125°C, mo
e significantlyed but not shat the linear m
was a significanrature was raisl. (1969). Furthsed from 15% e and drier cobsorption indebsorption inded its internal ned extrusion c
ch
nse surface plok density in co
f temperature a(A) 3.33, (B) 5
e content, temdensity, 0.32 g, L/D of 7.25
25; and the higoisture content
affected the whown due to l
model was signnt increase of sed from 100 ºhermore, wateto 35%. This
onditions couldex and higher ex indicates th
structure. Thconditions are
ots of interactioded and actua
and moisture c5.83, and (C) 7
mperature and g/cm3, was rec5 and at 59% ghest bulk den
of 15%, and L
water absorptiolinear model
nificant (P < 0.in water absorºC to 150 ºC. W
er absorption inwas in agreem
d result in higextrudate watee part of the se experimentapresented in T
Vol. 3, No. 6;
on effect involal form is show
ontent at 40% 7.25
L/D ratio on corded at 29%
soy white flnsity of 0.57 g/L/D of 3.33 (T
on index throuand to reduce.05). Increasinrption index. WWith extruded ndex also increment with Willgher dextrinizaer solubility instarch that waal values of wTable 9.
2014
lving wn in
db
bulk % soy
akes, /cm3, Table
ugh a e the
ng the Water
corn eased liams ation, ndex. s not water
www.ccsen
3.4 Water S
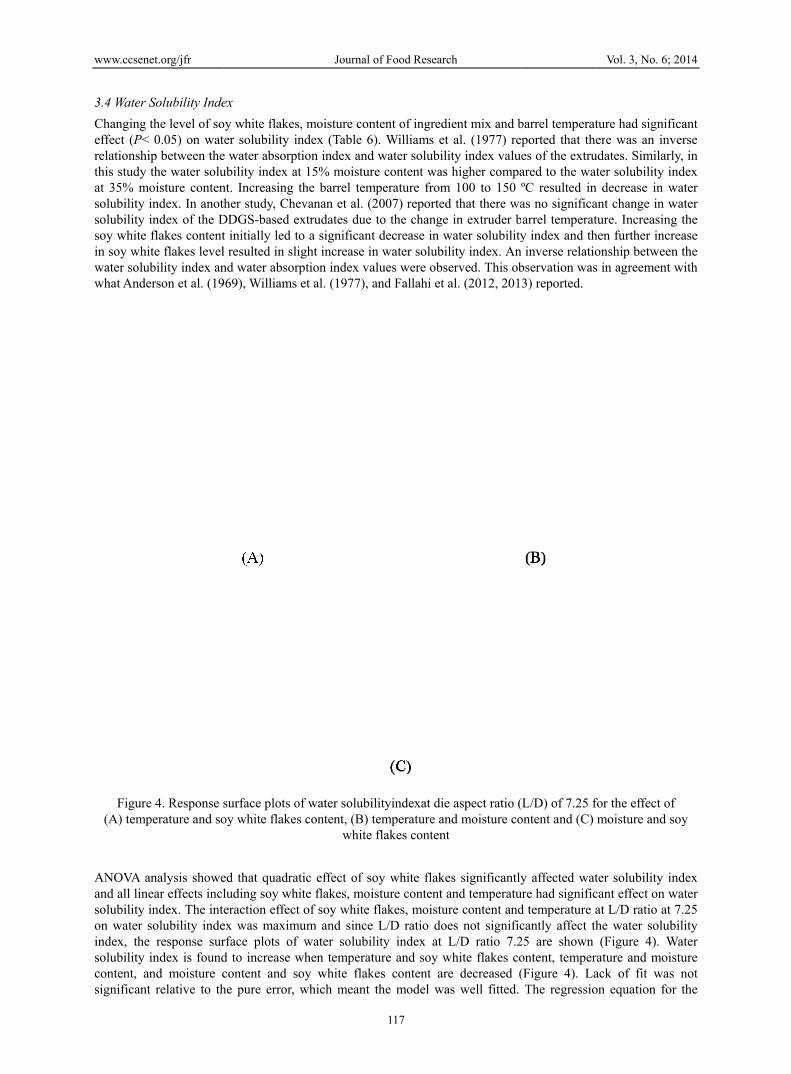
Changing effect (P<relationshithis study at 35% msolubility isolubility soy white in soy whiwater soluwhat Ande
Figure(A) temp
ANOVA aand all linesolubility ion water sindex, thesolubility content, asignificant
et.org/jfr
Solubility Inde
the level of so 0.05) on watip between thethe water soluoisture contenindex. In anotindex of the Dflakes content
ite flakes levelubility index anerson et al. (19
e 4. Response sperature and so
analysis showeear effects inclindex. The intsolubility indee response surindex is found
and moisture ct relative to th
ex
oy white flakester solubility ine water absorptubility index atnt. Increasing ther study, CheDDGS-based et initially led tl resulted in slind water absor969), Williams
surface plots ooy white flakes
ed that quadraluding soy wheraction effect
ex was maximrface plots of d to increase wcontent and she pure error,
Journal
s, moisture conndex (Table 6tion index andt 15% moisturthe barrel temevanan et al. (2extrudates due to a significantight increase inrption index vaet al. (1977), a
of water solubis content, (B) t
white
atic effect of soite flakes, moit of soy white
mum and sincef water solubilwhen temperatoy white flakwhich meant
of Food Researc
117
ntent of ingred6). Williams etd water solubilre content was
mperature from2007) reportedto the change
t decrease in wn water solubialues were obsand Fallahi et
ilityindexat dietemperature anflakes content
oy white flakeisture content aflakes, moistu
e L/D ratio dolity index at ture and soy wkes content ar
the model wa
ch
dient mix and bt al. (1977) repity index value
s higher compam 100 to 150 ºd that there wae in extruder bwater solubilityility index. An served. This obal. (2012, 201
e aspect ratio (nd moisture cot
es significantlyand temperatu
ure content andes not significL/D ratio 7.2
white flakes core decreased (as well fitted.
barrel temperatported that thees of the extruared to the watºC resulted inas no significaarrel temperaty index and thinverse relatio
bservation was3) reported.
L/D) of 7.25 fontent and (C)
y affected wature had significd temperature acantly affect th25 are shown ontent, temper(Figure 4). LaThe regressio
Vol. 3, No. 6;
ture had signifere was an inv
udates. Similarter solubility i
n decrease in want change in wture. Increasinhen further incronship betwees in agreement
for the effect omoisture and s
ter solubility icant effect on wat L/D ratio at he water solub(Figure 4). W
rature and moiack of fit wason equation fo
2014
ficant verse rly, in index water water g the rease
en the with
f soy
index water 7.25
bility Water isture s not
or the
www.ccsen
empirical each L/D r
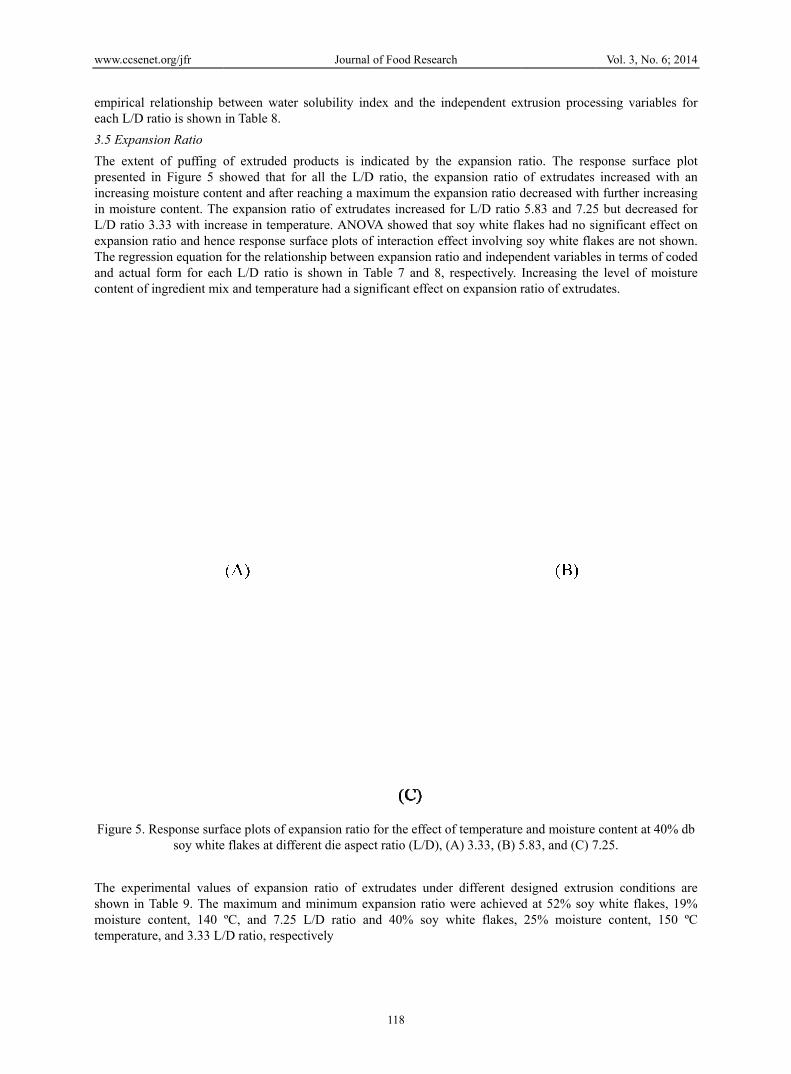
3.5 Expans
The extenpresented increasing in moisturL/D ratio expansion The regresand actualcontent of
Figure 5. R
The expershown in moisture ctemperatur
et.org/jfr
relationship bratio is shown
sion Ratio
nt of puffing oin Figure 5 s moisture cont
re content. The3.33 with incrratio and henc
ssion equation l form for eac
f ingredient mix
Response surfsoy white
rimental valueTable 9. The mcontent, 140 re, and 3.33 L/
between water in Table 8.
of extruded pshowed that fotent and after re expansion rarease in tempece response sufor the relation
ch L/D ratio isx and temperat
face plots of exe flakes at diffe
es of expansiomaximum andºC, and 7.25 /D ratio, respec
Journal
solubility ind
products is indor all the L/Dreaching a maxatio of extrudaerature. ANOVurface plots ofnship betweens shown in Tature had a sign
xpansion ratio erent die aspec
on ratio of exd minimum ex
L/D ratio anctively
of Food Researc
118
dex and the in
dicated by theD ratio, the exp
ximum the expates increased
VA showed thaf interaction efn expansion ratable 7 and 8, nificant effect o
for the effect oct ratio (L/D), (
xtrudates undexpansion ratio nd 40% soy w
ch
ndependent ex
e expansion rpansion ratio pansion ratio dfor L/D ratio
at soy white flaffect involvingtio and indepenrespectively. on expansion r
of temperature(A) 3.33, (B) 5
er different dewere achieved
white flakes,
xtrusion proce
ratio. The respof extrudates
decreased with5.83 and 7.25
akes had no sig soy white flandent variableIncreasing theratio of extrud
e and moisture 5.83, and (C) 7
esigned extrusd at 52% soy 25% moisture
Vol. 3, No. 6;
ssing variable
ponse surface increased wit
h further increa5 but decreaseignificant effe
akes are not shs in terms of c
e level of moiates.
content at 40%7.25.
ion conditionswhite flakes,e content, 15
2014
es for
plot th an asing d for ct on
hown. coded isture
% db
s are 19% 0 ºC
www.ccsenet.org/jfr Journal of Food Research Vol. 3, No. 6; 2014
119
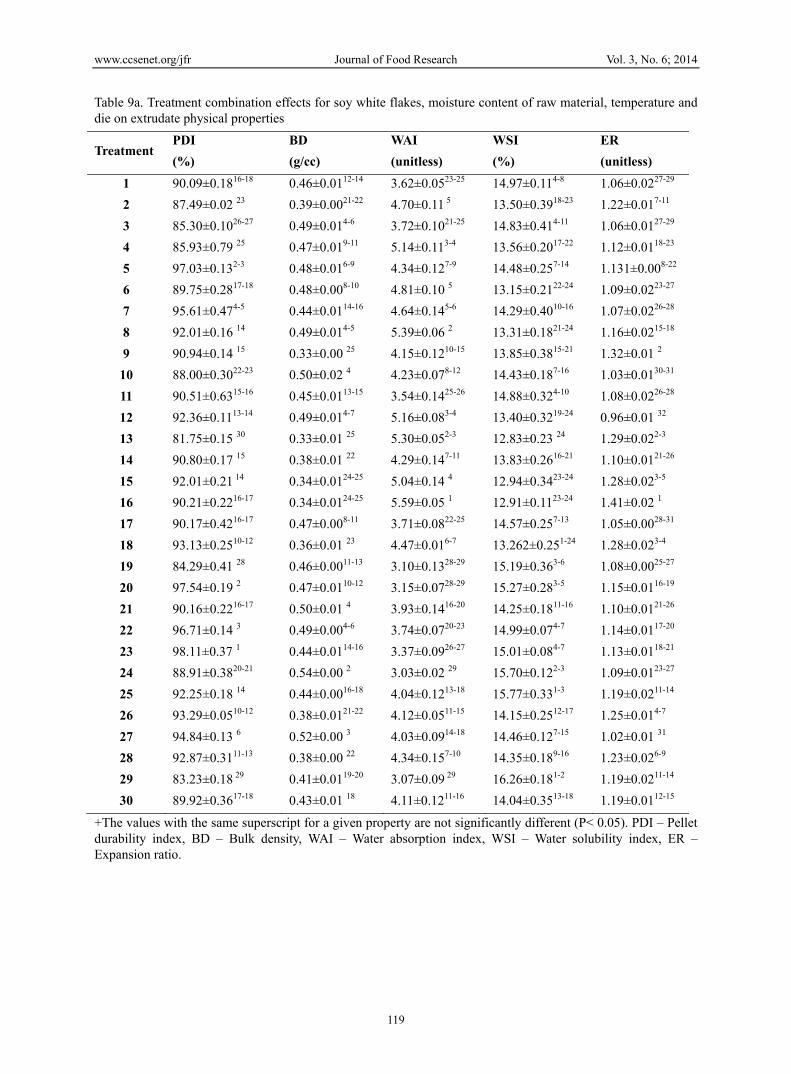
Table 9a. Treatment combination effects for soy white flakes, moisture content of raw material, temperature and die on extrudate physical properties
Treatment PDI BD WAI WSI ER
(%) (g/cc) (unitless) (%) (unitless)
1 90.09±0.1816-18 0.46±0.0112-14 3.62±0.0523-25 14.97±0.114-8 1.06±0.0227-29
2 87.49±0.02 23 0.39±0.0021-22 4.70±0.11 5 13.50±0.3918-23 1.22±0.017-11
3 85.30±0.1026-27 0.49±0.014-6 3.72±0.1021-25 14.83±0.414-11 1.06±0.0127-29
4 85.93±0.79 25 0.47±0.019-11 5.14±0.113-4 13.56±0.2017-22 1.12±0.0118-23
5 97.03±0.132-3 0.48±0.016-9 4.34±0.127-9 14.48±0.257-14 1.131±0.008-22
6 89.75±0.2817-18 0.48±0.008-10 4.81±0.10 5 13.15±0.2122-24 1.09±0.0223-27
7 95.61±0.474-5 0.44±0.0114-16 4.64±0.145-6 14.29±0.4010-16 1.07±0.0226-28
8 92.01±0.16 14 0.49±0.014-5 5.39±0.06 2 13.31±0.1821-24 1.16±0.0215-18
9 90.94±0.14 15 0.33±0.00 25 4.15±0.1210-15 13.85±0.3815-21 1.32±0.01 2
10 88.00±0.3022-23 0.50±0.02 4 4.23±0.078-12 14.43±0.187-16 1.03±0.0130-31
11 90.51±0.6315-16 0.45±0.0113-15 3.54±0.1425-26 14.88±0.324-10 1.08±0.0226-28
12 92.36±0.1113-14 0.49±0.014-7 5.16±0.083-4 13.40±0.3219-24 0.96±0.01 32
13 81.75±0.15 30 0.33±0.01 25 5.30±0.052-3 12.83±0.23 24 1.29±0.022-3
14 90.80±0.17 15 0.38±0.01 22 4.29±0.147-11 13.83±0.2616-21 1.10±0.0121-26
15 92.01±0.21 14 0.34±0.0124-25 5.04±0.14 4 12.94±0.3423-24 1.28±0.023-5
16 90.21±0.2216-17 0.34±0.0124-25 5.59±0.05 1 12.91±0.1123-24 1.41±0.02 1
17 90.17±0.4216-17 0.47±0.008-11 3.71±0.0822-25 14.57±0.257-13 1.05±0.0028-31
18 93.13±0.2510-12 0.36±0.01 23 4.47±0.016-7 13.262±0.251-24 1.28±0.023-4
19 84.29±0.41 28 0.46±0.0011-13 3.10±0.1328-29 15.19±0.363-6 1.08±0.0025-27
20 97.54±0.19 2 0.47±0.0110-12 3.15±0.0728-29 15.27±0.283-5 1.15±0.0116-19
21 90.16±0.2216-17 0.50±0.01 4 3.93±0.1416-20 14.25±0.1811-16 1.10±0.0121-26
22 96.71±0.14 3 0.49±0.004-6 3.74±0.0720-23 14.99±0.074-7 1.14±0.0117-20
23 98.11±0.37 1 0.44±0.0114-16 3.37±0.0926-27 15.01±0.084-7 1.13±0.0118-21
24 88.91±0.3820-21 0.54±0.00 2 3.03±0.02 29 15.70±0.122-3 1.09±0.0123-27
25 92.25±0.18 14 0.44±0.0016-18 4.04±0.1213-18 15.77±0.331-3 1.19±0.0211-14
26 93.29±0.0510-12 0.38±0.0121-22 4.12±0.0511-15 14.15±0.2512-17 1.25±0.014-7
27 94.84±0.13 6 0.52±0.00 3 4.03±0.0914-18 14.46±0.127-15 1.02±0.01 31
28 92.87±0.3111-13 0.38±0.00 22 4.34±0.157-10 14.35±0.189-16 1.23±0.026-9
29 83.23±0.18 29 0.41±0.0119-20 3.07±0.09 29 16.26±0.181-2 1.19±0.0211-14
30 89.92±0.3617-18 0.43±0.01 18 4.11±0.1211-16 14.04±0.3513-18 1.19±0.0112-15
+The values with the same superscript for a given property are not significantly different (P< 0.05). PDI – Pellet durability index, BD – Bulk density, WAI – Water absorption index, WSI – Water solubility index, ER – Expansion ratio.
www.ccsenet.org/jfr Journal of Food Research Vol. 3, No. 6; 2014
120
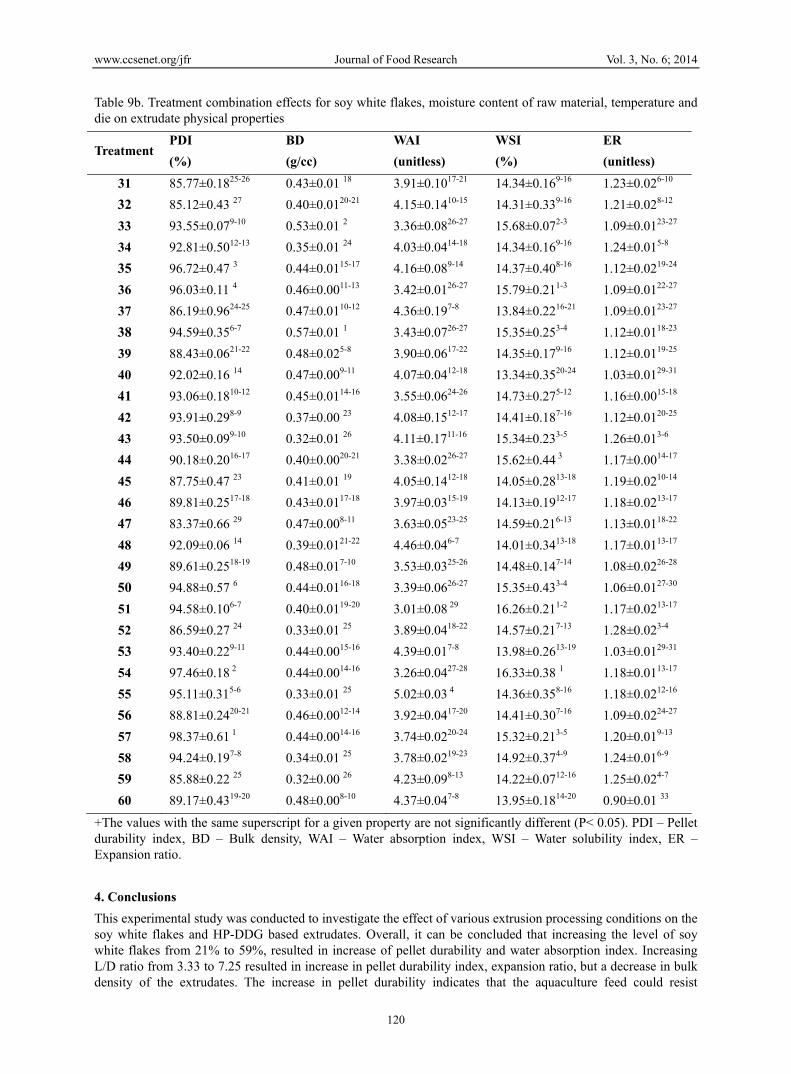
Table 9b. Treatment combination effects for soy white flakes, moisture content of raw material, temperature and die on extrudate physical properties
Treatment PDI BD WAI WSI ER
(%) (g/cc) (unitless) (%) (unitless)
31 85.77±0.1825-26 0.43±0.01 18 3.91±0.1017-21 14.34±0.169-16 1.23±0.026-10
32 85.12±0.43 27 0.40±0.0120-21 4.15±0.1410-15 14.31±0.339-16 1.21±0.028-12
33 93.55±0.079-10 0.53±0.01 2 3.36±0.0826-27 15.68±0.072-3 1.09±0.0123-27
34 92.81±0.5012-13 0.35±0.01 24 4.03±0.0414-18 14.34±0.169-16 1.24±0.015-8
35 96.72±0.47 3 0.44±0.0115-17 4.16±0.089-14 14.37±0.408-16 1.12±0.0219-24
36 96.03±0.11 4 0.46±0.0011-13 3.42±0.0126-27 15.79±0.211-3 1.09±0.0122-27
37 86.19±0.9624-25 0.47±0.0110-12 4.36±0.197-8 13.84±0.2216-21 1.09±0.0123-27
38 94.59±0.356-7 0.57±0.01 1 3.43±0.0726-27 15.35±0.253-4 1.12±0.0118-23
39 88.43±0.0621-22 0.48±0.025-8 3.90±0.0617-22 14.35±0.179-16 1.12±0.0119-25
40 92.02±0.16 14 0.47±0.009-11 4.07±0.0412-18 13.34±0.3520-24 1.03±0.0129-31
41 93.06±0.1810-12 0.45±0.0114-16 3.55±0.0624-26 14.73±0.275-12 1.16±0.0015-18
42 93.91±0.298-9 0.37±0.00 23 4.08±0.1512-17 14.41±0.187-16 1.12±0.0120-25
43 93.50±0.099-10 0.32±0.01 26 4.11±0.1711-16 15.34±0.233-5 1.26±0.013-6
44 90.18±0.2016-17 0.40±0.0020-21 3.38±0.0226-27 15.62±0.44 3 1.17±0.0014-17
45 87.75±0.47 23 0.41±0.01 19 4.05±0.1412-18 14.05±0.2813-18 1.19±0.0210-14
46 89.81±0.2517-18 0.43±0.0117-18 3.97±0.0315-19 14.13±0.1912-17 1.18±0.0213-17
47 83.37±0.66 29 0.47±0.008-11 3.63±0.0523-25 14.59±0.216-13 1.13±0.0118-22
48 92.09±0.06 14 0.39±0.0121-22 4.46±0.046-7 14.01±0.3413-18 1.17±0.0113-17
49 89.61±0.2518-19 0.48±0.017-10 3.53±0.0325-26 14.48±0.147-14 1.08±0.0226-28
50 94.88±0.57 6 0.44±0.0116-18 3.39±0.0626-27 15.35±0.433-4 1.06±0.0127-30
51 94.58±0.106-7 0.40±0.0119-20 3.01±0.08 29 16.26±0.211-2 1.17±0.0213-17
52 86.59±0.27 24 0.33±0.01 25 3.89±0.0418-22 14.57±0.217-13 1.28±0.023-4
53 93.40±0.229-11 0.44±0.0015-16 4.39±0.017-8 13.98±0.2613-19 1.03±0.0129-31
54 97.46±0.18 2 0.44±0.0014-16 3.26±0.0427-28 16.33±0.38 1 1.18±0.0113-17
55 95.11±0.315-6 0.33±0.01 25 5.02±0.03 4 14.36±0.358-16 1.18±0.0212-16
56 88.81±0.2420-21 0.46±0.0012-14 3.92±0.0417-20 14.41±0.307-16 1.09±0.0224-27
57 98.37±0.61 1 0.44±0.0014-16 3.74±0.0220-24 15.32±0.213-5 1.20±0.019-13
58 94.24±0.197-8 0.34±0.01 25 3.78±0.0219-23 14.92±0.374-9 1.24±0.016-9
59 85.88±0.22 25 0.32±0.00 26 4.23±0.098-13 14.22±0.0712-16 1.25±0.024-7
60 89.17±0.4319-20 0.48±0.008-10 4.37±0.047-8 13.95±0.1814-20 0.90±0.01 33
+The values with the same superscript for a given property are not significantly different (P< 0.05). PDI – Pellet durability index, BD – Bulk density, WAI – Water absorption index, WSI – Water solubility index, ER – Expansion ratio.
4. Conclusions
This experimental study was conducted to investigate the effect of various extrusion processing conditions on the soy white flakes and HP-DDG based extrudates. Overall, it can be concluded that increasing the level of soy white flakes from 21% to 59%, resulted in increase of pellet durability and water absorption index. Increasing L/D ratio from 3.33 to 7.25 resulted in increase in pellet durability index, expansion ratio, but a decrease in bulk density of the extrudates. The increase in pellet durability indicates that the aquaculture feed could resist
www.ccsenet.org/jfr Journal of Food Research Vol. 3, No. 6; 2014
121
mechanical damage during transportation and storage. Significant decrease in bulk density (P<0.001) due to increase in L/D ratio is desirable for storage purpose. Further studies should aim for the production of aquaculture feed with incorporation of soy white flakes levels between 20% and 60% db at different screw speeds and should optimize processing conditions.
Acknowledgements
The authors thank the USDA-North Central Agricultural Research Laboratory, Brookings, South Dakota, Agricultural Experiment Station, South Dakota State University, and Indian Council of Agricultural Research (ICAR), New Delhi, India for funding, facilities, equipment and supplies.
References
AACC. (2000). Method 44-19, moisture-air oven method, drying at 135 °C. AACC Approved Methods, (10th Ed.) American Association of Cereal Chemists: St. Paul, MN.
Alves, R. M. L., Grossmann, M. V. E., & Silva, R. S. S. F. (1999). Gelling properties of extruded yam (Dioscorea alota) starch. Food Chemistry, 67, 123-127. http://dx.doi.org/10.1016/S0308-8146(99)00064-3
Anderson, R. A., Conway, H. F., Pfeifer, V. F., & Griffin, E. L. (1969). Roll and extrusion cooking of grain sorghum grits. Cereal Sci. Today, 14(11), 373-375.
Anderson, R. A., Conway, H. F., Pfeifer, V. F., & Griffin, E.L. (1969). Gelatinization of corn grits by roll and extrusion cooking. Cereal Science Today, 14, 4-7.
ASAE. (2004). Engineering Standards, Practices and Data. ASABE, St. Joseph, MI.
Ayadi, F. Y., Fallahi, P., Rosentrater, K. A., & Muthukumarappan, K. (2013). Modeling single-screw extrusion processing parameters and resulting extrudate properties of DDGS-based Nile Tilapia (Oreochromis niloticus) Feeds. Journal of Food Research, 2(2). http://dx.doi.org/10.5539/jfr.v2n2p11
Bandyopadhyay, S., & Ranjan, K. R. (2001). Aquafeed extrudate flow rate and pellet characteristics from low cost single screw extruder. Journal of Aquatic Food Product Technology, 10(2), 3-14. http://dx.doi.org/10.1300/J030v10n02_02
Bhattacharya, M., & Hanna, M. A. (1986). Viscosity modeling of dough in extrusion. J. Food Process Eng, 2, 337-342.
Case, S. E., Hamann, D. D., & Schwartz, S. J. (1992). Effect of starch gelatinization on physical properties of extruded wheat and corn based products. Cereal Chem, 69(4), 401-404.
Chevanan, N., Muthukumarappan, K., Rosentrater, K. A., & Julson, J. L. (2007). Effect of die dimensions on extrusion processing parameters and properties of DDGS-based aquaculture feeds. Cereal chemistry, 84(4), 389-398.
Chin, H. K., Joseph, A. M., & Jeffery, T. M. (1989). Properties of extruded dried distillers grains (DDG) and flour blends. J. Food processing and preservation, 13, 219-231. http://dx.doi.org/10.1111/j.1745-4549.1989.tb00102.x
Chinnaswamy, R., & Hanna, M. A. (1987). Nozzle dimension effects on the expansion of extrusion cooked corn starch. J. Food Sci, 52(6), 1746-1747. http://dx.doi.org/10.1111/j.1365-2621.1987.tb05924.x
Dersjant-Li, Y. (2002). The use of soy protein in aquafeeds. In The use of soy protein in aquafeeds. In Cruz-suárez, l. E., ricque-marie, d., tapia-salazar, m., gaxiola-cortés, m. G., simoes, n. (Eds.). Avances en nutriciónacuícolavi. Memorias del vi symposium 76 internacional de nutriciónacuícola. 3 al 6 deseptiembredel 2002. Cancún, quintanaroo, méxico.
El-Sayed, A.-F. M. (1999). Alternative protein sources for farmed tilapia, Oreochromis spp. Aquaculture, 179, 149-168. http://dx.doi.org/10.1016/S0044-8486(99)00159-3
El-Sayed, A.-F. M. (2004). Protein nutrition of farmed tilapia: searching for unconventional sources. In R. Bolivar, G. Mair & K. Fitzsimmons (Eds.) (pp. 364-378) Sixth International Symposium on Tilapia in Aquaculture, Manila, Philippines.
Fallahi, P., Muthukumarappan, K., & Rosentrater, K. A. (2012). Twin-screw Extrusion Processing of Vegetable-based Protein Feeds for Yellow Perch (Percaflavescens) Containing Distillers Dried Grains, Soy Protein Concentrate, and Fermented High Protein Soybean Meal. Journal of Food Research, 1(3), 230-246. http://dx.doi.org/10.5539/jfr.v1n3p230
Fallahi, P., Rosentrater, K. A., Muthukumarappan, K., & Tulbek, M. (2013). Effects of Steam, Moisture, and
www.ccsenet.org/jfr Journal of Food Research Vol. 3, No. 6; 2014
122
Screw Speed on Physical Properties of DDGS-Based Extrudates. Cereal Chem, 90(3), 186-197. http://dx.doi.org/10.1094/CCHEM-08-12-0102-R
FAO. (2008). The state of the world fisheries aquaculture. Food and Agriculture Organization, Rome, Italy.
FAO. (2012). The state of the world fisheries aquaculture. Food and Agriculture Organization, Rome, Italy.
Gwiazda, S., Noguchi, A., & Saio, K. (1987). Microstructural studies of texturized vegetable protein products: Effects of oil addition and transformation of raw materials in various sections of a twin screw extruder. Food Microstructure, 6, 57-61.
Hardy, R. W. (2010). Utilization of plant proteins in fish diets: Effects of global demand and supplies of fishmeal. Aquaculture Research, 41, 770-776. http://dx.doi.org/10.1111/j.1365-2109.2009.02349.x
Harper, J. M, Rhodes, T. P., & Wanninger, L. A. (1971). Viscosity model for cooked cereal dough. AIChESymp. Ser, 67(108), 40-43.
Ibanoglu, S., Paul, A., & Geroge, D. H. (1996). Extrusion of tarhana: effect of operating variables on starch gelatinization. Food Chemistry, 57(4), 541-544. http://dx.doi.org/10.1016/S0308-8146(96)00047-7
Ilo, S., Tomschik, E. U., Berghofer., & Mundigler, N. (1996). The effects of extrusion operating conditions on the apparent viscosity and properties of extrudates in twin screw extrusion cooking of maize grits. Lebensm.-Wiss.u.-Technol, 29, 593-598.
Lam, C. D., & Rolando, A. F. (2003). Effect of particle size and moisture content on viscosity of fish feed. Cereal Chem, 80(1), 20-24. http://dx.doi.org/10.1094/CCHEM.2003.80.1.20
Lin, S., Huff, H. E., & Hsien, F. (2000). Texture and chemical characteristics of soy protein meat analog extruded at high moisture. J. Food Sci, 65(2), 264-269. http://dx.doi.org/10.1111/j.1365-2621.2000.tb15991.x
Lovell, T. (1988). Nutrition and feeding of fish. Van Nostrand Reinhold: New York.
Kannadhason, S., Rosentrater, K. A., & Muthukumarappan, K. (2010). Twin screw extrusion of DDGS-based aquaculture feeds. Journal of the World Aquaculture Society, 41(51), 1-15. http://dx.doi.org/10.1111/j.1749-7345.2009.00328.x
Kokini, L. J., Ho, C. T., & Karwe, M. V. (1992a). Food extrusion science and technology. Marcel Dekker, Inc.: New York.
Kokini, J. L, Chang, C. N., & Lai, L. S. (1992b). The role of rheological properties of extrudate expansion. In Kokini, J. L., Ho, C. T., & Karwe, M., (Eds.), Food extrusion science and Technology (pp. 631-652). Marcel Dekker, Inc. New York.
Mason, W. R., & Hoseney, R. C. (1986). Factors affecting the viscosity of extrusion-cooked wheat starch. Cereal Chem, 63, 436-441.
Mercier, C., Linko, P., & Harper, J. M. (1989). Extrusion cooking. American Association of Cereal Chemists, Inc., St. Paul, Minnesota.
Rolfe, L. A., Huff, H. E., & Hsieh, F. (2001). Effects of particle size and processing variables on the properties of an extruded catfish feed. Journal of aquatic food product technology, 10(3), 21-33. http://dx.doi.org/10.1300/J030v10n03_03
Romarheim, O. H., Aslaksen, M. A., Storebakken, T., Krogdahl, A., & Skrede, A. (2005). Effect of extrusion on trypsin inhibitor activity and nutrient digestibility of diets based on fish meal, soybean meal and white flakes. Archives of Animal Nutrition, 59(6), 365-375. http://dx.doi.org/10.1080/17450390500352897
Rosentrater, K. A., Richard, T. L., Bern, C. J., & Flores, R. A. (2005). Small-scale extrusion of corn masa by-products. Cereal Chemistry, 82(4), 436-446. http://dx.doi.org/10.1094/CC-82-0436
Sandra, H. P. F., & Jose, A. G. A. (1993). Effect of phospholipid on protein structure and solubility in the extrusion of lung proteins. Food Chemistry, 47, 111-119. http://dx.doi.org/10.1016/0308-8146(93)90230-D
Shukla, C. Y., Muthukumarappan, K., & Julson, J. L. (2005). Effect of single screw extruder die temperature, amount of distiller dried grains with solubles (DDGS) and initial moisture content on extrudates. Cereal Chem, 82(1), 34-37. http://dx.doi.org/10.1094/CC-82-0034
Singh, R. K., Nielsen, S. S., & Chambers, J. V. (1991). Selected characteristics of extruded blends of milk protein raffinate or nonfat dry milk with corn flour. Journal of Food processing and Preservation, 15,
www.ccsenet.org/jfr Journal of Food Research Vol. 3, No. 6; 2014
123
285-302. http://dx.doi.org/10.1111/j.1745-4549.1991.tb00173.x
Sokhey, A. S., Kollengode, A. N., & Hanna, M. A. (1994). Screw configuration effects on corn starch expansion during extrusion. J. Food Sci, 59(4), 895-899. http://dx.doi.org/10.1111/j.1365-2621.1994.tb08152.x
USDA. (2009). Practical Procedures for Grain Handlers: Inspecting Grain. United States Department of Agriculture – Grain Inspection, Packers, and Stockyards Administration: Washington, D.C. Retrieved from http://www.gipsa.usda.gov/publications/fgis/ref/primer.pdf
Williams, M. A., Horn, R. E., & Rugula, R. P. (1977). Extrusion: An in depth look at a versatile process. I. J. Food Eng., 49(10), 87-89.
Wu, Y. V., Ronald, R. R., David, J. S., & Paul, B. B. (1994). Utilization of protein rich Ethanol co-products from Corn in tilapia feed. JAOCS, 71(9), 1041-1043. http://dx.doi.org/10.1007/BF02542277
Wu, Y. V., Ronald, R. R., David, J. S., & Paul, B. B. (1996a). Effects of diets containing various levels of protein and ethanol coproducts from corn on growth of tilapia fry. J. Agric. Food Chem, 440, 1491-1. http://dx.doi.org/10.1021/jf950733g
Copyrights
Copyright for this article is retained by the author(s), with first publication rights granted to the journal.
This is an open-access article distributed under the terms and conditions of the Creative Commons Attribution license (http://creativecommons.org/licenses/by/3.0/).
Copyright © 2022 FDOKUMEN