Download 2017 Report - Demerara Distillers
104
-
Upload
khangminh22 -
Category
Documents
-
view
2 -
download
0
Transcript of Download 2017 Report - Demerara Distillers


2
COntentStabLe Of
Thick. Dark. Sweet. Crude 4
Company In Perspective 10
Notice of Meeting 11
Financial Highlights 12
Corporate Information 13
Board of Directors 14
Chairman's Report 16
Long Service Awards 20
Management Team 21
Report of the Directors 22
Corporate Social Responsibilities 27
Financial Statements 30
Ten Year Review 97
Procedure for Transfer of Shares 98
Proxy Form 103

3

4
financial statementsNOteS tO tHe cOnSOlidated
FOR THE YEAR ENDED DECEMBER 31, 2017
bLaCKGOld.
Thick. Dark.Sweet. Crude.
4

5
financial statementsNOteS tO tHe cOnSOlidated
FOR THE YEAR ENDED DECEMBER 31, 2017
Ever since its 2015 discovery at the Liza 1 Well in the Stabroek Block offshore of Demerara, the talk of the town has been about the three billion barrels of recoverable reserves.
This, and five other discoveries since, was made about 120 miles off the Demerara coast, just where the blue waters turn to brown – a point in our peculiar seashore best captured in the poetry and song of our legendary R. C. G. Potter, viz.
That Demerara coast is home to another crude - just as thick, just as dark, just as sweet.
It flows like oil. Sometimes looks like it. But that about which we are talking is truly sweet.
“When your ship has passed the islands and the blue sea turns to brown,
And the leadsman calls ‘Five Fathoms’ when he casts the lead-line down,
And you see a long flat coastland and a smokeless wooden town,
You can reckon you are nearing Demerara.”
Molasses!
In Demerara, home of the eponymous Demerara Distillers Limited (DDL) and its range of premium Demerara rums, this thick, dark, crude is very much a function of its origin.
The Atlantic Ocean, which once covered the Demerara coast, imbues into the reclaimed soil a tilled character that is rich in organics and high in minerality.
This vestige finds its ways into the sugarcane crop, thus into the molasses, and into the rum.
5

6
financial statementsNOteS tO tHe cOnSOlidated
FOR THE YEAR ENDED DECEMBER 31, 2017
liQuidGOld.
No longer crude. Just refined.
6
7
financial statementsNOteS tO tHe cOnSOlidated
FOR THE YEAR ENDED DECEMBER 31, 2017
Here at DDL, we are singularly responsible for refining the crude Demerara Molasses, through fermentation and distillation, to
produce the world’s best rums.
This heritage, preserved for over three centuries, harkens to looking back to moving forward.
Since the British endeavour in 1650 to cultivate sugarcane in the rich Demerara soils, production of sugar was so successful that a mere two decades later, distilling the molasses by-product was introduced to the plantations.
One hundred years later, by 1780, Demerara was home to over 300 distilleries, fermenting
and refining the crude molasses.Just like R.C.G. Potter’s sighting of the wooden town, wood was very central to this refinement, from fermenting in wooden vats, distilling in wooden pots and columns, and ageing in wooden barrels.
By 1940, most wooden vats and wooden stills gave way to steel, and only three of the nine surviving, consolidated sugar estates retained operation of wooden stills, one as old as 1732.
All of these stills from the ‘Big 9’ estates now find their home among the unique assembly at the Diamond Distillery on the East Bank of the Demerara River. And now, all of the molasses produced in Demerara and the rest of the coast of Guyana is destined for this historic distillery. 7

8
financial statementsNOteS tO tHe cOnSOlidated
FOR THE YEAR ENDED DECEMBER 31, 2017
DEMERARAGOld.
History. Culture. Flavour.
8

9
financial statementsNOteS tO tHe cOnSOlidated
FOR THE YEAR ENDED DECEMBER 31, 2017
Today, Demerara Distillers Limited, like its predecessors, continues to not only refine its contemporary products, but also to preserve this steep legacy.
Everything about our products is a time-tested combination that bridges our proud traditions, our current innovations, and our clear vision for the future.
Like the other crude and its refined products, we can measure our product in barrels too, and we do. This Demerara heritage, and the heads, hearts and hands driving the work of today’s craftsmen, are splendidly captured in each barrel, and aged to perfection.
These days, navigation is a lot easier, and there is so much more technology that even if one knows no geography, one could still get here. And, if one is still sailing, where the blue waters turn to brown, one will find the rigs extracting the thick dark sweet crude and know that one is nearing Demerara.
That Demerara is more than physical geography; it’s history, it’s culture, it’s flavour and it’s people. We have captured Demerara. And now, just as in the past, we will continue well into the future taking the thick dark sweet stuff, fermenting it, distilling it, and blending it to uniquely take the taste of Demerara to the world.
Each barrel tells a story, of our past and how we got here.9

10
PeRSPeCtiVeCOmPany In
It has been producing high grade Fruit Jams and Jellies, Fruit Juices and the well known Three County Fruit Mix. The Group’s Shipping and Warehouse services are among the most modern in Guyana. Its Fruit Juice operations range from fresh juice delivered to homes and premier restaurants and hotels to conveniently packaged juices done in a state-of-the-art Tetra Pak packaging plant under the brand name TOPCO. The Group also has interests in the Insurance industry.
The Company has expanded into the Distribution Business, where it is now the Distributor in Guyana for some of the most well-known consumer products such as Johnson & Johnson and Nestle. Distribution Services Limited as this part of the group is known also represents several leading local companies.
Demerara Distillers Limited has Subsidiaries and Associates in Europe, North America and the Caribbean. Demerara Distillers Limited is best known for its commitment to quality and has held continuous certification through the ISO 9001 (2008) International Quality Standard.
T HE core business of Demerara Distillers Limited for the three centuries has been Demerara Rum. In the 17th Century, every sugar plantation had its own small distillery
and these, with the passage of time, were gradually consolidated into one distillery at Diamond on the East Bank of Demerara. The Company’s alcoholic products especially its rums, including its flagship brand, the El Dorado 15 Year Old Special Reserve, and its other brands – the El Dorado 25 Year Old, the El Dorado 21 Year Old, the El Dorado 12 Year Old, the El Dorado Cask Aged 8 Year, the El Dorado 5 Year Old, the El Dorado Cask Aged 3 Year, the El Dorado Deluxe Silver Aged 6 Year – are well known in the Caribbean and International markets. The Company is also a leading supplier of bulk rum to bottlers in Europe and North America and its Bulk Terminal ensures the most efficient service to customers.
Over time, the Company has been diversifying its activities. It is a leading producer of carbonated beverages including Pepsi, Seven-Up and Slice, in addition to its own wide range of Soca flavours. It also produces Diamond Mineral Water. It produces its own Carbon Dioxide and Dry Ice.

11
MeetinGNOtiCe Of
The SIXTY-SIXTH ANNUAL GENERAL MEETING of Demerara Distillers Limited (DDL) will be held at DDL’s Diamond Complex, Plantation Great Diamond, East Bank Demerara on Thursday, March 29, 2018 at 4:30p.m.
AGENDA1. To receive and consider the Company’s Accounts and Reports of the Directors and Auditors
for the year ended December 31, 20172. To declare a Final Dividend of $0.60 per share free of Company Taxes in respect of the year
ended December 31, 2017.3. To elect Directors.4. To fix the Emoluments of the Directors.5. To appoint Auditors and authorise the Directors to fix their remuneration.
BY ORDER OF THE BOARD REGISTERED OFFICE Block A, Plantation Great Diamond, East Bank Demerara, Guyana.
Allison Thorne Director/Company Secretary February 20, 2018
•Every member entitled to attend and vote at the meeting is entitled to appoint a proxy to attend and vote instead of him/her and such proxy need not also be a member of the Company.
•A form for use at this meeting must be received at the registered office of the Company stated above, not less than 24 (twenty four) hours before the date of the Meeting
REGISTER OF MEMBERSThe Register of Members and Share Transfer Books of Demerara Distillers Limited will be closed from March 5, 2018- March 29, 2018 – both days inclusive- for the purpose of preparing warrants of the Final Dividends for the year ended December 31, 2017.
N.B. Gifts will be distributed only to shareholders present at the Meeting and not at any time or place thereafter.
12
HighLightSFinanCiaL
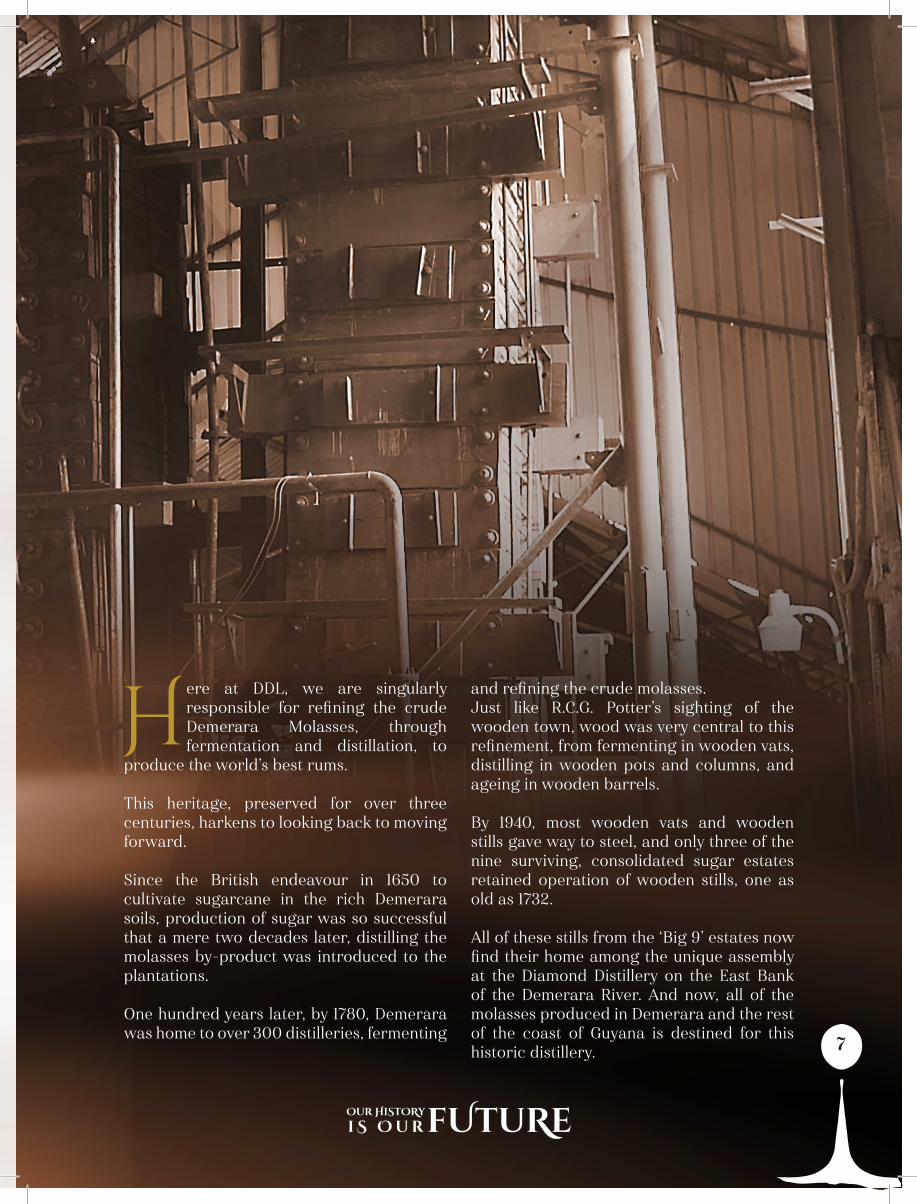
15,783,46616,954,198
18,515,611
20,913,489
2013 2014 2015 2016 2017
2,205,236
2,797,273 2,920,111
3,551,314
2013 2014 2015 2016 2017
Operating Profit | G$000
Profit Before Tax | G$000
3,913,862
3,392,0823,378,633
1,811,508
2,794,305
02013 2014 2015 2016 2017
Shareholders' Equity | G$000
500,000
500,000
1,135,873
16,058,647
500,000
0
0
1,000,000
1,000,000
1,000,000
1,500,000
1,500,000
1,500,000
2,000,000
2,000,000
2,000,000
2,500,000
2,500,000
2,500,000
3,000,000
3,000,000
3,500,000
3,500,000
4,000,000
4,000,000
4,500,000

13
AUDITORSTSD Lal & Co.
77 Brickdam, Stabroek,Georgetown, Guyana.
LEGAL ADVISORSDe Caries, Fitzpatrick & Karran
80 Cowan Street, Kingston,Georgetown, Guyana.
REGISTERED OFFICEBlock A, Plantation Great Diamond,
East Bank Demerara, Guyana.Email: [email protected]
Website: www.theeldoradorum.com
REGISTRAR & TRANSFER AGENTTrust Company (Guyana) Limited11 Lamaha Street, Queenstown, Georgetown, Guyana.
BANKERSDemerara Bank Limited230 Camp & South Streets,Georgetown, Guyana.
The Bank of Nova Scotia104 Carmichael Street,Georgetown, Guyana.
Republic Bank (Guyana) LimitedWater Street, Georgetown, Guyana.
infORmatiOnCOrpORate

14
TIMOTHY JONASL.L.B. (Hons) • Director
ALLISON THORNE L.L.B • Director Company Secretary
RUDOLPH COLLINSCCH, BSc. (Hons)DPA Director
KOMAL R. SAMAROOAA, FCCA, ACIS President • Chairman of the Board
SHARON SUE-HANGBSc (Chemistry) • EMBADirector of Technical Services
directorsboard of
From Left to Right:
14

15
DR. YESU PERSAUDCCH, FCCA, FRSA, CCMI • Director
LANCELOT TYRELLDirector
SHARDA VEEREN-CHANDBA • Marketing Director
EGBERT CARTER MSC. (Civil Engineering) Director
HARRYRAM PARMESARFCCA • Director
From Left to Right:
15

16
KOMAL R. SAMAROOPresident • Chairman of the Board
With the recent announcements of
proven deposits of petro-carbon off
Guyana’s shore and the expected first
oil production in 2020, the future
economic prospects of the country has
been considerably enhanced.
“ “

17
ReportChairman’S
I am pleased to report to shareholders that the Group’s performance for 2017 was very good. We continued our brand building and market development activities locally and internationally while simultaneously
advancing our diversification strategy.
In the International Monetary Fund (IMF) January 2018 issue on World Economic Outlook Update, the IMF reported that the global rise in activity, which started in the second half of 2016, gained further momentum in the first half of 2017. By the end of the year, the result was that global economic growth strengthened in 2017 to 3.7% compared to 3.2% in 2016. However, countries that depended on commodity exports continued to be hard hit, experiencing sharp declines in foreign earnings.
Global spirits market was expected to grow in 2017 by a cumulative annual growth rate of 3.3%. However, in relation to the Rum category, the cumulative annual growth was estimated at only 0.5%, that growth being confined to the premium and super-premium segments, while the standard segment was projected to experience marginal decline. Given these projections, the Group’s strategic decision to premiumise its Eldorado Rum brand was certainly well timed.
At the local level, the domestic economy was originally projected to grow at 3.8% but by the end of the year, this estimate had been revised downwards to 2.9%. A significant contributing factor to this downward revision was the contraction of the Sugar Industry, which produced 137,298 tons in 2017 compared to 183,615 tons produced in 2016. The state-owned Guyana Sugar Corporation (GUYSUCO) had been kept afloat in recent years by subsidies from the National Treasury. At the end of 2017, the Government announced the plan to downsize the sugar operations to only three Estates: Albion, Blairmont and Uitvlugt, while the other three Estates: Enmore, Skeldon and Rose Hall would be closed.
The downsizing of the local Sugar Industry has serious implications for the liquor operations of our Group. As such, we have been exploring all options as we seek to mitigate any potential adverse effects of such downsizing. It is, in this context, that our strategic decision sometime ago to diversify our business must be seen as the right course of action by the Group. However, our core business
is rum production and molasses is a key raw material for such production. DDL has expressed to the Government an interest in investing in the Enmore Estate to continue molasses production there. If that proposal does not prove to be economically feasible, DDL may have to source molasses from foreign suppliers to ensure adequate and reliable supply.
RESULTS FOR 2017The Group revenue in 2017 was $19.569 billion, representing an increase of $1.460 billion or 8% over that of 2016. The revenue from both the domestic as well as international markets showed steady growth.
Group profit before tax for 2017 was $3.551 billion compared to $2.920 billion for the previous year, an increase of $631m or almost 22%.
Profit after tax for the year was $2.6 billion compared to $2.191 billion for the previous year, an increase of $409m or almost 19%.
Earnings per share were $3.38 in 2017 compared to $2.85 in 2016.
Shareholders’ Funds increased by 13% in the year, while net debt to equity ratio at the end of the year improved from 22:1 in 2016 to 13:1 in 2017.
SUBSIDIARIESDistribution Services Ltd (DSL), which has been a major focus of our diversification, achieved $396m in profit before tax in 2017 compared to $358m the previous year, an increase of about 10.6%. This subsidiary has outgrown its present distribution facilities and a new warehouse and distribution centre is presently being constructed at Plantation Diamond. This 42,000 square feet new modern facility, including cold storage and offices, is projected to cost approximately $1 billion and is scheduled for completion in the second half of this year.
Demerara Shipping Co. Ltd (DSCL) achieved an operational profit before tax of $132m in 2017 compared to $102m the previous year, an increase of 29%. In 2017, the company acquired two nearby properties at a total cost of $143m. With these two properties, ancillary operations such as the Workshop and Retailing Outlet would be relocated in order
17
18
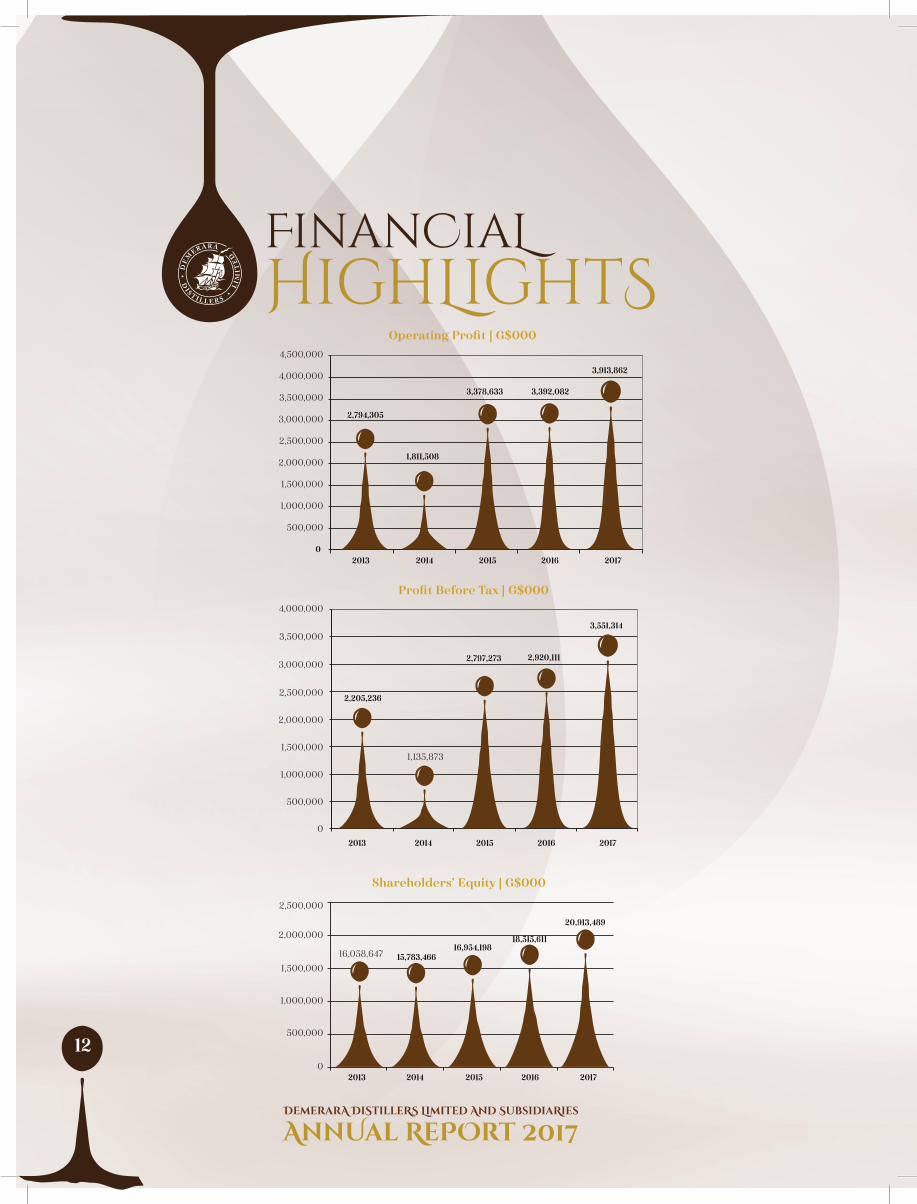
to facilitate greater warehouse space required for our expanding shipping business. Additionally, this subsidiary has embarked on a phased rehabilitation and upgrade of its Port and Warehouse facilities. In 2017, $33m was expended on such phased rehabilitation and upgrade while a further $1.5 billion has been earmarked to be expended over the next four years.
Tropical Orchard Products Company Ltd. (TOPCO) endured the entire year with the loss of the School Feeding contract, a Ministry of Education Project, which was contracted out to a foreign company. This company steadily increased its sales on the domestic market but made a loss of $53m in the year compared with a loss of $16m the previous year. In January 2018, the company was awarded the School feeding contract for the first three months of the year and we are hopeful for its renewal. In the meantime, management has been crafting an aggressive expansion plan for this company to widen and expand the range of products offered on the domestic and export market.
Our overseas subsidiaries, which provided route to market services for our liquor products, also performed well contributing $212m in Profit before Tax compared to $185m the previous year. Demerara Distillers St Kitts- Nevis Ltd recorded a profit of $23m, Demerara Distillers USA Inc. recorded a profit of $37m, Demerara Distillers Europe recorded a profit of $95m and Demerara Rum Co recorded a profit of $57m.
DIVIDENDSAn Interim Dividend of $0.20 per share was recommended and paid in November 2017. The Directors have recommended a Final Dividend of $0.60 per share which, if approved by the members at the Annual General Meeting, would result in a total of $0.80 per share paid for 2017.
CAPITAL EXPENDITUREThe Group has continued its investment program to modernise, expand and diversify its operations.
In addition to the construction of the DSL warehouse and the phased rehabilitation and upgrade of DSCL Wharf facilities, a new warehouse to accommodate 30,000 barrels of rum for aging along with access roadway is also being constructed at our Plantation Diamond complex and is expected to be completed before the end of the first quarter of this year. The cost of this project is estimated at almost $500m.
QUALITY AND OPERATIONAL IMPROVEMENTSOur production facilities and supporting services were audited by SGS during the year and certification of ISO 9001:2008 Quality Management System was maintained. In addition, our Distillery achieved Hazard Analysis and Critical Control Points (HACCP) certification while the Liquor Bottling Plant was also successful in its Good Manufacturing Practices (GMP) certification in the year.
Our Beverage Plant maintained certification from AIB (American Institute of Bakery) Audit as well as PepsiCo International Global Audit respectively.
We continue to place great emphasis on training of our staff to equip them with the skills required to ensure that our various operations continue to meet high and continuously evolving international standards. During the year, both the Executive and Management Teams were exposed to Lean Six Sigma training.
Our ongoing program to create a trained pool of professional staff for career development in the organization continued with the recruitment of additional graduate trainees. Through our Cadetship Program, we continued to sponsor employees pursuing undergraduate programs in various fields such as chemistry and engineering.
FUTURE PROSPECTSInternationally, we will continue to monitor the potential impact of the apparent reversal trend for free trade as some Western countries, who previously championed this cause, now appear to be resorting to more nationalistic policies.
Locally, the Government’s announcement of the downsizing of GUYSUCO to three Estates has triggered our re-assessment of our molasses procurement plans in both the short as well as long term. The projected molasses from the three retained Estates in 2018 is 42,000 tons. Our Distillery’s projected requirement for 2018 is 70,000 tons. As a short-term response therefore, we are exploring in collaboration with the Special Project Unit, which has been established under the National Industrial and Commercial Investments Limited (NICIL) to manage the divestment and privatisation of the three Estates, the possibility of utilising the standing cane in the fields from the closed Estates. We are also assessing the feasibility of importing molasses to bridge the supply gap.
RepOrt - cont’d
ChaiRman’S
18

19
ACKNOWLEDGEMENTS I would like to thank the members of the Management Team and Staff for their continued dedication, commitment and hard work towards making these results possible. I wish to thank the Board of Directors for their advice, guidance and support throughout the year. I would also like to thank our customers, business partners and shareholders for their continued support and confidence.
A long-term solution is also being pursued as we comprehensively assess the viability of acquiring the Enmore Estate for the purpose of providing molasses inputs for our distillery operations.
The Group’s diversification will gain momentum in 2018 with several major projects, at the planning stage, that would significantly expand our revenue from non-alcoholic products.
With the recent announcements of proven deposits of petro-carbon off Guyana’s shore and the expected first oil production in 2020, the future economic prospects of the country has been considerably enhanced.
Komal R. SamarooChairman
RepOrt - cont’d
ChaiRman’S
19

20
AwardSLOng SeRViCe
Ahmad AmzahDSCL
Parbattie BipathFinance
Bhoupaul LooknarainDistillery
Jagdesh M. PersaudDistillery
Kawall SinghMarketing
Nurmal KissoonlallBeverage Plant
Nandranie LawrenceFinance
Boodram PersaudProjects
Mahendra SawhDistillery
George R. SinghQuality Assurance (Central Lab)
Khelowattie Singh-ArmanauthBeverage Plant
Eric AlfredDSCL
Asif AllyBeverage Sales
Ashira Bacchus-SukdeoDistillery
Pauline BrathwaiteMarketing
Donny A. BrumellBottling Plant
Thirbani C. DoobayDSL
Premindra GharbaranDistillery
Naeem HallimDSCL
Colin A. HarteBeverage Plant
Fizal HussainDDL-Berbice
Trevor A. JohnBeverage Plant
Denis KishunBottling Plant
Roy KishunBottling Plant
Harry P. LookramDSCL
Arjune MahadeoDSCL
Udjister MahaseBeverage Plant
Khemrajie MangalFinance
Vishnudat NarainDDL-Security
Chintaman PariaugDSCL
Randolph PersaudDistillery
Bishnu RamnarineDSL
Indar RampersaudDDL-Essequibo
Michael RobertsSpecial Events
Arjun RoopnarineDDL-Essequibo
Chanmattie SeemangalBottling Plant
Wayne WilliamsDSL
Intaz AllyDistillery
Adrian AndriesDistillery
Jerome F. BairdDistillery
Komalram BisramDSL
Edward C. BristolDDL-Security
Andre N BrowneDSL
Tilak BudhuDistillery
Parmanand DolaiDistillery
Gupta P. GayadeenDSCL
Shamnarayan GoberdhanMarketing-Liquor
Beneram HeeralallDSCL
Ferdinand A. HollingsworthTopco
Shivangali James-RamjeawanFinance
Harry NarineBeverage Plant
Nateram NarineEssequibo
Chandrashakar PersaudDSCL
Rommel PersaudQuality Assurance (Central Lab)
Roshanie RagoonauthCustomer Service
Doodnauth RamnaraineDistillery
Seepaul RamsuraceBeverage Sales
Jaichan SeetahalBeverage Plant
Khemraj SukhdeoBeverage Plant
35YeaRS
30YeaRS
25YeaRS
20
20 15
YeaRS
YeaRS - cont’d YeaRS - cont’d
15YeaRS

21
TeamManagement
21
SHAUN CALEBSenior Process ImprovementManager
FAZAL BACCHUSChief Internal Auditor
VASUDEO SINGHFinance Controller
MONEETA SINGH-BIRD Human Resource Director
YESHWAR BHAGWANDATSenior Business Development Manager
From Left to Right:

22
DiReCtORSRepOrt Of tHe
The Board of Directors (“the Board”) is pleased to present its Report together with the Audited Financial Statements of Demerara Distillers Limited & Subsidiaries (“the Group”) for the year ended December 31, 2017.
Turnover and ProfitabilityGroup turnover increased by $1.5 billion from $18.1 billion recorded in 2016 to $19.6 billion in 2017. Group pre-tax profits increased by $631 million from $2.920 billion 2016 to $3.551 billion achieved in 2017.
DividendsA final dividend of $0.60 per share has been recommended, in addition to $0.20 per share interim dividend already paid, bringing the total dividends for the year to $0.80 per share.
BOARD OF DIRECTORS DESIGNATIONKomal Samaroo Executive ChairmanYesu Persaud Non-Executive DirectorRudolph Collins Non-Executive DirectorEgbert Carter Non-Executive DirectorTimothy Jonas Non-Executive DirectorHarryram Parmesar Non-Executive DirectorLancelot Tyrell Non- Executive DirectorSharda Veeren-Chand Executive DirectorSharon Sue Hang Executive Director Allison Thorne Executive Director
DirectorsIn accordance with Article 122 of the Company’s Articles of Association, Directors Messrs. Egbert Carter, Rudolph Collins, Timothy Jonas, Harryram Parmesar, Yesu Persaud and Lancelot Tyrell will retire by rotation at the close of the Annual General Meeting held on the 29th day of March 2018 and being eligible, offer themselves up for re-election.
Directors’ Emoluments as at December 31, 2017Egbert Carter $1,946,669Rudolph Collins $1,946,669Timothy Jonas $1,946,669Harryram Parmesar $1,946,669Yesu Persaud $1,946,669Lancelot Tyrell $1,946,669
23
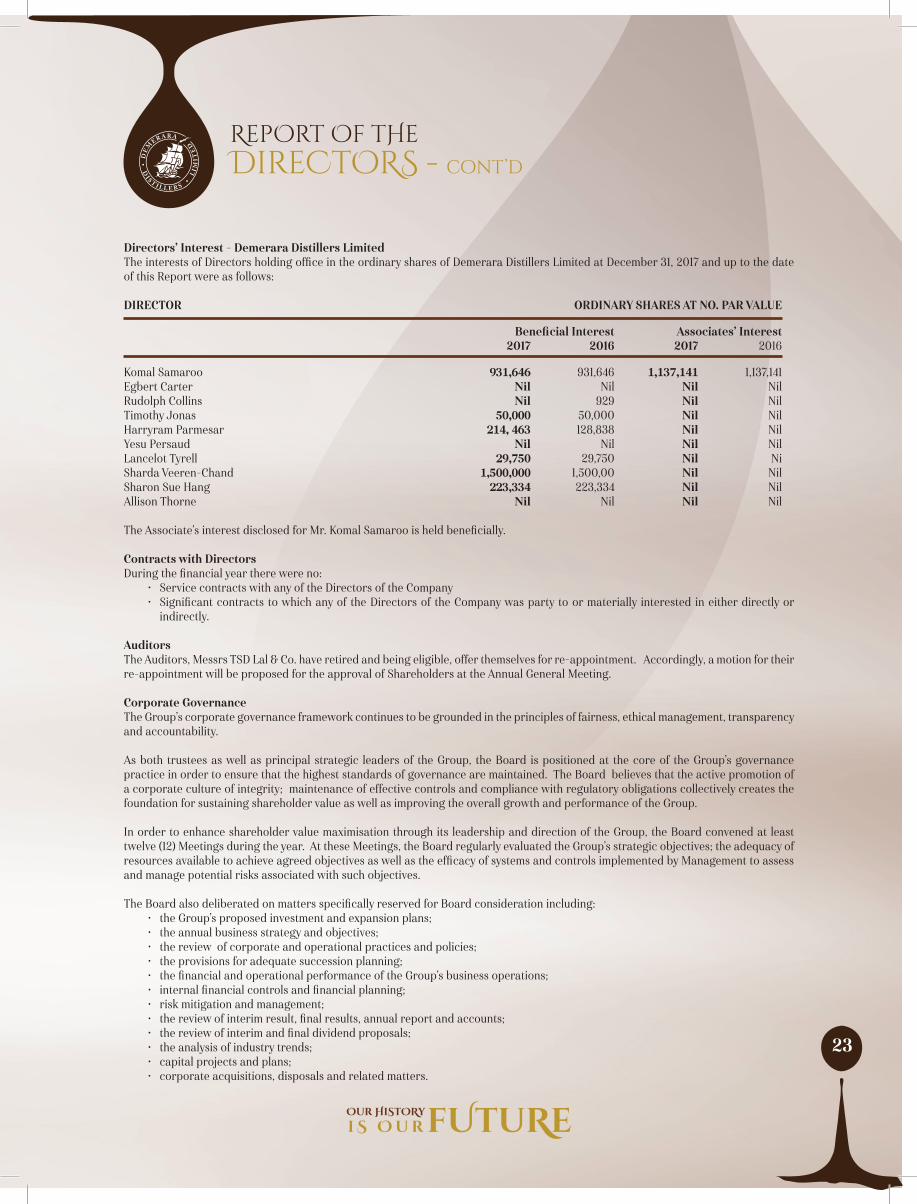
Directors’ Interest – Demerara Distillers LimitedThe interests of Directors holding office in the ordinary shares of Demerara Distillers Limited at December 31, 2017 and up to the date of this Report were as follows:
DIRECTOR ORDINARY SHARES AT NO. PAR VALUE
Beneficial Interest Associates’ Interest 2017 2016 2017 2016
Komal Samaroo 931,646 931,646 1,137,141 1,137,141Egbert Carter Nil Nil Nil NilRudolph Collins Nil 929 Nil NilTimothy Jonas 50,000 50,000 Nil NilHarryram Parmesar 214, 463 128,838 Nil NilYesu Persaud Nil Nil Nil NilLancelot Tyrell 29,750 29,750 Nil NiSharda Veeren-Chand 1,500,000 1,500,00 Nil NilSharon Sue Hang 223,334 223,334 Nil NilAllison Thorne Nil Nil Nil Nil The Associate’s interest disclosed for Mr. Komal Samaroo is held beneficially.
Contracts with DirectorsDuring the financial year there were no:
• Service contracts with any of the Directors of the Company• Significant contracts to which any of the Directors of the Company was party to or materially interested in either directly or
indirectly.
AuditorsThe Auditors, Messrs TSD Lal & Co. have retired and being eligible, offer themselves for re-appointment. Accordingly, a motion for their re-appointment will be proposed for the approval of Shareholders at the Annual General Meeting.
Corporate GovernanceThe Group’s corporate governance framework continues to be grounded in the principles of fairness, ethical management, transparency and accountability.
As both trustees as well as principal strategic leaders of the Group, the Board is positioned at the core of the Group’s governance practice in order to ensure that the highest standards of governance are maintained. The Board believes that the active promotion of a corporate culture of integrity; maintenance of effective controls and compliance with regulatory obligations collectively creates the foundation for sustaining shareholder value as well as improving the overall growth and performance of the Group.
In order to enhance shareholder value maximisation through its leadership and direction of the Group, the Board convened at least twelve (12) Meetings during the year. At these Meetings, the Board regularly evaluated the Group’s strategic objectives; the adequacy of resources available to achieve agreed objectives as well as the efficacy of systems and controls implemented by Management to assess and manage potential risks associated with such objectives.
The Board also deliberated on matters specifically reserved for Board consideration including:• the Group’s proposed investment and expansion plans;• the annual business strategy and objectives;• the review of corporate and operational practices and policies;• the provisions for adequate succession planning;• the financial and operational performance of the Group’s business operations; • internal financial controls and financial planning;• risk mitigation and management;• the review of interim result, final results, annual report and accounts;• the review of interim and final dividend proposals;• the analysis of industry trends;• capital projects and plans;• corporate acquisitions, disposals and related matters.
DireCtORS - cont’d
RepOrt Of tHe

24
For 2017, the Board comprised six Non-Executive Directors and four Executive Directors including the Executive Chairman.
At the last Annual General Meeting of the Group convened on April 7, 2017, Non-Executive Directors of the Board were re-elected by Shareholders. The re-elected Non-Executive Directors, each of whom is highly accomplished in their respective sectors, possess a diverse range of expertise and professional skills in areas relevant to the Group including accounting, audit, law, civil and mechanical engineering and human resource management. This apposite blend of varied knowledge and skills affords the Group access to substantive expert capacity as well as facilitates a healthy balance of perspectives and views during Board deliberations.
Within 2017, Non-Executive Directors convened formal as well as informal meetings amongst themselves as well as with Executive Directors and Management without the presence of the Executive Chairman.
Non-Executive Directors have abstained from active participation in the Group’s daily management in order to safeguard their independence as Shareholder’s representatives on the Board. Non-Executive Directors have instead delegated the responsibility for day to day management of the Group to the Executive Committee.
The Executive Committee comprises Executive Directors and Senior Management. This Committee is collectively responsible for ensuring that the policies, strategies and resources of the Group are properly utilised to achieve the Group’s objectives.
The Executive Committee, led by the Executive Chairman, convened at least twelve (12) Meetings in 2017, where the Committee focused on: Production, Sales, Marketing, Information Technology, Quality Assurance, New Product Development, Financial Performance, Regulatory Compliance, Corporate Social Responsibility, Human Resources, Training & Development, Health, Safety and Environment, Capital Projects, Security, Risk Management and Internal Controls. The Group’s Management structure embraces the dichotomy of roles and responsibilities between its operational units such as Production and Sales and its corporate service units such as Commercial, Human Resources, Legal & Compliance, Management Information Systems, Quality Assurance, Finance and Security so as to minimise the risks of conflict of interest and preserve the system of controls.
In an ever changing business environment in which the Group operates, the Board holds firm to its commitment towards safeguarding the integrity of the Group’s operations through continued adoption of sound governance practices and policies.
Board CommitteesTo assist in discharging some of its oversight functions, the Board has established and entrusted certain responsibilities to Board Committees. Throughout the year, these Committees have submitted periodic reports on the matters reviewed and agreed by the respective Committees which were then presented and reviewed at Board Meetings.
Audit CommitteeThe Board has delegated its responsibility for adequate supervision of financial controls to the Audit Committee, which regularly reports to the Board on its findings as well as recommendations.
The Members of the Audit Committee are:
Harryram Parmesar Non-Executive Director ChairmanTimothy Jonas Non-Executive Director Member
The general responsibilities of the Audit Committee include the following:
• to review the scope, quality and findings of internal as well as external audits;• to follow up on important findings of internal and external audits as well as the status of recommendations agreed to be adopted
by Management;• to evaluate the adequacy of internal control policies and procedures;• to scrutinize the Financial Statements and provide its conclusions to the Board;• to assess and advise the Board on the competence, independence and performance of the Company’s Internal Audit Department
as well as its Independent Auditors.
In addition to its general responsibilities, for the period under review, the Audit Committee also provided oversight of risk based assessment activities and is satisfied that its recommendations are being addressed by Management.
DireCtORS - cont’d
RepOrt Of tHe

25
Technical CommitteeThe primary role of the Technical Committee is to assist and guide the Board and Group in the technical and engineering oversight of: capital improvement plans; manufacturing practices, processes, and procedures as well as health, safety and environmental plans.
The specific objectives of the Technical Committee include:
• to guide the Board and Group on feasibility and strategies relating to the preparation and implementation of capital projects;• to develop, monitor and review policies for planned maintenance of buildings, plant and equipment of the Group in keeping with
engineering best practices and industry standards;• to guide the Board and Group on potential complexities relative to the preparation and implementation of programs, procedures
and systems to achieve the designed operating parameters.• to review the adequacy of the Group’s health, safety and environmental systems and procedures
During the period, the Technical Committee held several meetings to examine and evaluate organizational plans, buildings, and equipment designs, rehabilitation work and progress reports. In this context the Committee undertook the following activities:
• monitored the progress of new and on-going projects including the comprehensive evaluation of alternative energy solutions such as the Liquefied Natural Gas Pilot Project;
• evaluated designs and tender documents for project proposals and recommended suitable contractors;• at Board’s request, investigated and prepared reports, complete with recommendations, on matters aimed at strategic operational
improvement and upgrade;
In 2017, the composition of the Technical Committee remained unchanged, with five (5) Members namely:
Lancelot Tyrell Non-Executive Director ChairmanEgbert Carter Non-Executive Director MemberSharon Sue Hang Technical Director, Non-Liquor Plants MemberLennox Caleb Senior Process Improvement Manager, Liquor Plants MemberKenneth Ragnauth Project Manager MemberVasudeo Singh Finance Controller Member
Substantial Shareholders
Company/Institution 2017 2016 # of Shares % Shareholding # of Shares % Shareholding Trust Company (Guyana) Limited 233,667,669 30.34 233,486,291 30.32Secure International Finance Co Ltd 142,524,388 18.51 142,338,498 18.49National Insurance Company 61,600,000 8.00 61,600,000 8.00
A substantial shareholder is defined as a person who is entitled to exercise, or control the exercise of five percent (5%) or more of the voting power at any general meeting of the company.
DireCtORS - cont’d
RepOrt Of tHe
26
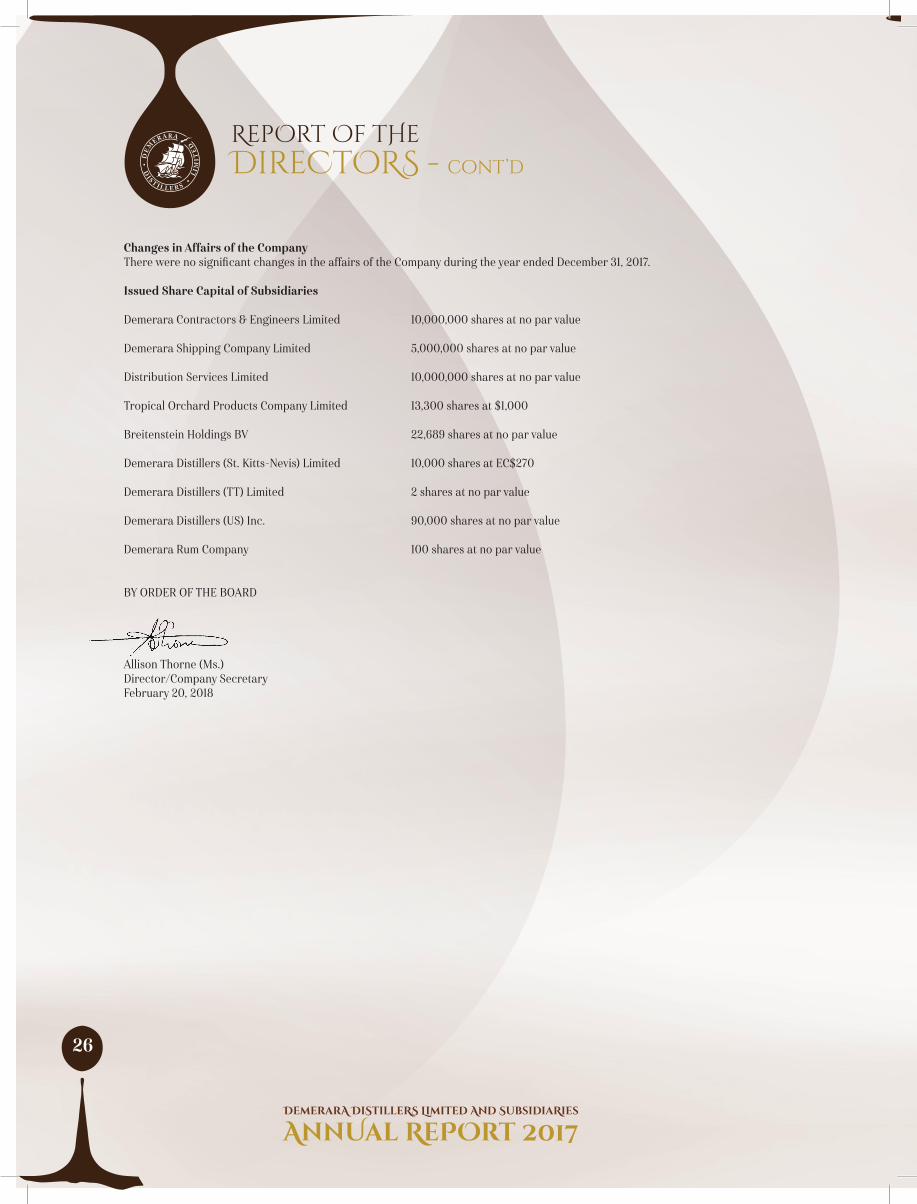
Changes in Affairs of the CompanyThere were no significant changes in the affairs of the Company during the year ended December 31, 2017.
Issued Share Capital of Subsidiaries
Demerara Contractors & Engineers Limited 10,000,000 shares at no par value
Demerara Shipping Company Limited 5,000,000 shares at no par value
Distribution Services Limited 10,000,000 shares at no par value
Tropical Orchard Products Company Limited 13,300 shares at $1,000
Breitenstein Holdings BV 22,689 shares at no par value
Demerara Distillers (St. Kitts-Nevis) Limited 10,000 shares at EC$270
Demerara Distillers (TT) Limited 2 shares at no par value Demerara Distillers (US) Inc. 90,000 shares at no par value
Demerara Rum Company 100 shares at no par value
BY ORDER OF THE BOARD
Allison Thorne (Ms.)Director/Company SecretaryFebruary 20, 2018
DireCtORS - cont’d
RepOrt Of tHe

27
ReSpOnsibilityCOrpORate SOciaL
At Demerara Distillers Limited we remain focused on our responsibility to help develop the next generation of consumers and employees who will be the future of both our Company and our Country. In 2017 our emphasis continues on the development of youth through several avenues in the areas of Education and Sports, including:
The DDL Foundation The DDL Foundation continues to be the key area of focus under our drive for education. This year, we saw four awardees who successfully completed their secondary education bringing the total number of graduates to twelve, since the foundation was launched in 2010. Khemchand Omadath, Bhovana Persaud, Andrew Persaud and Timall Phillips were among those that graduated this year.
This year, the foundation welcomed an additional five students; Wanita Williams, Prem Balmacoon, Rebekah McPherson, Micah Fordyce and Jasmine Johnson.
The goal of the Foundation is the advancement of education in secondary students by providing scholarships to assist with the main costs associated with attending school. This includes books, uniforms, transportation and, in some cases, meals.
All students who have excelled in the National Grade Six Examination and who have demonstrated their need for assistance as a result of their financial or social constraints can apply to the Foundation.
The Foundation comprises mainly volunteers from the DDL staff body, includes a Mentorship Program where each child is paired with a Mentor who monitors the performance of the child and provides the necessary moral and other support during the period of their relationship with the Foundation.
Today the Foundation has a total of twenty-four (24) students from across the country who benefit from scholarships
SPORTS – LOCAL SPONSORSHIPS
Pepsi Under 16 Boxing Demerara Distillers Limited continued to support the development of youth boxing in Guyana during 2017 by extending its relationship with the Guyana Amateur Boxing Association (GABA). In 2017, two (2) Pepsi Under-16 Boxing tournaments were executed. The GABA continued to build on the tournament expansion by including participants from varies islands in the Caribbean such as St. Lucia, Jamaica, Barbados and Antigua. This tournament also continues to bring excitement and experience to the young boxers who look forward to it every year.
HockeyThe Guyana Hockey Board and Demerara Distillers Limited, under its Diamond Mineral Water Brand once again executed the most anticipated in door hockey tournament, the 14th Annual Diamond
Mineral Water International In-Door Hockey Festival. With the new venue of the National Sports Hall, teams from Trinidad and Barbados were on board for this edition of the hockey festival. The Diamond Mineral Water International In-Door Hockey Festival continues to be the longest and most exciting in-door hockey tournament throughout the Caribbean.
Horse RacingDDL maintains a strong relationship with Kennard Memorial Turf Club (KMTC).This 45th year saw the club hosting three of the four meets due to adverse weather conditions. The club has been well maintained over the years and attracts many families to witness some of the fastest horses and skillful jockeys in Guyana. Many Berbicians deem these meets a key event in their entertainment calendar. DDL plans on maintaining this relationship for many more years.
Rose Hall Town Youth and Sports ClubDemerara Distillers Limited and the Rose Hall Town Youth and Sports Club Pepsi U-19 team continues to work together and towards the development of the team and the community through outreach programs.
SPONSORSHIPS
Hero Caribbean Premier League T20 2017Demerara Distillers’ under our El Dorado brand has renewed its sponsorship of the HERO Caribbean Premier League for five years as the ‘Official Spirit’ and ‘Celebration Partner’ of the tournament. To celebrate this occasion, El Dorado launched its limited edition rum, the El Dorado Master Blender’s Special Edition Rum, for cricket fans all around the world. Chairman of Demerara Distillers Limited, Komal Samaroo, said that “Every bottle of El Dorado Rum is imbued with the rich heritage of centuries of rum crafting experience. We take great care to preserve, enrich and showcase the heritage and skill and craftsmanship that makes every bottle of El Dorado so unique. It is in this context that our relationship with CPL since its inauguration must be seen - richer and deeper with the passage of time. As we commence a new and enhanced relationship over the next five years we are delighted to mark the occasion with the launch of this new El Dorado blend specially crafted by our Master Blender to celebrate once again the partnership between the World’s Best Rum and the Biggest Party in Sport.”
Mr. Jamie Stewart, Commercial Director of the Hero CPL, noted: “Over the years since CPL first exploded onto the regional stage, the deep, rich taste of El Dorado has become beloved by CPL players, officials and fans. It is with great pleasure we welcome this

28
special CPL edition of the world’s finest rum. It’s a landmark for the relationship and we are sure these unique cricket bat shaped bottles will be coveted by CPL fans around the world.”
Apart from the launching of its very first rum in celebration of the League, DDL has also gained exclusive pouring rights for the Jamaica Tallawahs for the very first time. El Dorado maintained its sponsorship of the other five teams; Guyana Amazon Warriors, Trinbago Knight Riders, St. Lucia Stars, Barbados Tridents and the St. Kitts Patriots.
The company looks forward to the next four years as the ‘Official Spirit’ of the League as the brand continues to win the hearts of cricket fans not only in the Caribbean but all around the world.
EDUCATION AND PERSONNEL DEVELOPMENT
Bursary SchemeDemerara Distillers Limited held its annual Bursary Awards Program on the 27th July, 2017 and awarded new bursaries to Ten (10) employees’ children who passed the year 2017 National Grade Six Assessment of the Secondary School Entrance Examination (SSEE).
DDL currently has a bursary scheme of sixty- nine (69) students receiving annual bursary. The DDL Bursary Awardees are located throughout the length and breadth of Guyana.
The Bursary Awards program aims to support employees within the company to provide education for their children.
Work AttachmentAs part of our Corporate Social Responsibility, the Company facilitated a limited Work Study Program for forty-two (42) students from i) University of Guyana ii) Secondary Schools iii) Government Technical Institute iv) Kuru Kuru Training Centre. These students were involved in on the job/ hands on activities at plants, as well as contributed in cultural and talent display within the company.
These students were assigned to the a) Diamond Vehicle Workshop b) New Bottling Plant c) Beverage Plant d) Distillery e) Central Lab f) Finance Department g) Audit h) Human Resources i) Demerara Shipping Company Limited j) Tropical Orchard Products Company Limited.
ToursDuring the year 2017, twelve (12) Institutions consisting of Eight Hundred and Five (805) students visited the company to gain onsite exposure to the operations of the Topco, Beverage Plant and Biomet Plant in order to assist in the Education and Career Pathing for in and out of school youths.
Cadetship/Scholarship/Sponsorship Programme Demerara Distillers Limited continues to maintain its cadetship/scholarship/sponsorship programmes and provides full and partial scholarships to staff.
There are currently five (5) persons who are at the University of Guyana on cadetship. These persons are pursuing Undergraduate Degrees in the areas of Engineering and Chemistry.
Fifty – Six (56) staff members are beneficiaries of partial support for professional development at Universities (local and foreign), and other professional institutions in accounting, information technology, business administration, distillation, human resources, marketing etc. These developmental programmes and initiatives represent just a few ways the Company gives back to the society, and underscores the Company’s commitment to human resource development.
Management Trainee ProgrammeIn 2017, the Demerara Distillers Limited accepted Six (6) University Graduates from the Departments of Social Sciences and Technology, into its Management Trainee Programme.
Most of these graduates are currently involved in on and off the job training. Their training will ensure exposure to most areas of operations within the business, so as to prepare them to function effectively in their future assignments.
Staff Self Improvement Programme (SIP)All categories of Staff within the Demerara Distillers Limited are provided additional opportunities to enable their personal growth, and identify with a career of their choice, through accredited programmes conducted by the Diamond Institute of Management and Technology (DIMATECH), which has been approved to conduct professional examinations under the Government Technical Educational Examinations (GTEE) and the Institute of Brewing and Distillation (IBD), UK.
In 2017, eight (8) staff sat the Government Technical Educational Examination (GTEE) in Craft and Advance Electrics. Six (6) were successful, with one (1) staff gaining a distinction and five (5) receiving credits.
During the year, three (3) of our staff also sat the modular examination in Distillation conducted by the Institute of Brewing and Distillation (IBD), UK. They were all successful and are continuing on the next phase in the Distillation Programme.
The Demerara Distillers’ Limited (DDL) will continue to build human capacity, as it prides itself as a responsible corporate entity, ensuring development of staff and community.
ReSpOnsibility - cont’d
COrpORate SOciaL
28

2929
30
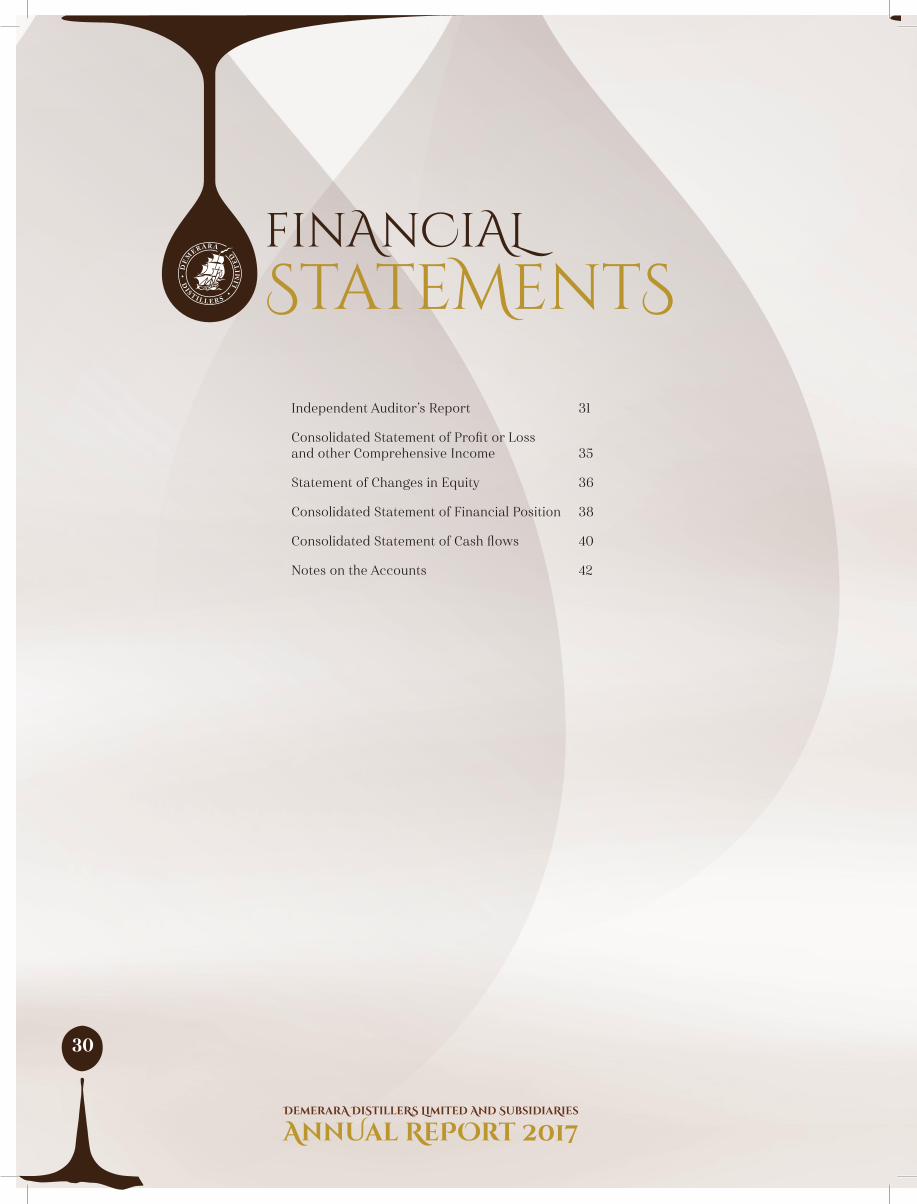
StateMentSfinAnCiAL
Independent Auditor’s Report 31
Consolidated Statement of Profit or Lossand other Comprehensive Income 35
Statement of Changes in Equity 36
Consolidated Statement of Financial Position 38
Consolidated Statement of Cash flows 40
Notes on the Accounts 42
31
AuditOR’S RepOrtiNdePeNdent
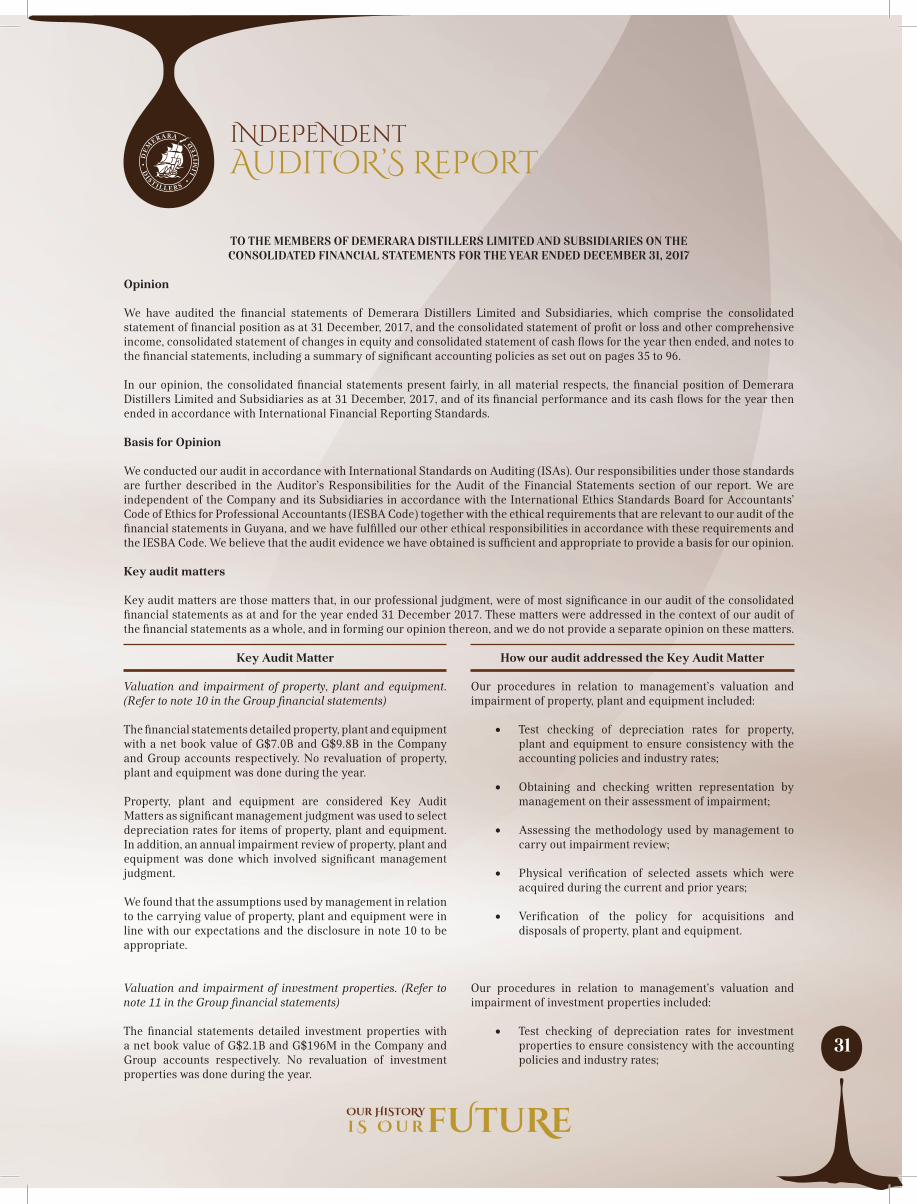
Key Audit Matter How our audit addressed the Key Audit Matter
Valuation and impairment of property, plant and equipment. (Refer to note 10 in the Group financial statements)
The financial statements detailed property, plant and equipment with a net book value of G$7.0B and G$9.8B in the Company and Group accounts respectively. No revaluation of property, plant and equipment was done during the year.
Property, plant and equipment are considered Key Audit Matters as significant management judgment was used to select depreciation rates for items of property, plant and equipment. In addition, an annual impairment review of property, plant and equipment was done which involved significant management judgment.
We found that the assumptions used by management in relation to the carrying value of property, plant and equipment were in line with our expectations and the disclosure in note 10 to be appropriate.
Valuation and impairment of investment properties. (Refer to note 11 in the Group financial statements)
The financial statements detailed investment properties with a net book value of G$2.1B and G$196M in the Company and Group accounts respectively. No revaluation of investment properties was done during the year.
TO THE MEMBERS OF DEMERARA DISTILLERS LIMITED AND SUBSIDIARIES ON THECONSOLIDATED FINANCIAL STATEMENTS FOR THE YEAR ENDED DECEMBER 31, 2017
Opinion
We have audited the financial statements of Demerara Distillers Limited and Subsidiaries, which comprise the consolidated statement of financial position as at 31 December, 2017, and the consolidated statement of profit or loss and other comprehensive income, consolidated statement of changes in equity and consolidated statement of cash flows for the year then ended, and notes to the financial statements, including a summary of significant accounting policies as set out on pages 35 to 96.
In our opinion, the consolidated financial statements present fairly, in all material respects, the financial position of Demerara Distillers Limited and Subsidiaries as at 31 December, 2017, and of its financial performance and its cash flows for the year then ended in accordance with International Financial Reporting Standards.
Basis for Opinion
We conducted our audit in accordance with International Standards on Auditing (ISAs). Our responsibilities under those standards are further described in the Auditor’s Responsibilities for the Audit of the Financial Statements section of our report. We are independent of the Company and its Subsidiaries in accordance with the International Ethics Standards Board for Accountants’ Code of Ethics for Professional Accountants (IESBA Code) together with the ethical requirements that are relevant to our audit of the financial statements in Guyana, and we have fulfilled our other ethical responsibilities in accordance with these requirements and the IESBA Code. We believe that the audit evidence we have obtained is sufficient and appropriate to provide a basis for our opinion.
Key audit matters
Key audit matters are those matters that, in our professional judgment, were of most significance in our audit of the consolidated financial statements as at and for the year ended 31 December 2017. These matters were addressed in the context of our audit of the financial statements as a whole, and in forming our opinion thereon, and we do not provide a separate opinion on these matters.
Our procedures in relation to management’s valuation and impairment of property, plant and equipment included:
• Test checking of depreciation rates for property, plant and equipment to ensure consistency with the accounting policies and industry rates;
• Obtaining and checking written representation by management on their assessment of impairment;
• Assessing the methodology used by management to carry out impairment review;
• Physical verification of selected assets which were acquired during the current and prior years;
• Verification of the policy for acquisitions and disposals of property, plant and equipment.
Our procedures in relation to management’s valuation and impairment of investment properties included:
• Test checking of depreciation rates for investment properties to ensure consistency with the accounting policies and industry rates;
32
AuditOR’S RepOrt - cont’d
iNdePeNdent
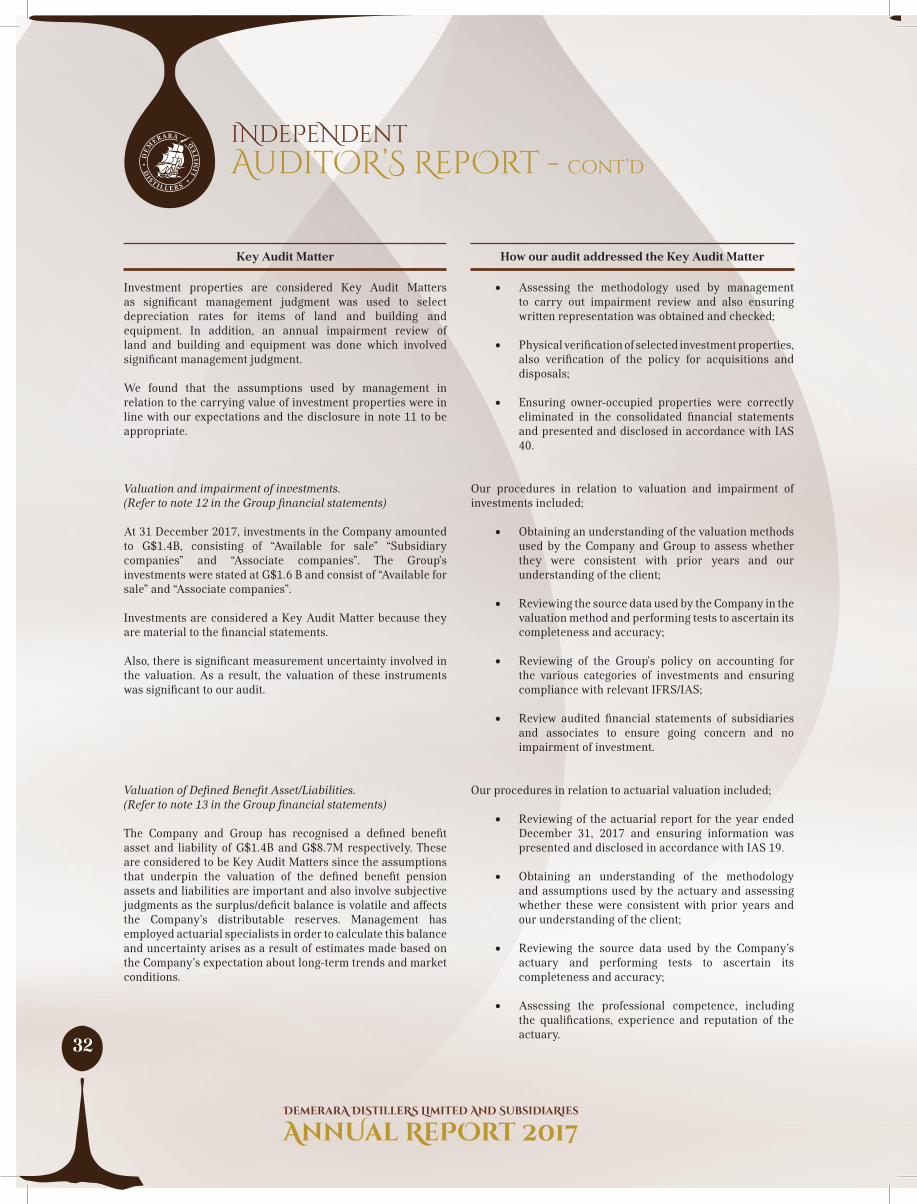
Investment properties are considered Key Audit Matters as significant management judgment was used to select depreciation rates for items of land and building and equipment. In addition, an annual impairment review of land and building and equipment was done which involved significant management judgment.
We found that the assumptions used by management in relation to the carrying value of investment properties were in line with our expectations and the disclosure in note 11 to be appropriate.
Valuation and impairment of investments. (Refer to note 12 in the Group financial statements)
At 31 December 2017, investments in the Company amounted to G$1.4B, consisting of “Available for sale” “Subsidiary companies” and “Associate companies”. The Group’s investments were stated at G$1.6 B and consist of “Available for sale” and “Associate companies”.
Investments are considered a Key Audit Matter because they are material to the financial statements.
Also, there is significant measurement uncertainty involved in the valuation. As a result, the valuation of these instruments was significant to our audit.
Valuation of Defined Benefit Asset/Liabilities. (Refer to note 13 in the Group financial statements)
The Company and Group has recognised a defined benefit asset and liability of G$1.4B and G$8.7M respectively. These are considered to be Key Audit Matters since the assumptions that underpin the valuation of the defined benefit pension assets and liabilities are important and also involve subjective judgments as the surplus/deficit balance is volatile and affects the Company’s distributable reserves. Management has employed actuarial specialists in order to calculate this balance and uncertainty arises as a result of estimates made based on the Company’s expectation about long-term trends and market conditions.
• Assessing the methodology used by management to carry out impairment review and also ensuring written representation was obtained and checked;
• Physical verification of selected investment properties, also verification of the policy for acquisitions and disposals;
• Ensuring owner-occupied properties were correctly eliminated in the consolidated financial statements and presented and disclosed in accordance with IAS 40.
Our procedures in relation to valuation and impairment of investments included;
• Obtaining an understanding of the valuation methods used by the Company and Group to assess whether they were consistent with prior years and our understanding of the client;
• Reviewing the source data used by the Company in the valuation method and performing tests to ascertain its completeness and accuracy;
• Reviewing of the Group’s policy on accounting for the various categories of investments and ensuring compliance with relevant IFRS/IAS;
• Review audited financial statements of subsidiaries and associates to ensure going concern and no impairment of investment.
Our procedures in relation to actuarial valuation included;
• Reviewing of the actuarial report for the year ended December 31, 2017 and ensuring information was presented and disclosed in accordance with IAS 19.
• Obtaining an understanding of the methodology and assumptions used by the actuary and assessing whether these were consistent with prior years and our understanding of the client;
• Reviewing the source data used by the Company’s actuary and performing tests to ascertain its completeness and accuracy;
• Assessing the professional competence, including the qualifications, experience and reputation of the actuary.
Key Audit Matter How our audit addressed the Key Audit Matter

33
AuditOR’S RepOrt - cont’d
iNdePeNdent
Other information in the annual report
Management is responsible for the other information. The other information comprises all the information included in the Company’s 2017 annual report, but does not include the financial statements and our auditor’s report thereon.
Our opinion on the financial statements does not cover the other information and we do not express any form of assurance conclusion thereon.
In connection with our audit of the financial statements, our responsibility is to read the other information and, in doing so, consider whether the other information is materially inconsistent with the financial statements based on the work we have performed, we conclude that if there is a material misstatement of this other information; we are required to report that fact. We have nothing to report in this regard.
Responsibilities of Those Charged with Governance for the Consolidated Financial Statements
The Directors/Management is responsible for the preparation and fair presentation of these consolidated financial statements in accordance with International Financial Reporting Standards, and for such internal control as management determines necessary to enable the preparation of consolidated financial statements that are free from material misstatement, whether due to fraud or error. The Directors/Management is responsible for overseeing the Company and its Subsidiaries’ financial reporting process.
In preparing the Group financial statements, the directors are responsible for assessing the Group’s ability to continue as going concern, disclosing, as applicable, matters related to going concern basis of accounting unless the Directors either intend to liquidate the Group or to cease operations, or have no realistic alternative but to do so.
The audit committee assists the Directors in discharging their responsibilities for overseeing the Group’s financial reporting process.
Auditor’s Responsibilities for the Audit of the Consolidated Financial Statements
The objectives of our audit are to obtain reasonable assurance about whether the consolidated financial statements as a whole are free from material misstatement, whether due to fraud or error, and to issue an auditor’s report that includes our opinion. Reasonable assurance is a high level of assurance, but is not a guarantee that an audit conducted in accordance with International Standards on Auditing will always detect a material misstatement when it exists. Misstatements can arise from fraud or error and are considered material if, individually or in the aggregate, they could reasonably be expected to influence the economic decisions of users taken on the basis of these consolidated financial statements.
As part of an audit in accordance with ISA’s, we exercise professional judgment and maintain professional scepticism throughout the audit. We also:
• Identify and assess the risks of material misstatement of the Group financial statements, whether due to fraud or error; design and perform audit procedures responsive to those risks; and, obtain audit evidence that is sufficient and appropriate to provide a basis for our opinion. The risk of not detecting a material misstatement resulting from fraud is higher than for one resulting from error, as fraud may involve collusion, forgery, intentional omissions, misrepresentations, or the override of internal control.
• Obtain an understanding of internal control relevant to the audit in order to design audit procedures that are appropriate in the circumstances, but not for the purpose of expressing an opinion on the effectiveness of the Group’s internal control.
• Evaluate the appropriateness of accounting policies used and the reasonableness of accounting estimates and related disclosures made by the directors.
• Conclude on the appropriateness of the directors’ use of the going concern basis of accounting and, based on the audit evidence obtained, whether a material uncertainty exists related to events or conditions that may cast significant doubt on the Group’s ability to continue as a going concern. If we conclude that a material uncertainty exists, we are required to draw attention in our auditor’s report to the related disclosures in the Group financial statements or, if such disclosures are inadequate, to modify our opinion. Our conclusions are based on the audit evidence obtained up to the date of our auditor’s report. However, future events or conditions may cause the Group to cease to continue as a going concern.
• Evaluate the overall presentation, structure and content of the Group financial statements, including the disclosures, and whether the Group financial statements represent the underlying transactions and events in a manner that achieves fair presentation.

34
Auditor’s Responsibilities for the Audit of the Consolidated Financial Statements - cont’d
• Obtain sufficient appropriate audit evidence regarding the financial information of the entities or business activities within the Group to express an opinion on the Group financial statements. We are responsible for the direction, supervision and performance of the group audit. We remain solely responsible for our audit opinion.
We communicate with the Audit Committee regarding, among other matters, the planned scope and timing of the audit and significant audit findings, including any significant deficiencies in internal control that we identify during our audit.
We also provide the Audit Committee with a statement that we have complied with relevant ethical requirements regarding independence, and to communicate with them all relationships and other matters that may reasonably be thought to bear on our independence, and where applicable, related safeguards.
From the matters communicated with the Audit Committee, we determine those matters that were of most significance in the audit of the Group financial statements of the current period and are therefore the Key Audit Matters. We describe these matters in our auditor’s report unless law or regulation precludes public disclosure about the matter or when, in extremely rare circumstances, we determine that a matter should not be communicated in our report because the adverse consequences of doing so would reasonably be expected to outweigh the public interest benefits of such communication.
Report on Other Legal and Regulatory Requirements The financial statements comply with the requirements of the Companies Act 1991.
The engagement partner responsible for the audit resulting in this independent auditor’s report is Mr. Rameshwar Lal FCCA.
TSD LAL & COCHARTERED ACCOUNTANTS
February 12, 2018
77 Brickdam, Stabroek, Georgetown, Guyana.
AuditOR’S RepOrt - cont’d
iNdePeNdent

35
NOTES COMPANY GROUP 2017 2016 2017 2016 G$ 000 G$ 000 G$ 000 G$ 000 Turnover 15,221,765 13,043,233 19,569,018 18,109,126 Cost of sales (9,439,832) (7,645,376) (11,961,927) (10,762,350) Gross profit 5,781,933 5,397,857 7,607,091 7,346,776 Other income 5 1,719,014 470,542 437,840 403,253 Investment properties income 108,394 90,994 11,094 9,759 Selling and distribution expenses (1,822,521) (1,711,831) (2,496,128) (2,497,216) Administration expenses (1,372,084) (1,539,541) (1,737,801) (1,991,388) Profit before interest and taxation 4,414,736 2,708,021 3,822,096 3,271,184 Finance cost (319,176) (419,036) (362,548) (471,971) Share of profit of associate companies 12b(i) - - 91,766 120,898 Profit before taxation 6 4,095,560 2,288,985 3,551,314 2,920,111
Taxation 7 (640,366) (431,680) (951,269) (728,683) Profit for the year 3,455,194 1,857,305 2,600,045 2,191,428 Other Comprehensive Income: Items that will not be reclassified to profit or loss: Remeasurement of defined benefit pension plans 7 168,000 (114,034) 168,000 (114,034)
168,000 (114,034) 168,000 (114,034) Items that may be subsequently reclassified to profit or loss: Exchange difference on consolidation 18(c) - - 175,776 (29,392) Fair value gain/(loss) on investments 18(b) 2,241 (11,205) (30,043) (9,189) 2,241 (11,205) 145,733 (38,581) Other comprehensive income/(loss) for the year 170,241 (125,239) 313,733 (152,615)
Total comprehensive income for the year 3,625,435 1,732,066 2,913,778 2,038,813 Basic earnings per share in dollars 9 4.49 2.41 3.38 2.85
and otHer compreHensive income consolidated statement of profit or loss
FOR THE YEAR ENDED DECEMBER 31, 2017
“The accompanying notes form an integral part of these financial statements”

36
COMPANY Share Capital Other Retained Notes capital reserves reserve earnings Total G$ 000 G$ 000 G$ 000 G$ 000 G$ 000 Balance at January 01, 2016 770,000 489,565 784,790 11,378,812 13,423,167 Changes in equity 2016 Total comprehensive income for the year - - (11,205) 1,743,271 1,732,066 Dividends 8 - - - (477,400) (477,400) Balance at December 31, 2016 770,000 489,565 773,585 12,644,683 14,677,833 Changes in equity 2017 Total comprehensive income for the year - - 2,241 3,623,194 3,625,435 Dividends 8 - - - (515,900) (515,900) Balance at December 31, 2017 770,000 489,565 775,826 15,751,977 17,787,368
changes in equityStatement of
FOR THE YEAR ENDED DECEMBER 31, 2017
“The accompanying notes form an integral part of these financial statements”

37
GROUP Exchange Share Capital Other difference Retained Notes capital reserves reserve reserve earnings Total G$ 000 G$ 000 G$ 000 G$ 000 G$ 000 G$ 000 Balance at January 01, 2016 770,000 450,854 837,571 (196,289) 15,092,062 16,954,198 Changes in equity 2016
Total comprehensive income/(loss) for the year - - (9,189) (29,392) 2,077,394 2,038,813 Dividends 8 - - - - (477,400) (477,400) Balance at December 31, 2016 770,000 450,854 828,382 (225,681) 16,692,056 18,515,611 Changes in equity 2017 Total comprehensive income/(loss) for the year - - (30,043) 175,776 2,768,045 2,913,778 Dividends 8 - - - - (515,900) (515,900) Balance at December 31, 2017 770,000 450,854 798,339 (49,905) 18,944,201 20,913,489
changes in Equityconsolidated statement of
FOR THE YEAR ENDED DECEMBER 31, 2017
“The accompanying notes form an integral part of these financial statements”

38
NOTES COMPANY GROUP 2017 2016 2017 2016 G$ 000 G$ 000 G$ 000 G$ 000ASSETS Non current assets Property, plant and equipment 10 6,995,835 6,937,677 9,826,372 9,688,250 Investment properties 11 2,144,987 2,189,059 195,725 206,600 Investments 12 1,438,448 1,436,207 1,556,501 1,540,207 Retirement benefit asset 13 1,353,844 1,111,303 1,353,844 1,111,303 Total non-current assets 11,933,114 11,674,246 12,932,442 12,546,360 Current assets Inventories 14 10,151,292 10,960,030 11,428,684 12,275,914 Trade and other receivables 15 1,990,754 908,969 2,748,875 1,599,713 Prepayments 75,002 85,879 113,922 105,314 Taxes recoverable 48,850 48,850 156,910 359,942 Cash in hand and at bank 79,776 449,560 1,115,041 1,049,503 Total current assets 12,345,674 12,453,288 15,563,432 15,390,386 TOTAL ASSETS 24,278,788 24,127,534 28,495,874 27,936,746 EQUITY AND LIABILITIES Equity Issued capital 17 770,000 770,000 770,000 770,000 Capital reserves 18 (a) 489,565 489,565 450,854 450,854 Other reserve 18 (b) 775,826 773,585 798,339 828,382 Exchange difference reserve 18 (c) - - (49,905) (225,681) Retained Earnings 15,751,977 12,644,683 18,944,201 16,692,056 TOTAL EQUITY 17,787,368 14,677,833 20,913,489 18,515,611
financial positionconsolidated statement of
AS AT DECEMBER 31, 2017
“The accompanying notes form an integral part of these financial statements”

39
NOTES COMPANY GROUP 2017 2016 2017 2016 G$ 000 G$ 000 G$ 000 G$ 000 Non-current liabilities Loans due after one year 19 1,222,654 1,904,968 1,463,449 2,299,706 Deferred tax 7 1,203,774 1,086,389 1,162,453 1,045,027 Retirement benefit obligation 13 8,777 9,400 8,777 9,400 Total non-current liabilities 2,435,205 3,000,757 2,634,679 3,354,133 Current liabilities Trade and other payables 16 2,200,380 4,064,181 2,421,119 2,892,602 Taxes payable 103,080 240,973 228,329 330,793 Current portion of Interest bearing borrowings 19 682,313 909,455 777,243 1,014,189 Bank overdraft (secured) 19 1,070,442 1,234,335 1,521,015 1,829,418 Total current liabilities 4,056,215 6,448,944 4,947,706 6,067,002 TOTAL LIABILITIES 6,491,420 9,449,701 7,582,385 9,421,135 TOTAL EQUITY AND LIABILITIES 24,278,788 24,127,534 28,495,874 27,936,746 The Board of Directors approved these financial statements for issue on February 12, 2018. …. …………………………. Chairman …....................…………………………. Director
AS AT DECEMBER 31, 2017financial position - cont’dconsolidated statement of
“The accompanying notes form an integral part of these financial statements”
40
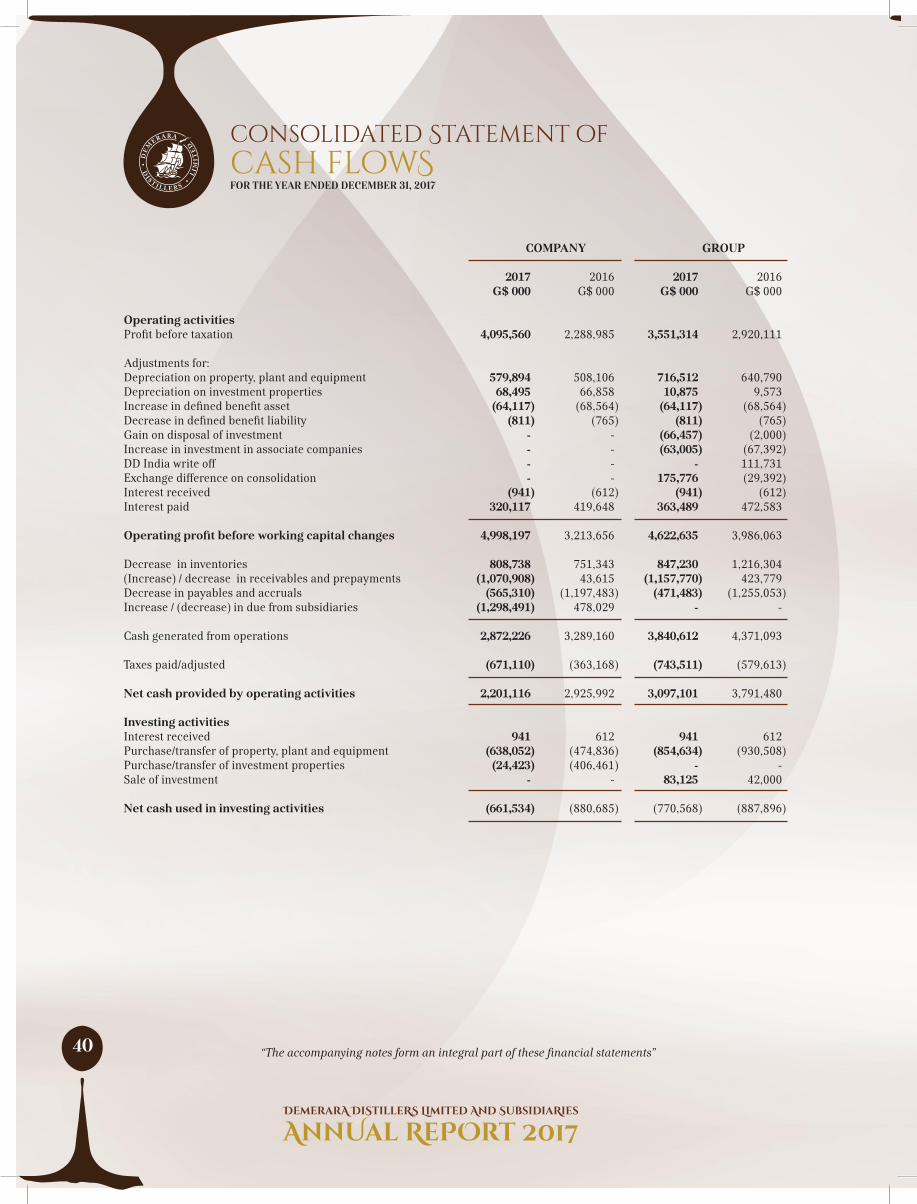
COMPANY GROUP 2017 2016 2017 2016 G$ 000 G$ 000 G$ 000 G$ 000 Operating activities Profit before taxation 4,095,560 2,288,985 3,551,314 2,920,111 Adjustments for: Depreciation on property, plant and equipment 579,894 508,106 716,512 640,790 Depreciation on investment properties 68,495 66,858 10,875 9,573 Increase in defined benefit asset (64,117) (68,564) (64,117) (68,564) Decrease in defined benefit liability (811) (765) (811) (765) Gain on disposal of investment - - (66,457) (2,000) Increase in investment in associate companies - - (63,005) (67,392) DD India write off - - - 111,731 Exchange difference on consolidation - - 175,776 (29,392) Interest received (941) (612) (941) (612) Interest paid 320,117 419,648 363,489 472,583 Operating profit before working capital changes 4,998,197 3,213,656 4,622,635 3,986,063 Decrease in inventories 808,738 751,343 847,230 1,216,304 (Increase) / decrease in receivables and prepayments (1,070,908) 43,615 (1,157,770) 423,779 Decrease in payables and accruals (565,310) (1,197,483) (471,483) (1,255,053) Increase / (decrease) in due from subsidiaries (1,298,491) 478,029 - - Cash generated from operations 2,872,226 3,289,160 3,840,612 4,371,093 Taxes paid/adjusted (671,110) (363,168) (743,511) (579,613) Net cash provided by operating activities 2,201,116 2,925,992 3,097,101 3,791,480 Investing activities Interest received 941 612 941 612 Purchase/transfer of property, plant and equipment (638,052) (474,836) (854,634) (930,508) Purchase/transfer of investment properties (24,423) (406,461) - - Sale of investment - - 83,125 42,000 Net cash used in investing activities (661,534) (880,685) (770,568) (887,896)
cash flowSconsolidated Statement of
FOR THE YEAR ENDED DECEMBER 31, 2017
“The accompanying notes form an integral part of these financial statements”
41
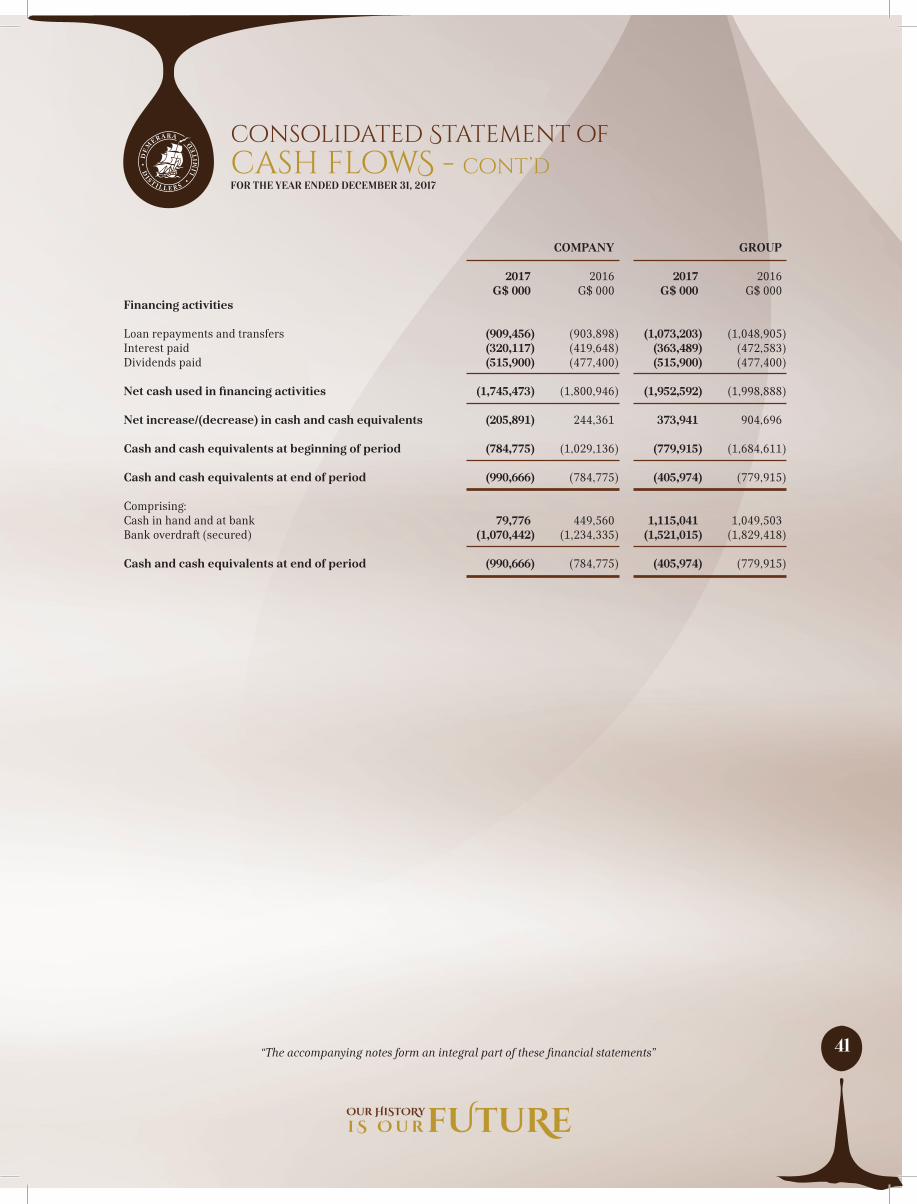
COMPANY GROUP 2017 2016 2017 2016 G$ 000 G$ 000 G$ 000 G$ 000 Financing activities Loan repayments and transfers (909,456) (903,898) (1,073,203) (1,048,905) Interest paid (320,117) (419,648) (363,489) (472,583) Dividends paid (515,900) (477,400) (515,900) (477,400) Net cash used in financing activities (1,745,473) (1,800,946) (1,952,592) (1,998,888) Net increase/(decrease) in cash and cash equivalents (205,891) 244,361 373,941 904,696 Cash and cash equivalents at beginning of period (784,775) (1,029,136) (779,915) (1,684,611) Cash and cash equivalents at end of period (990,666) (784,775) (405,974) (779,915) Comprising: Cash in hand and at bank 79,776 449,560 1,115,041 1,049,503 Bank overdraft (secured) (1,070,442) (1,234,335) (1,521,015) (1,829,418) Cash and cash equivalents at end of period (990,666) (784,775) (405,974) (779,915)
FOR THE YEAR ENDED DECEMBER 31, 2017cash flowS - cont’dconsolidated Statement of
“The accompanying notes form an integral part of these financial statements”

42
financial statementsNOteS tO tHe cOnSOlidated
FOR THE YEAR ENDED DECEMBER 31, 2017
1 Incorporation and activities
Incorporation
The Company was incorporated on November 17, 1952 under the name Guyana Distilleries Limited. In 1983, the Company’s name was changed to Demerara Distillers Limited.
Activities
The principal activities of the company, its subsidiaries and associate companies are as follows:
(a) Manufacturing
The distilling, blending and sale of bulk spirits and alcoholic products, manufacturing and sale of non-alcoholic beverages, Co2 gas and fruit juices.
(b) Trading
Distributors of branded products. (c) Services
Shipping, contracting services, insurance, sales and logistics.
2 New and amended standards and interpretations
Amendments effective for the current year end New and Amended Standards Effective for annual periods beginning on or after
IAS 12 Income taxes 1 January 2017IAS 7 Disclosure initiative 1 January 2017
IAS 12: Income TaxesThe amendments to IAS 12: Income Taxes are to be applied retrospectively and are effective from 1 January 2017 with earlier application permitted. The amendments were issued to clarify recognition of deferred tax assets for unrealized losses related to debt instruments measured at fair value in the financial statements but at cost for tax purposes which can give rise to deductible temporary differences.
The amendments also clarify that:- The carrying amount of an asset does not limit the estimation of probable future profits; and that;- when comparing deductible temporary differences with future taxable profits, the future taxable profits exclude tax
deductions resulting from the reversal of those deductible temporary differences;
IAS 7 Disclosure initiative The amendments to IAS 7 Statement of Cash Flows respond to investors’ requests for improved disclosures about changes in an entity’s liabilities arising from financing activities. The amendments require entities to provide disclosures that enable users of financial statements to evaluate changes in liabilities arising from financial activities, including both changes arising from cashflows and non-cashflows.
NOteS tO tHe

43
financial statementsNOteS tO tHe cOnSOlidated
FOR THE YEAR ENDED DECEMBER 31, 2017
2 New and amended standards and interpretations - cont’d
Pronouncements effective in future period for early adoption
New and Amended StandardsIAS 40 Transfers of investment property 1 January 2018IFRS 2 Share based Payment: Classification and measurement of share based transactions 1 January 2018IFRS 4 Insurance contracts: Applying IFRS 9 ‘’Financial Instrument’’ with ‘’IFRS 4 ‘’Insurance Contracts’’ 1 January 2018IFRS 9 Financial Instruments: Classification andMeasurement 1 January 2018IFRS 9 Additions for Financial Liability Accounting 1 January 2018IFRS 15 Revenue from Contracts With Customers 1 January 2018Annual improvements to IFRS 2014-2016 1 January 2018IFRS 16 Leases 1 January 2019IFRS 17 Insurance contracts 1 January 2021
The Company has not opted for early adoption.
The standards and amendments that are expected to have a material impact on the Company’s accounting policies when adopted are explained below.
IAS 40 Transfers of investment propertyThe amendments to IAS 40 Investment property amend the state that an entity shall transfer a property to or from investment property when and only when there is evidence of a change in use. A change in use occurs if property meets or ceases to meet the definition of investment property. A change in management’s intentions for the use of a property by itself does not constitute evidence of a change in use.
IFRS 2 - Share based paymentThe amendment to IFRS 2-Share Based Payment clarifies the classification and measurement of share-based payment transactions. The amendments are as follows:- (a) Accounting for cash-settled share-based payment transactions that include a performance condition; (b) Classification of share-based payment transactions with net settlement features; (c) Accounting for modifications of share-based payment transactions from cash-settled to equity-settled;
IFRS 4 - Insurance contractsThe amendment to IFRS 4 provides two options for entities that issue insurance contracts within the scope of IFRS 4:(a) an option that permits entities to reclassify, from profit or loss to other comprehensive income, some of the income or
expenses arising from designated financial assets;(b) an optional temporary exemption from applying IFRS 9 for entities whose predominant activity is issuing contracts
within the scope of IFRS 4;
44
financial statementsNOteS tO tHe cOnSOlidated
FOR THE YEAR ENDED DECEMBER 31, 2017
2 New and amended standards and interpretations - cont’d
IFRS 9-Financial instrumentsIFRS 9 is effective for annual periods beginning on or after1 January 2018 with earlier application permitted. Early adoption must apply all of the requirements in IFRS 9 at the same time, except for those relating to:
1. the presentation of fair value gains and losses attributable to changes in the credit risk of financial liabilities designated as at FVTPL, the requirements for which an entity may early apply without applying the other requirements in IFRS 9; and
2. hedge accounting, for which an entity may choose to continue to apply the hedge accounting requirements of IAS 39 instead of the requirements of IFRS 9.
The standard contains specific transitional provisions for: (i) classification and measurement of financial assets; (ii) impairment of financial assets; and (iii) hedge accounting.
IFRS 15: Revenue From Contracts With CustomersThis standard provides amendment to clarify how to:
• Identify the contract with the customer• Determine whether an entity is a principal or an agent• Determine whether the revenue from granting a licence to an entity’s intellectual property should be recognised
at a point in time or over time.
In addition to clarifications, the amendments include two additional reliefs to reduce cost and complexity for an entity when it first applies IFRS 15
IFRS 16: Leases IFRS 16 specifies how an IFRS reporter will recognise, measure, present and disclose leases. The standard provides a single lessee accounting model, requiring lessees to recognise assets and liabilities for all leases unless the lease term is 12 months or less or the underlying asset has a low value. Lessors continue to classify leases as operating or finance, with IFRS 16’s approach to lessor accounting substantially unchanged from its predecessor, IAS 17.
IFRS 17 Insurance liabilitiesIFRS 17 requires insurance liabilities to be measured at a current fulfillment value and provides a more uniform measurement and presentation approach for all insurance contracts. These requirements are designed to achieve the goal of a consistent, principle-based accounting for insurance contracts. IFRS 17 supersedes IFRS 4 Insurance Contracts as of 1 January 2021.
Annual improvements 2014-2016The annual improvements to IFRS Standards 2014-2016 cycle contains three amendments related to three standards. The following shows the topics addressed by these amendments:
Standard Subject of amendmentIFRS1- First time adoption to IFRS Deletion of short-term exemptions for first time adoptersIFRS 12- Disclosure of interest in other entities Clarification of the scope of the StandardIAS 28-Investments in Associates and Joint Ventures Measuring an associate or Joint Venture at fair value

45
financial statementsNOteS tO tHe cOnSOlidated
FOR THE YEAR ENDED DECEMBER 31, 2017
2 New and amended standards and interpretations - cont’d
New and revised interpretations
Available for early adoption Effective for annual periods beginning on or afterIFRIC 22 Foreign Currency Transactions and Advance Consideration 1 January 2018IFRIC 23 Uncertainty over Income Tax treatments 1 January 2019
IFRIC 22 Foreign Currency Transactions and Advance Consideration• There is consideration that is denominated or priced in a foreign currency;• The entity recognizes a prepayment asset or a deferred income liability in respect of that consideration, in
advance of the recognition of the related asset, expense or income; and • The prepayment asset or deferred income liability is non-monetary
The interpretation committee came to the following conclusion:• The date of the transaction, for the purpose of determining the exchange rate, is the date of initial recognition of
the non-monetary prepayment asset or deferred income liability. • If there are multiple payments or receipts in advance, a date of transaction is established for each payment or
receipt.
IFRIC 23 Uncertainty over Income Tax Treatment
The interpretation addresses the determination of taxable profit (tax loss), tax bases, unused tax losses, unused tax credits and tax rates, when there is uncertainty over income tax treatments under IAS 12. It specifically considers:
• Whether tax treatment should be considered collectively;• Assumptions for taxation authorities’ examinations;• The determination of taxable profit (tax loss), tax bases, unused tax losses, unused tax credits and tax rates;• The effect of changes in facts and circumstances.
3 Summary of significant accounting policies
(a) Accounting convention
The financial statements have been prepared under the historical cost convention, as modified by the revaluation of certain investments, property and equipment and conform with International Financial Reporting Standards.
(b) Property, plant and equipment and depreciation
Land and buildings held for use in the production or supply of goods or services, or for administrative purposes are stated in the statement of financial position at cost or revalued amounts. Revalued amounts are taken as the fair value at the date of revaluation determined from market-based evidence by appraisal undertaken by professional valuers.
Any revaluation increase arising on the revaluation of such land and buildings is credited to the revaluation reserve.
Depreciation on revalued assets is charged to the statement of profit or loss and other comprehensive income.
Equipment, fixtures and vehicles are stated at cost less accumulated depreciation and any recognised impairment loss.

46
financial statementsNOteS tO tHe cOnSOlidated
FOR THE YEAR ENDED DECEMBER 31, 2017
3 Summary of significant accounting policies – cont’d
Depreciation is charged so as to write off the cost or valuation of assets, other than land and construction work in progress, over their estimated useful lives using the straight line method as follows: 2017/2016
Buildings - 2.00%Plant and Machinery-Distillery - 6.25%Plant and Machinery-Others - 7.25%Office Equipment - 12.50%Furniture, Fixtures & Fittings - 10.00%Sundry equipment - 20.00%Computer equipment - 20.00%Vehicles - 25.00%
(c) Inventories
Stocks are valued at the lower of cost and net realisable value using the weighted average cost method. Work-in-progress and finished goods cost comprise cost of production and attributable overheads appropriate to the location and condition. Net realisable value is the selling price in the normal course of business less costs of completion and selling expenses.
Bottles/Crates in circulation
These represent returnable bottles and crates amortised over a period of three years.
(d) Foreign Currencies
Transactions in currencies other than Guyana dollars are recorded at the rates of exchange prevailing on the date of the transactions. At each reporting date, monetary assets and liabilities that are denominated in foreign currencies are retranslated at the rates prevailing on the reporting date.
Non monetary assets and liabilities carried at fair value that are denominated in foreign currency are translated at the rates prevailing when the fair value was determined. Gains and losses arising on retranslation are included in the statement of profit or loss and other comprehensive income for the period, except for exchange differences arising on non monetary assets and liabilities where the changes in fair value are recognised in the statement of changes in equity.
For the purpose of presenting consolidated financial statements, the assets and liabilities of the group’s foreign operations are expressed in Guyana dollars using exchange rates prevailing at the reporting date. Income and expense items are translated at the average exchange rates for the period, unless exchange rates fluctuated significantly during that period, in which case the exchange rates at the dates of the transactions are used. Exchange differences arising, if any, are classified as equity and recognised in the group’s exchange difference reserve. Such exchange differences are recognised in the profit or loss in the period in which the foreign operation is disposed of.
(e) Pension Funding
The group participates in two defined benefit pension plans for its employees. The contributions are held in trustee administered funds, which are separate from the company’s resources. The plans cover all permanent employees.
The last actuarial valuation was done as at 31 December 2014 and was used as the basis for information presented in Note 13 in accordance with International Accounting Standards No. 19 – Employee Benefits (Revised).
The valuation was done using the Projected Unit Credit Method, as required by IAS 19 – Employee Benefits (Revised).

47
financial statementsNOteS tO tHe cOnSOlidated
FOR THE YEAR ENDED DECEMBER 31, 2017
3. Summary of significant accounting policies – cont’d
(f) Consolidation
The consolidated financial statements incorporate the financial statements of the company and entities controlled by the company (its subsidiaries). Control is achieved through share ownership. The results of subsidiaries acquired or disposed of during the year are included in the consolidated statement of profit or loss and other comprehensive income from the effective date of acquisition or up to the effective date of disposal, as appropriate. Where necessary, adjustments are made to the financial statements of subsidiaries to bring their accounting policies in line with those used by other members of the group.
All intra-group transactions, income and expenses are eliminated in full on consolidation.
Non controlling interest in the net assets (excluding goodwill) of consolidated subsidiaries is identified separately from the group’s equity therein. Non controlling interest consists of the amount of those interests at the date of the original business combination and non controlling interest’s share of changes in equity since the date of the combination.
Losses applicable to the non controlling interest in the subsidiary’s equity are allocated against the interests of the group except to the extent that the non controlling interest has a binding obligation and is able to make an additional investment to cover the losses.
The consolidated accounts incorporate the accounts as at December 31, 2017 of the following:
Country of % MainName of Company Registration Shareholding Business
Tropical Orchard ProductsCompany Limited Guyana 100.00 ManufacturingDistillers Gas Company Guyana 100.00 DormantDistribution Services Limited Guyana 100.00 DistributionDemerara Distillers (TT) Limited Trinidad 100.00 DormantDemerara Distillers (US) Inc. USA 100.00 DistributionDemerara Distillers (St. Kitts-Nevis) Limited St. Kitts 100.00 Manufacturing & DistributionDemerara Contractors and Engineers Limited Guyana 100.00 Contracting ServicesDemerara Shipping Company Limited Guyana 100.00 ShippingBreitenstein Holdings BV. (i) Netherlands 100.00 DistributionDemerara Rum Company Inc. Canada 100.00 Sales & Logistics
(i) Breitenstein Holdings BV includes the accounts of:
Country of % Main Name of Company Registration Shareholding Business
Demerara Distillers (Europe) BV Netherlands 100 Distribution Breitenstein Trading BV Netherlands 100 Distribution

48
financial statementsNOteS tO tHe cOnSOlidated
FOR THE YEAR ENDED DECEMBER 31, 2017
3 Summary of significant accounting policies – cont’d
(f) Consolidation – cont’d
Associate Companies
The company’s associate companies are National Rums of Jamaica Limited and Diamond Fire and General Insurance Inc. The company owns 33.33% of the share capital of National Rums of Jamaica Limited and 19.5% of the shares of Diamond Fire and General Insurance Inc. Although the group owns 19.5% of the equity shares of Diamond Fire and General Insurance Inc. and it has less than 20% of the voting power in shareholder meetings the group exercises significant influence by virtue of its directorship.
(g) Taxation
Income tax expense represents the sum of the tax currently payable and the deferred tax.
Current tax
The tax currently payable is based on the taxable profit for the year. Taxable profit differs from profit as reported in the consolidated statement of profit or loss and other comprehensive income because of items of income or expenses that are taxable or deductible in other years and it further excludes items that are never taxable or deductible.
The group’s liability for current tax is calculated using tax rates that have been enacted in Guyana or substantively enacted by the end of the reporting period.
Deferred tax
Deferred tax is recognised on differences between the carrying amounts of assets and liabilities in the financial statements and the corresponding tax bases used in the computation of taxable profit and is accounted for using the liability method.
Deferred tax liabilities are generally recognised for all taxable temporary differences and deferred tax assets are recognised to the extent that it is probable that taxable profit will be available against which deductible temporary differences can be utilized.
The carrying amount of the deferred tax assets is reviewed at the end of each reporting period and reduced to the extent that it is no longer probable sufficient taxable profit will be available to allow all or part of the assets to be recovered.
Deferred tax is calculated at the tax rates that are expected to apply in the period when the liability is settled or the asset is realized based on tax rates (and tax laws) that have been enacted or substantively enacted by the end of the reporting period. Deferred tax is charged or credited to the statement of profit or loss and other comprehensive income except when it relates to items charged or credited directly to equity, in which case the deferred tax is also dealt with in equity. The measurement of deferred tax liabilities and assets reflects the tax consequences that would follow from the manner in which the Group expects, at the end of the reporting period, to recover or settle the carrying amounts of its assets and liabilities.
Deferred tax assets and liabilities are offset when there is a legally enforceable right to set off current tax assets against current tax liabilities, and when they relate to income taxes levied by the same taxation authority, and the company intends to settle its current tax assets and liabilities on a net basis.

49
financial statementsNOteS tO tHe cOnSOlidated
FOR THE YEAR ENDED DECEMBER 31, 2017
3 Summary of significant accounting policies – cont’d
(h) Revenue and expense recognition
Revenue is measured at the fair value of the consideration received or receivable and represents amounts receivable for goods and services provided in the normal course of business to third parties, net of discounts, and sales related taxes. Sales of goods are recognised when goods are delivered and title has passed. Interest income is accrued on a time basis, by reference to the principal outstanding and at the effective interest rate applicable. Expenses are recognized on an accrual basis.
(i) Investments properties
Investment properties are properties held to earn rentals and/or for capital appreciation. Investment properties are measured at cost less accumulated depreciation and any recognised impairment loss.
All of the Company’s property interests held under operating leases to earn rentals or for capital appreciation purposes are accounted for as investment properties and are measured using the cost value model.
An investment property is derecognised upon disposal or when the investment property is permanently withdrawn from use and no future economic benefits are expected from the disposal.
Any gain or loss arising on derecognition of the property is included in profit or loss in the period in which the property is derecognised.
Depreciation is charged so as to write off the cost or valuation of assets over their estimated useful lives using the straight line method as follows:
2017/2016
Buildings - 2.00%Plant and Machinery - 7.25%
(j) Financial instruments
Financial assets and liabilities are recognized on the group’s statement of financial position when the group becomes a party to the contractual provisions of the instruments.
Trade and other receivablesTrade and other receivables are measured at amortised cost. Appropriate allowances for estimated unrecoverable amounts are recognized in the statement of profit or loss and other comprehensive income when there is objective evidence that the asset is impaired. The allowance recognized is based on management’s evaluation of the collectability of the receivables.
Trade and other payablesTrade and other payables are measured at amortised cost.
Deposit on empties represents advances from customers for the usage of returnable bottles and crates.
Financial assets and liabilities are recognized on the group’s statement of financial position when the group becomes a party to the contractual provisions of the instruments.
InvestmentsThe group’s investments have been classified as follows:
“Available for sale” investments are initially recognized at cost and adjusted to fair value at subsequent periods.

50
financial statementsNOteS tO tHe cOnSOlidated
FOR THE YEAR ENDED DECEMBER 31, 2017
3 Summary of significant accounting policies – cont’d
(j) Financial instruments - cont’d
Gains or losses on “available for sale financial assets” are recognized through the statement of profit or loss and other comprehensive income until the asset is sold or otherwise disposed, at which time previously recognized gains or losses are transferred to the statement of profit or loss and other comprehensive income for that period.
“Investments held to maturity” are carried at amortised cost. Any gain or loss on these investments is recognized in the statement of profit or loss and other comprehensive income when the asset is de-recognized or impaired.
Investments in subsidiaries and associate companies are carried at cost in the company’s financial statements.
Investment in associate companies in the group is stated using the equity method.
Cash and cash equivalents
Cash and cash equivalents are held for the purpose of meeting short-term cash commitments rather than investment or other purposes.
These are readily convertible to a known amount of cash, with maturity dates of three (3) months or less.
(k) Capital reserves
This comprises the share premium account and revaluation surplus which arose from the revaluation of land and buildings. These reserves are not distributable.
(l) Other reserve
Fair value adjustments of available-for-sale investments are credited to this account. This reserve is not distributable.
(m) Impairment of tangible assets
At the end of each reporting period, the company reviews the carrying amounts of its tangible assets to determine whether there is any indication that those assets have suffered an impairment loss. If any such indication exists, the recoverable amount of the asset is estimated in order to determine the extent of the impairment loss (if any). Where it is not possible to estimate the recoverable amount of an individual asset, the company estimates the recoverable amount of the cash-generating unit to which the asset belongs.
Recoverable amount is the higher of fair value less costs to sell and value in use. If the recoverable amount of an asset is estimated to be less than its carrying amount, the carrying amount of the asset is reduced to its recoverable amount. An impairment loss is recognised immediately in the profit or loss, unless the relevant asset is carried at a revalued amount, in which case the impairment loss is treated as a revaluation decrease.
(n) Provisions
Provisions are recognised when there is a present obligation (legal or constructive) as a result of a past event, it is probable that the company and group will be required to settle the obligation, and a reliable estimate can be made of the amount of the obligation. The amount recognised as a provision is the best estimate of the consideration required to settle the present obligation at the reporting date, taking into account the risks and uncertainties surrounding the obligation.
De-recognition of Provisions
Provisions are de-recognized when it is no longer probable that an outflow of economic resources will be required to settle the obligation.

51
financial statementsNOteS tO tHe cOnSOlidated
FOR THE YEAR ENDED DECEMBER 31, 2017
3 Summary of significant accounting policies – cont’d
(o) Dividends
Dividends that are proposed and declared are recorded as an appropriation of retained earnings in the statement of changes in equity in the period in which they have been approved. Dividends that are proposed and declared after the reporting date are disclosed as a note to the financial statements.
(p) Segment reporting
A business segment is a component of an entity that is engaged in providing products or services that are subject to risks and returns that are different from those of other business segments.
A geographical segment is a group of assets and operations engaged in providing similar products and service that are subject to risks and returns that are different from those of other business segments. The company analyses its operations by both business and geographic segments. The primary format is business reflecting manufacturing, trading and services, its secondary format is that of geographic segments reflecting the primary economic environment in which the company has exposure.
(q) Borrowing Costs
Borrowing costs are interest and other costs that an entity incurs in connection with the borrowing of funds – IAS 23 – Borrowing Costs. Borrowing costs that are directly attributable to the acquisition and construction of qualifying assets are capitalized during the period. The amounts capitalized during the year was nil (2016: $1,670,923) for interest charges. Borrowing costs were computed using the effective interest method in accordance with IAS 39 – Financial Instruments: Recognition and measurement.
4 Critical accounting judgments and key sources of estimation uncertainty
In the application of the company’s and group’s accounting policies, which are described in note 3, the directors are required to make judgments, estimates and assumptions about the carrying amounts of assets and liabilities that are not readily apparent from other sources. The estimates and associated assumptions are based on historical experience and other factors that are considered to be relevant. Actual results may differ from these estimates.
The estimates and underlying assumptions are reviewed on an ongoing basis. Revisions to accounting estimates are recognised in the period in which the estimate is revised if the revision affects only that period, or in the period of the revision and future periods if the revision affects both current and future periods.
Key sources of estimation uncertainty The following are the key assumptions concerning the future, and other key sources of estimation uncertainty at the reporting date, that have a significant risk of causing a material adjustment to the carrying amounts of assets and liabilities in the financial statements:
(i) Other financial assetsIn determining the fair value of investments and other financial assets in the absence of a market, the directors estimate the likelihood of impairment by using discounted cash flows.
(ii) Property, plant and equipment and investment properties Management reviews the estimated useful lives of property, plant and equipment and investment properties at the
end of each year to determine whether their useful lives should remain the same and the assets not impaired.
(iii) Impairment of financial assets Management makes judgment at each reporting date to determine whether financial assets are impaired. Financial
assets are impaired when the carrying value is greater than the recoverable amount and there is objective evidence of impairment. The recoverable amount is the present value of the future cash flows.

52
financial statementsNOteS tO tHe cOnSOlidated
FOR THE YEAR ENDED DECEMBER 31, 2017
4 Critical accounting judgments and key sources of estimation uncertainty - cont’d
(iv) Retirement benefit asset/obligationThe provisions for defined benefit asset/obligation are determined by the actuary based on data provided by management. The computation of the provisions by the actuary assumes that the data provided is not materially misstated.
5 Other income COMPANY GROUP 2017 2016 2017 2016 G$ 000 G$ 000 G$ 000 G$ 000
Investment income (a) 1,440,507 176,798 40,507 26,798 Rent and Miscellaneous income 275,338 293,744 394,164 376,455 Sale of asset 3,169 - 3,169 -
1,719,014 470,542 437,840 403,253
(a) This represents dividends received from available for sale investments of G$22.410M (2016 - G$22.410M) and G$1.418B (2016 - G$164.388M ) from subsidiaries and associate companies. Investment income consists of G$22.410M (2016 - G$22.410M) from quoted investments and G$1.418B (2016 - G$154.388M) from unquoted investments.
6 Profit before taxation COMPANY GROUP
2017 2016 2017 2016
G$ 000 G$ 000 G$ 000 G$ 000
Profit before taxation 4,095,560 2,288,985 3,551,314 2,920,111
After charging: Property Tax 185,018 169,860 193,958 169,860 Interest and other finance charges 320,117 419,648 363,489 472,583Depreciation on property, plant and equipment 579,894 508,106 716,512 640,790 Investment properties expense 68,495 66,858 10,875 9,573Exchange difference (17,777) 128,154 (31,345) 112,370 Directors’ emoluments (a) 11,680 10,800 11,680 10,800 Staff costs:
Salaries and wages 1,686,430 1,495,510 2,098,008 1,977,298 Other staff costs 448,367 379,483 588,269 540,169 Pension 115,668 72,924 147,945 120,035
Auditors’ remuneration 8,907 8,800 26,615 29,884 Inventory provision 69,918 68,112 87,670 69,473
Provision for bad debts 12,779 619 11,538 (6,092)
And after creditingDividends from Subsidiaries and associate companies 1,418,097 154,388 18,097 4,388Interest 941 612 941 612
(a) At the end of the period there were six (2016 - six) non-executive Directors who received equal emoluments.

53
financial statementsNOteS tO tHe cOnSOlidated
FOR THE YEAR ENDED DECEMBER 31, 2017
7 Taxation
Reconciliation of tax expense and COMPANY GROUP accounting profit 2017 2016 2017 2016
G$ 000 G$ 000 G$ 000 G$ 000
Accounting profit 4,095,560 2,288,985 3,551,314 2,920,111
Corporation tax at 27.5% / 40% (30% / 40% 2016) 1,126,279 686,696 1,431,644 1,022,039 Add: Tax effect of expenses not deductible in determining taxable profits: Depreciation for accounting purposes 178,307 172,489 200,031 168,010 Property tax 50,880 50,958 56,377 64,447 Adjustment for tax rate change 6,747 - 6,747 - Others 224 53,801 224 53,801
1,362,437 963,944 1,695,023 1,308,297 Deduct: Tax effect of depreciation, dividends and other allowances for tax purposes 561,865 298,871 583,589 335,378 Export allowance 267,355 158,183 267,355 158,183
Corporation tax charge 533,217 506,890 844,079 814,736 Deferred tax 107,149 (75,210) 107,190 (86,053)
640,366 431,680 951,269 728,683
Taxation - current 533,217 506,890 815,318 761,230 associate companies - - 28,761 53,506 533,217 506,890 844,079 814,736 deferred 107,149 (75,210) 107,190 (86,053)
640,366 431,680 951,269 728,683
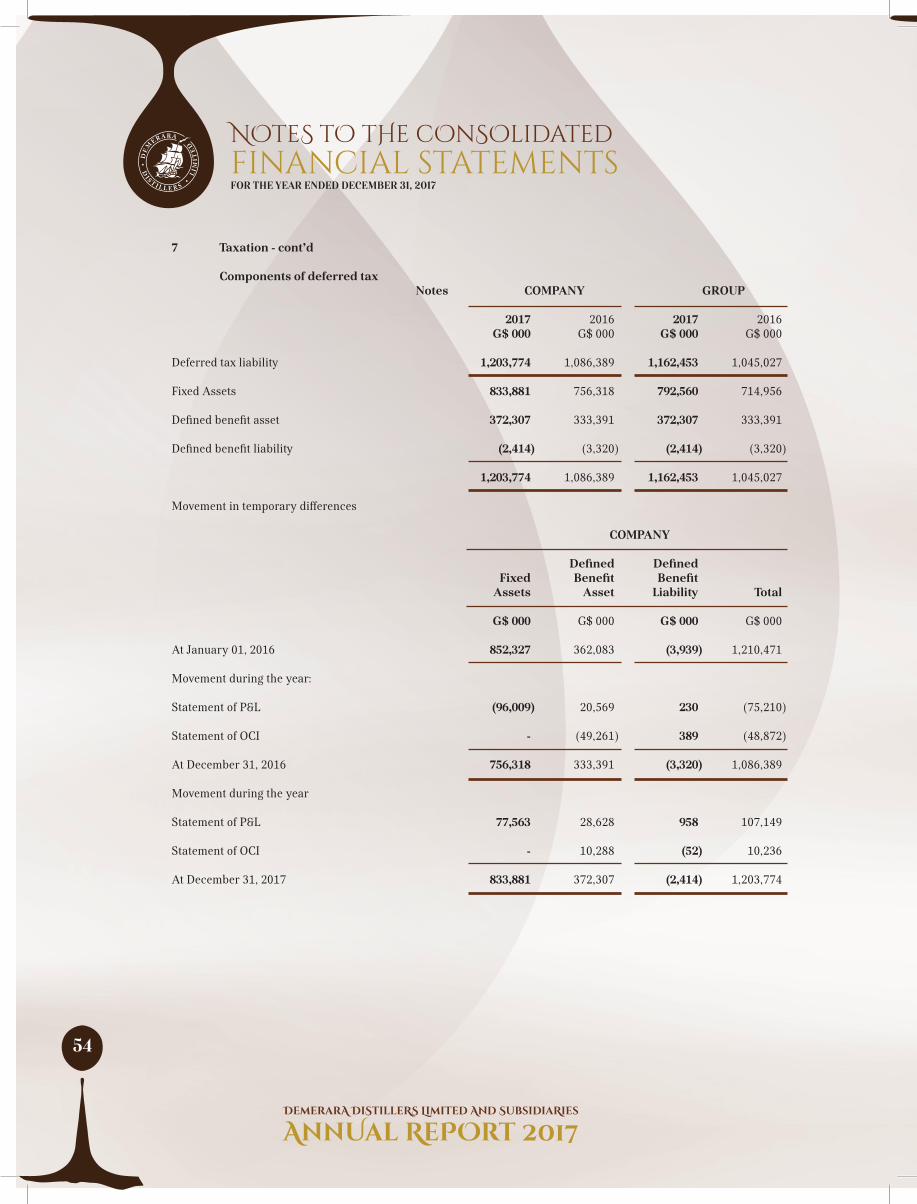
54
financial statementsNOteS tO tHe cOnSOlidated
FOR THE YEAR ENDED DECEMBER 31, 2017
7 Taxation - cont’d Components of deferred tax Notes COMPANY GROUP 2017 2016 2017 2016 G$ 000 G$ 000 G$ 000 G$ 000 Deferred tax liability 1,203,774 1,086,389 1,162,453 1,045,027 Fixed Assets 833,881 756,318 792,560 714,956 Defined benefit asset 372,307 333,391 372,307 333,391 Defined benefit liability (2,414) (3,320) (2,414) (3,320) 1,203,774 1,086,389 1,162,453 1,045,027 Movement in temporary differences COMPANY Defined Defined Fixed Benefit Benefit Assets Asset Liability Total G$ 000 G$ 000 G$ 000 G$ 000 At January 01, 2016 852,327 362,083 (3,939) 1,210,471 Movement during the year: Statement of P&L (96,009) 20,569 230 (75,210) Statement of OCI - (49,261) 389 (48,872) At December 31, 2016 756,318 333,391 (3,320) 1,086,389 Movement during the year Statement of P&L 77,563 28,628 958 107,149 Statement of OCI - 10,288 (52) 10,236 At December 31, 2017 833,881 372,307 (2,414) 1,203,774

55
financial statementsNOteS tO tHe cOnSOlidated
FOR THE YEAR ENDED DECEMBER 31, 2017
7 Taxation - cont’d GROUP Defined Defined Fixed Benefit Benefit Assets Asset Liability Total G$ 000 G$ 000 G$ 000 G$ 000 At January 01, 2016 821,808 362,083 (3,939) 1,179,952 Movement during the year Statement of P&L (106,852) 20,569 230 (86,053) Statement of OCI - (49,261) 389 (48,872) At December 31, 2016 714,956 333,391 (3,320) 1,045,027 Movement during the year Statement of P&L 77,604 28,628 958 107,190 Statement of OCI - 10,288 (52) 10,236 At December 31, 2017 792,560 372,307 (2,414) 1,162,453

56
financial statementsNOteS tO tHe cOnSOlidated
FOR THE YEAR ENDED DECEMBER 31, 2017
7 Taxation - cont’d Tax effect of IAS 19 actuarial valuation:
COMPANY
2017 2016 Before tax Tax Net of tax Before tax Tax Net of tax amount benefit amount amount (expense) amount G$000 G$000 G$000 G$000 G$000 G$000 Remeasurement of defined benefit pension plan 178,236 (10,236) 168,000 (162,906) 48,872 (114,034) Gain/(Loss) arising on revaluation of available for sale financial assets 2,241 - 2,241 (11,205) - (11,205) 180,477 (10,236) 170,241 (174,111) 48,872 (125,239) GROUP 2017 2016 Before tax Tax Net of tax Before tax Tax Net of tax amount benefit amount amount (expense) amount G$000 G$000 G$000 G$000 G$000 G$000 Remeasurement of defined benefit pension plan 178,236 (10,236) 168,000 (162,906) 48,872 (114,034) Exchange differences on translating foreign operations 175,776 - 175,776 (29,392) - (29,392) Loss arising on revaluation of available for sale financial assets (30,043) - (30,043) (9,189) - (9,189) 323,969 (10,236) 313,733 (201,487) 48,872 (152,615)

57
financial statementsNOteS tO tHe cOnSOlidated
FOR THE YEAR ENDED DECEMBER 31, 2017
8 Dividends COMPANY AND GROUP
2017 2016 G$ 000 G$ 000 Amount recognised as distributions to equity holders in the period: Interim dividend for the year ended December 31, 2017 G$0.20 (G$0.16 2016) 154,000 123,200 Final dividend for the year ended December 31, 2016 G$0.47 (G$0.46 2015) 361,900 354,200 515,900 477,400 The Directors recommended a final dividend of G$0.60 per share (2016 - G$0.47).
9 Basic earnings per share COMPANY GROUP 2017 2016 2017 2016 G$ 000 G$ 000 G$ 000 G$ 000 Calculated as follows:- Profit for the year 3,455,194 1,857,305 2,600,045 2,191,428 Ordinary shares issued and fully paid 770,000,000 770,000,000 770,000,000 770,000,000 Basic earnings per share in dollars 4.49 2.41 3.38 2.85

58
financial statementsNOteS tO tHe cOnSOlidated
FOR THE YEAR ENDED DECEMBER 31, 2017
10 Property, plant and equipment COMPANY Construction Land and work-in - 2017 2016 buildings Equipment progress Total Total G$ 000 G$ 000 G$ 000 G$ 000 G$ 000 Cost/valuation At January 01 2,963,306 10,162,084 413,968 13,539,358 13,114,637 Additions 25,350 218,364 406,074 649,788 424,721 Disposals (4,463) - - (4,463) - Intergroup transfers - (7,273) - (7,273) - Transfers 475,635 (475,635) - -
At December 31 2,984,193 10,848,810 344,407 14,177,410 13,539,358
Comprising: Valuation 6,662 68 - 6,730 6,730 Cost 2,977,531 10,848,742 344,407 14,170,680 13,532,628 2,984,193 10,848,810 344,407 14,177,410 13,539,358 Accumulated depreciation
At January 01 698,644 5,903,037 - 6,601,681 6,093,842 Charge for the year 52,463 527,431 - 579,894 507,839 At December 31 751,107 6,430,468 - 7,181,575 6,601,681
Net book values: At December 31, 2017 2,233,086 4,418,342 344,407 6,995,835 At December 31, 2016 2,264,662 4,259,047 413,968 - 6,937,677

59
financial statementsNOteS tO tHe cOnSOlidated
FOR THE YEAR ENDED DECEMBER 31, 2017
10 Property, plant and equipment cont’d GROUP Construction Land and work-in - 2017 2016 buildings Equipment progress Total Total
G$ 000 G$ 000 G$ 000 G$ 000 G$ 000 Cost/valuation At January 01 5,786,025 11,920,911 413,968 18,120,904 17,190,396 Additions 49,773 403,250 406,074 859,097 931,181 Disposals (4,463) - - (4,463) (673) Transfers - 475,635 (475,635) - - At December 31 5,831,335 12,799,796 344,407 18,975,538 18,120,904
Comprising: Valuation 6,662 68 - 6,730 6,730 Cost 5,824,673 12,799,728 344,407 18,968,808 18,114,174
5,831,335 12,799,796 344,407 18,975,538 18,120,904 Accumulated depreciation
At January 01 1,277,775 7,154,879 - 8,432,654 7,791,864 Charge for the year 91,547 624,965 - 716,512 640,790
At December 31 1,369,322 7,779,844 - 9,149,166 8,432,654
Net book values: At December 31, 2017 4,462,013 5,019,952 344,407 9,826,372
At December 31, 2016 4,508,250 4,766,032 413,968 - 9,688,250
Certain freehold land and buildings were revalued on December 09, 1974 while others were revalued at December 31, 1977 based on professional advice. The surplus arising from the revaluations was credited to capital reserves.
Because of the number of years since the revaluation was done and the small revaluation surplus, the net book value of the land and buildings if no revaluation was done, approximated to the values stated in the Financial Statements. Some of these assets are held as securities for loans drawndown and overdraft. Refer to note 19.

60
financial statementsNOteS tO tHe cOnSOlidated
FOR THE YEAR ENDED DECEMBER 31, 2017
11 Investment properties COMPANY Land and 2017 2016 buildings Equipment Total Total G$ 000 G$ 000 G$ 000 G$ 000 Cost/valuation At January 01 2,305,103 575,090 2,880,193 2,423,617 Additions 24,423 - 24,423 456,576 At December 31 2,329,526 575,090 2,904,616 2,880,193 Comprising:
Cost 2,329,526 575,090 2,904,616 2,880,193 2,329,526 575,090 2,904,616 2,880,193 Accumulated depreciation At January 01 314,965 376,169 691,134 624,009Charge for the year 32,552 35,943 68,495 67,125 At December 31 347,517 412,112 759,629 691,134 Net book values: At December 31, 2017 1,982,009 162,978 2,144,987 - At December 31, 2016 1,990,138 198,921 - 2,189,059 The investment properties are rented to subsidiary companies. GROUP Land and 2017 2016 buildings Total Total G$ 000 G$ 000 G$ 000 Cost At January 01 and December 31 357,844 357,844 357,844 Accumulated depreciation At January 01 151,244 151,244 141,671 Charge for the year 10,875 10,875 9,573 At December 31 162,119 162,119 151,244 Net book values: At December 31, 2017 195,725 195,725 - At December 31, 2016 206,600 - 206,600 The investment properties are rented to third parties. Demerara Distillers Limited has granted a guarantee to Breitenstein Trading BV for the investment properties amounting to G$169M (2016 G$169M)

61
financial statementsNOteS tO tHe cOnSOlidated
FOR THE YEAR ENDED DECEMBER 31, 2017
12 Investments COMPANY GROUP Fair Value Fair Value 2017 2016 2017 2016 G$ 000 G$ 000 G$ 000 G$ 000 Available for Sale 855,546 853,305 850,546 897,257 Provision for Impairment (57,750) (57,750) (57,750) (57,750) 797,796 795,555 792,796 839,507 Others: Subsidiary companies (a) 181,453 181,453 - - Associate companies (b) 459,199 459,199 763,705 700,700 640,652 640,652 763,705 700,700 1,438,448 1,436,207 1,556,501 1,540,207
COMPANY 2017 2016 G$ 000 G$ 000 (a) Subsidiary companies at cost
At January 01 and December 31 181,453 181,453
At December 31 181,453 181,453

62
financial statementsNOteS tO tHe cOnSOlidated
FOR THE YEAR ENDED DECEMBER 31, 2017
12 Investments - cont’d
COMPANY GROUP (b) Associate companies 2017 2016 2017 2016
G$ 000 G$ 000 G$ 000 G$ 000
At January 01 459,199 459,199 700,700 633,308
Share of reserves of associate companies (i) - - 63,005 67,392
At December 31 459,199 459,199 763,705 700,700
GROUP
(i) Share of reserves of associate companies 2017 2016 G$ 000 G$ 000 At January 01 700,700 633,308 Group’s share of associate companies profits/reserves 91,766 120,898 Group’s share of associate companies taxes (28,761) (53,506)
At December 31 763,705 700,700
The financial statement of Diamond Fire and General Insurance Inc. in summary form at December 31 (the financial reporting date) and National Rums of Jamaica Limited in summary form at September 30 (the financial reporting date) are presented below: Diamond Fire & General National Rums Insurance Inc. of Jamaica Ltd. Income statement 2017 2016 2017 2016 G$ 000 G$ 000 G$ 000 G$ 000 Revenue 380,009 373,224 2,721,804 3,416,365 Profit after taxation 86,649 72,453 176,407 198,534 Statement of Financial Position
Total assets 1,382,867 1,772,340 3,130,847 3,116,175
Shareholders funds 1,221,367 1,047,681 2,319,366 2,031,211 Long term liabilities 14,352 14,352 291,806 373,921
Current liabilities 147,148 710,307 519,675 711,043 Total equity and liabilities 1,382,867 1,772,340 3,130,847 3,116,175

63
financial statementsNOteS tO tHe cOnSOlidated
FOR THE YEAR ENDED DECEMBER 31, 2017
13 Defined benefit (asset)/liability - company and group
The most recent actuarial valuation of the plan assets and the present value of the defined benefit obligation was carried out as at December 31, 2014 by Bacon Woodrow & De Souza. The present value of the defined benefit obligation and the related current service cost to comply with IAS 19 were measured by the actuaries as at December 31, 2017 using the Projected Unit Credit Method.
PENSION PLAN 1 2017 2016 G$ 000 G$ 000Amounts recognised in the statement of financial position Present value of obligations 3,899,624 3,330,466 Fair value of plan assets (5,253,468) (4,441,769) (1,353,844) (1,111,303) Net defined benefit asset (1,353,844) (1,111,303) Reconciliation of amounts recognised In the balance sheet Opening defined benefit asset (1,111,303) (1,206,942) Net pension cost 102,991 92,369 Re-measurements recognised in Other Comprehensive Income (178,424) 164,203 Contributions paid (167,108) (160,933) Closing defined benefit asset (1,353,844) (1,111,303)

64
financial statementsNOteS tO tHe cOnSOlidated
FOR THE YEAR ENDED DECEMBER 31, 2017
13 Defined benefit (asset)/liability - company and group - cont’d
PENSION PLAN 1 2017 2016 Amounts recognised in the statement of profit or loss G$ 000 G$ 000 and other comprehensive income Current service cost 164,200 158,152 Net interest on defined benefit (asset)/obligation (61,209) (65,783) Net pension cost included in administrative expenses 102,991 92,369 Actual return on plan (assets)/liability 748,563 151,275 Unfunded ex-gratia arrangement Defined benefit obligation 8,777 9,400 8,777 9,400
Reconciliation of opening and closing retirement benefit obligation in the statement of financial position
Opening defined benefit liability 9,400 11,462 Plus net pension cost 439 541 Less: company contributions paid (1,250) (1,306) Re-measurements recognised in Other Comprehensive Income 188 (1,297) Closing defined benefit liability 8,777 9,400 Interest on defined benefit obligation 439 541

65
financial statementsNOteS tO tHe cOnSOlidated
FOR THE YEAR ENDED DECEMBER 31, 2017
13 Defined benefit (asset)/liability - company and group - cont’d
PENSION PLAN 1 2017 2016 2015 2014 Restated 2013 G$ 000 G$ 000 G$ 000 G$ 000 G$ 000 Experience history Defined benefit obligation 3,899,624 3,330,466 2,989,140 2,708,541 2,105,684 Fair value of plan assets (5,253,468) (4,441,769) (4,196,082) (3,993,426) (3,488,866) Surplus (1,353,844) (1,111,303) (1,206,942) (1,284,885) (1,383,182) PENSION PLAN 2 2017 2016 2015 2014 2013 G$ 000 G$ 000 G$ 000 G$ 000 G$ 000 Experience history Defined benefit obligation - - - - 382,001 Fair value of plan assets - - - - (332,458) Deficit - - - - 49,543 Unfunded Ex Gratia 2017 2016 2015 G$ 000 G$ 000 G$ 000 Experience History Defined benefit obligation 8,777 9,400 11,462 Deficit 8,777 9,400 11,462 Experience adjustment on plan liabilities 188 (1,297) (698)

66
financial statementsNOteS tO tHe cOnSOlidated
FOR THE YEAR ENDED DECEMBER 31, 2017
13 Defined benefit (asset)/liability - company and group (cont’d) Pension Plan 1 Pension Plan 2 Unfunded Ex Gratia 2017 2016 2017 2016 2017 2016 G$000 G$000 G$000 G$000 G$000 G$000 Summary of main assumptions % % % % % % Discount rate 5.0 5.0 - - - 5.0 Salary increases 5.0 5.0 - - - - Pension increases 2.0 2.0 - - - 2.0 2017 2016 G$ 000 G$ 000 Retirement benefit obligations Unfunded exgratia 8,777 9,400 8,777 9,400 Retirement benefit asset Pension plan 1 1,353,844 1,111,303

67
financial statementsNOteS tO tHe cOnSOlidated
FOR THE YEAR ENDED DECEMBER 31, 2017
14 Inventories COMPANY GROUP
2017 2016 2017 2016 G$ 000 G$ 000 G$ 000 G$ 000 Finished stocks (a) 7,073,075 7,742,388 8,080,551 8,662,782 Raw materials, containers & goods-in-transit 2,535,017 2,851,992 2,634,458 2,967,611 Spares 630,498 601,392 811,360 888,186 Provision for stock impairment (b) (87,298) (235,742) (97,685) (242,665)
10,151,292 10,960,030 11,428,684 12,275,914 Cost of inventory recognised asexpense during the period 4,747,275 4,588,924 5,010,511 5,027,163 Inventories expected to be recovered after more than twelve months 4,993,753 5,688,394 4,993,753 5,688,394 Raw material damaged written off 71,958 59,994 75,154 88,210 (a) Finished goods include maturing rums that are available for sale during various points of the ageing process. (b) Provision for impairment COMPANY GROUP 2017 2016 2017 2016 G$ 000 G$ 000 G$ 000 G$ 000 Balance as at January 01 (235,742) (167,630) (242,665) (173,192)
(Increase)/decrease during the year 148,444 (68,112) 144,980 (69,473)
Balance as at December 31 (87,298) (235,742) (97,685) (242,665) Provisions were individually assessed.

68
financial statementsNOteS tO tHe cOnSOlidated
FOR THE YEAR ENDED DECEMBER 31, 2017
15 Trade and other receivables COMPANY GROUP 2017 2016 2017 2016 G$ 000 G$ 000 G$ 000 G$ 000 Trade receivables 1,899,119 795,968 2,496,349 1,400,030 Provision for impairment (a) (13,398) (619) (31,005) (19,467) 1,885,721 795,349 2,465,344 1,380,563 Other receivables 105,033 113,620 283,531 219,150 1,990,754 908,969 2,748,875 1,599,713
(a) Provision for impairment (individually assessed)
Balance as at January 01 619 - 19,467 25,559 Increase/(decrease) during the year 12,779 619 11,538 (6,092)
Balance as at December 31 13,398 619 31,005 19,467
16 Trade and other payables COMPANY GROUP
2017 2016 2017 2016
G$ 000 G$ 000 G$ 000 G$ 000 Trade payables 814,322 459,397 1,066,532 628,855 Accruals 554,736 950,756 628,361 986,944 Other payables 703,844 928,059 726,226 976,803 Consumption and other taxes - 300,000 - 300,000 Due to subsidiary companies 127,478 1,425,969 - - 2,200,380 4,064,181 2,421,119 2,892,602
17 Share capital COMPANY AND GROUP 2017 2016 Authorised No. of ordinary shares 1,000,000,000 1,000,000,000 G$ 000 G$ 000 Issued and fully paid At January 01 and December 31 770,000 770,000 770,000,000 ordinary shares All fully paid ordinary shares with no par value carry equal voting and dividend rights
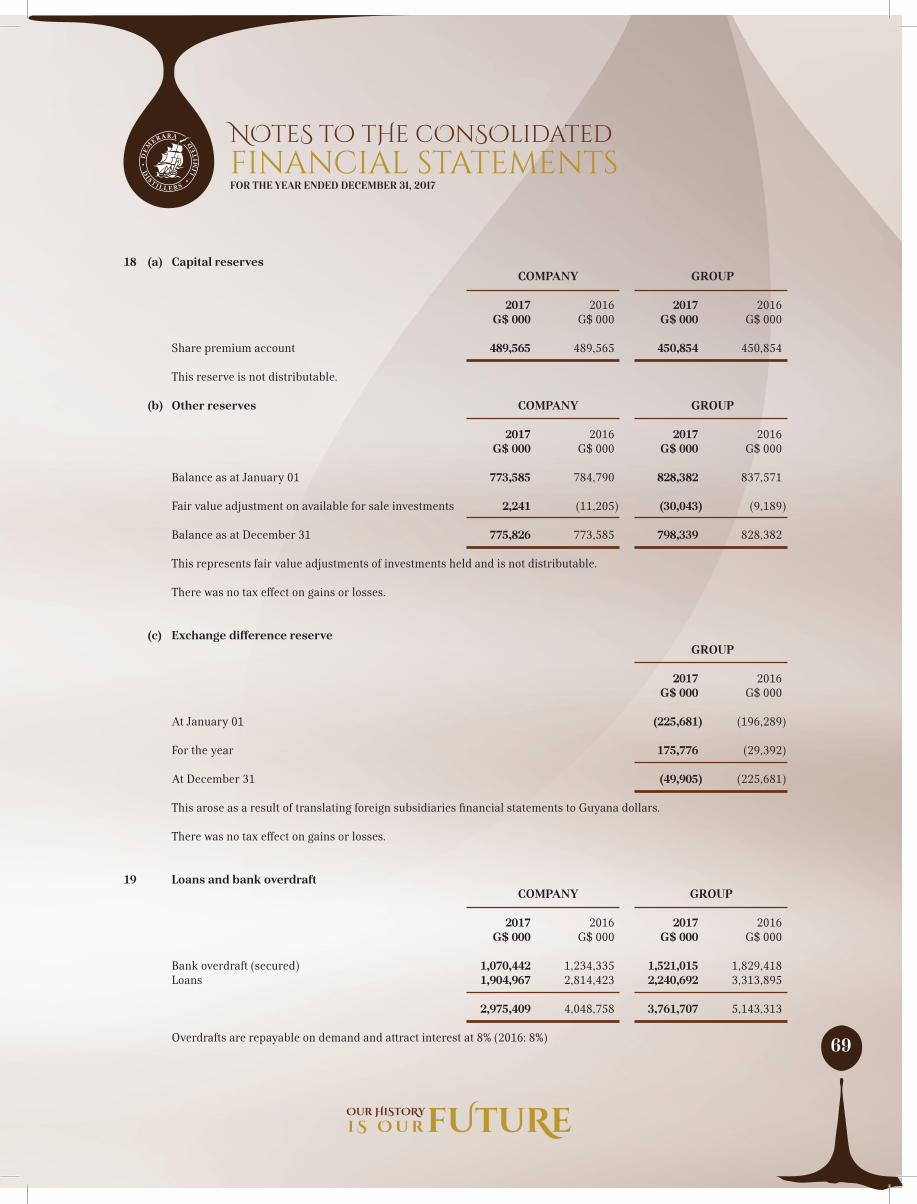
69
financial statementsNOteS tO tHe cOnSOlidated
FOR THE YEAR ENDED DECEMBER 31, 2017
18 (a) Capital reserves COMPANY GROUP 2017 2016 2017 2016 G$ 000 G$ 000 G$ 000 G$ 000
Share premium account 489,565 489,565 450,854 450,854 This reserve is not distributable.
(b) Other reserves COMPANY GROUP
2017 2016 2017 2016 G$ 000 G$ 000 G$ 000 G$ 000 Balance as at January 01 773,585 784,790 828,382 837,571 Fair value adjustment on available for sale investments 2,241 (11,205) (30,043) (9,189)
Balance as at December 31 775,826 773,585 798,339 828,382 This represents fair value adjustments of investments held and is not distributable. There was no tax effect on gains or losses.
(c) Exchange difference reserve
GROUP 2017 2016 G$ 000 G$ 000 At January 01 (225,681) (196,289) For the year 175,776 (29,392) At December 31 (49,905) (225,681) This arose as a result of translating foreign subsidiaries financial statements to Guyana dollars. There was no tax effect on gains or losses.
19 Loans and bank overdraft COMPANY GROUP 2017 2016 2017 2016 G$ 000 G$ 000 G$ 000 G$ 000
Bank overdraft (secured) 1,070,442 1,234,335 1,521,015 1,829,418 Loans 1,904,967 2,814,423 2,240,692 3,313,895 2,975,409 4,048,758 3,761,707 5,143,313 Overdrafts are repayable on demand and attract interest at 8% (2016: 8%)

70
financial statementsNOteS tO tHe cOnSOlidated
FOR THE YEAR ENDED DECEMBER 31, 2017
19 Loans and bank overdraft - cont’d COMPANY GROUP 2017 2016 2017 2016 Loans are repayable as follows: G$ 000 G$ 000 G$ 000 G$ 000 (i) Repayable - 2004 to 2017 - rate of interest 3.25% per annum - - - 65,570
(Breitenstein Holdings BV)
(ii) Repayable - 2009 - 2018 - rate of interest of 3.88% per annum 77,704 388,523 77,704 388,523
(Demerara Distillers Ltd)
(iii) Repayable - 2015 - 2020 - rate of interest of 4.19% per annum 93,244 134,686 93,244 134,686
(Demerara Distillers Ltd)
(iv) Repayable - 2013 - 2020 - rate of interest of 8% per annum 65,360 114,320 65,360 114,320
(Demerara Distillers Ltd)
(v) Repayable - 2014 - 2017 - rate of interest of 8% per annum - - - 9,247
(Demerara Shipping Company Ltd)
(vi) Repayable - 2013 - 2020 - rate of interest of 8% per annum 469,894 565,566 469,894 565,566
(Demerara Distillers Ltd)
(vii) Repayable - 2013 - 2020 - rate of interest of 8% per annum 1,020,000 1,360,000 1,020,000 1,360,000
(Demerara Distillers Ltd)
(viii) Repayable - 2013 - 2020 - rate of interest of 8% per annum 178,765 251,328 178,764 251,328
(Demerara Distillers Ltd)
(ix) Repayable - 2013 - 2020 - rate of interest of 8% per annum - - 227,500 272,500
(Distribution Services Ltd)
(x) Repayable - 2013 - 2020 - rate of interest of 8% per annum - - 108,226 152,155
(Demerara Shipping Company Ltd) 1,904,967 2,814,423 2,240,692 3,313,895
Loan (i) is guaranteed by the Parent Company Demerara Distillers Limited.

71
financial statementsNOteS tO tHe cOnSOlidated
FOR THE YEAR ENDED DECEMBER 31, 2017
19 Loans and bank overdraft - cont’d
Maturity profile of loan COMPANY GROUP 2017 2016 2017 2016 G$ 000 G$ 000 G$ 000 G$ 000 Repayments due in one year and included in current liabilities 682,313 909,455 777,243 1,014,189 Repayments due in the second year 578,523 682,313 681,818 781,415 Repayments due in the third year 644,131 578,523 781,631 681,544 Repayments due in the fourth and fifth year - 644,132 - 836,747
1,222,654 1,904,968 1,463,449 2,299,706 1,904,967 2,814,423 2,240,692 3,313,895
The foregoing loans and overdraft for the company are secured by floating and fixed charges on the assets of the company valued at G$8.142B (2016: G$11.544B). The loans for the group are secured by floating and fixed charges on the assets of the Group valued at G$8.142 B (2016 - G$11.644B).
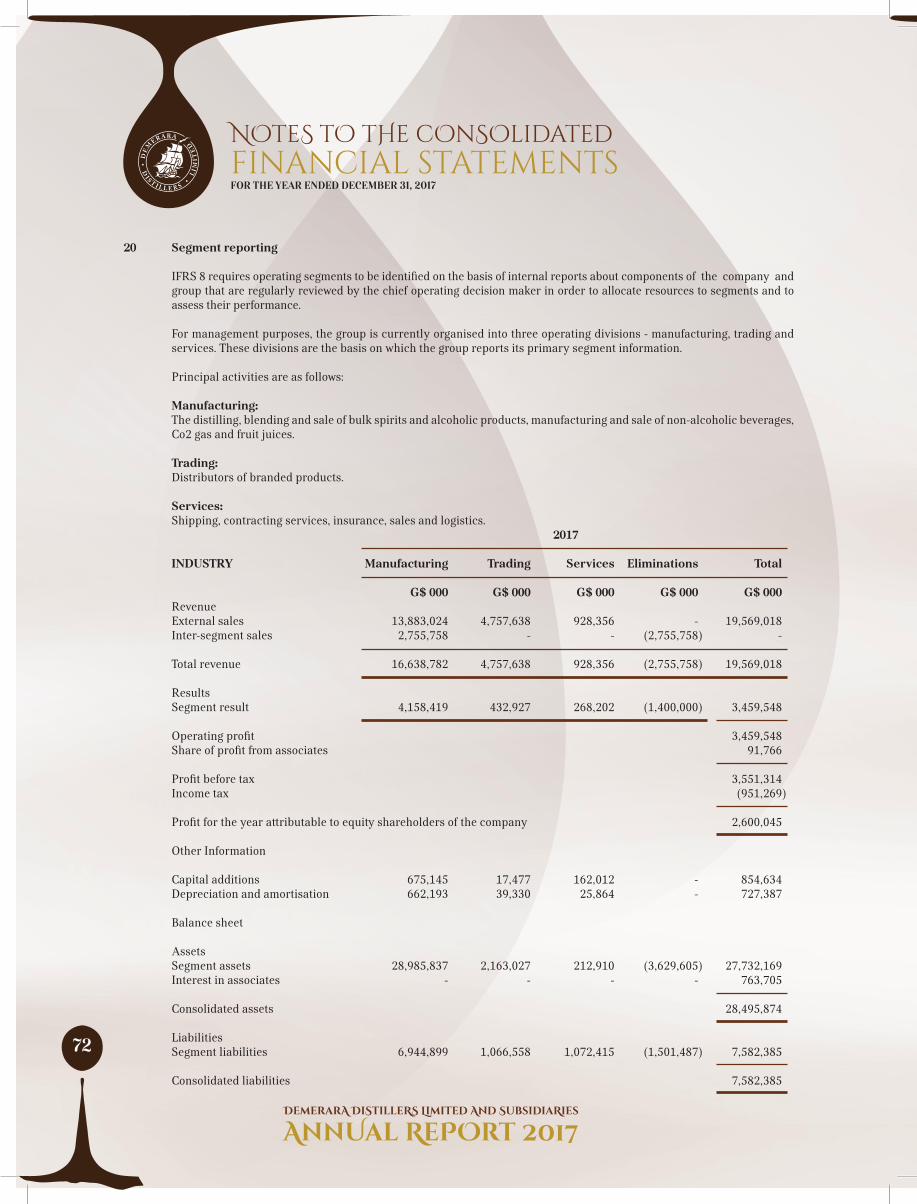
72
financial statementsNOteS tO tHe cOnSOlidated
FOR THE YEAR ENDED DECEMBER 31, 2017
20 Segment reporting IFRS 8 requires operating segments to be identified on the basis of internal reports about components of the company and group that are regularly reviewed by the chief operating decision maker in order to allocate resources to segments and to assess their performance. For management purposes, the group is currently organised into three operating divisions - manufacturing, trading and services. These divisions are the basis on which the group reports its primary segment information. Principal activities are as follows: Manufacturing: The distilling, blending and sale of bulk spirits and alcoholic products, manufacturing and sale of non-alcoholic beverages, Co2 gas and fruit juices. Trading: Distributors of branded products. Services: Shipping, contracting services, insurance, sales and logistics. 2017 INDUSTRY Manufacturing Trading Services Eliminations Total G$ 000 G$ 000 G$ 000 G$ 000 G$ 000 Revenue External sales 13,883,024 4,757,638 928,356 - 19,569,018 Inter-segment sales 2,755,758 - - (2,755,758) - Total revenue 16,638,782 4,757,638 928,356 (2,755,758) 19,569,018 Results Segment result 4,158,419 432,927 268,202 (1,400,000) 3,459,548 Operating profit 3,459,548 Share of profit from associates 91,766 Profit before tax 3,551,314 Income tax (951,269) Profit for the year attributable to equity shareholders of the company 2,600,045 Other Information Capital additions 675,145 17,477 162,012 - 854,634 Depreciation and amortisation 662,193 39,330 25,864 - 727,387 Balance sheet Assets Segment assets 28,985,837 2,163,027 212,910 (3,629,605) 27,732,169 Interest in associates - - - - 763,705 Consolidated assets 28,495,874 Liabilities Segment liabilities 6,944,899 1,066,558 1,072,415 (1,501,487) 7,582,385 Consolidated liabilities 7,582,385

73
financial statementsNOteS tO tHe cOnSOlidated
FOR THE YEAR ENDED DECEMBER 31, 2017
20 Segment reporting - cont’d 2016 INDUSTRY Manufacturing Trading Services Eliminations Total
G$ 000 G$ 000 G$ 000 G$ 000 G$ 000 Revenue External sales 11,623,514 5,652,604 833,008 - 18,109,126 Inter-segment sales 2,950,046 - - (2,950,046) - Total revenue 14,573,560 5,652,604 833,008 (2,950,046) 18,109,126 Results Segment result 2,385,219 399,464 164,530 (150,000) 2,799,213 Operating profit 2,799,213 Share of profit from associates 120,898 Profit before tax 2,920,111 Income tax (728,683) Profit for the year attributable to equity shareholders of the company 2,191,428 Other Information Capital additions 890,435 22,692 17,381 - 930,508 Depreciation and amortisation 588,664 37,419 24,280 - 650,363 Statement of Financial Position Assets Segment assets 27,598,763 2,491,443 176,188 (3,255,952) 27,010,442 Interest in associates - - - - 926,304 Consolidated assets 27,936,746
Liabilities Segment liabilities 9,958,184 829,767 1,350,401 (2,717,217) 9,421,135 Consolidated liabilities 9,421,135

74
financial statementsNOteS tO tHe cOnSOlidated
FOR THE YEAR ENDED DECEMBER 31, 2017
20 Segment reporting - cont’d The Group’s operations are located in Guyana, Europe, United States of America, St. Kitts, Jamaica and Trinidad. Its manufacturing operations are located in Guyana, St. Kitts and Jamaica. Its trading and services operations are located in Guyana, Europe, U.S.A, Canada and Trinidad. The geographical segment is defined by the location of the operation from which the sale is made and does not consider the location of the customer. GEOGRAPHICAL Revenue Profit before tax 2017 2016 2017 2016 G$ 000 G$ 000 G$ 000 G$ 000 Guyana 17,351,115 16,139,194 3,341,389 2,735,460 Europe 1,089,476 972,709 92,707 87,594 North America 1,024,233 890,348 94,174 72,052 St. Kitts 104,194 106,875 23,044 25,005 19,569,018 18,109,126 3,551,314 2,920,111 The following is an analysis of the carrying amount of segment assets, and additions to property, plant and equipment and intangible assets, analysed by the geographical area in which the assets are located. Carrying amount of Additions to property, plant and segment assets equipment & intangible assets 2017 2016 2017 2016 G$ 000 G$ 000 G$ 000 G$ 000 Guyana 28,933,389 25,654,525 847,667 930,658 Europe 1,639,790 1,481,128 - - North America 726,140 634,145 728 - St. Kitts 196,555 166,948 6,239 523 28,495,874 27,936,746 854,634 931,181 The following represents 5% or more of group revenue generated from a single geographical region of an external customer: Revenue Generating Segment (s) Revenue Generating Region Revenue Generated 2017 2016 2017 2016 G$ 000 G$ 000 Guyana and United States North America North America 3,356,887 3,321,441 Guyana, Europe and Caribbean Europe Europe 2,907,409 1,689,470 Guyana and Caribbean Caribbean Caribbean 1,259,670 1,346,432 Guyana Guyana Guyana 11,803,376 11,591,949 Others 241,676 159,834 Total 19,569,018 18,109,126 There was no customer which represented 5% or more of group revenue generated from a single external customer for the current and prior year.

75
financial statementsNOteS tO tHe cOnSOlidated
FOR THE YEAR ENDED DECEMBER 31, 2017
21 Contingent liabilities COMPANY AND GROUP 2017 2016 G$ 000 G$ 000 Bonds in respect of duty on spirits warehoused and exportation of goods 94,393 71,394 Bonds in favour of the State of Guyana 53,100 53,100
22 Capital commitments COMPANY GROUP 2017 2016 2017 2016 G$ 000 G$ 000 G$ 000 G$ 000 Contracted for but not received 75,003 69,674 75,003 69,674 These comprise of acquisition of non current assets.

76
financial statementsNOteS tO tHe cOnSOlidated
FOR THE YEAR ENDED DECEMBER 31, 2017
23 Related party transactions and other disclosures
(a) Related party transactions Parties are considered to be related if one party has the ability to control the other party or exercise significant influence over the other party in making financial or operating decisions. Listed below are transactions and balances with related parties.
(i) Subsidiary companies COMPANY 2017 2016 G$ 000 G$ 000 Sales 2,158,695 2,464,640 Commission paid 5,926 7,578 Purchases 451,136 354,777 Management fees received 139,931 220,743 Rent received 108,394 90,994 Dividends received 1,400,000 150,000 Human resource charges 277,776 346,357 Royalties charged - 375,391 Marketing fees paid 10,819 248,353 Interest paid 75,704 87,643 Balances at end of year (127,478) (1,425,969) Guarantee provided by the parent company on behalf of: Subsidiaries 755,000 755,000 Associate companies COMPANY GROUP 2017 2016 2017 2016 G$ 000 G$ 000 G$ 000 G$ 000 Balances at end of year 763,705 926,304 763,705 926,304 Dividends received 3,510 4,388 3,510 4,388 Insurance premiums paid 41,194 36,780 - -
(ii) Short Term Loans During the year 2017, the company took two short term loans from Demerara Distillers Limited (DDL) Foundation $20M at 4% interest, and Distillers and Associates Co-op Credit Union Limited $45M at 4.5%. Both loans were fully repaid in December 2017.

77
financial statementsNOteS tO tHe cOnSOlidated
FOR THE YEAR ENDED DECEMBER 31, 2017
23 Related party transactions and other disclosures - cont’d
(a) Related party transactions - cont’d
(ii) Key management personnel
Compensation The company’s key management personnel comprise its Directors, its Chief Executive Officer and Managers. The remuneration paid to key management personnel during the year was as follows:
2017 2016 G$ 000 G$ 000
Short-term employee benefits 217,008 229,859 Post-employment benefits 39,193 17,995 Directors emoluments 11,680 10,800 No provision was made for balances receivable from related parties.
(b) Other disclosures
The following are transactions with companies that share directors of the company: COMPANY GROUP 2017 2016 2017 2016 G$ 000 G$ 000 G$ 000 G$ 000 Demerara Bank Limited Overdraft interest (8%) 41,254 50,654 86,595 86,227 Balance at end of the year: Cash 49,122 352,783 353,881 353,680 Overdraft 695,636 757,224 1,205,512 1,350,022 Trust Company (Guyana) Limited also provides registrar and pension management services for the company: Pension management and registrar’s service fees 26,554 22,845 26,554 22,845
24 Pending Litigations
There are several pending litigations against the company and group, the outcome of which cannot be determined at this date.
Also the company has challenged in court an assessment by the Guyana Revenue Authority for corporate tax liability amounting to approximately $450M.

78
financial statementsNOteS tO tHe cOnSOlidated
FOR THE YEAR ENDED DECEMBER 31, 2017
25 (a) Analysis of financial assets and liabilities by measurement basis COMPANY Financial assets and Available for Loans and liabilities at 2017 sale receivables amortised cost Total ASSETS G$000 G$000 G$000 G$000 Investments 797,796 - - 797,796 Trade receivables - 1,885,721 - 1,885,721 Other receivables - 105,033 - 105,033 Prepayments - 75,002 - 75,002 Taxes recoverable - - 48,850 48,850 Cash on hand and at bank - - 79,776 79,776
Total assets 797,796 2,065,756 128,626 2,992,178 LIABILITIES Trade payables - - 814,322 814,322 Other payables and accruals - - 1,258,580 1,258,580 Due to subsidiaries - - 127,478 127,478 Bank overdraft (secured) - - 1,070,442 1,070,442 Taxation - - 103,080 103,080 Loans - - 1,904,967 1,904,967 Total liabilities - - 5,278,869 5,278,869 COMPANY Financial assets and Available for Loans and liabilities at 2016 sale receivables amortised cost Total ASSETS G$000 G$000 G$000 G$000 Investments 795,555 - - 795,555 Trade receivables - 795,349 - 795,349 Other receivables - 113,620 - 113,620 Prepayments - 85,879 - 85,879 Taxes recoverable - - 48,850 48,850 Cash on hand and at bank - - 449,560 449,560
Total assets 795,555 994,848 498,410 2,288,813 LIABILITIES Trade payables - - 459,397 459,397 Other payables and accruals - - 2,178,815 2,178,815 Due to subsidiaries - - 1,425,969 1,425,969 Bank overdraft (secured) - - 1,234,335 1,234,335 Taxation - - 240,973 240,973 Loans - - 2,814,423 2,814,423 Total liabilities - - 8,353,912 8,353,912

79
financial statementsNOteS tO tHe cOnSOlidated
FOR THE YEAR ENDED DECEMBER 31, 2017
25 (a) Analysis of financial assets and liabilities by measurement basis - cont’d
GROUP Financial assets and 2017 Available for Held to Loans and liabilities at sale maturity receivables amortised cost Total ASSETS G$000 G$000 G$000 G$000 G$000 Investments 792,796 - - 792,796 Trade receivables - - 2,465,344 - 2,465,344 Other receivables - - 283,531 - 283,531 Prepayments - - 113,922 - 113,922 Taxes recoverable - - - 156,910 156,910 Cash on hand and at bank - - - 1,115,041 1,115,041 Total assets 792,796 - 2,862,797 1,271,951 4,927,544 LIABILITIES Trade payables - - - 1,066,532 1,066,532 Other payables and accruals - - - 1,354,587 1,354,587 Bank overdraft (secured) - - - 1,521,015 1,521,015 Loans - - - 2,240,692 2,240,692 Taxation - - - 228,329 228,329 Total liabilities - - - 6,411,155 6,411,155
GROUP Financial assets and 2016 Available for Held to Loans and liabilities at sale maturity receivables amortised cost Total ASSETS G$000 G$000 G$000 G$000 G$000
Investments 839,507 - - 839,507 Trade receivables - - 1,380,563 - 1,380,563 Other receivables - - 219,150 - 219,150 Prepayments - - 105,314 - 105,314 Taxes recoverable - - - 359,942 359,942 Cash on hand and at bank - - - 1,049,503 1,049,503 Total assets 839,507 - 1,705,027 1,409,445 3,953,979 LIABILITIES Trade payables - - - 628,855 628,855 Other payables and accruals - - - 2,263,747 2,263,747 Bank overdraft (secured) - - - 1,829,418 1,829,418 Loans - - - 3,313,895 3,313,895 Taxation - - - 330,793 330,793 Total liabilities - - - 8,366,708 8,366,708
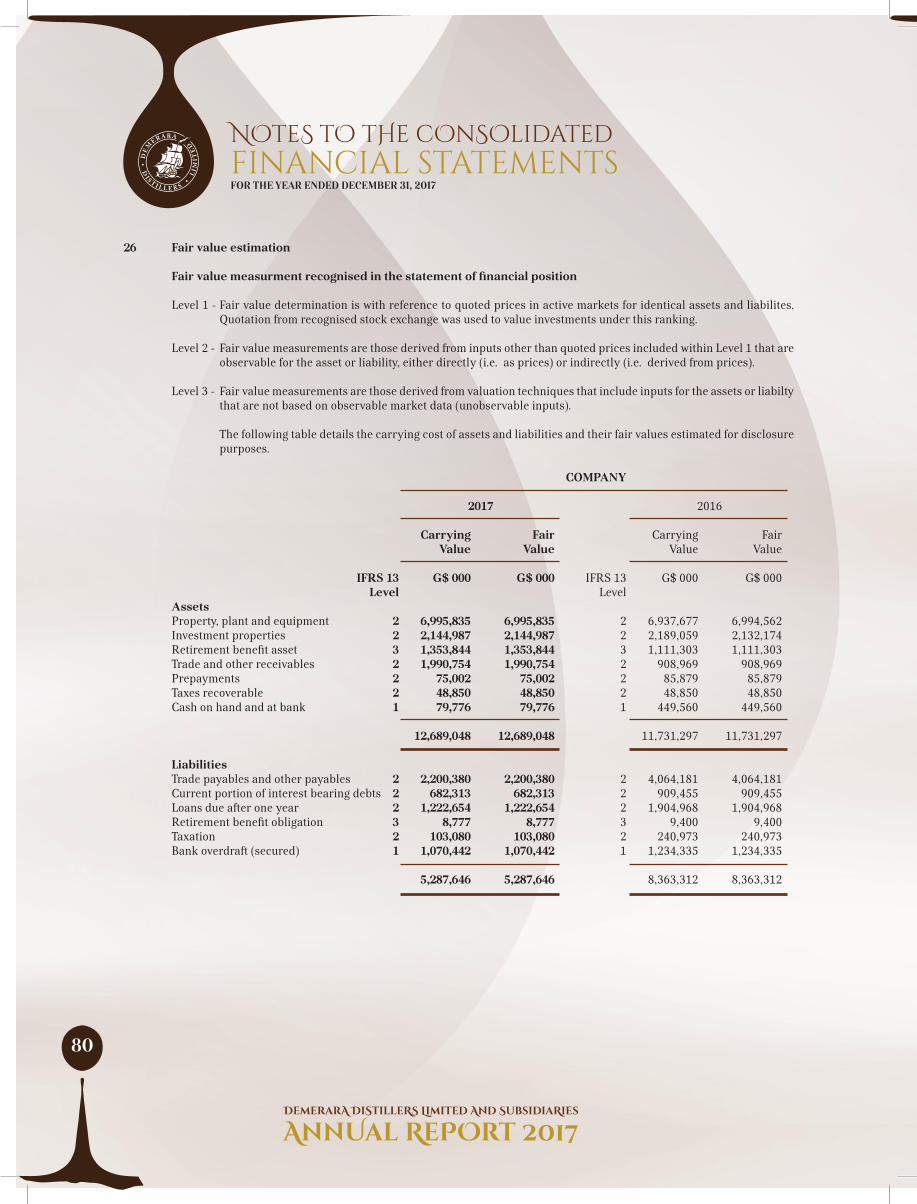
80
financial statementsNOteS tO tHe cOnSOlidated
FOR THE YEAR ENDED DECEMBER 31, 2017
26 Fair value estimation Fair value measurment recognised in the statement of financial position
Level 1 - Fair value determination is with reference to quoted prices in active markets for identical assets and liabilites. Quotation from recognised stock exchange was used to value investments under this ranking.
Level 2 - Fair value measurements are those derived from inputs other than quoted prices included within Level 1 that are observable for the asset or liability, either directly (i.e. as prices) or indirectly (i.e. derived from prices).
Level 3 - Fair value measurements are those derived from valuation techniques that include inputs for the assets or liabilty that are not based on observable market data (unobservable inputs).
The following table details the carrying cost of assets and liabilities and their fair values estimated for disclosure purposes.
COMPANY 2017 2016 Carrying Fair Carrying Fair Value Value Value Value IFRS 13 G$ 000 G$ 000 IFRS 13 G$ 000 G$ 000 Level Level Assets Property, plant and equipment 2 6,995,835 6,995,835 2 6,937,677 6,994,562 Investment properties 2 2,144,987 2,144,987 2 2,189,059 2,132,174 Retirement benefit asset 3 1,353,844 1,353,844 3 1,111,303 1,111,303 Trade and other receivables 2 1,990,754 1,990,754 2 908,969 908,969 Prepayments 2 75,002 75,002 2 85,879 85,879 Taxes recoverable 2 48,850 48,850 2 48,850 48,850 Cash on hand and at bank 1 79,776 79,776 1 449,560 449,560 12,689,048 12,689,048 11,731,297 11,731,297 Liabilities Trade payables and other payables 2 2,200,380 2,200,380 2 4,064,181 4,064,181 Current portion of interest bearing debts 2 682,313 682,313 2 909,455 909,455 Loans due after one year 2 1,222,654 1,222,654 2 1,904,968 1,904,968 Retirement benefit obligation 3 8,777 8,777 3 9,400 9,400 Taxation 2 103,080 103,080 2 240,973 240,973 Bank overdraft (secured) 1 1,070,442 1,070,442 1 1,234,335 1,234,335 5,287,646 5,287,646 8,363,312 8,363,312
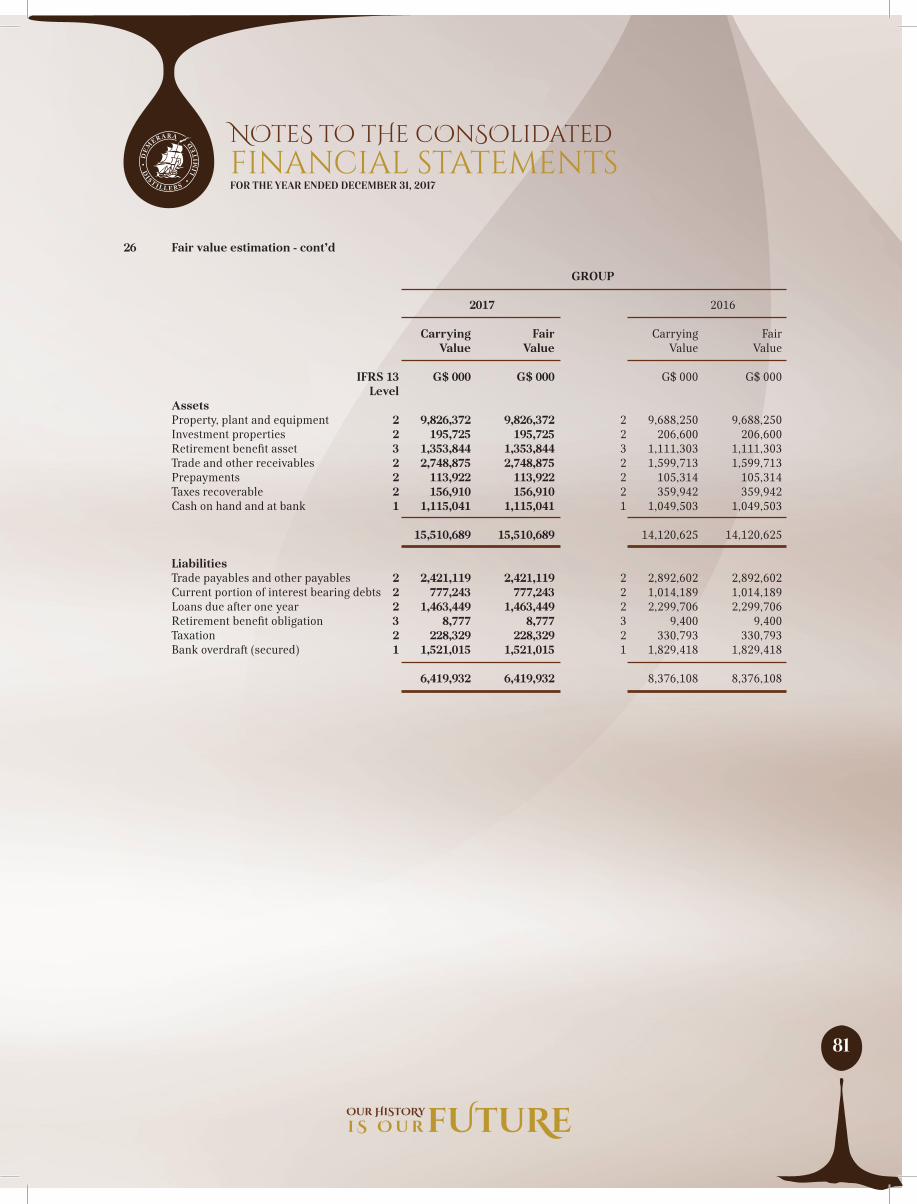
81
financial statementsNOteS tO tHe cOnSOlidated
FOR THE YEAR ENDED DECEMBER 31, 2017
26 Fair value estimation - cont’d
GROUP 2017 2016 Carrying Fair Carrying Fair Value Value Value Value IFRS 13 G$ 000 G$ 000 G$ 000 G$ 000 Level Assets Property, plant and equipment 2 9,826,372 9,826,372 2 9,688,250 9,688,250 Investment properties 2 195,725 195,725 2 206,600 206,600 Retirement benefit asset 3 1,353,844 1,353,844 3 1,111,303 1,111,303 Trade and other receivables 2 2,748,875 2,748,875 2 1,599,713 1,599,713 Prepayments 2 113,922 113,922 2 105,314 105,314 Taxes recoverable 2 156,910 156,910 2 359,942 359,942 Cash on hand and at bank 1 1,115,041 1,115,041 1 1,049,503 1,049,503 15,510,689 15,510,689 14,120,625 14,120,625 Liabilities Trade payables and other payables 2 2,421,119 2,421,119 2 2,892,602 2,892,602 Current portion of interest bearing debts 2 777,243 777,243 2 1,014,189 1,014,189 Loans due after one year 2 1,463,449 1,463,449 2 2,299,706 2,299,706 Retirement benefit obligation 3 8,777 8,777 3 9,400 9,400 Taxation 2 228,329 228,329 2 330,793 330,793 Bank overdraft (secured) 1 1,521,015 1,521,015 1 1,829,418 1,829,418 6,419,932 6,419,932 8,376,108 8,376,108

82
financial statementsNOteS tO tHe cOnSOlidated
FOR THE YEAR ENDED DECEMBER 31, 2017
26 Fair value estimation - cont ‘ d
Valuation techniques and assumptions applied for the purposes of measuring fair value
The fair values of assets and liabilities were determined as follows:
(a) Property, plant, equipment and investment properties fair values were measured primarly at cost less accumulated
depreciation. Management’s judgement was used to determine that fair value approximates the carrying value.
(b) For available for sale financial assets, the fair values were determined with reference to quoted market prices and level 2 fair value measurements.
(c) Retirement benefit assets and liabilites were measured by management on the advice from the actuaries.
(d) Trade receivables and other receivables are net of provision for impairment. The fair value of trade receivables and
other receivables was based on expected realisation of outstanding balances taking into account the company’s history with respect to delinquencies.
(e) Financial instruments where the carrying amounts were equal to fair value:- Due to their short term maturity,
the carrying values of certain financial instruments approximate their fair values. These include cash and cash equivalents, trade and other payables, tax liability/recoverable, prepayments and bank overdraft. Long term loans are fixed by contract.
Asset carried at fair value The following table provides an analysis of financial instruments that are measured subsequent to initial recognition
at fair value, grouped into levels 1 to 3 based on the degree to which the value is observable.
COMPANY COMPANY 2017 2016 Level 1 Level 2 Level 3 Level 1 Level 2 Level 3 G$ 000 G$ 000 G$ 000 G$ 000 G$ 000 G$ 000 Available for Sale - 797,796 - - 795,555 - - 797,796 - - 795,555 - GROUP GROUP 2017 2016 Level 1 Level 2 Level 3 Level 1 Level 2 Level 3 G$ 000 G$ 000 G$ 000 G$ 000 G$ 000 G$ 000 Available for Sale - 797,796 - - 839,507 - - 797,796 - - 839,507 - During the year, available for sale investment for 2016 was reclassified from Level 1 to Level 2 due to the activity of the market.

83
financial statementsNOteS tO tHe cOnSOlidated
FOR THE YEAR ENDED DECEMBER 31, 2017
27 Financial risk management
Objectives
The company’s and group’s management monitors and manages the financial risks relating to the operations of the company and group through internal risk reports which analyse exposures by degree and magnitude of risks. These risks include market risk (currency risk, interest rate risk and price risk), credit risk and liquidity risk. The company and group seek to minimise the effects of these risks by the use of techniques that are governed by management’s policies on foreign exchange risk, interest rate risk and credit risk which are approved by the board of directors. The company’s and group’s management reports monthly to the board of directors on matters relating to risk and management of risk (a) Market risk The company’s and group’s activities expose it to the financial risks of changes in foreign currency exchange rates and
interest rates. The company uses interest rate sensitivity and exposure limits to financial instruments to manage its exposure to interest rate and foreign currency risk. There has been no change in the company and group’s exposure to market risks or the manner in which it manages these risks.
(i) Foreign currency risk The financial statements at December 31, include the following assets and liabilities denominated in foreign
currencies stated in the Guyana Dollar equivalent
COMPANY GROUP Assets 2017 2016 2017 2016 G$ 000 G$ 000 G$ 000 G$ 000 US Dollar 1,374,511 747,056 1,882,199 1,200,199 GBP 29,420 51,364 29,420 51,364 Euro 35 - 1,060,559 946,450 Others 163,902 200,301 784,044 544,228 1,567,868 998,721 3,756,222 2,742,241 Liabilities US Dollar 556,278 1,461,217 592,753 719,120 GBP 10,246 (12,789) 10,246 9,891 Euro 35,844 311,763 66,712 127,006 Others 674 (14,400) 43,655 60,952 603,042 1,745,791 713,366 916,969 Net assets/(liabilities) 964,826 (747,070) 3,042,856 1,825,272

84
financial statementsNOteS tO tHe cOnSOlidated
FOR THE YEAR ENDED DECEMBER 31, 2017
27 Financial risk management - cont’d
(a) Market risk - cont’d
(i) Foreign currency sensitivity analysis - cont’d The following table details the company’s and group’s sensitivity to a 2.5% increase and decrease in the Guyana dollar against balances denominated in foreign currencies. The sensitivity analysis includes only outstanding foreign currency denominated monetary items and adjusts their translation at the period end for a 2.5% change in foreign currency rates. A positive number indicates an increase in profit where foreign currencies strengthen 2.5% against the G$. For a 2.5% weakening of the foreign currencies against G$ there would be an equal and opposite impact on the profit, and the balances below would be negative.
COMPANY GROUP 2017 2016 2017 2016 G$000 G$000 G$000 G$000
Profit/(loss) 24,121 (18,677) 76,071 45,632
(ii) Interest sensitivity analysis
The sensitivity analysis below has been determined based on the exposure to interest rate at the end of the reporting period. The sensitivity analysis includes only outstanding balances at the end of the reporting period. A 50 basis point increase or decrease is used when reporting interest rate internally to key management personnel and represents management’s assessment of the reasonable possible change in interest rates. A positive number indicates an increase in profits where the interest rate appreciated by 50 basis points. For a decrease of 50 basis points in the interest rate, this would have an equal and opposite impact on profit and the balances below would be negative. If interest rates had been 50 basis points higher/lower and all other variables were held constant, the impact on the company’s and group’s profit would have been: Impact on profit for the year
Increase/ Decrease in COMPANY GROUP Basis Point
2017 2016 2017 2016 G$000 G$000 G$000 G$000Cash and cash equivalent Foreign currency +/-50 245 1,764 245 1,764 Overdrafts Local currency +/-50 (5,352) (6,170) (7,594) (9,134) Apart from the foregoing with respect to the other financial assets and liabilites, it was not possible to determine the expected impact of a reasonable possible change in interest rates on profit or equity as other factors such as credit risks, market risks, political and disaster risks can affect the value of assets and liabilities.

85
financial statementsNOteS tO tHe cOnSOlidated
FOR THE YEAR ENDED DECEMBER 31, 2017
27 Financial risk management - cont’d (a) Market risk - cont’d
(iii) Interest rate risk
Interest rate risk is the risk that the value of financial instruments will fluctuate due to changes in market interest rates. The company and group are exposed to various risks that are associated with the effects of variations in interest rates. This impacts directly on its cash flows. The company’s and group’s management continually monitors and manages these risks through the use of appropriate tools and implements relevant strategies to hedge against any adverse effects.
COMPANY Maturing 2017 Interest Within Over Non-interest rate 1 year 2 to 5 years 5 years bearing Total Range % G$000 G$000 G$000 G$000 G$000Assets Investments - - - - 797,796 797,796 Trade and otherreceivables - - - - 1,990,754 1,990,754 Prepayments - - - - 75,002 75,002 Taxes recoverable - - - - 48,850 48,850 Cash at bank 0.03% - 1.5% 48,960 - - 30,816 79,776 48,960 - - 2,943,218 2,992,178 Liabilities Trade payableand accruals - - - - 2,200,380 2,200,380 Bank overdraft(secured) 8% 1,070,442 - - - 1,070,442 Loans 3.88% - 8% 682,313 1,222,654 - - 1,904,967 Taxation - - - - 103,080 103,080 1,752,755 1,222,654 - 2,303,460 5,278,869
Interest sensitivity gap (1,703,795) (1,222,654) -

86
financial statementsNOteS tO tHe cOnSOlidated
FOR THE YEAR ENDED DECEMBER 31, 2017
27 Financial risk management - cont’d (a) Market risk - cont’d
(iii) Interest rate risk - cont’d COMPANY
Maturing 2016
Interest Within Over Non-interest rate 1 year 2 to 5 years 5 years bearing Total Range % G$000 G$000 G$000 G$000 G$000AssetsInvestments - - - - 795,555 795,555 Trade and otherreceivables - - - - 908,969 908,969 Prepayments - - - - 85,879 85,879 Taxes recoverable - - - - 48,850 48,850 Cash at bank 0.03% - 1.5% 352,783 - - 96,777 449,560 352,783 - - 1,936,030 2,288,813 Liabilities Trade payableand accruals - - - - 4,064,181 4,064,181 Bank overdraft (secured) 3.88% - 8% 1,234,335 - - - 1,234,335 Loans 8% 909,455 1,817,760 87,208 - 2,814,423 Taxation - - - - 240,973 240,973 2,143,790 1,817,760 87,208 4,305,154 8,353,912 Interest sensitivity gap (1,791,007) (1,817,760) (87,208)

87
financial statementsNOteS tO tHe cOnSOlidated
FOR THE YEAR ENDED DECEMBER 31, 2017
27 Financial risk management - cont’d (a) Market risk - cont’d
(iii) Interest rate risk - cont’d GROUP Maturing 2017
Interest Within Over Non-interest rate 1 year 2 to 5 years 5 years bearing Total Range % G$000 G$000 G$000 G$000 G$000Assets Investments - - - - 792,796 792,796 Trade and otherreceivables - - - - 2,748,875 2,748,875 Prepayments - 113,922 113,922 Taxes recoverable - - - - 156,910 156,910 Cash on hand and at bank 0.03% - 1.5% 48,960 - - 1,066,081 1,115,041 48,960 - - 4,878,584 4,927,544 Liabilities Trade payable andaccruals - - - - 2,421,119 2,421,119 Bank overdraft (secured) 8% 1,521,015 - - - 1,521,015 Loans 3.25% - 8% 777,243 1,463,449 - - 2,240,692 Taxation - - - - 228,329 228,329 2,298,258 1,463,449 - 2,649,448 6,411,155 Interest sensitivity gap (2,249,298) (1,463,449) -
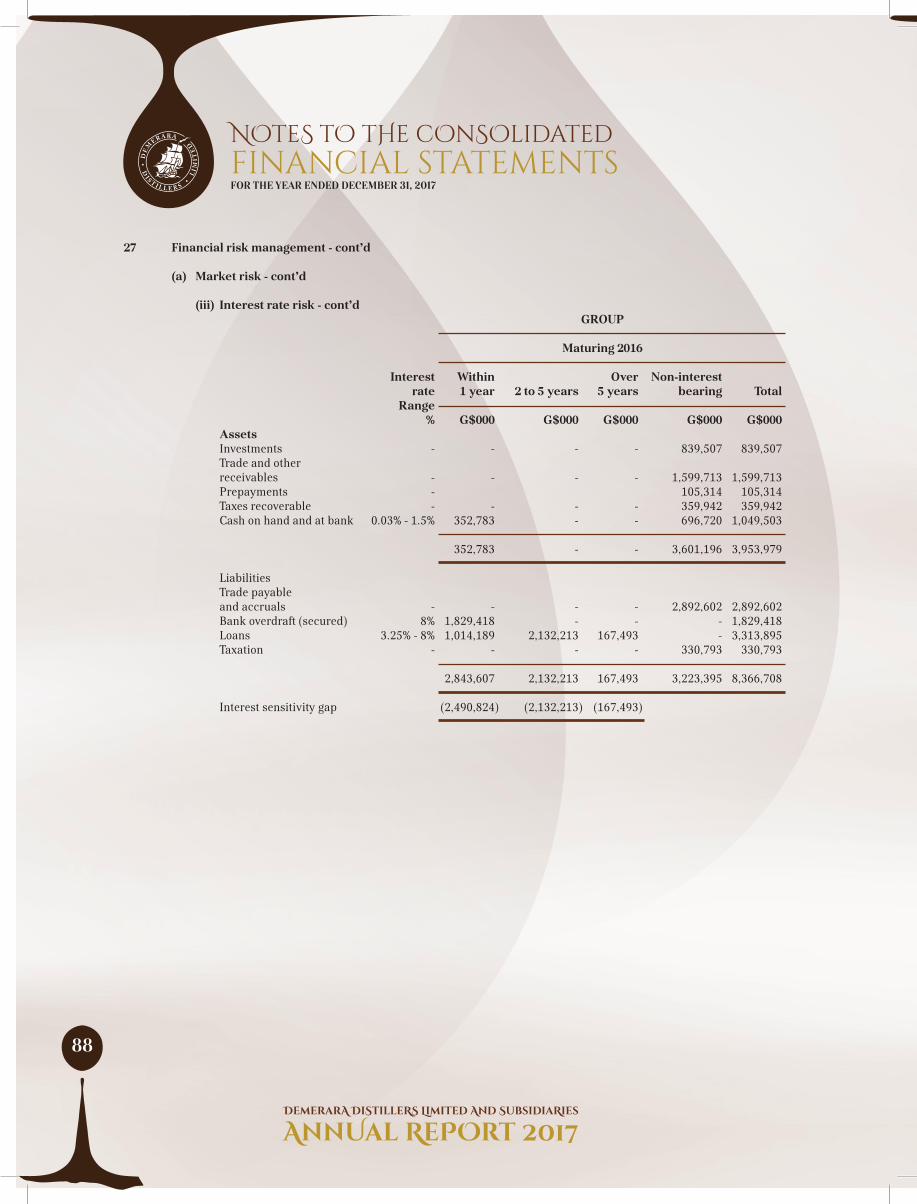
88
financial statementsNOteS tO tHe cOnSOlidated
FOR THE YEAR ENDED DECEMBER 31, 2017
27 Financial risk management - cont’d
(a) Market risk - cont’d
(iii) Interest rate risk - cont’d GROUP Maturing 2016
Interest Within Over Non-interest rate 1 year 2 to 5 years 5 years bearing Total Range % G$000 G$000 G$000 G$000 G$000Assets Investments - - - - 839,507 839,507 Trade and otherreceivables - - - - 1,599,713 1,599,713 Prepayments - 105,314 105,314 Taxes recoverable - - - - 359,942 359,942 Cash on hand and at bank 0.03% - 1.5% 352,783 - - 696,720 1,049,503 352,783 - - 3,601,196 3,953,979 Liabilities Trade payableand accruals - - - - 2,892,602 2,892,602 Bank overdraft (secured) 8% 1,829,418 - - - 1,829,418 Loans 3.25% - 8% 1,014,189 2,132,213 167,493 - 3,313,895 Taxation - - - - 330,793 330,793
2,843,607 2,132,213 167,493 3,223,395 8,366,708 Interest sensitivity gap (2,490,824) (2,132,213) (167,493)

89
financial statementsNOteS tO tHe cOnSOlidated
FOR THE YEAR ENDED DECEMBER 31, 2017
27 Financial risk management - cont’d (a) Market risk - cont’d
(iv) Price risk
Price risk is the risk that the value of financial instruments will fluctuate as a result of changes in market prices whether those changes are caused by factors specific to the individual security or its issuer or factors affecting all securities traded in the market. Management continually identifies, underwrites and diversifies risk in order to minimize the total cost of carrying such risk.
(b) Credit risk
The table below shows the company’s maximum exposure to credit risk
COMPANY GROUP Maximum Exposure Maximum Exposure
2017 2016 2017 2016 G$000 G$000 G$000 G$000
Cash on hand and at bank 79,776 449,560 1,115,041 1,049,503Investments
Available for Sale 797,796 795,555 792,796 839,507 Trade and other receivables 1,990,754 908,969 2,748,875 1,599,713 Taxes recoverable 48,850 48,850 156,910 359,942
Total Credit risk exposure 2,917,176 2,202,934 4,813,622 3,848,665
Credit risk is the risk that a customer or counterparty will default on its contractual obligations resulting in financial loss to the company and group. The company and group faces credit risk in respect of its cash and cash equivalents, investments and receivables. However, this risk is controlled by close monitoring of these assets by the company and group. The maximum credit risk faced by the company and group is the balance reflected in the financial statements. Cash and cash equivalents are held by commercial banks. These banks have been assessed by the Directors as being credit worthy, with very strong capacity to meet their obligations as they fall due. The related risk is therefore considered very low. Investments reflected in the company’s and group’s financial statement are assets for which the likelihood of default are considered minimal by the Directors. Trade receivables consist of a large number of customers, spread across diverse industries and geographical areas Ongoing credit evaluation is performed on the financial condition of accounts receivable on a regular basis.

90
financial statementsNOteS tO tHe cOnSOlidated
FOR THE YEAR ENDED DECEMBER 31, 2017
27 Financial risk management - cont’d
(b) Credit risk - cont’d COMPANY GROUP
Trade and other receivables 2017 2016 2017 2016 G$000 G$000 G$000 G$000 Trade receivables 1,885,721 795,349 2,496,349 1,400,030 Other receivables 105,033 113,620 283,531 219,150 Taxes Recoverable 48,850 48,850 156,910 359,942 2,039,604 957,819 2,936,790 1,979,122 The above balances are classified as follows:
COMPANY GROUP
2017 2016 2017 2016 G$000 G$000 G$000 G$000 Current 1,675,026 814,383 2,003,439 1,237,693 Past due but not impaired 377,902 142,817 915,670 721,962 Impaired (13,324) 619 17,681 19,467 2,039,604 957,819 2,936,790 1,979,122
COMPANY GROUP 2017 2016 2017 2016 G$000 G$000 G$000 G$000 Ageing of past due but not impaired 31-60 days 88,308 59,183 288,545 150,868 61-90 days 203,518 45,991 312,669 147,877 91-120 days 35,844 (104) 107,470 70,135 over 120 days 50,232 37,747 206,986 353,082
Total 377,902 142,817 915,670 721,962 While the foregoing is past due they are still considered to be collectible in full. Ageing of impaired trade receivables 31-60 days - - - - 61-90 days - 621 - 621 91-120 days - 9 - 9 over 120 days (13,324) (11) 17,681 18,837 Total (13,324) 619 17,681 19,467 Provision for impairment 13,398 619 31,005 19,467
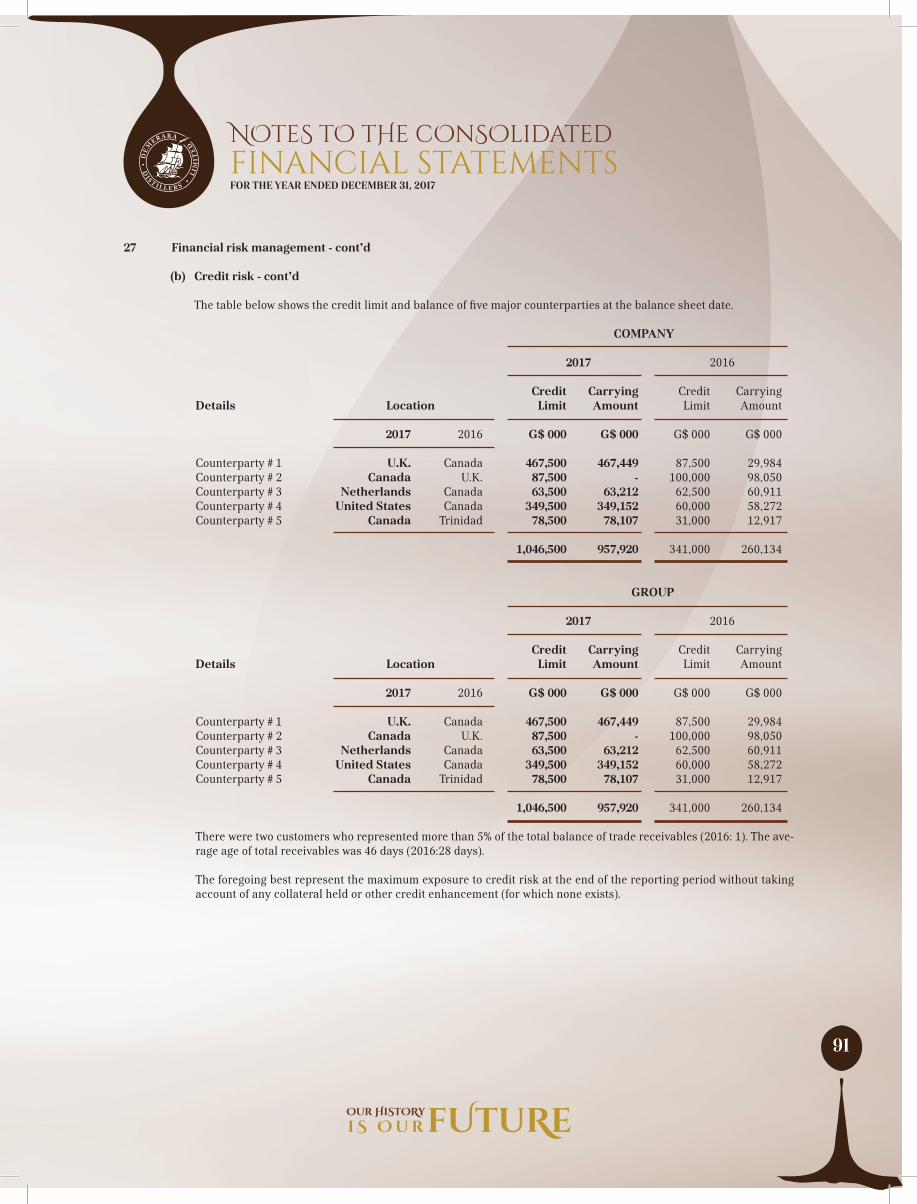
91
financial statementsNOteS tO tHe cOnSOlidated
FOR THE YEAR ENDED DECEMBER 31, 2017
27 Financial risk management - cont’d
(b) Credit risk - cont’d
The table below shows the credit limit and balance of five major counterparties at the balance sheet date.
COMPANY 2017 2016
Credit Carrying Credit Carrying Details Location Limit Amount Limit Amount 2017 2016 G$ 000 G$ 000 G$ 000 G$ 000 Counterparty # 1 U.K. Canada 467,500 467,449 87,500 29,984 Counterparty # 2 Canada U.K. 87,500 - 100,000 98,050 Counterparty # 3 Netherlands Canada 63,500 63,212 62,500 60,911 Counterparty # 4 United States Canada 349,500 349,152 60,000 58,272 Counterparty # 5 Canada Trinidad 78,500 78,107 31,000 12,917 1,046,500 957,920 341,000 260,134
GROUP 2017 2016
Credit Carrying Credit Carrying Details Location Limit Amount Limit Amount 2017 2016 G$ 000 G$ 000 G$ 000 G$ 000 Counterparty # 1 U.K. Canada 467,500 467,449 87,500 29,984 Counterparty # 2 Canada U.K. 87,500 - 100,000 98,050 Counterparty # 3 Netherlands Canada 63,500 63,212 62,500 60,911 Counterparty # 4 United States Canada 349,500 349,152 60,000 58,272 Counterparty # 5 Canada Trinidad 78,500 78,107 31,000 12,917 1,046,500 957,920 341,000 260,134
There were two customers who represented more than 5% of the total balance of trade receivables (2016: 1). The ave-rage age of total receivables was 46 days (2016:28 days). The foregoing best represent the maximum exposure to credit risk at the end of the reporting period without taking account of any collateral held or other credit enhancement (for which none exists).
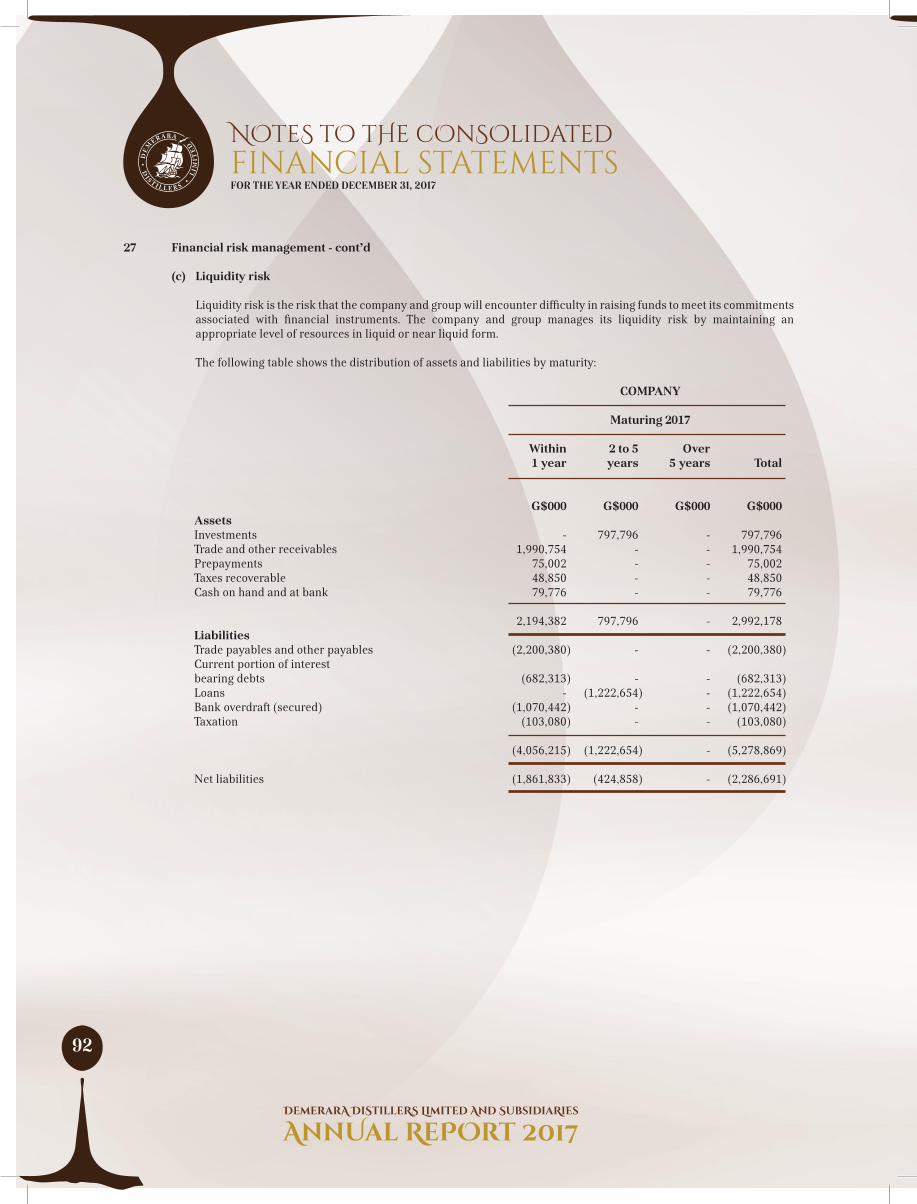
92
financial statementsNOteS tO tHe cOnSOlidated
FOR THE YEAR ENDED DECEMBER 31, 2017
27 Financial risk management - cont’d
(c) Liquidity risk
Liquidity risk is the risk that the company and group will encounter difficulty in raising funds to meet its commitments associated with financial instruments. The company and group manages its liquidity risk by maintaining an appropriate level of resources in liquid or near liquid form.
The following table shows the distribution of assets and liabilities by maturity:
COMPANY Maturing 2017
Within 2 to 5 Over 1 year years 5 years Total G$000 G$000 G$000 G$000
Assets Investments - 797,796 - 797,796 Trade and other receivables 1,990,754 - - 1,990,754 Prepayments 75,002 - - 75,002 Taxes recoverable 48,850 - - 48,850 Cash on hand and at bank 79,776 - - 79,776 2,194,382 797,796 - 2,992,178 Liabilities Trade payables and other payables (2,200,380) - - (2,200,380) Current portion of interestbearing debts (682,313) - - (682,313) Loans - (1,222,654) - (1,222,654) Bank overdraft (secured) (1,070,442) - - (1,070,442) Taxation (103,080) - - (103,080) (4,056,215) (1,222,654) - (5,278,869) Net liabilities (1,861,833) (424,858) - (2,286,691)

93
financial statementsNOteS tO tHe cOnSOlidated
FOR THE YEAR ENDED DECEMBER 31, 2017
27 Financial risk management - cont’d
(c) Liquidity risk - cont’d COMPANY Maturing 2016
Within 2 to 5 Over 1 year years 5 years Total G$000 G$000 G$000 G$000
Assets Investments - 795,555 - 795,555 Trade and other receivables 908,969 - - 908,969 Prepayments 85,879 - - 85,879 Taxes recoverable 48,850 - - 48,850 Cash on hand and at bank 449,560 - - 449,560 1,493,258 795,555 - 2,288,813 Liabilities Trade payables and other payables (4,064,181) - - (4,064,181) Current portion of interest bearing debts (909,455) - - (909,455) Loans - (1,817,760) (87,208) (1,904,968) Bank overdraft (secured) (1,234,335) - - (1,234,335) Taxation (240,973) - - (240,973) (6,448,944) (1,817,760) (87,208) (8,353,912) Net liabilities (4,955,686) (1,022,205) (87,208) (6,065,099)

94
financial statementsNOteS tO tHe cOnSOlidated
FOR THE YEAR ENDED DECEMBER 31, 2017
27 Financial risk management - cont’d
(c) Liquidity risk - cont’d GROUP Maturing 2017
Within 2 to 5 Over 1 year years 5 years Total
G$000 G$000 G$000 G$000Assets Investments - 792,796 - 792,796 Trade and other receivables 2,748,875 - - 2,748,875 Prepayments 113,922 - - 113,922 Taxes recoverable 156,910 - - 156,910 Cash on hand and at bank 1,115,041 - - 1,115,041 4,134,748 792,796 - 4,927,544 Liabilities Trade payables and other payables (2,421,119) - - (2,421,119) Current portion of interest bearing debts (777,243) - - (777,243) Loans - (1,463,449) - (1,463,449) Bank overdraft (secured) (1,521,015) - - (1,521,015) Taxation (228,329) - - (228,329) (4,947,706) (1,463,449) - (6,411,155) Net liabilities (812,958) (670,653) - (1,483,611)

95
financial statementsNOteS tO tHe cOnSOlidated
FOR THE YEAR ENDED DECEMBER 31, 2017
27 Financial risk management - cont’d
(c) Liquidity risk - cont’d GROUP Maturing 2016
Within 2 to 5 Over 1 year years 5 years Total
G$000 G$000 G$000 G$000Assets Investments - 839,507 - 839,507 Trade and other receivables 1,599,713 - - 1,599,713 Prepayment 105,314 - - 105,314 Taxes recoverable 359,942 - - 359,942 Cash on hand and at bank 1,049,503 - - 1,049,503 3,114,472 839,507 - 3,953,979 Liabilities Trade payables and other payables (2,892,602) - - (2,892,602) Current portion of interest bearing debts (1,014,189) - - (1,014,189) Loans - (2,132,213) (167,493) (2,299,706) Bank overdraft (secured) (1,829,418) - - (1,829,418) Taxation (330,793) - - (330,793) (6,067,002) (2,132,213) (167,493) (8,366,708)
Net liabilities (2,952,530) (1,292,706) (167,493) (4,412,729)

96
financial statementsNOteS tO tHe cOnSOlidated
FOR THE YEAR ENDED DECEMBER 31, 2017
28 Capital risk management
The company and group manages its capital to ensure that it will be able to continue as a going concern while maximising the return to stakeholders through the optimisation of the debt and equity balance. The overall strategy remains unchanged from 2016.
The capital structure of the company and group consists of cash equivalents and equity attributable to equity holders, comprising issued capital, reserves and retained earnings. Gearing ratio The company’s and group’s management reviews the capital structure on an on-going basis. As part of this review, management considers the cost of capital and the risks associated with each class of capital. The company and group have not set a target gearing ratio . The gearing ratio at the year end was as follows:
COMPANY GROUP 2017 2016 2017 2016 G$000 G$000 G$000 G$000 Debt (i) 2,975,409 4,048,758 3,761,707 5,143,313 Cash and cash equivalents (79,776) (449,560) (1,115,041) (1,049,503) Net debt 2,895,633 3,599,198 2,646,666 4,093,810 Equity (ii) 17,787,368 14,677,833 20,913,489 18,515,611 Net debt to equity ratio 0.16:1 0.25:1 0.13:1 0.22:1
(i) Debt is defined as advances long- and short-term borrowings as detailed in note 19.
(ii) Equity includes all capital and reserves of the company and group.
29 Reclassifications
In 2016, certain items of property, plant and equipment in the prior year were reclassified to investment properties to conform with the current year’s presentation.
Deposit on empties and crates, and goods received but not paid for were reclassified to payables from inventory for prior year to also conform with the current year’s presentation.
An amount of $225M previously shown separately as provision for impairment has been reclassified to the associate company balance as of December 31, 2016.
30 Approval of financial statements The financial statements were approved for issue by the Directors on February 12, 2018.
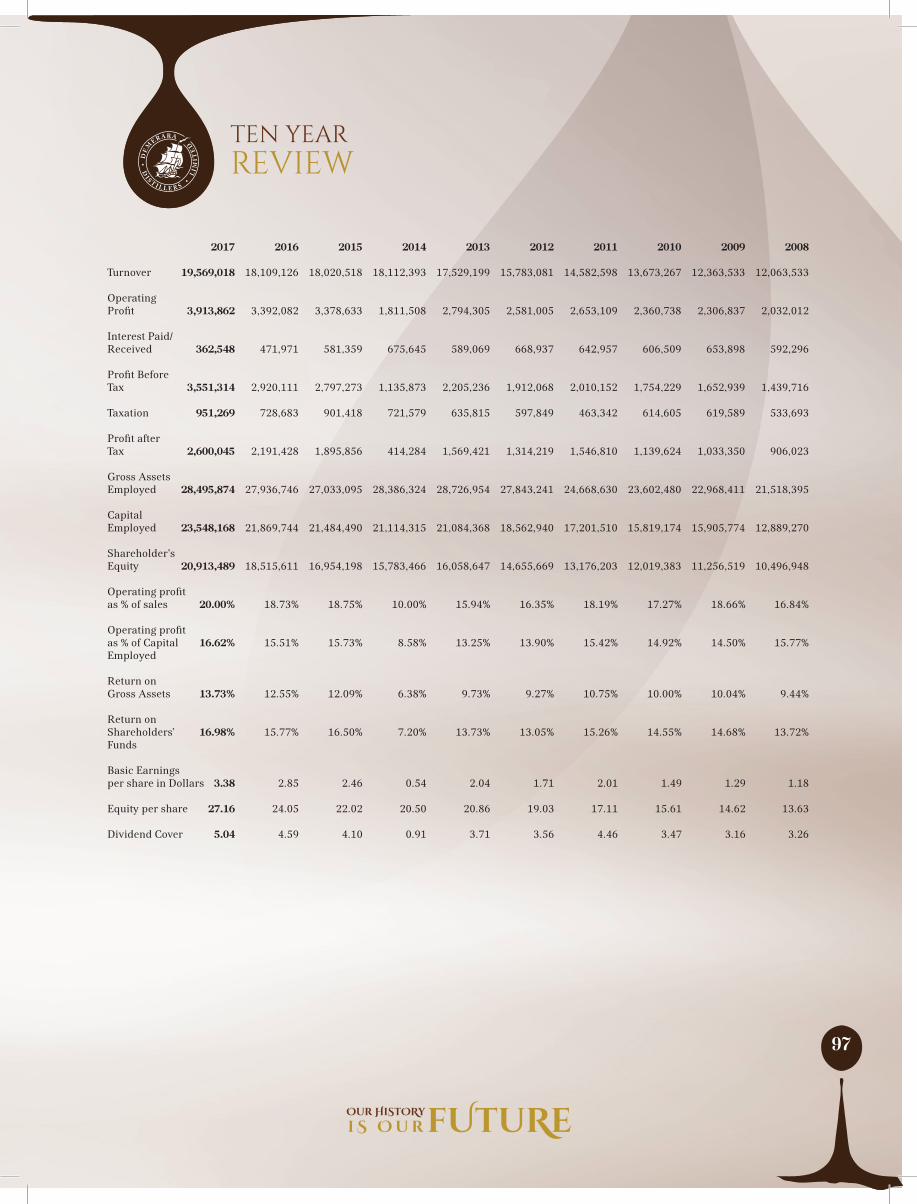
97
reviewten year
97
2017 2016 2015 2014 2013 2012 2011 2010 2009 2008 Turnover 19,569,018 18,109,126 18,020,518 18,112,393 17,529,199 15,783,081 14,582,598 13,673,267 12,363,533 12,063,533 OperatingProfit 3,913,862 3,392,082 3,378,633 1,811,508 2,794,305 2,581,005 2,653,109 2,360,738 2,306,837 2,032,012 Interest Paid/Received 362,548 471,971 581,359 675,645 589,069 668,937 642,957 606,509 653,898 592,296 Profit BeforeTax 3,551,314 2,920,111 2,797,273 1,135,873 2,205,236 1,912,068 2,010,152 1,754,229 1,652,939 1,439,716 Taxation 951,269 728,683 901,418 721,579 635,815 597,849 463,342 614,605 619,589 533,693 Profit afterTax 2,600,045 2,191,428 1,895,856 414,284 1,569,421 1,314,219 1,546,810 1,139,624 1,033,350 906,023 Gross AssetsEmployed 28,495,874 27,936,746 27,033,095 28,386,324 28,726,954 27,843,241 24,668,630 23,602,480 22,968,411 21,518,395 CapitalEmployed 23,548,168 21,869,744 21,484,490 21,114,315 21,084,368 18,562,940 17,201,510 15,819,174 15,905,774 12,889,270 Shareholder’sEquity 20,913,489 18,515,611 16,954,198 15,783,466 16,058,647 14,655,669 13,176,203 12,019,383 11,256,519 10,496,948 Operating profitas % of sales 20.00% 18.73% 18.75% 10.00% 15.94% 16.35% 18.19% 17.27% 18.66% 16.84% Operating profitas % of Capital 16.62% 15.51% 15.73% 8.58% 13.25% 13.90% 15.42% 14.92% 14.50% 15.77%Employed Return onGross Assets 13.73% 12.55% 12.09% 6.38% 9.73% 9.27% 10.75% 10.00% 10.04% 9.44% Return onShareholders’ 16.98% 15.77% 16.50% 7.20% 13.73% 13.05% 15.26% 14.55% 14.68% 13.72%Funds Basic Earningsper share in Dollars 3.38 2.85 2.46 0.54 2.04 1.71 2.01 1.49 1.29 1.18
Equity per share 27.16 24.05 22.02 20.50 20.86 19.03 17.11 15.61 14.62 13.63 Dividend Cover 5.04 4.59 4.10 0.91 3.71 3.56 4.46 3.47 3.16 3.26

98
From time to time, Management has been approached by Shareholders concerning the procedure for effecting the Transfer of Shares. For the future benefit of Shareholders, we take this opportunity to remind members of the procedure as stated hereunder.
Trust Company (Guyana) Limited is the Registrar and Transfer Agent of Demerara Distillers Limited.
A Shareholder who wishes to transfer his/her shares should take with him/her to the Trust Company (Guyana) Limited, the relevant share certificate (s), and officials there will assist in having the Transfer instrument completed as well as the Certificates of non-alienship in respect of both the Transferor / Transferee.
Stamp duty and the cost of the stamp for the new share certificate are payable and the Registrar will advise the Shareholders on this at the time of execution of the Transfer.
Without a Share Certificate, it would not be possible to execute a Transfer of Shares. Where a Shareholder has not his/her share certificate, it would be necessary, after conferring with the Registrar, to have the loss advertised in the Press at the Shareholder’s expense and the Shareholder will also be required to sign a form of indemnity and pay stamp duty.
Where the legal personal representatives of deceased Shareholders seek to have such shares transferred, they should, in addition to the relevant share certificate, take along with them the original of Letters of Administration/Probate of the Court with the Will attached (where applicable), for presentation to the Registrar.
If at any time you change your address or wish to revoke instructions given to the company or its Registrar, you should inform us promptly.
Under the provisions of the Company’s Articles of Association, replacement of Dividend Warrants, lost or mislaid from any cause whatsoever, will be for the account of the Shareholder reporting the cause. The Company’s Registrar will apprise you of the charges payable at the time of the report.
transfer of sharesprocedures for

99
NOteS

100
NOteS

101
NOteS
102
NOteS

103
I,
of
A MEMBER OF Demerara Distillers Limited hereby appoint
OR IN HIS/HER ABSENCE
To act as my proxy at the Annual General Meeting on March 29, 2018 and at every adjournment thereof.
As witness my hand this day of 2018
Signed
Unless otherwise instructed the proxy will vote as he/she thinks fit.
The date of the AGM is as per Notice published in the Press and as it appears in the Annual Report & Accounts, relevant to the particular year under review.
DEMERARA DISTILLERS LIMITED • ANNUAL GENERAL MEETING
proxyform of