Effect of Dairy Structures on Gastric Behaviour and Nutrient ...
324
Effect of Dairy Structures on Gastric Behaviour and Nutrient Digestion Kinetics using a Semi-Dynamic Model Ana-Isabel Mulet-Cabero A thesis submitted for the degree of Doctor of Philosophy to the University of East Anglia, for research conducted at the Quadram Institute Bioscience and Teagasc Food Research Centre. Quadram Institute Bioscience December 2018 © This copy of the thesis has been supplied on condition that anyone who consults it is understood to recognise that its copyright rests with the author and that use of any information derived there from must be in accordance with current UK Copyright Law. In addition, any quotation or extract must include full attribution.
-
Upload
khangminh22 -
Category
Documents
-
view
1 -
download
0
Transcript of Effect of Dairy Structures on Gastric Behaviour and Nutrient ...

Effect of Dairy Structures on Gastric Behaviour and Nutrient Digestion
Kinetics using a Semi-Dynamic Model
Ana-Isabel Mulet-Cabero
A thesis submitted for the degree of Doctor of Philosophy to the University of East Anglia, for research conducted at the Quadram Institute Bioscience and Teagasc
Food Research Centre.
Quadram Institute Bioscience
December 2018
© This copy of the thesis has been supplied on condition that anyone who consults it is
understood to recognise that its copyright rests with the author and that use of any information
derived there from must be in accordance with current UK Copyright Law. In addition, any
quotation or extract must include full attribution.

ii
Preface
This thesis was submitted to the University East of Anglia (Norwich, UK) for the
degree of Doctor of Philosophy. The work presented herein was undertaken between
the former Institute of Food Research (Norwich, UK) from January 2015 to February
2016, Moorepark-Teagasc Food Research Centre (Fermoy, Cork Co., Ireland) from
March 2016 to January 2018, the School of Food Science and Nutrition at the
University of Leeds (Leeds, UK) from October 2017 to December 2017 and Quadram
Institute Bioscience (formerly the Institute of Food Research) from February 2018 to
December 2018.

iii
Abstract
Dairy products, due to manufacturing processes, exhibit an array of
possible structures at different length scales and are associated with beneficial
nutritional and health effects. However, to date there is very little mechanistic
understanding of such links. Unravelling the fate of food in the gastrointestinal
tract is essential to better understand the health effects of food.
The investigation of different dairy structured matrices was performed
using a semi-dynamic model of gastric digestion, developed in this thesis, to
simulate the main dynamics of the adult stomach, i.e. gradual gastric
acidification, fluid secretion and emptying. It was validated with two dairy
matrices obtaining a similar gastric behaviour compared to the corresponding
in vivo digestion.
The ‘fast’ and ‘slow’ digestion kinetics of whey proteins and caseins were
shown to be due to their behaviour in the stomach, presenting soluble
aggregates and solid, firm coagulation, respectively, which was linked to a
higher ex vivo Leu absorption at early and late stages of digestion. The gastric
restructuring of caseins was modulated by changing the whey protein to
casein ratio, addition of lipid, and processing by heating and homogenisation.
The most intensive processing resulted in weaker, fragmented coagulation,
leading to quicker kinetics of nutrient emptying and rapid protein hydrolysis.
The latter was linked to an easier access of pepsin into the weaker structure.
The modulation of nutrient digestion kinetics was also obtained by comparing
specific dairy macrostructures of semi-solid versus liquid through different
gastric behaviours, which could be linked to the satiety responses observed in
vivo.
This thesis clearly demonstrated the key role of the gastric phase on
nutrient bioaccessibility, which can be associated to physiological responses
of dairy products. The modulation of gastric behaviour should be further
studied and can be exploited to develop food structures with improved and/or
tailored biofunctional properties addressing health/nutritional requirements.

iv
Acknowledgements
Firstly, I would like to sincerely thank my supervisors Prof Alan Mackie, Dr André Brodkorb
and Prof Pete Wilde for their support and expert guidance as well as motivation and patience
throughout my PhD. Their office door was always open whenever I had a question/concern and
each one had a key role in different moments of my PhD. I truly think I was very lucky to have them
in this process. Secondly, I would like to acknowledge the financial support, this work has funded
by the Irish Dairy Levy Research Trust (project number MDDT6261) under Teagasc Walsh
Fellowship and BBSRC in the UK (grant BB/J004545/1). The three-month placement at the
University of Leeds was funded by the Short-Term Overseas Training Award of the Walsh
Fellowship Programme.
My PhD journey gave me the opportunity, apart from performing about 200 gastric
digestions, to live in two countries and work with four different lab groups, which allowed me the
possibility to meet lovely people who helped me in many ways. I would like to thank everyone who
helped me directly or indirectly even though it is not possible to mention every single person in
here. From my first year of PhD working in the Mackie’s lab at IFR, I would like to acknowledge Neil
Rigby for his valuable help in the lab, Balazs Bajka for his support with the confocal and Mike Ridout
for training/assistance in several instruments. Outside the lab I would like to mention my Biorefinary
guys (Richardo Montull, Ian Wood, Sam Collins and Adam Elliston), I will not forget our breaks full
of laughter, and Enri Garcia, who shared a lot of things with me including the passion for cows. I
would like to thank Adam Elliston for his valuable help and moral support during the thesis writing
and for the rest of my crazy activities I was involved during my PhD. Regarding my period in Ireland,
I would like to thank the Brodkorb’s group for their support in the lab and I acknowledge Martina
O’Brien for her assistance with the LECO and the team of Moorepark Technology Ltd. for their help
in the pilot plant. A special thanks to Raul Cabrera, Laura Saez and Bea Mesa, who were my big
emotional support there. In my placement at University of Leeds, I am grateful to Amelia Torcello
who showed me all about Ussing chambers and Alan Mackie for allowing me to work in his lab
(once more). Back in Norwich, in the Wilde group, I would like to thank Louise Salt, Raffaele
Colosimo, Kathrin Haider and Romina Bashllari for their moral support and thanks for taking me
out of the cell for our Friday’s nights out. I would like to acknowledge Shikha Saha for her help with
the LC-MS analysis and Grant Calder for his assistance with the confocal, and Perla Troncoso and
Marianne Defernez for spending some time with my data. I thank Natalia Perez and Yvonne
Gunning for their moral support and attention.
And finally, last but by no means least, I would like to thank my friends and family members
back in Spain who have supported me along the way. With special mention to Eric Miguel, my best
friend and general life counsellor, because he has always been there through everything with me.
I am very grateful to my family, in particular my sister Reyes and brother Ximo for their invaluable
support. I would like to express my endless gratitude to my parents, for their continuous
encouragement throughout my thesis and my life in general as well as their patience when they
had to bear my moments of stress and frustration. Thanks for all the sacrifices that you have made
on my behalf. Moltes gràcies papà i mamà, vos vull molt!
Thanks/gracias/gràcies

v
Outputs from this Project
Peer-reviewed articles:
• Mulet-Cabero, A. I., Mackie, A. R., Wilde, P. J., Fenelon, M. A., &
Brodkorb, A. (2019). Structural mechanism and kinetics of in vitro gastric
digestion are affected by process-induced changes in bovine milk. Food
Hydrocolloids, 86, 172-183.
• Mulet-Cabero, A.-I., Rigby, N. M., Brodkorb, A., & Mackie, A. R. (2017).
Dairy food structures influence the rates of nutrient digestion through
different in vitro gastric behaviour. Food Hydrocolloids, 67, 63-73.
• Ferreira-Lazarte, A., Montilla, A., Mulet-Cabero, A.-I., Rigby, N., Olano,
A., Mackie, A., & Villamiel, M. (2017). Study on the digestion of milk with
prebiotic carbohydrates in a simulated gastrointestinal model. Journal of
Functional Foods, 33, 149-154.
• Mulet-Cabero, A. I, et al. (2019). A standardised semi-dynamic in vitro
digestion method suitable for food–an international consensus (in
preparation).
• Mulet-Cabero, A. I., Mackie, A. R., Brodkorb, A & Wilde, P. J. (2019).
Impact of casein and whey protein ratio and lipid content on in vitro
digestion and ex vivo absorption (in preparation).
• Mulet-Cabero, A. I., Mackie, A. R., Brodkorb, A & Wilde, P. J. (2019)
Dairy structures and physiological responses: a matter of gastric
digestion (in preparation).

vi
Oral presentations in international conferences:
Jun 2018 3rd Food Structure and functionality forum symposium and 3rd IDF symposium on microstructure of dairy products, Montreal, Canada.
Oct 2017 10th NIZO Dairy Conference, Arnhem, The Netherlands.
Apr 2017 5th International Conference on Food Digestion, Rennes, France.
Poster presentations in international conferences:
Nov 2018 32nd EFFoST International Conference, Nantes, France.
Apr 2018 17th Food Colloids Conference, Leeds, UK.
Apr 2017 Society Dairy Technology Spring 2017 Conference, Cork, Ireland. (Best Poster Award)
Dec 2015 44th Annual Food Research Conference, Fermoy, Ireland.
vii
Table of Contents
Preface .................................................................................................................................... ii
Abstract .................................................................................................................................. iii
Acknowledgements .............................................................................................................. iv
Outputs from this Project ...................................................................................................... v
Table of Contents ................................................................................................................. vii
List of Figures ...................................................................................................................... xii
List of Tables ...................................................................................................................... xxv
List of Equations .............................................................................................................. xxvii
List of Abbreviations ...................................................................................................... xxviii
............................................................................................................................... 31
1.1 Introduction .................................................................................................................. 32
1.2 General Implications of Dairy Consumption for Nutrition ............................................ 37
1.3 Composition and Structure of Dairy Constituents ....................................................... 38
1.3.1 Milk Proteins ........................................................................................................................................ 38
1.3.1.1 Caseins ....................................................................................................................................... 38 1.3.1.2 Whey Proteins ............................................................................................................................. 39
1.3.2 Milk Lipids ............................................................................................................................................ 40 1.3.3 Formation of Dairy Structures .............................................................................................................. 40
1.4 Human Gastrointestinal Tract ...................................................................................... 42
1.4.1 Gastric Physiology ............................................................................................................................... 44 1.4.2 Gastric Emptying and Food Properties ................................................................................................. 45
1.5 Methodology for Studying Gastric Digestion ............................................................... 47
1.5.1 In Vivo Methodology for Gastric Digestion Monitoring .......................................................................... 47 1.5.2 In Vitro Methodology for Investigating Gastric Digestion ....................................................................... 48
1.6 Digestion and Absorption of Nutrients ......................................................................... 49
1.6.1 Digestion and Absorption of Proteins ................................................................................................... 49
1.6.2 Digestion and Absorption of Lipids ....................................................................................................... 51
1.7 Effect of Dairy Proteins on Digestion and Physiological Responses .......................... 53
1.7.1 Dairy Proteins and Bioaccessibility ....................................................................................................... 53 1.7.2 Dairy Proteins and, Absorption and Protein Metabolic Utilization.......................................................... 54 1.7.3 Dairy Proteins and Skeletal Muscle Mass ............................................................................................ 56
1.7.4 Dairy Proteins, Satiety and Food Intake ............................................................................................... 57
1.8 Dairy Microstructure and Digestion, Absorption and Physiological Responses .......... 59
1.8.1 Dairy Microstructure Induced by Heat Processing ................................................................................ 59

viii
1.8.2 Dairy Microstructure Induced by Homogenisation Processing ..............................................................62
1.9 Dairy Macrostructures and Digestion, Absorption and Physiological Responses ....... 65
1.9.1 Liquid vs (Semi)Solid Structures and Digestion ....................................................................................65 1.9.2 Liquid vs (Semi)Solid Structures, and Appetite .....................................................................................67 1.9.3 (Semi)Solid Structures with Different Textures .....................................................................................68
1.10 Research aims ........................................................................................................... 72
............................................................................................................................... 74
2.1 Materials ....................................................................................................................... 75
2.1.1 Chemicals ............................................................................................................................................75
2.2 Methods ........................................................................................................................ 75
2.2.1 Emulsion Processing ............................................................................................................................75 2.2.2 In Vitro Digestion and ex Vivo Nutrient Transport .................................................................................79
2.2.2.1 In Vitro Gastric Digestion .............................................................................................................80 2.2.2.2 In Vitro Small Intestinal Digestion .................................................................................................81 2.2.2.3 Ex Vivo Absorption.......................................................................................................................81
2.2.3 Physical Properties Analysis ................................................................................................................83
2.2.3.1 Particle Size Analysis ...................................................................................................................84 2.2.3.2 Rheological Properties Analysis ...................................................................................................85
2.2.3.3 Confocal Laser Scanning Microscopy ..........................................................................................87 2.2.4 Protein Analysis ...................................................................................................................................88
2.2.4.1 Total Nitrogen Analyser................................................................................................................89
2.2.4.2 Sodium Dodecyl Sulphate-Polyacrylamide Gel Electrophoresis ...................................................90 2.2.4.3 o-Phthalaldehyde Spectrophotometric Assay ...............................................................................91
2.2.4.4 Amino Acid Analysis ....................................................................................................................93 2.2.5 Lipid Analysis .......................................................................................................................................96
2.2.5.1 Total Lipid Analyser .....................................................................................................................97
2.2.5.2 Gas Chromatography-Mass Spectrophotometry ..........................................................................99
............................................................................................................................. 102
3.1 Introduction ................................................................................................................. 103
3.2 Materials and Methods ............................................................................................... 104
3.2.1 Materials ............................................................................................................................................ 104 3.2.2 Preparation of Simulated Digestion Fluids .......................................................................................... 105 3.2.3 Semi-Dynamic Gastric Model Equipment ........................................................................................... 106
3.3 Results ........................................................................................................................ 109
3.3.1 Oral Phase ......................................................................................................................................... 109 3.3.2 Development of a Dynamic Gastric pH Profile .................................................................................... 110
3.3.3 Gastric Mixing System ....................................................................................................................... 114 3.3.4 Gastric Secretions and Gastric Emptying ........................................................................................... 116 3.3.5 Intestinal Phase ................................................................................................................................. 119
3.4 Discussion .................................................................................................................. 120
3.4.1 Shape/Geometry of Simulated Stomach ............................................................................................ 120 3.4.2 Gastric Mixing .................................................................................................................................... 120 3.4.3 Gastric Secretions .............................................................................................................................. 122 3.4.4 Dynamic pH Profile ............................................................................................................................ 123 3.4.5 Gastric Emptying ................................................................................................................................ 124

ix
3.4.6 Gastric Lipase .................................................................................................................................... 126 3.4.7 Applicability of the Semi-Dynamic Model ............................................................................................ 127
3.5 Conclusion ................................................................................................................. 128
............................................................................................................................. 129
4.1 Introduction ................................................................................................................ 130
4.2 Materials and Methods .............................................................................................. 132
4.2.1 Materials ............................................................................................................................................ 132 4.2.2 Methods ............................................................................................................................................. 132
4.2.2.1 Preparation of Samples ............................................................................................................. 134 4.2.2.2 In Vitro Digestion Protocol.......................................................................................................... 135
4.2.2.2.1 In Vitro Gastric Digestion by the Semi-Dynamic Model ...................................................... 135
4.2.2.2.2 Small Intestinal in Vitro Digestion ....................................................................................... 138 4.2.2.2.3 Ex Vivo Absorption by Ussing Chamber Technique ........................................................... 139
4.2.2.2.4 Intestinal Tissue Samples .................................................................................................. 139 4.2.2.2.5 Ussing Chamber Set up and Sampling .............................................................................. 139
4.2.2.3 Confocal Laser Scanning Microscopy ........................................................................................ 140 4.2.2.4 Texture Analysis of Gastric Digesta ........................................................................................... 141
4.2.2.5 Total Protein and Lipid Content Analysis .................................................................................... 141 4.2.2.6 Quantification of Protein Hydrolysis ........................................................................................... 141 4.2.2.7 Protein Identification in Emptied Digesta .................................................................................... 141
4.2.2.8 Cation Exchange Chromatography for Amino Acid Analysis ...................................................... 142 4.2.2.9 Liquid Chromatography coupled to Tandem Mass Spectrophotometry for Amino Acid Analysis . 142
4.2.3 Statistical Analysis ............................................................................................................................. 143
4.3 Results ....................................................................................................................... 143
4.3.1 Gastric pH of the Emptied Digesta ..................................................................................................... 143 4.3.2 Gastric Behaviour .............................................................................................................................. 144
4.3.3 Consistency of the Gastric Coagula ................................................................................................... 150
4.3.4 Nutrient Delivery from the in Vitro Stomach ........................................................................................ 151 4.3.5 Microstructure of Gastric Emptied Aliquots ......................................................................................... 154
4.3.6 Protein Composition of Gastric Emptied Aliquots ............................................................................... 158 4.3.7 Protein Hydrolysis during GI Digestion ............................................................................................... 160 4.3.8 Bioaccessibility and Absorption of AAs............................................................................................... 163
4.4 Discussion ................................................................................................................. 166
4.4.1 Influence of Protein Formulation on Gastric Behaviour ....................................................................... 166 4.4.2 Effect of Gastric Behaviour on Nutrient Delivery and Protein Digestion in the Small Intestine ............. 170 4.4.3 Effect of Gastric Behaviour on AA Bioaccessibility and Absorption ..................................................... 172 4.4.4 Physiological Relevance .................................................................................................................... 175
4.5 Conclusions ............................................................................................................... 176
............................................................................................................................. 177
5.1 Introduction ................................................................................................................ 178
5.2 Materials and Methods .............................................................................................. 180
5.2.1 Materials ............................................................................................................................................ 180 5.2.2 Methods ............................................................................................................................................. 180
5.2.2.1 Milk Processing at Pilot-Plant Scale ........................................................................................... 182

x
5.2.2.2 Semi-Dynamic Gastric Digestion Model ..................................................................................... 184 5.2.2.3 Confocal Laser Scanning Microscopy ........................................................................................ 186
5.2.2.4 Particle Size Distribution ............................................................................................................ 186 5.2.2.5 Total Protein and Lipid Content Analysis in Emptied Aliquots ..................................................... 186 5.2.2.6 OPA Assay for Quantification of Protein Hydrolysis .................................................................... 187 5.2.2.7 SDS-PAGE for Identification of Proteins during Digestion .......................................................... 187 5.2.2.8 Rheological Analysis .................................................................................................................. 187
5.2.2.9 In Vivo Gastric Imaging .............................................................................................................. 187 5.2.2.10 Statistical Analysis ................................................................................................................... 188
5.3 Results ........................................................................................................................ 188
5.3.1 Gastric pH Profile ............................................................................................................................... 188 5.3.2 Gastric Behaviour .............................................................................................................................. 189 5.3.3 Microstructure of the Gastric Emptied Aliquots ................................................................................... 192 5.3.4 Nutrient Delivery of the Gastric Emptied Aliquots ............................................................................... 194 5.3.5 Protein Digestion of the Gastric Emptied Aliquots .............................................................................. 195
5.3.6 In Vivo Intragastric Imaging ................................................................................................................ 197
5.4 Discussion .................................................................................................................. 198
5.4.1 Influence of Process-Induced Changes of milk on Gastric Behaviour ................................................. 198 5.4.2 Effect of Gastric Behaviour on Nutrient Delivery and Protein Digestion .............................................. 203 5.4.3 Physiological Relevance .................................................................................................................... 205
5.5 Conclusion .................................................................................................................. 206
............................................................................................................................. 207
6.1 Introduction ................................................................................................................. 208
6.2 Materials and Methods ............................................................................................... 211
6.2.1 Materials ............................................................................................................................................ 211
6.2.2 Methods ............................................................................................................................................. 211
6.2.2.1 Semi-Dynamic Gastric Digestion ................................................................................................ 211 6.2.2.2 Pepsin Activity Analysis ............................................................................................................. 214
6.2.2.3 OPA Assay for Quantification of Protein Hydrolysis .................................................................... 214 6.2.2.4 SDS-PAGE for Identification of Proteins during Digestion .......................................................... 214 6.2.2.5 Scanning Electron Microscopy ................................................................................................... 214 6.2.2.6 Pepsin Labelling ........................................................................................................................ 215
6.2.2.7 FRAP Experiments .................................................................................................................... 215
6.3 Results ........................................................................................................................ 216
6.3.1 Pepsin Activity.................................................................................................................................... 216
6.3.2 Protein Hydrolysis .............................................................................................................................. 217 6.3.3 Microstructure of Gastric Digesta ....................................................................................................... 218 6.3.4 FRAP Experiment .............................................................................................................................. 219
6.4 Discussion .................................................................................................................. 220
6.4.1 Pepsin Action is Influenced by the Coagulum Structure ..................................................................... 220 6.4.2 Pepsin Diffusion by FRAP .................................................................................................................. 222
6.5 Conclusion .................................................................................................................. 223
............................................................................................................................. 224
7.1 Introduction ................................................................................................................. 225

xi
7.2 Materials and Methods .............................................................................................. 227
7.2.1 Materials ............................................................................................................................................ 227
7.2.2 Methods ............................................................................................................................................. 228 7.2.2.1 Preparation of Samples ............................................................................................................. 230 7.2.2.2 Gastrointestinal in Vitro Digestion .............................................................................................. 230
7.2.2.2.1 Semi-Dynamic in Vitro Gastric Digestion............................................................................ 230 7.2.2.2.2 Gastric Emptying Simulation .............................................................................................. 231 7.2.2.2.3 Small Intestinal in Vitro Digestion ....................................................................................... 232
7.2.2.3 Confocal Laser Scanning Microscopy ........................................................................................ 232 7.2.2.4 Particle Size Distribution ............................................................................................................ 233
7.2.2.5 OPA Assay for Quantification of Protein Hydrolysis ................................................................... 233 7.2.2.6 Size-Exclusion Liquid Chromatography Analysis ........................................................................ 233 7.2.2.7 Lipid Analysis ............................................................................................................................. 234
7.2.2.7.1 Total Lipid Extraction ......................................................................................................... 234 7.2.2.7.2 Extraction of Different Lipid Classes .................................................................................. 235
7.2.2.7.3 Derivatization of Lipid Extraction Fractions ........................................................................ 236
7.2.2.7.4 Analysis of Fatty Acid Methyl Esters .................................................................................. 237 7.2.2.8 Dynamic Gastric Digestion ......................................................................................................... 237
7.2.2.9 Statistics .................................................................................................................................... 237
7.3 Results ....................................................................................................................... 238
7.3.1 Gastric pH Profile using the Semi-Dynamic Model ............................................................................. 238 7.3.2 Behaviour in the Gastric Compartment............................................................................................... 239
7.3.3 Protein Hydrolysis Analysis ................................................................................................................ 240 7.3.4 Lipid Analysis ..................................................................................................................................... 243
7.4 Discussion ................................................................................................................. 245
7.4.1 Simulation of Human Gastric Behaviour ............................................................................................. 245
7.4.2 Influence of Gastric Digestion Conditions on Food Restructuring ....................................................... 246 7.4.3 Influence of Gastric Behaviour on Small Intestinal Protein Digestion .................................................. 249
7.4.4 Influence of Gastric Behaviour on Small Intestinal Lipid Digestion ...................................................... 251 7.4.5 Possible Link to Physiological Responses .......................................................................................... 252
7.4.6 Comparison between in Vitro Dynamic and Semi-Dynamic Gastric Models........................................ 255
7.5 Conclusion ................................................................................................................. 258
............................................................................................................................. 259
8.1 General conclusions .................................................................................................. 260
8.2 Future perspectives ................................................................................................... 264
References .......................................................................................................................... 268
Appendices ......................................................................................................................... 289

xii
List of Figures
Figure 1.1 Structural elements and relevant length scales of milk, as an example of
the concept of food matrix, i.e. the arrangement and interactions of structural elements
at multiscales. Electron micrographs of an individual casein micelle and milk fat
globule are from Dalgleish et al. (2004) and Luo et al. (2014), respectively............ 33
Figure 1.2 Schematic representation of the approach showing the role of gastric
digestion in controlling nutrient delivery and absorption by the restructuring of food in
the gastric conditions. This might, subsequently, exert different physiological
responses that can be helpful to specific population groups. Images of the stomach
by magnetic resonance imaging of are from Mackie et al. (2013). .......................... 35
Figure 1.3 Schematic representation of the structure of casein micelle based on A)
sub-micelle model and B) nanocluster model (Adapted from De Kruif et al. (2012)).
.............................................................................................................................. 39
Figure 1.4 Schematic representation of the main dairy products produced by milk
processing showing the changes in matrix structure (image taken from Truong et al.
(2016)). .................................................................................................................. 41
Figure 1.5 Schematic representation of the major physiological factors that take place
during digestion in the upper GI tract. .................................................................... 43
Figure 1.6 Schematic diagram of the stomach and its main parts. ......................... 45
Figure 1.7. Human Gastric Simulator. (1) Motor (2) Gastric compartment (3) Mesh
bag (4) Simulating secretion tubes (5) Teflon roller set (6) Conveying belt (7) Insulated
chamber. From Kong et al. (2010). ........................................................................ 49
Figure 1.8 Schematic diagram for both proteins and lipids of the processes of
digestion in mouth, stomach and intestine, and the process of absorption through the
epithelium .............................................................................................................. 52
Figure 2.1 Schematic representation of the main mechanisms of instability of an oil-
in-water (O/W) emulsion, i.e. creaming sedimentation, flocculation, coalescence and
phase separation. (Yellow and blue represent lipid and water phases, respectively).
.............................................................................................................................. 76
Figure 2.2 Lab scale one-stage valve homogeniser, APV 1000 (SPX Flow
Technology, North Carolina, USA). ........................................................................ 78
Figure 2.3 MicroThermics® tubular heat exchanger (MicroThermics®, NC, U.S.A).
using an in-line two-stage valve homogeniser, Model NS 2006H (Niro Soavi, Parma,
Italy). ...................................................................................................................... 78

xiii
Figure 2.4 Two-stage homogeniser, Gaulin Labor, Lab 60 type (APV Gaulin GmbH,
Lubeck, Germany). ................................................................................................. 79
Figure 2.5 Schematic representation of the homogenisation mechanism by high-
pressure valve approach. ....................................................................................... 79
Figure 2.6 Schematic representation of the use of Ussing Chamber technique to
study protein absorption after gastric and intestinal digestion. A tissue section of
intestinal epithelium containing epithelium cells separates the apical and basolateral
sides of the Ussing chamber. (Ussing chamber diagram from Verhoeckx et al. (2015)).
............................................................................................................................... 82
Figure 2.7 (A) The setup of the Ussing chamber and (B) the electrical system. (C) A
slider used for mounting a section of murine intestine and (D) an example of the
murine digestive tract used for dissecting a section. ............................................... 83
Figure 2.8 Mastersizer 3000 equipped with a 300 RF lens with a wet dispersion unit
(Hydro MV), supplied by Malvern Instruments Ltd, Worcestershire, UK. ................ 85
Figure 2.9 AR 2000 EX Rheometer supplied by TA Instruments, Crawley, UK. ..... 86
Figure 2.10 (A)Texture analyser TA.XT Plus supplied by Stable Micro Systems,
Surrey, UK. (B) Typical curve obtained in the penetration test that was performed. 87
Figure 2.11 Confocal scanning laser microscopes, (A) Model Leica TCS SP5,
supplied by Leica Microsystems, Baden-Württemberg, Germany and (B) Zeiss LSM
780 confocal (Carl Zeiss, Inc.) ................................................................................ 88
Figure 2.12 LECO FP628 Nitrogen analyser supplied by LECO Corp., St. Joseph, MI,
USA. ...................................................................................................................... 89
Figure 2.13 Schematic representation of SDS-PAGE procedure for protein
separation. ............................................................................................................. 91
Figure 2.14 Representation of OPA reaction in a molecular level. ......................... 92
Figure 2.15 Jeol JLC-500/V AminoTac™ amino acid analyser supplied by Joel Ltd.,
Herts, UK. .............................................................................................................. 95
Figure 2.16 Chromatogram of the separation of each amino acid in a standard
solution using cation EC. ........................................................................................ 95
Figure 2.17 Agilent 6490 triple quadrupole MS equipped with an Agilent 1290 HPLC
system supplied by Agilent Technologies, Santa Clara, CA, USA. ......................... 96
Figure 2.18 CEM Smart Trac System-5 supplied by CEM Corp., Matthews, N.C.,
USA. ...................................................................................................................... 97

xiv
Figure 2.19 Schematic representation of the principle of NMR for the determination
of lipid content (adapted from the web site cem.com). ........................................... 98
Figure 2.20 Schematic representation of the protocol for the determination of lipid
content (taken from the web site cem.com) ............................................................ 99
Figure 2.21 7890B Gas Chromatography System equipped with a model 7694
autosampler and 5977A mass spectrometry detector (Agilent Technologies, USA).
............................................................................................................................ 101
Figure 2.22 Example of chromatogram obtained in a lipid standard mix by GC-MS
............................................................................................................................ 101
Figure 3.1. Set up of the semi-dynamic gastric model. ........................................ 107
Figure 3.2 Example of a pH curve of gastric digestion under static model conditions
and a zoom of the curve during the first 100 seconds of digestion. ...................... 110
Figure 3.3 Programmed pH curve for 9.5% SMP in phosphate buffer adding 0.5 mol/L
HCl. Note: a magnetic stirrer was used as mixing system. ................................... 111
Figure 3.4 Programmed pH curve with different endpoints using 9.5% SMP including
oral and gastric phases. Pepsin solution was prepared at 2,000 U/mL (in final volume)
and delivered by means of a dosing device following a constant rate of 0.0083 mL/min.
The solution 0.5 mol/L HCl was added by another dosing device. ........................ 112
Figure 3.5 Behaviour during gastric digestion of SMP in (A) dynamic pH and (B) static
pH. ....................................................................................................................... 112
Figure 3.6 SDS-PAGE of the samples taken during gastric digestion in (A) dynamic
pH and (B) static pH. ............................................................................................ 113
Figure 3.7 pH profile, in dynamic conditions, of different concentrations of SMP (20,
10 and 5%). ......................................................................................................... 113
Figure 3.8 In a sample of 20% SMP, (A) three measurements of the volume of HCl
needed to reach pH 2, (B) pH curve using a constant delivery of the measured volume
of HCl during gastric digestion time. ..................................................................... 114
Figure 3.9 pH profile of 10% SMP using an orbital shaker and a magnetic stirrer inside
of the vessel. ........................................................................................................ 115
Figure 3.10 Behaviour of 10% SMP after 2 hours of gastric digestion using an orbital
shaker as mixing system. Yellow arrow pointing the clot on the bottom of the vessel.
............................................................................................................................ 115
Figure 3.11 Gastric behaviour of a sample (UHT+homogenisation milk) used in
Chapter 5, (A) before mixing with syringe and (B) after mixing with syringe. ........ 116

xv
Figure 3.12 Different lab tools that were used to simulate the gastric emptying, (A)
pipette tip, (B) serological pipette and (C) plastic syringe with attached tubing (in-
house made). ....................................................................................................... 119
Figure 3.13 Schematic diagram of gastric digestion using the semi-dynamic model
having five gastric emptying points (GE) and the subsequent intestinal digestion of
each gastric emptied aliquot, during which several aliquots can be taken during time
(e.g. after 5, 30 and 60 min of intestinal digestion). .............................................. 119
Figure 3.14 Examples of the paddle stirrers that can be used in the semi-dynamic
model, the dimensions of which will depend on the geometry of the reaction vessel
and they can be 3D printed. ................................................................................. 121
Figure 3.15 Example of the fluctuations in pH recording measured in the reaction
vessel. The pH record was performed using the pH electrode attached to the pH
titrator (Titrando, Metrohm). This graph corresponds to a sample of raw milk used in
Chapter 5. ............................................................................................................ 124
Figure 3.16 Example of the pH profile of some samples (used in Chapter 4), (A)
values obtained from inside the simulated stomach by the pH probe attached to the
pH titrator and (B) pH values from the emptied aliquots using an external pH meter
after the step of mixing with Ultraturrax homogeniser. .......................................... 124
Figure 3.17 Examples of the sample losses during gastric digestion experiments in
(A) serological pipette, (B) tubing of plastic syringe and (C) reaction vessel. ........ 126
Figure 3.18. Overview and flow diagram of the simulated semi-dynamic in vitro
digestion method included in the consensus manuscript within the INFOGEST
network that will be published. .............................................................................. 127
Figure 4.1 Schematic representation of the experimental work for Chapter 4. ..... 133
Figure 4.2. Change in pH during gastric digestion using the semi-dynamic model,
measured in the emptied aliquots, of (A) protein solution samples, (B) emulsion
samples with 2% lipid, (C) samples with C:W ratio of 1 (i.e. formulation 50C:50W)
containing 0%, 2%, 4% and 8% lipid in the emptied aliquots expressed as function of
the GE points, and (D) same pH values than in graph (C) but expressed as function
of the actual gastric digestion time. Gastric digestion time is as indicated in A, B and
D graphs and the time before the start of the digestion (-20 min) corresponds to the
basal stage. In C, the pH values are referred to the basal stage (before gastric
digestion), initial (t=0, sample including oral phase and basal volumes) and the
different GE samples (GE1-GE5) corresponding to each gastric emptying (GE) point.
The time values are displayed in Table 4.3. Values are presented as means ± SD
xvi
(n=6). Significance difference in pH between samples in each GE point was
determined by one-way ANOVA, p ≤ 0.05 (*), p ≤ 0.01 (**), p ≤ 0.001 (***) and p ≤
0.0001 (*****). ...................................................................................................... 144
Figure 4.3 Gastric behaviour of the protein solution samples displayed in the vessel
of the gastric model at 16, 48 and 80 min, corresponding to the GE1, GE3 and GE5
time points, respectively. Figures from M to P correspond to the gastric behaviour
displayed in a petri dish at 32 min (GE2 time point). The images correspond to the
behaviour immediately before emptying. .............................................................. 146
Figure 4.4 Gastric behaviour of the emulsion samples displayed in the vessel of the
gastric model at 25, 75 and 125 min, corresponding to the GE1, GE3 and GE5 time
points, respectively. Figures from M to P correspond to the gastric behaviour
displayed in a petri dish at 50 min (GE2 time point). The images correspond to the
behaviour immediately before emptying. .............................................................. 148
Figure 4.5 Gastric behaviour of emulsion samples with higher lipid content (4% and
8%) displayed in the vessel of the gastric model at GE1, GE3 and GE5 points. Figures
G and H correspond to the gastric behaviour displayed in a petri dish at 68 and 104
min (GE2 time point). The images correspond to the behaviour immediately before
emptying. ............................................................................................................. 149
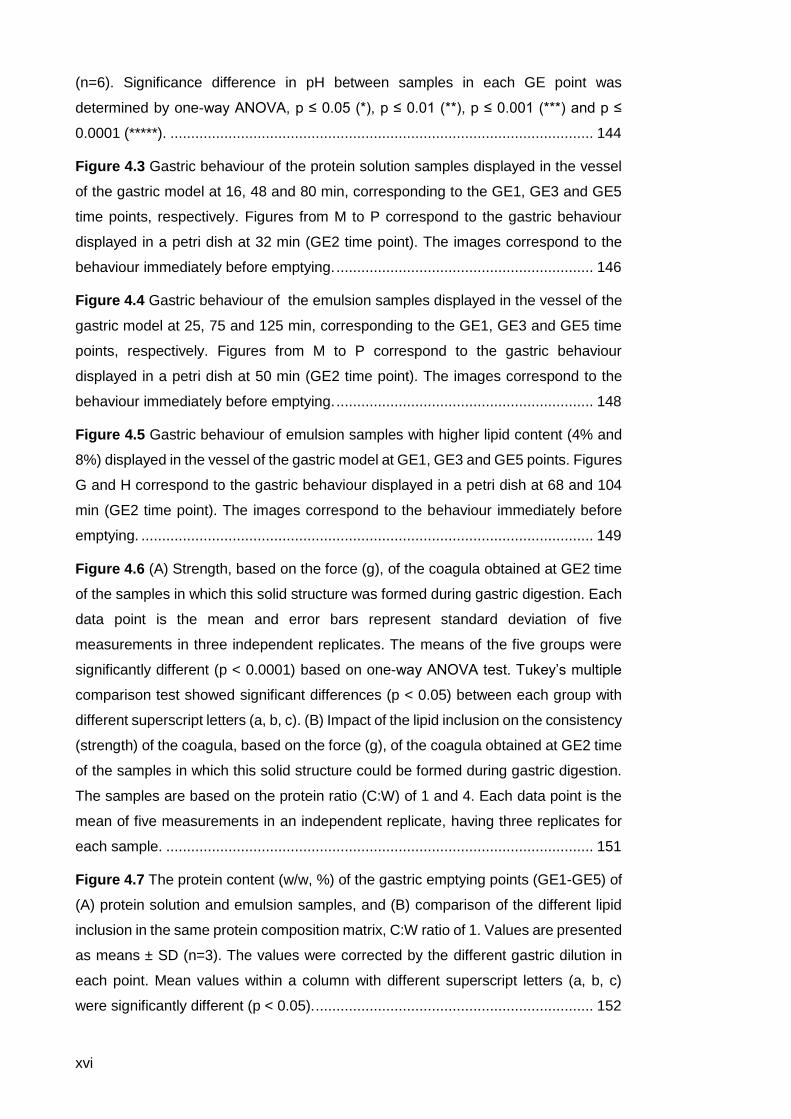
Figure 4.6 (A) Strength, based on the force (g), of the coagula obtained at GE2 time
of the samples in which this solid structure was formed during gastric digestion. Each
data point is the mean and error bars represent standard deviation of five
measurements in three independent replicates. The means of the five groups were
significantly different (p < 0.0001) based on one-way ANOVA test. Tukey’s multiple
comparison test showed significant differences (p < 0.05) between each group with
different superscript letters (a, b, c). (B) Impact of the lipid inclusion on the consistency
(strength) of the coagula, based on the force (g), of the coagula obtained at GE2 time
of the samples in which this solid structure could be formed during gastric digestion.
The samples are based on the protein ratio (C:W) of 1 and 4. Each data point is the
mean of five measurements in an independent replicate, having three replicates for
each sample. ....................................................................................................... 151
Figure 4.7 The protein content (w/w, %) of the gastric emptying points (GE1-GE5) of
(A) protein solution and emulsion samples, and (B) comparison of the different lipid
inclusion in the same protein composition matrix, C:W ratio of 1. Values are presented
as means ± SD (n=3). The values were corrected by the different gastric dilution in
each point. Mean values within a column with different superscript letters (a, b, c)
were significantly different (p < 0.05). ................................................................... 152
xvii
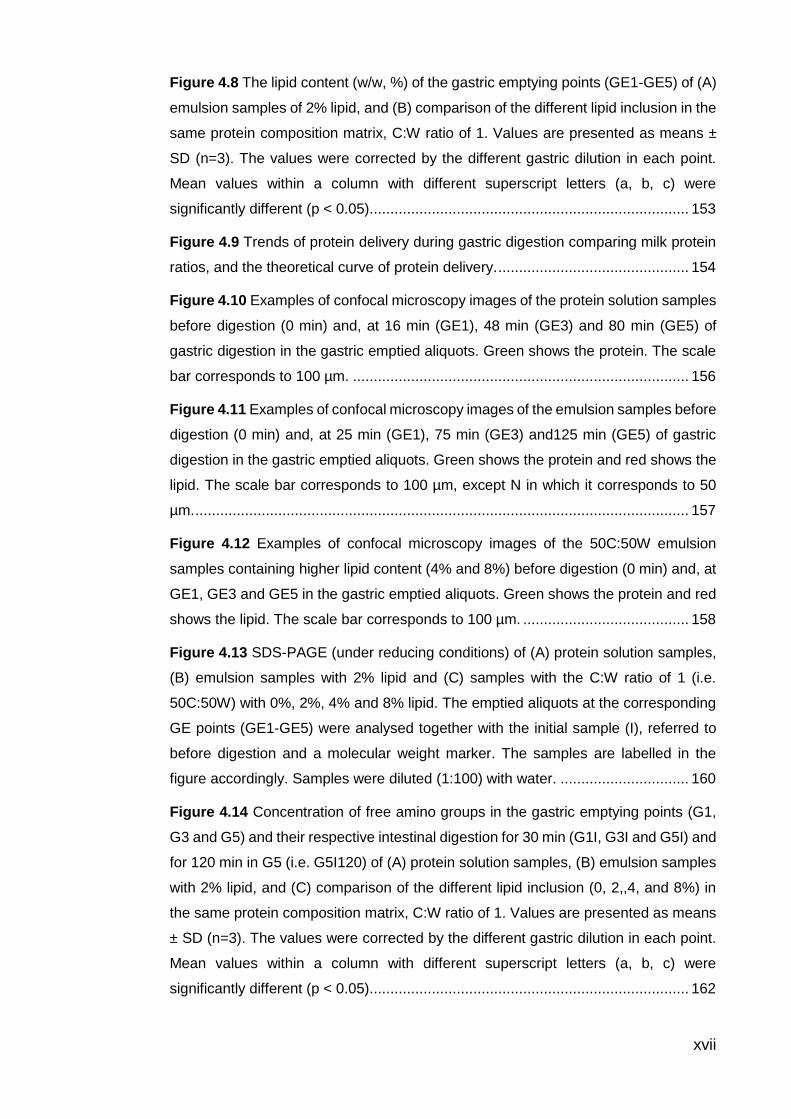
Figure 4.8 The lipid content (w/w, %) of the gastric emptying points (GE1-GE5) of (A)
emulsion samples of 2% lipid, and (B) comparison of the different lipid inclusion in the
same protein composition matrix, C:W ratio of 1. Values are presented as means ±
SD (n=3). The values were corrected by the different gastric dilution in each point.
Mean values within a column with different superscript letters (a, b, c) were
significantly different (p < 0.05)............................................................................. 153
Figure 4.9 Trends of protein delivery during gastric digestion comparing milk protein
ratios, and the theoretical curve of protein delivery. .............................................. 154
Figure 4.10 Examples of confocal microscopy images of the protein solution samples
before digestion (0 min) and, at 16 min (GE1), 48 min (GE3) and 80 min (GE5) of
gastric digestion in the gastric emptied aliquots. Green shows the protein. The scale
bar corresponds to 100 µm. ................................................................................. 156
Figure 4.11 Examples of confocal microscopy images of the emulsion samples before
digestion (0 min) and, at 25 min (GE1), 75 min (GE3) and125 min (GE5) of gastric
digestion in the gastric emptied aliquots. Green shows the protein and red shows the
lipid. The scale bar corresponds to 100 µm, except N in which it corresponds to 50
µm. ....................................................................................................................... 157
Figure 4.12 Examples of confocal microscopy images of the 50C:50W emulsion
samples containing higher lipid content (4% and 8%) before digestion (0 min) and, at
GE1, GE3 and GE5 in the gastric emptied aliquots. Green shows the protein and red
shows the lipid. The scale bar corresponds to 100 µm. ........................................ 158
Figure 4.13 SDS-PAGE (under reducing conditions) of (A) protein solution samples,
(B) emulsion samples with 2% lipid and (C) samples with the C:W ratio of 1 (i.e.
50C:50W) with 0%, 2%, 4% and 8% lipid. The emptied aliquots at the corresponding
GE points (GE1-GE5) were analysed together with the initial sample (I), referred to
before digestion and a molecular weight marker. The samples are labelled in the
figure accordingly. Samples were diluted (1:100) with water. ............................... 160
Figure 4.14 Concentration of free amino groups in the gastric emptying points (G1,
G3 and G5) and their respective intestinal digestion for 30 min (G1I, G3I and G5I) and
for 120 min in G5 (i.e. G5I120) of (A) protein solution samples, (B) emulsion samples
with 2% lipid, and (C) comparison of the different lipid inclusion (0, 2,,4, and 8%) in
the same protein composition matrix, C:W ratio of 1. Values are presented as means
± SD (n=3). The values were corrected by the different gastric dilution in each point.
Mean values within a column with different superscript letters (a, b, c) were
significantly different (p < 0.05)............................................................................. 162

xviii
Figure 4.15 Total AAs content (mg/mL) in the gastric emptied aliquots G1, G3 and
G5, and their respective small intestinal digestion for 30 min (G1I, G3I and G5I), and
the intestinal digestion of G5 for 120 min (G5I120). The protein solution and the
emulsion (2% lipid) samples are represented in solid line and broken line,
respectively. Values are presented as means ± SD (n=3). The values were corrected
by the different gastric dilution in each point. Significance difference in AAs content
between samples in each GE point was determined by one-way ANOVA, p ≤ 0.05 (*),
p ≤ 0.01 (**), p ≤ 0.001 (***) and p ≤ 0.0001 (*****). .............................................. 163
Figure 4.16 Concentration of Leu (µg/mL) of the (A, a) protein solution samples, (B,
b) emulsions with 2% lipid and (C, c) comparison of the different lipid inclusion (0, 2,
4 and 8%) in the same protein composition matrix, C:W ratio of 1 during the small
intestinal digestion of the digesta related to GE1 (upper case) and GE5 (lower case),
both apical and basolateral sides in solid and broken line, respectively, using Ussing
chamber. Values are presented as means ± SD of two independent determinations.
Significance difference in Leu content between samples in each GE point was
determined by one-way ANOVA, p ≤ 0.05 (*), p ≤ 0.01 (**), p ≤ 0.001 (***) and p ≤
0.0001 (*****), black relates to the apical side axe and red relates to the basolateral
side axe. .............................................................................................................. 165
Figure 5.1 Flow diagram of the four main steps of the experimental procedure of the
study in relation to Chapter 5. Each step has been described in the corresponding
Methods section. .................................................................................................. 181
Figure 5.2 Schematic representation of the molecular structure of the samples of
studied after the different processing combining homogenisation and heat processes.
............................................................................................................................ 183
Figure 5.3 Change in pH of milk aliquots emptied from the gastric digestion in the
semi-dynamic model corresponding to each gastric emptying (GE) point. The time
represents an approximation of the actual values displayed in Table 5.2. The pH
values are referred to the basal stage (before gastric digestion), initial (milk sample
including oral phase and basal volumes) and the different GE samples (GE1-GE5).
Each data point is the mean of 2 independent determinations. Significance difference
in pH between milk samples in each GE point was determined by one-way ANOVA,
p < 0.05 (*). .......................................................................................................... 189
Figure 5.4 Images of the milk samples at approximately 36 and 182 min of gastric
digestion (displayed in a petri dish), corresponding to the behaviour right before the
first and last gastric emptying points. Raw milk (A, D), pasteurised milk (B, E), UHT
milk (C, F), homogenised milk (G, J), pasteurised+homogenised milk (H, K) and

xix
UHT+homogenised milk (I, L). Note: the diameter of the petri dish in the samples at
36 min and 182 min was 13.5 cm and 8.5 cm, respectively. ................................. 190
Figure 5.5 Images of the milk samples at approximately 36 and 182 min displayed in
the reaction vessel of the gastric model. Raw milk (A, D), pasteurised milk (B, E), UHT
milk (C, F), homogenised milk (G, J), pasteurised+homogenised milk (H, K) and
UHT+homogenised milk (I, L). The images correspond to the behaviour right before
the emptying corresponding to that time, i.e. GE1 at 36 min and GE5 at 182 min. 191
Figure 5.6 Examples of confocal microscopy images of the milk samples before
digestion (Initial) and, at about 36 min (GE1) and 182 min (GE5) of gastric digestion.
Raw milk (A, D, G), pasteurised milk (B, E, H), UHT milk (C, F, I), homogenised milk
(J, M, P), pasteurised+homogenised milk (K, N, Q), UHT+homogenised milk (L, O,
R). Red shows the lipid and green shows the protein. The scale bar corresponds to
75 µm. .................................................................................................................. 193
Figure 5.7 The nutrient content (%, w/w) in terms of (A) protein and (B) lipid of initial
(before digestion) and the gastric emptying point (GE1-GE5). Each data point is the
mean and error bars represent standard deviation of two independent replicates. The
values were corrected by the different gastric dilution in each point. Mean values
within a column with different superscript letters (a, b, c) were significantly different (p
< 0.05). ................................................................................................................. 195
Figure 5.8 Concentration of free amino groups per mass of total protein in sample;
initial (before digestion) and gastric emptying points (GE1-GE5). Each data point is
the mean and error bars represent standard deviation of two independent replicates.
The values were corrected by the different gastric dilution in each point. Mean values
within a column with different superscript letters (a, b, c) were significantly different (p
< 0.05). ................................................................................................................. 196
Figure 5.9 SDS-PAGE (under reducing conditions) of the milk samples, initial (I)
referred to before digestion and the gastric emptying points (GE1-GE5), and a
molecular weight marker. The samples are labelled in the figure accordingly. The
protein content in each sample was 0.1%. ........................................................... 197
Figure 5.10 . In vivo images taken by MiroCam® of (A) emptied human stomach and
(B) after 160 min gastric digestion of raw whole milk. ........................................... 198
Figure 5.11 Lipid/protein ratio (w/w) of both serum and coagulum in the digesta at
approximately 36 min of digestion (time referred to GE1 point). Mean values within a
column with different superscript letters (a, b, c, d) were significantly different (p <
0.05). .................................................................................................................... 199
xx
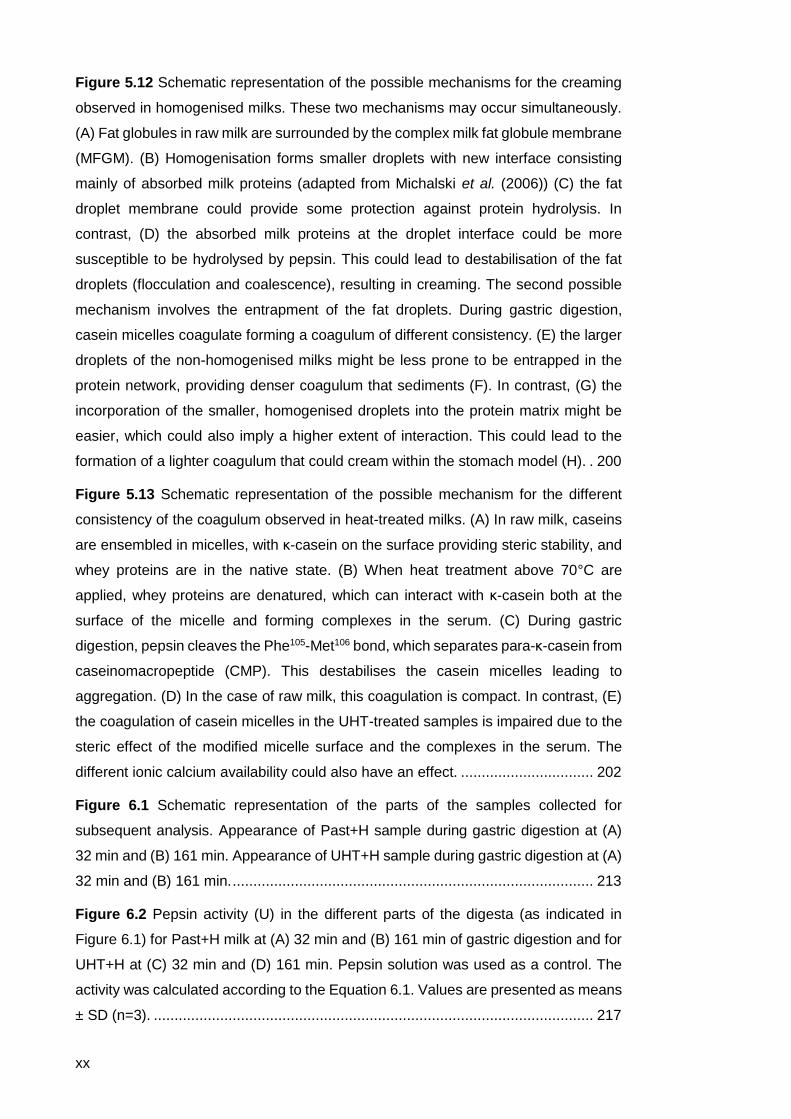
Figure 5.12 Schematic representation of the possible mechanisms for the creaming
observed in homogenised milks. These two mechanisms may occur simultaneously.
(A) Fat globules in raw milk are surrounded by the complex milk fat globule membrane
(MFGM). (B) Homogenisation forms smaller droplets with new interface consisting
mainly of absorbed milk proteins (adapted from Michalski et al. (2006)) (C) the fat
droplet membrane could provide some protection against protein hydrolysis. In
contrast, (D) the absorbed milk proteins at the droplet interface could be more
susceptible to be hydrolysed by pepsin. This could lead to destabilisation of the fat
droplets (flocculation and coalescence), resulting in creaming. The second possible
mechanism involves the entrapment of the fat droplets. During gastric digestion,
casein micelles coagulate forming a coagulum of different consistency. (E) the larger
droplets of the non-homogenised milks might be less prone to be entrapped in the
protein network, providing denser coagulum that sediments (F). In contrast, (G) the
incorporation of the smaller, homogenised droplets into the protein matrix might be
easier, which could also imply a higher extent of interaction. This could lead to the
formation of a lighter coagulum that could cream within the stomach model (H). . 200
Figure 5.13 Schematic representation of the possible mechanism for the different
consistency of the coagulum observed in heat-treated milks. (A) In raw milk, caseins
are ensembled in micelles, with κ-casein on the surface providing steric stability, and
whey proteins are in the native state. (B) When heat treatment above 70°C are
applied, whey proteins are denatured, which can interact with κ-casein both at the
surface of the micelle and forming complexes in the serum. (C) During gastric
digestion, pepsin cleaves the Phe105-Met106 bond, which separates para-κ-casein from
caseinomacropeptide (CMP). This destabilises the casein micelles leading to
aggregation. (D) In the case of raw milk, this coagulation is compact. In contrast, (E)
the coagulation of casein micelles in the UHT-treated samples is impaired due to the
steric effect of the modified micelle surface and the complexes in the serum. The
different ionic calcium availability could also have an effect. ................................ 202
Figure 6.1 Schematic representation of the parts of the samples collected for
subsequent analysis. Appearance of Past+H sample during gastric digestion at (A)
32 min and (B) 161 min. Appearance of UHT+H sample during gastric digestion at (A)
32 min and (B) 161 min. ....................................................................................... 213
Figure 6.2 Pepsin activity (U) in the different parts of the digesta (as indicated in
Figure 6.1) for Past+H milk at (A) 32 min and (B) 161 min of gastric digestion and for
UHT+H at (C) 32 min and (D) 161 min. Pepsin solution was used as a control. The
activity was calculated according to the Equation 6.1. Values are presented as means
± SD (n=3). .......................................................................................................... 217

xxi
Figure 6.3 (A) SDS-PAGE (under reducing conditions) of the studied parts of the
digesta of Past+H and UHT+H samples, and a molecular weight marker. The samples
are labelled in the figure accordingly. (B) Free amino group concentration (mM/g
sample) of the different parts of the digesta of Past+H and UHT+H samples. Values
are presented as means ± SD (n=3)..................................................................... 218
Figure 6.4 Examples of SEM micrographs of the coagula of Past+H sample at (A-D)
32 min of gastric digestion and (E-H)161 min, and UHT+H at (I-L) 32 min and (M-P)
161 min. Scale bars are indicated below each micrograph. .................................. 219
Figure 6.5 Fluorescence intensity of the recovery period after bleaching in FRAP
experiment for (A) Past+H and (B) UHT+H after 32 min of gastric digestion at different
part of the digesta. ............................................................................................... 220
Figure 7.1 Schematic diagram flow of the experimental procedure for Chapter 7. 229
Figure 7.2 Volume (mL) contained in the stomach model as a function of time (min)
of the Semi-Solid (solid line) and Liquid (broken line) samples. The data was obtained
by downscaling the in vivo data of the referred study (Mackie et al., 2013). Each
gastric emptying (GE) aliquot is indicated in the graph. The table (right hand side)
presents the sample names and their corresponding GE aliquots in each time point.
............................................................................................................................. 231
Figure 7.3 Example of a common chromatogram obtained in samples by size-
exclusion chromatography analysis. ..................................................................... 234
Figure 7.4 Schematic diagram of the separation of lipid classes using solid phase
extraction with aminopropyl columns. ................................................................... 236
Figure 7.5 pH profile during gastric digestion in the semi-dynamic model, using pepsin
and gastric lipase, of the Semi-Solid (solid line) and Liquid (broken line) samples. pH
was measured in the digesta inside of the reaction vessel. Values are presented as
means ± SD (n=3). ............................................................................................... 238
Figure 7.6 pH profile during gastric digestion in the semi-dynamic model of (A) the
Semi-Solid and (B) Liquid samples with pepsin and lipase (orange line), pepsin (green
line) and no enzyme (black line). pH was measured in the digesta inside of the
reaction vessel. Values are presented as means ± SD (n=3). .............................. 239
Figure 7.7 Images of Semi-Solid (A-B) and Liquid (C-D) samples in the initial state
(A and C) and after 111.1 min (B) and after 110.3 min (D) of gastric digestion in the
semi-dynamic gastric model using pepsin and gastric lipase. Representation of
microstructure in the liquid sample before gastric digestion (E) and, the upper cream
layer (F) and the bottom aqueous layer (G) after gastric digestion. Proteins and lipids
xxii
are present in green and red, respectively. To note that the yellow block seen in
images B and D corresponds to the pH probe. ..................................................... 240
Figure 7.8 Surface plot representation of concentration of free amino groups (mmol/L)
for each gastric emptying aliquot (GE) at 0 (referred to end point of gastric digestion),
1, 30 and 60 min after small intestinal digestion for both (A) Semi-Solid and (B) Liquid
samples. The values were corrected by the different gastric and intestinal dilution in
each point. The data represents the mean of three independent replicates.......... 241
Figure 7.9 Peptide analysis of (A) Semi-Solid and (B) Liquid samples at the different
GE aliquots after 0 (referred to end point of gastric digestion), 1, 30 and 60 min small
intestinal digestion. This is referred to the aliquots from the gastric digestion in the
semi-dynamic model using both gastric lipase and pepsin. The values were corrected
by the different gastric and intestinal dilution in each point. Values are presented as
means ± SD (n=3). ............................................................................................... 242
Figure 7.10 Peptide analysis of (A) Semi-Solid and (B) Liquid samples at the different
GE aliquots at 1, 30 and 60 min after small intestinal digestion. The values are referred
to the intestinal digestion after gastric digestion using both gastric lipase and pepsin
with subtraction of the blank, i.e. only enzyme included. The values were corrected
by the different gastric and intestinal dilution in each point. Values are presented as
means ± SD (n=3). ............................................................................................... 243
Figure 7.11 Levels (expressed as mass percentage) of lipid classes (TAG, DAG,
MAG and FFA) in each gastric emptying (GE) aliquot at 1, 30 and 60 min after small
intestinal digestion for both Semi-Solid and Liquid samples (mean of 3 replicates).
The values were corrected by the different gastric and intestinal dilution in each point.
The SD averages for Semi-Solid sample are 2.5, 5.3, 4.5 and 1.6% for MAG, FFA,
TAG and DAG respectively. The SD averages for liquid sample are 1.7, 7.6, 7.3 and
2.4% for MAG, FFA, TAG and DAG respectively ................................................. 244
Figure 7.12 pH profile of both Semi-Solid (solid line) and Liquid (broken line) samples
where gastric emptying was not included. pH was measured in the digesta inside of
the reaction vessel. The gastric digestion was carried out for 2 hours using the semi-
dynamic gastric model (gastric basal volume was not considered). Values are
presented as means ± SD (n=5). ......................................................................... 246
Figure 7.13 Comparison of the gastric behaviour in the Liquid sample obtained using
the semi-dynamic model at (A) 29.7 min and (B) 111.1 min of gastric digestion and
(C) MRI image reported in Mackie et al. (2013) showing the gastric digestion of liquid
sample at 25 min of gastric digestion (human stomach was highlighted). This
illustrates the colloidal behaviour of phase separation in both digestion systems. 248
xxiii
Figure 7.14 Comparison of the gastric behaviour in the Semi-Solid sample obtained
using (A) the semi-dynamic model at 5.9 min of gastric digestion and (B) MRI image
reported in Mackie et al. (2013) showing the gastric digestion of liquid sample at 5 min
of gastric digestion (human stomach was highlighted). This illustrated the colloidal
behaviour of sedimentation in both digestion systems. ......................................... 248
Figure 7.15 Schematic representation of the molecular mechanisms causing the
outcomes obtained in Semi-Solid sample. (A) Semi-Solid sample is a complex protein
matrix in which lipid droplets are entrapped. (B)This sample enters in the stomach,
and is located in the bottom part within liquid phase of water and gastric fluids. (C)
There is very limited phase separation and prolonged nutrient entrapment. (D) There
is an early nutrient emptying together with the liquid phase of water and secretions,
leading to fast lipid and protein hydrolysis. ........................................................... 249
Figure 7.16 Schematic representation of the molecular mechanisms causing the
outcomes obtained in Liquid sample. (A) Liquid sample is an oil in water emulsion.
(B)This sample enters in the stomach and is mixed with gastric secretions. (C) There
are changes in interfacial composition of the droplet due to the gastric environment,
causing protein destabilisation and precipitation. (D) There is some coalescence (E)
There is phase separation, in which the cream layer is located in the top, leading to
the delay of lipid emptying and lipolysis in the small intestine. .............................. 249
Figure 7.17 Representation of potentially absorbable nutrients, (A) protein and (B)
lipid, during the digestion time. Absorbable protein refers to the free amino group
levels obtained, and absorbable lipid refers to the sum of the amount of FFA and MAG
obtained. This representation is based on the data in Figure 7.8 and Figure 7.11 but
expressed in linear time (values are presented as means ± SD of three replicates). p
< 0.001 (***); p < 0.01 (**); p < 0.05 (*). ................................................................ 254
Figure 7.18 pH profile obtained in (A) HGS and (B) semi-dynamic model, solid line
for Semi-Solid sample and broken line for Liquid sample. .................................... 255
Figure 7.19 Particle size obtained in the HGS (A,B) and semi-dynamic model (C,D)
for both Semi-Solid (A,C) and Liquid samples (B,D). ............................................ 256
Figure 7.20 Solid content (%) of the emptied digesta during gastric digestion in HGS,
solid line for Semi-Solid sample and broken line for Liquid sample. ...................... 257
Figure 7.21 Nitrogen and lipid content (%), as compared to the original sample, of the
digesta retained in the HGS during gastric digestion for (A) Semi-Solid and (B) Liquid
samples................................................................................................................ 257
xxiv
Figure 7.22 Degree of hydrolysis obtained in the HGS values express in
absorbance(A,B) and the semi-dynamic model values expressed in mmol/L of amino
groups (C,D), for both Semi-Solid (A,C) and Liquid (B,D) samples. ..................... 257
Figure 8.1 Schematic representation of how the initial structure of casein micelle can
be modified by formulation (inclusion of lipid) and processing (homogenisation and
heat treatment), comparing to their native state and how these changes affect the
structure that is formed in the stomach. The latter is shown by schematic
representation and images of digesta obtained in the different studies. ............... 262
xxv
List of Tables
Table 3.1 Preparation of the simulated salivary fluid (SSF), 1.25x concentrated, for
the simulation of the oral phase. ........................................................................... 105
Table 3.2 Preparation of simulated gastric fluid (SGF), 1.25x concentrated, for the
simulation of the gastric phase. ............................................................................ 106
Table 3.3 Preparation of simulated intestinal fluid (SIF), 1.25x concentrated, for the
simulation of the intestinal phase.......................................................................... 106
Table 3.4. Description of the parts of the semi-dynamic gastric model. ................ 107
Table 3.5 Example of the parameters used in the semi-dynamic model. Example of
20 g food having 3 g of dry weight and nutrient composition of 5% lipid 3.8% protein,
5% carbohydrate. The energy content is 0.8 kcal/mL calculated using the Atwater
factors of 9 kcal/g for fat and 4 kcal/g for protein and carbohydrates. The gastric
emptying was scaled down from the considered in vivo emptying average of 2
kcal/min in a 500 mL meal (Hunt et al., 1985) . Then, the gastric half time (t1/2) was
considered to be the same. A volume of 1.5 mL of 2 mol/L HCl is needed to reach pH
2. Five gastric emptied aliquots are taken during the gastric digestion. The density
was set at 1 g/cm3. ............................................................................................... 117
Table 4.1 Compositional description of the studied samples. ............................... 135
Table 4.2 Total volume of both oral and gastric mixture added in the simulated
digestion of each sample. ..................................................................................... 137
Table 4.3 Time (min) at which gastric emptying (GE) was applied in the samples,
based on their caloric content. Five emptying points were used. .......................... 138
Table 5.1 Nutritional composition of the studied milk samples. Values are the mean
and standard deviation of two independent replicates .......................................... 184
Table 5.2 Calculated time (min) at which gastric emptying (GE) was applied in the
milk samples. Five emptying points were used. Values are the mean of two
independent replicates. ........................................................................................ 186
Table 5.3 Mean diameter (d4,3) of the initial samples (before digestion), with and
without SDS addition, and the last gastric emptying (GE) point, i.e. GE5, including
SDS. The values represent the mean and standard deviation of two independent
replicates. Values of the complex module, G*, at 15 min of shear of the milk coagulum
collected at GE5 time (after about 182 min). Means within the same column and
having the same superscript lowercase letter and means within the same superscript
uppercase letter are not significantly different by Tukey’s t-test at p < 0.05. ......... 192
xxvi
Table 6.1 Nutrient composition of Past+H and UHT+H. ....................................... 211
Table 7.1 Time (min) and target volume (mL) corresponded in each gastric emptying
aliquot. These values were based on a pre-set curve obtained in the in vivo study data
using the same dairy systems (Mackie et al., 2013). ............................................ 232
Table 7.2 Molecular weight and retention time of the standard proteins used in size-
exclusion liquid chromatography analysis. ........................................................... 234

xxvii
List of Equations
Equation 6.1 Equation used for the calculation of pepsin activity, calculated in units.
............................................................................................................................. 214
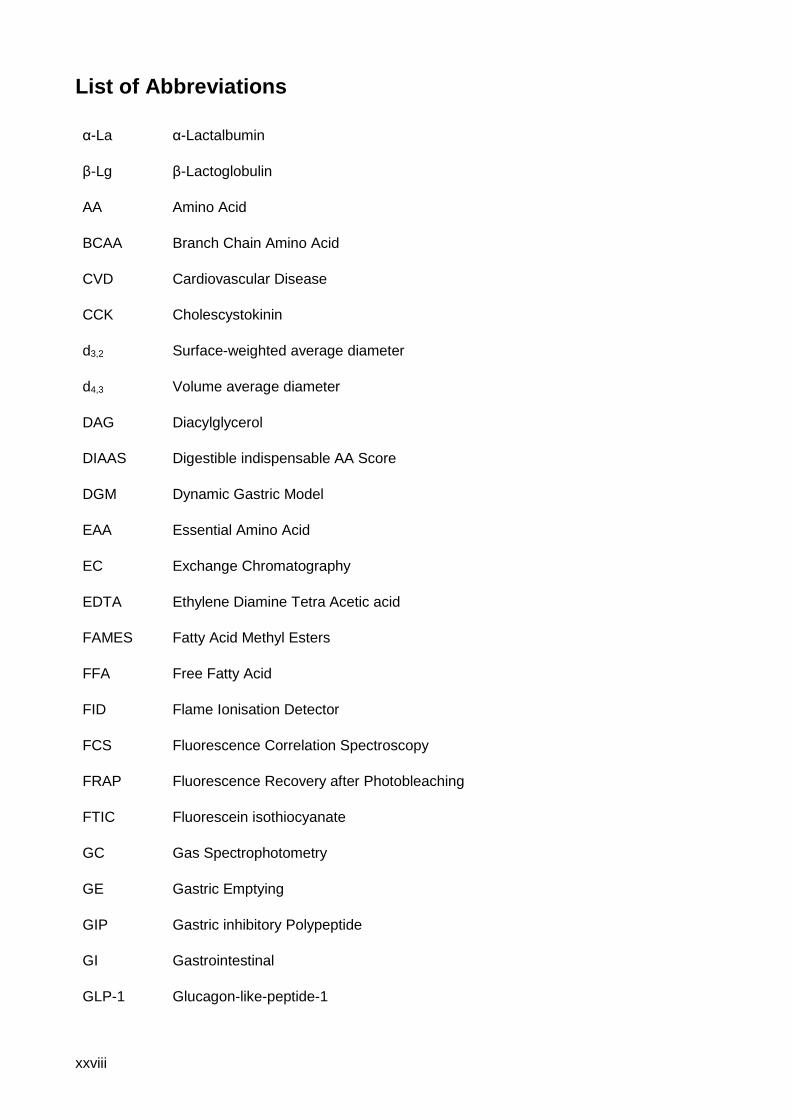
xxviii
List of Abbreviations
α-La α-Lactalbumin
β-Lg β-Lactoglobulin
AA Amino Acid
BCAA Branch Chain Amino Acid
CVD Cardiovascular Disease
CCK Cholescystokinin
d3,2 Surface-weighted average diameter
d4,3 Volume average diameter
DAG Diacylglycerol
DIAAS Digestible indispensable AA Score
DGM Dynamic Gastric Model
EAA Essential Amino Acid
EC Exchange Chromatography
EDTA Ethylene Diamine Tetra Acetic acid
FAMES Fatty Acid Methyl Esters
FFA Free Fatty Acid
FID Flame Ionisation Detector
FCS Fluorescence Correlation Spectroscopy
FRAP Fluorescence Recovery after Photobleaching
FTIC Fluorescein isothiocyanate
GC Gas Spectrophotometry
GE Gastric Emptying
GIP Gastric inhibitory Polypeptide
GI Gastrointestinal
GLP-1 Glucagon-like-peptide-1

xxix
HPLC High Pressure Liquid Chromatography
HGL Human Gastric Lipase
HGS Human Gastric Simulator
HCl Hydrochloric Acid
IFR Institute of Food Research
IS Internal Standard
LDL Low-density lipoprotein
MRI Magnetic Resonance Imaging
MS Mass Spectrophotometry
MFGM Milk Fat Globule Membrane
MPC Milk Protein Concentrate
MAG Monoacylglycerol
MPS Muscle Protein Synthesis
MW Molecular weight
NaHCO3 Sodium Bicarbonate
NaCl Sodium Chloride
NaOH Sodium Hydroxide
N Nitrogen
NMR Nuclear Magnetic Resonance
OPA o-Phthaldialdehyde
PYY Peptide YY
PDCAAS Protein Digestibility -corrected AA score
QIB Quadram Institute Bioscience
RGE Rabbit Gastric Extract
RPLC Reversed Phase Liquid Chromatography
SEM Scanning Electron Microscopy

xxx
SFA Saturated Fatty Acid
SGF Simulated Gastric Fluid
SIF Simulated Intestinal Fluid
SSF Simulated Salivary Fluid
SMP Skim Milk Powder
SDS-PAGE Sodium Dodecyl Sulphate-Polyacrylamide Gel Electrophoresis
TAG Triacylglycerol
TCA Trichloracetic acid
UHT Ultra-High Temperature
UEA University East of Anglia
UV Ultraviolet
WPI Whey Protein Isolate
Amino Acid Symbol Amino Acid Full Name
Ala Alanine
Arg Arginine
Asn Asparagine
Asp Aspartic acid
Cys Cysteine
Gln Glutamine
Glu Glutamic acid
Gly Glycine
His Histidine
Ile Isoleucine
Leu Leucine
Lys Lysine
Met Methionine
Phe Phenylalanine
Thr Threonine
Trp Tryptophan
Tyr Tyrosine
Pro Proline
Ser Serine
Val Valine

31
Introduction and Literature Review
Chapter 1: Introduction and Literature Review
32
1.1 Introduction
The health properties of foods are conventionally assessed according to their
individual nutrient composition. However, there is growing evidence showing that
digestion of nutrients and postprandial responses are strongly affected by the
structure (or matrix) of food, which is defined as the arrangement of food constituents
and their interactions at multiple spatial length scales (Parada et al., 2007), see Figure
1.1. The structure of food either occurs naturally or is created or destroyed by
processing and preparation, which might play a critical role in bioaccessibility and
bioavailability of nutrients. Bioaccessibility is defined as the amount of ingested
nutrient that is available for absorption whereas bioavailability is the proportion of an
ingested nutrient that is made available for exerting a defined physiological action in
cells (Parada et al., 2007).
Food structure can, then, control physiological responses, for instance,
Gebauer et al. (2016) showed that the amount of energy absorbed from almonds was
dependent on the form in which they were consumed (whole natural almonds; whole
roasted almonds; chopped almonds; almond butter). The metabolisable energy measured
in healthy volunteers indicated that the whole natural almonds presented the lowest
value followed by the whole roasted almonds, chopped almonds and almond butter.
Moreover, these values were significantly lower than predicted using Atwater factors,
which estimate the energy-yielding substrates, except for the almond butter that was
similar. This is one example illustrating that food is more than the sum of its nutrients.
However, the rate-determining processes and the underlying mechanisms of the link
between food properties and health outcomes remain unclear, which must be
addressed by the understanding of how food structures interact within the
gastrointestinal (GI) tract (Dupont et al., 2017). This knowledge will provide further
insight for the design of future functional foods with specific behaviour of digestion
and subsequent physiological outcomes (Norton et al., 2014).

Chapter 1: Introduction and Literature Review
33
Figure 1.1 Structural elements and relevant length scales of milk, as an example of the concept of food matrix, i.e. the arrangement and interactions of structural elements at multiscales. Electron micrographs of an individual casein micelle and milk fat globule are from Dalgleish et al. (2004) and Luo et al. (2014), respectively.
Much attention has been paid to strategies to tackle the worldwide obesity
problem and, in that context, appetite regulation should be investigated. The main
processes governing appetite are satiation and satiety; satiation refers to the feeling
of fullness within an eating occasion that leads to meal termination whereas satiety
refers to the feeling of fullness for a period until the following eating occasion. These
processes are controlled by a combination of neural and humoral signals in response
to food in the GI tract. The gastric distension induces neural signalling resulting in
short-lasting feeling of satiation and appetite reduction (Janssen et al., 2011). When
food enters the small intestine, the nutrient composition is sensed, and hormones are
secreted. The main appetite related gut hormones are cholecystokinin (CCK), peptide
YY (PYY) and glucagon-like peptide-1 (GLP-1), which can modulate satiety by
reducing appetite and altering GI processes. For instance, the presence of mainly lipid
and protein in the duodenum is known to stimulate CCK, which in turn, slows gastric
emptying (GE) and reduce appetite (Karhunen et al., 2008). This duodenal feedback
is mainly controlled by the caloric density of digesta, therefore sufficient nutrients need
to be emptied to modulate a given gastric volume. However, the persistence of this
effect depends on the hormone, and macronutrient type and source. Therefore, the
satiety signals need to be prolonged to induce that effect of satiety and fullness for
longer, which could be obtained by the slow nutrient breakdown and might benefit
obese/overweight people. Furthermore, more efficient nutrient release, in particular
protein, would be useful for athletes; depending on sport characteristics, fast protein
digestion and uptake are needed for strength training and fast recovery, whereas
more constant amino acid absorption is sought for endurance exercise. In the same
way, elderly individuals will benefit from foods with fast amino acid uptake to enhance
muscle synthesis, counteracting sarcopenia. Hence, different strategies need to be

Chapter 1: Introduction and Literature Review
34
developed in order to optimise kinetics of nutrient release and uptake to tailor
nutritional needs (Norton et al., 2014). Moreover, proteins have been recognised to
have a higher satiating power than lipids and carbohydrates (Veldhorst et al., 2008),
and this effect differs depending on the source of protein (Anderson et al., 2004).
The physico-chemical characteristics of food components and the whole matrix
impact how individual components interact and behave within the GI tract. Research
has mainly focussed on the small intestine digestion in order to control nutrient
digestion using different mechanisms such as the ileal break (Maljaars et al., 2008)
by manipulating interfacial composition of fat droplets for instance, that alters the
access to enzymes and bile and might slow the release of lipid.
However, possibly having a more significant impact, the stomach can play a key
role in controlling the rate of nutrient absorption and subsequent physiological
responses. A schematic diagram illustrating this approach is displayed in Figure 1.2.
There are several complex processes occurring in the gastric compartment:
enzymatic (pepsin and gastric lipase), physical (e.g. muscular contractions) and
chemical (e.g. pH decrease and ionic composition). The behaviour of food structures
will depend on their physico-chemical properties in the gastric environment, which
might cause changes to the initial structure altering the food’s functional
characteristics. Several types of colloidal behaviour might be observed depending on
the stability of the structure. Golding et al. (2011) showed that colloidal structures can
be tailored to exert different behaviour under the acidic conditions of the stomach.
The properties of food structure adopted in the stomach will profoundly impact gastric
disintegration and the rate of GE, i.e. gastric contents gradually delivered into the
duodenum. Marciani et al. (2007) showed that gastric acid-unstable emulsions led to
the formation of an intragastric oil layer to be formed on top of the chyme in the
stomach. This accelerated GE of the aqueous phase followed by a slow emptying of
the intragastric oil layer. This contrasted to the slow GE after the ingestion of gastric
acid stable emulsions. Then, due to differences in the rate of delivery of nutrients to
the duodenum, they might be absorbed and metabolised at different rates, altering
hormonal secretion and physiological responses. For instance, the slower GE of the
acid stable emulsion in the study by Marciani et al. (2007) study led to a greater
secretion of CCK and greater satiety. A slow GE has been also shown to help
diabetics by reducing peaks in lipemia (Rayner et al., 2001). Therefore, control of GE
by intragastric behaviour of digesta can be essential for ensuring optimal digestion
addressed to specific physiological responses. This approach should be further
studied and exploited to design healthier food structures in the future.

Chapter 1: Introduction and Literature Review
35
Figure 1.2 Schematic representation of the approach showing the role of gastric digestion in controlling nutrient delivery and absorption by the restructuring of food in the gastric conditions. This might, subsequently, exert different physiological responses that can be helpful to specific population groups. Images of the stomach by magnetic resonance imaging of are from Mackie et al. (2013).
To achieve this, a deep understanding of the mechanisms of food breakdown
in the stomach is critical. This research should progress further in the light of the
development of sophisticated in vivo techniques such as magnetic resonance
imaging. Despite the gold standard for investigating nutrient digestion being the
human body, there are ethical and economic reasons that constrain its use. In vitro
models are widely used, and they are mainly classified into static and dynamic.
Sophisticated dynamic models can simulate the dynamics of stomach physiology, but
they are also expensive and restrictive. One example is the Human Gastric Simulator
(HGS) developed at the Riddet Institute (Kong et al., 2010). In contrast, static models
(Minekus et al., 2014) are cheap and simple to use but are less suitable to simulate
complex gastric conditions, so they are mainly used to investigate the bioaccessibility
of nutrients with less consideration of the structural changes during gastric digestion.

Chapter 1: Introduction and Literature Review
36
Therefore, there is a need to develop a simple, intermediate model that provides the
advantages of both in vitro model types. The approach of a semi-dynamic gastric
model was developed and used in this thesis. This model can achieve digestive
properties comparable to in vivo behaviours in a more accessible way, although it
remains impossible to perfectly simulate human physiological conditions.
Nevertheless, these more sophisticated in vitro approaches can provide additional
knowledge regarding the physico-chemical mechanisms underpinning the in vivo
findings.
Dairy products are consumed widely and constitute an important part of our diet
due to their nutritional value. The manufacturing processes affect the macronutrient
organisation and texture providing an array of possible structures at different length
scales, which consequently might modulate the kinetics of product disintegration and
nutrient release in the GI tract. There is some research on absorption and
physiological responses in milk and dairy products. For example, Lacroix et al. (2008)
showed that the heat treatment of ultra-high temperature (UHT) in milk led to faster
nitrogen delivery, compared to pasteurised milk. Also, Boirie et al. (1997) showed fast
and slow absorption rates of whey proteins and caseins, respectively, although
caseins were reported to be more susceptible to enzymatic proteolysis than whey
proteins at molecular level (Macierzanka et al., 2009). The gastric phase has often
been overlooked in relation to food digestion and health implications. In some studies,
it has been suggested that the physiological responses obtained are related to gastric
digestion but it has hardly been investigated. Therefore, there are key gaps in the
literature about the structural changes and nutrient emptying kinetics during gastric
digestion of dairy matrices. Also, the study of complex foods, in which different types
of nutrients coexist is challenging since these nutrients might play synergistic or
competitive roles, which makes the outcomes of digestion even more difficult to
interpret.
This literature review therefore aims to illustrate how the physiological
responses and patterns of digestion observed following consumption of dairy products
with different structures might be linked to gastric digestion and the need for its further
study. Dairy products and their impact on health, and their main constituents will be
briefly discussed together with a general explanation of GI tract and nutrient digestion.
This literature review chapter will focus on assessing how dairy structures at several
length scales affect nutrient bioaccessibility and bioavailability kinetics leading to
different metabolic effects, in light of gastric digestion. In that view, only in vivo studies
and in vitro studies using dynamic and semi-dynamic models are considered. Static
in vitro methods will not be included because they are not able to provide accurate

Chapter 1: Introduction and Literature Review
37
kinetic data of nutrient digestion. This chapter only includes dairy structures from
bovine origin, so it does not include milk from other animal sources.
1.2 General Implications of Dairy Consumption for
Nutrition
Milk and dairy products have been widely recognised as excellent nutritional sources,
containing proteins, lipids, carbohydrates, vitamins and minerals, in particular,
calcium. The composition of milk, on average, is 87% water, 4% to 5% carbohydrate,
3% to 4% of protein and lipid, 0.8% minerals and 0.1% vitamins (Pereira, 2014). Dairy
foods are the major contributors of dietary saturated fatty acids (SFA) and the
evidence linking those fatty acids with cardiovascular diseases (CVD), through the
increase of blood lipids in particular low-density liopoprotein (Griffin, 2017), has partly
resulted in the reduction of dairy consumption, by 13.7% between 2003 and 2013 in
the UK (Defra family food survey, AHDB Dairy, 2015). Nevertheles, there is a paradox
in the fact that increasing evidence has shown the consistent neutral or even benefitial
associations between dairy food consumption and CVD as shown in meta-analyses
prospective cohort studies (Givens, 2017), and several other diseases (Thorning et
al., 2016). A multinational cohort study in 21 countries from five continents was
recently published showing that the consumption of dairy products (milk, yogurt and
cheese) was associated with lower risk of mortality and CVD (Dehghan et al., 2018).
This discrepancy is probably due to the generalised approach of evaluating the health
benefits of a food according to its individual components rather than the matrix and
then, the health benefits of dairy products are probably due to a synergistic effect
between the various components when consumed as a whole. Therefore, when
investigating the health effects of dairy products, the whole matrix and its specific
structure has to be considered (Thorning et al., 2017). Indeed, Panahi et al. (2014)
showed, using isovolumetric preloads, the effect of whole milk and its individual
macronutrients. The response of postprandial glycemia in whole milk was 56% lower
than the sum of the glycemic responses for each macronutrient.
Furthermore, milk proteins are classified as high-quality proteins considering
human amino acid (AA) requirements and digestibility. They have high true
digestibility and postprandial protein utilization of 95-96% and 74%, respectively (Bos
et al., 1999). In fact, milk proteins are frequently considered the best protein source
taking into account the conventional measurement methods for protein value of
essential amino acid score and protein-digestibility corrected amino acid score
(Schaafsma, 2000). The AA profile is different between the two main milk proteins;

Chapter 1: Introduction and Literature Review
38
whey proteins are especially riched in branched chain amino acids (BCAAs), i.e., Leu,
Ile, and Val as well as Lys, compared to caseins (Gorissen et al., 2018). Milk proteins
can be generally considered as a better source of protein compared to plant proteins
since the later proteins are less digestible and deficient in one or more essential amino
acids (EAAs) and their Leu content is 6-8%, compared to 10-13% in dairy proteins
(Gorissen et al., 2018). The EAAs, in particular BCAAs, are important since they
excert a key role in muscle protein synthesis (Wolfe, 2002). Moreover, the high levels
of Leu, in particular in whey proteins, induce the stimulation of glucose-dependent
insulin-tropic polypeptide (GIP) (Nilsson et al., 2004). This hormone increases insulin
response and lowers blood glucose, which might be beneficial for type-2 diabetics.
Milk protein ingestion has been suggested to have benefits on cardiometabolic health
(Fekete et al., 2016). Moreover, milk proteins have important biological functions,
casein micelle carries calcium and phosphate for efficient absorption. Several
peptides from milk proteins have been reported to exert certain functions such as
antihypertensive, opoid-like activity and antithrombotic properties (Fekete et al., 2015;
Jauhiainen et al., 2007).
1.3 Composition and Structure of Dairy Constituents
1.3.1 Milk Proteins
Bovine milk usually contains about 3-4% protein, which varies depending on the
lactation period, animal breed and seasonality among other factors. The main proteins
in milk are caseins and whey proteins, accounting for approximately 80% and 20% of
bovine milk protein respectively.
1.3.1.1 Caseins
There are four different casein proteins: αs1-, αs2-, β- and κ-casein, in a ratio of
4 : 1 : 4 : 1, respectively and ranging in molecular mass from about 20 to 25 kDa (Fox
et al., 1998). Caseins are insoluble at pH 4.6 (isoelectric point of the caseins), are
relatively hydrophobic molecules that are comparatively low in sulfur-containing AAs
(i.e. Cys and Met) and contained high levels of phosphate group. αs2- and κ-caseins
have two Cys residues per molecule, and high levels of Pro. It is mainly due to the
latter feature that the caseins have fairly little secondary (α-helix or β-sheet) and
tertiary structures showing a relatively open and flexible structure (Fox et al., 1998).
Their low level of secondary structure is of high importance since it is readily
susceptible to proteolysis but not easily denatured (Guo et al., 1995). Also, caseins

Chapter 1: Introduction and Literature Review
39
can exhibit good emulsifying properties because of their open, flexible structure and
uneven distribution of polar AAs.
Caseins are associated into supramolecular colloidal particles, called casein
micelles, having an average diameter of 120 nm (Fox et al., 1998). The structure of
the casein micelle is still a subject of discussion, in particular the internal part. Two of
the most persistent models proposed for casein micellar structure are the sub-micelle
and nanocluster models (Dalgleish et al., 2012) (see Figure 1.3) but there are some
common characteristics. Casein micelles contain colloidal calcium phosphate and κ-
casein faces the aqueous phase. κ-casein provides the stability of casein micelles
due to steric effects of the protruding “hair” from the C-terminal regions of κ-casein
sausing repulsion between micelles thus preventing aggregation. This is also helped
by the electrostatic repulsions due to the negative surface potential of -20 mV at native
pH of milk. The disposition of calcium phosphate in the micelle plays an important role
in the micelle properties; without the colloidal calcium phosphate, the transport of high
calcium concentrations in a soluble form would not be possible at pH conditions of
milk and milk could not be coagulated by rennet. A further description of the casein
structure is given in a review by Fox et al. (2008).
Figure 1.3 Schematic representation of the structure of casein micelle based on A) sub-micelle model and B) nanocluster model (Adapted from De Kruif et al. (2012)).
1.3.1.2 Whey Proteins
Whey proteins are globular proteins comprised of β-lactoglobulin (β-Lg), α-
lactalbumin (α-La), bovine serum albumin, lactoferrin and immunoglobulins. β-Lg is
the major whey protein in bovine milk (about 50% of the total whey proteins) with a
molecular mass of 18 kDa and α-La represents about 20% of the whey proteins of
bovine milk and has a molecular mass of 14 kDa (Walstra et al., 1984). In contrast to
caseins, whey proteins are soluble at pH 4.6 and are rich in sulphur-containing AAs.
β-Lg contains five Cys residues, four are involved in disulphide linkages (-S-S-) and

Chapter 1: Introduction and Literature Review
40
one is free (-SH) but buried inside the native form of the protein, which becomes
exposed on denaturation (e.g. by heating). This can result in the formation of
sulphydryl–disulphide interactions with other β-lg molecules or κ-casein. Denaturation
occurs at temperatures above 70°C (de la Fuente et al., 2002). The main feature of
whey proteins is the possession of high levels of secondary, tertiary and, in most
cases, quaternary structures, which is pH-dependent.
β-Lg has shown binding and carrier function to fatty acids as well as
hydrophobic compounds such as retinol, and antioxidant capacities, whereas
lactoferrin is crutial element in iron absorption (Mills et al., 2011).
1.3.2 Milk Lipids
Bovine milk typically contains 3-4% lipids but levels vary widely depending on
breed, seasonality and animal feed among many other factors (Pereira, 2014). Lipids
in milk are in globules surrounded by a trilayer, called milk fat globule membrane
(MFGM) that consists of phospholipids, cholesterol, glycoproteins and enzymes
(Lopez, 2011). The presence of the MFGM helps stabilise the lipids against the
processes of flocculation, coalescence and creaming as well as protecting the milk fat
from lipolysis (Lopez, 2005). However, the MFGM is dynamic and fragile and can be
damaged easily by processing operations. The lipid globules in milk range in size from
about 0.2 to 15 µm with a mean diameter of about 4 µm. The structure of milk fat has
been extensively reviewed by Michalski (2009).
Triacylglycerols (TAG) represent 97-98% of the fat in milk, having a complex
mixture of saturated, monosaturated, polysaturated and trans fatty acids which
accounts for approximately 70%, 25%, 2.3% and 2.7%, respectively (Månsson,
2008). Within SFAs, the most abundant are C16:0 (30%), C14:0 (11%), and C18:0
(12%) (Pereira, 2014). Milk contains a group of octadecadienoic isomers (cis-9, trans-
11, and the trans-10, cis-12) derived from linoleic acid that has been reported to
provide health benefits in the cardiovascular system and immune function
(Bhattacharya et al., 2006).
1.3.3 Formation of Dairy Structures
A vast range of dairy products originate from milk following processing, for instance,
fermented products such as yogurt, sour cream and some cheeses, and butter, which
possess different structural organisation (Figure 1.4). Farming of milk started around
10,000 BC during the “agricultural revolution” when the nomadic tribes changed and
settled in communities. Soon after, the apparition of products like cheese, yogurt and

Chapter 1: Introduction and Literature Review
41
butter occurred by accident due to the transport of milk in bottles made from sheep or
goat skin and stomach. Since then, a great variety of liquid milk (usually pasteurised
and homogenised) e.g. whole, semi-skimmed and skimmed milk, cheeses and other
products have been developed. Likewise, various powders obtained from milk or
whey proteins (e.g., casein, caseinates, whey protein concentrate and whey protein
isolate) are important food ingredients and consumer products. The processing
conditions will not only vary the physico-chemical properties such as pH and
rheological properties but the macronutrient organisation at the different length
scales.
Figure 1.4 Schematic representation of the main dairy products produced by milk processing showing the changes in matrix structure (image taken from Truong et al. (2016)).
Some of the most common processes used in the dairy industry are
homogenisation and heat treatment. More detailed information about these processes
can be found in other reviews (Michalski et al., 2006; Singh, 2004).
Heat treatment is applied to food in order to ensure microbial stability. The most
common heat treatments applied to milk are pasteurisation, that consists of heating
at 70-90°C for ≥ 15 s, and ultra-high temperature (UHT) sterilization involving heating
at 135-150°C for a few seconds. Heat treatment has been reported to induce several
changes in the protein constituents, including the denaturation and aggregation of
whey proteins, in particular β-Lg (de la Fuente et al., 2002). Heat-denatured β-Lg
interacts with κ-casein on the surface of the casein micelle via hydrophobic
interactions and disulfide bond formation (Sharma et al., 1993). The extent of
denaturation of whey proteins in UHT-treated milk is much higher than that in
pasteurised milk (Douglas et al., 1981). Therefore, the level of protein aggregation is

Chapter 1: Introduction and Literature Review
42
higher in UHT-treated milk compared to pasteurised milk. Moreover, the pH for
coagulation of unheated and heated milk is about 5 and 5.3 respectively (Donato et
al., 2007). Heat also causes reorganization in the casein micelles (Dalgleish et al.,
2012) and induce an alteration of the mineral equilibrium of the milk by decreasing
soluble calcium (Schreiber, 2001). This can impair the functionality of the casein
micelle and subsequently alter casein coagulation (Guinee et al., 1997), which may
affect nutrient digestion kinetics. Heated milk, in particular at UHT conditions, is
sensitive to glycosylation, through the Maillard reaction, due to its content of lactose
that can react with amine groups in protein, often from Lys, from caseins and,
therefore, this might reduce the availability of Lys (Rolls et al., 1973) but it has little
effect on the net protein utilization. The effect of Maillard reactions in milk was
reviewed by van Boekel (1998) showing that the optimum pH for the Maillard reaction
is between 8 and 10, which is not relevant to dairy products, and the amount of
Maillard products measured in UHT-treated milk was 0.6-0.9 mmol/L.
Homogenisation is used by the dairy industry to reduce the size of fat globules
in milk and creams, in order to reduce creaming and coalescence during long shelf-
storage. In milk, this reduction is usually from an average size of 3-5 µm to below 1
µm (Michalski et al., 2006). Homogenisation disrupts the MFGM and reduces the fat
globule size and causes also the disruption of casein micelles (Lodaite et al., 2009).
This, therefore leads to the formation of a new interface on the fat globules, which
mainly consists of adsorbed milk proteins and native MFGM fragments (Lopez, 2005;
Sharma et al., 1993). The effect of homogenization on dairy products has been
extensively reviewed by Michalski et al. (2006). Homogenisation increases the total
surface area of lipid droplets, which has relevance in nutrient digestion and will be
described in this work. There are other physicochemical properties that are altered
such as ζ-potential, which might also influence the colloidal stability and physico-
chemical behaviour during digestion in the GI tract.
1.4 Human Gastrointestinal Tract
In this section an overview of the upper gastrointestinal (GI) physiology is
presented. The gastric digestion will be explained in more detail since it constitutes
an important part of this work.
Human digestion is a complex multistage process during which ingested food is
broken down into the basic nutrient constituents, which enables effective absorption
by the small intestine enterocyte and can then be used by the body for growth, cell
maintenance, and energy (Guerra et al., 2012). Ingested food undergoes a number

Chapter 1: Introduction and Literature Review
43
of mechanical and biochemical processes during its passage through the different
compartments of the GI tract, starting from the mouth, and continuing in the stomach
and small intestine. Figure 1.5 illustrates the main processes occurring in each
compartment.
Figure 1.5 Schematic representation of the major physiological factors that take place during digestion in the upper GI tract.
The digestion of food starts in the oral cavity, in which food undergoes complex
physico-chemical processes due to mastication and salivation (Chen, 2009). Food is
mixed with salivary secretion containing salivary α-amylase, mucin and salts, with
moderate change in pH. The time of residence of food in the mouth depends on the
properties of food and varies between individuals. For solid food, this process forms
a bolus that enables the food to be swallowed and enter the stomach through the
oesophagus. In the gastric compartment, food is mixed with the gastric secretions
consisting of HCl, salts and enzymes (pepsin and gastric lipase), and it is subjected
to mechanical processes due to peristaltic waves. The digesta from the stomach (i.e.
chyme) gradually enters the small intestine in a process called gastric emptying. The
pH of food increases to pH 6-7.5 due to the secretion of NaHCO3. Chyme is mixed
with pancreatic enzymes (trypsin, chymotrypsin, carboxypeptidases, pancreatic
lipase and pancreatic amylase), coenzymes and bile salts, which are secreted by the
pancreas, gall bladder and liver. The major nutrient absorption occurs in the small

Chapter 1: Introduction and Literature Review
44
intestine via the mucosa, which is formed into villi and microvilli to increase the surface
area. These are lined with enterocytes, i.e. nutrient absorbing cells.
1.4.1 Gastric Physiology
The description of gastric physiology has been reviewed in detail in other works
(Kong et al., 2008; Malagelada et al., 1989), and a description of the main features is
provided as follows.
After oral processing, a bolus is formed and enters the stomach, which is divided
into four sections i.e. fundus, body, antrum and pylorus (see Figure 1.6) with different
functionality. The fundus and body act as a gastric reservoir whereas particle
disintegration and mixing occur in the antrum. The pylorus acts like a sieve between
the stomach and the duodenum, only particles smaller than 2-3 mm can pass through
it during the fed state (Hellström et al., 2006; Newton, 2010). The time of residence of
food in the stomach is also highly variable, ranged from 30 min to 4 hours (Lin et al.,
2005), which depends on the food properties such as caloric content and rheological
properties.
In the stomach, the ingested food is mixed with gastric secretions to produce a
mixture called chyme. The gastric juice is secreted gradually during digestion and
contains mainly hydrochloric acid (HCl) and the enzymes gastric lipase and
pepsinogen (an active precursor that is converted into the proteolytic enzyme pepsin
upon contact with acid). This secretion can be influence by the physical state of meal;
for instance, Malagelada et al. (1979), showed that a solid-liquid meal resulted in
greater gastric secretions compared to the same meal in homogenised form. The
gastric pH differs from the fasted to the fed state and during gastric digestion. The pH
value of fasted condition is below 2 and increases after the ingestion of food, which
depends on composition, pH, quantity and consistency of meal (Calbet et al., 2004;
Dressman et al., 1990; Malagelada et al., 1979). Then, the pH decreases gradually
until it reaches values below 2, restoring the basal state (Malagelada et al., 1976).
The rate of change in pH is as a consequence of the progressive secretion of HCl as
well as the decrease of buffering capacity of the content (mainly representing food
protein) by gastric emptying. Ionic strength and osmolality are other physicochemical
gastric factors to consider. In general, the ionic strength and osmolality of a fasted
stated are about 100 mmol/L and 190 mOsm/kg, respectively (Kalantzi et al., 2006)
and the major ions present are: Na+, K+, Ca2+ and Cl-.

Chapter 1: Introduction and Literature Review
45
Figure 1.6 Schematic diagram of the stomach and its main parts.
The muscular contractions of the stomach wall mix, shear and force the chyme
towards the pylorus. These contractions are spread from the fundus to the pylorus
being more vigorous and creating higher shear forces in the antrum, resulting in a
homogenous chyme at the bottom part in contrast to the non-homogenous digesta
located within the fundus (Pal et al., 2004). In the antrum, the disintegration of solids
mainly occurs in a mechanism of propulsion-grinding-retropulsion, until the particles
acquire the proper size to be emptied (Schulze, 2006; Schwizer et al., 2006). There
are three main types of mechanisms for the disintegration of particles: fragmentation,
erosion and degradation. Fragmentation involves the breakdown of larger particles
into smaller ones, erosion is the damage of surface food and degradation is related
to the action of enzymes and acid (Kong et al., 2008). As a result of these peristaltic
antral contractions, chyme is released through the pyloric sphincter into the
duodenum resulting in the last step of the food processing in the stomach, so called
gastric emptying.
1.4.2 Gastric Emptying and Food Properties
Gastric emptying (GE) depends on several food properties such as consistency
(Malagelada et al., 1979; Santangelo et al., 1998), viscosity (Marciani et al., 2001),
nutrient composition (Goetze et al., 2007), caloric density (Calbet et al., 1997; Hunt et
al., 1975; Kwiatek et al., 2009; Sauter et al., 2011), particle size (Holt et al., 1982) and
volume (Hunt et al., 1985; Kwiatek et al., 2009; Moore et al., 1981). For instance,
Malagelada et al. (1979) showed that the time of GE was shorter when a meal was
consumed in a homogenised form instead of a solid-liquid state, however the
emptying rate of the solid-liquid meal was faster for the first hour, probably due to an

Chapter 1: Introduction and Literature Review
46
initial emptying of the liquid part. The intestinal feedback mechanisms are able to
control GE rate with respect of the duodenum, which is the major control mechanism
for GE by stimulating a negative feedback pathway. The duodenum contains
receptors that sense the presence of nutrients and stimulates the secretion of gut
hormones, which slows down emptying by reducing the antral contractions (Janssen
et al., 2011). This modulation of antral peristalsis controls the volume of chyme that
is received from the stomach (Wren et al., 2007) and ensures that the optimal amount
of chyme is delivered to the duodenum to allow it to be fully digested and absorbed in
the small intestine.
It is generally accepted that liquid meals empty from the stomach according to
zero-order or first-order kinetics. In contrast, solid meals have shown a biphasic
pattern consisting of a lag phase during which little emptying occurs related to the
time solids achieve a suitable particle size, followed by a linear emptying phase
(Schulze, 2006; Siegel et al., 1988). However, the importance of this lag-phase is still
controversial since its identification and duration is highly variable, depending on meal
properties, e.g. meal viscosity and particle size (Hellström et al., 2006; Urbain et al.,
1989) as well as methodology and inherent intervariability. For instance, Moore et al.
(1981) showed, using a double-isotope technique for measuring solid and liquid
components, that the solid phase followed a linear GE whereas the liquid phase was
curvilinear with an initial rapid GE. Nevertheless, it seems apparent that liquid meals
empty with a shorter half time emptying compared to solid meals, which could be
related to the time for breaking down larger particles to obtain the particle size that
can pass through the pylorus. This is considering that there are no changes in the
physical state of the liquid during the gastric phase. Indeed, the intragastric behaviour
of the ingested food might also influence the GE profile. For instance, phase
separation in the stomach can lead to the layering of lipid on the top, which contributed
to an initial rapid GE, shown by Marciani et al. (2008). Similarly, Steingoetter et al.
(2015) showed that the gastric acid unstable emulsion exhibited biphasic and faster
emptying profile than the gastric stable emulsion. The Elashoff’s power exponential
curve modelling GE has been well described by Elashoff et al. (1982) and some
computer programmes for dynamic models use that equation for controlling chyme
transit.

Chapter 1: Introduction and Literature Review
47
1.5 Methodology for Studying Gastric Digestion
1.5.1 In Vivo Methodology for Gastric Digestion Monitoring
The use of some advanced techniques in combination with computational
modelling (Ferrua et al., 2015) has helped to gain more insight into the complex study
of gastric digestion dynamics in vivo. A more detailed description of the techniques
used for GI motor assessment can be found in Dinning et al. (2010) and Szarka et al.
(2009).
The classical methods to measure gastric motility require the insertion of a
barostat or manometer into the stomach, which may alter the normal gastric function.
Some methods to monitor volumes in the stomach include scintigraphy, in which there
is administration of a radionuclide isotope and has low spatial resolution and cannot
measure the volume of the total meal including secretions (Feinle et al., 1999).
Ultrasound has better resolution but cannot measure volumes in the body and fundus
accurately because of air-fluid interfaces (Szarka et al., 2009). Breath test is another
non-invasive technique that allows the determination of GE indirectly. This assesses
the rate of transit and uptake of 13C labelled substrate by the metabolic conversion of
13C in the liver into 13CO2 which is exhaled in the breath and detected using mass
spectrometer (Sanaka et al., 2008). Another method is a wireless capsule (Iddan et
al., 2000), in which the gastric behaviour of meal can be followed while the camera is
in the stomach. The images are obtained by using a lens of short focal length and
transmitted using ultra high frequency- band radio telemetry. Some wireless capsules
can also track the pH and some motility factors of the GI tract (Kloetzer et al., 2010).
Recently, some non-invasive techniques of visualisation and imaging have
increasingly been used. One of the most effective and used systems is magnetic
resonance imaging (MRI), which has the capability to simultaneously measure gastric
volume, gastric motility, gastric secretions and gastric emptying (Marciani, 2011). MRI
overcomes some of the limitations of other non-invasive techniques and allows high-
resolution imaging of the spatial distribution of the intraluminal ingested food
(Schwizer et al., 1994). Its sensitivity to proton changes allows the discrimination
between the water and the lipid components of a meal. For instance, MRI helped
establish the importance of the acid stability in the stomach (Marciani et al., 2008) and
the impact of the meal viscosity (Marciani et al., 2001). Bluemel et al. (2015) found
low concordance between breath test and MRI when using isocaloric and
isovolumetric meals differing in casein content. The results indicated that the
properties and intragastric processes of the test meal led to the differences between

Chapter 1: Introduction and Literature Review
48
the methods. The authors recommended validation by imagining methods prior the
13C-acetate breath test to allow for the correct interpretation of the derived GE data.
Regarding invasive techniques, endoscopy by nasogastric intubation offers the
possibility to aspirate samples from the gastric digesta and analyse them. This
technique, in contrast to the non-invasive techniques, focussed on the
characterisation of the physico-chemical properties of the digesta in the gastric
environment. This can be combined with imaging by using a tube with lens systems
and fibre optic.
Both invasive and non-invasive techniques are often applied in combination with
clinical assessment of blood testing for hormonal responses and plasma amino acid
and triacylglycerol uptake.
1.5.2 In Vitro Methodology for Investigating Gastric Digestion
The in vitro models to simulate the digestion in the GI tract are mainly classified
into static and dynamic. The static model is the simplest but most used system and it
is the harmonised static protocol (Minekus et al., 2014), developed by the INFOGEST
COST Action, which offers the possibility to apply a protocol with digestion parameters
by consensus that can be compared. The related gastric phase involves hydrolysis
by pepsin at constant pH 3 for 2 hours while applying sufficient stirring to mix at 37°C.
Static in vitro models can be useful in predicting the overall nutrient hydrolysis and
end-points values of the digestion in vivo (Egger et al., 2017). A comprehensive
review about the correlation between in vitro and in vivo data on macro- and micro-
nutrients is given by Bohn et al. (2017). However, this correlation is not feasible when
investigating the structural changes and nutrient breakdown kinetics that occur in
response to dynamic changes in gastric digestion conditions.
On the other hand, dynamic models are designed to mimic the gastric dynamics
in terms of physical and/or chemical environment, in particular the gradual secretion
of gastric fluids and peristaltic contractions. Examples of this model are the Human
Gastric Simulator (HGS), described in Kong et al. (2010), the Dynamic Gastric Model
(DGM) developed at the Institute of Food Research (UK), described in Thuenemann
et al. (2015), and the multicompartment models of TNO Gastro-Intestinal Model (TIM)
developed in TNO Triskelion (The Netherlands) described in Minekus (2015), DIDGI-
system from INRA (France) detailed in Ménard et al. (2015) and the SIMGI model
developed in CSIC, Spain (Barroso et al., 2015). A comprehensive review of
developments in dynamic systems for in vitro analysis of digestion can be found in
Dupont et al. (2018). Since the HGS will be referred to on several occasions
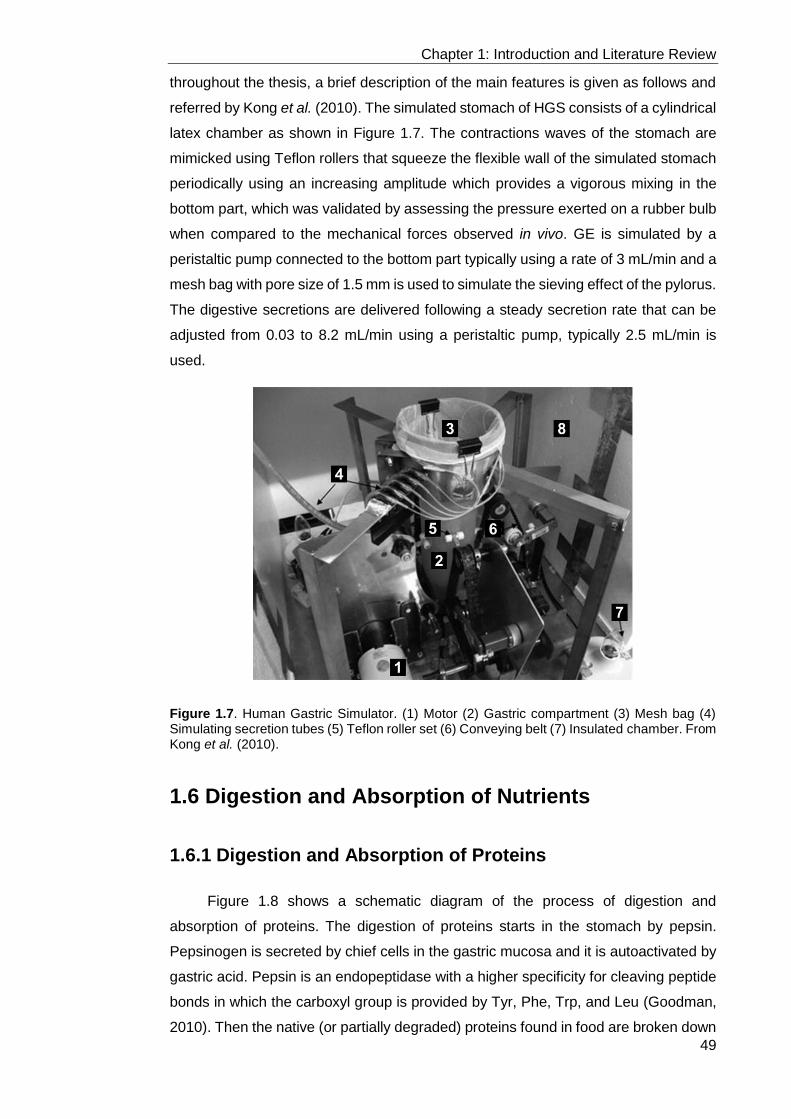
Chapter 1: Introduction and Literature Review
49
throughout the thesis, a brief description of the main features is given as follows and
referred by Kong et al. (2010). The simulated stomach of HGS consists of a cylindrical
latex chamber as shown in Figure 1.7. The contractions waves of the stomach are
mimicked using Teflon rollers that squeeze the flexible wall of the simulated stomach
periodically using an increasing amplitude which provides a vigorous mixing in the
bottom part, which was validated by assessing the pressure exerted on a rubber bulb
when compared to the mechanical forces observed in vivo. GE is simulated by a
peristaltic pump connected to the bottom part typically using a rate of 3 mL/min and a
mesh bag with pore size of 1.5 mm is used to simulate the sieving effect of the pylorus.
The digestive secretions are delivered following a steady secretion rate that can be
adjusted from 0.03 to 8.2 mL/min using a peristaltic pump, typically 2.5 mL/min is
used.
Figure 1.7. Human Gastric Simulator. (1) Motor (2) Gastric compartment (3) Mesh bag (4) Simulating secretion tubes (5) Teflon roller set (6) Conveying belt (7) Insulated chamber. From Kong et al. (2010).
1.6 Digestion and Absorption of Nutrients
1.6.1 Digestion and Absorption of Proteins
Figure 1.8 shows a schematic diagram of the process of digestion and
absorption of proteins. The digestion of proteins starts in the stomach by pepsin.
Pepsinogen is secreted by chief cells in the gastric mucosa and it is autoactivated by
gastric acid. Pepsin is an endopeptidase with a higher specificity for cleaving peptide
bonds in which the carboxyl group is provided by Tyr, Phe, Trp, and Leu (Goodman,
2010). Then the native (or partially degraded) proteins found in food are broken down

Chapter 1: Introduction and Literature Review
50
into a mixture of large polypeptides, smaller oligopeptides, and some free amino acids
(AAs) (Erickson et al., 1990). Pepsin can partially digest 10-15% dietary protein in the
stomach (Goodman, 2010) and it has its optimum pH at 2 (Piper et al., 1965).
These protein products are further digested in the small intestine by other
proteases, i.e. trypsin, chymotrypsin and elastase, which are serine proteases
secreted in the pancreas. Trypsin predominantly cleaves the peptide bonds next to
Lys and Arg, chymotrypsin cleaves peptide bonds adjacent to hydrophobic AAs (Tyr,
Trp, Phe, Met and Leu) and elastase cleaves peptide bonds adjacent to Ala, Gly and
Ser (Goodman, 2010). There are exopeptidases, called carboxypeptidases, that
cleaves the carboxyl ends of the peptide chains to remove AAs. Therefore, the
intestinal proteolysis is highly efficient resulting in a mixture of free AAs and
oligopeptides (2-6 AAs) that account for approximately 40% and 60%, respectively,
of the total α-amino nitrogen (Erickson et al., 1990). Some peptides are further
hydrolysed by aminopeptidases located on the brush border membranes. Therefore,
the joint action of the gastric, intestinal and brush border proteolysis provides the
availability of free AAs, di- and tri-peptides allowing their transport across the brush
border membrane. There are different carrier mechanisms for the intracellular
transport of AAs, di- and tri-peptides but they are mostly Na+ dependent (Hinsberger
et al., 2004). The AA transporters have been defined by these two main functional
criteria: type of AA transported (acidic, neutral or zwitterionic, or basic) and transport
mechanism used (facilitated diffusion or secondary active transport) (Goodman,
2010).
The rate and extent of protein digestion is strongly depended on the accessibility
of the cleavage sites to enzymes and side-chain flexibility of the substrate, which is
governed by the structure of protein. Macierzanka et al. (2009), showed that β-Lg was
resistant to pepsinolysis due to the compact globular structure compared to the loose
structure of β-casein. However, the degree of proteolysis in β-Lg was increased when
emulsified with oil, which was due to the partial unfolding of the β-Lg secondary
structure improving accessibility to pepsin. Other types of processing such as heat
treatment can lead to chemical modification and aggregation, depending on the
temperature and time of exposure, which, in turn, will affect protein digestion. For
instance, the heating at UHT conditions increased the rate of proteolysis of whey
proteins (Miranda et al., 1987), due to the unfolding of the structure, which exposes
the cleavage sites and enhances then the accessibility of enzymes. Similarly, the heat
treatments at 62.5-78°C resulted in an increase of proteolysis susceptibility of β-Lg
after 10 min of hydrolysis using trypsin and chymotrypsin (Stănciuc et al., 2008). This
was obtained at pH 7, however, there was a decrease in degree of hydrolysis at pH

Chapter 1: Introduction and Literature Review
51
7.5, due to probably the formation of covalent aggregates between the β-Lg
monomers presents at that pH that may hide the cleavage sites for the enzymes.
Moreover, milk protein digestion was slower and lower when in gel matrices compared
to that in liquid matrices (Barbé et al., 2013). Other factors that affect protein
hydrolysis are the lipid interaction with the proteins and the presence of physiological
surfactants, i.e. bile acids and phospholipids (Mackie et al., 2010). Gass et al. (2007)
showed that bile salts displaced proteins and increase proteolysis.Therefore, the
structure of proteins at the different length scales can impact the rate and extent of
proteolysis.
1.6.2 Digestion and Absorption of Lipids
A schematic diagram of the process of digestion and absorption of lipids is
shown in Figure 1.8. Lipids in food are mainly found as triacylglycerols (TAG) and
their digestion starts in the stomach by gastric lipase, accounting for 10-40% overall
lipolysis (Armand, 2007). Human gastric lipase is secreted by the chief cells located
in the fundic mucosa of the stomach. Gastric lipase has been reported to preferentially
cleave at sn-3 position of the ester bond of TAG resulting in sn-1,2 diacylglycerol
(DAG) and free fatty acids (FFA) (Michalski et al., 2013). Lipids are further digested
in the small intestine by the action of lipases and esterases, i.e. pancreatic lipase,
cholesterol esterase and phospholipase, with the presence of colipase and bile salts.
The intestinal lipolysis contributes to 40-70% of the overall lipid hydrolysis (Armand,
2007). Pancreatic lipase acts at the surface of the lipid particle and hydrolyses fatty
acids at the sn-1/ 3 positions of the glycerol backbone and produces FFAs and 2-
monoacylglycerol (MAG). Colipase absorbs to the TAG surface and interacts with
lipase and bile salts to allow the TAG to enter the active site of the lipase enzyme,
facilitating the digestion. Colipase also prevents the inactivation of lipase by the bile
salts. The products of dietary lipid breakdown are solubilized by the formation of mixed
micelles with bile salts and phospholipids, which pass through the enterocyte
membrane (Mu et al., 2004). In the enterocyte, the FFAs and 2-MAG become
protonated and leave the mixed micelles and they are re-synthesized into TAGs
(Goodman, 2010). These TAGs bind with lipoproteins forming chylomicrons that allow
the transport of lipids to the body's cells via the lymphatic system and then to the
systemic circulation .
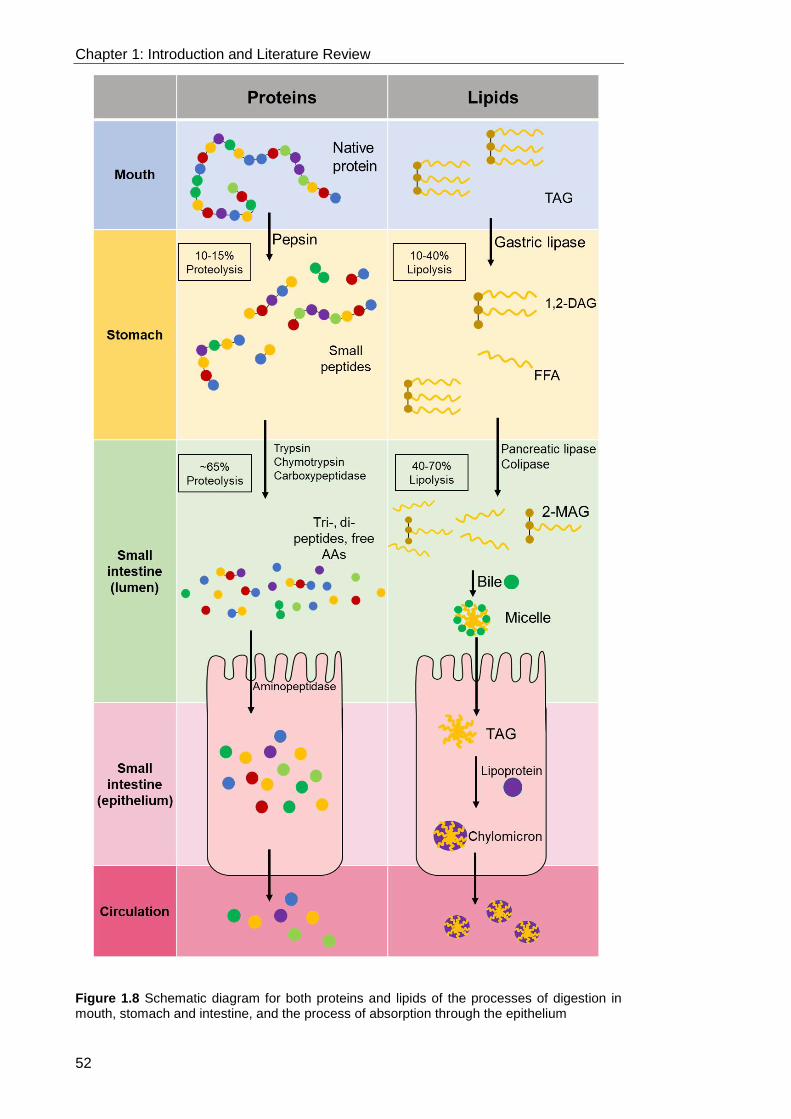
Chapter 1: Introduction and Literature Review
52
Figure 1.8 Schematic diagram for both proteins and lipids of the processes of digestion in mouth, stomach and intestine, and the process of absorption through the epithelium

Chapter 1: Introduction and Literature Review
53
1.7 Effect of Dairy Proteins on Digestion and
Physiological Responses
1.7.1 Dairy Proteins and Bioaccessibility
The nature of dairy proteins in terms of their molecular structure and physico-
chemical properties, as described above, has a strong impact on gastric and intestinal
digestion which subsequently affects the bioaccessibility of nutrients. In general, it is
assumed that casein coagulates in the acid conditions of the stomach whereas whey
proteins remain relatively soluble. Despite the fact that there are several indirect
indications suggesting this behaviour occurs, no direct visual evidence of the
restructuring of casein occurring in the human stomach has been reported so far.
Some studies reported the markedly different GE and digestion kinetics between the
main milk proteins (Mahé et al., 1991; Mahé et al., 1996). However, there are
contradictory studies in which no differences in GE for the different milk proteins were
found (Calbet et al., 2004; Lang et al., 1998). In the latter studies, sodium or calcium
caseinate was used whereas milk or micellar casein were digested in those studies
where the GE was different. Therefore, the state of the casein and its processing
history seems to strongly influence its digestion behaviour in the stomach. Caseins in
the micellar state are coagulated by pepsin (Tam et al., 1972) and low pH (Dalgleish
et al., 2012). This contrasts to caseinate, i.e. a mixture of caseins with the calcium
phosphate removed, which does not have the same micellar-type structure and is not
coagulated by pepsin. In this chapter, studies using casein in micellar form will be
mainly discussed because it is the most relevant structural form found in natural dairy
products.
In that context, Miranda et al. (1981) showed in rats that the rate of GE in
skimmed milk was slower compared with that of a mixture of denatured caseins and
the proteolysis in the stomach was much lower in the skimmed milk reporting that αs1-
casein and β-casein were almost undergraded and κ-casein was converted into para-
κ-casein.
The distinct rate and composition of the products delivered to the small intestine
after the ingestion of different milk proteins suggest a different time of residence and
behaviour in the stomach. Mahé et al. (1996) investigated the digestion kinetics of
intrinsically labelled 15N β-Lg and casein drinks, which were fed to healthy young
volunteers. The effluents from the jejunum were collected by a nasal tube and their
protein contents and flow rate were assessed. The jejunal flow rate peaked in the first

Chapter 1: Introduction and Literature Review
54
20 min after β-Lg digestion, which was present mostly in the intact form. In contrast,
casein was more slowly recovered in the jejunum in a more degraded form. These
results were supported by a more recent human study (Boutrou et al., 2013) where
the authors found that, after casein ingestion, the delivery of dietary protein in the
jejunum was progressive for 6 hours and in the form of medium size-peptides (750-
1,050 Da). In contrast, the ingestion of whey protein induced the release of larger-
size peptides (1,050-1,800 Da) and was completed after 3 hours. The authors
suggested that the coagulation of casein could lead to a slower rate of emptying
compared to a more rapid emptying of the whey proteins in solution. Therefore, casein
coagula could be more exposed to pepsin hydrolysis leading to the emptying of more
degraded products.
1.7.2 Dairy Proteins and, Absorption and Protein Metabolic
Utilization
The distinct pattern of protein digestion in the GI tract has been reflected in
different rates of AA absorption, which might modulate the postprandial metabolism
of whole body protein synthesis, breakdown and oxidation in the liver. Boirie et al.
(1997) performed a study on young healthy subjects using intrinsically 13C-Leu
labelled whey protein and micellar casein drinks, which were matched for Leu content
but were not isonitrogenous. The postprandial whole-body Leu balance, considered
as an index of protein deposition, was assessed by tracing samples from blood and
breath. The plasma AA appearance, i.e. aminoacidemia, was fast, high and transitory
after whey protein drink ingestion, which led to an increase in whole body protein
synthesis (68%) but no support in whole body protein breakdown. In contrast, the
ingestion of a casein drink resulted in a lower, slower and prolonged release of AAs.
This was associated with a markedly higher inhibition of whole protein breakdown
(34% for 7 hours), but just slight stimulation of whole protein synthesis (31%)
compared to whey protein drink. However, the Leu balance was positive for the casein
drink over 7 hours, promoting protein deposition whereas no effect was provided from
whey protein drink. The authors classified, in relation to that postprandial behaviour,
whey proteins and casein as ‘fast’ and ‘slow’ digested proteins respectively, which
has been widely considered in the literature. In the same line, Lacroix et al. (2006a)
showed in healthy volunteers that the aminoacidemia for the first hour in whey
proteins ingestion was rapid and high followed by a decrease reaching values below
the baseline of total plasma AAs after 3 hours, which resulted in hypoaminoacidemia.
The dietary nitrogen was labelled using 15N labelling and the kinetics of protein
utilization were followed during 8 hours in plasma and urinary urea. The observed

Chapter 1: Introduction and Literature Review
55
plasma AA rate matched with the higher rate and transfer of dietary N to urea after
whey protein intake compared to casein ingestion. In this study, a milk protein drink
containing 20:80 ratio of whey proteins:caseins was also studied and there was no
significant difference in the dietary nitrogen utilization when compared to casein drink.
This might be attributed to the profound effect of coagulation in the stomach. In this
line, the behaviour of blends with different ratios of whey proteins and caseins could
be interesting to investigate.
Caseins and whey proteins have different AA composition, the main difference
is a higher Leu content in whey proteins. One might think that the different AA
composition of the protein sources, not the protein digestion kinetics, might induce
different dietary nitrogen postprandial metabolism. Also, a different nitrogen content
could affect postprandial balance. This was addressed in a study by Dangin et al.
(2001). Casein and whey protein drinks were matched in AA composition and nitrogen
contents but designed to have different digestion rates. The fast-digested drinks were
whey protein and casein hydrolysate, and the slow-digested drinks were caseins and
whey proteins consumed at repeated times during digestion. In accordance with the
previous studies illustrated, they showed that fast-digested drinks induced rapid,
pronounced and transient increase of aminoacidemia, which led to high and
immediate stimulation of protein synthesis. In contrast, slow-digested drinks induced
moderated and prolonged aminoacidemia over 4-5 hours resulting in the inhibition of
protein breakdown and no effect in protein synthesis. Also, the possible effect of
insulin inhibiting hydrolysis was refuted because no increase in insulin level was
observed. Similarly, Bos et al. (2003) demonstrated that the availability of AAs by
digestion kinetics was the main driver for protein metabolism by using milk protein
compared to soy protein. The ingestion of the latter protein resulted in a higher and
earlier (2.5 hours) AA peak in plasma compared with milk proteins (3.9 hours), which
was linked to a lower postpandrial nitrogen retention of soy protein showing
significantly higher urea production within the first 2 hours.
The inclusion of other nutrients in the protein matrix might affect protein
utilization. Gaudichon et al. (1999), investigated whether the addition of sucrose or
milk fat affected the net postprandial protein utilization of milk protein. Sucrose, but
not fat, significantly reduced the postprandial transfer of [15N]-milk nitrogen to urea,
which could be mainly due to a delayed GE of the meal because of the higher energy
density. Nevertheless, the total amount of dietary nitrogen recovered over an eight-
hour period after meal ingestion was not different. The absence of any effect in the
presence of fat was unexpected because the energy density was similar to that of the
sucrose meal and the authors suggested that lipid may have separated and formed a
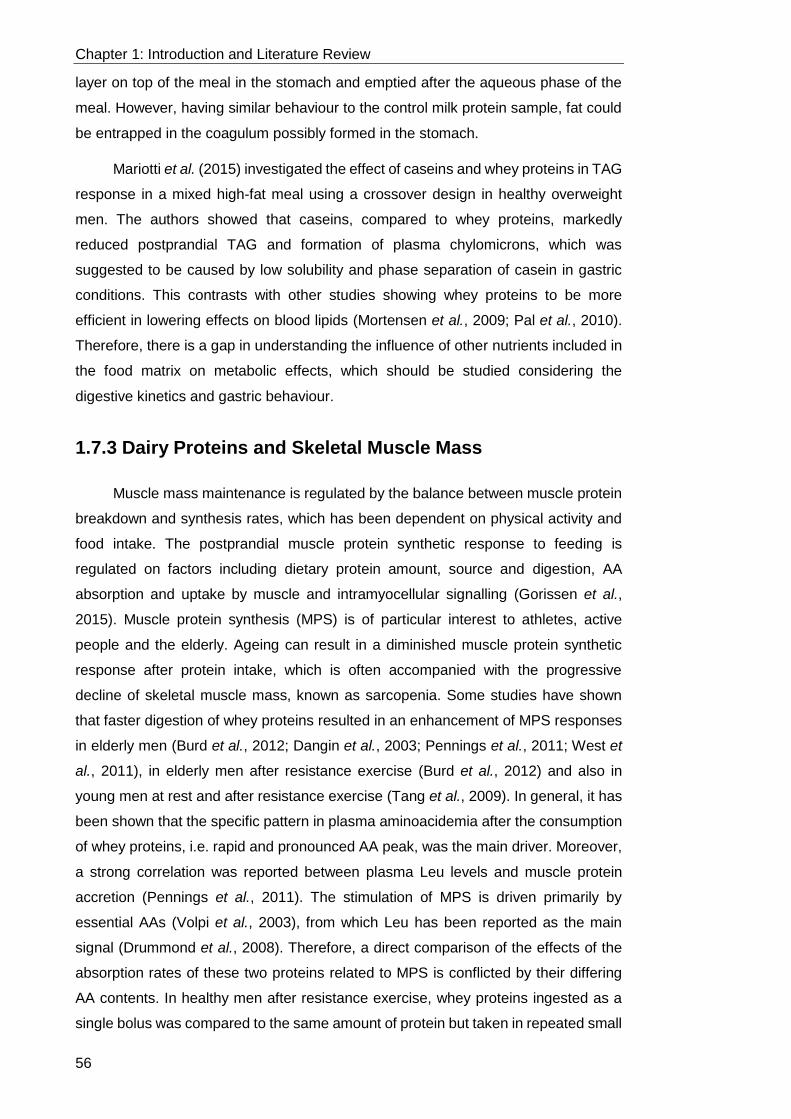
Chapter 1: Introduction and Literature Review
56
layer on top of the meal in the stomach and emptied after the aqueous phase of the
meal. However, having similar behaviour to the control milk protein sample, fat could
be entrapped in the coagulum possibly formed in the stomach.
Mariotti et al. (2015) investigated the effect of caseins and whey proteins in TAG
response in a mixed high-fat meal using a crossover design in healthy overweight
men. The authors showed that caseins, compared to whey proteins, markedly
reduced postprandial TAG and formation of plasma chylomicrons, which was
suggested to be caused by low solubility and phase separation of casein in gastric
conditions. This contrasts with other studies showing whey proteins to be more
efficient in lowering effects on blood lipids (Mortensen et al., 2009; Pal et al., 2010).
Therefore, there is a gap in understanding the influence of other nutrients included in
the food matrix on metabolic effects, which should be studied considering the
digestive kinetics and gastric behaviour.
1.7.3 Dairy Proteins and Skeletal Muscle Mass
Muscle mass maintenance is regulated by the balance between muscle protein
breakdown and synthesis rates, which has been dependent on physical activity and
food intake. The postprandial muscle protein synthetic response to feeding is
regulated on factors including dietary protein amount, source and digestion, AA
absorption and uptake by muscle and intramyocellular signalling (Gorissen et al.,
2015). Muscle protein synthesis (MPS) is of particular interest to athletes, active
people and the elderly. Ageing can result in a diminished muscle protein synthetic
response after protein intake, which is often accompanied with the progressive
decline of skeletal muscle mass, known as sarcopenia. Some studies have shown
that faster digestion of whey proteins resulted in an enhancement of MPS responses
in elderly men (Burd et al., 2012; Dangin et al., 2003; Pennings et al., 2011; West et
al., 2011), in elderly men after resistance exercise (Burd et al., 2012) and also in
young men at rest and after resistance exercise (Tang et al., 2009). In general, it has
been shown that the specific pattern in plasma aminoacidemia after the consumption
of whey proteins, i.e. rapid and pronounced AA peak, was the main driver. Moreover,
a strong correlation was reported between plasma Leu levels and muscle protein
accretion (Pennings et al., 2011). The stimulation of MPS is driven primarily by
essential AAs (Volpi et al., 2003), from which Leu has been reported as the main
signal (Drummond et al., 2008). Therefore, a direct comparison of the effects of the
absorption rates of these two proteins related to MPS is conflicted by their differing
AA contents. In healthy men after resistance exercise, whey proteins ingested as a
single bolus was compared to the same amount of protein but taken in repeated small
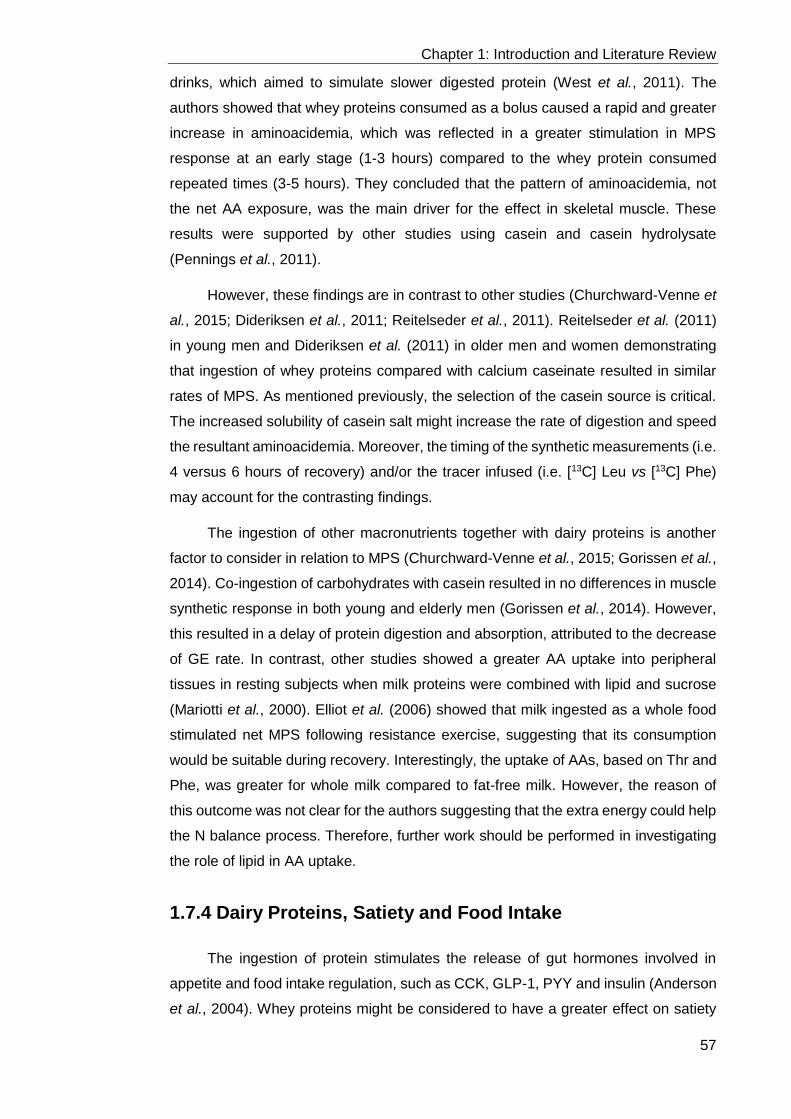
Chapter 1: Introduction and Literature Review
57
drinks, which aimed to simulate slower digested protein (West et al., 2011). The
authors showed that whey proteins consumed as a bolus caused a rapid and greater
increase in aminoacidemia, which was reflected in a greater stimulation in MPS
response at an early stage (1-3 hours) compared to the whey protein consumed
repeated times (3-5 hours). They concluded that the pattern of aminoacidemia, not
the net AA exposure, was the main driver for the effect in skeletal muscle. These
results were supported by other studies using casein and casein hydrolysate
(Pennings et al., 2011).
However, these findings are in contrast to other studies (Churchward-Venne et
al., 2015; Dideriksen et al., 2011; Reitelseder et al., 2011). Reitelseder et al. (2011)
in young men and Dideriksen et al. (2011) in older men and women demonstrating
that ingestion of whey proteins compared with calcium caseinate resulted in similar
rates of MPS. As mentioned previously, the selection of the casein source is critical.
The increased solubility of casein salt might increase the rate of digestion and speed
the resultant aminoacidemia. Moreover, the timing of the synthetic measurements (i.e.
4 versus 6 hours of recovery) and/or the tracer infused (i.e. [13C] Leu vs [13C] Phe)
may account for the contrasting findings.
The ingestion of other macronutrients together with dairy proteins is another
factor to consider in relation to MPS (Churchward-Venne et al., 2015; Gorissen et al.,
2014). Co-ingestion of carbohydrates with casein resulted in no differences in muscle
synthetic response in both young and elderly men (Gorissen et al., 2014). However,
this resulted in a delay of protein digestion and absorption, attributed to the decrease
of GE rate. In contrast, other studies showed a greater AA uptake into peripheral
tissues in resting subjects when milk proteins were combined with lipid and sucrose
(Mariotti et al., 2000). Elliot et al. (2006) showed that milk ingested as a whole food
stimulated net MPS following resistance exercise, suggesting that its consumption
would be suitable during recovery. Interestingly, the uptake of AAs, based on Thr and
Phe, was greater for whole milk compared to fat-free milk. However, the reason of
this outcome was not clear for the authors suggesting that the extra energy could help
the N balance process. Therefore, further work should be performed in investigating
the role of lipid in AA uptake.
1.7.4 Dairy Proteins, Satiety and Food Intake
The ingestion of protein stimulates the release of gut hormones involved in
appetite and food intake regulation, such as CCK, GLP-1, PYY and insulin (Anderson
et al., 2004). Whey proteins might be considered to have a greater effect on satiety

Chapter 1: Introduction and Literature Review
58
compared to caseins since a higher content of branched chain AAs can greatly
stimulate insulin secretion (Nilsson et al., 2004). However there is no consistent
evidence supporting one milk protein to be more satiating than the other (Bendtsen et
al., 2013). Hall et al. (2003) investigated in healthy lean volunteers the appetite
responses of whey proteins and casein drinks containing both lipid and carbohydrate
with their total energy matched. The authors found that a whey-based drink was
satiating for 180 min after ingestion according to the appetite subjective score and
was more efficient at decreasing energy intake in an ad libitum lunch, served 90 min
after ingestion, than a casein drink. The secretion of the most important hormones in
the role of satiety, i.e. CCK and GLP-1, increased by 60% and 65% respectively after
whey proteins ingestion compared to caseins. Similarly, Veldhorst et al. (2009)
reported a decrease in appetite after, in particular, 20 min of consumption of 15 g of
whey proteins (as a part of a standard breakfast) compared to casein or soy protein,
which was in accordance to the higher concentration of GLP-1 and insulin observed
following whey protein consumption. Accordingly, Luhovyy et al. (2007) showed that
whey proteins greatly suppressed food intake more quickly, i.e. at 90 min compared
to the latter time of 150 min observed in casein after meal consumption. In contrast,
casein consumption was reported to induce a greater satiety promoting effect than
whey proteins in a study by Acheson et al. (2011), in which subjective appetite
sensations were measured for 330 min. This was supported by Alfenas et al. (2010)
with normal weight subjects, in which casein consumption led to a daily lower energy
intake with 7-day supplementation compared to whey protein. Calbet et al. (2004) did
not find significant differences in the hormonal secretion of GLP-1 and PYY when the
casein and whey proteins were compared with their hydrolysates. The variability of
results can be explained by the protein source, quantity and time of measurements
used in the studies. Overall, it seems that fast digested protein could have a greater
satiety promoting power in the short term in contrast to the long-term effect shown by
the slow digested protein of casein. Then the different digestion and subsequent AA
absorption rate of casein and whey proteins might affect the secretion of GI hormones
and subsequent satiety and food intake.
The ingestion of milk as a whole was more effective for decreasing satiety and
reducing food intake than consuming the isocaloric drinks containing casein or whey
proteins alone (Lorenzen et al., 2012), which could be as the result of a greater
increase of CCK and GLP-1 (Diepvens et al., 2008). Moreover, milk consumption has
been reported to promote satiety and decrease food intake when compared to other
drinks such as fruit juice (Dove et al., 2009).
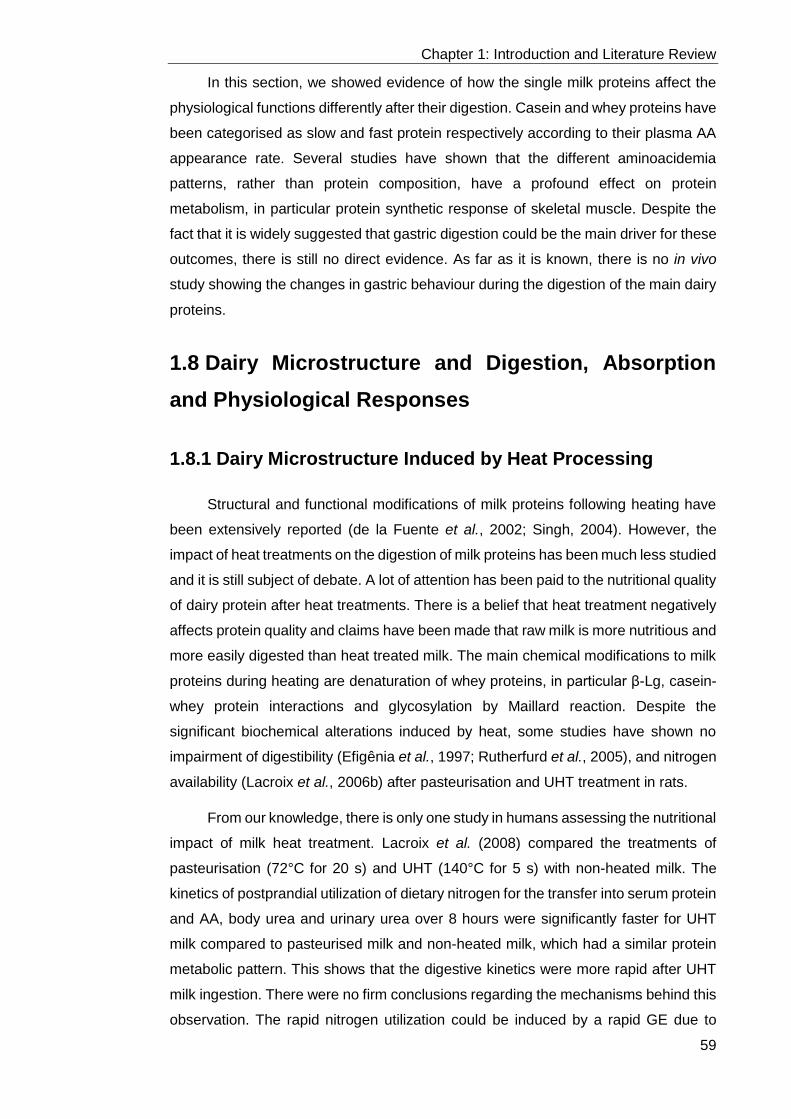
Chapter 1: Introduction and Literature Review
59
In this section, we showed evidence of how the single milk proteins affect the
physiological functions differently after their digestion. Casein and whey proteins have
been categorised as slow and fast protein respectively according to their plasma AA
appearance rate. Several studies have shown that the different aminoacidemia
patterns, rather than protein composition, have a profound effect on protein
metabolism, in particular protein synthetic response of skeletal muscle. Despite the
fact that it is widely suggested that gastric digestion could be the main driver for these
outcomes, there is still no direct evidence. As far as it is known, there is no in vivo
study showing the changes in gastric behaviour during the digestion of the main dairy
proteins.
1.8 Dairy Microstructure and Digestion, Absorption
and Physiological Responses
1.8.1 Dairy Microstructure Induced by Heat Processing
Structural and functional modifications of milk proteins following heating have
been extensively reported (de la Fuente et al., 2002; Singh, 2004). However, the
impact of heat treatments on the digestion of milk proteins has been much less studied
and it is still subject of debate. A lot of attention has been paid to the nutritional quality
of dairy protein after heat treatments. There is a belief that heat treatment negatively
affects protein quality and claims have been made that raw milk is more nutritious and
more easily digested than heat treated milk. The main chemical modifications to milk
proteins during heating are denaturation of whey proteins, in particular β-Lg, casein-
whey protein interactions and glycosylation by Maillard reaction. Despite the
significant biochemical alterations induced by heat, some studies have shown no
impairment of digestibility (Efigênia et al., 1997; Rutherfurd et al., 2005), and nitrogen
availability (Lacroix et al., 2006b) after pasteurisation and UHT treatment in rats.
From our knowledge, there is only one study in humans assessing the nutritional
impact of milk heat treatment. Lacroix et al. (2008) compared the treatments of
pasteurisation (72°C for 20 s) and UHT (140°C for 5 s) with non-heated milk. The
kinetics of postprandial utilization of dietary nitrogen for the transfer into serum protein
and AA, body urea and urinary urea over 8 hours were significantly faster for UHT
milk compared to pasteurised milk and non-heated milk, which had a similar protein
metabolic pattern. This shows that the digestive kinetics were more rapid after UHT
milk ingestion. There were no firm conclusions regarding the mechanisms behind this
observation. The rapid nitrogen utilization could be induced by a rapid GE due to

Chapter 1: Introduction and Literature Review
60
different structural changes in the stomach but the authors also suggested that
possible Lys damage following processing could also promote the higher deamination
level.
The faster nitrogen utilisation in highly heat treated milk might be due to faster
gastric digestion. Miranda et al. (1987), using a rat model, compared skimmed milk
samples heated using UHT and autoclaved (120°C for 20 min) conditions with non-
heated skimmed milk. The heat treatment, in particular autoclaved, accelerated the
GE rate of total nitrogen and casein hydrolysis. This contrasts to the work by Barbé
et al. (2013), in mini-pigs, in which a higher mean retention time in the stomach of
heated skimmed milk (90°C, 10 min) was observed when compared to a non-heated
system. However, in the latter study, they used chromium to measure the gastro-
duodenal transit, which does not represent the solid phase of any coagulum formed
in the stomach. In general, there is limited research on the GE rate of heated milk
samples to draw any firm conclusions.
However, a faster GE induced by heating might be more in accordance with
some evidence showing reduced milk protein coagulation in the stomach. The study
by Kaufmann (1984), using mini-pigs, appears to be the only in vivo study reporting
visually that heat treatment modifies the structure of the coagulum formed in the
gastric compartment. This study also demonstrated the restructuring of milk in the
stomach, whereby the coagulum formed with UHT sterilized milk in the stomach was
less firm and had crumbly structure compared to pasteurised milk and more so with
raw milk. Moreover, Meisel et al. (1984) reported a significant effect of UHT treatment
on acidification and protein emptying during gastric digestion. The pH at 360 min of
gastric digestion was 4.32 and 1.80 for raw and UHT+homogenised milk, respectively.
The protein content in chyme after 360 min digestion was approximately 75% in raw
milk compared to 25% in UHT+homogenised milk. This could potentially be related to
the differences in pepsin activity found. The analysis of the chyme at 360 min showed
that pepsin activity was approximately 1,000 U/g protein in raw milk in contrast to the
approximate value of 33,000 U/g protein measured in UHT+homogenised milk.
Similarly, using the in vitro model HGS, Ye et al. (2016a) showed the formation
of different structures of the coagula formed in the simulated stomach between
unheated and heated skimmed milk (90°C for 20 min). Unheated milk formed a dense,
solid structure with small pores in contrast to the loose and particulate structure of the
heated milk. This coagulation behaviour was not affected by the presence of milk fat
as shown in the digestion of whole milk under the same conditions (Ye et al., 2016b).
In unheated milk, casein hydrolysis slowed down and mainly occurred at the surface
of the coagulum compared to the inner part, indicating slower pepsin diffusion into the
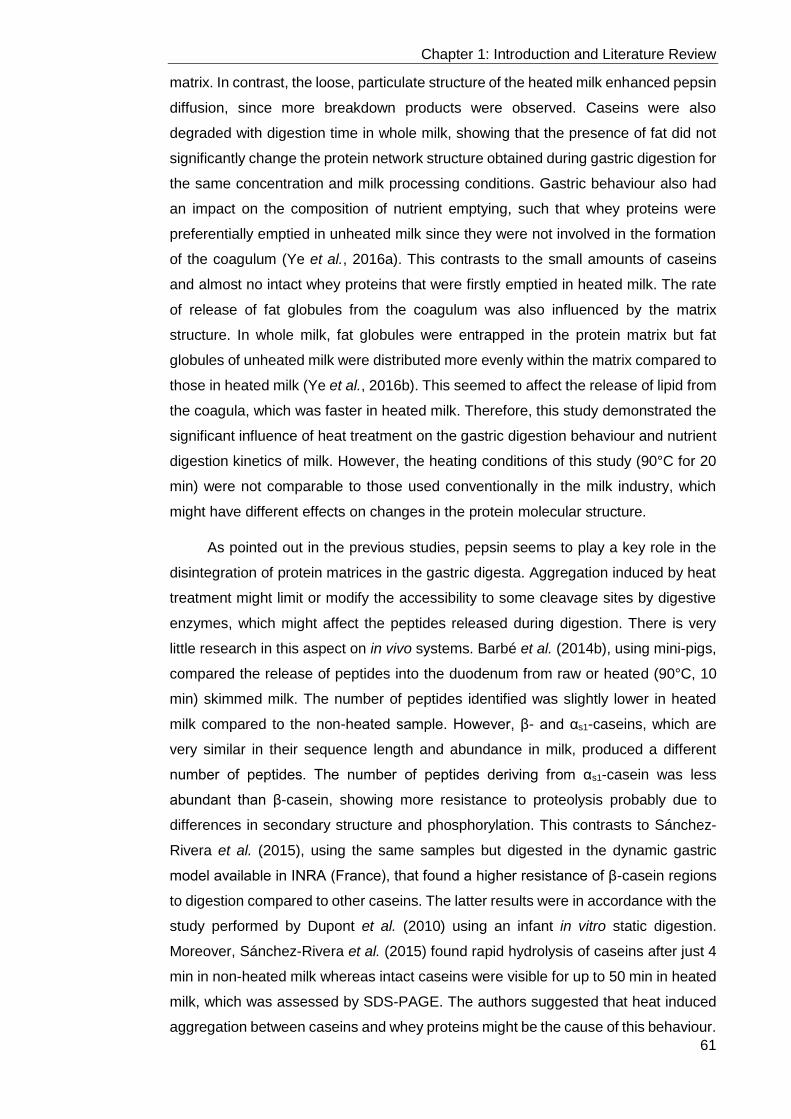
Chapter 1: Introduction and Literature Review
61
matrix. In contrast, the loose, particulate structure of the heated milk enhanced pepsin
diffusion, since more breakdown products were observed. Caseins were also
degraded with digestion time in whole milk, showing that the presence of fat did not
significantly change the protein network structure obtained during gastric digestion for
the same concentration and milk processing conditions. Gastric behaviour also had
an impact on the composition of nutrient emptying, such that whey proteins were
preferentially emptied in unheated milk since they were not involved in the formation
of the coagulum (Ye et al., 2016a). This contrasts to the small amounts of caseins
and almost no intact whey proteins that were firstly emptied in heated milk. The rate
of release of fat globules from the coagulum was also influenced by the matrix
structure. In whole milk, fat globules were entrapped in the protein matrix but fat
globules of unheated milk were distributed more evenly within the matrix compared to
those in heated milk (Ye et al., 2016b). This seemed to affect the release of lipid from
the coagula, which was faster in heated milk. Therefore, this study demonstrated the
significant influence of heat treatment on the gastric digestion behaviour and nutrient
digestion kinetics of milk. However, the heating conditions of this study (90°C for 20
min) were not comparable to those used conventionally in the milk industry, which
might have different effects on changes in the protein molecular structure.
As pointed out in the previous studies, pepsin seems to play a key role in the
disintegration of protein matrices in the gastric digesta. Aggregation induced by heat
treatment might limit or modify the accessibility to some cleavage sites by digestive
enzymes, which might affect the peptides released during digestion. There is very
little research in this aspect on in vivo systems. Barbé et al. (2014b), using mini-pigs,
compared the release of peptides into the duodenum from raw or heated (90°C, 10
min) skimmed milk. The number of peptides identified was slightly lower in heated
milk compared to the non-heated sample. However, β- and αs1-caseins, which are
very similar in their sequence length and abundance in milk, produced a different
number of peptides. The number of peptides deriving from αs1-casein was less
abundant than β-casein, showing more resistance to proteolysis probably due to
differences in secondary structure and phosphorylation. This contrasts to Sánchez-
Rivera et al. (2015), using the same samples but digested in the dynamic gastric
model available in INRA (France), that found a higher resistance of β-casein regions
to digestion compared to other caseins. The latter results were in accordance with the
study performed by Dupont et al. (2010) using an infant in vitro static digestion.
Moreover, Sánchez-Rivera et al. (2015) found rapid hydrolysis of caseins after just 4
min in non-heated milk whereas intact caseins were visible for up to 50 min in heated
milk, which was assessed by SDS-PAGE. The authors suggested that heat induced
aggregation between caseins and whey proteins might be the cause of this behaviour.

Chapter 1: Introduction and Literature Review
62
However, this is opposite to the results reported above with other dynamic gastric
models. It seems that the gastric colloidal behaviour was completely different,
unfortunately there was no reference to that in the study by Sánchez-Rivera et al.
(2015). This highlights the need for full characterisation of the structure and behaviour
of the matrices and also the physical and chemical environments of the dynamic
models that could induce differences in the coagulation and digestion behaviour.
As illustrated, there are still conflicting results regarding casein digestion, as this
appears to be sensitive to the matrix structure, which in turn is very sensitive to the
environmental conditions and processing. However, the effect of heat on whey protein
digestion is much simpler and more generally accepted. Native β-Lg is resistant to
pepsin digestion while heating β-Lg promotes its hydrolysis. Temperatures above
75°C denature whey proteins, in particular β-Lg which unfolds and exposes
hydrophobic groups. This susceptibility to proteolysis has been seen in several
digestion systems; mini-pigs (Barbé et al., 2013), dynamic gastric model (Ye et al.,
2016a) and static digestion model (Islam et al., 2017). However, as far as it is known,
there are no published human studies investigating this effect.
1.8.2 Dairy Microstructure Induced by Homogenisation
Processing
Homogenization is another common process used in the dairy industry.
Homogenisation induces very high shear rates to reduce the size of the lipid droplets,
which changes the microstructure and can have an impact on nutrient digestion.
Studies of the effect of droplet size on dairy nutrient digestion have been mainly
performed using in vitro static models in particular with regard to lipolysis in infant
formula and human milk (Bourlieu et al., 2015). It is generally believed that the
reduction in droplet size following homogenisation enhances lipid digestion because
of the overall larger interface area available for lipase action. However, other factors
such as protein matrix and droplet interfacial composition play an important role and
it is complex to distinguish the main driver of the digestion outcomes (Garcia et al.,
2014).
To our knowledge, the effect of homogenisation of a milk matrix on the digestive
kinetics has not been studied in adult humans to date. However, in vitro systems have
been used to get some understanding of this relationship. Ye et al. (2017) using the
HGS, reported very similar gastric behaviour in terms of pH and timing of coagulation
when homogenised milk was compared to non-homogenised milk. The structure of
the coagula in homogenised milk was more fragmented than raw milk but this effect

Chapter 1: Introduction and Literature Review
63
was much less profound than observed with heat treatment, and it did not affect the
pattern of protein digestion.
The structure of the protein network in which lipid droplets are embedded seems
to be a critical factor in the hydrolysis rates of lipid as previously stated. Guo et al.
(2014) investigated the effect of the droplet size in whey protein emulsion gels in the
oral and gastric compartments The different droplet size (1, 6 and 12 µm) induced a
different initial gel structure; the 1 µm-droplet gel appeared to be evenly distributed
and bound to the protein network compared to the 12 µm-droplet gel, which had a
lower fracture force modulus. The 6 µm-droplet gel presented an intermediate
structure. The oral breakdown of these samples in a human mouth showed significant
coalescence and release of oil droplets for the biggest droplet size (Guo et al., 2014).
The gel boluses were mimicked in the in vitro study followed by gastric digestion using
the HGS (Guo et al., 2014). The initial gel structure strongly influenced its
disintegration during the gastric phase, resulting in significant break down of particles
and coalescence during digestion for the 6 µm- and 12 µm-droplet gels, which caused
the creaming observed after 300 min of gastric digestion. In contrast, the oil droplets
of the 1 µm-droplet gel bolus largely remained within the protein matrix during gastric
digestion. Moreover, the hydrolysis rate of whey proteins was higher in 12 µm-droplet
gel. This could be attributed to the loose protein structure induced to the higher droplet
size, which could promote the access to pepsin to the cleavage sites.
The effect of the droplet size in relation to colloidal stability in gastric
environment has been less studied which can be attributed to the limitations of in vitro
systems, in particular static models. Some clinical studies have shown a significant
impact of emulsion droplet size and intragastric stability not only on nutrient delivery
and absorption (Golding et al., 2011; Marciani et al., 2007) but also on satiety
(Marciani et al., 2008), and subsequent regulation of energy intake (Hussein et al.,
2015). In general, emulsions that were stable in the gastric environment emptied more
slowly from the stomach, which was regulated by hormonal feedback from the
duodenum. Steingoetter et al. (2015). reported that a reduction in droplet size by two
orders of magnitude (0.3 versus 52 μm diameter) delayed GE by 38 min for acid-
stable emulsions in a human trial. Moreover, smaller droplet diameter (0.7 µm)
emulsions facilitated lipid digestion of TAG in the stomach (20-37%) and proximal
small intestine (57-73%), compared to lipid droplet size of 10 m (7-16% in gastric
and 37-46% in duodenum) due to the larger surface area (Armand et al., 1999),
suggesting an increase in fatty acid sensing. Nutrient sensing was linked to hormonal
response feedback mediated in particular by CCK (Ledeboer et al., 1995; Seimon et
al., 2009), which enhances the perception of satiety and reduced subsequent energy

Chapter 1: Introduction and Literature Review
64
intake. These human studies demonstrated that the gastric stability and particle size
of food emulsions greatly impacts the transit of lipids throughout the GI tract and might
further influence satiety and food intake. Unfortunately, these studies did not include
any dairy based ingredients or it was not the focus of the study. This highlights the
gap of knowledge in understanding the physiological response to consumption of
dairy structures.
Regarding dairy-based systems, Peters et al. (2014) studied the effect of droplet
size (3 versus 0.1 µm) in a milk shake. They did not find any significant effect in CCK
released, satiety and food intake for 180 min after drink ingestion. This is in contrast
to the significant enhancement in satiety for the smaller size droplets observed by
Maljaars et al. (2012). In the latter study, the same milk shake but without lipid was
orally administrated and the lipid droplets were infused directly to the small intestine.
In the Peters et al. (2014) study the sample including protein could potentially
coagulate in the stomach entrapping the lipid droplets, which could delay or change
the effect on satiety that was expected. Unfortunately, the gastric behaviour was not
investigated in the study. Again, this illustrates the crucial importance of studying the
gastric phase and the importance of the effect of the matrix within which the
components of interest are arranged.
Droplet size is also thought to influence food intake behaviour as previously
mentioned. However, the study of satiety is quite complex because it also involves
cognitive factors as well as physiological factors. Lett et al. (2016b) aimed to modulate
satiation and satiety by controlling oil droplet size (d4,3 of 2 versus 50 µm) of an
emulsion (1% wt sodium caseinate and 15% wt sunflower oil). This aimed to enhance
satiety using small droplet size by increasing the perception of creaminess via
enhancing hedonic appeal. They did not find significant differences in sensory
characteristics, which contrasts with their previous study (Lett et al., 2016a). However,
interestingly, the smaller droplet size within an emulsion preload resulted in a
significant reduction in food intake (62.4 kcal) at a subsequent ad libitum meal. The
authors did not find any conclusive primary mechanism responsible for this effect on
satiety, but it is likely from earlier discussions, that this difference in droplet size would
affect the lipid profile emptied from the stomach, and the subsequent feedback and
control of gastric emptying could influence satiety. This highlights the complexity of
investigating appetite behaviour because of the multiple physiological and sensory
factors involved, referred to as the “satiety cascade”.
The literature reviewed in this section illustrated the significant effect of dairy
processing by heating and droplet size modulation on nutrient digestion kinetics.
However, the underlying mechanisms are not fully understood. Regarding heat
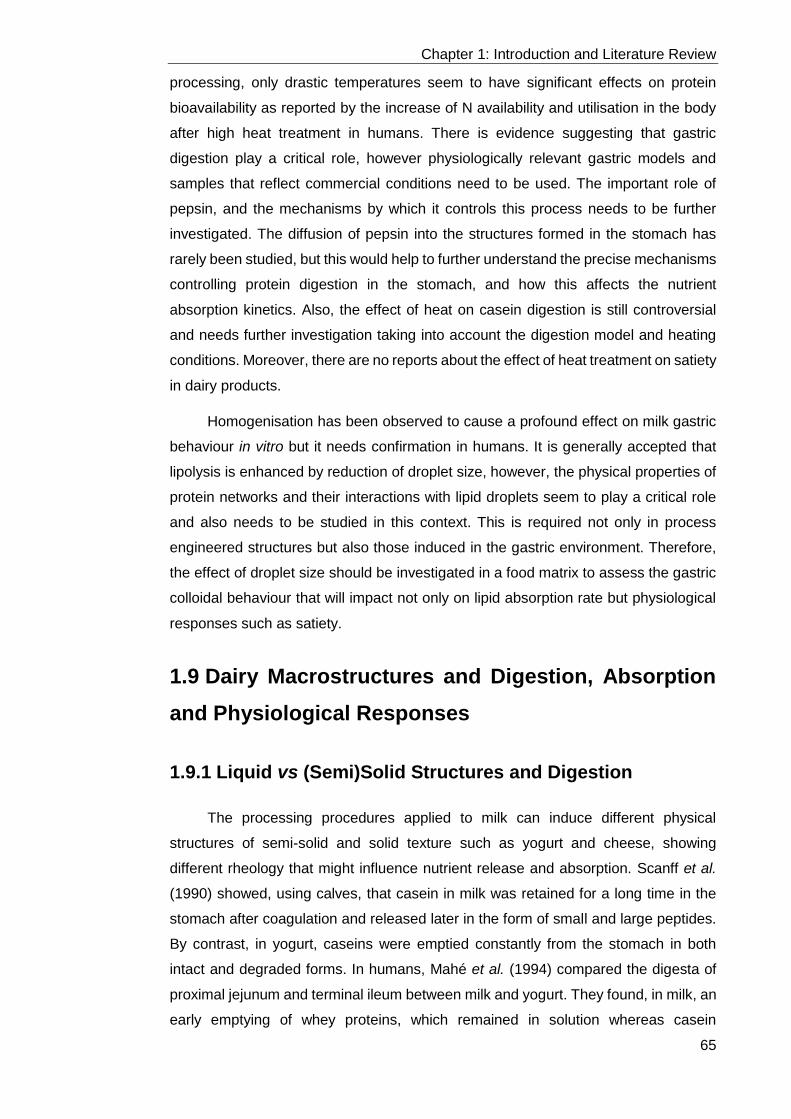
Chapter 1: Introduction and Literature Review
65
processing, only drastic temperatures seem to have significant effects on protein
bioavailability as reported by the increase of N availability and utilisation in the body
after high heat treatment in humans. There is evidence suggesting that gastric
digestion play a critical role, however physiologically relevant gastric models and
samples that reflect commercial conditions need to be used. The important role of
pepsin, and the mechanisms by which it controls this process needs to be further
investigated. The diffusion of pepsin into the structures formed in the stomach has
rarely been studied, but this would help to further understand the precise mechanisms
controlling protein digestion in the stomach, and how this affects the nutrient
absorption kinetics. Also, the effect of heat on casein digestion is still controversial
and needs further investigation taking into account the digestion model and heating
conditions. Moreover, there are no reports about the effect of heat treatment on satiety
in dairy products.
Homogenisation has been observed to cause a profound effect on milk gastric
behaviour in vitro but it needs confirmation in humans. It is generally accepted that
lipolysis is enhanced by reduction of droplet size, however, the physical properties of
protein networks and their interactions with lipid droplets seem to play a critical role
and also needs to be studied in this context. This is required not only in process
engineered structures but also those induced in the gastric environment. Therefore,
the effect of droplet size should be investigated in a food matrix to assess the gastric
colloidal behaviour that will impact not only on lipid absorption rate but physiological
responses such as satiety.
1.9 Dairy Macrostructures and Digestion, Absorption
and Physiological Responses
1.9.1 Liquid vs (Semi)Solid Structures and Digestion
The processing procedures applied to milk can induce different physical
structures of semi-solid and solid texture such as yogurt and cheese, showing
different rheology that might influence nutrient release and absorption. Scanff et al.
(1990) showed, using calves, that casein in milk was retained for a long time in the
stomach after coagulation and released later in the form of small and large peptides.
By contrast, in yogurt, caseins were emptied constantly from the stomach in both
intact and degraded forms. In humans, Mahé et al. (1994) compared the digesta of
proximal jejunum and terminal ileum between milk and yogurt. They found, in milk, an
early emptying of whey proteins, which remained in solution whereas casein

Chapter 1: Introduction and Literature Review
66
coagulated. In contrast, the greater viscosity of yogurt provided a more delayed and
regular release of nitrogen into the duodenum compared to milk. This was suggested
to be due to the different gastric emptying pattern, the gastric half emptying time
(measured using 14C-PEG-4000) was shorter in milk (35 min) than in yogurt (60 min).
However, this did not affect the overall extensive digestion of milk proteins from both
matrices; approximately 91% of N was absorbed between the stomach and the
terminal ileum in 240 min. These outcomes were supported by Gaudichon et al.
(1995) in humans and mini-pigs (Gaudichon et al., 1994), in which the dependence of
liquid to solid ratio of the gastric digesta in GE was highlighted. The viscosity of yogurt
also influenced the postprandial lipid profile in humans by delaying the peak in plasma
TAG whereas milk provided a lower but more long-lasting rise of TAG in plasma
(Sanggaard et al., 2004). Interestingly, Mahé et al. (1994) reported, in humans, that
the absorption of calcium in the duodenum was significantly higher after ingestion of
yogurt (67%) compared to that of milk (44%), probably due to a higher casein
availability in yogurt. This shows that the effect of intestinal delivery rates does not
only affect macronutrients but micronutrients as well.
Using similar macrostructures, Barbé et al. (2013) compared the effect of
unheated skimmed milk and its correspondent gel produced using rennet in mini-pigs.
The gel matrix ingestion induced significantly lower and prolonged Leu levels in
plasma throughout a 7-hour period after meal ingestion, whereas the liquid structure
peaked after 30 min of meal ingestion. It was suggested that the gel structure could
slow down proteolysis and AA absorption, which could be reflected physiologically.
However, the levels of the GI hormones measured in this study, CCK and Ghrelin, did
not present any significant difference between the matrices over a 4-hour period after
meal ingestion. Despite the different AA uptake rate that was obtained, the authors
found no significant differences in the mean retention time in the stomach. The
measurement was based on chromium-EDTA, which is a non-hydrolysable and non-
absorbable marker of the liquid phase, which might not be representative of the entire
gastric phase contents of the heterogeneous structures formed in the stomach. The
effect of these matrices (milk liquid versus gel) was further studied in relation to the
pattern of peptides released into the duodenum at different times using mini-pigs
(Barbé et al., 2014b). The authors reported that the food matrix did not affect the
accessibility of enzymes to the cleavage sites as seen, due to the identification of the
same peptides over the digestion time but the structure had a great impact on the
quantity of identified peptides. The gel structure presented lower amounts of free AAs
but higher number of peptides, when compared to the matrix ingested in a liquid state,
even though the latter was supposed to coagulate in the stomach. The mechanisms
behind these results were not clearly identified, which illustrates the difficulty of

Chapter 1: Introduction and Literature Review
67
interpretation of results in a system with several contributory factors, such as matrix
structure, gastric restructuring and emptying and enzyme accessibility. The
mechanisms behind the results of these dairy structures were investigated by
mathematical modelling, which accounted for the main digestive events including
gastric behaviours of coagulation and syneresis in the stomach (Le Feunteun et al.,
2014). It was shown that the gastric retention controlled by the physico-chemical
properties of the matrices was the limiting step explaining the differences in the mini-
pig data. Importantly, the gastric phase was determined to have the crucial, rate-
limiting effect in explaining the kinetics of AA absorption observed in vivo.
1.9.2 Liquid vs (Semi)Solid Structures, and Appetite
Only a few studies have investigated the impact of the physical structure of dairy
matrices in relation to appetite. Sanggaard et al. (2004), did not find any difference in
appetite sensation, measured by visual analogue scale, and insulin and glucose
between yogurt and whole milk in eight healthy men, despite the significant slower
rate of GE observed after yogurt consumption. However, the level of GIP was twice
higher in yogurt between 30 and 120 min but the measured gut hormones remained
elevated for longer time after milk ingestion, in agreement with the postprandial lipid
profile. The rapid first emptying of whey proteins and the subsequent slow emptying
of the casein coagulum might counteract the effect of viscosity in the yogurt with the
more homogenous nutrient emptying and lead to similar appetite sensations.
Dougkas et al. (2012) studied the effect of three isocaloric dairy products (semi-
skimmed milk, yogurt and cheese) consumed as a snack on appetite and subsequent
ab libitum lunch energy intake in overweight men. The yogurt intake reduced the rating
of hunger of 8 and 10% compared with cheese and milk, repectively, whereas they
did not present any difference in the overall energy intake or the satiety hormones of
ghrelin, PYY and insulin. Similarly, Mackie et al. (2013) compared two isocaloric
samples (same lipid, protein and carbohydrate content) with a different physical
structure. The liquid sample was a milk protein-stabilised emulsion and the semi-solid
sample was a mixture of grated cheese and yogurt. The authors showed a different
behaviour in the stomach using MRI; the semi-solid matrix presented sedimentation
whereas liquid matrix presented creaming. The semi-solid sample promoted greater
fullness over the three-hour study, which was linked to the volume of the gastric
contents remaining by the slower GE rate over the first hour. However, the effective
reduction of hunger of the semi-solid meal was not reflected in the plasma CCK level,
which was lower over the first hour and then similar for both meals. This shows that
the rationale of the satiety biomarkers does not always guarantee high perceived
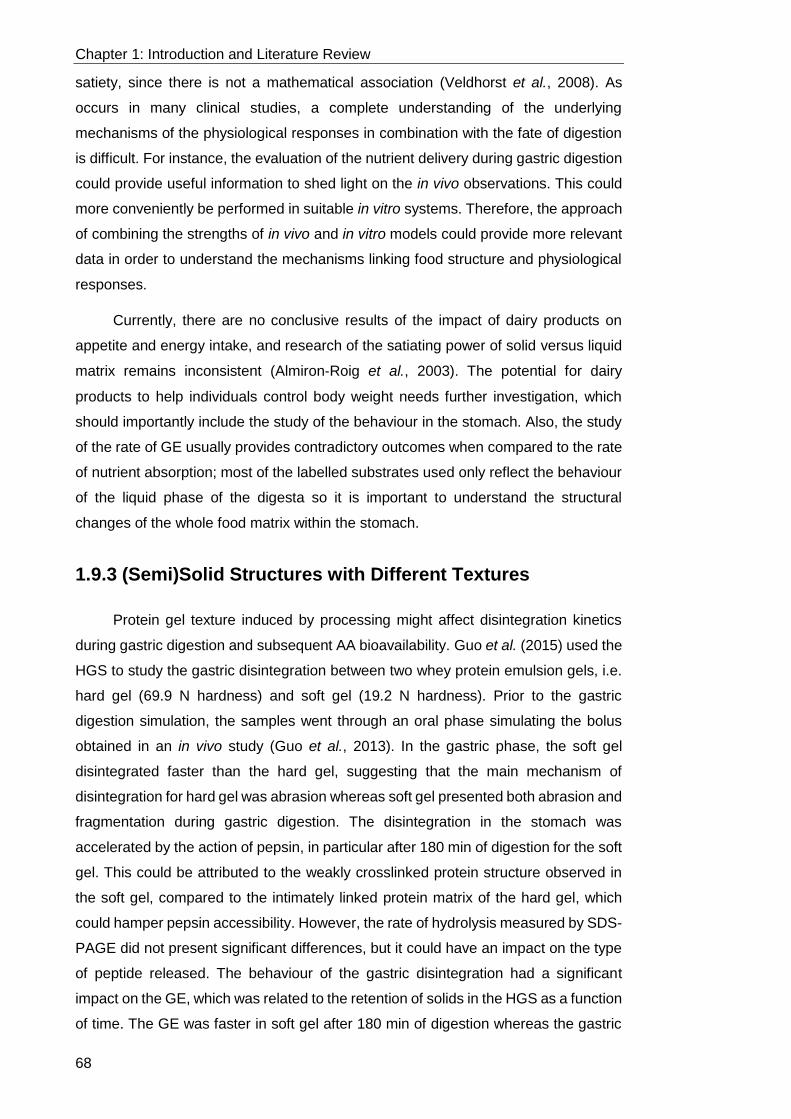
Chapter 1: Introduction and Literature Review
68
satiety, since there is not a mathematical association (Veldhorst et al., 2008). As
occurs in many clinical studies, a complete understanding of the underlying
mechanisms of the physiological responses in combination with the fate of digestion
is difficult. For instance, the evaluation of the nutrient delivery during gastric digestion
could provide useful information to shed light on the in vivo observations. This could
more conveniently be performed in suitable in vitro systems. Therefore, the approach
of combining the strengths of in vivo and in vitro models could provide more relevant
data in order to understand the mechanisms linking food structure and physiological
responses.
Currently, there are no conclusive results of the impact of dairy products on
appetite and energy intake, and research of the satiating power of solid versus liquid
matrix remains inconsistent (Almiron‐Roig et al., 2003). The potential for dairy
products to help individuals control body weight needs further investigation, which
should importantly include the study of the behaviour in the stomach. Also, the study
of the rate of GE usually provides contradictory outcomes when compared to the rate
of nutrient absorption; most of the labelled substrates used only reflect the behaviour
of the liquid phase of the digesta so it is important to understand the structural
changes of the whole food matrix within the stomach.
1.9.3 (Semi)Solid Structures with Different Textures
Protein gel texture induced by processing might affect disintegration kinetics
during gastric digestion and subsequent AA bioavailability. Guo et al. (2015) used the
HGS to study the gastric disintegration between two whey protein emulsion gels, i.e.
hard gel (69.9 N hardness) and soft gel (19.2 N hardness). Prior to the gastric
digestion simulation, the samples went through an oral phase simulating the bolus
obtained in an in vivo study (Guo et al., 2013). In the gastric phase, the soft gel
disintegrated faster than the hard gel, suggesting that the main mechanism of
disintegration for hard gel was abrasion whereas soft gel presented both abrasion and
fragmentation during gastric digestion. The disintegration in the stomach was
accelerated by the action of pepsin, in particular after 180 min of digestion for the soft
gel. This could be attributed to the weakly crosslinked protein structure observed in
the soft gel, compared to the intimately linked protein matrix of the hard gel, which
could hamper pepsin accessibility. However, the rate of hydrolysis measured by SDS-
PAGE did not present significant differences, but it could have an impact on the type
of peptide released. The behaviour of the gastric disintegration had a significant
impact on the GE, which was related to the retention of solids in the HGS as a function
of time. The GE was faster in soft gel after 180 min of digestion whereas the gastric

Chapter 1: Introduction and Literature Review
69
content retention before 120 min in soft gel was higher, which was attributed to a
larger particles size of the original bolus (Guo et al., 2013). This shows the relevant
importance of the oral phase in the process of gastric disintegration. The rate of GE
between the matrices was almost the same at the end of gastric digestion (300 min)
indicating that slower emptying of the soft gel at the beginning of digestion due to
particle size of bolus was compensated by the more rapid disintegration due to easier
hydrolysis by pepsin. Similarly, a recent study using pigs investigated the effect of
viscosity in yogurt on GE by gama scintigraphy and protein digestion using the
dynamic model DIDGI® (Ménard et al., 2018). The low and high viscosity yogurt with
the same nutrient composition but different viscosity (2.2 versus 0.3 Pa·s) were
compared a control yogurt with lower protein and fiber content, and intermediate
viscosity (1.3 Pa·s). The authors showed that the enrichment of protein and fibre
slowed down GE whereas the viscosity seemed not to be a controlling parameter in
emptying since low and high viscosity yogurts presented no significant difference.
However, since the control yogurt differed in both nutrient composition and viscosity,
it is not possible to draw any conclusive outcome. Moreover, the pepsin hydrolysis of
whey proteins was higher in the high viscosity yogurt compared to the low viscosity
sample, which was suggested by the authors to be due to the different behaviour
observed when entering the small intestine.
The mode of gelation applied might affect the protein network structure of the
gel. Barbé et al. (2014a), using mini-pigs, compared the gel structure obtained from
skimmed milk powder using rennet (cheese model) and acidification (yogurt model)
coagulation. The rennet gel led to lower levels of milk protein, in particular casein,
released in the duodenum. The Leu level in plasma was also significantly lower
throughout a 7-hour period after rennet gel ingestion compared to the acid gel. The
authors linked these results with a possible formation of a more compact chyme of
rennet gel in the stomach. They observed, using a dynamic gastric model, that the
acid gel formed with no apparent syneresis in contrast to the extensive syneresis
observed in the rennet gel. The hardness of rennet gel could imply a longer gastric
retention time. However, the measured mean residence time in the stomach based
on chromium-EDTA did not show any difference between the two matrices. Again,
this measurement may not be representative of the difficult analysis of heterogenous
systems. The different bioavailability of AAs could then be attributed to the different
starting pH of the meals; the acidity of the acid gel (pH 4.0) could favour pepsin
hydrolysis compared to the rennet gel (pH 6.6). There was no significant difference in
the postprandial CCK level whereas the level of ghrelin was significant lower in the
rennet gel compared to the acid gel, which might potentially enhance satiation and be

Chapter 1: Introduction and Literature Review
70
linked with a higher gastric distension. This shows the complexity of linking structuring
in the stomach, GE, nutrient absorption and physiological responses.
When lipid is included in the food matrix, the protein matrix is not only important
for protein digestion but might also affect lipid digestion in the intestine. Guo et al.
(2015) studied, in whey protein emulsion gels (hard versus soft), the effect of gastric
disintegration using HGS on lipid bioaccessibility during a simulated intestinal
digestion. The gastric digesta at 60 and 240 min were used for in vitro intestinal
digestion performed for 150 min. The size of the gel particles was reduced after 60
min of gastric digestion in both samples but the initial rate of lipolysis of the soft gel
was significantly higher than the hard gel, even though the solid content of that digesta
was lower. At 240 min, the digesta from the soft gel consisted of individual oil droplets
as well as smaller particles, compared to the hard gel in which most of the oil droplets
remained within the protein network. This study indicated that protein network
modulates the release of oil droplets and can limit the access to the droplet’s surface
by pancreatic lipases.
Examples of dairy products in which oil droplets are dispersed in a solid protein
matrix are yogurt and cheese. The influence of the protein matrix on the release of
lipids might impact absorption and lipaemia, which can have potential effects on risk
markers of cardiovascular diseases. Drouin-Chartier et al. (2017) compared the lipid
absorption from hard and soft cheeses and butter, matched in total calories and
macronutrient content. There were no differences in serum TAG, FFA and apoB-48
in the incremental area under the curve over 8 hours. However, it seemed that the
soft cheese induced greater increase in TAG concentration at 2 hours and attenuated
the low dense lipoprotein of apoB-48 compared to the firm cheese. These results
showed that the physical structure may not necessarily influence the overall
magnitude of postprandial lipemia but more importantly the timing and magnitude of
the TAG peak value. This could be related to the protein network and lipid droplet
arrangement within the cheese matrix. The authors suggested that the homogenised
lipid droplets in soft cheese are enclosed in a loose protein gel, which causes easier
access for both pepsin and gastric lipase in the stomach. Moreover, the lipid droplets
were smaller, giving the food an overall larger surface area, which might facilitate
lipolysis. Interestingly, they did not find any differences between hard cheese and
butter. This could be attributed to a limited availability of the nutrients; hard cheese
could take longer to be disintegrated in the stomach and the formation of layering
could be possible in the case of butter delaying the delivery of lipid. Similar results
were obtained in a study comparing milk, butter and mozzarella-cheese (Clemente et
al., 2003). There was no significant difference in the average of postprandial plasma

Chapter 1: Introduction and Literature Review
71
TAG but in the peak time (315, 277 and 225 min for butter, mozzarella and milk
respectively). This contrasts with the GE rate, using ultrasonographic measurements
of the antrum-pylorus section, in which mozzarella cheese presented a faster
emptying compared to milk and butter. This study showed that GE might not play a
critical role in modulating postprandial lipids in blood, using this specific methodology.
However, it should also be noted that the study was performed with type 2 diabetic
patients, which could modify the outcome when compared with healthy subjects. It is
important to note that lipemia can be affected by other factors such as fatty acid
composition (degree of saturation and length of fatty acid chain) and the properties of
the lipid droplet interface.
There are some studies suggesting that the consumption of fat in cheese form has
different effect on blood lipids by reducing low density lipoprotein cholesterol, when
compared to the same amount of fat consumed in butter form (Hjerpsted et al., 2011;
Tholstrup et al., 2004). Indeed, Feeney et al. (2018) showed that dairy fat in form of
cheese lower the total cholesterol levels compared with that of equal amount of fat,
casein and calcium content in different matrices, suggesting the synergistic effect of
the constients in the cheese matrix. The role of calcium in the fat absorption has been
seen one important factor controlling the metabolic responses observed (Thorning et
al., 2016) but this has to be proven in humans and, in general, more research is
needed to understand the role of the food matrix on gastric digestion and lipaemia,
and metabolic effects, which should be in the context of the lipid/protein organisation
and interaction and their behaviour in the gastric compartment.
In conclusion, this section illustrated that dairy products with different physical
structures can affect the rates of nutrient hydrolysis as well as absorption, which is
mainly driven by the physico-chemical effect of the structure on gastric digestion. It
seems that solid and semi-solid dairy structures have slower digestion than liquid
meals. However, the restructuring of liquid meals in the stomach through, for instance
coagulation and phase separation, should also be considered. Moreover, factors of
the initial food matrix such as hardness, viscosity and pH are also relevant for the
breakdown of the food, and how these properties evolve within the GI tract are crucial
in nutrient digestion. For instance, studying the rheological properties of the chyme
during gastric digestion could provide valuable information about the effect on gastric
digestion time. Protein digestion is usually overlooked when assessing lipid digestion
in complex matrices. However, research has shown that disintegration of a protein
matrix in the stomach is crucial for lipid accessibility and subsequent digestion. This
is important not only for the initial design of structures but also the structures that can
be formed within the gastric compartment. It has been evident from the literature that

Chapter 1: Introduction and Literature Review
72
there is a complex relationship between structuring in the stomach, the content and
rate of nutrients emptied from the stomach and the rate of nutrient absorption. This
could be due to the methodology used for measuring GE and also the characterisation
of the food matrix. It is difficult to assess both absorption of nutrients and
bioaccessibility in relation to gastric behaviour. For that, using both in vivo and
relevant in vitro gastric digestion systems could be an interesting approach to gain
more insight into the mechanisms of nutrient digestion. There is currently no evidence
of how the different physical dairy structures can influence nitrogen metabolism, and
also, more research on satiety responses is needed. Moreover, some research in
cheese (Fang et al., 2016; Lamothe et al., 2012) has shown that lipid digestion rates
can depend on the hardness, cohesiveness and elasticity of the cheese type, which
constitutes an important factor in gastric disintegration. However, these studies
applied an in vitro static model for digestion and there are no clinical studies showing
this influence.
1.10 Research aims
This thesis tackled the hypothesis that dairy structures exhibit different
physiological responses through the impact of gastric behaviour resulting in different
kinetics of nutrient digestion. The work described aimed at gaining fundamental
insights in this new direction of understanding the behaviour of food structures in the
stomach for controlling nutrient digestion. Milk and dairy products are widely
consumed and are associated with several physiological effects, but the mechanistic
understanding of this association is lacking. Dairy matrices cover a wide array of
structural levels from macrostructures to microstructures to the molecular level of the
milk proteins. Research literature has suggested that milk and dairy structures might
have a profound effect on gastric digestion, but better evidence is required. The work
described in this thesis was carried out at the Quadram Institute Bioscience (the
former Institute of Food Research) in Norwich (UK), Teagasc Food Research Center
in Fermoy (Ireland) and the School of Food Sciences and Nutrition at University of
Leeds in Leeds (UK).
The main objectives of this research were as follows.
• To develop an in vitro model that could closely simulate the dynamic
processes of the human stomach, i.e. an intermediate model between
the static and fully dynamic models, which could apply the strengths of
both systems. This work has been described in Chapter 3.

Chapter 1: Introduction and Literature Review
73
• To determine the gastric behaviour of whey proteins and caseins and
different blends, and the possible impact on intestinal digestion and
absorption of nutrients. Then, to understand the key limiting factors
controlling the rate of absorption of milk proteins (e.g. gastric emptying,
luminal hydrolysis, AAs mucosal absorption). Also, to investigate
whether lipid inclusion in milk protein matrices affects gastric
restructuring and the possible influence on intestinal digestion and
absorption of nutrients. This work has been detailed in Chapter 4.
• To evaluate the effect of processing of milk under controlled and
commercial conditions (UHT, pasteurisation and homogenisation) on
the gastric behaviour and nutrient digestion kinetics. This work has been
described in Chapter 5.
• To determine the mechanisms by which pepsin acts during the gastric
digestion of commercial milk samples. This work has been shown in
Chapter 6.
• To validate the in vivo-in vitro correlation approach by identifying the
mechanisms of physiological responses observed in dairy
macrostructures, which could also allow investigation of the efficacy and
usefulness of the developed semi-dynamic model. This work has been
described in Chapter 7.
74
General Materials and Methods

Chapter 2: General Materials and Methods
75
2.1 Materials
The common materials used in most experiments are included in this chapter.
The materials specific to each chapter have been included in the corresponding
chapter.
2.1.1 Chemicals
Pepsin from porcine gastric mucosa (lyophilized powder), pancreatin from
porcine pancreas (8x USP specifications), bovine bile (dried, unfractionated) were
obtained from Sigma-Aldrich Chemical Co. (St. Louis, MO, USA). The enzyme
activities and bile salt concentration were measured according to the assays detailed
in Minekus et al. (2014). Purified Milli-Q® water was used. The electrophoresis
reagents were obtained from Invitrogen™ (Life Technologies Corp., CA, USA). All
other chemicals used in different experiments were of standard analytical grade and
purchased from Sigma-Aldrich Chemical Co., unless otherwise specified and used
without further purification.
2.2 Methods
This section presents the common methods for most of the experiments used
in this thesis. It provides a description of the basic, general principles behind each
method and instrument. Also, the general protocol is described when a method was
applied in more than one chapter. Any modifications of the general protocol are
detailed in the methods section of the corresponding experimental study chapter.
2.2.1 Emulsion Processing
An important part of this project was the use of emulsions as the starting
material. Both naturally occurring such as milk or produced using milk proteins and
lipids. For that, a brief explanation of how they are formed in relation to the instruments
that were used is provided.
An emulsion is defined as a colloidal dispersion of liquid droplets in a liquid
continuous phase. In food systems, oil-in-water (O/W) and water-in-oil (W/O)
emulsions are the two main types of emulsions. In O/W emulsions, oil is dispersed as
finely droplets in the continuous phase of water (Dickinson, 1992) and milk is an
example of this type of system.

Chapter 2: General Materials and Methods
76
In an emulsion, an interfacial layer between the different phases is formed in
which surface-active compounds can be arranged in order to prevent the emulsion
instability. An unstable emulsion can lead to changes in the structure or size
distribution of droplets. Common processes of instability in emulsions are: creaming,
sedimentation, flocculation, coalescence and phase separation (see Figure 2.1).
Biochemical factors such as pH, salt concentration and enzyme hydrolysis can induce
those changes. Therefore, the instability processes might occur in the gastrointestinal
tract (McClements et al., 2010).
Figure 2.1 Schematic representation of the main mechanisms of instability of an oil-in-water (O/W) emulsion, i.e. creaming sedimentation, flocculation, coalescence and phase separation. (Yellow and blue represent lipid and water phases, respectively).
The most commonly used emulsifiers in food systems are proteins,
polysaccharides and small molecule surfactants (Dickinson, 2013). An emulsifier is
an amphiphilic molecule and is effective firstly when it adsorbs to the surface of the
droplet and reduces the interfacial tension of the emulsion droplet interface. Secondly,
it forms a protective layer surrounding the droplets providing stability against
coalescence and flocculation via electrostatic and steric stabilization mechanisms
(Dickinson, 1992).
An emulsion cannot be formed spontaneously (except for microemulsions which
are a special case) therefore mechanical energy approaches are normally needed in
order to break up the lipid phase obtaining a homogenous dispersion of oil droplets
with diameters usually ranging between 0.1 and 100 µm. The three main approaches
to create emulsions are: pressure (e.g. high-pressure valve homogeniser),
mechanical (e.g. high-shear mixer) and ultrasonic homogenisation. Food emulsions
are usually prepared using a range of methods (Walstra et al., 1997), which depends
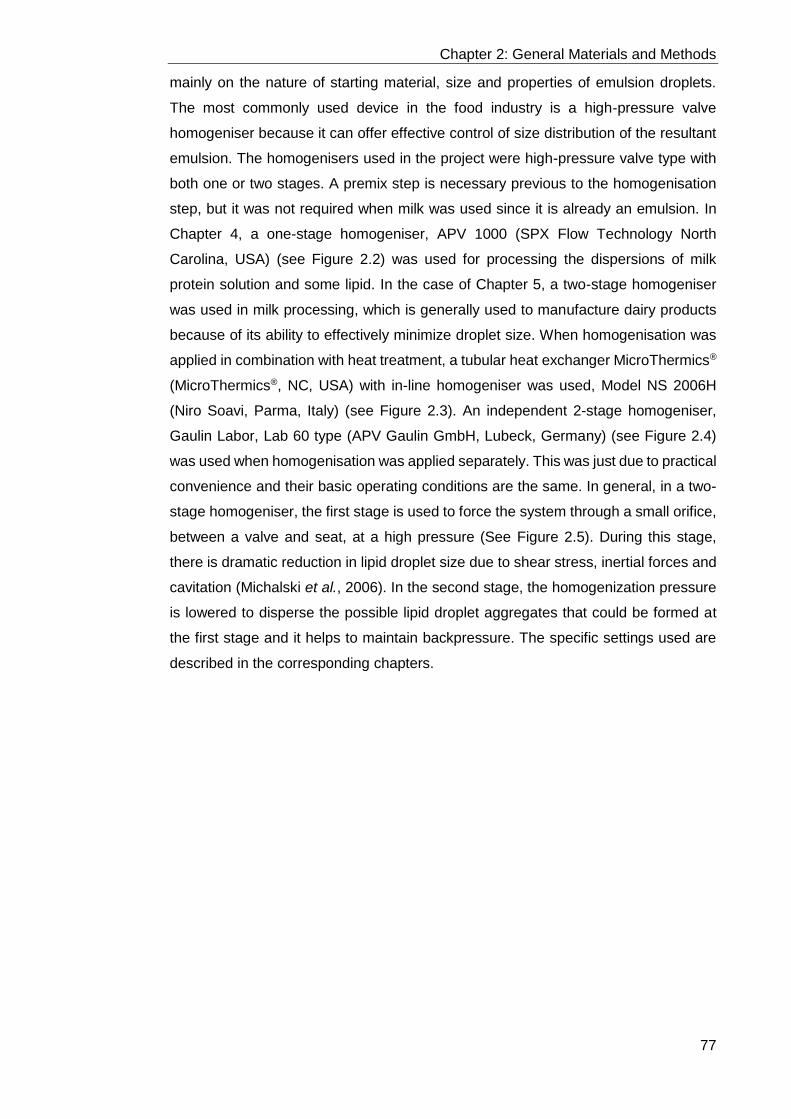
Chapter 2: General Materials and Methods
77
mainly on the nature of starting material, size and properties of emulsion droplets.
The most commonly used device in the food industry is a high-pressure valve
homogeniser because it can offer effective control of size distribution of the resultant
emulsion. The homogenisers used in the project were high-pressure valve type with
both one or two stages. A premix step is necessary previous to the homogenisation
step, but it was not required when milk was used since it is already an emulsion. In
Chapter 4, a one-stage homogeniser, APV 1000 (SPX Flow Technology North
Carolina, USA) (see Figure 2.2) was used for processing the dispersions of milk
protein solution and some lipid. In the case of Chapter 5, a two-stage homogeniser
was used in milk processing, which is generally used to manufacture dairy products
because of its ability to effectively minimize droplet size. When homogenisation was
applied in combination with heat treatment, a tubular heat exchanger MicroThermics®
(MicroThermics®, NC, USA) with in-line homogeniser was used, Model NS 2006H
(Niro Soavi, Parma, Italy) (see Figure 2.3). An independent 2-stage homogeniser,
Gaulin Labor, Lab 60 type (APV Gaulin GmbH, Lubeck, Germany) (see Figure 2.4)
was used when homogenisation was applied separately. This was just due to practical
convenience and their basic operating conditions are the same. In general, in a two-
stage homogeniser, the first stage is used to force the system through a small orifice,
between a valve and seat, at a high pressure (See Figure 2.5). During this stage,
there is dramatic reduction in lipid droplet size due to shear stress, inertial forces and
cavitation (Michalski et al., 2006). In the second stage, the homogenization pressure
is lowered to disperse the possible lipid droplet aggregates that could be formed at
the first stage and it helps to maintain backpressure. The specific settings used are
described in the corresponding chapters.
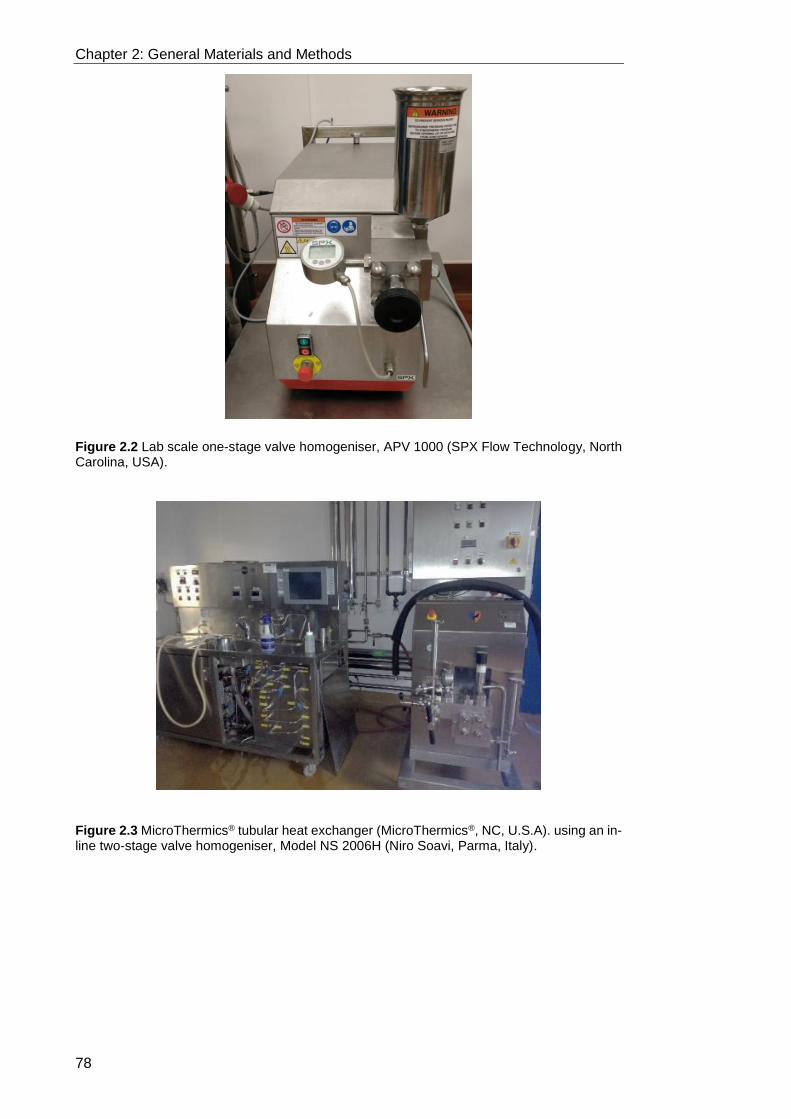
Chapter 2: General Materials and Methods
78
Figure 2.2 Lab scale one-stage valve homogeniser, APV 1000 (SPX Flow Technology, North Carolina, USA).
Figure 2.3 MicroThermics® tubular heat exchanger (MicroThermics®, NC, U.S.A). using an in-line two-stage valve homogeniser, Model NS 2006H (Niro Soavi, Parma, Italy).

Chapter 2: General Materials and Methods
79
Figure 2.4 Two-stage homogeniser, Gaulin Labor, Lab 60 type (APV Gaulin GmbH, Lubeck, Germany).
Figure 2.5 Schematic representation of the homogenisation mechanism by high-pressure valve approach.
2.2.2 In Vitro Digestion and ex Vivo Nutrient Transport
In vitro digestion experiments are very useful to investigate the effect of food
structure and composition on digestion. The following methods describe the different
in vitro systems used for the simulation of gastrointestinal (GI) digestion.

Chapter 2: General Materials and Methods
80
2.2.2.1 In Vitro Gastric Digestion
The gastric phase was simulated using a semi-dynamic gastric model, which
was developed during this project. Details about the model are described in a
separate chapter (Chapter 3). The general protocol was as follows.
The oral phase was simulated before the gastric digestion. 20 g of sample was
mixed with a volume of the oral mixture containing 79.9% SSF (1.25x) prepared
according to Minekus et al. (2014),19.6% MilliQ® water and 0.5% CaCl2(H2O)2 (0.3
mol/L). The volume of this oral mixture corresponded to the total solids content of the
sample (previously measured using CEM Smart Trac System-5 (CEM Corp.,
Matthews, N.C., U.S.A.). The mixing was performed using a rotator (SB3 Model,
Stuart, Bibby Scientific, UK) at 30 rpm for 2 min. The temperature was kept at 37°C
using an incubator (BF56, Binder GmbH, Germany).
The resulting mixture was then put through the gastric digestion using a reaction
vessel for the simulation of the stomach, which was a v-form glass vessel (5-70 mL
titration vessel, Metrohm, Switzerland) with thermostat jacket (37°C). The sample
from the oral phase was placed in the reaction vessel after the addition of the basal
volume, which consisted of the 10% of the constituents of SGF (1.25x), MilliQ® water,
HCl (1.5 mol/L) and CaCl2(H2O)2 (0.3 mol/L) from the total volume of the gastric
mixture. The total gastric mixture contained 80% SGF (1.25x), 7.78% MilliQ® water,
8.7% HCl (1.5 mol/L) and 3.48% pepsin and 0.04% CaCl2(H2O)2 (0.3 mol/L). Two
solutions were added at a constant rate, which depended on the corresponding gastric
time: (1) the simulated gastric electrolyte mixture containing the 90% of the
constituents of SGF (1.25x), MilliQ® water, HCl (1.5 mol/L) and CaCl2(H2O)2 (0.3
mol/L) from the total volume of the gastric mixture and (2) 0.8 mL pepsin solution
(made with MilliQ® water). The simulated gastric electrolyte mixture of SGF (1.25x),
HCl, water and CaCl2(H2O)2 was delivered by a dosing device of an automatic titrator
(brand specified in each chapter) and the enzyme solution was delivered by a syringe
pump (brand specified in each chapter). A 3D action shaker (Mini-gyro rocker, SSM3
Model, Stuart, Barloworld Scientific limited, UK) set at 35 rpm was used for agitating
the vessel.
Gastric emptying (GE) was simulated by taking five aliquots, as the general
protocol, referred to as GE1-5 in the text. Aliquots were taken from the bottom of the
vessel using a laboratory tool (specified in each chapter) that had an inner diameter
of approximately 2 mm. The pH was measured and a sufficient volume of NaOH (2
mol/L) was added to the samples to increase the pH above 7, inhibiting pepsin activity.

Chapter 2: General Materials and Methods
81
Finally, samples were snap-frozen in liquid nitrogen and stored at -20°C for further
analyses.
The simulation of the emptying was based on caloric density, as the general
protocol. A linear GE rate of 2 kcal/min, which is considered the average caloric
content that is emptied in vivo in a regulated manner by the antrum for an average
food volume of 500 mL (Hunt et al., 1985) was used and scaled down for this reduced-
volume system (20 mL of sample).
2.2.2.2 In Vitro Small Intestinal Digestion
Small intestinal digestion was performed following the standardised static
INFOGEST protocol (Minekus et al., 2014), including the preparation of simulated
intestinal fluid (SIF) and proportions added of the rest of the intestinal phase
components. However, the current procedure was performed individually in each GE
aliquot from the gastric digestion in order to assess the kinetics of nutrient digestion
in the small intestine. This methodology will be illustrated and explained further in
Chapter 3 and the corresponding experimental chapters. The general protocol was
as follows.
The simulation of the intestinal phase was performed using the individual GE
aliquots. The protocol was performed according to the standardised procedure of
Minekus et al. (2014). The amounts of pancreatin solution, bile salt and CaCl2 (H2O)2
were adjusted in each case depending on the gastric aliquot volume in order to get a
final activity/concentration of 100 U/mL (based on trypsin), 10 mmol/L and 0.6 mmol/L,
respectively. Samples were placed in a rotator (SB3 Model, Stuart, Bibby Scientific,
UK) at 40 rpm within an incubator (BF56, Binder GmbH, Germany) to keep the
temperature at 37°C. Aliquots (volume and time specified in each chapter) were taken,
mixed with inhibitor (0.1 mol/L phenylmethylsulfonyl fluoride), snap-frozen using liquid
nitrogen and stored at -20°C for further analyses.
2.2.2.3 Ex Vivo Absorption
The Ussing chamber methodology was applied to study absorption of amino
acids by ex vivo murine small intestinal tissue. The principles of the technique have
been described in this section since it is not widely used. The detailed protocol has
been described in Chapter 4.
The Ussing chamber was developed by Hans Ussing in 1951 to investigate the
ion transport across frog skin. Its application has increased to include measuring the
transport of electrolytes for instance. However, it has not often been used to study a

Chapter 2: General Materials and Methods
82
food-related system on health. In Chapter 4, the Ussing chamber methodology was
used to assess the absorption of amino acids across murine small intestinal tissue
after gastric digestion and in situ intestinal digestion (See Figure 2.6). However, this
technique could be also used to study the transport of other nutrients such as glucose,
fatty acids and vitamins across a range of animal species intestinal tissues, including
rat, pig and human (Geraedts et al., 2012; Neirinckx et al., 2010). It can be also used
to study other functionalities of epithelia tissue, e.g. protective and secretory.
Figure 2.6 Schematic representation of the use of Ussing Chamber technique to study protein absorption after gastric and intestinal digestion. A tissue section of intestinal epithelium containing epithelium cells separates the apical and basolateral sides of the Ussing chamber. (Ussing chamber diagram from Verhoeckx et al. (2015)).
The ex vivo methodology of the Ussing chamber provides a better
representation of the in vivo situation, when compared to the most used epithelial
Caco-2-cells, since the use of intestinal tissue segments offers the morphological and
physiological features of the intestinal wall, including the multicellular conglomeration
and presence of the mucus layer. This allows the direct measurement of nutrient
uptake. Moreover, it is a simpler and, less expensive and restrictive than the in vivo
approach. However, some of the weaknesses are, the relatively low throughput to get
an interpretation of the complex physiological system and dependence on the optimal
function of the intestine section preparation. Also, the viability and integrity of the
tissue is limited, and it is more difficult than other in vitro systems to compare results
due to inter-individual variability among animals (Neirinckx et al., 2010). Tissue from
animals is usually used since the availability of healthy human tissue is very limited,
so data is extrapolated.
The basic design of an Ussing chamber (Figure 2.7) consists mainly of a U-
shaped chamber, perfusion system and electrical circuitry. The chamber consists of
two halves, between which the tissue is placed in a removable slider with pins. This
separates the two halves of the chambers; the mucosal membrane, also named apical
side, is orientated to one chamber half, whereas the serosal membrane, also named
basolateral side, is facing the other half-chamber. The size of the chamber/slider

Chapter 2: General Materials and Methods
83
depends on the origin of the tissue being used. The electrical circuitry consists of four
electrodes (two Ag-AgCl electrodes for voltage and two Ag electrodes for current) in
each chamber connected by means of an agar-bridge. There is a continuous flow of
gas (95% O2/ 5% CO2 mixture) that causes bubbles. This allows the circulation and
oxygenation of buffer/sample throughout the system. The system is held at 37°C by
means of water jacket heating. Further description of the methodology can be found
in Hug (2001).
Figure 2.7 (A) The setup of the Ussing chamber and (B) the electrical system. (C) A slider used for mounting a section of murine intestine and (D) an example of the murine digestive tract used for dissecting a section.
The principle underlying the use of Ussing chamber stems from the polarity and
tightness of epithelia allowing the active transport of the nutrients. The asymmetric
distribution of proteins across both apical and basolateral membranes generates this
polarity. The disposition and permeability of tight junctions, which hold the cells
together, determine the resistance known as transepithelial resistance and integrity
of the tissue. The transepithelial resistance is monitored during the experiment, which
can be calculated by knowing the voltage and the transepithelial current from the
voltage clamp. The resistance is normalised per unit area.
2.2.3 Physical Properties Analysis
The analysis of some physical properties of the dairy systems were determined
to provide better understanding of the digestion behaviour. Particle size analysis,
Chapter 2: General Materials and Methods
84
rheology and microscopy imaging were applied, and their general principles and
methodologies have been described in this section.
2.2.3.1 Particle Size Analysis
Emulsion droplet diameter was determined by laser light diffraction (or static
light scattering) using a Mastersizer instrument (Malvern Instruments Ltd.,
Worcestershire, UK), see Figure 2.8. It reports size as equivalent spheres, which is a
universal concept across laser diffraction instruments. Laser diffraction measures
particle size distribution by measuring the angular variation in the intensity of light
scattered as a laser beam passes through a dispersed particulate sample. Smaller
particles scatter light at wider angles and the intensity of the light is lower, compared
to larger particles. Then, the angular scattering pattern is dependent on the particle
size distribution of the sample. Laser diffraction requires a model that accurately
defines the light scattering pattern of all particles. Mie theory has been found to be
more accurate over a wider range of sizes, this theory calculates the particle size
distribution, assuming a volume-equivalent sphere model. It is valid for all
wavelengths and size of particles. The application of Mie’s theory requires the
knowledge of three optical properties, i.e. the refractive index of both dispersant and
the sample material and the absorption of the sample material. These properties were
found in the database of the instrument. As part of the size distribution data, there are
size distribution statistics that can be automatically obtained through the instrument
software, i.e. mean, median and mode. The mean is an average particle diameter and
depends on the parameter that is weighted. The two most important weighed mean
values are d3,2 and d4,3 mean diameter. d3,2 is the surface area weighted mean,
referred to the diameter of a sphere having the same surface area as the particle. d4,3
is the volume weighted mean referred to the average diameter of spheres with
equivalent volume. Therefore the latter is sensitive to the presence of large particles
and d3,2 is sensitive to the presence of small particles.

Chapter 2: General Materials and Methods
85
Figure 2.8 Mastersizer 3000 equipped with a 300 RF lens with a wet dispersion unit (Hydro MV), supplied by Malvern Instruments Ltd, Worcestershire, UK.
The general protocol used was as follows.
The particle size distribution and average lipid droplet diameter of initial and
digested samples were determined using a laser-light diffraction unit (Mastersizer
3000, Malvern Instruments Ltd, Worcestershire, UK) equipped with a 300 RF lens and
a wet dispersion unit (Hydro MV). A volume of initial and digested samples was added
in the instrument to reach ~10% laser obscuration. The size distribution was obtained
using polydisperse analysis, while droplet size measurements were recorded as
surface area weighted (d3,2) and volume weighted (d4,3) means, where d3,2 is defined
as ∑nidi3/ nidi
2 and d4,3 is defined as ∑nidi4/ nidi
3, where ni is the number of particles
with diameter di. Each measurement was carried out in triplicate.
2.2.3.2 Rheological Properties Analysis
Rheology is the study of flow and deformation (viscosity) of materials. Viscosity
refers to the resistance of a fluid to flow and is the force per unit area applied to the
material, directly proportional to stress. When a force is applied to a material, it will
react and undergo either deformation (strain) or flow (strain rate). Properties of a
material such as particle size and interaction between the different constituents in the
matrix will influence the flow/deformation behaviour. A rheometer is a precision
instrument that contains the material of interest in a geometric configuration, controls
the environment around it, and applies and measures wide ranges of stress and
measures the resultant strain and strain rate.
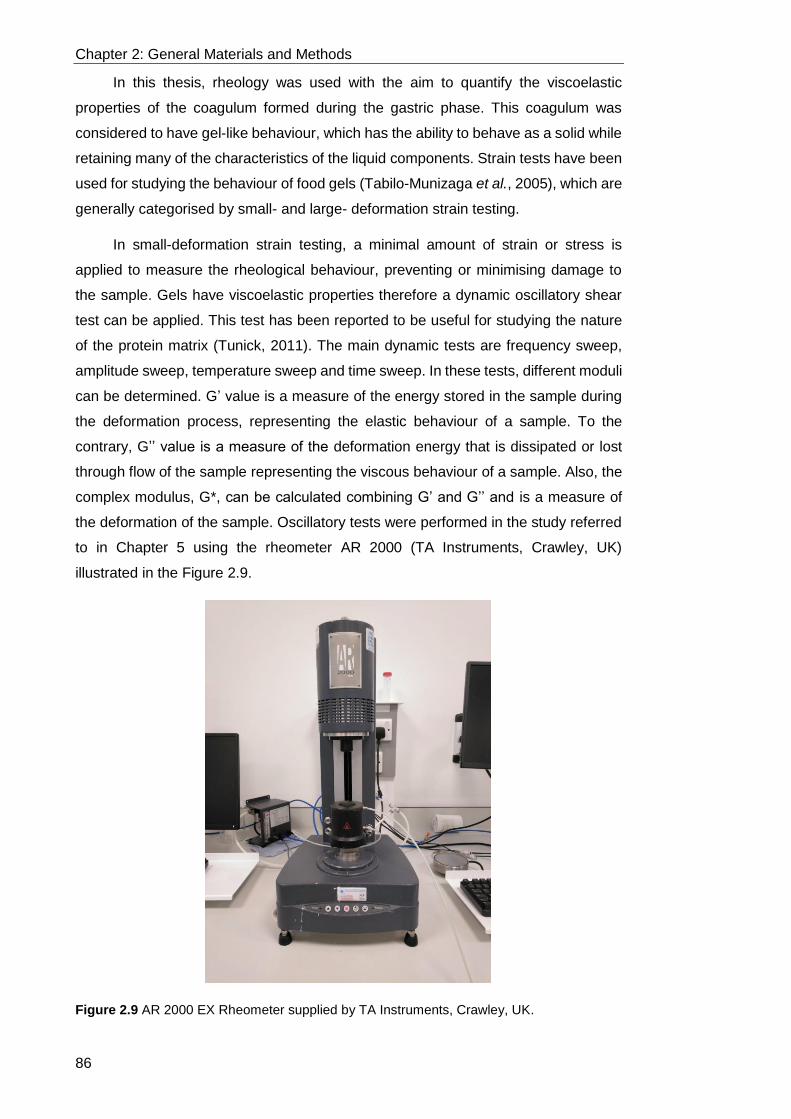
Chapter 2: General Materials and Methods
86
In this thesis, rheology was used with the aim to quantify the viscoelastic
properties of the coagulum formed during the gastric phase. This coagulum was
considered to have gel-like behaviour, which has the ability to behave as a solid while
retaining many of the characteristics of the liquid components. Strain tests have been
used for studying the behaviour of food gels (Tabilo-Munizaga et al., 2005), which are
generally categorised by small- and large- deformation strain testing.
In small-deformation strain testing, a minimal amount of strain or stress is
applied to measure the rheological behaviour, preventing or minimising damage to
the sample. Gels have viscoelastic properties therefore a dynamic oscillatory shear
test can be applied. This test has been reported to be useful for studying the nature
of the protein matrix (Tunick, 2011). The main dynamic tests are frequency sweep,
amplitude sweep, temperature sweep and time sweep. In these tests, different moduli
can be determined. G’ value is a measure of the energy stored in the sample during
the deformation process, representing the elastic behaviour of a sample. To the
contrary, G’’ value is a measure of the deformation energy that is dissipated or lost
through flow of the sample representing the viscous behaviour of a sample. Also, the
complex modulus, G*, can be calculated combining G’ and G’’ and is a measure of
the deformation of the sample. Oscillatory tests were performed in the study referred
to in Chapter 5 using the rheometer AR 2000 (TA Instruments, Crawley, UK)
illustrated in the Figure 2.9.
Figure 2.9 AR 2000 EX Rheometer supplied by TA Instruments, Crawley, UK.
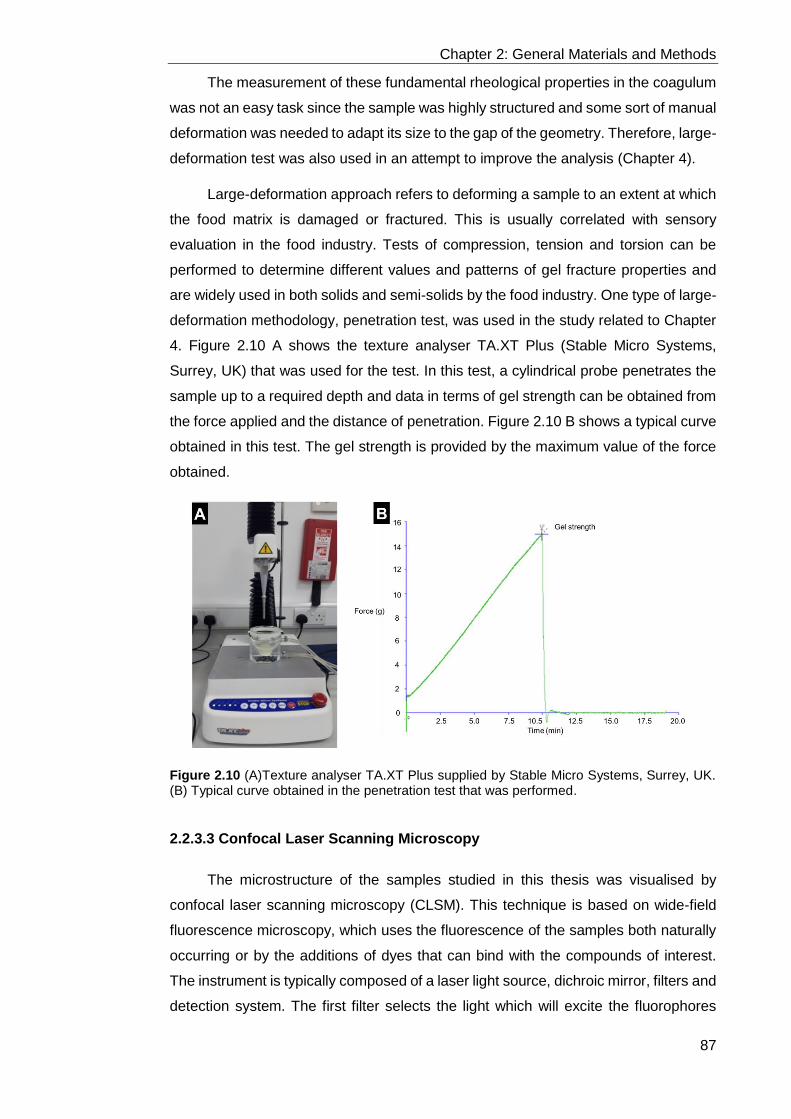
Chapter 2: General Materials and Methods
87
The measurement of these fundamental rheological properties in the coagulum
was not an easy task since the sample was highly structured and some sort of manual
deformation was needed to adapt its size to the gap of the geometry. Therefore, large-
deformation test was also used in an attempt to improve the analysis (Chapter 4).
Large-deformation approach refers to deforming a sample to an extent at which
the food matrix is damaged or fractured. This is usually correlated with sensory
evaluation in the food industry. Tests of compression, tension and torsion can be
performed to determine different values and patterns of gel fracture properties and
are widely used in both solids and semi-solids by the food industry. One type of large-
deformation methodology, penetration test, was used in the study related to Chapter
4. Figure 2.10 A shows the texture analyser TA.XT Plus (Stable Micro Systems,
Surrey, UK) that was used for the test. In this test, a cylindrical probe penetrates the
sample up to a required depth and data in terms of gel strength can be obtained from
the force applied and the distance of penetration. Figure 2.10 B shows a typical curve
obtained in this test. The gel strength is provided by the maximum value of the force
obtained.
Figure 2.10 (A)Texture analyser TA.XT Plus supplied by Stable Micro Systems, Surrey, UK. (B) Typical curve obtained in the penetration test that was performed.
2.2.3.3 Confocal Laser Scanning Microscopy
The microstructure of the samples studied in this thesis was visualised by
confocal laser scanning microscopy (CLSM). This technique is based on wide-field
fluorescence microscopy, which uses the fluorescence of the samples both naturally
occurring or by the additions of dyes that can bind with the compounds of interest.
The instrument is typically composed of a laser light source, dichroic mirror, filters and
detection system. The first filter selects the light which will excite the fluorophores
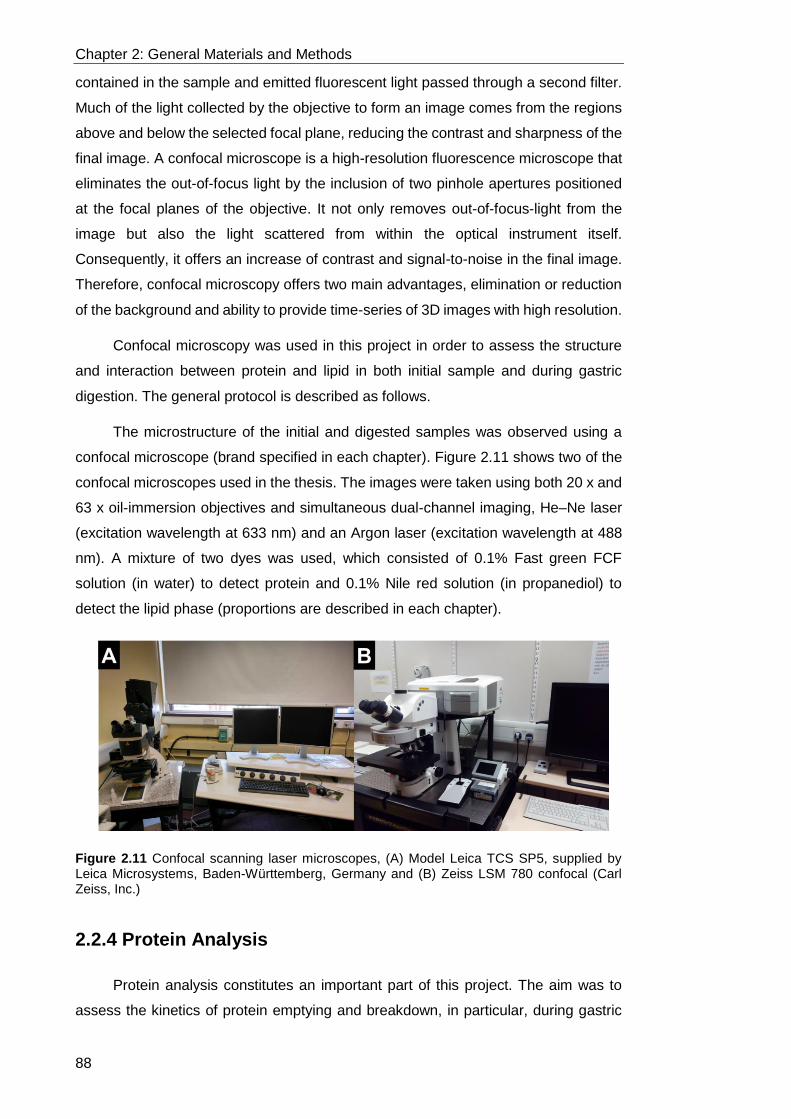
Chapter 2: General Materials and Methods
88
contained in the sample and emitted fluorescent light passed through a second filter.
Much of the light collected by the objective to form an image comes from the regions
above and below the selected focal plane, reducing the contrast and sharpness of the
final image. A confocal microscope is a high-resolution fluorescence microscope that
eliminates the out-of-focus light by the inclusion of two pinhole apertures positioned
at the focal planes of the objective. It not only removes out-of-focus-light from the
image but also the light scattered from within the optical instrument itself.
Consequently, it offers an increase of contrast and signal-to-noise in the final image.
Therefore, confocal microscopy offers two main advantages, elimination or reduction
of the background and ability to provide time-series of 3D images with high resolution.
Confocal microscopy was used in this project in order to assess the structure
and interaction between protein and lipid in both initial sample and during gastric
digestion. The general protocol is described as follows.
The microstructure of the initial and digested samples was observed using a
confocal microscope (brand specified in each chapter). Figure 2.11 shows two of the
confocal microscopes used in the thesis. The images were taken using both 20 x and
63 x oil-immersion objectives and simultaneous dual-channel imaging, He–Ne laser
(excitation wavelength at 633 nm) and an Argon laser (excitation wavelength at 488
nm). A mixture of two dyes was used, which consisted of 0.1% Fast green FCF
solution (in water) to detect protein and 0.1% Nile red solution (in propanediol) to
detect the lipid phase (proportions are described in each chapter).
Figure 2.11 Confocal scanning laser microscopes, (A) Model Leica TCS SP5, supplied by Leica Microsystems, Baden-Württemberg, Germany and (B) Zeiss LSM 780 confocal (Carl Zeiss, Inc.)
2.2.4 Protein Analysis
Protein analysis constitutes an important part of this project. The aim was to
assess the kinetics of protein emptying and breakdown, in particular, during gastric

Chapter 2: General Materials and Methods
89
digestion. The following methods describe the techniques used in this project to
assess the composition and concentration of proteins.
2.2.4.1 Total Nitrogen Analyser
A total nitrogen analyser, LECO FP628 (LECO Corp., St. Joseph, MI, USA), see
Figure 2.12, was used to determine the total protein content in initial and digested
samples. This is based on the combustion Dumas method, an international
standardised method for the determination of the total nitrogen content. The sample
is combusted at high temperature (950-1,050°C) in a pure oxygen atmosphere and
the combustion products (including N2 and NOx) are then collected in a vessel
(ballast) for equilibration. The homogenised gases are swept by a helium carrier gas
and, CO2 and H2O are removed by sorbents (Lecosorb / Anhydrone). The NOx gases
are passed through a copper tube that reduces the NOx to N2 and removes excess
oxygen. Then, N2 is measured with a thermal conductivity detector and its content is
calculated by taking into account the mass of the sample injected. The total nitrogen
value is converted into total protein by using a nitrogen conversion factor suitable for
the protein nature, which is determined according to the amount of nitrogen in the
protein amino acid sequence. The nitrogen conversion factor established for milk
proteins is 6.38 (FAO, 2003).
Figure 2.12 LECO FP628 Nitrogen analyser supplied by LECO Corp., St. Joseph, MI, USA.
The Dumas method offers several advantages over the other international
standard method for total nitrogen analysis, Kjeldahl method, since it provides shorter
analysis times, easier operation and improved safety. Both methods have similar
precision and no differences were found when they were applied in dairy products
(Wiles et al., 1998).

Chapter 2: General Materials and Methods
90
The general procedure followed for the analysis of total protein content is
described as follows.
The protein content of the initial sample and emptied digesta was determined
using a LECO FP628 Protein analyser (LECO Corp., St. Joseph, MI, USA). Prior to
the analysis, blank and drift corrections were performed. At least five blanks were
analysed, until three consecutive blanks had a stable value with a standard deviation
of less than 0.002% and the last three consecutive values were used for the blank
correction. EDTA is typically used as a reference standard to interpret the detector
response as % nitrogen (the theoretical N concentration for EDTA is 9.586%). At least
four EDTA standards were run until three consecutive values have a relative standard
deviation of 0.2% or less and the last three consecutive values were used to calculate
the drift factor correction. For the test samples, about 0.2 g of sample was weighed in
tin foil cups (LECO Corp.), sealed and placed in the instrument's loader. A conversion
factor of 6.38 was used to obtain the protein content from the nitrogen content.
2.2.4.2 Sodium Dodecyl Sulphate-Polyacrylamide Gel Electrophoresis
Sodium dodecyl sulphate-polyacrylamide gel electrophoresis (SDS-PAGE) was
performed to determine the intact and hydrolysed protein and the nature of the protein,
in this case caseins and whey proteins.
SDS-PAGE is a widely used method for separating proteins according to their
molecular weight. Figure 2.13 illustrates the principles of this technique. A reducing
agent such as dithiothreitol or mercaptoethanol is added to break the protein
disulphide bonds. SDS is an anionic detergent that unfolds and charges proteins
negatively by binding to the protein molecules proportionally to the length of the
protein, achieving the same charge to mass ratio. Then, the mobility of the protein
through the polycrylamide gel, which differs in pore size according to the state of
crosslinking, depends on the molecular weight of the protein. An electric field is
applied to move the charged molecules, the ones with small molecular weight migrate
more rapidly through the gel than larger molecules. This methodology is helpful for
relatively large peptides, but the resolution of SDS gel is usually low for small peptides
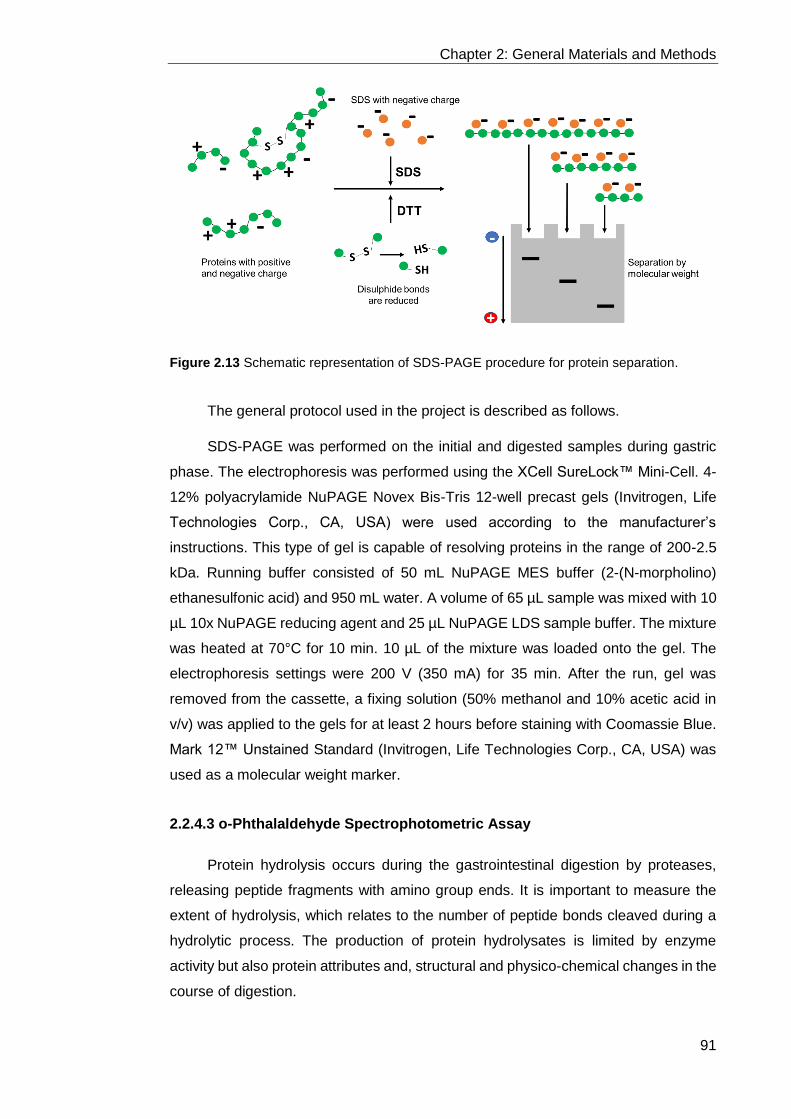
Chapter 2: General Materials and Methods
91
Figure 2.13 Schematic representation of SDS-PAGE procedure for protein separation.
The general protocol used in the project is described as follows.
SDS-PAGE was performed on the initial and digested samples during gastric
phase. The electrophoresis was performed using the XCell SureLock™ Mini-Cell. 4-
12% polyacrylamide NuPAGE Novex Bis-Tris 12-well precast gels (Invitrogen, Life
Technologies Corp., CA, USA) were used according to the manufacturer’s
instructions. This type of gel is capable of resolving proteins in the range of 200-2.5
kDa. Running buffer consisted of 50 mL NuPAGE MES buffer (2-(N-morpholino)
ethanesulfonic acid) and 950 mL water. A volume of 65 µL sample was mixed with 10
µL 10x NuPAGE reducing agent and 25 µL NuPAGE LDS sample buffer. The mixture
was heated at 70°C for 10 min. 10 µL of the mixture was loaded onto the gel. The
electrophoresis settings were 200 V (350 mA) for 35 min. After the run, gel was
removed from the cassette, a fixing solution (50% methanol and 10% acetic acid in
v/v) was applied to the gels for at least 2 hours before staining with Coomassie Blue.
Mark 12™ Unstained Standard (Invitrogen, Life Technologies Corp., CA, USA) was
used as a molecular weight marker.
2.2.4.3 o-Phthalaldehyde Spectrophotometric Assay
Protein hydrolysis occurs during the gastrointestinal digestion by proteases,
releasing peptide fragments with amino group ends. It is important to measure the
extent of hydrolysis, which relates to the number of peptide bonds cleaved during a
hydrolytic process. The production of protein hydrolysates is limited by enzyme
activity but also protein attributes and, structural and physico-chemical changes in the
course of digestion.

Chapter 2: General Materials and Methods
92
There is no absolute protein assay for assessing protein hydrolysis, each
method has different advantages and limitations. The most well-known methods for
the determination of degree of hydrolysis in food proteins are pH-stat technique, the
trinitro-benzene-sulfonic acid (TNBS) method and o-phthalaldehyde (OPA) method.
OPA method was selected on the basis of its sensitivity, convenience and
environmental safety, compared to other spectrophotometry assays (Nielsen et al.,
2001). The OPA assay has been reported to be useful for the evaluation of the
progress of hydrolysis during digestion of milk proteins (Church et al., 1983).
The OPA assay is based on the reaction between primary amino groups and
OPA chemical in presence of SH-compound such as dithiothreitol or β-
mercaptoethanol. This forms a compound that absorbs at 340 nm (Figure 2.14), which
is evaluated by spectrophotometry and the absorbance is proportional to the
concentration of free amino groups. This assay is based on the assumption that a free
amino group and a free carboxyl group are released every time a peptide bond is
hydrolysed.
Figure 2.14 Representation of OPA reaction in a molecular level.
Standard solutions were used for quantitation. A calibration curve was created
by plotting the absorbance at 340 nm of each standard concentration versus the
known concentration of the standards. Leu was selected as the standard since the
absorption of OPA after reacting with Leu was found very close to the average
response of other amino acids (Nielsen et al., 2001).
The application of this assay requires a clear sample without interference from
insoluble material or particles causing light scattering. The samples analysed by OPA
assay were therefore pre-treated as follows.
Addition of trichloroacetic acid (TCA) at 3.12% final concentration to sample,
causes the precipitation of insoluble protein that could interfere in the further analysis.
Then, the samples were centrifuge at 10,000 g for 30 min at room temperature and
the supernatant was filtered using a syringe filter of PVDF 0.45 µm membrane (Millex-
GV, Millipore). The use of TCA in protein hydrolysed samples prior to quantitative

Chapter 2: General Materials and Methods
93
analysis has been widely used (Flanagan et al., 2003). Therefore, the extent of
proteolysis was determined from the TCA-soluble protein fraction, which consists of
small peptides and amino acid residues (Rowland, 1938).
The levels of free R-NH2 groups were determined using the OPA
spectrophotometric assay in micro-titre plates based on the protocol described in
Nielsen et al. (2001) with some modifications. OPA reagent consisted of 3.81 g
sodium tetraborate decahydrate dissolved in approximately 80 mL water. Once
dissolved, 0.088 g dithiothreitol and 0.1 g SDS were added. Then, 0.080 g OPA
dissolved in 2-4 mL ethanol was placed in the solution that was finally made up to 100
mL with Milli-Q® water.
Different concentrations of standard Leu solution (made with phosphate buffer
solution) ranged from 0 to 10 mmol/L were used to obtain a calibration curve. 10 µL
of standard/sample was placed into each well and mixed with 200 µL of OPA reagent.
The reaction was allowed to proceed for 15 min, then the absorbance was measured
at 340 nm using a microplate reader (brand specified in each chapter).
2.2.4.4 Amino Acid Analysis
Amino acids (AAs) are the basic monomeric units of the protein molecule, which
are readily available to diffuse across the intestinal wall. Once absorbed, they are
involved in a range of physiological functions. Therefore, AAs analysis is important to
understand the implications of the food matrix on protein disintegration and the
potential effects on health. The analysis of AAs was performed using ion-exchange
chromatography and reversed phase chromatography coupled to tandem mass
spectrometry, independently. These techniques were applied in the study related to
Chapter 4. In this section the fundamentals of these techniques are explained, and
the details of the protocols have been described in the corresponding chapter.
There is no official standardised method for analysis of AAs in foods. However,
the most commonly used methods for separating and quantifying free AAs include the
liquid chromatography technique of ion exchange chromatography (EC), reversed
phase liquid chromatography (RPLC), gas chromatography (GC) and capillary
electrophoresis, coupled to UV absorbance or fluorescence. These techniques are
included in the group of column chromatography. In this, analytes in a mobile phase
are separated because their different affinities for the stationary phase of the column.
The interactions of the analytes with the stationary phase determine the migration
time, which are based on properties such as charge and size. After being separated

Chapter 2: General Materials and Methods
94
by the column, the concentration of each of the analytes is determined by a suitable
detector.
AAs are highly polar compounds and, therefore, their chemical derivatization
may be required for chromatographic separation to improve separation and detection,
which can be applied by a pre- or post-column step. In the derivatization process, a
reagent is used to react with the amino group. The most common derivatization
reagents are ninhydrin, o-phthalaldehyde, 6-aminoquinoyl-N-hydroxysuccinimidyl
carbamate, 2,5-dioxopyrrolidin-1-yl-2(4-methylpiperazin-1-yl) acetate and N-metyl-N-
trimethylsilyltrifluoroacetamide (Gilani et al., 2008). Derivation of AAs in GC is also
required, improving the volatility and thermal stability of analytes. The most employed
procedure is silylation. GC analysis provides good resolving power, the limit of
detection reported was 0.03-12 µmol/L (Kaspar et al., 2008). However, this
derivatization is sensitive to moisture and not all the AAs derivatives are stable.
The technique of cation EC has been widely used followed by post-column
derivatization with ninhydrin and ultraviolet detection. The analyser Jeol JLC-500/V
AminoTac™ (see Figure 2.15), based on the cation EC technique, was used in this
thesis for the analysis of AAs in samples after in vitro gastric and intestinal digestion.
The stationary phase consisted of highly polymerised resin that separates compounds
by differences in their overall charge, charge density, and surface charge distribution,
at particular pH and temperature. The analyte molecules are retained on the column
based on ionic interactions. The stationary phase surface contains ionic functional
groups of opposite charge that interact with analyte ions. For proteins, their surface
charge on the molecules, which binds to cation exchanger should be net positive.
Thus, to get binding of a specific protein, the pH should be below the isoelectric point
of that protein. This method also incorporates a post-column reaction of ninhydrin with
free AAs, so the results can be detected in the visible range. The reaction of ninhydrin
with AAs containing a primary amine generates a derivative that can be absorbed at
570 nm and secondary amines forms a product absorbing at 440 nm. The linearity
ranges, typically, from 5-2,500 μmol/L. The disadvantages of the method are the long
runtime and the instability of ninhydrin. An example of the chromatogram obtained for
a standard solution is illustrated in Figure 2.16.

Chapter 2: General Materials and Methods
95
Figure 2.15 Jeol JLC-500/V AminoTac™ amino acid analyser supplied by Joel Ltd., Herts, UK.
Figure 2.16 Chromatogram of the separation of each amino acid in a standard solution using cation EC.
RPLC has been increasingly used, compared to ion EC. This technique
separates molecules based on their hydrophobicity. RPLC uses a hydrophobic
stationary phase and a hydrophilic mobile phase. The stationary phase is commonly
composed of porous silica particles linked to alkyl chains (typically C8 and C18). C18
packed columns are typically used for the separation of small or low hydrophobic
proteins (≤10 kDa).

Chapter 2: General Materials and Methods
96
Liquid chromatography techniques that are coupled to an optical detector have
low limit of quantification, 5 µmol/L (Kaspar et al., 2008). However, they still offer low
specificity, when compared to mass spectrophotometry (MS). (Kaspar et al., 2008).
MS is a technique that ionizes analytes, separating the ions based on their mass-to-
charge (m/z) ratio and detects them. The selectivity of the quantification is increased
by the use of tandem MS (MS/MS). The principle of MS/MS is that a sample is ionized
by an ion source and separated by m/z ratio in the first mass analyser. The ions of
m/z value of interest are selected and fragmented generating fragment ions, which
are separated and recorded by the second mass analyser. MS/MS offers high
accuracy and sensitivity. Another advantage is that derivatization is not needed.
However, it can be subject to matrix effects, which could be addressed by the use of
stable-isotope-labelled internal standards. In this project, the use of a technique for
AA analysis with high sensitivity was needed in the samples obtained from Ussing
chamber (Chapter 4). For that, LC and electrospray ionization MS/MS, Agilent 6490
triple quadrupole MS equipped with an Agilent 1290 HPLC system (Agilent
Technologies, Santa Clara, CA, USA) (see Figure 2.17) was used using labelled
standards.
Figure 2.17 Agilent 6490 triple quadrupole MS equipped with an Agilent 1290 HPLC system supplied by Agilent Technologies, Santa Clara, CA, USA.
2.2.5 Lipid Analysis
The following methods describe the techniques used in this project to assess
the composition and concentration of lipids.

Chapter 2: General Materials and Methods
97
2.2.5.1 Total Lipid Analyser
The lipid content of the initial sample and emptied digesta was measured using
a CEM Smart Trac 5 System® (CEM Corp., Matthews, N.C., U.S.A.), see Figure 2.18.
The method consists of a microwave-drying step followed by nuclear magnetic
resonance (NMR) analysis. Moisture is evaporated from the sample using microwave
energy and weight loss is determined by electronic balance readings before and after
drying. Microwave drying is an AOAC-approved reference method (Method 985.14).
Then, lipids are determined on the basis of NMR analysis.
Figure 2.18 CEM Smart Trac System-5 supplied by CEM Corp., Matthews, N.C., USA.
The NMR technique incorporated into the CEM Smart Trac System® is based
on low-resolution time domain NMR, which is commonly used for lipid analysis. It uses
a low field strength that is not designed to correct the inhomogenity of the magnetic
field. This implies that the differences in the electronic structure of molecules obtained
using high-resolution NMR cannot be detected. Figure 2.19 illustrates the basic
principles of low-resolution NMR. This technology aligns the hydrogen protons of the
sample to the magnetic field. Then it sends pulses of radiofrequency energy for very
short periods through the sample, which causes a stronger field in which the hydrogen
atoms are aligned. Following the pulse, the atoms return to equilibrium orientation
emitting a signal known as a free induction decay or transverse relaxation time, which
is measured. The induction decay relates to realignment of the protons in response
to the pulsing. Therefore, differences in the signal of rate of decay are used to
differentiate constituents in the analysed matrix. Removal of water in the sample is
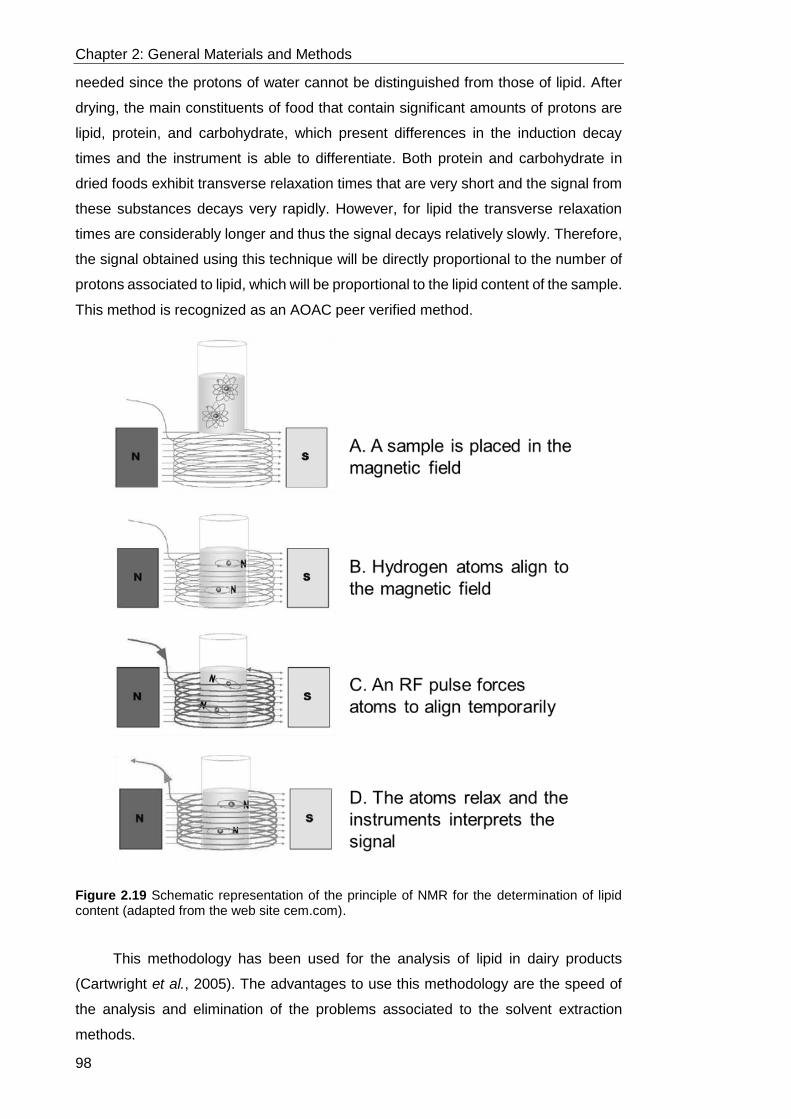
Chapter 2: General Materials and Methods
98
needed since the protons of water cannot be distinguished from those of lipid. After
drying, the main constituents of food that contain significant amounts of protons are
lipid, protein, and carbohydrate, which present differences in the induction decay
times and the instrument is able to differentiate. Both protein and carbohydrate in
dried foods exhibit transverse relaxation times that are very short and the signal from
these substances decays very rapidly. However, for lipid the transverse relaxation
times are considerably longer and thus the signal decays relatively slowly. Therefore,
the signal obtained using this technique will be directly proportional to the number of
protons associated to lipid, which will be proportional to the lipid content of the sample.
This method is recognized as an AOAC peer verified method.
Figure 2.19 Schematic representation of the principle of NMR for the determination of lipid content (adapted from the web site cem.com).
This methodology has been used for the analysis of lipid in dairy products
(Cartwright et al., 2005). The advantages to use this methodology are the speed of
the analysis and elimination of the problems associated to the solvent extraction
methods.

Chapter 2: General Materials and Methods
99
The general protocol is described as follows and it is illustrated in Figure 2.20.
Figure 2.20 Schematic representation of the protocol for the determination of lipid content (taken from the web site cem.com)
Initial and digested aliquots from gastric phase were used. A homogenised
sample was obtained by warming to 40°C to disperse the lipid and using an
ultraTurrax® homogeniser at 7,500 rpm for ~ 30 s. Approximately 2 g of sample was
placed on a glass fibre pad (CEM Corp.) and dried in the CEM Smart Trac 5 System®
by microwave drying. After drying, the sample (including the glass fiber pad) was
placed on a sheet of Teflon film (CEM Corp.), rolled into a cylindrical shape and placed
into a special Teflon tube (CEM Corp.) fitted for the instrument (Figure 2.20). The tube
containing the sample was placed into the NMR chamber of the CEM Smart Trac 5
System®. The settings of the NMR pulse generator were as follows: Pulse power 250
W nominal; pulse times variable in 100 ns increments; transmit and receive phases
selectable 0, 90, 180, and 270°; nominal 90° pulse times 4 ms (18 mm probe).
Magnet: permanent, thermally stabilized, 0.47 T (20 MHz), homogeneity >10 ppm.
Signal detection: dual channel (quadrature) detection with programmable low-pass
filtering, programmable data acquisition rate up to 4 MHz per pair of points. Moisture
and fat results are displayed by the instrument as a percentage (g/100 g).
2.2.5.2 Gas Chromatography-Mass Spectrophotometry
The use of gas chromatography (GC) coupled to MS was used in order to
quantify the lipid hydrolysis by analysing each lipid compound in both initial and
digested samples.
The matrix of these samples consisted of a mixture of lipid, protein and
carbohydrates. In order to avoid any interference, isolation of the lipid prior to analysis
was required. Solvent extraction techniques are one of the most commonly used
methods for lipid extraction. Lipids are soluble in organic solvents, i.e. chloroform, and
insoluble in water. Therefore, lipid components can be separated in foods from water
soluble components, such as proteins and carbohydrates. The lipid part of samples
consisted of a mixture of mainly triacylglycercols, diacylglycercols,

Chapter 2: General Materials and Methods
100
monoacylglycercols and free fatty acids. The separation among the lipid compounds
will depend on the polarity of the solvent compared to that of the lipid species.
Hydrophobic lipids such as triacyglycerols are more soluble in non-polar solvents
whereas diglycerides and monoglycerides have both hydrophobic and hydrophilic
moieties and short chain fatty acids (C1-C4) are very hydrophilic compounds.
The extracted samples can then be analysed. Chromatography techniques, e.g.
thin layer chromatography and GC are usually applied to determine the lipid profile of
food samples. GC coupled to a mass spectrophotometer was used in the study
referred in Chapter 7, using 7890B GC System equipped with 5977A mass
spectrometry detector (Agilent Technologies, USA) (Figure 2.21). In GC, the sample
is volatilized and injected into a column. The sample is transported by a mobile phase
of inert gas and the different elution occurs due to the different interaction with the
stationary phase of the column. However, some lipid compounds are not very volatile,
such as triacylglycerols. For this reason, lipid samples were treated to obtained fatty
acid methyl esters (FAMEs), increasing their volatility. Fatty acids in foods vary in
chain length, degree of unsaturation and position on the glycerol molecule and the
lipid fraction then consists of a complex mixture of different molecules. The
compounds elute at different times depending on their polarity (chain length and
degree of saturation) and boiling point, the fatty acids with the lowest boiling point
and/or the most polar had the shortest retention time. After the separation of the
molecules in the column, they are broken down into ionized fragments using electron
or chemical ionization sources. The compounds can be then identified by comparing
their retention times with those obtained from standards. MS is a powerful technique
that provides the identification and quantification of the chemical structure of these
molecules that it would be more difficult with the use of GC only. The most standard
procedure for ionization is electron ionization, the molecules are bombarded with free
electrons emitted from a filament. These fragmented ions are then separated based
on their different mass-to-charge ratio by a mass analyser. Finally, the signal of the
separated ions is amplified and transmitted by a detector, obtaining mass spectra
data. An example of the chromatogram obtained using the standards is shown in
Figure 2.22.

Chapter 2: General Materials and Methods
101
Figure 2.21 7890B Gas Chromatography System equipped with a model 7694 autosampler and 5977A mass spectrometry detector (Agilent Technologies, USA).
In this system of analysis, an internal standard should be used to normalise or
correct for sample-to-sample preparation variance and standard to sample matrix
differences. The internal standard chosen should not be naturally present in the
sample matrix.
Figure 2.22 Example of chromatogram obtained in a lipid standard mix by GC-MS

102
Development of a Semi-Dynamic in
Vitro Digestion Model
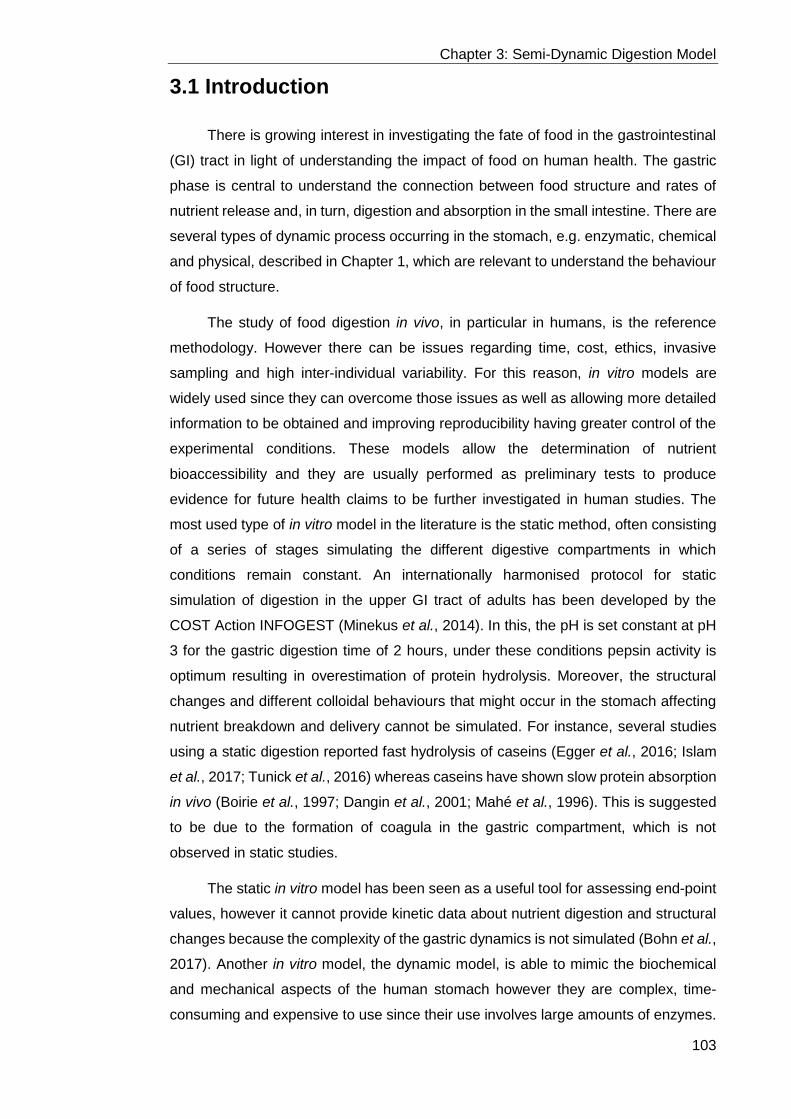
Chapter 3: Semi-Dynamic Digestion Model
103
3.1 Introduction
There is growing interest in investigating the fate of food in the gastrointestinal
(GI) tract in light of understanding the impact of food on human health. The gastric
phase is central to understand the connection between food structure and rates of
nutrient release and, in turn, digestion and absorption in the small intestine. There are
several types of dynamic process occurring in the stomach, e.g. enzymatic, chemical
and physical, described in Chapter 1, which are relevant to understand the behaviour
of food structure.
The study of food digestion in vivo, in particular in humans, is the reference
methodology. However there can be issues regarding time, cost, ethics, invasive
sampling and high inter-individual variability. For this reason, in vitro models are
widely used since they can overcome those issues as well as allowing more detailed
information to be obtained and improving reproducibility having greater control of the
experimental conditions. These models allow the determination of nutrient
bioaccessibility and they are usually performed as preliminary tests to produce
evidence for future health claims to be further investigated in human studies. The
most used type of in vitro model in the literature is the static method, often consisting
of a series of stages simulating the different digestive compartments in which
conditions remain constant. An internationally harmonised protocol for static
simulation of digestion in the upper GI tract of adults has been developed by the
COST Action INFOGEST (Minekus et al., 2014). In this, the pH is set constant at pH
3 for the gastric digestion time of 2 hours, under these conditions pepsin activity is
optimum resulting in overestimation of protein hydrolysis. Moreover, the structural
changes and different colloidal behaviours that might occur in the stomach affecting
nutrient breakdown and delivery cannot be simulated. For instance, several studies
using a static digestion reported fast hydrolysis of caseins (Egger et al., 2016; Islam
et al., 2017; Tunick et al., 2016) whereas caseins have shown slow protein absorption
in vivo (Boirie et al., 1997; Dangin et al., 2001; Mahé et al., 1996). This is suggested
to be due to the formation of coagula in the gastric compartment, which is not
observed in static studies.
The static in vitro model has been seen as a useful tool for assessing end-point
values, however it cannot provide kinetic data about nutrient digestion and structural
changes because the complexity of the gastric dynamics is not simulated (Bohn et al.,
2017). Another in vitro model, the dynamic model, is able to mimic the biochemical
and mechanical aspects of the human stomach however they are complex, time-
consuming and expensive to use since their use involves large amounts of enzymes.

Chapter 3: Semi-Dynamic Digestion Model
104
In addition, dynamic models are often commercially run and are often not available to
food researchers. Therefore, there was the need of an intermediate model that could
provide the advantages of the two models, a system that could provide more realistic
trends about nutrient digestion while taking into account the relevant in vivo gastric
secretion and emptying, and yet could easily be used in laboratories without specialist
facilities.
A semi-dynamic gastric model was developed in this thesis to obtain better
physiological relevance in the kinetics of gastric digestion compared to the static
model but without the constrictions of cost and access, and the use of large samples
needed in fully dynamic models. The features are the simulation of the main gastric
dynamics of gradual acidification, fluid and enzyme secretion and emptying. Using in
vivo data on gastric volume changes during digestion (Mackie et al., 2013), this model
has been reported to closely simulate the behaviour observed in the human stomach
by magnetic resonance imaging (Chapter 7), allowing the determination of the
underlying mechanisms leading to the physiological responses observed in humans.
In this chapter the main steps in the development of the model are described,
with particular consideration of the dynamic pH profile and gastric emptying (GE). This
chapter presents the final outcomes and design of the model based on the aims of
developing a simpler, cheaper, more accessible model that had a higher throughput
than fully dynamic models yet gives a more accurate insight into gastric processing
than current static models. It builds upon the standardised outcomes of the static
INFOGEST protocol (Minekus et al., 2014). The results of this thesis will be the basis
for an international consensus method published in 2019, with a detailed description
of the experimental parameters and commercially available equipment so that the
method can be easily reproduced in any laboratory worldwide.
3.2 Materials and Methods
3.2.1 Materials
Skimmed milk power (SMP), from Fonterra, New Zealand, was used in most of
the trial experiments performed. The enzymes were provided by Sigma Aldrich (St
Louis, Mo, USA). Enzyme activities were determined based on the assays detailed in
Minekus et al. (2014). The α-amylase of oral phase was not included in any
experiment because starch was not present in the matrix, however it should be
included when starch is present. Porcine pepsin activity was based on bovine blood
haemoglobin as a substrate (one unit will produce a ΔA280 of 0.001 per minute at pH

Chapter 3: Semi-Dynamic Digestion Model
105
2.0 and 37°C) measured as TCA-soluble products. Porcine pancreatin was used and
the trypsin activity was considered, which was based on p-toluene-sulfonyl-L-arginine
methyl ester, TAME, (one unit hydrolyses 1 µmol of TAME per minute at 25°C, pH
8.1). The concentration of bile salts (bovine origin) was measure using a commercial
kit (DiaSys Diagnostic System GmbH, Germany). The reagents and protocol for the
digestive fluids i.e. salivary, gastric and intestinal simulated fluids were according to
Minekus et al. (2014), and detailed below.
3.2.2 Preparation of Simulated Digestion Fluids
The preparation of the stock solutions for the simulated salivary fluid (SSF) is
detailed in Table 3.1. The stock solution was made up with water to 400 mL, obtaining
1.25x concentrated solution. The addition of enzymes, Ca2+ solution and water will
result in the correct electrolyte concentration (1x) in the final digestion mixture. This
aims to reach the concentration of 0.75 mmol/L of Ca2+ (using CaCl2(H2O)2) in the
final digestion mixture.
Table 3.1 Preparation of the simulated salivary fluid (SSF), 1.25x concentrated, for the simulation of the oral phase.
The solution was adjusted to pH 7 using 1 mol/L HCl and made up with distilled
water to 400 mL. The solution was stored at 4°C up to one week.
The preparation of the stock solutions for the simulated gastric fluid (SGF) is
detailed in Table 3.2. The stock solution was made up with water to 400 mL, obtaining
1.25x concentrated solution. The addition of enzymes, Ca2+ solution, HCl and water
will result in the correct electrolyte concentration (1x) in the final digestion mixture.
This aims to reach the concentration of 0.075 mmol/L of Ca2+ (using CaCl2(H2O)2) and
pepsin activity of 2,000 U/mL in the final digestion mixture.
Constituent Stock concentration
(mol·L-1) Volume of stock (mL)
Concentration in SSF (mmol·L-1)
KCl 0.5 15.1 15.1 KH2PO4 0.5 3.7 3.7 NaHCO3 1 6.8 13.6 NaCl 2 - - MgCl2(H2O)6 0.15 0.5 0.15 (NH4)2CO3 0.5 0.06 0.06

Chapter 3: Semi-Dynamic Digestion Model
106
Table 3.2 Preparation of simulated gastric fluid (SGF), 1.25x concentrated, for the simulation of the gastric phase.
The solution was adjusted to pH 7 using 2 mol/L HCl and made up with distilled
water to 400 mL. The solution was stored at 4°C up to one week.
The preparation of the stock solutions for the simulated intestinal fluid (SIF) is
detailed in Table 3.3. The stock solution was made up with water to 400 mL, obtaining
1.25x concentrated solution. The addition of enzymes, Ca2+ solution, bile and water
will result in the correct electrolyte concentration (1x) in the final digestion mixture.
This aims to reach the concentration of 0.3 mmol/L of Ca2+ (using CaCl2(H2O)2) and
pancreatin activity of 100 U/mL (based on trypsin activity) and bile concentration of
10 mmol/L in the final digestion mixture.
Table 3.3 Preparation of simulated intestinal fluid (SIF), 1.25x concentrated, for the simulation of the intestinal phase.
The solution was adjusted to pH 7 using 2 mol/L HCl and made up with distilled
water to 400 mL. The solution was stored at 4°C up to one week.
A solution of 0.3 mol/L CaCl2(H2O)2 was also prepared but added separately.
3.2.3 Semi-Dynamic Gastric Model Equipment
Figure 3.1 shows the typical set up for the semi-dynamic gastric model and the
functional parts are individually illustrated in Table 3.4. The auto-titrator (including pH
probe and dosing device), vessel with thermostat water jacket and vessel lid with
openings were purchased from Metrohm Ltd (Switzerland), circulating water bath was
from VWR, twin syringe infusion pump was from Harvard Apparatus PHD Ultra
Syringe Pump, orbital shaker (Stuart mini gyro-rocker, SSM3) was provided by Stuart,
Barloworld Scientific limited, UK. Plastic tubing to connect end of syringe with vessel
Constituent Stock concentration
(mol·L-1) Volume of stock (mL)
Concentration in SGF (mmol·L-1)
KCl 0.5 6.9 6.9 KH2PO4 0.5 0.9 0.9 NaHCO3 1 12.5 25 NaCl 2 11.8 47.2 MgCl2(H2O)6 0.15 0.4 0.1 (NH4)2CO3 0.5 0.5 0.5
Constituent Stock concentration
(mol·L-1) Volume of stock (mL)
Concentration in SIF (mmol·L-1)
KCl 0.5 6.8 6.8 KH2PO4 0.5 0.8 0.8 NaHCO3 1 42.5 85 NaCl 2 9.6 38.4 MgCl2(H2O)6 0.15 1.1 0.33 (NH4)2CO3 0.5 - -

Chapter 3: Semi-Dynamic Digestion Model
107
lid was made in-house and the tubing from the dosing device to the vessel was from
Metrohm Ltd.
Figure 3.1. Set up of the semi-dynamic gastric model.
Table 3.4. Description of the parts of the semi-dynamic gastric model.
Image of Model Part Generic Name Functions
pH electrode Records pH within the simulated stomach (reaction vessel). Since a pH curve is previously determined its use is not required in every digestion
Pump (Dosing device)
Delivers the simulated electrolyte gastric mixture containing the electrolytes and acid at a defined rate. The delivery rate is programmed using the software Tiamo™ (Metrohm)
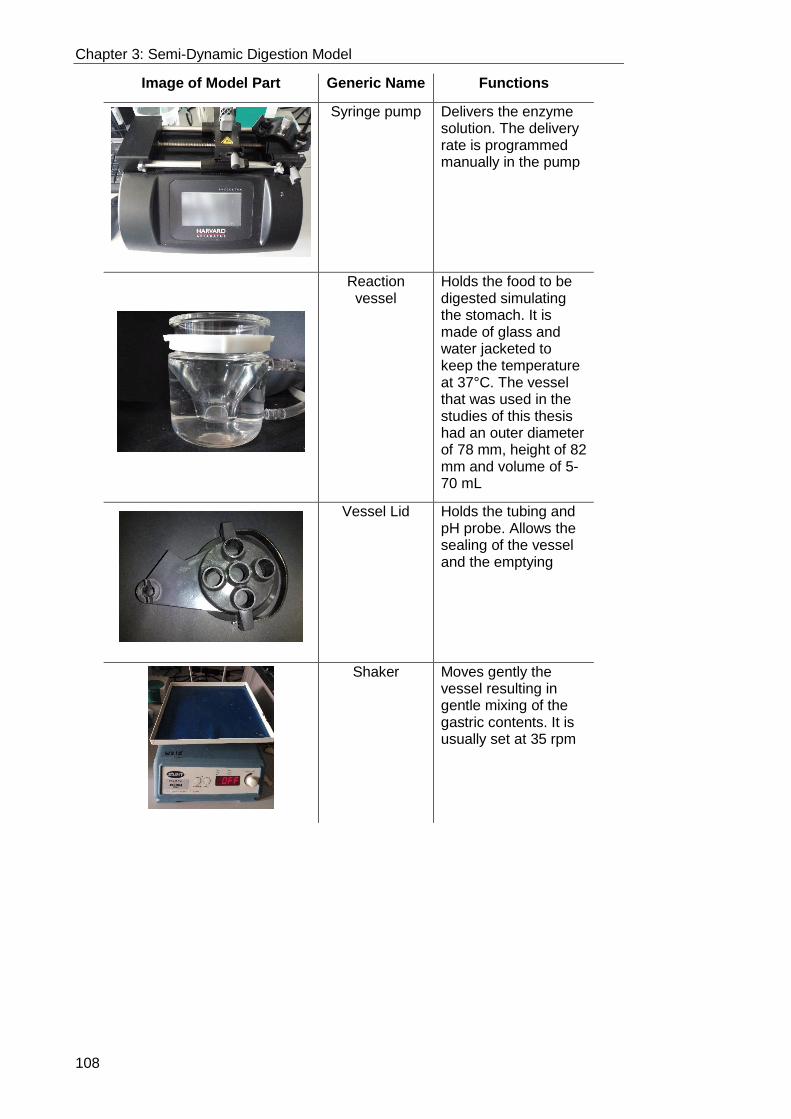
Chapter 3: Semi-Dynamic Digestion Model
108
Image of Model Part Generic Name Functions
Syringe pump Delivers the enzyme solution. The delivery rate is programmed manually in the pump
Reaction vessel
Holds the food to be digested simulating the stomach. It is made of glass and water jacketed to keep the temperature at 37°C. The vessel that was used in the studies of this thesis had an outer diameter of 78 mm, height of 82 mm and volume of 5-70 mL
Vessel Lid Holds the tubing and pH probe. Allows the sealing of the vessel and the emptying
Shaker Moves gently the vessel resulting in gentle mixing of the gastric contents. It is usually set at 35 rpm

Chapter 3: Semi-Dynamic Digestion Model
109
Image of Model Part Generic Name Functions
Water bath Heats water at 37°C, which is circulated through the vessel
Tubing I Connects the syringe containing the enzyme solution with the vessel, allowing accurate delivery of small volumes. It is held by the lid of the reaction vessel
Tubing II Connects the pump (dosing device from Metrohm) containing the simulated electrolyte gastric mixture with the vessel, allowing accurate delivery. It is held by the lid of the reaction vessel
3.3 Results
3.3.1 Oral Phase
The oral phase remains essentially the same as the INFOGEST static protocol
(Minekus et al., 2014) but the 1:1 ratio of salivary fluids to food was calculated based
on the dry weight of food proportion instead of the volume of food. This is mainly
designed for solid/semi-solid foods in order to obtain paste-like consistency simulating
the formation of a bolus. The amount of saliva secreted in relation to the amount and
type of food ingested is highly variable, the values typically can range from 0.05 to 0.5
g saliva/g food (Watanabe et al., 1988). Therefore, the proportion of saliva added with
the dry matter content can provide more relevant relation.

Chapter 3: Semi-Dynamic Digestion Model
110
3.3.2 Development of a Dynamic Gastric pH Profile
The dynamic pH curve observed in the human stomach was the principal
parameter to be simulated. For that, SMP was used in first trials as a food model. This
dynamic profile is one of the main changes from the static model. The latter provides
the constant pH profile during gastric digestion as illustrated in Figure 3.2. The initial
pH of the sample was 6.5, after the addition of HCl the pH dropped drastically to pH
3 and was constant during the gastric digestion time.
Figure 3.2 Example of a pH curve of gastric digestion under static model conditions and a zoom of the curve during the first 100 seconds of digestion.
The first approach to obtain a dynamic pH profile was to create a curve with set
pH endpoints using a method in the pH titrator’s software (Tiamo™). The method was
optimised by modifying the parameters of titration in particular the minimum and
maximum rate of addition of HCl. The best approximation is illustrated in Figure 3.3
using 9.5% SMP dissolved in phosphate buffer without the addition of digestive fluids.
The pH value at the end of the acidification was 2 and the average pH was
approximately 3.5.

Chapter 3: Semi-Dynamic Digestion Model
111
Figure 3.3 Programmed pH curve for 9.5% SMP in phosphate buffer adding 0.5 mol/L HCl. Note: a magnetic stirrer was used as mixing system.
The next step was to test the previous programmed method using simulated
digestive fluids, both salivary and gastric, including the addition of pepsin to reach a
final activity of 2,000 U/mL by means of the dosing device following a constant rate of
0.0083 mL/min. For this trial, 5 mL of 9.5% SMP was mixed with 5 mL SSF. Then, the
sample was placed in the vessel and 10 mL of SGF at pH 7 was added. Gastric
digestion was carried out for 2 hours at 37°C and using magnetic stirring at 225 rpm
meanwhile pepsin solution was added at constant rate of 0.0083 mL/min. Samples
(0.5 mL) were taken during the digestion at 5, 10, 15, 30, 60, 90 and 120 min and
mixed with 50 µL NaHCO3 to raise the pH in order to stop pepsin activity. The pH
profile together with the curve of HCl addition can be seen in Figure 3.4. In this case,
there was slower pH decrease compared with the previous trial and the final pH value
did not reach pH 2, which could be due to the buffering action of pepsin.

Chapter 3: Semi-Dynamic Digestion Model
112
Figure 3.4 Programmed pH curve with different endpoints using 9.5% SMP including oral and gastric phases. Pepsin solution was prepared at 2,000 U/mL (in final volume) and delivered by means of a dosing device following a constant rate of 0.0083 mL/min. The solution 0.5 mol/L HCl was added by another dosing device.
Regarding gastric behaviour, some precipitation was visible at around 30 min,
which gradually dissolved resulting in a clear solution (Figure 3.5 A). In contrast, no
visible formation of precipitate was observed during the static digestion Figure 3.5 B.
The SDS-PAGE of digestion using both static and dynamic pH profile can be seen in
Figure 3.6. In the dynamic pH profile there was progressive casein hydrolysis
compared to the static method, in which the bands of casein were not visible after 5
min.
Figure 3.5 Behaviour during gastric digestion of SMP in (A) dynamic pH and (B) static pH.
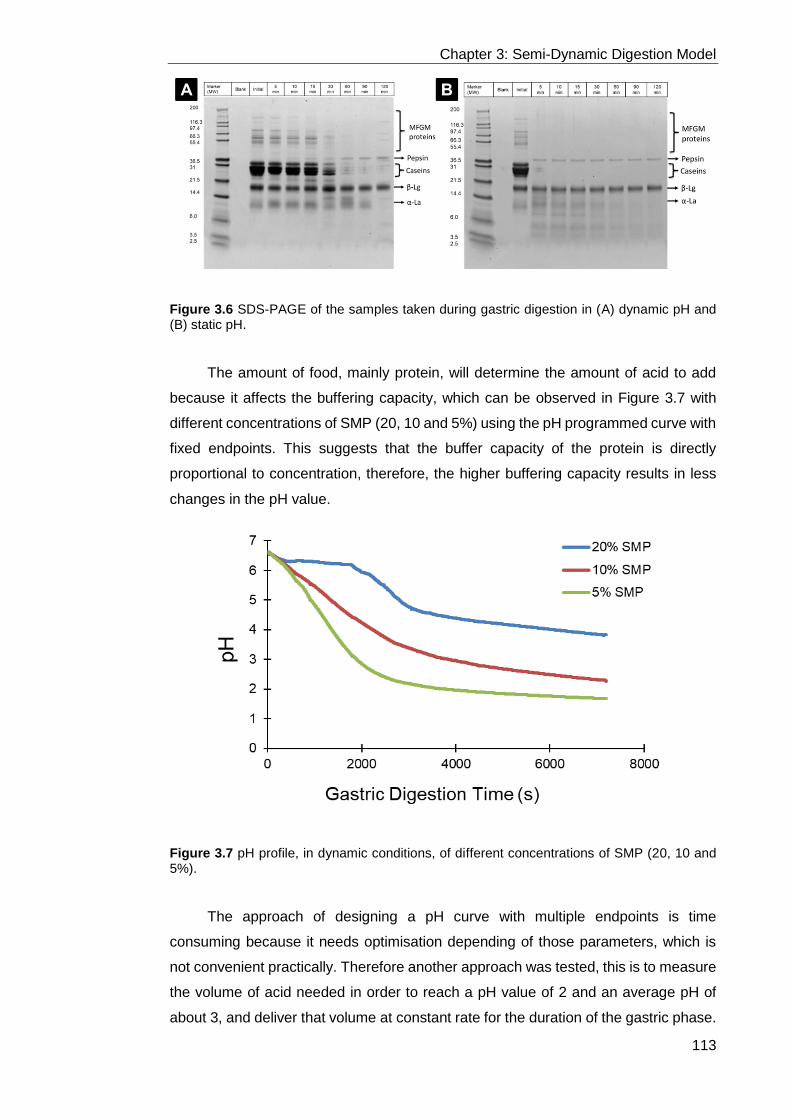
Chapter 3: Semi-Dynamic Digestion Model
113
Figure 3.6 SDS-PAGE of the samples taken during gastric digestion in (A) dynamic pH and (B) static pH.
The amount of food, mainly protein, will determine the amount of acid to add
because it affects the buffering capacity, which can be observed in Figure 3.7 with
different concentrations of SMP (20, 10 and 5%) using the pH programmed curve with
fixed endpoints. This suggests that the buffer capacity of the protein is directly
proportional to concentration, therefore, the higher buffering capacity results in less
changes in the pH value.
Figure 3.7 pH profile, in dynamic conditions, of different concentrations of SMP (20, 10 and 5%).
The approach of designing a pH curve with multiple endpoints is time
consuming because it needs optimisation depending of those parameters, which is
not convenient practically. Therefore another approach was tested, this is to measure
the volume of acid needed in order to reach a pH value of 2 and an average pH of
about 3, and deliver that volume at constant rate for the duration of the gastric phase.

Chapter 3: Semi-Dynamic Digestion Model
114
This experiment can be performed prior the actual digestion without considering the
addition of enzyme and performing gastric emptying. Therefore this excludes two
opposing factors adding the enzymes will increase the buffering capacity of the
system while the emptying will lower it. Then, a test digestion considering these two
aspects can be tested to check the pH curve. This approach is illustrated in Figure
3.8 for the sample of 20% SMP.
Figure 3.8 In a sample of 20% SMP, (A) three measurements of the volume of HCl needed to reach pH 2, (B) pH curve using a constant delivery of the measured volume of HCl during gastric digestion time.
The pH profile was further improved by the simulation of the basal state of the
stomach, in which the gastric residue pH is below 2 and results in a rapid initial
lowering of the food immediately after entering the stomach. This was achieved by
adding 10% of the required acid in the gastric reaction vessel before placing the food
to be digested. Then, the remaining 90% was gradually delivered during the total
gastric phase time.
3.3.3 Gastric Mixing System
The initial experiments were performed using a magnetic stirrer inside of the
simulated stomach, i.e. reaction vessel. However, this altered the structural changes
and could prevent the formation of colloidal structures. Therefore, other types of
mixing systems were tested, e.g. orbital shaker. The objective was to obtain some
gentle mixing between the gastric secretions and the food inside of the vessel. Figure
3.9 shows the pH curves comparing the mixing systems of magnetic stirrer and the
orbital shaking system using a 10% SMP solution, showing that the end values of pH
were similar. After two hours of gastric digestion, using the orbital shaker, there was
a white clot remaining (Figure 3.10) whereas a clear solution was obtained when
magnetic stirrer was used. The incorporation of glass balls (4 balls of 4.5 mm
diameter) at the bottom of the vessel when using the orbital shaker aimed to provide
a more vigorous mixing at the bottom simulating the higher shear that occurs in the
antral part of the stomach. This approach did not work because the balls became

Chapter 3: Semi-Dynamic Digestion Model
115
entrapped in the coagulum formed during the gastric behavior, which made their
movement impossible.
Figure 3.9 pH profile of 10% SMP using an orbital shaker and a magnetic stirrer inside of the vessel.
Figure 3.10 Behaviour of 10% SMP after 2 hours of gastric digestion using an orbital shaker as mixing system. Yellow arrow pointing the clot on the bottom of the vessel.
Another type of mixing was tried in the study relating to Chapter 5, mixing inside
of the vessel using a 50-mL syringe with plastic tubing. This consisted of pulling in
and then pushing out the digesta from the vessel using the syringe. This aimed to
take an accurate volume calculated from gastric emptying at each emptied point. The
mixing was performed initially before each gastric emptying point. However, this
resulted in excessive mixing that disrupted the colloidal structures that developed
during the gastric phase (see Figure 3.11), which could alter the simulated nutrient

Chapter 3: Semi-Dynamic Digestion Model
116
content emptied from the stomach to the duodenum. However, this mixing was
applied at early stage of digestion which seemed to provide better results without
affecting the later intragastric behavior.
Figure 3.11 Gastric behaviour of a sample (UHT+homogenisation milk) used in Chapter 5, (A) before mixing with syringe and (B) after mixing with syringe.
3.3.4 Gastric Secretions and Gastric Emptying
An example of the calculations for the volume of each gastric fluid used in the
semi-dynamic model can be seen in Table 3.5. The oral phase is simulated before
the gastric digestion. In this example, 20 g of sample is mixed with a volume of the
oral mixture containing 79.9% SSF (1.25x), 19.6% MilliQ® water and 0.5%
CaCl2(H2O)2 (0.3 mol/L), which corresponds to the total solids content of the sample
(3 mL in this example). This mixture is placed in the reaction vessel after the addition
of the basal volume, which consists of the 10% of the constituents of SGF (1.25x),
MilliQ® water, HCl (1.5 mol/L) and CaCl2(H2O)2 (0.3 mol/L) from the total volume of
the gastric mixture. The total gastric mixture contained 80% SGF (1.25x), 7.78%
MilliQ® water, 8.7% HCl (1.5 mol/L) and 3.48% pepsin and 0.04% CaCl2(H2O)2 (0.3
mol/L). Two solutions are added at a constant rate, which depends on the
corresponding gastric time, in this example 200 min: (1) the simulated gastric
electrolyte mixture containing the 90% of SGF (1.25x), MilliQ® water, HCl (1.5 mol/L)
and CaCl2(H2O)2 (0.3 mol/L) from the total volume of the gastric mixture and (2) 0.8
mL pepsin solution. The simulated gastric electrolyte mixture of SGF (1.25x), HCl,
water and CaCl2(H2O)2 was delivered by a dosing device of an automatic titrator and
the enzyme solution can be delivered by a syringe pump.
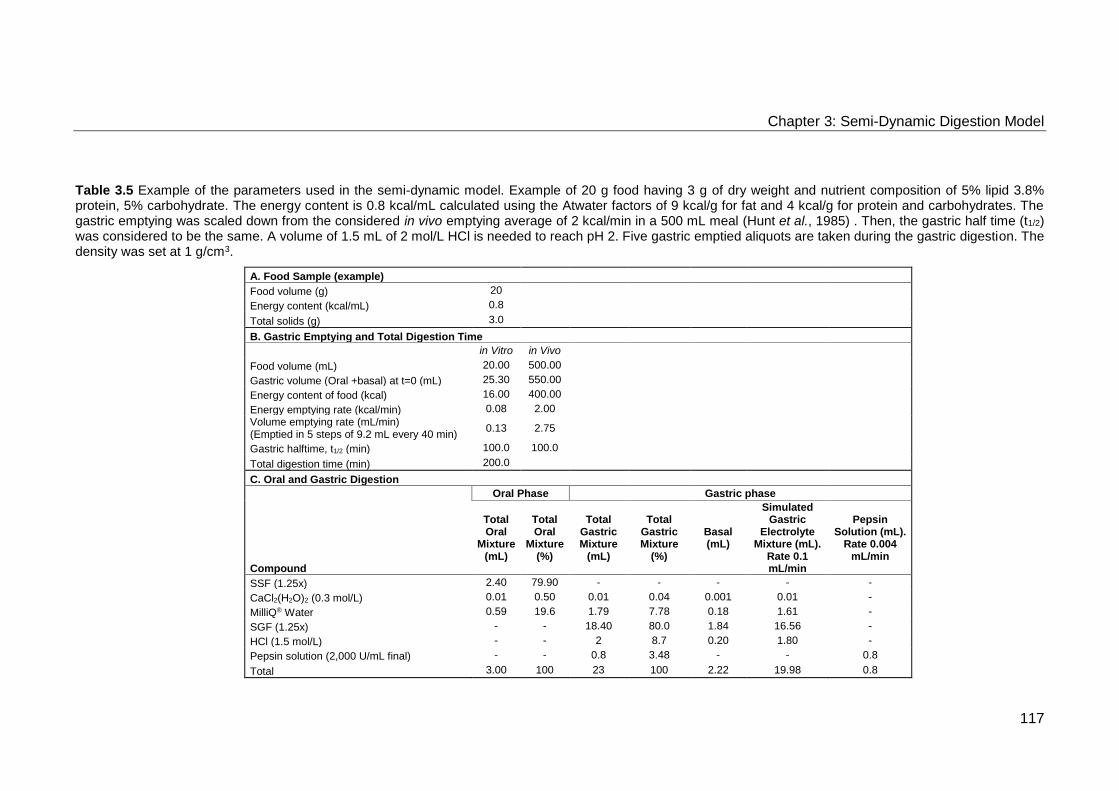
Chapter 3: Semi-Dynamic Digestion Model
117
Table 3.5 Example of the parameters used in the semi-dynamic model. Example of 20 g food having 3 g of dry weight and nutrient composition of 5% lipid 3.8% protein, 5% carbohydrate. The energy content is 0.8 kcal/mL calculated using the Atwater factors of 9 kcal/g for fat and 4 kcal/g for protein and carbohydrates. The gastric emptying was scaled down from the considered in vivo emptying average of 2 kcal/min in a 500 mL meal (Hunt et al., 1985) . Then, the gastric half time (t1/2) was considered to be the same. A volume of 1.5 mL of 2 mol/L HCl is needed to reach pH 2. Five gastric emptied aliquots are taken during the gastric digestion. The density was set at 1 g/cm3.
A. Food Sample (example)
Food volume (g) 20
Energy content (kcal/mL) 0.8
Total solids (g) 3.0
B. Gastric Emptying and Total Digestion Time
in Vitro in Vivo
Food volume (mL) 20.00 500.00
Gastric volume (Oral +basal) at t=0 (mL) 25.30 550.00
Energy content of food (kcal) 16.00 400.00
Energy emptying rate (kcal/min) 0.08 2.00 Volume emptying rate (mL/min) (Emptied in 5 steps of 9.2 mL every 40 min)
0.13 2.75
Gastric halftime, t1/2 (min) 100.0 100.0
Total digestion time (min) 200.0
C. Oral and Gastric Digestion
Oral Phase Gastric phase
Compound
Total Oral
Mixture (mL)
Total Oral
Mixture (%)
Total Gastric Mixture
(mL)
Total Gastric Mixture
(%)
Basal (mL)
Simulated Gastric
Electrolyte Mixture (mL).
Rate 0.1 mL/min
Pepsin Solution (mL).
Rate 0.004 mL/min
SSF (1.25x) 2.40 79.90 - - - - -
CaCl2(H2O)2 (0.3 mol/L) 0.01 0.50 0.01 0.04 0.001 0.01 -
MilliQ® Water 0.59 19.6 1.79 7.78 0.18 1.61 -
SGF (1.25x) - - 18.40 80.0 1.84 16.56 -
HCl (1.5 mol/L) - - 2 8.7 0.20 1.80 -
Pepsin solution (2,000 U/mL final) - - 0.8 3.48 - - 0.8
Total 3.00 100 23 100 2.22 19.98 0.8

Chapter 3: Semi-Dynamic Digestion Model
118
There are some in vivo studies providing data about gastric emptying (GE)
rates, i.e. the volume and time in which chyme is delivered from the stomach to the
small intestine. This information can be used and applied to the semi-dynamic model
by downscaling the volume, about 25 times, since the model is design for smaller
volumes than used in human studies. However, this information is only available for
a very limited range of foods. Therefore, the GE was based on the caloric density of
food, one of the main factors controlling GE (Calbet et al., 1997; Hunt et al., 1985;
Kwiatek et al., 2009; Moran et al., 1999; Sauter et al., 2011), the constant rate of 2
kcal/min and 500 mL of volume was used as reference of a standard meal size. The
information about the caloric content or the nutrient composition of the sample can be
measured or calculated theoretically by applying the standard Atwater factors (1 g of
lipid yields 9 kcal, 1 g of protein yields 4 kcal and 1 g of carbohydrates yields 4 kcal).
Table 3.5 shows an example of the calculations regarding GE. In this example,
it can be assumed that a 500 g meal is digested, using only a Y g sample. In this case
Y= 20. Assuming a scale of 20g / 500g = 0.04 for the rates calculated. Using a
constant emptying rate of 2 kcal/min, a 20 g meal with 3 g dry weight with a calorie
density of 0.8 kcal/mL would empty at 2 * 0.04 = 0.08 kcal/min. However, both the
oral secretions and gastric secretions also need to be taken into account. Thus, the
total volume entering the stomach from the oral phase is 20 g of food + 3 mL oral
secretion. Then there will be 23 mL of gastric secretion making a total of 46 mL to be
emptied. As already described the caloric emptying rate is 0.08 kcal/min and the total
calories is 20 g * 0.8 kcal/g = 16 kcal leading to an emptying time of 16/0.08 = 200
minutes. Therefore the total emptying rate will be 46/200 = 0.23 mL/min. If we decide
to empty in 5 stages then each stage will need to remove 46/5 = 9.2 mL, which occurs
after every 40 minutes.
Regarding the practicalities of the gastric emptying, the aliquots are taken from
the bottom of the vessel, simulating the portion of food that would be ready to be
delivered into the duodenum, by using lab tools with an opening diameter of
approximately 2 mm. Some of the lab tools that were tested and used are pipette tip,
serological pipette and syringe with embedded plastic tubing (see Figure 3.12). This
was different in some studies of the thesis according to the practical development and
the handling of the complex samples.

Chapter 3: Semi-Dynamic Digestion Model
119
Figure 3.12 Different lab tools that were used to simulate the gastric emptying, (A) pipette tip, (B) serological pipette and (C) plastic syringe with attached tubing (in-house made).
3.3.5 Intestinal Phase
The intestinal phase remains essentially the same as the INFOGEST static
protocol (Minekus et al., 2014) but with chyme emptied from the gastric phase being
digested separately in parallel, i.e. each emptied aliquot goes through as intestinal
digestion, as illustrated in Figure 3.13. Therefore, regarding the volume of the
intestinal phase, the volume of the SIF (1x), including pancreatin solution and bile
salts, was added according to the proportions based on the INFOGEST static protocol
(Minekus et al., 2014).
Figure 3.13 Schematic diagram of gastric digestion using the semi-dynamic model having five gastric emptying points (GE) and the subsequent intestinal digestion of each gastric emptied aliquot, during which several aliquots can be taken during time (e.g. after 5, 30 and 60 min of intestinal digestion).

Chapter 3: Semi-Dynamic Digestion Model
120
3.4 Discussion
The developed method was built on the basis of the harmonised static digestion
INFOGEST (Minekus et al., 2014) regarding digestive fluid composition and the
consideration of the dynamic addition of enzymes and reagents, which has been
developed further in order to better simulate the stomach dynamics to obtain more
physiologically relevant data about nutrient digestion kinetics and structural changes
during gastric digestion.
3.4.1 Shape/Geometry of Simulated Stomach
The human stomach has a J-shape however the construction or purchase of
this kind of vessel can be difficult. Therefore the reaction vessel selected for this
model has a vertical cylinder with V-form alignment, which has been adopted by other
dynamic models such as Human Gastric Simulator (HGS) and Dynamic Gastric Model
(DGM). This allows the formation of structures driven by colloidal behaviour such as
phase separation, as might occur in vivo. However, the limitation is that with this
arrangement gravity could influence sedimentation and then the particle sieving. The
maximum capacity of the vessel used in the experiments presented in this thesis was
70 mL, and typically the initial food volume of 20 mL was selected providing accurate
results. This relatively small volume is convenient in terms of handling and also cost,
because the use of relatively small amounts of enzymes needed.
Furthermore, the transparent wall of the vessel allows the visual observation
and continuous monitoring in real-time and allows photography and video recording.
This contrasts with other dynamic models such as HGS, having an opaque gastric
compartment. Moreover, the vessel is thermostatically controlled by a circulating
water jacket, which allows the simulation of the normal body temperature (37°C) and
it can be fully closed during gastric time, except when emptying is applied.
3.4.2 Gastric Mixing
One of the main strengths of this semi-dynamic model is the simulation of the
gentle mixing occurring in the fundus/body part of the stomach by using an orbital
shaker. This allowed some mixing of the fluids added with the food, in particular to
disperse the acid solution in the vessel and, at the same time, provided a non-
homogenous chyme. Some studies have shown that the contents in the stomach are
poorly mixed contradicting the traditional idea of a complete and rapid intragastric
homogenisation of food (Ferrua et al., 2010; Marciani et al., 2001). Therefore, the
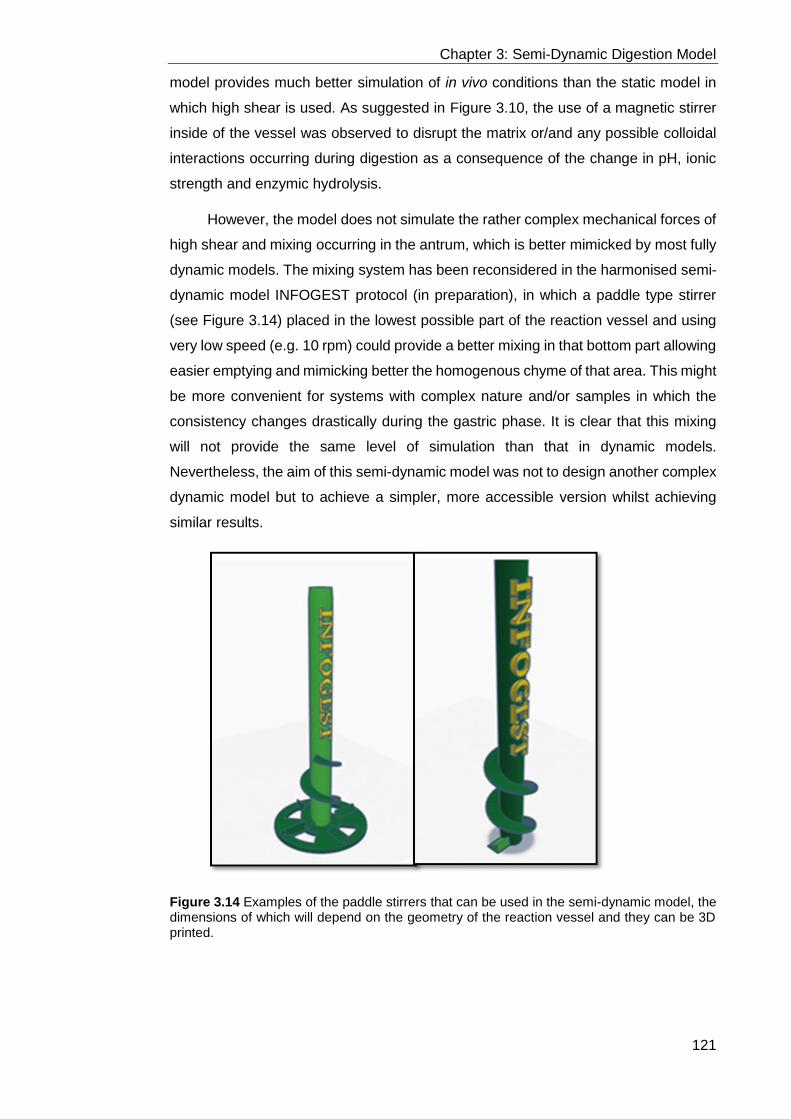
Chapter 3: Semi-Dynamic Digestion Model
121
model provides much better simulation of in vivo conditions than the static model in
which high shear is used. As suggested in Figure 3.10, the use of a magnetic stirrer
inside of the vessel was observed to disrupt the matrix or/and any possible colloidal
interactions occurring during digestion as a consequence of the change in pH, ionic
strength and enzymic hydrolysis.
However, the model does not simulate the rather complex mechanical forces of
high shear and mixing occurring in the antrum, which is better mimicked by most fully
dynamic models. The mixing system has been reconsidered in the harmonised semi-
dynamic model INFOGEST protocol (in preparation), in which a paddle type stirrer
(see Figure 3.14) placed in the lowest possible part of the reaction vessel and using
very low speed (e.g. 10 rpm) could provide a better mixing in that bottom part allowing
easier emptying and mimicking better the homogenous chyme of that area. This might
be more convenient for systems with complex nature and/or samples in which the
consistency changes drastically during the gastric phase. It is clear that this mixing
will not provide the same level of simulation than that in dynamic models.
Nevertheless, the aim of this semi-dynamic model was not to design another complex
dynamic model but to achieve a simpler, more accessible version whilst achieving
similar results.
Figure 3.14 Examples of the paddle stirrers that can be used in the semi-dynamic model, the dimensions of which will depend on the geometry of the reaction vessel and they can be 3D printed.
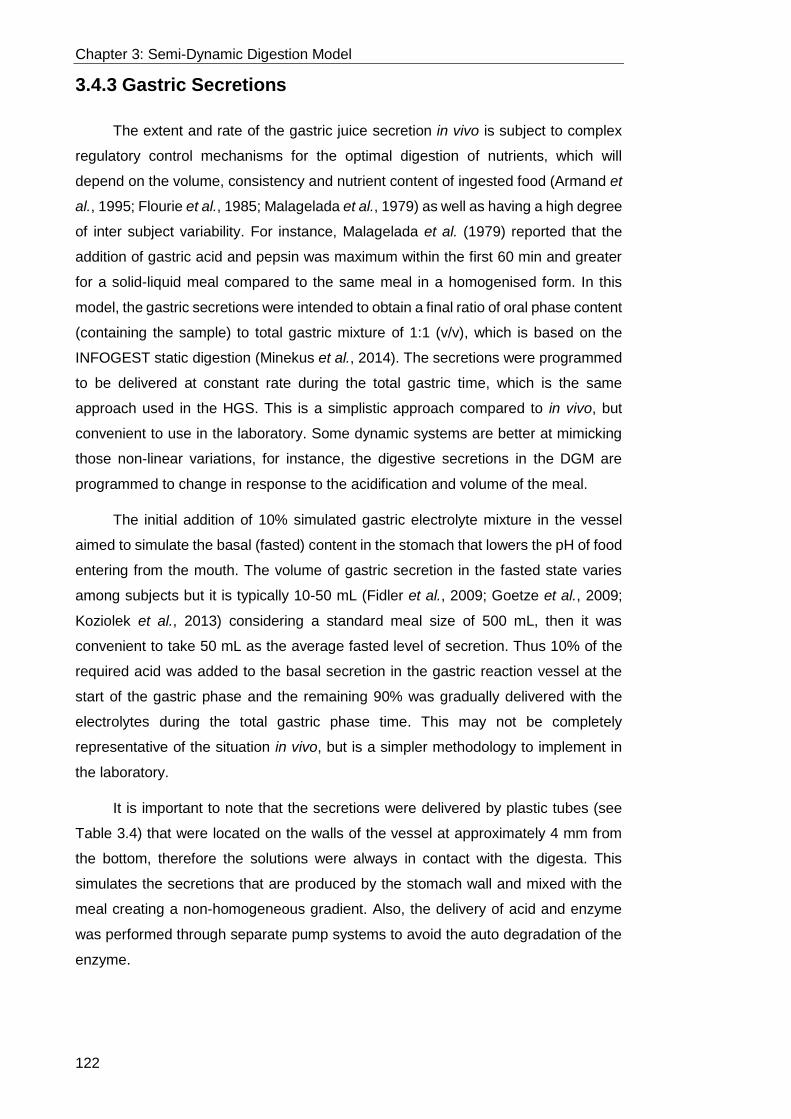
Chapter 3: Semi-Dynamic Digestion Model
122
3.4.3 Gastric Secretions
The extent and rate of the gastric juice secretion in vivo is subject to complex
regulatory control mechanisms for the optimal digestion of nutrients, which will
depend on the volume, consistency and nutrient content of ingested food (Armand et
al., 1995; Flourie et al., 1985; Malagelada et al., 1979) as well as having a high degree
of inter subject variability. For instance, Malagelada et al. (1979) reported that the
addition of gastric acid and pepsin was maximum within the first 60 min and greater
for a solid-liquid meal compared to the same meal in a homogenised form. In this
model, the gastric secretions were intended to obtain a final ratio of oral phase content
(containing the sample) to total gastric mixture of 1:1 (v/v), which is based on the
INFOGEST static digestion (Minekus et al., 2014). The secretions were programmed
to be delivered at constant rate during the total gastric time, which is the same
approach used in the HGS. This is a simplistic approach compared to in vivo, but
convenient to use in the laboratory. Some dynamic systems are better at mimicking
those non-linear variations, for instance, the digestive secretions in the DGM are
programmed to change in response to the acidification and volume of the meal.
The initial addition of 10% simulated gastric electrolyte mixture in the vessel
aimed to simulate the basal (fasted) content in the stomach that lowers the pH of food
entering from the mouth. The volume of gastric secretion in the fasted state varies
among subjects but it is typically 10-50 mL (Fidler et al., 2009; Goetze et al., 2009;
Koziolek et al., 2013) considering a standard meal size of 500 mL, then it was
convenient to take 50 mL as the average fasted level of secretion. Thus 10% of the
required acid was added to the basal secretion in the gastric reaction vessel at the
start of the gastric phase and the remaining 90% was gradually delivered with the
electrolytes during the total gastric phase time. This may not be completely
representative of the situation in vivo, but is a simpler methodology to implement in
the laboratory.
It is important to note that the secretions were delivered by plastic tubes (see
Table 3.4) that were located on the walls of the vessel at approximately 4 mm from
the bottom, therefore the solutions were always in contact with the digesta. This
simulates the secretions that are produced by the stomach wall and mixed with the
meal creating a non-homogeneous gradient. Also, the delivery of acid and enzyme
was performed through separate pump systems to avoid the auto degradation of the
enzyme.

Chapter 3: Semi-Dynamic Digestion Model
123
3.4.4 Dynamic pH Profile
The pH in the human stomach is highly variable. Changes in the pH strongly
affect the activity of the digestive enzyme and influence the possible structural
changes within the digested food. One of the aims in the development of this model
was to closely simulate the dynamic pH changes occurring in the human stomach
which depends on the properties of food, in particular the buffering capacity. Typically,
the pH in healthy subjects is around 2 under fasted conditions due to the basal
residue, which is homogenous within the stomach (McLauchlan et al., 1989). This
basal acidity leads to a rapid lowering of the pH of the ingested food, which is
simulated by the addition of the aforementioned 10% simulated gastric secretion in
the reaction vessel before the start of the in vitro gastric digestion. This will drop the
pH of food as soon as it is added to the simulated stomach. After meal consumption,
the pH increases rapidly up to values of pH 7 or that of the food, after which the pH
decreases gradually back to 2 over 2 hours as an average time (Dressman et al.,
1990; Malagelada et al., 1976). The pH values as well as the duration of these
processes depend on the food properties, e.g. the initial pH, buffering capacity,
composition, and quantity of the food ingested. The decrease of pH during gastric
digestion is not only due to the secretion of HCl but also the emptying of the chyme,
which reduced both the amount of digested food in the stomach and its buffering
capacity.
The determination of the volume of acid needed to reach pH 2 and the delivery
of the acid at a constant rate was the simplest and most effective approach. Gastric
acidification can be monitored in real-time by a pH electrode immersed in the solution.
However, it is important to note that there could be fluctuations in the pH inside the
vessel due to the heterogeneity of the sample, the limiting mixing and the emptying
performed during the digestion as illustrated in Figure 3.15. Nevertheless, this
provided close simulation of the stomach environment, in which the acid distribution
is not homogenous, leading to pH gradients (Hila et al., 2006). In particular,
McLauchlan et al. (1989) showed significant differences between the fundus and the
antral regions during fed conditions when the pH values were recorded over 24 hours.
The pH values of the emptied aliquots taken from the bottom were also measured,
which were different from the pH values of the digesta inside the vessel (Figure 3.16).

Chapter 3: Semi-Dynamic Digestion Model
124
Figure 3.15 Example of the fluctuations in pH recording measured in the reaction vessel. The pH record was performed using the pH electrode attached to the pH titrator (Titrando, Metrohm). This graph corresponds to a sample of raw milk used in Chapter 5.
Figure 3.16 Example of the pH profile of some samples (used in Chapter 4), (A) values obtained from inside the simulated stomach by the pH probe attached to the pH titrator and (B) pH values from the emptied aliquots using an external pH meter after the step of mixing with Ultraturrax homogeniser.
3.4.5 Gastric Emptying
The regulation of GE is a complex process which is regulated by factors
including gut hormones and properties of food, e.g. viscosity, consistency, volume,

Chapter 3: Semi-Dynamic Digestion Model
125
particle size and caloric density. There is some evidence that the caloric density may
be the main factor in regulating the rate of GE, a high caloric density inducing
slower/longer GE (Calbet et al., 1997; Moran et al., 1999). The caloric content
delivered to the duodenum is regulated so the nutrient delivery rate, maintained by a
feedback through the release of hormones, in a range from 0.5 to 8 kcal/min (Calbet
et al., 1997; Hunt et al., 1975). This depends on the time range over which this rate is
calculated and the physical state of the gastric content, having an average rate of 2-
3 kcal/min. Brener et al. (1983) reported a constant caloric delivery rate of 2.1
kcal/min, similar to Costill et al. (1974) and Hunt et al. (1985) who reported the mean
rate of caloric emptying of 2.5 kcal/min and Sauter et al. (2011) reporting 1.9 kcal/min.
Moreover, there are studies showing that the type of calories does not seem to play
a critical role (Calbet et al., 1997; Hunt et al., 1975; McHugh et al., 1979). The increase
in meal volume can also increase GE (Moore et al., 1981) but the semi-dynamic model
assumes a fixed volume of 500 mL which was scaled down to be more practical.
Furthermore, the physical state of meal (solid or liquid) has been shown to influence
the GE behaviour (Camilleri et al., 1985; Malagelada et al., 1979). The emptying for
liquids is more rapid following first order exponential kinetics compared to solid meals
in which a biphasic emptying behaviour has been observed. Also, the different
colloidal behaviour in the stomach has been shown to induce changes in emptying
profile (Marciani et al., 2007; Steingoetter et al., 2015).
This complex system of multiple variables cannot be simulated in a simple
model, therefore the most convenient approach was to consider a linear rate of
emptying of 2 kcal/min as an average, which seems a good approximation due to the
ability of the antrum and pylorus to maintain a relatively constant emptying rate.
Similarly, in the DGM, the duration of the gastric phase is based on the caloric content
of the sample. Nevertheless, the semi-dynamic model can also be applied if the
information of the GE (volume and time) from clinical studies is known.
The semi-dynamic gastric model also provides the option of selecting the
number of aliquots to be emptied. Since the aim of the model is to provide kinetic
data, a minimum of 3 points should be considered. As shown in the rest of the
chapters, an emptying protocol using five GE points was performed leading to a
balance between the quality and quantity of data and a practical workload.
The gastric sieving created by the pylorus (Thomas, 2006) is simulated by using
a 2 mm diameter orifice in the selected lab tool used for sampling (e.g. tip, serological
pipette, syringe), see Figure 3.12. It is important to note that by introducing this factor,
the delay in the delivery of solid particles can be more closely simulated to the
situation in vivo. There were some cases in which there was some residue remaining
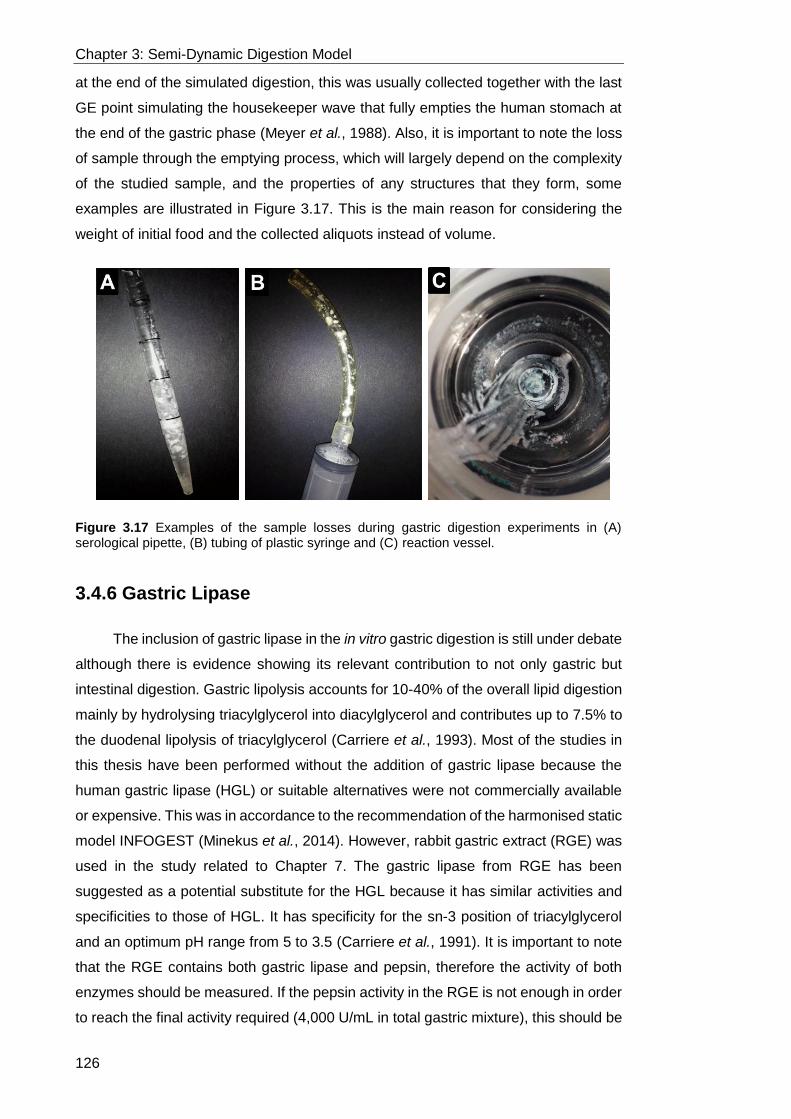
Chapter 3: Semi-Dynamic Digestion Model
126
at the end of the simulated digestion, this was usually collected together with the last
GE point simulating the housekeeper wave that fully empties the human stomach at
the end of the gastric phase (Meyer et al., 1988). Also, it is important to note the loss
of sample through the emptying process, which will largely depend on the complexity
of the studied sample, and the properties of any structures that they form, some
examples are illustrated in Figure 3.17. This is the main reason for considering the
weight of initial food and the collected aliquots instead of volume.
Figure 3.17 Examples of the sample losses during gastric digestion experiments in (A) serological pipette, (B) tubing of plastic syringe and (C) reaction vessel.
3.4.6 Gastric Lipase
The inclusion of gastric lipase in the in vitro gastric digestion is still under debate
although there is evidence showing its relevant contribution to not only gastric but
intestinal digestion. Gastric lipolysis accounts for 10-40% of the overall lipid digestion
mainly by hydrolysing triacylglycerol into diacylglycerol and contributes up to 7.5% to
the duodenal lipolysis of triacylglycerol (Carriere et al., 1993). Most of the studies in
this thesis have been performed without the addition of gastric lipase because the
human gastric lipase (HGL) or suitable alternatives were not commercially available
or expensive. This was in accordance to the recommendation of the harmonised static
model INFOGEST (Minekus et al., 2014). However, rabbit gastric extract (RGE) was
used in the study related to Chapter 7. The gastric lipase from RGE has been
suggested as a potential substitute for the HGL because it has similar activities and
specificities to those of HGL. It has specificity for the sn-3 position of triacylglycerol
and an optimum pH range from 5 to 3.5 (Carriere et al., 1991). It is important to note
that the RGE contains both gastric lipase and pepsin, therefore the activity of both
enzymes should be measured. If the pepsin activity in the RGE is not enough in order
to reach the final activity required (4,000 U/mL in total gastric mixture), this should be
Chapter 3: Semi-Dynamic Digestion Model
127
supplemented with pepsin from porcine origin as performed in Chapter 7. The delivery
of RGE solution can be performed in the semi-dynamic gastric model by the addition
of another syringe pump or a dual channel syringe pump.
3.4.7 Applicability of the Semi-Dynamic Model
The semi-dynamic model can provide valuable data about the extent and rate
of nutrient digestion and in particular it allows the study of the impact of the food
matrix, through structural changes occurring in the stomach, on nutrient
bioaccessibility. In a collaboration with the Spanish research institution, Consejo
Superior de Investigaciones Cientificas (CSIC), in Madrid, Ferreira-Lazarte et al.
(2017) used this model with some modifications to study the effect of prebiotic
carbohydrates on the gastric digestion of milk proteins. Importantly, efforts by the
INFOGEST network have been put into the development of a harmonised version of
this protocol that will provide its use internationally. A consensus manuscript, largely
based on the semi-dynamic model developed during this thesis and described in this
chapter, is currently being prepared and a publication including a detailed protocol will
be released soon. The flow diagram that will be presented in this manuscript is
illustrated in Figure 3.18. Moreover, an inter-laboratory trial on the digestion of SMP
using this model is planned within the INFOGEST network, in a similar way that the
inter-laboratory trial for the static digestion model was performed (Egger et al., 2016).
Figure 3.18. Overview and flow diagram of the simulated semi-dynamic in vitro digestion method included in the consensus manuscript within the INFOGEST network that will be published.
It is important to highlight the limitations and difficulties of an in vitro model of
digestion. Firstly, since one of the main aims was to develop a relatively simple,

Chapter 3: Semi-Dynamic Digestion Model
128
accessible model that could be used in most laboratories, the mixing consists of a
basic stirring system that is not realistically able to simulate the peristalsis occurring
in the stomach. Nevertheless, it reflects more closely the levels of mixing in the
stomach compared to a static model. In the same line, dynamic GE sampling is used,
based on caloric content using the simple approach of the linear GE rate of 2 kcal/min,
which is not altered, for instance, by the physical state of the food and the colloidal
behaviour within the stomach. Moreover, it does not simulate the oral and intestinal
phases as dynamic process. Furthermore, regarding analysis, it is not possible to
know the contribution of protease in the protein content/protein hydrolysis analysis
because the amount of enzyme that is intact or hydrolysed is uncertain. Also, it is
more complex and subjective to handle the samples with regards to the GE and the
data obtained can be more complex to analyse and difficult to interpret.
3.5 Conclusion
Gastric digestion is one of the most important steps for fully understanding the
mechanisms of the kinetics of nutrient digestion, particularly for real food, i.e.
heterogenous and structured foods. Therefore, it is imperative to use relevant in vitro
models that can simulate more closely the gastric environment, particularly where the
structure of the food influences digestion rate. The semi-dynamic model developed in
this thesis can provide more physiologically relevant data in relation to structural
changes of food and nutrient digestion kinetics in an accessible way in terms of cost
and practical simplicity. Nevertheless, it is rather difficult to simulate the overall
physiological conditions in the same precision as it occurs in the human stomach, so
it is important to recognise and account for its limitations. The work of this chapter has
significantly contributed to the development of the harmonised protocol and a related
manuscript has been currently prepared by the INFOGEST network, which will be
published in 2019 to provide laboratories across the world the opportunity to use this
model.

129
Impact of Dairy Proteins and Lipid
formulation on in Vitro Digestion
and ex Vivo Absorption
Chapter 4: Effect of Dairy Formulation
130
4.1 Introduction
There is a growing demand and interest in functional food products, addressed
to the needs of specific populations in order to optimise nutrition and provide more
effective ways of maintaining wellbeing. For instance, the current greater longevity,
causing the growth in population of elderly people aged 80 years and over, has
resulted in considering the relevance of products addressed to healthy aging. This
might help to prevent and/or attenuate sarcopenia, which is a condition of the
progressive loss of skeletal muscle mass with aging, and it is attributed to an
imbalance between muscle protein synthesis (MPS) and breakdown. Food intake and
physical activity are the main stimuli for MPS. With regards to diet, consumption of
proteins/amino acids, in particular Leu, have been seen to be the main stimuli of the
net protein synthesis (Tipton et al., 1999). Apart from protein composition, the amino
acid (AA) availability is significantly driven by the rate of protein digestion, a major
factor for protein deposition (Dangin et al., 2001). Different patterns of postprandial
aminoacidemia resulted in different body protein synthesis, breakdown and oxidation
(Boirie et al., 1997). Therefore, this should be considered as a strategy to exploit in
order to achieve specific uptakes and physiological responses that might benefit
specific population groups.
Milk proteins are considered a high quality protein source taking into account
the essential AA score and protein-digestibility corrected amino acid score
(Schaafsma, 2000). Moreover, they are generally considered a superior source of
protein compared to plant proteins since the latter are less digestible and deficient in
one or more essential AAs and their Leu content is 6-8%, compared to 10-13% in
dairy proteins (Gorissen et al., 2018). The main milk proteins, i.e. caseins and whey
proteins, have been reported to show different postprandial protein kinetics in
humans, which affect the whole body protein metabolism (Boirie et al., 1997). The
ingestion of whey proteins resulted in a high, rapid and transient increased in plasma
AAs promoting protein synthesis without supporting protein breakdown. In contrast,
caseins induced a low, slow and prolonged aminoacidemia profile, which inhibited
body protein breakdown. The Leu balance was positive for the casein drink over 7
hours, promoting protein deposition whereas no effect was provided from whey
protein drink. From this study, whey proteins and caseins were labelled as ‘fast’ and
‘slow’ proteins, respectively, as analogy to the carbohydrate metabolism. Some
studies have shown that faster digestion of whey proteins resulted in an enhancement
of MPS responses in elderly men (Dangin et al., 2003; Pennings et al., 2011; West et
al., 2011) and in elderly men after resistance exercise (Burd et al., 2012). The
coingestion of other macronutrients with dairy proteins is another factor to consider
Chapter 4: Effect of Dairy Formulation
131
that may affect the metabolic responses. Elliot et al. (2006) showed the uptake of AAs,
based on Thr and Phe, was greater for whole milk compared to fat-free milk.
However, the underlying mechanisms of this link between protein structure and
metabolic responses are not well understood. The main milk proteins have different
physico-chemical properties, which are governed by their structure. Caseins have a
relatively open and flexible conformation forming ordered structures known as casein
micelles and are insoluble at pH 4.7. In contrast, whey proteins have globular,
compact structure and are soluble under acidic conditions. Food is subjected to
several digestive conditions within the gastrointestinal (GI) tract and the physico-
chemical properties of food will determine the changes in the different compartments.
Therefore, it is important to understand the interactions of food structures within the
GI tract to underpin the health effects, but this information is still scarce.
There are some studies suggesting the gastric phase as the limiting factor of
some of the metabolic effects observed however its study has been rarely undertaken.
Boirie et al. (1997) suggested that the slow AA absorption behaviour of casein was
due to the coagulation that might occur in the human stomach, which could result in
a longer gastric emptying (GE), delaying the digesta that is delivered into the small
intestine in contrast to the whey proteins that remain soluble and can enter the small
intestine rapidly. Investigation of the food behaviour in the human stomach is complex
and requires advanced techniques such as magnetic resonance imaging or invasive
techniques, which have restrictions in terms of cost and ethics. For that, in vitro
models are usually used to investigate the mechanisms controlling nutrient digestion
within the GI tract. However, static models do not simulate the dynamics of digestion
in the stomach that are of relevance, in particular in milk proteins. For example, in
contrast to what has been suggested in vivo, caseins were reported to be digested
rapidly using a static model (Egger et al., 2017). Therefore, a semi-dynamic model
was developed and used in the present study to simulate the main dynamics of the
human stomach including gradual pH decrease and progressive gastric juice
secretion and emptying.
In this study the hypothesis that the different rates of absorption of the main milk
proteins were governed by the behaviour adopted within the gastric conditions was
tested. Also, the strategy of controlling nutrient uptake by the different rates of nutrient
bioaccessibility was studied. For that, formulations differing in the ratio of whey
proteins and caseins were tested and the influence of the inclusion of lipid in the
protein matrix was also studied. Therefore, the aim of this study was to investigate

Chapter 4: Effect of Dairy Formulation
132
the influence of the native protein structure on the gastric behaviour that could
potentially result in different physiological responses.
4.2 Materials and Methods
4.2.1 Materials
Whey protein isolate (WPI), BiPRO, was purchased from Davisco, Foods
international INC, USA. The protein content was 88.48% (w/w) of dry powder
measured by the Kjeldahl method in duplicate (in-house analytical service). Milk
protein concentrate (MPC), Solmiko® MPC 80, was obtained from Glanbia
Ingredients, Ireland. The protein content was 79.23% (w/w) of dry powder measured
by the Kjeldahl method in duplicate (in-house analytical service). Rapeseed oil was
purchased from a local supermarket (Tesco, Ireland). Deuterated Leu (5,5,5-D3,
99%), D10 Ile (D10, 98%) and Val (D8, 98%) were purchased from from Cambridge
Isotope Laboratories, Inc. (CK Isotopes Ltd., Leicestershire, UK).
4.2.2 Methods
An overview of the experimental planning for this study is illustrated in Figure
4.1.

Chapter 4: Effect of Dairy Formulation
133
Figure 4.1 Schematic representation of the experimental work for Chapter 4.
Chapter 4: Effect of Dairy Formulation
134
4.2.2.1 Preparation of Samples
Table 4.1 shows the content of protein, lipid and total solids of the studied
samples as protein solutions and emulsions. The protein solutions referred to
0C:100W and 80C:20W were prepared at 8% (w/w) protein. The 0C:100W was
prepared by dissolving WPI powder in water using a mixer (IKA Ecrostar, mix speed
700 rpm) with a paddle stirrer for 2 hours at room temperature. The sample 80C:20W
was prepared by dissolving MPC in water using a mixer (IKA Ecrostar, mix speed 700
rpm) with a paddle stirrer for 2 hours at 50°C (using a water bath). Then, an amount
of NaN3 was added (0.02% in the final solution) as anti-microbial agent and the
solutions were stored overnight at 4°C for rehydration. The samples 20C:80W and
50C:50W were prepared freshly by mixing different amounts of 0C:100W and
80C:20W. The 20C:80W sample was prepared by mixing 75% (w/w) of 0C:100W and
25% (w/w) of 80C:20W. The sample 50C:50W was prepared by mixing 37.5% (w/w)
0C:100W and 62.5% (w/w) 80C:20W. The pH of the samples was adjusted at pH 7
using NaOH (2 mol/L).
Samples with lipid inclusion were prepared starting with the preparation of
0C:100W and 80C:20W at 10% protein (w/w) following the same protocol described
previously. Then, the samples 20C:80W and 50C:50W were prepared in the same
manner as described before. Each stock protein solution was mixed with 2% rapeseed
oil and water in order to achieve a final protein concentration of 8% (w/w). These
emulsion samples were named as follows: (0C:100W)2%, (80C:20W)2%,
(50C:50W)2% and (20C:80W)2%. The protein solution of 50C:50W was also used to
obtained emulsions containing 4% and 8% rapeseed oil. The coarse emulsions were
prepared using an Ultra-Turrax (T25 digital, IKA, Germany) at 10,000 rpm for 1 min.
Then, they were processed using a homogeniser (APV 1000, SPX Flow Technology,
Charlotte, North Carolina, USA) at 200 bar with 3 passes. The pH of the samples was
adjusted at pH 7 using NaOH (2 mol/L).
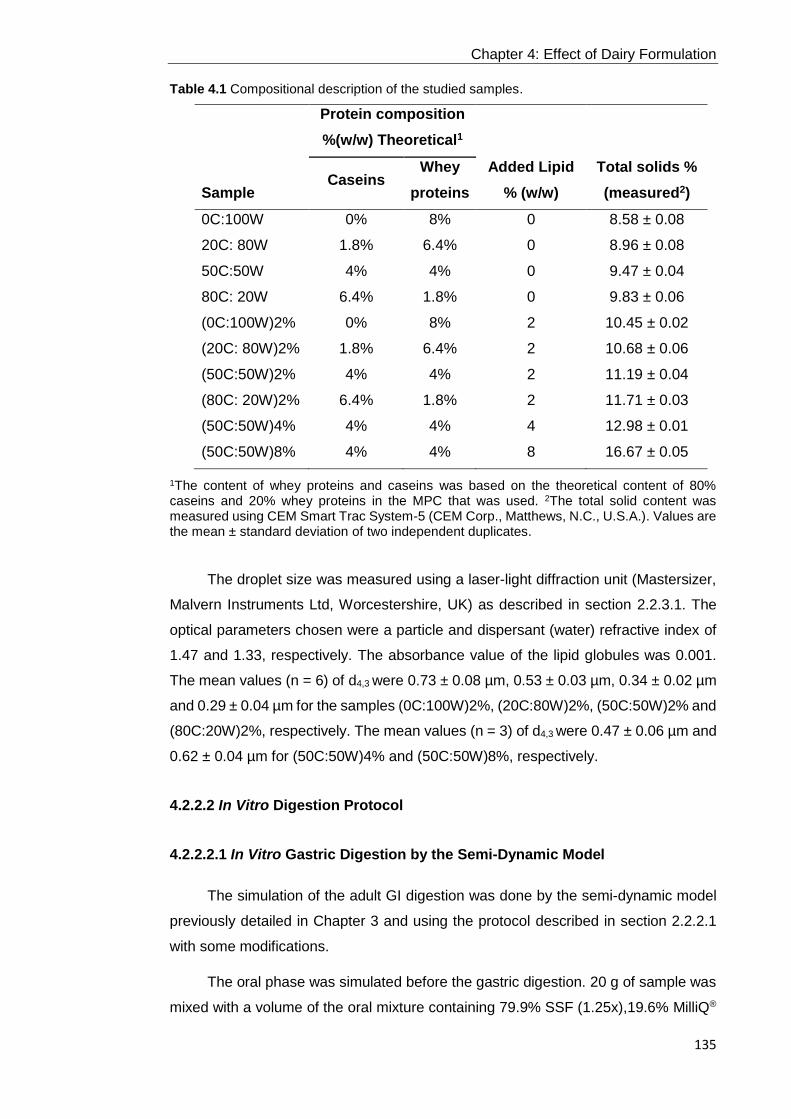
Chapter 4: Effect of Dairy Formulation
135
Table 4.1 Compositional description of the studied samples.
1The content of whey proteins and caseins was based on the theoretical content of 80% caseins and 20% whey proteins in the MPC that was used. 2The total solid content was measured using CEM Smart Trac System-5 (CEM Corp., Matthews, N.C., U.S.A.). Values are the mean ± standard deviation of two independent duplicates.
The droplet size was measured using a laser-light diffraction unit (Mastersizer,
Malvern Instruments Ltd, Worcestershire, UK) as described in section 2.2.3.1. The
optical parameters chosen were a particle and dispersant (water) refractive index of
1.47 and 1.33, respectively. The absorbance value of the lipid globules was 0.001.
The mean values (n = 6) of d4,3 were 0.73 ± 0.08 µm, 0.53 ± 0.03 µm, 0.34 ± 0.02 µm
and 0.29 ± 0.04 µm for the samples (0C:100W)2%, (20C:80W)2%, (50C:50W)2% and
(80C:20W)2%, respectively. The mean values (n = 3) of d4,3 were 0.47 ± 0.06 µm and
0.62 ± 0.04 µm for (50C:50W)4% and (50C:50W)8%, respectively.
4.2.2.2 In Vitro Digestion Protocol
4.2.2.2.1 In Vitro Gastric Digestion by the Semi-Dynamic Model
The simulation of the adult GI digestion was done by the semi-dynamic model
previously detailed in Chapter 3 and using the protocol described in section 2.2.2.1
with some modifications.
The oral phase was simulated before the gastric digestion. 20 g of sample was
mixed with a volume of the oral mixture containing 79.9% SSF (1.25x),19.6% MilliQ®
Sample
Protein composition
%(w/w) Theoretical1
Added Lipid
% (w/w)
Total solids %
(measured2) Caseins
Whey
proteins
0C:100W 0% 8% 0 8.58 ± 0.08
20C: 80W 1.8% 6.4% 0 8.96 ± 0.08
50C:50W 4% 4% 0 9.47 ± 0.04
80C: 20W 6.4% 1.8% 0 9.83 ± 0.06
(0C:100W)2% 0% 8% 2 10.45 ± 0.02
(20C: 80W)2% 1.8% 6.4% 2 10.68 ± 0.06
(50C:50W)2% 4% 4% 2 11.19 ± 0.04
(80C: 20W)2% 6.4% 1.8% 2 11.71 ± 0.03
(50C:50W)4% 4% 4% 4 12.98 ± 0.01
(50C:50W)8% 4% 4% 8 16.67 ± 0.05

Chapter 4: Effect of Dairy Formulation
136
water and 0.5% CaCl2(H2O)2 (0.3 mol/L). The volume of the oral mixture corresponded
to the content of total solids of the sample (Table 4.1) in 20 g. The volume of the oral
mixture varied slightly between samples, ranging from 1.72 to 3.33 mL due to the
difference of the total solid concentration in the analysed samples. The mixing was
performed using a rotator (SB3 Model, Stuart, Bibby Scientific, UK) at 30 rpm for 2
min. The temperature was kept at 37°C using an incubator (BF56, Binder GmbH,
Germany).
The resulting mixture was then put through the gastric digestion using a reaction
vessel, which was a v-form glass vessel (5-70 mL titration vessel, Metrohm,
Switzerland) with thermostat jacket (37°C). The sample from the oral phase was
placed in the reaction vessel after the addition of the basal volume, which consisted
of the 10% of the constituents of SGF (1.25x), MilliQ® water, HCl (1.5 mol/L) and
CaCl2(H2O)2 (0.3 mol/L) from the total volume of the gastric mixture. The total gastric
mixture contained 80% SGF (1.25x), 7% MilliQ® water, 8.7% HCl (1.5 mol/L) and
3.48% pepsin and 0.04% CaCl2(H2O)2 (0.3 mol/L). Two solutions were added at a
constant rate, which depended on the corresponding gastric time: (1) the simulated
gastric electrolyte mixture containing the 90% of the constituents of SGF (1.25x),
MilliQ® water, HCl (1.5 mol/L) and CaCl2(H2O)2 (0.3 mol/L) from the total volume of
the gastric mixture and (2) 0.8 mL pepsin solution (made with MilliQ® water). The
simulated gastric electrolyte mixture of SGF (1.25x), HCl, water and CaCl2(H2O)2 was
delivered by a dosing device (800 Dosino, Metrohm, Switzerland) of an automatic
titrator (842 Titrando, Metrohm, Switzerland) and the enzyme solution was delivered
by a syringe pump (Legato, Kd Scientific, USA). A 3D action shaker (Mini-gyro rocker,
SSM3 Model, Stuart, Barloworld Scientific limited, UK) at 35 rpm was used for
agitating the vessel. Since the amount of oral mixture was slightly different between
the samples due to their composition, the amount of gastric mixture added was
accordingly (see Table 4.2).

Chapter 4: Effect of Dairy Formulation
137
Table 4.2 Total volume of both oral and gastric mixture added in the simulated digestion of each sample.
aThe total oral mixture referred to a mixture of 79.9% SSF (1.25x concentrated), 19.6% MilliQ® water and 0.5% CaCl2(H2O)2 (0.3 mol/L). bThe total gastric mixture contained 80% SGF (1.25x concentrated), 7.78% MilliQ® water and 0.04% CaCl2(H2O)2 (0.3 mol/L), 8.7% HCl (1.5 mol/L) and 3.48% pepsin solution. C The simulated gastric electrolyte mixture represented the 90% of the total gastric mixture of the constituents of SGF (1.25x), MilliQ® water, CaCl2(H2O)2 (0.3 mol/L) and HCl (1.5 mol/L). This was delivered through a dosing device of an automatic titrator, which was programmed according to the total time of digestion and the remaining 10% was firstly added in the reaction vessel to simulate the basal state. dThe volume of 0.8 mL of pepsin solution was added in the gastric digestion of each sample, which was delivered during the corresponding total gastric digestion time.
Gastric emptying (GE) was simulated by taking five aliquots, referred to as GE1-
5 in the text. Samples were taken from the bottom of the vessel using a 10 mL plastic
syringe (BD Plastipak, Ireland), the aperture of which had an inner diameter of 2.5
mm with a plastic tube attached (3.6 mm inner diameter). It is important to note that
in some cases there was some residue left in the last GE point that could not be taken
using that syringe; this was taken using a spatula and included in the last point. The
pH was measured and a sufficient volume of NaOH (2 mol/L) was added to the
samples to increase the pH above 7, inhibiting pepsin activity. Finally, samples were
snap-frozen in liquid nitrogen and stored at -20°C until subsequent intestinal
digestion. A separate gastric digestion was performed in order to study the gastric
restructuring and nutrient delivery. An aliquot (250 μL) of these GE aliquots was used
for microscopy. Then, the sample was mixed using a homogeniser (T10 basic Ultra-
Turrax®, IKA®, Germany) at approximately 30,000 rpm for 30 s to obtain a
homogenous sample for the corresponding analyses.
The simulation of the emptying was based on caloric density. A linear GE rate
of 2 kcal/min, which is considered the average caloric content that is emptied in vivo
Samples
Total Oral
Mixture (mL)a
Gastric Fluids Secretions
Total Gastric
Mixture (mL)b
Delivery Rate of Simulated Gastric
Electrolyte Mixture (mL/min)c
Delivery Rate of pepsin solution (µL/min)d
0C:100W 1.72 21.72 0.24 10.0
20C: 80W 1.79 21.79 0.24 10.0
50C:50W 1.89 21.89 0.24 10.0
80C: 20W 1.97 21.97 0.24 10.0
(0C:100W)2% 2.09 22.09 0.15 6.40
(20C: 80W)2% 2.14 22.14 0.15 6.40
(50C:50W)2% 2.24 22.24 0.15 6.40
(80C: 20W)2% 2.34 22.34 0.15 6.40
(50C:50W)4% 2.60 22.60 0.12 4.70
(50C:50W)8% 3.33 23.33 0.08 3.08
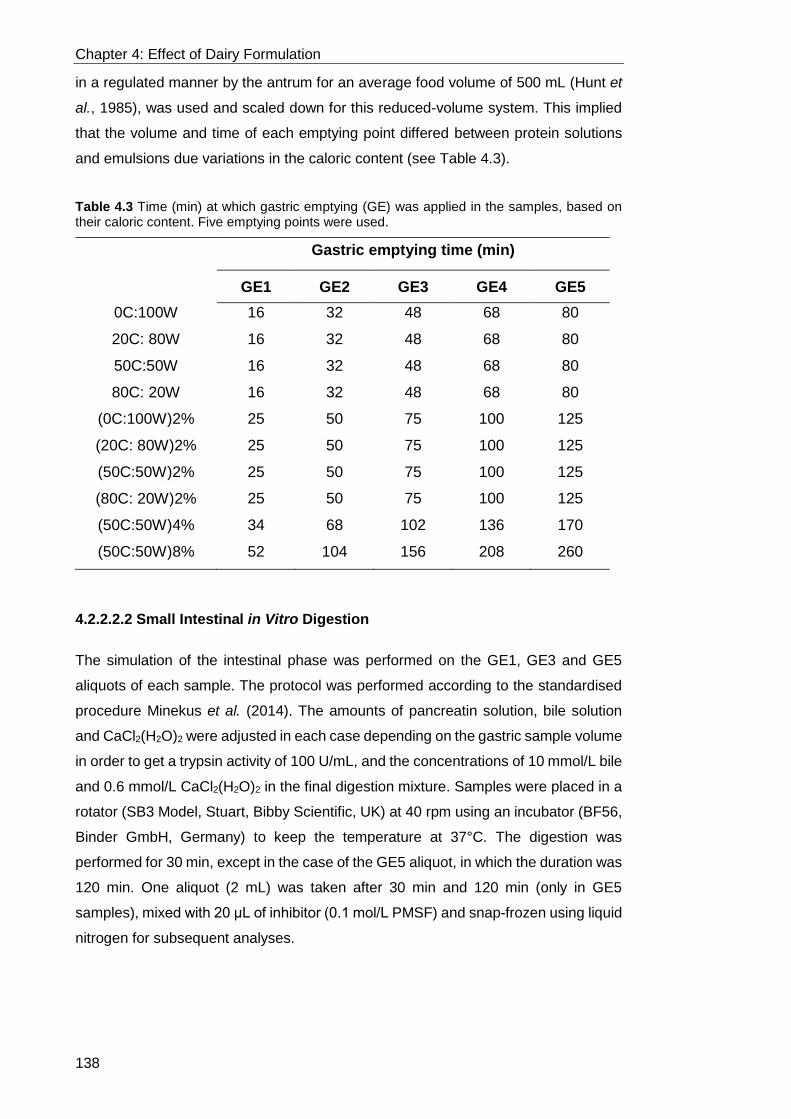
Chapter 4: Effect of Dairy Formulation
138
in a regulated manner by the antrum for an average food volume of 500 mL (Hunt et
al., 1985), was used and scaled down for this reduced-volume system. This implied
that the volume and time of each emptying point differed between protein solutions
and emulsions due variations in the caloric content (see Table 4.3).
Table 4.3 Time (min) at which gastric emptying (GE) was applied in the samples, based on their caloric content. Five emptying points were used.
4.2.2.2.2 Small Intestinal in Vitro Digestion
The simulation of the intestinal phase was performed on the GE1, GE3 and GE5
aliquots of each sample. The protocol was performed according to the standardised
procedure Minekus et al. (2014). The amounts of pancreatin solution, bile solution
and CaCl2(H2O)2 were adjusted in each case depending on the gastric sample volume
in order to get a trypsin activity of 100 U/mL, and the concentrations of 10 mmol/L bile
and 0.6 mmol/L CaCl2(H2O)2 in the final digestion mixture. Samples were placed in a
rotator (SB3 Model, Stuart, Bibby Scientific, UK) at 40 rpm using an incubator (BF56,
Binder GmbH, Germany) to keep the temperature at 37°C. The digestion was
performed for 30 min, except in the case of the GE5 aliquot, in which the duration was
120 min. One aliquot (2 mL) was taken after 30 min and 120 min (only in GE5
samples), mixed with 20 μL of inhibitor (0.1 mol/L PMSF) and snap-frozen using liquid
nitrogen for subsequent analyses.
Gastric emptying time (min)
GE1 GE2 GE3 GE4 GE5
0C:100W 16 32 48 68 80
20C: 80W 16 32 48 68 80
50C:50W 16 32 48 68 80
80C: 20W 16 32 48 68 80
(0C:100W)2% 25 50 75 100 125
(20C: 80W)2% 25 50 75 100 125
(50C:50W)2% 25 50 75 100 125
(80C: 20W)2% 25 50 75 100 125
(50C:50W)4% 34 68 102 136 170
(50C:50W)8% 52 104 156 208 260

Chapter 4: Effect of Dairy Formulation
139
4.2.2.2.3 Ex Vivo Absorption by Ussing Chamber Technique
The Ussing chamber methodology was used to investigate the kinetics of AA
absorption of different milk protein-based formulation. A further description of this
technique can be seen in section 2.2.2.3. This technique was applied in selected
samples previously digested using the semi-dynamic gastric model. These were the
first and last GE points, i.e. GE1 and GE5 points of each sample, using two replicates
from individual gastric digestions. Therefore, two independent samples of each GE
point and sample were used.
4.2.2.2.4 Intestinal Tissue Samples
All animal protocols were approved by local ethical review committees and
conformed to relevant national guidelines (University of Leeds, Leeds, UK). Intestinal
tissue sections were obtained from 6 to 8-week-old male/female mice (strain
C578L/6). The animals had free access to water and usual meal any time before the
collection. Mice were euthanized by cervical dislocation. The whole length of the
digestive tract was collected and transported in a tube containing 10 mmol/L glucose
solution in an ice-cold bag.
4.2.2.2.5 Ussing Chamber Set up and Sampling
A jejunum section was taken and cut longitudinally along the mesenteric
attachment. The section was washed with 10 mmol/L glucose solution and most of
the muscular layer was stripped away with fine forceps. The tissue segment was
mounted on the slider (P2404, Physiologic Instruments), which was placed in an
Ussing chamber (EM-CSYS-4 system EasyMount with P2400 chamber). Up to three
segments from each animal were used. The active epithelial surface area of each
segment was 0.25 cm2.
Both sides of the Ussing chambers were filled with Ringer solution containing
120 mmol/L NaCl, 3 mmol/L KCl, 23 mmol/L NaHCO3, 0.5 mmol/L MgCl2, 1.25 mmol/L
CaCl2 and 10 mmol/L mannitol, according to Brighton et al. (2015). The apical and
basolateral sides were filled with Ringer solution with 10 mmol/L mannitol and 10
mmol/L glucose, respectively. The system was maintained at 37°C with continuous
bubbling using 5% CO2/95% O2 (v/v).
The voltage and resistance were continuously monitored to evaluate the viability
of the tissue using DVC-1000 (WPI Instruments) multichannel computer-controlled
voltage clamp unit. This was performed with the use of Ag/AgCl electrodes and 150

Chapter 4: Effect of Dairy Formulation
140
mmol/L NaCl agarose (previously prepared). The recordings were collected using
Spike2 8.08 software.
After the slider with the tissue was placed in the Ussing chamber, the system
was allowed to equilibrate for 30 min. During this period, the voltage and resistance
values were monitored over time. After the equilibration, the solutions from both sides
were removed. The apical side was refilled with the sample and the basolateral side
was refilled with 1 mL of fresh Ringer solution containing 10 mmol/L glucose.
The sample placed in the apical side of the Ussing chamber was aimed to
simulate an in situ intestinal digestion while diffusion took place. For that, an aliquot
from gastric digestion was quickly mixed with bile solution, water, CaCl2(H2O)2 and
pancreatin solution. The proportions used were according to the standardised
INFOGEST static protocol for small intestinal digestion (Minekus et al., 2014), in order
to achieve 100 U/mL of pancreatin (based on trypsin activity), 0.6 mmol/L CaCl2(H2O)2
and 10 mmol/L of bile, in the final digestion mixture. A volume of this mixture was
mixed with Ringer solution (10x concentrated) and mannitol (100 mmol/L) to achieve
a final concentration of 10 mmol/L in the sample that was finally placed in the apical
side of the Ussing chamber.
An aliquot of 100 µL was taken from both apical and basolateral at 5, 30 and 60
min and the same volume was replaced with fresh Ringer solution containing 10
mmol/L mannitol and glucose accordingly. The aliquots collected were mixed with 100
µL of 24% TCA to stop protease activity and stored at -20°C for further analysis.
During the experiment, both voltage and current values were monitored every 10 min
and the resistance was calculated. At the end of the experiment, a mixture of foskolin
and 3-isobutyl-1-methylxanthine was added (final concentration of 10 µmol/L and 100
µmol/L, respectively) to both apical and basolateral sides, which should cause a
substantial increase in potential difference if the integrity of the tissue is satisfactory.
Experiments that did not show a clear increase were repeated. Two Ussing chambers
were used simultaneously each experimental day using the tissue sections of one
mouse. The two GE points, i.e. GE1 and GE5 of each sample were usually assessed
each day.
4.2.2.3 Confocal Laser Scanning Microscopy
The microstructure of the initial and the emptied aliquots from the semi-dynamic
gastric digestion was observed by confocal laser scanning microscopy (CLSM) using
a Leica TCS SP5 microscope (Leica Microsystems, Baden-Württemberg, Germany),
as described in section 2.2.3.3. A dye mixture of Fast green FCF solution (0.1% made
Chapter 4: Effect of Dairy Formulation
141
with water) and Nile red (0.1% made with propanediol) solution at 1:3 proportion was
used. 250 µL of initial/digested sample was gently mixed with 25 µL of mixed dye.
4.2.2.4 Texture Analysis of Gastric Digesta
Some indication of the consistency with regards to the strength of the coagulum
formed during semi-dynamic gastric digestion was assessed using a texture analyser
(TA.XT Plus, Stable Micro Systems). For that, additional gastric digestions were
performed but stopping the run at GE2 time and the vessel of reaction was
immediately placed in the texture analyser instrument. The digesta was compressed
by a cylindrical stainless-steel probe (6 mm diameter) until the distance of the probe
inside the coagulum was 10 mm. The test was run at a speed of 1.0 mm/s and the
trigger force was 1 g. Five measurements were made for the same digesta sample
and three independent gastric digestions were performed. The value of strength, i.e.
the maximum force, in each measurement was obtained from the force-time curve of
the texture profile (see section 2.2.3.2).
4.2.2.5 Total Protein and Lipid Content Analysis
The protein and lipid content of the initial sample and the emptied aliquots was
determined using a LECO FP628 Protein analyser and CEM Smart Trac System-5
and a SMART Trac Rapid Fat Analyzer, respectively. Details of these techniques have
been described in sections 2.2.4.1 and 2.2.5.1. Each sample was measured twice
and each measurement was carried out in in three independent replicates.
4.2.2.6 Quantification of Protein Hydrolysis
The spectrophotometric assay o-phthalaldehyde (OPA) described in 2.2.4.3
was used for the quantification of the free amino groups released during digestion.
The absorbance was measured at 340 nm using a multi-mode microplate reader,
Synergy™ HT (BioTek® Instruments, Inc., Winooski, VT). Each sample was measured
twice and each measurement was carried out in three independent replicates.
4.2.2.7 Protein Identification in Emptied Digesta
Sodium dodecyl sulphate-polyacrylamine gel electrophoresis (SDS-PAGE)
which is described in the section 2.2.4.2 was used to determine protein composition.
SDS-PAGE was performed on the initial and digested samples previously diluted
(1:100) with water.

Chapter 4: Effect of Dairy Formulation
142
4.2.2.8 Cation Exchange Chromatography for Amino Acid Analysis
The analysis was performed on samples from the semi-dynamic gastric (G1, G3
and G5) and static intestinal digestion (G1I, G3I, G5I and G5I120). The samples were
pretreated before AAs analysis. An aliquot of sample (750 μL) was mixed with 750 μL
24% (w/v) TCA, which removed higher molecular weight proteins from the matrix.
Then, the mixture was centrifuged at 14,000 rpm for 10 min. Ninhydrin derivatization
with norvaline was used as an internal standard. The analysis was performed using a
Jeol JLC-500/V AminoTac™ amino acid analyser fitted with a Jeol Na+ high-
performance cation-exchange column (Joel Ltd., Garden city, Herts, UK). The
chromatography analysis was performed by Anne Marie McAuliffe from the Technical
Services Lab in Moorepark Teagasc Food Research Centre (Ireland). Further details
of this method can be seen in the section 2.2.4.4.
4.2.2.9 Liquid Chromatography coupled to Tandem Mass Spectrophotometry
for Amino Acid Analysis
The branch chain AAs (BCAAs), i.e. Leu, Ile and Val, were detected and
quantified by LC-MS/MS (described in the section 2.2.4.4) on the samples from the
Ussing chamber experiments, both apical and basolateral sides.
A mixture of Leu, Ile and Val standard was used for the calibration ranging from
0.31 to 10 µmol/L. Internal standard consisted of 5 µmol/L of each Leu (5,5,5-D3,
99%), D10 Ile (D10, 98%) and Val (D8, 98%). 10 µL of this internal standard was
added to 50 µL of each concentration standard or sample. After centrifugation (13,300
rpm, 4°C for 10 min), sample was transfer to HPLC vials for LC-MS/MS analysis.
Agilent 6490 Triple Quad MS mass spectrometer equipped with an Agilent 1290
HPLC system (Agilent Technologies, Santa Clara, CA, USA) was used. The method
for the separation of amino acids was adapted from Nemkov et al. (2015). The LC
flow rate was 0.78 mL/min. The column used for the analysis was Phenomenex
Kinetex XB-C18 2.6 m (150 x 4.6 mm) column. The column temperature and auto
sampler were maintained at 25°C and 4°C, respectively. 1 µL was used for the
injection volume. The samples were analysed using 0.1% formic acid in water (mobile
phase A) and 0.1% formic acid in 100% acetonitrile (mobile phase B). The isocratic
elution was 5% mobile phase B and 95% mobile phase B. The run time was 6 min.
The 6490 MS/MS system was equipped with an electrospray ionization (ESI)
source operated in positive-ion detection mode. Nitrogen gas was used for nebulation,
desolvation, and collision. The analytes were monitored in multiple-reaction
monitoring (MRM) mode. The MRM precursor, product ions and collision energy were

Chapter 4: Effect of Dairy Formulation
143
optimized by Agilent optimizer software. The transitions of precursor ions to product
ions (m/z) and some optimized MS operating parameters of the analyte are described
in Appendix A. The source parameters were: gas temperature of 200°C with a gas
flow of 16 L/min, a sheath gas temperature of 300°C with a sheath gas flow of 11
L/min, a nebuliser pressure of 50 psi and capillary voltage of 3500 V for positive
polarity, Nozzle Voltage 1000 V. The iFunnel parameters were: high pressure radio
frequency of 150 V and low-pressure radio frequency of 60 V. The LC eluent flow was
sprayed into the mass spectrometer interface without splitting. Identification was
achieved based on retention time of authentic amino acid standards and product
ions.
The quantification was done by the MassHunter Quantitative B.06 Workstation
software (Agilent Technologies, CA, US). Calibration curves were obtained by using
authentic standards (Leu, Ile and Val) containing deuterated Leu, Ile and Val mixture
as internal standard. The ratio of analyte and internal standard peak area was plotted
against the corresponding concentration (0-10 µmol/L) to obtain the calibration curve.
In the analysed samples, the peak area ratio (peak area of analyte/peak area of the
internal standard). was calculated and applied to the calibration curve to obtain the
concentration of each AA.
4.2.3 Statistical Analysis
The results were expressed as mean ± standard deviation of three independent
replicates unless otherwise stated. To identify differences in normally distributed
results within groups during gastric digestion, one-way ANOVA was applied. Where
overall significant interaction was observed (p < 0.05), the means of individual
formulations were compared using Tukey’s post hoc test. Statistical analyses were
performed using GraphPad Prism software (Prism 5 for Windows, Version 5.04).
4.3 Results
4.3.1 Gastric pH of the Emptied Digesta
The pH of the emptied gastric aliquots during the semi-dynamic gastric digestion from
all the samples is shown in Figure 4.2. In general, they followed a predefined curve,
in which there was a low pH before the gastric digestion simulating the basal stage,
then the pH increased up to values around 6 and decreased progressively during
gastric digestion reaching values of about 2. There were significant differences, in

Chapter 4: Effect of Dairy Formulation
144
particular in the case of the sample 80C:20W, in which the pH was lower at 32 min
compared to the other samples (Figure 4.2 A). Also, the samples containing higher
casein content, i.e. 50C:50W and 80C:20W, had slight pH increase at the end of the
digestion. A similar trend was observed in the samples when 2% lipid was added
(Figure 4.2 B), although the profile of the sample (50C:50W)2% was more similar to
the samples containing higher content in whey proteins, in particular in the end point.
Figure 4.2 C compares the effect of lipid in samples with the same protein
composition, i.e. C:W ratio of 1. It can be observed that the pH decrease in
(50C:50W)8% was lower and slower during the gastric digestion time when compared
to the other samples, in particular when lipid was not included. This could be partly
due to the longer residence time, having lower secretion rate, in the simulated
stomach as observed in Figure 4.2 D, giving it more chance to be mixed.
Figure 4.2. Change in pH during gastric digestion using the semi-dynamic model, measured in the emptied aliquots, of (A) protein solution samples, (B) emulsion samples with 2% lipid, (C) samples with C:W ratio of 1 (i.e. formulation 50C:50W) containing 0%, 2%, 4% and 8% lipid in the emptied aliquots expressed as function of the GE points, and (D) same pH values than in graph (C) but expressed as function of the actual gastric digestion time. Gastric digestion time is as indicated in A, B and D graphs and the time before the start of the digestion (-20 min) corresponds to the basal stage. In C, the pH values are referred to the basal stage (before gastric digestion), initial (t=0, sample including oral phase and basal volumes) and the different GE samples (GE1-GE5) corresponding to each gastric emptying (GE) point. The time values are displayed in Table 4.3. Values are presented as means ± SD (n=6). Significance difference in pH between samples in each GE point was determined by one-way ANOVA, p ≤ 0.05 (*), p ≤ 0.01 (**), p ≤ 0.001 (***) and p ≤ 0.0001 (*****).
4.3.2 Gastric Behaviour
Figure 4.3 shows the gastric behaviour of the protein solution samples at the
corresponding time points of GE1, GE3 and GE5. In general, all the samples
Chapter 4: Effect of Dairy Formulation
145
presented protein aggregation within the first 10 min of gastric digestion. However,
the aggregates in samples 0C:100W and 20C:80W that were initially dispersed within
the vessel were progressively solubilised. During digestion time, they tended to form
a layer in the bottom part of the vessel with a clear top part, resulting in a completely
clear solution at the end of the gastric digestion. The extent of this aggregation was
visually larger in the case of 20C:80W as seen in Figure 4.3 F, and the clear solution
was obtained later on in the gastric digestion when compared to the 0C:100W sample.
In contrast, the initial aggregates formed within the vessel in the samples 50C:50W
and 80C:20W were insoluble, which led to the formation of firm and compact coagula
located at the bottom of the vessel, similar to mozzarella cheese in texture, and a
clear layer at the top part. However, according to visual observations, the formation
of that compact coagula in the case of 50C:50W tended to be slightly later and having
a more particulate consistency compared with the sample 80C:20W. The digesta of
the samples obtained at the corresponding GE2 time displayed in a petri dish can be
observed in Figure 4.3 M-P, illustrating the range of structures obtained in the gastric
phase.

Chapter 4: Effect of Dairy Formulation
146
Figure 4.3 Gastric behaviour of the protein solution samples displayed in the vessel of the gastric model at 16, 48 and 80 min, corresponding to the GE1, GE3 and GE5 time points, respectively. Figures from M to P correspond to the gastric behaviour displayed in a petri dish at 32 min (GE2 time point). The images correspond to the behaviour immediately before emptying.

Chapter 4: Effect of Dairy Formulation
147
Similar gastric behaviour was observed in the samples when 2% lipid was
included, which is illustrated in Figure 4.4. There was visible protein aggregation
within the first 10 min of gastric behaviour, similar to the behaviour observed in the
protein solution samples. The aggregates in the samples (0C:100W)2% and
(20C:80W)2% were being dissipated during the progress of gastric digestion,
resulting in the formation of cloudy and clear layers at the bottom and top,
respectively. However, in the emulsion (20C:80W)2%, the aggregates were more
persistent as seen in Figure 4.4 F and the height of the cloudy layer was larger at the
end of the digestion. This contrasted to the behaviour of the samples with higher
casein content, i.e. (50C:50W)2% and (80C:20W)2%, which resulted in compact
coagulation with a clear layer at the top of the vessel after the initial protein
aggregation. However, according to visual observations, the compact coagula was
formed earlier in the sample (50C:50W)2% and it was more particulate with a softer
consistency, having a larger serum layer in the top of the reaction vessel, when
compared to the sample (80C:20W)2%. The closer visualisation of the digesta
obtained at the corresponding GE2 time (see Figure 4.4 M-P) illustrates that the
inclusion of lipid reduced the firmness of the coagulum, in particular for (50C:50W)2%.
Also, the aggregates formed in (20C:80W)2% were smaller compared to those
obtained when lipid was not added.

Chapter 4: Effect of Dairy Formulation
148
Figure 4.4 Gastric behaviour of the emulsion samples displayed in the vessel of the gastric model at 25, 75 and 125 min, corresponding to the GE1, GE3 and GE5 time points, respectively. Figures from M to P correspond to the gastric behaviour displayed in a petri dish at 50 min (GE2 time point). The images correspond to the behaviour immediately before emptying.

Chapter 4: Effect of Dairy Formulation
149
The increase of lipid in the formulation within the same protein C:W ratio of 1,
i.e. formulation 50C:50W, did not visibly affect the behaviour during the gastric
digestion (Figure 4.5) when compared with the corresponding sample without lipid.
However, it was observed that the inclusion of lipid reduced the firmness of the
coagulum, in particular for the sample with the highest lipid content. Indeed, more
particulate coagula with a tendency to cream could be seen in the case of
(50C:50W)8% (see Figure 4.5 F). The reduced firmness could be seen in the digesta
at GE2 time displayed in Figure 4.5 H, showing the greater number of particles of
different sizes, when compared with the same digesta without lipid (Figure 4.3 O).
Figure 4.5 Gastric behaviour of emulsion samples with higher lipid content (4% and 8%) displayed in the vessel of the gastric model at GE1, GE3 and GE5 points. Figures G and H correspond to the gastric behaviour displayed in a petri dish at 68 and 104 min (GE2 time point). The images correspond to the behaviour immediately before emptying.

Chapter 4: Effect of Dairy Formulation
150
4.3.3 Consistency of the Gastric Coagula
The strength of the coagula was tested in the samples in which these structures
were formed, i.e. 50C:50W, 80C:20W, (50C:50W)2%, (80C:20W)2%, (50C:50W)4%
and (50C:50W)8% and the analysis was performed on the digesta corresponding to
GE2 time (Figure 4.6). However, the value corresponding to the sample
(50C:50W)8% could not be measured because the strength of the coagula was below
the limit of the detection of the instrument. From the compression test, the sample
80C:20W presented the highest value of force accounting for 22.8 g whereas the
weakest coagula were obtained in the sample with the highest lipid content tested,
i.e. (50C:50W)4%, resulted in a value of 2.25 g. The results showed that the addition
of lipid significantly affected the strength of the milk sample (80C:20W) coagula, more
than for the samples containing C:W ratio of 1, i.e. 50C:50W.
Figure 4.6 B shows that there was a greater extent of decrease in coagula
consistency in the samples with C:W ratio of 4 when lipid was added compared to the
samples with C:W ratio of 1, in which the decline of the coagula strength was much
less strongly affected.
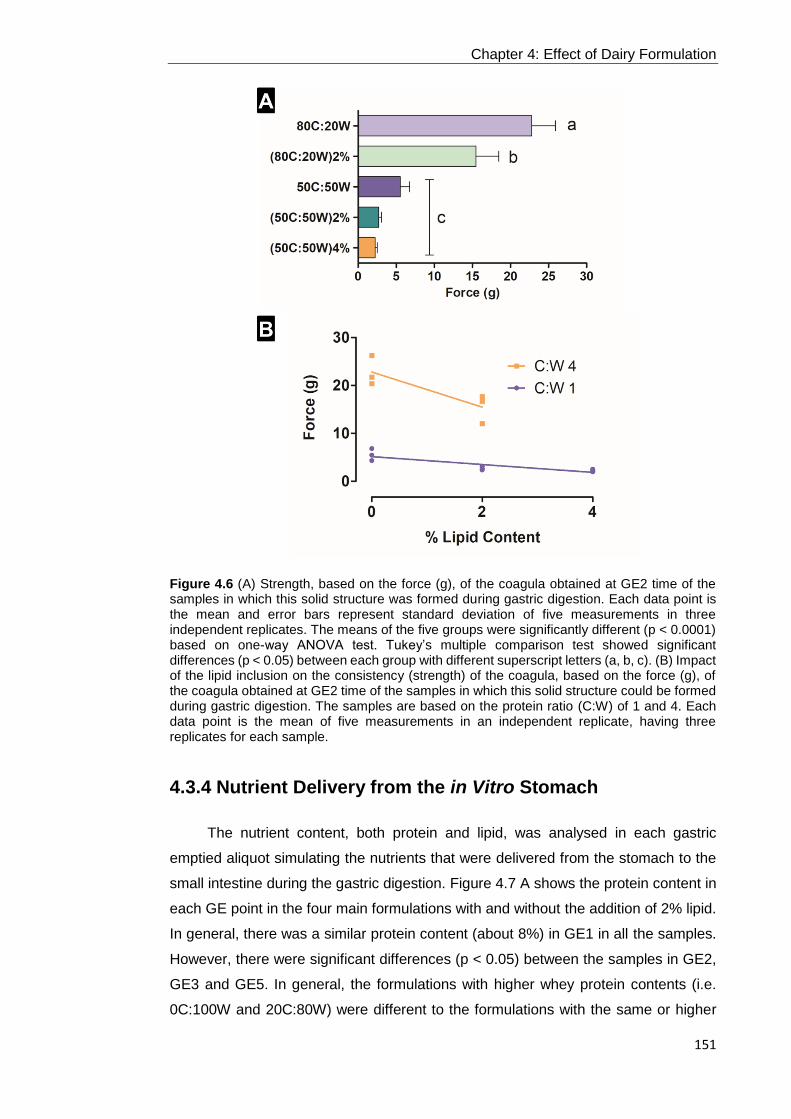
Chapter 4: Effect of Dairy Formulation
151
Figure 4.6 (A) Strength, based on the force (g), of the coagula obtained at GE2 time of the samples in which this solid structure was formed during gastric digestion. Each data point is the mean and error bars represent standard deviation of five measurements in three independent replicates. The means of the five groups were significantly different (p < 0.0001) based on one-way ANOVA test. Tukey’s multiple comparison test showed significant differences (p < 0.05) between each group with different superscript letters (a, b, c). (B) Impact of the lipid inclusion on the consistency (strength) of the coagula, based on the force (g), of the coagula obtained at GE2 time of the samples in which this solid structure could be formed during gastric digestion. The samples are based on the protein ratio (C:W) of 1 and 4. Each data point is the mean of five measurements in an independent replicate, having three replicates for each sample.
4.3.4 Nutrient Delivery from the in Vitro Stomach
The nutrient content, both protein and lipid, was analysed in each gastric
emptied aliquot simulating the nutrients that were delivered from the stomach to the
small intestine during the gastric digestion. Figure 4.7 A shows the protein content in
each GE point in the four main formulations with and without the addition of 2% lipid.
In general, there was a similar protein content (about 8%) in GE1 in all the samples.
However, there were significant differences (p < 0.05) between the samples in GE2,
GE3 and GE5. In general, the formulations with higher whey protein contents (i.e.
0C:100W and 20C:80W) were different to the formulations with the same or higher

Chapter 4: Effect of Dairy Formulation
152
casein content (i.e. 50C:50W and 80C:20W), in particular at GE5 accounting for 14.14
and 17.25% w/w protein respectively. In GE2 and GE3, the protein released was
higher in formulations 0C:100W and 20C:80W than that in formulations 50C:50W and
80C:20W whereas an opposite trend could be observed in GE5. Moreover, the pattern
of the nutrient released of the formulations was not influenced by the inclusion of 2%
lipid, with the exception to the formulation (50C:50W)2% at GE5 that presented
significant differences (p < 0.05). Comparing the different inclusions of lipid in the
same C:W ratio of 1 (Figure 4.7 B), the protein delivery was relatively constant during
the first four GE points and then there was a slight increase. There were significant
differences in GE1 and, in particular, GE5, in which the protein content for the non
lipid added sample (i.e. 50C:50W) was higher than the rest, which could be related to
the higher extent of coagulation.
Figure 4.7 The protein content (w/w, %) of the gastric emptying points (GE1-GE5) of (A) protein solution and emulsion samples, and (B) comparison of the different lipid inclusion in the same protein composition matrix, C:W ratio of 1. Values are presented as means ± SD (n=3). The values were corrected by the different gastric dilution in each point. Mean values within a column with different superscript letters (a, b, c) were significantly different (p < 0.05).

Chapter 4: Effect of Dairy Formulation
153
The pattern of lipid delivery for the emulsion samples with 2% lipid (Figure 4.8
A) showed similar delivery of lipid in GE1 but a different progression during the gastric
digestion time, in particular at GE2 and GE5. In GE2, the lipid delivery was higher in
the samples (0C:100W)2% and (20C:80W)2% accounting for 1.60 and 1.76%
respectively when compared to (50C:50W)2% and (80C:20W)2% representing 0.59
and 0.22% (w/w) lipid, respectively. In contrast, a higher lipid delivery was observed
in GE5 for (50C:50W)2% and (80C:20W)2% accounting for 4.43 and 4.84% (w/w)
lipid, respectively, suggesting the involvement of lipid in the protein coagulum. Figure
4.8 B shows the comparison of the different lipid concentrations using the same
protein formulation, C:W ratio of 1. In general, the pattern of lipid delivery was similar
to the pattern of protein delivery in the 50C:50W sample alone (Figure 4.7), thus the
pattern of lipid delivery was controlled by or linked to the protein composition.
Figure 4.8 The lipid content (w/w, %) of the gastric emptying points (GE1-GE5) of (A) emulsion samples of 2% lipid, and (B) comparison of the different lipid inclusion in the same protein composition matrix, C:W ratio of 1. Values are presented as means ± SD (n=3). The values were corrected by the different gastric dilution in each point. Mean values within a column with different superscript letters (a, b, c) were significantly different (p < 0.05).
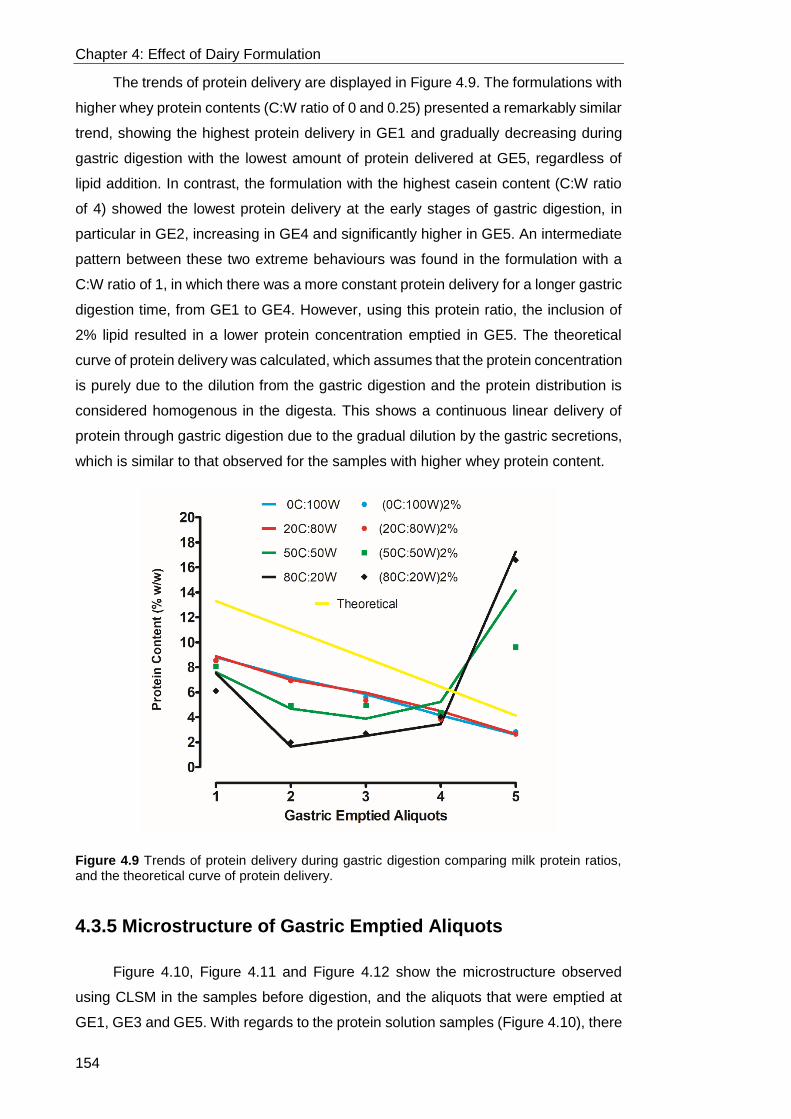
Chapter 4: Effect of Dairy Formulation
154
The trends of protein delivery are displayed in Figure 4.9. The formulations with
higher whey protein contents (C:W ratio of 0 and 0.25) presented a remarkably similar
trend, showing the highest protein delivery in GE1 and gradually decreasing during
gastric digestion with the lowest amount of protein delivered at GE5, regardless of
lipid addition. In contrast, the formulation with the highest casein content (C:W ratio
of 4) showed the lowest protein delivery at the early stages of gastric digestion, in
particular in GE2, increasing in GE4 and significantly higher in GE5. An intermediate
pattern between these two extreme behaviours was found in the formulation with a
C:W ratio of 1, in which there was a more constant protein delivery for a longer gastric
digestion time, from GE1 to GE4. However, using this protein ratio, the inclusion of
2% lipid resulted in a lower protein concentration emptied in GE5. The theoretical
curve of protein delivery was calculated, which assumes that the protein concentration
is purely due to the dilution from the gastric digestion and the protein distribution is
considered homogenous in the digesta. This shows a continuous linear delivery of
protein through gastric digestion due to the gradual dilution by the gastric secretions,
which is similar to that observed for the samples with higher whey protein content.
Figure 4.9 Trends of protein delivery during gastric digestion comparing milk protein ratios, and the theoretical curve of protein delivery.
4.3.5 Microstructure of Gastric Emptied Aliquots
Figure 4.10, Figure 4.11 and Figure 4.12 show the microstructure observed
using CLSM in the samples before digestion, and the aliquots that were emptied at
GE1, GE3 and GE5. With regards to the protein solution samples (Figure 4.10), there
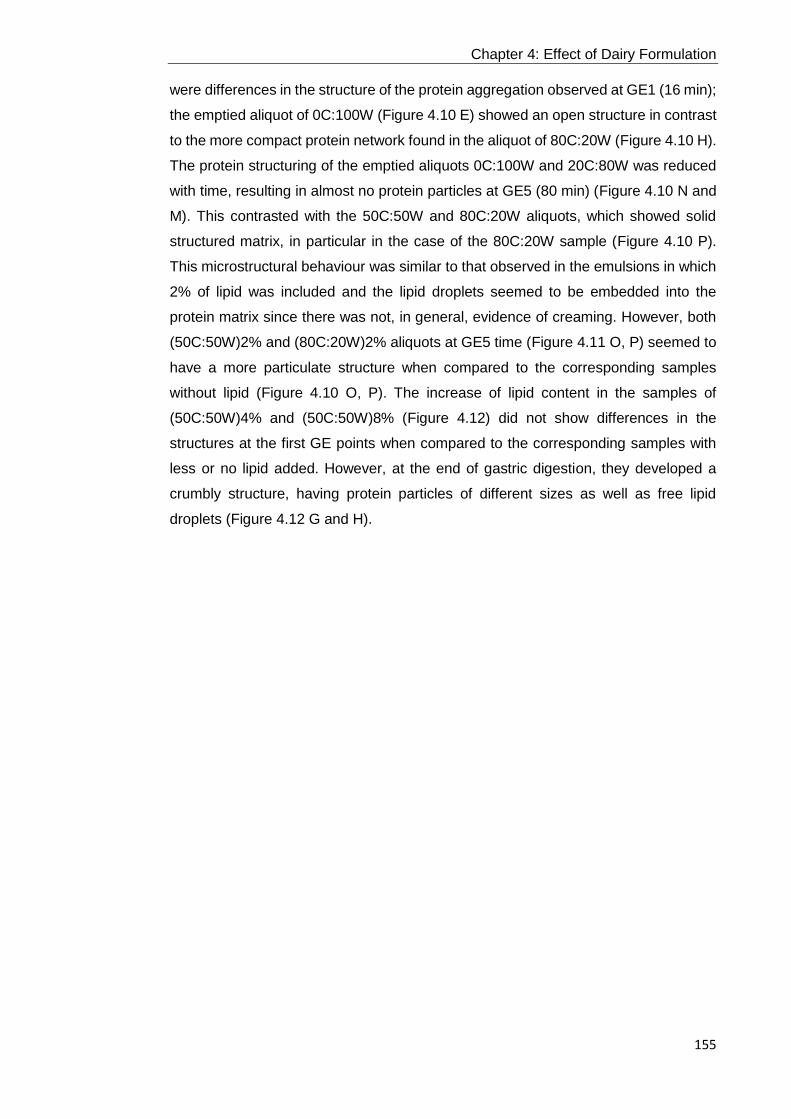
Chapter 4: Effect of Dairy Formulation
155
were differences in the structure of the protein aggregation observed at GE1 (16 min);
the emptied aliquot of 0C:100W (Figure 4.10 E) showed an open structure in contrast
to the more compact protein network found in the aliquot of 80C:20W (Figure 4.10 H).
The protein structuring of the emptied aliquots 0C:100W and 20C:80W was reduced
with time, resulting in almost no protein particles at GE5 (80 min) (Figure 4.10 N and
M). This contrasted with the 50C:50W and 80C:20W aliquots, which showed solid
structured matrix, in particular in the case of the 80C:20W sample (Figure 4.10 P).
This microstructural behaviour was similar to that observed in the emulsions in which
2% of lipid was included and the lipid droplets seemed to be embedded into the
protein matrix since there was not, in general, evidence of creaming. However, both
(50C:50W)2% and (80C:20W)2% aliquots at GE5 time (Figure 4.11 O, P) seemed to
have a more particulate structure when compared to the corresponding samples
without lipid (Figure 4.10 O, P). The increase of lipid content in the samples of
(50C:50W)4% and (50C:50W)8% (Figure 4.12) did not show differences in the
structures at the first GE points when compared to the corresponding samples with
less or no lipid added. However, at the end of gastric digestion, they developed a
crumbly structure, having protein particles of different sizes as well as free lipid
droplets (Figure 4.12 G and H).

Chapter 4: Effect of Dairy Formulation
156
Figure 4.10 Examples of confocal microscopy images of the protein solution samples before digestion (0 min) and, at 16 min (GE1), 48 min (GE3) and 80 min (GE5) of gastric digestion in the gastric emptied aliquots. Green shows the protein. The scale bar corresponds to 100 µm.
Chapter 4: Effect of Dairy Formulation
157
Figure 4.11 Examples of confocal microscopy images of the emulsion samples before digestion (0 min) and, at 25 min (GE1), 75 min (GE3) and125 min (GE5) of gastric digestion in the gastric emptied aliquots. Green shows the protein and red shows the lipid. The scale bar corresponds to 100 µm, except N in which it corresponds to 50 µm.

Chapter 4: Effect of Dairy Formulation
158
Figure 4.12 Examples of confocal microscopy images of the 50C:50W emulsion samples containing higher lipid content (4% and 8%) before digestion (0 min) and, at GE1, GE3 and GE5 in the gastric emptied aliquots. Green shows the protein and red shows the lipid. The scale bar corresponds to 100 µm.
4.3.6 Protein Composition of Gastric Emptied Aliquots
The protein composition of the gastric emptied aliquots was also studied by
SDS-PAGE, illustrating qualitatively the composition of the main milk proteins that
reach the small intestine (Figure 4.13). The bands of the main milk protein, casein
and whey proteins, in the samples before digestion (referred to I) did reflect the
different protein formulation in relation to C:W ratio. For instance, the sample
0C:100W showed higher band intensity in whey proteins in contrast to 80C:20W, in
Chapter 4: Effect of Dairy Formulation
159
which the whey proteins bands were weaker and the caseins bands had stronger
intensity. The intensity of the β-Lg band in the samples 0C:100W and 20C:80W
gradually decreased during gastric digestion (Figure 4.13 A), which can be attributed
to the continuously emptying and dilution of the digesta, whereas a higher intensity of
β-Lg was found in the sample 80C:20W at the end of the digestion with lower intensity
in the intermediate times of digestion. Interestingly, β-Lg seemed to be delivered
continuously throughout the gastric phase in the sample with the protein C:W ratio of
1 when compared with the sample of C:W ratio of 4. The band of α-La was present in
the three first GE points, after which it was not detected anymore, with the exception
of the sample 80C:20W, in which it was present in the two first GE points, with some
evidence of its presence in GE5. The pattern for caseins differed depending on their
concentration. The sample 20C:80W presented the caseins bands in the first three
GE points and thereafter no bands were detectable. In contrast, in the samples
50C:50W and 80C:20W, the caseins were detectable in the first emptying points, in
particular GE1 and GE2 points but they were almost not observed in GE3 and GE4
points, and they could be observed in the last emptying point (GE5), showing a higher
intensity in the case of 80C:20W. Similar trends were observed when 2% lipid was
added in the protein formulations (Figure 4.13 B). However, the casein bands seemed
to be weaker, in particular in the case of (50C:50W)2% and (80C:20W)2% at GE5,
showing a more constant and lower content of caseins during gastric digestion. The
increase of lipid at the levels of 4% and 8% did not cause significant changes in the
SDS-PAGE pattern observed in the emulsion using 2% in the 50C:50W sample
(Figure 4.13 C), except that the casein bands in GE2 appeared to be weaker in
(50C:50W)4% and (50C:50W)8%. It is important to note that pepsin band could not
be detected, which was probably due to the dilution applied to the samples (1:100) in
order to obtain distinct bands of the main milk proteins on the SDS PAGE gels.

Chapter 4: Effect of Dairy Formulation
160
Figure 4.13 SDS-PAGE (under reducing conditions) of (A) protein solution samples, (B) emulsion samples with 2% lipid and (C) samples with the C:W ratio of 1 (i.e. 50C:50W) with 0%, 2%, 4% and 8% lipid. The emptied aliquots at the corresponding GE points (GE1-GE5) were analysed together with the initial sample (I), referred to before digestion and a molecular weight marker. The samples are labelled in the figure accordingly. Samples were diluted (1:100) with water.
4.3.7 Protein Hydrolysis during GI Digestion
The level of free amino groups (R-NH2), obtained using OPA assay, represents
an indication of the degree of protein hydrolysis. Figure 4.14 shows the levels of free
amino groups of all the formulations in the G1, G3 and G5 points, and in the
corresponding intestinal digestions for 30 min and 120 min (in the case of G5 point).
There was a substantial increase in protein hydrolysis from the gastric to the small
intestinal phase in all the measured GE points. The major difference among the

Chapter 4: Effect of Dairy Formulation
161
protein solution formulations can be observed in the G5 point after intestinal digestion
for both 30 min and 120 min (Figure 4.14 A), in which the formulations of 0C:100W
and 20C:80W presented the lowest concentration of free amino groups compared to
50C:50W and 80C:20W. There were similar amounts of amino groups released in G1I
and G3I. Regarding the emulsions with the addition of 2% lipid (Figure 4.14 B), the
pattern was similar but the formulation (80C:20W)2% seemed to present a lower
concentration of amino groups in G1 and G3 after intestinal digestion for 30 min
showing significant differences between (0C:100W)2% and (80C:20W)2% in G1I. In
general, the inclusion of different lipid concentrations in the same protein formulation
does not seem to modify the protein hydrolysis (Figure 4.14 C). However, there were
some significant differences in G5I120 between the samples 50C:50W and
(50C:50W)8%.

Chapter 4: Effect of Dairy Formulation
162
Figure 4.14 Concentration of free amino groups in the gastric emptying points (G1, G3 and G5) and their respective intestinal digestion for 30 min (G1I, G3I and G5I) and for 120 min in G5 (i.e. G5I120) of (A) protein solution samples, (B) emulsion samples with 2% lipid, and (C) comparison of the different lipid inclusion (0, 2,,4, and 8%) in the same protein composition matrix, C:W ratio of 1. Values are presented as means ± SD (n=3). The values were corrected by the different gastric dilution in each point. Mean values within a column with different superscript letters (a, b, c) were significantly different (p < 0.05).

Chapter 4: Effect of Dairy Formulation
163
In relation to protein digestion, the individual AAs were also analysed (see
Appendix B) and the total AAs concentration of the four protein formulations with and
without the 2% lipid inclusion is represented in Figure 4.15. Similar to the results
obtained using OPA assay, there was a substantial increase in AA levels from the
gastric to the small intestinal phase. The concentration of total AAs during the
intestinal phase was relatively constant in the formulations of 0C:100W and 20C:80W,
regardless the inclusion of lipid. This differed with the gradual increase of AAs level
during intestinal digestion in the formulations of 50C:50W and 80C:20W, regardless
lipid addition, starting from concentrations of about 1,300 mg/mL at G1I to reaching
levels of about 3,000 mg/mL.
Figure 4.15 Total AAs content (mg/mL) in the gastric emptied aliquots G1, G3 and G5, and their respective small intestinal digestion for 30 min (G1I, G3I and G5I), and the intestinal digestion of G5 for 120 min (G5I120). The protein solution and the emulsion (2% lipid) samples are represented in solid line and broken line, respectively. Values are presented as means ± SD (n=3). The values were corrected by the different gastric dilution in each point. Significance difference in AAs content between samples in each GE point was determined by one-way ANOVA, p ≤ 0.05 (*), p ≤ 0.01 (**), p ≤ 0.001 (***) and p ≤ 0.0001 (*****).
4.3.8 Bioaccessibility and Absorption of AAs
The concentration of total branched-chain amino acids (BCAAs) and Leu, Ile
and Val, independently, for all the samples at both GE1 and GE5 in the apical and
basolateral sides of the Ussing chamber can be seen in Appendix C and the
representation of Leu trends is displayed in Figure 4.16. The determination in the

Chapter 4: Effect of Dairy Formulation
164
apical side represents the Leu content that was digested and became accessible
whereas the determination in the basolateral side represents the Leu content that was
able to be transported across the intestinal wall and thus available to be metabolised
and used for physiological functions. In general, the Leu concentration in all the
samples in both GE points increased during small intestinal digestion, showing the
progressive breakdown of the protein, liberating AAs and increasing their absorption.
However, the rate and extent of these processes were different between the samples.
In GE1, the protein solution samples in the absence of lipid (Figure 4.16 A), showed
similar Leu concentration in the apical side at 5 min of intestinal digestion. However,
the sample 0C:100W showed the most rapid increase in Leu concentration whereas
the lowest rate was found in the sample 80C:20W. After 60 min of intestinal digestion,
the highest apical Leu concentration was found in the sample 0C:100W followed by
20C:80W, 50C:50W and 80C:20W, accounting for 396.04, 280.83, 257.15 and 210.30
µg/mL, respectively. These patterns were related to the Leu concentration that was
absorbed (basolateral concentrations), the highest rate of Leu absorption was
observed in 0C:100W whereas the samples 50C:50W and 80C:20W presented the
slowest rate with a similar pattern. The order of the samples according the Leu
concentration analysed after 60 min of intestinal digestion was the same than in the
apical side, i.e. 0C:100W following by 20C:80W, 50C:50W and 80C:20W, accounting
for 20.97, 16.17, 13.15 and 11.72 µg/mL respectively. However, there were not
significant differences in the intestinal digestion time points among the samples. The
patterns observed in GE1 differed from those obtained in GE5 with the same samples
(Figure 4.16 a). With regards to apical side, the samples 50C:50W and 80C:20W
presented a higher Leu concentration than 0C:100W and 20C:80W after 5 min of
intestinal digestion. There was a slight increase in Leu concentration during intestinal
digestion in the samples 0C:100W and 20C:80W, which accounted for 87.59 and
108.71 µg/mL respectively at 60 min of intestinal digestion. Despite the low Leu
release in those samples, there was still some Leu absorption during the intestinal
phase, representing 8.77 and 12.95 µg/mL for 0C:100W and 20C:80W respectively
after 60 min of digestion. This contrasts to the rapid rate of Leu accessibility in. the
samples 50C:50W and 80C:20W showing 301.24 and 368.72 µg/mL respectively at
the end of the intestinal digestion. This was reflected in a higher absorbed Leu
obtained in the basolateral side, accounting for 16.78 and 18.25 µg/mL for the
samples 50C:50W and 80C:20W, respectively.
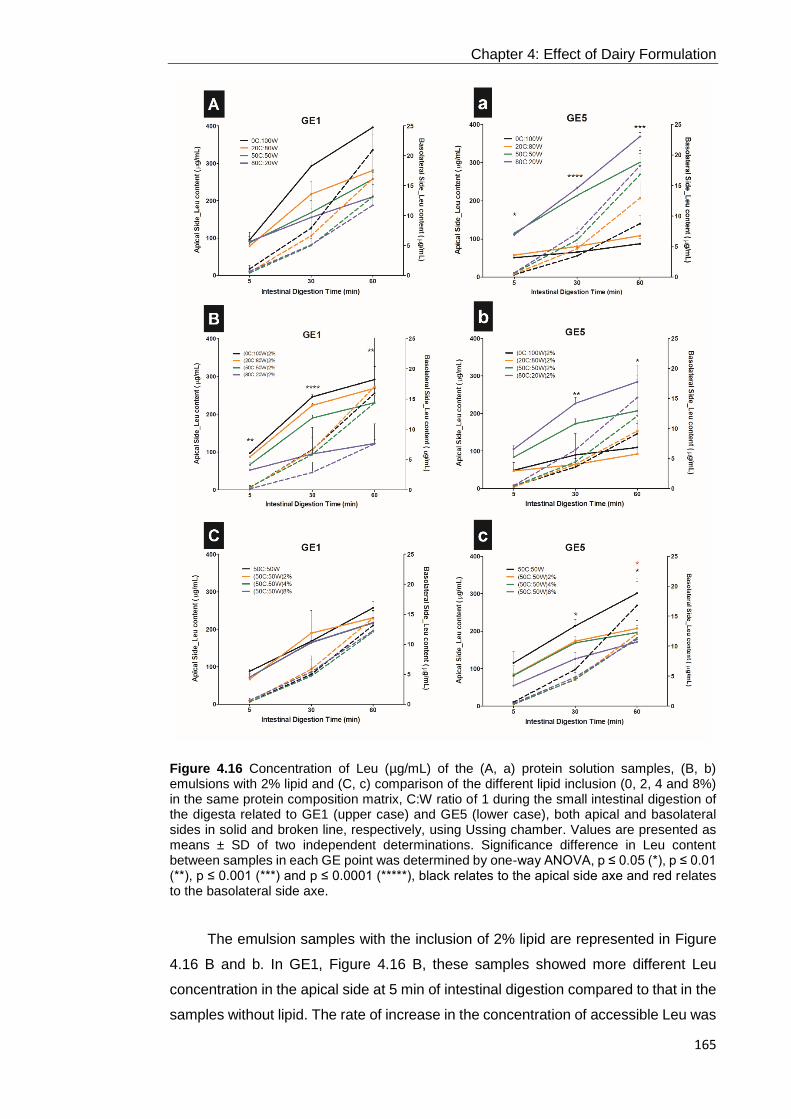
Chapter 4: Effect of Dairy Formulation
165
Figure 4.16 Concentration of Leu (µg/mL) of the (A, a) protein solution samples, (B, b) emulsions with 2% lipid and (C, c) comparison of the different lipid inclusion (0, 2, 4 and 8%) in the same protein composition matrix, C:W ratio of 1 during the small intestinal digestion of the digesta related to GE1 (upper case) and GE5 (lower case), both apical and basolateral sides in solid and broken line, respectively, using Ussing chamber. Values are presented as means ± SD of two independent determinations. Significance difference in Leu content between samples in each GE point was determined by one-way ANOVA, p ≤ 0.05 (*), p ≤ 0.01 (**), p ≤ 0.001 (***) and p ≤ 0.0001 (*****), black relates to the apical side axe and red relates to the basolateral side axe.
The emulsion samples with the inclusion of 2% lipid are represented in Figure
4.16 B and b. In GE1, Figure 4.16 B, these samples showed more different Leu
concentration in the apical side at 5 min of intestinal digestion compared to that in the
samples without lipid. The rate of increase in the concentration of accessible Leu was
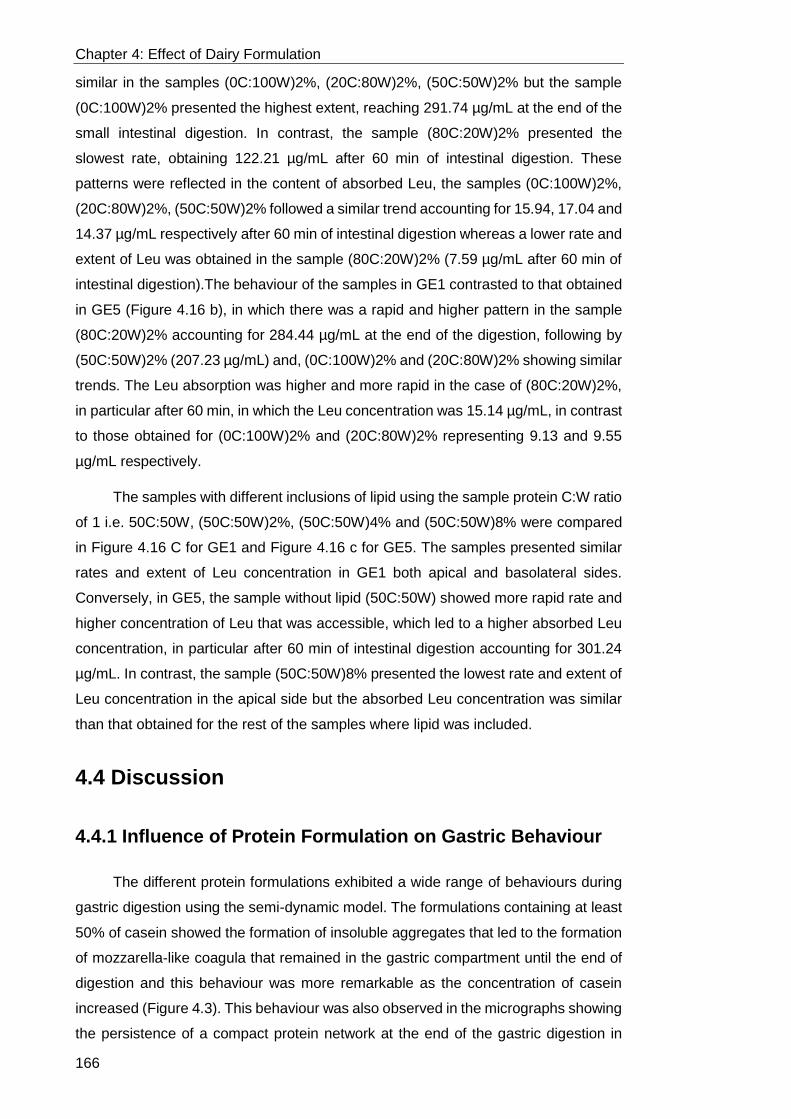
Chapter 4: Effect of Dairy Formulation
166
similar in the samples (0C:100W)2%, (20C:80W)2%, (50C:50W)2% but the sample
(0C:100W)2% presented the highest extent, reaching 291.74 µg/mL at the end of the
small intestinal digestion. In contrast, the sample (80C:20W)2% presented the
slowest rate, obtaining 122.21 µg/mL after 60 min of intestinal digestion. These
patterns were reflected in the content of absorbed Leu, the samples (0C:100W)2%,
(20C:80W)2%, (50C:50W)2% followed a similar trend accounting for 15.94, 17.04 and
14.37 µg/mL respectively after 60 min of intestinal digestion whereas a lower rate and
extent of Leu was obtained in the sample (80C:20W)2% (7.59 µg/mL after 60 min of
intestinal digestion).The behaviour of the samples in GE1 contrasted to that obtained
in GE5 (Figure 4.16 b), in which there was a rapid and higher pattern in the sample
(80C:20W)2% accounting for 284.44 µg/mL at the end of the digestion, following by
(50C:50W)2% (207.23 µg/mL) and, (0C:100W)2% and (20C:80W)2% showing similar
trends. The Leu absorption was higher and more rapid in the case of (80C:20W)2%,
in particular after 60 min, in which the Leu concentration was 15.14 µg/mL, in contrast
to those obtained for (0C:100W)2% and (20C:80W)2% representing 9.13 and 9.55
µg/mL respectively.
The samples with different inclusions of lipid using the sample protein C:W ratio
of 1 i.e. 50C:50W, (50C:50W)2%, (50C:50W)4% and (50C:50W)8% were compared
in Figure 4.16 C for GE1 and Figure 4.16 c for GE5. The samples presented similar
rates and extent of Leu concentration in GE1 both apical and basolateral sides.
Conversely, in GE5, the sample without lipid (50C:50W) showed more rapid rate and
higher concentration of Leu that was accessible, which led to a higher absorbed Leu
concentration, in particular after 60 min of intestinal digestion accounting for 301.24
µg/mL. In contrast, the sample (50C:50W)8% presented the lowest rate and extent of
Leu concentration in the apical side but the absorbed Leu concentration was similar
than that obtained for the rest of the samples where lipid was included.
4.4 Discussion
4.4.1 Influence of Protein Formulation on Gastric Behaviour
The different protein formulations exhibited a wide range of behaviours during
gastric digestion using the semi-dynamic model. The formulations containing at least
50% of casein showed the formation of insoluble aggregates that led to the formation
of mozzarella-like coagula that remained in the gastric compartment until the end of
digestion and this behaviour was more remarkable as the concentration of casein
increased (Figure 4.3). This behaviour was also observed in the micrographs showing
the persistence of a compact protein network at the end of the gastric digestion in

Chapter 4: Effect of Dairy Formulation
167
both 50C:50W and 80C:20W samples (Figure 4.10). In contrast, the sample
containing only whey proteins (0C:100W) presented the formation of aggregates that
dissipated over time resulting in a clear solution by the end of the digestion and this
pattern was not significantly affected by the addition of lower amounts of casein, i.e.
20%. This behaviour was confirmed following the microstructure development over
time, showing almost no protein aggregates at the end of the gastric digestion. The
distinct behaviour of the milk proteins observed in the present study is in agreement
with the suggestions presented in the literature (Boirie et al., 1997; Hall et al., 2003;
Mahé et al., 1996). However, there is no direct evidence of the gastric behaviour in
humans and the in vitro evidence is limited. Similar to our results, Wang et al. (2018)
showed, using the Human Gastric Simulator (HGS), that MPC presented a firm
coagulation whereas WPI did not present any aggregation after 220 min of gastric
digestion. Moreover, the authors reported that the coagulation of the MPC sample
was visible in the first 10 min of digestion corresponding to a pH of approximately 6,
in agreement to the present study.
The difference of the gastric behaviour between the main milk proteins can be
attributed to their native molecular structure and physico-chemical properties.
Caseins form supramolecular colloidal particles, called casein micelles, having an
average diameter of 120 nm (Fox et al., 1998). In a micelle, caseins are linked by
colloidal calcium phosphate by hydrophobic and electrostatic interactions.
Electrostatic interactions provides structural stability to the casein micelles and steric
effects of the protruding “hair” from the C-terminal regions of κ-casein causing steric
repulsion between micelles thus preventing aggregation. In contrast, whey proteins
are globular proteins with high levels of secondary, tertiary and, in most cases,
quaternary structures. Caseins are insoluble at pH 4.6 (isoelectric point) whereas
whey proteins remain soluble at that pH. In the present study, the protein aggregation
started after 10 min of gastric digestion at pH values of about 6 for both 50C:50W and
80C:20W, which was much higher pH than the isolectric point of caseins. This
suggests that the initial coagulation was driven by the action of pepsin that has been
reported to favour the hydrolysis of κ-caseins among the other caseins at pH 6.0 (Tam
et al., 1972), which will reduce the steric repulsion between micelles. Then, the
coagulation might be caused by the destabilisation of casein micelles since pepsin
cleaves the Phe-105-Met-106 bond in κ-casein liberating caseinomacropeptide.
With regards to the strength of the coagula within the digesta at GE2, the effect
of protein formulation seemed to have a more important role than the lipid inclusion
as shown in Figure 4.6 B, where the influence of lipid was greater in the C:W ratio of
4 in contrast to the C:W ratio of 1. Similarly, Lambers et al. (2013) showed that the
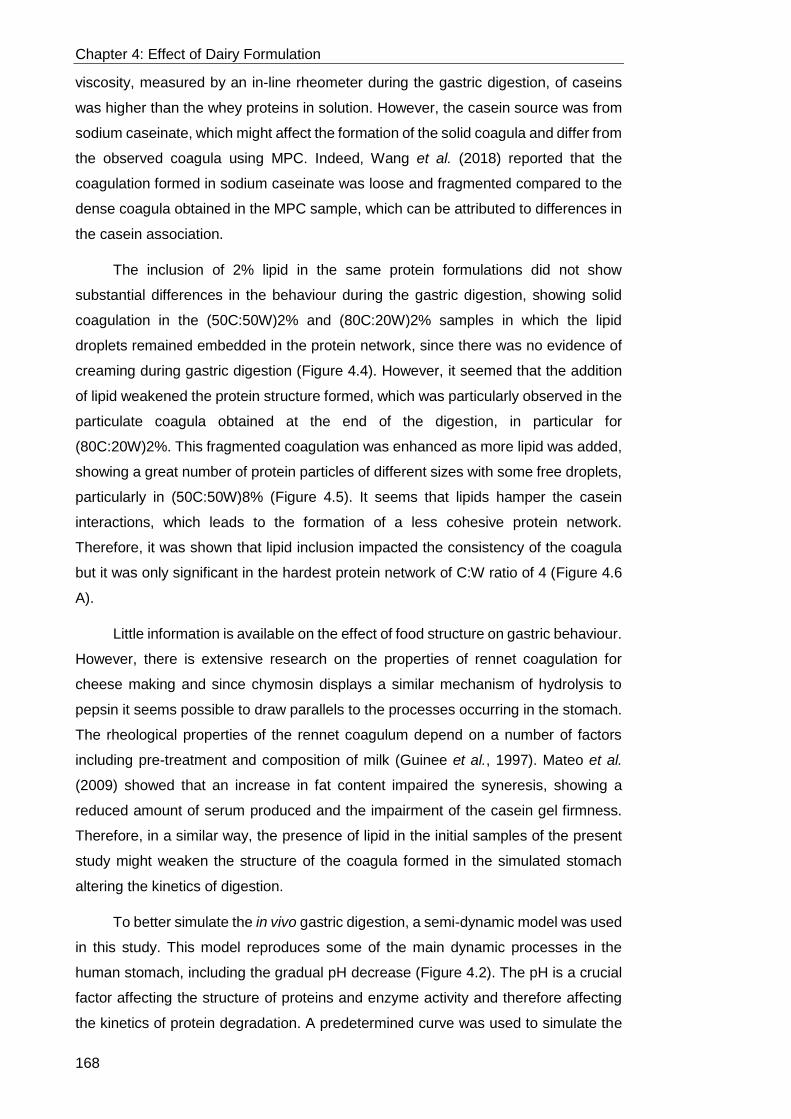
Chapter 4: Effect of Dairy Formulation
168
viscosity, measured by an in-line rheometer during the gastric digestion, of caseins
was higher than the whey proteins in solution. However, the casein source was from
sodium caseinate, which might affect the formation of the solid coagula and differ from
the observed coagula using MPC. Indeed, Wang et al. (2018) reported that the
coagulation formed in sodium caseinate was loose and fragmented compared to the
dense coagula obtained in the MPC sample, which can be attributed to differences in
the casein association.
The inclusion of 2% lipid in the same protein formulations did not show
substantial differences in the behaviour during the gastric digestion, showing solid
coagulation in the (50C:50W)2% and (80C:20W)2% samples in which the lipid
droplets remained embedded in the protein network, since there was no evidence of
creaming during gastric digestion (Figure 4.4). However, it seemed that the addition
of lipid weakened the protein structure formed, which was particularly observed in the
particulate coagula obtained at the end of the digestion, in particular for
(80C:20W)2%. This fragmented coagulation was enhanced as more lipid was added,
showing a great number of protein particles of different sizes with some free droplets,
particularly in (50C:50W)8% (Figure 4.5). It seems that lipids hamper the casein
interactions, which leads to the formation of a less cohesive protein network.
Therefore, it was shown that lipid inclusion impacted the consistency of the coagula
but it was only significant in the hardest protein network of C:W ratio of 4 (Figure 4.6
A).
Little information is available on the effect of food structure on gastric behaviour.
However, there is extensive research on the properties of rennet coagulation for
cheese making and since chymosin displays a similar mechanism of hydrolysis to
pepsin it seems possible to draw parallels to the processes occurring in the stomach.
The rheological properties of the rennet coagulum depend on a number of factors
including pre-treatment and composition of milk (Guinee et al., 1997). Mateo et al.
(2009) showed that an increase in fat content impaired the syneresis, showing a
reduced amount of serum produced and the impairment of the casein gel firmness.
Therefore, in a similar way, the presence of lipid in the initial samples of the present
study might weaken the structure of the coagula formed in the simulated stomach
altering the kinetics of digestion.
To better simulate the in vivo gastric digestion, a semi-dynamic model was used
in this study. This model reproduces some of the main dynamic processes in the
human stomach, including the gradual pH decrease (Figure 4.2). The pH is a crucial
factor affecting the structure of proteins and enzyme activity and therefore affecting
the kinetics of protein degradation. A predetermined curve was used to simulate the

Chapter 4: Effect of Dairy Formulation
169
acidification curve seen in the human stomach for a standard meal, in which the pH
decreases gradually during time reaching a pH of about 3.5 halfway and pH 2 at the
end of gastric digestion (Malagelada et al., 1976). Also, the pH curve obtained was
similar to that obtained using milk proteins in calf (Yvon et al., 1992). However, there
were some differences among the samples, which can be attributed to the different
structures formed during the gastric phase. The sample 0C:100W presented the
lowest pH values at the first stage of the gastric digestion, which can be related to the
lower buffering capacity of the soluble aggregates, and the pH gradually decreased
during digestion (Figure 4.2 A). In contrast, the sample 80C:20W presented irregular
pH values during the gastric time, showing a sharp reduction of pH in the middle of
the digestion due to the formation of a dense coagula which hampered the emptying
of protein, and there was an increase at the end of the digestion due to the increased
buffering capacity resulting from the emptying of more protein that had accumulated
in the simulated stomach. The pH curve in 50C:50W was more regular despite its
coagulation due to the weaker coagulation obtained, which made the protein delivery
and, thus the buffering capacity of the emptied digesta, more constant between GE
points.
GE is the other main essential parameter in the gastric phase. In the semi-
dynamic model, the rate of GE was based on the caloric content of the sample for an
easier methodology and the emptying was performed by means of a syringe with
plastic tubing. This GE approach implied that the emptying time of the samples was
the same regardless the behaviour of the proteins in the simulated stomach. However,
this may not be totally accurate since casein might present longer times of gastric
digestion due to the formation of the solid coagula that remains longer in the stomach
to be broken down and emptied, which might influence the extent of the protein
hydrolysis. In humans, Boutrou et al. (2013) found that, after casein ingestion, the
delivery of dietary protein in the jejunum was progressive for 6 hours and in the form
of medium size-peptides (750-1,050 Da) whereas the ingestion of whey protein
induced the release of larger-size peptides (1,050-1,800 Da) and was completed after
3 hours.
The regulation of GE is a complex process which depends on factors including
gut hormones and properties of food, e.g. viscosity, consistency, volume, particle size
and caloric density. However a simple in vitro model cannot take into account all of
these factors so this model considered the caloric density as the main factor in
regulating the rate of GE, a high caloric density inducing a slower/longer emptying.
The caloric content delivered to the duodenum in vivo is regulated so the nutrient
delivery is continuously maintained by a negative feedback through the release of
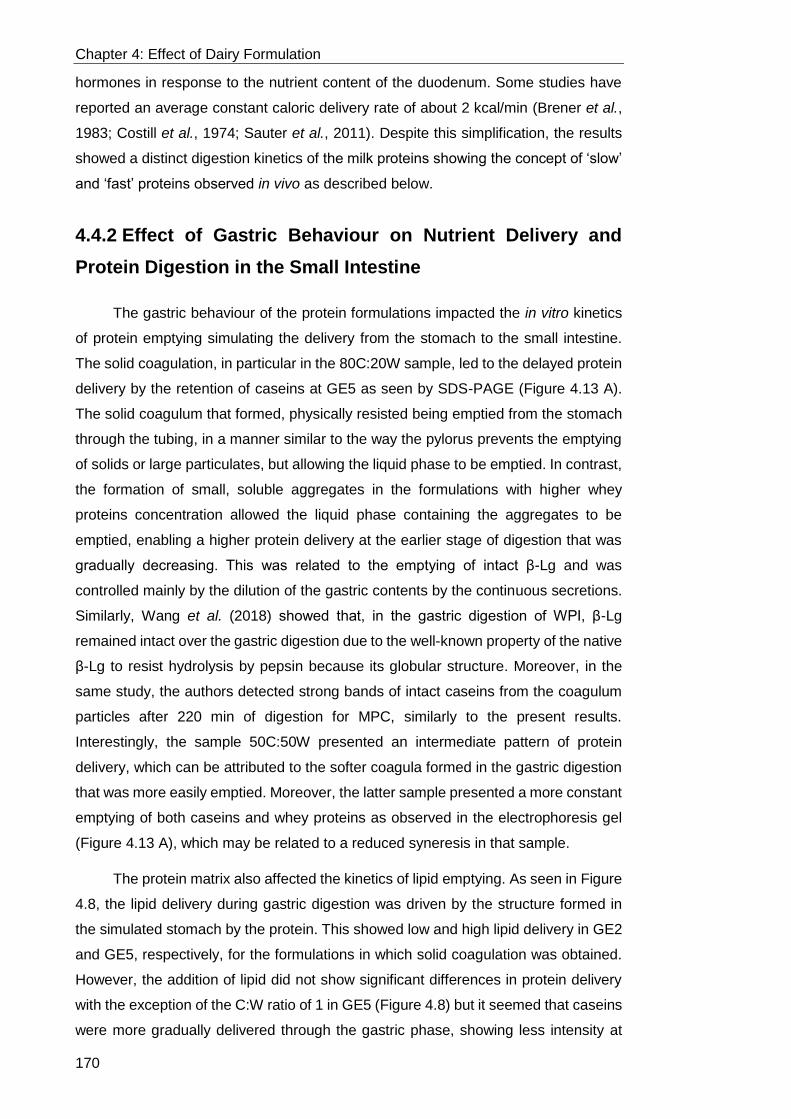
Chapter 4: Effect of Dairy Formulation
170
hormones in response to the nutrient content of the duodenum. Some studies have
reported an average constant caloric delivery rate of about 2 kcal/min (Brener et al.,
1983; Costill et al., 1974; Sauter et al., 2011). Despite this simplification, the results
showed a distinct digestion kinetics of the milk proteins showing the concept of ‘slow’
and ‘fast’ proteins observed in vivo as described below.
4.4.2 Effect of Gastric Behaviour on Nutrient Delivery and
Protein Digestion in the Small Intestine
The gastric behaviour of the protein formulations impacted the in vitro kinetics
of protein emptying simulating the delivery from the stomach to the small intestine.
The solid coagulation, in particular in the 80C:20W sample, led to the delayed protein
delivery by the retention of caseins at GE5 as seen by SDS-PAGE (Figure 4.13 A).
The solid coagulum that formed, physically resisted being emptied from the stomach
through the tubing, in a manner similar to the way the pylorus prevents the emptying
of solids or large particulates, but allowing the liquid phase to be emptied. In contrast,
the formation of small, soluble aggregates in the formulations with higher whey
proteins concentration allowed the liquid phase containing the aggregates to be
emptied, enabling a higher protein delivery at the earlier stage of digestion that was
gradually decreasing. This was related to the emptying of intact β-Lg and was
controlled mainly by the dilution of the gastric contents by the continuous secretions.
Similarly, Wang et al. (2018) showed that, in the gastric digestion of WPI, β-Lg
remained intact over the gastric digestion due to the well-known property of the native
β-Lg to resist hydrolysis by pepsin because its globular structure. Moreover, in the
same study, the authors detected strong bands of intact caseins from the coagulum
particles after 220 min of digestion for MPC, similarly to the present results.
Interestingly, the sample 50C:50W presented an intermediate pattern of protein
delivery, which can be attributed to the softer coagula formed in the gastric digestion
that was more easily emptied. Moreover, the latter sample presented a more constant
emptying of both caseins and whey proteins as observed in the electrophoresis gel
(Figure 4.13 A), which may be related to a reduced syneresis in that sample.
The protein matrix also affected the kinetics of lipid emptying. As seen in Figure
4.8, the lipid delivery during gastric digestion was driven by the structure formed in
the simulated stomach by the protein. This showed low and high lipid delivery in GE2
and GE5, respectively, for the formulations in which solid coagulation was obtained.
However, the addition of lipid did not show significant differences in protein delivery
with the exception of the C:W ratio of 1 in GE5 (Figure 4.8) but it seemed that caseins
were more gradually delivered through the gastric phase, showing less intensity at
Chapter 4: Effect of Dairy Formulation
171
the end of the digestion, which can be related to the softer coagula measured (Figure
4.6). This shows that lipid droplets were incorporated in the protein network formed in
the gastric digestion and that protein structure was the main driver for the nutrient
delivery. The addition of higher amounts of lipid in the C:W ratio of 1, in particular 8%,
resulted in a lower release of protein and lower intensity of casein bands at the end
of the digestion, which is related to the softer and more fragmented coagula obtained
(Figure 4.5 H). As seen in the present study, the incorporation of other nutrients might
affect the protein network structure and modify their digestion and behaviour within
the GI tract. Guo et al. (2015) studied, in whey protein emulsion gels (hard versus
soft), the effect of gastric disintegration using HGS on lipid bioaccessibility during a
simulated intestinal digestion. The size of the gel particles was reduced after 60 min
of gastric digestion in both samples but the initial rate of lipolysis of the soft gel was
significantly higher than the hard gel, even though the solid content of that digesta
was lower. At 240 min, the digesta from the soft gel consisted of individual oil droplets
as well as smaller particles, compared to the hard gel in which most of the oil droplets
remained within the protein network. The latter study represents an example of the
enginnering of gels, however the same principle can be applied for protein structures
formed within the gastric conditions. Therefore, this shows that protein networks can
modulate the release of lipid to the intestine and impact on the subsequent digestion
rates.
The formation of the solid coagula within the simulated stomach of the protein
formulations of 50C:50W and 80C:20W affected the protein hydrolysis in the early
stages of the gastric digestion (G1 and G3) resulting in the release of fewer free amino
groups (Figure 4.14) despite the fact that caseins have been reported to be more
easily digested than whey proteins in solution during the gastric phase. This was
illustrated by Macierzanka et al. (2009) who showed that β-Lg was resistant to
pepsinolysis due to the complact globular structure compared to the loose, disordered
structure of β-casein. These conflicting results could be explained on the basis that
the solid coagulum formed by the caseins could reduce accessibility of pepsin and,
thus, hamper the hydrolysis of caseins within the protein network. Indeed, some work
presented in Chapter 6 showed that pepsin activity was mainly found in the surface
of the compact coagula formed during the gastric digestion of milk whereas pepsin
was absent inside of the coagula. However, that solid coagulation did not seem to
impact the protein hydrolysis in the small intestinal phase, showing a more effective
hydrolysis of milk protein in that phase, regardless the structure of the digesta. During
the intestinal digestion of the last emptied aliquot for both 30 and 120 min, i.e. G5I
and G5I120, there was higher hydrolysis in the samples that presented solid gastric

Chapter 4: Effect of Dairy Formulation
172
coagulation, which was also reflected in the higher total AAs content (Figure 4.15),
this pattern was obtained regardless the inclusion of 2% lipid. These results differ from
the study by Macierzanka et al. (2009) where the degree of proteolysis in β-Lg was
increased when emulsified with oil, which was due to the partial unfolding of the β-Lg
secondary structure improving accessibility to pepsin. In the present study we did not
find significant differences in the presence of an emulsion, which may be due to the
high concentration of protein present in the sample where most of the protein was in
solution instead of being absorbed on the interface of the lipid droplet. In the samples
containing higher proportion of whey proteins, in contrast, there was more constant
hydrolysis and presence of total AAs during the intestinal phase with a higher
hydrolysis at the G1I, which can be attributed to the more regular and gradual protein
delivery of the soluble aggregates.
The results showed that there was rapid protein hydrolysis for all the samples
after 30 min of small intestinal digestion. This finding is in agreement with the study of
Macierzanka et al. (2009) showing that milk proteins were partially hydrolysed, after
just 1 min, into lower molecular weight peptides under intestinal conditions. The
intestinal proteolysis is highly efficient resulting in a mixture of free AAs and
oligopeptides (2-6 AAs) that account for approximately 40% and 60%, respectively,
of the total α-amino nitrogen (Erickson et al., 1990) and some peptides are further
hydrolysed by aminopeptidases located on the brush border membranes. Therefore,
the joint action of the gastric, intestinal and brush border proteolysis provides the
availability of free AAs, di- and tri-peptides allowing their transport across the brush
border membrane.
4.4.3 Effect of Gastric Behaviour on AA Bioaccessibility and
Absorption
The behaviour of the protein matrix in the gastric phase was shown to alter the
extent and rate of nutrients that was released over time from the in vitro stomach.
This, in turn, controlled the further protein digestion in the small intestine, affecting the
bioaccessibility and absorption of AAs.
The Leu level was selected to follow the kinetics of absorption since it plays a
key role in the body protein deposition (Garlick, 2005), and the digesta emptied in the
early (i.e. GE1) and late (i.e. GE5) stages of the gastric digestion were selected to
assess the behaviour of the samples. The Ussing chamber experiment was
performed using an in situ intestinal digestion in order to simulate the simultaneous
processes of protein/peptide hydrolysis and AA absorption, in contrast to the use of
Chapter 4: Effect of Dairy Formulation
173
pre-digested samples in most of the studies previously presented in the literature
(Awati et al., 2009). This ex vivo model using intact intestinal tissue segments from
an animal provides a better representation of the in vivo situation since it provides the
morphological and physiological features of the intestinal wall, including the
multicellular conglomeration and presence of the mucus layer allowing the simulation
of the possible further hydrolysis of some peptides by aminopeptidases located on
the brush border membranes. It is important to note that a lower concentration of Leu
in the basolateral side was obtained comparing to the apical side, which could be
attributed to the reduce area of the mouse tissue in the Ussing chamber experiment
resulting in possible saturation in the tissue hampering the AA transport. There are a
few studies investigating the absorption of AAs by Ussing chamber but the results are
difficult to compare since the experimental set ups are different, including the source
of the animal tissue (Grøndahl et al., 1997).
In general, it was shown quite clearly that the different rates of delivery of Leu
from the different samples at different stages of digestion, explained how whey
proteins and caseins are responsible for most of the early and late AA delivery,
respectively (Figure 4.16). For protein solutions, the sample 0C:100W presented the
highest rate and extent of both Leu accessibility and absorption in the first GE aliquot
when compared with the samples 50C:50W and 80C:20W. In contrast, the latter
samples presented a higher level of digestion and absorption in GE5, which might be
attributed to the delayed protein delivery to the intestinal phase due to the coagula
that remained at the end of the gastric digestion. These results could be related to the
plasma Leu concentrations after protein ingestion obtained by Boirie et al. (1997), in
which they described whey proteins and casein as ‘fast’ and ‘slow’ proteins
respectively, a concept previously adopted for dietary carbohydrates due to the
evidence of the link between their rate of digestion and absorption, and metabolic
response. Boirie et al. (1997) showed that there was a rapid increase in plasma Leu
levels after the ingestion of a whey protein drink when compared to that of caseins,
which showed a more attenuated pattern over time. Similarly, in the present study,
the rate and extent of Leu absorption at early stages of digestion was higher in the
sample 0C:100W whereas the sample with higher content of casein presented low
levels of Leu absorption at the beginning but a substantial increase in the later stage
of the digestion, that could have been prolonged if the gastric digestion had lasted
longer.
The structure of the milk protein networks formed within gastric conditions, in
which whey proteins showed a more open structure and the high casein samples
showed denser aggregation (Figure 4.10), could have somehow an impact on the
Chapter 4: Effect of Dairy Formulation
174
absorption but this was less probable since the hydrolysis levels of the samples were
not different in that point, G1I (Figure 4.14). Also, the protein content at this stage of
gastric digestion presented no significant differences between the protein solution
samples (Figure 4.7), which might be related to the incomplete formation of the solid
coagula by that time. Therefore the distinct absorption pattern could be attributed to
a higher level of Leu present in whey proteins compared to caseins (Gorissen et al.,
2018). In the current study the protein content was matched but they differed in the
Leu content due to the nature of the proteins. Nevertheless, this did not affect the
distinct absorption pattern of the milk proteins as studied by Boirie et al. (1997), in
which both casein and whey proteins drinks were matched in Leu content as well,
showing that that Leu content was not the limiting factor for the protein synthesis.
Moreover, the patterns for the other measured BCAAs reflected that of Leu pattern
(Appendix C) showing the relevance of the kinetics of digestion. Indeed, the
independence of the protein digestion rate on modulating postprandial deposition of
protein was also confirmed by Dangin et al. (2001).
With the inclusion of 2% lipid, the pattern of Leu absorption for (50C:50W)2% in
GE1 was similar to those of the samples with higher whey protein content whereas it
presented an intermediate behaviour between the two extremes in the last point of
the gastric digestion. The inclusion of higher levels of lipid did not affect the Leu
absorption pattern at the early stage but it lowered the Leu absorption in the latest
stage, which could be attributed to the lower protein delivery at the end of gastric
digestion due to the softer coagula formed. These findings are in contrast with that of
Gaudichon et al. (1999), showing no difference in postprandial protein utilization was
seen when milk protein was supplemented by milk fat compared to the milk protein
alone. This contrasts with Elliot et al. (2006), in which the ingestion of whole milk was
suggested to increase the utilization of AAs for protein synthesis when compared to
fat-free isocolaric milk. There is little information about the influence of other
macronutrients in the postprandial nitrogen utilization to draw any conclusion hence
more research is needed.
The results presented showed that the rate of absorption of AAs by the gut
depended on the physico-chemical properties of the ingested protein. AAs have
several roles in the body, including the synthesis, breakdown and oxidation of protein.
Therefore, different patterns in postprandial protein digestion might result in different
metabolic responses.

Chapter 4: Effect of Dairy Formulation
175
4.4.4 Physiological Relevance
The different kinetics of protein digestion have been reported to modulate the
postprandial metabolic and hormonal responses, similarly to carbohydrate
metabolism. Boirie et al. (1997) reported that the rapid appearance of levels of Leu in
plasma for whey proteins enhanced the protein synthesis to a greater extent than for
caseins, however, the latter resulted in an inhibition of body protein breakdown due
to the low and slow plasma appearance of Leu. In the current study, we presented
two extremes of behaviour in Leu absorption from the samples of pure whey proteins
(0C:100W) versus milk (80C:20W), which might exert the mentioned postprandial
effects of the ‘fast’ and ‘slow’ proteins, respectively. Interestingly, the sample
50C:50W, showing a solid coagulation with weaker coagula consistency, could
present an intermediate metabolic effect since the kinetics of protein delivery and Leu
absorption were overall showing middle levels. It is important to note that the sample
containing 100% casein was not included in this study however a similar behaviour to
the sample containing 80% can be expected. Lacroix et al. (2006a) showed that a
milk protein drink containing 20:80 whey protein:casein ratio presented no significant
difference in the dietary nitrogen utilization when compared to 100% casein drink,
which might be due to the profound effect of solid coagulation in the stomach from a
casein content level higher than 80%.
There is evidence showing that a slower pattern of protein digestion leads to a
better postprandial utilization of dietary nitrogen, improving AA retention (Boirie et al.,
1997; Bos et al., 2003). Lacroix et al. (2006a) showed that the rapid appearance of
high plasma AA concentrations from the ‘fast’ protein such as whey proteins induced
greater deamination rates by the liver, which decreases the AA concentration in
plasma. However, the effect of the protein digestion rates on the protein metabolism
seemed to be age-dependent (Dangin et al., 2003; Pennings et al., 2011). Pennings
et al. (2011) showed that whey proteins resulted in a more effective enhancement in
protein retention than casein in the elderly.
In general, the understanding of the gastric phase and how it modulates the
gastric behaviour for instance of protein formulation needs further investigation since
it offers great potential to design foods that can exert several physiological effects
such as satiety (Hall et al., 2003), glycaemic control (Gannon et al., 2010), lipemia
control (Mariotti et al., 2015) and improve GI complications such as reflux and
aspiration pneumonia (van den Braak et al., 2013).
Chapter 4: Effect of Dairy Formulation
176
4.5 Conclusions
This study has proposed underlying mechanisms behind the denoted ‘fast’ and ‘slow’
digested protein for whey proteins and caseins, respectively. The main milk proteins
presented different digestibilities and AA availabilities, which are key for defining
protein quality, and the gastric phase of digestion was shown to be the rate limiting
step. The solid coagulation of the casein-rich samples contributed to the delay in
nutrient delivery and thus overall digestion and AAs absorption kinetics. In contrast,
whey proteins formed soluble aggregates during gastric digestion that led to a gradual
decrease of nutrient delivery and a higher Leu absorption in early stages of GI
digestion. The modulation of the solid coagula could be obtained by addition of whey
proteins and lipid, which modulated the kinetics of digestion. The differences in AA
absorption kinetics, as modulated through gastric behaviour, can be associated to
different physiological effects. Therefore, this methodological approach is a powerful
tool to understand the mechanisms underlying the physiological impact of foods, in
order to design foods with different rates of nutrient digestion addressed to the
nutritional and health needs of different populations.
177
Effect of Process-induced Changes
in Whole Milk on in Vitro Gastric
Restructuring and Nutrient
Digestion Kinetics‡
‡This chapter is based on the published peer-reviewed article, Mulet-Cabero,
A.-I., Mackie, A. R., Wilde, P. J., Fenelon, M. A., & Brodkorb, A. (2019). Structural
mechanism and kinetics of in vitro gastric digestion are affected by process-induced
changes in bovine milk. Food Hydrocolloids, 86, 172-183.

Chapter 5: Effect of Milk Processing
178
5.1 Introduction
Bovine milk is conventionally heat treated and homogenised to improve
consumer acceptance, ensure microbial stability and extend shelf life. These dairy
processes cause changes in the physical structure, which have been widely
characterised. Homogenisation results in size reduction of the native fat globule,
initially surrounded by the milk fat globule membrane (MFGM), from an average size
of 3-5 µm to below 1 µm (Michalski et al., 2006). Moreover, homogenisation disrupts
the MFGM, drastically changing the interfacial composition, to mainly consist of
adsorbed milk protein (Lopez, 2005; Sharma et al., 1993) and reduces the average
casein micelle size when high pressure homogenisation (100-300 MPa) is applied
(Lodaite et al., 2009) The most common heat treatments applied to milk are
pasteurisation that consists of heating at 70-90°C for ≥ 15 s and ultra-high
temperature (UHT) sterilization involving heating at 135-150°C for a few seconds.
These thermal processes cause the denaturation of whey proteins, in particular β-
lactoglobulin (β-Lg) (Singh, 2004), which can then become bound to κ-casein via
hydrophobic interaction and disulphide bonding on both the new formed droplet
surface and serum (Anema et al., 2003; Guyomarc'h et al., 2003; Sharma et al., 1993).
The structure of food at different length scales has been shown to impact
nutrient digestion and absorption. However, there has been little research performed
on the impact of these process-induced changes on milk digestion. In some cases,
conflicting results have been obtained mainly due to the different digestion models
applied. The gastric compartment is a key site to regulate nutrient digestion and
control the rate of delivery to the small intestine. Differences in intestinal absorption
kinetics of dairy structures have been associated with changes in gastric emptying
(GE) rates (Gaudichon et al., 1994). The first steps of breakdown of food are in the
gastric compartment mainly due to the presence of pepsin, gastric lipase and acid.
Digested products are progressively emptied through the pylorus and released into
the small intestine, which has important implications for postprandial responses.
Studies of the in vivo digestion of processed milk are very rare. Lacroix et al.
(2008) found, in healthy humans, that UHT-treated milk consumption induced a
significantly higher and faster transfer of dietary nitrogen into serum amino acids and
proteins but also to body urea compared to pasteurised and microfiltrated milk. It was
suggested, but not investigated, that this modulation of the digestive kinetics was due
to the possible formation of a softer coagulum in the stomach and a higher enzyme
accessibility in the case of UHT-treated milk. These results were consistent with the
findings of Bach et al. (2017), in which urinary nitrogen secretion was greater for UHT-
Chapter 5: Effect of Milk Processing
179
milk compared to raw and pasteurised milk using young dairy calves as a model. In
addition, Miranda et al. (1987) found that heat treated milk (UHT and autoclaving)
increased GE rate and casein hydrolysis in rats. This contrasts to other work, in which
a higher mean retention time in the stomach of heated skim milk (90°C, 10 min) was
observed compared to a non-heated system observed in mini-pigs (Barbé et al.,
2013). It is broadly reported that heat treatment, using temperatures above 90°C,
facilitates protein digestion, which has been observed for β-Lg (Wada et al., 2014).
This is linked with the thermal denaturation of β-Lg being between 70°C and 90°C,
depending on heating time (Fang et al., 1997), which provokes the exposure of the
hydrophobic region. However, opposing observations have been made for caseins.
Heating skim milk (90°C, 10 min) promoted hydrolysis resistance of the casein fraction
compared to unheated skim milk during gastric digestion using an in vitro adult
dynamic model (Sánchez-Rivera et al., 2015) and in vitro infant static model (Dupont
et al., 2010), which could affect the kinetics of protein digestion in a mini-pig model
(Barbé et al., 2013). This was reportedly related to chemical modifications of the
protein during heating, i.e. lactosylation, glycosylation as well as casein-whey
interactions, resulting in different peptides generated during digestion. In contrast,
using a static digestion model, Tunick et al. (2016) found a rapid digestion of caseins
in the gastric phase of both processed (heated at pasteurisation and UHT conditions
and homogenised) and non-processed samples. Moreover, homogenisation was
observed to increase β-Lg hydrolysis compared to pasteurised milk (Islam et al.,
2017). Despite the differences in enzymatic digestion of the major milk proteins, Wada
et al. (2014) reported no significant differences in the overall in vitro digestion kinetics
among the heat treatments (pasteurisation, UHT and in-can sterilisation). A
sophisticated in vitro model, the Human Gastric Simulator (HGS), was used to
investigate the effect of milk treatment on the gastric behaviour (Ye et al., 2017) .
They showed the formation of coagula of different structures led to different protein
digestion behaviour. The homogenisation and heat treatment resulted in the formation
of a crumbly structure compared to the tight clot obtained in raw milk. This was similar
to what was proposed to occur in vivo and highlights the limitations of the static in
vitro digestion models. However, the heating conditions used, 90°C for 20 min, are
less representative of the typical conditions used in industrial milk processing.
In addition, the gastric conditions may induce different gastric colloidal
behaviours, which could affect postprandial responses through different rates of
nutrient delivery. Mackie et al. (2013) showed that homogenised droplets stabilised
by milk proteins caused creaming in the human stomach, as monitored by magnetic
resonance imaging, and decreased fullness due to the delayed lipid emptying, in

Chapter 5: Effect of Milk Processing
180
contrast to the early delivery of nutrients from a mixture of cheese and yogurt, which
sustained fullness.
In this study, we aimed to investigate how processing affected milk
microstructure during gastric digestion and nutrient digestion kinetics. The most
commonly used milk processes, homogenisation and the heat treatments of
pasteurisation and UHT, were used and compared to raw milk in order to assess the
influence on gastric behaviour, protein coagulation, nutrient delivery and protein
digestion. For that, the developed semi-dynamic model described in Chapter 3 was
used, which simulates the main dynamics of the stomach including gradual
acidification, gastric fluid and enzyme secretion and emptying.
5.2 Materials and Methods
5.2.1 Materials
Fresh whole bovine milk was collected from a bulk tank of the Moorepark Dairy
Unit, Teagasc Animal and Grassland Research and Innovation Center, Moorepark,
Fermoy, Co. Cork, Ireland. The milk was from Friesian cows that were fed a total
mixed ration diet consisted of grass silage, maize silage and concentrates. Bulk milk
samples were collected post-morning milking. The sampling was conducted between
November 2016 and February 2017.
Pepsin from porcine gastric mucosa had an enzymatic activity of 3,875 units/mg
protein, calculated by measuring the TCA-soluble products using haemoglobin as
substrate as described by Minekus et al. (2014).
5.2.2 Methods
Figure 5.1 illustrates the experimental procedure followed in the study related
to this chapter.

Chapter 5: Effect of Milk Processing
181
Figure 5.1 Flow diagram of the four main steps of the experimental procedure of the study in relation to Chapter 5. Each step has been described in the corresponding Methods section.
Chapter 5: Effect of Milk Processing
182
5.2.2.1 Milk Processing at Pilot-Plant Scale
The raw milk was collected on different days for each process performed. The
processes were conducted at pilot-plant scale using industrially relevant conditions.
Homogenisation was applied at 40°C, to disperse the lipid phase, using a two-stage
valve-type homogeniser (Gaulin Labor, type Lab 60; APV Gaulin GmbH, Lubeck,
Germany). The pressures used were 15 and 5 MPa for first and second stage,
respectively. The sample is referred as Homo in the chapter. Pasteurisation and UHT
treatments were carried out using a MicroThermics® tubular heat exchanger
(MicroThermics®, NC, USA). The conditions were a final heat temperature at 72°C
with a holding time of 15 s for pasteurisation and 140°C with a holding time of 3 s for
UHT treatment (pre-heating temperature of 91°C). The samples are referred as Past
and UHT respectively in the chapter. These heat treatments were also carried out with
a subsequent homogenisation step using an in-line two-stage valve homogeniser,
Model NS 2006H (Niro Soavi, Parma, Italy) employing a first-stage pressure of 15
MPa and a second-stage pressure of 5 MPa. The samples are referred as Past+Homo
and UHT+Homo respectively in the chapter. The samples were stored at 4°C after
preparation. The Raw, Homo, Past and UHT were studied within 1 day and
Past/UHT+Homo were used within 2 days. Figure 5.2 illustrates the six studied
samples with the schematic representation of the main structural and molecular
changes expected to occur.

Chapter 5: Effect of Milk Processing
183
Figure 5.2 Schematic representation of the molecular structure of the samples of studied after the different processing combining homogenisation and heat processes.
The nutritional content of raw milk was measured before each experiment in
order to calculate the parameters for the simulated gastric digestion. Milk fat, protein,
lactose and total solids values were obtained using a Milkoscan FT 6000 (FOSS,
Denmark) with a tolerance of ± 0.06%. This analysis was performed by Jim Flynn
(laboratory technician at Moorepark Teagasc Food Research Centre). The nutrient
composition of milk was measured before each sample (see Table 5.1), showing no
significant effect of the different treatments, and the caloric content was calculated
using the Atwater factors. This ranged from 0.78 to 0.68 kcal/mL during the period of
the study.

Chapter 5: Effect of Milk Processing
184
Table 5.1 Nutritional composition of the studied milk samples. Values are the mean and standard deviation of two independent replicates
5.2.2.2 Semi-Dynamic Gastric Digestion Model
After collection of the raw milk and the respective processing, the samples went
through a simulated, semi-dynamic gastric digestion. This was performed using two
independent samples on different days. Therefore, the simulated digestion
experiments were conducted independently, and subsequent analyses were
performed from these independent samples.
The simulation of the oral and gastric phase was performed using the semi-
dynamic adult digestion model previously detailed in the Chapter 3 and the protocol
used with some modifications is described in the section 2.2.2.1.
The oral phase was simulated before the gastric digestion. 20 g of sample was
mixed with a volume of the oral mixture containing 79.9% SSF (1.25x),19.6% MilliQ®
water and 0.5% CaCl2(H2O)2 (0.3 mol/L). The volume of the oral mixture corresponded
to the total solids content of the sample (Table 5.1). The volume added of oral mixture
varied slightly between samples, ranging from 2.52 to 2.82 mL due to the difference
of the total solid concentration in the analysed milk samples during the period of study.
The mixing was performed using a rotator (SB3 Model, Stuart, Bibby Scientific, UK)
at 30 rpm for 2 min. The temperature was kept at 37°C using an incubator (BF56,
Binder GmbH, Germany).
The resulting mixture was then put through the gastric digestion using a reaction
vessel, which was a v-form glass vessel (5-70 mL titration vessel, Metrohm,
Switzerland) with thermostat jacket (37°C). The sample from the oral phase was
% Lipid % Protein % Lactose % Total solids
Raw 4.67±0.26 3.44±0.41 4.72±0.09 13.53±0.67
Past 4.55±0.43 3.32±0.25 4.71±0.10 13.24±0.59
UHT 4.49±0.53 3.43±0.42 4.71±0.05 13.35±1.03
Homo 4.74±0.28 3.76±0.09 4.66±0.02 13.82±0.25
Past+Homo 4.55±0.43 3.32±0.25 4.71±0.10 13.24±0.59
UHT+Homo 4.49±0.53 3.43±0.42 4.71±0.05 13.35±1.03
Chapter 5: Effect of Milk Processing
185
placed in the reaction vessel after the addition of the basal volume, which consisted
of the 10% of the constituents SGF (1.25x), MilliQ® water, HCl (1.5 mol/L) and
CaCl2(H2O)2 (0.3 mol/L) from the total volume of the gastric mixture. The total gastric
mixture contained 80% SGF (1.25x), 7.78% MilliQ® water, 8.7% HCl (1.5 mol/L) and
3.48% pepsin and 0.04% CaCl2(H2O)2 (0.3 mol/L). Two solutions were added at a
constant rate, which depended on the corresponding gastric time: (1) the simulated
gastric electrolyte mixture containing the 90% of the constituents SGF (1.25x), MilliQ®
water, HCl (1.5 mol/L) and CaCl2(H2O)2 (0.3 mol/L) from the total volume of the gastric
mixture and (2) 0.8 mL pepsin solution (made with MilliQ® water). The simulated
gastric electrolyte mixture of SGF (1.25x), HCl, water and CaCl2(H2O)2 was delivered
by a dosing device (800 Dosino, Metrohm, Switzerland) of an automatic titrator (842
Titrando, Metrohm, Switzerland) and the enzyme solution was delivered by a syringe
pump (New Era Pump Systems, Inc., NY, USA). A 3D action shaker (Mini-gyro rocker,
SSM3 Model, Stuart, Barloworld Scientific limited, UK) at 35 rpm was used for
agitating the vessel.
After 25 min of gastric digestion, the sample was mixed using a 50 mL plastic
syringe (BD Plastipak, Ireland), the aperture of which had an inner diameter of 6.80
mm with a plastic tube attached (6 mm inner diameter). This mixing was required to
make the sampling more accurate. Nevertheless, the colloidal behaviour during
digestion seemed not to be impaired by the initial mixing. Gastric emptying (GE) was
simulated by taking 5 aliquots, referred to as GE1-5 in the text. The average time of
those were 36 min (GE1), 73 min (GE2), 109 min (GE3), 145 min (GE4) and 182 min
(GE5). GE aliquots were taken from the bottom of the vessel using a serological
pipette with a tip internal diameter of 2 mm because it approximates the upper limit of
particle size that has been seen to pass through the pyloric opening into the
duodenum (Thomas, 2006). It is important to note that there was some residue left in
the last GE point that could not be taken using a pipette; this was taken using a spatula
and included in the last point. An aliquot of these GE aliquots was used for
microscopic and particle size analysis. Otherwise, the sample was mixed using a
homogeniser (T10 basic Ultra-Turrax®, IKA®, Germany) at approximately 30,000 rpm
for 30 s to obtain a homogenous sample for the remaining analysis. The pH of each
GE aliquot was measured using a pH meter and a sufficient volume of NaOH (2 mol/L)
was added to the samples to increase the pH above 7, inhibiting pepsin activity.
Finally, GE aliquots were snap-frozen in liquid nitrogen and stored at -80°C until
subsequent analysis.
The simulation of the emptying was based on caloric density, using a linear GE
rate of 2 kcal/min as explained in Chapter 3. This implied that the volume and time of
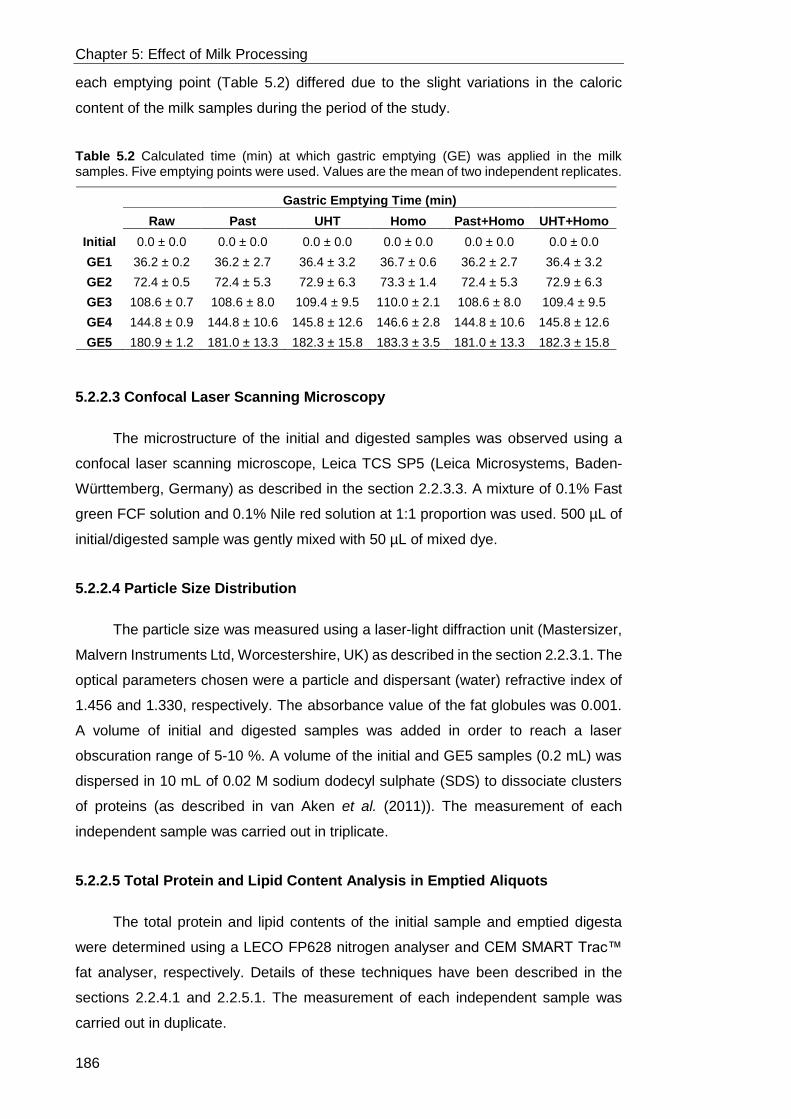
Chapter 5: Effect of Milk Processing
186
each emptying point (Table 5.2) differed due to the slight variations in the caloric
content of the milk samples during the period of the study.
Table 5.2 Calculated time (min) at which gastric emptying (GE) was applied in the milk samples. Five emptying points were used. Values are the mean of two independent replicates.
5.2.2.3 Confocal Laser Scanning Microscopy
The microstructure of the initial and digested samples was observed using a
confocal laser scanning microscope, Leica TCS SP5 (Leica Microsystems, Baden-
Württemberg, Germany) as described in the section 2.2.3.3. A mixture of 0.1% Fast
green FCF solution and 0.1% Nile red solution at 1:1 proportion was used. 500 µL of
initial/digested sample was gently mixed with 50 µL of mixed dye.
5.2.2.4 Particle Size Distribution
The particle size was measured using a laser-light diffraction unit (Mastersizer,
Malvern Instruments Ltd, Worcestershire, UK) as described in the section 2.2.3.1. The
optical parameters chosen were a particle and dispersant (water) refractive index of
1.456 and 1.330, respectively. The absorbance value of the fat globules was 0.001.
A volume of initial and digested samples was added in order to reach a laser
obscuration range of 5-10 %. A volume of the initial and GE5 samples (0.2 mL) was
dispersed in 10 mL of 0.02 M sodium dodecyl sulphate (SDS) to dissociate clusters
of proteins (as described in van Aken et al. (2011)). The measurement of each
independent sample was carried out in triplicate.
5.2.2.5 Total Protein and Lipid Content Analysis in Emptied Aliquots
The total protein and lipid contents of the initial sample and emptied digesta
were determined using a LECO FP628 nitrogen analyser and CEM SMART Trac™
fat analyser, respectively. Details of these techniques have been described in the
sections 2.2.4.1 and 2.2.5.1. The measurement of each independent sample was
carried out in duplicate.
Gastric Emptying Time (min)
Raw Past UHT Homo Past+Homo UHT+Homo
Initial 0.0 ± 0.0 0.0 ± 0.0 0.0 ± 0.0 0.0 ± 0.0 0.0 ± 0.0 0.0 ± 0.0
GE1 36.2 ± 0.2 36.2 ± 2.7 36.4 ± 3.2 36.7 ± 0.6 36.2 ± 2.7 36.4 ± 3.2
GE2 72.4 ± 0.5 72.4 ± 5.3 72.9 ± 6.3 73.3 ± 1.4 72.4 ± 5.3 72.9 ± 6.3
GE3 108.6 ± 0.7 108.6 ± 8.0 109.4 ± 9.5 110.0 ± 2.1 108.6 ± 8.0 109.4 ± 9.5
GE4 144.8 ± 0.9 144.8 ± 10.6 145.8 ± 12.6 146.6 ± 2.8 144.8 ± 10.6 145.8 ± 12.6
GE5 180.9 ± 1.2 181.0 ± 13.3 182.3 ± 15.8 183.3 ± 3.5 181.0 ± 13.3 182.3 ± 15.8
Chapter 5: Effect of Milk Processing
187
5.2.2.6 OPA Assay for Quantification of Protein Hydrolysis
The concentration of the free amino groups was analysed by OPA assay, which
has been described in the section 2.2.4.3. The absorbance was measured at 340 nm
using a multi-mode microplate reader, Synergy™ HT (BioTek® Instruments, Inc.,
Winooski, VT). The measurement of each independent sample was carried out in
duplicate.
5.2.2.7 SDS-PAGE for Identification of Proteins during Digestion
The composition of the main proteins in the gastric emptied aliquots was
determined by SDS-PAGE, which has been described in the section 2.2.4.2. SDS-
PAGE was performed on the initial and digested samples normalised to 0.1% of total
protein concentration.
5.2.2.8 Rheological Analysis
The consistency of the coagulum that persisted at the end of digestion, after
about 182 min (GE5 point) was analysed by small deformation rheology (see section
2.2.3.2). The coagulum was separated from the serum using a 70 µm Nylon cell
strainer, BD Falcon™ (BD Biosciences, Oxford, UK). The mass of the sample and,
the separated coagulum and serum was recorded. The coagulum was gently placed
in a rheometer, AR 2000 (TA Instruments, Crawley, UK). The rheometer geometry
consisted of a 40 mm diameter parallel steel plate using a shear strain of 0.5 and an
oscillation frequency of 1 Hz for 30 min at 37°C. The complex modulus (G*) was
calculated as follows G*=stress*/strain.
5.2.2.9 In Vivo Gastric Imaging
Intragastric in vivo imaging of the stomach was performed as a part of an
educational TV programme (no ethical permission was required). The study was
conducted at the Mercy University Hospital (Cork, Ireland) with the supervision of
medically qualified clinical staff. The imaging was performed using MiroCam®
technology capsule endoscope. The camera wirelessly transmitted images at
approximately three images per second to the receptors/electrodes that were
attached to the torso of the subject and was equipped with a light emitting diode,
which transmitted light to allow correct imaging of solution. A young healthy man
swallowed the camera and then, drank about 500 mL of whole raw milk, equivalent to
the Raw sample described earlier.

Chapter 5: Effect of Milk Processing
188
5.2.2.10 Statistical Analysis
The results were expressed as means ± standard deviation of two replicates.
For each replicate, raw milk was collected, analysed (composition) and processed
independently, i.e. one milk per day. To identify differences in normally distributed
results within groups during gastric digestion, one-way ANOVA was applied. Where
overall significant interaction was observed (P < 0.05), the means of individual milk
treatments were compared using Tukey’s post hoc test. Statistical analyses were
performed using GraphPad Prism software (Prism 5 for Windows, Version 5.04).
5.3 Results
5.3.1 Gastric pH Profile
The simulation of the gastric phase was performed using the developed semi-
dynamic model described in Chapter 3 that can simulate the main biochemical
dynamics of the human stomach. These are gradual enzyme and acid secretion and
progressive GE. The changes in pH of the gastric emptied aliquots taken during
digestion are shown in Figure 5.3. The gastric model had a low initial pH of about 1
simulating the basal conditions and the pH increased rapidly, up to values of about 6,
after the addition of a sample from the oral phase. Subsequently, there was a
progressive decrease reaching pH values below 1.4 after 3 hours due to the
continuous gastric fluid secretion containing acid as well as the reduction of buffering
capacity of the digested food by GE. All samples showed a similar pH behaviour to
the predefined profile observed in in vivo studies (Malagelada et al., 1976). The mean
pH of the samples did not show any statistically significant differences except in the
initial (p = 0.034) and GE1 (p = 0.041) points. The mean pH between Raw and
UHT+Homo in GE1 were significantly different using the Tukey’s multiple comparison
post-hoc test.

Chapter 5: Effect of Milk Processing
189
Figure 5.3 Change in pH of milk aliquots emptied from the gastric digestion in the semi-dynamic model corresponding to each gastric emptying (GE) point. The time represents an approximation of the actual values displayed in Table 5.2. The pH values are referred to the basal stage (before gastric digestion), initial (milk sample including oral phase and basal volumes) and the different GE samples (GE1-GE5). Each data point is the mean of 2 independent determinations. Significance difference in pH between milk samples in each GE point was determined by one-way ANOVA, p < 0.05 (*).
In addition, the influence of removing the pepsin on the pH behaviour was
investigated. The pH profile of non-heated milk was affected by the presence of
pepsin (see Appendix D). In the case of Raw, the pH of the sample containing pepsin
decreased more promptly during the first hour than that of the sample without pepsin.
In contrast, the pH profile of the heat-treated samples without using pepsin did not
differ much to that with pepsin, in particular in the case of the UHT-treated samples.
5.3.2 Gastric Behaviour
Using the semi-dynamic model, a range of different structures and behaviours
during gastric digestion were observed to form within the gastric compartment (Figure
5.4 and Figure 5.5). Protein coagulation was visible for all the samples within the first
10 min of digestion and the formation of larger aggregates was observed a few
minutes later, at which time the pH ranged from 5.5 to 6. Subsequently, there was the
formation of a more compact coagulum with clear serum within the following 15 min.
Differences in coagulum consistency were observed throughout the gastric phase as
illustrated in Figure 5.4. There were remarkable differences, in particular, between the
firm coagulum of Raw (Figure 5.4 A) and the fragmented structure of UHT+Homo
(Figure 5.4 I). In the absence of pepsin, we observed delayed aggregation and
formation of coagula. Protein coagulation was visually observed after 75 min at which
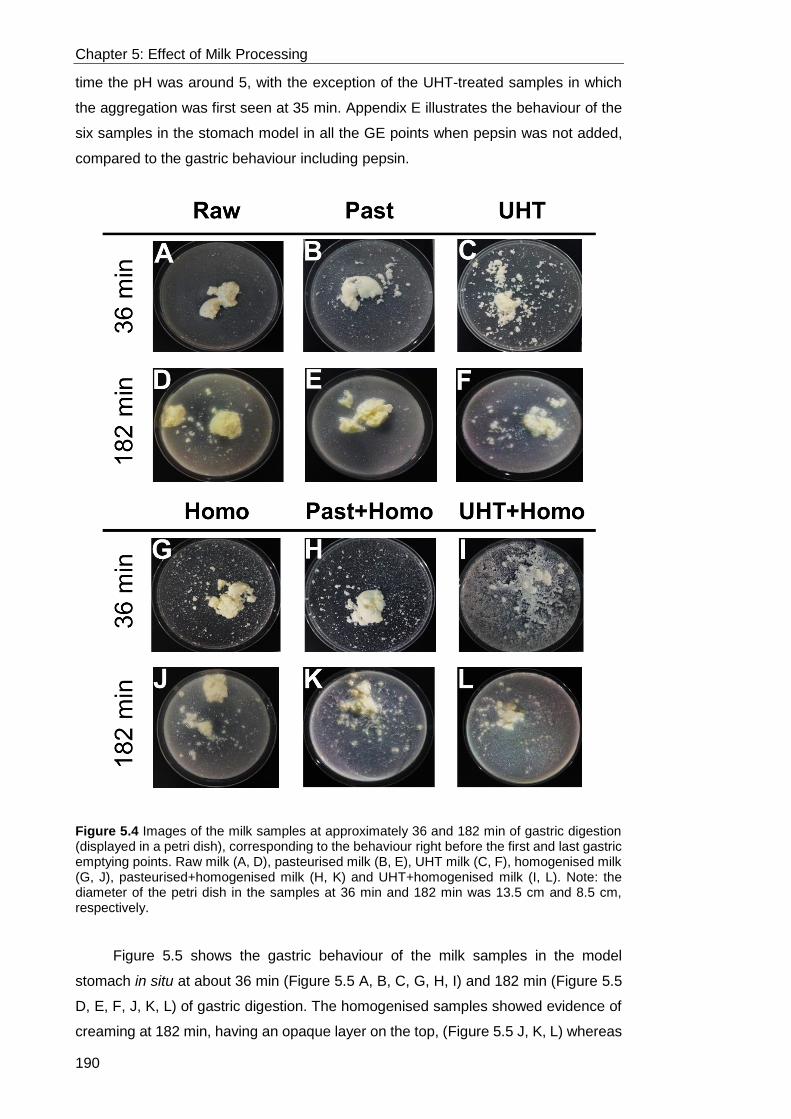
Chapter 5: Effect of Milk Processing
190
time the pH was around 5, with the exception of the UHT-treated samples in which
the aggregation was first seen at 35 min. Appendix E illustrates the behaviour of the
six samples in the stomach model in all the GE points when pepsin was not added,
compared to the gastric behaviour including pepsin.
Figure 5.4 Images of the milk samples at approximately 36 and 182 min of gastric digestion (displayed in a petri dish), corresponding to the behaviour right before the first and last gastric emptying points. Raw milk (A, D), pasteurised milk (B, E), UHT milk (C, F), homogenised milk (G, J), pasteurised+homogenised milk (H, K) and UHT+homogenised milk (I, L). Note: the diameter of the petri dish in the samples at 36 min and 182 min was 13.5 cm and 8.5 cm, respectively.
Figure 5.5 shows the gastric behaviour of the milk samples in the model
stomach in situ at about 36 min (Figure 5.5 A, B, C, G, H, I) and 182 min (Figure 5.5
D, E, F, J, K, L) of gastric digestion. The homogenised samples showed evidence of
creaming at 182 min, having an opaque layer on the top, (Figure 5.5 J, K, L) whereas

Chapter 5: Effect of Milk Processing
191
the non-homogenised samples displayed sedimentation throughout the digestion
(Figure 5.5 D, E, F). In the homogenised samples, phase separation was initially
observed when aggregates could form a layer at the top, with a cloudy layer in the
middle part and clearer layer in the bottom at about 109 min. The behaviour of the
samples was different in the absence of pepsin since there was no phase separation
and the coagulum of all the samples remained on the bottom of the vessel (see
Appendix E 2, 5 and 6).
Figure 5.5 Images of the milk samples at approximately 36 and 182 min displayed in the reaction vessel of the gastric model. Raw milk (A, D), pasteurised milk (B, E), UHT milk (C, F), homogenised milk (G, J), pasteurised+homogenised milk (H, K) and UHT+homogenised milk

Chapter 5: Effect of Milk Processing
192
(I, L). The images correspond to the behaviour right before the emptying corresponding to that time, i.e. GE1 at 36 min and GE5 at 182 min.
The consistency of the milk coagulum was further studied by small deformation
rheology analysing the coagulum remaining in the last point of digestion, at 180 min.
Table 5.3 shows the values of the complex modulus (G*) obtained after 15 min of
measurement. The non-heated samples, Raw and Homo, generated the highest
value of G*. The pasteurised samples (Past and Past+Homo) presented intermediate
values. The lowest G* values were found in UHT and UHT+Homo, which were an
order of magnitude lower than the Raw and Homo samples. The same behaviour was
observed during the rheological analysis, which was performed for 30 min. It is
important to note that some alteration of the structure could have been induced while
transferring the sample to the rheometer in order to perform the analysis.
Table 5.3 Mean diameter (d4,3) of the initial samples (before digestion), with and without SDS addition, and the last gastric emptying (GE) point, i.e. GE5, including SDS. The values represent the mean and standard deviation of two independent replicates. Values of the complex module, G*, at 15 min of shear of the milk coagulum collected at GE5 time (after about 182 min). Means within the same column and having the same superscript lowercase letter and means within the same superscript uppercase letter are not significantly different by Tukey’s t-test at p < 0.05.
5.3.3 Microstructure of the Gastric Emptied Aliquots
The coagulation, observed within the first 15 min of digestion, was reflected in
the microstructures of the emptied samples determined using confocal microscopy
(Figure 5.6). There were differences in the structure of the protein matrix in the first
stages of gastric digestion. The non-heated samples, in particular Raw, seemed to
form a more compact and dense network (Figure 5.6 D) in accordance with the visual
observation. This differed from the heated samples, in particular UHT (Figure 5.6 F),
in which the structure of the protein coagulum was open with more pores. This can
be linked with the particulate and soft macrostructure observed. Moreover, in the GE1
point of the non-homogenised samples (Figure 5.6 D, E, F), there appeared to be
more native fat droplets in the aqueous phase compared to non-homogenised
samples, and also showing some coalescence. In contrast, the fat droplets seemed
d4,3 (µm)
Initial Initial+SDS GE5+SDS G* (Pa)
Raw 2.48±0.48aA 2.96±0.08aA 8.26±5.44aA 4,555±236a Past 2.49±0.61aA 3.62±0.65aA 6.92±2.26aA 2,934±1426a UHT 2.49±0.15aA 3.82±0.02aA,B 4.28±0.57aB 501±186b Homo 0.42±0.02bA 0.37±0.01bA 0.42±0.03aA 4,113±501a Past+Homo 0.34±0.01bA 0.87±0.77bA 2.99±2.23aA 1,569±730b UHT+Homo 0.35±0.06bA 0.41±0.08bA 0.97±0.70aA 206±45b

Chapter 5: Effect of Milk Processing
193
to be easily entrapped in protein network of the homogenised samples (Figure 5.6 M,
N, O), in which fine particles could be seen distributed within the coagulum particles,
in particular UHT+Homo (Figure 5.6 O). The effect of homogenisation on the structure
at the end of gastric digestion (182 min) was significant. All the homogenised samples
presented a great number of small aggregates (Figure 5.6 P, Q, R) compared to the
large particles of non-homogenised samples (Figure 5.6 G, H, I).
Figure 5.6 Examples of confocal microscopy images of the milk samples before digestion (Initial) and, at about 36 min (GE1) and 182 min (GE5) of gastric digestion. Raw milk (A, D, G), pasteurised milk (B, E, H), UHT milk (C, F, I), homogenised milk (J, M, P), pasteurised+homogenised milk (K, N, Q), UHT+homogenised milk (L, O, R). Red shows the lipid and green shows the protein. The scale bar corresponds to 75 µm.
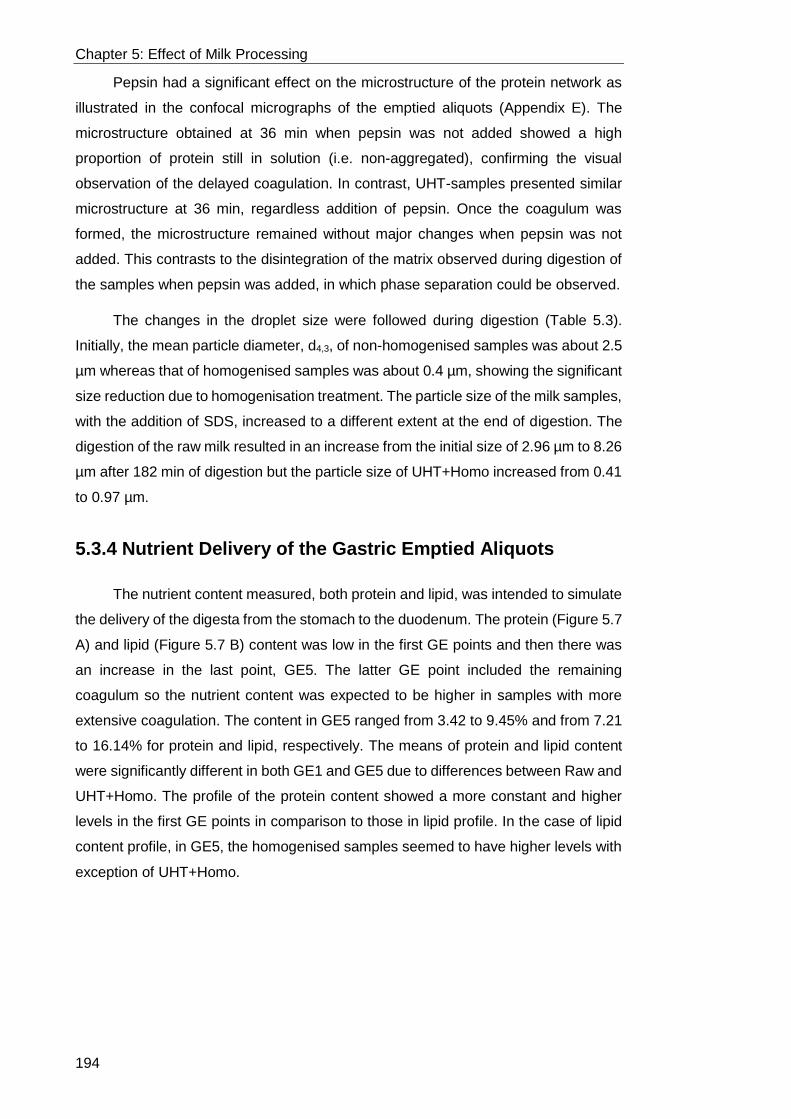
Chapter 5: Effect of Milk Processing
194
Pepsin had a significant effect on the microstructure of the protein network as
illustrated in the confocal micrographs of the emptied aliquots (Appendix E). The
microstructure obtained at 36 min when pepsin was not added showed a high
proportion of protein still in solution (i.e. non-aggregated), confirming the visual
observation of the delayed coagulation. In contrast, UHT-samples presented similar
microstructure at 36 min, regardless addition of pepsin. Once the coagulum was
formed, the microstructure remained without major changes when pepsin was not
added. This contrasts to the disintegration of the matrix observed during digestion of
the samples when pepsin was added, in which phase separation could be observed.
The changes in the droplet size were followed during digestion (Table 5.3).
Initially, the mean particle diameter, d4,3, of non-homogenised samples was about 2.5
µm whereas that of homogenised samples was about 0.4 µm, showing the significant
size reduction due to homogenisation treatment. The particle size of the milk samples,
with the addition of SDS, increased to a different extent at the end of digestion. The
digestion of the raw milk resulted in an increase from the initial size of 2.96 µm to 8.26
µm after 182 min of digestion but the particle size of UHT+Homo increased from 0.41
to 0.97 µm.
5.3.4 Nutrient Delivery of the Gastric Emptied Aliquots
The nutrient content measured, both protein and lipid, was intended to simulate
the delivery of the digesta from the stomach to the duodenum. The protein (Figure 5.7
A) and lipid (Figure 5.7 B) content was low in the first GE points and then there was
an increase in the last point, GE5. The latter GE point included the remaining
coagulum so the nutrient content was expected to be higher in samples with more
extensive coagulation. The content in GE5 ranged from 3.42 to 9.45% and from 7.21
to 16.14% for protein and lipid, respectively. The means of protein and lipid content
were significantly different in both GE1 and GE5 due to differences between Raw and
UHT+Homo. The profile of the protein content showed a more constant and higher
levels in the first GE points in comparison to those in lipid profile. In the case of lipid
content profile, in GE5, the homogenised samples seemed to have higher levels with
exception of UHT+Homo.
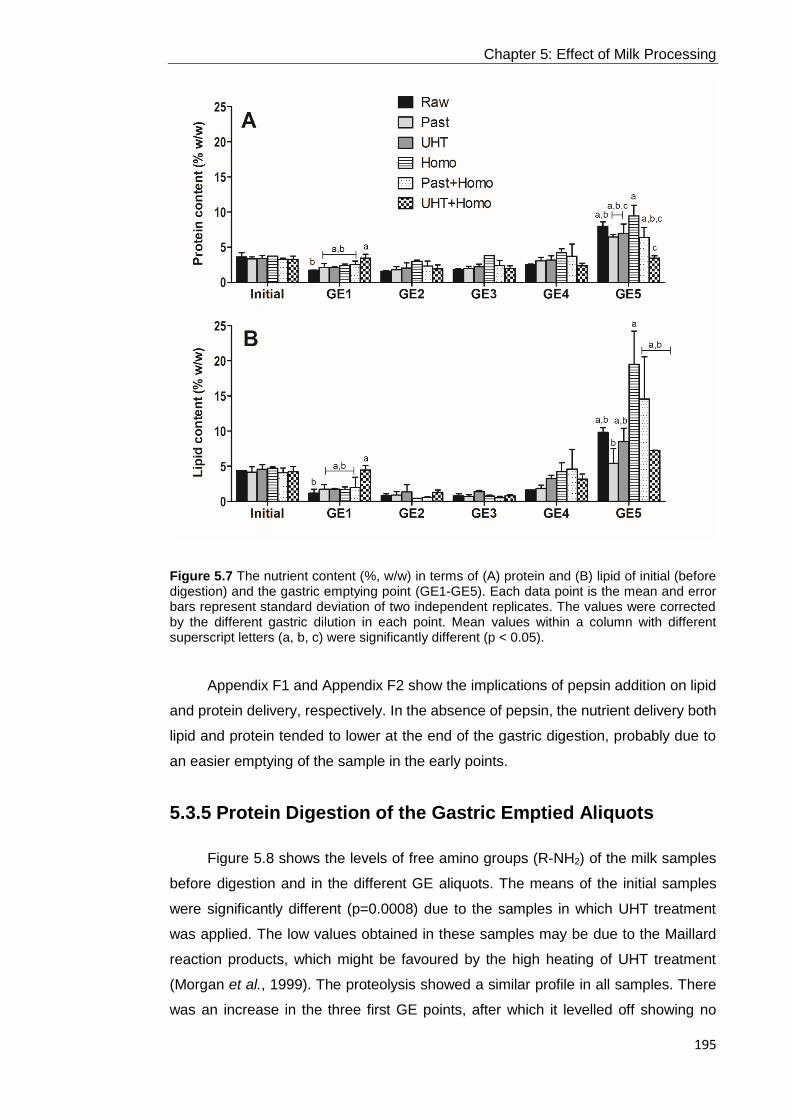
Chapter 5: Effect of Milk Processing
195
Figure 5.7 The nutrient content (%, w/w) in terms of (A) protein and (B) lipid of initial (before digestion) and the gastric emptying point (GE1-GE5). Each data point is the mean and error bars represent standard deviation of two independent replicates. The values were corrected by the different gastric dilution in each point. Mean values within a column with different superscript letters (a, b, c) were significantly different (p < 0.05).
Appendix F1 and Appendix F2 show the implications of pepsin addition on lipid
and protein delivery, respectively. In the absence of pepsin, the nutrient delivery both
lipid and protein tended to lower at the end of the gastric digestion, probably due to
an easier emptying of the sample in the early points.
5.3.5 Protein Digestion of the Gastric Emptied Aliquots
Figure 5.8 shows the levels of free amino groups (R-NH2) of the milk samples
before digestion and in the different GE aliquots. The means of the initial samples
were significantly different (p=0.0008) due to the samples in which UHT treatment
was applied. The low values obtained in these samples may be due to the Maillard
reaction products, which might be favoured by the high heating of UHT treatment
(Morgan et al., 1999). The proteolysis showed a similar profile in all samples. There
was an increase in the three first GE points, after which it levelled off showing no
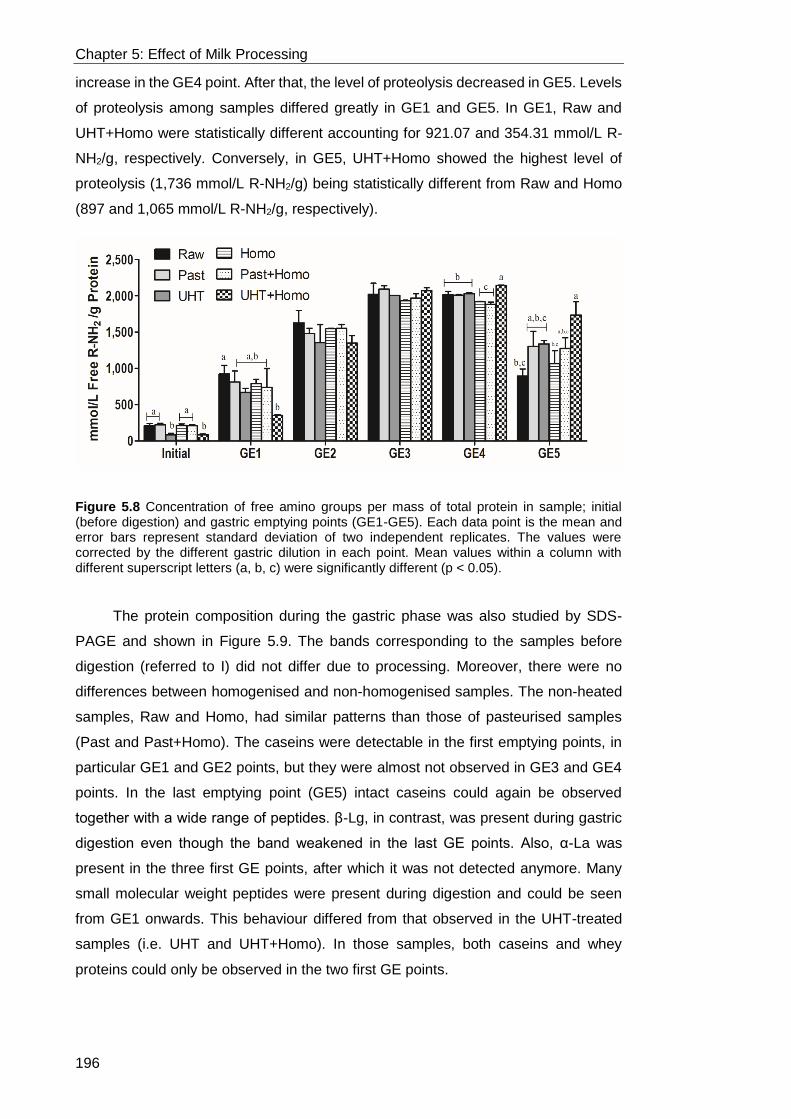
Chapter 5: Effect of Milk Processing
196
increase in the GE4 point. After that, the level of proteolysis decreased in GE5. Levels
of proteolysis among samples differed greatly in GE1 and GE5. In GE1, Raw and
UHT+Homo were statistically different accounting for 921.07 and 354.31 mmol/L R-
NH2/g, respectively. Conversely, in GE5, UHT+Homo showed the highest level of
proteolysis (1,736 mmol/L R-NH2/g) being statistically different from Raw and Homo
(897 and 1,065 mmol/L R-NH2/g, respectively).
Figure 5.8 Concentration of free amino groups per mass of total protein in sample; initial (before digestion) and gastric emptying points (GE1-GE5). Each data point is the mean and error bars represent standard deviation of two independent replicates. The values were corrected by the different gastric dilution in each point. Mean values within a column with different superscript letters (a, b, c) were significantly different (p < 0.05).
The protein composition during the gastric phase was also studied by SDS-
PAGE and shown in Figure 5.9. The bands corresponding to the samples before
digestion (referred to I) did not differ due to processing. Moreover, there were no
differences between homogenised and non-homogenised samples. The non-heated
samples, Raw and Homo, had similar patterns than those of pasteurised samples
(Past and Past+Homo). The caseins were detectable in the first emptying points, in
particular GE1 and GE2 points, but they were almost not observed in GE3 and GE4
points. In the last emptying point (GE5) intact caseins could again be observed
together with a wide range of peptides. β-Lg, in contrast, was present during gastric
digestion even though the band weakened in the last GE points. Also, α-La was
present in the three first GE points, after which it was not detected anymore. Many
small molecular weight peptides were present during digestion and could be seen
from GE1 onwards. This behaviour differed from that observed in the UHT-treated
samples (i.e. UHT and UHT+Homo). In those samples, both caseins and whey
proteins could only be observed in the two first GE points.

Chapter 5: Effect of Milk Processing
197
Figure 5.9 SDS-PAGE (under reducing conditions) of the milk samples, initial (I) referred to before digestion and the gastric emptying points (GE1-GE5), and a molecular weight marker. The samples are labelled in the figure accordingly. The protein content in each sample was 0.1%.
Appendix G1 to Appendix G6 show the protein composition in the emptied
points when pepsin was not added, in comparison to the samples in which pepsin was
added. The patterns in all the GE points in absence of pepsin were the same showing
no effect of protein degradation due to acidification.
5.3.6 In Vivo Intragastric Imaging
In vivo intragastric imaging using capsule endoscopy was performed in one
subject and some of the resulting images are shown in Figure 5.10. Following
consumption of raw whole milk, the formation of solid chunks of different sizes was
clearly observed after 160 min as seen in Figure 5.10 B, even though there was
evidence of this aggregation earlier on in the gastric digestion.

Chapter 5: Effect of Milk Processing
198
Figure 5.10 . In vivo images taken by MiroCam® of (A) emptied human stomach and (B) after 160 min gastric digestion of raw whole milk.
5.4 Discussion
5.4.1 Influence of Process-Induced Changes of milk on Gastric
Behaviour
By using a physiologically relevant gastric model described in Chapter 3, we
have been able to show that homogenised samples showed significantly more
creaming compared to non-homogenised samples where sedimentation was
observed, regardless of the heat treatment (Figure 5.5). Homogenisation caused the
disruption of the native MFGM, reduced the droplet size and promoted adsorption of
milk proteins, in particular caseins, onto the droplet surface (Lopez, 2005; Sharma et
al., 1993). This change of the droplet interfacial composition might be one of the main
reasons for the distinct gastric behaviour. The milk proteins on the droplet surface,
especially the denatured and aggregated proteins in the heated UHT+Homo sample,
were more susceptible to be hydrolysed by pepsin leading to the destabilisation of the
droplets by flocculation and some coalescence, and ultimately leading to the phase
separation observed. The non-homogenised samples, in contrast, still possessed the
native MFGM, which could provide more stability during gastric digestion. These
structural changes were certainly due to the proteolytic action of pepsin since there
was less phase separation and no creaming in the homogenised samples when
pepsin was absent (Appendix E 2, 5 & 6). Further investigation was undertaken in
order to gain insight into the mechanism of the different gastric behaviour observed.
The lipid/protein ratio in both coagulum and serum in the first GE point was
determined (Figure 5.11) and the separate amount of protein and lipid is shown in
Appendix H. The non-homogenised samples had significantly higher lipid/protein ratio
in the serum compared to the homogenised samples. Moreover, the microstructure

Chapter 5: Effect of Milk Processing
199
imaging showed that most of the droplets in the non-homogenised samples tended to
be in the serum (Figure 5.6 D-F) compared to those of the homogenised samples
(Figure 5.6 M-O). This might be due to easier incorporation of the smaller droplets
into the coagulum and also the possible interactions of the milk proteins adsorbed
onto the droplet surface following homogenisation, with the protein network that was
formed within the gastric compartment. Therefore, a higher inclusion of droplets into
the protein matrix could lead to a lower density of the coagulum resulting in the
creaming whereas the higher lipid content in the serum seen in the non-homogenised
samples could lead to a dense coagulum that sedimented. Hence, the different
colloidal behaviour of the samples was driven by both droplet destabilisation and
aggregate density. These possible underlying mechanisms of this gastric behaviour
are illustrated in Figure 5.12.
Figure 5.11 Lipid/protein ratio (w/w) of both serum and coagulum in the digesta at approximately 36 min of digestion (time referred to GE1 point). Mean values within a column with different superscript letters (a, b, c, d) were significantly different (p < 0.05).

Chapter 5: Effect of Milk Processing
200
Figure 5.12 Schematic representation of the possible mechanisms for the creaming observed in homogenised milks. These two mechanisms may occur simultaneously. (A) Fat globules in raw milk are surrounded by the complex milk fat globule membrane (MFGM). (B) Homogenisation forms smaller droplets with new interface consisting mainly of absorbed milk proteins (adapted from Michalski et al. (2006)) (C) the fat droplet membrane could provide some protection against protein hydrolysis. In contrast, (D) the absorbed milk proteins at the droplet interface could be more susceptible to be hydrolysed by pepsin. This could lead to destabilisation of the fat droplets (flocculation and coalescence), resulting in creaming. The second possible mechanism involves the entrapment of the fat droplets. During gastric digestion, casein micelles coagulate forming a coagulum of different consistency. (E) the larger droplets of the non-homogenised milks might be less prone to be entrapped in the protein network, providing denser coagulum that sediments (F). In contrast, (G) the incorporation of the smaller, homogenised droplets into the protein matrix might be easier, which could also imply a higher extent of interaction. This could lead to the formation of a lighter coagulum that could cream within the stomach model (H).

Chapter 5: Effect of Milk Processing
201
Heat treatment was shown to be the main driver for the differences in coagulum
consistency. The possible mechanism is illustrated in Figure 5.13. Both pasteurisation
(72°C for 15 s) and UHT (140°C for 3 s) treatments were used and compared to the
non-heated raw milk. It is well established that heating above 70°C induces the
denaturation of whey proteins, in particular β-Lg. The extent of whey protein
denaturation in UHT milk is much higher than that in pasteurised milk (Douglas et al.,
1981). The denatured whey proteins have been reported to interact with κ-casein,
forming complexes both at casein micelle surface and in serum phase, the prevalence
of which depends on the pH of the heated milk (Anema et al., 2011). Therefore, the
level of protein association is higher in UHT-treated compared to that of pasteurised
milk. This could have impaired casein coagulation and led to the more fragmented
structures obtained in heated milk samples, in particular UHT (Figure 5.4). This
different consistency persisted throughout digestion and the rheological analysis
(Table 5.3) confirmed that the heat treatment was the main cause of the change in
consistency of the coagulum.

Chapter 5: Effect of Milk Processing
202
Figure 5.13 Schematic representation of the possible mechanism for the different consistency of the coagulum observed in heat-treated milks. (A) In raw milk, caseins are ensembled in micelles, with κ-casein on the surface providing steric stability, and whey proteins are in the native state. (B) When heat treatment above 70°C are applied, whey proteins are denatured, which can interact with κ-casein both at the surface of the micelle and forming complexes in the serum. (C) During gastric digestion, pepsin cleaves the Phe105-Met106 bond, which separates para-κ-casein from caseinomacropeptide (CMP). This destabilises the casein micelles leading to aggregation. (D) In the case of raw milk, this coagulation is compact. In contrast, (E) the coagulation of casein micelles in the UHT-treated samples is impaired due to the steric effect of the modified micelle surface and the complexes in the serum. The different ionic calcium availability could also have an effect.
The initial protein aggregation to form the coagulum and the gastric behaviour
was induced by pepsin action. The protein aggregation was visually observed within
the first 10 min, at which time the pH was above 5.5. In contrast, when pepsin was
not included, the protein aggregation was observed after 75 min at which the pH was
around 5. It has been reported that the pH for coagulation of unheated and heated
milk is about 5 and 5.3 respectively (Donato et al., 2007). In accordance to Ye et al.
(2016a) there was an abrupt decrease of pH when pepsin was absent in raw milk
digestion linked to the late formation of the solid coagulum. In contrast, the pH profile
of the UHT-treated samples was similar in the absence of pepsin due to the similar
gastric behaviour (Appendix D). Pepsin has been reported to favour the hydrolysis of
κ-caseins among the other caseins at pH 6.0 (Tam et al., 1972). The coagulation is
caused by the destabilisation of casein micelles since pepsin cleaves the Phe-105-
Met-106 bond in κ-casein liberating caseinomacropeptide, which is the same
mechanism than that for chymosin (Drøhse et al., 1989) that is used for cheese
making. Hence, it seems possible to draw parallels to the effects of heat-induced
Chapter 5: Effect of Milk Processing
203
changes on the functional properties, which has been widely reported for rennet
coagulation. Kethireddipalli et al. (2010) showed that the poor rennet clotting of heat-
treated milk resulting in weak curds was due to the interactive effect of the following:
(i) modification of the surface of casein micelles with bound denatured whey proteins;
(ii) formation of soluble complexes between denatured whey proteins and κ-casein;
(iii) reduction of calcium concentration in the serum. In the present study, milk was
heated at its natural pH (6.67). It was shown that about 30% of whey proteins can
bind to the micelle surface when milk, at the mentioned pH, was heated at 90°C
(Kethireddipalli et al., 2010). This impairs the micelle aggregation by steric effects,
which in combination with the protein complexation and alteration of the ionic
equilibrium in the serum may explain the different consistency of the coagulum
obtained in the present study. For cheese, it was also reported that smaller fat droplets
can reduce curd contraction, resulting in higher cheese moisture (Giroux et al., 2014;
Thomann et al., 2008), which is in line with the more compact coagulum obtained in
the non-homogenised milks.
It is important to note that in this study the heat treatment was followed by
homogenisation. Lee et al. (2002) reported that the content of milk protein on the
droplet surface was not significantly different whether homogenisation was performed
before and after heat treatment. However, the impact of the order of these processes
is still subject of past and current research projects.
The comparison of the obtained gastric behaviour with other studies is difficult
because the in vivo studies using similar samples did not show the structural changes
in the stomach even though they suggested similar behaviours in terms of the
consistency of coagulum (Lacroix et al., 2008). Moreover, most in vitro studies use a
static model, which does not allow full assessment of the structural changes.
Nevertheless, the results in terms of coagulation behaviour, timing and consistency,
were in agreement with the findings reported by Ye et al. (2017) using a dynamic
model, the Human Gastric Simulator. Moreover, the in vivo images showed the
formation of these solid coagula (Figure 5.10 B) in accordance to our findings.
5.4.2 Effect of Gastric Behaviour on Nutrient Delivery and
Protein Digestion
The gastric behaviour caused by the milk processing affected the nutrients
emptied and protein digestion kinetics. The sampling method simulating the GE, by
sampling from the bottom of the vessel, was influenced by the consistency of the
coagulum. Mostly serum liquid was emptied in the first GE points for the samples
Chapter 5: Effect of Milk Processing
204
having a firmer coagulum, in particular Raw (Figure 5.4 A) accounting for the lowest
content of nutrients delivered in the GE1 (Figure 5.7). In contrast, the very soft
coagulum obtained from UHT+Homo (Figure 5.4 F) allowed more of the coagulum to
be emptied. Hence, the delivery of both lipid and protein in GE1 was the highest for
UHT+Homo (Figure 5.7). It was found that the release of lipid (Figure 5.7 A) was
influenced by the phase separation obtained in the homogenised samples. The lipid
content in GE5 point was generally higher in the homogenised samples, as the cream
layer remained at the top of the in vitro stomach until the last GE point. One exception
for that was UHT+Homo due to the high nutrient content at early stage. Similar results
could be seen in the protein profile (Figure 5.7 B) even though the differences were
more subtle. This might be due to the more constant delivery of protein throughout
digestion, which might be attributed to the emptying of serum containing mainly whey
proteins.
The proteolysis levels might be linked to the consistency of the coagulum, which
was mainly affected by heat treatment. The softness of the coagulum (Table 5.3) and
the greater number of smaller particles (Figure 5.4) from the heat-treated samples, in
particular in the UHT+Homo could provide a greater particle surface area for pepsin
activity and allow pepsin diffusion within the structure leading to the higher proteolysis
obtained at the end of digestion (Figure 5.8). In contrast the lowest level of proteolysis
was found in raw milk, in which the hardness of the coagulum and larger particles
hampered the pepsin accessibility. The UHT treatment resulted in an enhancement
of both caseins and whey protein digestion (Figure 5.9). For the UHT samples, almost
no detectable intact caseins or whey proteins were found after 73 min, corresponding
to the GE2 point. This finding is in agreement with the protein composition of the
heated homogenised milk shown in Ye et al. (2017). UHT treatment has been reported
to greatly denature β-Lg, which exposes the peptide bonds to pepsin. The
temperature of the pasteurisation process was not sufficient to induce any important
changes in the protein digestion; the SDS-PAGE profile did not differ from that
obtained of the non-heated samples similarly to the observations of Wada et al. (2014)
during in vitro gastric digestion. β-lg remained largely intact during gastric digestion,
which was already reported in humans with the ingestion of purified caseins and β-Lg
(Mahé et al., 1996). The degradation of α-La was observed after about 109 min (GE3)
at which the pH was under 4, which is in agreement with its pepsin hydrolysis
susceptibility by the change of protein conformation at that pH.

Chapter 5: Effect of Milk Processing
205
5.4.3 Physiological Relevance
This study has shown that the processing of milk can result in different
coagulation and colloidal behaviour during gastric digestion influencing the nutrient
digestion kinetics in vitro, and the restructuring of milk in the human stomach was
clearly illustrated. This may influence nutrient bioavailability and rates of absorption
in the intestine, and the subsequent metabolic responses.
The gastric behaviour of dairy systems observed in the stomach have been
shown to influence satiety responses, which are linked partly to the release of gut
hormones such as cholecystokinin (CCK). The clinical study performed by Mackie et
al. (2013) showed that the sedimentation of a semi-solid matrix (cheese and yogurt)
caused a lower GE rate and prolonged fullness response, in contrast to the isocaloric
comparison in a liquid matrix, which creamed and resulted in increased hunger. In the
present study, we observed creaming and sedimentation processes in the
homogenised and non-homogenised samples respectively. Therefore, one might
expect that non-homogenised samples may induce more fullness compared to the
homogenised samples. However, according to the nutrient delivery results obtained
in this study, UHT+Homo showed early release of both protein and lipid, which may
promote the release of CCK and thus increase satiety. This information could be used
to design products which behave in the gastric phase in a way to control rate and
profiles of nutrient release and to optimise the satiety response.
The heat treatment of milk has been reported to affect protein postprandial
kinetics in vivo. Lacroix et al. (2008) showed that the UHT treatment enhanced the
rate of digestion of milk protein causing a higher transfer of dietary nitrogen into serum
amino acids and protein, but pasteurisation treatment did not alter the outcome. In the
present study, in agreement with the in vivo data, the UHT treated samples had a
higher protein release in the early stages of digestion, in particular UHT+Homo. Also,
these samples showed higher digestion of both caseins and whey proteins, which
may lead to a different postprandial release of peptides (Boutrou et al., 2013). This
different digestion may favour certain population groups, for instance the elderly and
athletes may benefit from a higher postprandial nitrogen absorption rate.
The metabolic responses relate to the nutrients delivered as a result of GE,
which is linked with the different structural changes occurring in the stomach. In the
present study, we used a linear GE rate of 2 kcal/min, which is considered to be the
average caloric content that is emptied in a regulated manner by the antrum (Hunt et
al., 1985). However, this is a simplistic approach since the GE rate may differ over
time in response to the dynamic nutrient release profile caused by the

Chapter 5: Effect of Milk Processing
206
physicochemical behaviour developed during gastric conditions, as was shown by
Mackie et al. (2013). Therefore, depending on the structural changes observed during
gastric digestion in the differently processed milk presented in this study, we expect
that the GE rate in humans would strongly depend on the sample processing
conditions.
5.5 Conclusion
In this study, it was shown that different forms of dairy processing induced
changes in the physicochemical properties of milk which affect their behaviour during
gastric digestion in vitro. This behaviour may impact nutrient metabolism in vivo. This
study showed for the first time, clear evidence of different milk behaviours,
sedimentation versus creaming in vitro, and the restructuring and coagulation of milk
in the human stomach. Homogenisation was the main driver for the gastric phase
separation (creaming), which was caused by the different droplet surface, droplet-
coagulum interactions and the overall effect on coagulum density. The different
consistencies of the coagula were as a consequence mainly of the heat treatment.
The non-heated samples, especially Raw, formed a firm coagulum whereas the
heated samples had a fragmented coagulum particularly observed in UHT+Homo.
This stems from the formation of complexes between whey proteins and caseins,
which weakens the protein network. These structural changes occurring during the
gastric phase resulted in different nutrient emptying profiles, with significant
differences between Raw and UHT+Homo, and quicker digestion of milk proteins in
the UHT-treated samples due to the drastic heat treatment. This study provides
valuable information for understanding the mechanisms controlling the GE of milk in
relation to its processing. This knowledge can be applied to manipulate the nutrient
release rate from dairy matrices addressed to specific population groups such as
increasing protein uptake in the elderly and athletes and prolonging satiety for those
at risk of obesity.
207
Pepsin Diffusion and Proteolysis in
Commercial Milks during Gastric
Digestion

Chapter 6: Pepsin Diffusion
208
6.1 Introduction
In Chapter 5, it was showed that raw milk formed a very tight coagulum
compared to the loose coagula obtained in the most processed milk (UHT treatment
and homogenisation). This resulted in faster protein digestion kinetics in the latter
sample and it was hypothesised that the main limiting factor was the diffusion of
pepsin in the coagula. Therefore, the present study aims to determine how the
diffusion of pepsin is affected by the gastric restructuring of commercial milks. The
activity of pepsin in different parts of the digesta at early and late stages of gastric
digestion was measured together with the hydrolysis and composition of protein in
order to follow the presence and action of pepsin. To investigate the microstructural
implications, scanning electron microscopy (SEM) was performed. Also, fluorescence
recovery after photobleaching (FRAP) technique was tested as a potential tool to
quantify the diffusion coefficient of pepsin during gastric digestion. This study provides
fundamental knowledge of gastric digestion in relation to pepsin diffusion, showing for
the first time the effect of pepsin during gastric digestion in commercial milks.
The structure of food has been reported to control nutrient digestion kinetics,
which is influenced by the interactions with the gastrointestinal (GI) tract. The
disintegration of food in the stomach has been seen to play a key role, as the site at
which enzymatic, chemical and physical processing occurs. The physiological
processes of the stomach are well understood although their influence in food
structures are not fully clear. The diffusion of enzymes is greatly influenced by the
structural characteristics and properties of the matrix, affecting the bioaccessibility of
nutrients (Singh et al., 2015).
The digestion of proteins begins in the stomach where pepsin breaks down
proteins into peptides. Pepsinogen is the precursor of pepsin, which is released by
chief cells in the stomach walls and is activated by acid hydrolysis to form pepsin. The
acidic pH is provided by the hydrochloric acid of the gastric juice. Pepsin is an aspartic
protease with two Asp-Thr-Gly sequences separated by 170-190 amino acids (AAs)
conferring its unique catalytic site (Dunn, 2001), in which the catalysis based on the
general acid-base mechanism occurs. The molecular weight from porcine pepsin is
34,620 Da and exhibits the maximum activity at pH 2 but it is inactive at pH 8 (Piper
et al., 1965). The preferential cleavage side of pepsin is in the aromatic AAs groups
of Phe, Tyr or Trp (Inouye et al., 1967).
Protein hydrolysis is affected by processing of milk protein gels differing in the
coagulation mode, concentration and heat treatment conditions, which confer different
structures. Macierzanka et al. (2012) studied the effect of gel structure, induced by
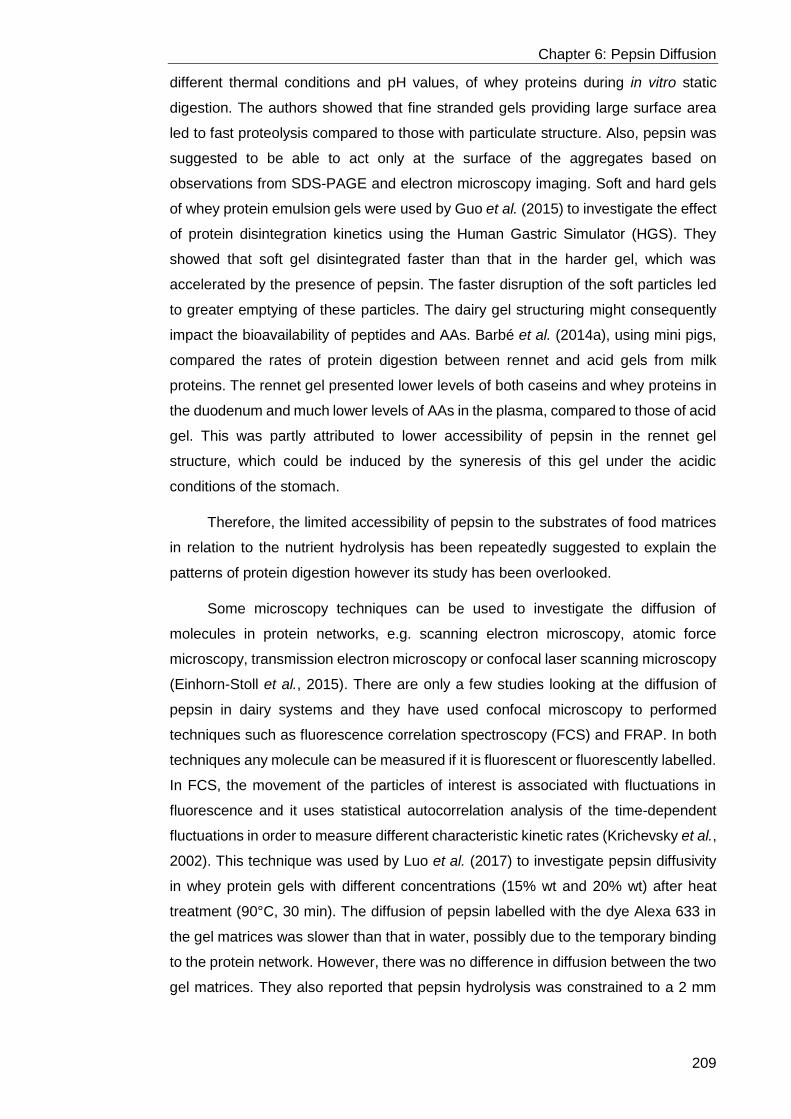
Chapter 6: Pepsin Diffusion
209
different thermal conditions and pH values, of whey proteins during in vitro static
digestion. The authors showed that fine stranded gels providing large surface area
led to fast proteolysis compared to those with particulate structure. Also, pepsin was
suggested to be able to act only at the surface of the aggregates based on
observations from SDS-PAGE and electron microscopy imaging. Soft and hard gels
of whey protein emulsion gels were used by Guo et al. (2015) to investigate the effect
of protein disintegration kinetics using the Human Gastric Simulator (HGS). They
showed that soft gel disintegrated faster than that in the harder gel, which was
accelerated by the presence of pepsin. The faster disruption of the soft particles led
to greater emptying of these particles. The dairy gel structuring might consequently
impact the bioavailability of peptides and AAs. Barbé et al. (2014a), using mini pigs,
compared the rates of protein digestion between rennet and acid gels from milk
proteins. The rennet gel presented lower levels of both caseins and whey proteins in
the duodenum and much lower levels of AAs in the plasma, compared to those of acid
gel. This was partly attributed to lower accessibility of pepsin in the rennet gel
structure, which could be induced by the syneresis of this gel under the acidic
conditions of the stomach.
Therefore, the limited accessibility of pepsin to the substrates of food matrices
in relation to the nutrient hydrolysis has been repeatedly suggested to explain the
patterns of protein digestion however its study has been overlooked.
Some microscopy techniques can be used to investigate the diffusion of
molecules in protein networks, e.g. scanning electron microscopy, atomic force
microscopy, transmission electron microscopy or confocal laser scanning microscopy
(Einhorn-Stoll et al., 2015). There are only a few studies looking at the diffusion of
pepsin in dairy systems and they have used confocal microscopy to performed
techniques such as fluorescence correlation spectroscopy (FCS) and FRAP. In both
techniques any molecule can be measured if it is fluorescent or fluorescently labelled.
In FCS, the movement of the particles of interest is associated with fluctuations in
fluorescence and it uses statistical autocorrelation analysis of the time-dependent
fluctuations in order to measure different characteristic kinetic rates (Krichevsky et al.,
2002). This technique was used by Luo et al. (2017) to investigate pepsin diffusivity
in whey protein gels with different concentrations (15% wt and 20% wt) after heat
treatment (90°C, 30 min). The diffusion of pepsin labelled with the dye Alexa 633 in
the gel matrices was slower than that in water, possibly due to the temporary binding
to the protein network. However, there was no difference in diffusion between the two
gel matrices. They also reported that pepsin hydrolysis was constrained to a 2 mm
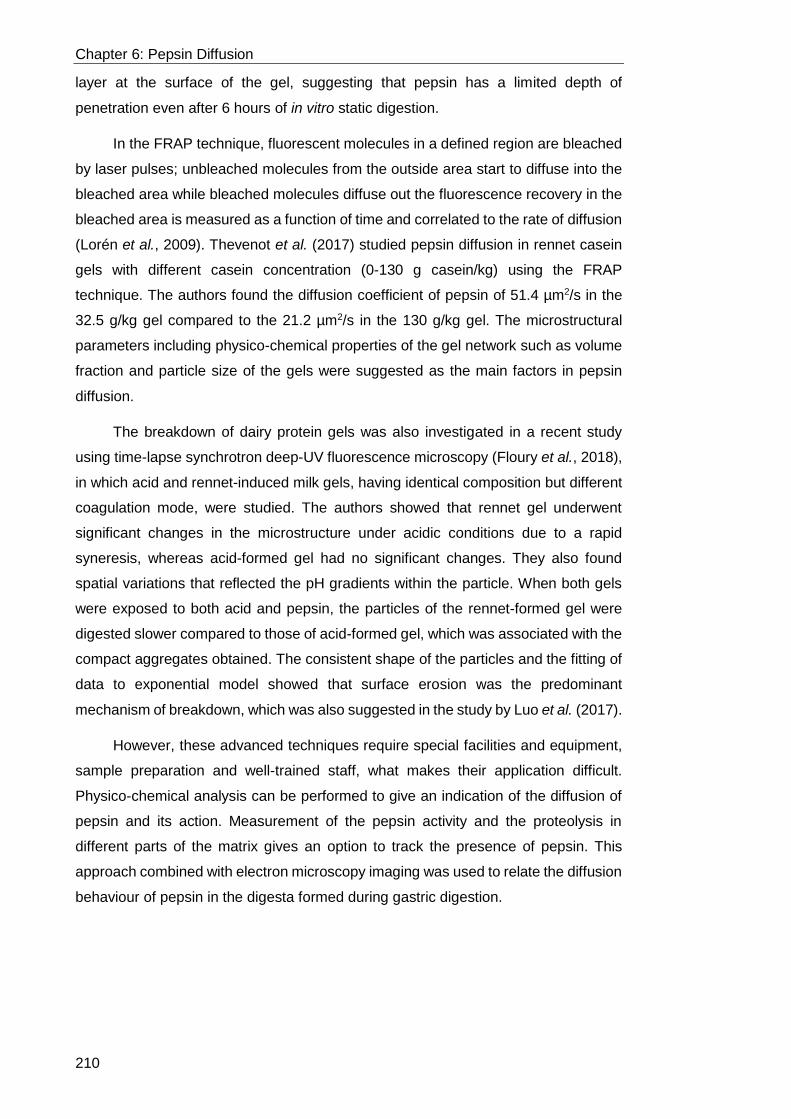
Chapter 6: Pepsin Diffusion
210
layer at the surface of the gel, suggesting that pepsin has a limited depth of
penetration even after 6 hours of in vitro static digestion.
In the FRAP technique, fluorescent molecules in a defined region are bleached
by laser pulses; unbleached molecules from the outside area start to diffuse into the
bleached area while bleached molecules diffuse out the fluorescence recovery in the
bleached area is measured as a function of time and correlated to the rate of diffusion
(Lorén et al., 2009). Thevenot et al. (2017) studied pepsin diffusion in rennet casein
gels with different casein concentration (0-130 g casein/kg) using the FRAP
technique. The authors found the diffusion coefficient of pepsin of 51.4 µm2/s in the
32.5 g/kg gel compared to the 21.2 µm2/s in the 130 g/kg gel. The microstructural
parameters including physico-chemical properties of the gel network such as volume
fraction and particle size of the gels were suggested as the main factors in pepsin
diffusion.
The breakdown of dairy protein gels was also investigated in a recent study
using time-lapse synchrotron deep-UV fluorescence microscopy (Floury et al., 2018),
in which acid and rennet-induced milk gels, having identical composition but different
coagulation mode, were studied. The authors showed that rennet gel underwent
significant changes in the microstructure under acidic conditions due to a rapid
syneresis, whereas acid-formed gel had no significant changes. They also found
spatial variations that reflected the pH gradients within the particle. When both gels
were exposed to both acid and pepsin, the particles of the rennet-formed gel were
digested slower compared to those of acid-formed gel, which was associated with the
compact aggregates obtained. The consistent shape of the particles and the fitting of
data to exponential model showed that surface erosion was the predominant
mechanism of breakdown, which was also suggested in the study by Luo et al. (2017).
However, these advanced techniques require special facilities and equipment,
sample preparation and well-trained staff, what makes their application difficult.
Physico-chemical analysis can be performed to give an indication of the diffusion of
pepsin and its action. Measurement of the pepsin activity and the proteolysis in
different parts of the matrix gives an option to track the presence of pepsin. This
approach combined with electron microscopy imaging was used to relate the diffusion
behaviour of pepsin in the digesta formed during gastric digestion.
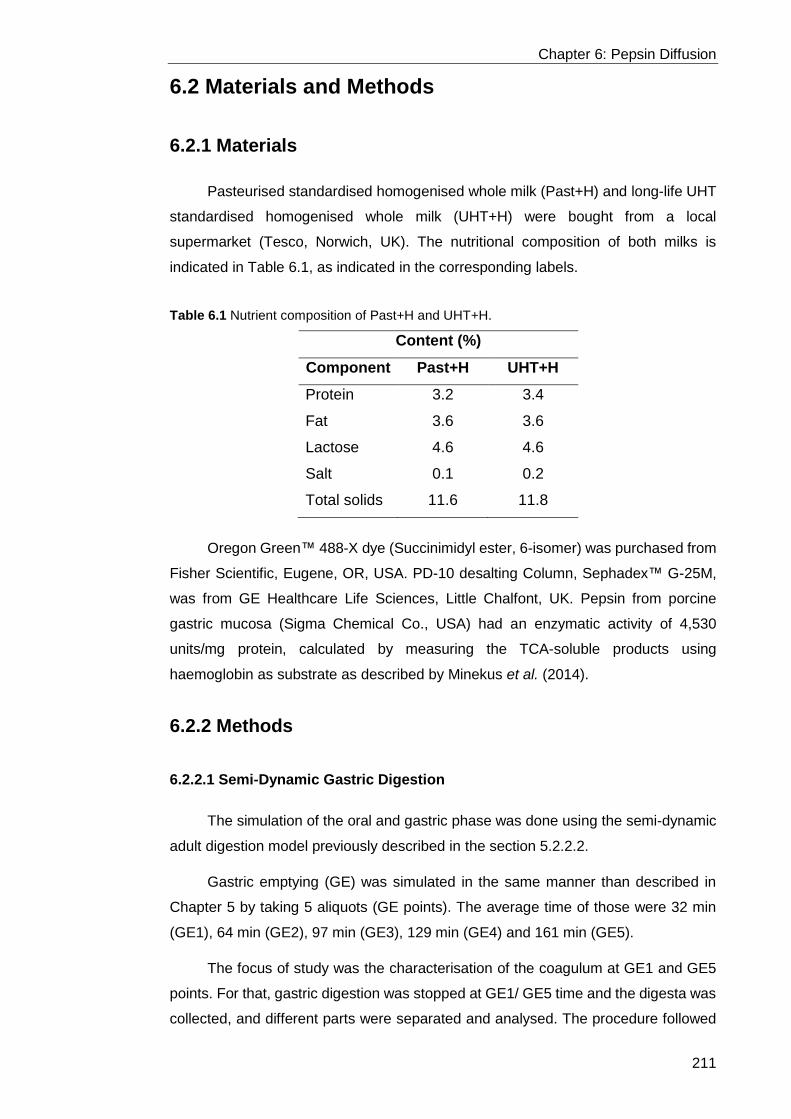
Chapter 6: Pepsin Diffusion
211
6.2 Materials and Methods
6.2.1 Materials
Pasteurised standardised homogenised whole milk (Past+H) and long-life UHT
standardised homogenised whole milk (UHT+H) were bought from a local
supermarket (Tesco, Norwich, UK). The nutritional composition of both milks is
indicated in Table 6.1, as indicated in the corresponding labels.
Table 6.1 Nutrient composition of Past+H and UHT+H.
Oregon Green™ 488-X dye (Succinimidyl ester, 6-isomer) was purchased from
Fisher Scientific, Eugene, OR, USA. PD-10 desalting Column, Sephadex™ G-25M,
was from GE Healthcare Life Sciences, Little Chalfont, UK. Pepsin from porcine
gastric mucosa (Sigma Chemical Co., USA) had an enzymatic activity of 4,530
units/mg protein, calculated by measuring the TCA-soluble products using
haemoglobin as substrate as described by Minekus et al. (2014).
6.2.2 Methods
6.2.2.1 Semi-Dynamic Gastric Digestion
The simulation of the oral and gastric phase was done using the semi-dynamic
adult digestion model previously described in the section 5.2.2.2.
Gastric emptying (GE) was simulated in the same manner than described in
Chapter 5 by taking 5 aliquots (GE points). The average time of those were 32 min
(GE1), 64 min (GE2), 97 min (GE3), 129 min (GE4) and 161 min (GE5).
The focus of study was the characterisation of the coagulum at GE1 and GE5
points. For that, gastric digestion was stopped at GE1/ GE5 time and the digesta was
collected, and different parts were separated and analysed. The procedure followed
Content (%)
Component Past+H UHT+H
Protein 3.2 3.4
Fat 3.6 3.6
Lactose 4.6 4.6
Salt 0.1 0.2
Total solids 11.6 11.8

Chapter 6: Pepsin Diffusion
212
for the collection of each part is illustrated in Figure 6.1. The digesta obtained at GE1
time, i.e. 32 min of Past+H sample was clearly separated into a tight coagulum and
serum, which contained small aggregates. A piece of the surface and inner parts from
the coagulum was taken using a blade and a volume of the serum was collected.
Then, the serum was filtered using a Buchner funnel with a Whatman paper filter no.
1 (Whatman®, Maidstone, UK) under vacuum, and a volume of the filtrated (called
Liquid) was collected. After 161 min (GE5 time), only a small piece of coagulum was
remaining, which had a soft consistency. The Figure 6.1 B shows the whiter serum
obtained, suggesting that part of the coagulum was dissolved into the serum. This
digesta was filtered in the same manner than previously described and a piece of the
surface and inner of the remaining coagulum was taken, as well as a volume of the
filtrated. The gastric behaviour of the UHT+H sample in gastric conditions was totally
different, which influenced the possibilities of the sampling. At 32 min of gastric
digestion the coagulum was very particulate and loose, which impaired the sampling
of the same parts than in Past+H sample. A volume of digesta was collected and
separated into solid and liquid fraction by filtration, collecting a portion of both
fractions. After 161 min of gastric digestion, the loose aggregates became even softer,
which was difficult to collect after filtration. Therefore a sample of the digesta was only
collected for analysis.
0.2 g of each mentioned parts was taken to measure the pepsin activity. Also,
about 0.3 g of the described parts of the sample was taken and mixed with 2.5 mL of
water. The sample was then mixed using a homogeniser (T25 Ultra-Turrax®, Ika-
Labortechnik, Germany) at approximately 9,500 rpm for 1 min to obtain a
homogenous sample for the remaining analysis. Then, the pH was increased above
pH 7 using NaOH (2 mol/L) in order to stop pepsin activity. Finally, samples were
snap-frozen in liquid nitrogen and stored at -20°C until subsequent treatment of SDS-
PAGE and OPA analyses.
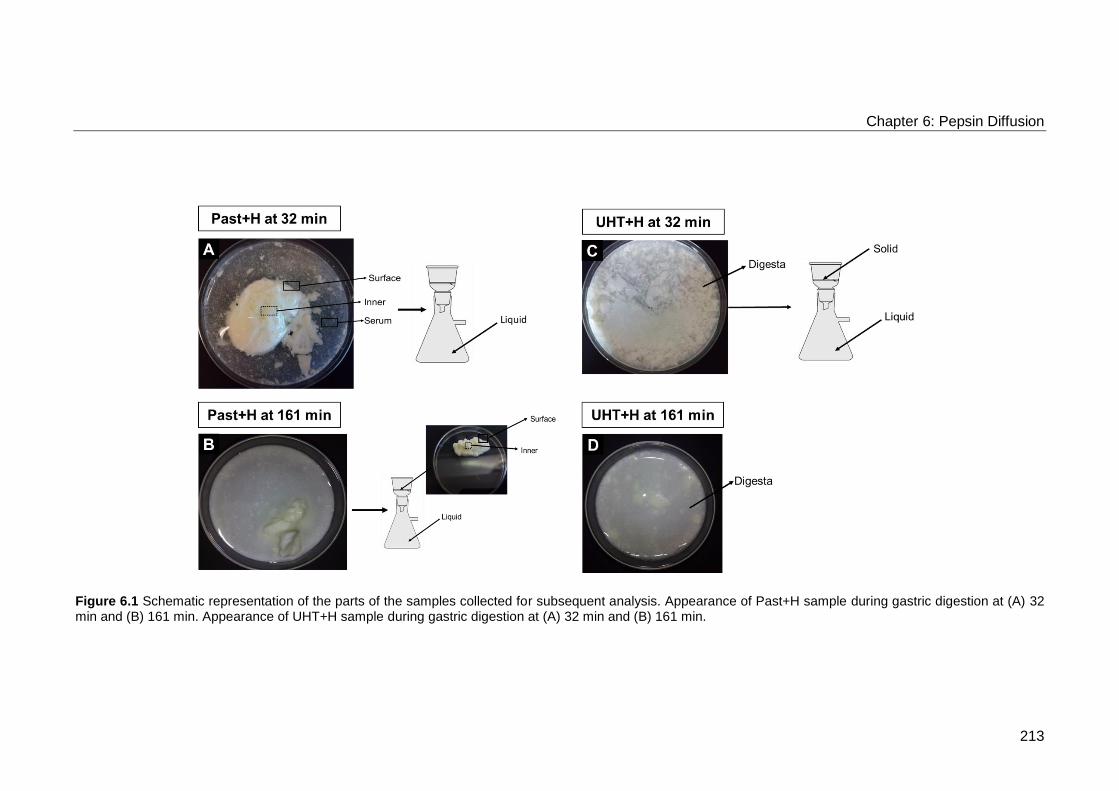
Chapter 6: Pepsin Diffusion
213
Figure 6.1 Schematic representation of the parts of the samples collected for subsequent analysis. Appearance of Past+H sample during gastric digestion at (A) 32 min and (B) 161 min. Appearance of UHT+H sample during gastric digestion at (A) 32 min and (B) 161 min.
Chapter 6: Pepsin Diffusion
214
6.2.2.2 Pepsin Activity Analysis
Pepsin activity was measured in the different parts of the coagulum following
the protocol of Meisel et al. (1984) with some modifications. The collected sample (0.2
g) was mixed with 1 mL HCl (0.01 mol/L) and the pH was adjusted to pH 2. Then, high
mixing by Ultra-Turrax® (9,500 rpm for 1 min) was used to break the structure of, in
particular, the solid particles of the Past+H at GE1 time. Then, 5 mL of haemoglobin
from bovine blood (25 g/L in 0.01 mol/L HCl) was added and the samples were
incubated at 37°C for 10 min. After incubation, the samples were treated with 10 mL
of 10% TCA and centrifuge at 5,000 rpm for 15 min at room temperature. The filtrated
was measure at 280 nm using a spectrophotometer (Libra S50, Biochrom US,
Holliston, MA). The blank sample received the same treatment as the sample, except
the addition of the sample was performed after the mixing of TCA and haemoglobin.
The equation for the calculation of the activity was as follows:
Equation 6.1 Equation used for the calculation of pepsin activity, calculated in units.
Activity (U) =(A280 − ABlank) x dilution
incubation time (min)x 0.001
6.2.2.3 OPA Assay for Quantification of Protein Hydrolysis
The concentration of free amino groups was determined using OPA assay,
which has been described in the section 2.2.4.3. The absorbance was measured at
340 nm using a multi-mode microplate spectrophotometer (Benchmark Plus™, Bio-
Rad, CA, USA).
6.2.2.4 SDS-PAGE for Identification of Proteins during Digestion
The protein composition in the samples was analysed by SDS-PAGE, described
in the section 2.2.4.2. The samples were further diluted 1:1 with water previous to the
treatment for the electrophoresis protocol.
6.2.2.5 Scanning Electron Microscopy
A separate gastric digestion was performed to obtain the coagulum of Past+H
and UHT+H, both GE1 and GE5 times, for imaging by scanning electron mycroscopy
(SEM). The coagulum obtained at 32 and 161 min of gastric digestion was cut into
cubes, measuring approximately 2x2x2 mm using a razor blade and fixed overnight
in 2.5% glutaraldehyde in 0.1 mol/L piperazine-N,N′-bis(2-ethanesulfonic acid)
(PIPES) buffer (pH 7.4). After washing with 0.1 mol/L PIPES buffer, the pieces were

Chapter 6: Pepsin Diffusion
215
post-fixed in 1% osmium tetroxide for 2 hours. The osmium tetroxide was then
removed and the pieces were washed three times in distilled water. Four pieces of
each sample were each put into a microporous specimen capsule (EMS, Hatfield,
USA) for critical point drying purposes. The sample pieces were dehydrated in a
series of ethanol solutions (30, 50, 70, 80, 90, 3x 100%). Samples were dried in a
Leica EM CPD300 critical point dryer using liquid carbon dioxide as the transition fluid.
Then, the sample pieces were mounted onto SEM stubs using agar silver paint and
left at room temperature to dry overnight. The pieces were then gently knocked with
the tip of fine-tipped tweezers to expose a fresh surface. The samples were coated
with gold in an agar high resolution sputter-coater apparatus. Electron microscopy
was carried out using a Zeiss Supra 55 VP FEG SEM, operating at 3 kV. This analysis
was performed by Kathryn Cross at Quadram Institute Bioscience.
6.2.2.6 Pepsin Labelling
Pepsin was labelled with Oregon Green™ 488-X dye according the
manufacturer instructions with some modifications. Five mg of pepsin was dissolved
in 0.5 mL sodium bicarbonate buffer (0.1 mol/L, pH 8.3). The fluorescence dye Oregon
Green 488 was dissolved in dimethyl sulfoxide at 10 mg/mL. A total amount of 5 µL
Oregon Green 488 was slowly added to the pepsin solution while mixing with a
magnetic stirrer. The mixture was incubated for 1 hour at room temperature with
continuous mixing protected from light. After incubation, the conjugate was purified
using PD-10 desalting column, Sephadex™ G-25M, which was previously
equilibrated with phosphate buffer saline (pH 7.4) and repeated twice in a different
column. The calculated degree of labelling was 1.56 and the activity of the labelled
pepsin was 13.1 U/mg, which was negligible compared to the activity of unlabelled
pepsin.
6.2.2.7 FRAP Experiments
The diffusion of pepsin was tested with FRAP technique using a laser scanning
confocal microscope, Zeiss LSM 780 confocal (Carl Zeiss, Inc.). Samples were
observed using a 40/1.2 water immersion objective lens. The pepsin conjugated with
Green Oregon was excited at wavelength of 488 nm and fluorescence was filtered
using a 500-600 nm spectral filter. The scan area was 283.4 µm x 70.8 µm. The
procedure used for FRAP measurement started with the acquisition of 20 scans,
following by the bleach in 10x10 square and using 100% power laser of 405 and 488
nm.

Chapter 6: Pepsin Diffusion
216
A small piece of the part of digesta at GE1 (Inner, Surface and Serum from
Past+H, and digesta from UHT+H) was placed in a concave slide and 1 µL of the
pepsin-Oregon Green conjugate was added for the analysis under the microscope. It
is important to mention that in previous experiments the gradual addition of pepsin-
Oregon conjugate during digestion was tested but the low fluorescence intensity
observed under the microscope required its direct addition to the digesta piece of
interest.
6.3 Results
6.3.1 Pepsin Activity
Figure 6.2 shows the pepsin activity obtained in different parts of the digesta in
an early and late stages of gastric digestion using the semi-dynamic model. It is worth
noting that the same parts of the digesta could not be analysed for both samples since
the consistency of the coagulum was different between the two stages of gastric
digestion studied, i.e. at 32 and 161 min. The parts of the tight coagulum obtained in
Past+H at 32 min (Figure 6.1 A) had a significant different pepsin activity; Inner part
presented no activity (-8.03 ± 2.00) whereas Surface part had 985.5 ± 417.9 U. The
maximum activity found among the analysed parts was in Serum, accounting for 2,927
± 227 U. After 161 min of gastric digestion, the digestion of the coagulum was
noticeable by not only the small size but the softness of the coagulum that remained
(Figure 6.1 B). The Inner part presented some activity accounting for 2,832 ± 459 and
there was an increase of activity in the Surface part. In UHT+H sample, in contrast,
pepsin was incorporated in the Solid of the digesta at the early time of digestion, i.e.
32 min, accounting for 3,920 ± 494 U. The activity in the Digesta considerably
increased during digestion, accounting for 10,174 ± 1,087 U at 181 min compared to
2,516 ± 606 obtained at 32 min of gastric digestion.
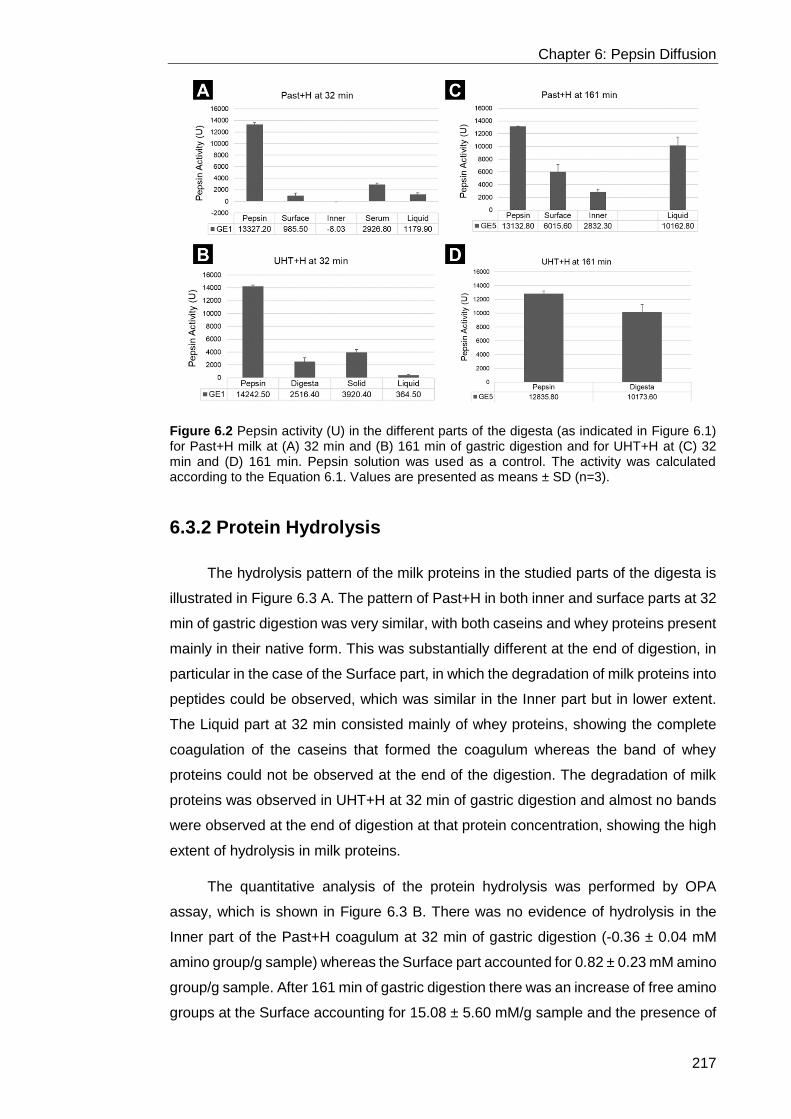
Chapter 6: Pepsin Diffusion
217
Figure 6.2 Pepsin activity (U) in the different parts of the digesta (as indicated in Figure 6.1) for Past+H milk at (A) 32 min and (B) 161 min of gastric digestion and for UHT+H at (C) 32 min and (D) 161 min. Pepsin solution was used as a control. The activity was calculated according to the Equation 6.1. Values are presented as means ± SD (n=3).
6.3.2 Protein Hydrolysis
The hydrolysis pattern of the milk proteins in the studied parts of the digesta is
illustrated in Figure 6.3 A. The pattern of Past+H in both inner and surface parts at 32
min of gastric digestion was very similar, with both caseins and whey proteins present
mainly in their native form. This was substantially different at the end of digestion, in
particular in the case of the Surface part, in which the degradation of milk proteins into
peptides could be observed, which was similar in the Inner part but in lower extent.
The Liquid part at 32 min consisted mainly of whey proteins, showing the complete
coagulation of the caseins that formed the coagulum whereas the band of whey
proteins could not be observed at the end of the digestion. The degradation of milk
proteins was observed in UHT+H at 32 min of gastric digestion and almost no bands
were observed at the end of digestion at that protein concentration, showing the high
extent of hydrolysis in milk proteins.
The quantitative analysis of the protein hydrolysis was performed by OPA
assay, which is shown in Figure 6.3 B. There was no evidence of hydrolysis in the
Inner part of the Past+H coagulum at 32 min of gastric digestion (-0.36 ± 0.04 mM
amino group/g sample) whereas the Surface part accounted for 0.82 ± 0.23 mM amino
group/g sample. After 161 min of gastric digestion there was an increase of free amino
groups at the Surface accounting for 15.08 ± 5.60 mM/g sample and the presence of
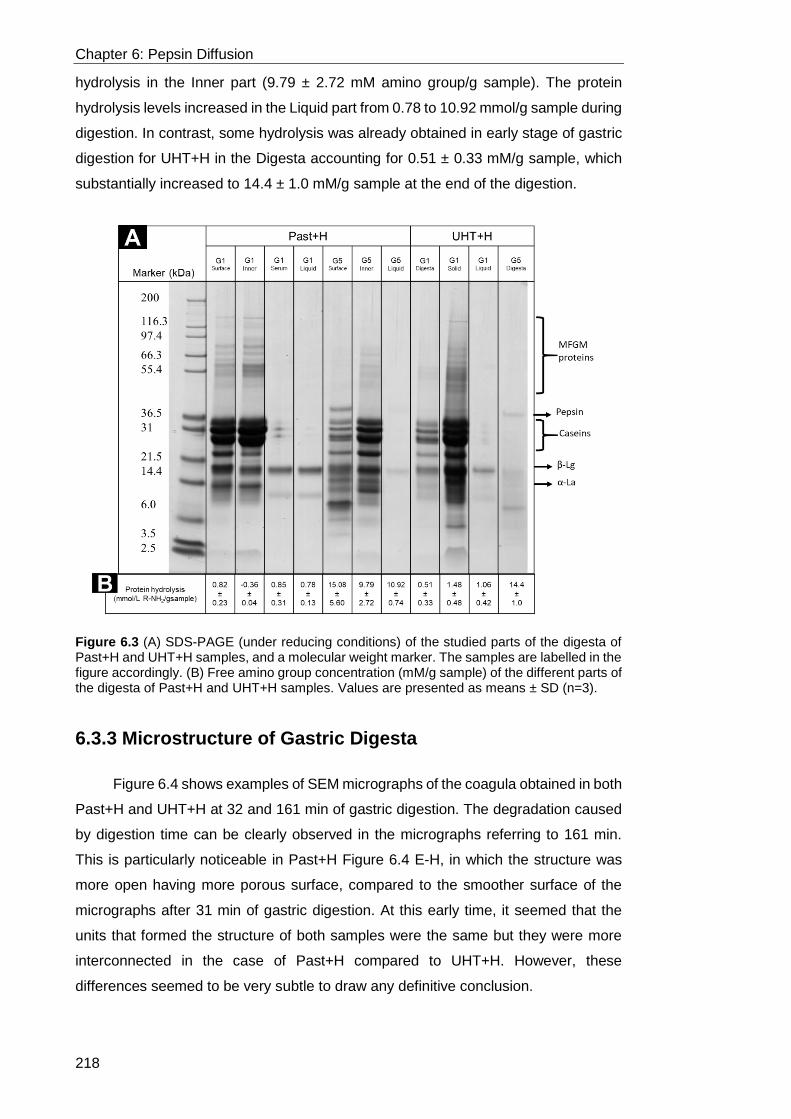
Chapter 6: Pepsin Diffusion
218
hydrolysis in the Inner part (9.79 ± 2.72 mM amino group/g sample). The protein
hydrolysis levels increased in the Liquid part from 0.78 to 10.92 mmol/g sample during
digestion. In contrast, some hydrolysis was already obtained in early stage of gastric
digestion for UHT+H in the Digesta accounting for 0.51 ± 0.33 mM/g sample, which
substantially increased to 14.4 ± 1.0 mM/g sample at the end of the digestion.
Figure 6.3 (A) SDS-PAGE (under reducing conditions) of the studied parts of the digesta of Past+H and UHT+H samples, and a molecular weight marker. The samples are labelled in the figure accordingly. (B) Free amino group concentration (mM/g sample) of the different parts of the digesta of Past+H and UHT+H samples. Values are presented as means ± SD (n=3).
6.3.3 Microstructure of Gastric Digesta
Figure 6.4 shows examples of SEM micrographs of the coagula obtained in both
Past+H and UHT+H at 32 and 161 min of gastric digestion. The degradation caused
by digestion time can be clearly observed in the micrographs referring to 161 min.
This is particularly noticeable in Past+H Figure 6.4 E-H, in which the structure was
more open having more porous surface, compared to the smoother surface of the
micrographs after 31 min of gastric digestion. At this early time, it seemed that the
units that formed the structure of both samples were the same but they were more
interconnected in the case of Past+H compared to UHT+H. However, these
differences seemed to be very subtle to draw any definitive conclusion.

Chapter 6: Pepsin Diffusion
219
Figure 6.4 Examples of SEM micrographs of the coagula of Past+H sample at (A-D) 32 min of gastric digestion and (E-H)161 min, and UHT+H at (I-L) 32 min and (M-P) 161 min. Scale bars are indicated below each micrograph.
6.3.4 FRAP Experiment
Figure 6.5 A shows the recovery profile of fluorescence intensity of the Past+H
sample at 32 min of three different parts of the digesta, i.e. Serum and, Inner and
Surface of the coagulum. The Inner part of the coagulum did not show any recovery
which contrasts to the recovery observed in the Serum and Surface part of the
coagulum. However, the precise differentiation between these two samples is difficult
to assess from that graph. An intermediate behaviour between those latter sample
was observed in the profile of recovery in the Digesta at 32 min of UHT+H (Figure 6.5
B).

Chapter 6: Pepsin Diffusion
220
Figure 6.5 Fluorescence intensity of the recovery period after bleaching in FRAP experiment for (A) Past+H and (B) UHT+H after 32 min of gastric digestion at different part of the digesta.
6.4 Discussion
The study of pepsin diffusion within the food matrix is relevant to understand the
mechanisms of protein digestion. In this study, the aim was the investigation of the
implications of the main milk heat treatments of pasteurisation and UHT, on the
disintegration of the coagulum formed in gastric conditions.
6.4.1 Pepsin Action is Influenced by the Coagulum Structure
By following the activity of pepsin in the different parts of the digesta we could
understand its proteolysis behaviour. The results of pepsin activity (Figure 6.2) and
the analysis of protein hydrolysis (Figure 6.3) are very much linked. In Past+H sample,
pepsin seemed unable to diffuse into the inner part of the coagulum at the early stages
of gastric digestion, and was mostly present in the serum. There was no activity in the
Inner part of the dense coagulum obtained after 32 min of gastric behaviour (Figure
6.1 A), which was supported by the lack of protein hydrolysis, and the intact milk
proteins observed by SDS-PAGE (Figure 6.3). The rapid formation of a dense
coagulum (Figure 6.1 A) could lead the exclusion of pepsin from the serum. It is
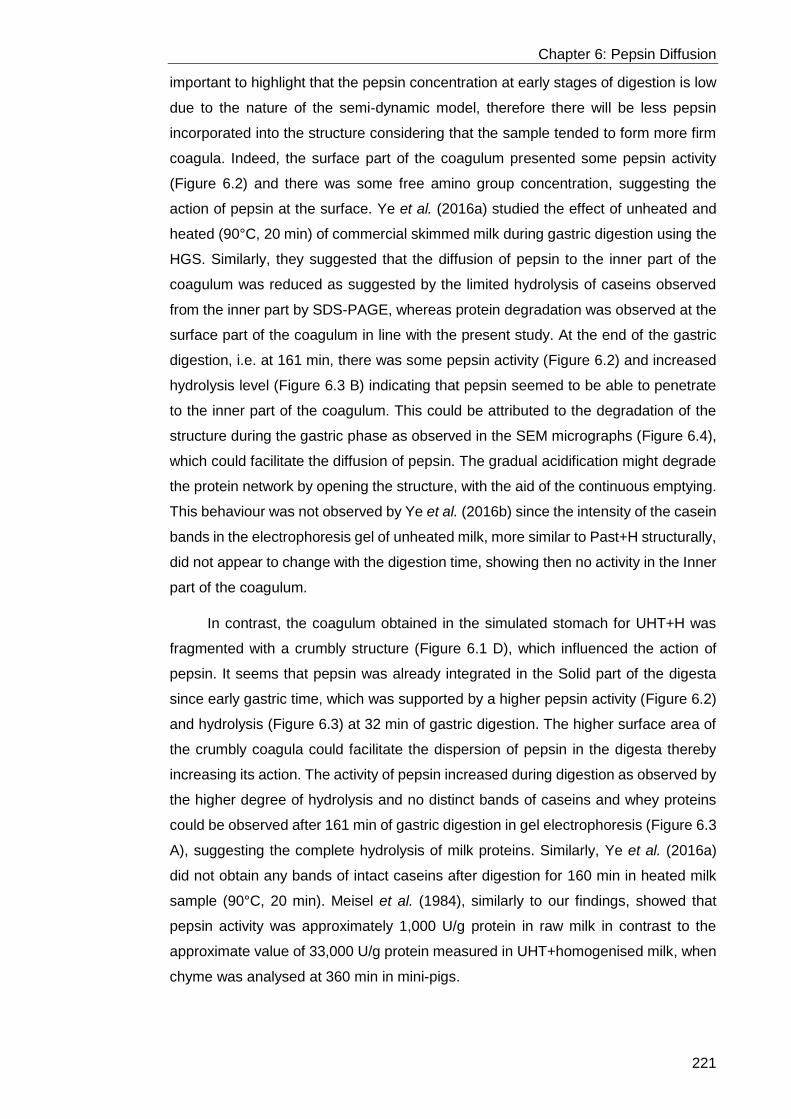
Chapter 6: Pepsin Diffusion
221
important to highlight that the pepsin concentration at early stages of digestion is low
due to the nature of the semi-dynamic model, therefore there will be less pepsin
incorporated into the structure considering that the sample tended to form more firm
coagula. Indeed, the surface part of the coagulum presented some pepsin activity
(Figure 6.2) and there was some free amino group concentration, suggesting the
action of pepsin at the surface. Ye et al. (2016a) studied the effect of unheated and
heated (90°C, 20 min) of commercial skimmed milk during gastric digestion using the
HGS. Similarly, they suggested that the diffusion of pepsin to the inner part of the
coagulum was reduced as suggested by the limited hydrolysis of caseins observed
from the inner part by SDS-PAGE, whereas protein degradation was observed at the
surface part of the coagulum in line with the present study. At the end of the gastric
digestion, i.e. at 161 min, there was some pepsin activity (Figure 6.2) and increased
hydrolysis level (Figure 6.3 B) indicating that pepsin seemed to be able to penetrate
to the inner part of the coagulum. This could be attributed to the degradation of the
structure during the gastric phase as observed in the SEM micrographs (Figure 6.4),
which could facilitate the diffusion of pepsin. The gradual acidification might degrade
the protein network by opening the structure, with the aid of the continuous emptying.
This behaviour was not observed by Ye et al. (2016b) since the intensity of the casein
bands in the electrophoresis gel of unheated milk, more similar to Past+H structurally,
did not appear to change with the digestion time, showing then no activity in the Inner
part of the coagulum.
In contrast, the coagulum obtained in the simulated stomach for UHT+H was
fragmented with a crumbly structure (Figure 6.1 D), which influenced the action of
pepsin. It seems that pepsin was already integrated in the Solid part of the digesta
since early gastric time, which was supported by a higher pepsin activity (Figure 6.2)
and hydrolysis (Figure 6.3) at 32 min of gastric digestion. The higher surface area of
the crumbly coagula could facilitate the dispersion of pepsin in the digesta thereby
increasing its action. The activity of pepsin increased during digestion as observed by
the higher degree of hydrolysis and no distinct bands of caseins and whey proteins
could be observed after 161 min of gastric digestion in gel electrophoresis (Figure 6.3
A), suggesting the complete hydrolysis of milk proteins. Similarly, Ye et al. (2016a)
did not obtain any bands of intact caseins after digestion for 160 min in heated milk
sample (90°C, 20 min). Meisel et al. (1984), similarly to our findings, showed that
pepsin activity was approximately 1,000 U/g protein in raw milk in contrast to the
approximate value of 33,000 U/g protein measured in UHT+homogenised milk, when
chyme was analysed at 360 min in mini-pigs.

Chapter 6: Pepsin Diffusion
222
With regards to whey proteins, the band of β-Lg in the Solid part of the coagula
at 32 min appeared to be more intense in the case of UHT+H than Past+H. This could
suggest greater involvement in the formation of the coagula due to the interactions
between whey proteins and caseins, which was higher in the case of UHT compared
to pasteurisation treatment. Miranda et al. (1987) reported that whey proteins did not
form part of the coagulum in non-heated milk and then preferentially evacuated from
the stomach. It has been reported that the heat treatment of milk proteins above 70°C
causes the denaturation of β-Lg in particular, and these denatured proteins can
interact with κ-casein at interface, which could subsequently form part of the
coagulum. Also, the band of β-Lg was very faint after 161 min of gastric digestion,
indicating the susceptibility of whey proteins to be hydrolysed by pepsin after drastic
heat treatment. It is known that native β-Lg is resistant to pepsin action, but heating
increases its susceptibility to hydrolysis by pepsin (Macierzanka et al., 2012).
Moreover, as evident in the gel electrophoresis (Figure 6.3), β-Lg was mostly present
in the Serum/Liquid part of the digesta in Past+H sample suggesting that was readily
available to be emptied, when compared to the solid part formed mainly by caseins.
The predominance of whey protein in the emptied fraction was also observed in
human studies (Barbé et al., 2014b).
Overall, the results suggest that the structure in the gastric digestion, i.e.
crumbly versus dense, had a significant impact on the protein hydrolysis, in particular
on the rate of casein hydrolysis. The digestion of whey proteins was influence by both
the structure and prior heat treatment that increased the exposure of the cleave bonds
in the protein structures. The changes of the molecular structure of the proteins
affected the gastric behaviour, which in turn have been shown to impact the activity
of pepsin and its subsequent action of hydrolysis. This effect not only impacts
bioaccessibility of proteolytic products but absorption of amino acids. Lacroix et al.
(2008) showed that UHT treatment induced a higher postprandial nitrogen utilization
in humans, when compared with pasteurisation.
6.4.2 Pepsin Diffusion by FRAP
The different diffusion coefficient of molecules can be assessed by confocal
microscopy using advanced techniques such as FRAP. The diffusion of pepsin has
been rarely study; the studies of Luo et al. (2017) using FCS and Thevenot et al.
(2017) using FRAP are the only reports available so far. In the present study, we
attempted to study the diffusivity of pepsin by the addition of pepsin-Oregon Green
conjugate during gastric digestion together with the gradual addition of unlabelled
pepsin. However, the low intensity obtained in these experiments led to the use of

Chapter 6: Pepsin Diffusion
223
conjugate directly onto the sample of interest. The increase of the conjugate
concentration added and the adjustment of the microscope parameters did not
improve the noise as seen in the Figure 6.5. Nevertheless, it is apparently clear that
there was no recovery in the Inner part of the coagulum in Past+H, which is in
accordance with the results based on pepsin activity and protein hydrolysis; there was
very little, if any, diffusion of pepsin in the inside of the coagulum, further slowing down
the digestion of the proteins within the coagulum. However, in general, the data
obtained using FRAP did not provide any clear outcomes and further work should be
undertaken in relation to sample preparation to obtain a conclusive diffusion
coefficient that can provide more insight about protein degradation in the stomach.
6.5 Conclusion
The effect of pepsin on the structure formed in the gastric environment was
investigated. Pepsin has been seen as key factor influencing the formation of the
coagulum and the behaviour in the course of digestion. The restructuring of milk was
initially driven by pepsin as shown in Chapter 5. Past+H milk formed a firm coagulum
similar to the one obtained in raw milk, compared to the crumbly coagula obtained in
UHT+H sample. These different structures caused different patterns of protein
hydrolysis, which was attributed to the different activity of pepsin in the different parts
of the digesta, affecting the bioaccessibility of proteins in the small intestine. There
are different aspects working together at the same time that might influence these
outcomes. Firstly, the amount of pepsin being incorporated inside the coagulum was
lower in the Past+H sample as the coagula were forming more quickly, that could
inhibit diffusion into the coagulum. Secondly, the viscosity of the Past+H coagulum
suggests a stronger and tighter structure, which could further slow down diffusion.
Thirdly, the nature of the semi-dynamic gastric model of the experiment, in which
pepsin and acid were added gradually resulting in low amount of pepsin and relatively
high pH in the initial stage of digestion, should be taken into account. This all
contributes the knowledge to the mechanisms underpinning the slower digestion of
the less processed samples.
Therefore, this study provides more insight into the behaviour of pepsin in
complex structures during gastric digestion, which is of high interest since it affects
the subsequent bioaccessibility and absorption of nutrients in the small intestine.

224
Effect of Dairy Macrostructure on in
Vitro Gastric Restructuring and
Nutrient Digestion Kinetics, and in
Vivo Correlation‡
‡This chapter is based on the published peer-reviewed article, Mulet-Cabero, A.-I.,
Rigby, N. M., Brodkorb, A., & Mackie, A. R. (2017). Dairy food structures influence
the rates of nutrient digestion through different in vitro gastric behaviour. Food
Hydrocolloids, 67, 63-73.

Chapter 7: Effect of Physical Structure
225
7.1 Introduction
The worldwide prevalence of diet-related diseases such as obesity is one of the
main health concerns. The cost of the National Health Service in the UK related to
obesity was in 2007 estimated at £2.3 billion, with a projection to rise to £7.1 billion
by 2050 (Butland et al., 2007). Several strategies have been developed to address
this problem, mainly by reducing the caloric content of the diet focussing on lipid
and/or sugar (Fiszman et al., 2013). However, this strategy does not seem to be
working, given the ongoing increase of obesity and this is, at least in part, due to the
decrease in palatability of foods. Therefore, approaches looking beyond caloric
content have to be investigated. Enhancing satiation and satiety could provide a
method to control energy intake helping weight management, which does not imply
the increase of food intake but the enhancement of the potential benefit from specific
foods (Wilde, 2009). Food companies have developed products with claims related to
satiety with the aim to induce feelings of fullness for a longer time (Hetherington et al.,
2013).
The satiety cascade is a complex phenomenon involving different pathways
(Benelam, 2009). The main factors affecting food intake are mechanical stimulation,
such as gastric distension, and release of peptides secreted in response to ingested
food (Cummings et al., 2007). Some of the most studied satiety-related peptides
released from the intestine are glucagon-like peptide 1 (GLP-1), peptide YY (PYY)
and cholecystokinin (CCK) (Frost et al., 2006). The release of CCK occurs in the
upper small intestine as response to nutrients, in particular lipid and protein (Frost et
al., 2006). Moreover, the release of CCK has important consequences for
gastrointestinal (GI) flow including the delay of gastric emptying (GE) (Wren et al.,
2007). Rapid emptying leads to a reduction of negative feedback satiety signals and
then promotes overconsumption of calories (Delzenne et al., 2010). Therefore, GE
can be modulated by controlling the rate of nutrient digestion and then leading to
specific postprandial physiological responses. However, the delivery of nutrients in
the small intestine is affected by their behaviour in the stomach. In this context, the
design of the structure in which nutrients are presented in food to exert specific
biophysical behaviour in the stomach comprised the core of this piece of work.
The physical state of food influences satiety perception through different
physico-chemical changes in the GI tract, affecting the nutrient flow in in vivo. For
example Marciani et al. (2012) studied two meals with different consistency,
solid/liquid and homogenised soup. The authors showed that the homogenised meal
delayed GE and enhanced satiation compared to the same meal consumed in solid

Chapter 7: Effect of Physical Structure
226
state. This was attributed to the steady release of nutrients into the duodenum of the
soup meal, which maintained a homogenous appearance throughout gastric
digestion. In contrast, using similar food structures but dairy-based systems, Mackie
et al. (2013) found that a semi-solid meal increased the feeling of fullness by a slower
rate of GE compared to the same isocaloric meal in a liquid form. However, in this
case, different gastric behaviours of sedimentation and creaming were observed,
using magnetic resonance imaging (MRI), for semi-solid and liquid sample,
respectively. The authors suggested a link between the satiety responses observed
and differences in composition of the chyme being emptied from the stomach.
Gastric conditions such as pH and ionic strength can affect the physico-
chemical properties of proteins. Caseins lose their micellar structure in the stomach
at around pH 4.6, their iso-electric point, and precipitate forming aggregates whereas
whey proteins remain soluble which has led to differences in digestion. This has been
reported to result in more rapid GE of whey proteins and a delayed GE of caseins
based on the collected digesta from the jejunum (Mahé et al., 1996). Moreover, a
higher satiating effect after consumption of whey protein drink was shown and was
associated with higher secretion of CCK, GLP-1 and GIP in plasma and elevated
levels of branched amino acids, compared with casein drink (Hall et al., 2003).
Lipid is another important nutrient playing a key role in satiety and there are
several in vivo studies looking at the impact of emulsion structure on lipid digestion
rate (Marciani et al., 2008). They have shown that lipid droplets can be designed to
exert specific behaviours in the stomach taking into account different colloidal
processes (i.e. flocculation, coalescence and creaming) that they might undergo
under the gastric conditions due to changes in the interfacial properties (Dickinson,
1997). Marciani et al. (2008) compared two emulsions with different acid stabilities
showing that the acid-stable emulsion, homogenous in the stomach, provided a
slower and more consistent GE, which caused the increase of CCK secretion
(Marciani et al., 2007) and fullness perception compared to the acid-unstable
emulsion that broke into two phases upon gastric acidification.
These studies have highlighted the implications of GE and postprandial
responses. However, the underlying mechanisms in terms of nutrient digestion rates
are not well understood. Most of these studies have been performed in vivo,
nevertheless, the influence of food structure on digestion can be studied using in vitro
systems providing ease of access to samples and minimal variation. Dynamic gastric
in vitro models such as the Human Gastric Simulator (HGS) developed at the Riddet
Institute or the Dynamic Gastric Model (DGM) set up in the Institute of Food Research
are sophisticated models that can closely mimic human gastric behaviour but they are
Chapter 7: Effect of Physical Structure
227
not a routine tool due to their complexity. On the other hand, static in vitro digestion
has been designed to be easy to use on a daily basis (Minekus et al., 2014), although
it does not mimic many relevant factors of gastric physiology such as a progressive
acidification and emptying, which might significantly affect the bioaccessibility of
nutrients. The importance of the pH dynamics in the protein gastric digestion has been
highlighted in previous in vitro studies where a pH gradient was considered (Shani-
Levi et al., 2013; van Aken et al., 2011). The semi-dynamic gastric model described
in Chapter 3 is simple to handle and more physiologically relevant than a static model
as it simulates the gradual pH decrease, and it has the novelty to include emptying,
and the sequential addition of digestives enzymes and gastric fluid.
Previous clinical data showed that specific dairy systems with different
macrostructure could cause different satiety responses (Mackie et al., 2013) but the
underlying mechanisms were not elucidated. The aim of the present study was to
investigate the link between these dairy structures and GI flow by analysing nutrient
content of the chyme. In particular it was investigated whether the physical state and
spatial distribution of nutrients within the simulated stomach could be a critical factor
for the rate of digestion in the small intestine. To this end the same two meals that
were isocaloric in terms of fat, protein and carbohydrates but with different structure,
liquid versus semi-solid, were used. The structural changes in the gastric
compartment using the semi-dynamic gastric model were studied and the digestion
was finally assessed by the amount of absorbable (lipid and protein) species available
as a function of time. Lastly, we correlated the absorbable nutrients with the
responses observed in the previously mentioned human study (Mackie et al., 2013)
and compared the nutrient digestion kinetics obtained with those using the fully
dynamic model, the HGS.
7.2 Materials and Methods
7.2.1 Materials
Gouda cheese (Waitrose Essential Dutch Gouda), yogurt (Waitrose Essential
low-fat yogurt), icing sugar (Tate & Lyle Fairtrade cane sugar) and sunflower oil
(Tesco) were purchased from local supermarkets in the UK. Sodium caseinate was
kindly given by VTT (Finland) and whey protein isolate (WPI) was purchased from
Davisco Foods International, USA. Lyophilized rabbit gastric extract was purchased
from Germe S.A., France, (lipase had an activity of 58 U/mg solid, measured using
tributyrin as substrate, and pepsin 1,113 U/mg solid, using haemoglobin as substrate).
Chapter 7: Effect of Physical Structure
228
Pepsin from porcine gastric mucosa (Sigma Chemical Co., USA) had an activity of
3,883 U/mg solid, using haemoglobin as substrate. Pancreatin from porcine pancreas
(8x USP specifications) had a trypsin activity of 7.18 U/mg and lipase activity of 26.5
U/mg. Orlistat ≥ 98% and phenylmethylsulfonyl fluoride (PMSF) approx. 0.1 mol/L in
ethanol were purchased from Sigma-Aldrich. D-leucine (puriss ≥ 99.0%) was obtained
from Fluka analytical, USA. The standards glyceryl triheptadecanoate and
heptadecanoic acid were purchased from Sigma-Aldrich, dipentadecanoin and
monononadecanoin were from Nu-Check Prep, In. USA. The solvents hexane,
chloroform, acetic acid, methanol, ethyl acetate and toluene were purchased from
Fisher Scientific, UK.
7.2.2 Methods
A schematic diagram of the experimental planning is illustrated in Figure 7.1.
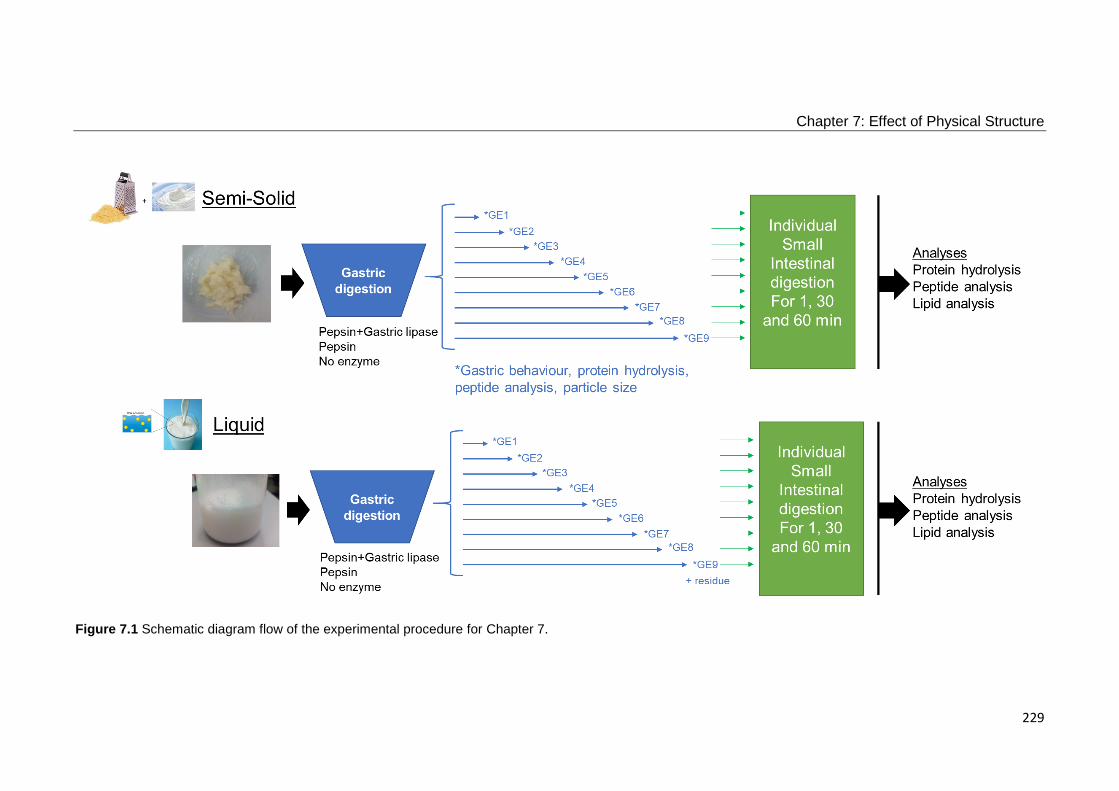
Chapter 7: Effect of Physical Structure
229
Figure 7.1 Schematic diagram flow of the experimental procedure for Chapter 7.

Chapter 7: Effect of Physical Structure
230
7.2.2.1 Preparation of Samples
The protocol followed for the preparation of the samples was as described
previously by Mackie et al. (2013). The Liquid sample was an oil in water emulsion. A
sodium caseinate solution containing 1.33 g sodium caseinate was dissolved in 110.5
g boiled tap water, the solution was stirred overnight at room temperature. 6.88 g of
sunflower oil was mixed with 60.63 g of that sodium caseinate solution in a blender
(BL450 series, Kenwood). The shear cycle comprised 30 s at the low shear setting,
30 s of rest, 30 s at the high shear setting, 30 s of rest and 30 s at high shear setting.
Then, the emulsion was mixed with the remaining sodium caseinate solution and 5 g
WPI was added a little at a time. Finally, 1.53 g of icing sugar was also added. The
Semi-Solid sample was prepared by mixing 23.17 g of finely grated gouda cheese
and 19.41 g yogurt. The sample also comprised 82.66 g water which was added at
the start of the gastric digestion to mimic the protocol of the in vivo study. It is important
to note that the samples were isocaloric in terms of protein, lipid and carbohydrate
content to ensure that the food structure was the main factor influencing the outcome.
7.2.2.2 Gastrointestinal in Vitro Digestion
The following protocol was used for the set of experiments using both gastric
lipase and pepsin. Two more sets were performed, in which just pepsin or no enzyme
was added, and the volume of enzyme was replaced by MilliQ® water.
7.2.2.2.1 Semi-Dynamic in Vitro Gastric Digestion
A 20 g of freshly prepared sample was placed into a glass v-form vessel
thermostated at 37°C after the addition of 3.6 mL of simulated gastric electrolyte
mixture simulating the gastric fluid residue in the stomach (basal state). The simulated
gastric electrolyte mixture contained SGF (1.25x), MilliQ® water, HCl (2 mol/L) and
CaCl2(H2O)2 (0.3 mol/L). Three solutions were added at a constant rate: (1) 15.4 mL
of simulated gastric electrolyte mixture was added using a pH-stat (836 Titrando-
Metrohm, Switzerland) dosing device at 0.09 mL/min, (2) 0.5 mL rabbit gastric extract
solution (13.8 mg in 0.5 mL MilliQ® water) at 0.003 mL/min and (3) 0.5 mL pepsin
solution (37.1 mg in 0.5 mL MilliQ® water) at 0.003 mL/min was also added because
the addition of pepsin from rabbit gastric extract did not fulfil the protease activity
required in the stomach which was 2,000 U/mL final digestion mixture (Minekus et al.,
2014). Enzyme solutions were added using a dual channel syringe pump (Harvard
apparatus, PHD Ultra, USA). An orbital shaker (Mini-gyro rocker-SSM3-Stuart,
Barloworld Scientific limited, UK) at 35 rpm was used for agitation of the vessel.
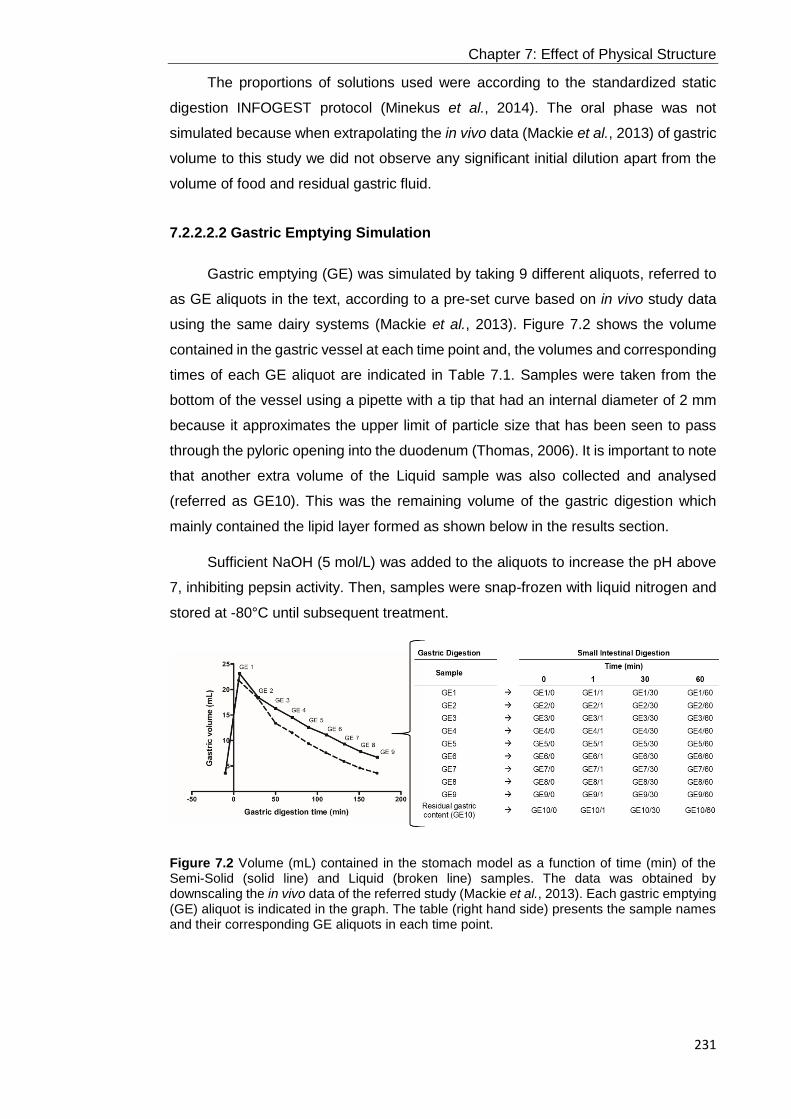
Chapter 7: Effect of Physical Structure
231
The proportions of solutions used were according to the standardized static
digestion INFOGEST protocol (Minekus et al., 2014). The oral phase was not
simulated because when extrapolating the in vivo data (Mackie et al., 2013) of gastric
volume to this study we did not observe any significant initial dilution apart from the
volume of food and residual gastric fluid.
7.2.2.2.2 Gastric Emptying Simulation
Gastric emptying (GE) was simulated by taking 9 different aliquots, referred to
as GE aliquots in the text, according to a pre-set curve based on in vivo study data
using the same dairy systems (Mackie et al., 2013). Figure 7.2 shows the volume
contained in the gastric vessel at each time point and, the volumes and corresponding
times of each GE aliquot are indicated in Table 7.1. Samples were taken from the
bottom of the vessel using a pipette with a tip that had an internal diameter of 2 mm
because it approximates the upper limit of particle size that has been seen to pass
through the pyloric opening into the duodenum (Thomas, 2006). It is important to note
that another extra volume of the Liquid sample was also collected and analysed
(referred as GE10). This was the remaining volume of the gastric digestion which
mainly contained the lipid layer formed as shown below in the results section.
Sufficient NaOH (5 mol/L) was added to the aliquots to increase the pH above
7, inhibiting pepsin activity. Then, samples were snap-frozen with liquid nitrogen and
stored at -80°C until subsequent treatment.
Figure 7.2 Volume (mL) contained in the stomach model as a function of time (min) of the Semi-Solid (solid line) and Liquid (broken line) samples. The data was obtained by downscaling the in vivo data of the referred study (Mackie et al., 2013). Each gastric emptying (GE) aliquot is indicated in the graph. The table (right hand side) presents the sample names and their corresponding GE aliquots in each time point.

Chapter 7: Effect of Physical Structure
232
Table 7.1 Time (min) and target volume (mL) corresponded in each gastric emptying aliquot. These values were based on a pre-set curve obtained in the in vivo study data using the same dairy systems (Mackie et al., 2013).
7.2.2.2.3 Small Intestinal in Vitro Digestion
Small intestinal digestion was simulated for each GE aliquot according to a
standardised protocol (Minekus et al., 2014). The pancreatin solution was prepared
with 3 x concentrated simulated intestinal fluid in order to keep the system as constant
as possible to pH 7 during digestion. The amounts of pancreatin solution, bovine bile
(190 mmol/L with water), CaCl2(H2O)2 (0.3 mol/L) and MilliQ® water were adjusted in
each case depending on the gastric aliquot volume to reach the pancreatin trypsin
activity required of 100 TAME units per mL, 10 mmol/L of bile and 0.6 mmol/L of
CaCl2(H2O)2 in the final digestion mixture (Minekus et al., 2014). The digestion was
performed for 60 min in a shaking incubator (Excella E24, New Brunswick Scientific,
USA) at 37°C, 190 rpm. Samples (0.5 mL) were taken at 0, 1, 30 and 60 min (as
shown in table of Figure 7.2) and 10 µl of enzyme inhibitor mix (1:1 0.1 mol/L PMSF:
10 mmol/L Orlistat in Ethanol) was added. The samples were snap-frozen using liquid
nitrogen and stored at -80°C until further analysis.
7.2.2.3 Confocal Laser Scanning Microscopy
The microstructure of selected samples was observed using a confocal laser
scanning microscope, Leica TCS-SP1 (Leica Microsystems, Baden-Württemberg,
Germany). A mixture of 0.1% Fast green FCF solution and 0.1% Nile red solution at
1:1 proportion was used. See the section 2.2.3.3 for details.
1
Gastric Emptying Aliquot
Semi-solid Sample Liquid Sample
Time (min) Emptied
Volume (mL) Time (min)
Emptied Volume (mL)
GE1 7.1 1.1 5.9 2.4
GE2 29.7 6.9 29.0 5.7
GE3 50.1 4.0 50.0 6.8
GE4 70.0 3.7 69.9 3.8
GE5 89.4 3.8 89.5 4.0
GE6 111.1 3.5 110.3 3.9
GE7 132.4 3.8 131.9 3.7
GE8 152.0 3.4 150.8 3.1
GE9 171.8 3.0 171.4 3.0
GE10 residual gastric content

Chapter 7: Effect of Physical Structure
233
7.2.2.4 Particle Size Distribution
The particle size was measured using a laser-light diffraction unit (Beckman
Coulter LS13320®, Beckman Coulter Ltd., High Wycombe, UK) as described in the
section 2.2.3.1. The optical parameters chosen were a particle and dispersant (water)
refractive index of 1.456 and 1.330, respectively. A volume of sample (0.5 mL) was
mixed with 5 mL of 2% SDS to dissociate clusters of proteins.
7.2.2.5 OPA Assay for Quantification of Protein Hydrolysis
The concentration of the free amino groups was determined using OPA assay,
which has been described in the section 2.2.4.3. The absorbance was measured at
340 nm using a multi-mode microplate reader (Benchmark Plus, BioRad, UK).
7.2.2.6 Size-Exclusion Liquid Chromatography Analysis
In an attempt to obtain more information about the protein digestion products,
we analysed the samples from the different GE aliquots after the intestinal digestion
using size exclusion chromatography. The analysis was performed on a BioSep SEC
S3000 column (300×7.8 mm with a 75×7.6 mm guard column; Phenomenex,
Cheshire, UK) connected to a Dionex SUMMIT high pressure liquid chromatography
using Chromeleon software (Dionex Ltd., Surrey, UK) and equipped with a photo
diode array detector. Samples were previously treated with 5% TCA, centrifuged at
10,000 rpm for 30 min at room temperature and filtrated using a syringe filter (0.45
µm PVDF membrane, GE Healthcare Life Sciences, UK). A volume of 10 μL was
eluted at 1 mL/min with buffer (50 mmol/L NaH2PO4, 150 mmol/L NaCl, 0.01% NaN3,
pH 7), and monitored at 210 nm for 20 min. The following standards were used:
vitamin B12, aprotinin, myoglobin from horse, ovalbulmin from chicken, γ-globulin
from cow and thyroglobulin from cow (Biorad). Their molecular weight and retention
time (RT) were as follows in Table 7.2.
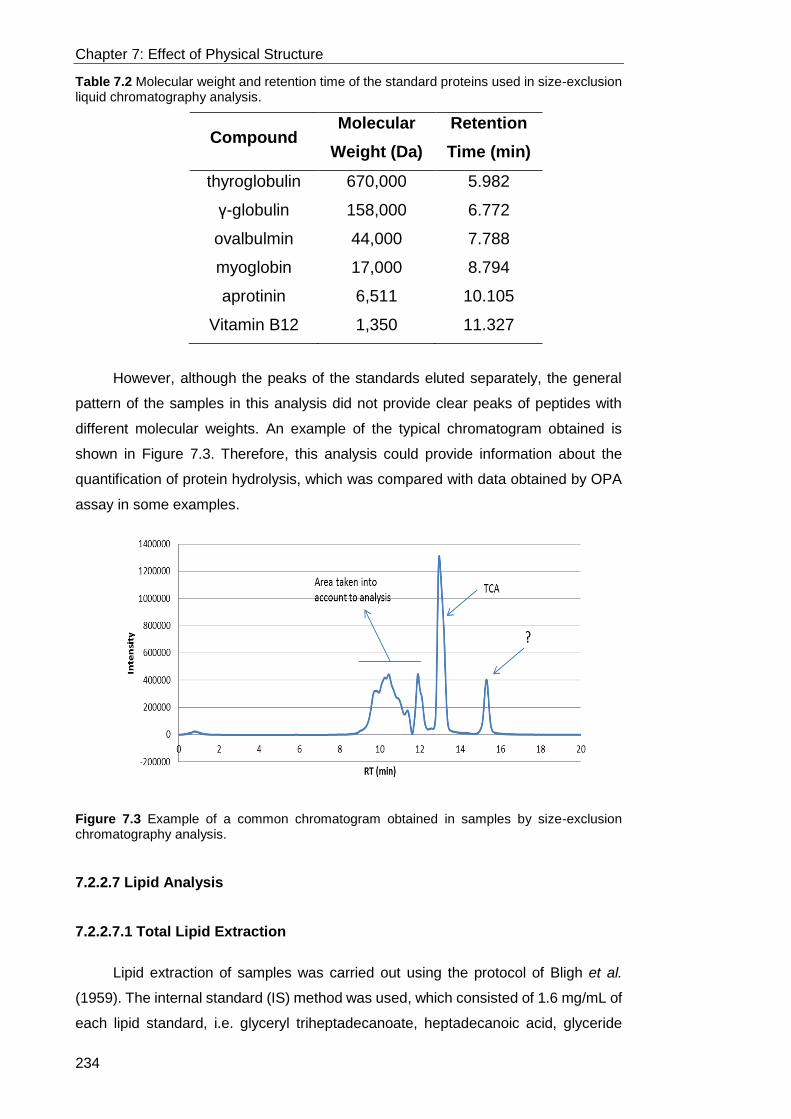
Chapter 7: Effect of Physical Structure
234
Table 7.2 Molecular weight and retention time of the standard proteins used in size-exclusion liquid chromatography analysis.
However, although the peaks of the standards eluted separately, the general
pattern of the samples in this analysis did not provide clear peaks of peptides with
different molecular weights. An example of the typical chromatogram obtained is
shown in Figure 7.3. Therefore, this analysis could provide information about the
quantification of protein hydrolysis, which was compared with data obtained by OPA
assay in some examples.
Figure 7.3 Example of a common chromatogram obtained in samples by size-exclusion chromatography analysis.
7.2.2.7 Lipid Analysis
7.2.2.7.1 Total Lipid Extraction
Lipid extraction of samples was carried out using the protocol of Bligh et al.
(1959). The internal standard (IS) method was used, which consisted of 1.6 mg/mL of
each lipid standard, i.e. glyceryl triheptadecanoate, heptadecanoic acid, glyceride
Compound Molecular
Weight (Da)
Retention
Time (min)
thyroglobulin 670,000 5.982
γ-globulin 158,000 6.772
ovalbulmin 44,000 7.788
myoglobin 17,000 8.794
aprotinin 6,511 10.105
Vitamin B12 1,350 11.327

Chapter 7: Effect of Physical Structure
235
dipentadecanoin and glyceride monononadecanoin, in chloroform. For each 0.5 mL
of sample, 0.625 mL IS solution and 1.25 mL methanol were added. Then, 0.625 mL
chloroform and 0.625 mL water with 0.9% NaCl were included obtaining two phases.
Thereafter, samples were centrifuged at 3,000 g for 10 min. The lower organic part
was taken for lipid extraction.
7.2.2.7.2 Extraction of Different Lipid Classes
Fractionation of lipid samples was performed using solid phase extraction
allowing the isolation of individual lipid classes: polar lipids namely free fatty acids
(FFA) and neutral lipids, namely, triacylglycerol (TAG), diacylglycerol (DAG) and
monoacylglycerol (MAG).
Figure 7.4 shows a schematic diagram of the experimental steps for lipid class
separation. The separation was performed using a 20-port vacuum manifold
(VacMaster, Biotage, UK) coupled to a vacuum pump and disposable primary
aminopropyl bonded phase cartridges (Agilent HF Bond Elut LRC-NH2, Agilent
Technologies UK Ltd., Wokingham, UK). The cartridge column was equilibrated by
rinsing with 4 mL of hexane and allowing it to flow through the cartridge under gravity.
The volume collected in the lipid extraction step was loaded onto the cartridge.
Thereafter the column was eluted with chloroform, 4 mL (fraction I, TAG and DAG)
followed by 5 mL of acetone (fraction II, MAG) which were eluted under gravity.
Methanol (5mL) eluted phospholipids and 5 mL of chloroform/methanol/acetic acid
(100:2:2 v/v) eluted FFA (fraction IV). Next, the tubes containing fractions I and II were
evaporated to dryness in a vortex evaporator (Haakebuchler, Büchi Labortechnik AG,
Switzerland) applying vacuum at 40°C and speed level 4 followed by drying in a
vacuum oven (Gallenkamp, England) connected to a high vacuum pump (Edwards
E2M2) for 30 min at room temperature.
A second cartridge was equilibrated in the same manner as above. The fraction
I was reconstituted in 0.5 mL of hexane and loaded onto the cartridge. A further 3.5
mL of hexane was applied to the column under gravity (fraction V, TAG). Then, a
fraction (4 mL) of hexane:ethyl acetate (85:15 v/v) was eluted under gravity (fraction
of cholesterol and other sterols). Next, 4 mL of hexane:ethyl acetate (80:20 v/v) was
eluted under gravity (fraction VII, DAG). Finally, 4 mL of chloroform:methanol (2:1 v/v)
was eluted under gravity collecting the total MAG in the fraction II tube. The solvent
of fractions II b, V and VII were evaporated as previously described.

Chapter 7: Effect of Physical Structure
236
Figure 7.4 Schematic diagram of the separation of lipid classes using solid phase extraction with aminopropyl columns.
7.2.2.7.3 Derivatization of Lipid Extraction Fractions
Lipids were converted to fatty acid methyl ester (FAME) through methylation to
allow subsequent analysis by gas chromatography (GC). 0.5 mL of toluene
(containing 0.02% butylated hydroxytoluene as an antioxidant) and 1 mL of
methylation reagent consisted of methanol containing 2% H2SO4 (v/v) was added to
the samples, which was mixed and placed in an oven at 50°C overnight. Thereafter,
tubes were removed from the oven to allow them to cool and 1 mL of neutralising
solution (12.5 g KHCO3 and 34.55 g K2HCO3 dissolved in 500 mL HPLC grade water)
was added. Hexane (1 mL) was added and following vigorous mixing samples were
centrifuged at 100 g for 5 min. The supernatant (organic phase) was transferred to a
vial for analysing by GC.
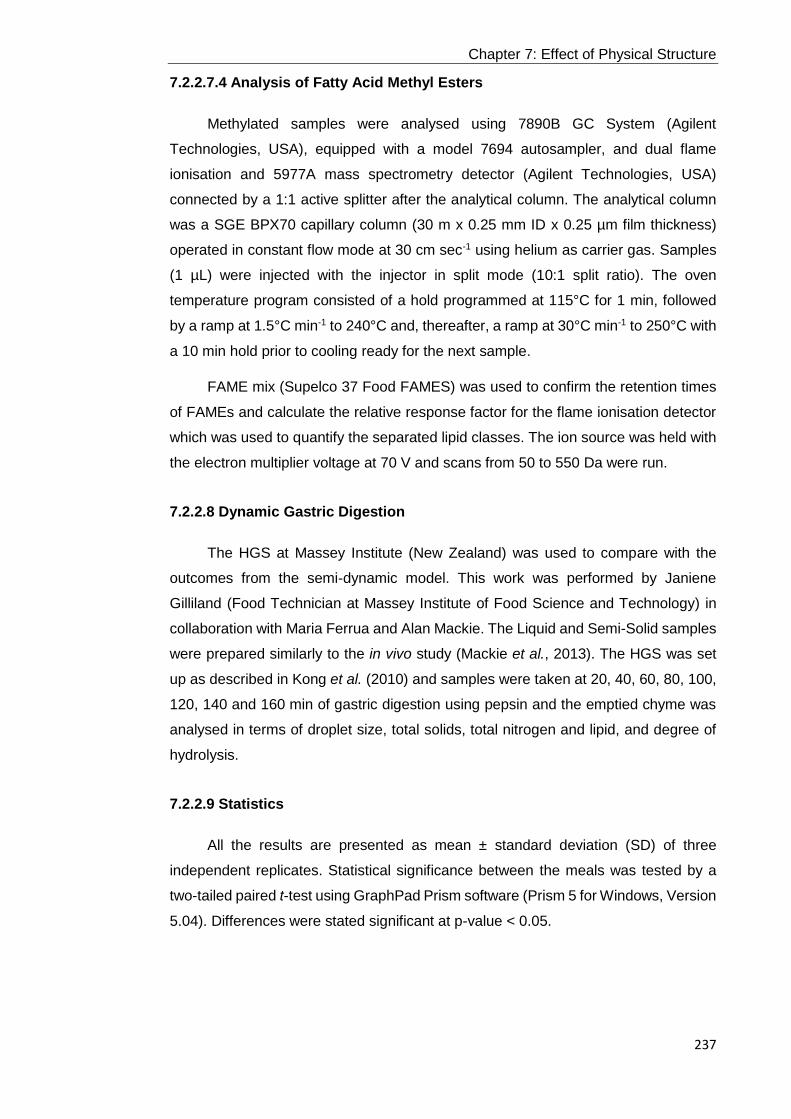
Chapter 7: Effect of Physical Structure
237
7.2.2.7.4 Analysis of Fatty Acid Methyl Esters
Methylated samples were analysed using 7890B GC System (Agilent
Technologies, USA), equipped with a model 7694 autosampler, and dual flame
ionisation and 5977A mass spectrometry detector (Agilent Technologies, USA)
connected by a 1:1 active splitter after the analytical column. The analytical column
was a SGE BPX70 capillary column (30 m x 0.25 mm ID x 0.25 µm film thickness)
operated in constant flow mode at 30 cm sec-1 using helium as carrier gas. Samples
(1 µL) were injected with the injector in split mode (10:1 split ratio). The oven
temperature program consisted of a hold programmed at 115°C for 1 min, followed
by a ramp at 1.5°C min-1 to 240°C and, thereafter, a ramp at 30°C min-1 to 250°C with
a 10 min hold prior to cooling ready for the next sample.
FAME mix (Supelco 37 Food FAMES) was used to confirm the retention times
of FAMEs and calculate the relative response factor for the flame ionisation detector
which was used to quantify the separated lipid classes. The ion source was held with
the electron multiplier voltage at 70 V and scans from 50 to 550 Da were run.
7.2.2.8 Dynamic Gastric Digestion
The HGS at Massey Institute (New Zealand) was used to compare with the
outcomes from the semi-dynamic model. This work was performed by Janiene
Gilliland (Food Technician at Massey Institute of Food Science and Technology) in
collaboration with Maria Ferrua and Alan Mackie. The Liquid and Semi-Solid samples
were prepared similarly to the in vivo study (Mackie et al., 2013). The HGS was set
up as described in Kong et al. (2010) and samples were taken at 20, 40, 60, 80, 100,
120, 140 and 160 min of gastric digestion using pepsin and the emptied chyme was
analysed in terms of droplet size, total solids, total nitrogen and lipid, and degree of
hydrolysis.
7.2.2.9 Statistics
All the results are presented as mean ± standard deviation (SD) of three
independent replicates. Statistical significance between the meals was tested by a
two-tailed paired t-test using GraphPad Prism software (Prism 5 for Windows, Version
5.04). Differences were stated significant at p-value < 0.05.

Chapter 7: Effect of Physical Structure
238
7.3 Results
7.3.1 Gastric pH Profile using the Semi-Dynamic Model
The change in pH of both samples during gastric digestion using pepsin and
gastric lipase is illustrated in Figure 7.5. The profiles obtained were similar, with an
initial low pH about 1.0 simulating the residual acid in the stomach related to fasting
conditions. After meal addition, the pH increased rapidly reaching values of 4.55 ±
0.08 and 5.37 ± 0.25 for the Semi-Solid and Liquid samples, respectively. This
increase was different between samples due to differences in their buffering capacity
even though they had the same protein content; the homogenous initial distribution of
the protein in the Liquid sample compared to the Semi-Solid sample caused the higher
pH observed. The pH then decreased in both samples reaching a value below 2.0
due to the constant addition of gastric fluid containing acid and the continuous
emptying. The pH profile during the digestions using just pepsin and no enzyme was
compared in Figure 7.6. There were no significant differences among these three sets
of experiments in the case of the Semi-Solid sample whereas the absence of enzyme
decreased the pH values between 50 and 130 min in the Liquid sample.
Figure 7.5 pH profile during gastric digestion in the semi-dynamic model, using pepsin and gastric lipase, of the Semi-Solid (solid line) and Liquid (broken line) samples. pH was measured in the digesta inside of the reaction vessel. Values are presented as means ± SD (n=3).
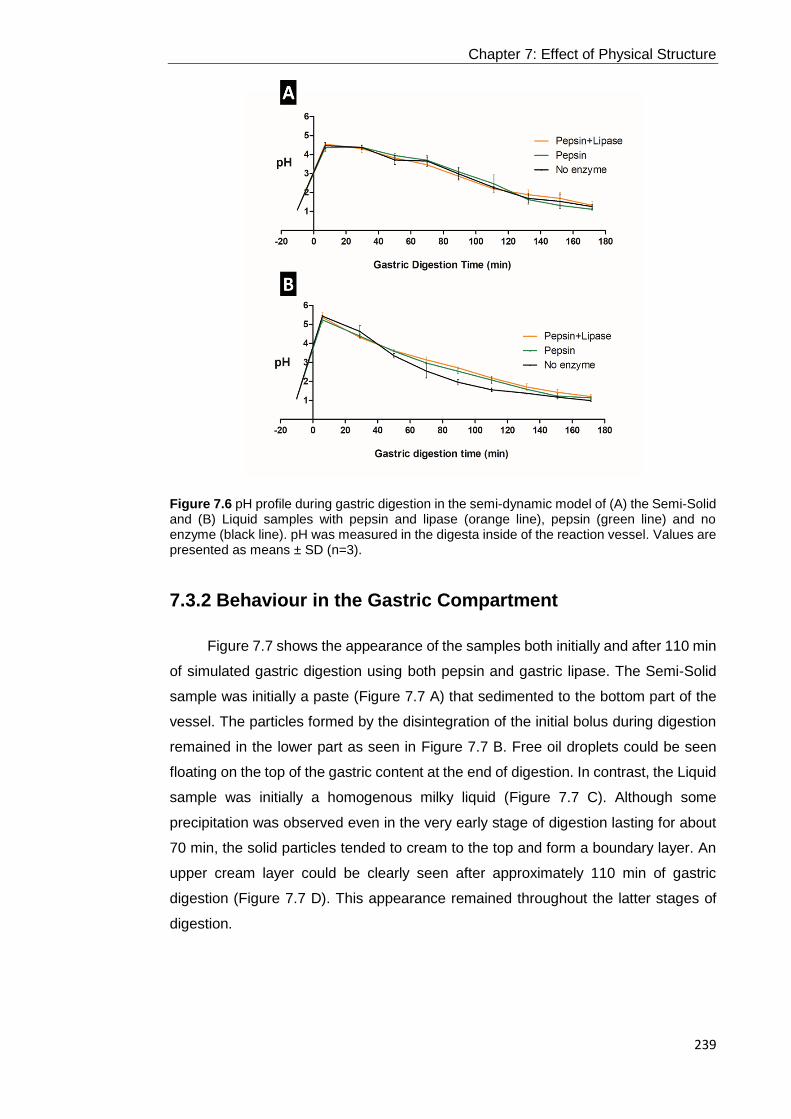
Chapter 7: Effect of Physical Structure
239
Figure 7.6 pH profile during gastric digestion in the semi-dynamic model of (A) the Semi-Solid and (B) Liquid samples with pepsin and lipase (orange line), pepsin (green line) and no enzyme (black line). pH was measured in the digesta inside of the reaction vessel. Values are presented as means ± SD (n=3).
7.3.2 Behaviour in the Gastric Compartment
Figure 7.7 shows the appearance of the samples both initially and after 110 min
of simulated gastric digestion using both pepsin and gastric lipase. The Semi-Solid
sample was initially a paste (Figure 7.7 A) that sedimented to the bottom part of the
vessel. The particles formed by the disintegration of the initial bolus during digestion
remained in the lower part as seen in Figure 7.7 B. Free oil droplets could be seen
floating on the top of the gastric content at the end of digestion. In contrast, the Liquid
sample was initially a homogenous milky liquid (Figure 7.7 C). Although some
precipitation was observed even in the very early stage of digestion lasting for about
70 min, the solid particles tended to cream to the top and form a boundary layer. An
upper cream layer could be clearly seen after approximately 110 min of gastric
digestion (Figure 7.7 D). This appearance remained throughout the latter stages of
digestion.

Chapter 7: Effect of Physical Structure
240
Figure 7.7 Images of Semi-Solid (A-B) and Liquid (C-D) samples in the initial state (A and C) and after 111.1 min (B) and after 110.3 min (D) of gastric digestion in the semi-dynamic gastric model using pepsin and gastric lipase. Representation of microstructure in the liquid sample before gastric digestion (E) and, the upper cream layer (F) and the bottom aqueous layer (G) after gastric digestion. Proteins and lipids are present in green and red, respectively. To note that the yellow block seen in images B and D corresponds to the pH probe.
The behaviour during the digestions using only pepsin and no enzyme was also
compared in Appendix I1 and Appendix I2 for Semi-Solid and Liquid samples,
respectively. In the Semi-Solid sample, the particles of the meal remained mainly in
the bottom of the vessel and there was a layer of oil droplets in all the sets although
it was more substantial in the case of gastric digestion including pepsin and gastric
lipase. In the Liquid sample, there was precipitation in all three sets, but the formation
of the cream layer was only observed in the digestion using enzymes, which was more
pronounced when gastric lipase was included.
7.3.3 Protein Hydrolysis Analysis
The extent of protein hydrolysis, using OPA assay, of both samples at each GE
point is displayed in the Figure 7.8. The samples were analysed during small intestinal
digestion at 0 (corresponding to the end of gastric digestion), 1, 30 and 60 min. The
gastric hydrolysis obtained in both meals GE1-9/0 ranged from 4.2 ± 3.4 to 36.9 ± 2.2
mmol/L and from 32.5 ± 10.2 to 12.5 ± 3.8 mmol/L for the Liquid and Semi-Solid
samples, respectively. This was substantially lower than the subsequent time samples
produced by small intestinal digestion, GE1-9/1, GE1-9/30 and GE1-9/60,
demonstrating the rapid action of small intestinal proteases. The samples showed
different proteolysis behaviour during small intestinal digestion. The Semi-Solid

Chapter 7: Effect of Physical Structure
241
sample exhibited a U-shape profile indicating a higher rate of proteolysis in the GE1
and GE9 aliquots and lower levels at intermediate time points. The highest level of
proteolysis was achieved in the GE1/60 point, delivering 250.4 ± 35.9 mmol/L of free
amino groups. The increase in proteolysis in the last aliquots might be due to the
release of protein associated with particles that were only emptied later on. The Liquid
sample, in contrast, had lower levels of proteolysis in the early GE aliquots which were
more constant throughout compared to Semi-Solid sample. The highest amount of
proteolysis was found in the GE10/60 point resulting in 246.7 ± 7.2 mmol/L of free
amino groups.
Figure 7.8 Surface plot representation of concentration of free amino groups (mmol/L) for each gastric emptying aliquot (GE) at 0 (referred to end point of gastric digestion), 1, 30 and 60 min after small intestinal digestion for both (A) Semi-Solid and (B) Liquid samples. The values were corrected by the different gastric and intestinal dilution in each point. The data represents the mean of three independent replicates.

Chapter 7: Effect of Physical Structure
242
Figure 7.9 shows the peak area obtained by size exclusion chromatography, in
both samples at the different GE aliquot. The patterns were fairly similar to those
obtained by OPA assay; the Semi-Solid sample presented U-shape (Figure 7.9 A)
and the release of peptides in the Liquid sample was constant with some increase at
the end of the digestion (Figure 7.9 B). This pattern was not altered when the values
of the enzyme blank, i.e. the pancreatin solution without the addition of sample, were
subtracted from those when sample was added (Figure 7.10) showing that there was
no effect from the protein of the enzyme.
Figure 7.9 Peptide analysis of (A) Semi-Solid and (B) Liquid samples at the different GE aliquots after 0 (referred to end point of gastric digestion), 1, 30 and 60 min small intestinal digestion. This is referred to the aliquots from the gastric digestion in the semi-dynamic model using both gastric lipase and pepsin. The values were corrected by the different gastric and intestinal dilution in each point. Values are presented as means ± SD (n=3).

Chapter 7: Effect of Physical Structure
243
Figure 7.10 Peptide analysis of (A) Semi-Solid and (B) Liquid samples at the different GE aliquots at 1, 30 and 60 min after small intestinal digestion. The values are referred to the intestinal digestion after gastric digestion using both gastric lipase and pepsin with subtraction of the blank, i.e. only enzyme included. The values were corrected by the different gastric and intestinal dilution in each point. Values are presented as means ± SD (n=3).
7.3.4 Lipid Analysis
Figure 7.11 shows the levels (% w/w) of TAG and lipolytic products (FFA, MAG
and DAG) in relation to the total lipid in each aliquot emptied at the different GE times.
GE aliquots were quantified during the small intestinal digestion at 1, 30 and 60 min.
In general, both samples followed the logical trends of lipolysis during intestinal
digestion showing a decrease of TAG, an increase of FFA and MAG, and about
constant levels of the intermediate product DAG. However, the rate of lipolysis was
different between the samples. The Semi-Solid sample presented the highest levels
of TAG in GE1/1, GE2/1 and GE3/1 points, accounting for 58.16 ± 11.67%, 59.05 ±
6.22% and 60.31 ± 4.91%, respectively. By contrast, the Liquid sample presented

Chapter 7: Effect of Physical Structure
244
56.90 ± 8.61% in the GE1/1 and the highest amount of TAG (75.15 ± 16.25%) was
found in the GE10 aliquot corresponding to the residual top cream layer. With regards
to FFA, the highest amounts were obtained in points GE4/60, GE5/60 and GE6/60 of
the Semi-Solid sample which contained about 75%, in contrast to the Liquid sample,
where the highest levels were found in GE7/60 and GE8/60 points which contained
72.11 ± 12.93% and 71.58 ± 19.57%, respectively. The GE10 showed the lowest
levels of FFA in the Liquid sample representing the 33.07 ± 5.99%.
Figure 7.11 Levels (expressed as mass percentage) of lipid classes (TAG, DAG, MAG and FFA) in each gastric emptying (GE) aliquot at 1, 30 and 60 min after small intestinal digestion for both Semi-Solid and Liquid samples (mean of 3 replicates). The values were corrected by the different gastric and intestinal dilution in each point. The SD averages for Semi-Solid sample are 2.5, 5.3, 4.5 and 1.6% for MAG, FFA, TAG and DAG respectively. The SD averages for liquid sample are 1.7, 7.6, 7.3 and 2.4% for MAG, FFA, TAG and DAG respectively
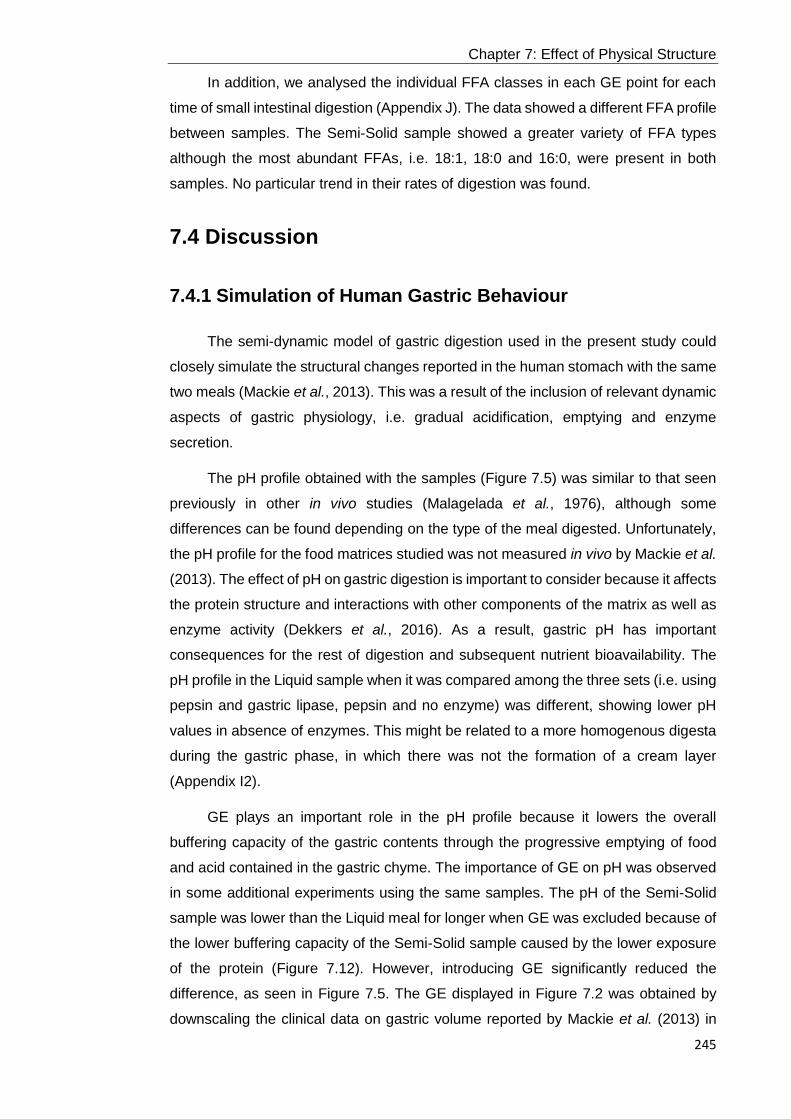
Chapter 7: Effect of Physical Structure
245
In addition, we analysed the individual FFA classes in each GE point for each
time of small intestinal digestion (Appendix J). The data showed a different FFA profile
between samples. The Semi-Solid sample showed a greater variety of FFA types
although the most abundant FFAs, i.e. 18:1, 18:0 and 16:0, were present in both
samples. No particular trend in their rates of digestion was found.
7.4 Discussion
7.4.1 Simulation of Human Gastric Behaviour
The semi-dynamic model of gastric digestion used in the present study could
closely simulate the structural changes reported in the human stomach with the same
two meals (Mackie et al., 2013). This was a result of the inclusion of relevant dynamic
aspects of gastric physiology, i.e. gradual acidification, emptying and enzyme
secretion.
The pH profile obtained with the samples (Figure 7.5) was similar to that seen
previously in other in vivo studies (Malagelada et al., 1976), although some
differences can be found depending on the type of the meal digested. Unfortunately,
the pH profile for the food matrices studied was not measured in vivo by Mackie et al.
(2013). The effect of pH on gastric digestion is important to consider because it affects
the protein structure and interactions with other components of the matrix as well as
enzyme activity (Dekkers et al., 2016). As a result, gastric pH has important
consequences for the rest of digestion and subsequent nutrient bioavailability. The
pH profile in the Liquid sample when it was compared among the three sets (i.e. using
pepsin and gastric lipase, pepsin and no enzyme) was different, showing lower pH
values in absence of enzymes. This might be related to a more homogenous digesta
during the gastric phase, in which there was not the formation of a cream layer
(Appendix I2).
GE plays an important role in the pH profile because it lowers the overall
buffering capacity of the gastric contents through the progressive emptying of food
and acid contained in the gastric chyme. The importance of GE on pH was observed
in some additional experiments using the same samples. The pH of the Semi-Solid
sample was lower than the Liquid meal for longer when GE was excluded because of
the lower buffering capacity of the Semi-Solid sample caused by the lower exposure
of the protein (Figure 7.12). However, introducing GE significantly reduced the
difference, as seen in Figure 7.5. The GE displayed in Figure 7.2 was obtained by
downscaling the clinical data on gastric volume reported by Mackie et al. (2013) in

Chapter 7: Effect of Physical Structure
246
which the Liquid sample emptied more quickly than the Semi-Solid sample; the
emptying rate of the Liquid meal was double that of the Semi-Solid meal after 25 min
of digestion. This differs from other studies (Marciani et al., 2012; Santangelo et al.,
1998) in which a combination of solid and liquid food emptied faster than the same
meal homogenised into a liquid form. It is important to note that in these studies the
liquid meal remained homogenous throughout gastric digestion in contrast to the
phase separation that occurred in the study by Mackie et al. (2013). This highlights
the importance of gastric behaviour in controlling the emptying rate. Other studies
(Marciani et al., 2007) reporting phase separation of emulsions in the stomach
showed a faster emptying rate compared to a homogenous system.
Figure 7.12 pH profile of both Semi-Solid (solid line) and Liquid (broken line) samples where gastric emptying was not included. pH was measured in the digesta inside of the reaction vessel. The gastric digestion was carried out for 2 hours using the semi-dynamic gastric model (gastric basal volume was not considered). Values are presented as means ± SD (n=5).
7.4.2 Influence of Gastric Digestion Conditions on Food
Restructuring
The Semi-Solid and Liquid samples underwent sedimentation and creaming,
respectively (Figure 7.7). The Liquid sample, an emulsion stabilised by milk proteins,
presented some precipitation in the early stages of gastric digestion (about pH 5),
which remained for about 70 min. This precipitation of the emulsion occurred as a
result of the pH approaching the iso-electric point of the caseins (pH 4.6) at which
point the net charge at the surface becomes zero. This change of charge on the
protein led to the loss of electrostatic repulsion and consequently stability as has been

Chapter 7: Effect of Physical Structure
247
shown previously (Day et al., 2014). Other aspects of the gastric environment
including ionic strength and proteolysis could also have affected the stability of lipid
droplets (Helbig et al., 2012). The salts contained in the simulated gastric fluid could
induce flocculation by screening the repulsive forces. In addition, the protective layer
of protein absorbed at the interface might be compromised by the proteolytic action
of pepsin resulting in the reduction of steric stability. Furthermore, the products of
lipolysis, i.e. FFA, MAG and DAG, are surface active and could displace the protein
from the emulsion interface leading to further destabilization. Indeed, these
compounds at GE1/1 point accounted for 41.84 and 43.1% of the total lipid in the
Semi-Solid and Liquid samples, respectively. All these factors could potentially
contribute to the destabilisation of the emulsion causing flocculation and some
coalescence of lipid droplets which progressively creamed to the top part during
digestion due to their lower density. The action of the enzymes, both pepsin and
gastric lipase, had an important role in the formation of this layer since the digestion
performed in the absence of enzymes did not show phase separation (Appendix I2).
A clear phase separation was observed after 110 min of gastric digestion
(Figure 7.7 D) but this trend already started to be observed after 30 min of digestion.
Figure 7.7 F confirms the presence of lipid droplets in the top layer leaving an aqueous
part in the bottom (Figure 7.7 G) and the extent of flocculation and coalescence in
that cream layer compared to the stabilised droplets presented in the initial sample
(Figure 7.7 E). The behaviour of phase separation showing the formation of a cream
layer at the top of the stomach was also shown in in vivo using MRI (Mackie et al.,
2013) as a result of destabilisation in gastric conditions. The comparison of the gastric
behaviour between these two digestion systems is illustrated in Figure 7.13. The
phase separation of the liquid sample was clearly obtained in an earlier stage in the
in vivo study, i.e. after 25 min. This might be due to the complex peristaltic movements
that were less well simulated in the gastric in vitro model used, where the shear rates
may have been lower than in vivo with regards to the gastric antrum.

Chapter 7: Effect of Physical Structure
248
Figure 7.13 Comparison of the gastric behaviour in the Liquid sample obtained using the semi-dynamic model at (A) 29.7 min and (B) 111.1 min of gastric digestion and (C) MRI image reported in Mackie et al. (2013) showing the gastric digestion of liquid sample at 25 min of gastric digestion (human stomach was highlighted). This illustrates the colloidal behaviour of phase separation in both digestion systems.
Conversely, in the Semi-Solid sample, the density of the cheese-yogurt matrix
resulted in the sedimentation of particles to the bottom of the simulated stomach
model leaving the top part a more aqueous system. This behaviour was consistent
throughout the digestion. Lipid from the cheese and yogurt was trapped in the food
matrix that generated the sediment. However, the combination of gastric conditions
including low pH and proteolysis led to the release of some oil droplets seen floating
on the top at the end of digestion, although phase separation overall was very limited.
Similar structural behaviour of both samples was observed in the MRI of the
comparative in vivo study using the same dairy systems (Mackie et al., 2013). Figure
7.14 illustrates the comparison of the gastric behaviour between these two digestion
systems.
Figure 7.14 Comparison of the gastric behaviour in the Semi-Solid sample obtained using (A) the semi-dynamic model at 5.9 min of gastric digestion and (B) MRI image reported in Mackie et al. (2013) showing the gastric digestion of liquid sample at 5 min of gastric digestion (human stomach was highlighted). This illustrated the colloidal behaviour of sedimentation in both digestion systems.

Chapter 7: Effect of Physical Structure
249
A schematic representation of the possible molecular mechanisms occurring in
the stomach leading to the observed behaviours is illustrated in Figure 7.15 and
Figure 7.16. for the Semi-Solid and Liquid samples, respectively.
Figure 7.15 Schematic representation of the molecular mechanisms causing the outcomes obtained in Semi-Solid sample. (A) Semi-Solid sample is a complex protein matrix in which lipid droplets are entrapped. (B)This sample enters in the stomach, and is located in the bottom part within liquid phase of water and gastric fluids. (C) There is very limited phase separation and prolonged nutrient entrapment. (D) There is an early nutrient emptying together with the liquid phase of water and secretions, leading to fast lipid and protein hydrolysis.
Figure 7.16 Schematic representation of the molecular mechanisms causing the outcomes obtained in Liquid sample. (A) Liquid sample is an oil in water emulsion. (B)This sample enters in the stomach and is mixed with gastric secretions. (C) There are changes in interfacial composition of the droplet due to the gastric environment, causing protein destabilisation and precipitation. (D) There is some coalescence (E) There is phase separation, in which the cream layer is located in the top, leading to the delay of lipid emptying and lipolysis in the small intestine.
7.4.3 Influence of Gastric Behaviour on Small Intestinal Protein
Digestion
Figure 7.8 shows the different protein digestion rates that were observed
between the samples. In the Semi-Solid sample there was a higher level of proteolysis
in the GE1 and GE2 aliquots compared to the Liquid sample, which might be related
to the early emptying of high density particles containing a greater amount of protein

Chapter 7: Effect of Physical Structure
250
which was subsequently digested throughout the small intestinal phase. The
contribution of the proteolysis due to the proteolytic activity of the bacterial culture
during fermentation and storage in cheese and yogurt should also be considered but
the GE1/0 data in Figure 7.9 shows similar peptide values for both samples. In
addition, the Semi-Solid sample showed high levels of proteolysis in the GE7, GE8
and GE9 aliquots which might be due to the emptying of soluble protein released
gradually from the matrix. In contrast, the Liquid sample showed a more consistent
extent of hydrolysis at all GE points because the proteins were more homogeneously
distributed within the sample. The highest level of proteolysis in the liquid sample was
obtained in the last volume collected, which might again be attributed to the protein
associated with the lipid that creamed to the top. However, these results differ from
those of van Aken et al. (2011), using a dynamic pH profile, in which the protein
distribution in the bottom layer was higher than in the cream layer obtained after the
gastric digestion of emulsions stabilised by milk proteins. These differences are likely
to be due to the gradual emptying that we carried out throughout the gastric digestion,
which was not included in the previous study. Indeed, the intestinal delivery from the
stomach has been found to be one of the major factors controlling intestinal absorption
kinetics, showing the high correlation between the rate of GE and absorption of
nitrogen in milk and yogurt (Gaudichon et al., 1994). The GE of the semi-solid
structure of yogurt was more regular compared to the liquid matrix of milk, which is in
accordance with the present study.
The results showed that there was rapid protein hydrolysis after 1 min of small
intestinal digestion. This finding is in agreement with the study of Macierzanka et al.
(2009), using β-lactoglobulin and β-casein- stabilized emulsions, showing that
proteins were partially hydrolysed, in particular β-casein, after 1 min into low molecular
weight peptides under intestinal conditions. The distinction between the different milk
proteins was not assessed in the present study because of differences in the nature
of the two starting materials; the two samples contained the same amount of protein,
although the dairy products used (yogurt and cheese) usually contain less whey
proteins due to the processing, which makes comparison problematic. Nevertheless,
it is important to note that the behaviour during the GI tract of casein and whey
proteins was different, resulting in that concept of ‘fast’ and ‘slow’ protein digestion
observed in Chapter 4.
Protein digestion has been less well studied than lipid digestion in relation to the
impact on colloidal behaviour under GI conditions. However, the understanding of the
behaviour of protein networks and how protein is emptied from the stomach is relevant

Chapter 7: Effect of Physical Structure
251
to the study of the nutritional impact of foods related to satiety responses (Mackie et
al., 2010), affecting lipid digestion kinetics as well.
7.4.4 Influence of Gastric Behaviour on Small Intestinal Lipid
Digestion
The rate of lipid hydrolysis was controlled by the nutrient composition of the
aliquot emptied into the small intestine which varied because of the different colloidal
behaviour within the stomach model. In the case of the Semi-Solid sample, the lipid
availability was much higher in the early stages of digestion as a consequence of the
high nutrient content of the sedimented particles. A substantial part of the initial TAG
was emptied early on i.e. the GE1/1, GE2/1 and GE3/1 time points compared to the
following digestion aliquots (Figure 7.11). In contrast, the lipid delivery of the Liquid
sample was quite steady at all the GE aliquots but was substantially higher in the last
residual volume analysed (GE10) that consisted almost entirely of the cream layer,
which resulted in a delay of lipid delivery into the small intestine. The coalescence
and phase separation observed in the Liquid sample led to reduction of the interfacial
area available for lipolysis as seen in the limited decrease of TAG in GE10 (Figure
7.11). The TAG percentage in GE10/30 and GE10/60 was 40 and 35% respectively
compared to 75% of TAG found in GE10/1. This could also be attributed to the
saturation of substrate compared to the availability of the enzyme. Similarly, van Aken
et al. (2011) reported a higher lipid distribution in the top layer when creaming was
observed after the gastric digestion of triolein emulsions stabilised by milk proteins.
They also observed that the FFA concentration in the bottom layer was much lower
than in the cream layer, probably because FFA were protonated in the low gastric pH
therefore they were oil-soluble and remained in the cream layer. In the present study
there was also a higher absolute amount of FFA present in the cream layer compared
to the lower aqueous layer, even though the relative values in Figure 7.11 do not
reflect it. The levels of FFA in GE1/0 accounted for 17 mg whereas the point GE10/0
contained 54.6 mg, which could be also due to the gastric lipase activity given the
time difference. The creaming process led to the concentration of the lipid droplets on
the top promoting coalescence and decreasing the rate of lipolysis. Another study
looking at the lipid digestion of protein stabilised emulsions using a dynamic GI system
at TNO, (Helbig et al., 2012) also showed the delay of lipid delivery into the small
intestine due to creaming of lipid in the stomach. They showed a higher amount of
lipid compounds, especially FFA and TAG, in the cream layer compared to the bottom
part. The authors pointed out that even though different gastric behaviour of the
samples was observed (homogeneous versus creaming), the total amount of FFA

Chapter 7: Effect of Physical Structure
252
released at the end of digestion remained similar, in line with our study. However, the
importance of the kinetics of lipid accessibility in postprandial lipaemia was shown by
Sanggaard et al. (2004) when comparing milk and yogurt. There was a faster increase
and higher peak concentration of TAG in blood after yogurt consumption when
compared to milk, suggesting that the homogenous and consistent fluid in the gastric
compartment emptied more quickly than the more heterogenous gastric behaviour
that could be obtained in milk.
Lipid digestion occurs mainly in the small intestine but we considered the
addition of gastric lipase relevant because there is evidence suggesting that it
accounts for the 5-40% of total TAG lipolysis (Armand et al., 1997). The gastric lipase
used in the present study was from rabbit gastric extract. This has been reported to
be similar to human gastric lipase (HGL) having similar specificity for sn-3 position
and optimum pH ranged between 5 and 3.5 (Carriere et al., 1991). Moreover, the
lipolytic products from gastric digestion may facilitate subsequent pancreatic lipolysis
(Armand, 2007). The digestion of lipid by the action of pancreatic lipase accounts
typically for 40-75%. The levels of lipolysis found in this study were in line with these
ranges. The extent of lipolysis obtained after an additional 60 min in the simulated
small intestine was determined and the Liquid sample showed 63% whereas the
Semi-Solid sample reached 82%. These values were calculated taking into account
the sum of the total FFA and MAG in relation to the sum of the total lipid obtained on
a weight basis. The Semi-Solid sample showed higher lipolysis than liquid sample
along GI tract, which could be attributed to the presence of a larger surface area of
the particles in the Semi-Solid sample whereas the reduced area available in the
phase separated and coalesced Liquid sample decreased the available surface area
for lipase action. It is important to state that the performance of the GE in this study
was quite complex due to the heterogeneity of the matrixes, which led to some losses
during the experimental procedure. This could lead to some variability of the total
initial and final lipid content and therefore the underestimation of lipid concentrations.
7.4.5 Possible Link to Physiological Responses
Since satiety related physiological responses such as CCK secretion and GE
are linked to the rate and extent of lipid and protein sensing by intestinal endocrine
cells, we can expect different satiety responses between the two samples. To provide
a better understanding of the physiological trends in our study, the previous data for
protein and lipid was replotted in a form representing the absorbable nutrient as a
function of linear time. We assumed the protein hydrolysates quantified were
absorbable since the protein digestion by intestinal proteases have been seen to be

Chapter 7: Effect of Physical Structure
253
efficient to further protein breakdown into amino acids and small peptides (2-3 amino
acids) which are absorbable. The absorbable lipid referred to the FFA and MAG
fractions that can be absorbed by enterocytes (Armand, 2007). Figure 7.17 A shows
a similar absorbable protein profile for both samples. The Semi-Solid sample
presented statistically higher levels of absorbable protein (p = 0.0341, paired, two-
sided t-test) in the first time point (i.e. 10 min). The samples were also statistically
different (p = 0.0356, paired, two-sided t-test) in the last time point (i.e. > 170 min)
with the Liquid sample having a higher concentration of absorbable protein. On the
other hand, the samples differed statistically in all the time points with regards to
absorbable lipid (i.e. FFA+MAG), which is illustrated in Figure 7.17 B. The Semi-Solid
sample presented higher levels of absorbable lipid than the Liquid sample in all the
time points except in the last one (i.e. > 170 min). These patterns can be linked with
the different gastric behaviour of the samples. Sedimentation of the Semi-Solid
sample led to the early detection of higher concentrations of both protein and lipid
seen in Figure 7.17 A and Figure 7.17 B in the first time points. The early delivery of
a higher amount of nutrients to the small intestine might trigger an increase of negative
hormonal feedback and thus slower GE, which could promote the feeling of fullness.
It could also result in increasing the period of time that food remained in the stomach
leading to a greater gastric distension and enhancing sensations of fullness
(Delzenne et al., 2010). Conversely, the effect of creaming observed in the Liquid
sample caused a delay of the nutrient release in the small intestine, seen in the last
time point (i.e. > 170 min) of Figure 7.17 A and Figure 7.17 B. Since the amount of
nutrient delivered during digestion was lower, especially in the case of lipid, we can
assume that this would cause the release of low levels of CCK. Conversely, Mackie
et al. (2013) found the CCK levels of the liquid emulsion were higher than those in the
structured sample for the first 40 min. The authors suggested that the lower viscosity
of liquid sample induced the rapid emptying and delay of CCK regulation.
Nevertheless, Marciani et al. (2007) showed a decrease of fullness and less CCK
released from an emulsion that layered in the stomach compared to another emulsion
which remained homogenous. The faster GE rate of the Liquid sample observed in
the parallel clinical study can now be explained with the lower nutrient concentration
in the aqueous layer that emptied first from the stomach. Mackie et al. (2013) also
showed differences in fullness and hunger between the samples. The Semi-Solid
sample induced substantially more fullness than the Liquid sample after just 15 min
of digestion. This could potentially be due to the higher levels of protein and lipid
released in the small intestine after the first 10 min from the Semi-Solid sample
compared to Liquid sample as shown in Figure 7.17. The in vivo study also found that
these differences in fullness were prolonged after two hours suggesting that the
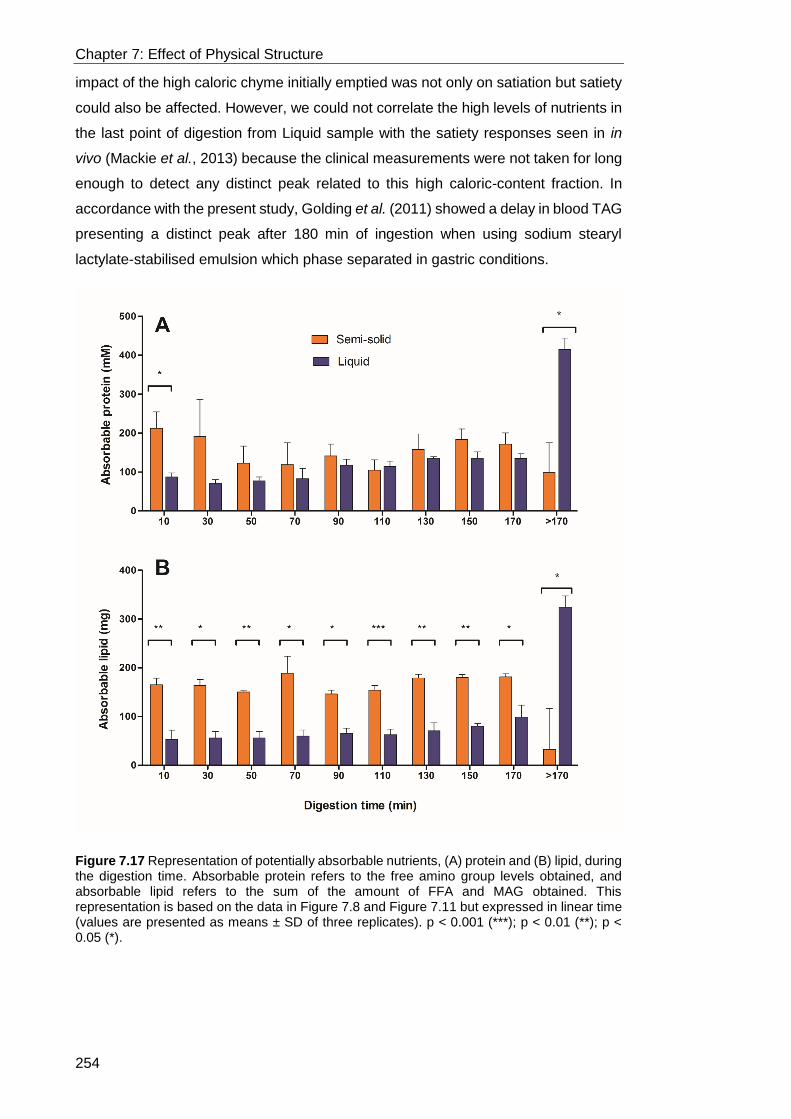
Chapter 7: Effect of Physical Structure
254
impact of the high caloric chyme initially emptied was not only on satiation but satiety
could also be affected. However, we could not correlate the high levels of nutrients in
the last point of digestion from Liquid sample with the satiety responses seen in in
vivo (Mackie et al., 2013) because the clinical measurements were not taken for long
enough to detect any distinct peak related to this high caloric-content fraction. In
accordance with the present study, Golding et al. (2011) showed a delay in blood TAG
presenting a distinct peak after 180 min of ingestion when using sodium stearyl
lactylate-stabilised emulsion which phase separated in gastric conditions.
Figure 7.17 Representation of potentially absorbable nutrients, (A) protein and (B) lipid, during the digestion time. Absorbable protein refers to the free amino group levels obtained, and absorbable lipid refers to the sum of the amount of FFA and MAG obtained. This representation is based on the data in Figure 7.8 and Figure 7.11 but expressed in linear time (values are presented as means ± SD of three replicates). p < 0.001 (***); p < 0.01 (**); p < 0.05 (*).

Chapter 7: Effect of Physical Structure
255
7.4.6 Comparison between in Vitro Dynamic and Semi-
Dynamic Gastric Models
The HGS is one of the dynamic gastric models that have been developed to
more accurately simulate the conditions of the human stomach. This model was used
to test the two studied dairy meals (work carried out by Janiene Gilliland, Maria Ferrua
and Alan Mackie) and compare the results with those obtained using the semi-
dynamic model.
Regarding the pH profile, Figure 7.18 shows the comparison between both
digestive systems. In the HGS, the initial pH of the Liquid sample (6.7 ± 0.1) was
higher than that in Semi-Solid sample (4.4 ± 0.1) whereas in the last point measured
the pH of Liquid sample (1.2) was lower than in the Semi-Solid sample (2.0), which
was similar to the results from the semi-dynamic model. The different mixing applied
could have led to some differences in the results; the HGS reproduces the motor
activity of the antral contraction waves using rubber conveyor belts along the
simulated stomach compared to the more simplistic approach of the semi-dynamic
model. Nevertheless, similar gastric behaviour was obtained using HGS as assessed
visually, in which a cream layer in the Liquid sample was observed. In fact, the particle
size distribution obtained in both digestion systems was similar (Figure 7.19); there
were no differences in the emptied aliquots along the gastric digestion of the Liquid
sample whereas variable droplet size distribution was obtained in the case of Semi-
Solid sample.
Figure 7.18 pH profile obtained in (A) HGS and (B) semi-dynamic model, solid line for Semi-Solid sample and broken line for Liquid sample.
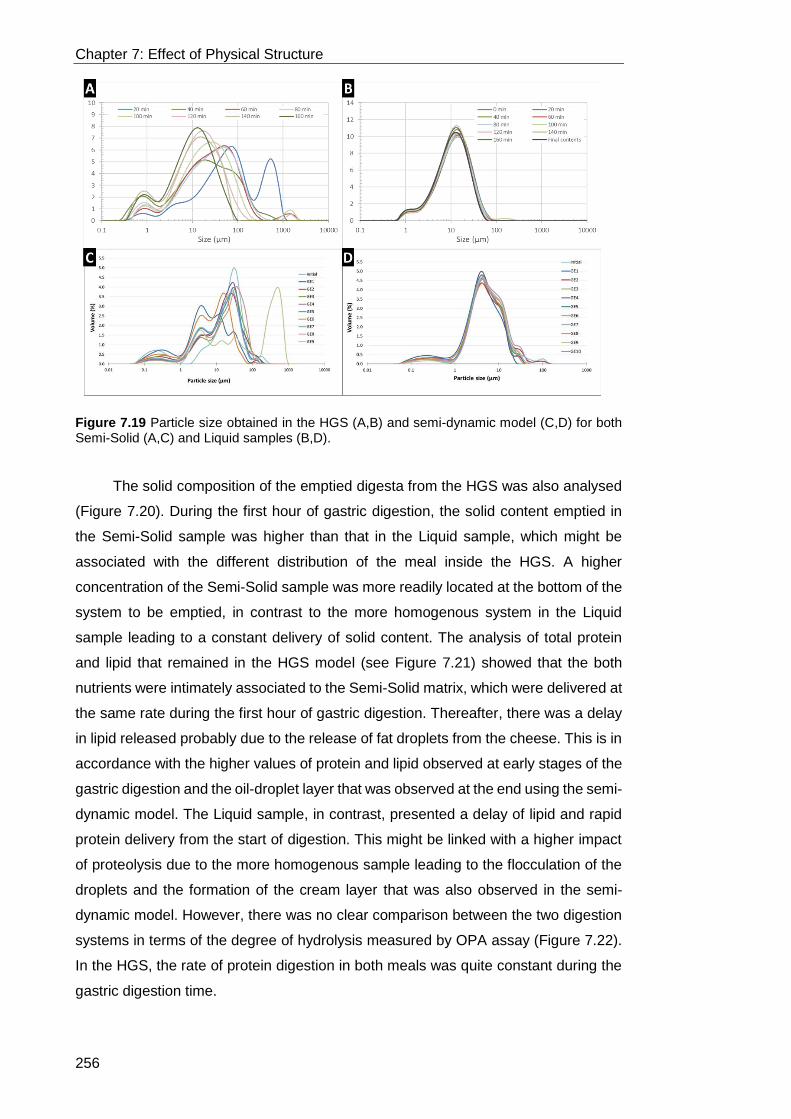
Chapter 7: Effect of Physical Structure
256
Figure 7.19 Particle size obtained in the HGS (A,B) and semi-dynamic model (C,D) for both Semi-Solid (A,C) and Liquid samples (B,D).
The solid composition of the emptied digesta from the HGS was also analysed
(Figure 7.20). During the first hour of gastric digestion, the solid content emptied in
the Semi-Solid sample was higher than that in the Liquid sample, which might be
associated with the different distribution of the meal inside the HGS. A higher
concentration of the Semi-Solid sample was more readily located at the bottom of the
system to be emptied, in contrast to the more homogenous system in the Liquid
sample leading to a constant delivery of solid content. The analysis of total protein
and lipid that remained in the HGS model (see Figure 7.21) showed that the both
nutrients were intimately associated to the Semi-Solid matrix, which were delivered at
the same rate during the first hour of gastric digestion. Thereafter, there was a delay
in lipid released probably due to the release of fat droplets from the cheese. This is in
accordance with the higher values of protein and lipid observed at early stages of the
gastric digestion and the oil-droplet layer that was observed at the end using the semi-
dynamic model. The Liquid sample, in contrast, presented a delay of lipid and rapid
protein delivery from the start of digestion. This might be linked with a higher impact
of proteolysis due to the more homogenous sample leading to the flocculation of the
droplets and the formation of the cream layer that was also observed in the semi-
dynamic model. However, there was no clear comparison between the two digestion
systems in terms of the degree of hydrolysis measured by OPA assay (Figure 7.22).
In the HGS, the rate of protein digestion in both meals was quite constant during the
gastric digestion time.
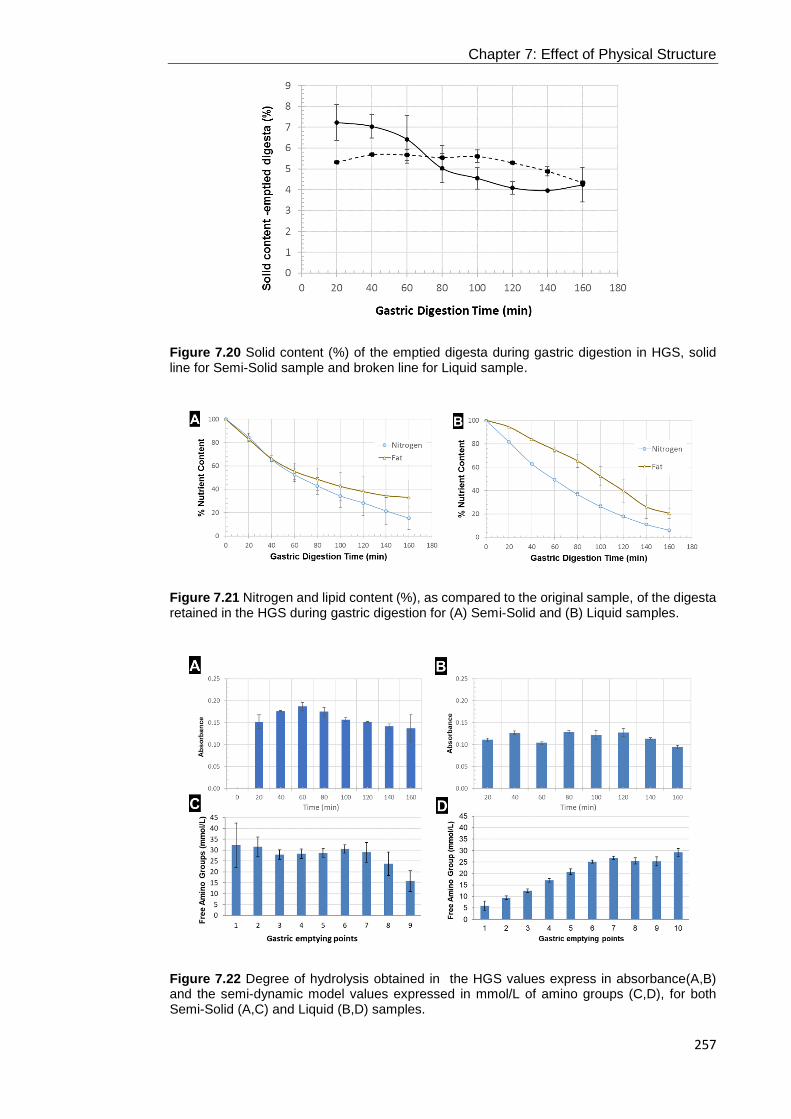
Chapter 7: Effect of Physical Structure
257
Figure 7.20 Solid content (%) of the emptied digesta during gastric digestion in HGS, solid line for Semi-Solid sample and broken line for Liquid sample.
Figure 7.21 Nitrogen and lipid content (%), as compared to the original sample, of the digesta retained in the HGS during gastric digestion for (A) Semi-Solid and (B) Liquid samples.
Figure 7.22 Degree of hydrolysis obtained in the HGS values express in absorbance(A,B) and the semi-dynamic model values expressed in mmol/L of amino groups (C,D), for both Semi-Solid (A,C) and Liquid (B,D) samples.

Chapter 7: Effect of Physical Structure
258
In general, the more simplistic approach of the semi-dynamic gastric model
provided similar results to the more sophisticated dynamic model of the HGS for these
specific dairy structures. Moreover, the comparison with the in vivo results illustrated
that this model can be an effective approach to simplify the complex dynamic models
and provide more physiological relevant data.
7.5 Conclusion
The present study shows that the in vitro gastric digestion of two dairy meals
with the same macronutrient composition was influenced by their macrostructure and
physico-chemical behaviour during gastric digestion. Their behaviour in the semi-
dynamic model was very similar to that observed in the human stomach and that in a
more advanced fully dynamic in vitro model. The colloidal behaviour of creaming and
sedimentation obtained in the Liquid and Semi-Solid samples, respectively, controlled
the composition of chyme delivered into the small intestinal phase. In the Liquid
system, the change of interfacial composition during gastric digestion was the main
driver for destabilisation of lipid droplets and formation of cream layer which led to the
delay in nutrient release. In contrast, the sedimented particles of the Semi-Solid
sample in the gastric phase caused the early emptying of high nutrient concentrations.
The results showed differences in protein and lipid digestion between the two meals.
The patterns of digestion observed in the in vitro system provided a plausible
explanation for the satiety responses seen in vivo showing a decrease in appetite for
the more structured meal.
259
Conclusions and Future
Perspectives

Chapter 8: Conclusions and Future Perspectives
260
8.1 General conclusions
Milk and dairy products are associated with benefitial health and nutritional
effects, but the mechanistic understanding of this association remains unresolved,
which may be related to how the wide array of dairy structured matrices behave in the
gastrointestinal tract. The present thesis investigated the digestive behaviour of
different dairy matrices, from macrostructures to microstructures at the molecular
level of the milk proteins. The general conclusion was that the structure and physical
properties of the dairy sample in the gastric phase determined the kinetics of nutrient
digestion, and those properties were modulated by formulation and processing. This
thesis provided more detail in the growing subject area of food structure and digestion,
highlighting the importance of the structures formed by the dairy products in the
gastrointestinal tract, in which the stomach was shown to play a key role. This study
provided for the first time, a mechanist insight regarding the factors controlling the
physical and chemical properties of the digesta, which ultimately can control the rate
of nutrient uptake and metabolic responses.
As shown in the literature review of Chapter 1, some studies have suggested
the gastric digestion as one of the possible limiting factors for the metabolic effects
observed in vivo. In order to investigate this hypothesis, a more accurate simulation
of the gastric phase was essential, thus, the semi-dynamic model was developed in
Chapter 3, which simulated the gradual pH decrease, secretion of fluids and gastric
emptying. This model could closely mimic the intragastric behaviour seen in the
human stomach by magnetic resonance imaging using the same dairy matrices.
Thus, it provides a better simulation of the main dynamics of the human stomach
compared to static models and, it is an easier and more cost-effective tool than fully
dynamic models. The semi-dynamic model has provided a useful tool to investigate
the role of structure upon nutrient digestion and has contributed to the international
scientific community with a new system to investigate food digestion.
There is an increased interest in protein consumption and supplementation
adressed to specific population needs, for instance, athletes and the elderly, and also
high protein diets are quite popular in the general population for weight reduction.
However, the digestive behaviour of proteins are not the same, which will impact the
metabolic responses. The main milk proteins, whey proteins and caseins, have been
generaly accepted as ‘fast’ and ‘slow’ proteins respectively, according to the rate of
amino acid appearance in plasma. However, the controlling factor has not been fully
explored yet. The objective of the research presented in the Chapter 4 was to
determine the gastric behaviour of the main milk proteins with different blends and

Chapter 8: Conclusions and Future Perspectives
261
lipid inclusion, and the possible impact on intestinal digestion and absorption of
nutrients in order to understand the key limiting factors controlling the rate of
absorption of milk proteins. The results showed that different milk proteins presented
different nutrient digestion rates and amino acid absorption, and the gastric digestion
was found to be the main rate limiting step. The solid coagulation of the casein
component resulted in the delay of nutrients emptied from the gastric phase and thus
slowed the overall digestion and amino acid absorption kinetics. In contrast, whey
proteins presented soluble aggregates during gastric digestion that led to a more rapid
emptying of protein from the stomach followed by a gradual decrease of nutrient
delivery and subsequent absorption. Therefore, these findings support the
generalised hypothesis that proposes the gastric phase as the main driver of the
different digestion rates of milk proteins. Moreover, a second important finding was
the modulation of the solid coagula by addition of whey proteins and lipid, a higher
lipid content resulted in a reduction of the firmness of the coagula. Moreover, the
protein matrix provided a kind of carrier for lipid and modulated lipid emptying
behaviour. This behaviour further controlled nutrient digestion and might be
associated with different physiological effects such as satiety and hyperlipidaemia.
This research shows the great potential for food formulation in modulating nutrient
digestion rate, through gastric restructuring, which could be potentially used by the
food and drink industry.
The design of foods should also consider how they are processed, by which the
structure of food matrices could be highly affected due to different ingredient/nutrient
interactions leading to different structures and physico-chemical properties.
Processing is widely used in order to provide consumers safe and convenient
products, and milk is a clear example. The main processing used in dairy industry is
homogenisation and heat treatment, and those treatments can change the native
microstructure of the milk matrix, and thus impact the kinetics of nutrient digestion. In
Chapter 5, we investigated the impact of process-induced changes of milk in the
gastric digestion. The results showed that processing induced different gastric
restructuring and coagulation in the simulated stomach. Homogenisation was the
main driver for the gastric creaming whereas the different consistencies of the coagula
were a consequence mainly of the heat treatment. The non-heated samples,
especially Raw, formed a firm coagulum whereas the heated samples developed a
weaker, fragmented coagulum particularly observed in UHT+Homo. These structural
changes occurring during the gastric phase resulted in different nutrient emptying
profiles, with significant differences between Raw and UHT+Homo, and quicker
digestion of milk proteins in the UHT-treated samples due to the drastic heat treatment
reducing the strength of the coagulum. This research showed a dramatic effect on the

Chapter 8: Conclusions and Future Perspectives
262
interactions and subsequent matrix formation within the gastrointestinal tract although
the processing did not have an obvious effect on the initial properties of the matrix.
Chapters 4 and 5 illustrated that the formation of the dense coagula in the
stomach from caseins can be modulated by formulation and processing. The inclusion
of lipid in the milk matrix as well as the processes of homogenisation and heat
treatment change the nutrient arrangement and interactions of the initial sample,
which impacts the syneresis and casein gel firmness in the stomach, illustrated in
Figure 8.1. The presence of lipid droplets can imply a physical obstacle for casein
micelles aggregation, which can also be affected by the size of the droplet by
homogenisation. Moreover, the process of homogenisation results in a new droplet
interface covered with absorbed milk proteins, which can induce to new casein
interactions. Heat treatment, at temperatures higher than 70°C, induced the
denaturation of whey proteins which interact with κ-casein at the surface of the casein
micelles and it might hamper the micelle aggregation by steric effects. Therefore,
these processes disrupt the formation of that compact micellar framework in the
gastric conditions, forming structures with different consistencies and colloidal
behaviours which affects the extent and composition of gastric emptying and, then,
the intestinal digestion and absorption.
Figure 8.1 Schematic representation of how the initial structure of casein micelle can be modified by formulation (inclusion of lipid) and processing (homogenisation and heat treatment), comparing to their native state and how these changes affect the structure that is formed in the stomach. The latter is shown by schematic representation and images of digesta obtained in the different studies.
Chapter 8: Conclusions and Future Perspectives
263
As illustrated, food formulation and processing can affect the arrangement and
interactions of nutrients within the matrix, which might influence the interaction with
the gastrointestinal factors, such as enzymes. Pepsin plays an important role in the
restructuring formed in the gastric compartment since the results of Chapter 5 showed
that it induced the formation of the coagulum earlier in the digestion, at pH values
higher than the isoelectric point of caseins (pH 4.6). Moreover, the activity of pepsin
depended on the structural changes in the stomach obtained in processed milk, which
was illustrated in Chapter 6. In general, the formation of the dense coagula obtained
in less processed milks prevented subsequent pepsin from penetrating the coagula.
However, further work needs to be performed using sophisticated techniques such as
confocal microscopy in order to obtain quantitative data. The study in Chapter 6
provided more insight into the behaviour of pepsin in complex structures during gastric
digestion, which is of high interest since it affects the subsequent bioaccessibility and
bioavailability of nutrients in the small intestine.
The bioaccessibility and bioavailability of nutrients might differ in dairy products
with different consistency due to the different processing of milk, such as cheese and
yogurt, when compared with milk. A comparison between two dairy meals with the
same caloric content but different macrostructure, semi-solid versus liquid, was
assessed in Chapter 7. The results showed that the colloidal behaviour of creaming
and sedimentation obtained in the Liquid and Semi-Solid samples, respectively,
controlled the composition of chyme delivery into the small intestinal phase. The
nutrient digestion and bioaccessibility was delayed in the Liquid sample due to the
late emptying of the dense-nutrient content of the cream layer formed, whereas the
sedimented particles in the Semi-Solid sample were emptied earlier, leading to a rapid
bioaccessibility of nutrients.
The correlation of in vivo and in vitro outcomes, as performed in Chapter 7,
provided a valuable approach to correlate the physico-chemical mechanisms with the
physiological effects and provide insight into the role of food digestion on health. In
that study comparing the Liquid and Semi-Solid samples, the different patterns of
protein and lipid digestion obtained in the simulated small intestine provided a
plausible explanation for the satiety responses observed in the corresponding human
study.
In conclusion, this thesis provides valuable insights addressing the relationship
between food structure and nutrient digestion. The dramatic effect of matrix structure
and its processing has been shown on the digestion kinetics of milk and dairy
products. This can be translated to other foods, showing that the nutritional/health
value of foods should therefore be considered as the functionality of the arrangement

Chapter 8: Conclusions and Future Perspectives
264
and interactions of the nutrients within the matrix instead of just individual nutrients.
Research should focus on mechanistic studies to understand how food matrices are
digested through the gastrointestinal tract, then, providing insights into their nutritional
and health effects, and the food restructuring in the stomach can be exploited to
develop food structures addressed to different physiological functionalities.
8.2 Future perspectives
The semi-dynamic model provided a suitable tool for the studies presented in
this thesis, however, as with any model, it is not able to completely simulate the
processes of the gastrointestinal tract. Therefore, human studies would be helpful to
correlate with the present results and would provide important insights into the
interactions of food within the gut. For instance, the use of techniques such as
magnetic resonance imaging would enable greater understanding of the restructuring
of dairy products in the stomach and their pattern of gastric emptying.
As mentioned above, there is an increased demand for protein-based products.
In this regard, there is an emergent area of research that involves proteins from plant
sources, due to the growing consumer market interest and the standpoint of global
environmental sustainability, which translates into plant-protein-based diets including
non-dairy milks and convenience foods such as bars and yogurts. Some examples of
sources of plant proteins are soy, quinoa, pea and rice.
There is currently little evidence of the metabolic effects of plant-based proteins,
mainly soy protein, but it has been generalised that these proteins result in lower
stimulation of muscle protein synthesis, compared to animal sources due to their
generally lower digestibility (based on conventional nutritional evaluation methods),
lower Leu content and deficiencies in certain essential amino acids (Gorissen et al.,
2018). There are some studies showing the increase of postprandial muscle protein
synthesis after the ingestion of isolated soy protein in young men (Tang et al., 2009;
Wilkinson et al., 2007). When compared with the response to milk proteins, the
ingestion of soy protein induced a greater effect when compared with casein but lower
response compared to whey protein and milk. The authors attributed this different
muscle protein synthesis to differences in protein digestion kinetics, suggesting an
intermediate behaviour between the fast whey protein and the slow casein protein.
Bos, 2003 showed that soy protein resulted in earlier and higher kinetics of dietary
amino acids in plasma, showing a peak at 2.5 hours compared to milk protein (3.9
hours). The faster amino acid absorption kinetics led to faster transfer of N into urea
Chapter 8: Conclusions and Future Perspectives
265
and, thus, lower N retention, which reduced the support required for muscle protein
synthesis.
Research has shown that the protein digestion rate determines the rate and
extent of amino acid absorption and the overall metabolic responses (Dangin et al.,
2001), and this thesis has shown that gastric digestion can play a key role. There is
no evidence explaining the possible intermediate behaviour of soy protein or other
plant-based protein. Also, soy protein has mostly been studied in its isolate form,
however, there are other processes applied to soy bean that might change its
functionality, also some plant-based proteins are usually associated with the cell wall,
which may affect bioaccessibility, and which should be considered. The more widely
investigated animal proteins (e.g. milk, egg and meat) present different behaviour,
which is affected by formulation and processing. This raises several questions, each
of which would lead to potential avenues of further research in food structure and
digestion. Do all plant proteins exhibit the same properties in the gastrointestinal
conditions? Processing might induce changes in their molecular structure and
interaction/aggregation behaviour, therefore, to what extent does processing of
proteins impact digestion? Do they have different gastric behaviour? And, does their
functionality differ from their source, taking into account the other components of the
matrix? Therefore, there is the need for more research on proteins from plants in
relation to digestion that will provide insights in the role of plant proteins in not only
skeletal muscle mass but other physiological responses such as satiety.
However, plant-based proteins are, in general, not complete proteins, in that
they are missing one or more essential amino acids, in contrast to milk proteins.
Therefore, there is the need to improve the quality in terms of nutrition and
functionality of plant proteins that could be achieved by some approaches such as
breeding and genetic selection, improve protein functionality, improve digestibility and
bioavailability of proteins during digestion. In that sense, proteins could be modified
by processes (enzymatic, chemical or physical) to improve or create new
functionalities, which could be beneficial for modulating nutrient digestion, for instance
inducing a different gastric behaviour that, consequently could modulate nutrient
bioavailability. The consumption of blends of different plant proteins or with other
protein sources that would satisfy all the essential amino acid requirements could be
an option to improve digestion and better muscle protein synthesis response, which
has not been investigated yet. Investigating different approaches may drive future
research towards novel formulations to achieve unique digestive properties, which will
allow an optimal nutrient profile absorption and subsequent metabolic response. For
instance, Reidy et al. (2013) showed that the blend of soy protein with milk proteins

Chapter 8: Conclusions and Future Perspectives
266
showed more benefits in muscle protein synthesis than a single protein, and illustrated
the relevance of the protein blends that have been incorporated in commercial sports
nutrition products. Therefore, the design of food formulation should be performed
taking into account the digestive behaviour in order to induce specific rate of nutrient
digestion and, tailor and optimise nutritional and health effects.
Industrial processes such as homogenisation are widely used in the food and
drink industry to provide long-shelf life products. However, this process affects the
size of the droplets and the interactions with other nutrients, which can affect the
functionality within the gastrointestinal tract. Following the observations in Chapter 5,
two milk protein stabilised emulsions differing in droplet size (approximately 1.3
versus 0.1 µm) were investigated (results not shown). Preliminary results showed that
some creaming was obtained in both samples during the gastric digestion using the
semi-dynamic model, however, the extent and rate of that creaming was higher in the
emulsion with smaller droplet size. This could potentially result in a different nutrient
digestion and absorption kinetics. Therefore, relatively small changes in the
production of food matrix could have significant impact on the metabolic effects.
Indeed, there are a few studies showing the effect of droplet size of emulsions on
physiological responses such as satiety (Armand et al., 1999; Lett et al., 2016a).
Therefore, food processing offers possibilities to modulate nutrient digestion, hence,
it is a potent tool to tailor metabolic effects.
When considering dairy products it is not only important to consider the
macronutrients but minerals; calcium is highly important for both textural and
nutritional roles. Calcium also plays an important role in lipid digestion since it has
been reported that calcium can form complexes with free fatty acids, which are
insoluble at the intestinal pH, called calcium soaps. This process can enhance the
rate of hydrolysis by preventing free fatty acids from accumulating at the droplet
surface, however, at the same time, hamper the accessibility and subsequent
absorption of free fatty acids. The formation of these calcium soaps has been
indicated to be one possible explanation for the reduction of cholesterol reported in
the consumption of dairy products by the reduction of bile acid reabsorption. However,
this might be affected by the type of matrix. Indeed, Lamothe et al. (2017) showed
that, in a simulated digestion, for the equivalent calcium content, a solid matrix
resulted in higher content of calcium soaps compared to liquid or semi-solid matrices
but the underlying mechanisms were not understood. A detailed understanding of the
influence of the matrix of the formation of calcium soaps is crucial to understand its
contribution in lipid digestion and provide new insights into cardiovascular effects.
This is an interesting area of research that needs further work. Moreover, in relation

Chapter 8: Conclusions and Future Perspectives
267
to the emergent area of the gut microbiota, would different structures of fermented
dairy products modify gut health?

268
References
References
269
Acheson, K. J., Blondel-Lubrano, A., Oguey-Araymon, S., Beaumont, M., Emady-Azar, S., Ammon-Zufferey, C., Monnard, I., Pinaud, S., Nielsen-Moennoz, C., & Bovetto, L. (2011). Protein choices targeting thermogenesis and metabolism1–3. The American journal of clinical nutrition, 93(3), 525-534.
Alfenas, R. d. C. G., Bressan, J., & Paiva, A. C. d. (2010). Effects of protein quality on appetite and energy metabolism in normal weight subjects. Arquivos Brasileiros de Endocrinologia & Metabologia, 54(1), 45-51.
Almiron‐Roig, E., Chen, Y., & Drewnowski, A. (2003). Liquid calories and the failure of satiety: how good is the evidence? Obesity reviews, 4(4), 201-212.
Anderson, G. H., & Moore, S. E. (2004). Dietary proteins in the regulation of food intake and body weight in humans. The Journal of nutrition, 134(4), 974S-979S.
Anema, S. G., & Li, Y. (2003). Association of denatured whey proteins with casein micelles in heated reconstituted skim milk and its effect on casein micelle size. Journal of Dairy Research, 70(1), 73-83.
Anema, S. G., Lee, S. K., & Klostermeyer, H. (2011). Rennet-Induced Aggregation of Heated pH-Adjusted Skim Milk. Journal of Agricultural and Food Chemistry, 59(15), 8413-8422.
Armand, M., Hamosh, M., DiPalma, J. S., Gallagher, J., Benjamin, S. B., Philpott, J. R., Lairon, D., & Hamosh, P. (1995). Dietary fat modulates gastric lipase activity in healthy humans. The American journal of clinical nutrition, 62(1), 74-80.
Armand, M., Pasquier, B., Borel, P., Andre, M., Senft, M., Peyrot, J., Salducci, J., & Lairon, D. (1997). Emulsion and absorption of lipids: the importance of physicochemical properties. Oleagineux Corps Gras Lipides (France).
Armand, M., Pasquier, B., André, M., Borel, P., Senft, M., Peyrot, J., Salducci, J., Portugal, H., Jaussan, V., & Lairon, D. (1999). Digestion and absorption of 2 fat emulsions with different droplet sizes in the human digestive tract. The American journal of clinical nutrition, 70(6), 1096-1106.
Armand, M. (2007). Lipases and lipolysis in the human digestive tract: where do we stand? Current Opinion in Clinical Nutrition & Metabolic Care, 10(2), 156-164.
Awati, A., Rutherfurd, S. M., Plugge, W., Reynolds, G. W., Marrant, H., Kies, A. K., & Moughan, P. J. (2009). Ussing chamber results for amino acid absorption of protein hydrolysates in porcine jejunum must be corrected for endogenous protein. Journal of the Science of Food and Agriculture, 89(11), 1857-1861.
Bach, A., Aris, A., Vidal, M., Fàbregas, F., & Terré, M. (2017). Influence of milk processing temperature on growth performance, nitrogen retention, and hindgut's inflammatory status and bacterial populations in a calf model. Journal of Dairy Research, 84(3), 355-359.
Barbé, F., Ménard, O., Le Gouar, Y., Buffière, C., Famelart, M.-H., Laroche, B., Le Feunteun, S., Dupont, D., & Rémond, D. (2013). The heat treatment and the gelation are strong determinants of the kinetics of milk proteins digestion and of the peripheral availability of amino acids. Food Chemistry, 136(3), 1203-1212.
Barbé, F., Ménard, O., Gouar, Y. L., Buffière, C., Famelart, M.-H., Laroche, B., Feunteun, S. L., Rémond, D., & Dupont, D. (2014a). Acid and rennet gels exhibit strong differences in the kinetics of milk protein digestion and amino acid bioavailability. Food Chemistry, 143, 1-8.
Barbé, F., Le Feunteun, S., Rémond, D., Ménard, O., Jardin, J., Henry, G., Laroche, B., & Dupont, D. (2014b). Tracking the in vivo release of bioactive peptides in

References
270
the gut during digestion: Mass spectrometry peptidomic characterization of effluents collected in the gut of dairy matrix fed mini-pigs. Food Research International, 63, 147-156.
Barroso, E., Cueva, C., Peláez, C., Martínez-Cuesta, M. C., & Requena, T. (2015). The computer-controlled multicompartmental dynamic model of the gastrointestinal system SIMGI. In The Impact of Food Bioactives on Health, (pp. 319-327): Springer.
Bendtsen, L. Q., Lorenzen, J. K., Bendsen, N. T., Rasmussen, C., & Astrup, A. (2013). Effect of Dairy Proteins on Appetite, Energy Expenditure, Body Weight, and Composition: a Review of the Evidence from Controlled Clinical Trials. Advances in Nutrition, 4(4), 418-438.
Benelam, B. (2009). Satiation, satiety and their effects on eating behaviour. Nutrition Bulletin, 34(2), 126-173.
Bhattacharya, A., Banu, J., Rahman, M., Causey, J., & Fernandes, G. (2006). Biological effects of conjugated linoleic acids in health and disease. The Journal of Nutritional Biochemistry, 17(12), 789-810.
Bligh, E. G., & Dyer, W. J. (1959). A rapid method of total lipid extraction and putification. Canadian Journal of Biochemistry and Physiology, 37(8), 911-917.
Bluemel, S., Menne, D., Fried, M., Schwizer, W., & Steingoetter, A. (2015). On the validity of the 13C‐acetate breath test for comparing gastric emptying of different liquid test meals: a validation study using magnetic resonance imaging. Neurogastroenterology & Motility, 27(10), 1487-1494.
Bohn, T., Carriere, F., Day, L., Deglaire, A., Egger, L., Freitas, D., Golding, M., Le Feunteun, S., Macierzanka, A., Menard, O., Miralles, B., Moscovici, A., Portmann, R., Recio, I., Rémond, D., Santé-Lhoutelier, V., Wooster, T. J., Lesmes, U., Mackie, A. R., & Dupont, D. (2017). Correlation between in vitro and in vivo data on food digestion. What can we predict with static in vitro digestion models? Critical Reviews in Food Science and Nutrition, 58(13), 2239-2261.
Boirie, Y., Dangin, M., Gachon, P., Vasson, M.-P., Maubois, J.-L., & Beaufrère, B. (1997). Slow and fast dietary proteins differently modulate postprandial protein accretion. Proceedings of the National Academy of Sciences, 94(26), 14930-14935.
Bos, C., Mahé, S., Gaudichon, C., Benamouzig, R., Gausserès, N., Luengo, C., Ferrière, F., Rautureau, J., & Tomé, D. (1999). Assessment of net postprandial protein utilization of 15 N-labelled milk nitrogen in human subjects. British Journal of Nutrition, 81(3), 221-226.
Bos, C., Metges, C. C., Gaudichon, C., Petzke, K. J., Pueyo, M. E., Morens, C., Everwand, J., Benamouzig, R., & Tomé, D. (2003). Postprandial Kinetics of Dietary Amino Acids Are the Main Determinant of Their Metabolism after Soy or Milk Protein Ingestion in Humans. The Journal of nutrition, 133(5), 1308-1315.
Bourlieu, C., Ménard, O., De La Chevasnerie, A., Sams, L., Rousseau, F., Madec, M.-N., Robert, B., Deglaire, A., Pezennec, S., Bouhallab, S., Carrière, F., & Dupont, D. (2015). The structure of infant formulas impacts their lipolysis, proteolysis and disintegration during in vitro gastric digestion. Food Chemistry, 182, 224-235.
Boutrou, R., Gaudichon, C., Dupont, D., Jardin, J., Airinei, G., Marsset-Baglieri, A., Benamouzig, R., Tomé, D., & Leonil, J. (2013). Sequential release of milk

References
271
protein–derived bioactive peptides in the jejunum in healthy humans. The American journal of clinical nutrition, 97(6), 1314-1323.
Brener, W., Hendrix, T. R., & McHugh, P. R. (1983). Regulation of the gastric emptying of glucose. Gastroenterology, 85(1), 76-82.
Brighton, C. A., Rievaj, J., Kuhre, R. E., Glass, L. L., Schoonjans, K., Holst, J. J., Gribble, F. M., & Reimann, F. (2015). Bile acids trigger GLP-1 release predominantly by accessing basolaterally located G protein–coupled bile acid receptors. Endocrinology, 156(11), 3961-3970.
Burd, N. A., Yang, Y., Moore, D. R., Tang, J. E., Tarnopolsky, M. A., & Phillips, S. M. (2012). Greater stimulation of myofibrillar protein synthesis with ingestion of whey protein isolate v. micellar casein at rest and after resistance exercise in elderly men. British Journal of Nutrition, 108(6), 958-962.
Butland, B., Jebb, S., Kopelman, P., McPherson, K., Thomas, S., Mardell, J., & Parry, V. (2007). Foresight. Tackling obesities: future choices. Project report. Foresight. Tackling obesities: future choices. Project report.
Calbet, J., & MacLean, D. (1997). Role of caloric content on gastric emptying in humans. The Journal of physiology, 498(2), 553-559.
Calbet, J. A. L., & Holst, J. J. (2004). Gastric emptying, gastric secretion and enterogastrone response after administration of milk proteins or their peptide hydrolysates in humans. European journal of nutrition, 43(3), 127-139.
Camilleri, M., Malagelada, J., Brown, M., Becker, G., & Zinsmeister, A. R. (1985). Relation between antral motility and gastric emptying of solids and liquids in humans. American Journal of Physiology-Gastrointestinal and Liver Physiology, 249(5), G580-G585.
Carriere, F., Moreau, H., Raphel, V., Laugier, R., Benicourt, C., Junien, J. L., & Verger, R. (1991). Purification and biochemical characterization of dog gastric lipase. European Journal of Biochemistry, 202(1), 75-83.
Carriere, F., Barrowman, J. A., Verger, R., & Laugier, R. (1993). Secretion and contribution to lipolysis of gastric and pancreatic lipases during a test meal in humans. Gastroenterology, 105(3), 876-888.
Cartwright, G., McManus, B. H., Leffler, T. P., & Moser, C. R. (2005). Rapid determination ofmoisture/solids and fat in dairy products by microwave and nuclear magnetic resonance analysis: PVM 1: 2004. Journal of AOAC International, 88(1), 107-120.
Chen, J. (2009). Food oral processing—A review. Food Hydrocolloids, 23(1), 1-25.
Church, F. C., Swaisgood, H. E., Porter, D. H., & Catignani, G. L. (1983). Spectrophotometric assay using o-phthaldialdehyde for determination of proteolysis in milk and isolated milk proteins1. Journal of Dairy Science, 66(6), 1219-1227.
Churchward-Venne, T. A., Snijders, T., Linkens, A. M., Hamer, H. M., van Kranenburg, J., & van Loon, L. J. (2015). Ingestion of Casein in a Milk Matrix Modulates Dietary Protein Digestion and Absorption Kinetics but Does Not Modulate Postprandial Muscle Protein Synthesis in Older Men–3. The Journal of nutrition, 145(7), 1438-1445.
Clemente, G., Mancini, M., Nazzaro, F., Lasorella, G., Rivieccio, A., Palumbo, A. M., Rivellese, A. A., Ferrara, L., & Giacco, R. (2003). Effects of different dairy products on postprandial lipemia. Nutrition, Metabolism and Cardiovascular Diseases, 13(6), 377-383.
Costill, D., & Saltin, B. (1974). Factors limiting gastric emptying during rest and exercise. Journal of Applied Physiology, 37(5), 679-683.
References
272
Cummings, D. E., & Overduin, J. (2007). Gastrointestinal regulation of food intake. The Journal of clinical investigation, 117(1), 13-23.
Dalgleish, D. G., Spagnuolo, P. A., & Goff, H. D. (2004). A possible structure of the casein micelle based on high-resolution field-emission scanning electron microscopy. International Dairy Journal, 14(12), 1025-1031.
Dalgleish, D. G., & Corredig, M. (2012). The structure of the casein micelle of milk and its changes during processing. Annual review of food science and technology, 3, 449-467.
Dangin, M., Boirie, Y., Garcia-Rodenas, C., Gachon, P., Fauquant, J., Callier, P., Ballèvre, O., & Beaufrère, B. (2001). The digestion rate of protein is an independent regulating factor of postprandial protein retention. American Journal of Physiology-Endocrinology And Metabolism, 280(2), E340-E348.
Dangin, M., Guillet, C., Garcia‐Rodenas, C., Gachon, P., Bouteloup‐Demange, C.,
Reiffers‐Magnani, K., Fauquant, J., Ballèvre, O., & Beaufrère, B. (2003). The rate of protein digestion affects protein gain differently during aging in humans. The Journal of physiology, 549(2), 635-644.
Day, L., Golding, M., Xu, M., Keogh, J., Clifton, P., & Wooster, T. J. (2014). Tailoring the digestion of structured emulsions using mixed monoglyceride–caseinate interfaces. Food Hydrocolloids, 36, 151-161.
De Kruif, C. G., Huppertz, T., Urban, V. S., & Petukhov, A. V. (2012). Casein micelles and their internal structure. Advances in Colloid and Interface Science, 171, 36-52.
de la Fuente, M. A., Singh, H., & Hemar, Y. (2002). Recent advances in the characterisation of heat-induced aggregates and intermediates of whey proteins. Trends in Food Science & Technology, 13(8), 262-274.
Dehghan, M., Mente, A., Rangarajan, S., Sheridan, P., Mohan, V., Iqbal, R., Gupta, R., Lear, S., Wentzel-Viljoen, E., & Avezum, A. (2018). Association of dairy intake with cardiovascular disease and mortality in 21 countries from five continents (PURE): a prospective cohort study. The Lancet, 392(10161), 2288-2297.
Dekkers, B., Kolodziejczyk, E., Acquistapace, S., Engmann, J., & Wooster, T. (2016). Impact of gastric pH profiles on the proteolytic digestion of mixed βlg-Xanthan biopolymer gels. Food & function, 7(1), 58-68.
Delzenne, N., Blundell, J., Brouns, F., Cunningham, K., De Graaf, K., Erkner, A., Lluch, A., Mars, M., Peters, H., & Westerterp‐Plantenga, M. (2010). Gastrointestinal targets of appetite regulation in humans. Obesity reviews, 11(3), 234-250.
Dickinson, E. (1992). Introduction to food colloids: Oxford University Press.
Dickinson, E. (1997). Properties of Emulsions Stabilized with Milk Proteins: Overview of Some Recent Developments. Journal of Dairy Science, 80(10), 2607-2619.
Dickinson, E. (2013). Stabilising emulsion‐based colloidal structures with mixed food ingredients. Journal of the Science of Food and Agriculture, 93(4), 710-721.
Dideriksen, K., Reitelseder, S., Petersen, S., Hjort, M., Helmark, I., Kjær, M., & Holm, L. (2011). Stimulation of muscle protein synthesis by whey and caseinate ingestion after resistance exercise in elderly individuals. Scandinavian Journal of Medicine & Science in Sports, 21(6).
Diepvens, K., Häberer, D., & Westerterp-Plantenga, M. (2008). Different proteins and biopeptides differently affect satiety and anorexigenic/orexigenic hormones in healthy humans. International Journal of Obesity, 32(3), 510.

References
273
Dinning, P. G., Arkwright, J. W., Gregersen, H., O'grady, G., & Scott, S. M. (2010). Technical advances in monitoring human motility patterns. Neurogastroenterology & Motility, 22(4), 366-380.
Donato, L., Alexander, M., & Dalgleish, D. G. (2007). Acid Gelation in Heated and Unheated Milks: Interactions between Serum Protein Complexes and the Surfaces of Casein Micelles. Journal of Agricultural and Food Chemistry, 55(10), 4160-4168.
Dougkas, A., Minihane, A. M., Givens, D. I., Reynolds, C. K., & Yaqoob, P. (2012). Differential effects of dairy snacks on appetite, but not overall energy intake. British Journal of Nutrition, 108(12), 2274-2285.
Douglas, F., Greenberg, R., Farrell, H., & Edmondson, L. (1981). Effects of ultra-high-temperature pasteurization on milk proteins. Journal of Agricultural and Food Chemistry, 29(1), 11-15.
Dove, E. R., Hodgson, J. M., Puddey, I. B., Beilin, L. J., Lee, Y. P., & Mori, T. A. (2009). Skim milk compared with a fruit drink acutely reduces appetite and energy intake in overweight men and women–. The American journal of clinical nutrition, 90(1), 70-75.
Dressman, J. B., Berardi, R. R., Dermentzoglou, L. C., Russell, T. L., Schmaltz, S. P., Barnett, J. L., & Jarvenpaa, K. M. (1990). Upper gastrointestinal (GI) pH in young, healthy men and women. Pharmaceutical research, 7(7), 756-761.
Drøhse, H. B., & Foltmann, B. (1989). Specificity of milk-clotting enzymes towards bovine κ-casein. Biochimica et Biophysica Acta (BBA)-Protein Structure and Molecular Enzymology, 995(3), 221-224.
Drouin-Chartier, J.-P., Tremblay, A. J., Maltais-Giguère, J., Charest, A., Guinot, L., Rioux, L.-E., Labrie, S., Britten, M., Lamarche, B., & Turgeon, S. L. (2017). Differential impact of the cheese matrix on the postprandial lipid response: a randomized, crossover, controlled trial. The American journal of clinical nutrition, 106(6), 1358-1365.
Drummond, M. J., & Rasmussen, B. B. (2008). Leucine-enriched nutrients and the regulation of mTOR signalling and human skeletal muscle protein synthesis. Current opinion in clinical nutrition and metabolic care, 11(3), 222.
Dunn, B. M. (2001). Overview of pepsin‐like aspartic peptidases. Current protocols in protein science, 25(1), 21.23. .
Dupont, D., Mandalari, G., Mollé, D., Jardin, J., Rolet‐Répécaud, O., Duboz, G., Léonil, J., Mills, C. E., & Mackie, A. R. (2010). Food processing increases casein resistance to simulated infant digestion. Molecular Nutrition & Food Research, 54(11), 1677-1689.
Dupont, D., Le Feunteun, S., Marze, S., & Souchon, I. (2017). Structuring food to control its disintegration in the gastrointestinal tract and optimize nutrient bioavailability. Innovative Food Science & Emerging Technologies, 46, 83-90.
Dupont, D., Alric, M., Blanquet-Diot, S., Bornhorst, G., Cueva, C., Deglaire, A., Denis, S., Ferrua, M., Havenaar, R., & Lelieveld, J. (2018). Can dynamic in vitro digestion systems mimic the physiological reality? Critical Reviews in Food Science and Nutrition, 1-17.
Efigênia, M., Povoa, B., & Moraes-Santos, T. (1997). Effect of heat treatment on the nutritional quality of milk proteins. International Dairy Journal, 7(8-9), 609-612.
Egger, L., Ménard, O., Delgado-Andrade, C., Alvito, P., Assunção, R., Balance, S., Barberá, R., Brodkorb, A., Cattenoz, T., & Clemente, A. (2016). The harmonized INFOGEST in vitro digestion method: From knowledge to action. Food Research International, 88, 217-225.

References
274
Egger, L., Schlegel, P., Baumann, C., Stoffers, H., Guggisberg, D., Brügger, C., Dürr, D., Stoll, P., Vergères, G., & Portmann, R. (2017). Physiological comparability of the harmonized INFOGEST in vitro digestion method to in vivo pig digestion. Food Research International.
Einhorn-Stoll, U., & Drusch, S. (2015). Methods for investigation of diffusion processes and biopolymer physics in food gels. Current Opinion in Food Science, 3, 118-124.
Elashoff, J. D., Reedy, T. J., & Meyer, J. H. (1982). Analysis of Gastric Emptying Data. Gastroenterology, 83(6), 1306-1312.
Elliot, T. A., Cree, M. G., Sanford, A. P., Wolfe, R. R., & Tipton, K. D. (2006). Milk ingestion stimulates net muscle protein synthesis following resistance exercise. Medicine & Science in Sports & Exercise, 38(4), 667-674.
Erickson, R. H., & Kim, Y. S. (1990). Digestion and absorption of dietary protein. Annual Review of Medicine, 41(1), 133-139.
Fang, X., Rioux, L.-E., Labrie, S., & Turgeon, S. L. (2016). Commercial cheeses with different texture have different disintegration and protein/peptide release rates during simulated in vitro digestion. International Dairy Journal, 56, 169-178.
Fang, Y., & Dalgleish, D. G. (1997). Conformation of β-Lactoglobulin Studied by FTIR: Effect of pH, Temperature, and Adsorption to the Oil–Water Interface. Journal of Colloid and Interface Science, 196(2), 292-298.
FAO. (2003). Food energy—methods of analysis and conversion factors. FAO Food and Nutrition Paper. Food and Agriculture Organization of the United Nations, 77(Rome).
Feeney, E. L., Barron, R., Dible, V., Hamilton, Z., Power, Y., Tanner, L., Flynn, C., Bouchier, P., Beresford, T., & Noronha, N. (2018). Dairy matrix effects: response to consumption of dairy fat differs when eaten within the cheese matrix—a randomized controlled trial. The American journal of clinical nutrition, 108(4), 667-674.
Feinle, C., Kunz, P., Boesiger, P., Fried, M., & Schwizer, W. (1999). Scintigraphic validation of a magnetic resonance imaging method to study gastric emptying of a solid meal in humans. Gut, 44(1), 106-111.
Fekete, Á., Givens, D., & Lovegrove, J. (2015). Casein-derived lactotripeptides reduce systolic and diastolic blood pressure in a meta-analysis of randomised clinical trials. Nutrients, 7(1), 659-681.
Fekete, Á. A., Givens, D. I., & Lovegrove, J. A. (2016). Can milk proteins be a useful tool in the management of cardiometabolic health? An updated review of human intervention trials. Proceedings of the Nutrition Society, 75(3), 328-341.
Ferreira-Lazarte, A., Montilla, A., Mulet-Cabero, A.-I., Rigby, N., Olano, A., Mackie, A., & Villamiel, M. (2017). Study on the digestion of milk with prebiotic carbohydrates in a simulated gastrointestinal model. Journal of Functional Foods, 33, 149-154.
Ferrua, M. J., & Singh, R. P. (2010). Modeling the Fluid Dynamics in a Human Stomach to Gain Insight of Food Digestion. Journal of Food Science, 75(7), R151-R162.
Ferrua, M. J., & Singh, R. P. (2015). Computational modelling of gastric digestion: current challenges and future directions. Current Opinion in Food Science, 4, 116-123.
Fidler, J., Bharucha, A. E., Camilleri, M., Camp, J., Burton, D., Grimm, R., Riederer, S. J., Robb, R. A., & Zinsmeister, A. R. (2009). Application of magnetic

References
275
resonance imaging to measure fasting and postprandial volumes in humans. Neurogastroenterology & Motility, 21(1), 42-51.
Fiszman, S., & Varela, P. (2013). The satiating mechanisms of major food constituents – An aid to rational food design. Trends in Food Science & Technology, 32(1), 43-50.
Flanagan, J., & FitzGerald, R. J. (2003). Characterisation and quantification of the reaction(s) catalysed by transglutaminase using the o-phthaldialdehyde reagent. Nahrung, 47(3), 207-212.
Flourie, B., Vidon, N., Chayvialle, J., Palma, R., Franchisseur, C., & Bernier, J. (1985). Effect of increased amounts of pectin on a solid-liquid meal digestion in healthy man. The American journal of clinical nutrition, 42(3), 495-503.
Floury, J., Bianchi, T., Thévenot, J., Dupont, D., Jamme, F., Lutton, E., Panouillé, M., Boué, F., & Le Feunteun, S. (2018). Exploring the breakdown of dairy protein gels during in vitro gastric digestion using time-lapse synchrotron deep-UV fluorescence microscopy. Food Chemistry, 239, 898-910.
Fox, P., & Brodkorb, A. (2008). The casein micelle: historical aspects, current concepts and significance. International Dairy Journal, 18(7), 677-684.
Fox, P. F., McSweeney, P. L., & Paul, L. (1998). Dairy chemistry and biochemistry: London: Blackie Academic & Professional.
Frost, G., Brynes, A. E., Ellis, S., Milton, J. E., Nematy, M., & Philippou, E. (2006). Nutritional influences on gut hormone release. Current Opinion in Endocrinology, Diabetes and Obesity, 13(1), 42-48.
Gannon, M. C., & Nuttall, F. Q. (2010). Amino acid ingestion and glucose metabolism—a review. IUBMB life, 62(9), 660-668.
Garcia, C., Antona, C., Robert, B., Lopez, C., & Armand, M. (2014). The size and interfacial composition of milk fat globules are key factors controlling triglycerides bioavailability in simulated human gastro-duodenal digestion. Food Hydrocolloids, 35, 494-504.
Garlick, P. J. (2005). The role of leucine in the regulation of protein metabolism. The Journal of nutrition, 135(6), 1553S-1556S.
Gass, J., Vora, H., Hofmann, A. F., Gray, G. M., & Khosla, C. (2007). Enhancement of dietary protein digestion by conjugated bile acids. Gastroenterology, 133(1), 16-23.
Gaudichon, C., Roos, N., Mahé, S., Sick, H., Bouley, C., & Tomé, D. (1994). Gastric emptying regulates the kinetics of nitrogen absorption from 15N-labeled milk and 15N-labeled yogurt in miniature pigs. The Journal of nutrition, 124(10), 1970-1977.
Gaudichon, C., Mahé, S., Roos, N., Benamouzig, R., Luengo, C., Huneau, J.-F., Sick, H., Bouley, C., Rautureau, J., & Tome, D. (1995). Exogenous and endogenous nitrogen flow rates and level of protein hydrolysis in the human jejunum after [15 N] milk and [15 N] yoghurt ingestion. British Journal of Nutrition, 74(2), 251-260.
Gaudichon, C., Mahé, S., Benamouzig, R., Luengo, C., Fouillet, H., Daré, S., Van Oycke, M., Ferrière, F., Rautureau, J., & Tomé, D. (1999). Net postprandial utilization of [15N]-labeled milk protein nitrogen is influenced by diet composition in humans. The Journal of nutrition, 129(4), 890-895.
Gebauer, S. K., Novotny, J. A., Bornhorst, G. M., & Baer, D. J. (2016). Food processing and structure impact the metabolizable energy of almonds. Food & function, 7(10), 4231-4238.

References
276
Geraedts, M. C., Troost, F. J., De Ridder, R. J., Bodelier, A. G., Masclee, A. A., & Saris, W. H. (2012). Validation of Ussing chamber technology to study satiety hormone release from human duodenal specimens. Obesity, 20(3), 678-682.
Gilani, G. S., Xiao, C., & Lee, N. (2008). Need for accurate and standardized determination of amino acids and bioactive peptides for evaluating protein quality and potential health effects of foods and dietary supplements. Journal of AOAC International, 91(4), 894-900.
Giroux, H. J., Bouchard, C., & Britten, M. (2014). Combined effect of renneting pH, cooking temperature, and dry salting on the contraction kinetics of rennet-induced milk gels. International Dairy Journal, 35(1), 70-74.
Givens, D. I. (2017). Saturated fats, dairy foods and health: A curious paradox? Nutrition Bulletin, 42(3), 274-282.
Goetze, O., Steingoetter, A., Menne, D., van der Voort, I. R., Kwiatek, M. A., Boesiger, P., Weishaupt, D., Thumshirn, M., Fried, M., & Schwizer, W. (2007). The effect of macronutrients on gastric volume responses and gastric emptying in humans: a magnetic resonance imaging study. American Journal of Physiology-Gastrointestinal and Liver Physiology, 292(1), G11-G17.
Goetze, O., Treier, R., Fox, M., Steingoetter, A., Fried, M., Boesiger, P., & Schwizer, W. (2009). The effect of gastric secretion on gastric physiology and emptying in the fasted and fed state assessed by magnetic resonance imaging. Neurogastroenterology & Motility, 21(7), 725-e742.
Golding, M., Wooster, T. J., Day, L., Xu, M., Lundin, L., Keogh, J., & Clifton, P. (2011). Impact of gastric structuring on the lipolysis of emulsified lipids. Soft Matter, 7(7), 3513-3523.
Goodman, B. E. (2010). Insights into digestion and absorption of major nutrients in humans. Advances in physiology education, 34(2), 44-53.
Gorissen, S. H., Burd, N. A., Hamer, H. M., Gijsen, A. P., Groen, B. B., & van Loon, L. J. (2014). Carbohydrate coingestion delays dietary protein digestion and absorption but does not modulate postprandial muscle protein accretion. The Journal of Clinical Endocrinology & Metabolism, 99(6), 2250-2258.
Gorissen, S. H., Rémond, D., & Van Loon, L. J. (2015). The muscle protein synthetic response to food ingestion. Meat science, 109, 96-100.
Gorissen, S. H., & Witard, O. C. (2018). Characterising the muscle anabolic potential of dairy, meat and plant-based protein sources in older adults. Proceedings of the Nutrition Society, 77(1), 20-31.
Griffin, B. (2017). Serum low‐density lipoprotein as a dietary responsive biomarker of cardiovascular disease risk: Consensus and confusion. Nutrition Bulletin, 42(3), 266-273.
Grøndahl, M. L., & Skadhauge, E. (1997). Effect of mucosal amino acids on SCC and Na and Cl fluxes in the porcine small intestine. Comparative Biochemistry and Physiology Part A: Physiology, 118(2), 233-237.
Guerra, A., Etienne-Mesmin, L., Livrelli, V., Denis, S., Blanquet-Diot, S., & Alric, M. (2012). Relevance and challenges in modeling human gastric and small intestinal digestion. Trends in Biotechnology, 30(11), 591-600.
Guinee, T. P., Gorry, C. B., O'Callaghan, D. J., O'Kennedy, B. T., O'Brie, N., & Fenelon, M. A. (1997). The effects of composition and some processing treatments on the rennet coagulation properties of milk. International Journal of Dairy Technology, 50(3), 99-106.

References
277
Guo, M., Fox, P., Flynn, A., & Kindstedt, P. (1995). Susceptibility of β-lactoglobulin and sodium caseinate to proteolysis by pepsin and trypsin. Journal of Dairy Science, 78(11), 2336-2344.
Guo, Q., Ye, A., Lad, M., Dalgleish, D., & Singh, H. (2013). The breakdown properties of heat-set whey protein emulsion gels in the human mouth. Food Hydrocolloids, 33(2), 215-224.
Guo, Q., Ye, A., Lad, M., Dalgleish, D., & Singh, H. (2014). Behaviour of whey protein emulsion gel during oral and gastric digestion: effect of droplet size. Soft Matter, 10(23), 4173-4183.
Guo, Q., Ye, A., Lad, M., Ferrua, M., Dalgleish, D., & Singh, H. (2015). Disintegration kinetics of food gels during gastric digestion and its role on gastric emptying: an in vitro analysis. Food & function, 6(3), 756-764.
Guyomarc'h, F., Law, A. J. R., & Dalgleish, D. G. (2003). Formation of Soluble and Micelle-Bound Protein Aggregates in Heated Milk. Journal of Agricultural and Food Chemistry, 51(16), 4652-4660.
Hall, W., Millward, D., Long, S., & Morgan, L. (2003). Casein and whey exert different effects on plasma amino acid profiles, gastrointestinal hormone secretion and appetite. British Journal of Nutrition, 89(02), 239-248.
Helbig, A., Silletti, E., Aken, G. A., Oosterveld, A., Minekus, M., Hamer, R. J., & Gruppen, H. (2012). Lipid Digestion of Protein Stabilized Emulsions Investigated in a Dynamic In Vitro Gastro-Intestinal Model System. Food Digestion, 4(2), 58-68.
Hellström, P. M., Grybäck, P., & Jacobsson, H. (2006). The physiology of gastric emptying. Best Practice & Research Clinical Anaesthesiology, 20(3), 397-407.
Hetherington, M., Cunningham, K., Dye, L., Gibson, E., Gregersen, N., Halford, J., Lawton, C., Lluch, A., Mela, D., & Van Trijp, H. (2013). Potential benefits of satiety to the consumer: scientific considerations. Nutrition research reviews, 26(1), 22-38.
Hila, A., Bouali, H., Xue, S., Knuff, D., & Castell, D. O. (2006). Postprandial stomach contents have multiple acid layers. Journal of clinical gastroenterology, 40(7), 612-617.
Hinsberger, A., & Sandhu, B. (2004). Digestion and absorption. Current Paediatrics, 14(7), 605-611.
Hjerpsted, J., Leedo, E., & Tholstrup, T. (2011). Cheese intake in large amounts lowers LDL-cholesterol concentrations compared with butter intake of equal fat content–. The American journal of clinical nutrition, 94(6), 1479-1484.
Holt, S., Reid, J., Taylor, T., Tothill, P., & Heading, R. (1982). Gastric emptying of solids in man. Gut, 23(4), 292-296.
Hug, M. J. (2001). Transepithelial measurements using the Ussing chamber. Provided through: The European working group on CFTR Expression, 1-10.
Hunt, J., & Stubbs, D. (1975). The volume and energy content of meals as determinants of gastric emptying. The Journal of physiology, 245(1), 209-225.
Hunt, J., Smith, J., & Jiang, C. (1985). Effect of meal volume and energy density on the gastric emptying of carbohydrates. Gastroenterology, 89(6), 1326-1330.
Hussein, M. O., Hoad, C. L., Wright, J., Singh, G., Stephenson, M. C., Cox, E. F., Placidi, E., Pritchard, S. E., Costigan, C., & Ribeiro, H. (2015). Fat emulsion intragastric stability and droplet size modulate gastrointestinal responses and subsequent food intake in young adults. The Journal of nutrition, 145(6), 1170-1177.

References
278
Iddan, G., Meron, G., Glukhovsky, A., & Swain, P. (2000). Wireless capsule endoscopy. Nature, 405(6785), 417.
Inouye, K., & Fruton, J. S. (1967). Studies on the specificity of pepsin. Biochemistry, 6(6), 1765-1777.
Islam, M. A., Devle, H., Comi, I., Ulleberg, E. K., Rukke, E.-O., Vegarud, G. E., & Ekeberg, D. (2017). Ex vivo digestion of raw, pasteurised and homogenised milk - Effects on lipolysis and proteolysis. International Dairy Journal, 65, 14-19.
Janssen, P., Vanden Berghe, P., Verschueren, S., Lehmann, A., Depoortere, I., & Tack, J. (2011). Review article: the role of gastric motility in the control of food intake. Alimentary pharmacology & therapeutics, 33(8), 880-894.
Jauhiainen, T., & Korpela, R. (2007). Milk peptides and blood pressure. Journal of Nutrition, 137.
Kalantzi, L., Goumas, K., Kalioras, V., Abrahamsson, B., Dressman, J. B., & Reppas, C. (2006). Characterization of the human upper gastrointestinal contents under conditions simulating bioavailability/bioequivalence studies. Pharmaceutical research, 23(1), 165-176.
Karhunen, L. J., Juvonen, K. R., Huotari, A., Purhonen, A. K., & Herzig, K. H. (2008). Effect of protein, fat, carbohydrate and fibre on gastrointestinal peptide release in humans. Regul Pept, 149(1-3), 70-78.
Kaspar, H., Dettmer, K., Gronwald, W., & Oefner, P. J. (2008). Automated GC–MS analysis of free amino acids in biological fluids. Journal of Chromatography B, 870(2), 222-232.
Kaufmann, W. (1984). Influences of different technological treatments of milk on the digestion in the stomach. VI. Estimation of amino acid and urea concentrations in the blood: conclusions regarding the nutritional evaluation. Milchwissenschaft (Germany, FR).
Kethireddipalli, P., Hill, A. R., & Dalgleish, D. G. (2010). Protein interactions in heat-treated milk and effect on rennet coagulation. International Dairy Journal, 20(12), 838-843.
Kloetzer, L., Chey, W., McCallum, R., Koch, K., Wo, J., Sitrin, M., Katz, L., Lackner, J., Parkman, H., & Wilding, G. (2010). Motility of the antroduodenum in healthy and gastroparetics characterized by wireless motility capsule. Neurogastroenterology & Motility, 22(5), 527.
Kong, F., & Singh, R. (2008). Disintegration of solid foods in human stomach. Journal of Food Science, 73(5), R67-R80.
Kong, F., & Singh, R. P. (2010). A Human Gastric Simulator (HGS) to Study Food Digestion in Human Stomach. Journal of Food Science, 75(9), E627-E635.
Koziolek, M., Garbacz, G., Neumann, M., & Weitschies, W. (2013). Simulating the postprandial stomach: physiological considerations for dissolution and release testing. Molecular Pharmaceutics, 10(5), 1610-1622.
Krichevsky, O., & Bonnet, G. (2002). Fluorescence correlation spectroscopy: the technique and its applications. Reports on Progress in Physics, 65(2), 251.
Kwiatek, M. A., Menne, D., Steingoetter, A., Goetze, O., Forras-Kaufman, Z., Kaufman, E., Fruehauf, H., Boesiger, P., Fried, M., & Schwizer, W. (2009). Effect of meal volume and calorie load on postprandial gastric function and emptying: studies under physiological conditions by combined fiber-optic pressure measurement and MRI. American Journal of Physiology-Gastrointestinal and Liver Physiology, 297(5), G894-G901.

References
279
Lacroix, M., Bos, C., Léonil, J., Airinei, G., Luengo, C., Daré, S., Benamouzig, R., Fouillet, H., Fauquant, J., Tomé, D., & Gaudichon, C. (2006a). Compared with casein or total milk protein, digestion of milk soluble proteins is too rapid to sustain the anabolic postprandial amino acid requirement. The American journal of clinical nutrition, 84(5), 1070-1079.
Lacroix, M., Léonil, J., Bos, C., Henry, G., Airinei, G., Fauquant, J., Tomé, D., & Gaudichon, C. (2006b). Heat markers and quality indexes of industrially heat-treated [15N] milk protein measured in rats. Journal of Agricultural and Food Chemistry, 54(4), 1508-1517.
Lacroix, M., Bon, C., Bos, C., Léonil, J., Benamouzig, R., Luengo, C., Fauquant, J., Tomé, D., & Gaudichon, C. (2008). Ultra High Temperature Treatment, but Not Pasteurization, Affects the Postprandial Kinetics of Milk Proteins in Humans. The Journal of nutrition, 138(12), 2342-2347.
Lambers, T. T., van den Bosch, W. G., & de Jong, S. (2013). Fast and Slow Proteins: Modulation of the Gastric Behavior of Whey and Casein In Vitro. Food Digestion, 4(1), 1-6.
Lamothe, S., Corbeil, M.-M., Turgeon, S. L., & Britten, M. (2012). Influence of cheese matrix on lipid digestion in a simulated gastro-intestinal environment. Food & function, 3(7), 724-731.
Lamothe, S., Rémillard, N., Tremblay, J., & Britten, M. (2017). Influence of dairy matrices on nutrient release in a simulated gastrointestinal environment. Food Research International, 92, 138-146.
Lang, V., Bellisle, F., Oppert, J. M., Craplet, C., Bornet, F. R., Slama, G., & Guy-Grand, B. (1998). Satiating effect of proteins in healthy subjects: a comparison of egg albumin, casein, gelatin, soy protein, pea protein, and wheat gluten. The American journal of clinical nutrition, 67(6), 1197-1204.
Le Feunteun, S., Barbé, F., Rémond, D., Ménard, O., Le Gouar, Y., Dupont, D., & Laroche, B. (2014). Impact of the dairy matrix structure on milk protein digestion kinetics: mechanistic modelling based on mini-pig in vivo data. Food and bioprocess technology, 7(4), 1099-1113.
Ledeboer, M., Masclee, A., Jansen, J., & Lamers, C. (1995). Effect of equimolar amounts of long-chain triglycerides and medium-chain triglycerides on small-bowel transit time in humans. Journal of Parenteral and Enteral Nutrition, 19(1), 5-8.
Lee, S. J., & Sherbon, J. W. (2002). Chemical changes in bovine milk fat globule membrane caused by heat treatment and homogenization of whole milk. Journal of Dairy Research, 69(4), 555-567.
Lett, A. M., Norton, J. E., & Yeomans, M. R. (2016a). Emulsion oil droplet size significantly affects satiety: A pre-ingestive approach. Appetite, 96, 18-24.
Lett, A. M., Yeomans, M. R., Norton, I. T., & Norton, J. E. (2016b). Enhancing expected food intake behaviour, hedonics and sensory characteristics of oil-in-water emulsion systems through microstructural properties, oil droplet size and flavour. Food quality and preference, 47, 148-155.
Lin, H. C., Prather, C., Fisher, R. S., Meyer, J. H., Summers, R. W., Pimentel, M., Mccallum, R. W., Akkermans, L. M., Loening-Baucke, V., & Transit, A. T. F. C. o. G. (2005). Measurement of gastrointestinal transit. Digestive Diseases and Sciences, 50(6), 989-1004.
Lodaite, K., Chevalier, F., Armaforte, E., & Kelly, A. L. (2009). Effect of high-pressure homogenisation on rheological properties of rennet-induced skim milk and standardised milk gels. Journal of Dairy Research, 76(3), 294-300.
References
280
Lopez, C. (2005). Focus on the supramolecular structure of milk fat in dairy products. Reproduction Nutrition Development, 45(4), 497-511.
Lopez, C. (2011). Milk fat globules enveloped by their biological membrane: Unique colloidal assemblies with a specific composition and structure. Current Opinion in Colloid & Interface Science, 16(5), 391-404.
Lorén, N., Nydén, M., & Hermansson, A.-M. (2009). Determination of local diffusion properties in heterogeneous biomaterials. Advances in Colloid and Interface Science, 150(1), 5-15.
Lorenzen, J., Frederiksen, R., Hoppe, C., Hvid, R., & Astrup, A. (2012). The effect of milk proteins on appetite regulation and diet-induced thermogenesis. European journal of clinical nutrition, 66(5), 622.
Luhovyy, B. L., Akhavan, T., & Anderson, G. H. (2007). Whey Proteins in the Regulation of Food Intake and Satiety. Journal of the American College of Nutrition, 26(6), 704S-712S.
Luo, J., Wang, Z. W., Wang, F., Zhang, H., Lu, J., Guo, H. Y., & Ren, F. Z. (2014). Cryo-SEM images of native milk fat globule indicate small casein micelles are constituents of the membrane. RSC Advances, 4(90), 48963-48966.
Luo, Q., Borst, J. W., Westphal, A. H., Boom, R. M., & Janssen, A. E. (2017). Pepsin diffusivity in whey protein gels and its effect on gastric digestion. Food Hydrocolloids, 66, 318-325.
Macierzanka, A., Sancho, A. I., Mills, E. C., Rigby, N. M., & Mackie, A. R. (2009). Emulsification alters simulated gastrointestinal proteolysis of β-casein and β-lactoglobulin. Soft Matter, 5(3), 538-550.
Macierzanka, A., Böttger, F., Lansonneur, L., Groizard, R., Jean, A.-S., Rigby, N. M., Cross, K., Wellner, N., & Mackie, A. R. (2012). The effect of gel structure on the kinetics of simulated gastrointestinal digestion of bovine β-lactoglobulin. Food Chemistry, 134(4), 2156-2163.
Mackie, A., Rafiee, H., Malcolm, P., Salt, L., & van Aken, G. (2013). Specific food structures supress appetite through reduced gastric emptying rate. Am J Physiol Gastrointest Liver Physiol, 304(11), G1038-1043.
Mackie, A. R., & Macierzanka, A. (2010). Colloidal aspects of protein digestion. Current Opinion in Colloid & Interface Science, 15(1), 102-108.
Mahé, S., Messing, B., Thuillier, F., & Tomé, D. (1991). Digestion of bovine milk proteins in patients with a high jejunostomy. The American journal of clinical nutrition, 54(3), 534-538.
Mahé, S., Marteau, P., Huneau, J.-F., Thuillier, F., & Tomé, D. (1994). Intestinal nitrogen and electrolyte movements following fermented milk ingestion in man. British Journal of Nutrition, 71(2), 169-180.
Mahé, S., Roos, N., Benamouzig, R., Davin, L., Luengo, C., Gagnon, L., Gausserges, N., Rautureau, J., & Tome, D. (1996). Gastrojejunal kinetics and the digestion of N-15 beta-lactoglobulin and casein in humans: The influence of the nature and quantity of the protein. American Journal of Clinical Nutrition, 63(4), 546-552.
Malagelada, J.-R., Longstreth, G. F., Summerskill, W. H. J., & Go, V. L. W. (1976). Measurement of Gastric Functions During Digestion of Ordinary Solid Meals in Man. Gastroenterology, 70(2), 203-210.
Malagelada, J.-R., Go, V. L., & Summerskill, W. (1979). Different gastric, pancreatic, and biliary responses to solid-liquid or homogenized meals. Digestive Diseases and Sciences, 24(2), 101-110.

References
281
Malagelada, J. R., & Azpiroz, F. (1989). Determinants of gastric emptying and transit in the small intestine. Handbook of physiology, section, 6, 909-937.
Maljaars, P. W., Peters, H. P., Mela, D. J., & Masclee, A. A. (2008). Ileal brake: a sensible food target for appetite control. A review. Physiology & Behavior, 95(3), 271-281.
Maljaars, P. W. J., van der Wal, R. J. P., Wiersma, T., Peters, H. P. F., Haddeman, E., & Masclee, A. A. M. (2012). The effect of lipid droplet size on satiety and peptide secretion is intestinal site-specific. Clinical Nutrition, 31(4), 535-542.
Månsson, H. L. (2008). Fatty acids in bovine milk fat. Food & nutrition research, 52.
Marciani, L., Gowland, P. A., Spiller, R. C., Manoj, P., Moore, R. J., Young, P., & Fillery-Travis, A. J. (2001). Effect of meal viscosity and nutrients on satiety, intragastric dilution, and emptying assessed by MRI. American Journal of Physiology-Gastrointestinal and Liver Physiology, 280(6), G1227-G1233.
Marciani, L., Wickham, M., Singh, G., Bush, D., Pick, B., Cox, E., Fillery-Travis, A., Faulks, R., Marsden, C., Gowland, P. A., & Spiller, R. C. (2007). Enhancement of intragastric acid stability of a fat emulsion meal delays gastric emptying and increases cholecystokinin release and gallbladder contraction. American Journal of Physiology - Gastrointestinal and Liver Physiology, 292(6), G1607-G1613.
Marciani, L., Faulks, R., Wickham, M. S., Bush, D., Pick, B., Wright, J., Cox, E. F., Fillery-Travis, A., Gowland, P. A., & Spiller, R. C. (2008). Effect of intragastric acid stability of fat emulsions on gastric emptying, plasma lipid profile and postprandial satiety. British Journal of Nutrition, 101(06), 919-928.
Marciani, L. (2011). Assessment of gastrointestinal motor functions by MRI: a comprehensive review. Neurogastroenterology & Motility, 23(5), 399-407.
Marciani, L., Hall, N., Pritchard, S. E., Cox, E. F., Totman, J. J., Lad, M., Hoad, C. L., Foster, T. J., Gowland, P. A., & Spiller, R. C. (2012). Preventing Gastric Sieving by Blending a Solid/Water Meal Enhances Satiation in Healthy Humans. The Journal of nutrition, 142(7), 1253-1258.
Mariotti, F., Mahé, S., Luengo, C., Benamouzig, R., & Tomé, D. (2000). Postprandial modulation of dietary and whole-body nitrogen utilization by carbohydrates in humans. The American journal of clinical nutrition, 72(4), 954-962.
Mariotti, F., Valette, M., Lopez, C., Fouillet, H., Famelart, M.-H., Mathé, V., Airinei, G., Benamouzig, R., Gaudichon, C., Tomé, D., Tsikas, D., & Huneau, J. F. (2015). Casein Compared with Whey Proteins Affects the Organization of Dietary Fat during Digestion and Attenuates the Postprandial Triglyceride Response to a Mixed High-Fat Meal in Healthy, Overweight Men. The Journal of nutrition, 145(12), 2657-2664.
Mateo, M., Everard, C., Fagan, C. C., O'Donnell, C., Castillo, M., Payne, F., & O'Callaghan, D. (2009). Effect of milk fat concentration and gel firmness on syneresis during curd stirring in cheese-making. International Dairy Journal, 19(4), 264-268.
McClements, D. J., & Li, Y. (2010). Structured emulsion-based delivery systems: Controlling the digestion and release of lipophilic food components. Advances in Colloid and Interface Science, 159(2), 213-228.
McHugh, P. R., & Moran, T. H. (1979). Calories and gastric emptying: a regulatory capacity with implications for feeding. American Journal of Physiology-Regulatory, Integrative and Comparative Physiology, 236(5), R254-R260.

References
282
McLauchlan, G., Fullarton, G., Crean, G., & McColl, K. (1989). Comparison of gastric body and antral pH: a 24 hour ambulatory study in healthy volunteers. Gut, 30(5), 573-578.
Meisel, H., & Hagemeister, H. (1984). [Influences of different technological treatments of milk on the digestion in the stomach. II. Gastric passage of different milk constituents].[German]. Milchwissenschaft.
Ménard, O., Picque, D., & Dupont, D. (2015). The DIDGI® System. In The Impact of Food Bioactives on Health, (pp. 73-81): Springer.
Ménard, O., Famelart, M.-H., Deglaire, A., Le Gouar, Y., Guérin, S., Malbert, C.-H., & Dupont, D. (2018). Gastric Emptying and Dynamic In Vitro Digestion of Drinkable Yogurts: Effect of Viscosity and Composition. Nutrients, 10(9), 1308.
Meyer, J. H., Elashoff, J., Porter-Fink, V., Dressman, J., & Amidon, G. L. (1988). Human postprandial gastric emptying of 1–3-millimeter spheres. Gastroenterology, 94(6), 1315-1325.
Michalski, M.-C., & Januel, C. (2006). Does homogenization affect the human health properties of cow's milk? Trends in Food Science & Technology, 17(8), 423-437.
Michalski, M.-C. (2009). Specific molecular and colloidal structures of milk fat affecting lipolysis, absorption and postprandial lipemia. European Journal of Lipid Science and Technology, 111(5), 413-431.
Michalski, M.-C., Genot, C., Gayet, C., Lopez, C., Fine, F., Joffre, F., Vendeuvre, J.-L., Bouvier, J., Chardigny, J.-M., & Raynal-Ljutovac, K. (2013). Multiscale structures of lipids in foods as parameters affecting fatty acid bioavailability and lipid metabolism. Progress in Lipid Research, 52(4), 354-373.
Mills, S., Ross, R., Hill, C., Fitzgerald, G., & Stanton, C. (2011). Milk intelligence: Mining milk for bioactive substances associated with human health. International Dairy Journal, 21(6), 377-401.
Minekus, M., Alminger, M., Alvito, P., Ballance, S., Bohn, T., Bourlieu, C., Carriere, F., Boutrou, R., Corredig, M., Dupont, D., Dufour, C., Egger, L., Golding, M., Karakaya, S., Kirkhus, B., Le Feunteun, S., Lesmes, U., Macierzanka, A., Mackie, A., Marze, S., McClements, D. J., Menard, O., Recio, I., Santos, C. N., Singh, R. P., Vegarud, G. E., Wickham, M. S. J., Weitschies, W., & Brodkorb, A. (2014). A standardised static in vitro digestion method suitable for food - an international consensus. Food & function, 5(6), 1113-1124.
Minekus, M. (2015). The TNO gastro-intestinal model (TIM). In The impact of food bioactives on health, (pp. 37-46): Springer.
Miranda, G., & Pelissier, J.-P. (1981). In vivo studies on the digestion of bovine caseins in the rat stomach. Journal of Dairy Research, 48(2), 319-326.
Miranda, G., & Pelissier, J.-P. (1987). Influence of heat treatment of bovine skim-milk on in vivo digestion in rat stomach. Lait, 67(3), 365-377.
Moore, J., Christian, P., & Coleman, R. (1981). Gastric emptying of varying meal weight and composition in man. Digestive Diseases and Sciences, 26(1), 16-22.
Moran, T. H., Wirth, J. B., Schwartz, G. J., & McHugh, P. R. (1999). Interactions between gastric volume and duodenal nutrients in the control of liquid gastric emptying. American Journal of Physiology-Regulatory, Integrative and Comparative Physiology, 276(4), R997-R1002.
Morgan, F., Léonil, J., Mollé, D., & Bouhallab, S. (1999). Modification of Bovine β-Lactoglobulin by Glycation in a Powdered State or in an Aqueous Solution:

References
283
Effect on Association Behavior and Protein Conformation. Journal of Agricultural and Food Chemistry, 47(1), 83-91.
Mortensen, L. S., Hartvigsen, M. L., Brader, L. J., Astrup, A., Schrezenmeir, J., Holst, J. J., Thomsen, C., & Hermansen, K. (2009). Differential effects of protein quality on postprandial lipemia in response to a fat-rich meal in type 2 diabetes: comparison of whey, casein, gluten, and cod protein–. The American journal of clinical nutrition, 90(1), 41-48.
Mu, H., & Høy, C.-E. (2004). The digestion of dietary triacylglycerols. Progress in Lipid Research, 43(2), 105-133.
Neirinckx, E., Vervaet, C., De Boever, S., Remon, J. P., Gommeren, K., Daminet, S., De Backer, P., & Croubels, S. (2010). Species comparison of oral bioavailability, first-pass metabolism and pharmacokinetics of acetaminophen. Research in Veterinary Science, 89(1), 113-119.
Nemkov, T., D’Alessandro, A., & Hansen, K. C. (2015). Three-minute method for amino acid analysis by UHPLC and high-resolution quadrupole orbitrap mass spectrometry. Amino Acids, 47(11), 2345-2357.
Newton, J. M. (2010). Gastric emptying of multi-particulate dosage forms. International Journal of Pharmaceutics, 395(1-2), 2-8.
Nielsen, P., Petersen, D., & Dambmann, C. (2001). Improved method for determining food protein degree of hydrolysis. Journal of Food Science, 66(5), 642-646.
Nilsson, M., Stenberg, M., Frid, A. H., Holst, J. J., & Björck, I. M. (2004). Glycemia and insulinemia in healthy subjects after lactose-equivalent meals of milk and other food proteins: the role of plasma amino acids and incretins. The American journal of clinical nutrition, 80(5), 1246-1253.
Norton, J. E., Wallis, G. A., Spyropoulos, F., Lillford, P. J., & Norton, I. T. (2014). Designing food structures for nutrition and health benefits. Annual review of food science and technology, 5, 177-195.
Pal, A., Indireshkumar, K., Schwizer, W., Abrahamsson, B., Fried, M., & Brasseur, J. G. (2004). Gastric flow and mixing studied using computer simulation. Proceedings of the Royal Society of London B: Biological Sciences, 271(1557), 2587-2594.
Pal, S., Ellis, V., & Dhaliwal, S. (2010). Effects of whey protein isolate on body composition, lipids, insulin and glucose in overweight and obese individuals. British Journal of Nutrition, 104(5), 716-723.
Panahi, S., El Khoury, D., Kubant, R., Akhavan, T., Luhovyy, B. L., Goff, H. D., & Anderson, G. H. (2014). Mechanism of action of whole milk and its components on glycemic control in healthy young men. The Journal of Nutritional Biochemistry, 25(11), 1124-1131.
Parada, J., & Aguilera, J. M. (2007). Food Microstructure Affects the Bioavailability of Several Nutrients. Journal of Food Science, 72(2), R21-R32.
Pennings, B., Boirie, Y., Senden, J. M., Gijsen, A. P., Kuipers, H., & van Loon, L. J. (2011). Whey protein stimulates postprandial muscle protein accretion more effectively than do casein and casein hydrolysate in older men–. The American journal of clinical nutrition, 93(5), 997-1005.
Pereira, P. C. (2014). Milk nutritional composition and its role in human health. Nutrition, 30(6), 619-627.
Peters, H. P. F., Bouwens, E. C. M., Schuring, E. A. H., Haddeman, E., Velikov, K. P., & Melnikov, S. M. (2014). The effect of submicron fat droplets in a drink on satiety, food intake, and cholecystokinin in healthy volunteers. European journal of nutrition, 53(3), 723-729.

References
284
Piper, D., & Fenton, B. H. (1965). pH stability and activity curves of pepsin with special reference to their clinical importance. Gut, 6(5), 506.
Rayner, C. K., Samsom, M., Jones, K. L., & Horowitz, M. (2001). Relationships of upper gastrointestinal motor and sensory function with glycemic control. Diabetes care, 24(2), 371-381.
Reidy, P. T., Walker, D. K., Dickinson, J. M., Gundermann, D. M., Drummond, M. J., Timmerman, K. L., Fry, C. S., Borack, M. S., Cope, M. B., & Mukherjea, R. (2013). Protein Blend Ingestion Following Resistance Exercise Promotes Human Muscle Protein Synthesis1–4. The Journal of nutrition, 143(4), 410-416.
Reitelseder, S., Agergaard, J., Doessing, S., Helmark, I. C., Lund, P., Kristensen, N. B., Frystyk, J., Flyvbjerg, A., Schjerling, P., Hall, G. v., Kjaer, M., & Holm, L. (2011). Whey and casein labeled with l-[1-13C]leucine and muscle protein synthesis: effect of resistance exercise and protein ingestion. American Journal of Physiology-Endocrinology And Metabolism, 300(1), E231-E242.
Rolls, B., & Porter, J. (1973). Some effects of processing and storage on the nutritive value of milk and milk products. Proceedings of the Nutrition Society, 32(1), 9-15.
Rowland, S. J. (1938). 175. The precipitation of the proteins in milk. I. Casein. II. Total proteins. III. Globulin. IV. Albumin and Proteose-peptone. Journal of Dairy Research, 9(1), 30-41.
Rutherfurd, S., & Moughan, P. (2005). Digestible reactive lysine in selected milk-based products. Journal of Dairy Science, 88(1), 40-48.
Sanaka, M., Yamamoto, T., & Kuyama, Y. (2008). Retention, fixation, and loss of the [13 C] label: A review for the understanding of gastric emptying breath tests. Digestive Diseases and Sciences, 53(7), 1747.
Sánchez-Rivera, L., Ménard, O., Recio, I., & Dupont, D. (2015). Peptide mapping during dynamic gastric digestion of heated and unheated skimmed milk powder. Food Research International, 77, 132-139.
Sanggaard, K., Holst, J., Rehfeld, J., Sandström, B., Raben, A., & Tholstrup, T. (2004). Different effects of whole milk and a fermented milk with the same fat and lactose content on gastric emptying and postprandial lipaemia, but not on glycaemic response and appetite. British Journal of Nutrition, 92(3), 447-459.
Santangelo, A., Peracchi, M., Conte, D., Fraquelli, M., & Porrini, M. (1998). Physical state of meal affects gastric emptying, cholecystokinin release and satiety. British Journal of Nutrition, 80(6), 521-527.
Sauter, M. M., Steingoetter, A., Curcic, J., Treier, R., Kuyumcu, S., Fried, M., Boesiger, P., Schwizer, W., & Goetze, O. (2011). Quantification of Meal Induced Gastric Secretion and Its Effect on Caloric Emptying by Magnetic Resonance Imaging (MRI). Gastroenterology, 140(5), S-297.
Scanff, P., Savalle, B., Miranda, G., Pelissier, J. P., Guilloteau, P., & Toullec, R. (1990). In vivo gastric digestion of milk proteins. Effect of technological treatments. Journal of Agricultural and Food Chemistry, 38(8), 1623-1629.
Schaafsma, G. (2000). The Protein Digestibility–Corrected Amino Acid Score. The Journal of nutrition, 130(7), 1865S-1867S.
Schreiber, R. (2001). Heat-induced modifications in casein dispersions affecting their rennetability. International Dairy Journal, 11(4-7), 553-558.
Schulze, K. (2006). Imaging and modelling of digestion in the stomach and the duodenum. Neurogastroenterology & Motility, 18(3), 172-183.

References
285
Schwizer, W., Fraser, R., Borovicka, J., Crelier, G., Boesiger, P., & Fried, M. (1994). Measurement of gastric emptying and gastric motility by magnetic resonance imaging (MRI). Digestive Diseases and Sciences, 39(12), 101S-103S.
Schwizer, W., Steingoetter, A., & Fox, M. (2006). Magnetic resonance imaging for the assessment of gastrointestinal function. Scandinavian journal of gastroenterology, 41(11), 1245-1260.
Seimon, R. V., Wooster, T., Otto, B., Golding, M., Day, L., Little, T. J., Horowitz, M., Clifton, P. M., & Feinle-Bisset, C. (2009). The droplet size of intraduodenal fat emulsions influences antropyloroduodenal motility, hormone release, and appetite in healthy males. The American journal of clinical nutrition, 89(6), 1729-1736.
Shani-Levi, C., Levi-Tal, S., & Lesmes, U. (2013). Comparative performance of milk proteins and their emulsions under dynamic in vitro adult and infant gastric digestion. Food Hydrocolloids, 32(2), 349-357.
Sharma, S. K., & Dalgleish, D. G. (1993). Interactions between milk serum proteins and synthetic fat globule membrane during heating of homogenized whole milk. Journal of Agricultural and Food Chemistry, 41(9), 1407-1412.
Siegel, J. A., Urbain, J. L., Adler, L. P., Charkes, N. D., Maurer, A. H., Krevsky, B., Knight, L. C., Fisher, R. S., & Malmud, L. S. (1988). Biphasic nature of gastric emptying. Gut, 29(1), 85-89.
Singh, H. (2004). Heat stability of milk. International Journal of Dairy Technology, 57(2-3), 111-119.
Singh, H., Ye, A., & Ferrua, M. J. (2015). Aspects of food structures in the digestive tract. Current Opinion in Food Science, 3, 85-93.
Stănciuc, N., van der PLANCKEN, I., Rotaru, G., & Hendrickx, M. (2008). Denaturation impact in susceptibility of beta-lactoglobulin to enzymatic hydrolysis: a kinetic study. Revue roumaine de chimie, 53(10), 921-929.
Steingoetter, A., Radovic, T., Buetikofer, S., Curcic, J., Menne, D., Fried, M., Schwizer, W., & Wooster, T. J. (2015). Imaging gastric structuring of lipid emulsions and its effect on gastrointestinal function: a randomized trial in healthy subjects. The American journal of clinical nutrition, 101(4), 714-724.
Szarka, L. A., & Camilleri, M. (2009). Methods for measurement of gastric motility. American Journal of Physiology-Gastrointestinal and Liver Physiology, 296(3), G461-G475.
Tabilo-Munizaga, G., & Barbosa-Cánovas, G. V. (2005). Rheology for the food industry. Journal of Food Engineering, 67(1), 147-156.
Tam, J. J., & Whitaker, J. R. (1972). Rates and Extents of Hydrolysis of Several Caseins by Pepsin, Rennin, Endothia parasitica Protease and Mucor pusillus Protease1. Journal of Dairy Science, 55(11), 1523-1531.
Tang, J. E., Moore, D. R., Kujbida, G. W., Tarnopolsky, M. A., & Phillips, S. M. (2009). Ingestion of whey hydrolysate, casein, or soy protein isolate: effects on mixed muscle protein synthesis at rest and following resistance exercise in young men. Journal of Applied Physiology, 107(3), 987-992.
Thevenot, J., Cauty, C., Legland, D., Dupont, D., & Floury, J. (2017). Pepsin diffusion in dairy gels depends on casein concentration and microstructure. Food Chemistry, 223, 54-61.
Tholstrup, T., Høy, C.-E., Andersen, L. N., Christensen, R. D. K., & Sandström, B. (2004). Does Fat in Milk, Butter and Cheese Affect Blood Lipids and Cholesterol Differently? Journal of the American College of Nutrition, 23(2), 169-176.

References
286
Thomann, S., Schenkel, P., & Hinrichs, J. (2008). Effect of homogenization, microfiltration and pH on curd firmness and syneresis of curd grains. LWT-Food Science and Technology, 41(5), 826-835.
Thomas, A. (2006). GastroGut motility, sphincters and reflex control. Anaesthesia & Intensive Care Medicine, 7(2), 57-58.
Thorning, T. K., Raben, A., Tholstrup, T., Soedamah-Muthu, S. S., Givens, I., & Astrup, A. (2016). Milk and dairy products: good or bad for human health? An assessment of the totality of scientific evidence. Food & nutrition research, 60(1), 32527.
Thorning, T. K., Bertram, H. C., Bonjour, J.-P., De Groot, L., Dupont, D., Feeney, E., Ipsen, R., Lecerf, J. M., Mackie, A., & McKinley, M. C. (2017). Whole dairy matrix or single nutrients in assessment of health effects: current evidence and knowledge gaps. The American journal of clinical nutrition, 105(5), 1033-1045.
Thuenemann, E. C., Mandalari, G., Rich, G. T., & Faulks, R. M. (2015). Dynamic Gastric Model (DGM). In K. Verhoeckx, P. Cotter, I. López-Expósito, C. Kleiveland, T. Lea, A. Mackie, T. Requena, D. Swiatecka & H. Wichers (Eds.), The Impact of Food Bioactives on Health: in vitro and ex vivo models, (pp. 47-59): Springer
Tipton, K. D., Ferrando, A. A., Phillips, S. M., Doyle, D., & Wolfe, R. R. (1999). Postexercise net protein synthesis in human muscle from orally administered amino acids. American Journal of Physiology-Endocrinology And Metabolism, 276(4), E628-E634.
Truong, T., Palmer, M., Bansal, N., & Bhandari, B. (2016). Effect of Milk Fat Globule Size on Functionalities and Sensory Qualities of Dairy Products. In Effect of Milk Fat Globule Size on the Physical Functionality of Dairy Products, (pp. 47-67): Springer.
Tunick, M. H. (2011). Small-Strain Dynamic Rheology of Food Protein Networks. Journal of Agricultural and Food Chemistry, 59(5), 1481-1486.
Tunick, M. H., Ren, D. X., Van Hekken, D. L., Bonnaillie, L., Paul, M., Kwoczak, R., & Tomasula, P. M. (2016). Effect of heat and homogenization on in vitro digestion of milk. Journal of Dairy Science, 99(6), 4124-4139.
Urbain, J.-L. C., Siegel, J. A., Charkes, N. D., Maurer, A. H., Malmud, L. S., & Fisher, R. S. (1989). The two-component stomach: effects of meal particle size on fundal and antral emptying. European journal of nuclear medicine, 15(5), 254-259.
van Aken, G. A., Bomhof, E., Zoet, F. D., Verbeek, M., & Oosterveld, A. (2011). Differences in in vitro gastric behaviour between homogenized milk and emulsions stabilised by Tween 80, whey protein, or whey protein and caseinate. Food Hydrocolloids, 25(4), 781-788.
van Boekel, M. (1998). Effect of heating on Maillard reactions in milk. Food Chemistry, 62(4), 403-414.
van den Braak, C. C. M., Klebach, M., Abrahamse, E., Minor, M., Hofman, Z., Knol, J., & Ludwig, T. (2013). A novel protein mixture containing vegetable proteins renders enteral nutrition products non-coagulating after in vitro gastric digestion. Clinical Nutrition, 32(5), 765-771.
Veldhorst, M., Smeets, A., Soenen, S., Hochstenbach-Waelen, A., Hursel, R., Diepvens, K., Lejeune, M., Luscombe-Marsh, N., & Westerterp-Plantenga, M. (2008). Protein-induced satiety: effects and mechanisms of different proteins. Physiology & Behavior, 94(2), 300-307.
References
287
Veldhorst, M. A. B., Nieuwenhuizen, A. G., Hochstenbach-Waelen, A., van Vught, A. J. A. H., Westerterp, K. R., Engelen, M. P. K. J., Brummer, R.-J. M., Deutz, N. E. P., & Westerterp-Plantenga, M. S. (2009). Dose-dependent satiating effect of whey relative to casein or soy. Physiology & Behavior, 96(4–5), 675-682.
Verhoeckx, K., Cotter, P., López-Expósito, I., Kleiveland, C., Lea, T., Mackie, A., Requena, T., Swiatecka, D., & Wichers, H. (2015). The Impact of Food Bioactives on Health: in vitro and ex vivo models: Springer.
Volpi, E., Kobayashi, H., Sheffield-Moore, M., Mittendorfer, B., & Wolfe, R. R. (2003). Essential amino acids are primarily responsible for the amino acid stimulation of muscle protein anabolism in healthy elderly adults. The American journal of clinical nutrition, 78(2), 250-258.
Wada, Y., & Lönnerdal, B. (2014). Effects of Different Industrial Heating Processes of Milk on Site-Specific Protein Modifications and Their Relationship to in Vitro and in Vivo Digestibility. Journal of Agricultural and Food Chemistry, 62(18), 4175-4185.
Walstra, P., & Jenness, R. (1984). Dairy chemistry & physics: John Wiley & Sons.
Walstra, P., & Smulders, I. (1997). Making emulsions and foams: an overview. Special Publications of the Royal Society of Chemistry, 192, 367-381.
Wang, X., Lin, Q., Ye, A., Han, J., & Singh, H. (2018). Flocculation of oil-in-water emulsions stabilised by milk protein ingredients under gastric conditions: Impact on in vitro intestinal lipid digestion. Food Hydrocolloids, 88, 272-282.
Watanabe, S., & Dawes, C. (1988). The effects of different foods and concentrations of citric acid on the flow rate of whole saliva in man. Archives of oral biology, 33(1), 1-5.
West, D. W., Burd, N. A., Coffey, V. G., Baker, S. K., Burke, L. M., Hawley, J. A., Moore, D. R., Stellingwerff, T., & Phillips, S. M. (2011). Rapid aminoacidemia enhances myofibrillar protein synthesis and anabolic intramuscular signaling responses after resistance exercise–. The American journal of clinical nutrition, 94(3), 795-803.
Wilde, P. J. (2009). Eating for Life: Designing Foods for Appetite Control. Journal of Diabetes Science and Technology, 3(2), 366-370.
Wiles, P. G., Gray, I. K., & Kissling, R. C. (1998). Routine analysis of proteins by Kjeldahl and Dumas methods: Review and interlaboratory study using dairy products. Journal of AOAC International, 81(3), 620-632.
Wilkinson, S. B., Tarnopolsky, M. A., MacDonald, M. J., MacDonald, J. R., Armstrong, D., & Phillips, S. M. (2007). Consumption of fluid skim milk promotes greater muscle protein accretion after resistance exercise than does consumption of an isonitrogenous and isoenergetic soy-protein beverage. The American journal of clinical nutrition, 85(4), 1031-1040.
Wolfe, R. R. (2002). Regulation of muscle protein by amino acids. The Journal of nutrition, 132(10), 3219S-3224S.
Wren, A. M., & Bloom, S. R. (2007). Gut hormones and appetite control. Gastroenterology, 132(6), 2116-2130.
Ye, A., Cui, J., Dalgleish, D., & Singh, H. (2016a). Formation of a structured clot during the gastric digestion of milk: Impact on the rate of protein hydrolysis. Food Hydrocolloids, 52, 478-486.
Ye, A., Cui, J., Dalgleish, D., & Singh, H. (2016b). The formation and breakdown of structured clots from whole milk during gastric digestion. Food & function, 7(10), 4259-4266.

References
288
Ye, A., Cui, J., Dalgleish, D., & Singh, H. (2017). Effect of homogenization and heat treatment on the behavior of protein and fat globules during gastric digestion of milk. Journal of Dairy Science, 100(1), 36-47.
Yvon, M., Beucher, S., Scanff, P., Thirouin, S., & Pelissier, J. P. (1992). In vitro simulation of gastric digestion of milk proteins: comparison between in vitro and in vivo data. Journal of Agricultural and Food Chemistry, 40(2), 239-244.

289
Appendices

Appendices
290
Appendix A
Operating parameters of the method for determination of the branch chain amino acids (Leucine, Isoleucine and Valine) by triple quadrupole LC-
MS/MS.
Compound
Name
Precursor
Ion
Product
Ion
Dwell
Time (ms) Fragmentor (V)
Collision
Energy
Cell
Accelerator (V)
Polarity
D3-Leu 135.20 89 100 380 10 4 Positive
Leu 132.11 86 100 380 10 4 Positive
Leu 132.11 43 100 380 30 4 Positive
D10-Ile 142.24 96.1 100 380 14 4 Positive
Ile 132.11 86 100 380 10 4 Positive
Ile 132.11 56 100 380 50 4 Positive
Ile 132.11 44 100 380 26 4 Positive
D8-Val 126.21 80.1 100 380 14 4 Positive
Val 118.11 72 100 380 14 4 Positive
Val 118.11 58.1 100 380 34 4 Positive

Appendices
291
Appendix B
Appendix B1: Concentration of the individual AAs of the 0C:100W sample in the gastric emptied aliquots of G1, G3 and G5 and the corresponding intestinal digestion for 30 min (i.e. G1I, G3I and G5I), and 120 min in G5 (i.e. G5I120).
Asp (µg/mL) 0.00 ± 0.00 0.00 ± 0.00 0.00 ± 0.00 22911 ± 1185 22566 ± 1436 37051 ± 1760 47858 ± 957
Thr (µg/mL) 0.00 ± 0.00 0.00 ± 0.00 131.16 ± 21.07 100284 ± 2452 93288 ± 4748 115033 ± 16002 150769 ± 7578
Ser (µg/mL) 0.67 ± 1.15 8.85 ± 15.33 0.00 ± 0.00 30423 ± 2833 33831 ± 2181 59110 ± 1718 86670 ± 4970
Glu (µg/mL) 0.00 ± 0.00 0.00 ± 0.00 0.00 ± 0.00 67243 ± 467 61122 ± 1253 99920 ± 2279 130000 ± 1605
Gly (µg/mL) 0.32 ± 0.56 0.40 ± 0.69 0.00 ± 0.00 17060 ± 1641 17525 ± 1305 29073 ± 1464 37543 ± 1237
Ala (µg/mL) 0.29 ± 0.51 0.00 ± 0.00 2.48 ± 4.30 41823 ± 756 41373 ± 1645 61349 ± 3469 87285 ± 3739
Cys (µg/mL) 29.00 ± 8.21 45.73 ± 18.69 135.24 ± 34.41 61413 ± 4532 55138 ± 6605 74644 ± 9155 101381 ± 10793
Val (µg/mL) 0.45 ± 0.78 17.79 ± 7.57 114.86 ± 33.88 87778 ± 6509 70998 ± 2408 69338 ± 5016 102688 ± 3030
Met (µg/mL) 1.10 ± 1.90 11.77 ± 10.48 5.64 ± 9.77 46125 ± 8314 30073 ± 3496 25911 ± 5247 36322 ± 5426
Ile (µg/mL) 0.00 ± 0.00 7.23 ± 12.53 0.00 ± 0.00 63805 ± 883 51198 ± 1808 53477 ± 4381 94801 ± 3110
Leu (µg/mL) 0.31 ± 0.54 12.94 ± 11.99 22.90 ± 5.32 251444 ± 10926 200079 ± 13477 160408 ± 16589 211322 ± 17678
Tyr (µg/mL) 42.28 ± 10.92 1151.89 ± 33.39 1386.50 ± 355.48 235966 ± 14575 166520 ± 13922 121577 ± 9928 140552 ± 11156
Phe (µg/mL) 0.00 ± 0.00 0.00 ± 0.00 0.00 ± 0.00 251589 ± 26390 162236 ± 21890 81240 ± 7111 102920 ± 10531
His (µg/mL) 99.17 ± 10.33 537.34 ± 69.45 1081.03 ± 146.38 106914 ± 2444 81719 ± 1288 64638 ± 405 70649 ± 2395
Lys (µg/mL) 6.37 ± 0.29 3.54 ± 4.07 0.00 ± 0.00 366778 ± 9821 265622 ± 13312 206784 ± 6760 236963 ± 8829
Trp (µg/mL) 0.00 ± 0.00 0.00 ± 0.00 0.00 ± 0.00 163932 ± 28481 103037 ± 25355 59387 ± 22816 109051 ± 31382
Arg (µg/mL) 8.28 ± 1.32 6.46 ± 2.60 8.03 ± 7.53 148058 ± 5830 117788 ± 6249 130801 ± 4771 149331 ± 2533
Pro (µg/mL) 0.95 ± 1.64 7.62 ± 13.20 26.36 ± 38.57 3033 ± 2630 3095 ± 3492 4978 ± 7959 22081 ± 1054
Total (mg/mL) 0.19 ± 0.04 1.81 ± 0.20 2.91 ± 0.66 2067 ± 131 1577 ± 126 1455 ± 127 1918 ± 128
G5I G5I120
0C:100W
G1 G3 G5 G1I G3I

Appendices
292
Appendix B2: Concentration of the individual AAs of the 20C:80W sample in the gastric emptied aliquots of G1, G3 and G5 and the corresponding intestinal digestion for 30 min (i.e. G1I, G3I and G5I), and 120 min in G5 (i.e. G5I120).
Asp (µg/mL) 0.41 ± 0.71 0.00 ± 0.00 0.00 ± 0.00 21349 ± 1413 21717 ± 181 37529 ± 3374 60708 ± 17403
Thr (µg/mL) 0.77 ± 1.33 1.21 ± 2.09 34.55 ± 59.84 92894 ± 5647 86289 ± 2866 108114 ± 2206 161952 ± 7682
Ser (µg/mL) 1.42 ± 1.24 0.34 ± 0.59 0.00 ± 0.00 31201 ± 976 31719 ± 475 56773 ± 3886 87691 ± 2250
Glu (µg/mL) 84.31 ± 136.86 58.95 ± 94.72 0.00 ± 0.00 61083 ± 3509 58412 ± 2069 102017 ± 11912 139442 ± 11262
Gly (µg/mL) 4.27 ± 1.23 3.51 ± 1.18 0.00 ± 0.00 17364 ± 1344 17549 ± 739 29141 ± 2242 40686 ± 1498
Ala (µg/mL) 0.00 ± 0.00 0.62 ± 1.07 0.00 ± 0.00 38635 ± 787 39016 ± 1177 57023 ± 3658 87183 ± 4469
Cys (µg/mL) 31.53 ± 8.90 40.97 ± 16.96 146.46 ± 60.74 52754 ± 4763 52047 ± 4989 72482 ± 8423 99561 ± 10187
Val (µg/mL) 0.00 ± 0.00 77.90 ± 27.79 68.66 ± 118.92 72543 ± 3421 64343 ± 5425 63767 ± 3845 102830 ± 4846
Met (µg/mL) 0.96 ± 1.66 0.00 ± 0.00 0.00 ± 0.00 41375 ± 6075 31932 ± 8891 21891 ± 1566 33983 ± 2509
Ile (µg/mL) 0.35 ± 0.61 0.00 ± 0.00 0.00 ± 0.00 51174 ± 1382 43977 ± 1786 47454 ± 2486 90376 ± 4358
Leu (µg/mL) 0.00 ± 0.00 19.59 ± 3.79 15.69 ± 27.18 222979 ± 11130 181436 ± 15482 136573 ± 13153 198791 ± 21476
Tyr (µg/mL) 11.65 ± 12.07 545.71 ± 473.47 1260.94 ± 18.33 223799 ± 7365 166793 ± 16319 114521 ± 11500 141639 ± 9947
Phe (µg/mL) 2.25 ± 3.90 206.63 ± 357.89 0.00 ± 0.00 232138 ± 19987 154918 ± 22525 77193 ± 11264 100849 ± 8313
His (µg/mL) 66.22 ± 4.91 429.25 ± 40.76 929.26 ± 40.19 104865 ± 8943 78233 ± 5249 58650 ± 3336 71136 ± 3517
Lys (µg/mL) 5.94 ± 0.85 1.15 ± 1.99 0.00 ± 0.00 333402 ± 9310 248864 ± 11243 186782 ± 13246 231529 ± 14870
Trp (µg/mL) 0.00 ± 0.00 0.00 ± 0.00 0.00 ± 0.00 150743 ± 27518 95107 ± 24712 48042 ± 22105 85603 ± 36264
Arg (µg/mL) 5.37 ± 1.75 3.29 ± 2.96 2.76 ± 4.77 157814 ± 3172 124016 ± 7143 128954 ± 9443 159582 ± 7610
Pro (µg/mL) 2.35 ± 4.07 23.87 ± 12.07 0.00 ± 0.00 667 ± 1155 0 ± 0 5697 ± 4982 24380 ± 5352
Total (mg/mL) 0.22 ± 0.18 1.41 ± 1.04 2.46 ± 0.33 1907 ± 118 1496 ± 131 1353 ± 133 1918 ± 174
G5I G5I120G1 G3 G5 G1I G3I
20C:80W

Appendices
293
Appendix B3: Concentration of the individual AAs of the 50C:50W sample in the gastric emptied aliquots of G1, G3 and G5 and the corresponding intestinal digestion for 30 min (i.e. G1I, G3I and G5I), and 120 min in G5 (i.e. G5I120).
Asp (µg/mL) 0.00 ± 0.00 0.00 ± 0.00 0.78 ± 1.35 19535 ± 1292 20840 ± 1427 32920 ± 4980 33876 ± 8184
Thr (µg/mL) 0.65 ± 1.12 9.32 ± 6.20 8.34 ± 7.97 75979 ± 8530 80867 ± 7303 145122 ± 29708 225880 ± 45105
Ser (µg/mL) 2.28 ± 2.42 0.26 ± 0.45 1.35 ± 2.33 29470 ± 2611 32443 ± 2384 53780 ± 9393 79928 ± 19406
Glu (µg/mL) 255.42 ± 410.85 130.68 ± 205.51 144.59 ± 239.47 53278 ± 2828 57544 ± 2813 83939 ± 310 118169 ± 26100
Gly (µg/mL) 8.73 ± 0.31 9.60 ± 3.79 6.16 ± 5.38 16734 ± 1605 17797 ± 1746 31683 ± 6525 37207 ± 7910
Ala (µg/mL) 1.78 ± 1.74 20.90 ± 30.13 2.38 ± 4.13 34599 ± 1778 37024 ± 1955 59145 ± 11632 88058 ± 21010
Cys (µg/mL) 33.68 ± 6.81 93.59 ± 83.97 84.65 ± 37.86 46372 ± 4864 47250 ± 2600 86123 ± 3946 114391 ± 11138
Val (µg/mL) 1.38 ± 0.51 94.37 ± 91.32 252.36 ± 89.18 52705 ± 3945 52313 ± 3849 89823 ± 15422 142687 ± 25737
Met (µg/mL) 0.00 ± 0.00 0.00 ± 0.00 1.57 ± 2.71 27253 ± 5320 24393 ± 2613 54616 ± 8166 80450 ± 16959
Ile (µg/mL) 0.00 ± 0.00 0.75 ± 1.29 2.16 ± 3.74 39225 ± 3010 35396 ± 2503 58745 ± 10168 95207 ± 18150
Leu (µg/mL) 0.00 ± 0.00 17.79 ± 6.02 34.51 ± 19.46 159785 ± 22826 151124 ± 19180 314411 ± 45005 440964 ± 76308
Tyr (µg/mL) 8.23 ± 14.25 427.67 ± 382.07 543.93 ± 47.16 163909 ± 30253 140839 ± 24666 329761 ± 50906 362507 ± 48357
Phe (µg/mL) 1.18 ± 1.03 124.69 ± 215.96 142.43 ± 46.37 147960 ± 26606 116458 ± 27901 276440 ± 40904 295367 ± 41224
His (µg/mL) 48.82 ± 13.51 305.03 ± 265.06 826.43 ± 212.64 78267 ± 13277 72584 ± 9471 170013 ± 24967 163627 ± 18157
Lys (µg/mL) 4.72 ± 0.43 0.00 ± 0.00 1.60 ± 1.42 229052 ± 19892 203696 ± 16803 414380 ± 48330 467054 ± 51969
Trp (µg/mL) 0.00 ± 0.00 0.00 ± 0.00 0.00 ± 0.00 106559 ± 30938 78237 ± 22299 190928 ± 32706 220250 ± 40552
Arg (µg/mL) 10.00 ± 1.15 6.97 ± 3.14 3.02 ± 2.91 130187 ± 18035 123392 ± 12027 283706 ± 36091 294330 ± 36470
Pro (µg/mL) 6.74 ± 9.37 2.36 ± 4.09 24.02 ± 24.63 3033 ± 3931 1133 ± 1060 3040 ± 2726 11044 ± 9620
Total (mg/mL) 0.38 ± 0.46 1.24 ± 1.30 2.08 ± 0.75 1414 ± 202 1293 ± 163 2679 ± 382 3271 ± 522
50C:50W
G1 G3 G5 G1I G3I G5I G5I120
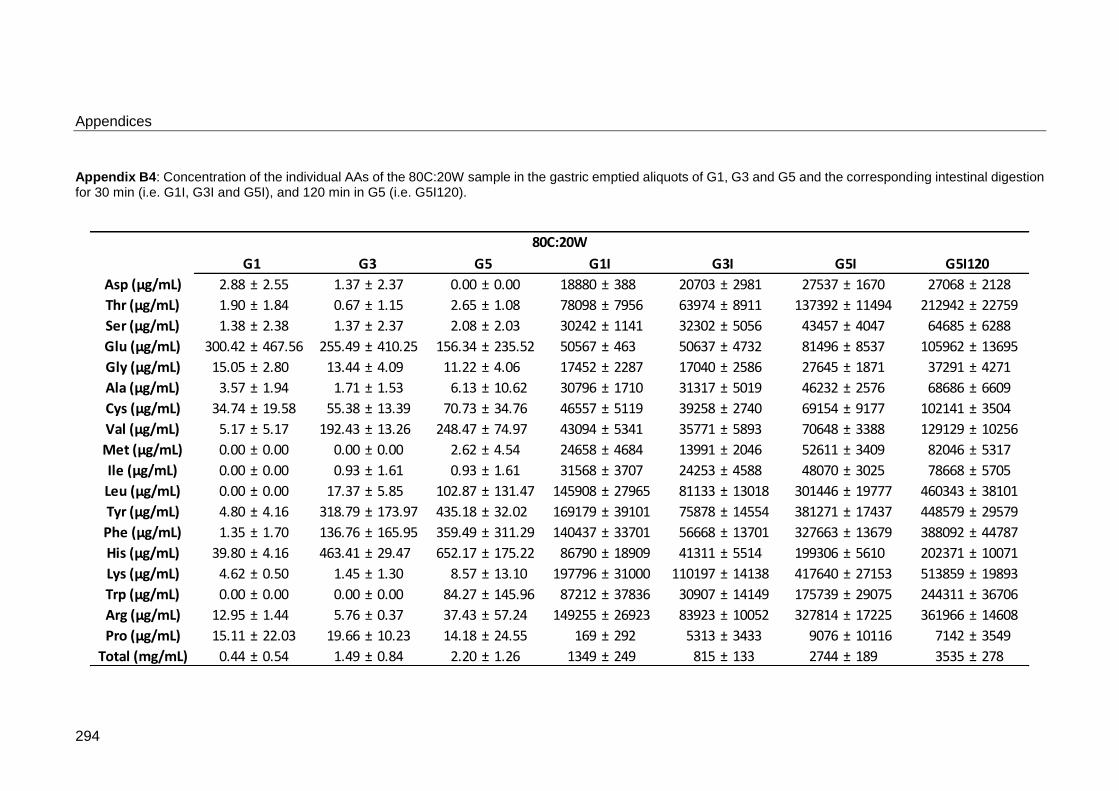
Appendices
294
Appendix B4: Concentration of the individual AAs of the 80C:20W sample in the gastric emptied aliquots of G1, G3 and G5 and the corresponding intestinal digestion for 30 min (i.e. G1I, G3I and G5I), and 120 min in G5 (i.e. G5I120).
Asp (µg/mL) 2.88 ± 2.55 1.37 ± 2.37 0.00 ± 0.00 18880 ± 388 20703 ± 2981 27537 ± 1670 27068 ± 2128
Thr (µg/mL) 1.90 ± 1.84 0.67 ± 1.15 2.65 ± 1.08 78098 ± 7956 63974 ± 8911 137392 ± 11494 212942 ± 22759
Ser (µg/mL) 1.38 ± 2.38 1.37 ± 2.37 2.08 ± 2.03 30242 ± 1141 32302 ± 5056 43457 ± 4047 64685 ± 6288
Glu (µg/mL) 300.42 ± 467.56 255.49 ± 410.25 156.34 ± 235.52 50567 ± 463 50637 ± 4732 81496 ± 8537 105962 ± 13695
Gly (µg/mL) 15.05 ± 2.80 13.44 ± 4.09 11.22 ± 4.06 17452 ± 2287 17040 ± 2586 27645 ± 1871 37291 ± 4271
Ala (µg/mL) 3.57 ± 1.94 1.71 ± 1.53 6.13 ± 10.62 30796 ± 1710 31317 ± 5019 46232 ± 2576 68686 ± 6609
Cys (µg/mL) 34.74 ± 19.58 55.38 ± 13.39 70.73 ± 34.76 46557 ± 5119 39258 ± 2740 69154 ± 9177 102141 ± 3504
Val (µg/mL) 5.17 ± 5.17 192.43 ± 13.26 248.47 ± 74.97 43094 ± 5341 35771 ± 5893 70648 ± 3388 129129 ± 10256
Met (µg/mL) 0.00 ± 0.00 0.00 ± 0.00 2.62 ± 4.54 24658 ± 4684 13991 ± 2046 52611 ± 3409 82046 ± 5317
Ile (µg/mL) 0.00 ± 0.00 0.93 ± 1.61 0.93 ± 1.61 31568 ± 3707 24253 ± 4588 48070 ± 3025 78668 ± 5705
Leu (µg/mL) 0.00 ± 0.00 17.37 ± 5.85 102.87 ± 131.47 145908 ± 27965 81133 ± 13018 301446 ± 19777 460343 ± 38101
Tyr (µg/mL) 4.80 ± 4.16 318.79 ± 173.97 435.18 ± 32.02 169179 ± 39101 75878 ± 14554 381271 ± 17437 448579 ± 29579
Phe (µg/mL) 1.35 ± 1.70 136.76 ± 165.95 359.49 ± 311.29 140437 ± 33701 56668 ± 13701 327663 ± 13679 388092 ± 44787
His (µg/mL) 39.80 ± 4.16 463.41 ± 29.47 652.17 ± 175.22 86790 ± 18909 41311 ± 5514 199306 ± 5610 202371 ± 10071
Lys (µg/mL) 4.62 ± 0.50 1.45 ± 1.30 8.57 ± 13.10 197796 ± 31000 110197 ± 14138 417640 ± 27153 513859 ± 19893
Trp (µg/mL) 0.00 ± 0.00 0.00 ± 0.00 84.27 ± 145.96 87212 ± 37836 30907 ± 14149 175739 ± 29075 244311 ± 36706
Arg (µg/mL) 12.95 ± 1.44 5.76 ± 0.37 37.43 ± 57.24 149255 ± 26923 83923 ± 10052 327814 ± 17225 361966 ± 14608
Pro (µg/mL) 15.11 ± 22.03 19.66 ± 10.23 14.18 ± 24.55 169 ± 292 5313 ± 3433 9076 ± 10116 7142 ± 3549
Total (mg/mL) 0.44 ± 0.54 1.49 ± 0.84 2.20 ± 1.26 1349 ± 249 815 ± 133 2744 ± 189 3535 ± 278
80C:20W
G1 G3 G5 G1I G3I G5I G5I120

Appendices
295
Appendix B5: Concentration of the individual AAs of the (0C:100W)2% sample in the gastric emptied aliquots of G1, G3 and G5 and the corresponding intestinal digestion for 30 min (i.e. G1I, G3I and G5I), and 120 min in G5 (i.e. G5I120).
Asp (µg/mL) 0.00 ± 0.00 0.00 ± 0.00 0.00 ± 0.00 24715 ± 1283 25312 ± 1620 47083 ± 11478 53305 ± 670
Thr (µg/mL) 0.00 ± 0.00 33.61 ± 2.12 143.34 ± 36.41 102739 ± 11822 94335 ± 5780 118086 ± 5579 159727 ± 10386
Ser (µg/mL) 1.21 ± 1.06 0.00 ± 0.00 0.00 ± 0.00 33148 ± 2224 35826 ± 1722 62204 ± 281 89497 ± 1891
Glu (µg/mL) 0.72 ± 1.24 52.73 ± 88.03 177.42 ± 307.30 73709 ± 10961 77698 ± 9759 108024 ± 3055 139282 ± 6359
Gly (µg/mL) 0.16 ± 0.27 1.19 ± 1.18 2.65 ± 2.76 17937 ± 1506 18947 ± 782 31922 ± 122 40785 ± 1161
Ala (µg/mL) 0.24 ± 0.41 0.00 ± 0.00 62.24 ± 103.09 45081 ± 3828 45250 ± 2520 67492 ± 1672 92407 ± 6061
Cys (µg/mL) 35.74 ± 11.64 68.13 ± 23.69 157.06 ± 25.97 58430 ± 3501 56308 ± 4263 78941 ± 4954 105258 ± 5650
Val (µg/mL) 0.00 ± 0.00 46.35 ± 36.72 80.41 ± 72.16 90854 ± 8899 77372 ± 4007 74010 ± 4159 107727 ± 4671
Met (µg/mL) 0.00 ± 0.00 26.14 ± 3.80 8.09 ± 7.46 48412 ± 4672 34215 ± 5629 25937 ± 2043 35519 ± 2484
Ile (µg/mL) 1.39 ± 2.40 0.00 ± 0.00 0.00 ± 0.00 61803 ± 6278 53665 ± 3638 58925 ± 4524 99030 ± 4891
Leu (µg/mL) 2.01 ± 3.48 43.57 ± 12.74 29.19 ± 25.39 245033 ± 25736 199119 ± 14389 167614 ± 14875 218254 ± 20602
Tyr (µg/mL) 42.19 ± 22.79 1349.76 ± 186.92 1106.54 ± 223.56 209973 ± 23197 162411 ± 5474 125567 ± 14361 140623 ± 7811
Phe (µg/mL) 3.12 ± 3.47 14.21 ± 24.62 157.01 ± 137.58 226175 ± 26098 157872 ± 10480 90966 ± 17127 102391 ± 5369
His (µg/mL) 85.12 ± 3.65 620.91 ± 43.16 1136.78 ± 386.77 110177 ± 2840 80552 ± 9117 67677 ± 5965 72397 ± 2601
Lys (µg/mL) 7.92 ± 1.07 5.05 ± 2.97 13.48 ± 23.35 367000 ± 22948 270775 ± 8838 214448 ± 5012 248226 ± 9627
Trp (µg/mL) 2.91 ± 5.03 0.00 ± 0.00 23.38 ± 40.50 160494 ± 39772 113212 ± 9309 63108 ± 25681 83456 ± 30006
Arg (µg/mL) 8.01 ± 2.56 4.35 ± 2.33 8.38 ± 8.72 146425 ± 8712 119638 ± 3826 137310 ± 870 159510 ± 2009
Pro (µg/mL) 17.34 ± 4.51 32.09 ± 39.95 27.31 ± 47.30 1848 ± 2364 1216 ± 2106 3106 ± 3696 20957 ± 7391
Total (mg/mL) 0.21 ± 0.06 2.30 ± 0.47 3.13 ± 1.45 2024 ± 207 1624 ± 103 1542 ± 125 1968 ± 130
(0C:100W)2%
G1 G3 G5 G1I G3I G5I G5I120

Appendices
296
Appendix B6: Concentration of the individual AAs of the (20C:80W)2% sample in the gastric emptied aliquots of G1, G3 and G5 and the corresponding intestinal digestion for 30 min (i.e. G1I, G3I and G5I), and 120 min in G5 (i.e. G5I120).
Asp (µg/mL) 0.76 ± 1.32 0.19 ± 0.33 3.10 ± 2.69 23820 ± 6391 23288 ± 613 46939 ± 11467 53519 ± 3085
Thr (µg/mL) 2.35 ± 4.07 1.43 ± 2.47 101.04 ± 4.64 88599 ± 19462 94476 ± 7329 118285 ± 9669 156403 ± 11059
Ser (µg/mL) 1.40 ± 1.27 0.60 ± 1.03 0.00 ± 0.00 30305 ± 924 33778 ± 1353 62720 ± 899 89682 ± 1558
Glu (µg/mL) 123.82 ± 210.53 98.52 ± 160.25 167.45 ± 285.68 56258 ± 2900 66770 ± 1835 114551 ± 7923 159744 ± 220
Gly (µg/mL) 3.93 ± 0.60 4.34 ± 0.46 9.05 ± 3.80 16211 ± 714 18070 ± 782 31836 ± 1144 41485 ± 442
Ala (µg/mL) 1.17 ± 1.04 2.05 ± 2.91 0.00 ± 0.00 37225 ± 3847 41309 ± 3177 64937 ± 2479 89344 ± 830
Cys (µg/mL) 32.80 ± 3.10 31.89 ± 12.11 218.44 ± 19.91 48017 ± 2549 52043 ± 5511 73847 ± 3634 98008 ± 8466
Val (µg/mL) 0.11 ± 0.20 53.92 ± 19.66 158.74 ± 59.73 61988 ± 12516 67271 ± 5191 71804 ± 760 106214 ± 4169
Met (µg/mL) 1.39 ± 1.22 0.58 ± 1.00 7.34 ± 12.72 33803 ± 11359 35816 ± 4082 27049 ± 3522 35963 ± 1370
Ile (µg/mL) 0.86 ± 1.49 1.34 ± 2.32 6.05 ± 10.49 43510 ± 6000 46225 ± 2713 53509 ± 2545 91698 ± 1062
Leu (µg/mL) 3.98 ± 3.08 34.08 ± 8.81 59.98 ± 14.07 173250 ± 41845 186131 ± 16141 150727 ± 9597 209993 ± 15230
Tyr (µg/mL) 3.43 ± 5.94 499.80 ± 113.50 749.82 ± 290.83 176367 ± 36181 175990 ± 34273 119985 ± 5696 144644 ± 7596
Phe (µg/mL) 7.05 ± 12.21 118.32 ± 45.07 248.17 ± 202.26 162595 ± 49504 160764 ± 33813 82338 ± 5860 103414 ± 6010
His (µg/mL) 61.26 ± 5.50 426.15 ± 101.01 1004.34 ± 258.28 85878 ± 30986 81867 ± 4196 63629 ± 4242 72344 ± 6618
Lys (µg/mL) 7.79 ± 3.76 4.76 ± 2.18 6.29 ± 5.93 269222 ± 68223 272066 ± 42544 208437 ± 15061 242177 ± 20995
Trp (µg/mL) 0.00 ± 0.00 0.00 ± 0.00 0.00 ± 0.00 106403 ± 51462 102860 ± 31419 55531 ± 20369 114238 ± 33303
Arg (µg/mL) 5.70 ± 1.57 3.50 ± 3.03 10.00 ± 8.91 128598 ± 28142 131285 ± 16912 140286 ± 6218 162855 ± 8885
Pro (µg/mL) 24.45 ± 7.79 7.12 ± 12.34 28.24 ± 24.46 1014 ± 370 3102 ± 5373 10742 ± 7715 21111 ± 11676
Total (mg/mL) 0.28 ± 0.26 1.29 ± 0.49 2.78 ± 1.20 1543 ± 373 1593 ± 217 1497 ± 119 1993 ± 143
(20C:80W)2%
G1 G3 G5 G1I G3I G5I G5I120
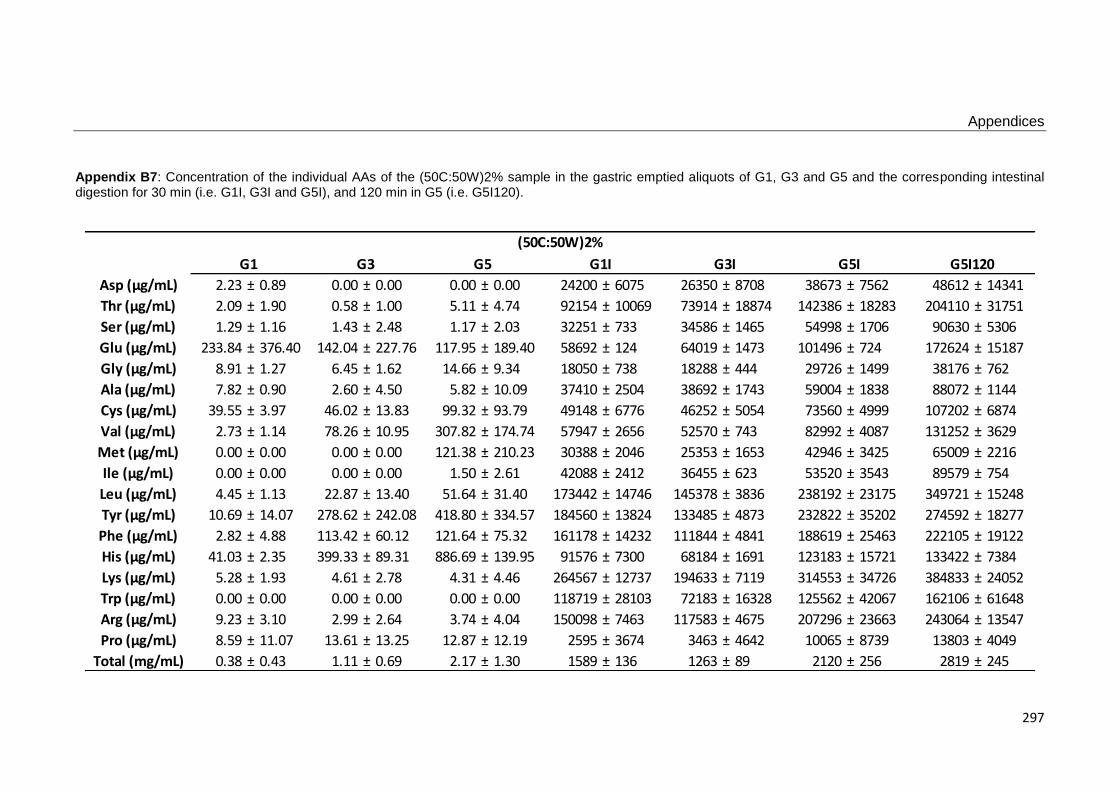
Appendices
297
Appendix B7: Concentration of the individual AAs of the (50C:50W)2% sample in the gastric emptied aliquots of G1, G3 and G5 and the corresponding intestinal digestion for 30 min (i.e. G1I, G3I and G5I), and 120 min in G5 (i.e. G5I120).
Asp (µg/mL) 2.23 ± 0.89 0.00 ± 0.00 0.00 ± 0.00 24200 ± 6075 26350 ± 8708 38673 ± 7562 48612 ± 14341
Thr (µg/mL) 2.09 ± 1.90 0.58 ± 1.00 5.11 ± 4.74 92154 ± 10069 73914 ± 18874 142386 ± 18283 204110 ± 31751
Ser (µg/mL) 1.29 ± 1.16 1.43 ± 2.48 1.17 ± 2.03 32251 ± 733 34586 ± 1465 54998 ± 1706 90630 ± 5306
Glu (µg/mL) 233.84 ± 376.40 142.04 ± 227.76 117.95 ± 189.40 58692 ± 124 64019 ± 1473 101496 ± 724 172624 ± 15187
Gly (µg/mL) 8.91 ± 1.27 6.45 ± 1.62 14.66 ± 9.34 18050 ± 738 18288 ± 444 29726 ± 1499 38176 ± 762
Ala (µg/mL) 7.82 ± 0.90 2.60 ± 4.50 5.82 ± 10.09 37410 ± 2504 38692 ± 1743 59004 ± 1838 88072 ± 1144
Cys (µg/mL) 39.55 ± 3.97 46.02 ± 13.83 99.32 ± 93.79 49148 ± 6776 46252 ± 5054 73560 ± 4999 107202 ± 6874
Val (µg/mL) 2.73 ± 1.14 78.26 ± 10.95 307.82 ± 174.74 57947 ± 2656 52570 ± 743 82992 ± 4087 131252 ± 3629
Met (µg/mL) 0.00 ± 0.00 0.00 ± 0.00 121.38 ± 210.23 30388 ± 2046 25353 ± 1653 42946 ± 3425 65009 ± 2216
Ile (µg/mL) 0.00 ± 0.00 0.00 ± 0.00 1.50 ± 2.61 42088 ± 2412 36455 ± 623 53520 ± 3543 89579 ± 754
Leu (µg/mL) 4.45 ± 1.13 22.87 ± 13.40 51.64 ± 31.40 173442 ± 14746 145378 ± 3836 238192 ± 23175 349721 ± 15248
Tyr (µg/mL) 10.69 ± 14.07 278.62 ± 242.08 418.80 ± 334.57 184560 ± 13824 133485 ± 4873 232822 ± 35202 274592 ± 18277
Phe (µg/mL) 2.82 ± 4.88 113.42 ± 60.12 121.64 ± 75.32 161178 ± 14232 111844 ± 4841 188619 ± 25463 222105 ± 19122
His (µg/mL) 41.03 ± 2.35 399.33 ± 89.31 886.69 ± 139.95 91576 ± 7300 68184 ± 1691 123183 ± 15721 133422 ± 7384
Lys (µg/mL) 5.28 ± 1.93 4.61 ± 2.78 4.31 ± 4.46 264567 ± 12737 194633 ± 7119 314553 ± 34726 384833 ± 24052
Trp (µg/mL) 0.00 ± 0.00 0.00 ± 0.00 0.00 ± 0.00 118719 ± 28103 72183 ± 16328 125562 ± 42067 162106 ± 61648
Arg (µg/mL) 9.23 ± 3.10 2.99 ± 2.64 3.74 ± 4.04 150098 ± 7463 117583 ± 4675 207296 ± 23663 243064 ± 13547
Pro (µg/mL) 8.59 ± 11.07 13.61 ± 13.25 12.87 ± 12.19 2595 ± 3674 3463 ± 4642 10065 ± 8739 13803 ± 4049
Total (mg/mL) 0.38 ± 0.43 1.11 ± 0.69 2.17 ± 1.30 1589 ± 136 1263 ± 89 2120 ± 256 2819 ± 245
(50C:50W)2%
G1 G3 G5 G1I G3I G5I G5I120

Appendices
298
Appendix B8: Concentration of the individual AAs of the (80C:20W)2% sample in the gastric emptied aliquots of G1, G3 and G5 and the corresponding intestinal digestion for 30 min (i.e. G1I, G3I and G5I), and 120 min in G5 (i.e. G5I120).
Asp (µg/mL) 2.54 ± 2.20 1.77 ± 1.80 2.47 ± 1.90 19362 ± 1481 20582 ± 1025 25183 ± 448 26852 ± 1221
Thr (µg/mL) 1.50 ± 0.90 5.52 ± 4.99 3.88 ± 3.57 74693 ± 12987 80569 ± 25226 106816 ± 5314 191526 ± 31632
Ser (µg/mL) 2.36 ± 2.07 3.80 ± 3.05 3.74 ± 3.32 31291 ± 1607 33006 ± 468 39796 ± 4286 58115 ± 3303
Glu (µg/mL) 407.92 ± 665.14 292.48 ± 474.12 239.31 ± 397.18 52431 ± 6774 56978 ± 892 75420 ± 14589 94519 ± 10150
Gly (µg/mL) 12.99 ± 0.69 9.90 ± 1.04 16.53 ± 6.03 16938 ± 1340 18001 ± 1517 22992 ± 490 30812 ± 2275
Ala (µg/mL) 6.23 ± 2.82 6.76 ± 3.82 6.16 ± 8.67 30844 ± 2952 31955 ± 2293 39923 ± 3864 57824 ± 6318
Cys (µg/mL) 33.77 ± 8.40 82.98 ± 20.41 96.58 ± 15.76 43708 ± 1731 45422 ± 3802 59281 ± 6515 93730 ± 6113
Val (µg/mL) 1.43 ± 1.36 235.93 ± 47.90 287.29 ± 13.62 40099 ± 5339 43000 ± 10287 57601 ± 4049 114118 ± 12876
Met (µg/mL) 0.00 ± 0.00 0.00 ± 0.00 0.00 ± 0.00 19179 ± 3683 22917 ± 13737 35337 ± 10386 66496 ± 9146
Ile (µg/mL) 0.57 ± 0.98 0.00 ± 0.00 0.00 ± 0.00 29971 ± 3704 28894 ± 5886 38521 ± 3826 70814 ± 4543
Leu (µg/mL) 0.71 ± 1.22 38.33 ± 17.00 46.37 ± 16.53 112186 ± 20858 129024 ± 69373 191154 ± 49562 366335 ± 44878
Tyr (µg/mL) 7.37 ± 8.42 268.32 ± 232.57 352.69 ± 27.69 117408 ± 15894 140768 ± 104342 230577 ± 99453 367461 ± 35489
Phe (µg/mL) 2.83 ± 2.86 357.80 ± 65.73 116.78 ± 10.10 86148 ± 3926 113684 ± 93937 183882 ± 93178 309689 ± 46778
His (µg/mL) 48.42 ± 1.45 482.42 ± 44.14 633.70 ± 65.61 67516 ± 11636 92652 ± 69664 113507 ± 66840 182699 ± 12001
Lys (µg/mL) 6.22 ± 3.14 3.18 ± 3.69 2.38 ± 4.12 154211 ± 20705 173895 ± 95556 283112 ± 104093 439939 ± 28689
Trp (µg/mL) 0.00 ± 0.00 0.00 ± 0.00 0.00 ± 0.00 69749 ± 28276 107852 ± 73218 95805 ± 40757 231088 ± 36346
Arg (µg/mL) 8.50 ± 1.14 6.98 ± 1.40 3.55 ± 3.37 110526 ± 18588 131017 ± 76297 212599 ± 78591 297044 ± 29537
Pro (µg/mL) 8.30 ± 11.82 30.12 ± 36.68 25.77 ± 22.44 7088 ± 4629 1599 ± 1926 6492 ± 5267 11232 ± 542
Total (mg/mL) 0.55 ± 0.71 1.83 ± 0.96 1.84 ± 0.60 1083 ± 166 1272 ± 649 1818 ± 592 3010 ± 322
(80C:20W)2%
G1 G3 G5 G1I G3I G5I G5I120

Appendices
299
Appendix C
Appendix C1: BCAAs (Leu, Ile and Val) concentration of the 0C:100W sample in the apical and basolateral side of the Ussing chamber experiment during 5, 30 and 60 min of intestinal digestion in the G1 and G5 emptied aliquot. Values are presented as means ± SD of two independent replicates.
Intestinal digestion time
5 min 94.62 ± 9.81 20.27 ± 2.77 26.39 ± 2.88 141.28 ± 15.45
30 min 291.89 ± 14.01 74.47 ± 10.96 94.15 ± 2.57 460.51 ± 0.48
60 min 396.04 ± 56.55 126.70 ± 14.50 140.10 ± 18.68 662.84 ± 89.73
Total concentration 782.56 ± 80.36 221.44 ± 6.31 260.63 ± 18.99 1264.62 ± 105.66
5 min 0.64 ± 0.61 0.33 ± 0.33 0.47 ± 0.40 1.43 ± 1.35
30 min 4.64 ± 4.62 2.06 ± 2.10 2.71 ± 2.53 9.42 ± 9.25
60 min 12.62 ± 11.80 6.74 ± 4.81 7.73 ± 6.99 27.10 ± 23.60
Total concentration 17.90 ± 17.04 9.13 ± 7.24 10.91 ± 9.92 37.95 ± 34.21
5 min 51.19 ± 8.27 16.33 ± 2.18 20.25 ± 3.48 87.77 ± 13.93
30 min 65.79 ± 12.78 26.50 ± 7.39 27.57 ± 7.27 119.86 ± 27.43
60 min 87.59 ± 13.96 43.84 ± 1.80 42.07 ± 5.33 173.51 ± 21.09
Total concentration 204.57 ± 18.47 86.68 ± 7.01 89.89 ± 9.12 381.13 ± 34.59
5 min 0.41 ± 0.11 0.18 ± 0.02 0.28 ± 0.06 0.87 ± 0.19
30 min 3.48 ± 0.60 1.90 ± 0.28 2.33 ± 0.03 7.70 ± 0.91
60 min 8.77 ± 1.27 5.57 ± 2.66 5.67 ± 0.70 20.01 ± 4.63
Total concentration 12.66 ± 1.98 7.64 ± 2.96 8.28 ± 0.79 28.58 ± 5.74
Apical
Basolateral
Basolateral
0C:100WG1
G5
Leu (µg/mL) Ile (µg/mL) Val (µg/mL) BCAAs (µg/mL)
Apical

Appendices
300
Appendix C2: BCAAs (Leu, Ile and Val) concentration of the 20C:80W sample in the apical and basolateral side of the Ussing chamber experiment during 5, 30 and 60 min of intestinal digestion in the G1 and G5 emptied aliquot. Values are presented as means ± SD of two independent replicates.
Intestinal digestion time
5 min 78.21 ± 36.49 14.79 ± 8.60 20.50 ± 11.45 113.50 ± 56.55
30 min 217.43 ± 35.44 55.91 ± 9.45 67.81 ± 14.36 341.14 ± 59.26
60 min 280.83 ± 95.81 82.73 ± 25.60 95.53 ± 30.08 459.09 ± 151.49
Total concentration 576.46 ± 167.74 153.43 ± 43.66 183.84 ± 55.90 913.73 ± 267.29
5 min 0.49 ± 0.32 0.19 ± 0.13 0.28 ± 0.13 0.97 ± 0.59
30 min 6.63 ± 1.79 3.34 ± 1.01 3.26 ± 0.20 13.24 ± 0.98
60 min 16.17 ± 2.46 8.70 ± 2.79 8.80 ± 0.21 33.67 ± 0.12
Total concentration 23.30 ± 4.58 12.24 ± 3.67 12.33 ± 0.54 47.87 ± 1.45
5 min 57.87 ± 0.90 20.17 ± 1.35 25.13 ± 2.57 103.17 ± 4.82
30 min 80.55 ± 7.80 36.40 ± 5.50 39.84 ± 6.06 156.78 ± 19.36
60 min 108.71 ± 3.90 53.30 ± 1.02 57.03 ± 5.88 219.04 ± 3.00
Total concentration 247.12 ± 4.80 109.88 ± 7.86 121.99 ± 14.51 478.99 ± 27.18
5 min 0.52 ± 0.16 0.30 ± 0.07 0.36 ± 0.06 1.18 ± 0.30
30 min 4.66 ± 0.19 2.11 ± 0.29 3.01 ± 0.51 9.78 ± 0.99
60 min 12.95 ± 2.80 8.21 ± 0.94 8.50 ± 2.44 29.65 ± 4.30
Total concentration 18.13 ± 2.83 10.61 ± 0.72 11.87 ± 2.88 40.61 ± 5.00
Apical
Basolateral
Apical
Basolateral
G5
G120C:80W
Leu (µg/mL) Ile (µg/mL) Val (µg/mL) BCAAs (µg/mL)

Appendices
301
Appendix C3: BCAAs (Leu, Ile and Val) concentration of the 50C:50W sample in the apical and basolateral side of the Ussing chamber experiment during 5, 30 and 60 min of intestinal digestion in the G1 and G5 emptied aliquot. Values are presented as means ± SD of two independent replicates.
Intestinal digestion time
5 min 87.58 ± 6.26 18.33 ± 2.58 24.82 ± 1.12 130.73 ± 9.96
30 min 168.28 ± 82.02 47.66 ± 17.63 57.82 ± 24.37 273.75 ± 124.02
60 min 257.15 ± 17.46 87.38 ± 16.78 101.28 ± 19.77 445.82 ± 54.01
Total concentration 513.01 ± 70.81 153.37 ± 3.44 183.92 ± 5.72 850.30 ± 79.97
5 min 0.40 ± 0.09 0.18 ± 0.06 0.29 ± 0.09 0.88 ± 0.23
30 min 4.99 ± 1.22 2.23 ± 0.21 3.02 ± 0.14 10.24 ± 1.57
60 min 13.15 ± 0.27 6.27 ± 0.62 8.71 ± 0.68 28.13 ± 1.03
Total concentration 18.53 ± 1.40 8.68 ± 0.46 12.03 ± 0.62 39.25 ± 0.31
5 min 115.10 ± 31.52 19.10 ± 6.47 25.50 ± 6.20 159.70 ± 44.20
30 min 214.06 ± 16.98 50.09 ± 15.24 68.76 ± 12.33 332.92 ± 44.55
60 min 301.24 ± 31.02 86.83 ± 30.58 105.71 ± 29.08 493.77 ± 90.69
Total concentration 630.40 ± 16.48 156.02 ± 39.35 199.97 ± 35.20 986.39 ± 91.04
5 min 0.65 ± 0.03 0.26 ± 0.08 0.40 ± 0.13 1.31 ± 0.19
30 min 6.09 ± 2.09 2.33 ± 0.14 3.35 ± 0.16 11.77 ± 2.39
60 min 16.78 ± 4.50 6.53 ± 0.93 9.93 ± 0.07 33.25 ± 3.64
Total concentration 23.52 ± 6.62 9.12 ± 0.87 13.69 ± 0.10 46.33 ± 5.84
Apical
Basolateral
Apical
Basolateral
G5
G150C:50W
Leu (µg/mL) Ile (µg/mL) Val (µg/mL) BCAAs (µg/mL)
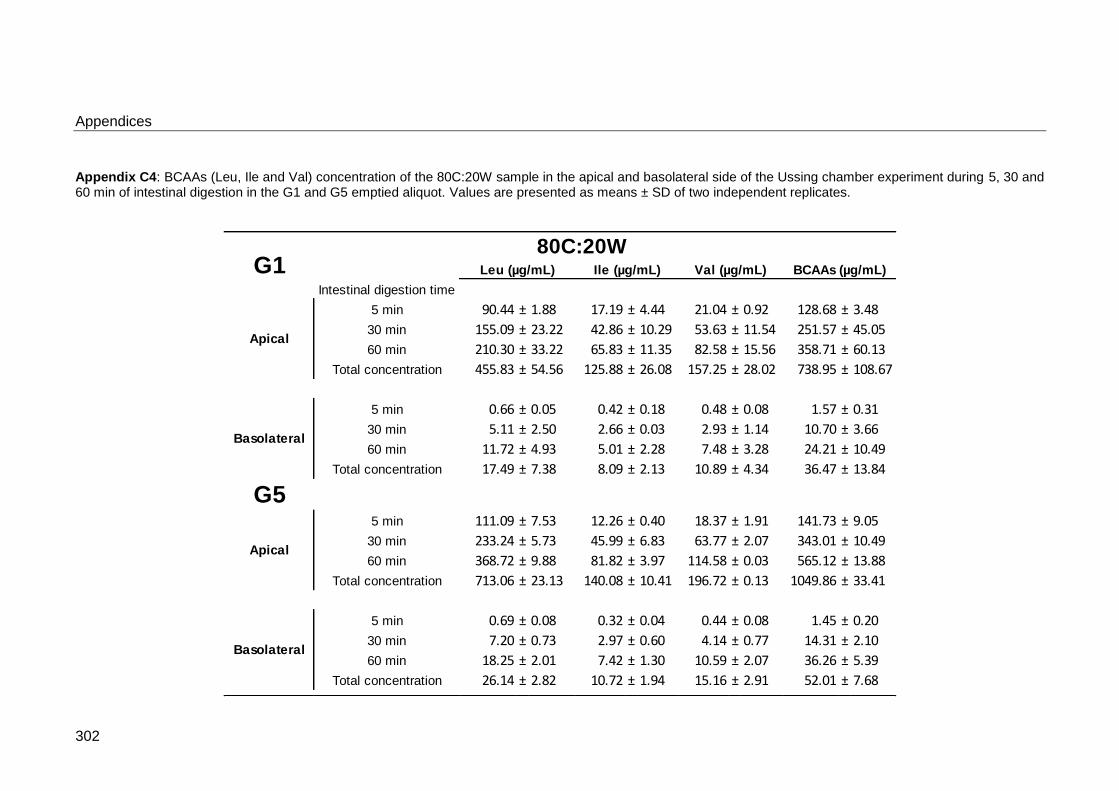
Appendices
302
Appendix C4: BCAAs (Leu, Ile and Val) concentration of the 80C:20W sample in the apical and basolateral side of the Ussing chamber experiment during 5, 30 and 60 min of intestinal digestion in the G1 and G5 emptied aliquot. Values are presented as means ± SD of two independent replicates.
Intestinal digestion time
5 min 90.44 ± 1.88 17.19 ± 4.44 21.04 ± 0.92 128.68 ± 3.48
30 min 155.09 ± 23.22 42.86 ± 10.29 53.63 ± 11.54 251.57 ± 45.05
60 min 210.30 ± 33.22 65.83 ± 11.35 82.58 ± 15.56 358.71 ± 60.13
Total concentration 455.83 ± 54.56 125.88 ± 26.08 157.25 ± 28.02 738.95 ± 108.67
5 min 0.66 ± 0.05 0.42 ± 0.18 0.48 ± 0.08 1.57 ± 0.31
30 min 5.11 ± 2.50 2.66 ± 0.03 2.93 ± 1.14 10.70 ± 3.66
60 min 11.72 ± 4.93 5.01 ± 2.28 7.48 ± 3.28 24.21 ± 10.49
Total concentration 17.49 ± 7.38 8.09 ± 2.13 10.89 ± 4.34 36.47 ± 13.84
5 min 111.09 ± 7.53 12.26 ± 0.40 18.37 ± 1.91 141.73 ± 9.05
30 min 233.24 ± 5.73 45.99 ± 6.83 63.77 ± 2.07 343.01 ± 10.49
60 min 368.72 ± 9.88 81.82 ± 3.97 114.58 ± 0.03 565.12 ± 13.88
Total concentration 713.06 ± 23.13 140.08 ± 10.41 196.72 ± 0.13 1049.86 ± 33.41
5 min 0.69 ± 0.08 0.32 ± 0.04 0.44 ± 0.08 1.45 ± 0.20
30 min 7.20 ± 0.73 2.97 ± 0.60 4.14 ± 0.77 14.31 ± 2.10
60 min 18.25 ± 2.01 7.42 ± 1.30 10.59 ± 2.07 36.26 ± 5.39
Total concentration 26.14 ± 2.82 10.72 ± 1.94 15.16 ± 2.91 52.01 ± 7.68
G180C:20W
Leu (µg/mL) Ile (µg/mL) Val (µg/mL) BCAAs (µg/mL)
Apical
Basolateral
Apical
Basolateral
G5

Appendices
303
Appendix C5: BCAAs (Leu, Ile and Val) concentration of the (0C:100W)2% sample in the apical and basolateral side of the Ussing chamber experiment during 5, 30 and 60 min of intestinal digestion in the G1 and G5 emptied aliquot. Values are presented as means ± SD of two independent replicates.
Intestinal digestion time
5 min 96.49 ± 3.85 23.83 ± 2.24 28.46 ± 3.73 148.77 ± 9.82
30 min 245.65 ± 5.81 63.12 ± 1.06 81.07 ± 1.64 389.85 ± 3.10
60 min 291.74 ± 33.99 93.24 ± 19.87 104.93 ± 17.88 489.90 ± 71.74
Total concentration 633.88 ± 24.33 180.19 ± 18.70 214.45 ± 15.79 1028.52 ± 58.82
5 min 0.32 ± 0.06 0.15 ± 0.02 0.22 ± 0.02 0.69 ± 0.10
30 min 6.62 ± 2.04 4.16 ± 2.43 3.74 ± 0.90 14.53 ± 5.37
60 min 15.94 ± 1.18 7.18 ± 0.01 9.29 ± 1.12 32.42 ± 2.29
Total concentration 22.89 ± 3.16 11.50 ± 2.40 13.25 ± 2.00 47.64 ± 7.56
5 min 143.89 ± 156.33 32.74 ± 31.40 46.21 ± 45.46 222.84 ± 233.19
30 min 95.28 ± 22.69 38.05 ± 8.69 39.96 ± 6.70 173.29 ± 38.07
60 min 87.69 ± 42.03 37.41 ± 16.79 38.32 ± 20.14 163.42 ± 78.96
Total concentration 326.86 ± 221.05 108.20 ± 56.87 124.49 ± 72.31 559.55 ± 350.23
5 min 2.74 ± 3.45 1.17 ± 1.43 1.50 ± 1.78 5.41 ± 6.67
30 min 4.62 ± 2.19 2.94 ± 1.68 2.61 ± 0.81 10.17 ± 4.67
60 min 8.67 ± 1.06 6.32 ± 2.65 5.95 ± 0.64 20.94 ± 4.36
Total concentration 16.03 ± 6.70 10.43 ± 5.76 10.06 ± 3.23 36.53 ± 15.69
Apical
Basolateral
Apical
Basolateral
G5
G1(0C:100W)2%
Leu (µg/mL) Ile (µg/mL) Val (µg/mL) BCAAs (µg/mL)

Appendices
304
Appendix C6: BCAAs (Leu, Ile and Val) concentration of the (20C:80W)2% sample in the apical and basolateral side of the Ussing chamber experiment during 5, 30 and 60 min of intestinal digestion in the G1 and G5 emptied aliquot. Values are presented as means ± SD of two independent replicates.
Intestinal digestion time
5 min 87.16 ± 1.41 17.49 ± 2.15 22.61 ± 0.41 127.25 ± 3.96
30 min 223.22 ± 6.49 59.55 ± 4.60 76.94 ± 2.15 359.72 ± 0.26
60 min 268.57 ± 23.96 97.39 ± 2.99 111.88 ± 3.84 477.84 ± 23.11
Total concentration 578.95 ± 29.05 174.43 ± 3.76 211.43 ± 6.40 964.81 ± 18.89
5 min 0.34 ± 0.14 0.16 ± 0.02 0.22 ± 0.02 0.73 ± 0.18
30 min 6.52 ± 3.78 3.96 ± 2.99 3.49 ± 1.82 13.97 ± 8.59
60 min 17.04 ± 8.41 6.86 ± 3.29 9.89 ± 5.85 33.79 ± 17.55
Total concentration 23.91 ± 12.33 10.98 ± 6.31 13.61 ± 7.69 48.50 ± 26.32
5 min 46.61 ± 0.19 16.43 ± 2.24 14.18 ± 5.85 77.22 ± 3.80
30 min 64.01 ± 15.13 27.10 ± 4.27 28.40 ± 4.02 119.51 ± 23.41
60 min 91.94 ± 12.24 45.01 ± 3.37 43.08 ± 2.64 180.03 ± 18.25
Total concentration 202.55 ± 27.56 88.54 ± 5.40 85.66 ± 12.50 376.75 ± 45.45
5 min 0.23 ± 0.01 0.13 ± 0.02 0.18 ± 0.03 0.54 ± 0.06
30 min 4.01 ± 1.00 1.64 ± 0.04 2.29 ± 0.04 7.94 ± 1.08
60 min 9.56 ± 1.08 4.56 ± 0.32 5.73 ± 0.45 19.85 ± 0.96
Total concentration 13.80 ± 2.09 6.32 ± 0.38 8.20 ± 0.37 28.32 ± 2.10
Apical
Basolateral
Apical
Basolateral
G5
G1(20C:80W)2%
Leu (µg/mL) Ile (µg/mL) Val (µg/mL) BCAAs (µg/mL)

Appendices
305
Appendix C7: BCAAs (Leu, Ile and Val) concentration of the (50C:50W)2% sample in the apical and basolateral side of the Ussing chamber experiment during 5, 30 and 60 min of intestinal digestion in the G1 and G5 emptied aliquot. Values are presented as means ± SD of two independent replicates.
Intestinal digestion time
5 min 66.57 ± 4.77 13.71 ± 2.76 16.58 ± 1.30 96.86 ± 8.84
30 min 189.64 ± 7.59 53.96 ± 1.51 68.90 ± 1.15 312.51 ± 10.25
60 min 230.52 ± 18.80 81.15 ± 3.37 94.27 ± 4.44 405.94 ± 26.61
Total concentration 486.73 ± 21.62 148.82 ± 2.11 179.75 ± 4.29 815.31 ± 28.02
5 min 0.45 ± 0.28 0.24 ± 0.14 0.34 ± 0.20 1.03 ± 0.62
30 min 5.82 ± 2.23 2.68 ± 1.05 3.84 ± 1.64 12.34 ± 4.91
60 min 14.37 ± 1.29 7.38 ± 0.77 10.16 ± 2.44 31.91 ± 4.51
Total concentration 20.64 ± 3.80 10.29 ± 1.96 14.34 ± 4.29 45.28 ± 10.04
5 min 83.24 ± 24.10 17.06 ± 4.89 20.92 ± 8.48 121.21 ± 37.47
30 min 173.16 ± 13.56 47.77 ± 4.53 58.89 ± 4.80 279.82 ± 22.89
60 min 207.23 ± 20.68 73.93 ± 6.36 84.93 ± 8.92 366.08 ± 35.96
Total concentration 463.62 ± 58.34 138.76 ± 15.78 164.73 ± 22.20 767.12 ± 96.31
5 min 0.38 ± 0.10 0.19 ± 0.03 0.29 ± 0.04 0.86 ± 0.18
30 min 4.41 ± 1.78 2.18 ± 0.72 2.83 ± 0.76 9.43 ± 3.26
60 min 12.05 ± 6.16 7.21 ± 0.65 7.82 ± 1.88 27.07 ± 7.39
Total concentration 16.84 ± 8.05 9.58 ± 0.10 10.94 ± 2.68 37.36 ± 10.83
Apical
Basolateral
Apical
Basolateral
G5
G1(50C:50W)2%
Leu (µg/mL) Ile (µg/mL) Val (µg/mL) BCAAs (µg/mL)
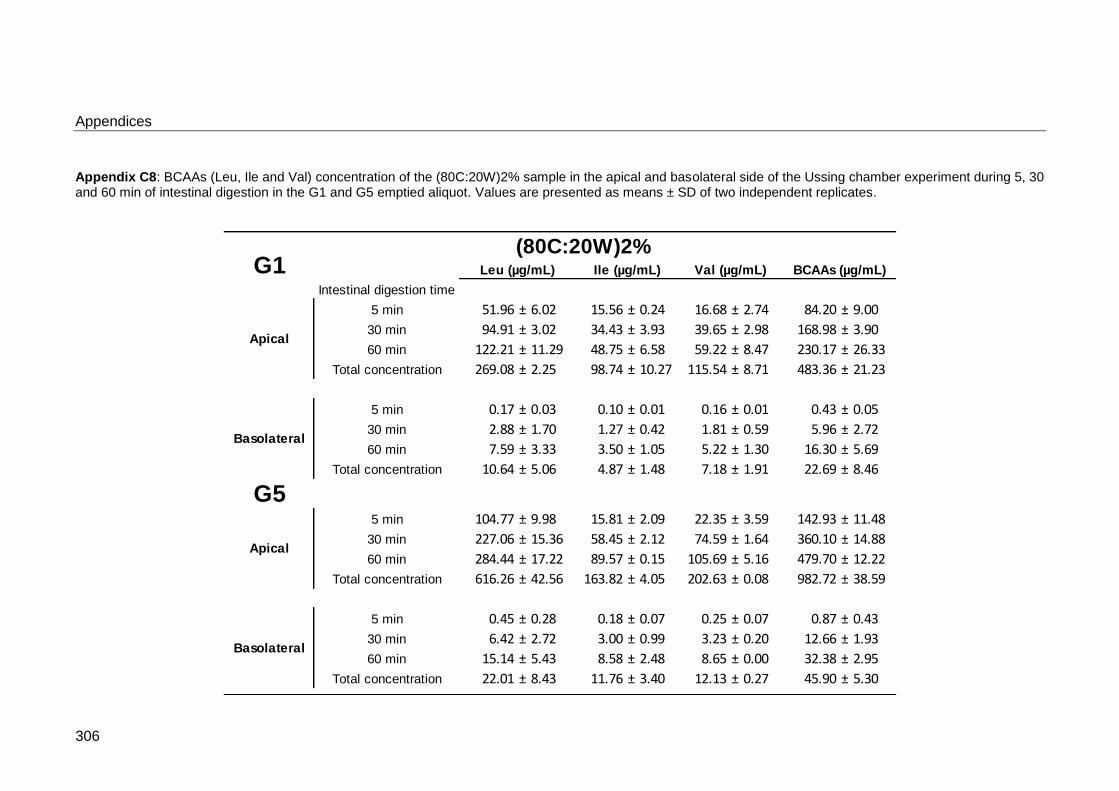
Appendices
306
Appendix C8: BCAAs (Leu, Ile and Val) concentration of the (80C:20W)2% sample in the apical and basolateral side of the Ussing chamber experiment during 5, 30 and 60 min of intestinal digestion in the G1 and G5 emptied aliquot. Values are presented as means ± SD of two independent replicates.
Intestinal digestion time
5 min 51.96 ± 6.02 15.56 ± 0.24 16.68 ± 2.74 84.20 ± 9.00
30 min 94.91 ± 3.02 34.43 ± 3.93 39.65 ± 2.98 168.98 ± 3.90
60 min 122.21 ± 11.29 48.75 ± 6.58 59.22 ± 8.47 230.17 ± 26.33
Total concentration 269.08 ± 2.25 98.74 ± 10.27 115.54 ± 8.71 483.36 ± 21.23
5 min 0.17 ± 0.03 0.10 ± 0.01 0.16 ± 0.01 0.43 ± 0.05
30 min 2.88 ± 1.70 1.27 ± 0.42 1.81 ± 0.59 5.96 ± 2.72
60 min 7.59 ± 3.33 3.50 ± 1.05 5.22 ± 1.30 16.30 ± 5.69
Total concentration 10.64 ± 5.06 4.87 ± 1.48 7.18 ± 1.91 22.69 ± 8.46
5 min 104.77 ± 9.98 15.81 ± 2.09 22.35 ± 3.59 142.93 ± 11.48
30 min 227.06 ± 15.36 58.45 ± 2.12 74.59 ± 1.64 360.10 ± 14.88
60 min 284.44 ± 17.22 89.57 ± 0.15 105.69 ± 5.16 479.70 ± 12.22
Total concentration 616.26 ± 42.56 163.82 ± 4.05 202.63 ± 0.08 982.72 ± 38.59
5 min 0.45 ± 0.28 0.18 ± 0.07 0.25 ± 0.07 0.87 ± 0.43
30 min 6.42 ± 2.72 3.00 ± 0.99 3.23 ± 0.20 12.66 ± 1.93
60 min 15.14 ± 5.43 8.58 ± 2.48 8.65 ± 0.00 32.38 ± 2.95
Total concentration 22.01 ± 8.43 11.76 ± 3.40 12.13 ± 0.27 45.90 ± 5.30
Apical
Basolateral
Apical
Basolateral
G5
G1(80C:20W)2%
Leu (µg/mL) Ile (µg/mL) Val (µg/mL) BCAAs (µg/mL)

Appendices
307
Appendix C9: BCAAs (Leu, Ile and Val) concentration of the (50C:50W)4% sample in the apical and basolateral side of the Ussing chamber experiment during 5, 30 and 60 min of intestinal digestion in the G1 and G5 emptied aliquot. Values are presented as means ± SD of two independent replicates.
Intestinal digestion time
5 min 72.00 ± 9.52 16.19 ± 3.75 19.07 ± 3.34 107.27 ± 16.61
30 min 164.15 ± 3.81 46.98 ± 8.67 62.00 ± 6.21 273.14 ± 18.69
60 min 216.79 ± 8.28 75.18 ± 0.28 86.69 ± 2.00 378.66 ± 10.01
Total concentration 452.95 ± 5.04 138.36 ± 12.69 167.76 ± 7.55 759.07 ± 25.29
5 min 0.37 ± 0.12 0.18 ± 0.06 0.24 ± 0.03 0.79 ± 0.22
30 min 4.69 ± 1.55 2.91 ± 1.57 2.84 ± 0.53 10.44 ± 3.65
60 min 12.06 ± 3.39 9.87 ± 0.80 7.99 ± 0.69 29.92 ± 4.88
Total concentration 17.12 ± 5.06 12.96 ± 2.44 11.08 ± 1.25 41.15 ± 8.74
5 min 81.54 ± 4.76 15.33 ± 3.68 18.16 ± 3.65 115.03 ± 12.08
30 min 168.94 ± 9.28 43.72 ± 11.18 55.95 ± 11.44 268.61 ± 31.90
60 min 196.43 ± 17.75 60.76 ± 3.37 70.20 ± 1.92 327.38 ± 23.04
Total concentration 446.91 ± 3.71 119.81 ± 11.49 144.31 ± 13.16 711.02 ± 20.94
5 min 0.27 ± 0.09 0.14 ± 0.05 0.19 ± 0.03 0.60 ± 0.17
30 min 4.45 ± 1.18 1.95 ± 0.23 2.74 ± 0.39 9.14 ± 1.80
60 min 11.33 ± 1.86 6.96 ± 2.55 7.42 ± 0.22 25.71 ± 0.46
Total concentration 16.05 ± 3.13 9.05 ± 2.27 10.35 ± 0.64 35.45 ± 1.51
Apical
Basolateral
Apical
Basolateral
G5
G1(50C:50W)4%
Leu (µg/mL) Ile (µg/mL) Val (µg/mL) BCAAs (µg/mL)

Appendices
308
Appendix C10: BCAAs (Leu, Ile and Val) concentration of the (50C:50W)8% sample in the apical and basolateral side of the Ussing chamber experiment during
5, 30 and 60 min of intestinal digestion in the G1 and G5 emptied aliquot. Values are presented as means ± SD of two independent replicates.
Intestinal digestion time
5 min 72.37 ± 7.46 15.07 ± 5.92 18.00 ± 3.02 105.43 ± 16.40
30 min 165.14 ± 1.19 51.46 ± 9.27 60.75 ± 11.77 277.35 ± 19.85
60 min 217.82 ± 11.68 80.73 ± 19.51 86.42 ± 15.85 384.98 ± 47.04
Total concentration 455.33 ± 17.95 147.26 ± 34.69 165.17 ± 30.65 767.76 ± 83.29
5 min 0.64 ± 0.33 0.33 ± 0.16 0.43 ± 0.16 1.40 ± 0.65
30 min 5.39 ± 2.09 2.54 ± 0.81 3.31 ± 0.76 11.25 ± 3.66
60 min 12.25 ± 2.19 7.89 ± 2.48 8.27 ± 0.29 28.41 ± 0.01
Total concentration 18.28 ± 4.62 10.76 ± 1.52 12.01 ± 1.21 41.05 ± 4.31
5 min 54.60 ± 27.90 11.20 ± 9.08 12.43 ± 8.81 78.23 ± 45.80
30 min 126.34 ± 15.82 38.29 ± 0.97 46.00 ± 0.14 210.63 ± 14.99
60 min 170.96 ± 0.16 60.55 ± 7.11 65.75 ± 12.28 297.26 ± 19.23
Total concentration 351.90 ± 11.92 110.04 ± 17.16 124.18 ± 20.95 586.12 ± 50.03
5 min 0.42 ± 0.03 0.21 ± 0.01 0.26 ± 0.01 0.89 ± 0.05
30 min 4.82 ± 0.41 3.01 ± 1.58 3.05 ± 0.58 10.89 ± 2.58
60 min 11.12 ± 1.31 5.08 ± 0.83 7.58 ± 1.82 23.78 ± 3.96
Total concentration 16.37 ± 1.69 8.30 ± 2.41 10.90 ± 2.39 35.56 ± 6.49
Apical
Basolateral
Apical
Basolateral
G5
G1(50C:50W)8%
Leu (µg/mL) Ile (µg/mL) Val (µg/mL) BCAAs (µg/mL)

Appendices
309
Appendix D
Change in pH of milk samples during gastric digestion in the semi-dynamic model corresponding to each gastric emptying (GE) aliquot with pepsin (closed dots) and without pepsin (open dots) addition. The time represents an approximation of the actual values displayed in Table 4.3. The pH values are referred to the basal stage (before gastric digestion), initial (t=0 min, milk sample including oral phase and basal volumes). Each data point corresponds to one determination.

Appendices
310
Appendix E
Appendix E1: Behaviour of the Raw sample with and without the addition of pepsin solution during the simulated gastric digestion. The images correspond to the behaviour in the stomach model right before the emptying, and examples of confocal microscopy images of the emptied aliquots in each gastric emptying (GE) point. The average of GE time was 36 min (GE1), 73 min (GE2), 109 min (GE3), 145 min (GE4) and 182 min (GE5). Red shows the lipid and green shows the protein.
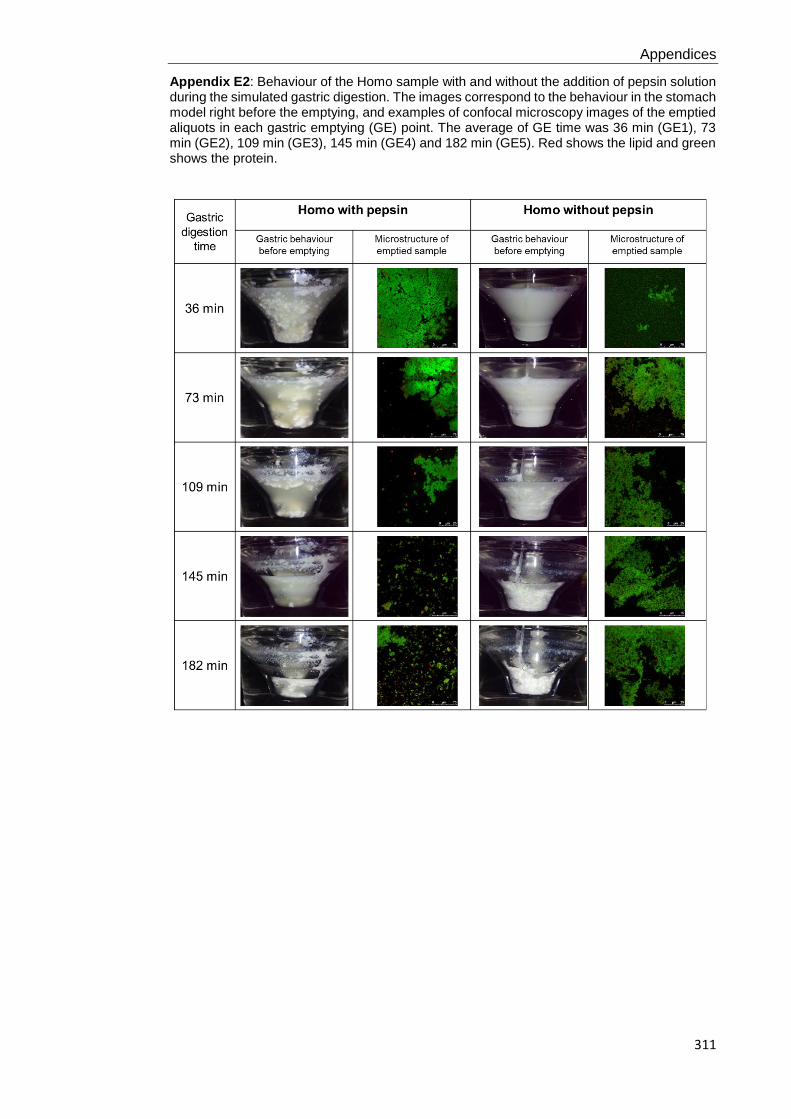
Appendices
311
Appendix E2: Behaviour of the Homo sample with and without the addition of pepsin solution during the simulated gastric digestion. The images correspond to the behaviour in the stomach model right before the emptying, and examples of confocal microscopy images of the emptied aliquots in each gastric emptying (GE) point. The average of GE time was 36 min (GE1), 73 min (GE2), 109 min (GE3), 145 min (GE4) and 182 min (GE5). Red shows the lipid and green shows the protein.

Appendices
312
Appendix E3: Behaviour of the Past sample with and without the addition of pepsin solution during the simulated gastric digestion. The images correspond to the behaviour in the stomach model right before the emptying, and examples of confocal microscopy images of the emptied aliquots in each gastric emptying (GE) point. The average of GE time was 36 min (GE1), 73 min (GE2), 109 min (GE3), 145 min (GE4) and 182 min (GE5). Red shows the lipid and green shows the protein.

Appendices
313
Appendix E4: Behaviour of the UHT sample with and without the addition of pepsin solution during the simulated gastric digestion. The images correspond to the behaviour in the stomach model right before the emptying, and examples of confocal microscopy images of the emptied aliquots in each gastric emptying (GE) point. The average of GE time was 36 min (GE1), 73 min (GE2), 109 min (GE3), 145 min (GE4) and 182 min (GE5). Red shows the lipid and green shows the protein.

Appendices
314
Appendix E5: Behaviour of the Past+Homo sample with and without the addition of pepsin solution during the simulated gastric digestion. The images correspond to the behaviour in the stomach model right before the emptying, and examples of confocal microscopy images of the emptied aliquots in each gastric emptying (GE) point. The average of GE time was 36 min (GE1), 73 min (GE2), 109 min (GE3), 145 min (GE4) and 182 min (GE5). Red shows the lipid and green shows the protein.
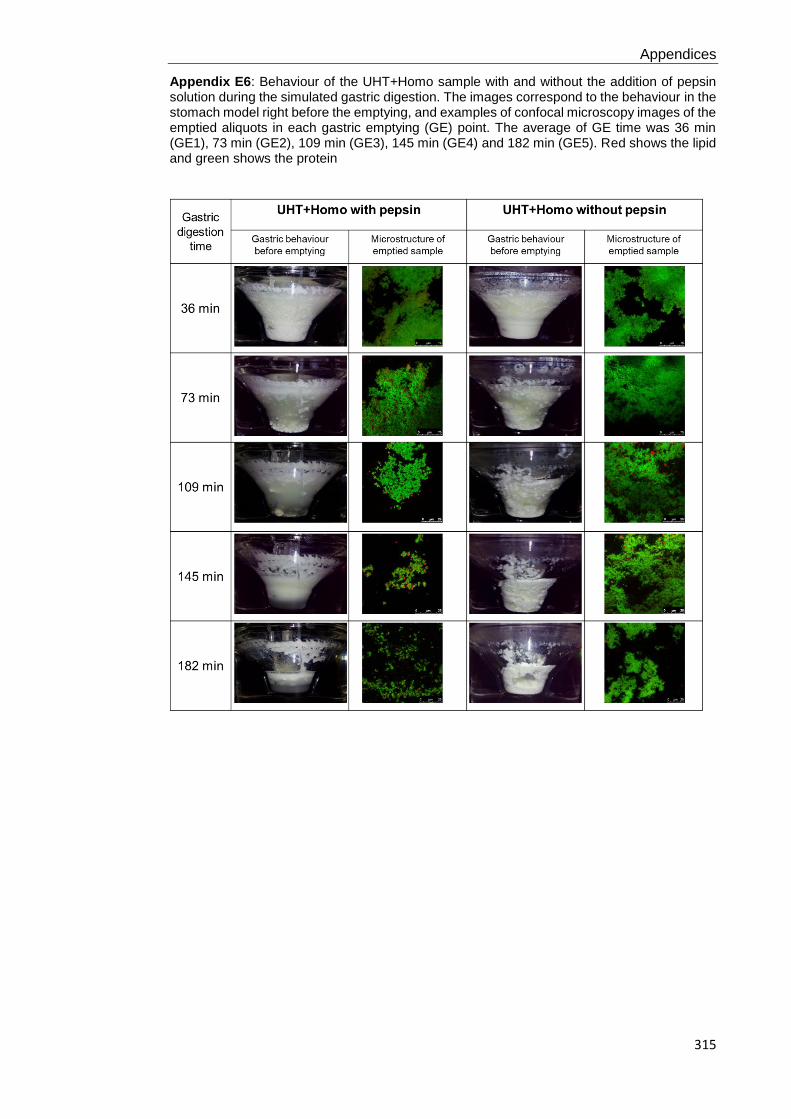
Appendices
315
Appendix E6: Behaviour of the UHT+Homo sample with and without the addition of pepsin solution during the simulated gastric digestion. The images correspond to the behaviour in the stomach model right before the emptying, and examples of confocal microscopy images of the emptied aliquots in each gastric emptying (GE) point. The average of GE time was 36 min (GE1), 73 min (GE2), 109 min (GE3), 145 min (GE4) and 182 min (GE5). Red shows the lipid and green shows the protein

Appendices
316
Appendix F
Appendix F1: The lipid content (% w/w) of initial (before digestion) and the gastric emptying points (GE1-GE5) in digestion with pepsin (black bar) and without pepsin (grey bar) for all milk samples. Each data point is the representation of one measurement. The values were corrected for the different gastric dilution in each point.

Appendices
317
Appendix F2: The protein content (% w/w) of initial (before digestion) and the gastric emptying points (GE1-GE5) in digestion with pepsin (black bar) and without pepsin (grey bar) for all milk samples. Each data point is the representation of one measurement. The values were corrected for the different gastric dilution in each point.
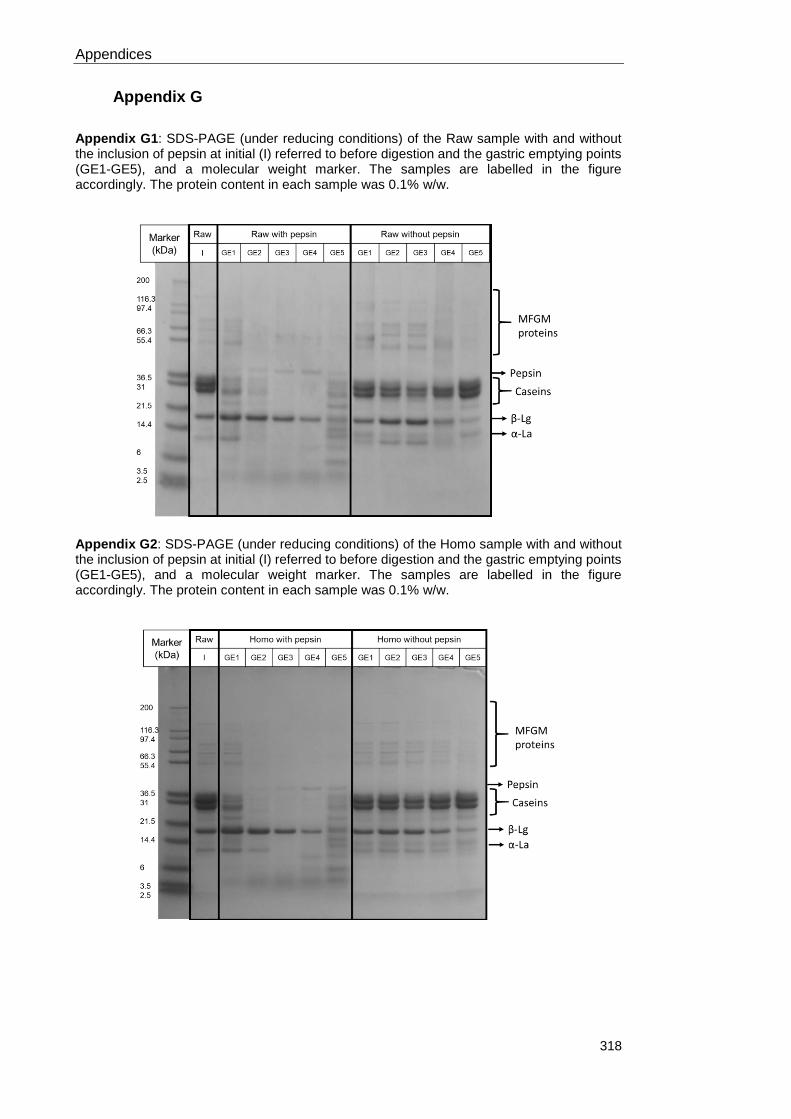
Appendices
318
Appendix G
Appendix G1: SDS-PAGE (under reducing conditions) of the Raw sample with and without the inclusion of pepsin at initial (I) referred to before digestion and the gastric emptying points (GE1-GE5), and a molecular weight marker. The samples are labelled in the figure accordingly. The protein content in each sample was 0.1% w/w.
Appendix G2: SDS-PAGE (under reducing conditions) of the Homo sample with and without the inclusion of pepsin at initial (I) referred to before digestion and the gastric emptying points (GE1-GE5), and a molecular weight marker. The samples are labelled in the figure accordingly. The protein content in each sample was 0.1% w/w.

Appendices
319
Appendix G3: SDS-PAGE (under reducing conditions) of the Past sample with and without the inclusion of pepsin at initial (I) referred to before digestion and the gastric emptying points (GE1-GE5), and a molecular weight marker. The samples are labelled in the figure accordingly. The protein content in each sample was 0.1% w/w.
Appendix G4: SDS-PAGE (under reducing conditions) of the Past+Homo sample with and without the inclusion of pepsin at initial (I) referred to before digestion and the gastric emptying points (GE1-GE5), and a molecular weight marker. The samples are labelled in the figure accordingly. The protein content in each sample was 0.1% w/w.

Appendices
320
Appendix G5: SDS-PAGE (under reducing conditions) of the UHT sample with and without the inclusion of pepsin at initial (I) referred to before digestion and the gastric emptying points (GE1-GE5), and a molecular weight marker. The samples are labelled in the figure accordingly. The protein content in each sample was 0.1% w/w.
Appendix G6: SDS-PAGE (under reducing conditions) of the UHT+Homo sample with and without the inclusion of pepsin at initial (I) referred to before digestion and the gastric emptying points (GE1-GE5), and a molecular weight marker. The samples are labelled in the figure accordingly. The protein content in each sample was 0.1% w/w.

Appendices
321
Appendix H
Amount of protein and lipid determined in all the samples at the digesta separated in A) serum and B) coagulum after 36 min of gastric digestion.

Appendices
322
Appendix I
Appendix I1: Gastric behaviour of Semi-Solid sample at the different gastric digestion time points, using pepsin and gastric lipase, pepsin and no enzyme. The images were taken just before the emptying. Note: the yellow block corresponds to the pH probe.
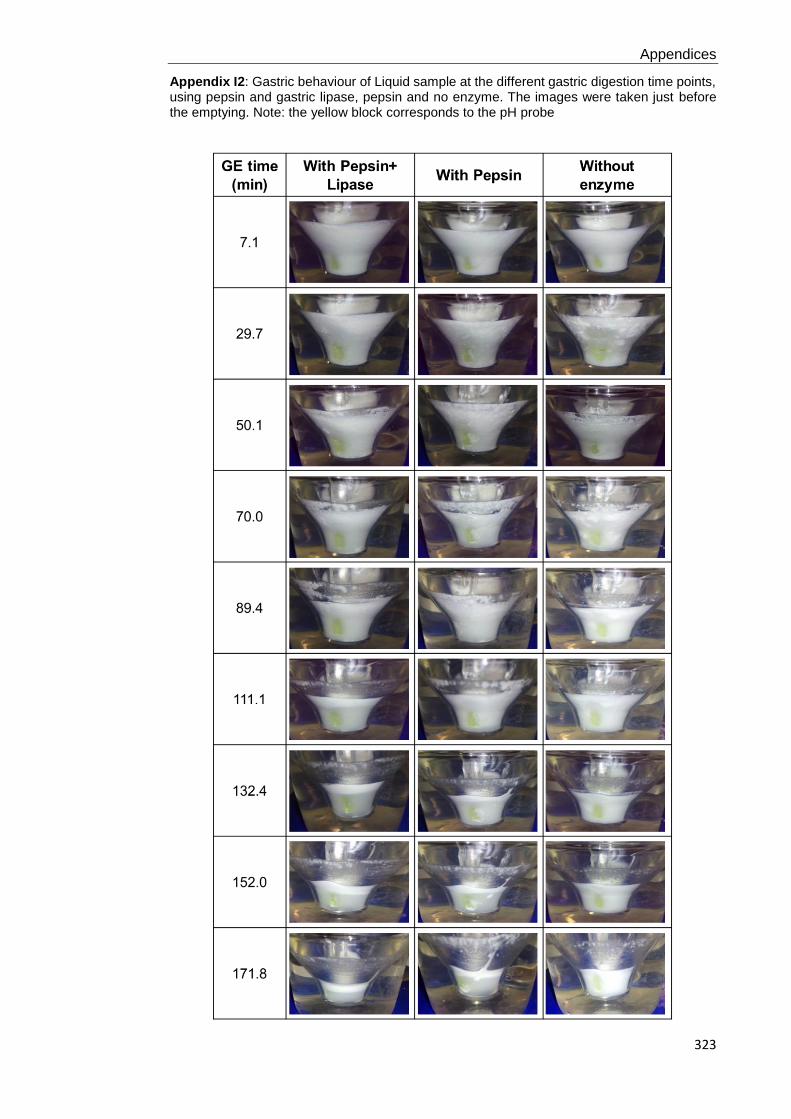
Appendices
323
Appendix I2: Gastric behaviour of Liquid sample at the different gastric digestion time points, using pepsin and gastric lipase, pepsin and no enzyme. The images were taken just before the emptying. Note: the yellow block corresponds to the pH probe

Appendices
324
Appendix J
Profile of free fatty acids released from Liquid (A, C, E) and Semi-Solid (B, D, F) samples after 1 min (A, B), 30 min (C, D) and 60 min (E, F) of intestinal digestion. Data point represents means (n=3 for each meal) of mass percentage.