
EEG Analysis of the Brain Activity during the Observation of Commercial, Political, or Public...
8
Hindawi Publishing Corporation Computational Intelligence and Neuroscience Volume 2010, Article ID 985867, 7 pages doi:10.1155/2010/985867 Research Article EEG Analysis of the Brain Activity during the Observation of Commercial, Political, or Public Service Announcements Giovanni Vecchiato, 1, 2 Laura Astolfi, 1, 2, 3 Alessandro Tabarrini, 2, 3 Serenella Salinari, 3 Donatella Mattia, 2 Febo Cincotti, 2 Luigi Bianchi, 2 Domenica Sorrentino, 2 Fabio Aloise, 2 Ramon Soranzo, 1 and Fabio Babiloni 1, 2 1 Department of Physiology and Pharmacology, University of Rome “Sapienza”, P.le A. Moro 5, 00185 Rome, Italy 2 IRCCS Fondazione Santa Lucia, Laboratory of Neuroelectrical Imaging, Via Ardeatina 354, 00179 Rome, Italy 3 Department of Computer Science and Informatics, University of Rome “Sapienza”, Via Ariosto 25, 00100 Rome, Italy Correspondence should be addressed to Fabio Babiloni, [email protected] Received 24 July 2009; Accepted 29 September 2009 Academic Editor: Fabrizio De Vico Fallani Copyright © 2010 Giovanni Vecchiato et al. This is an open access article distributed under the Creative Commons Attribution License, which permits unrestricted use, distribution, and reproduction in any medium, provided the original work is properly cited. The use of modern brain imaging techniques could be useful to understand what brain areas are involved in the observation of video clips related to commercial advertising, as well as for the support of political campaigns, and also the areas of Public Service Announcements (PSAs). In this paper we describe the capability of tracking brain activity during the observation of commercials, political spots, and PSAs with advanced high-resolution EEG statistical techniques in time and frequency domains in a group of normal subjects. We analyzed the statistically significant cortical spectral power activity in different frequency bands during the observation of a commercial video clip related to the use of a beer in a group of 13 normal subjects. In addition, a TV speech of the Prime Minister of Italy was analyzed in two groups of swing and “supporter” voters. Results suggested that the cortical activity during the observation of commercial spots could vary consistently across the spot. This fact suggest the possibility to remove the parts of the spot that are not particularly attractive by using those cerebral indexes. The cortical activity during the observation of the political speech indicated a major cortical activity in the supporters group when compared to the swing voters. In this case, it is possible to conclude that the communication proposed has failed to raise attention or interest on swing voters. In conclusions, high-resolution EEG statistical techniques have been proved to able to generate useful insights about the particular fruition of TV messages, related to both commercial as well as political fields. 1. Introduction Every day we are exposed to several solicitations for pur- chasing products, voting or supporting particular politicians and even improving our life style. Such pressure has become usual, being mediated by all the current media available, video, audio, and even internet. How and to what extent these messages could be detected and recognized by our brain is still not well understood. In fact, the study of brain responses to commercial and political announcements has been measured mainly by the hemodynamic responses of the different brain areas, by using the functional Magnetic Resonance Imaging devices (fMRI). However, both the stimuli and the relative brain responses have rapidly shifting characteristics that are not tracked by the evolution of the hemodynamic blood flow, which usually lasts 4–6 seconds. Different brain imaging tools, mainly EEG and Magnetoen- cephalography, exhibit a sufficient time resolution to follow the brain activity at an expense of a coarse level of spatial resolution with respect to the fMRI. In fact, during those last ten years, the use of the high resolution EEG techniques has retrieved an increased amount of information related to the brain during activities related to complex cognitive tasks, such as memory, visual attention, short-term memory, and so forth [1–3]. Starting from the interesting characteristic of the high resolution EEG techniques for the tracking of brain activity, the present work would like to describe neuroelectric-based
Transcript of EEG Analysis of the Brain Activity during the Observation of Commercial, Political, or Public...

Hindawi Publishing CorporationComputational Intelligence and NeuroscienceVolume 2010, Article ID 985867, 7 pagesdoi:10.1155/2010/985867
Research Article
EEG Analysis of the Brain Activity during the Observation ofCommercial, Political, or Public Service Announcements
Giovanni Vecchiato,1, 2 Laura Astolfi,1, 2, 3 Alessandro Tabarrini,2, 3 Serenella Salinari,3
Donatella Mattia,2 Febo Cincotti,2 Luigi Bianchi,2 Domenica Sorrentino,2 Fabio Aloise,2
Ramon Soranzo,1 and Fabio Babiloni1, 2
1 Department of Physiology and Pharmacology, University of Rome “Sapienza”, P.le A. Moro 5, 00185 Rome, Italy2 IRCCS Fondazione Santa Lucia, Laboratory of Neuroelectrical Imaging, Via Ardeatina 354, 00179 Rome, Italy3 Department of Computer Science and Informatics, University of Rome “Sapienza”, Via Ariosto 25, 00100 Rome, Italy
Correspondence should be addressed to Fabio Babiloni, [email protected]
Received 24 July 2009; Accepted 29 September 2009
Academic Editor: Fabrizio De Vico Fallani
Copyright © 2010 Giovanni Vecchiato et al. This is an open access article distributed under the Creative Commons AttributionLicense, which permits unrestricted use, distribution, and reproduction in any medium, provided the original work is properlycited.
The use of modern brain imaging techniques could be useful to understand what brain areas are involved in the observation ofvideo clips related to commercial advertising, as well as for the support of political campaigns, and also the areas of Public ServiceAnnouncements (PSAs). In this paper we describe the capability of tracking brain activity during the observation of commercials,political spots, and PSAs with advanced high-resolution EEG statistical techniques in time and frequency domains in a group ofnormal subjects. We analyzed the statistically significant cortical spectral power activity in different frequency bands during theobservation of a commercial video clip related to the use of a beer in a group of 13 normal subjects. In addition, a TV speech ofthe Prime Minister of Italy was analyzed in two groups of swing and “supporter” voters. Results suggested that the cortical activityduring the observation of commercial spots could vary consistently across the spot. This fact suggest the possibility to remove theparts of the spot that are not particularly attractive by using those cerebral indexes. The cortical activity during the observation ofthe political speech indicated a major cortical activity in the supporters group when compared to the swing voters. In this case, itis possible to conclude that the communication proposed has failed to raise attention or interest on swing voters. In conclusions,high-resolution EEG statistical techniques have been proved to able to generate useful insights about the particular fruition of TVmessages, related to both commercial as well as political fields.
1. Introduction
Every day we are exposed to several solicitations for pur-chasing products, voting or supporting particular politiciansand even improving our life style. Such pressure has becomeusual, being mediated by all the current media available,video, audio, and even internet. How and to what extentthese messages could be detected and recognized by ourbrain is still not well understood. In fact, the study of brainresponses to commercial and political announcements hasbeen measured mainly by the hemodynamic responses ofthe different brain areas, by using the functional MagneticResonance Imaging devices (fMRI). However, both thestimuli and the relative brain responses have rapidly shifting
characteristics that are not tracked by the evolution of thehemodynamic blood flow, which usually lasts 4–6 seconds.Different brain imaging tools, mainly EEG and Magnetoen-cephalography, exhibit a sufficient time resolution to followthe brain activity at an expense of a coarse level of spatialresolution with respect to the fMRI. In fact, during thoselast ten years, the use of the high resolution EEG techniqueshas retrieved an increased amount of information related tothe brain during activities related to complex cognitive tasks,such as memory, visual attention, short-term memory, andso forth [1–3].
Starting from the interesting characteristic of the highresolution EEG techniques for the tracking of brain activity,the present work would like to describe neuroelectric-based

2 Computational Intelligence and Neuroscience
methodology for the assessment of the efficacy of commer-cial, politic, and Public Service Announcements (PSAs).
The aim of the brain imaging techniques applied tothe fruition of commercial advertizing is to understandmechanisms underlying customer’s engagement with brandor company advertized [4–6]. In particular, the issue is toexplain how the exposure of subsequent film segments is ableto trigger in the consumer mind persisting stimuli leadingto interest, preference, purchase, and repurchase of a givenproduct. In the last decades, several authors have investigatedthe capability of subjects to memorize and retrieve sensible“commercial” information observed during a TV spot [7–12].
Recently, a growing number of research laboratories areinvolved in recognizing the cerebral areas activated duringthe observation of figures and videos showing politicians,a field that the most people call Neuropolicy. This intensescientific movement has encouraged some companies anduniversities to seriously take an interest about the cerebralactivity during fruition of politicians’ images and TVcommercials [13, 14].
Local governments of European countries, and alsoacross the world, are called to disseminate information abouthealth risky habits promoting instead healthy life style inorder to improve the health of their citizens. In this contextPSAs are noncommercial broadcast advertizemnets intendedto modify public behavior. PSAs are at the core of manypublic health campaigns against smoking, fatty foods, abuseof alcohol, and other possible threats for the health ofcitizens. But the content of these PSAs could be also directedfor the promotion of “positive” social collective behavior, forinstance, calling against racism, supporting the integrationof different cultures in the country, or promoting a healthydrive style, for the road security. Therefor effective PSAsprovide a great public health benefit [15, 16]. However,the lack of reliable, quantitative, and objective means ofadvertizement evaluation is one of the impediments to betterPSA outcomes. In addition, not well-designed PSAs are goingto have counter effects with respect to their desired goals[17].
The purpose of this paper is to illustrate the potentialof the High Resolution EEG techniques when applied tothe analysis of brain activity related to the observation ofTV commercials, political advertizing, and PSAs to localizecerebral areas mostly emotionally involved. In particular, wewould like to describe how, by using appropriate statisticalanalysis, it is possible to recover significant informationabout cortical areas engaged by particular scenes insertedwithin the video clip analyzed. The brain activity wasevaluated in both time and frequency domains by solvingthe associate inverse problem of EEG with the use ofrealistic head models. Successively, the data analyzed werestatistically treated by comparing their actual values tothe average values estimated during the observation ofthe documentary. Statistical estimators were then evalu-ated and employed in order to generate representationsof the cortical areas elicited by the particular videoconsidered.
2. Materials and Methods
The whole dataset is composed by EEG registrations of13 healthy subjects (mean age 30 ± 4 years) watchinga documentary of 30 minutes intermingled by a TVcommercial [18], and 10 subjects were involved in theobservation of a documentary of 15 minutes intermingledwith a couple of video clips supporting the Italian PrimeMinister (politic announcement) and a campaigns againstsmoking (PSA). Each subject is exposed to the observationof a same documentary. Subjects were informed aboutthe fact that the EEG recordings will be related to theobservation of the brain activity during the documentaryand TV commercial, political, and PSAs videos. The entireprocedure was authorized by the local ethical committee atthe recording site, and informed written consensuses to therecording procedures were taken before the EEG recordings.Subjects were instructed to pay attention to the materialshowed on the screen during the entire projection. Thevideos related to products, political support, and PSAs wereinserted at the middle of the documentary.
In order to enhance the poor spatial content of the EEGactivity, we employed the High Resolution EEG technologies[19, 20] to detect cortical areas involved in the task. Basically,these techniques involve the use of a large number (64–256) of scalp electrodes and rely on realistic MRI-constructedhead models [21, 22] and spatial deconvolution estimations,which are usually computed by solving a linear-inverseproblem based on Boundary-Element Mathematics [23,24]. Subjects were comfortably seated on a reclining chair,in an electrically shielded, dimly lit room. A 64-channelEEG system (BrainAmp, Brainproducts GmbH, Germany)was used to record electrical potentials by means of anelectrode cap, accordingly to an extension of the 10–20international system. In the present work, the cortical activitywas estimated from scalp EEG recordings by using realistichead models whose cortical surfaces consisted of about 5000triangles uniformly disposed. The current density estimationof each one of the equivalent electrical dipole of the under-lying neuronal population was computed by solving thelinear-inverse problem according to the techniques describedpreviously in this papers [18, 25, 26]. Thus, a time-varyingwaveform relative to the estimated current density activityat each single triangle of the modeled cortical surface wasobtained. Such waveform was then subjected to the time-varying spectral analysis by computing the spectral powerin the different frequency bands usually employed in EEGanalysis, that is, theta (4–7 Hz), alpha (8–12 Hz), beta (13–24 Hz), and gamma (24–45 Hz).
However, the estimation of the spectral power do notconvey information about the significance or nonsignificanceof what have been computed. This significance has to bebrought to the analysis by taking into account the z-scoretransformation of the cortical power spectra source imagingobtained. In fact, if a cortical area shows an increasedactivity during the period of the video to be tested, thisincrement has to be contrasted with the average powerspectra activity observed during the documentary period.The z-score variable is then obtained by computing the

Computational Intelligence and Neuroscience 3
differences between the estimated values (power spectrain the commercial advertizing, political announcement, orPSA) in the video and the average power spectra activityduring the documentary. This difference is successivelydivided by the standard deviation of the power spectraestimated during the documentary period.
Together with the statistically significant cortical sourceimaging applied in all the investigated videos, we wouldlike to track specifically the changes in the power spectralintensity of the EEG channels during the videos observation.In order to do that, first we selected the set of the frontalleads, including Fp1, Fp2, F1, F3, Fz, AFz, F2, F4, AF1,and AF2. Then, we filtered the observed EEG activity intwo main frequency bands: theta (4–7 Hz) and beta andgamma bands (13–40 Hz) [27]. This filtering procedurewas justified by the fact that the theta frequency band ismainly involved in the memorization processes, while thebeta and gamma frequency bands are instead advocatedfor the attention engagement. To summarize the activityfrom all these electrodes, the Global Field Power (GFP)was then computed. This is a measurement introduced byLehmann and Michel some decades ago to summarize theoverall activity over the scalp surface. GFP is computedfrom the entire set of electrodes by performing the sum ofthe squared values of the EEG potential at each electrodes,resulting in a time-varying waveforms related to the increaseor decrease of the global power in the analyzed EEG. Sincethe data were estimated from two EEG datasets, one filtered4–7 Hz and the other filtered between 13–40 Hz, we obtainedtwo time-varying waveforms: the GFP filtered in the 4–7 Hz and the GFP filtered in the 13–40 Hz. Successively,on these waveforms we apply the z-score transformationby estimating the average and the standard deviation ofthe GFP values during the documentary. Values of z-scoretransformation higher than 2 suggest statistical significancedifferences between the value of the variable estimated andthe baseline considered, at the 5% level.
In order to present these results relative to the entirepopulation, we needed a common cortical representation tomap the different activated areas of each subject. For thispurpose we used the average brain model available fromthe McGill University website to display the cortical areasthat are statistically significantly activated during differentexperimental conditions in all subjects analyzed. In this case,we are able to average the single subject result of the z-score test. In fact, we highlighted in yellow a voxel of theaverage brain model if it was a cortical site in which astatistical significant variation of the spectral power betweenthe experimental conditions was found in all the subjects; ifsuch brain voxel was statistically significant in all but one ofthe subjects analyzed, we depicted it in red. In all the othercases, the voxel was represented with a gray color. Only thestatistical significant variation of such spectral power whencompared to the documentary period was highlighted incolor. Statistical significance threshold was set at p < 0.05,which Bonferroni corrected for multiple comparisons.
2.1. Commercial Advertizing. After the EEG registrationrelated to the commercial advertizements each subject was
recalled in laboratory where an interview was performedasking if he/she usually drinks beer or light alcohol at leastonce per week. If yes, subjects were considered within thedataset of “drinkers” in opposition to the dataset of “nodrinkers”. In order to increase the sensitivity of the analysisperformed, only the EEG spectral analysis for the “drinkers”was analyzed and presented here.
3. Results
Of the 13 subjects recorded, only seven are “drinkers”. Hence,the successive analysis and results are presented for seven ofsuch subjects. We summarized all results for the “drinkers”group in a couple of figures showing the statisticallysignificant differences of cortical activation concerning thisdataset in the theta frequency band (4–7 Hz), being the dataregarding the alpha frequency band equivalent to the thetaband. Figure 1 presents the z-score average activity of thedrinkers population during the observation of a couple offrames of the commercial advertizing proposed, at time: T1= 10 seconds and T2 = 28 seconds (the entire duration ofthe spot is 30 seconds). Note in the left lower panel thedifferent brain views are relative to the brain seen from theback (1), left (2), front (3), and right (4). It is possible to notethat the brain is presented from different perspectives in thelower panels, while in the upper panels there are the videoframes observed by the subjects. The gray color representsthe absence of the statistical differences between the corticalactivity in the analyzed frequency band (theta in this case)during the video clips observation and the documentary. Thecolor zones instead presented the cortical areas in which suchspectral activity differs in the population analyzed.
By examining this strip, it results evident how thetemporal evolution of the mean cortical activity changesaccording to the images viewed by the subjects. In particular,an enhancement of cerebral activity is suggested by the resultof the application of the statistic tests at the beginning (T1)and at the end of the commercial presented (T2). The finalpart of the commercial spot attracts the interest in all thepopulation analyzed, as the large cortical areas depicted inyellow and red suggested. It could be hypothesized that theinitial part of the TV spot presented fails to attract theattention of the experimental group, as the brain activityresult is similar to that generated during the observation ofthe documentary. This could be used in future to better tailorthe TV spots by removing the parts of them that were unableto attract the attention of the audience.
The applications of the abovementioned technology tothe evaluation of a TV speech of the Italian Prime Ministerare shown in Figure 2.
Such figure shows the cerebral activity observed in twogroups of people divided as swing voters (panel a) andthe “supporters” of the Italian Prime Minister (panel b).The figure presents the statistically significant activity in theanalyzed groups in the theta frequency band for a particulartime frame of the speech. The brain activity is presented asseen from different perspectives (left, right, front, and back).The brain activity observed for the supporters (panel b) was

4 Computational Intelligence and Neuroscience
(1) (2)
(3) (4)
T1 T2
Figure 1: The track of the mean cortical activity of the groupof “drinkers” in the theta frequency band spot. The statisticalsignificant activity in this population is shown in 2 panelseach representing subsequent film segments of a TV spot withcorresponding brain activity. Temporal axes beat the spot incorrespondence to the beginning (T1) and the end (T2) of the entirefilm sequence: time in seconds. Note in the left lower panel thedifferent brain views are relative to the brain seen from the back(1), left (2), front (3), and right (4).
(a)
(b)
Figure 2: Analysis of a speech by the Italian Prime Minister: panel(a) presents the cerebral activity related to the population of swingvoters in the theta frequency bands. Note the four brains depictedat the right of each frame are relative to the four different views ofthe brain surface from different points of view; same convention ofFigure 1, panel (b) shows the cortical activity in the same frequencyband for the supporters of the Prime Minister. Cortical areasdepicted in red and yellow highlight those zones in which there isan enhancement of cerebral activity, when compared to a restingstate.
characterized during all the speech by power spectral activitysignificantly larger than those obtained in the documentary.On the contrary, swing voters are relatively less attracted bythe speech, since they had the brain activity not differentfrom that of the documentary for the major part of thespeech.
Hence, the results would suggest an overall efficacy ofthe communication generated by the video for the secondgroup of subjects (panel b) with respect to the “perceived”communication offered by the prime minister’s speech by thefirst one (panel a). A possible interpretation of these resultsis that analyzed speech could only intensify the supporters’idea leaving the swing voters neutral.
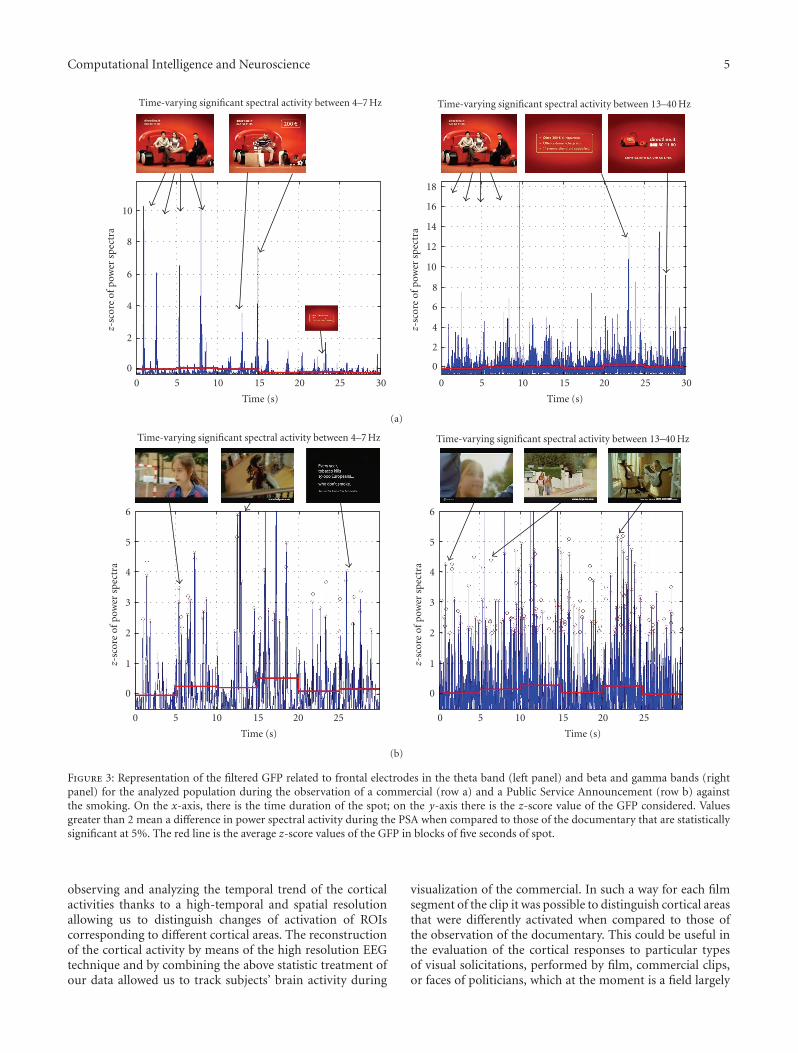
Another example of the application of the neuroelectricbrain imaging technology applied to the case of the com-mercial and PSAs is represented in Figure 3. In such figurethe time-varying changes of the filtered GFP in the theta (4–7 Hz) and in the beta and gamma bands (13–40 Hz) duringthe observation of a 30-second spot related to a commercial(row a) and a PSA against smoking (row b) are presented. Itis interesting to note how in both cases the spectral activityof the frontal leads showed values of z-score over 2 for manyinstants. In such a case it could be suggested that the spectralactivity in those time frames exceeds statistically the spectralactivity observed during the vision of the documentary.
The brain activity observed during this PSA spot isinstead presented in Figure 4, in which two cortical maps ofthe differences between the spectral activities during the spotwhen compared to those of the documentary are represented.Figure 4 shows the z-score maps during the PSA, where itis possible to note a precise activation of the frontal lobesduring the 30 seconds of the spot. Also in this case it isinteresting to note that the brain activity during the PSA isrelevant in the prefrontal areas, and it is symmetrical in thebeta and gamma frequency bands while located in the rightfrontal hemisphere for the theta band.
4. Discussions
Thanks to the high resolution EEG techniques, we trackedsubjects’ brain activity during visualization of a commercial:in such manner, it has been possible to obtain a globalmeasure of the reconstructed cortical signals by means of asimple graphic tool which allows us to distinguish the activityof different cortical areas. The abovementioned results allowus to comment on temporal and spatial events observed. Infact, it is worth noticing that the principal areas of statisticaldifferences in power spectra in the “drinkers” condition arelocated almost bilaterally in the prefrontal BAs 8 and 9 aswell as in the parietal BA 7. As presented in previous worksperformed both with EEG analysis [18] and MEG recordings[8], the observed phenomena suggest an active role of theprefrontal and parietal areas in coding of the informationthat will be retained by users from the TV commercials. Inparticular, activations of these cortical areas can be associatedwith attentional and memorization processes. The presentwork intends to stress the useful properties of the highresolution EEG technologies: this tool is able to help us in
Computational Intelligence and Neuroscience 5
0 5 10 15 20 25 30
Time (s)
0
2
4
6
8
10
z-sc
ore
ofpo
wer
spec
tra
Time-varying significant spectral activity between 4–7 Hz
0 5 10 15 20 25 30
Time (s)
0
2
4
6
8
10
12
14
16
18
z-sc
ore
ofpo
wer
spec
tra
Time-varying significant spectral activity between 13–40 Hz
(a)
0 5 10 15 20 25
Time (s)
0
1
2
3
4
5
6
z-sc
ore
ofpo
wer
spec
tra
Time-varying significant spectral activity between 4–7 Hz
0 5 10 15 20 25
Time (s)
0
1
2
3
4
5
6
z-sc
ore
ofpo
wer
spec
tra
Time-varying significant spectral activity between 13–40 Hz
(b)
Figure 3: Representation of the filtered GFP related to frontal electrodes in the theta band (left panel) and beta and gamma bands (rightpanel) for the analyzed population during the observation of a commercial (row a) and a Public Service Announcement (row b) againstthe smoking. On the x-axis, there is the time duration of the spot; on the y-axis there is the z-score value of the GFP considered. Valuesgreater than 2 mean a difference in power spectral activity during the PSA when compared to those of the documentary that are statisticallysignificant at 5%. The red line is the average z-score values of the GFP in blocks of five seconds of spot.
observing and analyzing the temporal trend of the corticalactivities thanks to a high-temporal and spatial resolutionallowing us to distinguish changes of activation of ROIscorresponding to different cortical areas. The reconstructionof the cortical activity by means of the high resolution EEGtechnique and by combining the above statistic treatment ofour data allowed us to track subjects’ brain activity during
visualization of the commercial. In such a way for each filmsegment of the clip it was possible to distinguish cortical areasthat were differently activated when compared to those ofthe observation of the documentary. This could be useful inthe evaluation of the cortical responses to particular typesof visual solicitations, performed by film, commercial clips,or faces of politicians, which at the moment is a field largely

6 Computational Intelligence and Neuroscience
−2
0
2
4
6
8
10
z-score4–7 Hz 16–40 Hz
Cortical power spectra statistical differences between PSAand documentary observation
Figure 4: Brain activity related to the observation of the PSA whencompared to that of the documentary. The brain is viewed froma frontal view. The color map is relative to the z-score values ofthe power spectra EEG activity during the PSA when comparedto the documentary. Z-score values different from the blue meanssignificant statistically activity. It is possible to note that in thetheta frequency band, the right prefrontal cortex is activated whilein the beta and gamma frequency bands the activation is rathersymmetrical.
unexplored by the neuroscience. In fact, the big attentionpaid to political scenes originates from the experimentalresult that decisions based on “superficial” observation couldpredict the elections’ results, linearly correlated with thecandidate’s margin of victory with a precision of 68.8% [28].The consequence of this observation is that the recognitionand liking of the politician’s face is a principal factor for thechoice of the citizen more than “rational” considerations.Such phenomenon has been also confirmed by subsequentstudies published in international scientific literature [29]and newspapers [30] suggesting that the scenic presence byitself mostly influences the decision of voting besides thefact that men and women can elicit a different kind ofengagement according to the figure they saw. These resultsare surprising if we think about the USA midterm electionsof 2006 when candidates and their supporting groups spentabout 1 billion dollars in advertizements in order to informelectors about their political affiliations, qualities, and ideas.After predicting the electoral results [28, 29], the subsequentpass of this research has been to understand whether in thisimmediate decision the positive effects were prevailing (i.e.,face pleasantness as well as his/her adaptation to particulara priori requirements demanded by the candidate) whencompared to the negative ones. This was then studied inliterature [29] and its result was that the effect of anemotionally “negative” judgement towards a candidate isan prevailing reason in his/her defeat (even in a contestof simulated elections) with respect to the fact of simplybeing “less attractive” then the other candidate. Thesedata could also suggest that the cerebral activity, generatedfrom an emotional state of “rejection” of the candidate,is completely different from the one generated from anemotional state of acceptation or satisfaction of the sameone. Another interesting aspect is that results obtained bymeans of analyses performed on behavioral data reveal howdecision makers sometimes have already made up theirminds at an unconscious level, even when they consciously
indicate that they have not yet decided. From the traditionalpolitical research, that is, performed without using cerebralmeasurements techniques, it was already known that thenegative vote plays also an important role in the final votedecision. In this contest, having a measure of the emotionalstate of people observing a candidate’s face assumes alwaysmore importance.
5. Conclusions
We employed advanced techniques for the tracking ofbrain activity during the observation of videos of differentemotional natures: commercial, PSAs, and even politicalspeech. The techniques here employed encompass the use ofdescriptors of the frequency contents of the EEG signals upto the statistical mapping of the cortical activity, during theobservation of the proposed clips [31–36]. In all the casespresented here, it is possible to localize rather precisely thecortical areas involved in the processing of the particularvideo material proposed. The application of these techniquesto the PSAs and to the political speech is still in its infancy,but in a near future could bring a neuroscience perspectivein an already mature communication field.
References
[1] P. L. Nunez, Electric Fields of the Brain: The Neurophysics ofEEG, Oxford University Press, New York, NY, USA, 1981.
[2] P. L. Nunez, Neocortical Dynamics and Human EEG Rhythms,Oxford University Press, New York, NY, USA, 1995.
[3] F. De Vico Fallani, L. Astolfi, F. Cincotti, et al., “Corticalnetwork topology during successful memory encoding ina lifelike experiment,” in Proceedings of the 30th AnnualInternational Conference of the IEEE Engineering in Medicineand Biology Society (EMBS ’08), pp. 4007–4010, 2008.
[4] T. Ambler, S. Braeutigam, J. Stins, S. P. R. Rose, and S.Swithenby, “Salience and choice: neural correlates of shoppingdecisions,” Psychology and Marketing, vol. 21, no. 4, pp. 247–261, 2004.
[5] S. Braeutigam, S. P. R. Rose, S. J. Swithenby, and T. Ambler,“The distributed neuronal systems supporting choice-makingin real-life situations: differences between men and womenwhen choosing groceries detected using magnetoencephalog-raphy,” European Journal of Neuroscience, vol. 20, no. 1, pp.293–302, 2004.
[6] J. Cappo, The Future of Advertising: New Media, New Clients,New Consumers in the Post-Television Age, McGraw-Hill, NewYork, NY, USA, 2005.
[7] H. E. Krugman, “Brain wave measures of media involvement,”Journal of Advertising Research, vol. 11, pp. 3–10, 1971.
[8] A. A. Ioannides, L. Liu, D. Theofilou, et al., “Real timeprocessing of affective and cognitive stimuli in the humanbrain extracted from MEG signals,” Brain Topography, vol. 13,no. 1, pp. 11–19, 2000.
[9] T. Ambler and T. Burne, “The impact of affect on memory ofadvertising,” Journal of Advertising Research, vol. 39, no. 2, pp.25–34, 1999.
[10] M. Rotschild and J. Hyun, “Predicting memory for compo-nents of TV commercials from EEC,” Journal of ConsumerResearch, pp. 72–78, 1989.

Computational Intelligence and Neuroscience 7
[11] J. R. Rossiter, R. B. Silberstein, P. G. Harris, and G. A. Nield,“Brain-imaging detection of visual scene encoding in long-term memory for TV commercials,” Journal of AdvertisingResearch, vol. 41, no. 2, pp. 13–21, 2001.
[12] C. Young, “Brain waves, picture sorts�, and brandingmoments,” Journal of Advertising Research, vol. 42, no. 4, pp.42–53, 2002.
[13] Sands Research, http://sandsresearch.com/.[14] Emory University, Centre For Neuropolicy, http://www
.neuropolicy.emory.edu/.[15] L. Biener, J. E. Harris, and W. Hamilton, “Impact of the
Massachusetts tobacco control programme: Population basedtrend analysis,” British Medical Journal, vol. 321, pp. 351–354,2000.
[16] S. Emery, M. Wakefield, Y. Terry-McElrath, G. Szczypka,P. M. O’Malley, L. D. Johnston, et al., “Televised state-sponsored anti-tobacco advertising and youth smoking beliefsand behavior in the United States, 1999–2000,” ArchivesPediatric Adolescent Medicine, vol. 159, pp. 639–645, 2005.
[17] M. Wakefield, B. Flay, M. Nichter, and G. Giovino, “Effects ofanti-smoking advertising on youth smoking: a review,” Journalof Health Communication, vol. 8, pp. 229–247, 2003.
[18] L. Astolfi, F. De Vico Fallani, S. Salinari, et al., “Brain activityrelated to the memorization of TV commercials,” InternationalJournal of Bioelectromegnetism, vol. 10, no. 3, pp. 1–10, 2008.
[19] J. Le and A. Gevins, “Method to reduce blur distortion fromEEG’s using a realistic head model,” IEEE Transactions onBiomedical Engineering, vol. 40, no. 6, pp. 517–528, 1993.
[20] A. Gevins, J. Le, N. K. Martin, P. Brickett, J. Desmond, and B.Reutter, “High resolution EEG: 124-channel recording, spatialdeblurring and MRI integration methods,” Electroencephalog-raphy and Clinical Neurophysiology, vol. 90, no. 5, pp. 337–358,1994.
[21] F. Babiloni, C. Babiloni, F. Carducci, et al., “High resolutionEEG: a new model-dependent spatial deblurring methodusing a realistically-shaped MR-constructed subject’s headmodel,” Electroencephalography and Clinical Neurophysiology,vol. 102, no. 2, pp. 69–80, 1997.
[22] F. Babiloni, C. Babiloni, L. Locche, F. Cincotti, P. M. Rossini,and F. Carducci, “High-resolution electro-encephalogram:source estimates of Laplacian-transformed somatosensory-evoked potentials using a realistic subject head model con-structed from magnetic resonance images,” Medical andBiological Engineering and Computing, vol. 38, no. 5, pp. 512–519, 2000.
[23] A. M. Dale, A. K. Liu, B. R. Fischl, et al., “Dynamic statisticalparametric mapping: combining fMRI and MEG for high-resolution imaging of cortical activity,” Neuron, vol. 26, no. 1,pp. 55–67, 2000.
[24] R. Grave de Peralta Menendez and S. L. Gonzalez Andino,“Distributed source models: standard solutions and newdevelopments,” in Analysis of Neurophysiological Brain Func-tioning, C. Uhl, Ed., pp. 176–201, Springer, New York, NY,USA, 1999.
[25] L. Astolfi, F. Cincotti, D. Mattia, et al., “Comparison ofdifferent cortical connectivity estimators for high-resolutionEEG recordings,” Human Brain Mapping, vol. 28, no. 2, pp.143–157, 2006.
[26] F. Babiloni, F. Cincotti, C. Babiloni, et al., “Estimation ofthe cortical functional connectivity with the multimodalintegration of high-resolution EEG and fMRI data by directedtransfer function,” NeuroImage, vol. 24, no. 1, pp. 118–131,2005.
[27] W. Klimesch, M. Doppelmayr, and S. Hanslmayr, “Upperalpha ERD and absolute power: their meaning for memoryperformance,” Progress in Brain Research, vol. 159, pp. 151–165, 2006.
[28] A. Todorov, A. N. Mandisodza, A. Goren, and C. C. Hall,“Inferences of competence from faces predict election out-comes,” Science, vol. 308, pp. 1623–1626, 2005.
[29] C. C. Ballew II and A. Todorov, “Predicting political electionsfrom rapid and unreflective face judgments,” Proceedings of theNational Academy of Sciences of the United States of America,vol. 104, no. 46, pp. 17948–17953, 2007.
[30] M. Iacoboni, J. Freedman, J. Kaplan, et al., “This is yourbrain on politics,” The New York Times, November 2007,http://www.nytimes.com/2007/11/11/opinion/11freedman.html?pagewanted=1& r=2&sq=marco%20iacoboni&st=cse&scp=8.
[31] F. De Vico Fallani, L. Astolfi, F. Cincotti, et al., “Corticalfunctional connectivity networks in normal and spinal cordinjured patients: evaluation by graph analysis,” Human BrainMapping, vol. 28, no. 12, pp. 1334–1346, 2007.
[32] L. Astolfi, F. De Vico Fallani, F. Cincotti, et al., “Imagingfunctional brain connectivity patterns from high-resolutionEEG and fMRI via graph theory,” Psychophysiology, vol. 44, no.6, pp. 880–893, 2007.
[33] L. Astolfi, F. Cincotti, D. Mattia, et al., “Tracking the time-varying cortical connectivity patterns by adaptive multivariateestimators,” IEEE Transactions on Biomedical Engineering, vol.55, no. 3, pp. 902–913, 2008.
[34] M. Oliveri, C. Babiloni, M. M. Filippi, et al., “Influence of thesupplementary motor area on primary motor cortex excitabil-ity during movements triggered by neutral or emotionallyunpleasant visual cues,” Experimental Brain Research, vol. 149,no. 2, pp. 214–221, 2003.
[35] C. Babiloni, F. Babiloni, F. Carducci, et al., “Mapping of earlyand late human somatosensory evoked brain potentials tophasic galvanic painful stimulation,” Human Brain Mapping,vol. 12, no. 3, pp. 168–179, 2001.
[36] A. Urbano, C. Babiloni, P. Onorati, and F. Babiloni, “Dynamicfunctional coupling of high resolution EEG potentials relatedto unilateral internally triggered one-digit movements,” Elec-troencephalography and Clinical Neurophysiology, vol. 106, no.6, pp. 477–487, 1998.

Submit your manuscripts athttp://www.hindawi.com
Computer Games Technology
International Journal of
Hindawi Publishing Corporationhttp://www.hindawi.com Volume 2014
Hindawi Publishing Corporationhttp://www.hindawi.com Volume 2014
Distributed Sensor Networks
International Journal of
Advances in
FuzzySystems
Hindawi Publishing Corporationhttp://www.hindawi.com
Volume 2014
International Journal of
ReconfigurableComputing
Hindawi Publishing Corporation http://www.hindawi.com Volume 2014
Hindawi Publishing Corporationhttp://www.hindawi.com Volume 2014
Applied Computational Intelligence and Soft Computing
Advances in
Artificial Intelligence
Hindawi Publishing Corporationhttp://www.hindawi.com Volume 2014
Advances inSoftware EngineeringHindawi Publishing Corporationhttp://www.hindawi.com Volume 2014
Hindawi Publishing Corporationhttp://www.hindawi.com Volume 2014
Electrical and Computer Engineering
Journal of
Journal of
Computer Networks and Communications
Hindawi Publishing Corporationhttp://www.hindawi.com Volume 2014
Hindawi Publishing Corporation
http://www.hindawi.com Volume 2014
Advances in
Multimedia
International Journal of
Biomedical Imaging
Hindawi Publishing Corporationhttp://www.hindawi.com Volume 2014
ArtificialNeural Systems
Advances in
Hindawi Publishing Corporationhttp://www.hindawi.com Volume 2014
RoboticsJournal of
Hindawi Publishing Corporationhttp://www.hindawi.com Volume 2014
ComputationalIntelligence &Neuroscience
Hindawi Publishing Corporationhttp://www.hindawi.com Volume 2014
Industrial EngineeringJournal of
Hindawi Publishing Corporationhttp://www.hindawi.com Volume 2014
Modelling & Simulation in EngineeringHindawi Publishing Corporation http://www.hindawi.com Volume 2014
The Scientific World JournalHindawi Publishing Corporation http://www.hindawi.com Volume 2014
Hindawi Publishing Corporationhttp://www.hindawi.com Volume 2014
Human-ComputerInteraction
Advances in
Computer EngineeringAdvances in
Hindawi Publishing Corporationhttp://www.hindawi.com Volume 2014