Editorial Assistant - UNIABUJA Open Education Resources ...
310
JOURNAL OF APPLIED AGRICULTURAL RESEAR Editor Editorial Assistt Advisory Board Prof. 0. Gazal Prof. W. S. Alhassan Prof. (Mrs.) P. Olorunju Prof. Avigdor Cahaner Prof. E. Malau-Aduli Dr E. Fallou Gueye Dr. Dan Bradley Prof. S. V. A Uzochukwu Prof. P. Kwaga Prof. E. B. Sonaiya About the Joual Dr. A. M. Ataja Dr. (Mrs.) de Frank St. Cloud State Universi, Minnesota, USA Program for Biosafety Systems, IFPRI/F ARA, Ghana University of Venda, South Africa The Hebrew Universi of Jerusalem, Israel University of Tasmania, Australia FAO, Regional Centre for Western and Central Africa, Ecr AD, Bamako, Mali Trinity College, University of Dublin (TCD) University of Agriculture, Abeokuta, Nigeria Ahmadu Bello University, Zaria, Nigeria Obafemi Awolowo University, Ile-lfe, Nigeria The Journal of Applied Agricultural Research GAAR) is published by the Agricultural Research Council of Nigeria (ARCN), Federal Ministry of Agriculture, Abuja, Nigeria. It devoted to the publication of results of agricultural research relevant to national development. It is to document, publish and disseminate emerging knowledge of agricultural research. The Editor is an internationally renowned Research Scienst with several years' experience in the Nigerian Agricultural Research System and the Nigerian University System. Members of the Editorial Board are carefully selected to represent the various disciplines and major specializations in Agricultural Sciences. Submission of Manuscript The Journal welcomes origal papers of research, reviews and reporʦ the various branches of agriculture with parcular reference to information relevant to agricultural development, food security and innovative technologies capable of drivg naonal development forward. Granted the global nature of issues agriculture and development, articles are welcome from l coers of the world. Manuscripʦ submitted for publication should be results of original research, reporʦ and reviews not previously published or submitted elsewhere for publication. Parallel submissions are not allowed. Authors should submit a copy of their manuscript on-line by attachment to the Editor at the following email address: editoraar-ng.org. For information on guides to authors, please visit the joual website at w .jaar-ng.org for details.
-
Upload
khangminh22 -
Category
Documents
-
view
2 -
download
0
Transcript of Editorial Assistant - UNIABUJA Open Education Resources ...

JOURNAL OF APPLIED AGRICULTURAL RESEARG-1
Editor
Editorial Assistant
Advisory Board
Prof. 0. Gazal
Prof. W. S. Alhassan
Prof. (Mrs.) P. Olorunju
Prof. A vigdor Cahaner
Prof. E. Malau-Aduli
Dr E. Fallou Gueye
Dr. Dan Bradley
Prof. S. V. A Uzochukwu
Prof. P. Kwaga
Prof. E. B. Sonaiya
About the Journal
Dr. A. M. Ataja
Dr. (Mrs.) Sade Frank-Akale
St. Cloud State University, Minnesota, USA
Program for Biosafety Systems, IFPRI/F ARA, Ghana
University of Venda, South Africa
The Hebrew University of Jerusalem, Israel
University of Tasmania, Australia
FAO, Regional Centre for Western and Central Africa, Ecr AD, Bamako, Mali
Trinity College, University of Dublin (TCD)
University of Agriculture, Abeokuta, Nigeria
Ahmadu Bello University, Zaria, Nigeria
Obafemi Awolowo University, Ile-lfe, Nigeria
The Journal of Applied Agricultural Research GAAR) is published by the Agricultural Research Council of Nigeria (ARCN), Federal Ministry of Agriculture, Abuja, Nigeria. It is devoted to the publication of results of agricultural research relevant to national development. It is to document, publish and disseminate emerging knowledge of agricultural research. The Editor is an internationally renowned Research Scientist with several years' experience in the Nigerian Agricultural Research System and the Nigerian University System. Members of the Editorial Board are carefully selected to represent the various disciplines and major specializations in Agricultural Sciences.
Submission of Manuscript
The Journal welcomes original papers of research, reviews and reports in the various branches of agriculture with particular reference to information relevant to agricultural development, food security and innovative technologies capable of driving national development forward. Granted the global nature of issues in agriculture and development, articles are welcome from all corners of the world. Manuscripts submitted for publication should be results of original research, reports and reviews not previously published or submitted elsewhere for publication. Parallel submissions are not allowed. Authors should submit a copy of their manuscript on-line by attachment to the Editor at the following email address: [email protected]. For information on guides to authors, please visit the journal website at www.jaar-ng.org for details.

' . ..
.. !'! .. � .
.. ,�
... � •
,_
. . -
. ..
'
JOURNAL OF
APPLIED AGRICULTURAL RESEARCH (JAAR)
Published by
AGRICULTURAL RESEARCH COUNCIL OF NIGERIA (ARCN)
2013
VOLUMES NUMBER2
li
JOURNAL OF
APPLIED AGRICULTURAL RESEARCH
ISSN 2006 - 750X
Typeset and formatted by
JAAR SECRETARIAT Agricultural Research Council of Nigeria
Agricultural Research House Plot 223D Cadastral Zone 86, Mabushi,
P.M. B. 5026, Wuse, Abuja, Nigeria
Published by
AGRICULTURAL RESEARCH COUNCIL OF NIGERIA (ARCN)
Printed by
FENAN DIGITAL PRINTS LTD. 17 Aba Close, Area 8,
Garki, Abuja
iii

JOURNAL OF APPLIED AGRICULTURAL RESEARCH
Contents Volume 5, Number 2, 2013 Page
Agricultural Economics and Extension 1
Accuracy of Extension Professionals' and Farmers' Perceptions of Privatization and Commercialization of Agricultural Extension Services
Ajieh, P. C. 3
Microcredit and Food Crops Production in Selected Local Government Areas of Ogun State: A Restricted Normalised Profit Function Analysis
Tijani, I. A., Rahji, M. A. Y., Monzoh, 5., Dipeolu, A. 0. and I. A. Ayinde 11
Analysis of Effective Prices of Kosai in Nigeria and Niger, West Africa Mohammed, A. B., Musa, S. A. and Z. Abdu 21
Motivational Factors Affecting Level of Job Satisfaction among Village Extension Workers of Delta State Agricultural Development Programme, Nigeria
�� A.U n
Resource Use Efficiency of Cassava-Based Farmers in Ogun and Oyo States, Nigeria
Obayelu , A. E., Afolami, C. A. and M. U. Agbonlahor 39
Preliminary Study of Market Potentials of Edible Frogs in Nigeria Nwabeze, G. 0. and A. N. Okaeme 55
[mpact of Anambra State Tractor and Equipment 'Hiring Scheme on Mechanization of Rice Production in Anambra State Nigeria: An Appraisal
Umeghalu, I. C. E., Okwonkwo, J. C., Ngini, J. 0. and E. C. Chukwuma 61
Factors Associated with Job Performance of Extension Agents in Kwara State, Nigeria
Akangbe, J. A., Omotesho, K. F. and 0. K. Asaju 73
A Comparative Analysis of Costs and Returns for Small Ruminants Marketing in Katsina State
!sa, H. K. , Mohammed, A. B . , Musa, S. A. and Z. Abdu 81
Farmers' Perception of Problems Influencing Maize Storage in Ahuja, Nigeria Ajah, J. and J. N. Nmadu 89
Extension Agents' Assessment of the Challenges of Agricultural Extension Practice for Nomadic Farmers in Northern Nigeria
Bidoli, T. D., Kezi, D. M., Aula, S. ]., !sa, A. G. and B. M. Shehu 95
Perception of Goat Milk Production and Consumption in Rural, Peri-Urban and Urban Areas of Oyo State, Nigeria
Ibhaze, G. A., Olorunnisomo, 0. A. and A. A. Ladele 103
iv
JOURNAL OF APPLIE!J AGRICULTURAL RESEARCH
Contents Volume 5, Number 2, 2013
Agricultural Engineering
Analysis of Pneumatic Cleaning of Cowpea Aderinlewo, A. A. and A. 0. Raji
An Appraisal of a Tillage Equipment for Small Holder Farming in South West of Nigeria
Adisa, A. F., Vaughan, I. 0., Aderinlewo, A. A., and P. 0. 0. Dada
Animal Production
H aematology and Serum-Chemistry of Growing Pullets and Layers Fed Raw and Treated Groundnut Husk Meal Based Diets
Page
109
111
117
125
Bello, K. 0. and D. Enwbetine 127
Comparative Egg Quality Traits of Four Poultry Species Orunmuyi, M., Okezie, 0. I., Bmva, G. 5., Ojo, 0. A. and T. S. Olugbemi 141
Crop Production and Soil Science 147
Effects of Different Plant Population Densities on Agronomic Performance and Quality Profile of High-Lysine Hybrids Maize (Zea mays) in Krasnodar Region of Russia
Sakariymvo, 0. 5., Rodachiskaya, L. V., Yakavlev, E. B. and A. A. Oyekanmi 149
Effect of Native Cassava Starch H ydrogel Amended Soil on Maize (Zea mays L.) Performance
Ekebafe, L. 0., Ogbeiftm, D. E. and F. E. Okieimen 161
Extraction and Characterization of Chemical Compounds in Coelaenomen odera elaeidis Mlk. (Coleoptera: Chrysomelidae)
Zhang, A., Aisagbonhi, C. I., Anikwe, ]., Obibuzor, f. U., Aneni, T. I. and C. 0. Ogbebor 169
Performance of Sweet Orange (Citrus Sinensis (L .) Osbeck) Varieties in fbadan, Derived Savannah Zone of South-Western Nigeria
Olaniyan, A. A., Babalola, S. 0., Amih, A. C. and A. ]. Kolade 175
Inter Cropping Sugarcane (Saccharium offtcinarum L.) with Annual Food Crops at Badeggi Southern Guinea Savannah of Nigeria
Gana, A. K. 185
Comparative Analysis of Agronomic Performance and Seed Morphometric Traits of Maize (Zea mays L) Seed From Varied Sources
Adetumbi, J. A., Daniel, I.._ 0. and S. A. Olakojo 193
v
JOURNAL OF APPLIED AGRICULTURAL RESEARCH
Contents Volume 5, Number 2, 2013
Evaluation of the Heavy Metals Remediation Potential of Cashew (Anacardium occidentale) on Edta-Applied Acidic ru1d Basic Soils
Page
Azeez, f. 0., Yusuf, 0. M., Busari, M.A. and G. T. Salaudeen 205
Evaluation of Herbicides on Weed Control, Performance and Profitability of Onion (Allium cepa) in the Forest Zone of Nigeria
Ibrahim, U., Oluwatosin, 0. f., Ayinde, B. T. and B. A. Mahmoud 217
Effects of Poultry Manure Rates and Population Density on Productivity of Fluted Pumpkin (Telfaiaria occidentalis Hook F.) on a Sandy Soil
Shiyam, f. 0. 223
Variations in Chemical Properties of Soils from Shale Parent Material in South Western Nigeria
Obi, J. C., Akin bola, G. E. and P. I. Ogban 229
Vegetative and Reproductive Growth of Uplru1d Nerica Rice (On;za sativa) Varieties as Affected by Types ru1d Rates of Application of Organic Manure
Oyekanmi, A. A., Bakare, 0. 0., Okeleye, K. A., Adejuyigbe, C. 0., Shittu, T. A., Sakariymvo, 0. S., Aderibigbe, S. G., Okonji, C.]., and D. A. C. Aki11tobi 241
Comparative Evaluation of Response of Lowland NERICA® Rice and
Improved Oriza sativa Rice to Nitrogen ru1d Phosphorus Rates in Moist
Savanna of West Africa Aderibigbe, S. G"' Oko11ji, C.]., 0/celeyr., K. A., Oikeh, S . 0., Oyekanmi, A A., Bodunde, G., Ajayi, 0. and F. Nwilene 251
Fungi Pathogens and Total Aflatoxin Contents in Sesame (Sesamwn indicum L.) Seeds Marketed in Abuja, Nigeria
Anjorin, S. T., Chijioke, C. G. and S. C. Ugoh 263
Response of Vegetable Cowpea (Vigna unguiculnta (L.) Walp) to Planting Density and Variety in a Humid Zone of Southeastern Nigeria
Muoneke, C. 0., Ndukwe, 0. 0., Akpan, A. U. and P. I. Okocha 273
Productivity of Cucumber in Semi-Arid Savannah of Nigeria as Affected by Organic Fertilizer
Dantata, I.]. and F. E. Babatunde 283
Review Paper 289
Agricultural Innovation Networks: Forms and Appropriate Governance
Ulmejiofo, R. U. 291
vi
AGRICULTURAL ECONOMICS
AND
EXTENSION
1


Journal of Applied Agricultw-al Research 2013, 5(2): 1-10 ISSN 2006-7'iOX ©Agricultural Research Council of Nigeria, 2013
ACCURACY OF EXTENSION PROFESSIONALS' AND FARMERS' PERCEPTIONS OF PRIVATIZATION AND COMMERCIAUZATION
OF AGRICULTURAL EXTENSION SERVICES
Ajieh, P. C. Department of Agricultural Economics and Extension, F aculty of Agriculture
Delta State University, Asaba Campus, Asaba, Nigeria *[email protected], + 2347065575047
ABSTRACT
This study examined the accuracy between extension professionals and farmers regarding their perceptions of privatization and commercialization (P and C) of agricultural extension services. The study was carried out in Delta State, Nigeria and it had a sample size of 224 respondents comprising 134 extension professionals of the Delta State Agricultural Development Programme (DTADP) and 90 farmers thal were randomly selected across the state. Data for the study were collected from the respondents through the use of validated questionnaire and interview schedule. The questionnaire was used for the extension professionals, while the interview schedule was used for the farmers. Spearman's rank order correlation coefficient was used to determine the accuracy in perceptions of respondents. Results of the study show that extension professionals estimated farmers' perception with a high degree of accw-acy (rho = 0. 80), while farmers estimated extension professionals' perception with low accuracy (rho = 0.22). The inability of farmers to accurately estimate extension professionals' perception could be due to differences in their background and knowledge of issues relating to privatization and commercialization (P and C) of agricultural extension services. The study recommends that farmers' knowledge of issues relating to P and C should be enhanced through seminars and workshops organized by the appropriate extension agency.
Keywords: accuracy, perception, privatization, commercialization, extension professionals, farmers, agriculturaJ extension services
INTRODUCTION
Relational communication models provide a
framework for identifying the relationship
between individuals or groups in a
communication process. The models
acknowledge that communication is a
delicate process evolving from the joining of
two participants into a relationship that is more than the sum of its parts. They clearly
illustrate the central role of message
interpretation and reciprocal perceptions
between parties in a communication process.
3
A relationship in interpersonal
communication has been defined as a set of
expectations which two parties have for each
other's behaviour and feelings. It is the
connection that exists when: a) the
interactants are aware of each other and take
each other into account; b) there is some
exchange of influence; and c) there is some
agreement about what the nature of
relationship is and what the appropriate
behaviours are, given the nature of the
relationship (Berko et al., 1997).

Ajieh, 2013
The best known example of relational communication is the co-orientation model (Littlejohn, 1992). According to Gruning and Hunt (1984), the co-orientation model identifies three critical relationships between participants in a communication process. These are accuracy, congruency and agreement. Figure 1 shows that accuracy relationship can be estimated between person 'A' and 'B' by comparing their estimates of one another's perception with their actual perceptions, while congruency relationship can be determined by comparing each person's perception with his/her estimate of the other person's perception. Agreement relationship, on the other hand, is determined by comparing the similarity in the perceptions of persons 'A'
and 'B'.
Co-orientational studies have been reported among researchers, extension workers and farmers regarding attributes of plant cultivars (Groot, 1970; Dolly, 1997), community consensus building (Meiller, 1975; Broom, 1977), listening behaviour states (Buchili and Pearce, 1974) and shared behaviour among rational partners (Gantz et al., 1995). The co-orientation model has also been used to compare the views of
Person A
community leaders and local residents regarding Hudson River ecosystem restoration in New York State (Connelly and Knuth, 2002).
This study examined the accuracy between extension professionals and farmers regarding their perceptions of privatization and commercialization (P and C) of agricultural extension services. Privatization refers to the disengagement of government from public enterprises. It is often associated with the sale of state assets or shares in
public enterprises. The sale may involve all or some of the equity interests of an enterprise. However, it also involves the introduction of private capital management or management expertise into a public sector activity. Thus, privatization of agricultural extension services implies government disengagement so as to allow private operators to participate in the provision of agricultural extension services.
Commercialization involves the reorganization of government-owned enterprises by making them self-sustaining and profit oriented. It does not entail divestment or the introduction of private management into public enterprises. The
Person B
A's Perception about X A- B understanding B's Perception about X
l � Agreement / l
Congruency A Accuracy Congruency B ...------'-l_A / �B .---.....______,l
A's estimate of B's perception
Figure 1: Relationships in co-orientation Source: Chaffee and McLeod (1973)
4
B's estimate of A's Perception
Perception of Privatization and Commercialization of Extension Services
basic concept of commercialization of
agricultural extension services (CAES) is that
farmers have to pay for the services which
they receive. This implies that agricultural
extension would be run as a profit - oriented
enterprise. Whether farmers pay totally or
partially, it depends on the extension
approach. Farmers may pay full amount or
part of the fee. Government or other funding
agency could subsidize it partially. Extension
providers can be a government or semi
government organisation, private company,
non-governmental organisation, and
cooperative or farmers' organisation. The
important point is that the farmer has to bear
at least some percentage of the total cost of
the extension service and extension service
providers are paid for their services.
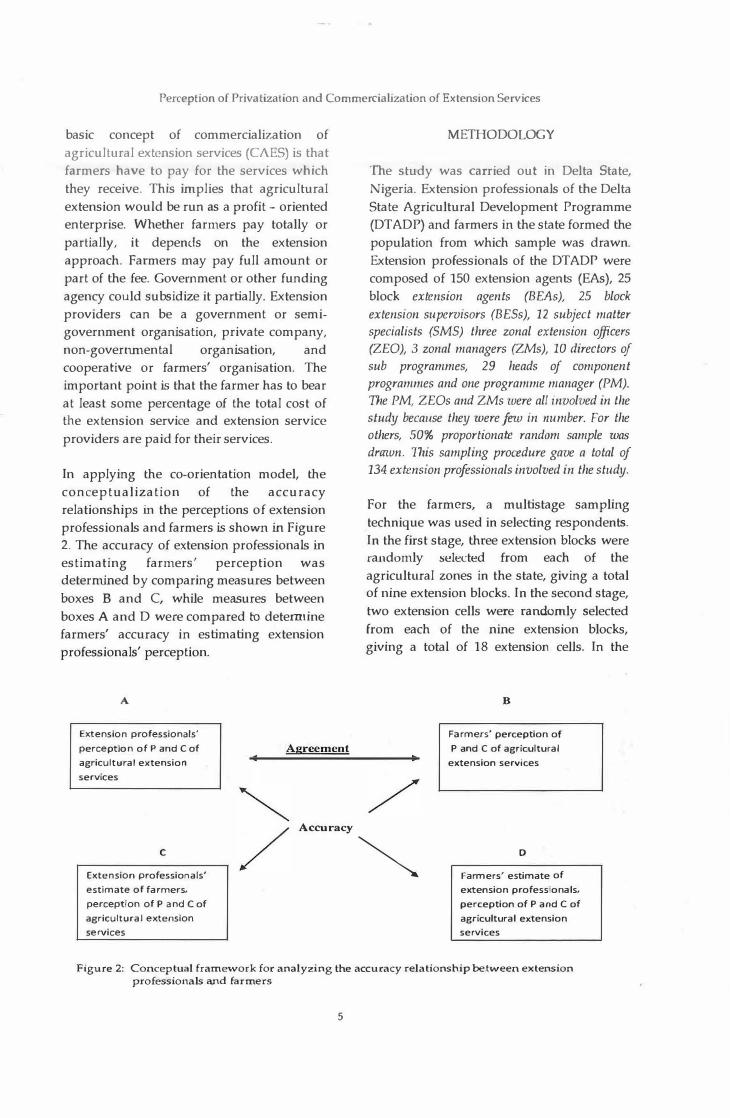
In applying the co-orientation model, the
conceptualization of the accuracy
relationships in the perceptions of extension
professionals and farmers is shown in Figure
2. The accuracy of extension professionals in
estimating farmers' perception was
determined by comparing measures between
boxes B and C, while measures between
boxes A and D were compared to detemtine
farmers' accuracy in estimating extension
professionals' perception.
A
Extension professionals' perception of P and C of
agricultural extension
services
c Extension professionals'
estimate of f armers'
perception of P and C of
agricultural extension services
Agreement
Accuracy
METHODOLOGY
The study was carried out in Delta State,
Nigeria. Extension professionals of the Delta
State Agricultural Development Programme
(DTADP) and farmers in the state formed the
population from which sample was drawn.
Extension professionals of the DTADP were
composed of 150 extension agents (EAs), 25
block extension agents (BEAs), 25 block
extension supervisors (BESs), 12 subject matter
specialists (SMS) three zonal extension officers
(ZED), 3 zonal managers (ZMs), 10 directors of
sub programmes, 29 heads of component
programmes and one programme manager (PM).
The PM, ZEDs and ZMs were all involved in the
study because they were few in number. For the
others, 50% proportionate random sample was
drawn. This sampling procedure gave a total of
134 extension professionals involved in the study.
For the farmers, a multistage sampling
technique was used in selecting respondents.
In the first stage, three extension blocks were randomly sdt:!cted from each of the
agricultural zones in the state, giving a total of nine extension blocks. In the second stage,
two extension cells were randomly selected
from each of the nine extension blocks,
giving a total of 18 extension cells. In the
�
B
Farmers' perception of
P and C of agricultural
extension services
D Farmers' estimate of
extension professionals'
perception of P and C of
agricultural extension
services
Figure 2: Conceptual framework f or analyzing the accuracy relationship between extension professionals and farmers
5
Ajieh, 2013
third stage, five farmers in contact with
extension were randomly selected from the
list provided by the extension agents m each
of selected extension cells. This gave a total
of 90 farmers that were sampled. In all, 224 respondents compnsmg 134 extension
professionals and 90 farmers were used for
the study.
A set of questionnaire and structured
interview schedule were used for data
collection. The questionnaire was used for
extension professionals, while the interview
schedule was used for the farmers because of
their low educational status. Content
validation of the research instruments were
done by a team of experts in agricultural
extension system. The . instruments were
pilot tested before administration to test for
reliability. Trained assistants, in addition to
the researcher, collected data for the study.
To determine accuracy in perceptions of
extension professionals and farmers, 17 positive and negative statements regarding
the features of P and C of agricultural
extension services were framed through a
review of literature and interviews with
experts. Extension professionals and farmers
were asked to indicate their level of
agreement with the statements. They were
also asked to estimate one another's
perception. A 4 - point Likert type scale with
values of strongly agree = 4; agree = 3; disagree = 2; and strongly disagree = 1 was
used to determine respondents' level of
agreement to the statements. Means of their
responses were then used for analysis.
Spearman's rank order correlation coefficient
was computed for: (i) Accuracy of extension
professionals' estimate of farmers'
perception compared with farmers' own
perception and (ii) Accuracy of farmers'
estimate of extension professionals'
perception compared with extension
professionals' own perception.
6
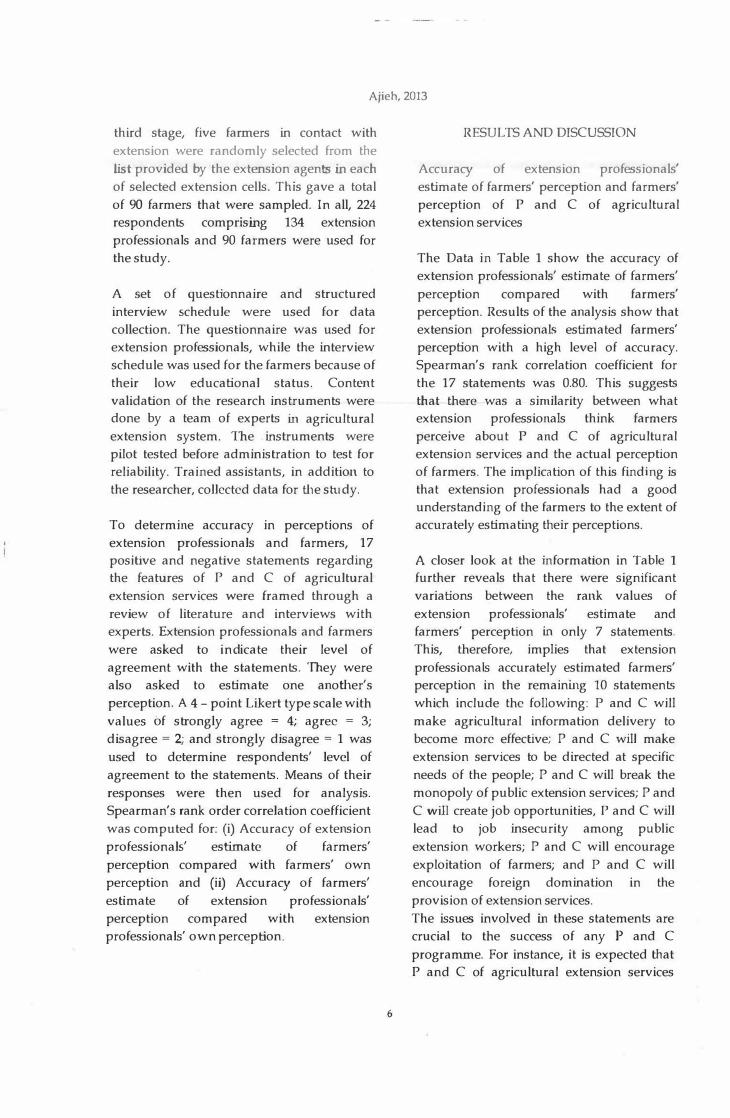
RESULTS AND DISCUSSION
Accuracy of extension professionals'
estimate of farmers' perception and farmers'
perception of P and C of agricultural
extension services
The Data in Table 1 show the accuracy of
extension professionals' estimate of farmers'
perception compared with farmers'
perception. Results of the analysis show that
extension professionalc; estimated farmers'
perception with a high level of accuracy.
Spearman's rank correlation coefficient for
the 17 statements was 0.80. This suggests
that there was a similarity between what
extension professionals think fanners
perceive about P and C of agricultural
extension services and the actual perception
of farmers. The implication of this finding is
that extension professionals had a good
understanding of the farmers to the extent of
accurately estimating their perceptions.
A closer look at the information in Table 1 further reveals that there were significant
variations between the rank values of
extension professionals' estimate and
farmers' perception in only 7 statements.
This, therefore, implies that extension
professionals accurately estimated farmers'
perception in the remaining 10 statements
which include the following: P and C will
make agricultural information delivery to
become more effective; P and C will make
extension services to be directed at specific
needs of the people; P and C will break the
monopoly of public extension services; P and
C will create job opportunities, P and C will
lead to job insecurity among public
extension workers; P and C will encourage
exploitation of farmers; and P and C will
encourage foreign domination in the
provision of extension services.
The issues involved in these statements are
crucial to the success of any P and C
programme. For instance, it is expected that
P and C of agricultural extension services

Perception of Privatization and Commercialization of Extension Services
Table 1: Spearman's rank correlation showing the accuracy of extension professionals' estimate
of farmers' perception and farmers' perception of P and C of agricultural extension services
Statements Extension Rank Farmer's Rank professionals' perception
estimate of farmers'
Privatization and commercialization will 3.16 1 3.04 9 make il possible for more farmers to be reached Privatization and commercialization will 3.16 1 3.14 5 provide opportunity for neglected areas of agric production to be attended to Privatization and commercialization will 3.15 3 3.33 2 make agricultural information delivery to become more effective Privatization and commercialization will 3.14 4 3.44 1 encourage competition among extension service providers Privatization and commercialization will 3.14 4 3.01 10 improve linkages between research and extension Privatization and commercialization will 3.13 6 3.19 4 make extension services to be directed at specific needs of the people Privatization and commercialization will 3.07 7 3.28 3 increase priority areas of extension coverage Privatization and commercialization will 3.01 8 3.12 7 break the monopoly of public extension service Privatization and commercialization will 2.99 9 3.14 5 help to reduce govt. financial burden on agriculture Privatization and commercialization will 2.96 10 3.12 7 make agricultural extension services Wlaffordable by farmers Privatization and commercialization will 2.72 11 2.76 12 create job opportunities Privatization and commercialization will 2.65 12 2.92 11 lead to job insecurity among public extension workers Privatization and commercialization will 2.60 13 2.72 13 encourage exploitation of farmers Privatization and commercialization will 2.52 14 1.98 16 encourage income inequality Privatization and commercialization will 2.46 15 2.06 15 encourage foreign domination in the provision of extension services Privatization and commercialization will 2.35 16 1.77 17 lead to poor capacity building Privatization and commercialization will 2.22 17 2.21 14 Eromote corruEtion and neEotism
Spearman's Rank Correlation Coefficient, corrected for ties- 0.80
7
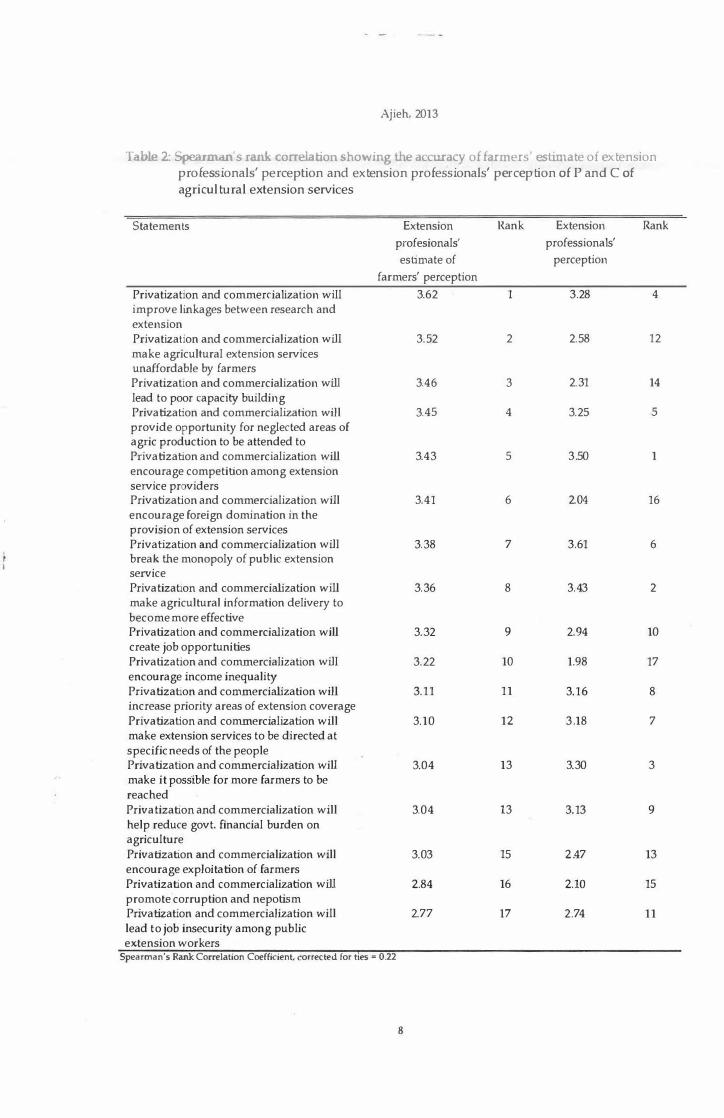
Ajieh, 2013
Table 2. Spearman's rank correlation showing the accuracy of farmers' estimate of extension professionals' perception and extension professionals' perception of P and C of agricultural extension services
Statements Extension Rank Extension Rank
profesionals' professionals'
estimate of perception
farmers' perception
Privatization and commercialization will 3.62 1 3 .28 4 improve linkages between research and extension Privatization and commercialization will 3.52 2 2.58 12 make agricultural extension services unaffordable by farmers Privatization and commercialization will 3.46 3 2.31 14 lead to poor capacity building Privatization and commercialization will 3.45 4 3.25 5 provide opportunity for neglected areas of agric production to be attended to Privatization a11d commercialization will 3.43 5 3.50 1 encourage competition among extension service providers Privatization and commercialization will 3.41 6 2.04 16 encourage foreign domination in the provision of extension services Privatization and commercialization will 3.38 7 3 .61 6 break the monopoly of public extension service Privatization and commercialization will 3.36 8 3 .43 2 make agricultural information delivery to become more effective Privatization and commercialization will 3.32 9 2.94 10 create job opportunities Privatization and commercialization will 3.22 10 1.98 17 encourage income inequality Privatization and commercialization will 3.11 11 3.16 8 increase priority areas of extension coverage Privatization and commercialization will 3.10 12 3.18 7 make extension services to be directed at specific needs of the people Privatization and commercialization will 3.04 13 3.30 3 make it possible for more farmers to be reached Privatization and commercialization will 3.04 13 3. 13 9 help reduce govt. financial burden on agriculture Privatization and commercialization will 3.03 15 2.47 13 encourage exploitation of farmers Privatization and commercialization will 2.84 16 2.10 15 promote corruption and nepotism Privatization and commercialization will 2.77 17 2 .74 11 lead to job insecurity among public ex;tension workers
Spearman's Rank Correlation Coefficient, corrected for ties = 0.22
8
Perception of Privatization and Commercialization of Extension Services
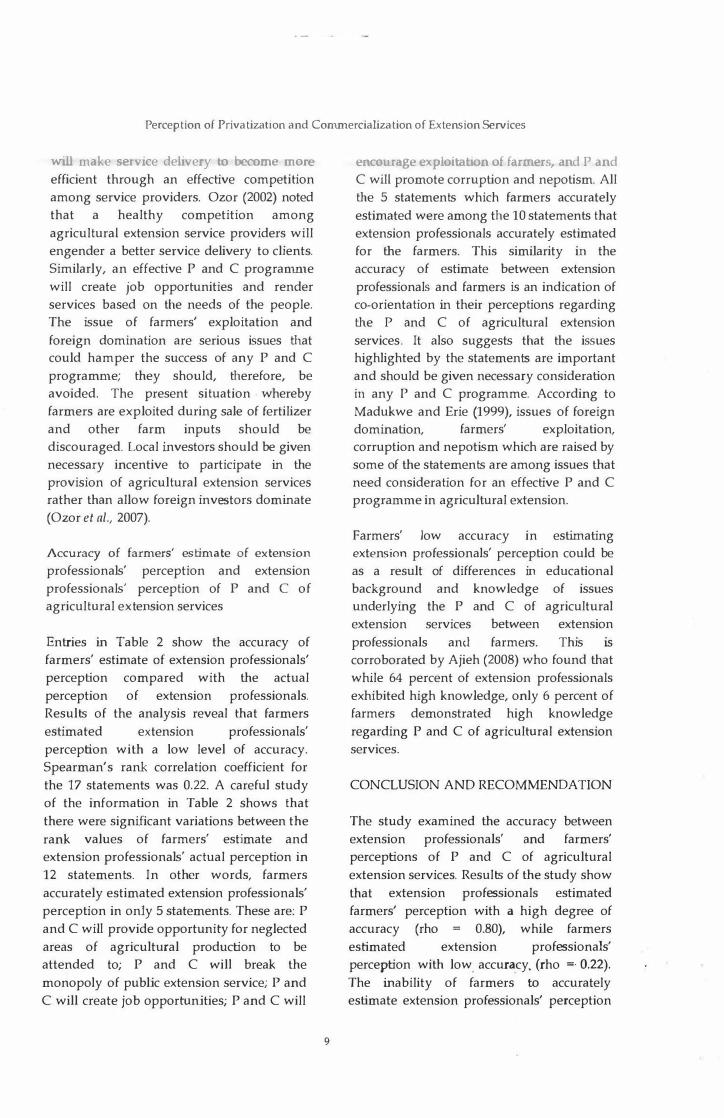
will make service delivery to become ::nore
efficient through an effective competition among service providers. Ozor (2002) noted that a healthy competition among agricultural extension service providers will engender a better service delivery to clients. Similarly, an effective P and C progranm1e will create job opportunities and render services based on the needs of the people. The issue of farmers' exploitation and foreign domination are serious issues that could hamper the success of any P and C progranm1e; they should, therefore, be avoided. The present situation whereby farmers are exploited during sale of fertilizer and other farm inputs should be discouraged. Local investors should be given necessaxy incentive to participate in the provision of agricultural extension services rather than allow foreign investors dominate (Ozor et al., 2007).
Accuracy of farmers' estimate of extension professionals' perception and extension professionals' perception of P and C of agricultural extension services
Entries in Table 2 show the accuracy of farmers' estimate of extension professionals' perception compared with the actual perception of extension professionals. Results of the analysis reveal that farmers estimated extension professionals' perception with a low level of accuracy. Spearman's rank correlation coefficient for the 17 statements was 0.22. A careful study of the information in Table 2 shows that there were significant variations between the rank values of farmers' estimate and extension professionals' actual perception in 12 statements. In other words, farmers accurately estimated extension professionals' perception in only 5 statements. These are: P and C will provide opportunity for neglected areas of agricultural production to be attended to; P and C will break the monopoly of public extension service; P and C will create job opportunities; P and C will
9
encourage exploitation of farmers and P and C will promote corruption and nepotism. All the 5 statements which farmers accurately estimated were among the 10 statements that extension professionals accurately estimated for the farmers. This similarity in the accuracy of estimate between extension professionals and farmers is an indication of co-orientation in their perceptions regarding the P and C of agricultural extension services. It also suggests that the issues highlighted by the statements are important and should be given necessary consideration in any P and C programme. According to Madukwe and Erie (1999), issues of foreign domination, farmers' exploitation, corruption and nepotism which are raised by some of the statements are among issues that need consideration for an effective P and C progranm1e in agricultural extension.
Farmers' low accura�y in estimating extension professionals' perception could be as a result of differences in educational background and knowledge of issues underlying the P and C of agricultural extension services between extension professionals anti farmers. This is corroborated by Ajieh (2008) who found that while 64 percent of extension professionals exhibited high knowledge, only 6 percent of farmers demonstrated high knowledge regarding P and C of agricultural extension services.
CONCLUSION AND RECOMMENDATION
The study examined the accuracy between extension professionals' and farmers' perceptions of P and C of agricultural extension services. Results of the study show that extension professionals estimated farmers' perception with a high degree of accuracy (rho 0.80), while farmers estimated extension professionals' perception with low accuracy. (rho =· 0.22). The inability of farmers to accurately estimate extension professionals' perception
Ajieh, 2013
could be due to differences m their
background and knowledge of issues
relating to P and C of agricultural extension
services. The study recommends that
farmers' knowledge of issues relating to P
and C should be enhanced through seminars
and workshops organized by the
appropriate extension agency.
REFERENCES
Ajieh, P. C. 2008. A co-orientation analysis of
extension professionals' and farmers'
perceptions of privatization and
commercialization of agricultural extension
services in Delta state, Nigeria, PhD Thesis,
Department of Agricultural Extension,
University of Nigeria, Nsukka.
Berko, R. M., Rosenfeld, L. B. and Samovar, L. A. 1997. Connecting, 2nd ed. New York: Harcourt Brace College Publishers.
Broom, G. M. 1977. Community consensus
building: A communication experiment in
two rural Wisconsin communities.
Unpublished doctoral dissertation,
University of Wisconsin, Madison.
Buchili, V. and Pearce, B. 1974. Listening
behaviour in co-orientation states. Journal of
Communication, 24(3): 62- 70.
Connelly, N. A. and Knuth, B. A. 2002. Using
the co-orientation model to compare
community leaders' and local residents'
views about Hudson River ecosystem
restoration. Socieh; an d Natural Resources. vol.
15 (10): 933 -948.
Dolly, D. 1997. Accuracy, congruency and
agreement among researchers, extension
workers and pigeon pea farmers in Trinidad
and Tobago. Journal of International
Agricultural and Extension Education, 4(1): 21
-30.
10
Gantz, W., Wenner, L. A., Carrico, C., and
Kroon, M. 1995. Assessing the football
window hypothesis; A ·co-orientation study
of the role of televised sports in long
standing relationships. Journal of Sport and
Social Issues, 19(4): 352-376.
Groot, H. C. 1970. Co-orientation and
technological change: Communication
variables in perceptions of "miracle rice" in
the Philippines. Unpublished doctoral
dissertation, University of Wisconsin,
Madison.
Gruning, J. and Hunt, T. 1984. Managing
Public Relations. Orlando: Harcourt Brace
Publishers.
Littlejohn, S. W. 1992. Theories of Human
Communication, 7th ed. Belmont, C.A:
Wadsworth Publishers.
Madukwe, M. C. and Erie, A. P. 1999
Privatization and commercialization of
agricultural extension services in Nigeria: A proposal. Proceedings of the 5"' Annual
National Conference of Agricultural Extension
Socieh; of Nigeria. UNN, April 12; 5: 106 -112.
Meiller, L. 1975. A co-orientation approach
to consensus building in two Wisconsin
communities. Unpublished doctoral
dissertation, University of Wisconsin,
Madison.
Ozor, N. 2002. Extension professionals'
perception of privatization and
commercialization of agricultural extension
service in Enugu State Agricultural
Development Programme. M.Sc Research
Project. Department of Agricultural
Extension, University of Nigeria, Nsukka.
Ozor, N., Agwu, A. E., Chukwuone, N. A.,
Madukwe, M. C. and Garforth, C. J. 2007.
Cost sharing of Agricultural Technology
Transfer in Nigeria: Perceptions of Farmers
and Extension Professionals, Journal of
Agriculhtral Extension and Education, 13(1): 23 -27.

Journal of Applied Agricullural Research 2013, 5(2): 11-20 JSSN 2006-7SOX © Agricultural Research Council of Nigeria, 2013
MICROC:REDIT AND FOOD CROPS PRODUCTION IN SELECTED LOCAL GOVERNMENT AREAS OF OGUN STATE: A RESTRICTED NORMALISED PROHT FUNCTION ANALYSTS
*Tijani, I . A.l, Rahji, M. A. Y. 2, Momoh, S. 3, Dipeolu, A. 0.3 and I. A. Ayinde3 10gun State Agricultural Development Programme (OGADEP), Abeokuta, Nigeria
2Deparbnent of Agricultural Economics, University of Ibadan, Nigeria 3Department of Agricultural Economics and Farm management, Federal
University of Agriculture, Abeokuta (FUNAAB), Nigeria *[email protected], +2348056353250
ABSTRACT
This paper examined the effect of access to credit on the resource productivity of food crop producers in selected Local Government Areas of Ogun State. A mu lti-stage sampling teclmique was used to select 240 respondents from eight villages in four local government areas. Data collected were analysed using descriptive stalistics and normalised profit function. The results revealed planting material, fertilizer and fixed input being positive for users and non-users of credit, though at different significant levels {1% and 5%) Labour wage was negatively significant at 1 % a level for credit users' only. The implication is that there is significant difference in the groups' resource use/ allocation, indicating that with access to credit facilities, resource productivity of rural farmers in Ogun State, and Nigeria at large, can be enhanced.
Keywords: resource productivity, food crops, rural farmers, restricted normalised profit function.
INTRODUCTION
It is an established fact that there is food
shortage problem (otherwise known as food
crisis) in Nigeria, despite being an agrarian
country. Bulk of food crops production in
. Nigeria still rest, with peasant farmers, who
are constrained by a number of factors from
rising to the task of meeting the country's
food requirement. They practise subsistence
system of farming, whose goal remain solely
that of balancing family food needs and cash
income needs, and is characterized by low
farm income, low level production capacity
arising from scattered small farm size that
varies between ecological zones within the
country, and use crude production
technology.
11
Food problem in Nigeria has been
exacerbated by low level of productivity of
resources being used (by the farmers), which
is a reflection of their low (production)
efficiency level (Ogundari, 2006).
Productivity performance in the agricultural
sector, according to Fulginiti et al. (2004), is
critical to improvement in overall economic
well-being.
Government development policy that
favours urban over and above rural sectors
in terms of infrastructures and amenities,
land tenure problem whose effect has not
encouraged peasant farmers into medium
scale farming, unstable inputs price, non
availability and inadequate supply of credit
facilities, especially at the rural sector, for
these farmers to access in time, as well as

Tijani et a/., 2013
efficient marketing, are some of the constraints identified as limiting the productive capacity of the peasant farmers (Olatunbosun, 1978; Agbato, 2000; Amaza and Olayemi, 2002).
Given the above constraints, the peasant farmers are being adjudged to be risk averse, yet need credit facility to boost their agricultural production and smooth family consumption need. This is against the backdrop that provision of credit facility is being adjudged globally as a veritable instrument for enhancing agricultural production (Aihonsu, 2001). The need, therefore, to study the effect access to credit by peasant farmers could have in enhancing their production ability is appropriate at this point in time, given government clarion call for massive production of food crops encapsulated in programme such as RTEP (Root Tuber Expansion Programme), with special emphasis on cassava, cocoyam, sweet potatoes and yam, because of the wide range of uses they could be subjected to.
This type of study engenders a number of policy implications. Firstly, an understanding of the broader role of rural finance for agricultural production would establish the relative importance of various factors that permit certain (peasant farmers) households in a given socio-economic environment to achieve greater benefit from access to credit than others. Secondly, on the long-run, it would assist policy makers in putting in place dynamic and enduring institutional innovation(s) that can transform the existing nascent micro-credit institutions in the country into efficient and full-fledged financial intermediaries, with different packages for these farmers and covering large geographical rural areas where majority of these peasant farmers reside.
1 2
THEORETICAL FRAMEWORK
Normalised profit function
Profit function, which was first inh·oduced by McFadden (1978), is a flexible tool and is increasingly being employed for empirical study of production, and for addressing a broad range of developmental issues, an integral part of which is agricultural production (Yotopoulos and Lau, 1979). The flexibility of profit (function) model is based on duality theory (between production and profit/ cost function), thus, making it a handy tool in the analysis of various economic problems. The use of duality in production theory dates back to 1953, while applications involving flexible forms have been available for almost two decades (Asche et a/., 2007). Cost function can be viewed as a restricted profit function with all outputs treated as fixed (Lau, 1976; McFadden, 1978).
A crucial feature of the profit function, according to Lau and Yotopoulos (1971), is that it assumes firms behave according to certain decision rules, which include profit maximization, given the price regime for output and variable inputs, and given the quantities of fixed factors of production. Its advantages, according to authors, include: serving dual purpose of both profit/ cost and production, thus providing a richer specification of production relations than the traditional function; prevention of the prob!ems of mis-specification noticed in traditional production function, and multicollinearity; it yields statistically consistent estimates under standard assumptions and can conveniently measure the three components of efficiency (technical, allocative and economic), unlike traditional function (which can only measure technical efficiency), in the determination of relative ecoilom�� efficiency, and; supply and demand functions can be derived from a (rtarrnalised) profit function directly, rather
Microcredit and Food Crops in Ogun State
than through solving the profit-maximising
problem, thus avmdmg the potential
difficulties (sometimes impossibility) of
obtaining closed form solutions.
A competitive firm's profit function is
convex in price, while cost and expenditure
functions are concave. For differentiable
functions, these properties, with Hotelling's
or Shephard's Lemmas, imply weak
inequality own-price effects on net supplies
or demands (Yotopoulos and Lau, 1979).
Normalised profit function (NPF), which is
con!)idered to be a later development on
(variable) profit function and sharing the
same advantages itemised above with profit
function, have other unique features that
confer further advantages on it, and makes it
handier than variable profit function. These
include its ready ability to accommodate
price difference between two identical firms
facing different input and output prices, as
well as its ability in employing the use of
relative input price unlike traditional
variable profit function which employs
actual prices of both input and output. This allows for easy derivation of supply and
demand functions. It proves more handy
from theoretical and econometrics points of
view, according to Sankhayan (1988),
because it reduces the number of
explanatory variables by one, thus,
providing a wider choice of functional forms
to use, meaning that it cannot be reduced to
an homogenous function of degree one.
From the true implicit variable profits
function specified by Coelli (1996); Battesse
and Coelli (1995); Yotopoulos and Lau
(1979):
. . . 1
NPF can, however, be derived by dividing
both sides of equation (1) with output price
as:
!! = rff(X;; Z;) - EPiXi Py PyPy
... 2
13
Which becomes: rr*= G(Xt;Z;) - ErX(
or simply wntten as:
n* =G* (X*;Z) = G*(r� Z;)
. . . 3
. .. 4
Where rr* = 'Unit-Output-Price' profit; r =
Normalized price of the ith variable (X)
input; Py = Output price; f / G = Functional
symbol. the fixed costs of fixed input (Z) are
ignored, since it is known that they do not
affect the optimal combination of the
variable inputs. The profit function gives the
maximized value of the profit for each set of
independent variable value. Homogeneity
can be imposed on this identity/ equation by
dividing profit and price by (labour) wage
rate (Abrar, 2004).
Yotopoulos and Lau (1979) specified the
equivalent profit function of one output,
multiple-input Cobb-Douglas production
functional form, used in this study, as:
. . . 5
This becomes linearised by taking its natural
logarithm, to assume the expression below:
Where, n* = Normalised restricted ' Unit
Output-Price' Profit
A;* = Technological (Efficiency) parameter,
higher value of which signify higher
normalised profit for all possible normalised
prices (i.e. orr/ oA;* >0) at = onj ori = Profit elasticity with respect to
changes in (normalised) variable
input price (Equivalent of marginal product
of variable inputs in traditional production
function)
Pi* = on/ oZ; = Profit elasticity with respect
to changes in fixed input quantity used
(Equivalent of marginal product of fixed
inputs in traditional production function)
r; Vector of normalised variable input
·.0 . 'f). price
\,��\ r�O��\ \ '.\.- .,.., -...e) ... ··� �"' . ! \ ,,.. j .
Tijani et al., 2013
Z; = Vector of fixed input quantity
i = l. m; j = l.. .n
v = .E Oj< 1 = Rate of returns to scale. This
condition is required under profit function
approach since constant or increasing
returns in the variable inputs are inconsistent
with profit maximization.
Normalized 'unit-output-price' (UOP) profit
(rr*), according to Lau and Yotopoulos
(1971), is easier to work with than un
normalized variable input profit function, as one can always find n given n*. The UOP
profit function, continued the author, is decreasing and convex in the normalized
prices of variable inputs, but increasing in
quantities of fixed inputs and the price of
output. It should be noted that for the Cobb
Douglas production function case,
differences in technical efficiency and
relative differences in price efficiency cannot
be separately identified from the actual UOP
profit function.
Differentiation of the normalized equation
(6) with respect to the normalized price of jth
variable input, using Hotteling-Shephard
and lemmas' approach, according to Jensen
(2002), will yield the inputs' demand
function for jth variable input, expressed
thus:
orr/ or;i = Xi* . . :7
while the output supply function can be
derived by substituting equation (7) into
equation (3), which can be specified as:
... 8
where Xi* and Y* represent maximum
variable inputs to use and output to produce
to have maximum profit. The first order
condition for maximization of norma]jzed
profit is given by the usual rule that equates
marginal product of an input to its
opportunity cost (i.e. input price), expressed
mathematically as:
14
dP/dX = r . . . 9
based . on the assumption of profit
maximization, thus:
-drr*(r)/ dr = D(r) . . . 10
In other words, the negative of the derivative
of the normalized profit function is the
demand function, which is sometimes
referred to as the Hotelling-Shephard
Lemma. Necessary conditions for the above
assumption (in equation 9 or 10) to hold,
according to Yotopoulos and Lau (1979) is
that, first, D(r) must be positive, suggesting
that as input price increases, profit would
fall, implying that drr* / dr is negative.
Secondly, for profit to be relatively
insensitive to input price, that is, dn*/ dr
being small, it then means that input
demand cannot be large. The conclusion here
is applicable to multiple variable inputs case,
in which the negative of the vector of the
partial derivatives of the normalized profit
function represent the vector of demand
functions for the variable inputs.
The elasticity values of profit function are
important for providing policy answers to
the questions of price response (aims at
assessing the responsiveness of the
agricultural producers to changes in market
prices of inputs), economies of scale,
efficiency in the allocation of the variable
factors of production, and shadow pricing of
the fixed factors.
The naturalised logarithmic form of NPF,
according to Lau and Yotopoulos (1971), can
be estimated with the least squares estimator
(OLS), as it turns to be minimum variance,
linear and unbiased. However, for any
function to qualify as a normalised profit
function, it must be non-negative,
monotonically decreasing and convex in the
normalised price (Yotopoulos and Lau,
1979).
Microcredit and Food Crops in Ogun State
Two profit functions can be distinguished
under stochastic frontier approach (SFA),
depending on whether or not market forces
are taken into consideration (Ogundari,
2006), namely:
(i) Standard profit function, which assumes
that markets for outputs and inputs are
perfectly competitive. It also assumes that
the firm/ farm maximises profits by
adjusting the amount of inputs and output,
given the input (W) and output (P) price
vectors. In this case, the profit function can
be expressed implicitly as:
n = f (P, W; V, U) . . . 11
whose logarithmic form is expressed as:
ln (n + 8) = lnf((P, W) (V + U)
Where 8 =A constant added to the profit of
each firm in order to attain positive values,
and enable jt to bt! trt!att!d logarithmically; V
= iid two sided random error (term), having
normal N (O,o2v) distribution, independent of
the U; U = Profit inefficiency term, assumed
to be non-negative truncation of the half
normal distribution N (11, o2u).
The exogenous nature of prices, given the
profit efficiency concept, assumes that there
is no market power on the firms/ farmers
side. Meaning that rather than taking price
as given, the firms/farmers assume the
possibility of imperfect competition, given
output vector and not that of price.
(ii) Alternative profit function, which has the
quantity of output (Y) produce, replaces the
output price (P) in the standard profit
function. It is expressed as:
n = f (Y, W; V, U) . . . 12
whose logarithmic form is expressed as:
ln (n + 8) = l:nf((Y, W) (V + U)
15
V and U are relevant if stochastic frontier
approach is used for analysiS.
METHODOLOGY
The study area
The study was carried out in Ogun State
which is endowed with extensive fertile soils
suitable for agriculture and enjoys abundant
rainfall almost all year round. The State has a
number of rivers and streams, while
principal employer in the rural parts of the
state is small farm-holding agriculture
involving the use of crude implements. The
major farming practice in the rural parts of the State is mixed cropping, as a means
towards conserving their soil fertility and as
a traditional crop diversification stTategy. Main crops grown in the rural settings
within the State include both arable food and
tree crops (OGADEP, 2000).
Data collection and sampling technique
Cross-sectional data were collected from 240
respondents from eight villages that were
evenly distributed among four local
government areas in Ogun State, namely
Odeda, Yewa South, Ikenne and Ijebu North.
A multi-stage sampling technique was used
to select sample units within the State, while
a well-structured questionnaire was used to
collect information on the socio-economic
characteristics of the farmers, in addition to
the production cost and returns for crops
such as cassava, maize, and yam.
Respondents were categorised into two main
groups, namely, users and non-users of
microcredit based on their statement.
Data analysis
Descriptive statistics and normalised profit
function (NPF) were employed for data
analysis. Descriptive statistics involving the
use of frequency table, percentages, and
mean were used to describe respondents'
socioeconomic characteristics, while
Tijani et al., 2013
normalized profit function analysis was
carried out to show the effects of inputs
(both variable and fixed) used for production
on profit, for each of the categories of farmer,
using ordinary least square (Ol.S)
techniques.
A hypothesis of no significant difference in
the partial production slope parameters of
the two categories of farmers (Ho: picu = pincu) was tested.
Model specification
The Cobb-Douglas production functional
form of restricted NPF, which specifies the
production technology of the farmers with
decreasing returns in the ith variable and
fixed inputs, was chosen instead of translog
model, which though more flexible, requires
considerably greater number of parameters
(Battese et al. , 1996). In addition, its (that is,
Cobb-Douglas functional form) wide
acceptance/ use, theoretical fitness,
manageability and suitability, when dealing
with small farms/small farm holding
farmers (Singh, 1975; Ajibefun and
Daramola, 2000; Aihonsu, 2001), made it the
choice for this study analysis. Its definition
and specification is specified in equation (6),
thus:
. . . 5
Lnrr* = LnAi* + aj*ELnrii + f3i*ELnZij ... 6
Where j=l . . .4; i=1,2
The functional form chosen for the study
analysis was estimated using ordinary least
square (Ol.S) method.
RESULTS AND DISCUSSIONS
Socio-economic characteristics
Table 1 shows that the average age of the
credit user and non-user farmer is about 47
16
and 50 years, respectively, while the mean
educational years of these categones of
farmers is not above five years, implying low
literacy level among the farmers. The
implication is that while the farming families
are still agile, their low literacy level will
impact negatively on their resource
allocation (productivity) and production
efficiency.
Furthem1ore, mean family size for the
categories of farmers were 9 and 7, whereas
mean experience in food crops cultivation
ranges between 27 and 29 years. Family size
suggests that family labour can easily
substitute for hired labour in case of the
scarcity or highcost of the latter, whereas
farming experience is considered t6 enhance
efficiency, hence amenable to policy
formulation than age (Rougoor et al., 1998;
Rahji, 2005). The table further shows average
cultivated land for the two categories of
farmer to be 2. 7 and 2.3 hectares,
respectively, suggesting that the credit users
are endowed with more farm land. The
import is that with access to credit, credit
users can afford to purchase more land or
lease, thus affirming earlier findings that
land expansion (and factors contributing to
it) is the only guarantee for increased food
crop production (Olomola, 1988; Kumar,
1994), as it results from increase in marginal
productivity of labour (Zeller et al., 2001) .
Normalised profit function analysis
The F-value, as shown in Table 2, is
positively significant at 1 percent for the two
groups of farmers (credit users and non
users). The low R2 value for the two
categories of farmers shows that 48 and 46
percent variation in the equations were due
to changes in the specified explanatory
variables for those equations. The low value
of R2 is explained by the diversity of the
units of variables used, which is peculiar to
cross-sectional data (Gujarati and Sangeetha,
2007). The adjusted R2 values for the two

Microcredit and Food Crops in Ogun State
categones of farmers were 0.45 and 0.43, respectively.
Four variables, namely the prices of planting materials, fertilizer, labour and fixed inputs used were found to significantly affect the realized profit made by the credit user farmers, whereas for non-credit users profit was affected by planting material, fertilizer and fixed inputs prices. Planting material and fertilizer are positively significant at 5%
a - level for the two categories of farmers; labour is negatively signed for the categories but significant at 1% for credit user farmers only, while fixed input is positively significant at 1 % for the two categories of farmers.
The sum of profit elasticity of variable inputs (i.e. demand function) was found positive for the two categories of farmers, though that of the non-credit user farmers is marginally lower (0.24) than that of credit user farmer
(0.25) meaning that use of additional unit of this variable would result in smaller increase in profit for the two categories of farmers with consequence on their economic efficiency (Olarinde and Kuponiyi, 2004). For the fixed inputs, credit user's farmers recorded a higher elasticity value (0.57) than non-credit user's farmers (0.37), indicating a decreasing returns to scale (Ip<1) exist among rural peasant farmers in Ogun State, which agrees with production economic postulates that increasing returns to scale are not very common in agriculture, while the positivity of the values suggest room for increasing returns to scale (Olayide and Heady, 1982). Overall profit elasticity of 0.82 for credit users and 0.61 for non-user farmers implies that use of additional unit of any of these inputs will result in increase in output and profit equivalent to the values. The sum elasticity for all the inputs, being less than unity, for the two categories of farmers, indicate that the farmers are in rational stage
Table 1: Summary of socio-demographic characteristics of respondents
Variables/Mean Credit users Non-credit users Age (years) 50.00 47.00
Educational level (years) 5.00 4.00
Family size 9.00 7.00
Farming experience (years) 29.00 27.00
Farm size cultivated (ha) 2.70 2.30
Source: Field Survey, 2010
Table 2: OI.S estimates of normalized profit function parameters
Variables Credit Users
Planting material (N) Fertilizer (N) Agro-chemical (N) Labour wage (N) Farm fee (N) Fixed inputs (N) R2 R2 Adj F-value N
. ·- . . _,
Coefficient 0.18**
0.22**
0.08
-0.22***
-0.03
0.60***
0.48
0.45
14.83***
105�-
.
... , "", • represent 1%, 5% and 10% signiiicant levels
Source: Field Survey, 2010
17
t-value 2.18
2.32
0.31
-2.86_ .
-0.38
7.08· .
. ,'; �. --; : ·� ...
Non-credit Users Coefficient t-value
0.22** 2.57
0.16** 2.13
0.02 0.93
-0.15 -0.61
-0.09 -1.34
0.46*** 6.28
0.46
0.43
18.12***
135
Tijani et al., 2013
of production (stage ll) and that the
commodities produced by the farmers are
price/ demand inelastic.
CONCLUSIONS AND
RECOMMENDATIONS
From the results above, it is concluded that
most of the rural farmers in Ogun State are
moving towards old age as revealed by the
mean age of 50 and 47 years (for credit and
non-credit users, respectively), suggesting
high migration of able bodied young men
from rural areas to major cities, thus denying
agriculture the contributions of these people
to agricultural growth and development. It is
also concluded, from the results, that there is
problem of land consh·aint in Nigeria, a
situation that will have serious effect on the
ability of the rural peasant farmers to go
beyond subsistence farming, and for Nigeria
to be self-sufficient in food crop production.
Access to credit has been revealed by the results to have strong relationship with
inputs used in food crop production.
The implications of these results are that
Ogun State Government needs to look into
the issue of high price of necessary
agricultural inputs and come up with a
policy that will make them affordable to the
rural peasant farmers. The issue of
infrastructure development and social
amenities provision at the rural level, needs
to be urgently tackled by the State
Government, with a view to discouraging
out-migration of able bodies from rural areas
to major cities. Government also needs to
readdress land tenure system law, such that
rural farmers, who still constitute the bulk
producers of food crops in the country, can
have access to large expanse of land for
farming, while interested large scale
investors in agriculture will not be denied
access to requisite land for large scale
commercial farming. Above all, there is need
for policy that will ensure timely availability
and supply of credit facility to the rural
1 8
farmers in order for them to be able to
acquire requisite inputs and necessary
technology that can raise their productivity,
and production efficiency. In essence, well
integrated pro-poor policies that can
facilitate access to basic physical capital and
credit are urgently called for.
REFERENCES
Abrar, S. 2004. Smallholder Supply Response
and Gender in Ethopia: A Profit Function
Analysis. Sheffield Economic Research Paper
Series, SERP NO: 2004007.
Agbato, A. 0. 2000. Financing Medium and
Long gestation Agricultural Enterprises in
Nigeria: Problems and Prospects
Borrowers' view point. A paper delivered at
a CBN organised workshop.
Aihonsu, J. 0. Y. 2001. Bank Loaan Default
by Small-scale farmers in Ogun state, Nigeria. The Ogun state Journal of Agricultural
Sciences, 1 : 11-21.
Ajibefun, I. A. and Dararnola, A. G. 2000.
Measurement and Sources of Technical in
Poultry Egg Production in Ondo State,
Nigeria. Journal of Rural Economics, 10 (1): 85-
93.
Amaza, P. S. and Olayemi, J. K., 2002.
Analysis of Technical Inefficiency in Food
Crop Production in Gombe State, Nigeria.
Applied Economics Letter, 9: 51-54.
Asche, F., Kumbhakar, S. C. and Tveteras, R.,
2007. A dynamic profit function with
adjustment costs for outputs. Empirical
Economics, 15 pp; Springer Verlag.
Battesse, G. E., Malik, S. ]. and Gil, M. A.
1996. An Investigation of Technical
Inefficiencies of Production of Wheat
Farmers in Four District of Pakistan. Journal
of Agricultural Economics, 47: 37-49.
Microcredit and Food Crops in Ogun State
Battcssc, G. and Coelli, T. 1995. A Model for
Technical Inefficiency Effects in a Stochastic
Frontier Production Function for Panel Data.
Empirical Econornics, 20: 325 - 332.
Coelli, T. 1996. Frontier Version 4.1: A
Computer Programme for Stochastic Frontier Production nnd Cost Function Estimation.
Department of Econometrics, University of
New England, Armidale, NSW.
Fulginiti, L. E., Perrin, R. K. and Yu, B. 2004.
Institution and agricultural productivity in
Sub-Saharan Africa . Agricultural Economics,
31: 169 - 180.
Gujarati, D. N. and Sangeetha, 2007 (4th
Special Indian Edition). Basic Econometrics.
Tata McGraw-Hill Publishing Company
Ltd., New-Delhi.
Jensen, C. L. 2002. Application of the Dual
Theory in Fisheries: A Survey. Marine
Resource Economics, 17: 309 - 334.
Kumar, S. K. 1994. Adoption of Hybrid
Maize in Zambia: Effects on Gender Roles,
Food Consumption and Nutrition. Research
Report 100. IFPRJ, Washington, D.C.
Lau, L. J. and Yotopoulos, P. A. 1971. A Test
for Relative Efficiency: An Application to
Indian Agriculture. American Economic
Review, 61(1): 94-109.
Lau, L. J. 1976. A characterisation of the
normalised restricted profit function. J.
Econs. Theory, 12: 131-163.
McFadden, D. 1978. Cost, revenue and profit
functions. In The Econometric Approach to
Production Theon; (McFadden, eds.). North
Holland, Amsterderm.
Ogundari, K. 2006. Determinants of Profit
Efficiency among Small-scale Rice Farmers in
Nigeria: A profit function approach. Poster
paper prepared for presentation at the
International Association of Agricultural
19
Economics Conference, Gold Coast,
Australia, August 12- 18, 2006.
Ogun State Agricultural Development
Project (OGADEP). 2000. Annual Report.
Ogun Printing Corp., Abeokuta, Nigeria.
Olarinde, L. 0. and Kuponiyi, F. A., 2004.
Resource productivity among poultry
farmers in Oyo State, Nigeria. Joumnl of
Sustainable Development, 1(1): 20 - 26.
Ola tunbosun, D. 1978 (Reprint). Nigeria's
Neglected Rural Majority. Oxford University
Press, Nigeria.
Olayide, S. 0. and Heady, E. 0. 1982.
Introduction to Agricultural Production Economics. Ibadan University Press, Nigeria.
Olomola, A. S. 1988. Agricultural Credit and
Production Efficiency: A case study. NISER
Monograph, Series No.4, Ibadan, Nigeria.
Rahji, M. A. Y. 2005. Determinants of
Efficiency Differentials in Lowland Rice
Production Systems in Niger State, Nigeria.
lbadan Journal of Agricultural Research, 1(1): 7
- 17.
Rougoor, C. W., Trip, G., Huime, R. B. M.
and Renkema, J. A. 1998. How to define and
study farmers' management capacity:
Theory and use in Agricultural Economics.
Agricultural Economics, 18: 261 - 272.
Sankhayan, P. L. 1988. The Profit Functions:
In Introduction to the Economics of Agricultural
Production. Prentice-Hall of India, Private
Limited, New Delhi, p. 84-92.
Singh, J. P. 1975. Resource Use Efficiency and
Returns to Scale in a Backward Agriculture.
Ind. J. Agri. Eco., 30: 33-46.
Yotopoulos, P. A. and Lau, L. J. 1979.
Resource use in agriculture: Application of
the profit function to selected countries. Food
Research Institute Studies, XVII(1): 1-22.

Tijani el a/., 2013
Zeller, M. and Sharma, M 2001 Rural
finanCial �fVlces for Poverty AUeviation.
The Role of Public. In The Unfillislzed Ageuda:
Perspectives on Overcoming Hunger, Poverh; and Environmental Oegrnriation (Pinstrup
"Andersen and Pandaya-Lorch, Eds.), p. 191-
196.
20
Journal of Applied Agricultural Research 2013, 5(2): 21-29 ISSN 2006-750X © Agricultural Research Council of Nigeria, 2013
ANALYSIS OF EFFECTIVE PRICES OF KOSAI IN NIGERIA AND NIGER, WEST AFRICA
*Mohammed, A. B., Musa, S. A. and Z. Abdu Department of Agricultural Economics and Extension
Faculty of Agriculture, Bayero University, Kano *[email protected], +2348023564611
ABSTRACT
Cowpea processing into kosai and its sale is an important economic activity for the local communities in West Africa. Therefore, revealing the factors that contribute to the effective pricing of kosai, potentially leading to higher revenues of the street vendors, is important for economic development and poverty alleviation in the region. This research reveals that several product and retailer specific characteristics have statistically significant effect on effective prices of the product. However, the results vary for different areas/locations of the cities. Therefore, the study concludes that vendor's effective pricing strategy, as well as inclusion of a certain product attribute should be considered depending on the location of the kosai vendor.
Keywords: cowpea, price, kosai
INTRODUCTION
Cowpea is the most important indigenous
African grain legume (Langyintuo et al.,
2003a). It is grown throughout West and
Central Africa and because of its tolerance to
drought it is especially important for the
Sahel. Cowpea is grown on small scale farms and is used for both family consumption and
as a cash crop. In addition, cowpea is a major
item in regional trade with official statistics
showing over 300,000 MT crossing borders
annually (Langyintuo et al., 2003b).
The very early studies by Dalziel (1937) and
Dovlo et al. (1976) provide good insight
about the local cowpea processing in West
Africa . Cowpea can be processed into a wide
array of edible products, such as kosai
(akara), danwake, adalu, awuje, apraprange, etc.,
as well as cowpea soup with beef and okra,
cowpea croquettes, cowpea crepes, etc. The
product of interest in this research is kosai -deep fried cowpea paste alone or with
21
chopped onions, and/ or other spices. Dovlo
et al. (1976) described kosai preparation as a
process that requires incorporating air into
the cowpea paste with a whisk or beater for
3-5 minutes, adding a small amount of water
to a thick mixture, and adding salt just
before frying. Small balls of the mixture are
then deep fried in oil for about 3 minutes.
Cooked product has a golden brown colour
and is crispy.
In West and Central Africa kosai, a deep-fat
fried fritter is a street food prepared
essentially from cowpea and sold almost
exclusively by women. Kosai is the Hausa
word for this product. In some languages
used along the West African coast it is called
"akara". This entrepreneurial activity can be
observed first thing in the morning as customers go out to get their breakfast and
in the late afternoon/ early evening when
kosai is consumed as a snack between lunch
and dinner. This enterprise is generally small
in size and requires relatively simple skills,

Muhammed et al., 2013
basic facilities and small amount of capital
yet those who engage in it are numerous and
it has considerable potential for generating
income and employment. In Niger, food
street vending constitutes a large percentage
of the small-scale industry. With over 1300
vendors in the city of Niamey, Niger, using
an average of 2 kg of cowpea each per day,
the usage of cowpea is over 2600 kg per day
in the one city alone (Ibro et al., 2005).
Studies by Simmons (1973), Smirl and Zoaka
(1974), and Dovlo et al. (1976) described the
factors for success of the kosai vendors as being based on providing a tasty, fresh,
crispy, deep fried product, readily available
to the consumer at specific time of the day
and convenient location. According to the same authors, kosai preparation provides employment opportunities to the local
community, requiring only a small capital
investment. On the other hand, the tectious
work of cowpea processing into kosai can
take as much as 5 to 6 hours per batch.
Kosai customers are often identified as
"everyone" ranging from small children to
elderly persons and from labourers to office
workers. The women entrepreneurs spend
their income from kosai vending directly on
their families for savings, food, clothes,
health care, and school expenses. This
traditional activity is, therefore, important
for economic development and poverty
alleviation. A study on kosai production is
important because it involves the use of a
significant volume of cowpeas and generates
income for many women entrepreneurs and
their families. The major focus of the analysis
in this paper is Nigeria with thirteen
locations and Niger, where sample data
were collected from the three largest cities of
the country.
The objective of this paper was to analyze
effective pricing of kosai in Nigeria and
Niger, West Africa. The hypotheses of the
research, therefore, were:
22
H1· Location has statistically significant
impact on effective kosm prices of vendors.
H2: Retailer specific characteristics and
product specific characteristics have
statistically significant impact on effective
kosai prices at given locations.
The data for the research were collected in different cities of Nigeria and Niger during
the period of 2004-2007. The Ordinary Least
Square (OLS) and Seemingly Unrelated
Regression (SUR) were implemented based
on hedonic pricing model to analyze the
product, vendor, and location specific
characteristics affecting the price of kosni in the region. Results and conclusions highlight
the most vivid and significant outcomes of
the research.
METHODOLOGY
Data for this study were collected in thirteen
different locations of Nigeria (Ahuja, Lagos,
Og�n, Rivers, Edo, Abia, Enugu, Kaduna,
Kano, Borno, Bauchi, Benue and Plateau)
during the year 2004. This selection was
based on states that have large concentration
of working and labour class. These are the
states where there are large numbers of
people, thus purchasing power is high,
demand for food items is high, and majority
of kosai vendors are found in these centers.
In each of the centers chosen, a major city
was selected. In addition, the Federal Capital
Territory Ahuja was also cl1osen. This gave a
total of 13 centers in Nigeria and three cities
of Niger (Niamey, Maradi and Zander), were
also sampled between December 2006 and
August 2007. From each of the thirteen
selected centers, in Nigeria five (5) locations
were also selected namely; motor parks,
Mammy markets, city centers, markets
(Conventional) and road sides for the cross
sectional kosai study. The reasons for this
selection are that they are areas with high
concentration of kosai · vendors and the
population of people is high in these
locations as such the supply and demand for

Analysis of Effective Prices of Kosai in West Africa
kosa• will be high in tllf' chosen places. In each location a simple census of kosai
vendors was Wldertaken to select five kosai
vendors randomly for the study. It should be
noted here that in some cities they have a number in conventional markets and motor
parks; a survey of all the markets and motor
parks was conducted so as to incorporate all
of them in the study. The selection above
gave a total of three hundred and twenty
five (325) respondents in Nigeria.
According to the Lancaster's theory of
demand, value of a marketed product can be decomposed into the values of its attributes
(Lancaster, 1966). Hence, a consumer's choice depends and is derived from the
product-specific and individual-specific
aspects which directly or indirectly affect the
final demand of the product. Mojduszka and
Caswell (2000), based on previous studies
(e.g. Nelson, 1970; Nelson, 1974), proposed three different groups of attributes: search attributes, experience attributes and
credence attributes. Consumers can define the search ath·ibutes (for example color,
shape) of the product before or during
buying; experience attributes (for example
taste, cooking time) can be detem1ined
during the use of the product; as for
credence attributes (for example safety
issues, nutritional value) - those cannot be
defined by consumers at any stage of
purchase process (consumer can only trust
the source).
To bring these
research, kosai
considered as
parallel with the current
as a product can be
the sum of potential
Table 1: Locations of kosai vendors
Location Description
nutritional value (calories. protein and fat
content, etc.), quality attributes (freshness,
texture, taste, etc.), convenience attributes
(location of the retailer), etc. This type of
product decomposition is essentially
important when the research objective is to
find (derive) consumers' willingness-to-pay
for the attributes of interest (which are not
d.U·ectly marketed). Together with product
specific atb·ibutes, the individual
(household) specific characteristics and/ or
retailer-specific characteristics can be
analyzed usn1g the same approach. Since
each attribute of the product can be
associated with certain willingness to pay
from consumers, appearance of this attribute in tl1e product will shift the demand curve
outward (or inward, if attribute actually is
"bad" rather than "good"); and hence, lead to change of the market price of the product.
The hedonic pricing analysis of this research
is mainly based on the above mentioned assumptions. Hedonic pricing model for j locations used in this research can be
expressed as follows:
where, !Ji stands for effective price, defined
as price per 1 00 grams of kosai, at given
location, Xi is a matrix of independent
variables that includes site, product, and
vendor specific characteristics at a given
location (additionally, monthly dummy
variables are added to the model with a
time-series data), Oj is an intercept, and f3i is a
vector of parameters to be estimated; t:j is an
i.i.d. error term. Also, since fuere was no
Motor Park Manuny Market City Center
A park where cars enter during the long-distance journeys A small market located at military and police barracks
Market (Conventional) Road Side
An old settlement location in the big city An area for business activities An area along the street of the big city
23
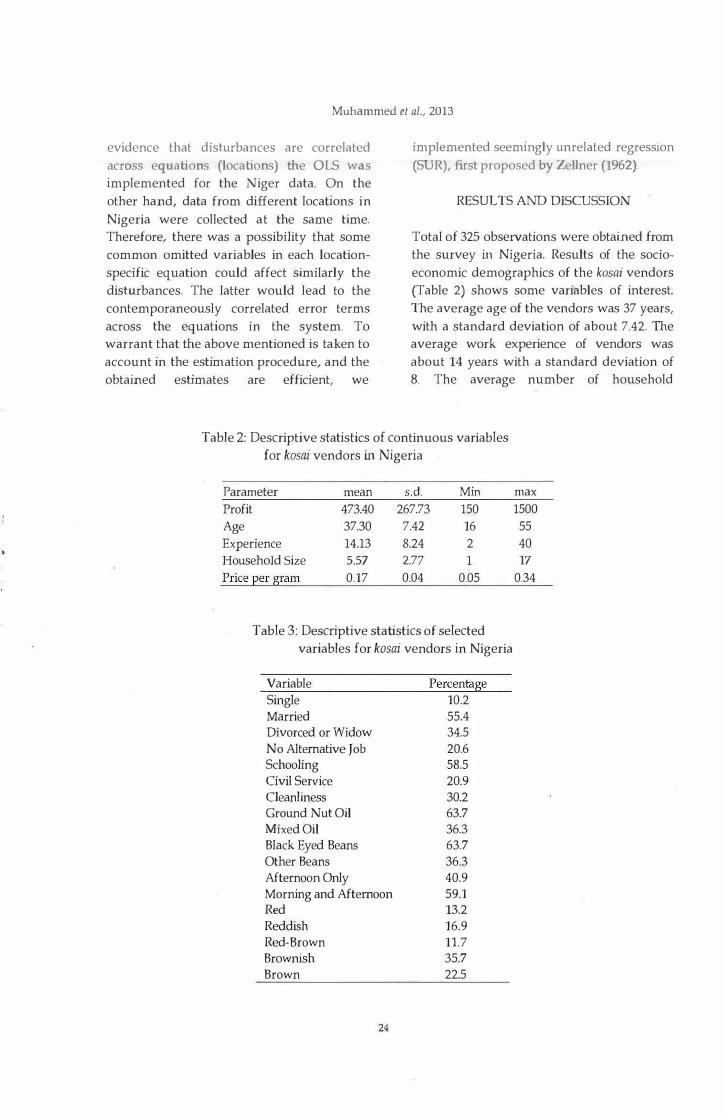
Muhammed et al., 2013
evidence that disturbances are correlated across equations (locations) the OLS was implemented for the Niger data. On the other hand, data from different locations in Nigeria were collected at the same time. Therefore, there was a possibility that some common omitted variables in each locationspecific equation could affect similarly the disturbances. The latter would lead to the contemporaneously correlated error terms across the equations in the system. To warrant that the above mentioned is taken to account in the estimation procedure, and the obtained estimates are efficient, we
implemented seemingly unrelated regression (SUR), first proposed by Zellner (1962).
RESULTS AND DISCUSSION
Total of 325 observations were obtained from the survey in Nigeria. Results of the socioeconomic demographics of the kosai vendors (Table 2) shows some variables of interest. The average age of the vendors was 37 years, with a standard deviation of about 7.42. The average work experience of vendors was about 14 years with a standard deviation of 8. The average number of household
Table 2: Descriptive statistics of continuous variables for kosai vendors in Nigeria
Parameter mean s.d. Min Profit 473.40 267.73 150
Age 37.30 7.42 16
Experience 14.13 8.24 2
Household Size 5.57 2.77 1
Price per gram 0.17 0.04 0.05
Table 3: Descriptive statistics of selected variables for kosai vendors in Nigeria
Variable Percentage Single 10.2
Married 55.4
Divorced or Widow 34.5
No Alternative Job 20.6 Schooling 58.5
Civil Service 20.9
Cleanliness 30.2 Ground Nut Oil 63.7
Mixed Oil 36.3 Black Eyed Beans 63.7
Other Beans 36.3
Afternoon Only 40.9
Morning and Afternoon 59.1 Red 13.2
Reddish 16.9
Red-Brown 11.7 Brownish 35.7
Brown 22.5
24
max 1500
55
40
17
0.34
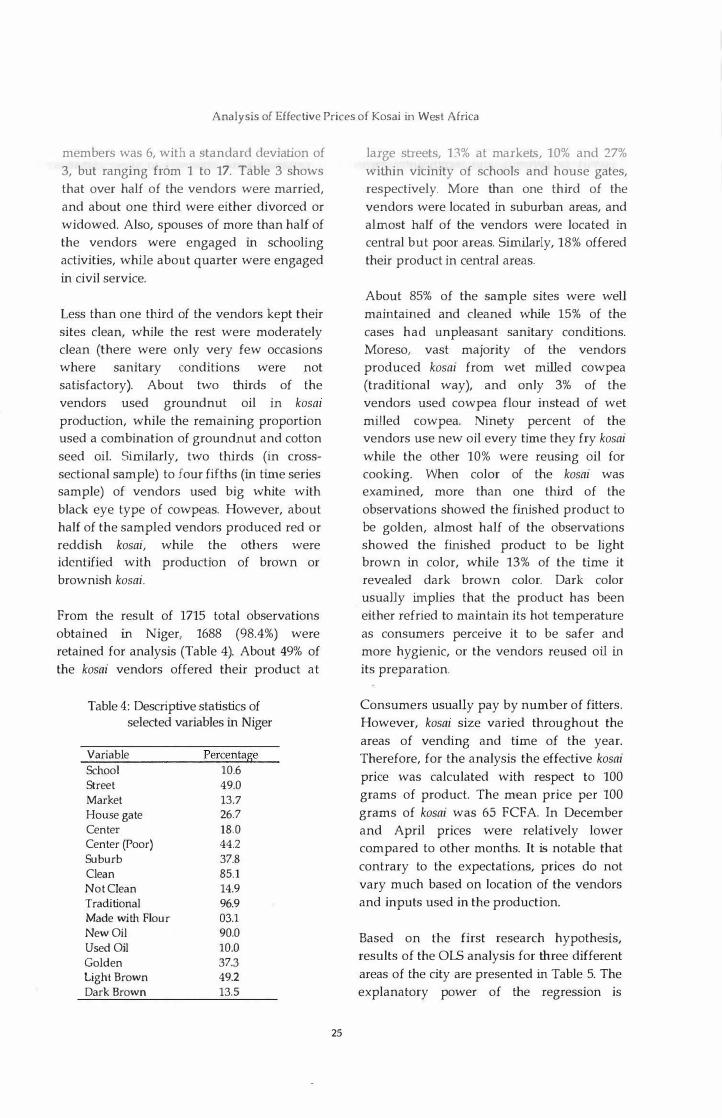
Analysis of Effective Prices of Kosai in West Africa
members was 6, with a standard deviation of
3, but ranging from 1 to 17. Table 3 shows
that over half of the vendors were married,
and about one third were either divorced or
widowed. Also, spouses of more than half of
the vendors were engaged in schooling
activities, while about quarter were engaged
in civil service.
Less than one third of the vendors kept their
sites clean, while the rest were moderately
clean (there were only very few occasions
where sanitary conditions were not
satisfactory). About two thirds of the
vendors used groundnut oil in kosai
production, while the remaining proportion
used a combination of groundnut and cotton
seed oil. Similarly, two thirds (in cross
sectional sample) to four fifths (in time series
sample) of vendors used big white with
black eye type of cowpeas. However, about
half of the sampled vendors produced red or
reddish kosai, while the others were
identified with production of brown or
brownish kosai.
From the result of 1715 total observations
obtained in Niger, 1688 (98.4%) were
retained for analysis (Table 4). About 49% of
the kosai vendors offered their product at
Table 4: Descriptive statistics of selected variables in Niger
Variable Percentage School 10.6
Street 49.0
Market 13.7
House gate 26.7 Center 18.0 Center (Poor) 44.2
Suburb 37.8 Clean 85.1
Not Clean 14.9
Traditional 96.9
Made with Flour 03.1
New Oil 90.0
Used Oil 10.0
Golden 37.3 Light Brown 49.2
Dark Brown 13.5
25
large streets, 13% at markets, 10% and 27%
within vicinity of schools and house gates,
respectively. More than one third of the
vendors were located in suburban areas, and
almost half of the vendors were located in
central but poor areas. Similarly, 18% offered
their product in central areas.
About 85% of the sample sites were well
maintained and cleaned while 15% of the
cases had unpleasant sanitary conditions.
Moreso, vast majority of the vendors
produced kosai from wet milled cowpea
(traditional way), and only 3% of the
vendors used cowpea flour instead of wet
milled cowpea. Ninety percent of the
vendors use new oil every time they fry kosai
while the other 10% were reusing oil for
cooking. When color of the kosai was
examined, more than one third of the
observations showed the finished product to
be golden, almost half of the observations
showed the finished product to be light
brown in color, while 13% of the time it
revealed dark brown color. Dark color
usually implies that the product has been
either refried to maintain its hot temperature
as consumers perceive it to be safer and
more hygienic, or the vendors reused oil in its preparation.
Consumers usually pay by number of fitters.
However, kosai size varied throughout the
areas of vending and time of the year.
Therefore, for the analysis the effective kosai
price was calculated with respect to 100
grams of product. The mean price per 100
grams of kosai was 65 FCF A. In December
and April prices were relatively lower
compared to other months. It is notable that
contrary to the expectations, prices do not
vary much based on location of the vendors
and inputs used in the production.
Based on the first research hypothesis,
results of the OLS analysis for three different
areas of the city are presented in Table 5. The
explanatory power of the regression is

Muhammed et al., 2013
highest for the centi·al areas of Niamey
(about 19 percent), and significantly lower
for central but poor districts and suburbs (7
and 1 0 percent, respectively).
It was observed that effective prices of kosai were lowest in December when cowpea
prices were lowest immediately after
harvest. Compared to December, prices were
significantly higher in Fepruary, May and
July. There was a relatively big variation in
prices in suburban areas of the city, while
prices were less vulnerable to changes in poor central areas of the .city.
From the results in Table 5, location
variables were observed to show statistical
significance only for the estimate
representing vendor within vicinity of
schools in the central area; compared to the
vendors who sell kosai in front of their house
gates, those who sell their product in front of
the schools price it about 35 FCFA lower per
100 grams of product.
Cleanliness is an important factor affecting
sales volume of kosai. Vendors who clean
their sites sell their product at slightly higher
price. This estimate, however, is statistically
Table 5: OLS estimates of factors affecting the effective price of kosai in Niger
Variable Central area Central (poor) area Suburb area
Estimate Estimate Estimate
Intercept 68.155*** 59.135*** 59.541 ***
January 4.375 3.448 2.106
February 12.138*** 6.088*** 4.469*
March 9.075** 2.207 3.572
April -5.25 0.781 3.657
May 4.1 2.047 9.824***
June 8.878* 3.677 8.459***
July 8.319* 7.29*** 12.447***
August 7.244 5.979** 7.311**
Location (Reference Variable - In front of the house gate)
School -35.268* -9.146 5.631
Street -2.873 1.05 0.371
Market -9.419 5.662 0.946
Product and Site Specific Attributes
Clean -3.136 10.956* -0.161
Flour 0.04 -9.378* -3.871
Golden -1.996 -8.001 -0.598
Light brown -2.897 -2.39 1.054
Interaction Terms
School x clean 20.633 2.771 2.104
School x golden 10.034 10.847 -9.972
School x light brown -0.813 9.445 -12.857**
Street x clean -2.336 -6.251 -0.28
Street x golden 4.666 10.664** -1.206
Street x light brown -4.113 8.498** -2.293
Market x clean -4.147 -8.945 -6.895
Market x golden 9.547 10.191 4.451
Market x light brown 1.935 2.62 5.533
Clean x golden -2.701 -6.658 0.718
Clean x light brown 9.42 -7.983 2.328
R2 0.19 0.07 0.10
-, -, and * represent a-0.01, 0.05, and 0.1 significance levels, respectively
26
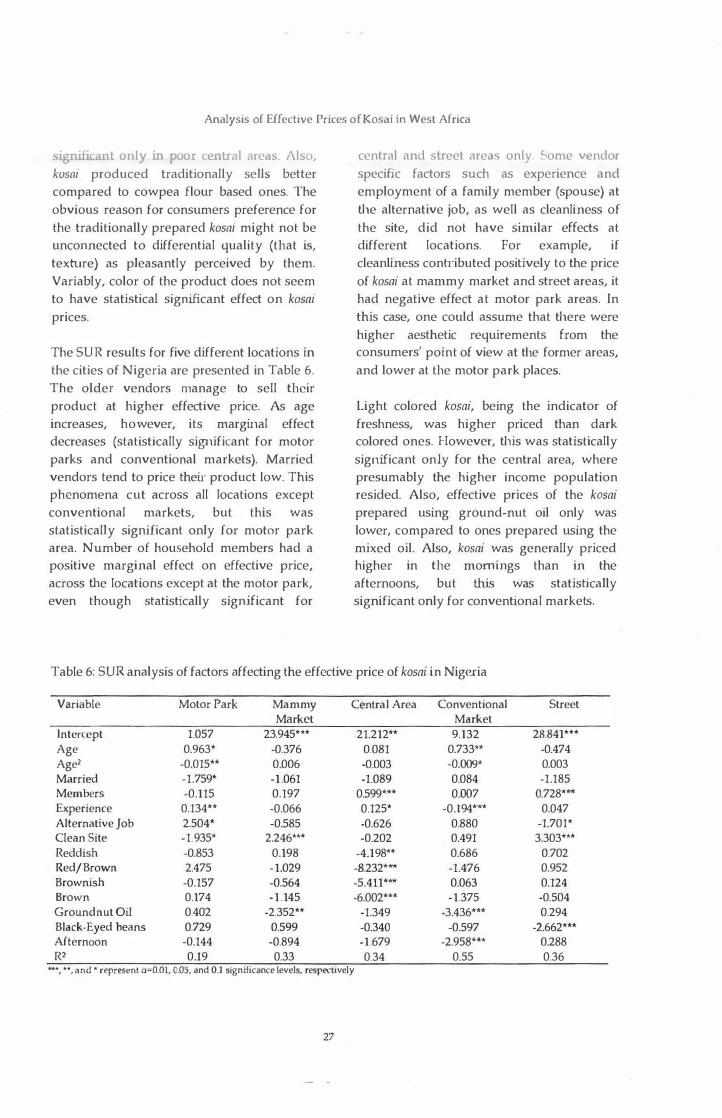
Analysis of Effective Prices of Kosai in West Africa
siv.nilicant only in poor central areas. Also,
kosni produced traditionally sells better
compared to cowpea flour based ones. The
obvious reason for consumers preference for
the traditionally prepared kosai might not be
unconnected to differential quality (that is, texture) as pleasantly perceived by them.
Variably, color of the product does not seem
to have statistical significant effect on kosai
prices.
The SUR results for five different locations in
the cities of Nigeria are presented in Table 6. The older vendors manage to sell their
product at higher effective price. As age
increases, however, its marginal effect
decreases (statistically significant for motor
parks and conventional markets). Married
vendors tend to price their product low. This
phenomena cut across all locations except
conventional markets, but this was
statistically significant only for motor park
area. Number of household members had a
positive marginal effect on effective price,
across the locations except at the motor park,
even though statistically significant for
central and street areas only. Some vendor
specific factors such as experience and
employment of a family member (spouse) at
the alternative job, as well as cleanliness of
the site, did not have similar effects at
different locations. For example, if
cleanliness conb·ibuted positively to the price
of kosai at mammy market and street areas, it
had negative effect at motor park areas. In
this case, one could assume that there were
higher aesthetic requirements from the consumers' point of view at the former areas,
and lower at the motor park places.
Light colored kosai, being the indicator of
freshness, was higher priced than dark colored ones. However, this was statistically
significant only for the central area, where
presumably the higher income population
resided. Also, effective prices of the kosai
prepared using ground-nut oil only was
lower, compared to ones prepared using the
mixed oil. Also, kosai was generally priced
higher in the mornings than in the
afternoons, but this was statistically
significant only for conventional markets.
Table 6: SUR analysis of factors affecting the effective price of kosai in Nigeria
Variable Motor Park Mammy Central Area Conventional Street Market Market
Intercept 1.057 23.945*** 21.212** 9.132 28.841*** Age 0.963* -0.376 0.081 0.733** -0.474 Age2 -0.015** 0.006 -0.003 -0.009* 0.003 Married -1.759* -1 .061 -1.089 0.084 -1.185 Members -0.115 0.197 0.599*** 0.007 0.728*** Experience 0.134** -0.066 0.125* -0.194*** 0.047 Alternative Job 2.504* -0.585 -0.626 0.880 -1.701* Clean Site -1.935* 2.246*** -0.202 0.491 3.303*** Reddish -0.853 0.198 -4.198** 0.686 0.702 Red/Brown 2.475 -1.029 -8.232*** -1.476 0.952 Brownish -0.157 -0.564 -5.411*** 0.063 0.124 Brown 0.174 -1.145 -6.002*** -1.375 -0.504 Groundnut Oil 0.402 -2.352** -1.349 -3.436*** 0.294 Black-Eyed beans 0.729 0.599 -0.340 -0.597 -2.662*** Afternoon -0.144 -0.894 -1.679 -2.958*** 0.288 R2 0.19 0.33 0.34 0.55 0.36
"**, ••, and • represent a;Q.Ol, 0.05, and 0.1 significance levels, respectively
27
Muhammed et al., 2013
CONCLUSIONS AND IMPUCA TIONS
The production and selling of kosai by street
vendors in West Africa is an important
economic activity. The value added
processing activity uses a significant amount
of cowpeas. The nutritious snack is regularly
consumed by everyone - from sma li children
to the elderly and by people from all walks
of life and social classes. The income earning
activity is stereotyped to sex where women
dominated the enterprise. Understanding the
factors that conh·ibute to effective pricing of
the product and success for these women
entrepreneurs is important for economic
development and poverty alleviation.
The kosai processors/vendors are diverse
with respect to both years of experience and
marital status. In addition, they represent all
ages from 15 to 90 years of age. The overall
level of formal education is low for these
women with at least one-half of them having
no formal education.
The results reveal that some product and
location specific characteristics had
statistically significant effect on effective
prices of the product. It is notable that there
are significant differences in effects of
different characteristics in different areas of
the city. So, location of the vendor might be
one of the most important factors that a
vendor should take into account when
making certain product-augmentation
decisions.
This research was conducted based on the
data obtained from Nigeria and Niger
countries. Therefore, the results of this study
may to some extent be generalized for the
whole Western African region. However,
since country specific factors, such as
culture, overall education level, employment
opportunities and international relations, as
well as climate, may differ from country to
country some caution in making the
deterministic statements should also be
taken.
28
REFERENCES
Dalziel, J. M. 1937. The useful Plants of West
Tropical Africa Crown Agents for Oversee
Governments and Administrative. London,
England, 25 pp.
Dovlo, F. E., Williams, C. E. and Zoaka, L.
1976. Cowpeas Home Preparation and Use
in West Africa. International Development
Research Centre, Queen Street, Ottawa,
Canada, p. 96.
Ibro, G., Ferguson, A., Fulton, J. and
Lowenberg-DeBoer, J. 2005. "Women
Entrepreneurs in Cowpea Based Food Micro
Enterprises: Factors for Success."
Presentation at Bean Cowpea Collaborative
Research Support Program All Researcher�
Meeting. Dakar, Senegal, 2005, September 3G
pp.
Langyintuo, A., Lowenberg-DeBoer, J., and
Arndt, T. C. 2003a. "Potential Impacts of the
Proposed West African Monetary Zone on
Cowpea Trade in West and Central Africa,"
AAEA Selected Paper, Montreal, 31 pp.
Langyintuo, A, Lowenberg-DeBoer, J., Faye,
M., Lambert, D., Ibro, G., Moussa, B.,
Kergna, A., Kushwaha, S., and Ntoukam, G.,
2003b. "Cowpea Supply and Demand in
West Africa". Field Crops Research, 82: 215-
231.
Lancaster, K. ]. 1966. "A New Approach to
Consumer Theory," The Journal of Political
Economy, 74(2): 132-157.
Mojduszka, E. M. and Caswell, ]. A. 2000. A
Test of Nutritional Quality Signaling in Food
Markets Prior to Implementation of
Mandatory Labeling, American Journal of
Agricultural Economics, 82: 298-309 . .
Nelson, P. 1970. Information and Consumer
Behavior. Journal of Political Economy, 78: 311-
329.

Analysis of Effective Prices of Kosai in West Africa
Nelson, P. 1974. Advertising as Information.
journal of Political Economy, 82: 729-754.
Simmons, E. B. 1973. The Economic of
Consumer Oriented Food-Processing
Technology in Northern Nigeria. IDRC-016e
(Annex) Ottawa, Canada, 27 pp.
Smi.rl, C. A. and Zoaka, L. 1974. Consumer
Preference Study for Cowpea in Maiduguri.
Pilot Flourmill Minish-y of Natural
Resources, Maiduguri Northeastern State,
Nigeria.
29
Zellner, A. 1962. An Efficient Method of
Estimating Seemingly unrelated Regression Equations and Tests for Aggregation bias.
Journal of the American Statistical Association,
57: 348-368.

Journal of Applied Agricultural Research 2013, 5(2): 31-37 lSSN 2006-750X © Agricultural Research Council of Nigeria, 2013
MOTIV ATIQNAL FACTORS AFFECTING LEVEL OF JOB SATISFACTION AMONG VILLAGE EXTENSION WORKERS OF DELTA STATE AGRICULTURAL
DEVELOPMENT PROGRAMME, NIGERIA
Ofuoku, A. U. Department of Agricultural Economics and Extension,
Delta State University, Asaba Campus, P. M. B. 95074, Asaba, Delta State, Nigeria
[email protected], +2348038784890
ABSTRACT
The study was carried out to assess different motivating variables affecting level of job satisfaction among village agricultural extension agents of Delta State Agricultural Development Programme (DTADP), Nigeria. All (183) the village agricultural extension agents from the three agricultural zones in the state were purposively used for the study, using structured questionnaire for data collection. Data were analyzed using frequency counts, percentages, Chi square and PPMC The findings of the study revealed that lunch allowance (81.9%), high remuneration (80.3%), promotion (80.3%), utility allowances (78.1 %), good pension scheme (73.2%), recognition (72.1 %), sick leave (66.1 %), leave bonus (64.5%), relationship with boss (62.3%), annual leave (63.4%), job security (61.2%), and official vehicle (65.0%) were rated as very important motivating factors. It was further revealed that majority of the field extension agents were poorly motivated for hE"ing excluded from decision making. They were, however, highly satisfied with the basis for and rate of promotion. It is, therefore, recommended that public extension agencies like the ADP should encourage field extension agents' input during decision making and attention should be paid to their reward system.
Keywords: motivation, job satisfaction, hygiene factors, extension agents, remuneration
INfRODUCTION
Efficient management of personnel in agricultural extension agencies is important in boosting their morale and consequently improve agricultural productivity. One important responsibility of agricultural managers is to ensure that there is efficient utilization of human resources with the specific skills, attitudes and motivation that will allow the organizational objectives to. be attained as much as possible (Bermel and Zulderma, 1989). Motivation for improved job satisfaction is an indispens-able aspect of good management and is pro-actiye human resources that could lead to vibrant economy of a nation (Oloruntoba and Ajayi, 2003). Van den Ban and Hawkins (1999) opined
31
that motivation of production workers and professional staff is an important but rather contentious issue in management theory. It is observed that early studies on motivation concentrated on ways by which the individual could be motivated to apply more effort and talent to the service of the employer. Hence, Oforuntoba and Ajayi (2003) stated that the issu.e of motivation has received greater attention now than ever before in personnel management.. According to Argyle (1_983} . culd · Herzberg (1959),· motivation has also stimulated. research on otl\eF areas of endea�our like psychology, · �onomics and agricultUre.
Although writers disagree about the components of management system which
..
Ofuoku, 2013
motivate workers efficiently, at least one or
two writers have suggested two main types
of factors which energize or weaken
workers' activities. Herzberg (1959)
identified two classes of factors relating to
people's attitude to work, which he called
• "the two factors theory". Herzberg (1959)
noted that particular factors seemed to be
associated with dissatisfaction. Factors
involved in producing job satisfaction thus
separate from those causing dissatisfaction.
Herzberg (1959) considered hygiene factors
as preventive actions taken to expunge
sources of dissatisfaction which include; the
physical working environmental conditions,
poor pay, interpersonal relations, and lack of
job security. According to him, once any of
these is lacking, employees are mostly likely
to be dissatisfied and express same.
Conversely, motivation factors are
commonly observed to increase and sustain
job satisfaction, which consequently increase
or raise productivity. These motivational
factors include: achievement, recognition,
responsibility, advancement and the work
itself. All these determine job satisfaction. In the presence of these, employees will muster
all their creative skills and energy to arrive at
a solution in any challenging situation.
Therefore, managers should provide
employees with opportunities for
advancement and recognition, while at the
same time minimizing causes · of
dissatisfaction such as lack of policy, poor
supervision, low salaries and bad working
conditions (Van den Ban and Hawkins,
1999). Odugbesan (1985), Gregson and
Liversey (1986) as cited by Oloruntoba and
Ajayi (2003) indicated that reward is the key
factor that dictates man's attitude to work
while good wage is the most significant
element. Consequently, different things
motivate different people. According to
Archanakhare (2012), enriched jobs lead to
more satisfied and motivated workers.
32
Delta State Agricultural Programme
(DT ADP) is the official agricultural extension
agency of Delta State, Nigeria. The
headquarters is located in Asaba, the state
capital. DT ADP, for adm.inish"ative purposes
demarcated the state into three zones
namely: Delta North, Cenh"al and South
Agricultural zones with headquarters in
Agbor, Effurun and Warri, respectively. Each
of the zones covers local government areas
which form the extension blocks, while the
blocks are made up of villages that form the
extension cells. The blocks are manned by
block extension agents who oversee the cells,
the cells are covered by the village extension
agents (VEAs) who interact or work
frequently with the farm households and
other non-farm households in the cell.
Agricultural research efforts will be
meaningless and futile if research results are
not communicated to farmers. This shows
how important agricultural extension
services are. Agriculture conh"ibutes almost
40% of the gross domestic product of
Nigeria. Hence there is recourse to DT ADP
which is the major extension services
provider of Delta Stale. However, a few
empirical studies on motivation of
employees working in large private
agricultural firms and other selected states
extension agencies are available despite the
fact that the agricultural sector, employer of
most labour, conh"ibutes immensely to the
nation's food security and overall economic
development. Therefore, this study was
embarked upon to address the following
objectives: identify major motivating factors
that influence job satisfaction among village
agricultural extension agents (VEAs) in Delta
State, Nigeria; determine the level of job
satisfaction by the VEAs; determine the
relationship between VEAs demographic
characteristics and motivation; and
determine the relationship between
motivating factors and job satisfaction.
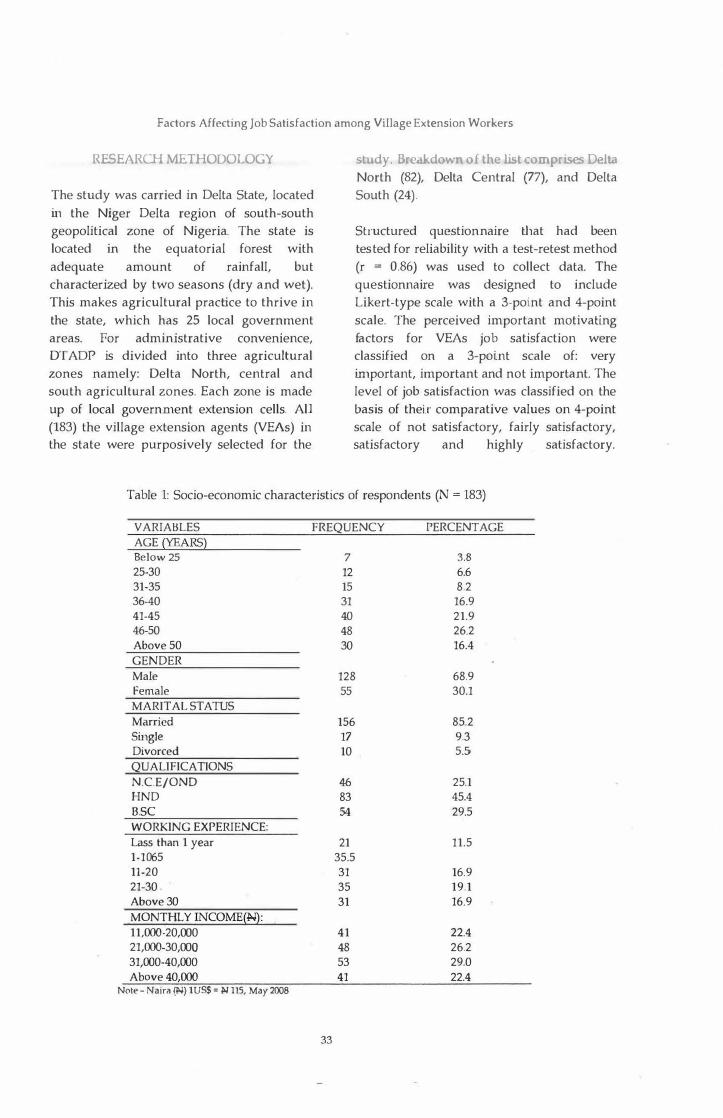
Factors Affecting Job Satisfaction among Village Extension Workers
RESEARCH METHODOLOGY
The study was carried in Delta State, located
in the Niger Delta region of south-south
geopolitical zone of Nigeria. The state is
located in the equatorial forest with
adequate amount of rainfall, but
characterized by two seasons (dry and wet).
This makes agricultural practice to thrive in
the state, which has 25 local government
areas. For administrative convenience,
DT ADP is divided into three agricultural
zones namely: Delta North, central and
south agricultural zones. Each zone is made
up of local government extension cells. All
(183) the village extension agents (VEAs) in
the state were purposively selected for the
study BreakdoY< n of the list comprises Delta North (82), Delta Central (77), and Delta
South (24).
Sb·uctured questionnaire that had been
tested for reliability with a test-retest method
(r = 0.86) was used to collect data. The
questionnaire was designed to include
Likert-type scale with a 3-poi.nt and 4-point
scale. The perceived important motivating
factors for VEAs job satisfaction were
classified on a 3-point scale of: very
important, important and not important. The
level of job satisfaction was classified on the
basis of thei..r comparative values on 4-point
scale of not satisfactory, fairly satisfactory,
satisfactory and highly satisfactory.
Table 1: Socio-economic characteristics of respondents (N = 183)
VARIABLES FREQUENCY PERCENTAGE AGE (YEARS} Below 25 7 3.8 25-30 12 6.6
31-35 15 8.2
36-40 31 16.9
41-45 40 21.9 46-50 48 26.2
Above 50 30 16.4
GENDER Male 128 68.9
Female 55 30.1
MARITAL STATUS Married 156 85.2
Single 17 9.3 Divorced 10 55
QUALIFICATIONS N.C.E/OND 46 25.1 HND 83 45.4
B.SC 54 29.5
WORKING EXPERIENCE: Lass than 1 year 21 11.5
1-1065 35.5
11-20 31 16.9
21-30 ° 35 19.1
Above 30 31 16.9
MONTHLY INCOME(�: 11,000-20,000 41 22.4
21,000-30,000 48 26.2
31,000-40,000 53 29.0
Above 40,000 41 22.4 Note - Naira (W) 1 US$ = W 115, May 2008
33
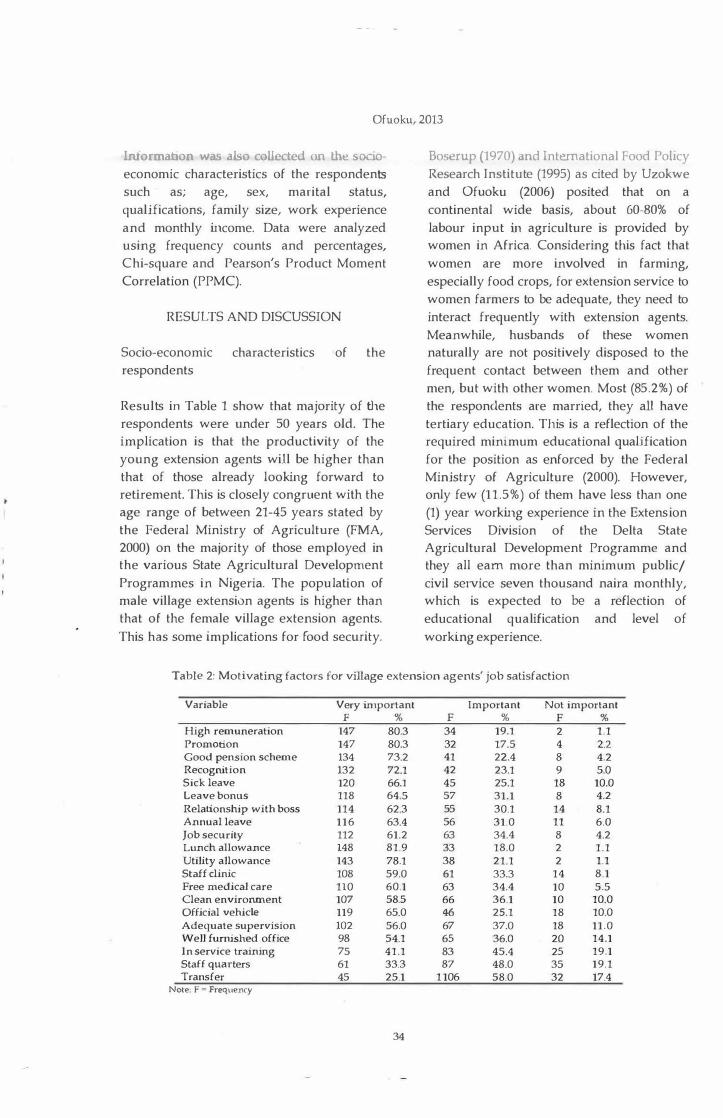
Ofuoku, 2013
lnformaoon !.Vas also collected on thL socin
economic characteristics of the respondents
such as; age, sex, marital status,
qualifications, family size, work experience
and monthly income. Data were analyzed
using frequency counts and percentages,
Chi-square and Pearson's Product Moment
Correlation (PPMC).
RESULTS AND DISCUSSION
Socio-economic characteristics of the
respondents
Results in Table 1 show that majority of the
respondents were under 50 years old. The
implication is that the productivity of the
young extension agents will be higher than
that of those already looking forward to
retirement. This is closely congruent with the
age range of between 21-45 years stated by
the Federal Ministry of Agriculture (FMA,
2000) on the majority of those employed in
the various State Agricultural Development
Programmes in Nigeria. The population of
male village extension agents is higher than
that of the female village extension agents.
This has some implications for food security.
Boserup (1970) and International Food Policy
Research Institute (1995) as cited by Uzokwe
and Ofuoku (2006) posited that on a
continental wide basis, about 60-80% of
labour input in agriculture is provided by
women in Africa. Considering this fact that
women are more involved in farming,
especially food crops, for extension service to
women farmers to be adequate, they need to
interact frequently with extension agents.
Meanwhile, husbands of these women
naturally are not positively disposed to the
frequent contact between them and other
men, but with other women. Most (85.2%) of
the respondents are married, they all have
tertiary education. This is a reflection of the
required minimum educational qualification
for the position as enforced by the Federal
Ministry of Agriculture (2000). However,
only few (11 .5%) of them have less than one
(1) year working experience in the Extension
Services Division of the Delta State
Agricultural Development Programme and
they all earn more than minimum public/
civil service seven thousand naira monthly,
which is expected to be a reflection of
educational qualification and level of
working experience.
Table 2: Motivating factors for village extension agents' job satisfaction
Variable Vety important Important Not important F % F % F %
High remuneration 147 80.3 34 19.1 2 1.1
Promotion 147 80.3 32 17.5 4 2.2
Good pension scheme 134 73.2 41 22.4 8 4.2
Recognition 132 72.1 42 23.1 9 5.0
Sick leave 120 66.1 45 25.1 18 10.0
Leave bonus 118 64.5 57 31.1 8 4.2
Relationship with boss 114 62.3 55 30.1 14 8.1
Annual leave 1 1 6 63.4 56 31.0 11 6.0
Job security 112 61.2 63 34.4 8 4.2
Lunch allowance 148 81.9 33 18.0 2 1.1
Utility allowance 143 78.1 38 21.1 2 1.1
Staff clinic 108 59.0 61 33.3 14 8.1
Free medical care 110 60.1 63 34.4 10 5.5
Clean environment 107 58.5 66 36.1 10 10.0
Official vehicle 119 65.0 46 25.1 18 10.0
Adequate supervision 102 56.0 67 37.0 18 11.0
Well furnished office 98 54.1 65 36.0 20 14.1
In service training 75 41.1 83 45.4 25 19.1
Staff quarters 61 33.3 87 48.0 35 19.1
Transfer 45 25.1 1 106 58.0 32 17.4
Note: F - Frequency
34

: ,1Ct<)rs ,\ffecting Job Sati;-factit'll .1mong V i l lage E"tension Workers
1Yiotivating i,Kt< > ' , for village extension
agents' job satisfact1on
Results in Table 2 show the motivating
factors that influence village extension
agents' job satisfaction. I t was glaring that
high remuneration, promotion, good
pension scheme, recognition, sick leave,
friendly environment, annual leave, job
security, lunch allowance, utility allowance,
free medical care and official vehicle were
rated very important motivating factors by
most of the respondents. Other factors such
as staff clinic, clean environment, adequate
supervision and well-furnished office were
rated important. The village extension agents
may have considered these factors to be
important to their job output or productivity
as extension management cannot achieve its
objectives of agricultural development in a
chaotic environment, despair and
unfriendliness. These findings are congruent
with those of Shief (2008), Oloruntoba and
Ajayi (2003) and Akpala (1991).
Level of satisfaction of the village extension
workers with motivational factors
Majority (56.3%) of the village extension
agents are highly satisfied with the criteria
used for promotion (Ta�le 3). The annual
performance appraisal is a factor which
ensures regular promotion. This is an
encouraging factor which ensures regular
promotion and removal of stagnation froin
the svstem. Irregular �)romotion and
stagnation are discouragin� and surely have
adverse effect on staff productivity. This is in
consonance with the finding of Oloruntoba
and Ajayi (2003) and Gagne et n/. (2010).
Similar result was obtained with respect to
rate of promotion. However, most of the
VEAs (57.4%) were not satisfied with the
reward system. This might affect their
productivity adversely. This finding
supports Huglin (2Q08), Oloruntoba and
Ajayi (2003), Creson and Livesey (1986) and
Odugbesan (1985). This can positively affect
their productivity. Similar result was also
obtained with respect to the extension
organization comrnihnents, as 47.5% were
fairly satisfied with it. In terms of
participation in decision-making, the VEAs
are not satisfied. This means they make little
or no input to decision-taking in the
extension organization. According to
Oloruntoba and Ajayi (2003), an aspiration
gives the employer an idea of the employee's
value system. The result implies that
majority of the VEAs are satisfied with the
level of realization of their aspiration by
working in the Delta State Agricultural
Development Programme. This means that
the VEAs want higher quality of life for
Table 3: Level of satisfaction with motivational factors among the VEAs (N = 183)
Motivating Variable HS s FS NS F % F % F % F %
Basis for promotion 103 56.3 36 19.7 18 9.8 26 14.2 Rate of promotion 85 46.4 54 29.5 4{) 21.9 45 2.2 Reward system 19 10.4 43 23. 16 8.7 105 57.4 Work experience 44 ' 24.0 19 10.4 111 60.7 9 4.9 Extension organization commitment 40 21.9 34 18.6 87 47.5 22 12.0 Participation in decision making 22 30.1 30 16.4 36 19.7 95 51.9 Realization of aspirations 19 10.4 51 27.9 55 30.1 58 31.7
35
llluoh.u, 201.3
Rcla tion� h i �� between �elected ._,,,·i{'·
�>conomtc charactenst1cs and motJ\ .1tnm ot
field extension agents
There was no significant re lationship
(P>O.OS) between the selected socioeconomic variables and field extension
agent's motivation. This may be an
indication that field extension agents'
motivation is not influenced by demographic
characteristics. This result is in consonance
with the finding of Eric (1995) as well as
those of Oloruntoba and Ajayi (2003) that job
related factors are better predictors of job
satisfaction than socio-economic
characteristics. This is at variance with the
finding of Nestor and Leary (2000) that age
and years of working experience had
significant relationship with job satisfaction
of extension faculty in West Virginia
University.
Relationship between motivating factors and
satisfaction
As for the relationship between motivating
factors and job satisfaction, it was
determined that statistically high significant
correlation (r = 0.99, P<O.OS) existed between
non-monetary motivating factors and job
satisfaction. This is a confirmation of the
finding of Oloruntoba and Ajayi (2003) that
non-monetary benefits would probably
increase job satisfaction and productivity. In
a similar study in Pakistan, Ayub (2011)
found a relationship between motivation and
job satisfaction.
This is congruent with Maslow's (1943)
hierarchy of need theory and motivation,
which can be classified as esteem and self
actualization, while the hygiene factors can
be classified as physiological and safety
needs. Therefore, to obtain workers
motivation positively, there is need to
increase the intrinsic interest in the job and
give the workers a sense of responsibility,
achievement, recognition, growth and
36
ovcr;: d l job enrichment. which involve.; job rotahon and 1ob eni;Jrbem�nt (Oioruntoba
and Ajayi, 2003).
CONCLUSION
The design of the study did not allow the
drawing of a generalised conclusion with
respect to motivating factors for field
extension agents. However, the findings
habour implications for the management of
public agricultural extension agencies
especially the Delta State Agricultural
Development Programme. The non
monetary benefits had a direct relationship
with field extension agents' job satisfaction.
The field extension agents desire
remuneration which includes; timely
promotions, recognition, good relationship
with boss and good pension scheme. The
study also indicated that most of the field
extension agents were not satisfied with the
reward system, their exclusion from decision
making and non-realization of their aspirations. The study also showed that
socio-economic characteristics had no
relationship with field agents' motivation in
Agricultural Development Programme
(ADP).
It is, therefore, recommended that public
extension agencies allow village extension
agents to make their input during the
process of decision making. Management of
public extension agencies . should pay
attention to reward systems like official
recognition, good pension scheme, dismissal,
transfer, allowance and in service traiiung.
REFERENCES
Akpala, A. 1991 . Principles of Management:
A Nigerian Approach. Lagos: Fourth
Dimension Publishers Limited.
Archanakhare, I. 2012. Job Enrichment and
Motivation. Retrieved on 18/4/2013 from:
http: II mgmt600. wordpress.com/ au thor I arc
hanakhare21/.

t\r�\ IL', \ ! ! l)S""; rllt' Soci,1 1 f'<;\-cholog\' Ll( work Middlesex. Penguin Book Limited.
Ayub, N. 201 1 . The Relationship between
Work Motivation and job Satisfaction.
Pakistan Busi11ess Review, 7: 332- 347.
Benne!, P. and Zulderma, L. 1989. Human
Resource Management and Agricultural
Research. Overview and Issues. Proceedings
of the Regional Workshop on Human
Resource Management in NARS, Harare,
Zimbabwe, p. 29-38.
Boserup, E. 1970. Women's Role in Economic
Development. New York: St. Martins Press,
George Allen and Union.
Eric, A. P. 1995. Detenninants of job
satisfaction among extension workers in Edo
and Delta States of Nigeria. Proceeding oi
Annual National Conference of AESON. p.
173-177.
Federal Ministry of Agriculture. 2000.
Animal Report on the Agricultural Sector.
Abuja, Nigeria: FMA.
Gagne, M., Forest, J., Gilbert, M. H., Aube,
C., Morin, M. and Malomi, A. 2010. The
Motivation at Work Scale: Validation
Evidence in two Languages. Educational and
Psychological Measurement, 70: 628-646.
Gregson, S. and
:vianagement and
ELBS/Heineman.
Liversey, F. 1986.
Organization. London:
Herzberg, F. W. 1959. The motivation of
Work. New York: John Willey.
Huglin, L. 2008. Week 4 read me first.
Retrieved November 1, 2008, from IPT
5644156/4157 course database.
37
l n tt'rndtional rood Polic\ Rv"I.'MCh lnstitutl'
( IFPRI). 1995. rood Policy �t,1tement. No. 12
Washington, D.C: J FPRI.
Maslow, A. H. 1943. A Theo1y of Human
Motivation. Psychological Review, 50: 370-396.
Nestor, P. I . and Lea1y, P. 2000. The
Relationship Tenure and Non-Tenure Track
Status of Extension Faculty and Job
Satisfaction. Jou rna/ of Extension (Online), 33
(5). Available: http://joe/2000august/
i·b1 .html.
Odugbesan, A. 0. 1985. Motivation: A
Management Tool . Perman Journal,12(1): 13-
14.
Oloruntoba, A. and Ajayi, M. T. 2003.
Motivational Factors and Employees Job
Satisfaction in large-scale Private Farms in
Ogun State, Nigeria. Journal of International
Agricultural and Extension Education, 10(1): 67 -72.
Shief, M. 2008. Motivation and Job
Satisfaction. Boise, Idaho: Boise State
University.
Van den Ban, A. W. and Hawkins, H. S. 1999.
Agricultural Extension London: Blackwell
science.
Uzokwe, U. N. and Ofuoku, A. U. 2006.
Changes in Gender Division of Agricultural
Tasks in Delta State, :--Tigeria :mct Implications for Agricultural Extension
Services. Extension Fanning Systems Journal, 7. :1): 91-96.

· ·· : .

ll'Urnal nf Applied A�ricu l t u r,l l Re�<' 1rch 20D, 5(2). JlJ-5-+ ISSN 2006-750X © Agricultural Research Council of N igeria, 2013
RESOURCE USE EFFICIENCY OF CASSAVA-BASED FARMERS I N OGUN AND OYO STATES, NIGERIA
*Obayelu, A. E., Afolami, C. A. and M. U. Agbonlahor Deparhnent of Agricultural Economics and Farm Management,
Federal University of Agriculture, Abeokuta (FUNAAB), Abeokuta *[email protected]
ABSTRACf
The efficiency with which farmers use the available resources is very important in agricultural production. The main objective of this study was to compare resource use efficiency of cassava farmers in Ogun and Oyo states, Nigeria. The specific objectives were to examine the availability and affordability of agricultural resources in the two states; estimate the existing scales of operation of cassava producers and evaluate the relative resource use efficiency of farmers. Cross-sectional data were collected from 265
cassava farmers (150 in Ogun State and 115 in Oyo State), using a multistage sampling technique. Descriptive statistics, production elasticity from Cobb-Douglas production function and marginal analysis of resource utilization were some of the analytical tools used in the study. The mean farm size cultivated in Ogun State was 2.24 ha and 1.59 ha in Oyo State. Only 5.33 and 17.39 percent farmers in Ogun State and Oyo State, respectively, grew cassava as a sole crop. The prevalent cassava-based cropping systems were cassava intercropped with maize and guinea corn (92.67 percent in Ogun State and 77.39 percent in Oyo State); cassava-yam (14.67 percent in Oyo State): cassava-cowpea (3.48 percent in Ogun State). Producers in the two states were inefficient in their use of resources but there exists enough potential to increase cassava output in the areas. This study therefore suggests cropping larger hectares of land rather than the observed; regulated usage of :1igher quantities of fertilizers and provision of laboursaving devices will help to reduce labour requirements and enhance efficiency.
Keywords: resource-use, efficiency, cassava-based, mixed crop, Nigeria
INTRODUCTION
The term "resource" is a human-centered
concept perceived to have value by humans.
We can therefore talk about availability,
affordability and changes in the use and
distribution of resources in agriculture.
While some resources like water and land
remain fairly stable in thejT use and value,
others such as agrochemical and labour
change a great deal. Resource use efficiency
implies how efficiey;ttly the farmer can use
his resources in the production process. I t is
very important because the resources are
very limited. One way of increasing
39
production by farmers is to efficiently use all
available resources in the production process
(Mesike et al., 2009). The most productive
;.md efficiently used inputs in farming
include land, labour, seeds or plant cuttings
as applicable to crops like cassava and farm
equipment (Olayide, 1980). Land as �
resource is efficiently used through shifting
cultivation practices and other cropping
systems such as mixed cropping system
(Okigbo, 1978), but the full potentials of
land, capital and labour res9urces in many
parts of Nigeria are yet to be efficiently
husbanded for optimum production.
Db,l \ l· l u , ' ,i/., 20 1 ."\
One of the m.1 j or a�ricultu r<1l problems i n
'\!•gena �.:entr• .., ' n t 1e cfftCJenc} 1th 'h��.:h
farmers use resou rces on their farms. One
way of approaching the problem of
increasing production, therefore, is to
examine how efficiently farmers are using
their resources. Even though the government
is making efforts under its agricultural
transformation agenda at increasing
agricultural productivity with the
introduction of various schemes such as
microcredit programmes, sensitization of
farmers on the use of teclmology and
considerable research on the availability, yet
affordability and resource use efficiency of
cassava-based producers are observed to be
very weak (Odoemenem and Otanwa, 2011) .
The average land-holding is still less than
two hectares and for most farmers, land and
family labour remain the essential inputs.
Land is held on a communal basis, inherited
or rented. Access to agricultural resources
such as credit, fertilizer, labour and land
have been observed as constraints to
increasing cassava production but their
effects in Ogun and Oyo states have not been
fully documented.
Due to farm land constraint usually
occasioned by the absence of labour and
other purchased farm inputs for agricultural
production in Nigeria, majority of the
subsistence farmers practise intercropping
for several years without fallow, with no
definite planting pattern (Ayoola and
Makinde, 2007). Cassava value chain is
constrained by low farm productivity / high
unit farm costs. Little or no fertilizers are
applied by farmers. Both soil fertility and crop yields also decline over time
(Amujoyegbe and Elemo, 2011; Uwah et a/.,
2013; Aigbe and Isiorhovoja, 2013). The need
to maximtze agricultural resources is,
therefore, becoming more evident because of
high population pressure and other humcln
activities competing with agriculture for the
limited available resources. Maximization of
resources has not been achievable with
-10
monocu ltu rc with -> i ngiL• h,H\'t•-;t::; per season,
, !'- 5• .s n produLtJ 1 J.A. 11t arLa ur dL1
this system have not been impressive in the
tropical environment ( I ITA, 1 990). Cassava
cultivation for several years usually results
in a decline in soil fertility. lntercropping
cassava with other crops is widely practiced
in Nigeria, but the patterns are location
specific, especially in the range of crop
species that may be intercropped. Babatunde
(2004), Oguoma and Nwosu (2009) and
others have investigated the allocative
efficiencies among farmers in Nigeria but
with varying results. While some have found
farmers as being efficient (Holden and
Shifraw, 1997; Amaza and Olayerni, 1999) others showed that they are inefficient
(Fafchamps, 1998; Adejobi, 2004).
This study, therefore, attempts to assess . the
resources use efficiency of cassava farmers in
Og�n and Oyo states, Nigeria. The study
differs from other similar studies in terms of
the scope. For instance, while Babatunde
(2004), Oguoma and Nwosu (2009) analysed
efficiency of resource use in selected farms in
Kwara State, Nigeria, and resource
management of cassava-based cropping
systems in Imo State, Nigeria, respectively,
this study compares resource use efficiency
of the cassava-based mixed cropping system
of farmers in Ogun and Oyo states. The
study also provides information on the
resource use availability, affordability and
usage particularly among farmers in
cassava-based cropping system in Nigeria
which is believed to be pertinent to policy
makers for a number of reasons. First, it can
be used to quantify suspected regional
disparities and identify which areas are
falling behind in the process of cassava
transformation. A study like this has also
become necessary since cassava intercrop is
the prevalent cropping system in· southern
Nigeria (F AO, 2004) but with little
documentation on farmers perceptions on
resource availability, affordability and
utilization for policy discourse.
rhe tnalll object!\'(' pf thi .; :-;tu,h \\',)-.. t() ilnalyze how agricultural resources were used by cassava fanners in Ogun and Oyo st<ltes, Nigeria. The specific object ives were to: i. exa mine the availability and a ffordability of agricultural resources; i i . estimate the existing scales of operation of cassava producers and 111. evaluate the relative resource use efficiency of farmers.
Conceptual framework
Efficiency is a very important factor of productivity growth, especially in developing agrarian economies where resources are meager and opportunities for developing and adopting better technologies are dwindling. Olukosi and Erhabor (1988)
categorized resources into variable and fixed resources. Variable resources according to them include labour, seeds and fertilizers,
·which are normally used up in one production process. Fixed resources are more durable resources, which contribute to the production process over several production periods. They include land, machinery and farm buildings.
Farrell (1957) observed that production efficiency is divided into technical, allocative and economic efficiencies. Economic efficiency embodies both technical and allocative efficiencies; once the issues of technical inefficiency have been removed from the question of choosing between the set of technically efficient alternative methods of production, allocative efficiency comes to the forefront (Inoni, 2007). A farmer is allocatively efficient if production inputs are allocated according to their relative prices (Torkamani and Hardaker, 1996). It is important to note that a farm using a technically efficient input combination may not be producing optimally depending on the prevailing factor prices. Thus, the allocative efficient level of production is where the farm
operntes a t tlw IL•nst-cost com binn ti on l11 mputs.
The condition of optimum use of input x, as predicted by the theory of equilibrium in factor markets under profit maximization is that the marginal value product (MVP) equals the price of the input (P;). If MVP is lower than P; the resource is over-utilized and lowering the quantity used at the current price will increase the MVP and restore optimality. On the other hand, if MVP is greater than P; the resource is under-utilized and using more of it will bring additional gains to the producer. Allocative efficiency quantifies how near an enterprise is to using the optimal combination of production inputs when the goal is to maximize profit (Richetti and Reis, 2003).
Mesike et al. (2009) stated that one of the strategies for increasing agricultural production is a combination of measures designed to increase the level of farm resources as well as make efficient use of the resources already committed to the farm sector. Fakayode et al. (2008) assessed the productivities oi prevalent cassava-based farms in the large Guinea Savanna ecology of Nigeria using the Total Factor Productivity (TFP). The study revealed that cassava/ maize enterprise with a 4.4 TFP level was the most popular and most productive cassavabased enterprise, followed by the Cassava/ Cowpea, Cassava/Maize/Guinea-<::orn and the Cassava/Melon systems with 4.1, 3.6 and 3.5 TFP levels, respectively. Oguoma and Nwosu (2009) examined the resource use efficiency of cassava-based mixeJ crop farmers in Imo State, Nigeria; the results of the relative profitability of their operations &i\Owed that the identified ::;cates of producers were inefficient ;n �heir use of resources.
Hulugalle and Ezumah (1991), Olasantan et
al. (1996) analyzed the effects of cassavabased cropping systems on earthworms and
Oba \ d u c/ ,,, 20 1 ::'>
observed that these macro-organisms were
more active n mtercroppmg thc11 tn
monocropping systems. Natarajan and
Willey (1980) stated that inter-cropping
systems often result in better land use
efficiencies than sole cropping systems, and
are usually associated with greater
production of total dry matter. Land use
efficiency in general was determined by
calculating the land equivalent ratio (Mead
and Willey, 1980). The monetary returns per
ha are appreciably higher under
intercropping systems, and is mainly due to
the higher value of intercrops (Prabh�ar et
al., 1996).
Polthanee et al. (2007) in their study observed
that when cassava was intercropped with
legumes the cassava root yield generally
decreased compared to when cassava was
planted alone. This according to Polthanee et
al. (2007) was due to the competition of the
component crops for light, water and
nutrients. Inter-cropping cassava with cowpea reduced dry matter yield and the
number of cassava roots significantly and
had no effect on cowpea yield but increased
land use efficiency (Mason and Leihner,
1988). Aderinola et al. (2006) in a study of
comparative analysis of three cassava-based
farming systems in Nigeria which includes:
cassava-sole, cassava plus maize, and ,
cassava plus other crops, concluded that the
cassava expansion program of the Nigerian
Government would enjoy a boost through
the promotion of the cultivation of cassava
with other crops. A similar observation was
made by Chukwuji (2008).
In a study by Nweke (1997), out of 494 fields
surveyed where cassava was grown; 36%,
38% and 26% of the farmers grew the crop as
sole, major and minor crop, respectively.
This implied that in about 74% of all cassava
farms surveyed, the crop was grown as a
major component (Chukwuji, 2008). The
complex crop associations, as obtains in
intercrop farms, serve as an insurance
42
,1gain� t L"rop failure, erosion control and
t:nhaJ .... the u"e o available ·es�o.)Ufl s as
wel l as providing more balanced diets for
the fann ing households ( ! 'olson and
Spencer, 1992; Sullivan, 2001 ; Alabi and
Esobhawan, 2006).
MATERIALS AND METHODS
The Study area
The two selected states for the study are
located in Southwest Nigeria. Ogun State is
situated between latitude 6.2°N and 7.8°N
and longitude 3.0°E and 5.0°E while Oyo
State stretches from latitude 7° N to latitude
9° N and longitude 2.8°E to longitude 4.SOE.
Ogun State has a total land area of
approximately 16,762 square kilometers,
density of 140 people/ square kilometers
and estimated population of 3.7 million,
while Oyo has a land area of 28,454 square
kilometers, population density of 200
people /square kilometers and estimated
population of 5.6 million (National
Population Commission (NPC), 2006). With
projected population growth rate of 3.3%
and 3.4% for Ogun and Oyo states,
respectively, both states are projected to
have estimated populations of 4,765,058 and
7,140,973 in 2013 (NPC, 2006). This implies
that over 87% of the land area in the two
states is suitable for arable crops farming.
Methods of data collection
Primary data were mainly employed for the
study, supported by secondary information
from journal articles, textbooks, internet,
Oyo State Agricultural Development Project
(OYSADEP) and Ogun State Agricultural
Development Project (OGADEP). The
primary data were collected from the
randomly selected sample of cassava
cultivators using a structured questionnaire
and personal interview method.
Resource Usc Efficiency of Cassava Farmers
Sampling technique and sample size
Multistage sampling procedure was adopted
for this study. The first stage was the
purposive selection of Oyo and Ogun states
being among the largest cassava producing
states in the Southwest Nigeria (Moyib et nl., 2013; Phillips et nl., 2004). In the second
stage, each of the states was stratified into
four agricultural zones, which is in line with
the Agricultural Development Project (ADP)
zoning system. In the third stage, one local
government area (LGA) each was
purposively chosen from the zones based on
the intensity of cassava production. In the
fourth stage, the list of producing communities within each selected LGA was
collected from the ADPs and two
communities were purposively selected
based also on the intensity of cassava
production following pilot survey of the
area. In the fifth stage, nineteen cassava
farmers were randomly selected from each selected community giving a total of 152
respondents per state and 304 respondents
altogether for the study. The decision to take
equal sample of cassava farmers across the
states was informed by the difficulty at
getting cassava farmers sample frame in each
of the selected states. A total of 265
questionnaires (150 in Ogun State and 115 in
Oyo State) were returned with an overall
response rate of 87.17 % (98.68% in Ogun
State and 76.67% in Oyo State).
Methods of data analysis
Descriptive statistics such as percentages,
mean, variance and tables were used to
analyse the availability and affordability of
agricultural resources, and to estimate the
existing scales of operation of cassava
producers in the study. In order to ascertain
whether resources were efficiently utilized,
the marginal value product (MVP) of land,
seed, family labour, hired labour, fertilizer
and pesticide were computed and then
compared to their factor costs. Since these
43
variablt>s were expres�cd in physical
quantities in the function estimated, the
MVP of such were compared to their unit
prices to determine the degree of efficiency
in their use.
The MVP of resource provides a framework
for policy decision on resource adjustment
(Adeyemo and Kuhlmann, 2009). The value
of the MVP was compared with the per unit
price of input, which is the marginal factor
cost (MFC) of the input, in order to
determine whether to increase or reduce the
level of the factor used. The divergence
between tl1e acquisition price of the input
and its MVP indicates the scope of resource adjustment necessary to attain economic
optimum. A given resource is optimally
allocated when there is no divergence between its MVP and the MFC of the
resource input.
MVPxi= MPPxi . Pyi = Pxi or MFC . . . 1
Where
MVPxi= Marginal Value Product of Input xi
MPPxi = Marginal .Physical Product of Input
Xi gives information about the output
response to an additional input wifu oilier
factors held constant or fue change in output
resulting from a unit increment or unit
change in variable input. It measures the
amount by which total output increases or
decreases as input increases.
Pyi = Price of ilh Output P xi = Unit Price of Specific Input = MFC
MFC = Marginal Factor Cost of Input used
MPPxi = dy / dXi = Change in quantity of
output/ change in fue quantity of input used.
The regression coefficients, which are equal
to fue elasticity coefficients in Cobb-Douglas
production function (equation 3) was used to
measure the returns-to-scale which shows
fue response of ilie output as all factors of
production change by ilie same proportion.
Obavelu cl al., 20r>
Logn* = b, + bdogX, + bth>gX � (i = � .5) +
b,D;(i = . . . 2) + u . . . 2
Where;
IT* = Normalized profit (profit divided by
geometric weighted average price in naira
per unit of farm output (po) expressed as a
function of the quantity of one fixed input (X1) and the cost of other specified variable
inputs such as x2_, XJ, x4 Xs of production
(adapted from Babatunde, 2004) . xl = land area cultivated in hectares
x2· = labour cost in naira per day divided by
Po
X3' = planting material in naira divided by
Po
N' = agrochemical (fertilizer) costs in naira
divided by Po
Xs' = cost of herbicide divided by Po
Di = dummy variable to capture the scale of
operation (i =1 for small scale cassava-based
operation and 0 otherwise, i =2 for medium
scale cassava-based operation and 0 otherwise, i =3 assuming zero value for the
excluded large-scale group which was used
as base scale cassava-based operation).
U = Error term which is assumed to be
normally distributed with constant variance
bo, hJ, bi are parameters to be estimated.
When hJ +ln + . . . + bs equal one, there is
constant returns to scale, above one indicates
increasing returns to scale, and less than one
indicates decreasing returns to scale.
Marginal analysis of resource utilisation: This is
necessary to determine resource use
efficiency · of some of the inputs used by the
farmers following Oguoma and Nwosu
(2009); Shehu et al., (2007). The allocative
resource use efficiency is specified as:
r = MVP/ MFC . . . 3
Where;
MVP = Marginal Value Product
MFC = Marginal Factor Cost of input (Unit
Price of Input)
r = Resources use efficiency
44
The deusion rule is that when th.: r<� tHl "r"
is:
r = 1 or MVP,; = MFC", n1eam optimum
utilization of resource (that is, farmer
maximizes profit becanse of the optimum
utilization of resources).
If r < 1 or MVPxi < MFC;, it means over
utilization of resources by cassava farmers
(that is, there is indication that more than
profit maximization level if inputs are being
utilized, suggesting that a reduction in the
use of that input is required to increase
efficiency).
If r > 1 or MVPxi > MFCxi, it means under
utilization of resources (that is, there is an
indication that less than profit maximization
level of the resources are being utilized and
therefore, efficiency could be increased by an
increased use of that particular input).
To test the hypothesis that the various scales
of cassava farmers were equally efficient in
resource allocation, their mean allocative
efficiency indices were compared using the
Z-test at 1 % probability level, specified as:
Zmt
Where,
Zeal = Z score
. . .4
K; and ki = Mean efficiency ratios for
each production scale
5;2 and Sp = Variance of efficiency ratios in
resource use by the corresponding
production scale
ni and ni = Sample size of the respective
production scales
In line with Oguoma and Nwosu (2009), a
pair of scale of operations is said to have
equal allocative efficiency if the mean values
for all the inputs obtained for r were equal.
That is:
. . . 5
Where,
K 1 = mean allocat-ive vffici�ncv of sma ll scale
L '1-'-"· ..1-based 1rm
K� = allocative efficiency of medium scale
cassava-based fann
K:J = allocative efficiency of la rge scale
cassava-based farm
RESULTS AND DISCUSSION
Distribution of Labour Used on Cassava
Farm
The mean number of family members and
hired labour that work on cassava fann was
2.55 and 6.07, respectively (Tables 1). The
highest number of family laboUl' that was
available to farmers in Ogun State was 3 and
7 in Oyo State. About 32.1 percent of farmers
in Oyo State had more than 3 family
members who work in the family farm.
Results show that cassava farmers in Oyo
State made use of family labour than their
counterparts in Ogun State. In order to make
up for the shortfa 11 in the supply of family
labour, farmers in Ogun State make use of
hired labour (mean = 7.61) than their
counterparts in Oyo State (mean = 3.94). The
results also show a significant difference
between both states at one percent on the use
of family labour and hired labour in
production. This suggests that farmers in
Oyo State have more access to cheap family
labour than those in Ogun State. The high
hired labour farm inputs in Ogun farms may
be as a result of cheaper cost of labour when
compared to the hired farm labour wage in
Oyo farms. It may also be due to the higher
opportunity cost of the family labour in
Ogun State.
The use of hired labour (mainly casuals) was
found to be prevalent during critical
operations of land clearing, weeding and
harvesting while family labour was mostly
used during planting. Majority of the
farmers (95%) utilising hired labour
complained of labour shortage during the
peak production period. There was no
45
signi ficant difference in the labour man-days use I in Ogun State and 0\'0 <-:t<lte The average family labour man-day was 4.43,
while hired labour was 8.06 (T.:�ble 1). Based
on an average of 1 2 days in the study area
required for land preparation or weeding of
1 ha of land, an average of 96 man-days/ha
of hired labour were used of which family
labour accounted for 48 man-days. This was
in agreement with an average labour
requirement in Thailand for cassava
production (Yangmood, 1994).
Land cultivated by cassava-based farmers in
Ogun and Oyo states
Land is the most important input for
agricultural production but it is generally
believed to be abundant relative to other
inputs. Nigerian farms arP. classified into
small scale, medium scale and large scale.
According to Upton (1972) farm sizes
classification of less than 5 ha should be
classified as small, between 5 ha and 10 ha as
medium, and more than 10 ha as large scale.
Going by the classification of Upton ,1972)
about 92.83 percent of all farm holdings by
the respondents in the study was dassified
as small scale farms and the remaining 7.17
percent as medium, while none was
classified as large farm. This study, therefore,
adapted the classification of Babatunde
(2004) that farm size of 0.01-1.0 ha, 1 .1-2.0 ha
and above 2.0 ha can be classified as small,
medium and large farm, respectively. This is
also supported by Agbonlahor (2012) who
estimated average farm size of farmers in
southern Nigeria as 0.97 ha. Although the
average farm size in Ogun State was
estimated at 2.24 ha and that of Oyo State at
3.40 ha; the mean farm size cultivated,
however, were 2.24 ha and 1.59 ha in Ogun
State and Oyo State, respectively (Table ::!).
There is a significant difference between
both states at one percent for land owned
and land cultivated. About 71.4 and 54.8
percent of the cassava-based farming
population have small farm holdings (<1 ha)

Obayelu et a/., 2013
in Ogun State and Oyo State, respectively.
Similarly, the highest proportion of the
cassava-based farmers in Ogun State (90.0
percent) and Oyo State (49.6 percent) were
cultivating small farm holdings (�1 ha). Tills
corroborates the widely reported view that
small-scale farmers constitute the nerve
centre of food production in Nigeria
(Olayide and Heady, 1982).
Cassava farmers cropping practice with
major reasons
Agricultural production is confronted with
the challenges of identifying management
options that will maximize productivity of
compatible crops in traditional cropping
systems. Cassava grows on marginal lands
where cereals and other crops do not grow
well. It can tolerate drought and can grow in low-nutrient soils (Gobeze et al., 2005).
Cassava has relatively high productivity on
marginal soils, flexible harvest dates and it is
consumed where drought, poverty, and
malnutrition are often prevalent (Dixon et al., 2005). However, a sole crop of cassava,
which is considered a long-season crop, does
not efficiently use the available resources
(land, light, water and nutrients) during its
early growth stages due to its slow initial
development. A short-duration second crop
may be inter-planted to make more efficient
use of these growth factors.
Table 1: Distribution of number of labour used on cassava farm
Family Ogun Oyo Pooled Labour man- Ogun Oyo Pooled labour (Ogun and day used
Oyo)
1 0 (0.0) 34 (29.6) 34 (12.8) 1 0(0.0) 0(0.0) 0(0.0) 2 94 (62.7) 25 (21.7) 119 (44.9) 2 4(2.7) 3(2.6) 7(2.6) 3 56 (37.3) 1 8 (15.7) 74 (27.9) 3 25(16.7) 19(16.5) 44(16.6) 4 0 (0.0) 16 (13.9) 16 (6.0) 4 53(35.3) 46(40.0) 99(37.4) 5 0 (0.0) 15 (13.0) 15 (5.7) 5 39(26.0) 31(27.0) 70(26.4} 6 0 (0.0) 6 (5.2) 6 (2.3) 6 22(14.7) 11(9.6) 33(12.5) 7 0 (0.0) 1 (0.9) 1 (0.4) 7 5(3.3) 5(4.3} 10(3.6) 8 0(0.0) 0(0.0) 0(0.0) 8 2(1.3) 0(0.0) 2(0.8) Total 150 (100.0) 115(100.0) 265 (100.0) Total 150 (100.0) 115(100.0) 265 (100.0) Mean 2.37 2.78 2.55 Mean 4.49 4.37 4.43 Standard 0.49 1.63 1.55 Standard 1.19 1.09 1.14 deviation deviation t-stat. -2.61*** t-stat. -1.12 Distribution of respondents by number of hired labour used
Hired Ogun Oyo Pooled labour man- Ogun Oyo Pooled da used
None 37(24.17) 33 (28.7) 70(26.4) None 37(24.17) 33 (28.7) 70(26.4) 1 9(6.0) 12(10.4) 21(7.9) 1 0(0.0) 0(0.0) 0(0.0) 2 16(10.7) 12(10.4) 28(10.6) 2 0(0.0) 0(0.0) 0(0.0) 3 5(3.3) 12(10.4) 17(6.4) 3 0(0.0) 0(0.0) 0(0.0) 4 7(4.7) 15(13.0) 22(8.3) 4 0(0.0) 1 (0.9) 1(0.4) 5 8(5.3) 12(10.4} 20(7.5) 5 2 (1.3} 1(0.9) 3(1.1) 6 9(6.0) 8(7.0) 17(6.4) 6 9(6.0) 3(2.6) 12(4.5) 7 25(16.7) 6(5.2) 3(11.7) 7 23(15.3) 13(11.3) 36(13.6) �8 34(22.67) 5(4.4) 39(14.72) �8 79(52.7) 64(55.7) 143(64.0) Total 150(100) 1 15(100) 265 Total 150(100) 1 15(100) 265(100.00) Mean 7.61 3.94 6.07 Mean 7.98 8.23 8.06 Standard 5.93 2.09 5.05 Standard 1.11 1 .20 1.10 Deviation Deviation t-stat 16.79*** t-stat -1.13 Note: Values in parenthesis are in percent and those outside, the frequency. The man-day is defined as an adult male working time in a day and -"Significance at 1% level Source: Field Survey data, 2011
46
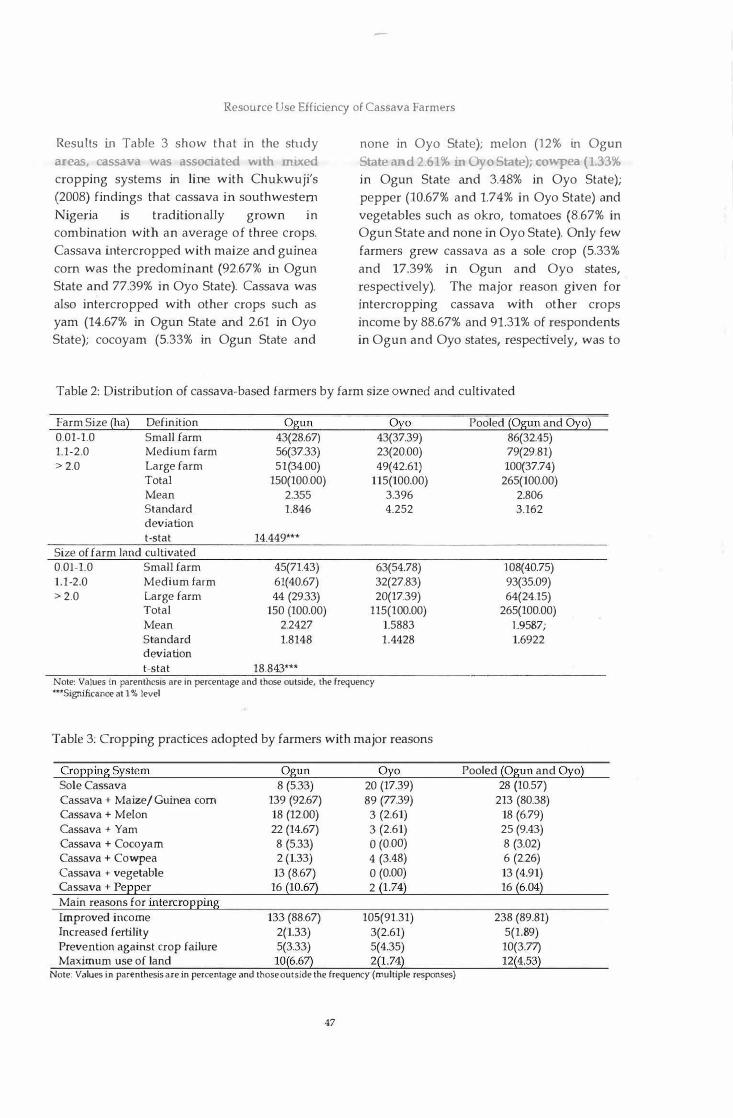
Resource Use Efficiency of Cassava Farmers
Results in Table 3 show that in the study
areas, cassava was associated with mixed
cropping systems in line with Chukwuji's
(2008) findings that cassava in southwestern
Nigeria is traditionally grown in combination with an average of three crops.
Cassava intercropped with maize and guinea
com was the predominant (92.67% in Ogun
State and 77.39% in Oyo State). Cassava was
also intercropped with other crops such as
yam (14.67% in Ogun State and 2.61 in Oyo
State); cocoyam (5.33% in Ogun State and
none in Oyo State); melon (1 2% in Ogun
State and 2.61% in Oyo State), cowpea (1.33% in Ogun State and 3.48% in Oyo State);
pepper (10.67% and 1.74% in Oyo State) and
vegetables such as okro, tomatoes (8.67% in Ogun State and none in Oyo State). Only few
farmers grew cassava as a sole crop (5.33%
and 17.39% in Ogun and Oyo states,
respectively). The major reason given for
intercropping cassava with other crops
income by 88.67% and 91.31% of respondents
in Ogun and Oyo states, respectively, was to
Table 2: Distribution of cassava-based farmers by farm size owned and cultivated
Farm Size (ha) Definition Ogun Oyo 0.01-1.0 Small farm 43(28.67) 43(37.39) 1.1-2.0 Medium farm 56(37.33) 23(20.00) > 2.0 Large farm 51(34.00) 49(42.61)
Total 150(100.00) 115(100.00) Mean 2.355 3.396 Standard 1.846 4.252 deviation t-stat 14.449***
Size of farm land cultivated 0.01-1.0 Small farm 45(71.43) 63(54.78) 1.1-2.0 Medium farm 61(40.67) 32(27.83) > 2.0 Large farm 44 (29.33) 20(17.39)
Total 150 {100.00) 115{100.00) Mean 2.2427 1.5883 Standard 1.8148 1.4428 deviation t-stat 18.843***
Note: Values in parenthesis are in percentage and those outside, the frequency -Significance at 1% level
Table 3: Cropping practices adopted by farmers with major reasons
Cropping System Sole Cassava Cassava + Maize/ Guinea corn Cassava + Melon Cassava + Yam Cassava + Cocoyam Cassava + Cowpea Cassava + vegetable Cassava + Pepper Main reasons for intercropping Improved income Increased fertility Prevention against crop failure Maximum use of land
Ogun 8 (5.33)
139 (92.67) 18 (12.00) 22 (14.67) 8 (5.33) 2 {1.33)
13 (8.67) 16 {10.67)
133 (88.67) 2(1.33) 5(3.33)
10(6.67)
Oyo 20 {17.39) 89 (77.39) 3 (2.61) 3 (2.61) 0 (0.00)
4 (3.48) 0 (0.00) 2 {1 .74)
105(91.31) 3(2.61) 5(4.35) 2(1.74)
Note: Values in parenthesis are in percentage and those outside the frequency (multiple responses)
47
Pooled (Ogun and Oyo) 86(32.45) 79(29.81)
100(37.74) 265(100.00)
2.806 3.162
108(40.75) 93(35.09) 64(24.15)
265(100.00) 1.9587; 1.6922
Pooled (Ogun and Oyo) 28 {10.57)
213 {80.38) 18 (6.79) 25 (9.43) 8 (3.02) 6 (2.26) 13 (4.91) 16 (6.04)
238 (89.81) 5(1.89) 10(3.77) 12(4.53)
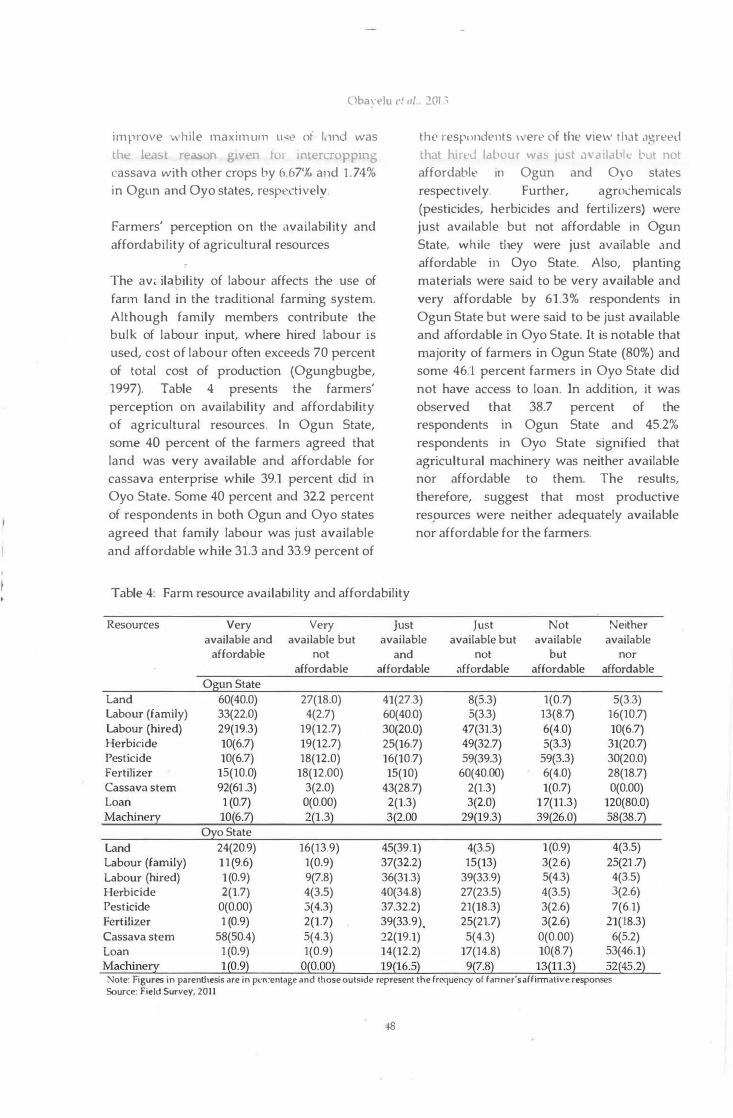
Obayelu et a/ . lOJ 1
improve while maximum u-..e of 1,1nd was
1e I <, re�so' �JVen '1tP LH'DPll1o, cassava with other crops by 6.67'){, and 1 .74%
in Ogun and Oyo states, respectively.
Farmers' perception on the availability and
affordability of agricultural resources
The av; il�bility of labour affects the use of
farm land in the traditional farming system.
Although family members contribute the
bulk of labour input, where hired labour is
used, cost of labour often exceeds 70 percent
of total cost of production (Ogungbugbe,
1997). Table 4 presents the farmers'
perception on availability and affordability
of agricultural resources. In Ogun State,
some 40 percent of the farmers agreed that
land was very available and affordable for
cassava enterprise while 39.1 percent did in
Oyo State. Some 40 percent and 32.2 percent
of respondents in both Ogun and Oyo states
agreed that family labour was just available
and affordable while 31.3 and 33.9 percent of
the respondents were of the view that agreed that hnl'd labour was just :l\'ailabtt:.· bJt not
affordable in Ogun and Oyo states
respectively. Further, agrochemicals
(pesticides, herbicides and fertilizers) were
just available but not affordable in Ogun
State, while they were just available and
affordable in Oyo State. Also, planting
materials were said to be very available and
very affordable by 61.3% respondents in
Ogun State but were said to be just available
and affordable in Oyo State. lt is notable that
majority of farmers in Ogun State (80%) and
some 46.1 percent farmers in Oyo State did
not have access to loan. In addition, it was
observed that 38.7 percent of the
respondents in Ogun State and 45.2%
respondents in Oyo State signified that
agricultural machinery was neither available
nor affordable to them. The results,
therefore, suggest that most productive
res,ources were neither adequately available
nor affordable for the farmers.
Table 4: Farm resource availabi lity and affordability
Resources Very Very Just Just Not Neither available and available but available available but available available
affordable not and not but nor affordable affordable affordable affordable affordable
0 n State Land 60(40.0) 27(18.0) 41(27.3) 8(5.3) 1(0.7) 5(3.3) Labour (family) 33(22.0) 4(2.7) 60(40.0) 5(3.3) 13(8.7) 16(10.7) Labour (hired) 29(19.3) 19(12.7) 30(20.0) 47(31.3} 6(4.0) 10(6.7) Herbicide 10(6.7) 19(12.7) 25(16.7) 49(32.7) 5(3.3) 31(20.7) Pesticide 10(6.7) 18(12.0) 16(10.7) 59(39.3) 59(3.3) 30(20.0) Fertilizer 15(10.0) 18(12.00) 15(10) 60(40.00) 6(4.0) 28(18.7) Cassava stem 92(61 .3} 3(2.0) 43(28.7) 2(1.3} 1(0.7) 0(0.00) Loan 1 (0.7) 0(0.00) 2(1.3) 3(2.0) 17(11.3} 120(80.0) Machinery 10{6.� 2{1.3} 3{2.00 29{19.3} 39{26.0} 58{38.�
o State Land 24(20.9) 16(13.9) 45(39.1} 4(3.5) 1(0.9) 4(3.5) Labour (family) 11(9.6) 1(0.9) 37(32.2) 15(13) 3(2.6) 25(21 .7) Labour (hired) 1(0.9) 9(7.8) 36(31.3) 39(33.9) 5(4.3) 4(3.5) Herbicide 2(1.7) 4(3.5) 40(34.8) 27(23.5) 4(3.5) 3(2.6} Pesticide 0(0.00) 3(4.3) 37.32.2) 21(18.3) 3(2.6) 7(6.1} Fertilizer 1 (0.9) 2(1.7) 39(33.9). 25(21.7) 3(2.6) 21(18.3) Cassava stem 58(50.4) 5(4.3) 22(19.1) 5(4.3) 0(0.00) 6(5.2) Loan 1 (0.9) 1(0.9) 14(12.2) 17(14.8) 10(8.7) 53(46.1) Machinery 1(0.9) 0(0.00) 19(16.5) 9(7.8) 13(11 .3) 52(45.2)
Note: Figures in parenthesis are in pen:entage and those outside represent the frequency of fanner's affirmative responses Source: Field Survey, 2011
-18

Table 5: Resource use efficiency of cassava-based fam1ers
Inputs Ogun Stale Oy_o State Pooled {Ogun and Oyo) EP MPP MVP MFC EP MPP MFC MVP EP MPP MFC MVP
Land cultivdted (ha) -0.0690 -0.023 -0.909 5,328.18 -0.00017 -0.1423 0.021 12,189.86 0.191 1.566 -0.0869 0.080 9,802.21 2.1-!7 0.000219
Labour (N/manday) 0.2093 -0.219 -8.653 1,438.61 -0.00601 0.0868 -0.830 1,308.20 -7.733 -0.0059 0.1319 -1.030 1,388.93 -27.6-!5 -0.0199
Herbicide (N/litre) 0.1116 12.657 500.078 1,194.07 0.4188 0.3700 -5.033 913.50 -46.872 -0.0513 0.3013 -4.010 1,071.32 -107.b28 -0 100�
Agrochemical (fertilizer N/kg) 0.4198 3.935 155.471 99.47 1.5630 0.1284 -33.8!J7 87.93 -315.679 -3.5901 0.3932 -21.187 94.03 -568.659 -6 om
Planting material (N/bundle*) 0 .5178 U55 57.487 252.37 0.2278 0 .3048 -15.721 229.52 -146.408 -0.638 0.3082 -2.107 243.6-! -56.55"1 -0.2:\2 Retu m tu Seal�
(RTS) 0.6717 Mean allocative efficienly 0.4407 0.4421} Mean allocative efficiency -0.5439 1.0477 Mean a !locative efficiency -1 .2800
Note: Ep = �lasticity of production, MFC - unit price of input, r = resource use �fficiency, • a bundle conL1ins about 50 cassava sticks of I m .md between 50 to 60 bundles are rt'quired to plrlnl l h,: of l,md dep.:nding on th,• pl.mting space. Source: Oat.! obt.lined n.; .. , field surh')', 2011

Obayelu et al., 2013
Resource USP efficiency of cassava-based
farming system in Ogun and Oyo states
One way of increasing production by the
small farmers is to efficiently use all the
resources available in the production
process. However, farmers' output was
elastic with respect to the age of the farmers,
level of education, number of extension
contacts, membership of social groups,
fertilizer application and farm size. This implied that a change in the level of any of
these variables will result in more than
proportionate change in farmers' output.
Nonetheless, the inelasticity of variables
such as hired labour, quantity of seed used,
agrochemicals and level of capital is a clear
indication of the fact that increments in such
farm inputs do not necessarily translate to
corresponding change in farmers output.
Production elasticity values in Table 5 shows
that farmers' outputs with respect to inputs used in Ogu.n and Oyo states were inelastic,
indicating that a change in the level of any of these variables will also result in less than
proportionate change in farmers' cassava
output. Hence, the need for optimum and effective deployment of farm inputs
alongside sustainable agricultural practices
The Returns to Scale (RTS) on the other
hand, calculated as the sum of individual
production inputs elasticities of 0.6717 in
Ogun State and 0.4429 in Oyo State implied
that there was decreasing returns - to- scale
by 0.67 and 0.44, respectively, in farms in
both states.
The results in Table 5 show that except for
fertilizers usage in Ogun State and land cultivated in Oyo State that were under
utilized, all other production inputs (herbicides, labour, cassava-cuttings) were
over-utilized. This means that increase in the
use of fertilizer in Ogun State and area of
land cultivated in Oyo State will lead to
further increase in output.
The hypothesis that the various scales of
cassava operators was equally efficient in
their resources allocation was rejected in the
study areas (Ogun and Oyo states) when
examined in relation to tl1e mean efficiency
index (Table 6). The computed Z-scores for each pair of cassava producers were found to
be significantly different from tl1eir critical
val!J.e at 1% leading to the rejection of the
null hypothesis in each case.
Table 6: Results of the Z-test for resource-use efficiency of operators at various scales
Pair of scale operators Computed Z-score Critical Z-value at 1% Decision level of significance
0 State Small scale versus medium -1.89 0.059 Accept scale Small scale versus large scale -0.80 0.425 Reject Medium scale versus large scale 0.81 0.417 Reject
0 o State Small scale versus medium 1.79 0.073 Accept scale Small scale versus large scale 1 .74 0.082 Accept Medium scale versus large scale 0.05 0.963 Reject
Pooled {Ogun and Oyo) Small scale versus medium -0.25 0.805 Reject scale Small scale versus large scale 0.88 0.379 Reject Medium scale versus large scale 1.33 0.260 Reject
Source: Field survey, 2011
50
Resource U-;e Eit1cienc1' ,11 C<1ssav<1 F<1rmers
CONCLUSION AND RECOM MEl\fDA TIONS
This study examined resource-use efficiency among cassava-based mixed cropping farmers in Ogun and Oyo states. The result indicates that some degree of inefficiency exist among cassava fanners in Oyo and Ogun states. The level of inefficiency was lower among cassava producers in Oyo State than those in Ogun State. Cassava production has a decreasing return-to-scale in Ogun and Oyo states though profitable in both. In Ogun State, production inputs such as land, labour, herbicides and planting material (cassava sticks or cuttings) are overutilized while fertilizer was under-utilized. In Oyo State, apart from land, which was under-utilized, all other inputs were overutilized meaning that opportunities still exist to increase output by increasing the level of these inputs.
To attain allocative efficiency by cassavabased mixed cropping farmers in Oyo and Ogun states, farmers should make some necessary adjustments in their use of production resources. In addition, farmers who want to go into cassava-based mixed cropping system should be encouraged on the need to combine their production with leguminous crops such as cowpea so as to save costs from other inputs.
ACKNOWLEDGEMENI'S
The authors gratefully acknowledge the funding support of Tertiary Education Trust Fund (TETFUND) through Institute of Food Security, Environmental Resources and Agricultural Research (IFSERAR), Federal University of Agriculture Abeokuta (FUNAAB) Ogun State, Nigeria to carry out this study. We also acknowledge the African
Growth · and Development Policy (AGRODEP) for a travel grant to present part of the findings at the 4th African
51
Association of Agricu l t u rc1l Economics Conference , Ithmamet, Tun1sia, 2013.
REFERENCES
Adejobi, A. 0. 2004. Rural Poverty, Food Production, and Demand ln Kebbi State, Nigeria, Unpublished PhD thesis; Department of Agricultural Economics, University of Ibadan.
Aderinola, E. A., Fasoranti, M. M. and Ojo, S. 0. 2006. Resource-productivity in CassavaBased farming systems in Ondo state: Implications for the cassava expansion program in Nigeria. Applied Tropical Agriculture, 11(1 & 2): 40-46.
Agbonlahor, M. U., Enilolobo, 0. S., Sodiya, C. 1., Akerele, 0. and Oke, J. T. 2012.
Accelerating Rural Growth . 'through Collective Action: Groups' Activities and Determinants of Participation in Southwestern Nigeria. Journal of Rural Social
Sciences, 27(1): 114-13.
Aigbe F. 0. and Isiorhovoja, R. A. 2013. Crop Productivity, Land Degradation and Poverty Nexus in Delta North Agricultural Zone of.
Delta State, Nigeria. Journal of Agricultural
Science; 5 (4); 85-93.
Alabi, R. A. and Esobhawan, A. 0. 2006.
Relative economic value of maize-okra intercrops in rainforest Zone, Nigeria. Journal
of Central European Agriculture, 7(3): 4�-438.
Amaza, P. S. and Olayemi, J. K. 1999. An Investigation of Production Efficiency in Food Crop Enterprises, Combe State, Nigeria. Journal of Rural Economics and
Development, 13(2): 11-122.
Amujoyegbe B. ]. and K.A Elemo 2011.
Decline in crop prdductivity �n Nigeria: A
review of possible strategies for self-reliance,
increase and sustained production. Journal of
Obayelu et a/., 2013
Agriculhtre and Biological 'lclellccs, 3(1): 250-
256.
A yoola 0. T. and Makin de, E. A. 2007.
Fertilizer Treabnent Effects on Performance
of Cassava under Two Planting Patterns in a
Cassava-based Cropping System in South
West Nigeria. Res. J. Agric. Bio. Sci., 3(1): 13-
20.
Babatunde, R. 0. 2004. Efficiency of Resource
use in Selected Farms in Kwara State of
Nigeria. A Profit-Functio.n Approach. journal
of Resource and Development, 3:47-59.
Chukwuji, C. 0. 2006. Factor productivity
and technical efficiency in Cassava-Based
Food Crop Production Systems in Delta
State, Nigeria. Unpublished PhD Thesis.
Delta State University, Abraka, Nigeria.
Chukwuji, C. 0. 2008. Comparative analysis of enterprise combinaHon costs and returns
in cassava-based food crop farming systems
in Delta, Nigeria. Journal of Agricultural and
Biological Sciences, 3(4): 27-32.
Dixon, A. G. 0., Ssemakula, G. N., Maziya
Dixon, B. and Mkumbira, J. 2005. Genetic
enhancement of beta carotene, iron and zinc
contents in cassava for alleviating
micronutrient deficiency. African Crop
Science Conference Proceeding, 7: 169-173.
Fafchamps, M. 1998. Efficiency in Intra
household Resource Allocation. Food
Consumption and Nutrition Division
(FCND), Discussion Paper, No. 55, IFPRI,
Washington D.C. USA, Dec. 1998.
Fakayode, S. B., Babatunde, R. 0. and
Rasheed, A. 2008. Productivity Analysis of
Cassava-Based Production Systems in the
Guinea Savannah: Case Study of Kwara
State, Nigeria. American-Eurasian Journal of
Scientific Research, 3(1): 33-39.
52
FAO (Food and Agricultural Organization)
200-l. Annual Stausllcs . .kome, Italy
Farrell, J. M. 1957. The Measurement of
Productive Efficiency. journal Royal Statistics,
506, 120, Part (III): p. 253-290.
Gobeze, L., Legese, H. and Markos, D. 2005.
Screening of inter and intra row spacing on
yield and yield components of cassava in
moisture stress. African Crop Science
Conference Proceedings, 7: 147-150.
Hulugalle, N. R. and Ezumah, H. C. 1991.
Effects of cassava-based cropping systems on
physico-chemical properties of soil and
earthworm casts in a tropical Alfisol.
Agriculture Ecosystems and Environment, 35(1):
55-63.
International Institute of Tropical
Agriculture (IITA). 1990. Cassava in Tropical
Africa. A Reference Manual. 176 pp.
Inoni, 0. E. 2007. A llocative efficiency in
pond fish production in Delta State, Nigeria:
A production function approach. Agricultura
Tropica Et Subtropica, 40(4): 127-134.
Mason, S. C. and Leihner, D. E. 1988. Yield
and Land-Use Efficiency of a Cassava/
Cowpea Intercropping System Grown at
Different Phophorus Rates. Field Crops
Research, 18: 215-226.
Mead, R. and Willey, R. W. 1980. The
concept of a land equivalent ratio and
advantages in yield from intercropping.
Experimental Agriculture, 16: 217-218.
Mesike, C. S., Owie, 0. E. D. and Okoh, R. U.
2009. Resource-Use Efficiency and Return to
Scale in Smallholders Rubber Farming
System in Edo State, Nigeria. Journal of
Human Ecology, 28(3): 183-186.
Moyib, F. R., Akinwumi, J. A. and Okoruwa,
V. 2013. Resource-Use Efficiency of Female
cassava Farmers in Rain- Forest Zone of
Resource Use Efficiency of Cassava Farmers
Ogun State. Joumal of Agrzculture and
BiodwersitlJ Research, 2(2): 17-23.
National Population Commission (NPC).
2006. NPC population figures. Available
online at http:/ / www.nigeriavillage
square. com/ articles/ nvs/npc-releases-2006-
population-figures-1 4.html.
Natarajan, M. and Willey, R. W. 1980.
Sorghum/ pigeon pea intercropping and
effects of plant population density. I. Growth
and yield. Joumal of Agricultural Science, 95
(4): .51-58.
Nweke, F. I. 1997. Cassava is a cash crop in
Africa: A viewpoint. IITA Research, No.
14/15: 26-27.
Oguoma, N. N. 0. and Nwosu, F. 2009.
Resource Management of Cassava-based
cropping systems in Imo State, Nigeria.
Journal of Economic Theory, 3(3): 33-40.
Odoemenem I. U. and Otanwa, L. B. 2011.
Economic Analysis of Cassava Production in
Benue State, Nigeria. Current Research Journal
of Social Sciences, 3(5): 406-411.
Ogungbugbe, 0. H. 1997. Economics of
Cassava Production by Peasant Farmers in
Oriade Local Govt. Area of Osun State.
Unpublished thesis presented to Department
of Agricultural Economics, University of
lbadan, Nigeria.
Okigbo, B. N. 1978. Cropping systems and
related research in Africa. Special issue On
the occasion of the 10th anniversary of the
Association of the Advancement of Agricultural Science in Africa (AAASA), p.
127.
Olasantan, F. 0., Ezumah, H. C. and Lucas,
E. 0. 1996. Effects of intercropping with
maize on the micro-environment, growth
and yield of cassava. Agriculture, Ecosystems
and Environment, 57(2-3): 149-158.
53
Olayidc, S. 0. 1 980. Characteristics, Problems
and Sigrufxcance of ra.rmers. In. �. 0. OlaiOt!,
Eweka Bello (Eds.): Nigeria Small Farmers.
Problems and Prospects in Integrated Rural
Development. Published by centre for
Agricultural, Rural and Development
(CARO), University of lbadan, Nigeria, p. 1-
15.
Olayide, S. 0. and Heady, E. C. 1982.
Introduction to Production Economics. Ibadan
University press, Ibadan, p. 42.
Olukosi, J. 0. and Erhabor, P. 0. 1988.
Introduction to Farm Management Economics.
Principles and Applications. AGIT AB
Publishers Ltd, Zaria, Nigeria.
Phillips, T. P., Taylor, D. S., Sanni, L. and
Akoroda, M. 0. A. 2004. Cassava industrial
revolution in Nigeria: The potential for a
new industrial crop. IFAD/FAO/UN Rome
2004, 49-56.
Polthanee, A., Wanapat, S., Wanapat, M.
and Wachirapokorn, C. 2007. Cassava
Legumes inter-cropping: A potential food
feed system for dairy farmers. Available
online at http://www.mekarn.org/procKK/
polt.htm.
Polson, R. A. and Spencer, D. S. E. 1992. The
technology adoption process in subsistence
agriculture: The case of cassava in south
eastern Nigeria. IITA Research, (5): 12-16.
Prabhakar, M., Nair, G. M. and Ghosh, S. P.
1996. Intercropping legumes with cassava.
Agric. Inti., 47(11): 126-128.
Richetti, A. and Reis, R. P. 2003. The Soybean
Production Frontier and Economic Efficiency
in Mato Grosso do Sui, Brazil. Revista de
Economia e Sociologia Rural, 41(1): 1-11.
Shehu, J. F., Tashikalma, A. K. and Gabdo,
G. H. 2007. Efficiency of Resource use in
Small Scale Rain-Fed Upland Rice
Production in Northwest Agricultural Zone
Obilyelu ct nl., 2013
of \damaw<1 St<1te, Niger ia . Paper �'resented at 9th Annual National Conference of
Ni�eria Association of Agricu ltural
Economics (NAAE) Held at ATBU, Bauchi,
Nigeria.
Su II ivan, P. 2001. Intercropping Principles
and Practices. Appropriate technology
transfer for rural areas. Fayetteville, AR
72702.
Torkamani, J. and Hardaker,J. B. 1996: A
study of economic efficiency of Iranian
farmers in Ramjerd district: "An application
of stochastic programming". Agricultural
Economics Journal, 14(2): 73-83.
54
Upton, M 1972. " Farm :VL.1nil�cment m
Nigeria" o, casional Paper, Department of
Agricultural Economics, University of
Ibadan, Nigeria.
Uwah, D. F , Effa E. B., Ekpenyong, L. E. and
Akpan, I. E . 2013. Cassava (Manihot esculenta
Crantz) Performance as influenced by
Nitrogen and Potassium fertilizers In Uyo,
Nigeria. Tl1e Journal of Animal and Plant
Sciences, 23(2): 550-555.
Yangmood, A. 1994. Cassava Situation in Thai. In: Cassava Monograph II. DOA. Bangkok. p.
193-205.
Journal of .-\pplied Agr cul tur<�l Re;,e<�rch 2013, 5(2): 55-60 ISSN 2006-750X © Agricultu ral Research Council of Nigeria, 20B
PRELIMINARY STUDY OF MARKET POTENTIALS OF EDIBLE FROGS IN NJGERIA
*Nwabeze, G. 0. and A. N. Okaeme National Institute for Freshwater Fisheries Research,
P.M.B. 6006, New Bussa, Niger State, Nigeria *[email protected]
ABSTRACT
This study examined market potentials of edible frogs in Nigeria. A sample size of 126 respondents was selected through purposive sampling in eight states in the country. Instrument for data collection was semi-structured questionnaire. Data were analyzed using descriptive statistics. The results showed that majority (54.8%) of the respcndents fall within the age bracket of 21 to 40 years. Most of the respondents were males (60.3%). About 66.7% of the respondents agreed that frog is consumed by young people while 33.3% agreed that frog is consumed by all categories of people (children, adolescent and adult). The result also indicated that a carton of frog weighing about 10 kg is sold for N4,500, N3,500 and N2,500 for the period of dry season, harmattan period and rainy season, respectively. It is recommended that awareness of frog business as alternative source of livelihoods should be intensified by extension agents.
Keywords: Market, Edible, Frog, and Nigeria
INTRODUCTION
Frog is a non-fin fish aquatic resource. Edible frogs are one of the world's largest non-fish aquatic families with many of the species believed to be familiar (Anon, 1999). Apart from fish, frogs are the next most dominant aquatic vertebrates in terms of their number and distribution. Most edible frogs stay close to fish culture systems, streams, lakes and reservoirs, rich . in aquatic and littoral vegetation. The African giant frog is the largest of a_ll true (edible) frogs; it grows as long as 66 em and weighs as much as 4.5 kg. Frogs aid humans. in many ways. They control insect pest in woods, farms and gardens and several species have been introduced into various parts of the world as a defence against undesirable insects. They are widely used as food, for recreation and are of medicinal value (Gray, 2006;
Marantelli, 1999). Frogs are also important to
ss
research and medical laboratories because their skeletal, muscular, digestive, nervous, and other systems are similar to those of higher animals. Frogs are cheap alternative source of feed for catfish and poultry.
In Nigeria, there exists a high level of potential for frog business. However, efforts have not been made to culture frogs for both market and household consumption, but frogs eaten today in the country are generally captured from their natural habitat. They are harvested from ponds ' and watej' logged areas within rural and urban settlements.
The objective of the study is to carry out survey of edible frogs in Nigeria and in specific terms to determine some selected perso�al characteristics of the respondents in the study area; produce a preliminary report on the acceptability of edible frogs as a
Nwabeze and Okaeme, 2013
source.-of protein in Nigeria; find out existing frog marketers/ dealers union(s); identify
_, i frog market and its framework; and provide a baseline information for future study of the biology ap.d culture of edible frogs.
f MATERIALS AND METHODS
Sampling procedure and sample size
Multi-stage sampling technique was used for the study. The first stage was the stratification of the cow1try into the existing six geo-political zones, namely; northeast, northwest, north-central_ southwest, southeast and south-south, and selection of Four (66.7%) out of the six zones, Second was the identification of states within the zones based on active involvement in frog business thus; Benue, Bomo, Delta, Kano, Kebbi, Kogi and Niger states were purposively selected from the chosen zones. The third step was purposive selection of 18 respondents in each of the selected states (Markurdi, Maiduguri, Obiaruku, Kano, Yauri, Lokoja and New Bussa for Benue, Borno, Delta, Kano, Kebbi, Kogi and Niger states, respectively) based on the willingness of the respondents to provide necessary information to the researcher. Therefore, a total of 126 respondents formed the sample size for the study.
·
Measurement of variables
Variables for the study include selected socio-economic characteristics of the respondents, acceptability of edible frogs as protein source, frog market and its framework and identified species of edible frogs in the market.
Selected socio-economic characteristics of the respondents
Age: Respondents were asked to indicate their actual age in years.
56
Educational backgroul!d: Respondents were asked to indicate from the list provided, their level of education as no formal education, primary education, secondary education and tertiary education. Sex: Respondents were asked to indicate their sex. Ethnicil:t;: Respondents were asked to state their ethnicity. Marital status: Respondents were asked to indicate their marital status as single, married, divorced and widowed. Family size: Respondents were asked to indicate the number of dependents that live under one roof and also eat from their pot.
Acceptability of edible frogs as protein source
This was expressed in terms of awareness of frog as source of food and animal protein, gender consideration for frog consumption, preferred form of frog meat and taboo associated with frog consumption.
Frog market and its framework
This was based on edible frog pricing system, processing, packaging, value addition and identification of marketable species of edible frogs.
Data collection
Participatory observation and semistructured questionnaire containing open and closed ended questions was used to elicit information from the respondents; this was obtained by interview schedule.
Data analysis
Data generated from the study were analyzed using descriptive statistics tools (percentages, frequency count mean and standard deviation).

Market Potentials of Edible Frogs in Nigeria
RESULTS AND DISCUSSION
S o cio-economic characte ris ti cs of respondents
Age distribution of respondents: The result from Table 1 shows that majority (54.8%) of the respondents fall within the age bracket of 21 to 40 years; mean age was 36 (SO = 9.7). About 37.3% of the respondents fall within the age bracket of 41 to 60 years, 6.3 % are less than 21 years while 1.6% constitute those above 60 years of age. The result of the findings suggests that the respondents in the age bracket of 21 to 40 years are more likely to be involved in frog business than those in the other age categories.
Educational background of respondents: It could also be seen from Table 1 that 38.9%, 34.1% and 27.0% of the respondents had primary education, no formal education and tertiary education, respectively. The findings indicated that 65.9% of the respondents were educated. This would be expected to affect respondents' positive responses to innovation that could boost frog production.
Sex distribution of respondents: Majority (60.3%) of the respondents in the study area were males while the rest (39. 7% ) were females (Table 1). The low percentage of the female respondents may be as a result of their limited access to productive resources (Nwabeze, 2006). In fisheries, women are mainly involved in fish processing, fish mongering and fish marketing to mention a few aspects of their involvement in production. This agrees with the findings of Uchola (2000) and Alamu (1999) that women prefer marketing and distribution.
Ethnicih; of the respondents: Most (35.0%) of the respondents were Tiv in origin. This was followed by Yoruba (14.0%); Ukwuani (10.0% ); Shuwa Arab (9.0% ); Hausa (7.0% ); Kanuri (7.0% ); Igbo (6.0% ); Igala (5.0% ); Idoma and Urhobo (2.0% each); Efik, Igede
57
and Ijaw (1.0% each). The result implies that frog business IS not restricted to a particular ethnic group but dominated by those of Tiv origin.
Marital status of the respondents: Higher percentage (67.7%) of the respondents were married. Singles cons tituted 22.2%, 6.3% and 4.8% were widowed and divorced, respectively (Table 1). The dominance of married household imply that appreciable numbers of the households are likely to adopt frog culture.
Household sizes of the respondents: Respondents' household size ranged from 2 to 7 persons with a mean of 4 (SO = 1.6). About 38.1% of the respondents family size was 4 to 6 persons, 34.1% had 1 to 3 persons, 17.5% had 7 to 9 persons while 10.3% had 9 persons and above. The low family size of the respondents could be attributed to increased awareness of family planning in the area.
Acceptability of edible frogs as source of protein for Nigeria
In an attempt to examine the acceptability of frog as source of protein for Nigeria, the following variables were considered:
Awareness on frog as source of food and animal protein
All the respondents (100%) were aware that frog is a source of food and provides animal protein for some of the population (Table 2).
Gender consideration for frog consumption
Table 2 shows that a large percentage (66.7%) agreed that frog is consumed by young p eople while 33.3% agreed that frog is consumed by all categories of people (children, adolescent and adult).
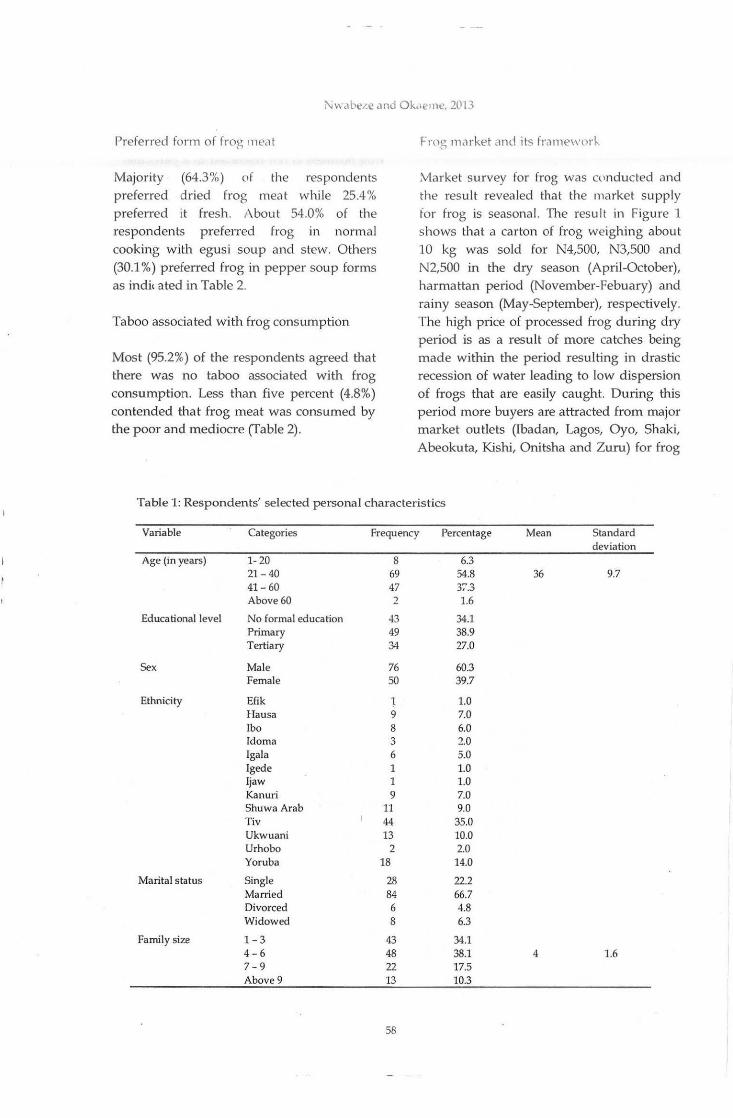
Prefened form of frog meil t
Majority (64.3%) of the respondents prefen ed dried frog meat while 25.4% preferred it fresh. About 54.0% of the resp ondents preferred frog in normal cooking with egusi soup and stew. Others (30.1%) preferred frog in pepper soup forms as indi< ated in Table 2.
Taboo associated with frog consumption
Most (95.2%) of the respondents agreed that there was no taboo associated with frog consumption. Less than five percent (4.8%) contended that frog meat was consumed by the poor and mediocre (Table 2).
Frog market ilnd its fril mework
Market survey for frog was w nducted and the result revea led that the market supply fo r frog is seasonal. The resul t in Figure 1 shows that a carton of frog weighing about 10 kg was sold for N4,500, N3,500 and N2,500 in the dry season (April-October), harmattan period (November-Febuary) and rainy season (May-September), respectively. The high price of processed frog during dry period is as a result of more catches being made within the period resulting in drastic recession of water leading to low dispersion of frogs that are easily caught. During this period more buyers are attracted from major market outlets (Ibadan, Lagos, Oyo, Shaki, Abeokuta, Kishi, Onitsha and Zuru) for frog
Table 1: Respondents' selected personal characteris tics
Variable Categories Frequency Percentage Mean Standard deviation
Age (in years) 1-20 8 6.3 21 - 40 69 54.8 36 9.7 41-60 47 37.3 Above 60 2 1.6
Educational level No formal education 43 34.1 Primary 49 38.9 Tertiary 34 27.0
Sex Male 76 60.3 Female 50 39.7
Ethnicity Efik 1 1.0 Hausa 9 7.0 Ibo 8 6.0 ldoma 3 2.0 !gala 6 5.0 Igede 1 1.0 !jaw 1 1.0 Kanuri 9 7.0 Shuwa Arab 11 9.0 Tiv 44 35.0 Ukwuani 13 10.0 Urhobo 2 2.0 Yoruba 18 14.0
Marital status Single 28 22.2 Married 84 66.7 Divorced 6 4.8 Widowed 8 6.3
Family size 1- 3 43 34.1 4-6 48 38.1 4 1.6 7-9 22 17.5 Above 9 13 10.3
58
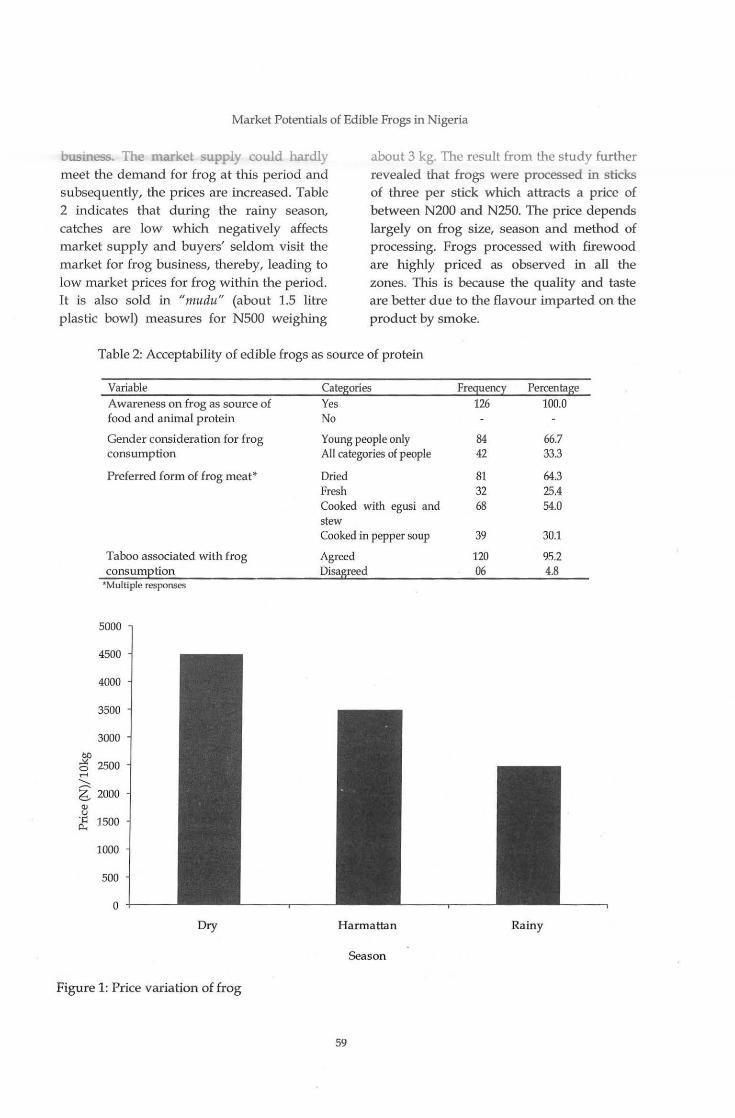
Market Potentials of Edible Frogs in Nigeria
business. The market supply could hardly meet the demand for frog at this period and subsequently, the prices are increased. Table 2 indicates that during the rainy season, catches are low which negatively affects market supply and buyers' seldom visit the market for frog business, thereby, leading to low market prices for frog within the period. It is also sold in "mudu" (about 1.5 litre plastic bowl) measures for NSOO weighing
about 3 kg. The result from the study further revealed that frogs were processed in sticks of three per stick which attracts a price of between N200 and N250. The price depends largely on frog size, season and method of processing. Frogs processed with firewood are highly priced as observed in all the zones. This is because the quality and taste are better due to the flavour imparted on the product by smoke.
Table 2: Acceptability of edible frogs as source of protein
bO
Variable Awareness on frog as source of food and animal protein
Gender consideration for frog consumption
Preferred form of frog meat*
Taboo associated with frog consumption
*Multiple responses
5000
4500
4000
3500
3000
~ 2500 ..... ~ 6. 2000 Cll u
· ~:: p.. 1500
1000
500
0
Dry
Figure 1: Price variation of frog
Categories Frequency Percentage Yes 126 100.0 No
Young people only 84 66.7 All categories of people 42 33.3
Dried 81 64.3 Fresh 32 25.4 Cooked with egusi and 68 54.0 stew Cooked in pepper soup 39 30.1
Agreed 120 95.2 Disagreed 06 4.8
Harmattan Rainy
Season
59

Nwabeze and Okaeme, 2013
Existing frog union
Frog marketers have formed unions so as to have a voice in the marketing and pricing of their products. Some of the unions include;
Nigerian Frog Investors with branches in Numan and Dadinkowa
Nigerian Frog Marketers Association with headquarters in Kano. This is a strong union with members from Kogi, Kano, Yauri and Dikwa.
The problem with these unions was that their activities were limited to their market place and only directed at determining price and who loaded the products. They have not been able to build an advocacy group or articulate documents regarding the quality of products and consumer preferences.
Identified species of frog
The respondents identified two edible species of frog. The species include;
Rana spp. (Rana esculenta and Rana
nigromaculata): The species are called Kwado
Ruwa in Hausa. It is referred to as waterfrog; the species swim rapidly and take long leap
. son land. It was found to be edible and marketable.
PhnJnobatrachus spp. : They are small bodied frog (about 2 em long), abundant in wetland area at the end of the dry season. The species has great potential as an aquarium specimen due to its small size and attractive coloration.
CONCLUSION
It was concluded that frog provides cheap alternative source of animal protein. It also provides an alternative source of livelihood portfolio for many Nigerians. In the light of the above, the following recommendations are made:
60
Research shou ld be initiated, adequately funded to vigorously intensify identification of vurious methods of frog culture.
Awareness of frog bus iness as alternative source of livelihood should be intensified by extension agents.
Adequate incentive and grants should be given to frog farmers to finance frog
· production.
Credit and co-operative societies should be encouraged among those in frog business to enable them help themselves.
REFERENCES
Alamu, S. 0. 1999. The role of women in artisanal fish production in Jebba Lake Area. 1999 NIFFR Annual Report, New Bussa. p. 61.
Anonymous. 1999. Amphibian Research Centre. Available from <http/ jwww. medianlauch. com.au> Assessed 16th December, 2007.
Gray, R. 2006. Afn"can Frog. Available from <http j jww.archive.scotrnan.com> Assessed 16th December, 2007.
Marantelli, G. 1999. Amphibian Research. Available from <http/ jwww.medianlauch. com.au> Assessed 16U1 December, 2007.
Nwabeze, G. 0. 2006. Factors related to changing livelihood strategies of artisanal fisherfolks in inland fishing communities in Delta State. Unpublished, M.Sc. Thesis, Dept of Agricultural Extension and Rural Development, University of Ibadan, Ibadan, p. 41.
Uchola, E. B. 2000. An economic analysis of fish farming in Western Extension Zone of Lagos State. Unpublished M.Sc. Thesis, Dept of Wildlife and Fisheries Management, University of Ibadan, Ibadan.

Journal of Applied Agricultural Research 2013, 5{2): 61-71 ISSN 2006-750X
, >.g.JCultural Research Council of Nigeria, 2013
IMP ACT OF ANAMBRA STATE TRACTOR AND EQUIPMENT HIRING SCHEME ON MECHANIZATION OF RICE PRODUCTION
IN ANAMBRA STATE NIGERIA: AN APPRAISAL
Umcghalu, I. C. E., *Okwonkwo, J. C., Ngini, J. 0. and E. C. Chukwuma Department of Agriculture and Bioresources Engineering,
Nnamdi Azikiwe University, PMB. 5025, Awka, Anambra, Nigeria *[email protected], +2348035414358
ABSTRACT
This study appraised the impact of Anambra State Tractor and Equipment Hiring Company (ASTRAC) on mechanization of rice production in the state. Four predominantiy rice producing local government areas were studied namely; Aghamelum, Ogbaru, Orumba North, and Anambra West. Investigative survey approach, using structured questionnaires and personal observa tions was used to obtain primary data. The data collected were analyzed, using simple statistics such as percentages. Results show that the company has not contributed much to rice production in the sta te due to various problems facing the scheme, which include; high frequency of machine break down arising from poor maintenance culture, poor funding, lack of skilled maintenance personnel, lack of spare parts, poor handling of machines, unfavourable environmental factors etc. However, the Company's potential to make positive impact on rice production in the state is high, and regular maintenance should be adopted to achieve or prolong the machine service life.
Keywords : mechanization, rice production, maintenance cullure, environmental fac tors, skilled personnel
INTRODUCTION
The climate of Anambra State, which is one
of the 36 s tates of the Federal Republic of
Nigeria, is typical of equatorial climate with two main seasons viz; rainy and dry seasons .
The rainy season is often characterized by heavy thunderstorm and las ts for a p eriod
between April and October. Sometimes, the
season arrives as early as March and lasts till November. The mean annual rainfall varies between 1500 mm and 2250 mm north of the
state. A bimodal rainfa ll pattern with a brief drop in rainfall known as the "August
Break" is often noticed in the zone. Dry season starts from November and las ts till March. Annual potential evapotranspira tion (PET) in the area varies between 1425 mm an d 1625 mm (NIMET, 2006).
-- --·-··-·- ---·---- -
61
The zone has an average m aximum temperature range of 32°C and average annual mean temperature of about 27°C. At
rainy season, however, the temperature is about 33°C and high rela tive humidity of about 85% is recorded. Bu t the heavy wind,
cover at this period may help to mask the
influence of high temperature. The annual rainfall is usually higher than the annual potential evapotranspiration. According to Jungericus ' classification of 1964, soil types in Anambra State are formed from sand stones, alluvial deposits, basemen t rocks and shale. Okig bo (1986) noted tha t soil types
mainly of lithosols, ferra llitic soils,
fe ruginous tropical soils a 1d the hydromophic soils are prew lcn t in thL 1rca
Toprography ranges from undu1.1Ling tu .Jn!.
plains and cuesta landJOJ!'1.~ ch LO(' uppL;·
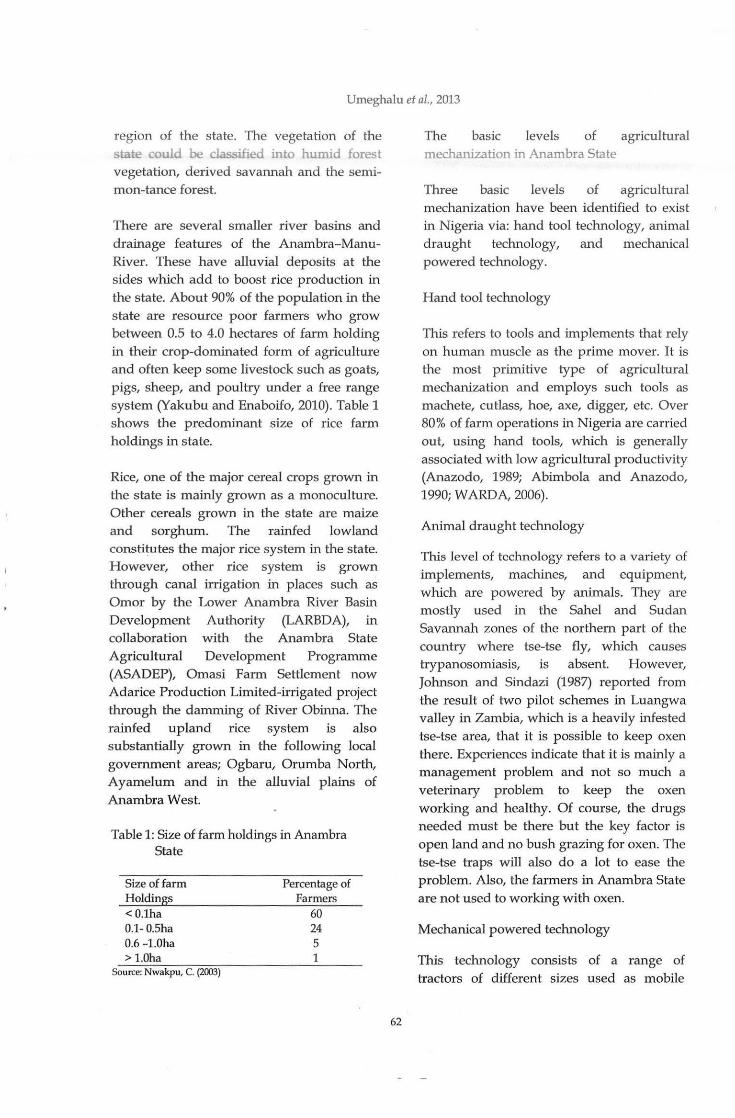
Umeghalu et al., 2013
region of the state. The vegetation of the state could be classified into humid forest vegetation, derived savannah and the semimon-tance forest.
There are several smaller river basins and drainage features of the Anambra-ManuRiver. These have alluvial deposits at the sides which add to boost rice production in the state. About 90% of the population in the s tate are resource poor farmers who grow between 0.5 to 4.0 hectares of farm holding in their crop-dominated form of agriculture and often keep some livestock such as goats, pigs, sheep, and poultry under a free range system (Yakubu and Enaboifo, 2010). Table 1 shows the predominant size of rice farm holdings in state.
Rice, one of the major cereal crops grown in the state is mainly grown as a monoculture. Other cereals grown in the state are maize and sorghum. The rainfed lowland constitutes the major rice system in the state. However, other rice system is grown through canal irrigation in places such as Omor by the Lower Anambra River Basin Development Authority (LARBDA), in collaboration with the Anambra State Agricultural Development Programme (ASADEP), Omasi Farm Settlement now Adarice Production Limited-irrigated project through the damming of River Obinna. The rainfed upland rice system is also substantially grown in the following local government areas; Ogbaru, Orumba North, Ayamelum and in the alluvial p lains of Anambra West.
Table 1: Size of farm holdings in Anambra State
Size of farm Holdings < 0.1ha 0.1- O.Sha 0.6 -l.Oha > 1.0ha
Source: Nwakpu, C. (2003)
Percentage of Farmers
60 24 5 1
62
The basic levels of agricultural mechanization in Anambra State
Three basic levels of agricultural mechanization have been identified to exist in Nigeria via: hand tool technology, animal draught technology, and mechanical powered technology.
Hand tool technology
This refers to tools and implements that rely on human muscle as the prime mover. It is the most primitive type of agricultural mechanization and employs such tools as machete, cutlass, hoe, axe, digger, etc. Over 80% of farm operations in Nigeria are carried out, using hand tools, which is generally associated with low agricultural productivity (Anazodo, 1989; Abimbola and Anazodo, 1990; WARDA, 2006).
Animal draught technology
This level of technology refers to a variety of implements, machines, and equipment, which are powered by animals. They are mostly used in the Sahel and Sudan Savannah zones of the northern part of the country where tse-tse fly, which causes trypanosomiasis, is absent. However, Johnson and Sindazi (1987) reported from the result of two pilot schemes in Luangwa valley in Zambia, which is a heavily infested tse-tse area, that it is possible to keep oxen there. Experiences indicate that it is mainly a management problem and not so much a veterinary problem to keep the oxen working and healthy . Of course, the drugs needed must be there but the key factor is open land and no bush grazing for oxen. The tse-tse traps will also do a lot to ease the problem. Also, the farmers in Anambra State are not used to working with oxen.
Mechanical powered technology
This technology consists of a range of tractors of different sizes used as mobile

Equipment Hiring Scheme and Rice Production in Anambra State
power for field operation, transport and stationary power source for different mechanical engines or motors using petrol or diesel fuel or electricity to power such machines as threshers, mills, irrigation pumps, grinders, aircraft for spraying, selfpropelled machines for wide variety of crops. One of the major handicaps of engine powered technology in mechanization of agriculture is the low investing capacity of farmers to buy machines and their low level technical know-how as well as the absence of maintenance culture (Agu and Oluka, 2008). However, this is being given serious attention by the state government by establishing a Tractor and Equipment Hiring Scheme and granting of soft loans for purchases of farm machines and scheme equipment.
Establishment of Anarnbra State Tractor and Equipment Hiring
Anarnbra State Tractor and Equipment Hiring Scheme (ASTRAC) was established to boost agricultural productivity in the state. But unfortunately, for over two decades of the introduction of engine powered technology and massively importing tractors and equipment into the agricultural sector in the state, small farm holdings still dominate in many farming communities, and the greater percentage of agricultural activities are still performed manually. Though the state government established tractor and equipment hiring scheme, whereby tractors and agricultural equipment were purchased and made available to farmers at subsidized rates of hiring for various agricultural practices, services rendered to rice farmers are limited to seed bed preparation such as ploughing, harrowing, and rotovating of paddy field. Threshing operations, transportation, storage of agricultural products and processing, and other practices associated with rice production are not provided for by the hiring outfit.
63
In some cases, ASTRAC provides the <>q_uipment and farmers pay a fixed rate per hectare or hours for the services rendered. In others, the tractors are hired out to contractors who are responsible for the repair and maintenance of the machines.
Problems of Anambra State Tractor and Equipment Hiring Scheme
The problems facing the scheme are as follows:
Environmental factor: Environmental factors such as vegetation, relative humidity, temperature, topography, etc., accelerate machinery deterioration, especially when machines are left in the open. Moreso, these machines are designed without tropical ecological conditions or crops in mind. Therefore, they break down frequently.
Poor management: Government establishments are noted for their administrative bottlenecks which often lead to inefficient management. Series of protocols are passed through before simple decision affecting the proper management is taken. This often affects the working condition of the machines.
Impraper use of machines and poor maintenance culture: The tractors are often employed to do the work they were not designed for (Agu and Oluka, 2008). Also, lack of necessary tools and trained personnel to ensure effective maintenan.ce of the machines lead to frequent break down of the machines; this disrupts progarnmes (Anazodo et al., 1989). Sometimes service manuals are not available.
Age of machines: Most of the tractor models imported into the country are outmoded (Anazodo et al., 1989). Some are refurbished, and naturally, machines depreciate with time. As soon as the service life of the machine is reached, many components start
Umeghalu et al. , 2013
to fail. Thus, because the models may be out of production the failed components are not readily available, leading to abandonment of the machine.
High cost of spare parts: Spare parts for imported machines are costly due to the fluctuating value of the Naira. Also, high cost of freight in importing these spare parts lead to abandonment of the machine (Onwualu, 2006; Nwuba, 1979).
Lack of proper record: Inadequate record keeping leads to mismanagement of the tractor (Onwualu, 2006; Nwuba, 1979). All the machine history must be kept. This will help in knowing the state of the tractor and the type of maintenance it requires or otherwise. Record keeping is absent in the scheme, leading to sudden breakdown of the machines (Agu and Oluka, 2008).
Improper financial accounting: The financial status of the Company is not properly kept because of the fraudulent practices prevalent in the country. Thus, the Company lacks financial s tatus to keep with the repair and maintenance requirements of their machines and equipment.
Poorly cleared farm lands: The poor agricultural land clearing services rendered in the s tate because of low skilled operators promote rapid res tora tion of the undergrowth and small trees coupled with the prolific root system just below the surface of the ground. These cause severe losses from breakage of agricultural implements, thereby, hindering smooth operation of the tractors (Hodder, 1978; Nwuba 1984). This is a hindrance to smooth operation of the tractors.
Lack of ecological or survey data: Very little is known about the topographical, geological, hydrological and soil composition of Anambra State. The knowledge would have enhanced good selection of machines and
64
equipment mos t suited to work in the state. Without thes dat a~r -ul :1.. ., l IP !ti....., 1>
working in the state face the risk of breaking down.
Size of fa rm holdings: Most farm holdings of rice farmers in the s tate are fragmented and scattered. This hampers use of machines and leads lo time wastage.
Absence of infrastructural facilities: Without good roads, tractors cannot get to the field where they will work. Without electricity, processing activities of agricultural products will be difficult and costly, s torage of certain agricultural products such as perishable products like vegetables and fruits will be impossible. Also, absence of irrigation water limits rice cropping to only during the rain period.
Low capncif:l; building of maintenance personnel: Inadequate training of operators and low capacity building of maintenance personnel inhibits proper exploitation of agricultural machines and equipment.
Lack of technical management: Lack of technical management does not allow the imported machines to yield the expected dividends. Thus, other basics upon which mechanization would be established are either neglected or taken for granted. Ruseva {1980) posited that agricultural machines, given their ultimate potentials, depend upon their unique function, their operating environment, and in particular on how well equipment and machines are exploited to meet conditions such as availability, efficiency, serviceability and quality.
Absence of local content: Summing it up, Spiridonov {1980); Odigboh (2008) and Adama and Onwualu (2010) pointed out that for agricultural mechanization to succeed, all the needed machines and equipment should as far as possible be manufactured locally to ensure th eir acceptability, adaptability,

Eq uipment Hiring Scheme and Rice Production in Anambra State
affordability, reliability, availability and sustainability. Importation of agricultural machines into the country should be based on professional advice by experts in the field (Nwuba, 1984).
METHODOLOGY
The study area
The study area is made up of four most prominent rice producing local government areas in Anambra State namely: Aghamelum, Ogbaru, Orumba North and Anambra West. Anambra State is located in the South-East geo-political zone of Nigeria and lies between latitude So37' - 6°N and Longitude 7oJQo'E (NPC, 2006). It is made up of 21 Local Government Areas with Awka as the s tate capital. It has a population of about 4.06 million p eople (2006 census) and a population density of about 1,500 to 2,000 persons per square kilometre. Anambra State has a land mass of about 4,844 km2. About 80% of the workforce is engage in the agricultural sector of the economy.
Method of data collection
Investigative survey trips were made to the four study areas for primary data collection. Structured questionnaires were randomly dish·ibution to 50 rice farmers per zone, and personal observations were made. Secondary data were obtained from the records available at the administrative headquarters of ASTRAC at the State Ministry of Agriculture, Awka, and from its maintenance base at Awkuzu. Information such as the nature of services rendered to farmers, cost of services, number of tractors owned by the hiring outfit, the nature and frequency of breakdowns of the machineries, availability of spare parts, maintenance strategy, number of operators and their competence, problems being encountered by the tractor hiring outfit were obtained from ASTRAC. The structured questionnaires administered to r ice farmers contained questions such as: age of respondent, size of farm holding, cost of each farm operation, method of farming, accessibility to ASTRAC tractors, and equipment, problem facing the rice farming community and suggestions.
Table 2: Inven tories of ASTRAC tractors and equipment from inception to 2011
Year Name of machinery No No. Not Remarks functioning functioning
Between Assorted brands and 150 Nil 150 All the 150 tractors and 1985and models of tractors implements broke down, 2009 abandoned and were sold
off by the state government as scraps.
2011 Assorted brands and 15 14 1 One non-functional models of tractors tractor requires engine
over haul. Disc plough 8 8 Nil Mould board plough 8 8 Nil Trailer 2 2 Rice sheller Harrows 8 6 2 Bearing and disc
breakdown Planter Ridgers 6 6 Slashers S ra ers
Source: ASTRAC (2011)
65
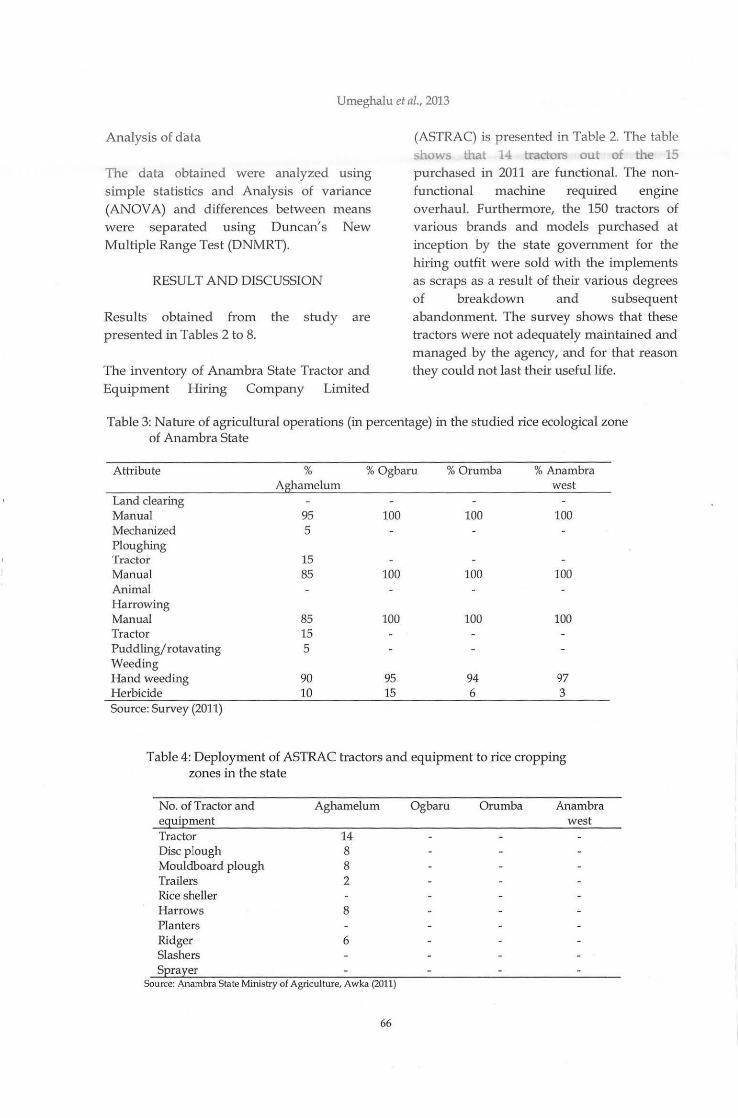
Umeghalu et al., 2013
Analysis of data
The data obtained were analyzed using simple statistics and Analysis of variance (ANOV A) and differences between means were separated using Duncan's New Multiple Range Test (DNMRT).
RESULT AND DISCUSSION
Results obtained from the study are presented in Tables 2 to 8.
The inventory of Anambra State Tractor and Equipment Hiring Company Limited
(ASTRAC) is presented in Table 2. The table show that 14 tractors out of the 15 purchased in 2011 are functional. The nonfunctional machine required engine overhaul. Furthermore, the 150 tractors of various brands and models purchased at inception by the state government for the hiring outfit were sold with the implements as scraps as a result of their various degrees of breakdown and subsequent abandonment. The survey shows that these tractors were not adequately maintained and managed by the agency, and for that reason they could not last their useful life.
Table 3: Nature of agricultural operations (in percentage) in the studied rice ecological zone of Anambra State
Attribute
Land clear ing Manual Mechanized Ploughing Tractor Manual Animal Harrowing Manual Tractor Puddling/ rotava ting Weeding Hand weeding Herbicide Source: Survey (2011)
% Aghamelum
95 5
15 85
85 15 5
90 10
% Ogbaru
100
100
100
95 15
% Orumba
100
100
100
94 6
% Anambra west
100
100
100
97 3
Table 4: Deployment of ASTRAC tractors and equipment to rice cropping zones in the state
No. of Tractor and equipment Tractor Disc plough Mouldboard plough Trailers Rice sheller Harrows Planters Ridger Slashers S ra er
Aghamelum
14 8 8 2
8
6
Source: Anambra State Minis try of Agriculture, Awka (2011)
66
Ogbaru Orumba Anambra west

Equipment H iring Scheme and Rice Production in Anambra State
Table 3 indicates that ASTRAC services did not include land clearmg .. \t the Lower Anambra River Basin Au thority (LARBA), where their tractors are deployed, only p loughing, harrowing and puddling are the operations they render to. farmers. Such operations like paddy harvesting, chemical application, planting and mechanical transplanting are not carried out. As a result, most operations involved in rice cultivation are still performed manually.
The time and cost for completion of one hectare of various field operations in rice production using hand or mecharucal power source and presented in Table 5. The table indicates that it takes 8 days to plough one hectare of paddy field by hand at the cost of twenty-four thousand naira only (N24,000.00), while a tractor completes the same size of work at the cost of ten thousand, four hundred naira only {Nl0,400) within the time frame of 3 hours 30 minutes.
Table 5: Time and cost for completing one hectare of various field operations using hand or mechanical power source in rice production
Operation Time (Hrs or days)
Hand Mechanical
Cost (N)
Hand Mechanical Clearing (shrubs and grasses) Ploughing hoeing Harrowing
7 days Nil 20,000/ha Nil 8 days 3.5 h 24,000/ha 10,400
Rotating Transplanting of seedlings Direct seeding Weeding Fertilizer application Spraying Harvesting Threshing Transportation
Source: Survey (2011)
NA 1.5h NA 3h
8days NA 8days NA 10days NA
3h NA 3 h NA
6 days NA ' S d ays 5 h
NA NA
Table 6: Accessibility of ASfRAC services to rice farmers
Variables
Benefited Not benefited Total
Source: Survey (2011)
Aghamelum 15 85 100
Respondents % Ogbaru Orumba
Nil Nil ... 100 100 100 100
8,400 NA 12,000
11,200 NA 10,600 NA · 16,000 NA 2000 NA 3000 NA
11,200 NA 12,000 NA
...
Anambra West Nil 100 100
Table 7: Predominant size of rice farm holding in Anambra State
Size of holding Aghamelum Ogbaru Orumba Anambra West < 0.1ha 58 65 72 I
.' 68 0.1 - O.Sha 35 30 25 27 0.6 -l.Oha 05 03 02 04 .>· 1.0ha 02 02 01 01
Source: Survey (2011)
67

Table 8: Nature and frequency of ASfRAC's tractor and equipment breakdown
Machine Frequency Breakdown Causes of Average Replacement Source of Type of Average component breakdown annually break down duration of not sourcing spare maintenance cost of
breakdown immediate parts schedule repair because of
Tractor steering ram Not 15 times or Hose blockage dirt oil 5-10 days Lack of Some of them Emergency 50,000 oil leakage, frequent more and inadequate spare parts but others and hydraulic failure maintenance imported above
Tyres, bearing, fuel Frequent Not Stumps, vibration, poor As above As above As above As above As c :::l
lift pump available maintenance above i1i OQ ::r
Disc plough, Frequent 30 or above Stumps, sand stumps, As above As above As above As above As I»
cr- c <» bearing disc, disc environmental factors, above ~
bolt and blades poor maintenance }'=-N 0 ...... VJ
Disc harrows, Frequent 20 or above As above As above As above As above As above As blades, bolts, disc above bolts
Ridgers bolts and Less Not Poor maintenance As above As above As above As above As disc frequent available environmenta l factor above
adulterated 2roduct Source: ~11{1\C (2011)
Equipment Hiring Scheme and Rice Production in Anambra State
Table 6 presents the accessibility of ASTRAC service to farmers. At Aghamelum zone, which is the only rice producing zone where ASTRAC services are available; the farmers however, can be divided into two groups viz:
Group 1: Beneficiaries
About 15 percent of fam1ers in Aghamelum zone belong to this group, and they are the farmers who have benefited from ASTRAC services. Thus, this has led to appreciable increase in their farm holdings and income.
Group 2: Non-Beneficiaries
This group constitutes about 85% of the respondents and are those who have not benefited from ASTRAC services. They can further be sub-divided into three groups: those farmers who have sufficient farm holdings but cannot afford the cost of ASTRAC services; those whose farms are far remote from the areas accessible to tractors because of poor farm road network. Though the farmers can pay for the services, bad road network makes the fam1 inaccessible and those whose farm holdings are too small, fragmented or badly cleared. It becomes uneconomical for tractors to be engaged in such farm sizes.
Table 7 shows the predominant farm sizes of rice farmers in the state. This could be increased if the fleet of ASTRAC's agricultural machines are increased and well maintained.
In Table 8 the nature and frequency of ASTRAC's tractors and equipment breakdown were presented. The survey also show that the frequency of the company's machinery breakdown and failure is relatively high and this can be attributed to several factors, and prominent amongst them are poor maintenance culture and bad machinery management. This finding is in
69
line with Nwuba (1979); FMA (1988) who noted thc1 t the imported agricultural machineries into the country were ne 'e exploited for appreciable length of time before they break down and are abandoned. The factors responsible for this early abandonment, he noted, include: Jack of spare parts, poor maintenance culture, absence of repair and maintenance manuals, untrained maintenance personnel, machines not designed for tropical environn1ent and crops, poor funding by state government, corruption, poor system of land clearing, lack of modern workshop and tools. This also could explain the reason for the fate of the Company's abandoned 150 tractors and equipment which were sold as scrap by the state govemment. Moreover, the maintenance schedule of the hiring outfit is seasonal as the machines are only maintained or repaired when there is serious need for it. Scheduled periodic maintenance and predictive maintenance are not carried out on the machmes.
CONCLUSION
The study shows that the services of Anambra State Tractor and Hiring Scheme are grossly inadequate. The percentage of farmers who benefit from the services of the outfit is very small and has negligible impact on the overall output i.r1 rice farming in Anambra State.
Such services like processing and storage which could boost rice productivity i.r1 the state are yet to be adequately addressed. Thus, the profits derivable from mechanized rice cropping such as the time savmg, raismg farmers' financial earnings resulting from mcreased farm holdmgs, are still not realized.
Poor mamtenance of the tractors and equipment is still weighmg down the operational capacity of the hirmg outfit. Thus, delays caused by frequent breakdown
Umeghalu et al., 2013
of its machines, especially during the farming season disturb the production programme of farmers, by affecting areas cropped and crop yield. Agricultural operations are time specific.
RECOMMENDATIONS
The hiring outfit has great potentials for improving ric*: production in Anambra State if well managed. The following suggestions will help in achieving the objective of its establishment:
The existing central workshop at Awkuzu should be made more functional by adequately equipping it with tools, skilled personnel, and adequately funded by government.
There should be a mobile workshop per rice producing zone where the tractors are deployed to work In this way, minor repairs and maintenance should be effected while major repair work will be referred to the mother workshop at Awkuzu. This will put the tractors and equipment in better form to perform more work, especially during the cropping season without much time wasted by taking the faulty machines to Awkuzu for minor repair and maintenance. More tractors should be purchased for the outfit to enable them serve more number of farmers per ~nit time within the cropping season as agricultural activities are both time and location specific .•
, . .... There ~a~~ : ·te~~ aspects of machine
ope~ation and m.a~~ance to which our local ·oper.ators} .because of their level of
• education ·· apd ~ ~~O!lffiental background, do not ~aturally ~dapt. Training, however, will recj:ify Ute-s~' shortcomings. Careful .. . selection, train:ir!g, marketing incentives, and surveillance from higher management will reduce supervisory weakness to negligible proportions.
70
The state government should not only fund the outfit adequately, but also recognize the need for the outfit to be self-sustaining. This will allow the Company to render services freely without government bureaucracy.
A culture of regular maintenance should be adopted to achieve or prolong the machine service life.
REFERENCES
Adama, J. C. and Onwualu, A P. 2010. Agricultural Mechanization as a strategy for sustainable food security in Nigeria. Proceedings of the 10th International Conference of the Nigerian Institute of Agricultural Engineering, Vol. 31, Enugu.
Abimbola, T. 0. and Anazodo, U. G. N. 1990.
Development of Agricultural Mechanization Strategies in Nigeria. Paper presented at the workshop an Agricultural Mechanization in Common Wealth Africa. Ahmadu Bello University Zaria.
Agu, 0. S. and Oluka, S. I. 2008. An inventory and maintenance study of agricultural machinery in Enugu State. A case study of Enugu State Tractor Hiring Agency. A paper presented at First Regional Conference of the south-East Nigerian Institution of Agricutural Engineers held at Nnamdi Azikiwe University Awka, Anambra State, Aug., 2008, p. 175-181.
· Anazodo, U. G. N. 1989. Perspective plan for Agricultural Development in Nigeria (1959-
2004). Agricultural Mechanization study Report Federal Agricultural Coordinating unit (FACU). Ibadan .
ASfRAC. 2011. Anambra State Tractor and Equipment Hiring Company. Unpublished data.

Equipment Hiring Scheme and Rice Production in Anambra State
FMA. 1988. Federal Ministry of Agriculture. Agriculture Policy for Nigeria. Jeromekibe and Association Ltd, Lagos, Nigeria.
Hodder, B. W. 1978. Economic Development in the Tropics. Methuen and Co. Ltd. London EC4.
Johnson, L. 0. and Sindazi, M. 1987. Small Farm Mechanization - Improving Food Crop Production on small farm in Africa Food and Agricultural Organization, Rome.
Nwakpu, C. 2003. Practical Guide to Lowland rice production in Nigeria. Snap Press Ltd, Enugu.
Nwuba, E. I. U. 1979. Land Clearing: A prerequisite of self-sufficiency in food. Proceedings Nigeria Society of Agric Engineers 3:243-356.
Nwuba, E. I. U. 1984. Agricultural land clearing Practices in Nigeria: An appraisal. Proceedings Nigerian Society of Agric Engineers (NSAE) 1984 Symposion an soil and water management, p. 69-87.
Odigboh, E. U. 2008. Global Food Crisis: Intensified Agricultural Mechanization Imperative for Nigeria. Lead paper presented at the First South- East Regional Conference of the NIAE held at Nnamdi Azikiwe University Awka, August 2008. p. 12-19.
71
Okigbo, B. N. 1986. Towards a new Green Revolution from Chemicals to new biological techniques in the improvement of tropical African agriculture. Paper presented at the International meeting of the Italian Academy of Science, Rome, Italy.
Okigbo, B. N. 1987. Increased Food Production Through Low- Cost Food Crop Technology at liT A.
Onwualu, A. H. et al. 2006. Fundamentals of Engineering for Agriculture. Immaculate Publications Limited, Enugu-Nigeria.
Ruseva, S. 1980. Strategies for Repair maintenance and Exploitation of Agricultural machines. Vimes Press, Rouses Bulgaria.
Spiridonov, G. 1980. Repair and Maintenance of machines. Zemiz Press, Sofia.
WARDA. 2006. West African Rice Development Association.
Yakubu, A. J. 0. and Enaboifo, M. A. 2010. Appraisal of available Farm paper sources for land Preparation in Nigeria Paper presented at th.e lOth Internationr ! Conference of the Nigerian Institution c Agricultural Engineers, Enugu.


Journal of Applied Agricultural Research 2013, 5(2): 73-80 ISS~ 2006-750X ©Agricultura l Research CounCil of Nigena, 2013
FACTORS ASSOCIATED WITH JOB PERFORMANCE OF EXTENSION AGENTS IN KW ARA STATE, NIGERIA
Akangbe, J. A., *Omotesho, K. F. and 0. K. Asaju tDeparbnent of Agricultural Extension and Rural Development,
University of Ilorin, Ilorin, Nigeria *[email protected]
ABSTRACT
The study investigated role perception, job satisfaction and motivation as factors associa ted with job perfonnance of extension agents in Kwara State, N igeria. A complete sampling of all the extension agents of the Kwara State Agricultural Development Project (KWADP) produced the 66 respondents of the study. Data were obtained by the use of a structured questionnaire and was subjected to descriptive statistics, specifically, frequencies, percentages, and means. A linear regression model was used to investigate re lationship between variables. Three point Likert-type scales were employed in ascertaining perception on roles, job satisfaction and job motivation among the respondents. The respondents were found to be predominantly male (79.8%), with a mean age of 49 years. About 80% of the respondents had tertiary education and rural background. The study revealed that majority of the respondents (78.8%) considered input supply to fanners as their most important role. Age and childhood background were significantly related to job performance at 1% level of significance with t-values of 7.649 and 7.488, respectively. The extension agents were most satisfied with the level of job security they had and the ir supervisor and organization' s interest in their welfare. Salary I allowances and prospects of promotion were the most important motivational factors of the extension agents. The study recommended continuous h·ain.ing of the extension agents on their role expectations. It also suggested that age be considered in future recruitment exercises of the Kwara State ADP.
Keywords: Job Performance, Role Perception, Job Satisfaction, ~ fotiva tion, Extension Agents
INTRODUCTION
Agriculture remains the mainstay of the Nigerian economy, providing food, shelter, clothing and employment. The need for a renewed focus on agriculture stems from the FAO (2010) report that one out of every seven persons in the world is hungry with majority of the world's hungry living in developing countries. Rural areas account for three out of every four persons living on less than $1.25 a day while 50% of hungry people are farming families that depend on agriculture and related activ ities for livelihood (HDR, 2008: F AO, 2012).
73
Although FMARD (2010) reported that agriculture contributed 42% of the total GDP of Nigeria in 2007, the human and natural resources endowment of the country suggest that this is a far cry from the potentials that agriculture holds for the country's economic development.
Under-investment in new technology and low level of adoption of existing technology are part contributors to the mixed performance and poor growth of agricul~re
in Nigeria (World Bank, 2005). The existence of significant correlation between extension and yield has been upheld by several studies
Akangbe et al., 2013
(Evenson and Bravv-u . ... . ct, 1994; Rivera, ~001). The Nigerian agriculture, in particular, l ~ing dominated by small-scale farmers who dre mostly illiterate, places enormous burden on the country and calls for an efficient and effective agricultural extension system. Agricultural extension in Nigeria is largely public, administered by the State Agricultural Development Projects (ADPs) under the supervision of the State Ministries of Agriculture. By design, the ADPs are meant to improve the agricultural productivity, income and general well being of the farmers (Maduekwe and Obibuaku, 1991). Referred to by Ifenkwe (2012) as the nerve centre of the extension organization, extension agents are important to, and determine, to a large extent, the level of success in any extension effort. Eku mankama and Anyanwu (2007) noted that the job performance of the field extension workers in the ADPs was of great concern to agricultural administrators, policy makers and development practitioners in Nigeria.
Closely related, role perception, job satisfaction and motivation are factors that greatly influence job performance of extension workers (Ibrahim et al., 2008). According to Robbin (2005), perception, which is an awareness or understanding unique to each individual, is an important factor that shapes peoples behavior and attitude. An extension officer who has failed to interpret his or her role correctly, therefore, risks non-performance or underperformance as the case may be. SHRM (2009) reported that employees who are satisfied with their jobs are generally more committed, productive and more likely to stay on the job. Motivation, a pro-active human resource management strategy, is imperative in ensuring job satisfaction (Oloruntoba and Ajayi, 2003).
The state of the Nigerian agricultural sector and the reported poor performance of
74
agricultural extension under the ADPs, particularly since the withdrawal of the World Bank financing, demand a critical look at the performance of the key resource of the system (extension agents) (Qamar, 2011). The following research questions were answered by the study: How do extension agents perceive their job roles? What are the factors of job satisfaction among the extension agents? Which ·socio-economic factors are associated with job performance? and, What factors motivate the extension agents?
Objectives of the study
The study investigated factors associated with job performance among extension agents in Kwara State. Specifically, the study: evaluated extension agents perception of their job roles; investigated the factors of job satisfaction among the extension agents; ascertained the socio-economic characteristics associated with job performance; and examined the factors that motivate the extension agents.
MATERIALS AND METHODS
The study area
The study was conducted in Kwara State, Nigeria. Created in 1967, the state consists of sixteen local government areas grouped into four agro-ecological zones. Agriculture is the major economic activity of the state with both cash and food crops grown in appreciable quantity. The primary ethnic group in the state is Yoruba with others being Nupe, Fulani and Baruba.
Sampling design
Questionnaires were administered on all sixty-nine (69) extension agents of the Kwara State ADP; however, only sixty-six (66) were returned and this formed the basis of the analysis.

f actors Associated with Job Performance of Extension Agen ts
Data collection and analytical tools
Data were obtained by the use of a s tructured and pretested questionnaire.
Descriptive statistics, specifically, frequ encies, percen tages and means were employed in analyzing the data collected.
The linear regression model was used to ascertain the relationship between selected socio-economic characteristics of the
respondents and their job performances.
Measurement of variables
Respondents were required to indicate the
extent to which they considered different activities to be their roles as extension agents. Their perception of the roles was then measured using a three point Likert -type scale rated as;
No extent = 1, g reat extent = 2, greater extent =3
The exten t to which respondents were satisfied with different aspects of their job was measured using a three point Liker t -type scale ra ted as;
No extent = 1, great extent = 2, greater extent
=3
The self p erceived job p erformance of the
respondents was obtained through their responses to specific s tatements on level of achievem ents on 10 key responsibilities handled by them. A three point Likert-type scale was employed and rated as follows;
Not satisfactory = 1, fairly satisfactory 2
and highly satisfactory = 3
The total mean score was calculated and taken as the level of job performance of each resp ondent.
The relationship between selected socioeconomic ch aracteris tics of the respondents
75
and their level of performance was
determmL-"t.. usmg tht lmea. rl:gres:>i n model.
The linear form of the regression model was expressed in the implicit form as follows;
Where Y = Job performance (Total mean
score) X1= Age (Years)
X2= Marital s tatus (1 if m arried, 2 otherwise) X3= Gender (1 for m ale, 0 for female) X4= Educational background (1 = Primary, 2= Secondary, 3= Tertiary, 4=Adult education, 5=
Training institute) Xs= Experience (Years) X6=Childhood background U= Error term.
RESULTS AND DISCUSSION
Socio-econ omic characteris tics of extension
agen ts
Selected socio-economic characteristics of the resp ondents are as presented in Table 1. With a mean age of approximately 49 years
the extension agents of the Kwara State ADP were predominantly middle aged and it is
expected that they were capable of the agility and versatility required in extension work.
Table 1 also reveal that in s pite of the important role of women in agriculture (UN, 1996; FAO, 2011), only 21.2% of the extension workers were female. This may possibly
affect the level of extension services provided to women farmers in Kwara State.
More than two thirds of the extension agents were married and 80.3% had tertiary
education. The remaining 19.7% attended training ins titutes. Majority of the extension agents (74.7%) had over 10 years of work
experience. This is Likely to have a good
impact on their performance and response to research questions given the wealth of

Akangbe et a/., 2013
experience which they might have acquired over time. The fact that 83.3% of the extension agents had rural childhood is likely to enhance their understanding of the mindset of their clientele and also of the peculiarities of rural communities.
Role perception among respondents
All the activities listed in Table 2 were considered by the respondents as their job roles. Making arrangement for input supply to farmers, with a mean score of 2. 79 was rated the highest by the majority in spite of the fact that this is more of a service role. Processing and recovery of loans ranked the lowest with a mean score of 227. Although teaching and educating farmers is a major function of extension agents, communicating new ideas and conducting Management Plot
Adaptive Technology (MPAT) were ranked average with modal frequencies of 5.15% and 66.7% respectively. The fact that input supply was perceived more important than the core agricultural extension responsibilities of technology transfer suggests that the extension agents had not correctly prioritized their roles and were likely to dissipate more energy, time and other resources in input supply at the expense of technology transfer and other advisory services. This has negative implications for the effectiveness of extension and needs to be addressed.
Job satisfaction among extension agents in Kwara State
Table 3 reveals that with mean score of 2.08 in both, the respondents were most satisfied
Table 1: Socio- economic characteristics of respondents
Socio-economic characteristics Frequency Percentage Age ~40 5 7.6 41-50 34 51.5 51-60 19 28.8 >60 8 12.1 Total 66 100 Gender Male 52 78.8 Female 14 21.2 Total 66 100 Marital status Single 16 24.2 Married 50 75.8 Total 66 100 Educational gualification Tertiary 53 80.3 .Training institutes 13 19.7 Total 66 100 Working exeerience ~10 17 25.8 11-20 36 54.5 21-30 12 18.2 >30 1 1.5 Total 66 100 Childhood backS!ound Rural 55 83.3 Urban 11 16.7 Total 66 100
Source: Field Survey, 2010
76

Factors Associated with Job Performance of Extension Agents
with the interest shown in them by their
supervisors and the feeling of job security they enjoy on the job. This is similar to the
findings of McCaslin and Mwangi (1994). In fact, all the respondents were satisfied, to a great extent, with the job. Seventy percent of
the respondents were satisfied with the level
of b·aining and the criteria for selection for
training. The level of cooperation received
from co-agents (1.32) and peoples'
perceptions of extension agents (1.12) had
scores o o average (1.5 and were the
areas of least satisfaction among the
extension agents. The low m ean score on cooperation received from co-agents is
suggestive of a low level of team spirit, team
work and networking among extension agen ts. People's perception of extension
Table 2: Distribution of respondents based on role perception
Statements summary Percentage Mean Rank No Great Greater
extent extent extent Studying village situations and learning its problems 37.9 62.1 262 5 Commw1icating new ideas to farmers 54.5 45.5 245 6 Preparing schedule for extension activities 25.8 74.2 2.74 2 Feeding back farm problems to researchers and 31.8 68.2 268 3 supervisors Initiating and promoting leadership 68.2 31.8 232 8 Conducting MPAT on farmer's plot 66.7 33.3 233 7 Organizing people for extension activities 68.2 31.8 2.32 8 Securing markets for farmers 69.7 30.3 230 11 Advising farmers on farm problems 31.8 68.2 268 3 Organizing farmers into cooperative societies 68.2 31.8 232 8 Processing and recovery of loans from farmers 72.7 27.3 227 12 Making arrangement for ineut sueely to farmers 21.2 78.8 279 1
Source: Field survey, 2010
Table 3: Distribution of respondents based on factors of job satisfaction
Statements summary Percentage Mean Rank No Great Greater
extent extent extent Training farmers g ives the agent job satisfaction 25.8 66.7 7.6 1.82 5 Cooperation received from co-agents satisfy the 69.7 28.8 1.5 1.32 11 agents The time I spend at work are the ones I enjoy most 21.2 78.8 1.79 6 The interest shown by my supervisor motivates 12.1 68.2 19.7 2.08 1 me The number of farmers am expected to visit is ok 28.8 71.2 1.71 8 People's perception about agents job satisfy the 87.9 12.1 1.12 12 agents I feel secured on my job 92.4 7.6 2.08 1 Organization concern for staff welfare satisfy the 45.5 54.5 1.55 10 agent Available transport facilities ease agents work 16.7 83.3 1.83 4 Pay and allowance satisfy the agent 13.6 86.4 1.86 3 I am ok with the criteria used for selection 28.8 71.2 1.71 8 Criteria used for selection to in-service training is 22.7 77.3 1.77 7 ok Source: Field survey, 2010
77
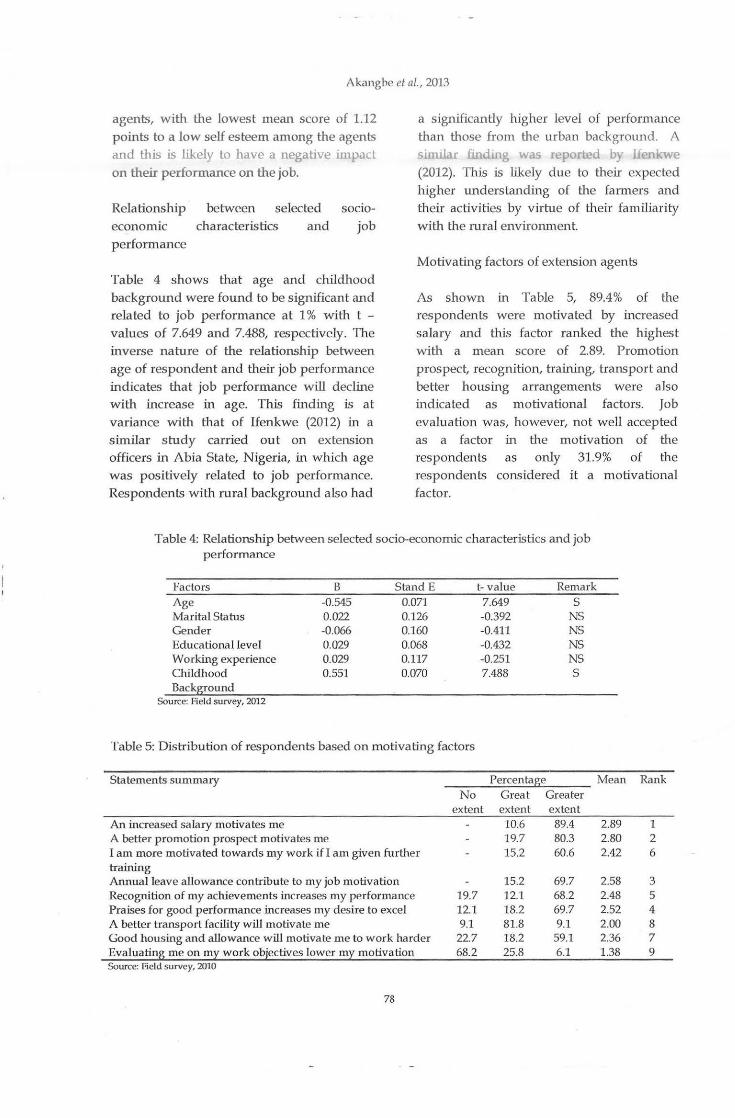
A kangbe el al., 2013
agents, with the lowest mean score of 1.12 points to a low self esteem among the agents and this is likely to have a negative impact on their performance on the job.
Rela tionship between selected socio-economic characteristics and job performance
Table 4 shows that age and childhood background were found to be significant and related to job performance at 1% with t -values of 7.649 and 7.488, respectively. The inverse nature of the relationship between age of respondent and their job performance indicates that job performance will decline with increase in age. This finding is at variance with that of Ifenkwe (2012) in a similar study carried out on extension officers in Abia State, Nigeria, in which age was positively rela ted to job performance. Respondents with rural background also had
a significantly higher level of performance than those from the urban background. A
similar find'ng "lS ·epomd by Ife-->kwe (2012). This is likely due to their expected higher unders tanding of the farmers and their activities by virtue of their familiarity with the rural environment.
Motivating factors of extension agents
As shown in Table 5, 89.4% of the respondents were motivated by increased salary and this factor ranked the highest with a mean score of 2.89. Promotion prospect, recognition, training, transport and better housing arrangements were also indicated as motivational factors. Job evaluation was, however, not well accepted as a factor in the motivation of the respondents as only 31.9% of the respondents considered it a motivational factor.
Table 4: Relationship between selected socio-economic characteristics and job performance
Factors B Stand E t- value Remark Age -0.545 0.071 7.649 s Marital Status 0.022 0.126 -0.392 NS Gender -0.066 0.160 -0.411 NS Educational level 0.029 0.068 -0.432 NS Working experience 0.029 0.117 -0.251 NS Childhood 0.551 0.070 7.488 s Background
Source: Field survey, 2012
Table 5: Distribution of respondents based on motivating factors
Statements summary
An increased salary motivates me A better promotion prospect motivates me I am more motivated towards my work if I am given fur ther training Annual leave allowance contribute to my job motivation Recognition of my achieve ments increases my performance Praises for good performance increases my desire to excel A better transport facility will motivate me Good housing and allowance will motivate me to work harder Evaluating me on my work objectives lower my motivation Source: Field survey, 2010
78
No extent
19.7 12.1 9.1
22.7 68.2
Percentage Great Greater extent extent 10.6 89.4 19.7 80.3 15.2 60.6
15.2 69.7 12.1 68.2 18.2 69.7 81.8 9.1 18.2 59.1 25.8 6.1
Mean Rank
2.89 1 2.80 2 2.42 6
2.58 3 2.48 5 2.52 4 2.00 8 2.36 7 1.38 9

Factors Associated with Job Performance of Extension Agents
CONCLUSION AND RECOMMENDATIONS
The study concluded that agricultural extension agents of the Kwara State ADP have a good understanding of the roles expected of them as extension agents. However, there were some challenges as to prioritizing th.ese roles. Job security and the interest shown in extension agents by their supervisors were the factors that gave the extension agents the most satisfaction on theiJ: job. Age and childhood background were the socio- economic factors which showed significant levels of relationship with the extension agents job performance. Increased salmy and prospect of promotion were the most important factors that motivated the extension agents to improved performance.
Based on the findings of this s tudy, it is recommended that:
There is the need to train extension officers of the Kwara State ADP on prioritizing their job roles.
Team spirit and networking should be encouraged among extension agents through training workshops.
The employment of younger and more versatile employees as extension agents to take over from the older once presently in service should be explored.
Regular payment of allowances and steady promotion of extension agents as at when due should be ensured.
REFERENCES
Ekumankama, 0. 0. and Anyanwu, A. C. 2007. Assessment of the Job Performance of Extension Staff in Akwa Ibom State of Nigeria. ASSET series, 2(1): 165-178.
79
Evenson, R. and Bravo-Ureta, B. 1994. Efficiency in Agricultural Production: The Case of Peasant Farmers m Eastern Paraguay. Agricultural Economics, 10(1): 27-37.
FAO. 2010. The State of Food Insecurity in the World 2010. Retrieved on 15U1 June, 2012 from http://www.fao.org/ docrep/013/ i1683e/ i1683 e.pdf.
FAO. 2011. The Role of Women in Agriculture. Working Paper No 11-02.
FAO. 2012. The State of Food Insecurity in the World.
Federal Ministry of Agriculture and Rural Development (FMARD). 2010. Nigeria National Agricultural Investment Plan (NAIP) 2011-2014.
HDR. 2008. Human Development Report 2007/2008 Retrieved on 16U1 August, 2012 from http://hdr.undp.org/ en / report/ global/ hdr.
Ibrahim, H., Muhammad, D. M., Yahaya, H. and Luka, E. G. 2008. Role Perception and Job Satisfaction Among Extension Workers In Nasarawa Agricultural Development Programme (NADP) of Nasarawa Sta te, Nigeria. Production Agriculture and Technology (PAT), 4(1): 62-70.
Ifenkwe, G. E. 2012. Agent-Related Factors Affecting the Performance of Agricultural Extension Staff in Abia State. Nigeria Journal of Agricultural Science, 3(1): 45-48.
Maduekwe, M. C. and Obibuaku, L. 0. 1991. Effects of personal factors on the effectiveness of extension supervisors. The Nigerian Journal of Agricultural Extension, 6 (1&2): 34-39.
McCaslin, N. L. and Mwangi, J. 1994. Job Satisfaction of Kenya Rift Valley Extension Agents. Journal of Extension, 32(3): 113-117.
Akangbe el al., 2013
Oloruntoba, A. and Ajayi, M. T. 2003. Motivational Factors and Employees job Sabsfactlon m large scale pnvate rarms m Ogun State Nigeria. Journal of International
Agricultural and Extension Education, 10(1): 67 -72.
Qamar, M. K. 2011. Introducing Demand -Driven Extension Approach in Traditional Region. FAO Rome 2011.
Rivera, W. 2001. Agricultural and Rural Extension Worldwide: Options for Institutional Reform in the Developing Countries. FAO, Rome.
80
Robbin, S. 2005. Organizational Behavior, Eleventh Edition. Prentice Hall: Pearson Educahon.
Society for Human Resources Management (SHRM). 2009. "Employee Job Satisfaction Report".
United Nations. 1996. Food Security for AU, Food Security for Rural Women. Geneva:
International Steering Committee on the Economic Advancement of Rural Women.
World Bank. 2005. "Getting Agriculture Going in Nigeria" African Development
Report.
Journal of Applied Agricultural Research 2013, 5(2): 81-87 ISSN 2006-750X ©Agricultural Research Council of Nigeria, 2013
A COMPARATIVE ANALYSIS OF COSTS AND RETURNS FOR SMALL RUMINANT MARKETING IN KA TSINA STATE
Isa, H. K.1, *Mohammed, A. B.2 Musa, S. A.2 and z. Abdu2 1Department of Agricultural Technology, College of Agriculture,
Hassan Usman Katsina Polyteclmics, Katsina, Nigeria 2Department of Agricultural Economics and Extension
Faculty of Agriculture, Bayero University, Kano. Nigeria *[email protected], +2348023564611
ABSTRACT
This study was a comparative analysis of the marketing of sma l.l ruminants (Sheep and Goats) in Katsina State, Nigeria. Primary data were used, collected from 112 randomly selected marketers us ing structured questionnaire. Descriptive statistics and profitability ratio were used to analyze the data collected. The result revealed a net return of N1342 per sheep marketed and N1004.40 per goat with ra te of return ratio of 0.12 in each with a difference of N337.96 per animal. The study identified insufficient capital (67.0%), poor sources of credit (61.6%), lack of marketers' associations (62.5%), lack of insurance of the business (94.6%), transportation problems (100%), lack of social amenities in the markets (100%) and lack of standard units of measurement (100%) as problems of sheep and goat marketing in the study area. It was recommended that marketers should embrace marketing sheep because it is more profitable compared to goat marketing. Massive enlightenment campaign, linkage w ith financial institutions, construction and rehabilitation of roads, provision of social amenities and enforcement of law and order were also recommended toward solving the constraints of small ruminant marketing in Katsina State.
Keywords: comparative analysis, cost and return, small ruminants, marketing
INTRODUCTION
Small ruminan t animals, simply referred to as sheep and goats, belong to the tribe caprini in the sub-family caprinae of the order artiodactyla. They are typical cloven-hooved ruminants of relatively small size. The caprini com prises of five (5) gen era; two of these (Capra and Hamitragus) are true goats, one genus (Ovis) is true sheep, and the other two genera (Ammotragus and Pseudois) are goat-like-sheep and sheep-like-goats (Fehilly et al. , 1984). The most simple and effective visual way of separating goats from sheep is the carriage of their tail. In all domestic goats, tails are erect while those of sheep are p endant. There are, however, a considerable
81
number of additional morphological differences between the two species. Goats have beards, caudal and scent glands in the male. Sheep have suborbital under the eyes, tear glands and lachrymals (tear) pits in the skull and also possess foot glands (Bunch et
al., 1976). There are many breeds of sheep and goats found in different regions of the world. In Nigeria, there are predominantly four (4) indigenous breeds of sheep (Uda, Balami and Yankasa in the North and the West African Dwarf in the South) and three (3) breeds of goats which are Red Sokoto (Maradi) and Sahelian (Desert Goat) in the North and West African Dwarf in the South (Oni, 2002).

Isa et a/., 2013
Sheep and goats a rc reared in the tropical regions of Africa and Asia mainly for the
. production of meat. Secondaty and less · widespread functions include wool, hair,
'i- - .• ~kin: rnilk, manure and even to carry small loads.~ Nigeria, sheep and goats are kept
;;.' ~ .. . pr:i.ril.ariiy for meat, skin, milk, cheese and
., ~~. ""J;?~ure. Apart from these, they feature , prominently in sacrifices, marriage and -.. "
., - miming ceremonies, festivals like sallah and • ;:,r ~receptions. Other advantages according to Winrock (1982) include their s mall sizes which allow for low investment costs, rapid maturity rate, ease of housing, reproductive efficiency, feeding behaviour, adaptability to dry areas and easy convertion to money for other purposes. Zipp (2000) lamented that the demand for animal resources is soaring in the developing world because of growing population and increased standard of living.
Marketing provides the m echanism whereby producers exchange their products for cash. The cash is used for acquiring goods and services, which they do not produce themselves, in order to satisfy a variety of needs ranging from food items, clothing, shelter, medication and schooling to the purchase of breeding s tock and other production inputs and supplies (Solomon and Negussie, 2002). Clerence et al. (1997) and Olukosi et al. (2005) defined marketing as the performance of all business activities which direct the forward flow of goods and services from producers to consumers in order to accomplish the producers ' and consumers' objectives.
In Nigeria, the sheep and goat producers transport their animals to the rural markets mainly on hoof or by motor vehicles (Olukosi et al., 2005). In the markets, middlemen take over the business of selling the animals from the producers. Potential buyers make their selection from assorted animals by visual inspection and feel. At the end of the transaction, the buyers pay the agreed price and a fee called commission
82
(Ia' ada), which is a commission for selling agents. Sometimes, local assemblers come to rural markets to assemble farm animals they buy from the producers and middlemen, and then transport the animals in lorries and buses to sheep and goat retail markets on daily basis. The purchased animals are either s laughtered there or carried to public abattoirs.
Statement of the research problem
Small ruminants in Nigeria suffer from neglect in marketing services in spite of their importance to the national and household welfare and economy. It is alleged that the basic marketing facilities rem ain underdeveloped. The marketing system was said to be disorganized, congested and the sanitary condition of the m arkets can best be described as appalling (Dahiya and Sharma, 1994). Furthermore, it was believed that prices of agricultural products, especially lives tock, are manipulated by numerous market middlemen: the units of measurement are not uniform; the physical and institutional infras h·uctures are inadequate; the absence of reliable market information and lack of organized sources of credit (Abbot and Makeham, 1986). In addition, it was understood that the marketers of sheep and goats go into the business concurrently without knowing which among the two is more profitable. It is apparent in this regard that focused information is required in this respect, especially cost and return information.
Objectives of the s tudy
The main aim of the study was to compare the costs and returns of marketing of sheep and goats in Katsina State. The specific objectives were to: (i) determine the costs and returns in marketing of sheep and goats in the study area (ii) identify the constraints of small ruminant marke ting in the study area.
Comparative Analysis of Small Ruminant Marketing
METHODOLOGY
The research was conducted in Katsina State which comprises of three agricultural zones namely: Zone I (Katsina zone), Zone II (Fw1tua Zone) and Zone III (Dutsin-ma Zone). The state is located in the extreme northern part of Nigeria and lies between latitude 11002" and 13003"N, and longitude 6005" and 9003"E. It covers an area of about 22,983 km2 with a population of 5,801,584 people &om which 2,948,279 were male while 2,853,305 were female. The people comprised of Hausa, Fulani, Kanuri, Yoruba, Igbo and many other Nigerians with migrants &om neighbouring countries like Niger Republic. Islam is the major religion of the state indigenes with few Christians and other religions (National Population Commission, 2006). Weather in the state varies accordin g to season. It has a maximum temperature of about 29-380C and a minimum of 18-270C with the average rainfall of 400-1300 mm. The soil types include clay loamy in the south, sandy loamy in the central and sandy soil in the extreme north with clay soil in most of the low lands of the state. Katsina State produces crops like cotton, groundnut, millet, guinea corn, maize, beans, rice, cassava, sesame, etc. and livestock like cattle, sheep, goats, poultry, donkeys and horses. It has many m arkets including rural and urban types scattered around the state where agricultural products are assembled for sale (Chukwuezi, 2009).
Sampling technique and sample size
The research considered all the three zones of the state. From each zone, two major markets were purposively selected based on size; location and inhabitants' involvement in small ruminant marketing. On that basis, Mashi and Charanchi markets were selected &om zone I, Kafur and Sheme markets &om zone II, as well as Danmusa and Batsari m arkets from zone III, making a total of six
83
markets selected for the study. In each market selected, twenty (20) small ruminanl
marketers were randomly selected by means of simple random sampling technique. Thus, a total of one hundred and twenty (120) marketers were selected from the six markets for the research.
Data collection
The research largely used primary data. Data collection was with the aid of structured· questionnaire prepared and distributed to one hundred and twenty (120) selected marketers. The questionnaire comprises multiple choices, open ended and closed ended questions &om which answers were selected or provided. However, only one hundred and twelve (112) of the 120 administered questionnaires were retrieved for the final analysis.
Tools of analysis
Descriptive statis tics was used to achieve objective 2 while profitability ratio was used for the achievement of objective 1.
Model specification
In descriptive s tatistics, frequency and percentage tables were used, while in profitability ratio the model was sp ecified as:
NR = TR - TC ... 1
where,
NR = Net Return in naira per animal. TR = Total Revenue (value of sale in naira per animal). TC = Total Cost (operating cost plus capital cost in naira per animal) (Olukosi et al., 2005)
RRR = NR/ TC
where,
RRR = Rate of Return Ratio NR = Net Return TC = Total Cost (Olukosi et al., 2005)

Isa eta/., 2013
RESULT AND DISCUSSION
The profitability concept tries to investigate the return from the business as some resources were invested in that business. Costs are the actual expenses incurred in the performance of the marketing functions as the commodity moves from the producer to the consumer. Returns on the other hand, are the earnings (profit or loss) received by the marketers as a result of certain resources invested into a particular business. Costs and returns associated with small ruminant marketing in Katsina State were investigated and the results are presented in Table 1.
The results presented in Table 1 revealed that sheep marketers in the study area purchased a sheep at N9,936.30 which is 92.5% of the total cost with h·ansport fee at N170.63 (21.2% of TMC and 1.6% of TC), handling cost at N413.16 (51.3% of TMC and 3.8% of TC), commission fee at N79.46 (9.9%) of TMC and 0.8% of TC) and tax/revenue at N141.52 (17.6% ofTMC and 1.3% ofTC). The total marketing costs were shown to be
N804.77 (100 % of TMC and 7.5% of TC) lule total cost ~ as ho ., as N10,7il a~
(100% of TC). The selling price of sheep was indicated as N12,083.43, net return as Nl,342.36 and rate of return ratio as 0.12.
Table 1 also shows that goat marketers in Katsina State purchased a goat at N7,447.59 (90.2% of total cost) with transport fee at N170.63 (21 .2% of TMC and 2.1% of TC handling cost at N413.16 (51.3% of TMC and 5.0% of TC), commission fee at N79.46 (9.9% of TMC and 1.0% of TC) and tax/revenue at N141.52 (17.6% ofTMC and 1.7% ofTC). The Total Marketing Cost (TMC) was indicated as N804.77 (100 % of TMC and 9.8% of TC) while total cost (TC) was N8,252.36 (100% of TC). The selling price of goat was shown as N 9,256.76 with Net Return (NR) of N 1,004.40 and Rate of Return Ratio (RRR) of 0.12.
Therefore, in marketing sheep and goats in the study area, purchasing cost was the major contributor to the total capital of the business while handling cost accounts for
Table 1: Costs and returns for small ruminant marketing in Katsina State
Variables
Sheep
Components
Selling p rice (SP) Purchasing price(PP) Transport fee Hand ling cost Com mission fee Tax/revenue Total marketing cost (TMC) Total cost (TC) Net return (NR)
_____ Rate of return ratio (RRR) Goat
Selling price (SP) Purchasing price(PP) Transport fee Handling cost Commission fee Tax/ revenue Total marketing cost (TMC) Total cost (TC) Net retum (NR)
Rate of return ratio (RRR) Source: Field Survey, 2010
84
12,083.43 9,936.30 170.63 413.16 79.46
141.52 804.77
10,741.07 1,342.36
0.12
9,256.76 7,447.59 170.63 413.16 79.46
141.52 804.77
8,252.36 1,004.40
0.12
%TMC %TC
92.5 21.2 1.6 51.3 3 .8 9.9 0.8
17.6 1.3 100.0 7.5
100.0
90.2 21.2 2.1 51.3 5.0 9.9 1.0 17.6 1.7
100.0 9.8 100.0

Comparative Analysis of Small Ruminant Marketing
more of the total marketing costs followed by transport then tax/ revenue. It also indicates that marketing of both sheep and goats contributes positively to the earning from the resources invested in the business. But earnings from sheep marketing were shown to be more than those from goats. This might be the reason why majority of the marketers in the study area go into marketing both sheep and goats concurrently. This generally means that, things being equ aL the more animals (sheep and goats) marketers purchase in the business, the more the earnings.
Constraints of small ruminant marketing in Ka tsina State
The marketing of agricultural products, including livestock, have their various problems. Over the years, agricultural
marketing has not received the type of attL'nhon accorded agrieultun... prouuction. Some of the constraints associated with small ruminant marketing in Katsina State were analyzed and the results presented in Table 2 indicate the constraints of sheep and goat marketing in Katsina State to include; insufficient land area (49.1% ), insufficient capital and poor sources of credit (67.0% each), difficulty in having access to credit (58.0%) lack of marketers associations (61.6 %) and lack of insurance of the business (94.6%). All (100%) of the respondents indicate transportation problems, lack of social amenities in the markets and lack of standard units of measurement as difficulties encountered in the marketing of sheep and goats. This agrees with Heter (1987) who noted that the marketing arrangements in animal marketing are without w eighing scales and this results in arbitrary. fixing of
Table 2: Identified constraints of small ruminant marketing in Katsina State
Variables Category Frequency % Availability of market area Yes 57 50.9
No 55 49.1 Total 112 100.0
Sources of capital Personal serving 56 50.0 Credit facilities 20 17.9 Both above 36 32.1 Total 112 100.0
Availability of capital Yes 37 33.0 No 75 67.0 Total 112 100.0
Sources of credit Family and friends 75 67.0 Local money lenders 20 17.9 Cooperatives 6 5.4 Banks 11 9.8
Total 112 100.0
Access to credit Easy 47 42.0 Difficult 65 58.0
Total 112 100.0
Availability of marketers association Yes 43 38.4 No 69 61.6 Total 112 100.0
Belonging to any association Yes 42 37.5 No 70 62.5
Total 112 100.0 Insurance of the business Yes 6 5.4
No 106 94.6
Total 112 100.0 Source: Field Survey, 2010
85
Isa et a/., 2013
prices by mere physical examination of animal rather than eigho., that is, quality standard are elusive. Abbot and Makeham (1986) also supported the finding as they stressed the inadequacy of physical and institutional infrastructures. Transport facilities, insufficient handling and processing as well as storage and warehousing facilities were among the physical infrastructures they indicated as being inadequate. The institutional infrastructures include; the absence of reliable information on supplies, prices and market prospects, lack of organized source of credit, parochial controls over urban markets and abattoirs and irregular standard of weights, measures and quality.
CONCLUSION AND RECOMMENDATION
The study revealed a net return of N1,342.36 per sheep and N 1,004.40 per goat marketing with rate of return ratio of 0.12 in each . The constraints of the business included; insufficient capital, poor sources of credit, lack of marketers associations, lack of insurance of the business, transportation problems, lack of social amenities in the markets and lack of standard units of measurement. Massive enlightenment campaign, linkage with financial institutions, construction and rehabilitation of roads, provision of social amenities in the markets and enforcement of law and order were recommended towards solving the constraints of small ruminant marketing in Katsina State.
REFERENCES
Abbot, J. C. and Makeham, J. C. 1986. Agricultural Economics and Marketing in the Tropics, Longman Group Ltd, UK
Bunch, T. D., Foote, W. C. and Spillet, J. ]. 1976. Sheep-Goat Hybrid Karyo Type. TheriogenolOgJJ, 6: 379 - 85.
86
Chukwuezi, P. 2009. Katsina State Student's Success Guide. P.C. Link, N1gena.
Clerence, W. T., Douglas, D. S. and Gail, L. C. 1997. Agricultural Economic and Agri
Business. John Wiley and Sons, New York.
Dahiya, B. 0. and Sharma, H. C. 1994. "Potato Marketing in India". Status Issues and Outlook, C.I.P. Social Science Working Paper 1994, Lima, Peru, CIP, 21 .
Fehilly, C. B., Willadson, S.M. and Tucker, E. M. 1984. Inter-Specific Chimaerism Between Sheep and Goats. Nate (London), 307: 634-6.
Heter, D. 1987. Potato Production, Marketing
and Programmes for Developing Countries. Boulder Co. U.S.A West View IT Publications, London.
NPC. 2006. Nigeria National population Census of 2006 Record, Africa first Publishers Ltd, Onitsha Nieeria, p . 120-127.
Olukosi, J. 0., Isitor, S. U. and Moses, 0. 0. 2005. Introduction to Agricultural Marketing
and Prices: Principles and Application. 3rd
Edition. Living Books Series, G. U. Publishers, Abuja, Nigeria.
Oni, 0. 0. 2002. Manual for Small Ruminant
Production. Compilation for a Training Workshop on Small Ruminant Production, Held at the National Animal Production Research Institute, Ahmadu Bello University Zaria, Nigeria, 13th to 18th January, 2002. p. 1 -4.
Solomon, B. and Negussie, T. 2002. Livestock Marketing Studies. http/www.fao.org/ weirdoes/ILRI/X5542B/5542BOJ.HTM.
Winrock. 1982. Livestock Programme Priorities and Strategies. WinrockInternational, Petit Jean Mountain, Aransas, U.S.A.

Comparative Analysis of Small Ruminant Marketing
Zipp, A. J 2000. Role of Global Animal Agricultural in the 21st Century. The Netherlands 13: 1 - 6.
87

Journal of Applied Agricultural Research 2013, 5(2): 89-94 ISSN 2006-750X ©Agricultural Research Council of Nigeria, 2013
FARMERS' PERCEPTION OF PROBLEMS INFLUENCING MAIZE STORAGE IN ABUJA, NIGERIA
*Ajah, J.l and J. N. Nmadu2 1Department of Agricultural Economics and Extension, University of Ahuja, Nigeria
2Department of Agricultural Economics and Extension Technology, Federal University of Technology, Minna, Nigeria
~'\ .. OP'i-*[email protected], +234 8053188880)
~~--·· ~ ABSTRACT (;;' f -~(\_ \ ~;;.~\ r -~ '~\. .. -......'·
Excess maize (Zea mays) grains need to be stored in order to maintain constant supply all 'lo' ~ , .~; .._ ~\ / >1 -year-round. However, most of the small scale farmers sell large proportion of their · _ , \~~-. I
4 j
produce immediately after harvest when price is low due to high supply. In view of this, '., .~ ./~_:'C""') a study was conducted to identify the problems that prevent farmers from s toring maize _ "?" ~J"- _.,: _..,_\) ~ ./ in Ahuja. A multi-stage sampling technique was adopted while structured questionnaires "-~..__:_ '1' ~-- _.. were used for data collection. A total of 160 maize farmers were interviewed in four -- .. ~.--.. -·-agricultural zones (40 farmers from each zone) of Ahuja. Data obtained were analyzed using one-way analysis of variance and mean separation was done at 5% probability level. Results sh owed that there was significant difference (P<0.05) in the perceptions of maize farmers regarding problems that militated against their d esire to store part of their maize grains after harvest. The most limiting problem against maize storage was rodent a ttack (2.70) and the cost of storage materials (2.33). On the other hand, the least limiting problem to maize storage was fear of the quantity the household would consume if s tored (0.74). In all the zones, Ahuja East Agricultural Zone was the worst hit (1.95) in terms of the problems. Based on the findings, it is recommended that government and non-governmental agencies should embark on campaign to sensitize the farmers on the use of rodenticides and other cultural means of controlling rodents.
Keywords: rats and rodents, storage materials, mean perception, agricultural zones
INTRODUCTION
Maize (Zea mays) is one of the most important cereals in the world. It has the highest world average yield per hectare among cereals followed by rice, wheat and millet (ASCE, 2008). It has its significance as a source of raw materials to a large number of industrial products besides its uses as human food and animal feed. According to Iken and Amusa (2004), the cultivation of maize was initially for subsistence purposes, but it has gradually become an important commercial crop on which many agro-allied industries depend for raw materials. According to Philip et al. (2006), it is the third
89
most important cereal crop and is grown largely in the rainforest and Guinea Savannah vegetation zones. Because of the importance of maize, Thamaga-Chitja et al. (2004) stated that maize needs to be stored from one harvest to the next in order to maintain its constant supply all-year-round and to preserve its quality until required for use. Nigeria is one of the few countries where maize can be grown all the year round either through irrigation or rain-fed. Edache (1999) stated that maize is produced across the country right from the mangrove region in the southern to the sahel savannah in the northern part of Nigeria. The author further added that the largest maize producing belts
Ajah and Nmadu, 2013
are in Kwara, Benue, Kaduna, Oyo, Ondo, and Ogun states. In support of the fact that maize can be grown in any part of Nigeria, Ado et al. (2004) also stated that maize is grown throughout Nigeria from Bayelsa State to Kebbi State and from Delta State to Barno State. In terms of output, ASCE (2008) stated that Nigeria produces over 6 million tonnes of the 624 million tonnes of maize produced annually worldwide.
From the forgoing, it is very clear that maize occupies a prime position among the food crops grown in Nigeria because it is one of the staples widely grown in the country. Nigeria has favourable conditions for the production of maize. Apart from the favourable conditions, there are different ways of storing maize which the farmers can adopt. The various storage techniques according to Sokumade and Oluwatayo (2009), range from open field storage, polyethylene, jute bags, and platform/ tree storage to built structures.
In spite of the favorable conditions in Nigeria, the price is high and unstable (fluctuating) indicating that there is a problem. For instance, the average prices of maize per 50kg in Ahuja in 2008, 2009 and 2010 were N2,640, N3,500 and N3,000, respectively (ASCE, 2008; 2009; 2010). Motivated by the fluctuations in price, the aim of this study is to find out the problems that prevent some farmers from storing maize after harvest in Ahuja. This is necessary because according to Garba (2000), Ahuja lies in the transitional zone between the grain dominated agriculture of the north and the predominantly root crop farming of the forest zone. In other words, it is situated between the savannah in the north and forest vegetation potentials production.
in the south with enough for supporting agricultural
The study is important because Sokunade and Oluwatayo (2009) stated that some of
90
the functions of agricultural produce storage are quantity equalization and market price stabilization. Again, effective storage, according to Thamaga-Chitja et al. (2004), p lays an important role in stabilizing food supply at the household level by smoothing seasonal food production. In other words, successful farm storage according to Sokunade and Oluwatayo (2009) enables farmers to sell maize when the price is most attractive (off-season).
RESEARCH METHODOLOGY
This study was conducted in Ahuja, Nigeria located between latitudes 8025' and 9025' North of the equator and longitudes 6045' and 7045' East. The population for the study comprised the small scale maize farmers in Ahuja. A multi-stage sampling and structured ques tionnaires were used for data collection. The area were delineated down to cells by Agricultural Development Programme (ADP). Presently, Ahuja has four (4) agricultural zones - Central, Eastern, Northern and Western Zones with twelve (12) agricultural blocks and ninety three (93) cells (AADP, 2009). In each of the four (4) agricultural zones, two (2) agricultural extension blocks were randomly chosen giving a total of eight (8) agricultural extension blocks. From each of the agricultural extension blocks, ten (10) cells were randomly chosen giving a total of 80 cells. In each of the cells, three (3) small scale maize farmers were randomly selected and interviewed. From those that were returned, two (2) properly filled questionnaires from each cell were used for the analysis. This gave a total of twenty (20) and forty (40) respondents per agricultural extension block and agricultural zone, respectively. For the four (4) agricultural zones, a total of 160 respondents were used for the analysis. Equal number (40 from each of the agricultural zones) was used because oneway repeated measure Analysis of Variance (ANOVA) was used for the analysis . By
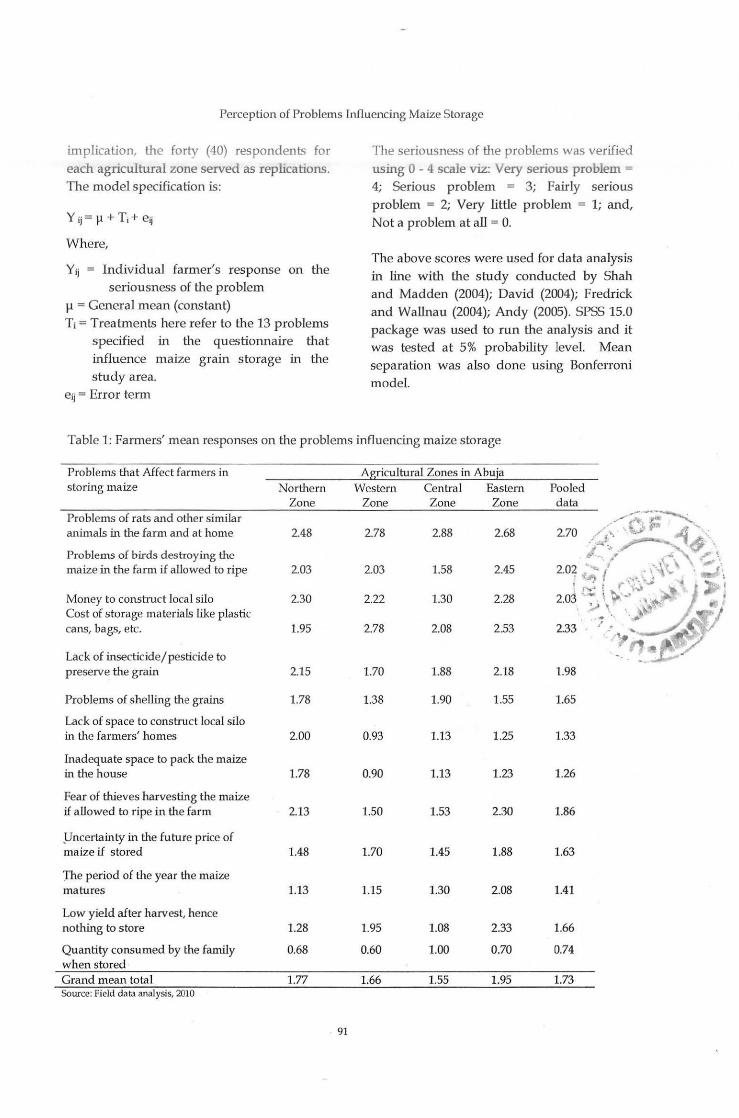
Perception of Problems Influencing Maize Storage
implication, the forty (40) respondents for
each agricu ltural zone served as replications. The model specification is:
Where,
Yij = Individual farmer's response on the
seriousness of the problem
Jl =General mean (constant) Ti = Treatments here refer to the 13 problems
specified in the questionnaire that influence maize grain storage in the study area.
eii = Error term
The seriousness of the problems was verified
using 0- 4 scale viz: Very serious problem= 4; Serious problem = 3; Fairly serious problem = 2; Very little problem = 1; and,
Not a problem at all = 0.
The above scores were used for data analysis in line with the study conducted by Shah and Madden (2004); David (2004); Fredrick
and Wallnau (2004); Andy (2005). SPSS 15.0 package was used to run the analysis and it was tested at 5% probability level. Mean separation was also done using Bonferroni
m odel.
Table 1: Farmers' mean responses on the problems influencing maize storage
Problems that Affect farmers in Agricultural Zones in Ahuja storing maize Northern Western Central Eastern Pooled
Zone Zone Zone Zone data Problems of rats and other similar --~ /'A s;: . #... ......
animals in the farm and at home 2.48 2.78 2.88 2.68 270 / ·. • .¥ Jf 0
0
··~··.£2 ~ 6. Problems of birds destroying the , .... ' c"· r.~. maize in the farm if allowed to ripe 2.03 2.03 1.58 2.45 0 ' J -~'o-, ~ 0 2. 2 .... { • \. .... 0 J.• . 1(, .. ,4'". t ~ ~
: .•. , ,,~ ' Money to construct local silo . ..... ~ _, ' 2.30 2.22 1.30 2.28 2.03 '~ ·• • • Cost of storage materials like plastic ~\ . .. 9' . ..,. cans, bags, etc. 1.95 2.78 2.08 2.53 2.33 . ; -:_ - .
Lack of insecticide/pesticide to preserve the grain 2.15 1.70 1.88 2.18 1.98
Problems of shelling the grains 1.78 1.38 1.90 1.55 1.65
Lack of space to construct local silo in the farmers' homes 2.00 0.93 1.13 1.25 1.33
Inadequate space to pack the maize in the house 1.78 0.90 1.13 1.23 1.26
Fear of thieves harvesting the maize if allowed to ripe in the farm 2.13 1.50 1.53 2.30 1.86
J.Jncertainty in the future price of maize if stored 1.48 1.70 1.45 1.88 1.63
)be period of the year the maize matures 1.13 1.15 1.30 2.08 1.41
Low yield after harvest, hence nothing to s tore 1.28 1.95 1.08 2.33 1.66
Quantity consumed by the family 0.68 0.60 1.00 0.70 0.74 when stored Grand mean total 1.77 1.66 1.55 1.95 1.73 Source: Field data analysis, 2010
91

Ajah and Nmadu, 2013
RESULTS AND DISCUSSION
Table 1 shows the farmers' mean responses to the problems hindering them from s toring maize. The mean responses were arranged according to the four agricultural zones in Abuja. Based on the pooled data results, none of the problems was perceived as being venJ serious (4). The highest problem was that of rat (Rattus rattus) and other similar animals (rodents) that destroy maize both in the farm and at home (2.70). This problem was p erceived by the farmers as serious (3). This confirms the observation of Ofor and Opara (2009) who stated that rodents, particularly, rats and grass cutters cause extens ive damage to both maize and sorghum in the northern and southern Guinea Savannah. According to them, rats (Rattus rattus) and bush fowls (Fraucolinus bicnlcnrntus) attack seedlings causing wide gap in crop rows which results in supplying and consequently increased cost and low y ield. The second problem was that of the
cos t of s torage materials like plastic can, ju te bags, plasb.c contamers, etc., (2.33) "'hile the least problem was that of fear of the quantity of maize the household would consume if stored (0.74). By implication, the farmers perceived the problem (the quantity of maize the household would consume if s tored) as being very little (1). At the zonal level, Abuja East Agricultural Zone felt the problems most (1.95) followed by the Northern Agricultural Zone (1.77). Furthermore, the grand mean perception is 1.73 implying that the farmers on average perceived the problems enumerated as fairly serious (2) in Abuja because the mean response tended towards two (2). This goes to show that the storage problems maize farmers encounter in Abuja were fair enough to allow them store maize. The value of the grand mean (1.73) indicated that the problems were not serious (3).
Table 2 shows the comparisons of the mean responses of farmers across agricultu ral
Table 2: Mean separation of problems influencing maize storage
Problems influencing maize storage
Problems of rat and other similar animals in the farm and at home
Cost of storage materials like plastic cans, bags, e. t.c
Money to construct local silo (silo made with mud)
Problems of birds destroying the maize in the farm if allowed to ripe
Lack of insecticide/pesticide to preserve the grain
Fear of thieves harvesting the maize if allowed to ripe in the farm Low yield after harvest, hence nothing to store
Problems of shelling the grains
Uncertainty in the future price of maize if stored
The period of the year the maize mature
Lack of space to construct local silo in the farmers' homes
Inadequate space to pack the maize in the house
Quantity consumed by the family if stored Grand mean response
abc Means with different superscript letters differ significantly (P<O.OS) Source: Field data analysis. 2010
92
Mean response value 2.70"
2.33•b
2.03"b
2.02bc
1.98bcd
1.86bcd 1.66<d•
1.65<de
1.63<de
1.41d•
1.33•
1.26-
0.741
1.73
Perception of Problems Influencing Maize Slorage
zones in the study area. Although the mean responc;e "alue on rodents' attack (2.70) was higher than that of storage materials (2.33), the mean values did not significantly differ from each other. This implies tha t the two problems were perceived the same by the farmers . It is apparent that some of the mean responses are relatively higher than others but it is important to note that they are not s tatistically significant (P>O.OS). This indicates that farmers' perception of the influence of some of the problems on maize storage was identical. This implies that some of the problems may be difficult to address in isolation. Remarkably, the leas t limiting problem to maize storage is that of the fear of the quantity the household would consume if s tored. The mean value (0.74) of this problem, significantly differed from all other problems. The implication of this mean value is that, among the problems lis ted, the least problem the maize farmers considered was the quantity their households would consume during the storage period. This is expected because as Sokunade and Oluwatayo (2009) s tated, Nigerian farmers store maize in various indigenous storage structures for the p urpose of self sustenance and household food security.
CONCLUSION
The goal of food policy in Nigeria is to examine the country's food self-sufficiency status, the gaps between food demand and supply of the various types of food and to recommend appropriate measu res which would raise production in quantitative and qualitative terms. To raise food production demands that some factors preventing farmers from storing food crops like maize should be indentified and addressed hence the need for the study. From the findings, it was obvious that several problems d iscouraged farmers from s toring maize grains after harvest but the most outstanding problem was rodents' a ttack. The least limiting problem to maize s torage was the
93
fear of the quantity the household would consume if stored. Based on the findings, it is, therefore, recommended that government and non-governmental agencies should embark on campaign to sensitize the farmers on the use of rodenticides and other cultural means of conh·olling rodents.
REFERENCES
AADP. 2009. Abuja Agricultural Development Programme: Document on the Delineation of Abuja into Zones, Blocks and Cells. Unpublished. p.l-2.
ASCE. 2008. Essential Commodity Price Polling as at 19th November 2008: Abuja Secu rities and Commodity Exchange, Federal Ministry of Agriculture and Rural Development, 397 Muhammadu Buhari Way, Central Business District, Abuja Nigeria. www.abujacomex.com/ pages/ market-data/ essential-commodities. php? g=O.
ASCE. 2009. Essential Commodity Price Polling as at 25th November 2009: Abuja Securities and Commodity Exchange, Federal Ministry of Agriculture and Rural Development, 397 Muhamrnadu Buhari Way, Cen tral Business District, Ahuja Nigeria. www.abujacomex.com / pages/ market-data/ essential-commodities.php? g=O.
ASCE. 2010. Essential Commodity Price Polling as at 3rd November 2010: Abuja Securities and Commodity Exchange, Federal Ministry of Agriculture and Rural Development, 397 Muhammadu Buhari Way, Central Business District, Abuja Nigeria. www.abujacomex.com/ pages/ market-data/ essential-commodities. php? g=O.
Ado, S. G., Adamu, R. S., Hussaini, M. N., Maigida, D. N. and Zarafi, A. B. 2004. Maize. In: N. U. A. Idem, and Showemimo (editors)

Ajah and Nmadu, 2013
Cereals Crops of Nigeria: Principles of Production and Utilization. p. 79-114.
Andy, F. 2005. Discovering Statistics Using
SPSS. (2nd edition), SAGE Publications, London, p. 427-482.
David, C. H. 2004. Fundamental Statistics for
the Behavioral Sciences (5U> edition), Thomson Higher Education Dan Drive Belmont, C.A., USA, p . 355- 437.
Edache, 0. A. 1999. Agricultural Policy in Relation to Sustainable Maize Production in Nigeria. In: Valencia, J. A., Falaki, A, M., Miko, S. and S, G. Ado (eds) Proceedings of the SG/200/ IAR/FMARD/ ADPs. National Maize Production Workshop, 22nd- 24U> July 1999 held at ABU. Zaria, p . 24.
Fredrick, G. ]. and Wallnau, B. L. 2004. Statistics for the Behavioral Sciences (6th edition), The Omson Learning Inc, USA, p. 395-471.
Garba, M. L. 2000. Agricultural Development in the Federal Capital Territory. In: Dawan, P. D. (ed.). Geography of Abuja Federal Capital Territory. Famous/ Asanlu publishers, Mirma, Niger State, Nigeria, p. 107-126.
Iken, J. E. and Amusa, N. A. 2004. Maize Research and Production in Nigeria. African
Journal ofBiotechnolog~;, 3(6): 302-307. ·
94
Ofor, M. 0. and Oparaeke, A.M. 2009. Crop Protection Challenges and Management in Production of Maize and Guinea Corn in Northern Guinea Savannah of Nigeria and Control Measures. Proceedings of the 43rd Annual Conference of Agricultural Society of Nigeria, 1 - 23th Oct., 2009, National University Commission (NUC) and Raw Material Research and Development Commission (RAMRDC), Abuja, p. 24 - 28.
Philip, 0. A., Kehinde, A. 0. and Ganiyu, 0. 0. 2006. Principles of Crop Production. IDEAS and INNOVATIONS Publication Ltd., p. 165-175.
Sokumade, A. B. and Oluwatayo, I. B. 2009. Comparative Analysis of Maize Storage Technologies in Kwara State, Nigeria. International Journal of Sustained Crop Production, 4(5): 24-31.
Shah, D. A. and Madden, L. V. 2004. Nonparametric Analysis of Ordinal Data in Designed Problemial Experiments. Phytopatholog~;, 94(1): 33-43.
Thamaga-Chitja, J. M., Hendriks, S. L.,
Ortmana, G. F. and Green, M. 2004. Impact of maize storage on rural household food security in northern Kwazuru-Natal. Journal
of Family Ecolog~; and Consumer Sciences, 32: 8-
15.
Journal of Applied Agricultural Research 2013, 5(2): 95-101 ISSN 2006-750X © Agricultural Research Council..of Nigeria, 2013
EXTENSION AGENTS' ASSESSMENT OF THE CHALLENGES OF AGRICULTURAL EXTENSION PRACTICE FOR NOMADIC FARMERS IN NORTHERN NIGERIA
Bidoli, T. D.l, *Kezi, D. M.2, Auta, S. p , Isa, A.G.3 andShehu, B.M.l I National Agricultural Extension Research and Liaison Services (NAERLS),
Ahmadu Bello University, Zaria 2West Africa Agricultural Productivity Programme (WAAPP), Ahuja, Nigeria
3Department of Vocational and Technical Education, A. B. U. Zaria *[email protected], +234813804 3788
ABSTRACT
The nature of operation of nomadic fanners has over the years posed a great challenge to extension practice due to frequent movements; thus, relevant and proven technologies hardly reach them. The main objective of this paper was to identify the socio-economic characteristics of extension agents in the study area, assess extension agents' perception of the challenges confronting extension efforts in disseminating proven agricultural practices to nomadic farmers. The study was conducted through a survey of State Agricultural Development Projects (ADPs) in the three (3) Agro-ecological zones of Northern Nigeria. Sample population was extension agents (EAs) and the purpose was to assess the challenges of extension service to nomadic farmers. Multistage sampling technique was used in the selection and interviewing of 135 EAs with the aid of questionnaire. Majority (85.93%) of the respondents fell within the active age group of 26 - 50 years and only 8.15% of the respondents were less than 25 years and another 5.19% w ere above 51 years of age. Also, 91.85% were males, while only 8.15% were females.
52.59% had Ordinary National Diploma/National Certificate of Education (OND/NCE), 36.30% had Senior School Certificate Exan1ination (SSCE), while only 11.11% had Bachelor of Science degree/Higher National Diploma (B.Sc./HND). Majority (81.49%) had working experiences ranging between 11-30 years, while 11.85% of the respondents had 31 years and above as working experience. Based on the mean scores, migration of nomads, funding of agricultural extension and training of extension agents were perceived by EAs as the most serious challenges for extension practice to nomads (X = 2.89, X = 2.74 and X = 2.23, respectively). Level of education (r = 0.838) and work experience (r = 0.942) also influenced significantly their perception of the challenges in delivering extension service to nomadic farmers. Conversely, age (r = 0.244) and gender (r = 0.127) did not significantly influence their perception.
Keywords: challenges, agricultural extension practice, nomadic farmers, Nigeria
INTRODUCTION
Nomads are e thnic or socio-professional groups who travel or migrate in large or small groups in search of means of livelihoods within a community, nation or across international boundaries. The nomadic population in Nigeria accounts for approximately 9.4 million people. They are organized in two broad categories
95
rom~~ ~ p~~rofu~ ~~ an estimated population of 6.5 million and artisanal migrant fishermen, whose population is estimated to be 2.8 million. The pastoral nomads are made up of the Fulani (5.3 million), the Koyam (32,000), the Badawi (20,000) and the Dark Buzzu (15,000). The Fulani being the largest group of p~toral nomads are found in 31 out of 36 states of the federation (National Commission for

Bidoli et al., 2013
Nomadic Education, 2009). The migrant fishermen reside in the riverine areas of Rivers, Bayelsa, Cross River, Akwa-Ibom, Delta, Ondo and Ogun states, and others are found in Inland water ways of Lake Chad (the Baduma people). Tawari (2002) stated that a migrant fisherman is one who leaves his natural community and moves from one h abitation to another in fulfilment of his occupation. The livelihoods of migrant fisher folks are tied around fishing. Apart from fishing, some engage in crop production, palm wine tapping, carving of dug-out canoes and weaving of baskets.
Though Oladoja et al. (2005) observed that extension delivery to a majority of fisher folks was effective, appropriate and consequently, majority had access to extension services, the nature of operation of nomads h as over the years posed great ch allenges to extension practice because nomads exhibit inherent values of frequent movement in small or large numbers and hardly s tay in permanent locations; thus, relevant and proven technologies do not get to them . Kezi et al. (2010) identified the challenges of agricultural extension practice to nomadic farmers as including; inadequate funding of agricultural extension, inadequ ate training of field extension agents, lack of agricultural extension policy, gender inequality/ imbalance in extension, migratory nature of nomads, choice/ use of appropriate extension method and geopolitical factors.
The main objective of this paper was to assess the perception of extension agents involved in delivering extension service to nomadic farmers in the study area. The sp ecific objectives of the s tudy were to identify the socio-economic characteristics of extension agen ts, assess extens ion agents' perception of the challenges confronting exten sion efforts in disseminating proven agricultural practices to nomadic farmers and recommend appropriate and practical
96
strategies towards improving extension service delivery to nomads.
MATERIALS AND METHODS
The study was conducted through a survey of State Agricultural Development Projects (ADPs) in the three (3) Agro-ecological zones of Northern Nigeria, namely; North East (NE) North West (NW) and North Central (NC). The target population of the survey was extension agents (EAs) in the ADPs and the purpose was to assess the challenges of extension service to nomadic groups. A multistage sampling technique was used to select respondents for the study as follows: Three (3) State ADPs were selected from each of the agro-ecological zones using simple random sampling, making a total of nine (9) ADPs included in the study. From the NE zone, Borno, Bauchi and Adamawa ADPs were selected; Zamfara, Jigawa and Kaduna ADPs were selected from the NW zone; while Benue, Niger and Kogi ADPs were selected from the NC zone . From each ADP, fifteen (15) extension agents (EAs) were purposely selected and interviewed based on their level of involvement in extens ion service towards nomadic groups. Thus information was collected from a total of 135 respondents using sh·uctured questionnaire. Information collected was centered on the socio-economic characteristics of responden ts and their perception of identified challenges of extension practice from reviewed literature. Socio-economic characteristics were age, gender, level of education and work experience. Identified challenges of agricultural extension practice include; inadequate funding of agricultural extens ion, inadequate training of field extens ion agents, lack of agricultural extension policy~ gender inequality/ imbalance in extension, migratory nature of nomads, choice/use of appropriate extension method and Geo-political factors (Kezi et al., 2010). Respondents were as ked to rate the
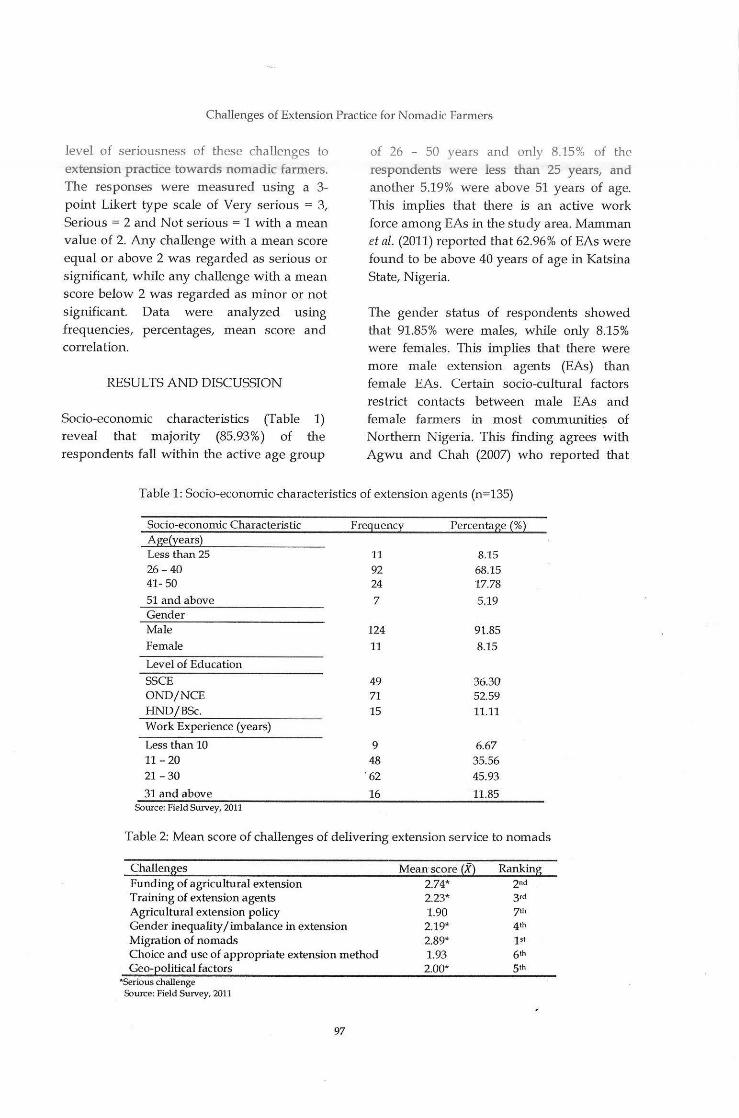
Challenges of Extension Practice for Nomadic Farmers
level of seriousness of these challenges to extension practice towards nomadic farmers. The responses were measured using a 3-point Likert type scale of Very serious = 3, Serious= 2 and Not serious= 1 with a mean value of 2. Any challenge with a mean score equal or above 2 was regarded as serious or significant, while any challenge with a mean score below 2 was regarded as minor or not significant. Data were analyzed using frequencies, percentages, mean score and correlation.
RESULTS AND DISCUSSION
Socio-economic characteristics (Table 1) reveal that majority (85.93%) of the respondents fall w ithin the active age group
of 26 - 50 years and only 8.15% of the respondents were less than 25 years, and another 5.19% were above 51 years of age. This implies that there is an active work force among EAs in the study area. Marnman et al. (2011) reported that 62.96% of EAs were found to be above 40 years of age in Katsina State, Nigeria.
The gender status of respondents showed that 91.85% were males, while only 8.15% were females . This implies that there were more male extension agents (EAs) than female EAs. Certain socio-cultural factors restrict contacts between male EAs and female farmers in most communities of Northern Nigeria. This finding agrees with Agwu and Chah (2007) who reported that
Table 1: Socio-economic characteristics of extension agents (n=l35)
Socio-economic Characteristic Frequency Percentage (%) Age(years} Less than 25 11 8.15 26 -40 92 68.15 41-50 24 17.78
51 and above 7 5.19 Gender Male 124 9 t.85 Female 11 8.15
Level of Education SSCE 49 36.30 OND/NCE 71 52.59 HND/BSc. 15 11.11 Work Experience (years)
Less than 10 9 6.67 11 - 20 48 35.56 21 -30 '62 45.93
31 and above 16 11.85 Source: Field Survey, 2011
Table 2: Mean score of challenges of delivering extension service to nomads
Challenges Funding of agricultural extension Training of extension agents Agricultural extension policy Gender inequality I imbalance in extension Migration of nomads Choice and use of appropriate extension method Geo-political factors
"Serious challenge Source: Field Survey, 2011
97
Mean score (X) 2.74* 2.23* 1.90 2.19* 2.89* 1.93 2.00*
Ranking
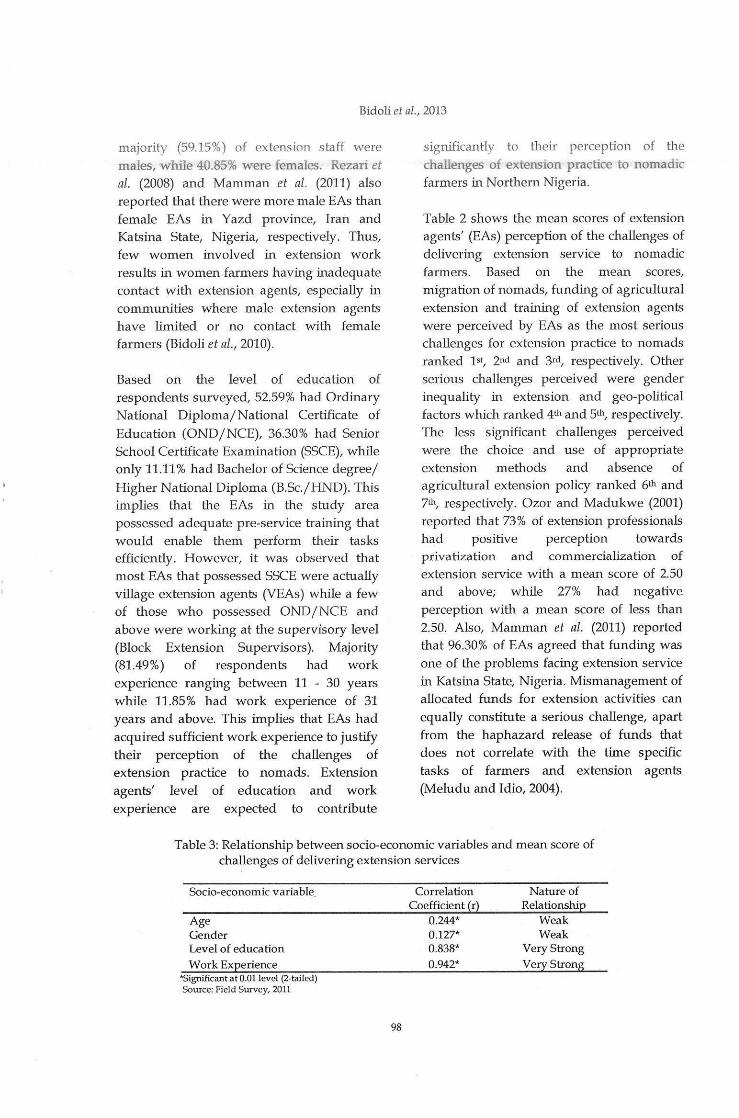
Bidoli et al., 2013
majority (59.15%) of extension staff were males, while 40.85% were females. Rezari et
al. (2008) and Mamman et al. (2011) also reported that there were more male EAs than female EAs in Yazd province, Iran and Katsina State, Nigeria, respectively. Thus, few women involved in extension work results in women farmers having inadequate contact with extension agents, especially in communities where male extension agents have limited or no contact with female farmers (Bidoli et al., 2010).
Based on the level of education of respondents surveyed, 52.59% had Ordinary National Diploma/National Certificate of Education (OND/NCE), 36.30% had Senior School Certificate Examination (SSCE), while only 11.11% had Bachelor of Science degree/ Higher National Diploma (B.Sc./HND). This implies that the EAs in the study area possessed adequate pre-service training that would enable them perform their tasks efficiently. However, it was observed that most EAs that possessed SSCE were actually village extension agents (VEAs) while a few of those who possessed OND/NCE and above were working at the supervisory level (Block Extension Supervisors). Majority (81.49%) of respondents had work experience ranging between 11 - 30 years while 11.85% had work experience of 31 years and above. This implies that EAs had acquired sufficient work experience to justify their perception of the challenges of extension practice to nomads. Extension agents' level of education and work experience are expected to contribute
significantly to their perception of the challenges of extension practice to nomadic farmers in Northern Nigeria.
Table 2 shows the mean scores of extension agents' (EAs) perception of the challenges of delivering extension service to nomadic farmers. Based on the mean scores, migration of nomads, funding of agricultural extension and training of extension agents were perceived by EAs as the most serious challenges for extension practice to nomads ranked 1st, 2nd and 3rct, respectively. Other serious challenges perceived were gender inequality in extension and geo-political factors which ranked 4th and 5th, respectively. The less significant challenges perceived were the choice and use of appropriate extension methods and absence of agricultural extension policy ranked 6th and 7th, respectively. Ozor and Madukwe (2001) reported that 73% of extension professionals had positive perception towards privatization and commercialization of extension service with a mean score of 2.50 and above; while 27% had negative perception with a mean score of less than 2.50. Also, Mamman et al. (2011) reported that 96.30% of EAs agreed that funding was one of the problems facing extension service in Katsina State, Nigeria. Mismanagement of allocated funds for extension activities can equally constitute a serious challenge, apart from the haphazard release of funds that does not correlate with the time specific tasks of farmers and extension agents (Meludu and Idio, 2004).
Table 3: Relationship between socio-economic variables and mean score of challenges of delivering extension services
Socio-economic variable.
Age Gender Level of education Work Experience
*Significant at O.Dllevel (2-tailed) Source: Field Survey, 2011
98
Correlation Coefficient (r)
0.244* 0.127* 0.838*
0.942*
Nature of Relationship
Weak Weak
Very Strong Very Strong
Challenges of Extension Practice for Nomadic Farmers
In Table 3, using correlation analysis, the
results of the relationslup between sOCioeconomic variables and extension agents' perception of the challenges of extension
practice to nomadic farmers is presented. Four socio-economic variables of EAs (age,
gender, level of education and work experience) were correlated against their perception of the challenges of administering
extension service to nomadic farmers. Extension agents' level of education (r = 0.838) and work experience (r = 0. 942)
exhibited very strong relationships to their perceived challenges of extension practice to
nomads. On the other hand, age (r = 0.244) and gender (r = 0.127) of EAs reflected weak rela tionships to their p erceived challenges of extension practice. This implies that EAs level of education and work experience influence significantly their perception of the
challenges of delivering extension service to nomadic farmers in the study area, whereas age and gender do not significantly influence their perception. Adedoyin et al. (1999)
observed that attainment of high level of education by EAs is necessary for effective
extension service. Accordingly, educational
and professional qualifications were identified to enhance the professional competence of extension staff and this may
in turn improve their personal effectiveness (Meera et al., 2004).
It can be argued that the changing nature of nomadic activities make training for agricultural extension agents indispensable. Ajieh and Ofuoku (2006) reported the
purpose of training in agricultural extension
to be for coping with constant changes in agricultural knowledge, technology and
farm improvement; coping with the constant
changes in the problems of farming in given
locations; making adjustments to meet changes in the patterns of behavior of extension beneficiaries and learning about appropriate procedures, approaches,
techniques and teaching aids in extension work amongst others.
99
CONCLUSION
Agricultural extension service designed to improve the health and production abilities of nomadic farmers is important. However, extension services are faced with challenges of the frequent movement of nomads,
inadequate funding of extension activities and sustained training of extension agents. Based on this study, EAs' level of education and work experience influenced significantly
their perception of the challenges of delivering extension service to nomadic
farmers in the study area, whereas age and
gender did not significantly influence their perception.
RECOMMENDATIONS
It is recommended that:
ADPs should be adequately funded to be able to organize, plan and implement extension activities for a wide variety of their clientele. This will enable them to meet their
needs and also to provide mobility or mobile residence for the extension agents in order to match the frequent movements of nomadic
farmers.
Specialized training programmes should be embarked upon by extension agencies to
create awareness and enable extension agents appreciate and understand the nature
of operation of nomadic farmers.
Development programmes should be organized to help nomads appreciate their environments, for example, providing grazing land with adequate watering facilities for livestock nomads.
Women should be mobilized and
encouraged to take up agricultural extension work. This will help address the cultural restrictions associated with male extension
agents visiting or talking with female farmers .

Bidoli et a/. , 2013
REFERENCES
Adedoyin, S. F., Fapojuwo, E. 0. and Torimiro, D. 0. 1999. Educational Communication Materials in Agricultural Technology Promotion: A Survey of Extension Agents in ljebu Area of Ogun State. Proceedings of the 5th Aruma! National Conference of the Agriculutural Extension Society of Nigeria (AESON) on Agricultural Research and Development in Nigeria. 12 -14th April, 1999.
Agwu, A. E. and Chah, J. M. 2007. Access and Utilisation of Modern Information Communication Technologies among Extension Personnel in Benue State of Nigeria. In Agricultural Extension and Challenges of the Millenium Development Goals (MDGs). Proceedings of the 12th
Annu al National Conference of the Agricultural Extension Society of Nigeria (AESON). El- Kanemi Hall, University of Maidugri. 5th- 6th July, p. 7-21.
Ajieh, R. C. and Ofuoku, A. U. 2006.
Assesssment of in-service training prospects for extension agents in Delta State ADP (DT ADP), Journal of Agricultural Extension, 9: 23 - 30.
Bidoli, T. D., Auta, S. J., Abiyong, P. A. and Kezi, D. M. 2010. Analysis of Gender Imbalance in Agricultural Education in Kaduna State: Challenges for Extension Education and Training. Proceedings of 15th
Annual National Conference of Agricultural Extension of Nigeria (AESON). Obafemi Owolowo University, Ile-Ife. 10th -14th May, 2010. p. 101-109.
Kezi, D. M., Bidoli, T. D., Shehu, B. M. and Issa, F. 0. 2010. Challenges of Agricultural Extension Practice among Nomadic Farmers in N igeria. Proceedings of 15th Annual National Conference of Agricultural Extension of Nigeria (AESON). Obafemi Owolowo University, Ile-Ife. 10th -14th May, 2010. p. 169-176.
100
Mamman, M., Umar, B. F. and Abubakar, B. Z. 2011. Analysis of Job Performance of Agricultural Extension Agents in Ka tsina State of Nigeria. In: Hassan, et. al. (Eds). Mobilising Agricultural Research towards Attaining Food Security. Proceedings of the 45th Annual Conference of the Agricultural Society of Nigeria (ASN). Faculty of Agriculture, Usman Danfodio University, Sokoto, Nigeria. 24U> - 28th October. p. 113-
117.
Meera, S. N., Jhamtani, A. and Rao, D. U. M. 2004. Information and Communication Technology in Agricultural Development: A
Comparative Analysis of Three Projects from India. Agricultural Research and Extension Network (AgREN). No 135.
Meludu, N. T and Idio, A. A. 2004. Options for Sustainable Funding of Agricultural Research and Extension for Small Scale Farmers in a Deregulated Economy. Paper presented at the Agric Extension Society of Nigeria (AESON) Conference at Obafemi Awolowo University, IJe-Ife. March, 9th-11th.
National Commission for Nomadic Education. 2009. Situation Report of Nomadic Education. Prepared by the Department of Programme Development and Extension, National Commission for Nomadic Education, Kaduna, N igeria. http:/ jwww.chr.up.ac.za/indigenous/ docu mentsjNigeria/Report/Situation Report on Nomadic Education.pdf on 25/11/09.
Oladoja, M. A., Adisa, B. 0. and Adeokun, 0. A. 2005. Access to Extension Delivery by Fisher folks in Lagos State, Nigeria. In: Capacity Building in Nigerian Agricultural System. Proceeding of the lOth Annual National Conference of the Agricultural Extension Society of Nigeria (AESON), 14th -
17th June. Pp 20-27.
Rezari, A. M., Alambeigi, A. and Rezvanfar, A. 2008. Analysis of the Job Performance of
Challenges of Extension Practice for Nomadic Farmers
the Agricultural Extension Experts of Yazd Province, Iran. Research joumal of Agnculture and Biological Sciences, 4(1): 78-85. Available at: http:// www.insinet.netj rjabs.html on 08/02/2012.
Tawari, F. 2002. Dissemination of Research Findings on Nomadic Education in Nigeria (The Migrant Fishermen Education Experience), Issues and Directions. Presented at the International Conference organized by International Extension College (IEC) Cambridge and sponsored by the Department for International Development (DFID) at Rock View Hotel, Abuja - Nigeria 16th- 19th January.
101

Journal of Applied Agricultural Research 2013, 5{2): 103-108 ISSN 2006-750X ©Agricu ltural Research Council of N1gena, 2013
PERCEPTION OF GOAT MILK PRODUCTION AND CONSUMPTION IN RURAL, PERI-URBAN AND URBAN AREAS OF OYO STATE, NIGERIA
*Ibhaze, G. A.l, Olorunnisomo, 0. A.l and A. A. Ladele3 I Department of Animal Science, Ruminant Nutrition and Dairy Science Laboratory,
20 epartment of Agricultural Extension and Rural Development, University of Ibadan, Ibadan, Nigeria
ABSTRACT
In order to evaluate the perception of respondents towards production and consumption of goat milk in Oyo State, a total of one hundred and twenty questionnaires were purposively administered to respondents in three different locations representing the rural, peri-urban and urban areas of the state. Findings revealed that 112 of the respondents had never consumed goat milk. Lack of awareness was the major factor influencing the attitudes of the people towards consumption of goat milk in the study area, followed by the fact that it is not traditional to milk goats and consume their milk. Cultural taboo and preference for meat production an10ng the populace were tertiary factors affecting perception of goat milk. There were no significant associations (P>O.OS) between socio-economic characteristics such as age (x2= 0.013), level of education (x2=9.049), religion (x2=2.357), sex (x2= 1.005), household si~e (x2=0.57) and study areas (x2=2.889) with the perception of the respondents about goat milk production and consumption. Results obtained indicated that goat keeping can be practised by all and sundry and adequate campaign programmes could encourage the consumption of goat milk by a ll classes of people in the society.
Keywords: perception, goat milk, consumption
INTRODUCTION
Milk is a source of animal protein with high biological value and it has a high potential for promoting good health. It is also a ready source of nutrients, being particularly rich in protein and lactose (Yahuza, 2001). It contains high concenb·ation of calcium and phosphorus (Chamberlain, 1989). Milk fats are u seful in the production of butter and cheese (Adeneye, 1991). It is also a source of energy, vitamins and its therapeutic properties, including anti-allergic properties, have long been recognized. Local fresh milk production and consumption in Nigeria has declined over the years (Apata and Adewumi, 2010) leading to importation of milk products. This in turn has led to high
103
prices of milk products, hence making it unaffordable for the average Nigerian.
From antiquity, cows have been the major producer of milk while goat milk products are not widely consumed (Nolan, 1982) but goats are reared for their meat, hides and skin. Milk production from dairy cattle requires substantial capital investments, including land, labour, technical, financial and managerial skills. All these factors of production are not within the reach of most rural households who are resource-limited; hence, the need for a sustainable source of milk supply for the people of the rural communities. Goats have played an important role in the social life of many Nigerians. Goats are relatively cheap to
Ibhaze el a/., 2013
acquire and reproduce quickly (Peacock, 1996) and they produce more milk in relation to boa y weight compared w1th cows (Apata and Adewumi, 2010). They are also easier to handle, have lower maintenance requirements, which makes them ideal for milk production by small scale farmers and rural households. Goat milk is a highly nutritious food and has great potentials to correct the nutritional imbalance of starchbased diets in Nigeria.
Goat milk is of benefit to children who are allergic to cow milk; it has gastronomic value for ulcer patients who may not consume milk from other sources (Ogebe, 1993). Goat milk is superior to cow milk in that tuberculosis (TB) bacteria are absent or rare in goat milk. Its protein resembles that of humans, it is higher in niacin, choline and inositol than cow milk, but lower in vitamins B6, B12. Carotenoids and the shorter chain fatty acids (C6, C8, C10, C12) are characteristically higher in goat milk than in cow milk (Aina, 2012). The milk casein and fat are more digestible than cow milk (Thomas and Rollins, 2004). The medicinal value of goat milk has boosted its popularity in developed countries (Solola et al., 2009). Barnet and Frederick (2000) reported that goat milk contains more fat an d ash than cow milk and also contains vitamin A which exists exclusively in its true form and not as carotenoid pigment. The small size fat globule of goat milk helps it to form a fine curd in the stomach and makes it more easily digested than cow milk.
Goat milk can be transformed into other forms of dairy products like cheese, yoghurt, ice cream and butter. Wilson {1984) reported that almost every household keeps sheep and goat in most rural areas in Nigeria, although the consumption of milk from goat is not traditional in this country. However, there is a growing awareness of the importance of goat as a source of milk for man (Malau-Aduli et al., 2001). The
104
consumption of goat milk is a veritable means of improving animal protein intake This study was carried out to investigate the perception of households towards production and consumption of goat milk in
rural, peri-urban and urban areas in Oyo State.
MATERIALS AND METHODS
This study was conducted among goat farmers in Oyo State of Nigeria. The state was categorized into three, namely; rural, peri-urban and urban. The selected areas were Malemuku, representing the rural; Onidundun, representing the peri-urban; and Bodija, representing urban. A total of one hundred and twenty questionnaires were administered to the respondents, with forty questionnaires distributed to each area of study. Data from the study were analyzed using, descriptive statistics (range, mean, frequency count and p ercentages) using SPSS (1999). Data on age, marital status, religion and level of education of respondents were obtained.
RESULTS AND DISCUSSION
Table 1 shows the background information of the respondents expressed in frequencies and percentages. The result of the study shows that the rural area had a larger p ercentage (45 %) of respondents who were above the age of 60 years. This implies that goat rearing is mostly practised in the rural area by the elderly. In the peri- urban area, majority of the respondents (32.5%) were between the ages of 41- 60 which shows that goat rearing is mostly practiced by the middle aged.
In the urban area, majority of the respondents (37.5 %) were above the age of 60 implying that most of the respondents were retirees who rear goat as a source of generating income. Majority of the respondents (79%) were females while 41%
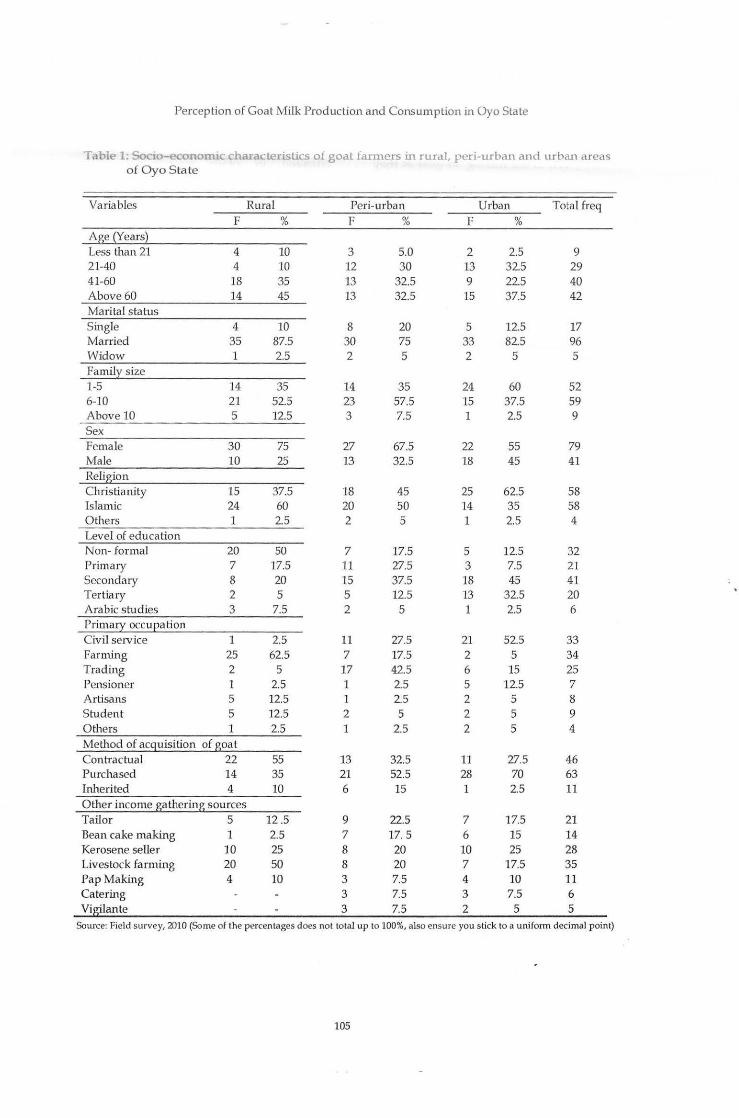
Perception of Goat Milk Production and Consumption in Oyo State
Table 1. Socio-economic characteristics of goal farn1ers in rural, peri-urban and urban areas ofOyo State
Variables Rural Peri-urban Urban Total freq F % F % F %
Age {Years} Less than 21 4 10 3 5.0 2 2.5 9 21-40 4 10 12 30 13 32.5 29 41-60 18 35 13 32.5 9 22.5 40 Above 60 14 45 13 32.5 15 37.5 42 Marital status Single 4 10 8 20 5 12.5 17 Married 35 87.5 30 75 33 82.5 96 Widow 1 2.5 2 5 2 5 5 Famili: size 1-5 14 35 14 35 24 60 52 6-10 21 52.5 23 57.5 15 37.5 59 Above 10 5 12.5 3 7.5 1 2.5 9 Sex Female 30 75 27 67.5 22 55 79 Male 10 25 13 32.5 18 45 41 Religion Christianity 15 37.5 18 45 25 62.5 58 Islamic 24 60 20 50 14 35 58 Others 1 2.5 2 5 1 2.5 4 Level of education Non- formal 20 50 7 17.5 5 12.5 32 Primary 7 17.5 11 27.5 3 7.5 21 Secondary 8 20 15 37.5 18 45 41 Tertiary 2 5 5 12.5 13 32.5 20 Arabic studies 3 7.5 2 5 1 2.5 6 Primary occu~ation Civil service 1 2.5 11 27.5 21 52.5 33 Farming 25 62.5 7 17.5 2 5 34 Trading 2 5 17 42.5 6 15 25 Pensioner 1 2.5 1 2.5 5 12.5 7 Artisans 5 12.5 1 2.5 2 5 8 Student 5 12.5 2 5 2 5 9 Others 1 2.5 1 2.5 2 5 4 Method of acguisition of goal Contractual 22 55 13 32.5 11 27.5 46 Purchased 14 35 21 52.5 28 70 63 Inherited 4 10 6 15 1 2.5 11 Other income gathering sources Tailor 5 12.5 9 22.5 7 17.5 21 Bean cake making 1 2.5 7 17.5 6 15 14 Ke rosene seller 10 25 8 20 10 25 28 Livestock farming 20 50 8 20 7 17.5 35 Pap Making 4 10 3 7.5 4 10 11 Catering 3 7.5 3 7.5 6 Vig!lante 3 7.5 2 5 5
Source: Field survey, 2010 (Some of the percentages does not total up to 100%, also ensure you stick to a uniform decimal point)
105
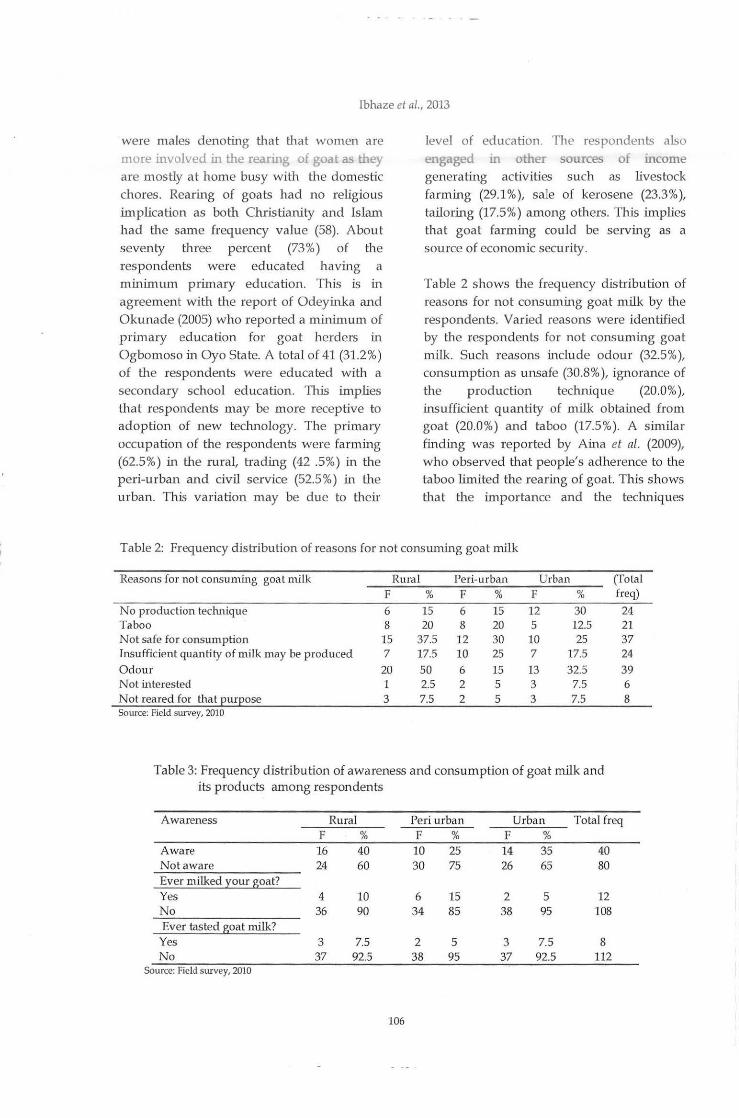
Ibhaze et al., 2013
were males denoting that that women are more involved in the rearing of goat as they are mostly at home busy with the domestic chores. Rearing of goats had no religious implication as both Christianity and Islam had the same frequency value (58). About seventy three percent (73%) of the respondents were educated having a minimum primary education. This is in agreement with the report of Odeyinka and Okunade (2005) who reported a minimum of primary education for goat herders in Ogbomoso in Oyo State. A total of 41 (31.2%)
of the respondents were educated with a secondary school education. This implies tha t respondents may be more receptive to adoption of new technology. The primary occupation of the respondents were farming (62.5%) in the rural, trading {42 .5%) in the peri-urban and civil service (52.5%) in the urban. This variation may be due to their
level of education. The respondents also engag~d m other sources of mcome generating activities such as livestock farming {29.1%), sale of kerosene (23.3%),
tailoring (17.5%) among otl1ers. This implies that goat farming could be serving as a source of economic security.
Table 2 shows the frequ ency distribution of reasons for not consuming goat milk by the respondents. Varied reasons were identified by the respondents for not consuming goat milk. Such reasons include odour (32.5%),
consumption as unsafe (30.8% ), ignorance of the production technique (20.0% ),
insufficient quantity of milk obtained from goat (20.0 %) and taboo (17.5% ). A similar finding was reported by Aina et al. (2009),
who observed that people's adherence to the taboo limited the rearing of goat. This shows that the importance and the techniques
Table 2: Frequency distribution of reasons for not consuming goat milk
Reasons for not consuming goat milk Rural Peri-urban Urban F % F % F %
No production technique 6 15 6 15 12 30 Taboo 8 20 8 20 5 12.5 Not safe for consumption 15 37.5 12 30 10 25 Insufficient qua11tity of milk may be produced 7 17.5 10 25 7 17.5 Odour 20 50 6 15 13 32.5 Not interested 1 2.5 2 5 3 7.5 Not reared for that 2ur2ose 3 7.5 2 5 3 7.5 Source: Field survey, 2010
Table 3: Frequency distribution of awareness and consumption of goat tnilk and its products among respondents
(Total freq) 24 21 37 24 39 6 8
Awareness Rural Peri urban Urban Total freq F % F % F %
Aware 16 40 10 25 14 35 40 Not aware 24 60 30 75 26 65 80 Ever milked your goat? Yes 4 10 6 15 2 5 12 No 36 90 34 85 38 95 108 Ever tasted goat milk? Yes 3 7.5 2 5 3 7.5 8 No 37 92.5 38 95 37 92.5 112
Source: Field survey, 2010
106
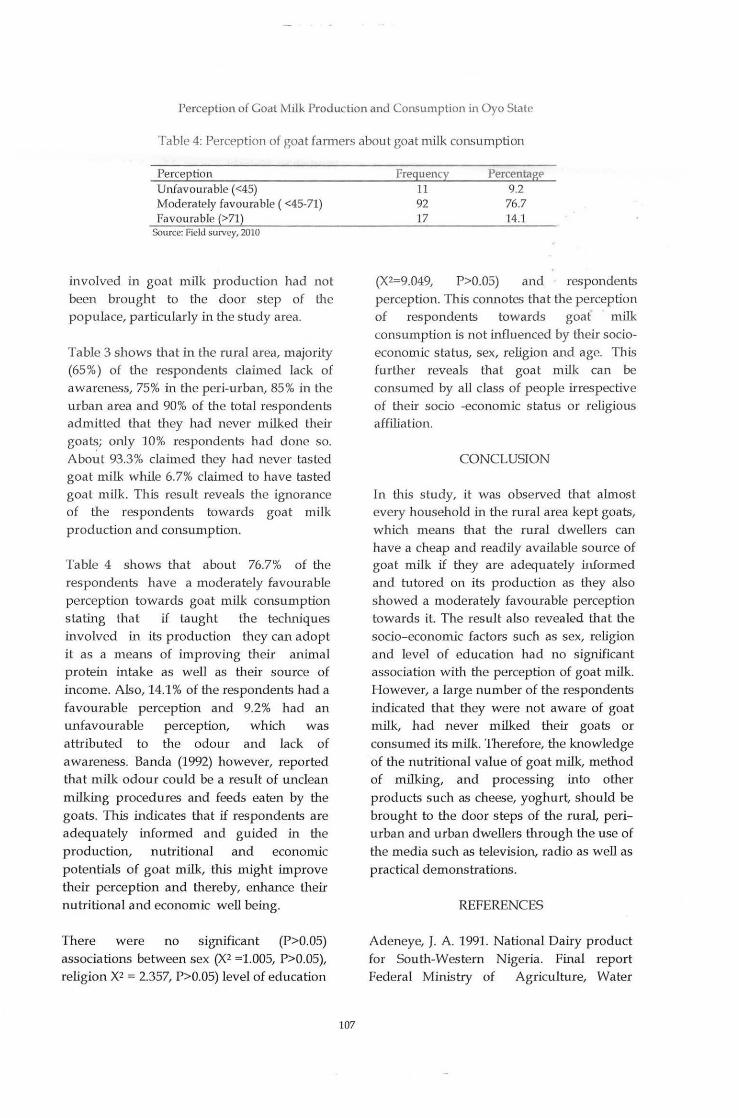
Perception of Goat Milk Production and Consumption in Oyo State
Table 4: Perception of goat farmers about goat milk consumption
Perception Unfavourable (<45) Moderately favourable ( <45-71) Favourable (>71)
Source: Field survey, 2010
involved in goat milk production had not been brought to the door step of the populace, particularly in the study area.
Table 3 shows that in the rural area, majority (65%) of the respondents claimed lack of awareness, 75% in the peri-urban, 85% in the urban area and 90% of the total respondents admitted tha t they had never milked their goats; only 10% respondents had done so. About 93.3% claimed they had never tas ted goat milk while 6. 7% claimed to have tasted goat milk. This result reveals the ignorance of the respondents towards goat milk production and consumption.
Table 4 shows that about 76.7% of the resp onden ts have a moderately favourable perception towards goat milk consumption stating that if taught the techniqu es involved in its production they can adop t it as a means of improving their animal protein intake as well as their source of income. Also, 14.1% of the respondents had a favourable perception and 9.2% had an unfavourable perception, which was attributed to the odour and lack of awareness. Banda (1992) however, reported tha t milk odour could be a result of unclean milking procedures and feeds eaten by the goats. This indicates that i.f respondents are adequately informed and guided in the production, nutritional and economic potentials of goat milk, this might improve their perception and thereby, enhance their nutritional and economic well being.
There were no significant (P>0.05) associations between sex (X2 =1.005, P>0.05), religion X2 = 2.357, P>0.05) level of education
107
Frequency 11 92 17
PercentagP 9.2
76.7 14.1
(X2=9.049, P>0.05) and respondents perception. This connotes that the perception of respon dents towards goat milk consumption is not influenced by their socioeconomic status, sex, religion and age. This further reveals that goat milk can be consumed by all class of people irrespective of their socio -economic s tatus or religious affiliation.
CONCLUSION
In this study, it was observed that almost every household in the rural area kept goats, which means that the rural dwellers can have a cheap and readily available source of goat milk if they are adequately informed and tutored on its production as they also showed a moderately favourable perception towards it. The result also revealed that the socio-economic factors such as sex, religion and level of edu cation had no significant association with the perception of goat milk. However, a large number of the respondents indicated that they were not aware of goat milk, had never milked their goats or consumed its milk. Therefore, the knowledge of the nutritional value of goat milk, method of milking, and processing into other products such as cheese, yoghurt, should be brought to the door steps of the rural, periurban and urban dwellers through the use of the media such as television, radio as well as practical demonstrations.
REFERENCES
Adeneye, ]. A. 1991. National Dairy product for South-Western Nigeria. Final report Federal Ministry of Agriculture, Water
Ibhaze et a/., 2013
Resources and Rural Development. National livestock Project Division.
~ina, A ~ . ]., Sowande, 0. S., Fasae, A. 0 ., Gloko, b. ·~. and Oderinde, 0. 0. 2009.
• •. . Traditional ~h~ep and Goat Rearing and
·· Taboos ... · ' m • South -Western Nigeria. Proceedings of 1!f111 A nnual Conference of Animal -Science Asi9~ation of Nigeria (ASAN). SepterJJPe; 14111 -17"1 2009. Lautech Ogbomoso, Nigeria.
Aina, A. B. J. 2012. GOAT (Capra hircus ) : A Misunderstood Animal. FUNAAB Inaugural lecture series no. 35.
Apata, 0. M. and Adewumi, 0. 0. 2010. Perception of Sheep and Goat Milk Consumption among rural Dwellers in South - Western Nigeria. Nigerian Journal of Animal Production, 37: 145-152.
Banda J. W. 1992. Comparison of consumer attitude towards and acceptance of goat, sheep and cow milk in Malawi. In: small ruminant research and development in Africa. Proceeding of the First Biennial Conference of the African Small Ruminant Research Network ILRD, Nairobi, Kenya 10- 14 December 1990.
p. 105 - 114.
Barnet, H. Jr. and Fredrick, S. 2000. Dairy Goat Production Guide. University of Florida, USA., p . 102-121.
Chamberlain, A. 1989. Milk production in the tropics. Longman scientific and ethnical, England, p . 242.
Malau-Aduli, B. S., Eduvie, I. 0 ., Lakpini, C. A. M. and Malau-Aduli, A. E. 0. 2001.
Effects of supplementation on the milk yield of Red Sokoto does. Proceedings of the 26U' Annual Conference of Nigerian Society for Animal Production, March 2001, ABU, Zaria, Nigeria, p. 353-355.
Nolan, M. 1982. Dual-purpose goats in Western Kenya; a summary of sociological
108
constraints. Proceedings SR-CRSP Workshop, Nairobi, Kenya. March 15,1982.
Odeyinka, S. M. and Okunade, G. K. 2005. Goat Production in Oyo State :A case study of Ogbomoso town. Nig. f. Anim. Prod., 32
(1): 108-115.
Ogebe, 0. P. 1993. Productivity, N utrient utiliza tion and behavioural Responses of WAD Goats fed on Sodium Supplement. Ph.D Thesis University of Ibadan.
Peacock, C. 1996. The feeding habits of goats. Improving goat production in the tropics. A manual for development workers. Oxfam, UK and Ireland, p . 66-68.
Solola, F. T., Osinowo, 0. A. and Onagbesan , 0. M. 2009. Effect of Roughage to Concentrate Ratio on Goat Milk Composition and Secretion Rate. Proceedings of the 14th Annual Conference of the Anima l Science association of Nigeria (ASAN), p. 652-654.
SPSS. 1999. Statis tical packages for social Sciences. SPSS for Microsoft windows, release 6.0 users manual.
Thomas, G. and Rollins, D. 2004. Persistency of milk production in three temperate goat breeds. Proceedings of the Annual National Agricultural Conference, Babados, p. 45-49.
Wilson, R. T. 1984. In: Socio-economic factors affecting large scale goat and sheep production in Ogun Sta te. J. 0. Okunlola. Proceeding. of the 27th Annual Conference of the Nigerian Society for Animal Production. March 17-21, FUT, Akure, Nigeria, p. 355-
358.
Yahuza, M. L. 2001. Small-holder Dairy production and Marketing Constraints in Nigeria. National Livestock Project division (NLPD) in Proceedings of a South-South Workshop held at the National Dairy Development Board (NDDB) Anan, India.
AGRICULTURAL ENGINEERING
109

~1\.}'i~
"'~A·"li
Journal of Applied Agricultural Research 2013, 5(2): 111-116 ISSN 2006-750X © Agricultural Research Council of N1gena, 2ill3
ANALYSIS OF PNEUMA TIC CLEANING OF COWPEA
*Aderinlewo, A. A.l and A. 0. Raji2 1Departrnent of Agricultural Engineering, University of Agriculture, Abeokuta, Nigeria
2Department of Agricultural and Environmental Engineering, University of Ibadan, Nigeria *[email protected]
ABSTRACT
This work examines the pneumatic separation of impurities from cowpea in a vertical flow pneumatic cleaner with a view to determining the influence of air velocity and angle of injection of cowpea-impurities mixture on cleaning efficiency. Cowpea-impurities mixture was injected into a pneumatic cleaner at air velocities of 4, 6 and 8 m/ s and angles of injection of 15, 30, 45, 6Cf'. It was observed that cleaning efficiency increased as air velocity and angle of injection increased . Optimum separation at a particular air velocity is obtained at angle of injection of 42-45". This is a useful guide for the inclination of hopper in vertical pneumatic cleaners.
Keywords: cowpea, impurities, pneumatic cleaner, cleaning efficiency
INTRODUCTION
Cowpea (Vigna unguiculnta (L.) Walp) is an annual legume that is widely grown and consumed in Nigeria. Cowpea contains about 25% protein (Davis et al., 2003,)
making it a cheap source of protein in the diet of many Nigerians. Cowpea also has the potential to be used as nutritional products to compensa te for the high proportion of carbohydra te often ingested in African diets and for infant and children weaning food (Lambot, 2003). However, a major constraint to such industrial use is the poor quality of cowpea available in the market in Nigeria (Taiwo, 1998).
The poor quality of cowpea available in Nigerian market is as a result of presence of impurities in them. After harvesting and threshing of cowpea in Nigeria, it is mostly cleaned by natural winnowing. However, the presence of impurities still persists. This is due to the relative ineffectiveness of manual winnowing. This has led to the development of a stationary vertical flow
111
pneumatic cleaner which has effective in removing impurities cowpea (Adegbulugbe, 2004).
proved from
Pneumatic cleaner has many advantages which include flexibility, safety and low initial cost. There is, however, a need to investigate the interaction of various parameters that influence aerodynamic separation of cowpea-impurities mixture in a cowpea pneumatic cleaner. Such parameters include physical and aerodynamic properties of components of the mixture, angle of injection of cowpea-impurities mixture into the vertical air stream, air velocity, moisture content, and angle of injection of the air stream into the vertical tunnel. This will help to determine the combination of parameters that will produce optimum cleaning or separation.
Different researchers have investigated the influence of different parameters that influence aerodynamic separation in a pneumatic system. Simllowo et al. (2007)
investigated the effect of tilt angle of air

Aderinlewo and Raj~ 2013
blower on the cleaning efficiency of a prototype pneumatic separator for cowpea. They mvestigated tilt angles of ()o to 3()o and concluded that maximum cleaning efficiency was obtained at 30°. Macmillan (1999) developed a computer model to analyse the particle separation that occurs when grain and chaff are winnowed by being thrown or dropped in the wind. The model showed that for a given throw velocity, increasing the air velocity increases the separation for all angles of throw. It also showed that for all combination of air and throw velocity the maximum separation is achieved at an angle of throw of about 140°. Adewumi et al.
(2006) developed a two dimensional mathematical model to predict particle trajectory when threshed cowpea materials were projected from a thresher into a horizontal air stream. The models were used to obtain displacement equations which were solved numerically to obtain a plot of particle trajectory which was used as a guide for selecting the dimensions of a cross flow pneumatic classifiers for the grains. Coria! and O'Callaghan (1991a,b) developed a two dimension equation to investigate grain and
impurities
straw separation in a vertical and horizontal air stream. They concluded that speed and direction of injected particles have significant effect on the design and dimensions of the cross section of the column.
The objective of this study was to investigate the effects of air velocity and angle of injection on the cleaning efficiency of cowpea-impurities mixture in a vertical pneumatic cleaner.
MATERIALS AND METHODS
Three varieties of cowpea, namely: Ife Brown, Ife 98-12 and IT90K-277-2 were obtained from the experimental farm of the Institute of Agricultural Research and Training, Moor Plantation, Ibadan, Nigeria. The moisture content of grains was determined by oven drying method using ASAE standards (1998). Physical properties of the grains such as true density, bulk density, porosity, thousand grain mass and projected areas were determined by standard experimental procedures. The terminal velocities were determined by
Hopper
C lean grain Air
Figure 1: Schematic diagram of the pneumatic cleaner (Aderinlewo, 2011)
112
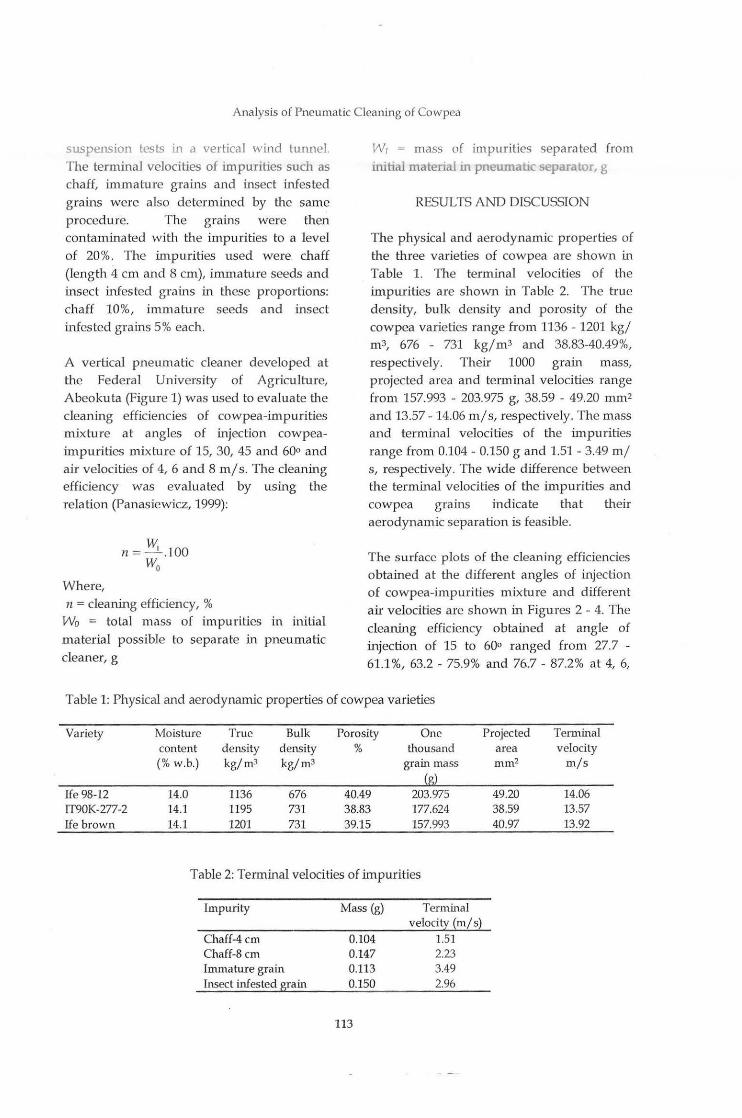
Analysis of Pneumatic Cleaning of Cowpea
suspension tests in a vertical wind tunnel. The terminal velocities of impurities such as chaff, immature grains and insect infested grains were also determined by fue same procedure. The grains were fuen contaminated with the impurities to a level of 20%. The impurities used were chaff (length 4 ern and 8 ern), immature seeds and insect infested grains in these proportions: chaff 10%, immature seeds and insect infested grains 5% each.
A vertical pneumatic cleaner developed a t the Federal University of Agriculture, Abeokuta (Figure 1) was used to evaluate the cleaning efficiencies of cowpea-impurities mixture a t angles of injection cowpeaimpurities mixture of 15, 30, 45 and 60° and air velocities of 4, 6 and 8 m/ s. The cleaning efficiency was evaluated by using the relation (Panasiewicz, 1999):
Where,
n= ~ .100 Wo
n = cleaning efficiency, % Wo = to tal mass of impurities in initial material possible to separate in pneumatic cleaner, g
W1 = mass of impurities separated hom mibal matenal m pneumabc separatOr, g
RESULTS AND DISCUSSION
The physical and aerodynamic properties of the three varie ties of cow pea are shown in Table 1. The terminal velocities of the impurities are shown in Table 2. The true density, bulk density and porosity of the cowpea varie ties range from 1136 - 1201 kg/ m3, 676 - 731 kgjm3 and 38.83-40.49%, respectively. Their 1000 grain mass, p rojected area and terminal velocities range from 157.993 - 203.975 g, 38.59 - 49.20 mm2 and 13.57 - 14.06 m /s, respectively. The m ass and terminal velocities of the impurities range from 0.104- 0.150 g and 1.51 - 3.49 m/ s, respectively. The wide difference between the terminal velocities of the impurities and cowpea grains indicate tha t their aerodynamic separation is feasible.
The surface plots of the cleanine efficiencies obtained at the different angles of injection of cowpea-impurities mixture and different air velocities are s hown in Figures 2 - 4. The cleaning efficiency obtained a t angle of injection of 15 to 60° ranged from 27.7 -61.1 %, 63.2 - 75.9% and 76.7 - 87.2% at 4, 6,
Table 1: Physical and aerodynamic properties of cowpea varieties
Variety
Ife 98-12 IT90K-277-2 Ife brown
Moisture True Bulk Porosity One content density density % thousand (% w.b.) kg/ m3 kgj m3 grain mass
14.0 1136 676 40.49 203.975 14.1 1195 731 38.83 177.624 14.1 1201 731 39.15 157.993
Table 2: Terminal velocities of impurities
Impurity Mass (g) Terminal velocil:X ~m/ s~
Chaff-4 em 0.104 1.51 Chaff-8 em 0.147 2.23 Immature grain 0.113 3.49 Insect infested grain 0.150 2.96
113
Projected Terminal area velocity mm2 m/s
49.20 14.06 38.59 13.57 40.97 13.92

* 90
>. 80 u 1:: I .2i
70 u ;r: I "'"' Q)
bCJ
·~ «l
I 60
Q) -u i
........ w _J
0
C: Air velocity, m/s ~Angle of injection (degree) o.uo 33.00
C: AIR VELOCITY 5·00 .. . S;oANGLE OF INJECTION Figure 2: Response surface plot fdrDeleanaqg efficiency of Ife 98-12
90
80
* 70
>. 60 u
c .2i u $ Q)
bCJ
·~ «l ~ u
7.00 51.00
6.00 42.00
33.00
C A. 1 . I 5.oo : u ve oc1ty, m s 4.00 15.00
Angle of injection (degree)
Figure 3: Response surface plot for cleaning efficiency of IT90K-277-2
114
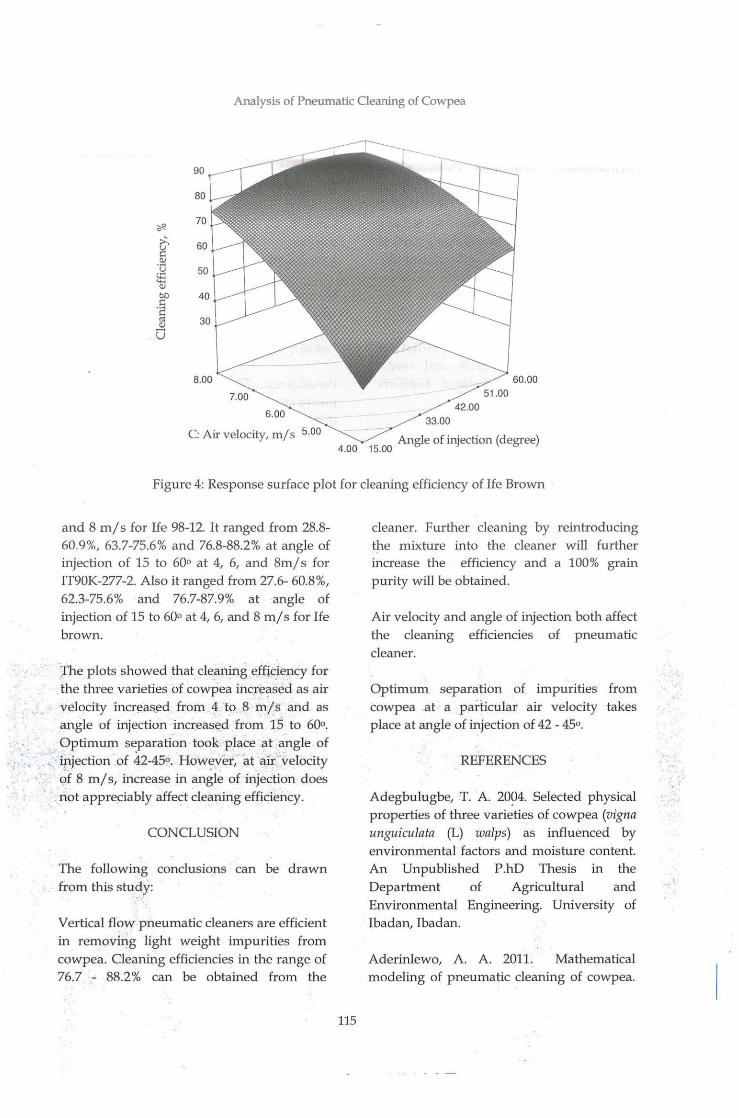
. ;,
Analysis of Pneumatic Cleaning of Cowpea
~
:>. l:j Q)
:g ::::: Q)
00
-~ Q)
0
90
80
70
60
7.00
6.00
C: Air velocity, m/ s 5.00 4.00 15.00
33.00
51.00 42.00
Angle of injection (degree)
Figure 4: Response surface plot for cleaning efficiency of Ife Brown
and 8 m/s for Ife 98-12. It ranged from 28.8-60.9%, 63.7-75.6% and 76.8-88.2% at angle of injection of 15 to 60° a t 4, 6, and 8m/ s for IT90K-277-2. Also it ranged from 27.6- 60.8%, 62.3-75.6% and 76.7-87.9% at angle of injection of 15 to 60° at 4, 6, and 8 m/ s for Ife brown.
Jhe plots showed that cleaning efficiency for the three varieties of cowpea increased as air velocity ·incr~ased from 4 to. 8 m/s and as angle of injection incx:eased from 15 to 6Qo .
. Optimum s~paration took place at angle of , · injection · of 42-45o. However, at air velocity
of 8 mj s, iricrease in ~gle of injection does not appreciably affect cleaning efficiency.
CONCLUSION
The following conclusions can be drawn from this study:
Vertical flow pneumatic cleaners are efficient in removirjg light weight impurities from cowpea. Cleaning efficiencies in the range of 76.7 - 88.2% can be obtained from the
115
cleaner. Further cleaning by reintroducing the mixture into the cleaner will further increase the efficiency and a 100% grain purity will be obtained.
Air velocity and angle of injection both affect the cleaning efficiencies of pneumatic cleaner.
Optimum separation of impurities from cowpea at a particular air velocity takes place at angle of injection of 42 - 45°.
REFERENCES
Adegbulugbe, T. A 2094. Selected physical properties of three varieties of cowpea (vigna unguiculata (L) walps) as influenced by environmental factors and moisture content. An Unpublished P.hD Thesis in the Department of Agricultural and Environmental Engineering. University of Ibadan, Ibadan.
Aderinlewo, A. A. 2011. Mathematical modeling of pneumatic cleaning of cowpea.

Aderinlewo and Raji, 2013
An Unpublished PhD Thesis in the Department of Agricultural and Envuonmental Engineering. University of lbadan, Ibadan.
Adewumi, B. A., Ogunlowo, A. S. and Ademosun, C. 0. 2006. Investigating particle trajectory as a parameter for selecting the dimensions of cross flow grain classifier. Agricultural Engineering In ternational: CIGR £journal, 7: 19.
ASAE Standards. 1998. Mois ture measurement-unground grain and seeds. American Society of Agricultural Engineers (ASAE), 5352.2:551.
Davis, D . W., Oelke, E. A., Oplinger, E. S., Doll, J. P., Hanson, C. V. and Putman D. H. 2003. Cowpea. Alternative Field Crops Manual. www.hort.purdue.edu/NEW CROP/ AFCM / cowpea.html, accessed on 9/10/ 08.
. . •· "1.. Gofiah B. Y. and O'Callaehan, ]. R. 1991a
Separation of grain from straw in a vertical air stream. Journal of Agricultural Engineering
Research, 48: 112-122.
116
Gorial, B. Y. and O'Callaghan, ]. R. 1991b. Separation of particles in a horizontal air
stream. Joumal of Agricultural Engineenng
Research, 49: 273-284.
Lambot, C. 2003. Industrial potential of cowpea. www.iita.org/ details/ cowpea, accessed on 13-06-06.
Macmillan, R. H. 1999. Winnowing in the wind- a computer study. Agricultural
Mechanisation in A sia, Africa and Latin
America, 30(1): 56-58.
Panasiewicz, M. 1999. Analysis of the pneumatic separation process of agricultural material. International Agrophysics, 13(2): 233-239.
Simolowo, 0. E., Araromi, 0. T. and Adesanya, 0. 0. 2007. Performance analysis of a modified pneumatic separator for cowpeas. Journal of Science and Technology
(Ghana), 27(3): 131-140 .
Taiwo, K. A. 1998. The potential of cowpea as human food in Nigeria. Technovation, 18
(7): 467-481.
Journal of Applied Agricultural Research 2013, 5(2): 117-124 ISSN 2006-750X ©Agricultural Research Council of N igeria, 2013
AN APPRAISAL OF A TILLAGE EQUIPMENT FOR SMALL HOLDER FARMING IN SOUTH WEST OF NIGERIA
*Adisa, A. F.l, Vaughan, I. 0.2, Aderinlewo, A. A.l, and P. 0. 0. Dadal I Agricultural Engineering Department,
2Jnstitute of Food Security, Environmental Resources and Agricultural Research, Federal University of Agriculture, Abeokuta, Nigeria.
*[email protected]. uk, +2348036319686
ABSTRACT
High level of labour use in small holder farming remains a big challenge and an alba tross to their operations. Addressing th is requires acquisition of appropriate mechanized farm tillage tools. This, however, must begin with the field testing and recommendation for adoption which took place at Federal University of Agriculture, Abeokuta, South West of Nigeria based on performance efficiency, affordability, durability and ease of operation for the small holde rs. A 6 hp (4.48 kw) Husqvarna T560RS rotary cultivator of 0.78 m width was acquired for field performance test for appraisal and adoption in small scale farming. This was a part of the front-end concern in the procurement-adoption chain. The e~uipment was .found not effective on a newly cleared !.and .. The effective field /~Q~ capaCity of the machine on a land that was already under cultivation was found to be /.--wi\' \ •Jir i''· 0.033 ha/hr; that is, it will take about 30.30 hours to till one hectare (tha t is, 5 working / ;l • · ~, days/hectare) and about 12 hours to till one acre in well cleared s tone-free soil typ!f': -. -~ \ where it was tested. The soil tillage performance of this equipment was found suitabl~ .;] for crops that can tolerate zero to shallow tillage depth of 0.21 m, w hich this equipment ~,._ was able to prov ide in the sandy loam under friable soil moisture condition. The machine· •.J is therefore recommended for introduction to research institutions, private horticulturists ~ ... and vege table farmers in the rural and urban farming communities with one to two ~. ~ hectares farm holding capacity. ' ~
Keywords: field test, cultivator, adoption, small holder and soil tilth
INTRODUCTION
Tillage equipment
There are primary and secondary tillage
implements. The primary tillage implements include; (a) mouldboard plow, (b) one-way
disc, (c) offset disc, (d) tined plow etc.
Secondary tillage implements include; (a) peg tooth harrow, (b) disc cultiva tor, (c) tined cultivator, (d) rotavator, to mention
few.
Small holder tillage equipment appraisal
Several studies have been conducted on the impact of agricultural mechanization on production, productivity, cropping intensity,
117
human labour employment as well as income generation for sustainable
livelihoods of hous eholds. The faith in agricultural mechanization as a panacea to
the production and productivity problems of Zimbabwe has its roots in the policy and
theoretical developments of the last half a
century drawing from the major conclusions of the seminal works reported by Hayami and Ruttan (1995), Beinswanger (1986) and
Beinswanger and Braun (1991). In line with this, Nweke (1978) observed that postindependence Ghana tractor mechanization
may have accounted for production
expansion arising from bringing more land under cultivation.

Adisa et a/., 2013
Small holder farm mechanization in SubSaharan Africa (SSA) relies heavily on manual labour and the hand hoe is the main implement used for crop production on up to 80% of the arable area. Draught animal power (DAP) represents a major advance in terms of available power and is especially important where human resources are being depleted by age, migration and pandemics. Farmers perceived advantages with mechanized tillage operations (e.g. improved weed control, mobilization of nutrients from the organic matter, preparation of a smooth seedbed, elimination of compacted zones, control of pest diseases, control of water runoff and accumulation of water). However, the damaging effects of the use of hoes and plows soon become apparent. They reduce soil organic matter through oxidation, cause various forms of physical, chemical and biological degradation (especially hard pans, soil crusting and erosion) and produce lower yields, which result in increased poverty and hunger, reduced food security and eventually abandonment of degraded farm land (Sims et al., 2012). The high level of labour use in small holder farming remains a big challenge and an albatross to the farmers and small farm tillage equipment. Any effort,. therefore, to alleviate the drudgery should enhance farmers' yields and eventual output (Schwenke, 1998).
Rotary cultivator
A cultivator is any of several types of farm implements used for secondary tillage that are used to loose, aerate and prepare soil for new planting or enhance the condition of soil for existing plantings. There are different types of cultivators and these include: field cultivators, row crop cultivators and garden cultivators. A rotary cultivator often known as a rotor tiller or rotor cultivator consists of sharp rotating tines or blades that are typically made of steel or aluminium. The rotating tines dig into the soil, loose and
118
aerate the soil in a process known as cultivation
A priority candidate tool, which is the small rotor tiller, is typically propelled forward by one to five horse power engine rotating tines that do n ot have traction wheels, though may have sn<aJl transport/ level control wheel(s) (LSU AgCentre, 2010). To keep the machine from moving too fast forward, an adjustable tine is usually fixed just behind the blades so that through friction with deeper untilled soil, it acts as a brake, slowing the machine and allowing it to pulverize the soils. The slower a rotor tiller moves forward, the better is the soil tilth or pulverization achieved (Buckingham et al.,
1984). The operator can control the amount of friction/ breaking action by raising and lowering the handle bars of the tiller. Rotor tiller do have reverse gears while in some, reversing is done by pulling machine backward manually. Rotor tilling is generally faster than manual tilling, but can be difficult to handle and exhausting to work with, especially in the heavy and higher horse power models. If the rotor tiller is clogged by a substance or an object, such as tree roots and buried garbage, it can cause the rotor tiller to abruptly and violently move in any direction.
Adoption of tillage equipment by small holders
Since adoption of new technologies is a gradual process exerted by a sequence of stages, there exists a time delay or lag between farmers' initial awareness on a new technology and their subsequent decision to adopt this technology (Masuki et al., 2006). Farmers go through transitional phases in adopting new technologies that they are introduced to. Introduction and awareness to these new technologies may be coordinated through extension efforts by private or public organisations or simply by observing
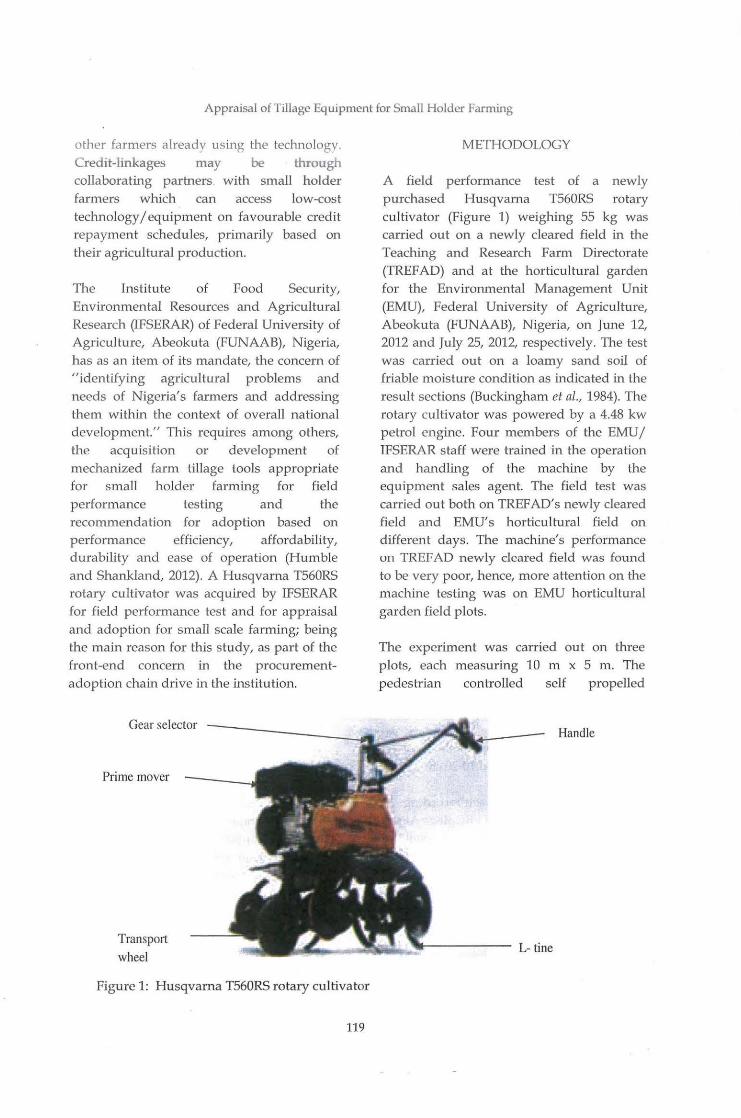
Appraisal of Tillage Equipment for Small Holder Farming
other farmers already using the technology. Credit-linkages may be through collaborating partners with small holder farmers which can access low-cost technology I equipment on favourable credit repayment schedules, primarily based on their agricultural production.
The Institute of Food Security, Environmental Resources and Agricultural Research (IFSERAR) of Federal University of Agriculture, Abeokuta (FUNAAB), N igeria, has as an item of its mandate, the concern of "id entifying agricultural problems and needs of Nigeria's farmers and addressing them within the context of overall national development." This requires among others, the acquisition or development of mechanized farm tillage tools appropriate for small holder farming for field performance testing and the recommendation for adoption based on performance efficiency, affordability, durability and ease of operation (Humble and Shankland, 2012). A Husqvarna T560RS rotary cultivator was acquired by IFSERAR for field performance test and for appraisal and adoption for small scale farming; being the main reason for this s tudy, as part of the front-end concern in the procurementadoption chain drive in the institution.
Gear selector
Prime mover
Transport wheel
Figure 1: Husqvarna T560RS rotary cultivator
119
METHODOLOGY
A field performance test of a newly purchased Husqvama T560RS rotary cultivator (Figure 1) weighing 55 kg was carried out on a newly cleared field in the Teaching and Research Farm Directorate (TREFAD) and at the horticultural garden for the Environmental Management Unit (EMU), Federal University of Agriculture, Abeokuta (FUNAAB), N igeria, on June 12, 2012 and July 25, 2012, respectively. The test was carried out on a loamy sand soil of friable moisture condition as indicated in the result sections (Buckingham et al., 1984). The rotary cultivator was powered by a 4.48 kw petrol engine. Four members of the EMU I IFSERAR staff were trained in the operation an d handling of the machine by the equipment sales agent. The field test was carried out both on TREFAD's newly cleared field and EMU's horticultural field on different days. The machine's performance on TREF AD newly cleared field was found to be very poor, hence, more attention on the m achine testing was on EMU horticultural garden field plots.
The experiment was carried out on three p lots, each measuring 10 m x 5 m. The pedestrian controlled self propelled
Handle
Adisa et al., 2013
cultivator is powered by a 5 hp petrol engine. On each of the plots. the following parameters were measured: length of the field plot covered by the cultivator, the average width covered by the equipment, depth of cut, time taken to cover the tilling of the plot plus turning time, equipmen t unclogging and other idle time inclusive as well as fuel consumption. A trial run was earlier conducted on the TREFAD farm of FUNAAB on a newly cleared land with stony sand loamy soil type which came up with poor result, hence the test did not continue on this field. It was after this trial that the equipment sale agent's operator came to train the operators and assisted carrying out the experiment that took place on EMU'S horticultural garden. Lengths along the row and furrow width were measured by 30 m field measuring tape; ruler was used to measure depth of cut of the loosed soil. Time at start and finishing of operation was taken by digital stop watch and the fuel consumption was measured by the use of calibrated cylinder to always top the fuel tank to a marked level after each operation and taking note of volume used for topping each time. Soil samples were collected from the three plots before and after tillage operation and taken to the laboratory to determine the soil moisture content and bulk density measurements. Soil moisture content and bulk density before and after the tillage operation were investigated using the method of core sample to depth: 0-10 and 10-20 em.
A CP20 penetrometer self-recording type, manufactured by Agri RIMIK, Aus tralia (1994), was used to take soil tilth measurements before and after plowing operation on the three p lots a t depth ranging from 0 to 22.5 em under a friable soil moisture condition . It is an ultrasonic dep th recording mode penetrometer type which was operated by driving stainless s teel cone (apex angle) of 30o and a basal area 78.5 em mounted at the end of a steel shaft of leng th
120
1 m of 10 mm diamete r vertically into the <>oil. Insertion of the probe " ·as eased h} a rubber mounted on two handles at the upper end of the instrument. A footplate with a hole for passage of the 1 m shaft ensured stability of the unit during the measurements. The maximum depth that the equipment was configured to measure was 50 em at depth interval of 2.50 em. The equipment was sensitive enough to terminate measurements if the rate of penetration was too fast or too slow, according to its user-dependent calibration. The implication of this is that the cone index sensor is depth calibrated because it was able to remove subjective push of penetrometer into the soil. Furthermore, it could take penetrometer resistance up to 5000 kPa (N/ m2). Therefore, if it cam e in contact with an impediment like gravel, which it could not penetrate, the measurement was terminated. All readings were stored electronically in the memory of the controller unit. In addition, a con venient feature was a digital readout that showed the readings during operation. An Excel Microsoft Spreadsheet was used for the downloading of the data to computer from where cone index value readings were obtained for the three plots' soil resistance before and after tillage operation.
Parameters measured
Length of the plot, m Machine theoretical width (equipment plow width), m Working width of cut (plow width), m Working depth of cu t (plow depth), m Time of operation, h/ha Fuel consumption, L/ha Soil tilth (soil resistance before and after plowing operations), N/ m2 Soil moisture content determination, %
Parameters computed
Theoretical field capacity, effective field capacity and machine field efficiency

Appraisal of Tillage Equipment for Small Holder Farming
Parameters were computed with the
following equations (Kepner et al. 2005):
TFC = SxW 10 ... 1
MFE = ¥~~X 100
Where:
EFC= SWxWW 10 ... 2
TFC = Theoretical field capacity, ha/hr EFC =Effective field capacity, ha/hr
MFE = Machine field efficiency,%
S = Machine rated speed, km/ hr
Table 1: Field performance test for T560RS rotary cul tivator
Parameter P lots II
Length of plot (m) 10 10 Machine rated width (m) 0.78 0.78 Machine rated speed (km/hr) 0.55 0.55 Working wid th of cut (m) 0.62 0.63 Depth of cut (plow d epth) (m) 0.19 0.21 Average time taken per plo t (min/plot) 1.18 1.20 Fu el con sumption (L/ha) 49.25 47.50 Working speed (km/hr) 0.51 0.50 Theoretical field capacity (ha/hr) 0.043 0.043 Effective field capacity (ha/ hr) 0.032 0.032 Machine field e fficiency (%) 74.42 74.42 Soil moisture content before plow(%) (w.b .) 14.11 15.02 Soil moisture content after elow { %~ {w.b.~ 13.64 12.81
Table 2: Soil properties before tillage operation
Depth (em) Bulk density (g/cmJ) Plots
II III 0-10 1.44 1.38 1.34 10-20 1.45 1.38 1.36
Table 3: Soil properties after operation
Depth (em)
0-10 10-20
1.35 1.29
Table 4: Cone index before tillage
Depth (em)
I 2.5 861 5.0 1028 7.5 1021 10.0 1134 12.5 1680 15.0 2271 17.5 2074 20.0 1900 22.5 2855
Bulk density (g/ cm3) Plots
n III 1.31 1.27
1.24 1.25
Cone index kNj m2 Plots
II III 876 664
1142 1157 1733 2423 2248 2779 1589 2582 960 2862
1202 3719 1672 5000 2506 5000
121
III 10
0.78 0.55 0.65 0.22 1.13
46.50 0.53
0.043 0.034 79.07 12.87 15.13
Average (g/cm~)
1.39 1..40
Average (g/cm~)
1.30 1.27
Average
800 1109 1726 2054 1950 2031 2332 2857 3454
Ave rage
10 0.78 0.55 0.63 0.21 1.18 47.75 0.51
0.043 0.033 75.97 14.00 13.86
... 3

Adisa et al., 2013
W = Rated width, m Sw = Machine working speed, km/hr Ww = Workmg wtdth, m
RESULTS
The theoretical field capacity, effective field capacity and machine field efficiency obtained from data measured and computed from the field tests are presented in Tables 1, 2, 3, 4 and 5.
DISCUSSION
The machine tillage performance test result on the TREFAD newly cleared land was very poor, hence test on this field was discontinued. The average values of the parameters obtained from the EMU horticultural garden field performance tests are shown in Table 1. The average time of operation was 1.18 minutes per plot. The average field efficiency was 76.74% which shows that the machine was efficient for the tillage operation in terms of the work rate for the small farm holding. The average moisture content before (14.00%, wet basis) and after (13.86%, wet basis) plowing operation showed slight reduction because of water draining to some extent after plowing on the loamy sand soil. The average rated speed of the machine was 0.55 km/h at average rated width of 0.78 m compared with the average working speed of 0.51 km/ hat average working width of 0.63 m.
Table 5: Cone index after tillage
Depth (em)
2.5 316 5.0 937 7.5 1748 10.0 930 12.5 1536 15.0 1513 17.5 1847 20.0 2082 22.5 2112
Soil physical properties (texture and structure) before and after the experiment are shown in Tables 2 and 4 and 3 and 5, respectively. Textural nature of soil sample at EMU horticultural garden was determined from the textural triangle which resulted in;
87.00% sand, 5.60% silt and 5.10% clay, making it a sandy loam soil. The average bulk densities increased marginally by depth plowing operation as shown in Table 2. Table 3 shows the bulk densities after the experiment which decreased when placed side by side with Table 2 at every level all through and it also decreased with depth. This shows that the machine improved the structure of the soil; for instance, at depth 10 cm-20 em on plot 111, the bulk density was 1.40 g/ cm3 before ploughing and became 1.27 g/ cm3 after plough. The cone index readings (soil resistance) of the plots before and after the experiment are as shown in tables 4 and 5. It can be seen that soil resistance of the plots after the tillage operation reduced. This shows that the machine was effective in breaking soil clods or compacted soil within the seed and root bed zones at an average depth of 0.21 m as shown in Table 1, providing good soil condition for crop establishment.
By interpretation of the , ' effective field capacity (0.033 ha/h) resul~ . obtained from this experiment, it will take about 30.30 hours to plow one hectare :.~i.e. 5 working days at 6 hours/ day) and aq~ut 12 hours ta.
.· ..
Cone index KN / m 2 Plots Average
II III 566 566 483 786 528 750
1051 331 1043 861 854 882 823 1794 1384 1551 2605 1890 2286 2552 2228 1986 3560 2544 1945 2855 2304
122

Appraisal of Tillage Equipment for Small Holder Farming
plow one acre in well cleared stone free soil type where tested. On the TREFAD farm, where the land was newly cleared with great stumps and gravel type of soil, it would take more time to accomplish the same operation.
It was observed that more time was spent on plot 2 due to time taken to turn the machine and overcome obstructions in form of stumps as well as other field conditions as the blades were noticeably clogged. Plot 3 was lightly raked to reduce obstructions thus, less time was spent compared to plot 2, and as the operator got more familiar with the working conditions, less time was spent in plot 3.
More fuel was consumed on plot 1 due to fuel losses as a result of leakage and extent of tilting of the machine on unlevelled ground. It was noticed that when the loose parts of the fuel tank were adjus ted, the fuel consumption reduced greatly on plot 3 because of further adjustment of fuel leakage and the raking of plot 3.
The machine was found rugged, did not break down, was easy to operate and has minimum moving parts with replaceable cutting edge. The handling of the machine was not too difficult for the first timers who within a short time of training mas tered the operation.
CONCLUSION
Going by the result obtained from this experiment, it took about 30.30 hours to plow one hectare which amounted to 5 working days at 6 hours/ day and about 12 hours to plow one acre on an old land where the trash had been cleared and the soil was stone free. The experience on the TREF AD farm where the land was newly cleared, had stumps and gravel type of soil was not encouraging.
123
The equipment can be used for secondary tillage operation, it 'Orked effectively and efficiently better on land that had been cleared of trash already, void of stones and not weedy, as in gardens, vegetable farms and horticultural fields. Though the machine capacity is small, if well handled, it will perform well in soil loosening and pulverization for good seed bed under friable soil moisture condition. The soil tillage performance of this equipment will be suitable for crop seeds that can tolerate zero to shallow tillage plowing depth of 0.21 m which this equipment was able to provide.
RECOMMENDATIONS
Husqvama T560RS rotary cultivator is, therefore, recommended based on its performance efficiency, affordability, durability and ease of operation for small holder farms. It should be introduced to all relevant colleges, departments, institutes and centres of the University and vegetable farmers in the rural and urban farming communities. It is also recommended to be introduced to small scale private horticulturists (N265,000.00). The current price patronage is within what some farming groups even in rural areas can afford to improve and increase their size of holdings, output and incomes.
REFERENCES
Agridry Rimik Pty Ltd. 1994. Rimik CP Cone Penetrometer. Agridry Rirnik Pty Ltd. Toowomba, Queensland.
Beinswanger, H. P. 1986. Modelling the Impact of Agricultural Growth and Government Policy on Income Distribution in India. The World Bank Research Observer. Oxford University Press.
Beinswanger, H. P. and Braun, V. 1991. Technological Change and Commercialization in Agriculture: The effect

Adisa et al., 2013
on the poor. The World Bank and Research Observer, 6(1): 57-80.
Buckingham, F., Thomgren, H. and Johannsen, B. 1984. Tillage, Fundamentals of Machine Operation, Second Edition, Deere Company Service Training, Illinois, USA.
Hayami, Y. and Ruttan, W. 1995. Mechanization in a Developing Country, Mbabane, Swaziland. The Johns Hopkins University press, Boltmore/ London.
Humble, K. and Shankland, L. 2012. Smallholding Manual: The complete step-bystep Guide. Amazon Prime. UK.
Kepner R. A., Bainer, R. and Barger, E. L. 2005. Principles of Farm Machinery. CBS Publishers & Distributors, Third Edition. New Delhi, India.
LSU AgCentre. 2010. Cultivator for Precision
Rotary Tiller/ Cultivation of
Vegetables, Research and Extension Services; USA.
124
Masuki, F. G., Mutabazi, K. D., Turnbo, S. P., Rwehumbiza F B. Mattee, A. Z. .<\...'1d Hatibu, N. 2006. Determinants of farm- level Adoption of Water System Innovations in Dryland Areas: The Case Makanya Watershed in the Pangani River Basin, Tanzania. Proceedings of the East Africa Integrated River Basin Management Conference, Skoine University, Tanzania, p. 330- 337.
Nweke, F. I. 1978. Irrigation Development in Ghana. Oxford Agrarian Studies, 7: 38- 53, Oxford.
Schwenke, K. 1998. Successful Small-Scale Farming. Amazon Prime. UK.
Sims, H., Thierfelder, C., Kienzle, J., Friedrich, T. And Kassam, A. 2012. Development of the conservation Agricultural Equipment Industry in SubSaharan Africa. Applied Engineering in Agriculture, American Society of Agricultural and Biological Engineering (ASABE) 28(6): 813 - 823.
ANIMAL PRODUCTION
125

Journal of Applied Agricultural Research 2013, 5(2): 127-139 ISSN 2006-750X ©Agricultural Research Council of Nigeria, 2013
HAEMATOLOGY AND SERUM CHEMISTRY OF GROWING PULLETS AND LAYERS FED RAW AND TREATED GROUND NUT HUSK MEAL BASED DIETS
*Bello, K. 0.1 and D. Eruvbetine2 I Institute of Food Security, Environmental Resources and Agricultul'al Research;
2College of Animal Science and Livestock Production; Federal University of Agriculture, Abeokuta, P. M. B. 2240, Abeokuta, Ogun State, Nigeria
*kazeembello [email protected]
ABSTRACT
Treated and untreated groundnut husk based diets were fed to four hundred and thirty two (432) pullets to determine the effect on their haematology and serum chemistry as indicators of their health status. Nine d iets were formulated in a 3 x 3 factorial arrangement containing Unfermented Groundnut Husk (UFGNH), Fermented Groundnut Husk (FGNH) and Unfermented Groundnut Husk supplemented with HemiCel (D) enzyme (UFGNH+Enzy) each at 0, 30 and 60% replacement levels for wheat offal during their growing and laying phases. Blood samples were obtai,nedyia -the wing vein puncture. The samples were analyzed for packed cell volume (PCV), haemoglobin · (Hb), red blood cells (RBC), white blood cells (WBC) and white blood differential for haematology and glucose, total protein, albumin, uric acid and creatirline for serum chemistry. Treatment effects of UFGNH, FGNH and UFGNH+Enzy and GNH level were insignificant (P>0.05) for all haematological parameters in growing pullets while interaction between treatment and level was significant (P<0.05) only for PCV and RBC. Pullets on UFGNH+Enzy at 60% replacement of wheat offal recorded the highest PCV (30.67%) and RBC (5.73 x 10⁶/mmJ). GNH level had significant (P<0.05) effect on total protein and albumin of growing pullets. Birds on 30% GNH had significantly (P<O.OS) highest total protein (6.50 g/ dl) and albumiri (3.27 g/ dl). Growing pullets fed FGNH based diet at 30% replacement gave highest a lbumin (3.27 g/ dl) while birds. fed FGNH at 60% had the least (2. 93 g/ d l). All the haematological parameters in layers were significantly (P<0.05) affected by GNH treatment. Layers fed FGNH had the highest PCV (27.89%), H aemoglobin (9.33g/ dl), RBC (4.74x10⁶/mm3) and eosinophils (0.11 %). GNH level also had significant (P<0.05) effect on the haematological parameters of layers. Layers on 60% FGNH replacement for w heat offal based diet had significantly (P<O.OS) higher PCV (30%), Hb (10 g/dl), RBC (5.01x1Q6jmm3) and WBC (21.85x10S/mm3). Growing and laying birds on GNH based diets did not show any adverse effect on their immune status, health status and tissue integrity. The study also concluded that growing pullets and layers could tolerate 60% treated GNH as replacement for wheat offal in their diets.
Keywords: groundnut husk, haematology, serum chemistry, growers, layers
INTRODUCTION
Out of the several millions of tonnes of groundnut produced in the world each year, husks (Figure 1) represent about 15% of the total mass produced (FAOSTAT, 1999). Though Nigeria had declined as the number
127
one leading producer of groundnut in the world and world's shelled groundnut exports trom a high of 46% in 1961, the country still produced 1.92 million tonnes of groundnut as at 2008 and generated 0.288 milllon tonnes of groundnut husk (GNH) as by-product (ATA, 2011) much of which is

Bello and Eruvbetine, 2013
grossly under-utilized. The proximate composition of this by-product is (% air-dry basis) 90.30 dry matter; 14.46 crude protein; 22.00 crude fibre; 8.19 ash; 7.54 ether extract and 47.81 nitrogen &ee extract (Bello et al.,
2011).
Poultry accounts for more than 80% of commercial feed utilization in Nigeria with feed constituting 65-75% of the cost of production (Awesu et al., 2002). Therefore, means to optimise profit of poultry farmers and productivity without sacrificing technical efficiency remain the focus of animal scientists and poultry nutritionists, hence the exploration of GNH potential in this regard.
As efforts in the tropics to find alternatives to cereal or legume grains for feeding to monogastric animals continues, the health of the animals need to be monitored. Determination of haematological parameters is an important part of evaluating health status in avian species (Harper and Lowe, 1998) as it provides holistic information on the diet quality, since dietary components have measurable effects on blood constituents.
This study was carried out to determine the haematological and serum bio-chemical profiles of. growing pullets and layers fed GNH mea( types as replacement for wheat offal. ·;
· ( .
MAJERIALS AND METHODS
Experimental site
The study was a continuation of an earlier report by Bello et al. (2010). It was carried out at the Poultry Unit, Teaching and Research Farm, Federal University of Agriculture, Abeokuta, Ogun State, Nigeria. The site falls within longitude 7013'28.18"N and latitude 3025'25.57"E (Google Earth, 2010) with an average rainfall of 1,037 mm, a mean annual
128
temperature of 340C and relative humidity of 82%.
Groundnut husk (GNH)
Groundnut husk was obtained &om the Teaching Farms Seed Store, Federal University of Agriculture, Abeokuta (FUNAAB). The husk was sun-dried, bulked and milled. The resultant meal was divided into 3 parts to produce unfermented, fermented and enzyme treated meals. The fermented GNH was prepared by mixing GNH with 40% water relative to GNH weight as described by Bello et al. (2010). The mixture was bagged in air tight polythene bag and allowed to stay for 3 days. Thereafter, it was opened, shade dried for 5 days, packed, bagged and stored in a cool place until use (Figure 2). HemiCel (D) enzyme sourced from reputable ingredient company and was added to one portion of the unfermented GNH after milling at 500 rpm. The enzyme and feed were thoroughly mixed on clean concrete floor, p acked, bagged and stored in a cool and dry place until use. Each treated GNH at 0, 30 or 60% was used as replacement for wheat offal in the diets (Tables 1 and 2). Other feed ingredients were purchased.
Experimental birds and management
Four hundred and thirty two (432) 8 weeks old growing pullets were directly transferred from chicks experiment (Bello et al., 2010). Forty eight (48) birds per group were divided into 3 subgroups comprising of 16 birds each per replicate. They were intensively managed in battery cage system.
Experimental diets
Nine grower's experimental diets were formulated (Table 1). The diets consisted of 3 levels (0, 30 and 60%) of unfermented groundnut husk (UFGNH), fermented groundnut husk (FGNH) and unfermented

Haematology and Serum Chemistry of Growing Pullets and Layers Fed Groundnut Husk
Figure 1: Groundnut Hus k
Table 1: Composition of growing pulle t diets
UFGNH FGNH UFGNH + ENZYME Ingredients (%) 0% 30% 60% 0% 30% 60% 0% 30% nO%
1 2 3 4 5 6 7 8 9 Maize 45.00 45.00 45.00 45.00 45.00 45.00 45.00 45.00 45.00 Soybean Meal 15.00 15.00 15.00 15.00 15.00 15.00 15.00 15.00 15.00 Groundnut 3.50 3.50 3.50 3.50 3.50 3.50 3.50 3.50 3.50 cake Wheat offal 33.00 23.10 13.20 33.00 23.10 13.20 33.00 23.10 13.20 UFGNH 9.90 19.80 FGNH 9.90 19.80 UFGNH+ 9.90+ 19.80+ Bone Meal 2.20 2.20 2.20 2.20 2.20 2.20 2.20 2.20 2.20 Oyster Shell 0.30 0.30 0.30 0.30 0.30 0.30 0.30 0.30 0.30 Lysine 0.20 0.20 0.20 0.20 0.20 0.20 0.20 0.20 0.20 Methionine 0.30 0.30 0.30 0.30 0.30 0.30 0.30 0.30 0.30 Premix* 0.25 0.25 0.25 0.25 0.25 0.25 0.25 0.25 0.25 Salt 0.25 0.25 0.25 0.25 0.25 0.25 0.25 0.25 0.25 Total 100.00 100.00 100.00 100.00 100.00 100.00 100.00 100.00 100.00 Determined Analysis (%} Crude Protein 16.66 16.52 16.40 16.66 16.52 16.40 16.66 16.52 16.40 Crude Fibre 5.34 6.46 7.57 5.34 6.46 7.57 5.34 6.46 7.57 Ether extract 3.53 3.49 3.64 3.53 3.56 3.57 3.59 3.61 3.75 Calculated analysis(%} Calcium 0.83 0.83 0.83 0.83 0.83 0.83 0.83 0.83 0.83 Phos£horus 0.61 0.61 0.61 0.61 0.61 0.61 0.61 0.61 0.61
*Contained the following per kilogram diet: vitamin A - 4,000,000i.u; vitamin 0 3 - SOO,OOOi.u; vitamin E - l O,OOOmg; vitamin K -1,200mg; Thiamine Bl - l ,OOOmg; Riboflavin B2 - 1,500mg; Niacin - lO,OOOmg; Pantothenic Acid - 4,500mg; Vitamin B6 - 500mg; Vitamin B12 - lOmg; Folic Acid - 200mcg; Biotin - 15i.u; Choline Chloride - 120,000mg; Cobalt - 500mg; Copper - SOOmg; Iodide -400mg; [ron- 15,000mg; Manganese - 60,000mg; Selenium - 40mg; Zinc - 15,000mg. UFGNH = Unfermented Groundnut Husk FGNH = Fermented Groundnut Husk UFGNH + Enzyme = Unfermented Groundnut Husk supplemented with Enzyme
129
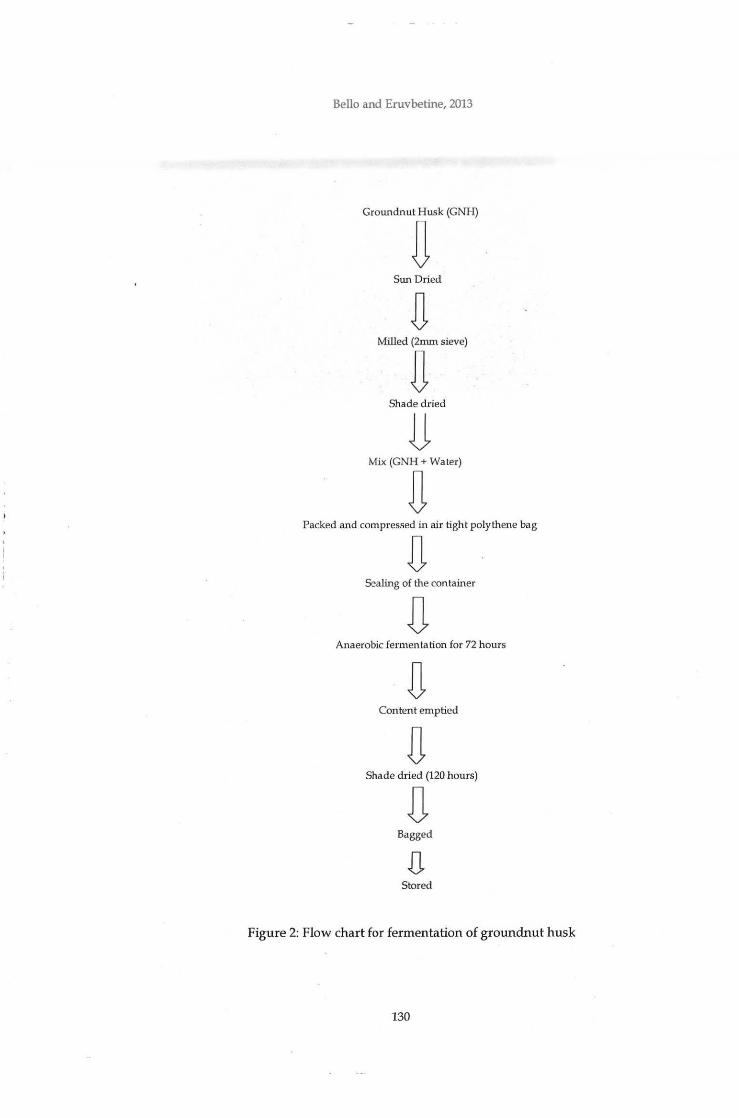
Bello and Eruvbetine, 2013
GroWldnut Husk (GNH)
il SWl Dried
Milled (2mm sieve)
D Shade dried
D Mix (GNH +Water)
D Packed and compressed in air tight polythene bag
D Sealing of the container
Anaerobic fermentation for 72 hours
Content emptied
Shade dried (120 hours)
j} Bagged
Stored
Figure 2: Flow chart for fermentation of groundnut husk
130
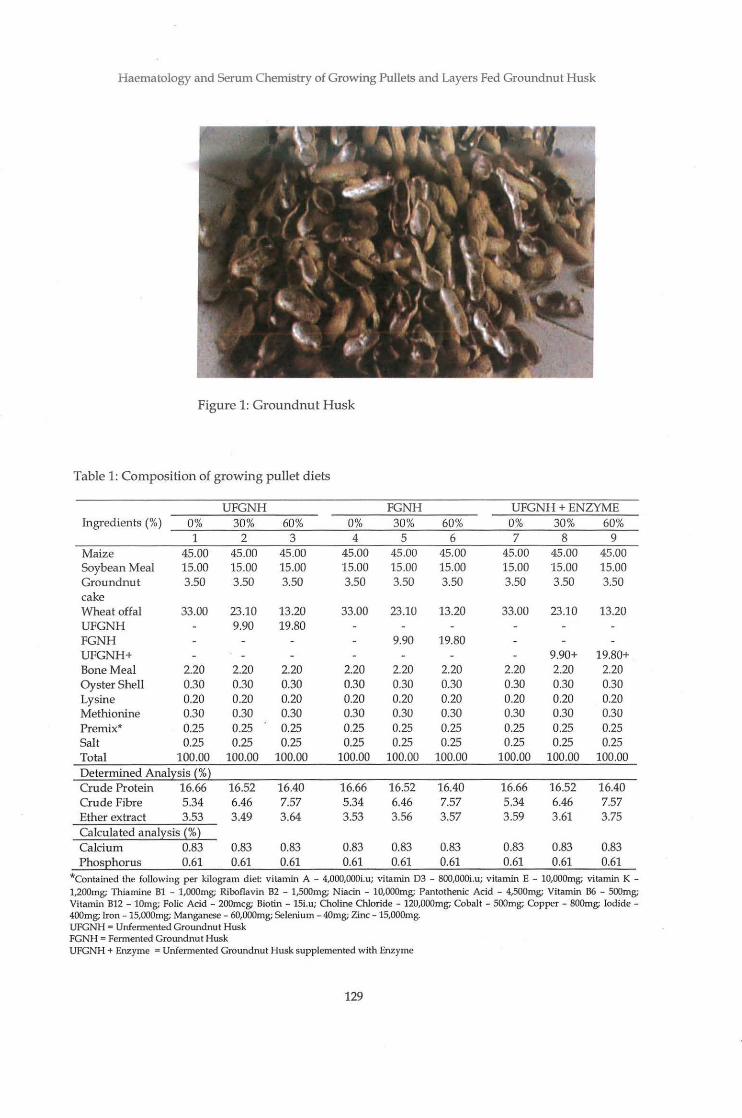
Haem atology and Serum Chemistry of Growing Pullets and Layers Fed Groundnut Husk
Figure 1: Groundnut Husk
Table 1: Composition of growing pullet diets
UFGNH FGNH UFGNH +ENzyME Ingredients (%) 0% 30% 60% 0% 30% 60% 0% 30% 60%
1 2 3 4 5 6 7 8 9 Maize 45.00 45.00 45.00 45.00 45.00 45.00 45.00 45.00 45.00 Soybean Meal 15.00 15.00 15.00 15.00 15.00 15.00 15.00 15.00 15.00 Ground nut 3.50 3.50 3.50 3.50 3.50 3.50 3.50 3.50 3.50 cake Wheat offal 33.00 23.10 13.20 33.00 23.10 13.20 33.00 23.10 13.20 UFGNH 9.90 19.80 FGNH 9.90 19.80 UFGNH+ 9.90+ 19.80+ Bon e Meal 2.20 2.20 2.20 2.20 2.20 2.20 2.20 2.20 2.20 Oyster Shell 0.30 0.30 0.30 0.30 0.30 0.30 0.30 0.30 0.30 Lysine 0.20 0.20 0.20 0.20 0.20 0.20 0.20 0.20 0.20 Methionine 0.30 0.30 0.30 0.30 0.30 0.30 0.30 0.30 0.30 Premix* 0.25 0.25 0.25 0.25 0.25 0.25 0.25 0.25 0.25 Salt 0.25 0.25 0.25 0.25 0.25 0.25 0.25 0.25 0.25 Total 100.00 100.00 100.00 100.00 100.00 100.00 100.00 100.00 100.00
Determined Ana lysis(%} Crude Protein 16.66 16.52 16.40 16.66 16.52 16.40 16.66 16.52 16.40 Crude Fibre 5 .34 6.46 7.57 5.34 6.46 7.57 5.34 6.46 7.57 Ether extract 3.53 3 .49 3.64 3.53 3.56 3.57 3.59 3.61 3.75
Calcu lated analysis (%} Calcium 0.83 0.83 0.83 0.83 0.83 0.83 0.83 0.83 0.83
PhosEhorus 0.61 0.61 0.61 0.61 0.61 0.61 0.61 0.61 0.61
*Contained the following per kilogram diet: vitamin A - 4,000,000i.u; vitamin D3 - 800,000i.u; vitamin E - 10,000mg; vitamin K -1,200mg; Thiamine Bl - 1,000mg; Riboflavin 82 - 1,500mg; Niacin - 10,000mg; Pantothenic Acid - 4,500mg; Vitamin B6 - 500mg; Vitamin 812 - 10mg; Folic Acid - 200mcg; Biotin - lSi.u; Choline Chloride - 120,000mg; Cobalt - SOOmg; Copper - 800mg; Iodide -400mg; Iron - 15,000mg; Manganese - 60,000mg; Selenium - 40mg; Zinc- 15,000mg. UFGNH = Unfermented Groundnut Husk FGNH = Fermented Groundnut Husk UFGNH + Enzyme = Unfermented Groundnut Husk supplemented with Enzyme
129

Bello and Eruvbetine, 2013
Groundnut Husk (GNH)
D Sun Dried
Milled (2mm sieve)
il Shade dried
Mix (GNH + Water)
il Packed and compressed in air tight polythene bag
D Sealing of the container
D Anaerobic fermentation for 72 hours
Content emptied
D Shade dried (120 hours)
Bagged
Stored
Figure 2: Flow chart for fermentation of groundnut husk
130
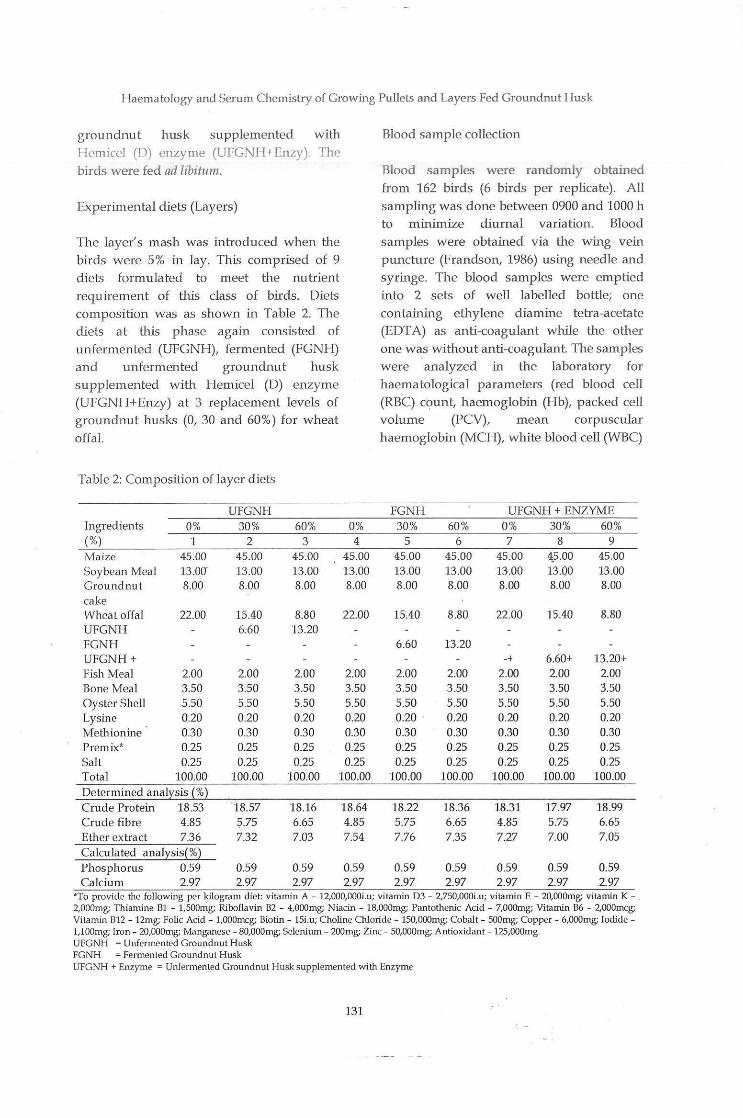
Haematology and Serum Chemistry of Growing Pullets and Layers Fed Groundnut Husk
groundnut husk supplemented with IIemiccl (D) enzyme (UFGNH+Enzy). The birds were fed ad libitum.
Experimental diets (Layers)
The layer's mash was introduced when the birds were 5% in lay. This comprised of 9
diets formulated to meet the nutrient
requirement of this class of birds. Diets composition was as shown in Table 2. The diets at this phase again consisted of unfermented (UFGNH), fermented (FGNH) and unfermented groundnut husk
supplemented with Hemicel (D) enzyme (UFGNH+Enzy) at 3 replacement levels of groundnut husks (0, 30 and 60%) for wheat
offal.
Table 2: Composition of layer diets
UFGNH Ingredients 0% 30% 60% (%) 1 2 3 Maize 45.00 45.00 45.00 Soybean Meal 13.0(J 13.00 13.00 Groundnul 8.00 8.00 8.00 cake Wheat offal 22.00 15.40 8.80 UFGNH 6.60 13.20 FGNH UFGNH+ Fish Meal 2.00 2.00 2.00 Bone Meal 3.50 3.50 3.50 Oyster Shell 5.50 5.50 5.50 Lysine 0.20 0.20 0.20 Methionine 0.30 0.30 0.30 Premix* 0.25 0.25 0.25 Salt 0.25 0.25 0.25
0% 4
45.00 13.00 8.00
22.00
2.00 3.50 5.50 0.20 0.30 0.25 0.25
Total 100.00 100.00 100.00 100.00 Determined a nalysis(%} Crude Protein 18.53 "18.57 18.16 18.64 Crude fibre 4.85 Q.75 6.65 4.85 Ether extract 7.36 7.32 7.03 7.54 Calculated analysis(%) Phosphorus 0.59 0.59 0.59 0.59 Calcium 2.97 2.97 2.97 2.97
Blood sample collection
Blood samples were randomly obtained from 162 birds (6 birds per replicate). All sampling was done between 0900 and 1000 h to minimize diurnal variation. Blood
samples were obtained via the wing vein puncture (Frandson, 1986) using needle and
syringe. The blood samples were emptied into 2 sets of well labelled bottle; one
containing ethylene diamine tetra-acetate (EDT A) as anti-coagulant while the other one was without anti-coagulant. The samples were analyzed in the laboratory for haematological parameters (red blood cell
(RBC) count, haemoglobin (Hb), packed cell volume (PCV), mean corpuscular
haemoglobin (MCH), white blood cell (WBC)
FGNH UFGNH + ENZYME 30% 60% 0% 30% 60%
5 6 7 8 9 45.00 45.00 45.00 4;5.00 45.00 13.00 13.00 13.00 13.00 13.00 8.00 8.00 8.00 8.00 8.00
15.40 8.80 22.00 15.40 8.80
6.60 13.20 -+ 6.60+ 13.20+
2.00 2.00 2.00 2.00 2.00 3.50 3.50 3.50 3.50 3.50 5.50 5.50 5.50 5.50 5.50 0.20 0.20 0.20 0.20 0.20 0.30 0.30 0.30 0.30 0.30 0.25 0.25 0.25 0.25 0.25 0.25 0.25 0.25 0.25 0.25
100.00 100.00 100.00 100.00 100.00
18.22 18.36 18.31 17.97 18.99 5.75 6.65 4.85 5.75 6.65 7.76 7.35 7.27 7.00 7.05
0.59 0.59 0.59 0.59 0.59 2.97 2.97 2.97 2.97 2.97
•To provide the following per kilogram diet: vitamin A - 12,000,000i.u; vitamin 0 3 - 2,750,000i.u; vitamin E - 20,000mg; vitamin K-2,000mg; Th.iamine 81 - 1,500mg; Riboflavin 82 - 4,000mg; Niacin - 18,000mg; Pantothenic Acid - 7,000mg; Vitamin 86 - 2,000mcg; Vitamin 812 - 12mg; Folic Acid - 1,000mcg; Biotin - 15i.u; Choline Chloride- l SO,OOOmg; Cobalt- SOOmg; Copper- 6,000mg; Iodide-1, lOOmg; Iron - 20,000mg; Manganese- 80,000mg; Selenium - 200mg; Zinc- SO,OOOmg; Antioxidant - 125,000mg. UFGNH ; Unfermented Groundnut Husk FGNH ; Fermented Groundnut Husk UFGNH +Enzyme ; Unfermented Groundnut Husk supplemented with Enzyme
131
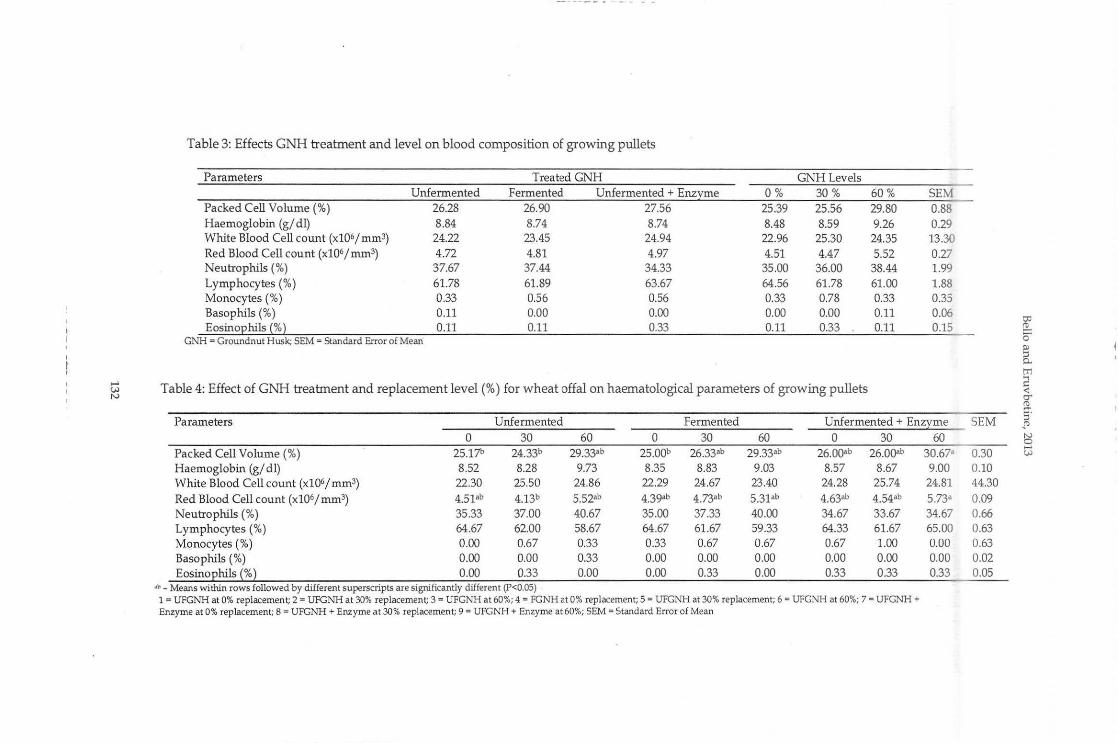
...... ()) I'V
Table 3: Effects GNH treatment and level on blood composition of growing pullets
Parameters Treated GNH GNHLevels Unfermented Fermented Unfermented + Enzyme 0% 30% 60% SEM
Packed Cell Volume(%) 26.28 26.90 27.56 25.39 25.56 29.80 0.88 Haemoglobin (gl dl) 8.84 8.74 8.74 8.48 8.59 9.26 0.29 White Blood Cell count (x106 I mm3) 24.22 23.45 24.94 22.96 25.30 24.35 13.30 Red Blood Cell count (x106 I mm3) 4.72 4.81 4.97 4.51 4.47 5.52 0.27 Neutrophils (%) 37.67 37.44 34.33 35.00 36.00 38.44 1.99 Lymphocytes (%) 61.78 61.89 63.67 64.56 61.78 61.00 1.88 Monocytes (%) 0.33 0.56 0.56 0.33 0.78 0.33 0.35 Basophils (%) 0.11 0.00 0.00 0.00 0.00 0.11 0.06 Eosinoehils (%} 0.11 0.11 0.33 0.11 0.33 0.11 0.15
GNH = Groundnut Husk; SEM =Standard Error of Mean
Table 4: Effect of GNH treatment and replacement level (%) for wheat offal on haematological parameters of growing pullets
Parameters Unfermented Fermented Unfermented + Enzyme 0 30 60 0 30 60 0 30 60
Packed Cell Volume (%) 25.17b 24.33b 29.33•b 25.00b 26.33•b 29.33•b 26.0Qab 26.0Qab 30.67• Haemoglobin (gl d l) 8.52 8.28 9.73 8.35 8.83 9.03 8.57 8.67 9.00 White Blood Cell count (x106/mm3) 22.30 25.50 24.86 22.29 24.67 23.40 24.28 25.74 24.81
Red Blood Cell count (x1061mm3) 4.51"b 4.13b 5.52•b 4.39•b 4.73•b 5.31•b 4.63•b 4.54•b 5.73• Neutrophils (%) 35.33 37.00 40.67 35.00 37.33 40.00 34.67 33.67 34.67 Lymphocytes(%) 64.67 62.00 58.67 64.67 61.67 59.33 64.33 61.67 65.00 Monocytes (%) 0.00 0.67 0.33 0.33 0.67 0.67 0.67 1.00 0.00 Basophils (%) 0.00 0.00 0.33 0.00 0.00 0.00 0.00 0.00 0.00 Eosino_Ehils {% l 0.00 0.33 0.00 0.00 0.33 0.00 0.33 0.33 0.33
"' -Means within rows followed by different superscripts are significantly different (P<O.OS) 1 = UFGNH at 0% replacement; 2 = UFGNH at 30% replacement; 3 = UFGNH at 60%; 4 = FGNH at 0% replacement; 5 = UFGNH at 30% replacement; 6 = UFGNH at 60%; 7 = UFGNH + Enzyme at 0% replacement; 8 = UFGNH + Enzyme a t 30% replacement; 9 = UFGNH + Enzyme at 60%; SEM = Standard Error of Mean
SEM
0.30 0.10 44.30 0.09 0.66 0.63 0.63 0.02 0.05
c:o ro t:: 0
[ tTl .., !:: < c:r ro s· ~
8 ())
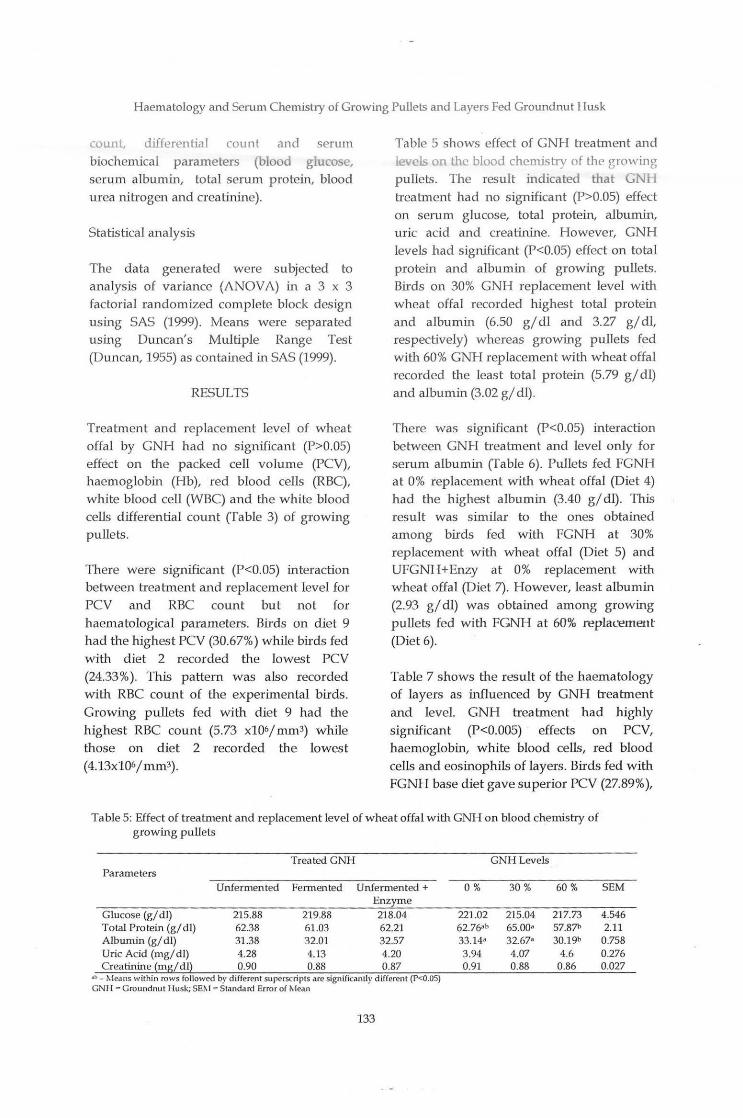
Haematology and Serum Chemistry of Growing Pullets and Layers Fed Ground nut Husk
count differential coun t and serum biochemical parameters (blood glucose, serum albumin, total serum protein, blood urea nitrogen and creatinine).
Statistical analysis
The data generated were subjected to analysis of variance (ANOV A) in a 3 x 3 factorial randomized complete block design us ing SAS (1999). Means were separated using Duncan's Multiple Range Test (Duncan, 1955) as contained in SAS (1999).
RESULTS
Treatment and replacement level of wheat offal by GNH had no significant (P>O.OS) effect on the packed cell volume (PCV), haemoglobin (Hb), red blood cells (RBC), wh ite blood cell (WBC) and the white blood cells differential count (Table 3) of growing pullets.
There were significant (P<0.05) interaction between treatment and replacement level for PCV and RBC count but not for haematological parameters. Birds on diet 9 had the highest rev (30.67%) while birds fed with diet 2 recorded the lowest PCV (24.33%). This pattern was also recorded with RBC count of the experimental birds . Growing pullets fed with diet 9 had the highest RBC count (5.73 x10⁶/ mm3) while those on diet 2 recorded the lowest (4.13xl06j rrun3).
Table 5 shows effect of GNH treatment and k rels on the blood chemistry of the growing pullets. The result indicated that GNH treatment had no significant (P>0.05) effect on serum glucose, total protein, albumin, uric acid and creatinine. However, GNH levels had significant (P<0.05) effect on total protein and albumin of growing pullets. Birds on 30% GNH replacement level with wheat offal recorded highest total protein and albumin (6.50 g/ dl and 3.27 g/ dl, respectively) whereas growing pullets fed with 60% GNH replacement with wheat offal recorded the least total protein (5.79 g/ dl) and albumin (3.02 g/ dl).
There was significant (P<0.05) interaction between GNH treatment and level only for serum albumin (Table 6). Pullets fed FGNH at 0% replacement with wheat offal (Diet 4) had the highest albumin (3.40 g/ dl). This result was similar to the ones obtained among birds fed with FGNH at 30% replacement with wheat offal (Diet 5) and UFGNH+Enzy at 0% replacement with wheat offal (Diet 7). However, least albumin (2.93 g/ dl) was obtained among growing pullets fed with FGNH at 60% replac:ement (Diet 6).
Table 7 shows the result of the haematology of layers as influenced by GNH treatment and level. GNH treatment had highly significant (P<O.OOS) effects on PCV, haemoglobin, white blood cells, red blood cells and eosinophils of layers. Birds fed with FGNH base diet gave superior PCV (27.89% ),
Table 5: Effect of treatment and replacement level of wheat offal with GNH on blood chemistry of growing pullets
Treated GNH GNHLevels Parameters
Unfermented Fermented Unfermented + 0% 30% 60% SEM Enzyme
Glucose (g/ dl) 215.88 219.88 218.04 221.02 215.04 217.73 4.546 Total Protein (g/dl) 62.38 61.03 62.21 62.76<-h 65.00• 57.871> 2.11 Albumin (g/ dl) 31.38 32.01 32.57 33.14• 32.67• 30.19~ 0.758 Uric Acid (mg/dl) 4.28 4.13 4.20 3.94 4.07 4.6 0.276 Creatinine (mg[ dl) 0.90 0.88 0.87 0.91 0.88 0.86 0.027
•• - ~leans w ithin rows followed by different superscripts are s ignificantly different (P<O.OS) GNH c Grow1dnut Husk; SE~ I • Standard Error of ~lean
133
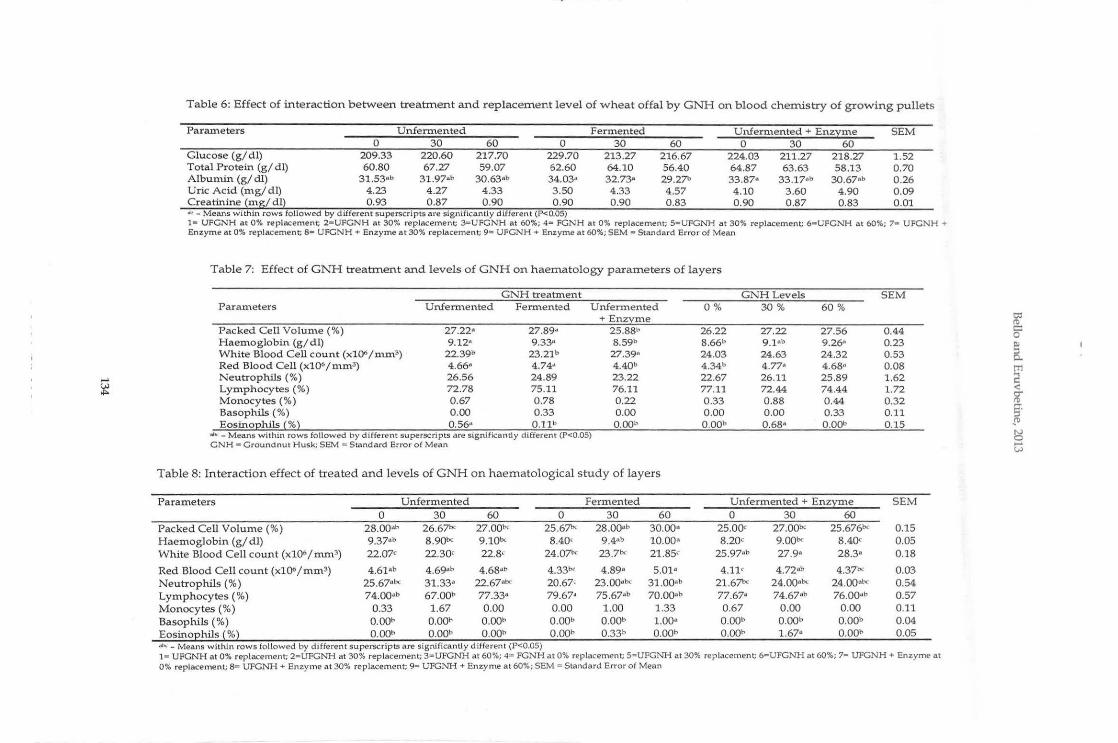
..... VJ
""
Table 6: Effect of inte rac tion b e tween treatment and replacem ent level of w h eat offal by GNH on blood ch emistry of growing pullets
Paran1eters Unfermen te d Fermented Unfermented + Enz:l::me SEM 0 30 60 0 30 60 0 30 60
Glucose (g/ dl) 209.33 220.60 217.70 229.70 213.27 216.67 224.03 211.27 218.27 1.52 Total Protein (g/ dl) 60.80 67.27 59.07 62.60 64.10 56.40 64.87 63.63 58.13 0.70 Albumin (g/ dl) 31.53•b 31 .97•h 30.63•b 34.03• 32.73• 29.27b 33.87• 33.17•b 30.67•b 0.26 Uric Acid (mg/ dl) 4.23 4 .27 4 .33 3.50 4.33 4.57 4 .10 3.60 4.90 0.09 Creatinine (mg/ dl) 0.93 0.87 0 .90 0.90 0.90 0.83 0.90 0.87 0.83 0.01 •''- Means within rows followed by d ifferent su perscripts are significantly different (P<O.OS) 1• UFGNH at 0% replacement; 2•UFGNH at 30% replacement; 3mUFGNH at 60%; 4• FGNH at 0% replacement; S•UFGNH at 30% replacement; 6•UFGNH at 60%; 7• UFGNH + Enzyme a t 0% replacement; 8• UFGNH +Enzyme at 30% replacement; 9• UFGNH + Enzyme at 60%; SEM • Standard Error of Mean
T a ble 7: Effect of GNH treatment and levels of GNH on haematology parameters of layers
GNH treatment GNH Levels SEM Paran1eters Unfem1ented Fem 1ented Unfermented 0% 30% 60%
+ En z n1e Packed Cell Volume(%) 27.22• 27.89• 25.88h 26.22 27.22 27.56 0.44 Haemoglobin (g/ dl) 9.12• 9.33• 8.59b 8.66b 9.1•b 9.26" 0.23 White Blood Cell count (x106/mm3) 22.39b 23.21b 27.39• 24.03 24.63 24.32 0.53 Red Blood Cell (x106/mm3) 4.66• 4.74" 4.40b 4.34b 4.77• 4.68" 0.08 Neutrophils (%) 26.56 24.89 23.22 22.67 26.11 25.89 1.62 Lymphocytes (%) 72.78 75.11 76.11 77.11 72.44 74.44 1.72 Monocytes (%) 0.67 0.78 0.22 0.33 0.88 0.44 0.32 Basophils (%) 0.00 0.33 0.00 0 .00 0.00 0.33 0.11 Eosino:ehils (%} 0.56• 0.11" O.OOb O.OOb 0 .68• O.OOb 0.15
""'-Means within rows followed by different superscripts a re significantly different (P<O.OS) GNH • Groundnut Husk; SEM- Standard Error of Mean
Table 8: Inter action e ffect of treated and levels of GNH on haematological study o f layers
Parameters Unfermente d Ferm en ted Unfermented + En zyme SEM 0 30 60 0 30 60 0 30 60
Packed Cell Volume(%) 28.00•b 26.671>< 27.00l'>< 25.671>< 28.0Qab 30.00• 25.00< 27.00bc 25.676bc 0.15 Hae m oglobin (g/ dl) 9.37•b 8.90bc 9.101>< 8.40< 9.4•b 10.00• 8.20< 9.0Qbc 8.40< 0.05 White Blood Cell count (x106jmm3) 22.07< 22.30< 22.8' 24.071'< 23.7bc 21.85< 25.97•b 27.9• 28.3• 0 .18
Red Blood Cell count (x1Q6/mm3) 4.61•b 4.69•b 4.68•b 4.33bc 4.89• 5.01• 4.11< 4.72•b 4.37bc 0.03 Neutrophils (%) 25.67•bc 31.33• 22.67•"" 20.67• 23.00•bc 31.00•b 21.671>< 24.00•"' 24.00•t>c 0.54 Lymphocytes (%) 74.00•b 67.0Qb 77.33• 79.67• 75.67•b 70.00-b 77.67• 74.67•b 76.00•b 0.57 Monocytes (%) 0.33 1.67 0.00 0.00 1 .00 1.33 0.67 0.00 0 .00 0.11 Basophils (%) O.OQb 0.00" 0.00" O.OQb O.OOb 1.00• O.OOb O.OOb O.OOb 0.04 Eosino£hils ~%~ O.OOb O.OOb 0 .00" O.OQb 0.33b O.OOb 0.00" 1 .67• 0 .00" 0.05 ,,., - Means within rows followed by different superscripts are significantly different (P<O.OS) 1 • UFGNH at 0% replacement; 2 • UFGNH at 30% replacement; 3•UFGNH at 60%; 4• FGNH at 0% replacement; S•UFGNH at 30% replacement; 6- UFGNH at 60%; 7• UFGNH +Enzyme at 0% replacement; 8• UFGNH +Enzyme at 30% replacement; 9• UFGNH +Enzyme at 60%; SEM • Standard Error of Mean
O:l ('1) c:: 0
a [Tl
C! < ~ §'· .!0 !::5 ..... VJ

...... ~ V1
Table 9: Effect of GNH treatment and levels on blood chemistry of layers
Treated GNH Parameters Unfermented Fermented Unfermented 0 %
+ Enz me Glucose (g/ dl) 224.33•b 239.88• 213.55b 217.64b Total Protein (g/ dl) 56.12b 59.89• 62.52• 59.52•b Albumin (g/ dl) 32.86b 33.54b 35.12• 32.56b Uric Acid (mg/ dl) 4.8 4.71 4.88 4.31b Creatinine (mgi dl~ 0.97b 1.02• 1.02• 1.03• •"' - Means within rows followed by different superscripts are significantly different (P<O.OS) GNH = Groundnut Husk SEM = Standard Error of Mean
Table 10: Effects of treatment and levels of GNH on blood chemistry of layers
Parameters Unfermented Fermented 0 30 60 0 30 60
Glucose (g/ dl) 198.67b 240.57• 233.75•b 249.27• 241.57• 228.8Qab Total Protein (g/ dl) 57.40bcd 54.8Qd 56.17<d 58.7Qbcd 57.20bcd 63.77•b Albumin (g/ dl) 32.40< 32.40< 33.77bc 31.97< 22.40< 36.271' Uric Acid (mg/ dl) 4.87bc 4.67b< 4.87bc 4.27bc 5.25•b 4.60bc
Creatinine ~mg/ dl~ 0.97b 1.07• 0.87< 1.07• 0.93bc 1.07• •""- Means within rows followed by different superscripts are significantly different (P<O.OS) SEM = Standard Error of Mean
GNH Levels 30 % 60 % SEM
238.66• 221.45•b 6.15 56.03b 62.98• 1.17 32.71b 36.26• 0.50 4.8Jab 5.27• 0.22 0.97b l.Ol•b 0.02
Unfermented+ Enzyme
205.00•b 233.85ab 201.85•b 62.47bc 56.1Qcd 69.00• 33.30< 31.97< 40.10• 3.80< 4.5bc 6.33• 1.07• 0.9bc 1.10•
SEM
2.05 0.39 0.17 0.07 0.01
:r: Dl (1)
3 Dl
0 0 ~ Dl ::J 0..
~ c 3 ()
i6 3 c;;·
~ ~ C) ..., 0 ~ s·
()Q
'V E. ~ !ir Dl ::J 0.. c-< Dl '<
(1)
til '"rl (1)
0.. C)
3 c ::J 0.. ;:J
~ ::r: c "' X"
Bello an9 Eruvbetine, 2013
h aemoglobin (9.33 gl dl), red blood cell count (4.74 x 10⁶lm.m3), white blood cell cou.1t (23.21 11. 10. lmm) and eosinophils (0.56% ). The result also shows that GNH level s ignificantly (P<0.05) influenced haemoglobin concenh·ation, red blood cell and eosinophils of layers. Layers fed 60% GNH level had highest haemoglobin (9.26 gl dl), red blood cell count (4.68 x 10⁶l mm3) and lowest eosinophils (0.00%) values.
Interaction between GNH h·ea tment and levels of replacement was significant (P<0.05) for all the haematological indices considered except monocytes (Table 8). Layers on FGNH at 60% (Diet 6) recorded superior PCV (30% ), haemoglobin (10 gl dl), RBC count (5.01x10³ I mm3), basophils (1%) and WBC count (21.85 x10³lmm3).
DISCUSSION
Packed cell volume (PCV), Hb and RBC count of growing pullets were higher for FGNH and UFGNH supplemented will1
Hemicel (D) enzyme diets. The values were s till within the normal range for avian species. Maxwell et al. (1990) reported 23-55% PCV for healthy birds. The PCV values obtailled for all dietary treahnents also conformed with the values reported by Fasuyi (2007).
GNH treatment and levels showed haemoglobin range of between 8.48 gl dl and 9.26 gl dl in growing pullets. The values agreed with the findings of Pellet and Young (1980) who reported 7 gl dl to 18.6 gl dl range for normal chicken.
The WBC count were similar for GNH treahnent and levels and were within the normal range for healthy chickens (6.00 to 6.80 x 10⁶ I mm3) as reported by Mirtuka and Rawnsley (1977). The birds were apparently in good health since WBC count indicates the level of infections in animals. The finding
136
supports the earlier report of Bello (2005} on broiler chickens
Eosinophils and basophils have been used as indicators to determine tissue injUiy and infections. Increased eosinophil counts are caused by allergiclhypersentivity reactions, parasitism, tissue injury, etc. Basophils are closely related to mast cells and initia te the inflammatory response by releasing histamine. An increased basophil count follows same for eosinophils in some species as pa1t of the hypersensitivity reaction. Though layers under UFGNH+Enzyme at 30% replacement of wheat offal (Diet 8) recorded high (1.67%) eosinophil count, they could not be assumed to be hypersensitive as the corresponding basophil count was very low (0% ). Campbell (1988) gave credence to this finding.
RBC count followed same pattern with PCY an d Hb, being higher for FGNH and UFGNH supplemented w ith HemiCel (D). It appears that FGNH and UFGNH supplemented with enzyme were of good dietary quality and the birds were in good state of health. FGNH may contain endogenous enzyme. Fermentation improves enzyme action and HemiCel (D) helps the synergy and improves the diet quality. The earlier work by Eggum (1989) who reported that haematocrits, erythrocytes and haemoglobin tend to be positively correlated with protein quality and level, gave cred ence to this finding. This result was also supported by the findings of Onifade et al.
(1999a, b) who reported that yeast is a natural non-antibiotic growth promoter and engenders formation and development of blood cells (haematopoiesis). Hemicel (D) enzyme is prepared by the fermentation of Bacillus lentus with p-mannanase as active ingredient. It also contains amylase, xylase, cellulase and a-galactosidase (Akpodiete et al., 2006). Consequently, it could be said to aid haematopoiesis.
H aematology and Serum Chemistry of Growing Pullets and Layers Fed Groundnut H usk
Most normal birds have serum total protein values between 3 and 9 mg/ dl. Values less than 3.0 mg/ dl usually indicate hypoalbumenemia, because albumin is the largest individual protein fraction in avian plasma. Total protein values less than 2.5 g/ dl indicate a grave prognosis and birds with severe hypoproteinemia rarely survive (Altman, 1979).
Total protein obtained among the growing pulle ts and layers fall within the normal range for birds. The results also revealed that the experimental birds were free from chronic renal or liver d isease. The birds were probably also free from intestinal parasitic infection or chronic blood loss. Altman (1979) had reported that hypoproteinemia (total protein value greater than 9 g/ dl) can occur with chrome renal or hepatic disease, malnutrition, malabsorption (e.g. intestinal parasitism), or chronic blood loss.
Blood glucose of the experimental birds ranged between 209 and 229 m g/ dl which falls within the range for healthy birds (Altman, 1979). The normal blood glucose level for most birds is 200 to 450 mg/ dl. Birds with serum glucose concentration less than 150 mg/ dl should be given supplem ental feeding with dextrose, and values less than 70 mg/ dl are grave signs. The growing pulle ts or layers fed with treated GNH at 0 to 60% replacement level for wheat offal, from this finding, may need no supplemental d extrose.
According to Chandra et al. (1983) the normal blood uric acid value for most birds is 2 to 15 mg/ dl and diets of such birds are considered as better-quality diets. Diets high in protein and urea will elevate serum uric acid due to an increase in uric acid biosyntheses. However, the values still fall within the normal range recommended for quality diet as opined by Chandra et al.
(1983). Therefore, treated GNH as replacement for wheat offal between 0 and
137
60% level make quality diet and could still meet the nutrient requirements of growing pullets and layers.
The similarity in the uric acid values of all birds sampled among GNH treament, levels and interaction were within the values reported by Halliwell (1981) and Rosskopf (1982). The normal serum creatinine for most birds is 0.5 to 1.5 mg/ dl and the values obtained fell within this range indicating that the diets are of good protein quality.
CONCLUSION
The study revealed that neither form (treatment) nor level of GNH had serious effects on the health of growing and laying pullets. Growing or laying birds on GNH meal did not present any negative immune status and had normal haemoglobin concentration for proper oxygen circulation. The basophils and eosinophils of the birds were normal thus, no pronounced case of tissue injury I allergy as a result of feeding GNH in various forms and levels . The study also concluded that growing pullets and layers could tolerate 60% treated GNH as replacement for wheat offal in their diets.
REFh"RENCES
Agricultural Transformation Agenda (ATA). 2011. Agricultural Transformation Agenda: We Will Grow Nigeria's Agricultural Sector - Draft Proposal. Federal Ministry of Agriculture and Rural Development Abuja, Nigeria, p. 90.
Altman, R. B. 1979. Avian clinical pathology, radiology, parasitic and infectious diseases. Proceedings of the American Animal Hospital Association, A.A.H.A., South Bend.
Akpodiete, 0. J., Eruvbetine, D. and Gagiyovwe, E. E. 2006. Effect of enzyme supplementation on palm kernel cake based
Bello and Eruvbetine, 2013
diets on broiler chicken performance. Nig.
Jour. Paul t. Sci., 4: 39-46.
Awesu, J. R., Bamgbose, A.M., Oduguwa, 0. 0., Fanimo, A. 0., and Oguntona, E. B. 2002. Performance and nutrient of cockerel finishers fed graded level of rice milling waste. Nig.]. of Anim. Prod., 29: 181-188.
Bello, K. 0. 2005. Performance of broiler chickens on ground.nut husk diets Supplemented with yeast. M. Agric dissertation, Department of Animal Production and Health, University of Agriculture, Abeokuta, Ogun State, Nigeria.
Bello, K 0 ., Fapimo, 0. A., Eruvbetine, D. and Aina, B. J. 2010. Growth Performance ang Cost Benefits of Chicks and Growing Pullets Fed Fermented and Unfermen ted Ground.nut Husk Meal Based Diets . Nig J. Poult. Sci., 7: 94-103.
Bello, K. 0., Eruvbetine, D., Fanimo, 0. A. and Ai.na, A. B. J. 2011. Sensible Heat Balance of Egg-Type Chickens Fed Fermented and Unfermented Groundnut Husk Diets duri.ng their Growing and Laying Phase. Nig. J. Anim. Prd., 39 (1): 74-85.
Campbell, T. W. 1988. Avian Hematology and Cytology. Ames, Iowa State University Press.
Chandra, M., Si.ngh, B., Soni, G. L. an d Ahuja, S. P. 1983. Renal and biochemical changes produced i.n broilers by highprotein, high-calcium, urea-containing and vitamin A- deficient diets. Avian D. S. 28:1.
Duncan, D. B. 1955. Multiple range and F tests. Biometrics, 11: 1-42.
Eggum, B. 0. 1989. Biochemical and methodological pri.nciples. In Bock. H D., Eggum, B. 0. Low, A. G. Simon, 0 ., Zebrowska, T. (Eds), Protei.n metabolism in farm animals, evaluation, digestion,
138
absorption, and metabolism. Oxford Science Publications, Duetschcr Landwirtschafts Verlag, Barhn, pp. 1 - 52.
FAOSTAT 1999. Food and Agricultural Organization of the United Nations, http:// apps.fao.org/ default.htm.
Fasuyi A. 0. 2007. Amaranthus cntentus leaf meal as a protei.n supplement i.n broiler finisher die ts part 2. Haematological responses, carcass characteris tics and relative organ weight. African Journal of Food Agriculture Nutrition and Development, Vol. 7, No.6, 2007.
Frandson, R. D. 1986. Blood and other fluids. In: Anatomy and physiology of farm Animals. Lea and febiger, Philadelphia. 4th edition, p. 233 - 254.
Halliwell, W. H . 1981. Serum Chemistry profiles in the health and disease of birds of prey. In Recent Advances or the study of Raptor Diseases, edited by Cooper, J. E. and Greenwood, A. G. Chiron Publication Ltd., West Yorkshire, England.
Harper, E. J. artd Lowe, B. 1998. Hematology Values in a Colony of Budgerigars (Melopsittacus undulatus) and Changes Associated with Agi.ng. The Journal of Nutrition, 128 (12): 2639S-2640S.
Maxwell, M. H, Robertson, W., Spencer, S. and Maclorquodale, C. C. 1990. Comparison of haematological parameters i.n restricted and ad libitum fed domestic fowls. Br. Poult.
Sci., 31: 407-413.
Mirtuka, B. M. and Rawnsley, H. M. 1977. Clinical, Biochemical and Haematological Reference values i.n Normal Experimental Animals. Masson Publishi.ng USA inc. New York, USA, p. 82-144.
Onifade, A. A., Odunsi, A. A., Babatunde, G. M., Olorede, B. R. and Muma, E. 1999a.

I-Iaematology and Serum Chemistry of Growing Pullets and Layers Fed Groundnut Husk
Comparison of the supplemental effects of Saccharomyces cerevisiae and antibiotics in low -protem and high fibre diets fed to bro!ler chickens. Arch. Anim. Nutr., 52: 29-39.
Onifade, A. A., Obiyan, R. I., Onipede, E., Adejumo, D. 0., Abu, 0. A. and Babatunde, G. M. 1999b. Assessment of the effects of supplementing rabbit diets with a culture of Saccharomyces cerevisiae using performance, blood composition and clinical enzyme activities. Anim. Feed Sci. Techno[., 77: 25-32.
Pellet, P. Z. and Young, N. P. 1980. Nutritional evaluation of protein feeds. United Nation Universal World Hunger Programme Food and Nutrition Bulletin 4, p. 154.
139
Rosskopf, W. J., Woerpel, R. W., Rosskopf, G. and Van De Water, D. 1982. Hematologic a."'ld blood chenustry values for comma~ _r>L. avian species. Vet. Med. Small Anim. Clin., 77:
1233-1239.
SAS, 1999. Statistical Analysis Sys tem . SAS Institute Inc. Cary, NC 27513, USA.

Journal of Applied Agricultural Research 2013, 5(2): 141-145 ISSN 2006-750X ©Agricultural Research Council of Nigeria, 2013
COMPARATIVE EGG QUALI1Y TRAITS OF FOUR POULTRY SPECIES
Orunmuyi, M., Okezie, 0 . I., Bawa, G. S., Ojo, 0. A. and *T. S. Olugbemi Department of Animal Science, Faculty of Agriculture, Ahmadu Bello University, P. M. B. 1044, Zaria, Nigeria
*[email protected] , +2348086638349
ABSTRACT
Eggs from four poultry species were assessed to compare their internal and external . quality characteristics. The poultry species were the chicken, guinea fowl, duck and
quail. The egg external traits studied were weight, height, width and shape while Lhe interior egg qualities studied were albumen quality, yolk quality and haugh unit. Guinea fowl egg shell was found to have the highest shell thickness (0.54 mm) while the eggs from the brown type of the commercial laying bird had the highest average weight (62.54 g) as well as albumen weight. Quail eggs had the highest proportion of yolk (41 .55%) as well as yolk to albumen ratio (0.89). The yolk index ranged from 0.30 to 0.44, and brown layer was observed to have the highest. Albumen height (9.06 mm) and haugh unit (89.43%) were highest in duck; and lowest in quail (3.96 mm} and local chicken (80.02%). The relatively higher value of shell thickness obtained in guinea fowl egg is an indication that it is more resistant to breakage compared to the shell of other poultry species.
Keywords: poultry, egg quality, comparison, storage
INTRODUCTION
Eggs are eaten by several people in the world and are an important component of the human diet; egg is recognized as a natural balance of essential nutrients (MAFF 2006). In Nigeria, different poultry species contribute significantly to the animal protein supply of the populace in terms of eggs laid (Ikeobi et al., 1999). These species include the local chicken, guinea fowl, improved duck, commercial laying birds, pigeon, ostrich, geese, turkey and quail. The egg is a complex structure distinguished by having four main parts, viz yolk, albumen, shell membrane
and shell. The quality of egg is determined by its acceptability to consumers (Stadelman, 1997); hence, it is important to produce high quality eggs.
141
Egg quality aspects can be measured internally and externally and consist of those characteristics that affect its acceptability to consumers, such as cleanliness, freshness, egg weight, shell quality; yolk index, albumen index, haugh unit and chemical composition (Song et al., 2000). Interior egg quality is based on albumen quality, quality of yolk and the presence of blood spots aacob and Miles, 2000), while external egg quality refers to egg weight, height, width, shape, strength as well as cleanliness of the egg. Song et al. (2000) observed that information on egg quality characteristics as well as utilization has been limited to chicken. With increased demand for processed eggs, it is important to determine the quality of eggs of various poultry species. The objective of this study was, therefore, to compare the internal and external egg quality parameters from

·.
Orurunuyi el a/., 2013
different poultry species such as the chicken, guinea fowl, duck and quail.
MA TERIAl5 AND METHODS
The study was carried out in the Biochemical
Laboratory of the Department of Animal Science, Faculty of Agriculture, Ahmadu
Bello University, Zaria, Nigeria. Data were ~ .. obtained by measuring both the internal and
external parameters of 30 black layer eggs, 30
brown layer eggs, 24 guinea-fowl eggs, 30 duck eggs, 27 local chicken eggs and 74 quail eggs.
The eggs of the quail, guinea fowl and duck were obtained from the National Veterinary Research Institute (Vom), Jos, Plateau State,
Nigeria. These were collected on the day they were laid. Eggs from the black and
brown strains of commercial layers were collected fresh from commercial farms in
Zaria, while eggs from the local chickens were collected from birds raised in the Zaria environs.
Floatation test as recommended by Payne and Williamson (1990) was carried out on the eggs of local chickens to confirm that the
eggs were still good. The eggs were cleaned and placed in a carton which was padded with cotton wool to prevent egg shell
breakage/ cracking during transportation. The eggs were weighed using an electronic balance (Sartorius AG Gottingen) while the egg width, egg height, albumen height, yolk height and yolk diameter were obtained using a vernier caliper. A micrometer screw gauge was used to measure shell thickness. The shape index was calculated by dividing
the egg diameter by height and expressing as a percentage. The haugh unit was calculated from the measurement of the height of albumen and weight of the egg using the
formula:
Hu = 100 log (H + 7.6 -1.7W037)
Hu = Haugh unit H =Albumen h eight in millimeters W = Egg weight in grams.
Table 1: Egg shape and shell characteristics of the different species of birds
Species N Breath (B), Length (L), Shape index Shell Surface Area, mm mm Titickness, cm2
mm Black Layer 30 41.9 ± 0.03b 56.8 ± 0.04b 73.73 ± 0.75< 0.36 ± 0.05< 81.55 ± 0.72b Brown Layer 30 43.6 ± 0.03b 57.9 ± 0.04b 75.45 ± 0.75b 0.35 ± 0.05< 89.91 ± 0.72• Local Chicken 27 35.5 ± 0.03d 48.7 ± 0.04< 72.86 ± 0.79< 0.45 ± 0.06b 58.91 ± 0.76d Guinea Fowl 24 39.1 ± 0.03< 48.8 ± 0.04< 80.28 ± 0.83• 0.54 ± 0.06• 66.85 ± 0.81 ( Duck Eggs 30 42.9 ± 0.0• 60.4 ± 0.04• 71.27 ± 0.75d 0.34 ± 0.05< 89.97 ± 0.72• Quail 74 25.2 ± 0.02• 31.7 ± 0.02d 79.40 ± 0.48• 0.20± 0.03d 26.96 ± 0.46•
""""• means within the same colwnn with different superscripts differ significantly (P<O.OS)
Table 2: Weights of components of the poultry eggs (g)
SEecies Whole Egg Yolk Weight Albumen Weight Shell Weig!1t Black Layer 53.23 ± 0.70b 15.92 ± 0.32b 31.59 ± 0.63b 5.72± 0.12b Brown Layer 62.54 ± 0.70• 16.08 ± 0.32b 39.88 ± 0.63• 6.58 ± 0.12• Local Chicken 33.36 ± 0.74< 12.25 ± 0.33d 17.48 ± 0.67d 3.62 ± 0.12< Guinea Fowl 40.51 ± 0.78< 14.51 ± 0.35< 19.45 ± 0.71< 6.65 ± 0.13• Duck Eggs 61.77 ± 0.70• 22.50 ± 0.32• 33.14 ± 0.631> 6.14 ± 0.12b Quail 10.79 ± 0.45' 4.48 ± 0.20< 5.13 ± 0.40< 1.17 ± O.Q7d
""""' means within the same colwnn with different superscripts differ significantly (P<O.OS)
142
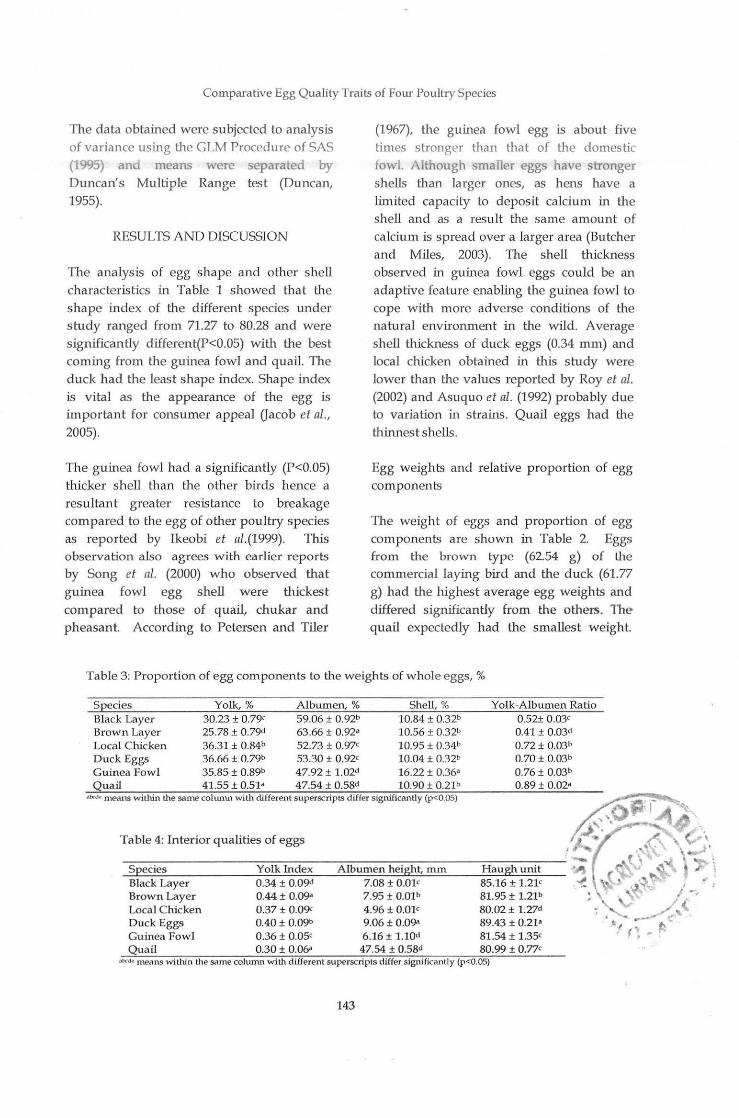
Comparative Egg Quality Traits of Four Poultry Species
The data obtained were subjected to analysis of variance using the GLM Procedure of SAS (19'15) and means were sep arated by Duncan's Multiple Range test (Duncan, 1955).
RESULTS AND DISCUSSION
The analysis of egg shape and other shell characteristics in Table 1 showed that the shape index of the different species under s tudy ranged from 71.27 to 80.28 and were significantly di.fferent(P<O.OS) with the best coming from the guinea fowl and quail. The duck had the least shape index. Shape index is vital as the appearance of the egg is important for consumer appeal Gacob et al.,
2005).
The guinea fowl had a signi.ficantly (P<O.OS) thicker shell than the other birds hence a resultant greater resistance to breakage compared to the egg of other poultry species as reported by Ikeobi et a/.(1999). This observation also agrees w ith earlier reports by Song et al. (2000) who observed that guinea fowl egg shell were thickest compared to those of quail, chukar and pheasant. According to Petersen and Tiler
(1967), the guinea fowl egg is about five times stronger than that of the domestic fowl. Although smaller eggs have stronger shells than larger ones, as hens have a limited capacity to deposit calcium in the shell and as a result the same amount of calcium is spread over a larger area (Butcher and Miles, 2003). The shell thickness observed in guinea fowl eggs could be an adaptive feature enabling the guinea fowl to cope with more adverse conditions of the natural environment in the wild. Average shell thickness of duck eggs (0.34 mm) and local chicken obtained in this study were lower than the values reported by Roy et al.
(2002) and Asuquo et al. (1992) probably due to variation in strains. Quail eggs had the thinnest shells.
Egg weights and relative proportion of egg components
The weight of eggs and proportion of egg components are shown in Table 2. Eggs from the brown type (62.54 g) of U1e commercial laying bird and the duck (61.77
g) had the highest average egg weights and differed significantly from the others. The quail expectedly had the smallest weight.
Table 3: Proportion of egg components to the weights of whole eggs,%
seecies Yolk,% Albumen,% Shell,% Yolk-Albumen Ratio Black Layer 30.23 ± 0.79< 59.06 ± 0. 92b 10.84 ± 0.32b 0.52± 0.03< Brown Layer 25.78 ± 0.79d 63.66 ± 0.92• 10.56 ± 0.32b 0.41 ± 0.03ct Local Chicken 36.31 ± 0.84b 52.73 ± 0.97< 10.95 ± 0.34b 0.72 ± 0.03b Duck Eggs 36.66 ± 0.79b 53.30 ± 0.92< 10.04 ± 0.32b 0.70 ± 0.03b Guinea Fowl 35.85 ± 0.89b 47.92 ± 1.02d 16.22 ± 0.36• 0.76 ± 0.03b Quail 41.55 ± 0.51- 47.54 ± 0.58d 10.90 ± 0.21b
•"''"' means within the same colnnm with different superscripts differ significanUy (p<O.OS)
Table 4: Interior qualities of eggs
Seecies Yolk Index Albumen height, mrn Haugh unit Black Layer 0.34 ± 0.09d 7.08 ± 0.01< 85.16 ± 1.21< Brown Layer 0.44 ± 0.09• 7.95 ± 0.01b 81.95 ± 1.21b Local Chicken 0.37± 0.09< 4.96 ± 0.01< 80.02 ± 1.27d Duck Eggs 0.40 ± 0.09b 9.06 ± 0.09a 89.43 ± 0.21• Guinea Fowl 0.36 ± 0.05< 6.16± 1.1Qd 81.54 ± 1.35< Quail 0.30 ± 0.06• 47.54 ± 0.58d 80.99 ± 0.77<
'''d' means within U1e same column with different superscripts differ significanlly (p<O.OS)
143
Orunmuyi et a/., 2013
Though a negative relationship has been reported by Yannakopoulos and Tserverugous1 (1985) to exist between egg shape index and egg weight, this was not consistent among the species under study.
Significant differences existed among percentage albumen weights obtained, with that from the brown strain of the commercial laying birds accounting for the highest weight. The albumen weight obtained in this study agrees with the result obtained by Asuquo et al. (1992). The egg weight for duck egg observed in this study agrees with the findings of Kalita et al. (2004) but is slightly higher than those obtained by Roy et
al. (2002) for Nageswari duck eggs. The proportion of yolk, albumen and shell are shown in Table 3. Quail egg had the largest proportion of yolk (41.55 % ), followed by duck (36.66% ), local chicken (36.31% ), guinea fowl (35.85% ), black layer, (30.10%) and brown layer (25.78% ).
The proportion of a lhumen to the total egg ranged from 47.54% - 59.06% among the poultry species. Quail egg was found to be highest in yolk to albumen ratio (0.89), followed by guinea fowl (0.76), local chicken (0.72), duck (0.70), black layer (0.52) and brown layer (0.41). The yolk albumen ratio known to influence the quality of egg vary based on many factors such as weight of the egg, age of the layer and genetic factors (Song et al., 2000). The report of Dottavio et al. (2005) indicates that among eggs with same flock age, small eggs have higher yolk proportion than large eggs. The yolk index, albumen height and haugh unit are shown in Table 4.
The yolk index ranged from 0.30 to 0.44. The albumen height and haugh unit were highest in duck and lowest in quail and local chicken, resp ectively. This may be due to variation in environmental factors. Average yolk index and haugh unit obtained for duck egg was slightly lower than those obtained
144
by Roy et al. (2002). Yolk index and haugh unit for local chicken egg obtained in this stud}' ere higher than the 0.33 and 80.02, respectively obtained by Asuquo (1995). Yolk index and haugh unit for brown layer eggs obtained in this study were, however, similar to reports obtained by Pandey et al.
(1987).
CONCLUSION
In conclusion, the comparatively larger yolk proportion in quail eggs may be useful, especially in the bakery indushy while the relatively high shell thickness obtained for guinea fowl can probably be an advantage in terms of storage and handling with less risk of damage than the eggs of the other species.
REFERENCES
Asuquo, B. 0 ., Okon, B. and Ekong, A. 0. 1992. Quality parameters of Isa Brown and Nigerian local chicken eggs. Nigeria Joumal of Animal Production, 19: 1-5.
Asuquo, B. 0. 1995. The repeatability of egg quality traits in the Nigerian local chicken. East African Agricultural and Forestn; Joumal, 60:4.
Butcher, G. D. and Miles, R. D. 2003. Concepts of eggshell quality. http:// www.edis. if as. ufl.edu/ pdffiles / VM/ VM01300.pdf.
Duncan, D. S. 1955. Multiple range and Multiple F test. Biometrics, 11:1-42.
Dottavio, A.M., Canet, Z.E., Faletti, C., Alvarez, M., Font, M.T. and Di Masso, R.J. 2005. Yolk: Albu.men ration in experimental hybrid layers with different paternal genotype. Arch. Zootech, 54: 87-95.
Ikeobi, C. 0. N., Hyginus, C. M., Adenowo, ]. A. and Adebambo, 0. A. 1999. Egg quality characteristics of four poultry species
Comparative Egg Quality Traits of Four Poultry Species
in Nigeria. Tropical journal of Animal Science, 1(1): 37-42.
Jacob, ]. and Miles, R. 2000. Designer and Specialty Eggs. Fact sheet PS-51, Department of Animal Sciences, Florida Cooperative Extension Service, Institute of Food and Agricultural Sciences, University of Florida. November 2000. http:/ j edis.ifas.ufl.edu/pdffiles/PS/PS04800.pdf
Jacob, J. P., Miles, R. D. and Mather, F. B. 2005. Egg quality. University of Florida Extension. Ins titute of Food and Agricultural Science. http:/ jedis.ifas.ufl.edu/pdffiles/ ps/ps02000.pdf.
Kalita, N., Sarma, D., Talukdar, ]. K., Barua, N. and Ahmed, N. 2004 Comparative Performance of Khaki Campbell ducks and Desi ducks and their reciprocal crosses for certain economic traits in rural conditions. World Poultry Science, 60: 349-335.
MAFF. 2006. Minisry of Agriculture Fisheries and Food, egg quality guide. Retrieved October 21,2012 from www.maff.gov.
Pandey, N. K., Mahapatra, C. M. and Verm a, S. S. 1987. Physio-chemical evaluation of egg quality traits in Rhode Is land Red Chickens. Indian Journal of Animal Science, 57(6): 609-613.
145
Payne, W. ]. A. and Williamson, G. 1990. An inb·oduction to Animal husbandry in the tropics (4th ed.) Longman.
Petersen, J. and Tiler, C. 1967. The strength of guinea fowl egg shell quality. Poultnj Science, 61 : 2022-2039.
Roy, T. C., Rahman, M., Deka, D. and Bula, D. 2002. Studies on some physical quality traits of Nageswari duck eggs. Indian Veterinary Journal, 79: 517-518.
SAS Institute Inc. 1995. Statistical Analysis System users Guide; version 8. SAS Institute, Inc., Cary, NC USA.
Song, K T., Choi, S. H. and Oh, H. R. 2000. A comparison of egg quality of Pheasant, Chukar, Quail and Guinea fowl. AsianAustralasian Journal of Animal Science, 13(17): 986-990.
Stadelman, W. J. 1997. Quality preservation of shall eggs in egg science and technolof51j (2nd
edition) (Ed. W J Stadelman and 0 J Cotterill) Avi Publishers Co., Inc Westport C.T. p. 41-47.
Yannakopoules, A. L. and Tservenigousi, A. S. 1985. Quality characteristics of quail eggs. British Poultnj Science, 27: 171-176.

/
CROP PRODUCTION
AND
SOIL SCIENCE
147
·.


Journal of Applied Agricultural Research 2013, 5(2): 149-159 ISSN 2006-750X ©Agricultural Research Council of Nigeria, 2013
EFFECTS OF DIFFERENT PLANT POPULATION DENSITIES ON AGRONOMIC PERFORMANCE AND QUALITY PROFILE OF HIGH-LYSINE HYBRID MAIZE
(Zea mays) IN KRASNODAR REGION OF RUSSIA
*Sakariyawo, 0. S.1.3, Rodachiskaya, L. V.2, Yakovlev, E. B.3 and A. A Oyekanmi1
I Department of Plant Physiology and Crop Production, Federal University of Agriculture, Abeokuta. P.M.B. 2240, Alabata, Ogun State. Nigeria
2Lukyanenko Krasnodar Agricultural Research Institute, Leningradskaya Settlement, 353742, Krasnodar. Russia
3Faculty of Tropical and Sub-Tropical Agriculture, Kuban Agricultural University, 13, Kalinin Street, 350044, Krasnodar, Russia.
*[email protected]. uk, + 2347030890180
ABSTRACT
Increasing maize productivity through increasing plant population beyond the optimum could have negative consequences on its canopy architecture and flowering phenology, while the resolution of contradictory relationship between quantity and quality profile of maize poses a serious challenge, bearing in mind the low nutritional status of maize. The objectives of this trial were to determine performance of high lysine maize hybrid and their quality profile at different plant population densities. A field trial was conducted in the Krasnodar region of Russia in 1993. A 7 x 2 factorial experiment laid out in randomised completely blocked, replicated four times. Seven high lysine hybrid maize varieties were selected at two planting densities (40,000 and 60,000 plants ha-l). Data were collected on flowerine phenology, growth and yield. Incidence of infection, protein and lysine content were also determined. At 40,000 plants ha-l, KR395SV HL, KR.400 HL, KR.473 HL and KR.474 HL were significantly taller when compared with the standard variety, while at 60,000 plants ha·l; KR.473 HL and KR-474 HL were significantly taller than the standard variety. A depression was observed in 1000 grain weight of hybrids with increasing population density, compared to standard variety. At 40,000 plants ha-l KR. 400 HL recorded a higher yield, compared to the standard variety, it was not significantly different, while at 60,000 plants ha-1, all hybrids except KR.401 HL and KR. 473 HL had significantly lower yield than the standard variety. KR. 401 and KR. 402 (8%) were mostly infested with Fusarium. Lysine content in hybrids was significantly higher with maximum content recorded at 4.5% and 4.4% for KR.402 HL and KR.474, respectively, in both plant population densities. This confers on the hybrid high nutritional value. However, protein content was higher in standard variety compared to the high lysine maize hybrids.
Keywords: high-lysine maize, plant population density, flowering phenology, hybrid
INTRODUCTION
Maize (Zea mays) is widely grown in most
regions of the world. It constitutes a very important component in the diet of the
growing world population and serves as a
fodder for livestock. Performance of maize on the field could be improved through prop er management practices. Available
149
literature reported that one of the constraints of maize in ensuring nutritional security is
the low composition of essential amino acids
Geffrey et al., 1995).
Increasing plant population density per unit
area could increase the productivity of maize. However, its low tillering ability could not allow it to increase its leaf area
Sakariyawo et a/., 2013
index for the interception of radiant energy in ensuring efficient photosynthetic process or increase number of reproductive structure in the advent of negative environmental factors (Gardner et al., 1985). It was reported that increasing plant population density above optimum level could have a negative effect on maize performance (Lemcoff and Loomis, 1994). With increasing plant population there is a tendency for asynchronous flowering phenology with predominance of protandry, resulting in differential rate of the transportation of growth substances, especially auxin, causing apical dominance (Sangoi and Salvador 1998). Preferential partitioning of assimilates to the vegetative structure and its relatively higher growth rate could create shading . effect on the stand, modifying far red-to-red light ratio (Kasperbauer and Karlen, 1994). Hence, accumulation of auxin could be through modification of canopy architecture or activities of photomorphogenic light; farred and red light (Sangoi, 2000). Other consequences of differential distribution of growth substances are delayed ear differentiation and growth and its negative effect on kernel set (Wilson and Allison, 1979; Tollenaar and Daynard, 1978; Jacobs and Pearson, 1991). Increasing plant population of maize would eventually compromise harvest index and grain yield.
Maize kernel is made up of 6% pericarp, 82% endosperm and 12% germ. The normal maize kernel contains the following proportion of storage protein in the endosperm; 3% albumin, 3% globulin, 60% prolamin or zein and 34% glutelin (Salamini and Soave, 1982). However, the prolamin constituent is deficient in essential amino acid. Genetically, improvement in the amino acid profile of the maize kernel could be through the transformation of the amino acid profile of the endosperm, alternation of germ -endosperm ratio and an increase in the aleurone layer (Prasanna et al., 2001). Transformation of the endosperm involves
150
the exploitation of single or double mutant and the simultaneous use of mutant maize, mainlv opaque with gene modifier It had been widely reported in the past that the gene opaque 2 and subsequently other mutants; floury 2, floury 3, opaque 6 and micronate altered kernel phenotype (Landry, et al., 2002). Available literature also indicated that those mutant genes significantly altered the amino acid profile of the endosperm, importantly, essential amino acids of lysine and tryptophan in 3-fold (Prasanna et al., 2001). Proportion of other amino acids like histidine, arginine, aspartic acid and glycine increased significantly. However, it was observed that there was a decrease in the concentration of glutamic acid, alanine and leucine in the endosperm. Apart from the nutritional and biological values of high lysine hybrid maize, other negative pleiotrophic effects had been reported on the kernel phenotype (Yau et al., 1999). It was observed that there is a negative correlation between lysine content and protein (Kniep and Mason, 1991), while protein content is positively correlated with the proportion of zein and carbohydrate Oose et al., 2004). Proportion of carbohydrate in the kernel confers on it high agronomic and processing value since seed density and grain weight is directly dependent on it. The simultaneous use of opaque mutant and gene modifier, the so called Quality Protein Maize is a promising path for further exploitation.
There is little information on the effect of plant population density on the yield and quality profile of high lysine maize variety. The objectives of this trial were to determine growth, development and yield response of high lysine hybrid maize to different plant population densities and evaluate their quality profile.
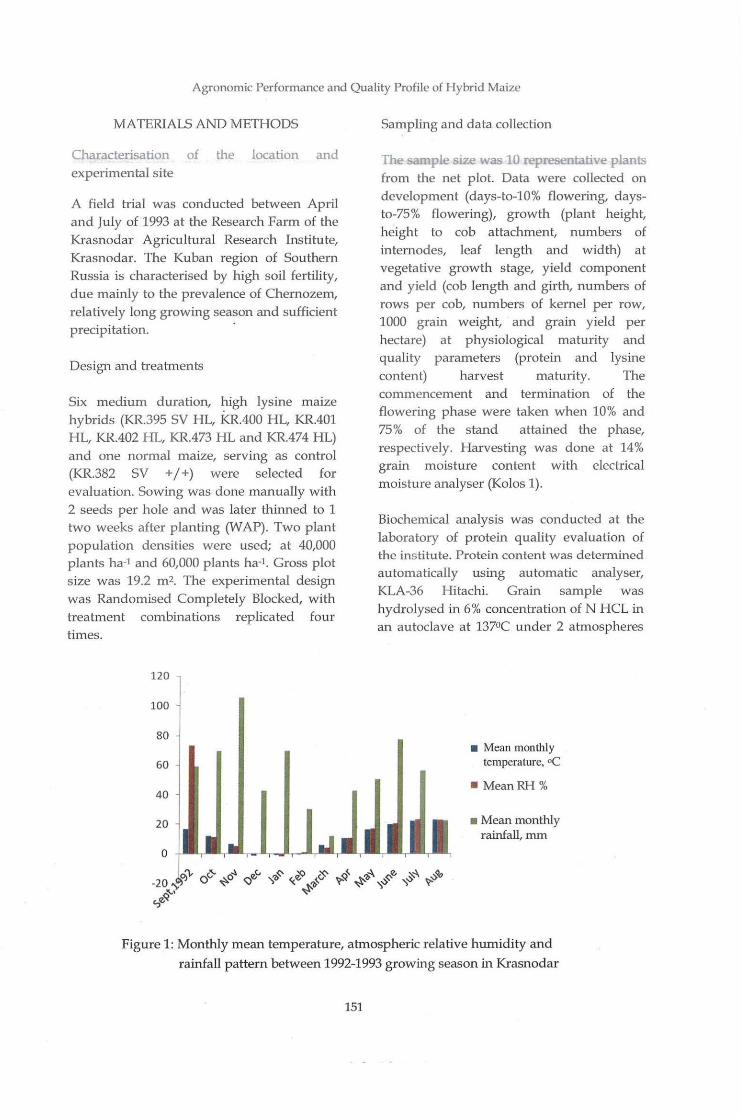
Agronomic Performance and Quality Profile of Hybrid Maize
MATERIAlS AND METHODS
Characterisation of the location and experimental site
A field trial was conducted between April and July of 1993 at the Research Farm of the Krasnodar Agricultural Research Institute, Krasnodar. The Kuban region of Southern Russia is characterised by high soil fertility, due mainly to the prevalence of Chernozem, relatively long growing season and sufficient precipitation.
Design and treatments
Six medium duration, high lysine maize hybrids (KR.395 SV HL, KR.400 HL, KR.401 HL, KR.402 HL, KR.473 HL and KR.474 HL) and one normal maize, serving as control (KR.382 SV + / +) were selected for evaluation. Sowing was done manually with 2 seeds per hole and was later thinned to 1 two weeks after planting (WAP). Two plant population densities were used; at 40,000 p lants ha-1 and 60,000 plants ha-1. Gross plot size was 19.2 m2. The experimental design was Randomised Completely Blocked, with treatment combinations replicated four times.
120
100
80
60
40
Sampling and data collection
The sam?le size was 10 rep-esc..."1tative plants from the net plot. Data were collected on development (days-to-10% flowering, daysto-75% flowering), growth (plant height, height to cob attachment, numbers of internodes, leaf length and width) at vegetative growth stage, yield component and yield (cob length and girth, numbers of rows per cob, numbers of kernel per row, 1000 grain weight, and grain yield per hectare) at physiological maturity and quality parameters (protein and lysine content) harvest maturity. The commencement and termination of the flowering phase were taken when 10% and 75% of the stand attained the phase, respectively. Harvesting was done at 14% grain moisture content with electrical moisture analyser (Kolos 1).
Biochemical analysis was conducted at the laboratory of protein quality evaluation of the ins titute. Protein content was determined
automatically using automatic analyser, KLA-36 Hitachi. Grain sample was hydrolysed in 6% concentration of N HCL in an autoclave at 1370C under 2 atmospheres
• Mean monthly temperature, oC
• MeanRH%
• Mean monthly rainfall, mm
Figure 1: Monthly mean temperature, atmospheric relative humidity and
rainfall pattern between 1992-1993 growing season in Krasnodar
151

Sakariyawo et al., 2013
for a duration of 6 hours. Grain nutritional value was evaluated on mouse in the laboratory of plant protein of the institute.
Statistical analysis
Data collected were subjected to Analysis of Variance (ANOV A) and means were separated using Least Significant Difference (LSD) at 5% probability level. All statistical analyses were done at the Biometrical Centre of the Institute and Computational Centre of Kuban State Agricultural University, Krasnodar.
RESULTS
Agro-meteorological location
characteristics of
Representative climate for Krasnodar region is moderate continental, with very hot summer season and with short but warm winter. The 1993 cropping season was characterised with comparatively very high temperature, with a mean value of 11.00C when compared with the mean temperature values of several years in the region hovering at 10.80C. The hottest month during the cropping season of 1992-1993 was August (22.90C), while the coldest month was recorded in December, January and February (Figure 1).
The quantity of precipitation recorded for Krasnodar was quite sufficient to sustain agronomic practices, though quite unstable. Mean monthly rainfall distribution for the
region was 53.1 mm during the planting period. This was quite high when compared to mean values for several years recorded in the region, standing at 50.6mm. It was observed that there was a decline in the rainfall pattern, especially from July to the end of August of 1993. In the 3rct quarter of July, 4.6 mm of rainfall was recorded, while in the 1st, 2nd and 3rd quarters of August, 2.9, 19.2 and 0.4 mm of rainfall were observed, respectively.
Atmospheric relative humidity recorded during the growing season was within a range of 64.88% which was evenly distributed monthly. The sum total atmospheric relative humidity for the period of 1992-1993 was 87.10%. In the 3rd quarter of April of the year 1993, environmental condition for germination and crop establishment was satisfactory enough, though temperature as of that time was a growth limiting factor. The month of July, which was critical with respect to moisture availability (anthesis period), agro-climatic condition for the growth and development of maize was conducive enough. Temperature, which was a critical factor in that phase of development, was moderate at a value of 22.1 oc, which was less than mean values obtained over several years.
In August, mean rainfall was 22.5 mm, which was less than mean of several years. That condition could negatively affect grain filling process due mainly to the loss of moisture from the soil.
Table 1: Interaction of variety x plant population density on flowering phenology of h ybrid maize, 1993
Name of hybrid 40,000 Ela nts ha·1 60,000 Elants ha·• 10% flowering 75% flowering 10% flowering 75% flowering
KR.382 SV +I+ 8 60 10 76 KR.395SVHL 8 57 10 78 KR.400HL 5 57 10 78 KR.401 HL 7 54 10 78 KR. 402HL 7 54 11 89 KR.473 HL 8 63 11 82 KR.474HL 7 57 10 77
152
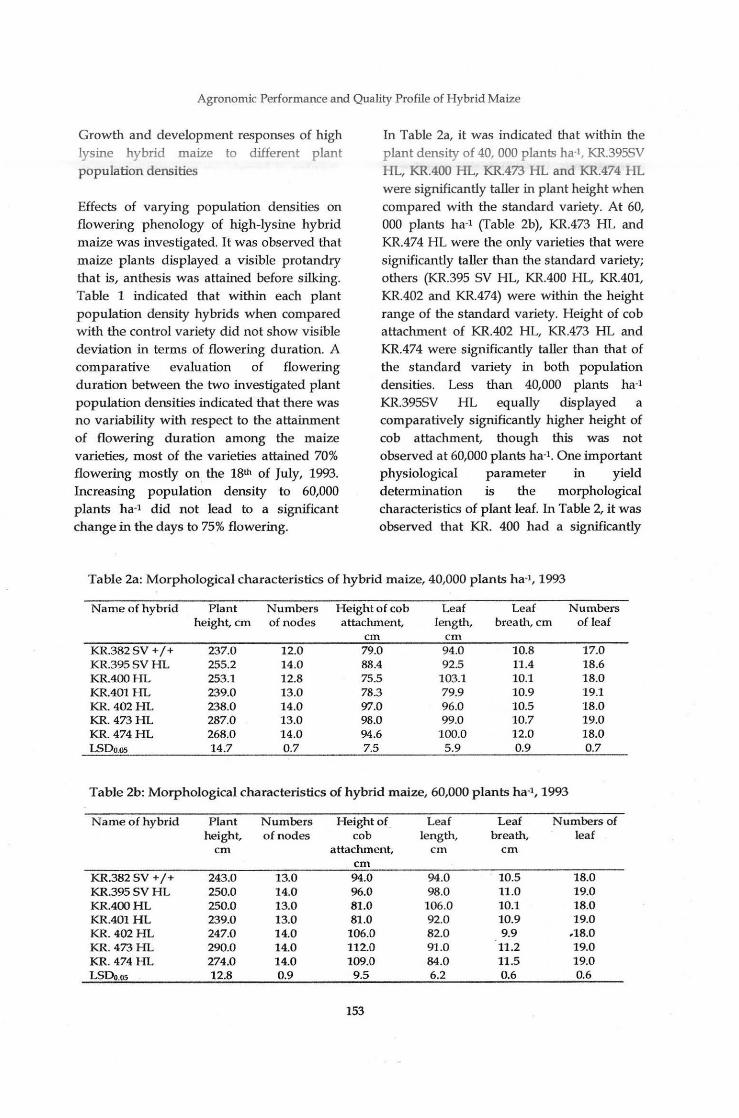
Agronomic Performance and Quality Profile of Hybrid Maize
Growth and development responses of high lysine hybrid maize to different plant population densities
Effects of varying population densities on flowering phenology of high-lysine hybrid maize was investigated. It was observed that maize plants displayed a visible protandry that is, anthesis was attained before silking. Table 1 indicated that within each plant population density hybrids when compared with the control variety did not show visible deviation in terms of flowering duration. A comparative evaluation of flowering duration between the two investigated plant population densities indicated that there was no variability with respect to the attainment of flowering duration among the maize varieties, most of the varieties attained 70% flowering mostly on the 18th of July, 1993. Increasing population density to 60,000 plants ha-l did not lead to a significant change in the days to 75% flowering.
In Table 2a, it was indicated that within the plant density of 40, 000 plants ha-l, KR.395SV HL, KR.400 HL, KR.473 HL and KR.474 HL
were significantly taller in plant height when compared with the standard variety. At 60, 000 plants ha-t (Table 2b), KR.473 HL and KR.474 HL were the only varieties that were significantly taller than the standard variety; others (KR.395 SV HL, KR.400 HL, KR.401, KR.402 and KR.474) were within the height range of the standard variety. Height of cob attachment of KR.402 HL, KR.473 HL and KR.474 were significantly taller than that of the standard variety in both population densities. Less than 40,000 plants ha-l KR.395SV HL equally displayed a comparatively significantly higher height of cob attachment, though this was not observed a t 60,000 plants ha-l. One important physiological parameter in yield determination is the morphological characteristics of plant leaf. In Table 2, it was observed that KR. 400 had a significantly
Table 2a: Morphological characteristics of hybrid maize, 40,000 plants ha-1, 1993
Name of hybrid Plant Numbers Height of cob Leaf Leaf Numbers height, em of nodes attachment, length, breath, em of leaf
em em KR.382 sv +I+ 237.0 12.0 79.0 94.0 10.8 17.0 KR.395SVHL 255.2 14.0 88.4 92.5 11.4 18.6 KR.400HL 253.1 12.8 75.5 103.1 10.1 18.0 KR.401 HL 239.0 13.0 78.3 79.9 10.9 19.1 KR.402HL 238.0 14.0 97.0 96.0 10.5 18.0 KR. 473HL 287.0 13.0 98.0 99.0 10.7 19.0 KR. 474HL 268.0 14.0 94.6 100.0 12.0 18.0 LSDo.os 14.7 0.7 7.5 5.9 0.9 0.7
Table 2b: Morphological characteristics of hybrid maize, 60,000 plants ha-1, 1993
Name of hybrid Plant Numbers Height of Leaf Leaf Numbers of height, of nodes cob length, breath, leaf
em attachment, em em em
KR.382 sv +I+ 243.0 13.0 94.0 94.0 10.5 18.0 KR.395SVHL 250.0 14.0 %.0 98.0 11.0 19.0 KR.400HL 250.0 13.0 81.0 106.0 10.1 18.0 KR.401 HL 239.0 13.0 81.0 92.0 10.9 19.0 KR. 402HL 247.0 14.0 106.0 82.0 9.9 .18.0 KR.473HL 290.0 14.0 112.0 91 .0 11.2 19.0 KR. 474 HL 274.0 14.0 109.0 84.0 11.5 19.0 LSDo.os 12.8 0.9 9.5 6.2 0.6 0.6
153
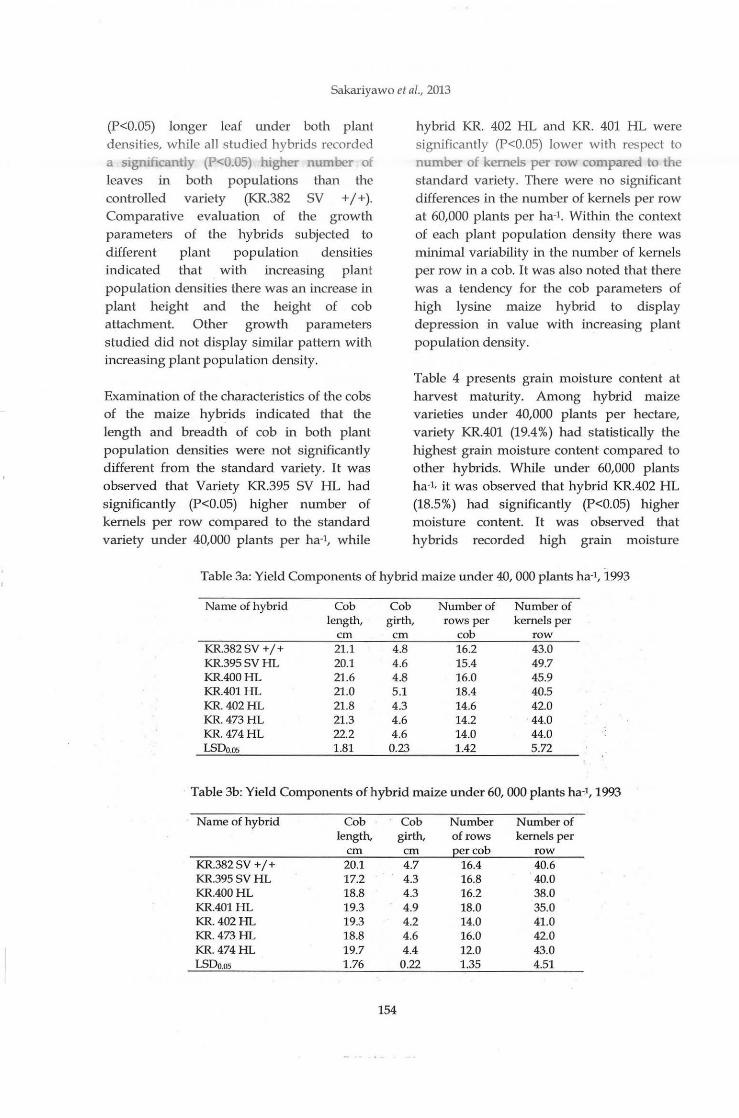
Sakariyawo eta/., 2013
(P<O.OS) longer leaf under both plant densities, while all s tudied hybrids recorded a significanuy (P<O.OS) higher numbt!r of leaves in both populations than the controlled variety (KR.382 SV +/+). Comparative evaluation of the growth parameters of the hybrids subjected to different plant population densities indicated that with increasing plant population densities there was an increase in plant height and the height of cob attachment. Other growth parameters studied did not display similar pattern with increasing plant population density.
Examination of the characteristics of the cobs of the maize hybrids indicated that the length and breadth of cob in both plant population densities were not significantly different from the standard variety. It was observed that Variety KR.395 SV HL had significantly (P<O.OS) higher number of kernels per row compared to the standard variety under 40,000 plants per ha-1, while
hybrid KR. 402 HL and KR. 401 HL were significantly (P<O.OS) lower with respect to number of kernels per ro\V compared to the standard variety. There were no significant differences in the number of kernels per row at 60,000 plants per ha-t. Within the context of each plant population density there was minimal variability in the number of kernels per row in a cob. It was also noted that there was a tendency for the cob parameters of high lysine maize hybrid to display depression in value with increasing plant population density.
Table 4 presents grain moisture content at harvest maturity. Among hybrid maize varieties under 40,000 plants per hectare, variety KR.401 (19.4%) had statistically the highest grain moisture content compared to other hybrids. While under 60,000 plants ha·l, it was observed that hybrid KR.402 HL (18.5%) had significantly (P<O.OS) higher moisture content. It was observed that hybrids recorded high grain moisture
Table 3a: Yield Components of hybrid maize under 40, 000 plants ha-l, 1993
Name of hybrid Cob Cob Number of Number of length, girth, rows per kernels per
em em cob row KR.382 sv +I+ 21.1 4.8 16.2 43.0 KR.395SVHL 20.1 4.6 15.4 49.7 KR.400HL 21.6 4.8 16.0 45.9 KR.401 HL 21.0 5.1 18.4 40.5 KR.402HL 21.8 4.3 14.6 42.0 KR.473HL 21.3 4.6 14.2 44.0 KR. 474HL 22.2 4.6 14.0 44.0 LSDo.os 1.81 0.23 1.42 5.72
Table 3b: Yield Components of hybrid maize under 60, 000 plants ha-1, 1993
Name of hybrid Cob Cob Number Number of length, girth, of rows kernels per
em em Eercob row KR.382 SV +I+ 20.1 4.7 16.4 40.6 KR.395SVHL 17.2 4.3 16.8 40.0 KR.400HL 18.8 4.3 16.2 38.0 KR.401HL 19.3 4.9 18.0 35.0 KR.402HL 19.3 4.2 14.0 41.0 KR.473HL 18.8 4.6 16.0 42.0 KR.474HL 19.7 4.4 12.0 43.0 LSDo.os 1.76 0.22 1.35 4.51
154
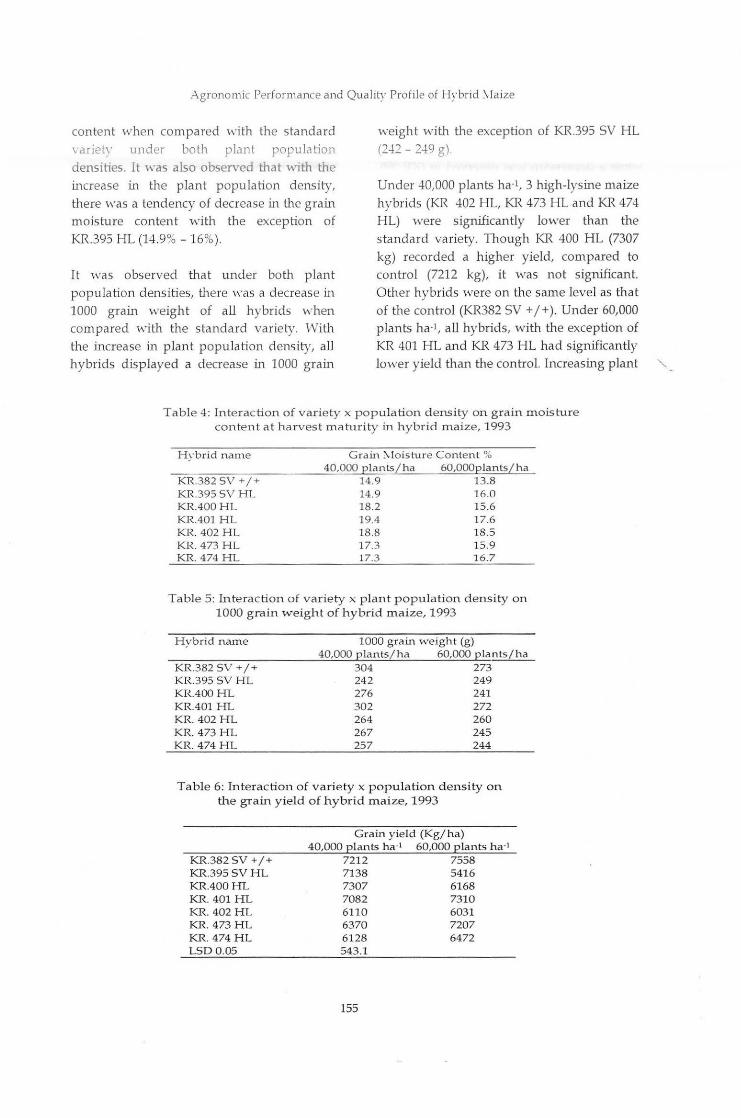
.-\gronomic Performance and Quality Profile of Hybrid ~ Iaize
content when compared with the standard variet\' under both plant population densities. It was also observed that w1th the increase in the plant population density, there was a tendency of decrease in the grain moisture content with the exception of KR.395 HL (14.9% -16%).
It was observed that under both plant population densities, there was a decrease in 1000 grain weight of all hybrids when compared with the standard variety. With the increase in plant population density, all hybrids displayed a decrease in 1000 grain
weight with the exception of KR.395 SV HL
(2-:1:2- 249 g)
Under 40,000 plants ha·l, 3 high-lysine maize hybrids (KR 402 HL, KR 473 HL and KR 474 H L) were significantly lower than the standard variety. Though KR 400 HL (7307
kg) recorded a higher yield, compared to control (7212 kg), it was not significant. Other hybrids were on the same level as that of the control (KR382 SV +/ +).Under 60,000 plants ha·l, all hybrids, with the exception of KR 401 H L and KR 473 HL had significantly lower yield than the con troL Increasing plant "..
Table 4: Interaction of variety x population density on grain moisture content a t harvest maturity in hybrid maize, 1993
Hybrid name
KR.382 SV +/+ KR.395SV HL KR.400HL KR.401 HL KR. 402 HL KR. 473 HL KR. 474 HL
Grain \loisture Conte n t % 40,000 p lants/ ha 60,000plants / ha
14.9 13.8 14.9 16.0 18.2 15.6 19.4 17.6 18.8 18.5 17.3 15.9 17.3 16.7
Table 5: Inte rac tio n of varie ty x p lant p opulation d e n si ty on 1000 grain weight of h ybrid m a ize, 1993
Hybrid name
KR.382 sv +I+ KR.395 SV HL KR.400 HL KR.401 HL KR. 402 HL KR. 473 HL KR. 474 HL
1000 grain weight (g) 40,000 plants/ha 60,000 plants/h a
304 273 242 249 276 302 264 267 257
241 272 260 245 244
Table 6: Interac tion of varie ty x population d ensity on the grain y ie ld of hybr id maize, 1993
KR.382 sv +I+ KR.395SV HL KR.400 H L KR. 401 HL KR. 402 H L KR. 473 H L KR. 474 HL LSD 0.05
Grain y ie ld (Kg/ h a) 40,000 plants ha·•
7212 7138 7307 7082 6110 6370 61 28 543.1
155
60,000 plants ha·• 7558 5416 6168 7310 6031 7207 6472
Sakariyawo et al., 2013
density resulted in an increase in the grain yield of (control, KR 401 I IL, KR.473HL), while a depression was observed in (KR.395 SV I-lL, KR 400HL and KR 402 HL).
Incidence of Fusarium in high lysine maize varieties
When compared with the standard variety, high-lysine maize hybrid was infested with Fusarium (Table 7). Mostly affected were KR 401 I-lL and KR 402 HL (8% ). Regarding the percentage of infested grain per cob, it was 2% and 1.5% higher than the standard variety in KR 400 and KR 401, respectively. Other examined hybrids were on the same level with the standard flinty variety KR 382 SV + j +. The evaluation of incidence of infestation was analysed only on the plant population density of 40,000 plants ha-1.
Quality profile of high lysine maize varieties at different plant population
It was observed that thf>re was a depression in protein content with increase in plant population density in most hybrids, except KR 402 I-lL (7.4 - 9.1%) that showed increase with increasing population density (Table 8). Conversely, an increase in lysine content was observed in most hybrids with the exception of KR 402 ( 4.5 - 4.4%) and control variety that showed a depression in protein content.
It was observed under 40,000 plants per ha-1 that protein content in hybrids was within the range of 9.8 - 7.4%, while that of the s tandard variety was 9.7%. Lysine content in hybrid was visibly greater with maximum content recorded as 4.5 and 4.4% for KR 402 HL and KR 474, respectively. Similar pattern was equally observed when the plant population density was increased to 60,000 plants ha-l. It was observed that protein content was higher in standard variety compared to hybrids, while lysine content was more in hybrids.
156
Table 9 indicates the effect of feeding mouse with hybrid maize, higher in lysine content. Maxrmum mean weight of mouse was observed when it was been fed with KR395 HL (2.67 g), while minimum mean was observed when it was feed with standard variety (1.13 g). It was recorded that nutritional value of high-lysine hybrid of maize was twice that of the standard variety.
DISCUSSION
Productivity of maize could be improved through management practices such as increasing plant population density to the optimum, taking into account the availability of growth resources to sustain such increase. Due to constant plant system capacity for available assimilates for different physiological and biochemical processes, quantitative improvement in most cereals could not be reconciled with improvement in their nutritional profile, especially protein content, such is the case with maize, having low content for essential amino acids such as lysine (Wallace and Y an, 1998).
A disruption in flowering phenology of hybrid was reported to have led to differential transportation and partitioning of assimilates for vegetative and reproductive growth in maize, with a preference for vegetative growth Gacobs and Pearson, 1991). This trial did not establish any significant asynchronous flowering phenology in all the hybrids and the standard variety. However, other factors were reported that could have led to a change in canopy architecture; they include hormonal disequilibrium and shading, which could have resulted in photomorphogenic effect of far red-red light (Kasperbauer and Karlen, 1994). Considering canopy architecture hybrid KR 473 HL displayed significantly more rigorous vegetative growth compared to other hybrids and control variety. This growth pattern could have been as a result of apical

Agronomic Performance and Quality Profile of Hybrid Maize
dominance, an effect of increased concentration of auxin when the plants at high populanon density are most likely to experience mutual shading. Though this could not be empirically substantiated in this trial, there is the possibility of such an occurrence at high plant population density. Conversely, reproductive growth (cob length, number of rows per cob) of this hybrid indicated a significant (P<O.OS) depression under 60,000 plants ha-1. It was observed in this trial that increasing plant
population density depressed 1000 grain weight in all varieties with the exception of KR 395 SV HL This could suggest a reduced partitioning of assimilates to the ear as a result of high plant population density, compromising ear differentiation and growth as reflected in reduced yield components which are responsible for the eventual performance of maize. Available literature indicated also that opaque gene 2 confers a pleiotrophic effect on certain structural elements of the maize plant;
Ta ble 7: Incidence of Fusarium in hybrid maize, at 40,000 plants ha-1, 1993
Hybrid name Incidence of cob Percentage of infestation, % infested kernels in
the cob,% KR.382 SV +I+ 1.5 1.0 KR.395SV HL 3 1.1 KR.400HL 3 2.0 KR.401 HL 8 1.5 KR. 402HL 8 1.0 KR.473HL 2 1.0 KR. 474HL 3 1.0
Table 8: Effect of different population densities on hybrid maize grain protein and 1 ysine content, 1993
Hybrid name 40,000 Elants ha-1 60,000 plants ha·' Protein,% Lysine,% Protein,% Lysine,%
KR.382 sv +I+ 9.7 2.9 9.7 2.8 KR.395SVHL 9.0 3.8 7.5 4.0 KR.400HL 9.0 3.8 7.3 4.1 KR.401HL 9.0 4.0 8.5 4.0 KR.402HL 7.4 4.5 9.1 4.4 KR.473HL 9.8 3.6 9.6 3.6 KR.474HL 7.8 4.4 7.9 4.5
Table 9: Nutritional value of hybrid maize and mean daily weight in mice
Hybrid name
KR.382 SV +I+ KR.395SVHL KR.400HL KR.401 HL KR.402HL KR.473HL KR.474HL
Quantity Protein(%) Lysine(%)
9.7 2.9 9.0 3.8 9.0 3.8 9.0 4.0 7.4 4.5 9.8 3.6 7.8 4.4
157
Mean daily weight gain in
mice, 1.13 2.67 2.43 2.60 2.45 2.40 2.50
namely, height of cob attach ment, leaf length and width, numbers of rows per cob, numbers of kernels per row, etc. (13jamason and v asal, 1992). It was also reported that those structural e lements are significantly co rrela ted witl1 the y ield of the hybrid (Yahid et a/., 2012). One very visible consequence of the presence of opaqu e gene-2 was the reduction in the 1000 grain weight when compa red to the flinty maize.
Apart from the management practice, the gen otype of the hybrids could be a contribu ling factor to its eventual perfom1ance. The moisture content of hybrids was significantly higher than conb·ol varie ty, though a depression was observed \'.ritl1 increasing popula tion dens ity. However, this condition p redisposed hybrids to the incidence of ear rot as compared with the control. Available literature indica ted tllat textural type of endosperm of opaque modified maize is a contributing factor not necessarily the management practice (Warren, 1978). Significant increase in the grain y ield of KR 473 with increasing population density comparable to tllat of tl1e control, despite a more vigorous vegetative growtl1, could indicate tllat it was more tolera ble to the incidence of fungal a ttack, that most likely could have decreased its performance. Depression in protein content at increas ing plant popula tion density had been corroborated in earlier s tudies (Simmonds, 1995). Mean daily weight gain by m ice feed on hybrids could be attributed to the increased concentration of lysine in them compared to the standard variety.
CONCLUSION
Significant varietal variability was observed on growth with increasing plant population density. However, KR 473 HL had more vigorous vegetative growth, with moderate reproductive growtll and reduced incidence of Fusarium attack. This could have
158
sugges ted its comparc1tively high yield with increasing plant population density. lnc reasin~; plc1nt popul<ltion de11S1lv r~..>Sult •d in a significant depression in protein content and an increase in lysine content. Mean daily weight gain of mice was more in hybrids than the standard variety, suggesting tl1ei.r high n utritional va lue.
. REFERENCES
Bja rnason, M. a.nd Vasal, S. K. 1992. Breeding of Quality protein maize (QPM). Pln11t Breed. Review, 9: 181 -216.
Gardner, F. P., Pearce, R. B. and Mitchell, R.
L. 1985. Physiology of crop plants. Iowa State University Press, USA. 478 pp.
Jacobs, B.]. and Pearson, C. J. 1991. Poten tial y ield of maize determined by rates of growth and development of ears. Field Crops Research, 2(27): 281-298.
Jeffrey, E. A., Gloverson, L. M., Brenda, G. H., Bruce, R. H. and Brian, A. L. 1995. Elongation fac tor 1a concenb·ation is highly correla ted with lysine content of maize endosperm. Proceedings of Na tional Academy of Science, USA, 95: 8640-8644.
Jose, A. L., Bryan, C. G., David, R. H. and Brian, A. K. 2004. Cytoskeletal proteins are coordinately increased in maize genotype witll high level of eEFiA. Plmt t Plzysiology, 135 (3): 1784 - 1797.
Kasperbauer, M. J. and Karlen, D. C. 1994.
Plant spacing and reflected far-red light effects on phytochrome regulated photosynthate allocation in corn seedling. Crop Science, 6(34): 1564-1569.
Kniep, K. R. and Mason, S. C. 1991. Lysine and protein content of normal and opaque-2 maize grain as influenced by irrigation and nitrogen. Crop Scie11ce, 1(31): 177-181.

Agronomic Performdnce dnd Qua lity Profile of Hybrid Maize
Landry, J., Delhayc, S. and Damerval, C.
200:2. Fffl'ct of tlw opaque-:2 gene on accumulation of protem fraction m maize endosperm. Maydicn, 47: 59-66.
Lemcoff, J. A. and Loomis, R. S. 1994. Ni trogen and density influences on s ilk emergence, endosperm development and g rain yield of maize (Zenlllfl!JS L.). Field Crops Rcsearclr, l(38): 63 -72.
Prasam1a, B. M., Vasal, S. K., Kassahun, 13.
and Singh, N. N. 2001. Quali ty protein maize. Cum:ul scicllce, 81(10): 1308-1310.
Salamini, F. and Soave, C. 1982 Ma ize for Biological Resea rch, ed. Sheridan W.F., Univers ity of North Dakota Press, p. 155-160.
Sangoi, L. 2000. Understanding p lant densities effects on maize g rowth and development: an im portant issue to maximise grain yield. Cicncia Rum/, 31: 159-168.
Sangoi, L. and Salvado r, R. ]. 1998. Influence of p lan t height and leaf number on ma ize production at high population densities. Pesquisn Agropecuarin Bmsileim, 3(33): 297 -306.
Simmonds, N. W. 1995. The relation between yield and protein in cereal grain. joumnl of Science of Food nud Agricultural Scieuce, 67:431 -437.
159
Tollenaar, M. and Daynard, T. B. 1978. Leaf senescence in short season maize hybrids Cnnndrmr ]oumnl of Plnnf Screnccs, 3(58): 869-874.
Vahid, G., Mohammad, J, R. , Mohammad, S. T. and Abbas, K. 2012. Yield and yield components of corn (Zca mays L.) in response to fo liar application with indole butyric acid and g ibberellic acid. AmcricnnEumsinn joumnl of AgriClllturc 1111d
EuvirOIIIIICII tnl Sciwces, 12(9): 1246-1251.
Wallace, D. H. and Yan, W. 1998 Plant Breeding and Whole-System Crop Physiology: Improving adaptation, maturity and yield. UK: Cab Internationa l, Wallingford, Oxon OX 10 8DE. 390 pp.
Warren, H. L. 1978. Comparison of normal and high lys i..nc maize i.nbreds for resistance to kernel rot caused by Fusarium monilifonne. Plrytopntlrology, 68: 1331.
Wilson, J. H. and Allison, J. C. S. 1979. Effect of plant popu lation on ea r differentiation and growth in maize. A111rnls of Applied Biology, 1(90): 127-132.
Yau, J. C., 13ockhalt, A j., Smith, ]. D., Rooney, L. W. and Waniska, R. D. 1999. Maize endosperm protein that contribute to endosperm lysine content. Ccrenls Che111istry, 76: 668-672.

Journal of Applied Agricultural Research 2013, 5(2): 161-168 ISSN 2006-750X © Agricultural Research Council of Ntgena, 2013
EFFECf OF NATIVE CASSAVA STARCH HYDROGEL AMENDED SOIL ON MAIZE (Zea mays L.) PERFORMANCE
*Ekebafe, L. 0., Ogbeifun, D. E.l and F. E. Okieimenl *Department of Polymer Technology, Auchi Polytechnic, P.M. B. 13, Auchi, Nigeria
1Centre for Biomaterials Research, University of Benin, P.M.B 1154, Benin City, Nigeria. *[email protected], +2348029320114
ABSTRACT
Hydrolyzed graft copolymers of cassava starch and acrylonitrile were synthesized in aqueous solution using eerie ammonium ion as the initiator. Soil samples collected from farm site were prepared and analyzed for physico-chemical properties using standard techniques. The physico-chemical properties of the hydrogel - soil mixture (3.0, 6.0, 9.0, 12.0 g/2 kg soil) samples in which maize seedlings had been planted were measured as a function of hydrogel loading and compared with the values obtained in the control in which hydrogel was not added. The hydrogel treatment showed significant (P<O.OS) increase in plant height, s tem diameter, leaf area, and biomass accumulation. The optimum application of the hydrogel in the study was the 12 g/2 kg soil which resulted in greater progressive increase in the growth of the maize seedlings over the other lower rates.
Keywords: hydrogel, soil, cassava starch, acrylonitrile, maize.
INTRODUCTION
During the 20th century, the main emphasis of agricultural development all over the world was to increase crop productivity per unit area of land in order to feed the everincreasing population. This was accomplished through over exploitation of natural resources su ch as water and plant resources and excessive use of fertilizers and pesticides. Although the intervention resulted in considerable increase in crop yields in the short-term, they were n ot sustainable in the long-run (Yazdani et al., 2007). The productive capacity of some arable land had been imparred permanently; the natural water resources were depleted and also polluted with hazardous pesticides and chemicals from fertilizers which threatened the survival and well being of all life. The emphasis of agriculture development in the present century has shifted to su stainable maximization of land
161
and water utilization without threatening the environment and the natural resources in view of the climate change effect (Bhat et al., 2009).
The continued threat to the world's land resources is exacerbated by the need to reduce poverty, climate change and unsustainable farming practices. Climate change is predicted to worsen the incidence of drought and desertification in subSaharan Africa in few years to come (Okorie, 2003). During the last decade, food security was not a global priority, but s tudies such as the 2020 Vision (FAO, 1996) have shown that food security is one of the mairl global concerns in this century. Food security cannot be guaranteed unless the issue of soil erosion, drought, desertification, and soil water management are given due consideration. Super-absorbent polymer hy drogels have a critical role to play here, particularly in developing countries. '
i:.kebafe eta/., 2013
Su per-abso rbent polymers (SAPs) or hydrogels arc loosely cross -linked, threedimensiOnal networks ot flexible pol) mer chains that carry dissociated, ionic functional groups. They a re basically the materia ls that can absorb fluids of greater than 15 times their own dry weight, e ither under load or without load, such as water, electrolyte solu tion, synthetic urine, brines, biological fluids such as urine, sweat and blood (Zohuriaan-Mehr and Kourosh, 2008).
Sandy soils are coarse-textured, light and are easier to till; they drain better and warm up fas ter. Crop production on sandy soil, therefore, requires frequent irrigation to make up for its poor water retention capacity. Thus, the idea of applying hydrogel is to increase the water retention capacity of the soil so as to reduce the frequency of irrigation and its cost implication.
Relatively few or no data are available in the literature on the effect of hydrogel on the growth responses of crops in developing countries. The present communication describes the investigation of the effect of cassava starch-g-P (AN) hydrogel on growth responses of maize by varying the loading concentration of the hydrogel.
MATERIALS AND METHODS
Acrylonitrile (AN) used was supplied by B.D.H. as reagent grade and was dis tilled under reduced pressure and stored in the dark at SoC before use. Cassava starch was sourced from a local cassava starch processing factory in Benin City, Nigeria. The soil sample (0-15 em) was collected from a farm site at Auchi Polytechnic campus on latitude 06.49°N and longitude 06.07°E with the aid of an auger. It was air dried at room temperature for two weeks, sieved using 2 mm sieve and analyzed for its physicochemical properties. Maize grains were purchased from a local market in Auchi. Analar grade Cerium ammonium nitrate was
162
obtained from British Drugs House, Poole, England
Characterization of the soil
Bulk density was measured by core method, (Grossman and Reinsch, 2002). Soil pH was measured in 1:1 soil-water ratio (Hendershot et al., 1993). Soil organic carbon was estima ted by combustion at 840°C (Wang, and Anderson, 1998), while total nitrogen was obtained by microkjeldahl method. Cation exchange capacity was measured using ammonium acetate leaching at pH 7.0 (Rhoades, 1982). Available phosphorus was determined by Olsen method (Emteryd, 1989) and soil heavy metal content was determined using the AAS.
Synthesis of the hydrogel
The preparation procedure of the hydrogel was based on the method described by Pourjavadi et al. (2007).
Soil- Hydrogel mixing procedure
Measured quantities of the hydrogel (0, 3.0, 6.0, 9.0, 12.0 g) were thoroughly mixed with 2 kg of soil each and designated as Wt, W2, to Ws, placed in five-liter polyethylene containers. Two maize grains were planted in the center of each container. The soil was irrigated with water and the volume of water required to saturate the soil to field capacity was recorded. Subsequent irrigations were applied at two weeks interval, the amount of water required to attain field capacity was recorded. Moisture content of the soil was determined by oven-drying aliquots of the soil at llOoC.
Experimental conditions / phenological measurements
The experiment was conducted for three months in an evaporatively cooled greenhouse. The indoor temperature during

Effect of Native Cassava Starch Amended Soil on Maize Performance
the initial phase of the experiment (November/December 2010) was warm with average maximum and minimum temperatures ranging between 33- 42DC and 28 - 320C, respectively. The conditions became slightly moderate in January/ February, 2011.
In all, 5 treatments per set (Hydroget 4 concentrations and one control) were replicated three times and arranged in complete randomized block design with five containers per h·eatment.
Determinations of plant growth (plant height s tem diameter, leaf area, grain yield and biomass) were carried out at physiological maturity. Relative water content (RWC) of leaves was measured on fully expanded leaves at 2 weeks after sowing (WAS). Leaves were cut and collected at midday to determine fresh weight (FW). Leaf blades were then placed with their cut end pointing down into a tube containing about 15 ml of 1 rnM CaCh. The CaCh was used to increase leaf cell integrity, with the aim of reducing cell lysis due to excessive rehydration. The turgid weight (TW) was then recorded after overnight rehy dration at 4°C. For dry weight (OW) determination, samples were oven-dried at
Table 1: Characterization of the soil
Analytical characteristics Particle size distribu tion (%)
pH Bulk Density(g/ cm3) Soil organic carbon, g/kg Total N itrogen, g/kg Cation exchange capacity,m g/ kg Available Phosphorus, mg/kg Sodium conten t, mg/kg Potassium content, m g/kg Magnesium content, mg/kg Calcium content, mg/kg Lead (mg/Kg) Cadm ium (mg/Kg) Arsenic ( mg/ Kg) Coppe r (mg/Kg) Total acidity
NO - Not Detected
163
70°C for 48 hr. Relative water content was calculated according to Schonfeld et a/ (1988), thus:
RWC (%) = [(FW- DW) I (TW- DW)] X 100 ... (1)
Plant height was taken with 30cm ruler; leaf area was measured using grid meter and summed up to obtain the total leaf area. The stem diameter was measured with calipers. The number of grain per plant was counted from randomly selected plant and the (100) grain weight was calculated from randomly sampled grains after harvest. At maturity, a sample from each pot was harvested for grain yield and biomass determination after oven drying at 70°C for 72 h.
Grain quality determination
Dried samples were grounded and passed through a 1 rnrn sieve before analysis. Nitrogen content (%) was determined by the micro Kjeldhal method (AOAC 1990) and crude protein (CP) content was obtained by multiplying the micro Kjeldahl N values by 6.25. Starch and soluble sugar contents were also determined by official AOAC method (1990).
Results Clay 16.38 Silt 14.40
Sand 69.22 8.0 ± O.Ql
1.33 ± 0.02 0.544± 0.05
0.048 ± 0.002 286.02 ± 0.92 5.89 ± 0.150 7.18 ± 0.07 2.70±0.05
67.63 ± 0.25 208.51 ± 0.55 0.05 ± 0.001
ND ND
0.002 ± 0.0005 0.2 ± 0.001
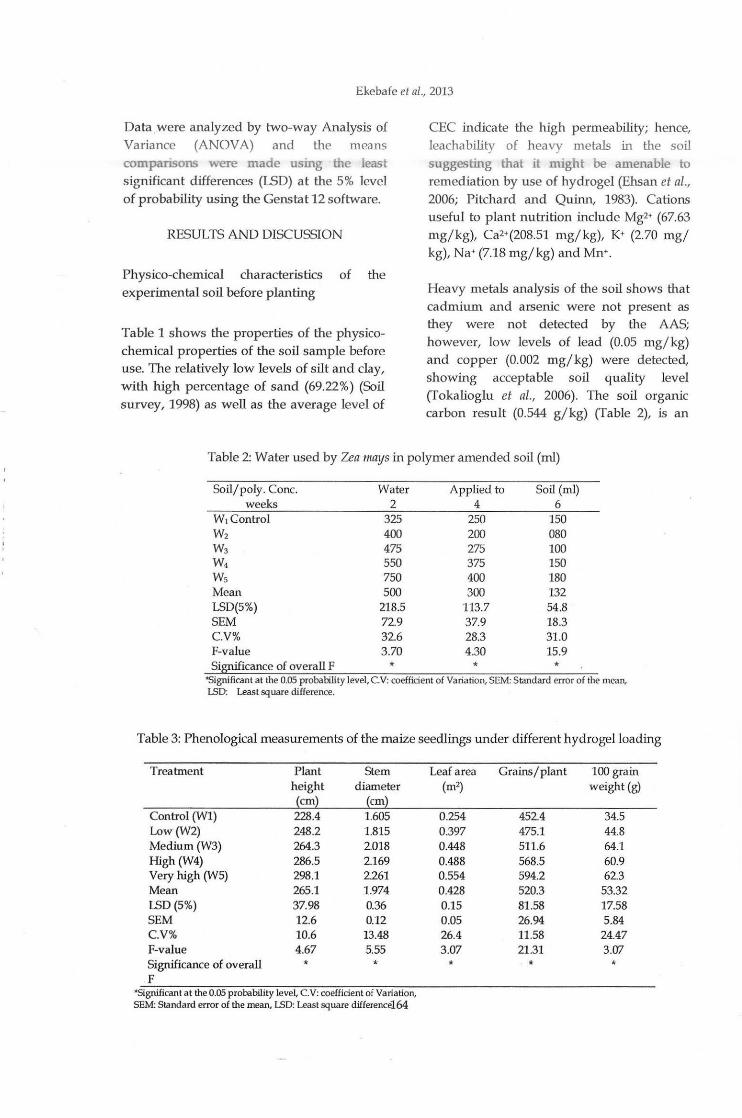
Ekebafe el al., 2013
Data .were analyzed by two-way Analysis of
Variance (ANOVA) and the means
compansons were made usmg the least significant differences (LSD) a t the 5% level
of probability using the Genstat 12 software.
RESULTS AND DISCUSSION
Physico-chemical characteristics of the
experimental soil before planting
Table 1 shows the properties of the physico
chemical properties of the soil sample before use. The relatively low levels of silt and clay,
with high percentage of sand (69.22%) (Soil survey, 1998) as well as the average level of
CEC indicate the high permeability; hence, leachability of heavy metals in the soil
suggesting that It mtght be amenable to
remediation by use of hydrogel (Ehsan et al., 2006; Pitchard and Quinn, 1983). Cations useful to plant nutrition include Mg2+ (67.63
mg/kg), Ca2+(208.51 mg/kg), K+ (2.70 mg/ kg), Na+ (7.18 mg/kg) and Mn+.
Heavy metals analysis of the soil shows tha t cadmium and arsenic were not present as they were not detected by the AAS; however, low levels of lead (0.05 mg/kg) and copper (0.002 mg/ kg) were detected,
showing acceptable soil quality level (Tokalioglu et al., 2006). The soil organic
carbon result (0.544 g/kg) (Table 2), is an
Table 2: Water used by Zea mays in polymer amended soil (ml)
Soil/poly. Cone. Water Applied to Soil (ml) weeks 2 4 6
W1 Control 325 250 150 w2 400 200 o8o w3 475 275 100 w4 550 375 150 Ws 750 400 180 Mean 500 300 132 LSD(5%) 218.5 113.7 54.8 SEM 72.9 37.9 18.3 C.V% 32.6 28.3 31.0 F-value 3.70 4.30 15.9 Significance of overall F * * *
"Significant at the 0.05 probability level, C.V: coefficient of Variation, SEM: Standard error of the mean, ISD: Least square difference.
Table 3: Phenological measurem ents of the maize seedlings under different hydrogel loading
Treatment Plant Stem Leaf area Grains/plant 100 grain height diameter (m2) weight (g)
Control (W1) 1.605 0.254 452.4 34.5 Low (W2) 248.2 1.815 0.397 475.1 44.8 Medium (W3) 264.3 2.018 0.448 511.6 64.1 High (W4) 286.5 2.169 0.488 568.5 60.9 Very high (W5) 298.1 2261 0.554 594.2 62.3 Mean 265.1 1.974 0.428 520.3 53.32 LSD (5%) 37.98 0.36 0.15 81.58 17.58 SEM 12.6 0.12 0.05 26.94 5.84 C.V% 10.6 13.48 26.4 11.58 24.47 F-value 4.67 5.55 3.07 21.31 3.07 Significance of overall * * * * * F
"Significant at the 0.05 probability level, C.V: coefficient of Variation, SEM: Standard error of the mean, lSD: Least square differenceJ.64
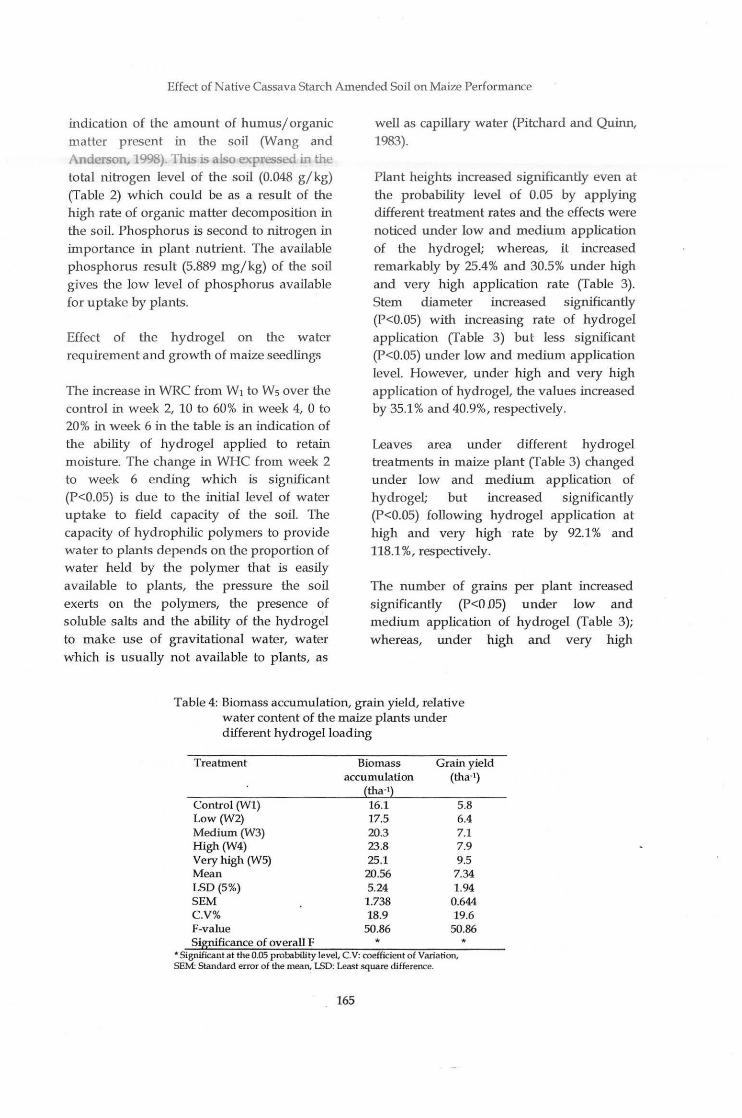
Effect of Native Cassava Starch Amended Soil on Maize Performance
indication of the amount of humus/ organic matter present in the soil (Wang and Anderson, 1Q98). 11us is also expressed m the total nitrogen level of the soil (0.048 g/kg) (Table 2) which could be as a result of the high rate of organic matter decomposition in the soil. Phosphorus is second to nitrogen in importance in plant nutrient. The available phosphorus result (5.889 mg/ kg) of the soil gives the low level of phosphorus available for uptake by plants.
Effect of the hydrogel on the water requirement and growth of maize seedlings
The increase in WRC from W1 toWs over the control in week 2, 10 to 60% in week 4, 0 to 20% in week 6 in the table is an indication of the ability of hydrogel applied to retain moisture. The change in WHC from week 2 to week 6 ending which is significant (P<0.05) is due to the initial level of water uptake to field capacity of the soil. The capacity of hydrophilic polymers to provide water to plants depends on the proportion of water held by the polymer that is easily available to plants, the pressure the soil exerts on the polymers, the presence of soluble salts and the ability of the hydrogel to make use of gravitational water, water which is usually not available to plants, as
well as capillary water (Pitchard and Quinn, 1983).
Plant heights increased significantly even at the probability level of 0.05 by applying different treatment rates and the effects were noticed under low and medium application of the hydrogel; whereas, it increased remarkably by 25.4% and 30.5% under high and very high application rate (Table 3). Stem diameter increased significantly (P<0.05) with increasing rate of hydrogel application (fable 3) but less significant (P<O.OS) under low and medium application level. However, under high and very high application of hydrogel, the values increased by 35.1% and 40.9%, respectively.
Leaves area under different hydrogel treatmen ts in maize plant (fable 3) changed under low and medium application of hydrogel; but increased significantly (P<0.05) following hy drogel application at high and very high rate by 92.1% and 118.1%, respectively.
The number of grains p er plant increased significantly (P<O.D5) u nder low and medium application of hydrogel (Table 3); whereas, under high and very high
Table 4: Biomass accumulation, grain yield, relative water content of the maize plants under d ifferent hydrogel loading
Treatment Biomass Grain yield accu mulation (tha·1)
tha·l Control (W1) 16.1 5.8 Low (W2) 17.5 6.4 Medium(W3) 20.3 7.1 High (W4) 23.8 7.9 Very high (W5) 25.1 9.5 Mean 20.56 7.34 LSD (5%) 5.24 1.94 SEM 1.738 0.644 C.V% 18.9 19.6 F-value 50.86 50.86 Significance of overall F * *
• Significant at the 0.05 probability level, C.V: coefficient of Variation, SEM Standard error of the mean, LSD: Least square difference.
165
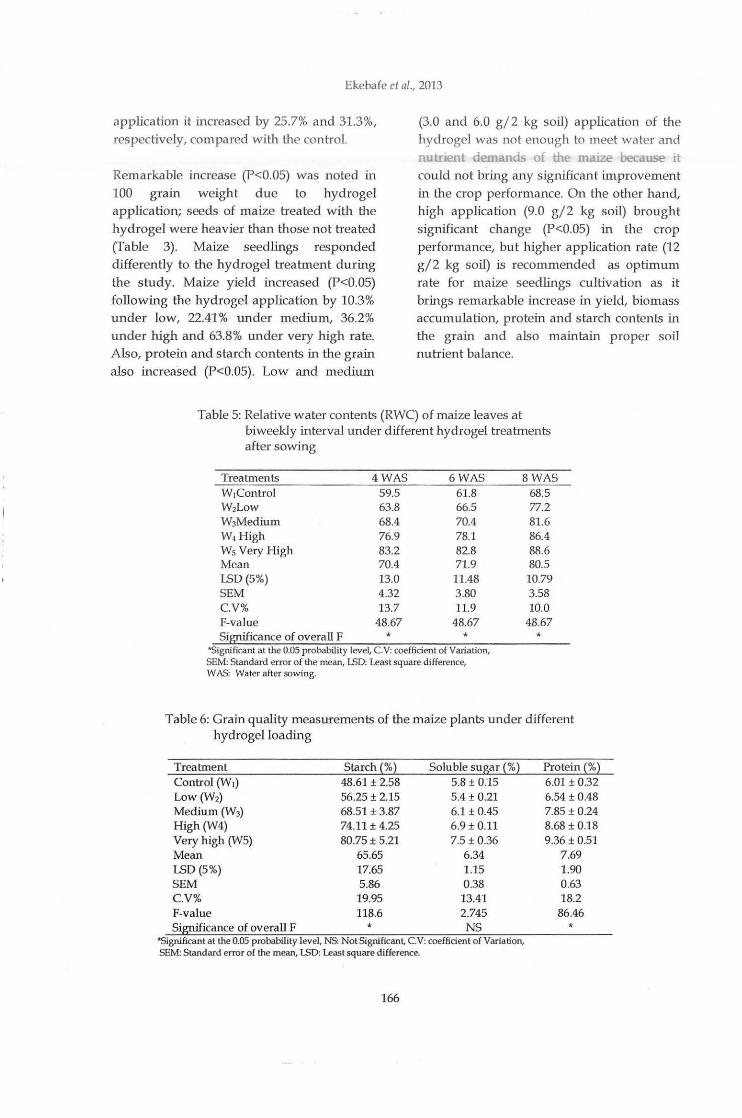
Ekebafe eta/., 2013
application it increased by 25.7% and 31.3%, respectively, compared with the control.
Remarkable increase (P<0.05) was noted in 100 grain weight due to hydrogel application; seeds of maize treated with the hydrogel were heavier than those not treated (fable 3). Maize seedlings responded differently to the hydrogel treatment during the study. Maize yield increased (P<0.05) following the hydrogel application by 10.3% under low, 22.41% under medium, 36.2% under high and 63.8% under very high rate. Also, protein and starch contents in the grain also increased (P<0.05) . Low and medium
(3.0 and 6.0 g/2 kg soil) application of the hydrogel was not enough to meet water and nutrient demanL.S o£ the matze because It
could not bring any significant improvement in the crop performance. On the other hand, high application (9.0 g/2 kg soil) brought significant change (P<0.05) in the crop performance, but higher application rate (12 g/2 kg soil) is recommended as optimum rate for maize seedlings cultivation as it brings remarkable increase in yield, biomass accumulation, protein and starch contents in the grain and also maintain proper soil nutrient balance.
Table 5: Relative water contents (RWC) of maize leaves at biweekly interval under different hydrogel treatments after sowing
Treatments 4WAS 6WAS 8WAS W1Control 59.5 61.8 68.5 W2Low 63.8 66.5 77.2 W3Medium 68.4 70.4 81.6 W4High 76.9 78.1 86.4 Ws Very High 83.2 82.8 88.6 Mean 70.4 71.9 80.5 LSD (5%) 13.0 11.48 10.79 SEM 4.32 3.80 3.58 C.V% 13.7 11.9 10.0 F-value 48.67 48.67 48.67 Significance of overaU F * * *
"Significant at the 0.05 probability level, C.V: coefficient of Variation, SEM: Standard error of the mean, ISO: Least square difference, WAS: Water after sowing.
Table 6: Grain quality measurements of the maize plants under different hydrogel loading
Treatment Starch(%) Soluble sugar(%) Protein(%) Control (W1) 48.61 ± 2.58 5.8 ± 0.15 6.01 ± 0.32 Low (W2) 56.25 ± 2.15 5.4 ± 0.21 6.54 ± 0.48 Medium(W3) 68.51 ± 3.87 6.1 ± 0.45 7.85 ± 0.24 High (W4) 74.11 ± 4.25 6.9± 0.11 8.68 ± 0.18 Very high (W5) 80.75± 5.21 7.5 ± 0.36 9.36 ± 0.51 Mean 65.65 6.34 7.69 LSD (5%) 17.65 1.15 1.90 SEM 5.86 0.38 0.63 C.V% 19.95 13.41 18.2 F-value 118.6 2.745 86.46 Significance of overall F * NS *
"Significant at the 0.05 probability level, NS: Not Significant, C.V: coefficient of Variation, SEM: Standard error of the mean, lSD: Least square difference.
166
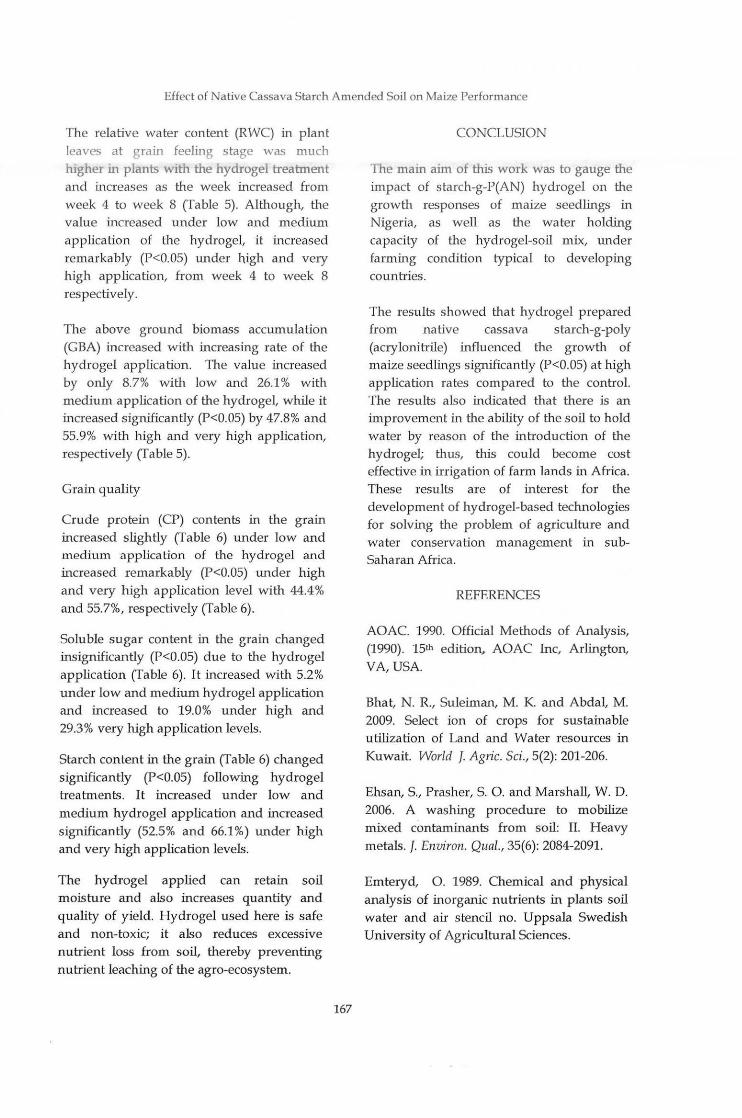
Effect of Native Cassava Starch Amended Soil on Maize Performance
The relative water content (RWC) in plant leaves at grain feeling stage was much higher in plants With the hydrogel treatment and increases as the week increased from week 4 to week 8 (Table 5). Although, the value increased under low and medium application of the hydrogel, it increased remarkably (P<O.OS) under high and very high application, from week 4 to week 8 respectively.
The above ground biomass accumulation (GBA) increased with increasing rate of the hydrogel application. The value increased by only 8.7% with low and 26.1% with medium application of the hydrogel, while it increased significantly (P<O.OS) by 47.8% and 55.9% with high and very high application, respectively (Table 5).
Grain quality
Crude protein (CP) contents in the grain increased slightly (Table 6) under low and m edium application of the hydrogel and increased remarkably (P<O.OS) under high and very high application level with 44.4% and 55.7%, respectively (Table 6).
Soluble sugar content in the grain changed insignificantly (P<0.05) due to the hydrogel application (Table 6). It increased with 5.2% under low and medium hydrogel application and increased to 19.0% under high and 29.3% very high application levels.
Starch content in the grain (Table 6) changed significantly (P<0.05) following hydrogel treatments. It increased under low and medium hydrogel application and increased significantly (52.5% and 66.1%) under high and very high application levels.
The hydrogel applied can retain soil moisture and also increases quantity and quality of yield. Hydrogel used here is safe and non-toxic; it also reduces excessive nutrient loss from soil, tl1ereby preventing nutrient leaching of the agro-ecosystem.
167
CONCLUSION
The mam arm of this work was to gauge the impact of starch-g-P(AN) hydrogel on the growth responses of maize seedlings in Nigeria, as well as the water holding capacity of the hydrogel-soil mix, under farming condition typical to developing countries.
The results sh owed that hydrogel prepared from native cassava starch-g-poly (acrylonitrile) influenced the growth of maize seedlings significantly (P<O.OS) at high application rates compared to the control. The results also indicated that there is an improvement in the ability of the soil to hold water by reason of the introduction of the hydrogel; thus, this could become cost effective in irrigation of farm lands in Africa. These results are of interest for the development of hydrogel-based technologies for solving the problem of agriculture and water conservation management in subSaharan Africa.
REFERENCES
AOAC. 1990. Official Methods of Analysis, (1990). 151h edition, AOAC Inc, Arlington, VA, USA.
Bhat, N. R., Suleiman, M. K. and Abdal, M. 2009. Select ion of crops for sustainable utilization of Land and Water resources in Kuwait. World J. Agric. Sci., 5(2): 201-206.
Ehsan, S., Prasher, S. 0. and Marshall, W. D. 2006. A washing procedure to mobilize mixed contaminants from soil: II. Heavy metals. J. Environ. Qual., 35(6): 2084-2091.
Emteryd, 0. 1989. Chemical and physical analysis of inorganic nutrients in plants soil water and air stencil no. Uppsala Swedish University of Agricultural Sciences.
Ekebafe el al., 2013
FAO. 1996. Reappraisal Approaches. Rome.
World Food Security: a of the Concepts and Duector Genera.s Report,.
Grossman, R. B., Ranches, T. G. 2002. Bulk Density and linear extensibility. In: Dane, J. H., Topp, G. C. (eds), Methods of soil analysis, Part 4: Physical methods. Soil Sci. Am. Book series No. 5 ASA and SSSA. Madison WT., 201-228.
Hendershot, W. H., Lalande, H. and Duqye~e, M. 1993. Soil reaction and exchangeable acidity in; carte M.R. (ED) Soil sampling and methods of analysis. Can. Soc. Soil sci. Lweis publisher London, 141-145.
Okorie, F. C. 2003. Studies on Drought in the Sub-Saharan Region of Nigeria using Satelite Remote Sensing and Precipitation Data; Department of Geography, of Lagos, Nigeria,
Pitchard James J. and Quinn James J. 19R::\. Terra-Sorb, A Water management Tool for World crop production. Industrial Services International, Inc.
Pourjavadi, A., Zohuriaan-Mehr, M. J., Ghaempoori, S. N. and Hossenzadh, H. 2007. Modified CMC. V. (2007) Synthesis and superswelling behaviour of hydrolysed CMC-g-P AN Hydrogel. J. Appl. Polym. Sci., 103: 877 - 883.
Rhoades, J. D. 1982. Cation Exchange Capacity. In; page A.l. Miller R.H. Keeney D.R. (eds) (1982); Methods of soil analysis, Part 2: American Soc. Agro. Madison W.I., 149-158.
168
Schonfeld, M. A., Johnson, R. C., Carver, B. F. and Mornhinweg, D. W. 1988. Water relations :n inter ·heat as drought resistance indicator. Crop Sci., 28: 526-531.
Soil Survey. 1998. Keys to Soil Taxonomy (8th. Ed.), (1998) USDA-NRCS, Center Technology Evaluation Report TE- 98-01: 37.
Tokalioglu, S., Kartal, S. and Gultekin, A. 2006. Investigation of heavy-metal uptake by vegetables growing in contaminated soils using the modified BCR sequential extraction.
Wang, D. and Anderson, D. W. 1998. Direct measurement of organic carbon content in soils by leco CR-12 carbon analyzer. Commun. Soil sci. plant Anal., 29: 15-21.
Yazdani, F., Allahdadi, I. and Abas Akbari G. 2007. Impact of superabsorbent polymer on Yield and Growth Analysis of Soybean (Glycine max L.) under drought stress condition. Pakistan f. Bio. Sci., 10(23): 4190-4196.
Zohuriaan-Mehr, M. J. and Kourosh, K. 2008. Superabsorbent Polymer Materials: A Review. Iranian Polymer J., 17(6): 451-477.

Journal of Applied Agricultural Research 2013, 5(2): 169-174 ISSN 2006-750X @Agricultural Research Council of Nigeria, 2013
EXTRACfiON AND CHARACfERIZA TION OF CHEMICAL COMPOUNDS IN COELAENOMENODERA ELAEIDIS MLK. (COLEOPTERA: CHRYSOMELIDAE)
Zhang, A.l, * Aisagbonhi, C. P, Anikwe, p, Obibuzor, J. U.2, Aneni, T. J.2 and C. 0. Ogbebor2
IUSDA-ARS, Plant Science Ins titute, Chemicals Affecting Insect Behaviour Laboratory, Beltsville, Maryland, USA
2Nigerian Institute for Oil Palm Research, Benin-City, Nigeria 3University of Lagos, Lagos, Nigeria *[email protected], +2348035522286
ABSTRACf
To elucidate the characterization of probable pheromone chemical compounds in Coelaenomenodera elaeidis Mlk., volatile samples were collec ted and subjected to gas chromatographic-mass spectrometric analyses. These compounds were contained in active fractions: Butylated hydroxytoluene (C1sH240); 4, 4' (P-phenylene) d: isopropyedene diphenol (C24H 260 2); Benzeethanol 1, 4-hyd roxy (CaHJoOl); heptacosane (C27H 56); Octacosane (C2sHss); Euricacid (C22~02); 1-Docosene (C22H44); 1-heptacosanal (C27H 560); Heptacosane (C27H 560); 17-pentatriacontane (C3sH7o); Benzenoatanol 4-hydroxyl (CsH1002); Tetracosane (C24Hso); Heneicosane (C21H44); Nonacosane; 9, 12-0 ctadecadienoic acid (C1sH320 2); Squalene (C30Hso); 1-Docosanol (C22a 60); Cholest-5-en-3-ol (C27a 60); and 9, 12-0ctadecad ienoic acid (22) (C1sH320 2); 7-5 methyl-6-heneicoseneII-one (C22a20). These compounds need to be further elucidated for their a ttractive effects on adult males and females of C. elaeidis.
Keywords: coelaenomenodera elaeidis, oil palm, pheromone compounds, characterization, spectrometric analyses
INTRODUCfiON
The success of oil palm cultivation mainly depends on efficient management of pests and diseases with a prime objective of "better crop for every farmer". Most of the areas within the oil palm belt of Nigeria usually experience C. elaeidis infestation. This attack could cause as much as 60-70% loss in Fresh Fruit Bunches (FFB) yield per annum. This single factor accounts for mos t of the yield gap between Nigeria and South East Asia where the yield of FFB could be as high as 30 tonnes per hectare per year, compared to the maximum of about 20 tonnes per hectare per year currently attainable in Nigeria. The most constructive control strategy is to plan suitable locally available, low-cost, long lasting IPM technologies
169
coupled with suitable farming practices to check the destructive effect of major pests on oil palm. Under normal conditions, oil palm cultivation is a very profitable venture. The yield of FFB mainly depends on several factors which include; pest and diseases, climatic conditions (amount, intensity, and duration of rainfall), topography, vegetation and soil characteristics. Considering the above factors, the study on sustainability of environmentally friendly pest control systems through integrated pest management to generate systematic research information on major pest control strategies, including cost effective and environmentally friendly packages with sustainable cropping system for maximum FFB yield, is of vital importance.

Zhang et al., 2013
The oil palm leaf miner, Coelaenomenodera e/aeidis Mlk. (Coleoptera: Ch1ysomelidae) is one of the most rmportant pests of oil palm in the West African Sub-region. It also, occasionally, attacks coconut palm. They mine longitudinal grooves under the upper epidermis of leaflets of all ages, except those of palms below three years old. A severely attacked field looks like a plantation that has recently suffered a fire outbreak. There has been estimated 40% yield loss in the two years following an outbreak (Agwu, 1981a). Agwu (1979, 1981b); Agwu et al. (1986) found pruning and heaping of affected fronds to decay on the floor of lhe plantation, in the rainy season of the year, an effective input in the integrated method of control of this devastating pest. Spraying with Evisec (thiocyclam) while being careful not to decimate the natural population of the predators; the Hymenopterans, Chalcid and Eulophid flies in the ecosystem has been recommended (Philippe, 1990). A census monitoring method, involving counting of adults and larvae on a leaf between 25 and 30 (lower fronds} with small and large larvae, pupae and adults being counted separately is presently adopted. Counting is done every three months when the number of larvae is below 10 and adults below 1, monthly when the numbers are 10- 20, and weekly if more than 20 and 30, respectively. When the later s tage is reached, treatment is considered necessary. There has been remarkable success recorded by Oehlschlager et al. {1993); Halett et al. (1995) {Simon Fraser University, British Columbia, Canada) in the development of Ethyl-4-methyloctanoate, the pheromone bait of On;ctes monoceros 01, and Rynolure, the bait of Rhynchopho-rus phoenicis Fabricius .. In the recent past the Simon Fraser University (SMU) group in Canada has identified p heromones of several species of Coleoptera. The insect species of previous interest have been grain beetles of the genera Cn;ptolestes, On;zaephilus, Oil Palm weevils, Rhynchophorus spp. and the Scarabid, On;ctes
170
monoceros and the timber beetles, De11droctonus spp., that each yielded aggregahon pheromones. Commercial mass trapping systems emerged from SMU work on several species and now form the basis of a stable business in Canada and Costa Rica. Aisagbonhi and Oehlschlager {2006) successfully mass-h·apped Oryctes monoceros on Coconut palms, and Rhynclwphorus phowicis Fabricius, on date palms in Nigeria. The use of pheromones has been insh·umental in increasing the effectiveness of both monitoring insect populations and in providing adequate information to enable implementation of cost-effective control (Hutchinson, 1998). Since the discovery of pheromones, a term first used by Karlson and Luscher (1959), a multiplicity of uses has been found for them involving monitoring and control although no significant applied use was achieved for monitoring until the mid-1970's (Lewes, 1975). Identification of the female-produced dogwood borer (Synanthedon scitula (Harris) sex pheromone (Zhang et al., 2005) resulted in the establishment of a more effective monitoring system (Leskey et al., 2006) and created opportunities to evaluate the potential of mass trapping and mating disruption for dogwood borer control (Leskey et al ., 2009). Zhang et al. {1994) identified the sex pheromone isolated from female Oriental beetle, Anomala orienta/is F. using gas chromatography-mass spectrometry (GCMS), along with flight-tunnel bioassays, to be a 96:4 to 88:12 mixture of (Z)-and (E)-7-
tetradecen-2-one. The double-bond position of the pheromone (monosaturated ketone) was determined by DMDS (dimethyl disulfide) derivatization and interpretation of the diagnostic ions in their mass spectra. Behaviour studies with male Oriental Beetle in the flight tunnel showed that 10 J.Lg of a 90:10 Z/E blend on a rubber septum was an a ttractive source. This integrated pest management system is based on the attraction of the adults to traps baited with attractive chemicals that the insects

Extraction and Characterization of Chemical Compounds in Coleoptera
themselves use to locate their food sources and their partners for the purpose of mating and colonization. The p rotocol for identification of the attractant chemicals is based on GC-mass spectromehy (GC-MS).
This study describes the extraction and isolation of the sex pheromone compounds of the Coelaenomenodera elaeidis.
MATERIALS AND METHODS
Collection of data
The leaf miner adults were collected in the experimental field of Nigerian Institute for Oil Palm Research (NIFOR) Benin, Nigeria. They were collected into plastic containers fitted with a net to allow for ventilation and the insects were later transferred into a sleeve-on-net hung on oil palm fronds in the field. Oil palm leaflets were carefully tied into the sleeve-on -net to provide the insects suitable, natural environmental conditions. The Sleeve-on-Net containing 40 adult C. elaeidis were carefully transported to the laboratory in plastic buckets fitted with nets. The buckets were occasionally watered to
reduce stress or death to the insects while in transit. At the Zoology Deparhnent, University of Lagos, sexing was undertaken to separate male from the female C. elaeidis under Wide M3B stereo Microscope, using the presence or absence of ovipositors and body sizes. Ten pairs of C. elaeidis were placed in separate Petri-dishes and labelled.
Apparatus
Zhang et al. (1994) method of collection of volatiles of female sex pheromone of Oriental beetle, Anomala orientalis (Coleoptera:Scarabaeidae) was used. The aeration apparatus consisted of three-neck glass bottle (500 ml) filled with a wetted Kim
wipes tissue and connected to Super Q (200 mg each, Alltech Associates, Inc. Deerfield, Illinois) traps (15 em x 0.6 em OD). The air was filtered with charcoal (Activated Carbon, 6-14 mesh, Fisher Scientific) trap (7 em x 1 em OD) before being pulled through the apparatus with a vacuum pump. Flow rate was controlled at 1 L/min. The airborne volatiles were obtained by percolating the Super Q trap with a portion of diethylether.
Table 1: Isolates from female contact and soaked samples
*Female contact sample Benzeneethanol 1, 4-hydroxyl (CsHw02) Buly la ted hydroxytoluene (C1sH240) 1-Docosene (C22~4) Euricacid (C22~202)
Heptacosane (C21HS6) Heptacosane (C27H56) Heptacosane (C21HS6) Heptacosane (C27HS6) Heptacosane (C21HS6) 1-heptacosanal (C27Hs60) 1-heptacosanal (C27Hs60) Octacosane (C28Hss) Octacosane (C28Hss) Octacosane (C2sHss) Octacosane (C28Hss) 17-pentatriacontane (C3sH7o)
• Arranged according to number of carbon a toms
*Female soak sample
9, 12-0ctadecadienoic acid (C1sHJ202) 7-5 methyl-6-heneicosene-11-one (C22~20) Heptacosane (C21Hs6) Heptacosane (C21Hs6) Heptacosane (C21HS6) Cholest-5-en-3-ol (C27H460) 1-heptacosanol (C27H560) Octacosane (C28Hss) Octacosane (C28Hss) Squalene (C:J<Jfso) 17-pen tatriacontene (C3sH1o) 17-pentatriacontene (C3sH70)
171

Zhang et al., 2013
Aeration
The leaf miner adults were sorted mto males and females. Ten males were introduced into the aeration chamber. The chamber was securely covered with Teflon tape and the vacuum pump was connected and switched on. The set up was operated for 30 minutes and the Volatile Organic Compounds (VOC) adsorbed into the Super Q (Polymeric and heat labile). At the end of 30 minutes, the VOC were eluted from the super Q column with 2 ml of diethylether into a brown vial and securely covered.
Ambient temperature solvent extraction
Ten each of male and female C. elaeidis were respectively transferred with the aid of forceps into brown vials. Two millilitres of diethylether were added, covered and allowed to settle for 20 minutes. This dissolved and washed contaminants from the cuticle on the body of the insect. After
the 20 minutes, the solvent was decanted and another 2 ml of fresh solvent (dtethylether) was added into the respective vials, and allowed to stand for another 20 minutes. At the end of 20 minutes, the solvent was decanted into a vial and securely covered prior to GC-MS analysis of samples in the laboratory of the United States Department of Agriculture, Beltsville Agricultural Research Centre (BARC-West), West Beltsville, Baltimore, Maryland, U.S.A
RESULTS
The eluates (3J.Ll each sample) were made up of the following: Male aeration sample; female contact sample; male contact sample; male soak sample and female soak sample. Female contact sample had more compounds than the female soak sample (fable 1). Male contact sample had more compounds than male soak sample (Table 2). The male aeration sample had least number of compounds (fable 3).
Table 2: Isolates from male contact and soaked samples
•Male contact sample Benzeneethanoll, 4-hydroxyl (CsH10~)
Butylated hydroxytoluene (CtsH240) Heneicosane (C21H44) 1-Docosene (C22~) Euricacid (C22~2~) Tetracosane (C2Jfso) Heptacosane (Cvtls6) Heptacosane (CvH56) Heptacosane (Cvtls6) Heptacosane (Cvtls6) Octacosane (C~ss) Octacosane (C~ss) Nonacosane (C29llio)
*Arranged according 10 number of carbon atoms
*Male soak sample 9, 12-0ctadecadienoic acid (CtaHJ2~)
1-Docosanol (C22~60)
Heptacosane (CvH56) Heptacosane (CvH56) Heptacosane (Cvtls6) Heptacosane (CvH56) Cholest-5-en-3-ol (Cv~O) Octacosane (C28Hss) Octacosane (C~ss) Squalene (C:roliso)
Table 3: Isolates from male aeration sample_S:
*Male aeration sample Butylated hydroxytoluene (C tsH240) 4, 4' (P-phenylene) d: isopropyedene diphenol (C24H26~) *Arranged according to number of carbon atoms
172
Extraction arid Characterization of Chemical Compounds in Coleoptera
DISCUSSION
The female soak and contact samples were largely made up of similar compounds and could be extraneous matter (fable 1). The male soak and contact samples were also mostly similar compounds (fable 2). However, the presence of Nonacosane (C29H5o) is a distinguishing compound in the male contact sample. It could be inferred that aeration method is the most suitable for analysis as it contained less debris (Table 3) than the contact and soak sample methods utilized. With the aeration method, the insects were reusable and the method was, therefore, more sustainable. The various compounds (Table 3) so far identified in the samples need to be subjected to coupled gas chromatography and electroantennogram detection (GC-EAD) in order to determine which has attractive effect on adult C. elaeidis.
Sex pheromones are produced by the insects themselves and they are attractive to partners in very low levels {Chapman, 1973,
Richards and Davies, 1977a; Griepink, 1996). They are important for species survival as species-specific partners cannot be located without them. Development of resistance against sex pheromones, in contrast to con ventional pesticides, is considered unlikely. Chuman et al. (1989) isolated and identified 6, 12 - Dimethylpentadecan-2-one, a pheromonal compound produced by the banded cucumber beetle, Diabrotica balteata LeConte (Coleoptera: Chrysomelidae). They found that both the synthetically prepared racemic compound and the purified natural pheromone elicited responses by banded cucumber males in field tests, and thus Chuman et al. became the owner of the US Patent that first described the compound as a useful tool in monitoring and controlling this major agricultural pest. This compound is produced by members of the family, Chrysomelidae, to which C.elaeidis belongs (Richards and Davies, 1977b). However,
173
most insects of same family produce specific pheromonal compounds specific to their own individual species (Richards and Davies, 1977b). Thus different species within the same family very often produce different pheromones characteristic of their individual species.
CONCLUSION
In this study, these compounds identified in the GC-mass spectra analysis are the first report of chemical composition of volatiles of C. elaeidis. They need to be further elucidated for their attractive effects on adult males and females of C. elaeidis including electroantenographic studies.
ACKNOWLEDGEMENTS
We thank the Executive Director, NIFOR, for his support and permission to publish. The project was funded by the Agricultural Research Council of Nigeria, Competitive Agricultural Research Grant Scheme (CARGS) RFA 4 No.6. We acknowledge the collaborative linkage of ARCN/NIFOR/ USDA (United States Department of Agriculture) for the training on skills and techniques of chemical ecology, July 15 to August 15, 2011 in Beltsville Agricultural Research Centre (BARC-West), West Beltsville, Baltimore, Maryland, U.S.A.
REFERENCES
Agwu, S. I. 1981a. The effectiveness of leaf pruning in Controlling field population of Coelaenomenodera elaeidis. Journ. Nig. Inst. Oil Palm Res., 6: 59-64 ..
Agwu, S. I. 1981 b. A check list of Insects injurious to the oil palm in Nigeria. Journ. Nig. Inst. Oil Palm Res., 6: 65-69.
Aisagbonhi, C. I. and Oechlaschlager, A. C.
2006. Pheromone trapping of two major pests of palms in Nigeria. CORD, 22(1): 1-9.
Zhang et al., 2013
Chapman, R. F. 1973. The Insects. Structure and Function. The English Language Book Society and the English Universities Press Ltd., 818 pp.
Chuman, T., Guss, P. L., Doolittle, R. E., Mclaughlin, J. R. and Tumlinson, Ill, J. H. 1989. 6,12-Dimethylpentadecan-2-one and its use in Monitoring and Controlling the Banded Cucumber Beetle, Diabrotica balteata
Le Conte (Coleoptera: Chrysomelidae). United States Patent Number 4,871,537, Oct. 3, 1989.
Griepink, F. C. 1996. Analysis of the Sex pheromones of Symmetrischema tangolias and Scrobipalpuloides absoluta. 132 pp.
H allet, R. H., Prez, A. L., Gries, G., Gries R.,
Pierce, H. D., Yue, J., Oehlschlager, A.C.,
Gonzalez L. M. and Borden, J. H. 1995. Aggregation pheromone of coconut rhinoceros beetle, Oryctes rhinoceros (1) (Coleoptera:Scarabaeidae). J.Chem £col., 21: 1549-1570.
Hutchinson, R. 1998. The role of pheromones in the control and monitoring of p ests. Insect attack, p. 1-6.
Karlson, P. and LUscher, M. 1959. Pheromones: a new term for a class of biologically active substances. Nature, 183 (4653): 55-56.
Leskey, T. C., Bergh, j . C., Walgenbach, J. F. and Zhang, A. 2006. Attractiveness and Specificity of pheromone-baited haps for male dogwood borer, Synanthedan scitula
(Harris) (Lepidoptera: Sesiidae). Environ.
Entomol., 35: 268-275.
Leskey, T. C., Ber~h, J. C., Walgenbach, J. F. and Zhang, A. 2009. Evaluation of Pheromonal based management strategies for dogwood borer (Lepidoptera:Sesiidae) in commercial apple orchards. f. £con. Entomol.,
102: 108.5-1093.
174
Lewes, T. 1975. Feasibility of using pheromone monitoring traps. Awt. Appl. Bioi., 80: 257-274.
Oehlschlager, A. C., Chinchilla, C. M., Gonzalez, L. M., Jiron, L. F., Mexzon, R. and Morgan, B. 1993. Development of pheromone - based trapping system for Ryhnchophorus palmarum (Coleoptera:Curculionidae). f. Econ. Entomol.,
86, 1381-1392.
Philippe, R. 1990. Study of Evisec S action on Coelaenomenodera minuln (Coleoptera: Chrysomelidae:Hispinae). Oleagineux, 45(4): 157-163.
Richards, 0. W. and Davies, R. G. 1977a. Imm's General Textbook of Entomology. Tenth Edition. Volume 1: Structure, Physiology and Development. London Chapman and Hall, 418 pp.
Richards, 0. W. and Davies, R. G. 1977b. Imm's General Textbook of Entomology. Tenth Edition. Volume II: Classificallon and Biology. London Chapman and Hall, 1354
pp.
Zhang, A., Facundo, H. T., Robbins, P. S., Linn, C. E., Hanula, J. L., Villani, M. G. and Roelofs, W. L. 1994. Identification and synthesis of female sex pheromone of Oriental beetle, Anomala orienta/is
Coleoptera: Scarabaeidae). ]. Chem. Ecol., 20: 2415-2427.
Zhang, A., Leskey, T. C., Bergh, J. C. and Walgenbach, J. F. 2005. Sex pheromone of the Dogwood borer, Synanthedon Scitula. ]. Chem.
Ecol., 31: 2463-2479.
Journal of Applied Agricultural Research 2013, 5(2): 175-184 ISSN 2006-750X ©Agricultural Research Council of Nigeria, 2013
PERFORMANCE OF SWEET ORANGE (CITRUS SINENSIS (L .) OSBECK) VARIETIES IN IBADAN: HUMID ZONE OF SOUTH-WESTERN NIGERIA
*Oianiyan, A. A., Babalola, S. 0., Amih, C. A. and J. A. Kolade Citrus Programme, National Horticultural Research Institute
P.M. B. 5432, Jericho, Idi-Ishin lbadan, Oyo State, Nigeria. *[email protected], +2348023327486
ABSTRACT
Sweet orange (Citrus sinensis (L.) Osbeck) varieties constitute more than 90% of citrus production in Nigeria. Many of the varieties that constitute the production figure behave differently under different ecology. This study aimed to select sweet orange varieties that are suitable for production in the Humid Zone of South-western Nigeria. Twelve sweet orange varieties budded on Cleopatra mandarin rootstocks were transplanted to the field in 1977 at a spacing of 7 m x 7 m in a randomized complete block design. Data were collected on tree growth, fruit yield and quality for a period of twenty-e ight years (1977-2004). The study revealed that all the sweet orange varieties continued to increase in growth attributes. In terms of plant survival, Agege 1, Valencia, Bende and Lue-gimgong had all their twelve s tands initially planted retained while Carter navel and Washington navel recorded four and two stands, respectively, twenty-eight years after transplanting. Washington navel had the highest average fruit weight of 278.14 g and Parson Brown the least with 137.42 g. Umudike had the highest average fruit yield of 46.02 t/ha and Washington navel the lowest w ith 17.05 t/ ha over four-year period . Luegim-gong showed the best yield efficiency of 5.38 ke fruit/m3. Juice content varied between 11.24-55.70%, Washington navel recorded the least and Meran the highest; however, the highest Brix/ Acid ratio of 19.15% was recorded for Washington navel. The following sweet orange varieties ranked best in this order: Bende, Agege 1 and Umud ike tied for the second position; they are local land races. Lue-gim-gong an exot ic variety came fourth. Washington and Carter navels were less preferred in th is s tudy.
Keywords: sweet orange, performance, fruit quality, Humid zone
INTRODUCTION
Citrus (Citrus spp) is one of the most important cultivated fruit crops in Nigeria because of its various uses and the land area of the country m ajorly falls within the citrus production belt of the world, latitude 40°
north and south of the Equator (Larry, 1999).
Production of citrus in Nigeria started in 1850 (Adigtm, 1992). Nigerian environment favoured citrus production and in 1932 -:
1934, the country exported sweet orange fruits to United Kingdom (Adigtm, 1992).
Citrus has been reported to surpass all other
175
fruit tree crops in terms of fruit juice processing because of its many varieties and suitability for processing into concentrated juice and squash (David, 1986; Olaniyan, 2009). The awareness of the health benefits in consumption of citrus fruit products and the need to conserve foreign exchange earnings has led to increase in citrus production and prdcessing in Nigeria. Adigun (1977)
reported the qualities of five local land races in Nigeria; also Kolade and Olaniyan (1998)
reported yield qualities of twelve sweet orange cultivars in south-western Nigeria. Data reported was for 7-12 years old
Olaniyan et al., 2013
planting (1985-1989). Citrus life expectancy varied depending on the environment and cultivars and ranges between 25-200 years (Davies and Albrigo, 1994; Aubert and Vullin, 1998; Larry, 1999). All the authors agreed that citrus trees in Mediterranean and sub-humid climates live longer than those in tropical environment.
Nigeria has about six different ecological zones from the rain forest to the Sahel Sudan ecology. This situation has led to two different types of rootstock used in Nigeria; Cleopatra mandarin for the humid zone and rough lemon for the drier areas (Kolade et al., 1997; Kolade and Olaniyan, 1998). The planting of citrus in the different ecological zones has been by chance without recourse to adaptability, yield and fruit quality which determine the end use.
The purpose of this study was to give account of productivity of twelve sweet orange varieties over twenty-eight years in humid environment of south-western Nigeria and make recommendations.
MATERIALS AND METHODS
The experimental site was at the National Horticultural Research Institute (NIHORT), Ibadan, Nigeria. The site lies between longitude 3o5Q' and 3o5' East and latitude 7o23' and 7°25' North. The soils in the area belong to the main soil series of Egbeda, Olorunda, Iwo, Makun, Etioni and Iregun (Smyth and Montgomery, 1962). They are also classified as Alfisols (Soil Survey Staff, 1990) and Lixisols (FAO/UNESCO, 1986). The terrain is fairly flat and the slope is less than 8%. The elevation of the site is between 150 - 200 m above sea level. The wet season with high rainfall is from April to October and the dry season with low rainfall is from December to February with annual rainfall of 1280 mm. The temperature is high with slight variations throughout the year. The maximum temperature range is about 27.9-
176
34.7<>C and minimum temperature is about 20.0 - 22.8<>C. There is a wide range in temperature during the harmattan between December and February with relatively cold late evenings and early mornings and exceptionally hot afternoon. Relative humidity of the area is fairly high and ranges from 73- 87%,38-47% and 83-95% at 0900 h, 1500 h and 2100 h, respectively.
Twelve sweet orange (Citrus sinensis (L.) Osbeck) varieties earlier raised in the nursery on cleopatra mandarin (Citrus reticulata Blanco) rootstock were transplanted to the field in June 1977, at a spacing of 7 m x 7 m (204 plants/ha). Seven of the varieties budwood were collected from Florida in United States of America; they are: Pineapple, Parson brown, Hamlin, Washington navel, Carter navel, Valencia and Lue-gim-gong and five local land races which include: Agege 1, Etinan, Meran, Bende and Umudike. Each plot consisted of three trees per variety and replicated four times, the experimental design was a randomized complete block.
The trees were irrigated during the first five years of planting using overhead sprinklers during the dry season. The field was tractor slashed and the under canopy manually ring weeded. Fertilizer application started second year after planting, application for 2-4 year old trees was 500 g/tree of 15-15-15 N:P:K fertilizer, 5 - 10 years 2 kg of N:P:K (15-15-15) + 600 g K20 per tree, above 10 years, it was 3 kg of N:P:K (15-15-15) compound fertilizer + 800 g K20. The application was done twice annually; May / June and September/October. The fertilizer application was discontinued in 1993 due to logistic reasons. There was routine spraying against insect pests to prevent leaf and fruit damage of citrus by scale insects, leaf miner, fruit piercing moths and aphids using Cypermethrin (cymbush 10EC) or sherpaplus. Also, physical removal of parasitic mistletoe (Louranthus Spp) and
Performance of Sweet Orange Varieties in Ibadan
epiphytic orchid on the citrus trees was carried out.
Growth data of plant height, canopy diameter/spread, tree girth measurement below and above bud union were measured in December of every year after fruit harvest when the growth for the current year should have ceased. Canopy volume was calculated using the formula developed by Castle (1983), 0.54HD2 where H and D indicate height and diameter, respectively. Fruit were mainly harvested in November/December (major season); however, there was minor crop harvested in April/May in some years. Total fruits harvested from each tree were weighed and added together at the end of each year to express the yield by weight. The fruit yields of the same varieties were pooled together and the average fruit weight was calculated .
Yield efficiency was calculated using the formula,
Yield efficiency = Fruit weight/tree (kg/mJ) Total canopy volume
(Castle, 1983).
The fruit physico-chemical properties were determined in January /February of the following year us ing fruit samples left on the trees. Twenty fruit samples for each variety were used. Volume of juice was determined using fruit weight of 1.3 kg; volume of juice extracted was obtained using a graduated measuring cylinder. Titratable acidity was determined by titrating 10 mis of juice with 0.1N NaOH using a drop of phenolphthalein as indicator and the result was expressed as percentage citric acid. Total soluble solids of juke from fruits was read on a temperature controlled hand held refractometer (model Atago 1140} and expressed in degree brix or percentages. Vitamin C and pH were determined by the methods described by Kimball (1W1), Brix to Acid ratio was a ratio of the values. Means were calculated and
177
data analyzed using analysis of variance and means separated by Duncan Multiple Range Test (DMRT) at 5% probability level using SAS version 9.1 procedures.
Ranking: Positions were assigned to the mean of the 12 varieties on how they performed on top five fruit qualities sampled. The mean position of the five qualities for each of the varieties was calculated by dividing by five and position assigned in increasing order.
RESULTS AND DISCUSSION
Vegetative growth
There was annual increase in the growth attributes as the years progressed for all the sweet orange varieties twenty-eight years after transplanting. Washington navel had the highest height of 7.20 m and Bende, a local land race with 5.39 m, was the lowest (Table 1). None of the varieties recorded more than 50 em increase in height within the space of four years after 12 years of transplanting with the exception of Lue-gimgong (Table 1).
Stem girth below bud union was greater than stem girth above (Table 1) during the twenty-eight years of data collection. With this quality 'benc~ing' is unlikely to occur on all the sweet oranges planted on cleopatra mandarin rootstock. Washington navel had the highest stem gilth below and above 136.50 and 119.50 em, respectively, closely followed by Carter navel. Lue-gim-gong produced the lowest stem girth below and above with 93.08 and 81.67 em, respectively, closely followed by Bende (Table 1). Again, Washington navel recorded the widest canopy spread of 9;23 m closely followed by Carter navel while Lue-gim-gong produced the lowest canopy spread of 5.97 m (Table 2). Even though canopy spread of 7 m was provided, Washington navel, Carter navel, Umudike and Etinan exceeded the
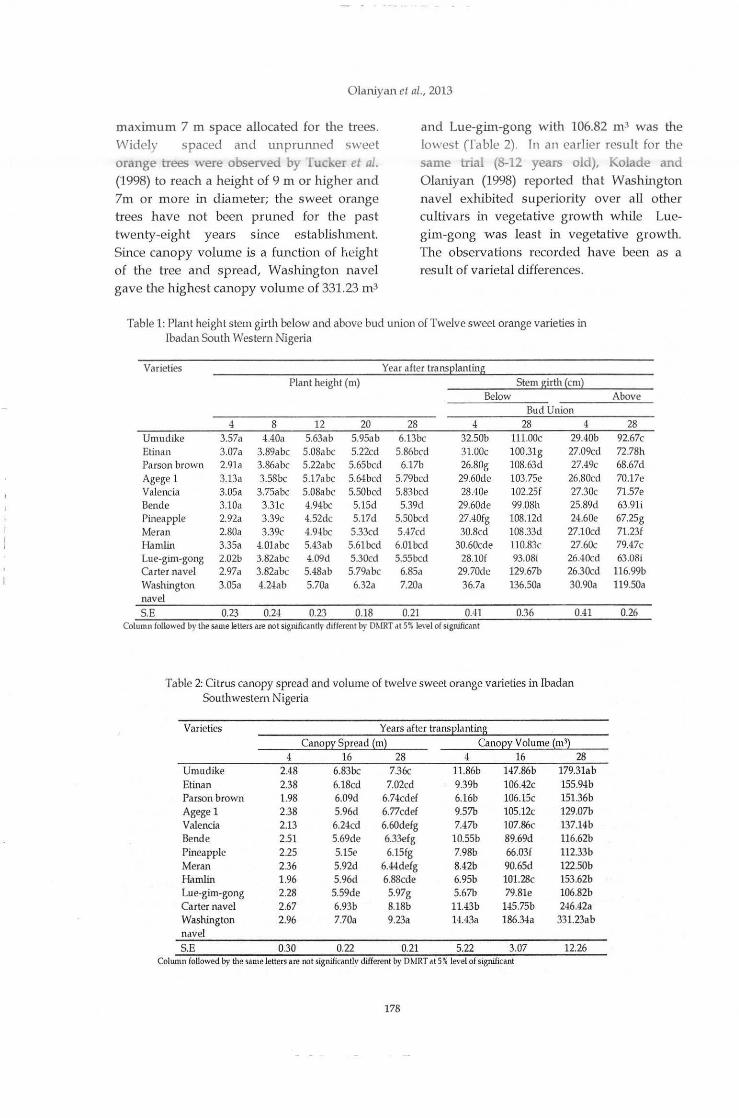
Olaniyan el al., 2013
maximum 7 m space allocated for the trees. Widely spaced and w1prunned sweet orange trees were observed by Tucker et al. (1998) to reach a height of 9 m or higher and 7m or more in diameter; the sweet orange trees have n ot been pruned for the past twenty-eight years since establishment. Since canopy volume is a function of height of the h·ee and spread, Washington navel gave the highest canopy volume of 331.23 m3
and Lue-gim-gong with 106.82 m3 was the lowest (Table 2). In an earlier result for the same trial (8-12 years old), Kolade and Olaniyan (1998) reported that Washington navel exhibited superiority over all other cultivars in vegetative growth while Luegim-gong was least in vegetative growth. The observations recorded have been as a result of varietal differences.
Table 1: Plant height stem girth below and above bud union of Twelve sweet orange varieties in Ibada.n South Western Nigeria
Varieties Year after trans2lanting Plant height (m) Stem girth {em)
Below Bud Union
4 8 12 20 28 4 28 4 Umudike 3.57a 4.40a 5.63ab 5.95ab 6.13bc 32.50b lll.OOc 29.40b Eti.nan 3.07a 3.89abc 5.08abc 5.22cd 5.86bcd 31.00c 100.31g 27.09cd Parson brown 2.91a 3.86abc 5.22abc 5.65bcd 6.17b 26.80g 108.63d 27.49c Agege 1 3.13a 3.58bc 5.17abc 5.64bcd 5.79bcd 29.60de 103.75e 26.80cd Valencia 3.05a 3.75abc 5.08abc 5.50bcd 5.83bcd 28.40e 102.25f 27.30c Bende 3.10a 3.31c 4.94bc 5.15d 5.39d 29.60de 99.08h 25.89d Pineapple 2.92a 3.39c 4.52dc 5.17d 5.50bcct 27.40fg 108.12d 24.60c Me ran 2.80a 3.39c 4.9-lbc 5.33cd 5.47cd 30.8cd 108.33d 27.10cd Hamlin 3.35a 4.01abc 5.43ab 5.61bcd 6.0lbcd 30.60cde 110.83c 27.60c Lue-gim-gong 2.02b 3.82abc 4.09d 5.30cd 5.55bcd 28.10f 93.08i 26.40cd Carter navel 2.97a 3.82abc 5.48ab 5.79abc 6.85a 29.70cle 129.67b 26.30cd Washington 3.05a 4.2-lab 5.70a 6.32a 7.20a 36.7a 136.50a 30.90a navel S.E 0.23 0.2-l 0.23 0.18 0.21 0.41 0.36 0.41
Column followed b)• the same letters are not significantly different by miRT at 5% lewl of significant
Table 2: Citrus canopy spread and volume of twelve sweet orange varieties in Ibadan Southwestern Nigeria
Varieties Years after transplanting Cano2y S2read (m) Cano2y Volume {ml)
4 16 28 4 16 28 Umudike 2.48 6.83bc 7.36c 11.86b 147.86b 179.31ab Etinan 2.38 6.18cd 7.02cct 9.39b 106.42c 155.9-lb Parson brown 1.98 6.09d 6.74cdef 6.16b 106.15c 151.36b Agege 1 2.38 5.96ct 6.77cdef 9.57b 105.12c 129.07b Valencia 2.13 6.24cd 6.60defg 7.-l7b 107.86c 137.14b Bende 2.51 5.69de 6.33efg 10.55b 89.69d 116.62b Pineapple 2.25 5.15e 6.15fg 7.98b 66.03f 112.33b Mer an 2.36 5.92d 6.44defg 8.42b 90.65d 122.50b Hamlin 1.96 5.96ct 6.88cde 6.95b 101.28c 153.62b Lue-gim-gong 2.28 5.59de 5.97g 5.67b 79.8le 106.82b Carter navel 2.67 6.93b 8.18b 11.43b 145.75b 2-!6.42a Washington 2.96 7.70a 9.23a 14.43a 186.34a 331.23ab navel S.E 0.30 0.22 0.21 5.22 3.07 12.26
Column followed by the same letters are not significantly different by D~lRT ,, t 5% level of significant
178
Above
28 92.67c 72.78h 68.67d 70.17e 71.57e 63.91i 67.25g 71.23£ 79.47c 63.08i
116.99b 119.50a
0.26
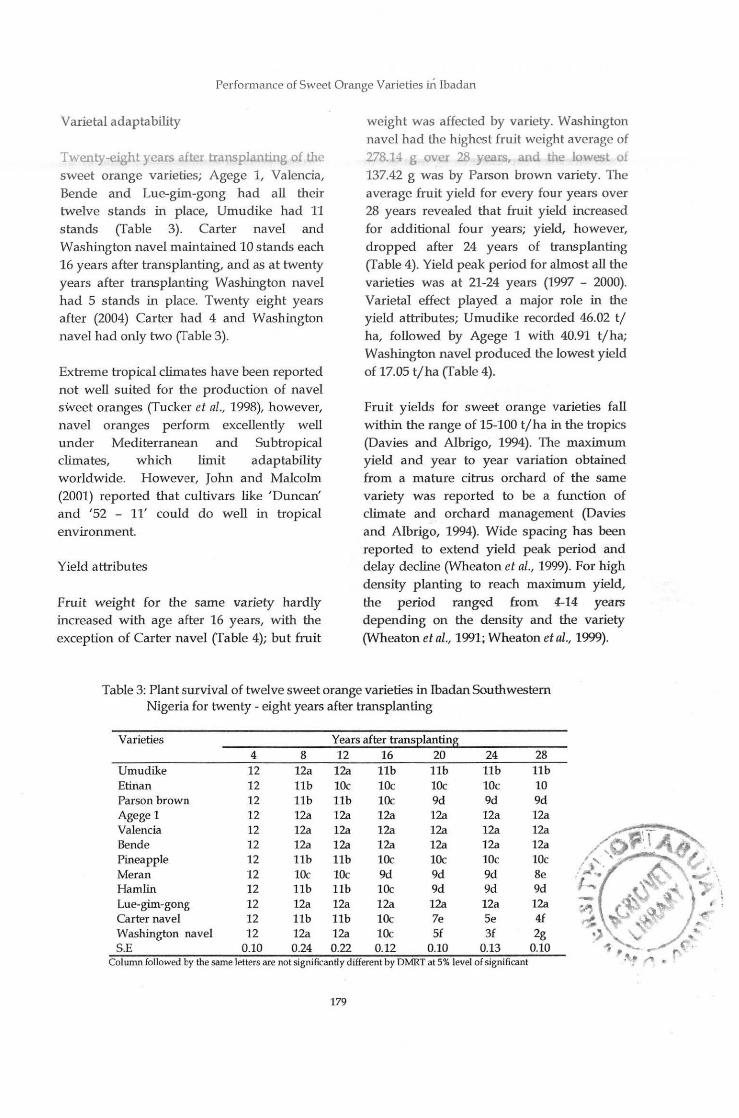
Performance of Sweet Orange Varieties in Ibadan
Varietal adaptability
Twenty-eight years after transplanting of the sweet orange v arieties; Agege 1, Valencia, Bende and Lue-gim-gong had all their twelve stands in place, Umudike had 11 stands (Table 3). Carter navel and Washington navel maintained 10 stands each 16 years after transplanting, and as at twenty years after transplanting Washington navel had 5 stands in place. Twenty eight years after (2004) Carter had 4 and Washington navel had only two (Table 3).
Extreme tropical climates have been reported not well suited for the production of navel sweet oranges (Tucker et al., 1998), however, navel oranges perform excellently well under Mediterranean and Subtropical climates, which limit adaptability worldwide. However, John and Malcolm (2001) reported that cultivars like 'Duncan' and '52 - 11' could do well in tropical environment.
Yield attributes
Fruit weight for the same variety hardly increased with age after 16 years, with the exception of Carter navel (Table 4); but fruit
weight was affected by variety. Washington navel had the highest fruit weight average of 278.14 g over 28 years and the lowest of 137.42 g was by Parson brown variety. The average fruit yield for every four years over 28 years revealed that fruit yield increased for additional four years; yield, however, dropped after 24 years of transplanting (Table 4). Yield peak period for almost all the varieties was at 21-24 years (1997 - 2000).
Varietal effect played a major role in the yield attributes; Umudike recorded 46.02 t/ ha, followed by Agege 1 with 40.91 t/ha; Washington navel produced the lowest yield of 17.05 t/ha (Table 4).
Fruit yields for sweet orange varieties fall within the range of 15-100 t/ha in the tropics (Davies and Albrigo, 1994). The maximum yield and year to year variation obtained from a mature citrus orchard of the same variety was reported to be a function of climate and orchard management (Davies and Albrigo, 1994). Wide spacing has been reported to extend yield peak period and delay decline (Wheaton et al., 1999). For high density planting to reach maximum yield, the period ran~d &om 4-14 years depending on the density and the variety (Wheaton et al., 1991; Wheaton et al., 1999).
Table 3: Plant survival of twelve sweet orange varieties in Ibadan Southwestern Nigeria for twenty - eight years after transplanting
Varieties Years after transplanting 4 8 12 16 20 24 28
Umudike 12 12a 12a llb llb llb llb Etinan 12 llb 10c 10c 10c 10c 10 Parson brown 12 llb llb 10c 9d 9d 9d Agege 1 12 12a 12a 12a 12a 12a 12a Valencia 12 12a 12a 12a 12a 12a 12a Ben de 12 12a 12a 12a 12a 12a 12a Pineapple 12 llb llb 10c 10c 10c lOc Me ran 12 10c 10c 9d 9d 9d Be Hamlin 12 llb llb 10c 9d 9d 9d Lue-gim-gong 12 12a 12a 12a 12a 12a 12a Carter navel 12 llb llb 10c 7e Se 4f Washington navel 12 12a 12a 10c Sf 3f 2g S.E 0.10 0.24 0.22 0.12 0.10 0.13 0.10
Column followed by the same letters are not significantly different by DMRT at 5% level of significant
179

Yield efficiency (YE)
Olaniyan et al., 2013
sweet orange trees after 8 years of p lanting
showed an up and downward trend. After Yield efficiency expressed as kg !:-nit m-3 of
canopy was affected by varieties over time
(Table 5). Yield and Canopy volume affect
yield efficiency (Castle, 1983). Lue-gim-gong
had the highest yield efficiency of 5.38 kg
fruit m -3 when the tree was four years old;
Carter and Washington navels had less than
0.5 kg fruit m -3. The yield efficiency for the
ent} years of establishment, none of th? sweet orange varieties attained yield
efficiency of 1 kg m ·3 fruit (Table 5). This is
an indication that the canopy volume
increased without appreciable increase in
fruit yield. Wheaton et al. {1999) s ta ted that
yield potential of a citrus tree is closely
rela ted to canopy bearing volume, they
Table 4: Fruit weight and yield of twelve sweet orange varieties in Ibadan, Southwestern Nigeria
Years afte r h·ansplanting Varieties Fruit weight (g/fruit) Fruit yield (t/ha)
4 16 28 Average over 1981-1984 1997-2000 2001-2004 28 Years 5-8 21-24 25-28
Umudike 131a 216d 200g 170 11.25b 46.02a 31.54a Etinan 110cd 219d 273d 185.86 12.39ab 36.68cd 21.49bc
Parson brown 102cd 158f 193gh 137.42 6.76e 23.53f 20.90bc Agege 1 104cd 241c 246e 189.86 12.27ab 40.91b 23.18b Valencia 112bcd 214de 298c 189.86 9.07c 30.12e 22.50bc Bende 101d 201e 187h 155.71 12.69a 39.33bc 21.95bc Pineapple 113bc 236c 216f 206.43 6.55d 35.93cd 18.28c Me ran 103cd 209de 299c 199.00 11.54ab 38.43bc 21.71bc Hamlin 110cd 167f 317b 184.29 5.02£ 34.13d 21.06bc Lue-gim-gong 100d 219d 192gh 171.86 11.42b 28.99e 18.18c Carter navel 123ab 348a 371a 267.14 1.26g 28.69e 18.32c Washington navel 122ab 258b 306c 278.14 1.40g 17.05g 11.04d S.E 3.56 4.58 3.21 0.38 1.32 1.32 Colunm followed by the same letters are not significantly different by DMRT at 5% level of significant
Table 5: Yield efficiency (kg/m 3) of twelve sw eet orange varieties in Ibadan, Southwestern, Nigeria
Varieties Years after transplanting 4 8 12 16 20 24 28
Umudike 3.04b 3.85b 0.95ab 0.92abc 1.10abc 0.92a 0.85abc Etinan 2.97bc 4.34a 0.75bc 1.29a 1.22abc 0.39cd 0.80cd Parson brown 1.77e 2.03ef 0.61cd · 1.03ab 1.03c 0.63cd 0.71de Agege 1 2.48cd 3.29c 0.46de 0.62bcd 1.52ab 0.58bc 0.97a Valencia 2.79bc 3.25c 0.76bc 0.68bcd 1.10bc 0.84ab 0.80bcd Ben de 2.70bc 4.34ab 0.94ab 1.26a 1.26abc 0.86ab 0.95a Pineapple 0.98f 2.55de 1.10a 0.95abc 1.35abc 0.35cd 0.95a Me ran 2.19de 2.84cd 0.62cd 0.53cd 1.57a 0.75ab 0.93a Hamlin 1.04f 2.06ef 0.29ef 0.67bcd 1.34abc 0.72ab 0.66e Lue-gim-gong 5.38a 1.99£ 1.03a 0.66bcd 1.16abc 0.63bc 0.92ab Carter ni'.vel 0.36g 0.51g 0.22f 0.38d 1.26abc 0.55bc 0.35f Washington navel 0.21g 0. 21g 0.15f 0.31d 0.13d 0.09d 0.20f S.E 0.17 0.19 0.06 0.14 0.12 0.09 0.04
Colunm followed by the same letters are not significantly d ifferent by DMRT at 5% level of significant
180
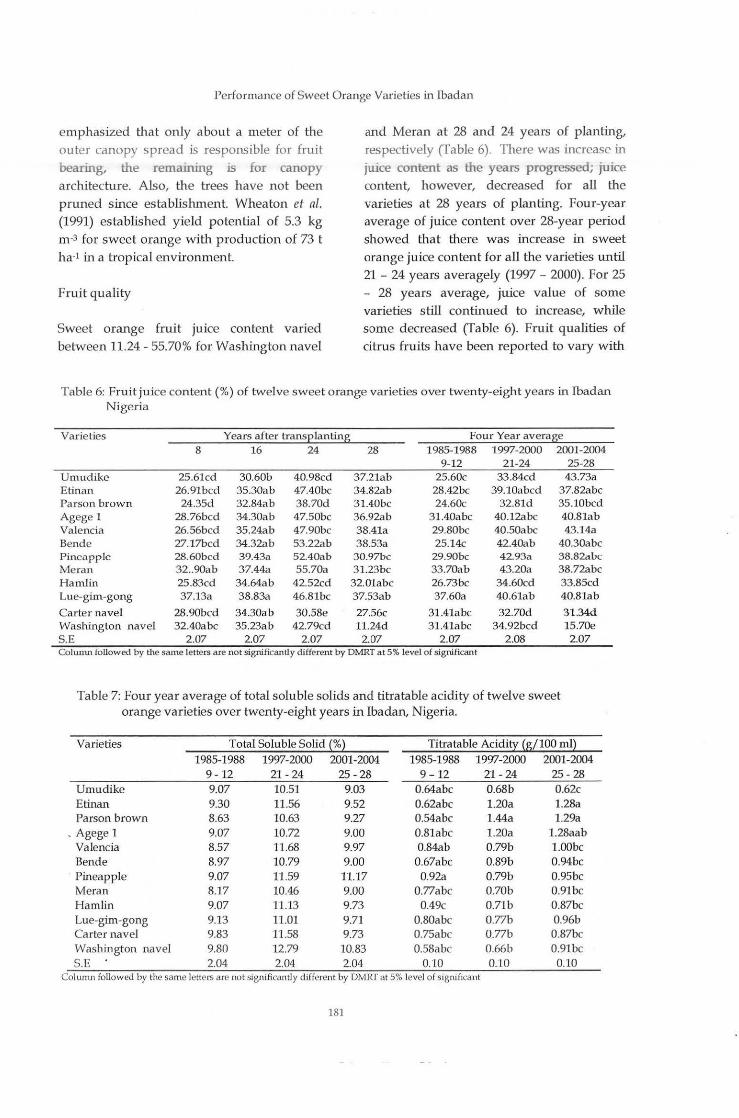
Performance of Sweet Orange Varieties in Ibadan
emphasized that only about a meter of the outer canopy spread is responsible for fruit bearing, the remaining is for canopy architecture. Also, the trees have not been pruned since establishment. Wheaton et nl. (1991) established yield potential of 5.3 kg m-3 for sweet orange with production of 73 t ha-l in a tropical environment.
Fruit quality
Sweet orange fruit juice content varied between 11.24-55.70% for Washington navel
and Meran at 28 and 24 years of planting, respectively (Table 6). There was increase in
juice content as the years progressed; juice content, however, decreased for all the varieties at 28 years of planting. Four-year average of juice content over 28-year period showed that there was increase in sweet orange juice content for all the varieties until 21 - 24 years averagely (1997 - 2000). For 25 - 28 years average, juice value of some varieties still continued to increase, while some decreased (Table 6). Fruit qualities of citrus fruits have been reported to vary with
Table 6: Fruit juice content (%) of twelve sweet orange varieties over twenty-eight years in Ibadan Nigeria
Varie ties Years after trans~ Ianting Four Year average 8 16 24 28 1985-1988 1997-2000 2001-2004
9-12 21-24 25-28 Umudike 25.61cd 30.60b 40.98cd 37.21ab 25.60c 33.84cd 43.73a Etinan 26.91bcd 35.30ab 47.40bc 34.82ab 28.42bc 39.10abcd 37.82abc Parson brown 24.35d 32.84ab 38.70d 31.40bc 24.60c 32.81d 35.10bcd Agege 1 28.76bcd 34.30ab 47.50bc 36.92ab 31.40abc 40.12abc 40.81ab Valencia 26.56bcd 35.24ab 47.90bc 38.4la 29.80bc 40.50abc 43.14a Ben de 27.17bcd 34.32ab 53.22ab 38.53a 25.14c 42.40ab 40.30abc Pineapple 28.60bcd 39.43a 52.40ab 30.97bc 29.90bc 42.93a 38.82abc Me ran 32 .. 90ab 37.44a 55.70a 31.23bc 33.70ab 43.20a 38.72abc Hamlin 25.83cd 34.64ab 42.52cd 32.01abc 26.73bc 34.60cd 33.85cd Lue-gim-gong 37.13a 38.83a 46.81bc 37.53ab 37.60a 40.61ab 40.81ab
Carter navel 28.90bcd 34.30ab 30.58e 27.56c 31.41abc 32.70d 31.34d Washington navel 32.40abc 35.23ab 42.79cd 11.24d 31.4labc 34.92bcd 15.70e S.E 2.07 2.07 2.07 2.07 2.07 2.08 2.07 Colwnn followed by the same letters are not significanUy different by DMRT at 5% level of significant
Table 7: Four year average of total soluble solids and titratable acidity of twelve sweet orange varieties over twenty-eight years in Ibadan, Nigeria.
Varieties Total Soluble Solid(%~ Titratable Acidi~ (g/100 m.Q 1985-1988 1997-2000 2001-2004 1985-1988 1997-2000 2001-2004
9-12 21-24 25-28 9-12 21-24 25-28 Umudike 9.07 10.51 9.03 0.64abc 0.68b 0.62c Etinan 9.30 11.56 9.52 0.62abc 1.20a 1.28a Parson brown 8.63 10.63 9.27 0.54abc 1.44a 1.29a
• Agege 1 9.07 10.72 9.00 0.81abc 1.20a 1.28aab Va lencia 8.57 11 .68 9.97 0.84ab 0.79b l.OObc Bende 8.97 10.79 9.00 0.67abc 0.89b 0.94bc Pineapple 9.07 11.59 11.17 0.92a 0.79b 0.95bc Me ran 8.17 10.46 9.00 0.77abc 0.70b 0.91bc Hamlin 9.07 11.13 9.73 0.49c 0.71b 0.87bc Lue-gim-gong 9.13 11.01 9.71 0.80abc 0.77b 0.96b Carter navel 9.83 11 .58 9.73 0.75abc 0.77b 0.87bc Was hington navel 9.80 12.79 10.83 0.58abc 0.66b 0.91bc S.E 2.04 2.04 2.04 0.10 0.10 0.10
Column followed by the same letters arc not sienificantly different by DMRT at 5% level of significant
181
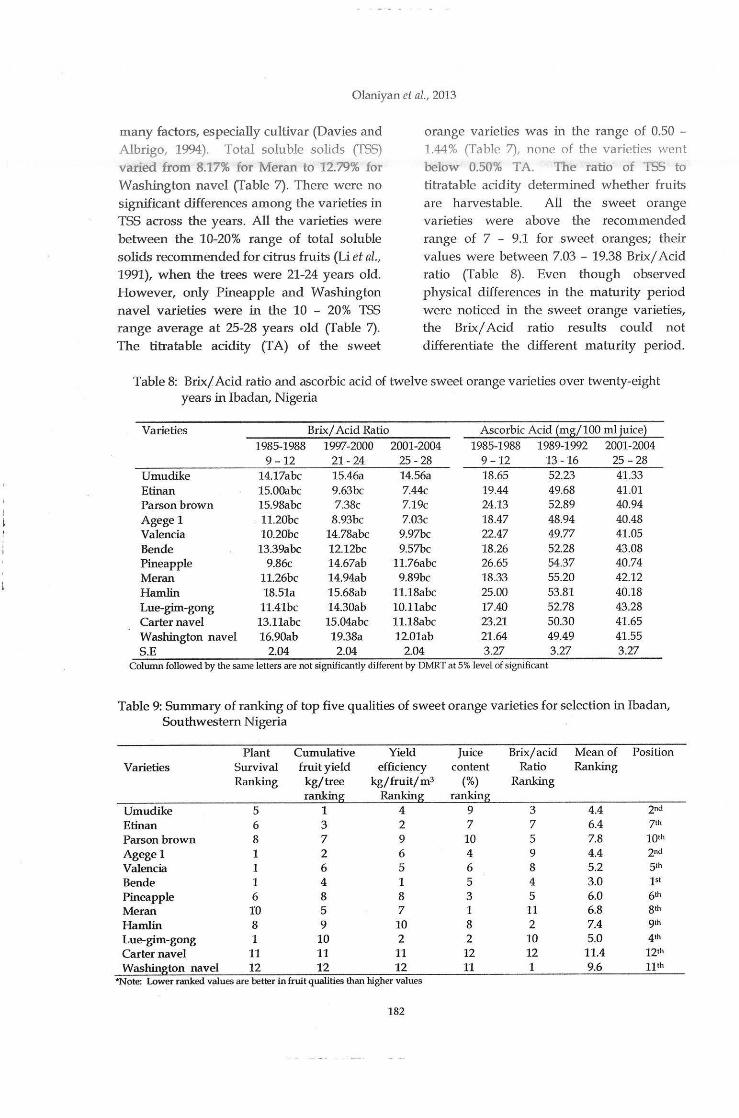
Olaniyan et al. , 2013
many factors, especially cultivar (Davies and
Albrigo, 1994). Total soluble solids (TSS)
varied from 8.17% for Meran to 12.79% for
Washington navel (Table 7). There were no
significant differences among the varieties in
TSS across the years. All the varieties were
between the 10-20% range of total soluble
solids recommended for citrus fruits (Li et al., 1991), when the trees were 21-24 years old.
However, only Pineapple and Washington
navel varieties were in the 10 - 20% TSS
range average at 25-28 years old (Table 7). The titratable acidity (fA) of the sweet
orange varieties was in the range of 0.50 -
1.44% (Table 7), none of the varieties went
below 0.50% T A. The ratio of TSS to
titratable acidity determined whether fruits
are harvestable. All the sweet orange
varieties were above the recommended
range of 7 - 9.1 for sweet oranges; their
values were between 7.03 - 19.38 Brix/ Acid
ratio (Table 8). Even though observed
physical differences in the maturity period
were noticed in the sweet orange varieties, the Brix/ Acid ratio results could not
differentiate the different maturity p eriod.
Table 8: Brix/Acid ratio and ascorbic acid of twelve sweet orange varieties over twenty-eigh t years in Ibadan, Nigeria
Varieties Brix/ Acid Ratio Ascorbic Acid {mg/100 ml juice~
1985-1988 1997-2000 2001-2004 1985-1988 1989-1992 2001-2004 9-12 21-24 25-28 9-12 13- 16 25-28
Umudike 14.17abc 15.46a 14.56a 18.65 52.23 41.33 Etinan 15.00abc 9.63bc 7.44c 19.44 49.68 41.01 Parson brown 15.98abc 7.38c 7.19c 24.13 52.89 40.94 Agege 1 11.20bc 8.93bc 7.03c 18.47 48.94 40.48 Valencia 10.20bc 14.78abc 9.97bc 22.47 49.77 41.05 Ben de 13.39abc 12.12bc 9.57bc 18.26 52.28 43.08 Pineapple 9.86c 14.67ab 11.76abc 26.65 54.37 40.74 Meran 11.26bc 14.94ab 9.89bc 18.33 55.20 42.12 Hamlin 18.51a 15.68ab 11.18abc 25.00 53.81 40.18 Lue-gim-gong 11.41bc 14.30ab 10.11abc 17.40 52.78 43.28 Carter navel 13.11abc 15.04abc 11.18abc 23.21 50.30 41.65 Washington navel 16.90ab 19.38a 12.01ab 21.64 49.49 41.55 S.E 2.04 2.04 2.04 3.27 3.27 3.27
Column followed by the same letters are not significantly different by DMRT at 5% level of significant
Table 9: Summary of ranking of top five qualities of sweet orange varieties for selection in Ibadan, Southwestern Nigeria
Plant Cumulative Yield Juice Brixjacid Mean of Position Varieties Survival fruit yield efficiency content Ratio Ranking
Ranking kg/tree kg/fruitjm3 (%) Ranking ranking Ranking ranking
Umudike 5 1 4 9 3 4.4 2nd
Etinan 6 3 2 7 7 6.4 7'" Parson brown 8 7 9 10 5 7.8 10th Agege1 1 2 6 4 9 4.4 2"d Valencia 1 6 5 6 8 5.2 5th
Bende 1 4 1 5 4 3.0 1" Pineapple 6 8 8 3 5 6.0 6th Mer an IO 5 7 1 11 6.8 8th Hamlin 8 9 10 8 2 7.4 9th Lue-gim-gong 1 10 2 2 10 5.0 4th
Carter navel 11 11 11 12 12 11.4 12th Washing!on navel 12 12 12 11 1 9.6 11th
•Note: Lower ranked values are better in fruit qualities than higher values
182
Performance of Sweet Orange Varieties in lbadan
Therefore, emphasis was not laid on the results to separate maturity period amon? the sweet orange varieties. The ascorbic acid for sweet orange varieties was low in the range of 17.40 - 55.20 mg/100 ml (Table 8). Davies and Albrigo (1994) reported 70 mg/ 100 ml juice for Pineapple, sweet orange variety. Ascorbic acid levels generally decrease seasonally as fruits mature; the rate of decrease is much rapid in the tropics than in sub-tropics due to higher temperatures in the tropics (Davies and Albrigo, 1994). Climate plays an important role in producing high quality oranges under hot low land tropical conditions. Total acidity decreases rapidly for sweet orange (Davies and Albrigo, 1994). Orange juice from fruit in these areas is often said to be insipid (Lack of acidity). The acidity was not below 0.5%; however, there was a good balance in the Brix/ Acid ratio for all the sweet orange varieties for good fruit qualities. The only limitation for the sweet orange varieties was the absence of the peel orange fruit colour (not measured) due to high temperature associated with the tropics. Ranking the varieties for top five qualities for sweet orange varieties, the local land races ranked best (Table 9). Bende was found to be the best among the twelve sweet orange varieties, Agege 1 and Umudike tied for the second position and Lue-gim-gong, an exotic varieties was in the fourth position. The navels came last with Washington navel occupying the 11th and Carter navel in the 12U1 position.
CONCLUSION
This study revealed that Bende, Agege 1, Umudike local land races and Lue-gim-gong, Valencia and Pineapple exotic varieties were suitable for planting in rain forest Ecological Zone of Nigeria. Washington navel and Carter were unsuitable for the area.
183
REFERENCES
Adigun, 0. 0. 1977. Evaluation of five local sweet orange cultivars Proceeding International Citriculture, 2: 640- 641.
in Nigeria. Society of
Adigun, 0. 0. 1992. Citrus production in Nigeria. Occasional paper No. 289: National Horticultural Research Institute, P.M.B. 5432, Idi-Ishin, Ibadan, Nigeria, 1992. 41 pp.
Aubert, B. and Vullin, G. 1998. Citrus nurseries and planting techniques, published by Center for International Cooperation in Agronomical Research for Development (CIRAD) Acropolis Bp 5035, 34032 Montieuier Cedex 7 France, 1998, 183 pp.
Castle, W. S. 1983. Growth, yield and cold hardiness of seven year old. "Bears" Lemon on twenty seven rootstocks, Proceeding of Florida State Horticultural Society, 1983, 96: 23-25.
David, J. 1986. Temperate and Subtropical fruit production. Butterworths of New Zealand (ltd). 33 - 35 Cumberland place CPO Box 472 Wellington New Zealand, 1986, p. 223-233.
Davies, F. S. and Albrigo, L. G. 1994. Citrus crop production science in Horticulture 2. CAB International Printed in Great Britain by Redwood books Trowbridge, Wiltshire, 1994, 253 pp.
FAO/UNESCO, 1986. Soil Map of the World revised legend. World Soil Resources Report. Fourth Draft, 1986, 122 pp.
John, L. Griffis, Jr. and Malcolm M. Manners. 2001. Improved Citrus Production arid spoilage curtailment of Excess Produce. Preliminary Technical Consultancy report NIG 009, submitted to National Horticultural Research Institute, Idi-Ishin, • Jericho Reservation Areas, Ibadan, Oyo State,

Olaniyan el a/., 2013
Nigeria and farmer to Farmer Program (USAID) Winrock International, 2001, 50 pp.
Kimball, D. 1991. Citrus Process ing: Quality Control an d Technology. Van Nosh·and Reinhold: New York, 256 pp.
Kolade, J. A., Olaniyan, A. A. and Taylor, 0. A. 1997. Performance of Lake Tangelo on six different commercial rootstocks. Proceedings of 15th Annual Conference of Horticultural Society of Nigeria (HORTSON), p. 88-92.
Kolade, J. A. and Olaniyan, A. A. 1998. Performance of 12 Sweet orange cultivars in the South-western Nigeria. Fruits, 53(3): 175 -182.
Larry K. Jackson. 1999. Citrus cultivation, In: Timmer L. W., Lany W. Duncan (Eds), Citrus Health Management. The American Phytopathological Society Press (APS) USA, ISBN: 0-89054-227-9, p. 17-20.
Li, B. W., Andrews, K. W. and Pehrsson, P. R. 2002. Individual sugar soluble and insoluble dietary fibre contents of 70 high consumption foods. Journal of Food Composition and analysis, 15(6): 715- 723.
Olaniyan , A. A. 2009 Strategy for the development of sustainable citrus production in Nigeria. In A.A. Idowu and M.A. Adejoro (eds). Repositioning the National Horticultural Research Institute for effective contribution to the Millennium development goals. Proceedings of the s take holders Retreat Organized by the National Horticultural Research Institute, Ibadan, Nigeria, 219 pp.
184
Smyth, A. T. and Mon tgomery, R. F. 1962.
Soils and land use in Central Western Nxgena, Government Prmters, lbadan, Nigeria, p. 256.
Soil Survey Staff. 1990. Keys to soil Taxonomy, SMSS technical monograph No. 6. Blacks burg. Virginia. Fourth edition, 1919 ISBN 0-929900 - 01.
Tucker, D. P. H., Futch, S. H., Gmitter, F. H. and Kesinger, M. C. 1998. Florida Citrus Varieties. University of Florida/ FAS Publications P. 0. Box 110011 Gainesville. FL 32611 - 0011. p. 5.
Wheaton, T. A., Castle, W. S., Whitney, J. D. and Tucker, D. P. H. 1999. Horticultural Practices for Citrus Health. In: Timmer L.W., Larry W. Duncan (Eds), Citrus Health Management. The American Phytopathological Society Press (APS) U.S.A. ISBN: 0-89054-27-9, p. 49-54.
Wheaton, T. A., Castle, W. S., Whitney, J. D. and Tucker, D. P. H. 1991. Performance of citrus scion cultivars and Rootstocks in a High - density p lanting. Horticultural Science, 26(7): 837.
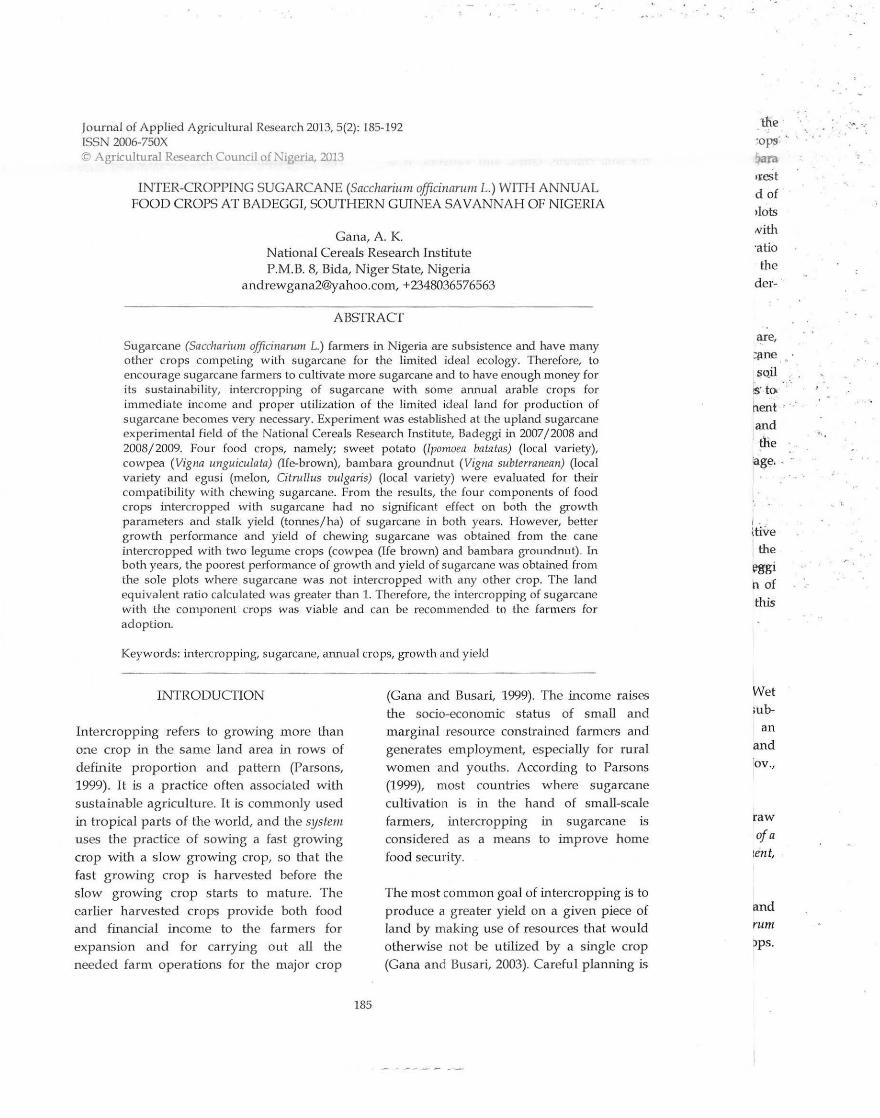
·'.
Jow·nal of Applied Agricultural Research 2013, 5(2): 185-192 ISSN 2006-750X © Agricultural Research Council of Nigeria. 2013
INTER-CROPPING SUGARCANE (Saccharium officinarum L.) WITH ANNUAL FOOD CROPS AT BADEGGt SOUTHERN GUINEA SAVANNAH OF NIGERIA
Gana, A. K. National Cereals Research Institute P.M. B. 8, Bida, Niger State, Nigeria
and [email protected], + 2348036576563
ABSTRACT
Sugarcane (Saccharium officinarum L.) farmers in Nigeria are subsistence and have many other crops competing with sugarcane fo r the limited ideal ecology. Therefore, to encourage sugarcane farmers to cultivate more sugarcane and to have enough money for its sustainability, intercropping of sugarcane with some annual arable crops for immediate income and proper utilization of the limited ideal land for production of sugarcane becomes very necessary. Experiment was established at the upland sugarcane experimental field of the National Cereals Research Institute, Badeggi in 2007/2008 and 2008/2009. Four food crops, namely; sweet potato (Ipomoea batatas) (local variety), cowpea (Vigna unguiculala) (He-brown), bambara groundnut (Vigna subterranean) (local variety and egusi (melon, Citrullus vulgaris) (local variety) were evaluated for their compatibility with chewing sugarcane. From the results, the four components of food crops intercropped with sugarcane had no significant effect on both the growth parameters and stalk yield (tonnes/ha) of sugarcane in both years. However, better growth performance and yield of chewing sugarcane was obtained from the cane intercropped with two legume crops (cowpea (lfe brown) and bambara v-oundnut). In both years, the poorest performance of growth and yield of sugarcane was obtained from the sole plots where sugarcane was not intercropped with any other crop. The land equivalent ratio calculated was greater than 1. Therefore, the intercropping of sugarcane with the component crops was viable and can be recommended to the fanners for adoption.
Keywords: intercropping, sugarcane, annual crops, growth and yield
INTRODUCTION
Intercropping refers to growing more than o:1e crop in the same land area in rows of
definite proportion and pattern (Parsons, 1999). It is a practice often associated with
sustainable agriculture. It is commonly used
in tropical parts of the world, and the system uses the practice of sowing a fas t growing crop w ith a slow growing crop, so that the
fast growing crop is harvested before th e s low growing crop starts to mature. The earlier harvested crops provide both food
and financial income to the farmers for
expansion and for carrying out all the needed farm operations for the major crop
185
(Gana and Busari, 1999). The income raises
the socio-economic s tatus of small and
margin al resource constrained farmers and generates employment, especially for rural women and youths. According to Parsons
(1999), most countries where sugarcane
cultivation is in the hand of small-scale
farm ers, intercropping in s ugarcane is considered as a means to improve home
food security.
The mos t common goal of i.ntercropping is to produce a greater yield on a given piece of land by making use of resources that would otherwise not be utilized by a single crop
(Gana and Busari, 2003). Careful p lanning is
lne · " :ops
m-a •xest d of >lots ,vith
·atio
the der-
are,
=lille
SQil
~-tO<
hent ·
and
the rage ..
ltive the
~gi n of
this
Wet ;ub
an and
ov.,
raw
of a 1en t,
an d rum
.... ~~. ·.·
,,
..
- '
.

Gana, 2013
Gana, A. K., Busari, L. D. and Ibrahim, P. A.
2000. Assessment of the contribu tion of legumes to the nitrogen nutrition of Sugarcane. Acta Agronomica Hungarica, 48(1): 103-106.
Gana, A. K. and Busari, L. D. 2003. Intercropping study in sugarcane (Saccharum
officinarum L.). Sugar Tech India, 5(3): 193-196.
Gana, A. K. 2008. Determination of optimal rate of nitrogen (N) for chewing sugarcane Production in the Southern Guinea savannah of Nigeria. International Journal of Sugar Tech. India, 10 (3): 278-279
Gana, A. K. 2010. Agronomy of Sugarcane.
Jude. Evans Books and Publications Bida,Niger State, Nigeria, 93 pp.
,, .
I
, I Ji/ ) •. ' ,, ; j
( f · ~ I I . 1 )• I ,• (
r, t ''
I •· ~ I • . rt· I . ' 1 )
1 '1 r H
j (\ t
192
Gupta, R, Kumar R., Singh, V. R. and Tripathi, S. K. 2004. Study on agro climatic condition and productivity pattern of sugarcane in India. Sugar Tech Journal, 6(3): 141-149. 1
Parsons, M. J. 1999. Intercropping with sugarcane. Proceedings of South Africa Sugar Teclmology, p. 112-119.
Singh, S. N., Singh, R. K. and Singh, B. 2001. Herbicidal cum integrated approach of weed management in spring planted su garcane. Indian Journal of Weed Science, 33(3 & 4): 136-138.
Snedecor,· G. W an d Cochran, W. G. 1967.
' Statistical Methods. Iowa. S!ate University Press, Ames, Iowa, USA, 425 pp.
I '
f •
''
I '
' ' . , ,, . ~ .
I ,, •f
(,
,. I Jl
:rt '•' .,
[,
I ' ,, ' ; ,,, ''
,!
11 ,' :i
' •• J . ' r • ·~ .. ., • ~ • J l
• J ., ( ~ ' . \ J ,,
' 'I ) { I , l '• ·. ' ,, , t 1n:\ .,., J .I
. i "{ ! . (_: I'·' I tw' "f I
Journal of Applied Agricultural Research 2013, 5(2): 193-203 ISSN 2006-750X © Agricultural Research Council of Nigeria, 2013
COMPARATIVE ANALYSIS OF AGRONOMIC PERFORMANCE AND SEED MORPHOMETRIC TRAJTS OF MAIZE (Zea mays L) SEED FROM VARIED SOURCES
*Adetumbi, J. A.l, Daniel, I. 0.2 and S. A. Ola.kojol lJnstitute of Agricultural Research and Training, ObafemiAwolowo University,
P.M.B.5029, Moor Plantation, Ibadan.Oyo State. Nigeria. 2Federal University of Agriculture, P.M.B.5240, Abeokuta, Ogun state, Nigeria.
*[email protected] +2348055308715
ABSTRACT
Laboratory and field experiments were conducted at the Institute of Agricultural Research and Training (IAR&T), Ibadan, Nigeria, in 2010 and 2011 to compare seed morphometric traits and agronomic performance of six maize varieties (Oba Super 1, Oba Super 2, SUWAN 1-SR, DMRESRY, TZPBSRW and Obatanpa) collected from different sources (International Institute of Tropical Agriculture, IAR&T and Premier Seed Limited). The objectives were to evaluate relationships among the seeds as a measure of their gene tic similarity and purity, and identify traits that can be used as descriptors for varieties of maize plants and seeds. Ten seeds in three replicates per sample were subjected to digital imaging by placing each seed under the USB microscope (Veho™ UK) to capture the seed image which was later viewed and various seed morphometric measurements taken. On the field, a single row trial of 5 m long planted at 75 em interrow by 50 em intra-row at 2 seeds/ stand was planted using Randomised Complete Block Design with three replicates, and data were collected each year on agronomic performance of the plants. Data were subjected to analysis of variance (ANOV A), principal component analysis (PCA) and single linkage cluster analysis (SLCA). Results show tha t only number of days to tasselling and silking were significantly different (P<0.05) among seeds collected from different sources while most of the seed morphometric traits were significantly different (P<0.05) across the years and among the seed sources. Principal component analysis revealed that 35.01 % of the agronomic variation was loaded largely with plant height while seed area (product of seed length and width) contributed about 34.04% of morphometric variation. This. study concludes that there were diverse genetic variations among the seeds of maize of same variety and recommends more concerted effort directed towards ensuring genetic purity and uniformity of seeds through genetic purity certification.
Keywords: maize seed, seed source, genetic purity certification, agronomic performance.
INTRODUCTION
The Plant Variety Protection and Seed Act provides the plant variety registration system for protection of plant breeders' rights to promote breeding of new varieties. Plant morphological characters have been the universally undisputed criteria applied for testing distinctness uniformity and stability (DUS) of crop varieties (Arun-
193
Kumar et al., 2007). Most DUS test and crop characterization requires growing a representative number of seeds from previously conserved seeds on the field using a statistically sound replicated experimental design to record characters that are highly heritable, easily seen by eye and measureable (Balkaya and Odabas, 2002). Though morphological parameters have been widely used in the evaluation of
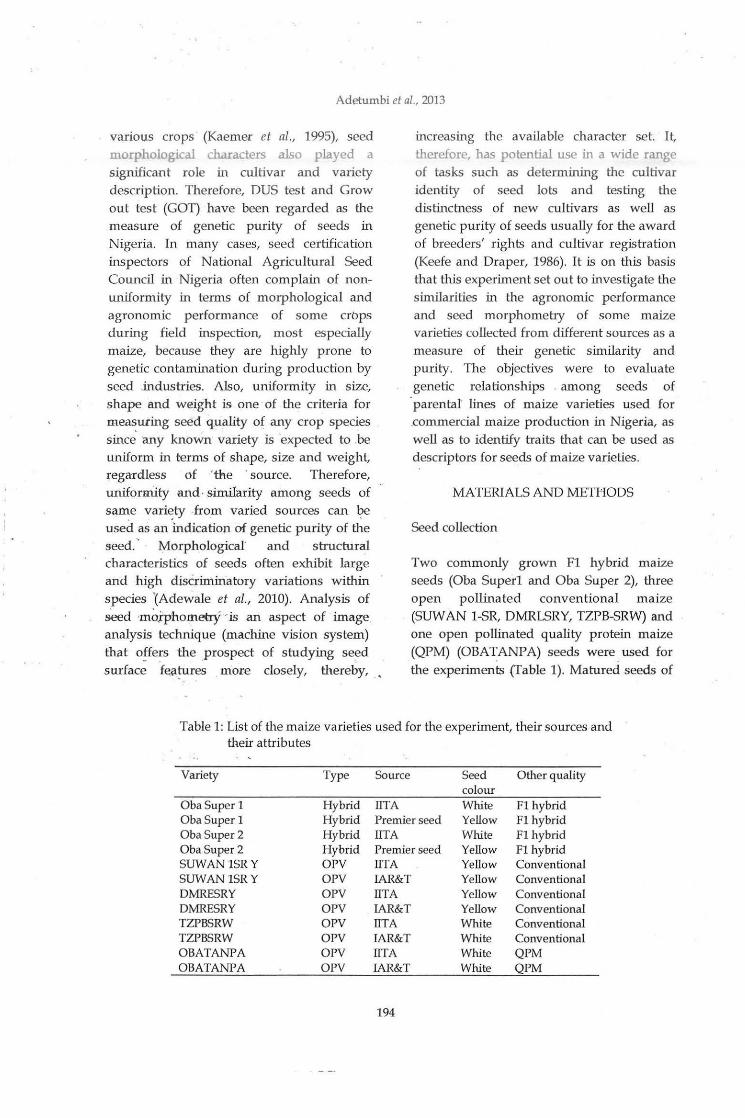
Adeturnbi et al., 2013
various crops (Kaemec et al., 1995), seed morphological characters also played a significant role in cultivar and variety description. Therefore, DUS test and Grow out test (GOT) have been regarded as the measure of genetic purity of seeds in Nigeria. In many cases, seed certification inspectors of National Agricultural Seed Council in Nigeria often complain of nonuniformity in terms of morphological and agronomic performance of som e crbps during field inspection, most especially maize, because they are highly prone to genetic contamination during production by seed .industries. Also, uniformity in size, shape and weight is one of the criteria for mea~uring seed q.uality of any crop species since any known variety is ·expected to be uniform in terms of shape, size and weight, regardless of 'the ·source. Therefore, uniformity and· similarity among seeds of same vari~ty from varied sources can 1;>e used as an indication of genetic purity of the seed. ' Morphological. and structural characteristics of seeds often exhibit large and high discriminatory variations within species '(Adewale et al., 2010). Analysis of ~d ·moj:phometry ·· is an aspect of image analysis technique (machine vision system) that o!fe~s the prospect of studying se~d surface fea~res more closely, thereby,
increasing the available character set. It,
therefore, has potential use in a wide range of tasks such as determining the cultivar identity of seed lots and testing the distinctness of new cultivars as well as genetic purity of seeds usually for the award of breeders' rights and cultivar registration (Keefe and Draper, 1986). It is on this basis that this experiment set out to investigate the similarities in the agronomic performance and seed morphometry of some maize varieties collected from different sources as a measure of their genetic similarity and purity. The objectives were to evaluate genetic relationships . among seeds of parental lines of maize varieties used for .commercial maize production in Nigeria, as well as to identify traits that can be used as descriptors for seeds of maize varieties.
MATERIALS AND METHODS
Seed collection
Two commonly grown F1 hybrid maize seeds (Oba Super1 and Oba Super 2), three open pollinated conventional m aize (SUWAN 1-SR, DMRLSRY, TZPB-SRW) and one open pollinated quality protein maize (QPM) (OBA T ANPA) seeds were . used for the experiments (Table 1). Matured seeds of
Table 1: List of the maize varieties used for the experiment, their sources and their attributes
Variety Type Source Seed Other quality colour
ObaSuper 1 Hybrid IITA White F1 hybrid Oba Super 1 Hybrid Premier seed Yellow F1 hybrid Oba Super 2 Hybrid IITA White F1 hybrid ObaSuper2 Hybrid Premier seed Yellow F1 hybrid SUWAN1SRY OPV IITA Yellow Conventional SUWAN 1SRY OPV IAR&T Yellow Conventional DNIRESRY OPV IITA Yellow Conventional DNIRESRY OPV IAR&T Yellow Conventional TZPBSRW OPV IITA White Conventional TZPBSRW OPV IAR&T White Conventional OBATANPA OPV IITA White QPM OBATANPA OPV IAR&T White QPM
194

Agronomic Performance and Morphometric Traits of Maize Seed
each varietv were collected from at least two different sources in 2010 and 2011. Hybrid seeds were sourced from International Institute of Tropical Agriculture (IITA); an international organization and Premier Seed Ltd., a private seed company, while samples of foundation seeds of open pollinated varieties were sourced from Institute of Agricultural Research and Training (IAR&T) and IITA (Table 1).
Morphometric analysis
Seeds of the six maize varieties from 2 sources each were randomly sampled after which good and intact seeds were selected
Plate 1
Plate 3
regardless of their sizes, while broken and perforated seeds were discarded. The selected thirty seeds were la ter assigned to three replicates. Each replicate of ten seeds per sample was subjected to digital imaging using the USB microscope (V eho ™ UK) in such a way that the embryo axis of the seed was facing the lens of the camera under light. The light on the USB microscope was adjusted until the desired focus was achieved. The magnifica tion of the USB microscope was adjustfi!d until the desired magnification of x40 was obtained. The seed was then viewed with photo camera so that the image of the seed was captured by the USB microscope as shown in Pla te 1. The
Seed width
---7 Seed length
Plate 2
Maize seed Digital measurement of the seed
Plate 4
Plate 1: The setup of the apparatus used for the experiment Plate 2: Measurement of seed length and seed width Plate 3: Measurement of seed radius and seed circumference Plate 4: \l!casurement of maize seed thickness with the use of digital vernier caliper
195
Adetumbi eta/., 2013
image was double-clicked to be previewed and displayed at the measurement window of the USB microscope to measure the desired parameters. The magnification of the image was taken into consideration before the measurements were taken in millimeters.
The following measurements were taken and recorded as follows:
Seed Length (SL): This was the greatest dimension on the seed, the distance between the base of the embryo axis to the tip of the endosperm of the maize seed (mm) (Plate 2).
Seed Width (SW): This was the dimension taken across and at right angle to the length of the seed and expressed in mm (Plate 2).
Seed Perimeter (SP): This was measured as a perimeter of a circle drawn around the seed ensuring the line touched all edges of the seed. It is expressed in mm (Plate 3).
Seed Diameter (SO): This was measured by value of the line drawn across the circle made round the seed and expressed in mm (Plate 3).
Seed Thickness (ST): Each maize seed was held in between the vernier caliper to digitally measure the thickness, expressed in mm (Plate4)
Seed Area (A): Calculated as product of values of the seed length and seed width (Area= length x width). It was expressed in mm2.
Seed Angle (SA): The value of angle created in between two lines touching each other at the tip where the seed was attached to the husk. It was expressed in degrees (0 ).
Embn;o Angle (EA): This was done by reading the angle created in between two lines touching each other at the tip of the embryo and was expressed in degrees (0 ).
196
Shape Factor (SF): Seed shape descriptor was calculated using the formular 4nA/ C2 where A is the seed area and C represents the perimeter (Grillo et al, 2011, Geetha et al., 2011).
Flatness Index (FI): Estimated as the ratio of seed length to seed width and seed thickness using the formular: FI = SL+SW /2ST (Adewale et al., 2010).
Eccentricitlj Index (EI): Estimated as the ratio SL to SW according to Balkaya and Odabas (2002).
Agronomic and morphological analyses
This experiment was conducted in 2010 and 2011 on the maize breeding farm of I.A.R.&T., Ibadan, located on latitude 7° 22.5'N and longitude 3°50.5'E. The experiment was a single row trial of 5 m long, sown at 75 em inter-row by 50 em intra-row at 2 seeds/ stand. Experimental design was Randomised Complete Block Design with three replicates. Two manual weedings were done at third and seventh week after planting. N.P.K. 20-10-10 fertilizer was applied once at the rate of 10 g/ stand at 4 weeks after planting using band application method. Data were collected each year on agronomic and morphological characteristics according to descriptors specified for maize by Centre for Maize and Wheat Improvement (CIMMYT) (CIMMYT, 1991). Data were obtained from 5 inner plants of each row. The data were pooled and means were used for statistical analysis. Parameters studied include:
Days to tasselling (DT): Taken as number of days from planting to the time 50% of the plants tasseled.
Days to silking (OS): Taken as number of days from planting to the time when 50% of the plants have silks emerged.

Agronomic Performance and Morphometric Traits of Maize Seed
Flng lenf length (FLL): Measurement taken in centimeters (em) on the topmost leaf of the plant beginning from the leaf base to the tip of the leaf.
Plant 'height (PHT): Measured in em from the soil level to the base of the tassel after milking stage.
Tassel length (TL): Measurement taken in em from the last primary branch at the base of the tassel to topmost tip of the tassel after milking stage.
Number of tassel branches (NTB): Number of primary branches on tassel counted on each plant after milk stage.
Number of lenves above the uppermost ear (NLUE): Including ear leaf counted on each plant after milk stage.
Cob length (CL): Measurement taken in em from the tip of the cob to the end point of the cob.
Kernel rawjcob (KrjC) : Numbers of complete rows of kernel setting on the cob
Grnin weight (GW): Measured after ensuring that they have attained 12% moisture con tent after harvesting and processing.
Data analysis
All the data were analysed using the Statis tical Analysis System (SAS™) for windows version 8 for analysis of variance (ANOV A). Principal component analysis (PCA) and single linkage cluster · analysis (SLCA) were done with the aid of PAST software version 1.89.
RESULTS AND DISCUSSION
All the agronomic traits except flag leaf length were significantly different (P<0.05) from each other across the years (Table 2).
197
Similarly, the varie ties were significantly different from each other for the agronomic traits except flag leaf length, tassel length and number of tassel branches. This result indicates considerable variations among maize varieties. Ilarslan et al. (2002) reported significant variation for morphological and agronomic traits among Turkish maize landraces. Also, Sanchez et al. (1993) observed a very high level of variation among and within the Mexican maize races. However, only the number of days to tasselling and silking were significantly different (P<0.05) among seeds collected from different sources (Table 2). Analysis of variance for seed morphometric parameters for the six maize varieties (Table 3) showed tl1at there were significant differences in all the seed morphometric parameters (P<0.05) across the years and among the seed sources except for the seed thickness, seed circumference and eccentricity index that were not significantly different from each other (Table 3). Also, all seed morphometric traits of the varieties were significantly different from each other. This implies that seed shape of different maize varieties differed from each other as reported by Daniel et al. (2012). The significant result recorded in almost all the agronomic and morphometric traits across the years can be attributed to variation in weather situation of each year. Morakinyo and Ajibade (1998) reported that variation in environmental and climatic factors can impose effects em crop genotypes, thereby producing differences in results when using morphological traits for grouping, especially when the experiments are repeated over times or locations. Significant agronomic and morphometric traits recorded among the maize varieties confirmed varied characteristic differences among the traits of the maize. The significant resu lts among the seeds sourced, recorded by seed morphometric analysis, showed ability to reliably distinguish maize seeds from each other at 5% significant probability level. These results corroborate the findings

Table 2: Mean square values of combined analysis of variance for agronomic parameters of six maize varieties from different sources
Source of Df Days to Days to Flag leaf Plant Tassel Tassel Leaf above Cob Kernel Grains variation tasselling silking length height length branches uppermost ear length row f cob weight/ plant Year (Y) 1 1586.72* 694.01* 22.78 13081.53* 117.33* 1012.50* 0.35* 154.15* 34.59* 29.06* Seed source (S) 1 24.50* 19.01 * 92.25 2.53 34.90 32.00 0.01 0.93 0.00 0.01 Variety (V) 5 6.19* 21.15* 44.40 753.23* 5.93 31.20 0.78* 11.13* 8.64* 14.11* Y X S 1 14.22 19.01* 6.42 12.09 4.44 8.00 1.13 0.06 12.21* 1.89 Y XV 5 4.62 3.01 123.82* 799.55* 22.44 10.40 0.38 16.34* 2.94* 9.71 S XV 5 13.93* 11.35* 39.73 234.80 25.58 17.17 0.32 5.68* 4.27* 7.30 Y X S XV 5 8.86 10.41 96.99 188.57 105.29* 31.43 0.09 2.31 3.51 * 14.09* Error 46 3.94 4.20 38.13 235.78 11.03 15.28 0.28 2.22 1.00 4.60 *Significant at P<0.05
..... ~
Tables 3: Mean square values of combined analysis of variance for seed morphometric parameters of six maize varieties from different sources
Source of Df Seed Seed Seed Seed Seed Seed Embryo Seed Shape Flatness Eccentricity Variation length width thickness circumference diameter angle angle area factor index index Year (Y) 1 17.65* 8.24* 0.22 0.13 225.07* 15028.87* 9040.42* 3845.17* 909.88* 86.52* 0.01 Source (S) 1 2.24* 3.18* 0.08 1.36 16.70* 82.28 10.51 840.47* 2.52* 95.16* 0.00 Variety (V) 5 7.46* 4.79* 2.99* 37.14* 11.48* 532.27* 468.19* 1664.90* 7.28* 121.50* 0.03* YxS 1 4.43* 4.34* 0.70 13.98 24.62* 282.62* 100.42 1120.35* 7.43* 267.78* 0.00 YxV 5 7.59* 2.53* 2.09* 55.24* 9.80* 399.43* 643.75* 1373.92* 2.86* 8.09 0.02* SxV 5 2.71* 1.92* 0.15 32.64* 15.06* 187.80* 298.07* 531.42* 2.42* 94.19* 0.02* YxSxV 5 2.09* 1.09* 0.18 32.60* 15.60* 80.13* 163.75* 391.70* 7.24* 64.87* 0.01* Error 0.13 0.12 0.12 10.28 0.33 21.77 26.22 25.90 0.27 10.67 0.00
*Significant at P<0.05
:> 0.. rt>
~ sr. ~
?!:5 ..... VJ
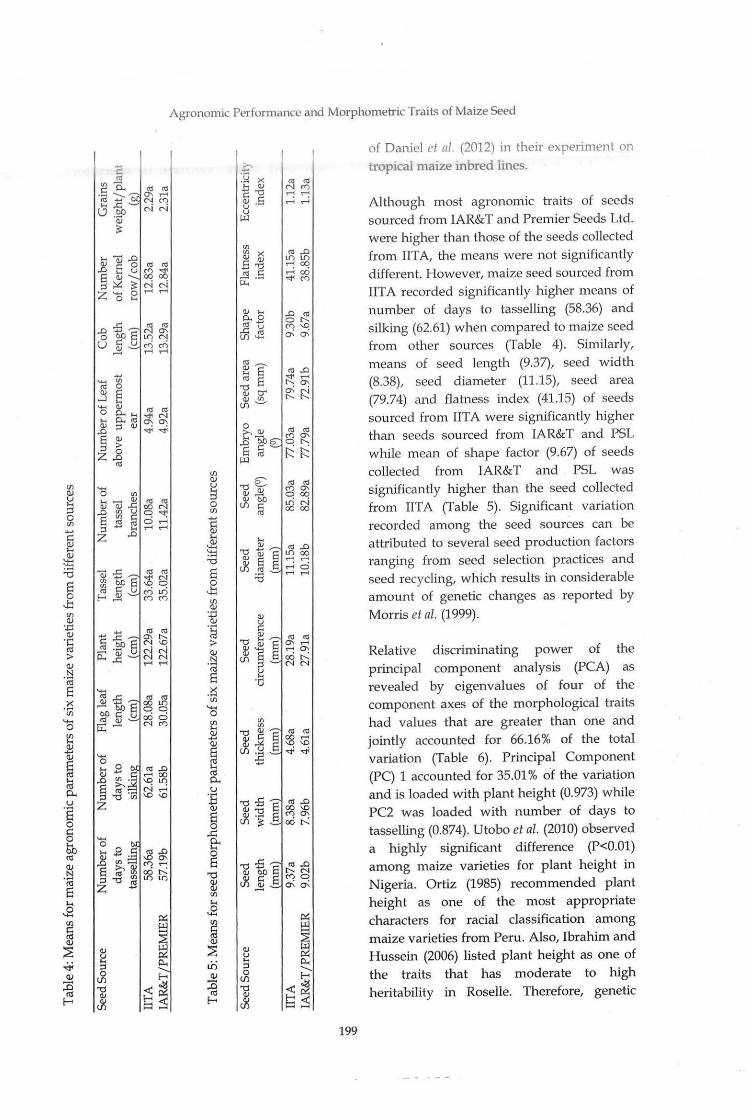
Agronomic Performance and Morphometric Traits of Maize Seed
l!')
Q)
::0 ~
Q) .... 0..0 "' ..... ..c: u
r.J).fl
-o£ Ql"tj
~ ·~
199
of Daniel et nl. (2012) in their experiment on
tropical maize mbred lmes.
Although most agronomic traits of seeds sourced from IAR& T and Premier Seeds Ltd. were higher than those of the seeds collected from IITA, the means were not significantly different. However, maize seed sourced from IITA recorded significantly higher means of number of days to tasselling (58.36) and silking (62.61) when compared to maize seed from other sources (Table 4). Similarly, means of seed length (9.37), seed width (8.38), seed diameter (11.15), seed area (79.74) and flatness index (41.15) of seeds sourced from IITA were significantly higher than seeds sourced from IAR& T and PSL while mean of shape factor (9.67) of seeds collected from IAR&T and PSL was significantly higher than the seed collected from IITA (Table 5). Significant variation recorded among the seed sources can be attributed to several seed production factors ranging from seed selection practices and seed recycling, which results in considerable amount of genetic changes as reported by Morris et al. (1999).
Relative discriminating power of the principal component analysis (PCA) as revealed by eigenvalues of four of the component axes of the morphological traits had values that are greater than one and jointly accounted for 66.16% of the total variation (Table 6). Principal Component (PC) 1 accounted for 35.01% of the variation and is loaded with plant height (0.973) while PC2 was loaded with number of days to tasselling (0.874). Utobo et al. (2010) observed a highly significant difference (P<0.01) among maize varieties for plant height in Nigeria. Ortiz (1985) recommended plant height as one of the most appropriate characters for racial classification among maize varieties from Peru. Also, Ibrahim and Hussein (2006) listed plant height as one of the traits that has moderate to high heritability in Roselle. Therefore, genetic

Adetumbi et al., 2013
purity of maize seed production fie ld can be
assessed by the level of uniformity of the plant height and number of days to
tasselling. Principal axes of the morphometric traits had eigenvalues of 4.77, 3.59, 1.94 and 1.05 for PC1, PC2, PC3 and PC4, respectively, and they accounted for 80.98% of the to tal variance (Table 7).
Principal Component 1 was loaded largely with seed angle (0.859) and seed area (0.811) w hich was a product of seed leng th and seed width while PC2 was loaded with seed diamete r (0.925).
These results suggest tha t these traits are the main seed metric vanables to select for
effective discrimination amon g maize seeds. Daniel et nl. (2012) had reported that seed
area, seed length, pe rimeter and flatness index conh·ibuted largely to the variability of tropical inbred maize genotypes. The dendogram d rawn from the single linkage
cluster analysis (SLCA) illustrating the rela tionship between the 6 maize varieties based on their agronomic performance shows that all the varieties were dis tinct from each other at a minimum distance of
0.00 level of similarity (Figure 1). The result
Table 6: Eigenvalues and percentage contributions of each agronomic trait as revealed by Principal Component Analysis (PCA)
Morphological PC 1 PC2 PC3 PC4 PC5 characters Days to tasselling 0.120 0.874 0.446 0.264 -0.294 Days to silking 0.080 -0.213 0.617 0.235 -0.225 Flag leaf length 0.071 -0.259 0.220 -0.091 -0.411 Plant height 0.973 -0.016 -0.220 0.037 0.000 Tassel length 0.054 0.331 0.322 0.364 0.772 Tassel branches 0.139 -0.091 0.453 -0.807 0.276 Leaf above uppermost ear 0.010 -0.023 0.004 0.005 0.009 Cob length 0.053 -0.065 0.101 0.040 -0.006 Kernel rows/ cob 0.019 -0.015 0.041 -0.011 -0.077 Grains weight / plant 0.036 0.024 0.021 0.275 0.121 Eigenvalue 4.55 1.74 1.26 1.05 0.93 % variance 35.01 13.41 9.70 8.04 7.13
Table 7: Eigenvalues and percentage contributions of each seed morphometric parameters as revealed by Principal Compon ent Analysis
Seed parameters PC1 PC2 PC3 PC4 PC5 Seed length 0.786 0.580 -0.106 0.066 O.Q15 Seed width 0.757 0.514 0.237 -0.150 -0.003 Seed thickness -0.408 -0.204 0.812 0.175 0.204 Seed circumference 0.299 0.715 -0.083 0.164 0.163 Seed diameter -0.257 0.925 0.067 -0.042 -0.057 Seed angle 0.859 -0.424 0.055 -0.054 -0.086 Embryo angle 0.654 -0.590 0.013 -0.055 -0.103 Seed area 0.811 0.561 O.Q38 -0.041 0.001 Shape factor 0.795 -0.544 0.017 0.043 0.073 Flatness index 0.256 0.333 0.847 0.151 0.208 Eccentricity index 0.264 0.293 -0.583 0.354 O.Q28 Eigenvalue 4.765 3.588 1.939 1.045 0.942 %variance 34.039 25.627 13.852 7.464 6.727
200
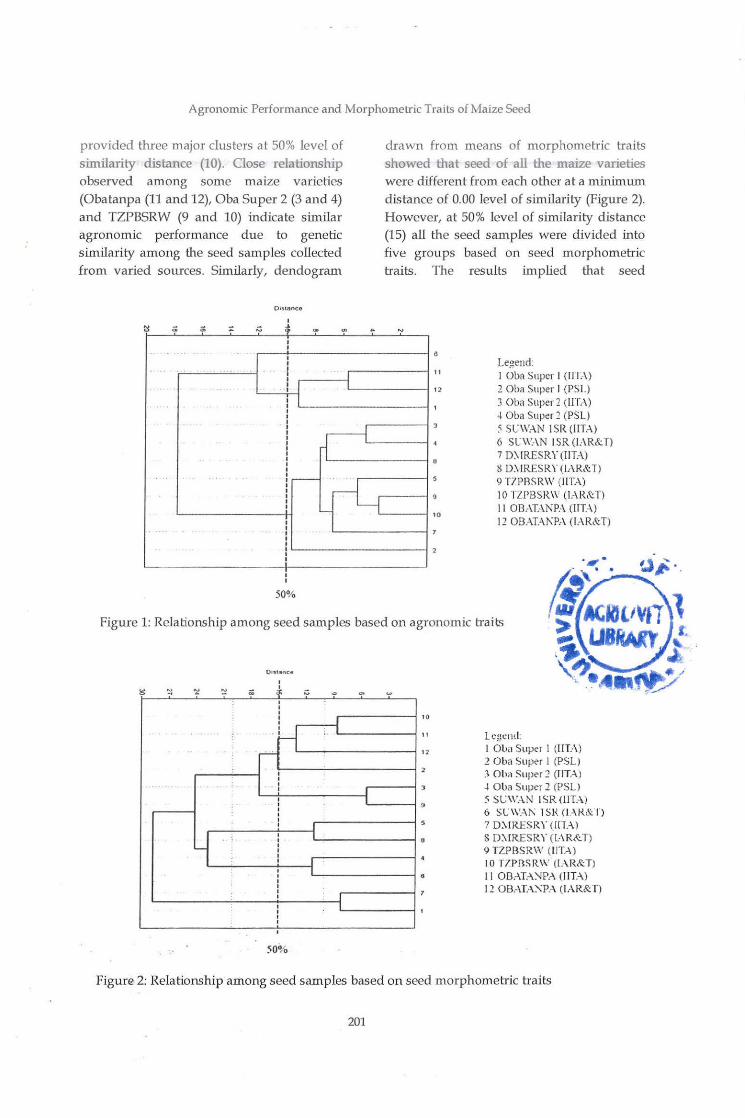
Agronomic Performance and Morphometric Traits of Maize Seed
provided three m ajor clus ters a t 50% level of similarity distance (10). Close relationship observed among some maize varieties (Obatanpa (11 and 12), Oba Super 2 (3 and 4) and TZPBSRW (9 and 10) indicate similar agronomic p erformance due to genetic similarity among the seed samples collected from varied sources. Similarly, dendogram
:!! 0: ;;; ::: ~ * ~ m
..
.. I I
rl ...
.
....--
~r-l-J . .
50 Vo
drawn from means of morphometric traits showed that seed of all the maize varieties were different from each other at a minimum distance of 0.00 level of similarity (Figure 2). However, at 50% level of similarity distance (1 5) all the seed samples were divided into five groups based on seed morphometric traits. The results implied that seed
~
11
12
10
Legend: I Oba Super I (Ill.-\) 2 Oha Super I (PSI.) 3 Oba Super 2 (l!Tr\) .J Oba Super 2 (PSL) 5 SC\\'.-\N I SR (liT.-\} 6 St.: WAN I SR (1:\ R& T) 7 D).IRESRY(IITAJ 8 D\IRESRY (IAR&T) 9 T7PASR\V (liT.-\) 10 TZPBSK\\' (1.-\R&Tl II OBAHNPA (liT.-\) 12 ODAHJ\PA (1.-\R&.T)
Figure 1: Relationship among seed samples based on agronomic traits
OrSI.ItttCe
I
~ ::: ~ ~ I
0: f " I I I
10 I I
,{1 11 Lt.:ll<'!!d :
12 I Oba Super I (riT:\) 2 Oba Supe-r I (PSL) :; Oha Sup<>r 2 (I IT-\)
3 .J Oba Super 1 (PSL)
9 5 SGW.-\ N I SR (IlT.-\) 6 SL \\'.-\1\ I Sl\ (1.-\R& I')
s 7 0:\ IR.ESRY (([H)
y ·. 8 D:\ IRESRY (L·\R&T) 9 TZPBSR\:V (liT-\) 10 T7 PflSR\\' (1.-\R&T)
6 II OBAT.--\~PA (liT.--\) 12 OBr\TA:'\PA (1.-\R&T)
50%
Figure 2: Relationship among seed samples based on seed morphometric traits
201
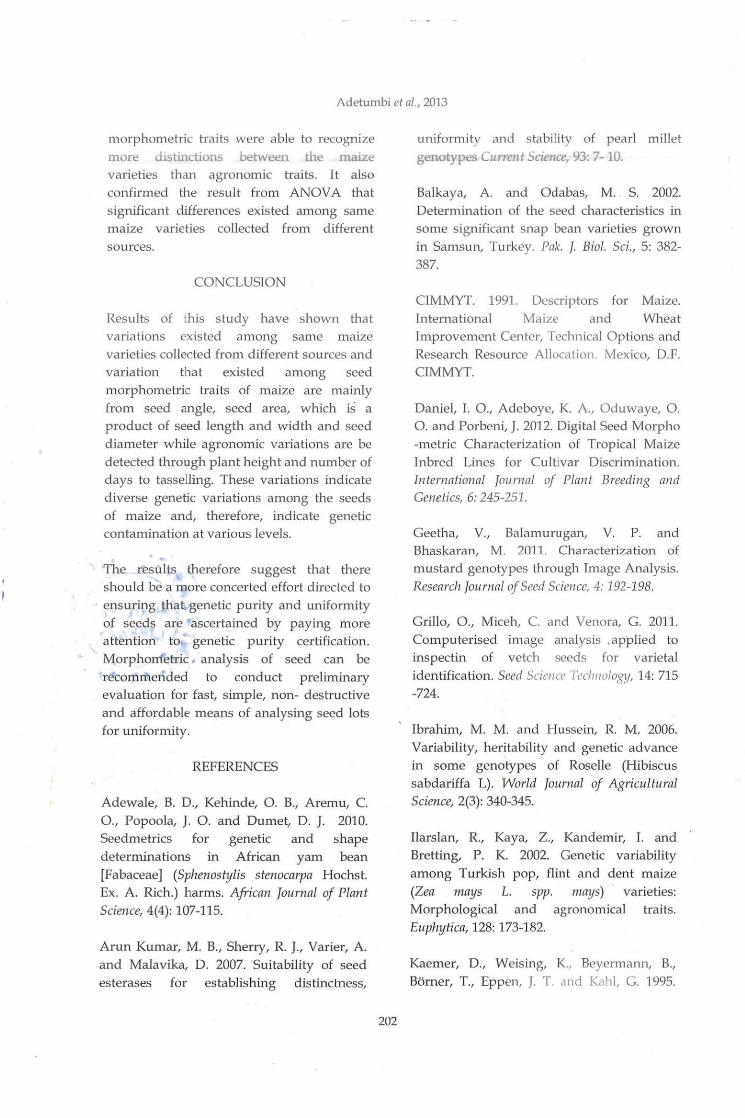
Adeturnbi et al. , 2013
morphometric traits were able to recognize more distinctions between the maize varieties than agronomic traits. It also confirmed the result from ANOV A that s ignificant differences existed among same maize varieties collected from different sources.
CONCLUSION
Results of this study have shown that variations existed among same maize varieties collected from different sources and variation that existed among seed morphometric traits of maize are mainly from seed angle, seed area, which is a product of seed length and width and seed diameter while agronomic variations are be detected through plant height and number of days to tasselling. These variations indicate diverse genetic variations among the seeds of maize and, therefore, indicate genetic contamination at various levels.
'The results therefore suggest that there should be a more concerted effort directed to ensuring that. genetic purity and uniformity of seeds are ascertained by paying more attention to genetic purity certification. Morphorrletric • analysis of seed can be recommended to conduct preliminary evaluation for fast, simple, non- destructive and affordable means of analysing seed lots for uniformity.
REFERENCES
Adewale, B. D., Kehinde, 0. B., Aremu, C.
0., Popoola, J. 0. and Dumet, D. J. 2010. Seedmetrics for genetic and shape determinations in African yam bean [Fabaceae] (Sphenostylis stenocarpa Hochst. Ex. A Rich.) harms. African Journal of Plant Science, 4(4): 107-115.
Arun Kumar, M. B., Sherry, R. J., Varier, A
and Malavika, D. 2007. Suitability of seed esterases for establishing distinctness,
202
uniform ity and stability of pearl millet genotypes Current Science, 93: 7-10.
Balkaya, A. and Odabas, M. S. 2002.
Determination of the seed characteris tics in some significant snap bean varieties grown in Samsun, Turkey. Pak. J. Bioi. Sci., 5: 382-
387.
CIMMYT. 1991. Descriptors for Maize. International Maize and Wh eat Improvemen t Center, Technical Options and Research Resource Allocation. Mexico, D.F. CIMMYT.
Daniel, I. 0., Adeboye, K. A., Oduwaye, 0. 0. and Porbeni, J. 2012. Digital Seed Morpho -metric Characterization of Tropical Maize Inbred Lines for Cultivar Discrimination. International Jou rna/ of Plant Breeding and Genetics, 6: 245-251.
Geetha, V., Balamurugan, V. P. and Bhaskaran, M. 2011. Characterization of mustard genotypes through Image Analysis. Research Journal of Seed Science, 4: 192-198.
Grillo, 0., Miceh, C. and Venora, G. 2011.
Computerised image analys is .app lied to insp ectin of vetch seeds for varietal identification. Seed Scienct' Technology, 14: 715 -724.
Ibrahim, M. M. and Hussein, R. M. 2006.
Variability, heritability and genetic advance in some genotypes of Roselle (Hibiscus sabdariffa L). World Journal of Agricultural Science, 2(3): 340-345.
llarslan, R., Kaya, Z., Kandemir, I. and Bretting, P. K. 2002. Genetic variability among Turkish pop, flint and dent maize (Zea mays L. spp. mays) varieties: Morphological and agronom ical traits. Euphytica, 128: 173-182.
Kaemer, D., Weising, K , Beyennann, B., Borner, T., Eppen, J. T. and Kahl, G. 1995.

Agronomic Performance and Morphometric Traits of Maize Seed
Oligonucleotide fingerprinting of tomato Dann. Plant Breeding, 114: 12-17.
Keefe, P. D. and Draper, S. R. 1986. The measure ment of new characters for cultivar identification in wheat, using machine vision. Seed Science Tecluwlogy, 14: 715-724. Morakinyo, ]. A. and Ajibade, S. R. 1998. Characterisation of segregants of an improved cowpea line IT84K-126-6. Nigerian Journal of Science, 32: 27-32.
Morris, M. L., Risopoulos, ]. and Beck. D. 1999. Genetic Change in Farmer-Recycled Maize Seed: A Review of the Evidence.CIMMYT Economics Working Paper No. 99-07. Mexico, D.F.
Ort iz, R. 1985. Efectoambienta l, in t e race i 6 n ge no ti pop ora m bi en t e yhereda bilid ad de lascaracteristicasmorfol6gicasutilizadas en la clasificaci6n racial de maiz en Ia Sierra del Peru. M.Sc. Thes is, Universidad NacionalAgraria-La Molina, Lima, Peru.
203
Sanchez, I J ., Goodman 'vi. 'v1. and Rawlings, ). 0 . 1993.Appropriate characters for racial classification in maize. Econ. Bot., 47:44-59.
Utobo, E. B., Okporie, E. 0., Oselebe, H. 0., Ekwu, L. G., Ogah, E. 0. and Nwokwu, G.
N. 2010. Evaluation of eleven varieties of maize (Zeamnyzl.) in Abakaliki Agricultural Area, Southeastern Nigeria. Continental J. Agricultural Science, 4: 42 - 47.

Journal of Applied Agriculhual Research 2013, 5(2): 205-216 ISSN 2006-750X c \gr~.<:ultural Rf'Search Council of Nigeria, 2013
EVALUATION OF THE HEAVY MET Al.5 REMEDIATION POTENTIAL OF CASHEW (Anacardium occidentale) ON EDT A-APPLIED ACIDIC AND BASIC SOII.5
*Azeez, J. 0.1, Yusuf, 0. M.t, Busari, M. A.l and G. T. Salaudeen2 IDeparbnent of Soil Science and Land Management,
Federal University of Agriculture, P.M. B. 2240 Abeokuta, Nigeria 20eparbnent of Forest Products Development and Utilization,
Forestry Research Institute of Nigeria, Jericho Hill, P.M. B. 5054, Ibadan, Nigeria *[email protected]; +2348037156262
ABSTRACT
The metals extractive ability and the distTibution in cashew seedlings were evaluated in the screen house with the application of EDTA to soils artificially spiked with Pb, Cd and Zn. The results indicated that metal bioavailability was enhanced by soil acidity. The order of abundance of the metals in the plant's part was: root > leaf> stem. With the application of EDTA at 5 mmol l-1 and heavy metals at 400 mg kg-,, the average uptake of Pb, Cd and Zn, in the shoot of the plant was 43.04 mg kg·l, 200.61 mg kg·' and 34.42 mg kg·1, respectively under basic soil and 26.92 mg kg·l, 145.47 mg kg·l, 30.57 mg kg·l in acidic soil. Metal uptake selectivity by cashew was: Cd > Zn > Pb. The metals were concentrated in the root of the plant, indicating difficulties in mobilizing the heavy metals to the shoot system. Concentrations of the metals in the shoot suggest that cashew is suitable for phytoremediation.
Keywords: cashew seedlings; eleml:!ut :;pt:!dation; heavy metals; metals partitioning; phytoremediation
INTRODUCTION
The ques t for the remediation of metal
pollu ted soils is high in the developed and developing coun tries, particularly for a sustainable option. Several methods of
remediating polluted soils have been documented in literature; however, each method has its own demerits (Michael and H uang, 2000; Glass, 2000). The most
perturbing concerns are of the nonsustainable potentials and high cost of the
interventions. An environment-friendly, cost-effective, sustainable and widely
accepted remediating option is phytorernediation. It is defined as the use of plants to remove pollutants from the environm ent or to render them harmless (Salt et al., 1998). According to Pulford and Watson (2003), five main subgroups of
205
phytoremediation have been identified and
they include: (i) Phytoextraction: where plants remove
metals from the soil and concentrate them in the harvestable parts of plants (Kumar et al., 1995); (ii) Phytodegradation: plants and
associated microbes degrade organ ic
pollutants (Burken and Schnoor, 1997); (iii)
Rhizofiltration: plant roots absorb metals from waste s treams (Dushenkov et al., 1995);
(iv) Phytostabilisation: plants reduce the
mobility and bioavailability of pollutants in the environment either by immobilisation or by prevention of migration (Vangronsveld et al., 1995); and (v) Phytovolatilisation:
vola tilisation of pollutants into the atmosphere via plants (Burken and Schnoor, 1999).
A zecz el a/. , 20 L3
Plant species are judged as being suited for phy toextraction based on severa l criteria including: wide distribubon, high aboveground biomass, high bioaccumulation factors (hy per accumulators), and high propagating ra tes. It has been reported that a significantly high amount of plant biomass can compensate for a relatively low cap acity for metal accumulation, resulting in the accumulation of large amounts of heavy metal removed from the soil (Zhuang et al., 2007). Trees have been suggested as a lowcost, sustainable and ecologically sound solution to the remediation of heavy metal contaminated land (Dickinson, 2000),
particularly for soils which have been washed-off by heavy metals; thereby, leaching pollutants to the subsoil which ordinarily are not accessible to lower arable plants used in phy toremediation. Dendroremedia tion is thus an emerging phy toremedia tion technology (1-Iadacek, 2002) for cleaning up soils contaminated with organic or inorganic pollutan ts by using trees to extract pollutants. The success of dendroremediation is however, dependent on several factors; (i) plants must be able to produce sufficient biomass for much extraction, (ii) plants should be respons ive to agricultural practices to allow repeated planting and harvesting, (iii) in addition, these plants should be preferentially able to accumulate environmentally toxic materials (Pulford and Watson, 2003). For the purposes of dendroextraction, Punshon et al. (1996) su ggested that the following characteristics were beneficial: (a) ability to grow on nutrient-poor soil, (b) deep root system, (c) fast rate of growth, (d) metalresistance trait.
In addition to these factors, the availability of the heavy metal in the soil for plant uptake is another limitation for successful dendraremediation. For example, Pb, one of the heavy metals deposited in soil has limited solubility and availability for plant uptake due to adsorption by soil colloids (McBride,
206
1994), thus, making the soluble level of lead VNY low, not a llowing substantial uptake bv plants. To enhance solubility of such pollutants, chelators are applied to soil; chelators desorb heavy metals from soil colloids/ solid phases by fom1ing strong water soluble-complexes, which can be removed from the soil by plants through enhanced phytoextraction (Lestan et al., 2008). Another factor to consider is leaching of the pollutants beyon d the root zone of the top soil; thus, making dendra-remediation an alternative for exb·action of heavy metals leached beyond root zone to prevent pollution of ground water table because h·ees tend to have a deep root system. The usc of trees in remediation of polluted soil, mostly in temperate countries, is very common (Dickinson, 2000; Pulford et al., 2002) while EDT A has also been used for enhan ced phytoremediation (Sun et al., 2001; Bm·ona et al., 2001).
Despite the p rom ising potential of trees at remedia ting polluted soils, past efforts on dendra-remediation have focused on temperate tree species like the genus Salix which belongs to the Salicaceae plant family, with over 400 species and more than 200
listed hybrids (Newsholme, 1992), Betula (Birch), Populus (Poplar), All!us (Alder) an d Acer (Sycamore). All these and many more are not available in the tropical countries, hence the need to evaluate the potential of promJSmg tropical trees like cashew (Anacnrdium occidentale). Consequently the experiment was set up with the objectives of evaluating the effect of different soil reactions on the heavy meta I extractive abili ty of Anacardiwn occiden talis; evaluating the effect of ethylene-diamine-teh·a-acetic acid (EDTA) on heavy meta l exh·active ability of Anacarcliwn occidentalis; and evaluate the heavy metal selectivity of the cashew seedling.

I feavy Me ta l Remediatio n Potentia l o f Cashew
MATERIALS AND METHODS
Soil sample collection and characterisation
The study was a pot experiment carried out in the N ursery of the Department of Horticulture, Federal University of Agriculture, Abeokuta, Nigeria. Soil samples a t the depth of 0 -15 em were collected from two locations viz: Makun (Ogun Waterside) W30'N, 4°10'E, 14m above sea level (ASL)] and Ewekoro W54'N, 3°13'E, 53 m ASL] in Ogun State, representing acidic and alkaline soil, resp ectively. The soil was air-dried for 48 hours and sieved (2 mm mesh size). Ten kg each of the soils were d ispensed into several plas tic pots while the remaining was used for pre-planting laboratory an alyses as fo llows: total N using micro-Kjeldahl digestion techniques Uackson, 1964), soil pH using 1:1 (soil : water) and determined using potentiometric method, organic matter content us ing wet-oxidation method (Walkley and Black, 1934), available P extracted using Bray 1 (Bray and Kurtz, 1945) and determined colorimetrically using Murphy and Riley (1962) method. Exchangeable bases were extracted using 1N NH40Ac buffered at pH 7; Na and Kin the ex tract were determined using flame photometry w hile Ca and Mg were determined using atomic absorption spectrophotometer (AAS), particle size distribution of the soil was determined by hydrometer method (Bouyoucos, 1951), heavy metals (Pb, Cd and Zn) were extracted with 0.05 M EDT A solution and determined using the AAS. Seeds of Anacardium
occidentale (Brazilian biotypes) used for the experiment were raised from seeds in-situ in polythene sacks to seedlings for 32 days in the screen house.
Heavy metal contamination, treatment allocation and seedlings propagation
Each soil pot (10 kg) was artificially contaminated with 400 mg kg-1 soil of Cd, Pb
207
and Zn as CdCh.2V2I-hO, Pb(N01)2 and ZnO sal~ (Adesodur t al 2010). respecti" ·ly to achieve desirable concentrations of Cd, Pb and Zn pollution. Two (2) soil types from differen t locations and four (4) trea tments replicated thrice, making a total of twentyfour (24) experimental pots were used for the study. The h·eatments were (i) heavy metal contaminated soil without EDT A (ii) heavy m etal contaminated soil with EDT A (iii) noncontaminated soil with EDT A (iv) noncontaminated soil without EDTA (control experimen t). The soi l after contamination and wetting was left for 16 days to equilibrate; afterwards, the seedlings of Anacardium occidentale (1 seedling/ pot) were transplanted into the pots. Ten ml (10 ml) of ethylenediamine-tetraacetic acid (EDTA) was applied at concentration of 5 mmoll-1 as solution at 2nd week after transplant (4th week after heavy metal contamination). Following applications of amendment, the soil was irrigated to field capacity. The plant was hatvested carefully by uprooting th P p lant samples at the 8th week after heavy metal contamination to check for heavy metal concentration in plant parts. The plant was washed off soil with distilled water and then separated in to parts viz; root, stem and leaves. The parts were oven d ried at 70 oc to constant weight and then milled. Heavy metal concentration was determined by digesting milled plants in HN03, HzS04, and HCl01 at ratio 3:1:1. The digest was then analyzed for Cd, Pb and Zn using Atomic Absorption Spectrophotometer (AAS) at SMO laboratory in Ibadan, N igeria.
Soil analysis and calculations
Soil samples from each experimental pot were sampled at 8th week after heavy metal contamination. Soil samples were weighed a nd extracted in O.OSM EDTA and then analyzed for extractable Cd, Pb and Zn using AAS. The translocation factor (TF) of heavy metals from roots to shoots and the enrichment coefficient (EC) of heavy metals

Azeez et al. , 2013
in a plant (Zu et al., 2005) were calculated as follows:
TF = C above ground/ C soil
Where: C above ground is the metal concentration in stem and leaf tissues; C soil is the metal concentration in soil
(Ghosh and Singh, 2005).
EC = C above groW1d/ C root
Where: C above ground is the metal concentration in stem and leaf C root is the metal concentration in root. This was calculated for each heavy metal to ascertain effect concerning concentration, uptake, translocation and selectivity.
Statistical analysis
Data collected were subjected to analysis of variance while leasl sign.ificant differences (LSD) of the means at 5% probability level
were used to separate the means. Correlation analysis was done to de termine the relahonship among the studied parameters. All analyses were done using SAS analytical package version 8.
RESULTS
Soil properties
The properties of the two soils used for the experiment are shown in Table 1. It was observed that the soils differed in characteristics. The pH of the soils indicated that they diffe red in reaction. Both soils were poor in nutrients and organic matter contents. Ewekoro soil characteristically had higher Ca compared with the MakW1 soil. The ECEC value also showed that Ewekoro soil had higher cations than the Makun soil. The acidic soil had higher Cd while Ewekoro soil had higher values of Pb, Cu, Zn, Mn and Fe. The textural class of the soils was sand and loamy sand for Makun and Ewekoro soils, respectively.
Table 1: Some properties of the soils used for the screen house experiment
Parameter Units Makun Ewekoro {Acidic soil} {Basic soil}
pH 4.80 7.50 Organic carbon g kg-1 13.00 13.20 Total nitrogen g kg-1 1.10 1.30 Available phosphorus mg kg-1 11.35 10.65 Exchangeable K c mol kg-1 0.06 0.73 Exchangeable Na c mol kg-1 0.03 1.17 Exchangeable Mg c mol kg-1 0.16 0.46 Exchangeable Ca c mol kg-1 1.17 9.68 Exchangeable H+AI c mol kg-1 0.15 0.02 ECEC c mol kg-1 3.33 10.99 Pb mg kg-1 0.20 5.70 Cd mg kg-1 7.95 2.35 Cu mg kg-1 1.10 1.00 Zn mg kg-1 6.45 7.20 Mn mg kg-1 1.10 9.30 Fe mg kg-1 9.80 15.65 Particle size sand g kg-1 924.00 764.00 Particle size clay g kg-1 48.00 148.00 Particle size silt g kg-1 28.00 88.00 Texture class sand Loamy sand
208
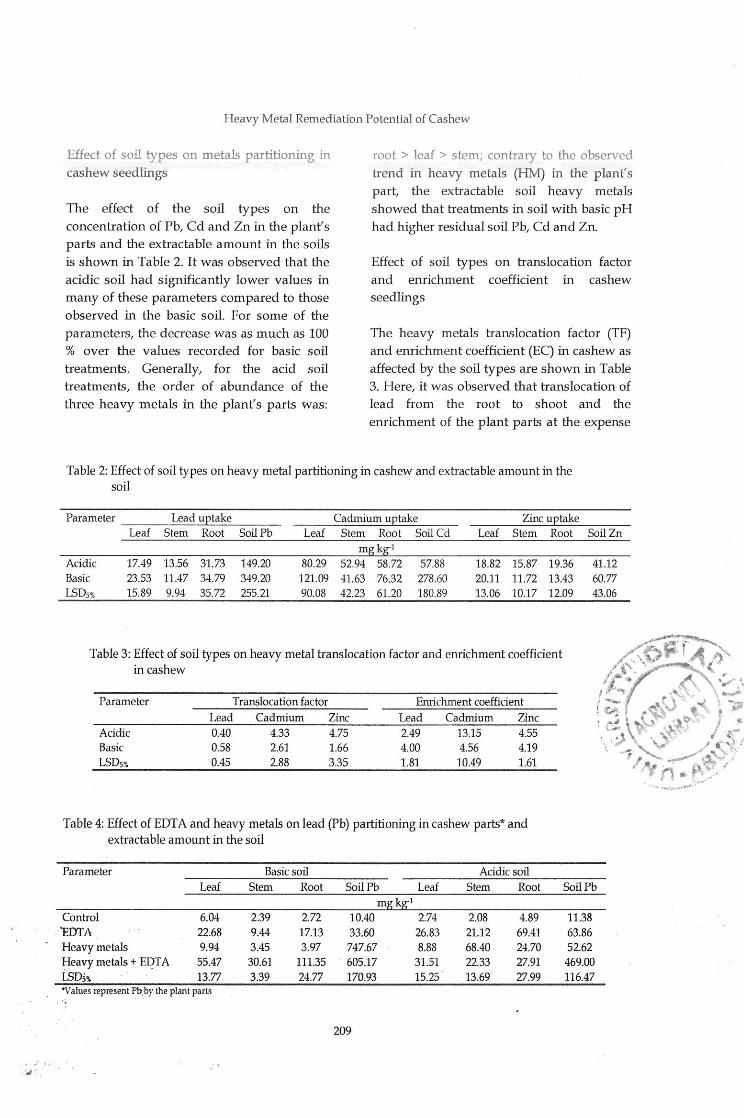
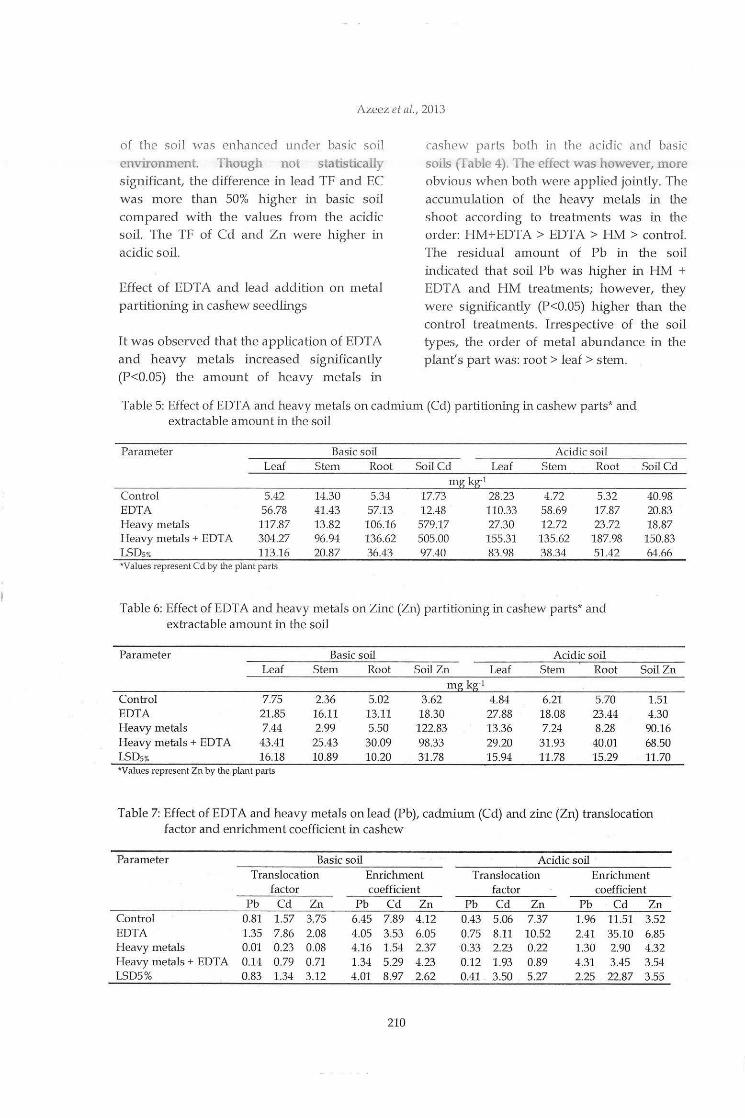
Azeez et al., 2013
of the soil was enhanced under basic soil
environment Though not statistically significant, the difference in lead TF and EC was more than 50% higher in basic soil compared with the values from the acidic soil. The TF of Cd and Zn were higher in acidic soil.
Effect of EDT A and lead addition on metal partitioning in cashew seedlings
It was observed that the application of EDTA and heavy metals increased significantly (P<O.OS) the amount of heavy metals in
cashew parts both in the acidic an d basic soils (Table 4). The effect was however, more obvious when both were applied jointly. The accumulation of the heavy metals in the shoot according to b·eatments was in the order: HM+EDTA > EDTA > HM >control. The residual amount of Pb in the soil indicated that soil Pb was higher in HM + EDTA and HM treatments; however, they were significantly (P<O.OS) higher than the conh·ol h·eatments. Irrespective of the soil types, the order of metal abundance in the plant's part was: root> leaf > s tem.
Table 5: Effect of EDTA and heavy metals on cadmium (Cd) partitioning in cashew parts* and extractable amount in the soil
Parameter Basic soil Acidic soil Leaf Stem Root Soil Cd Leaf Stem Root Soil Cd
m k ·I
Control 5.42 14.30 5.34 17.73 28.23 4.72 5.32 40.98 EDTA 56.78 41.43 57.13 12.48 110.33 58.69 17.87 20.83 Heavy metals 117.87 13.82 106.16 579.17 27.30 12.72 23.72 18.87 Heavy m etals + EDT A 304.27 96.94 136.62 505.00 155.31 135.62 187.98 150.83 LSDs% 113.16 20.87 36.43 97.40 83.98 38.34 51.42 64.66 *Values represent Cd by the plant pa rts
Table 6: Effect of EDTA and heavy metals on Zinc (Zn) partitioning in cashew parts* and extractable amoun t in the soil
Parameter Basic soil Acidic soil Leaf Stem Root Soil Zn Leaf Stem Root Soi! Zn
m k · I
Control 7.75 2.36 5.02 3.62 4.84 6.21 5.70 1.51 EDTA 21.85 16.11 13.11 18.30 27.88 18.08 23.44 4.30 Heavy metals 7.44 2.99 5.50 122.83 13.36 7.24 8.28 90.16 Heavy metals + EDT A 43.41 25.43 30.09 98.33 29.20 31.93 40.01 68.50 LSDs" 16.18 10.89 10.20 31.78 15.94 11.78 15.29 11.70 *Values represent Zn by the plant parts
Table 7: Effect of EDTA and heavy metals on lead (Pb), cadmium (Cd) and zinc (Zn) translocation factor and enrichment coefficien t in cashew
Parameter Basic soil Acidic soil Translocation Enrichment Translocation Enrichment
factor coefficien t factor coefficient Pb Cd Zn Pb Cd Zn Pb Cd Zn Pb Cd Zn
Control 0.81 1.57 3.75 6.45 7.89 4.12 0.43 5.06 7.37 1.96 11.51 3.52 EDTA 1.35 7.86 2.08 4.05 3.53 6.05 0.75 8.11 10.52 2.41 35.10 6.85 Heavy metals 0.01 0.23 0.08 4.16 1.54 2.37 0.33 2.23 0.22 1.30 2.90 4.32 Heavy metals + EDT A 0.14 0.79 0.71 1.34 5.29 4.23 0.12 1.93 0.89 4.31 3.45 3.54 LSD5% 0.83 1.34 3.12 4.01 8.97 2.62 0.41 3.50 5.27 2.25 22.87 3.55
210
Heavy Metal Remediation Potential of Cashew
Effect of EDT A and cadmium addition on metal part:Ibonmg m cashew seedlmgs
The uptake of Cd by the plant parts is shown in Table 5. It was observed that Cd uptake by cashew leaf, stem and root was significantly (P<O.OS) higher in treatments w ith joint application of HM and EDT A than other treatments under basic and acidic soil reaction. Data from basic soil also showed that the application of EDT A and HM singly or jointly enhanced the uptake of Cd by cashew parts. A similar trend was observed with the soil extractable Cd. The trend noticed under acidic soil is similar to that from the basic soil. Generally, there was more accumulation of Cd in the leaf compared to other plant parts.
Effect of EDT A and zinc addition on metal partitioning in cashew seedlings
Table 6 shows that the application of the treatments to basic soil resulted in the accumulation of Zn in cashew parts in the order: leaf> root> stem. However, the effect of the treatments was significant (P<O.OS) on the plant's Zn content particularly under the basic soil. Higher Zn values were recorded under HM + EDT A -treatments followed by EDT A treatment, then HM alone treatment and least in the control. A similar trend was observed on acidic ~oil samples. For both soils, the extractable :sc;>il Zn was significantly (P<O.OS) highest in_ HM treatme~t, followed by HM and EDTA ~eatm~t then' EDTA treatment and lmyest in the control.
Effect of EDT A and metal addition on metal translocation factor and enrichment coefficient in cashew seedlings
The effect of EDT A and heavy metals on lead (Pb), cadmium (Cd) and zinc (Zn) translocation factor and enrichment coefficient in cashew is shown in Table 7. The results indicated that under the basic soil treatments, a higher TF was recorded in
211
the control and EDT A alone treatments. On the other hand,. the significantly (P<O.OS) high EC was observed in treatment with EDT A alone for Zn. The treatments under acid soil however, showed that the application of EDTA alone resulted in significantly (P<O.OS) higher TF and EC in all the metals studied. The lowest TF and EC values were recorded in treatments with EDTA and HM applied jointly.
DISCUSSION
The higher pH and Ca content of Ewekoro compared with Makun soils might be due to cement dust deposition in the soils of Ewekoro area. Cement and its dust characteris tically contain high amount of calcium. The data shown indicated that basic soil enhanced the uptake of metals by the crop. This is perhaps due to the effect of the addition of EDT A and heavy metals to the soils. With EDT A the soil acidity is enhanced and the metals solubility is increased; all these are known to enhance metal uptake by plan ts (Cui et al., 2004). It also means that basic soil polluted with heavy metals will need some level of acidification before any plant remedial efforts could be achieyed. It:-has been widely r~ported m literature -that soil aeidific~tion
enhances the bioavailability of hee)vy metals (Salt et aC 1995; Chlopecka et al., _1996;
Blaylock et al., 1997; Cui et• al., 2004). This , acidification could, 'h C'>wever, ·:'be · achieved ·
·either -by· appticatio~ of -~al 'or organic acids or acid-producing fertilizers · sueh as the sulphate or ch~oiide of ru:l\IDOnium (Salt et al., 1995; Huang et al., 1997-; Wasay eJ al., 1998), or the use of elemental S to decrease soil pH and 'increase the solubility of heavy metals in soils (Seidel et at., 1998; Kayser et al., 2000). By implication, acidic soil will also need to be treated with caution if polluted because of the free mobility of the heavy metals, especially when chela tor like EDT A is applied. It also means such soils are likely to e~1courage the pollution of the ground
Azeez et al., 2013
water by the leached metals. In fact, EDTA has been reported as one of the important chelates used for the solubility of heavy metals in soil (Blaylock et al., 1997; Finzgar and Lestan 2007; Turgut et nl., 2004).
The higher TF in acidic soil is probably due to the saturation of the soil exchange sites with protons and the subsequent exclusion of the heavy metals and thus, the high concentration of the metals in the soil water made them bioava ilable. Consequently, the plant's root translocates the absorbed metals to the shoot system. Blaylock et al. (1997)
noted that Pb translocation from roots to shoot is very slow, and Cr, Pb, and Hg have the least translocation rate to the plant tops (Chaney et al., 1997). The high translocation factor > 1 for Cd and Zn under acid soil shows the metal moved easily in the plant compared with Pb (Adesodun et al., 2010).
On the other hand, the higher EC in acidic soil treatments indicated that on a comparative basis, the acidic soil had higher amount of heavy metals in the soil compared with the basic soil. This also has implication for the ability of the plant cultivated and the environment. It implies that more metals arc potentially available for Joss to the environment through surface runoff and leaching. It also shows that cashew might not be able to absorb all the metals that have been made soluble by the EDT A applied and the acidic environment. According to Adesodun et al. (2010) and Haque et al.
(2008), the EC values greater than 1 indicate phytoremediation potential, hence the crop has a high remediative potential under these two soil conditions.
In the basic soil, the data suggests that the application of either EDT A or HM was able to mobilize soil heavy metals (HM) for plant uptake. The very low amount of soil Pb in the HM treatments might be due to leaching, partly because the soil was sandy. Acidification of basic soil with EDT A had hitherto been reported to solubulize soil Pb
212
(Finzgar and Lcstan, 2007). Generally, the trend observed showed that more of the lead was concentrated in the plant shoot while the leaves had higher amount compared with the stem. Lai and Chen (2004) had earlier found that EDT A treatment significantly increased the total uptake of Pb in the shoots of Rainbow pink and Vetiver grass over that obtained with the control treatment. Lesage et al. (2005) also reported that heavy metal concentrations in Helianthus annuus increased with EDT A concenh·ation but the actual amount of phytoextracted heavy metals decreased at high EDT A concentrations due to severe growth depression. The enhancement of Cd uptake by cashew parts by the application of EDT A and HM singly or jointly might not be unconnected with the solubilization of soil Cd and tl1e uptake by the cashew plant. This metal could have hitherto not been available under the bas ic soil environmen t. It thus, means that application of chelators might be one of the ways of enhancing heavy metal uptake for soil with basic pH. This is supported by the works of Safari Sinegani and Khalilikhah (2010), Evangelou et nl.
(2007) who all reported that the application of EDT A increased the uptake of Cd by crops. Vassil et al . (1998) have also reported that Cd-EDT A complex is mobile in plant root and shoot systems. However, under acidic soil, the residual soil Cd was least in EDT A treatment probably due to leaching of the mobilized Cd and also low in the control because some of the Cd might have not been detached from the soil component at extraction.
The higher values in the treatment compared with when HM alone was applied to the soil showed that the soil media needs acidification before heavy metal mobilization and uptake by the cashew plants . The application of the EDT A might, however, predispose the p lants to metal toxicity if added in excess (Sun et al., 2001). The residual soil Pb, Cd and Zn were also seen to
Heavy Metal Remediation Potential of Cashew
be higher in this particu lar treatment, The lower amounts of soll metals m treatment with EDT A + HM could be explained in part by the likelihood of the leaching of the solubulized metals by the application of EDT A. On the other hand, in the basic soil treatments the addition of chelators was needed to make the applied heavy metals soluble before uptake by the plant. Luo et al.
(2005) reported that the application of EDTA significantly increased the shoot-to-root ratios of Cu, Pb, Zn, and Cd in corn (Zea mays L. cv. Nongda 108) and in white bean (Phaseolus vulgaris). EDTA is also known to form high-stability complexes with heavy metals such as Fe, Zn, and Pb (Satroutdinov et al., 2000).
The TF and EC data obtained due to application of EDT A and HM revealed that phytoremediative ability of cashew was enhanced by the addition of EDT A alone in the soils. With this, the native soil HM was mobilized and taken up by the plants. On the other hand, the extra application of EDT A as done in this study reduced the efficiency of transport of HM from the roots to shoot perhaps due to metal toxicity effects on the plant. The results from the present s tudy showed that the plant had low Pb, Cd, and Zn translocation factor values, indicating that plants had difficulties in mobilizing the heavy metals in the root zone. Application of EDT A was, however, seen to improve the efficiency of Pb uptake. Metal uptake and translocation of an element from roots to shoots is basically linked to the element speciation, soil pH, and other factors. However, in this study it was noted that the multi-contamination of the soil could have affected the plant's performance.
CONCLUSION
The study showed that heavy metal bioavailability is enhanced under acidic soil environment. The order of abundance of the three heavy metals in the plant's parts was:
213
root> leaf > stem. The application of EDTA enhanced the heavy metal extracti e ability of cashew plant. Metal uptake by cashew was in the order of abundance: Cd > Zn > Pb. The results also showed that huge part of the heavy metals was concentrated in the root of the plant indicating that plants had difficulties in mobilizing the heavy metals to the shoot system." However, the concentration of the metals in the shoot suggests that the plant is suitable for phytoremediation. The application of EDTA at 5 mmol 1-1, as done in this study, could perhaps have been toxic to the cashew plant and hence reduced its heavy metal extractive ability. Further research on different levels of EDTA additions is recommended to ascertain the proper dose of EDTA in enhanced phytoremediation; however, the environmental risk of EDT A application should be considered.
REFERENCES
Adesodun, J. K., Atayese, M. 0., Agbaje, T. A., Osadiaye, B. A., Mafe, 0. F. and Soretire, A. A. 2010. Phytoremediation potentials of Sunflowers (Tithonia diversifolia and Helianthus annuus) for Metals in Soils Contaminated with Zinc and Lead Nitrates. Water Air and Soil Pollution, 207: 195-201.
Barona, A., Aranguiz, I. and Elias, A. 2001.
Metal association$ in soils before and after EDT A extractive decontaminations: implications for the effectiveness of further cleanup procedures. Environmental Pollution,
113: 79-85.
Blaylock, M. J., Salt, D. E., Dushenkov, S., Zakharova, 0., Gussman, C. and Kapulnik, Y. 1997. Enhanced accumulation of Pb in Indian mustard by soil-applied chelating agents. Environmental Science and Technology, 31: 860 -865.
Bouyoucos, G. H. 1951. A calibration of the hydrometer method for making mechanical

Azeez et al., 2013
analysis of soils. Agronomy follmal, 43: 434-
438.
Bray, R. H. and Kurtz, L. T. 1945.
Determination of total, organic, and available forms of phosphorus in soils. Soil
Science, 59: 39-45.
Burken, J. G. and Schnoor, J. L. 1997. Uptake and metabolism of Atrazine by poplar trees. Environmental Science and Technology, 31: 1399
-1406.
Burken, J. G. and Schnoor, J. L. 1999.
Distribution and volatilization of organic compounds following uptake by hybrid p oplar trees. Intem ational Journal of
Phytoremediation, 1: 139-151.
Chaney, R. L., Malik, M., Li, Y. M., Brown, S. L. , Brewer, E. P. and Angle, J. S. 1997.
Phytoremediation of soil metals. Current
Opinion in Biotechnolog~;, 8: 279-284.
Chlopecka, A., Bacon, J. R., Wilson, M. J. and Kay, J. 1996. Forms of cadmium, lead, and . zinc in contaminated Soils from southwest Poland. Journal of Environmental Qualihj, 25:
69-79.
Cui, Y., Dong, Y., Li, H. and Wang, Q. 2004.
Effect of elemental sulphur on solubility of soil heavy metals and their uptake by maize. Environment International, 30: 323-328.
Dickinson, N. M. 2000. Strategies for sus tainable woodland on contaminated soils.
Chemosphere, 41: 259-263.
Dushenkov, V., Kumar, P. B. A. N., Motto, H. and Raskin, I. 1995. Rhizofiltration: the use of plants to remove heavy me tals from aqueous streams. Environmental Science and
Technolog~;, 29: 1239-1245.
Ev angelou, M. W. H., Ebel, M. and Schaeffer, A. 2007. Chelate assisted phytoextraction of heavy metals from soils. Effect, mechanism,
214
toxicity, and fate of chelating agents. Gtemospll.ere, 68: 989-1003.
Finzgar, N. and Lestan, D. 2007. Multi-step leaching of Ph and Zn contaminated soils with EDT A. Chemosphere, 66: 824-832.
Ghosh, M. and Singh, S. P. 2005. A
comparative s tudy of cadmium phytoextraction by accumulator and weed species. Environmental Pollution, 133: 365-371.
Glass, D. J. 2000. Economic potential of phytoremediation.In Phytoremediation of Toxic Metals Using Plants to Clean u p the Environment. Eds. Raskin, I and Ensley, B D. pp. 15- 31. John Wiley & Sons, Inc., New York.
Hadacek, F. 2002. Secondary metabolites as plant traits: current assessment and future perspectives. Critical Review in Plant Science,
21: 273-322.
Haque, N., Peralta-Videa, J. R., Jones, G. L., Gill, T. E. and Gardea-Torresdey, J. L. 2008.
Screening the phytoremediation potential of desert broom (Braccharis sarathroides Gray) growing on mine tailings in Arizona, USA. Environmental Pollution, 153: 362-368.
Huang, J. W., Chen, J. J., Berti, W. R. and Cunningham, S. D. 1997. Phytoremediation of lead-contaminated soils: role of synthetic chelates in lead phytoextraction. Environmental Science and Technolog~;, 31: 800-
805.
Kayser, A., Wenger, K., Keller, A., Attinger, A., Felix, H. R. and Gupta, S. K. 2000.
Enhancement of phytoextraction of Zn, Cd, and Cu from calcareous soil: the use of NT A and sulphur amendments. Environmental Science and Technolog~;, 34: 1778
-1783.
Kumar, P. B. A. N., Dushenkov, V., Motto, H. and Raskin, I. 1995. Phytoextraction: the use
Heavy Metal Remediation Potential of Cashew
of plants to remove heavy metals from soils. _ Environmental Science and Technology, 29: 1232
-1238.
Jackson, M. L 1964. Soil Chemical Analysis. Prentice Hall Englewood Cliffs NJ pp. 86-92.
Lai, H Y. and Chen, Z. S. 2004. Effects of EDT A on solubility of cadmium, zinc, and lead and their uptake by rainbow pink and Vetiver grass. Chemosphere, 55: 421-430.
Lesage, E., Meers, E., Vervaeke, P., Lamsal, S., Hopgood, M., Tack, F. M. G. and Verloo, M. G. 2005. Enhanced phytoextraction: II. Effect of EDT A and citric acid on heavy metal uptake by Helia11thus annuus from a calcareous soil. International Journal of Phytoremediation, 7: 143-152.
Lestan, D., Luo, and Li X. 2008. The use of chelating agents in the remediation of metalcontaminated soils: A review. E11vironmental Pollution, 153: 3-13.
Luo, C. L, Shen, Z. G. and Li, X. D. 2005.
Enhanced phytoextraction of Cu, Pb, Zn and Cd with EDT A and EDDS. Chemosphere, 59: 1 -11.
McBride, M. B. 1994. Environmental Chemistn; of Soils. New York: Oxford Universih; Press.
Michael, J. B. and Huang, J. W. 2000. Phytoextraction of metals.In Phytoremediation of Toxic Metals Using Plants to Clean up the Environment. Eds. Raskin, I and Ensley, B D., p. 53- 70. John Wiley & Sons Inc., New York
Murphy, J. and Riley, J. P. 1962. A modified Single solution method for determination of phosphate in natural waters AnaL Chima Acta, 27: 31-36.
Newsholme, C. 1992. y{illow_s: The genus ' Salix. 224 p. Lp_ndon:· · Timber press, Incorporated.
215
Pulford, L D., Riddell-Black, D. and Stewart, C. 2002. Heavy metal uptake by willow clones from sewage sludge-treated soil: the potential for phytoremediation. International Journal of Phytoremediation, 4: 59-72.
Pulford, L D. and Watson, C. 2003. Phytoremediation of heavy metal contaminated land by trees: A review. Environment International, 29: 528-540.
Punshon, T. N., Dickinson, M. and Lepp, N. W. 1996. The potential of Salix clones for bioremediating metal polluted soil. In: Heavy metals and trees. Proceedings of a Discussion Meeting, Glasgow. Edinburgh: Institute of Chartered Foresters (Ed I Giimmerveen), p. 93-104.
Safari Sinegani, A. A. and Khalilikhah, F. 2010. Effects of EDT A, Sheep Manure Extract, and their Application Time on Cd Uptake by Helianthus annuus from a Calcareous Mine Soil. Soil Sediment and
Contamination: An International journal, 19(3): 378-390.
Salt, D. E., Blaylock, M. J., Kumar, P. B. AN., Dushenkov, V., Ensley, B. D. and Chet, I. 1995. A n ovel strategy for removal of toxic metals from the environment using plants. Biotechnologt;, 13: 468-474.
Salt, D. E., Smith, R. D. and Raskin, I. 1998. Phytoremediation. Annals of Review in Plant Physiologt; and Plant Molecular Biologt;, 49: 643
-668.
Satroutdinov, A D., Dedyukhina, E. G., Chistiakova, T. I., Witschel, M., Minkevich, I. G., Eroshin, V. K. and Egli, T. 2000.
Degradation of metal-EDT A complexes by resting cells of the bacterial strain DSM 9103.
Environmental Science and Technologt;, 34: 1715
-1720.
Seidel, H., Ondruschka, J., Morgenstern, P. and Stottrneister, U. 1998. Bioleaching of
A zeez eta/. , 2013
heavy metals from contaminated aq uatic sediments using indigenous sulphur oxidizing bacteria: a feasibility study. Wafer Science and Technology, 37: 387-394.
Sun, B., Zhao, F. J., Lombi, E. and McGrath, S. P. 2001. Leaching of heavy metals from contaminated soils using EDT A.
Environmental Pollution, 113: 111-120.
Turgut, C., Pepe, M. K. and Cutright, T. J. 2004. The effect of EDT A and citric acid on phytoremediation of Cd, Cr, and Ni from soil using Helianthus annuus. Environmental Pollution, 131, 147-154.
Vangronsveld, J., Van Assche, F. and Clijsters, H. 1995. Reclamation of a bare industrial area contaminated by non-ferrous m etals: in situ metal immobilization and revegetation. Environmental Pollution, 87: 51-59.
Vassil, A D., Kapulnik, Y., Raskin, I. and Salt, D. E. 1998. The role of EDT A in lead transport and accumulation by Indian mus tard. Plant PhysiolOgJJ, 117: 447-453.
216
Walkley, A. and Black, l. A. 1934. An
examination of the Degljareff method for determining soil organic matter, and a proposed modification of the chromic acid titration method. Soil Sciwce, 37: 29-38.
Wasay, S. A., Barrington, S. F. and Tokunaga, S. 1998. Remediation of soils poilu ted by heavy metals us ing salts of organic acids and chelating agents. Environmen tal TechnologJ;, 19: 369-379.
Zhuang, P., Yang, Q. W., Wang, H. B. and Shu, W. S. 2007. Phytoexh·action of Heavy Metals by Eight Plant Species in the Field. Water Air and Soil Pollution, 184: 235-242.
Zu, Y. Q., Li, Y., Chen, J. J., Chen, H. Y., Qi..n, L. and Schvartz, C. 2005. Hyperaccumulation of Pb, Zn, and Cd in herbaceous grown on lead-zinc mining area in Yunnan, China. Environment International, 31: 755-762.
Journal of Applied AgricuJtural Research 2013, 5(2): 217-222 ISSN 2006-750X ©Agricultural Research Council of Nigeria, 2013
EVALUATION OF HERBICIDES ON WEED CONTROL, PERFORMANCE AND PROFITABILITY OF ONION (Allium cepa) IN THE FOREST ZONE OF NIGERIA
*Ibrahim, U.I, Oluwatosin, 0. J. 2, Ayinde, B. T.3 and B. A. Mahmoud'! 1Samaru College of Agriculture, D.A.C., Ahmadu Bello University, Zaria
2 Department of Agronomy, University of Ibadan, 3Department of Agricultural Economics and Rural Sociology, Ahmadu Bello University, Zaria
4 Department of Crop Science and Horticulture, Federal University of Technology, Yola *Ibrusman2007@ yahoo.com, +2348034374967
ABSTRACT
Field experiments were conducted at Akufo Farm Settlement in Ibadan, Oyo State, Nigeria during the 2009 and 2010 dry seasons to evaluate the performance of herbicides on onion varieties. The treatments consisted of factorial combination of two varieties of onions (Redcreole and Early Texas yellow ) and five weed control methods (Three hoe weeding, 2400 g S-metolachlor ha-l, 107.25 g pendimenthaline ha-l, 94.5 g Oxyflorfen ha-1 and unweeded check). The treatments were laid out in a randomized complete block design replicated three times. The results revealed that all th e weed control methods s ignificantly (P<0.05) decreased weed population. Similarly, surv ival percentage of ortion was affected by the use of these herbicid es. Bulb diameter, number of bulbs and onion yield were affected by the application of the herbicides. The lowest yield in the unweeded ch eck was due to the com petition of weed with the onion plants for space, nu trients and light as was evident from the high population of weeds in this treatment. Among the evaluated herbicides, 94.5 g Oxyflorfen ha-l reduced weeds density which resulted in greater number of bulbs plot·1, highest survival percentage and highest bulb diameter. The gross margin and cost benefit ratio were also increased by the application of Oxyflorfen. Il was concluded that the profitability of producing onion in the Forest zone can be increased by the use of 94.5 g Oxyflorfen ha·1•
Keywords: weed, onion, varieties, h erbicides
INTRODUCTION
Onion (Allium cepa L.), belonging to the family Amaryllidaceae, is one of the most important vegetable crops all over the world. Onion is a condiment crop and usually consumed fresh in salad pickles or added in cooking dishes as a spice. Apart from furnishing n utrition, it provides relishing flavor to the diet. It is also used to cure a wide array of physiological disorders such as cough, obesity, insomnia, hemorrhoid, and constipation (BOPG, 2000). Weed control is an unavoidable need for successful production of vegetable crops like onion. Product losses increase with weed
217
infestation (Muhammed et al., 2003) . Controlling weed development during the onion crop cycle is essential to obtain high yields and marketable product. Onions do not compete well with weeds. They are slow growing and can suffer from su ccessive flushes of weed; they have narrow upright leaves which do not shade out weeds that emerge in the row. So early season weed con trol is critical for successful onion production (Tim and Charles, 2010).
The broad leaf herbicides available for post emergence use in onion is only marginally selective and are mos t effective if applied when weeds are small (Hasan and Malik,
Ibrahim et a/., 2013
2001). Crop injury is also more J..ikely when these herbicides are applied to young onion crop. Onion producers are faced with the troubling questions: Should herbicide be applied early to slow the weed and risk crop injury from the herbicide? Or would it be better to wait for the onion to get big enough to safely spray and risk crop loss from early weed competition or weeds getting too large to control? (Hassan, 2008).
It has been shown that farmers use various ways to control weeds; however, their dependence is mainly hoe weeding. Despite high yielding cultivars, adequate seedling per unit area, adequate irrigation and other cultural practices, yield is very low due to weed infestation (Appleby, 1996). Losses from 45% to 56% have been reported due to weed interference (Peter et al., 2007). Losses up to 96% in onion due to weed competition have been reported from United Kingdom (Bond and Burston, 1996). The critical weed competition is up to 40 days after transplanting (Rajendra et al., 1986). In weed control, yield was decreased by 54%
compared to the control (weed free condition). Uncontrolled weed growth caused 49-86% reduction in the bulb yield compared with best herbicide treatment Games and Harlen, 2010). · Ibrahim et al. (2011) rep01;ted that in the No~:thern Guinea Savannah of Nigeria the , application of Oxyflorfen reduced labour requirements by 75%. The yield and -economic p 'edormance of onion was·irnpressive when it was applied.-as post-emergence at 4 weeks after transplanting. Profitability of' onion was increased by 3% over hoe weeding and that yield loss was as ·high as 80% in an uncontrolled condition.
In Nigeria, onion is produced mainly in the Guinea Savannah and from 1995 till date there has been a decline in production in onion producing areas in terms of area and output/ha. Onion has become more expensive, particularly in the fores t zones,
218
where it is largely consumed The poor yield, cost of transportation and the bad road from the north to southern part of Nigeria is of major concern and these factors make onion very expensive. There is a need to evaluate onion productivity in the forest zone of Nigeria under weed control methods. There is little information on weed control in onion production in the forest zone of Nigeria. The objective of this work is to evaluate available early post-emergence herbicides on weed control and on the performance of onion.
MATERIALS AND METHODS
Field experiments were carried out at Akufo Farm Settlement in Ibadan, Oyo State (7023116N 30 531471E 275 m above sea level) during the dry seasons of 2009 and 2010. The treatments consisted of factorial combination of two varieties of onions (Redcreole and Early Texas yellow) and five weed control methods (Three hoe weeding, 2400 g Smetolachlor ha-1, 107.25 g pendirnenthaline ha-l, 94.5 g Oxyflorfen ha-l and unweeded check). The treatments were laid out in a randomized complete block design replicated three ·times.). Seeds were planted in a nursery at 15 em interval in a 120 em wide seed bed using a grove of about 12 mm depth along the rows. A seed rate of 60 g/ha was used. The seedlings were transp~anted 8 weeks after sowing in the nursery. The transplanted seedlings were fertilized · using 100 kg of NPK _15;~15:15 at five weeks after transplantirig and H:rigated weekly 'up to ~3 weeks after transplanting. The bulbs were harvested at 15 weeks after transpl~ting. Herbicides were applied at. 2 weeks aftertransplanting with knapsack sprayer in a spray volume of about 200 liters per ha. Unsprayed plots were hand-weeded at 4, 8 and 12 weeks after sowing. Data were collected on weed density, onion survival percentages, the diameter of onion, number of bulbs of onion and yield of onion. Data collected were subjected to analysis of variance, and where significant differences
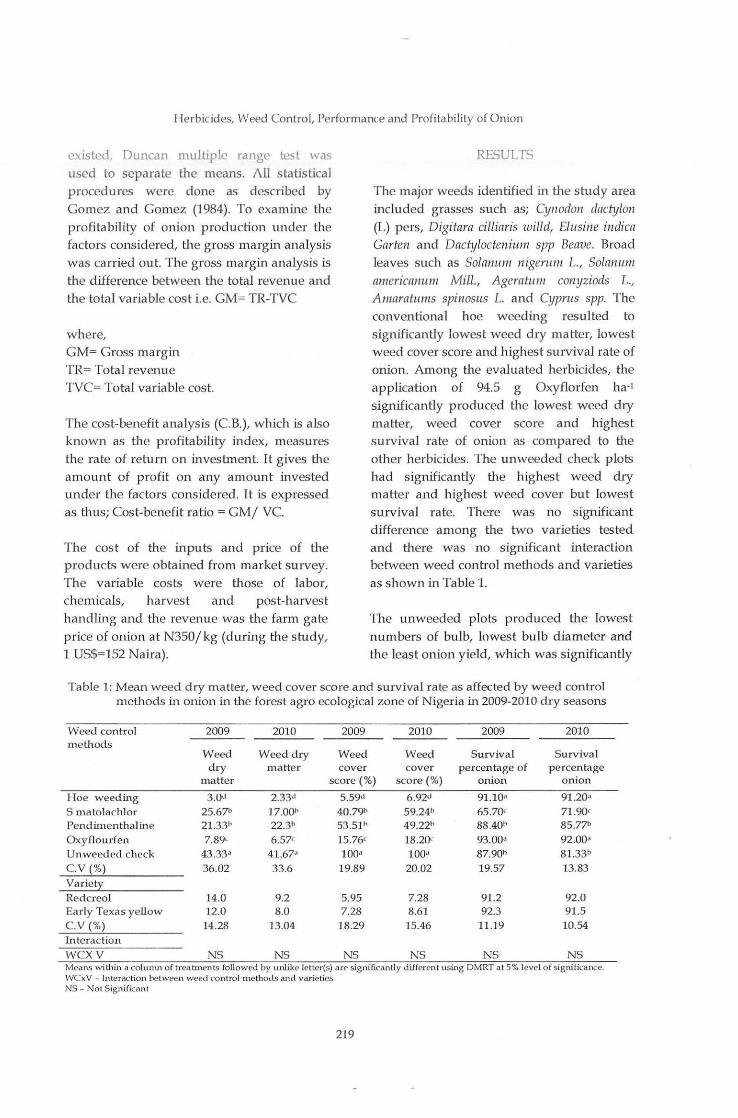
Herbicides, Weed Conlrol, Performance and Profitability of Onion
existed, DwKan multiple range test was used to separate the means. All statistical procedures were done as described by Gomez and Gomez (1984). To examine the profitability of onion production under the factors considered, the gross margin a11alysis was carried out. Th e gross margin analysis is the difference between the total revenue and the total variable cost i.e. GM= TR-TVC
where, GM= Gross margin TR= Total revenue TVC= Total variable cost.
The cost-benefit analysis (C. B.), which is also known as the profitability index, measures the rate of return on investment. It gives the amount of p rofit on any amount invested under the factors considered. It is expressed as thus; Cost-benefit ratio = GM/ VC.
The cost of the inputs and price of the products were obtained from market survey. The variable costs were those of labor, chemicals, harvest and pos t-h arvest handling and the revenue was the farm gate price of onion at N350/kg (during the study, 1 US$=152 Naira).
RESULTS
The major weeds identified in the study area included grasses such as; Cyl!odon dach;lon (L) pers, Digitara cillinris willd, Elusine indica Garten and Dach;loctenium spp Beave. Broad leaves such as Solanum nigenwt L., Solanum americallum Mill ., Ageratum conyziods L.,
Amaratums spinosus L. and Cyprus spp. The conventional hoe weeding resulted to significantly lowest weed dry matter, lowest weed cover score and highest survival rate of onion. Among the evaluated herbicides, the application of 94.5 g Oxyflorfen ha-l significantly produced the lowest weed dry matter, weed cover score and highest survival rate of onion as compared to the other herbicides. The unweeded check plots had significantly the highest weed dry matter and highest weed cover but lowest survival rate. There was no significant difference among the two varieties tested and there was no significan t interaction between weed control methods and varieties as shown in Table 1.
The unweeded plots produced the lowest numbers of bulb, lowes t bu lb diameter and the least onion yield, which was significantly
Table 1: Mean weed dry matter, weed cover score and surviva l ra te as affected by weed control methods in onion in the forest agro ecological zon e of Nigeria in 2009-2010 dry seasons
Weed control 2009 2010 2009 2010 2009 2010 me thods
Weed Weed dry Weed Weed Survival Survival dry m a tter cover cover percentage of p e rcentage
matter score(%) score (%) onion onion
Hoe weeding 3.0" 2.33" 5.59" 6.92" 91.10• 91.20d S matolachlor 25.67b 17.00h 40.79h 59.24b 65.70< 71.90< Pend imenthal ine 21.331' 22.3b 53.51h 49.22° 88.401' 85.77b Oxyflourfen 7.89' 6.57< 15.76< 18.20.- 93.00• 92.00d Unweeded check 43.33" 41.67·· 100• 100• 87.901> 81.33h C.V (%) 36.02 33.6 19.89 20.02 19.57 13.83
Varie t2:: Redcreol 14.0 9.2 5.95 7.28 91.2 92.0 Early Texas yellow 12.0 8.0 7.28 8.61 92.3 91.5 C.V (%) 14.28 13.04 18.29 15.46 11.19 10.54 Interaction wcxv NS NS NS NS NS NS Means within a colunm o f lrea lmenls fo llowed by u nlike letler(s) are significantly different using DMRT a t 5% level of significance. WCxV - Interaction between weed controlinethods and varie ties NS- Nol Significant
219

Ibrahim et al., 2013
lower as compared to the other weed control
treatments. The use of Oxyflorfen resulted to
onions with the highest bulb diameter and· onion yield which were significantly (P<0.05) higher than for hoe weeding. There
was similarity in bulb diameter when three hoe weedings, (application of 2400 g Sme tolachlor ha-l and 107.25 g pendimenthaline ha-l) was employed. The
mean yield produced by the use of Oxyflorfen was significantly higher than when hoe weeding was employed. Hoe weeding, however, produced mean yield
that was significantly higher when compared to the application of 2400 g S-metolachlor ha-l and 107.25 g Pendimenthaline ha-l as shown in Table 2.
The highest gross margin was obtained by the use of Oxyflorfen followed by hoe
weeding. The use of S-Metolachlor and Pendimenthaline gave the same gross margin and cost benefit ratio. The unweeded plots resulted to negative gross margin and cos t benefit ratio. The Redcreole variety was
N57,000 more profitable than the early Texas yellow variety (fable 3).
DISCUSSION
The results revealed tl1at all the weed control methods significantly (P<0.05) decreased weed population as reported by Muhammed
et al. (1986) and Peter et al. (2007). Similarly, survival percentage of onion was affected by the application of the various herbicides. Bulb diameter, number of bulbs and onion yield were affected by the application of the
various herbicides. These findings confirmed the results reported by Hassan and Malik (2001) and Ranjendra (1986). The lowest yield in the control was due to the competition of weeds with the onion plants for space, nutrients and light as is evident from the high population of weeds in this treatment. Three times hoe weeding reduced weeds competition which resulted in greater number of bulbs plot-1, highest survival percentage and highest bulb diameter. The use of Oxyflorfen gave the best performance
Table 2: Mean number of bulbs, diameter and yield of onion varieties as affected by weed control methods in 2009-2010
Weed control 2009 2010 2009 2010 2009 2010 2009-2010 methods Number Number Bulb Bulb Yield of Yield of Mean
of bulbs of bulbs diameter diameter Bulbs Bulbs yield of (tonnes/ha) (tonnes/ha) onion
bulb Hoe weeding 69.9(}1 70.60• 5.86° 6.06b 10.60b 10.07• 10.34b
S matolachlor 67.0(}1 65.00• 5.73b 5.30< 5.30< 5.73b 5.52<
Pendimenthaline 68.67• 68.00• 5.90b 6.00b 5.30< 5.72b 5.51" Oxyflourfen 69.80• 71.00• 6.40• 6,67• 13.58• 11.2• 12.39•
Un weeded check 59.00b 65.00b 2.90< 2.67d 0.67d 0.75< 0.71d
c.v (%) 28.29 20.55 42.41 32.11 18.75 15.54 17.15
Variety
Redcreol 68.3 70 6.67 6.54 10.5 9.59 10.05
Early Texas yellow 67.7 68.53 6.5 6.45 9.34 10 9.67 C.V. (%) 32.983 32.17 12.54 12.65 17.98 16.23 17.12 Interaction wcxv NS NS NS NS NS NS NS Means within a column of treatments followed by unlike letter(s) are significantly different using DMRT at 5% level of significance. WCxV- Interaction between weed control methods and varieties NS - Not Significant
220
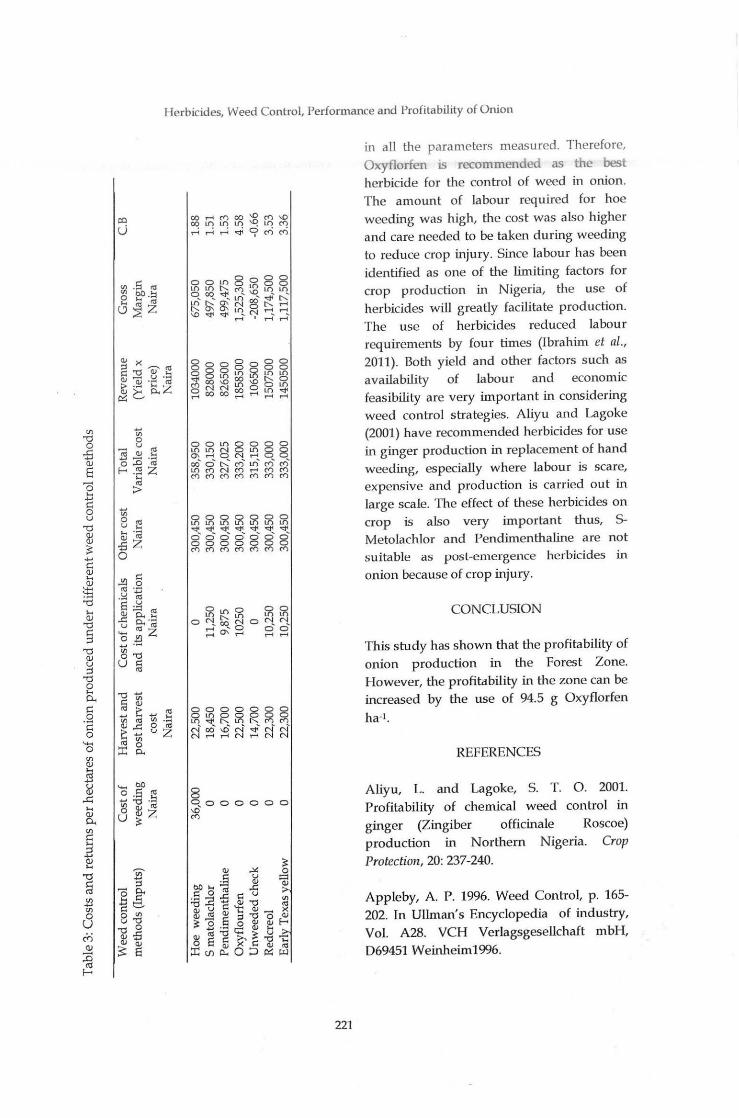
..... Ill 0 «l u ... ... ·a .Bz 0
Herbicides, Weed Control, Performance and Profitability of Onion
gg~~~~~~ ,....;,....;,....<""c:;>c<"ic<"i
8 qoo o ooo \0 C()
221
in all the parameters measured. Therefore, Oxyflorfen is recommended as the best herbicide for the control of weed in onion. The amount of labour required for hoe weeding was high, the cost was also higher and care needed to be taken during weeding to reduce crop injury. Since labour has been identified as one of the limiting factors for crop production in Nigeria, the use of herbicides will g reatly facilitate production. The use of herbicides reduced labour requirements by four times (Ibrahim et al., 2011). Both yield and other factors such as availability of labour and economic feasibility are very important in considering weed control s trategies. Aliyu and Lagoke (2001) have recommended herbicides for use in ginger production in replacement of hand weeding, especially where labour is scare, expensive and production is carried out in large scale. The effect of these herbicides on crop is also very important thus, 5-Metolachlor and Pendimenthaline are not suitable as pos l-emergence herbicides in onion because of crop injury.
CONCLUSION
This study has shown that the profitability of onion production in the Forest Zone. However, the profitability in the zone can be increased by the use of 94.5 g Oxyflorfen ha-1.
REFERENCES
Aliyu, L. and Lagoke, S. T. 0. 2001. Profitability of chemical weed control in ginger (Zingiber officinale Roscoe) production in Northern Nigeria. Crop Protection, 20: 237-240.
Appleby, A P. 1996. Weed Control, p. 165-202. In Ullman's Encyclopedia of industry, Vol. A28. VCH Verlagsgesellchaft mbH, 069451 Weinheim1996.

Ibrahim el al., 2013
Bond W. and S. Burston. 1996. Timing of removal of weeds from drilled salad onions to prevent crop losses. Crop protection 15:205-21.
BOPG. 2000. Bulb onion production guide
information Bulle tin No 197/2000 PCARRD. Deparbnent of Agricultural Region 1 V -Mimaropa.
Gomez, K. A. and Gomez, A. A. 1984. Statistical Procedures for Agricultural
Research. An international Rice Research Institute Book. A Wiley -Inter science
Publication John Wiley an d Sons.
Hassan, S. and Malik, F. M. 2001. Weed
Management in Broadcast Onion (Alliu111 cepa). Journal of Plant Science, 1: 28-30.
Hassan, Z. 2008. Evaluation of different
Herbicides for weed control in Onion. Sarhad Journal of Agriculture, 24(3): 453-456.
Ibrahim, U., Ayinde, T. B. and Mahmou d, B. A. · 201'1. Profitability of Onion (Allium cepa) Production as affected by various Weed
-control methods in Northern Guinea Savanna of Nigeria presented a t the 45u,
Annual conference of Agricultural Society of
Nigeria. Held a t Faculty of Agriculture Usman Danfodio University, Sokoto Nigeria, 24th to 28U' October. Programme of events
and order of presen tation, p. 12.
222
James, R L. and I Ia rlen, M. I I. V. 2010.
Multiplication of reduced rate herbicides for weed control in onion. Weed Tecl11lolog~;, 24 (2): 153-159.
Mohammed, S. ]., Abdul, G. and Rehman, S.
2003. Conventional and chemical conh·ol of weed in five cu ltivars of transplanted Onion. Pakistan journal of Weed Science Research, 9 (3&4): 215-224.
Peter, T., Lagoke, S. T. 0. and Ishaya, D. B. 2007. Evaluation of herbicides for weed control in irrigated Garlic Allium sativa L. at
Samaru, Nigeria. Crop Protection, 26(4): 642-646.
Ranjendra, S., Sinha, A. P. and Singh, A. 1986. Competitive efficacy of hand weeding for the conh·ol of weed in Onion. Hariana ]mmwl of Horticultural Science, 15(1 ): 276-82.
Tim, C. K. and Charles, P. 2010. Evaluation of Pre emergence Herbicide for early season onion weeds con trols. http/ ag.arizona.ed u./ pubsjcrop/ az1143.

Journdl of Applied Agricultural Research 2013, 5(2): 22.1-228 ISS!\: 2000-750X © Agricultural Research Council of Nigeria, 2013
EFFECTS OF POULTRY MANURE RATES AND POPULATION DENSITY ON PRODUCTIVITY OF FLUTED PUMPKIN (Telfninria occidentalis HOOK F.)
ON A SANDY SOIL
Shiyam, J. 0. Department of Crop Science
University ofCalabar, P.M.B. 1115, Calabar, Nigeria. j .shiyam@y ahoo.com
ABSTRACT
Field studies were conducted during the rainy and dry seasons of 2010 at the Crop Science Research Farm of the University of Calabar (CW57' N and 08"1.8' E altitude of 37 m above sea level) Nigeria, to investigate the effects of four rates of poultry manure (0, 6, 12 and 24 kg/ha) and three plant population densities (10,000, 20,000 and 40,000 plants/ ha) on leaf productivity of Telfaiaria occidentalis Hook F. The experimental design was a 3x 4 factorial fitted in a randomised complete block design with four replications. Results obtained indicated significant (P<0.05) increase in vine length, leaf proliferation, fresh leaf weight/ p lant and dry matter accumulation. Longest vines were 256 em, bearing 181 leaves/plant with the highest fresh lea f weight of 5435 kg/ha and correspondingly :;.""~:-'-highest dry matter yield of 183.5 kg/ ha by applying 24 toru1es of poulb·y manure to . ·." ~ · f.'Jl.,
20,000 plants/ha. This indicates the optimum rate of poultry manure and plant :...~ ··. ~~V ?• population density for increased leaf productivity of the crop in the rainforest zone of . L., "'/ .. \~\ ;....;\ Cross River State of Nigeria. .._ I ~ ": •
o~;~;, ~ ••• "" ~ r J ! , i , v .. \ "!<,• ..t • . , ...
Keywords: food security, organic manures, poverty reduction, soil ferti lity, soil :) \ \#< "/.
management, soil organic matter. _. ·, ' • ~ f".;
INTRODUCTION
Fluted Pumpkin (Telfairia occidentalis Hook
F.) is one of the most widely and intensively
cultivated leafy vegetable in the humid fores t zone of Southern Nigeria. It has high socio-cultural and economic values among
the Efiks and lbibios of Cross River and Akwa Ibom s tates wh ere the tender vines
and foliage are cons umed as a p otherb in a
deUcious soup popula rly known as 'Edikan Ikong'. The iron-rich leaves are used for the treatment of diabetes and anaemia in children and the oily seeds have high
lactating effect on nursing mothers (Esia ba,
1982; Akoroda, 1990 and Schippers, 2000). The cultivation and trade in Telfairia is a
major economic activity in Cala bar,
providing a major source of income and
223
' t ,......--. .... · ... r)
~-- '"'. >- -·
livelihood for farmers and the market women who constitute the middlemen in the vegetable business.
Commercial cultivation of the crop is principally concentrated in the peri-urban
areas and on undeveloped p lots in the urban
centres under the intensive market gardening system on small plots holdings.
The demand for the vegetable is high, especially in the dry season when most local vegetables harvested from the wild are
scarce or unavailable.
Intensification of crop production w ithou t
appropriate soil fertility management co mmonly practised by traditional farmers is
no t sustainable in the humid tropics as it lea ds to deterioration in physical, chemical
--~

Shiyam, 2013
and biological properties of the soil. The undesu-able consequences are decillung y1eld and low resource productivity which worsen poverty in rural agricultural communities (Nwajiuba and Akinsanmi, 2002).
The problem of declining soil productivity in crop based farming systems of sub-Saharan Africa arises because the low-inputs traditional soil fertility management practices, which require enough time to restore soil fertility, are no longer feasible due to the increasing land use pressure arising from increasing human population and activity.
Resource productivity has been increased substantially using synthetic fertilizers. However, within the past two decades, cumulative negative effects of the use of chemical fertilizer on the environment and biodiversity have been identified . Though fertilizer usage is still a far-cry in Nigeria, its scarcity and high cost makes it unattractive to the pro-poor farmers who dominate the Nigerian agricultural landscape.
In recognition of the multiple benefits of organic soil fertility management, the International Forum for Organic Agriculture Movement (IFOAM) is strongly advocating and promoting the adoption of organic farming as a strategy for increased and sustainable crop production; nutritional well-being of consumers and environmental health (Hynes, 2005; IFOAM, 2008).
Organic soil nutrient management deemphasizes the use of synthetically compounded fertilizers and advocates reliance on a combination of sustainable cropping practices such as crop rotation, crop residues, animal manures, legumes, green manures or farm organic matter to maintain soil productivity (Hanspeter and Manon, 1994) and the use of optimum plant population densities for enhanced light-use efficiency and yield sustainability.
224
Planting of inappropriate plant densities and abuse o! the use or poultry manure on vegetable plots is common among commercial vegetable farmers who erroneously believe that high plant populations and high quantities of animal manures increase crop productivity indefinitely. Optimum plant population depends primarily on the morphology of the crop while the right quantity of organic resources is determined by the nature of the soil, its fertility status as well as the source and nutrient composition of the material used, coupled with the type of crop involved.
This trial was aimed at establishing the optimum rate of poultry manure and appropriate plant population density for increased productivity of Telfaiaria occidentalis on sandy soil in Calabar.
MATERIALS AND METHODS
The experimental site was at the Crop Teaching and Research Farm of the University of Calabar, latitude 04°57'N and longitude 08D18' E with altitude of 37 m above sea level. The rainfall in the area is bimodal, distributed with the highest peak in July and the lowest peak in September sandwiched with a short dry spell in August, usually referred to as 'August Break' . The rainfall commences between March/ April and terminates in October/November. The total annual rainfall is about 2500 - 3000 mm with maximum and minimum temperatures of 30oC and 23°C, respectively, while the relative humidity is about 70-80% throughout the year. The land used was previously under intercropping with cassava, maize, melon and water leaf (Talinum triangulare L.) and pumpkin (Teifaiaria occidentalis Hook F.).
The surface soil (0 - 15 em depth) was a characteristic sandy soil with 80% sand, 7.7% silt and 12.3% clay contents. The soil pH

Effect of Manure Rates and Population Density on Productivity of Pumpkin
(soil:H20) was 4. 9 and it contained 1.16% organic carbon, 0.09% total N, 43.0 mg/kg available P, w hile Ca, Mg, K and Na contents were 1.0, 0.6. 0.8 and 0.05 cmol/ kg, respectively. The effective cation exchange capacity (ECEC) of the soil sample was 8.53 cmol/ kg, exchangeable acidity 4.64 cmolj kg and base saturation was 20.0%. The nutrient profile of the poultry manure used was 72.76% organic carbon, 7.06% total N, 37 m g/Kg available P, while Calcium, Magnesium, Potassium and Sodium concentrations were 4.8, 3.0, 0.17 and 0.10 cmoljkg, respectively. The effective cation exchange capacity (ECEC) and base saturation of the manure were 19.2 cmol/ kg an d 40 %, respectively.
The land was cleared and tilled flat m anually using a spade and dem arcated into unit plots measuring 2.0 m x 3.0 m (6.0 m2). Four poultry manure rates (0, 6, 12 and 24 t/ ha) combined with th ree plant populations (10,000, 20,000 and 40,000 plantsj ha) of fluted pumpkin (Telfaiaria occiden talis H ook F.) were investigated in a randomized complete block design rep licated four times. Clean healthy seeds were sun-dried for two days and h·eated with · 'Apron s tar' seed dresser to conh·ol soil-borne pests and pathogens . Seeds were planted 1.0 m x 1.0 m at one seed/ hole, 1.0 m x 1.0 m at two seeds/hole and 0.5 m x 0.5 m at one seed / hole to achieve 10,000, 20,000 and 40,000 plan ts/ha, respectively. Field planting was done during the early or main planting season on 5th April, 2010 and 9th April, 2011. Cu red poultry manure was worked into the soil during tilling for rapid decomposition and nu trient release to the crop . All plots were fertilized with Urea a t 80 kg Urea - N/ ha in two s plit a pplications. The firs t half dose of 40 kg Urea-N/ ha was app lied at four weeks after planting while the application of the second half dose was done four weeks later. Da ta collected on vine length, leaf number/ per plant, fresh leaf weight and d1y matter (DM) y ield were analysed s tatistically
225
using analysis of variance (ANOV A) technique described by Wahua (1999). Means were tested using the Least Significant Different (LSD) a t 5% level of probability.
RESULTS AND DISCUSSION
Vine leng th responded p ositively to application of differen t r ates of poultry manure in all plant populations (Table 1). Vine growth increased with increasing ra tes of poultry manure applied and was longest in plots manured with 24 tonnes of the organic nutrient per hectare and shortest in zero- manure plots . In such plots, the longest vine length was in 40,000 plants/ ha, followed by those planted at 20,000 plants/ ha, which did not differ in vine length with those of 10,000 plan ts/ha. In all other levels of poulhy manure, vine length was longest in 20,000 plantsj ha, followed by 40,000 plants/ ha and least in 10,000 plants/ ha. Enhanced vine growth was obtained in 20,000 plants/ ha across all levels uf poull ry
manure with significan tly (P=O.OS) longest vines produced by manuring with 24tons of p oultry manure per hectare (Table 1).
Leaf production similarly followed the same trend with vine elongation and increased with increasing ra tes of poultry manure applied with more leaves produced in 20,000 plants/ ha across all poultry manure levels. The highest leaf production was obtained by applying 24 tonnes of poultry manure per hectare, followed by 12 and 6 t/ ha least in the zero-manure plots. Leaf produ ction increased by 46, 64, 102 leaves/ plant corresponding to 110%, 152% and 243% increase in plots manured with 6, 12 and 24 tons of poultry manure per hectare, respectively. Enhanced vine growth and leaf produ ction obtained by fertilizing 20,000 plants/ ha with 24 tons of poultry manure migh t indicate availability of balanced plant n utrien ts and optimum plant p opulation and obvious favourable growing conditions. Increased leaf production in okra attributed

Shiyam, 2013
to beneficial effect of poultry manure has
been reported b} Umoeto~ e1 al. (2007).
Fresh leaf yield varied significantly (P<O.OS) in all h·ea tment combinations and increased with increasing poultry manure ra tes, and
was highest at 24 tonnes of poultry manure
per hectare m all plant populations. Like vine length and number of leaves per plant,
fresh leaf yield was h ighest in 20,000 plants/
ha, than in other plant populations in the corresponding poulh·y manure rates. In this
Table 1: Influence of poultry manure ra tes and plant populations on vegetative growth and yield o£ Telfaiaria occidentalis Hook F.
Plant Popula tion Poullry Manure Rates (t/ ha)
0 6 12 24
Vine Length (em) 10,000 173 214 230 265 20,000 176 257 268 288 40,000 192 214 258 258 Mean 180 228 238 270 LSD (0.05) A Ns ns Ns Ns
B 9.9 9.9 9.9 9.9 A X B Ns ns Ns Ns
Leaves/Pla nt 10,000 30 64 84 89 20,000 42 88 106 144 40,000 38 54 86 96 Mean 40 69 92 107 LSD (0.05) A 5.6 4.0 4.0 4.0
R 6.5 4.7 4.7 4.7 Ax B 6.5 4.7 4.7 4.7
Fresh Leaf Yield (kg/ha) 10,000 202.3 251.0 337.1 372.8 20,000 269.3 414.4 658.0 734.1 40,000 199.2 316.2 489.2 579.2 Mean LSD (0.05) A 5.5 7.2 56.6 65.2
B 6.4 8.3 68.4 72.4 AxB 6.4 7.9 64.4 83.0
Dry Malter Yield (kg/ ha) 10,000 66 75 102 107 20,000 64 113 193 210 40,000 93 96 131 142 Mean 75 95 143 157 LSD (0.05) A 5.5 5.6 5.6 5.6
B 6.4 6.4 6.4 6.4 AxB 6.4 6.4 6.4 6.4
Table 2: Interaction effect of plant population and poultry manure ra tes on dry matter yield (kg/ ha) at lOWAP
Plant Populalion Pou la·y Man u re Rates (kg/ ha) 0 6 12 24 Mean
10,000 12.1 15.3 20.8 27.1 18.8 20,000 12.1 29.5 40.9 51.7 33.5 40,000 16.2 20.6 37.2 45.8 29.9 Mean 13.5 21.8 32.9 41.5 LSD (0.05) 6.4 7.8 6.8 2.8
226
Effect of Manure Rates and Population Density on Productivity of Pumpkin
plant population, fre h leaf yield ·a als, significantly highest in plots incorporated with 24 tonnes of poultry manure per hectare and lowest in the zero input plots. Across plant populations, fresh leaf production increased from 10,000 plants/ha u p to 20,000 plantsjha and declined as plant population was increased to 40,000 plants/ ha, possibly due to the adverse effect of competition for growth resources such as; space, sunlight, nutrien ts and water.
Dry matter yield was also enhanced by application of poultry manure with . 24 tonnes of the organic nutrient having the mos t favourable effect across all plant populations. The highest OM was obtained in 20,000 plants/ ha, followed by 40,000 plants/ha and least in 10,000 plants/ha, representing an increase of 108 kg/ha and 68 kgjha in OM yield by increasing the plant population from 10,000 plantsj ha to 20,000 p lants/ha and 40,000 plants/ha, respectively. Across the poultry manure levels, OM yield in 20,000 plants/ha increased by 69,129 and 146 kg/ha by raising the quantity of poultry manure applied to 6, 12 and 24 tonsjha, respectively.
Positive interaction effect of poultry manure and plant population on vegetative growth and OM production increased at all levels of the organic nutrient and in all plant populations (Table 2).
The most beneficial effect of the nutrient on foliage production and OM yield was obtained by incorporating 24 tonnes of poultry manure in plots containing 20,000 plantsj ha. Leaf production and OM increased by increasing the plant population from 10,000 plants/ ha to 20,000 plants/ ha and declined across all poultry manure levels by raising the plant population to 40,000 plants/ h a. Sub-optimal plant density might account for the poor productivity of the crop in plant populations lower than 20,000 plants/ ha, while the suppressed yield
227
obtainei in 40.000 plants/h<t could be attributed to the adverse effects of overcrowding and competition for space and plant nutrients as well as other growth factors such as sunlight and soil moisture.
The decline of crop yields in the traditional farming systems has been attributed largely to soil-related constraints Guo et al., 1995; Aihou et al., 1998; AGRA, 2007) and highly variable plant densities including inappropriate cropping practices. However, enhanced growth and increased productivity obtained in manured plots u nderscore the importance of organic resources in soil fertili ty managemen t. Balanced fertilization of soils through synchronized supply of adequate nutrients to growing crops as well as increasing soil organic matter contents over long-term usage are major gains realized through application of organic resources.
CONCLUSION
Poultry manure improved the vegetative growth and dry matter production of Telfaiaria occidentalis. Foliage production and dry matter yield increased with increasing levels of poultry manure and maximized at 24 tjha in 20,000 plants/ ha. Managing the crop at this plant population with application of this quantity of poultry manure could boost the productivity of the crop for poverty reduction and improved livelihood of farmers.
REFERENCES
AGRA. 2007. Alliance for Green Revolution in Africa: AGRA at work. Retrieved 13th
March, 2008 from www.agra-alliance.org/ work.
Aihou, K., Buckles, K., Carsky, I.,
Dagbenonbakin, G., Eleka, A., Fagbohoun, F., Fassassai, R., Galiba, M., Gokai, G.,
Osiname, 0., Versteeg, M. and Vissoh, P.

Shiyam, 2013
1988. Cover Crops in West Africa: Contributing to Sustainable Agriculture. IDRC, Canada, 318 pp.
Akoroda, M. 1990. Seed production and breeding potentials of fluted pumpkin. Euphyta, 4a (1): 25-32.
Esiaba, R. 1982. Propagating fluted pumpkin (Telfaiaria occidentalis) in Nigeria by sections. Paper presented at the 51h Annual Conference of the horticultural Society of Nigeria.
Hanspeter, S. and Manon, H. 1994. EU Regulation "Organic Farming". Stanford Publishers, England, 968 pp.
Hynes. 2005. Organic Farming. Microsoft Corporation, N. Y, USA.
International Forum for Organic Agriculture Movement (IFOAM). 2008. Basic standards for organic agriculture and processing. !FOAM Head Office, Oko Zentrum Imbash, D-66636. Tholey- Tholey, p . 44.
Juo, A. S., Franziuebbers, R., Dabiri, A. and Ikhile, B. 1995. Changes in soil properties during long term fallow and continuous cultivation after forest clearing in Nigeria. Agric. Ecosystem Environment, 56:9-18.
228
Nwajiuba, C. and Akinsanmi, 0 A 2002. Organic manure use among smallholders in the rainforest of Southeast Nigeria. Deutscher Tropentag, October 9-11, 2002. Witzenhausen. "Challenges to organic farming and sustainable land use in the tropics and subtropics".
Schippers, R. 2000. African Indigenous Vegetables. An overview of the cultivated species. Dept. of international Development, p. 67-140.
Umoetok, S., Uko, A., Archibong, B., Ukeh, D, and Udo, I. 2007. Effects of application of inorganic fertilizer and poultry manure on insect pests and yield of soybeans (Glycine max.(L)) in the rainfores t of Nigeria. Journal of Food, Agriculture and Environment, 5(2): 149 -152.
Wahua, T. A. T. 1999. Applied Statistics for Scientific Studies. Transparent Earth, Nig. Ltd., Port Harcourt.
Journal of Applied Agricultural Research 2013, 5(2): 229-239 ISSN 2006-750X ©Agricultural Research Council of Nigeria, 2013
VARIATIONS IN CHEMICAL PROPERTIES OF SOILS FROM SH ALE PARENT MATERIAL IN SOUTH W ESTERN NIGERIA
*Obil, J. C., Akinbola2, G. E. and P. I. Ogbanl 1Department of Soil Science, University of Uyo, Uyo, Nigeria
2Dep artme nt of Agronomy, University of Ibadan, Ibadan, Nigeria *[email protected], +2348033497933
ABSTRACT
Soil series are designed to be highly homogenous to the extent that they could be managed as a single unit, especially when precision agriculture is not practised. A study was carried out in Papalanto in Ogun State to evaluate the variation between some contiguous soils series formed on shale parent materia l in South Western Nigeria. A detailed soil survey was carried out on a 100 m by 100 m rigid grid transects for identification, characterization and classification of the soil series. Soil samples were randomly and representatively collected at 0 - 15 em (surface) and 15 - 30 em (subsurface) for each of the delineated series. Data collected on the various soil series were compared in randomized complete block design (RCBD) us ing analysis of covariance (ANCOV A) with subsurface soil as the dependent and surface soil as independent variables. The soil series class ified were Abesse, Lapeleke, Yewa, Ogun and Onikoko occupying 50%, 10%, 16%, 4% and 20%, respectively, of the study area. The sand contents of Abesse, Lapeleke and Onikoko series (ranged from 547.1- 612.7 g kg-1)
were not significantly different from each other, and Yewa series was not significantly different from Onikoko. Similar trend in variability was observed in the clay content, which explains their similarity in the morphological classification. The properties of Abesse series including pH, available phosphorus, total nitrogen, organic carbon, exchangeable bases, ECEC, extractable manganese, zinc and copper were higher than other soil series with the exception of exchangeable acidity (0.3 cmol kg-') and extractable iron (124.9 mg kg·1). The pH (H20 and KCI) of Onikoko soil series (5.4 and 4.9, respectively) were significantly different from those of Abesse series (6.0 and 5.3, respectively). Ogun State soil series was least in the majority of properties with the exception of ECEC (23.6 cmol kg-1) , potassium (1.4 cmol kg-1) and soil organic carbon content (31.9 g kg-1). The properties of soil series studied were significantly different from each other and could be managed differently with the exception of Abesse and Onikoko series that could be managed similarly.
Keywords: soil series, soil variation, shale parent material, ANCOV A
INTRODUCTION
The major aim of soil mapping is to delineate
dissimilar units while enclosing similar ones
to increase homogeneity and precision of
statements that could be made about their
sustainable utilization. Most land evaluation
systems utilize soil series in the delineation
of mapping units, especially in detailed soil
survey activities. This is because they are
229
considered as fundamental units of
morphological classification, which is a basis
for practical interpretation of soil map for
alternative uses. The grouping of soils into a
series is on the consideration of their
similarities in characteristics and behaviour.
These similarities emanate from that which
exists in the number of horizons present. their colour, texture, structure and presence
of carbonates or soluble salt, mineralogy etc.

Obi et al., 2013
(Soil Survey Staff, 2006). Principally, series classification emphasizes criteria which influence response to land use and management and they characterize the groups. Therefore, it is anticipated that the realization of expected purity standard of variability of detailed soil map units will be within tolerable levels (Soil Survey Staff, 1993).
The consequences of crop yield variability as a result of within field variability of soil properties remain a critical challenge (Wilding et al., 1964; Wilding et al. 1965, McCormack and Wilding, 1969; Becke tt and Webster, 1971). Additionally, uniform application of fertilizers on the mapping units already assumed to be largely homogenous to either ameliorate deficiency or improve yield may result to unequal crop response and/ or over application due to within field or soil unit/ series variability.
Soil variability complicates interpretation of a map u nit for a specific use. Identification and quantification of spatial variability of soil properties in map units are needed to make accurate soil and land use interpretations (Obi and Udoh, 2011). Map unit variability can be evaluated by several statistical methods including analysis of variance, geostatistics, and coefficients of variability (Wilding, 1985; Nielson et al., 1973). No one procedure is recommended over another and designs depend on time constraints, efficiencies, needs, and objectives of the user and investigators. Analysis of variance can be used to evaluate map unit composition and variability in a typical second-order soil survey as it allows the study of the spa tial aspect of variability with reduced numbers of samples (Wilding and Drees, 1983). Nested ANOV A has been employed in several map unit studies (Wilding et al., 1965; Edmonds et al., 1985; Thomas et al., 1989). These studies allowed for the partitioning of variability into map units, delineations within map units, pedons
230
within delineations, and profiles within pedons.
Studies evaluating variability of crop yields and soil properties in map units have found variability to be as great within map units as between map uni ts (Edmonds et al., 1985; Thomas et al., 1989; Karlen et al., 1990). Variabili ty within map unit delineations is often greater among delineations of the same map unit (Wilding et al., 1965). However, variability within delineations has been observed to be greater than variability between delineations (McCormack and Wilding, 1969) possibly due to complex parent materials, landscape variability, aspect, or other factors that cannot be delineated at the mapping scale. Some research rep orts (Obi et al., 2010, 2011, Obi and Udoh, 2011) have revealed that in locations under low input rain fed crop production systems, heavy equipment are not utilized and as such locations below the annual crops root feeding zone (15 - 30 em depths) are less variable compared to the am1Ual crops root feeding zone (0 - 15 em depth). Therefore, analysis of covariance (ANCOV A) could actually be adapted to study within field variability of soil which ANOV A could not capture due to high degree of variability (Campbell and Bauer, 2007) and therefore enhance sustainable land use and management in the absence of precision agriculture.
The objective of the s tudy was to evaluate the variability of some contiguous soil series formed on shale parent material in South Western Nigeria.
MATERIALS AND METHODS
Study site
The study was carried out a t a site located 5 km away from Papalan to along PapalantoShagamu road in Ogun State, Nigeria. The area measured 110 hectare and falls within
Variations in Chemical Properties of Soils &om Shale Parent Materials
lati tu des 6° 53' and 6° 54' Nand lon gitude 3° 10' and 3 12' E. The climate of the study area is moderately hot, humid tropical. Mean annual rainfall ranges from 599 mm to 1117 mm, while annual temperature ranges between 23.0°C and 32.4°C. The vegetation is moist savanna while the soils were classified as sedimentary (Moss, 1957), formed over shale parent material inter-bedded with thin bands of limestone. These materials as described vary from laminated deposits to virtually non-laminated clay. The shale parent material contains calcium carbonate concretions and often thin bands of same mineral arc found between the la mellae. The shale gives rise to a distinct group of clayey soil m ost of which are poorly-drained or seasonally swampy (Moss, 1957).
Soil survey and sample collection
A detailed soil survey was carried out on a 100 m by 100 m rigid grid transects for identification, characterization and classification of soil series. In addition to transect, are utilization of existing roads and foot paths for the survey. During the survey, soil was observed at 15 em intervals from the surface to a depth of 120 em with the aid of Dutch auger. Consideration was given to physiognomic characteristics which facilitated delineation of Abesse, Lapeleke, Yewa, Ogun, and Onikoko soil series (Moss, 1957). Profile pits were prepared for each of the representative soil series for proper characterization and classification. Soil samples were subsequ ently randomly and representatively collected at 0 - 15 em (surface) and 15 - 30 em (subsurface) for each of the delineated series based on the spatial coverage of each mapping unit (soil series) and financial capacity to conduct laboratory analysis. The areas covered by each of the soil series were 55.0 ha (Abesse), 11.0 ha (Lapeleke), 17.6 ha (Yewa), 4.4 ha (Ogun) and 22.0 ha (Onikoko) representing 50, 10, 16, 4 a nd 20 percent, respectively, of the tota l area studied. The number of soil
231
samples collected from each of the soil series was proportional to its coverage of the study area. Therefore, 25, 5, 8, 2 and 10 (total of 50) samples were collected from the surface and sub-surface soil for Abesse, Lapeleke, Yewa, Ogun and Onikoko, respectively. All together, the sum of 100 samples was collected at 50 per depth. One additional sample per depth was collected from Ogun soil series to make the sample size 3 per depth to enhance its degree of freedom and error term.
Laboratory ana lysis
The samples were air dried, pulverized and made to pass through 2 mm mesh sieve. Particle size distribution was determined by hydrometer method (Gee and Bauder, 1986). Total nitrogen ~as determined by Kjeldahl distillation method (Bremner and Mulvaney, 1982) and organic carbon content by dichromate oxidation method (Nelson and Summer, 1982). Soil pH was determined in a 1:2 (soil : water) solution using pH meter (McLean, 1982). Exchangeable bases, available phos phorus and micronutrients were exh·acted with Mehlich No. 3 exh·action (Mehlick, 1984). Potassium (K) and sodium (Na) content were read with the aid of flame enuss10n spectroscopy, calcium (Ca2•), magnesium (Mg2•) and micronutrients (Fe, Zn, Cu and Mn) were read with the aid of atomic absorption spectroscopy (AAS), while total phosphorus was determined colorimetrically. Exchangeable acidity was extracted with un-buffered potassium chloride solution and titration with 0.01Msolution of sodium hydroxide to the first permanent pink endpoint as described by Anderson and Ingram (1993), while effective cation exchange capacity (ECEC) was determined by summation exchangeable bases and exchangeable acidity (Soil Survey Staff, 2006). ,
•),: .
~o·--·~:1~.~ '"-r;. • , .. , '\ . .., •• .. ' \ "'" ;. .. ·:ej (",_. ... '"'· ~' :.) . ,.,. . .. 'J ... ·;->' ..... )·~~ / ~/
' .,·· ..... ~~ . ": .. ,-..-r- ".

Obi et a/., 2013
Statistical analysis
Data on the various soil series were analyzed using randomized complete block design (RCBD) and compared using analysis of covariance (ANCOV A} with sub-surface soil as the dependent and surface soil as independent variables (SAS Institute, 1996). The sub-surface soil is not as variable as the surface soil because tillage and other management systems were such that could not modify soil characteristics beyond the rooting zone of annual crops. ANCOV A implies a systematic utilization of supplemental data to reduce the experimental error through the elimination of the effect of known initial variation (Cochran and Cox, 1957). Therefore, the effect of variation that may have been introduced by land use and management on the properties of the 0 - 15 em soil depth will be complimented by the supplemental or additional data generated from the subsurface soil (15 - 30 em depth). Least significant difference (LSD) was used to separate the means at 5% probability level.
RESULTS AND DISCUSSION
Characterization and classification of the various soil series
The delineation of soil series emphasizes morphological characteristic of the profile irrespective of their origin. In this study, the delineated soil series according to Moss (1957) were Abesse, Lapeleke, Yewa, Ogun and Onikoko occupying 50%, 10%, 16%, 4% and 20%, respectively. AU the series studied with the exception of Abesse soil series (with the largest spatial distribution) were generally clayey at the sub-soil, Abesse series comprised of well drained soils, while Yewa series and Ogun series are the shrinking and swelling soils.
The Abesse soil series occupy the upland, gently undulating and sloping to almost flat
232
portions, with percent slope ranging from 2-6%. Soil texture of Abesse senes ranges from loamy sand a t the top, becoming finer with depth and eventually sandy clay loam and sandy clay (Table 1). Soil colour ranges from brown (7.5YR 5/2 moist) I light brownish gray (10YR 6/2 dry) at the top to light gray (10YR 7 I 1 moist) at depth. There were mottles from Bh horizon downwards (ranging from dark reddish yellow 2.5YR 4ls to dusky red 2Y 21 4). Typically, it consist 0 -50 em of non-mottled sandy loam topsoil over compact coarse mottled (reddish) sandy clay (grayish). They possess argillic horizon with ECEC less than 24 cmol kg-1 clay and more than 50% base saturation throughout the B - horizon and are classified as Arenic kandiudalf (Soil Survey Staff, 2006) and Haplic lixisol (FAOI IUSS, 2006) .
Lapaleke soil series occupy the upper portions of middle slope positions in the toposequence, with slope percent ranging between 2 and 4%. Texture varied from fine sandy loam and sandy clay loam on the upper portions to sandy clay and clay downwards, and these imposed fairly well drained condition on the soils. Soil colour varied from light gray (2.5Y 7 I 1 dry) and pale brown (10YR 6/3 dry) on the first-two horizons (0 - 70 em) to light brownish gray (10YR 6/2 dry), gray (2.5Y 6/t dry) downwards. The presence of mottles from the second horizon (20 - 70 em) was a clear evidence of hydromorphism in the soil series. They posses argillic horizons with hydromorphic properties within 100 em of the soil surface and base saturation of greater than 50% throughout the profile and classified as Aerie kanduaqualf (Soil Survey Staff, 2006) and Epigleyic lixisol (FAOIIUSS, 2006).
Yewa soil series possesses characteristics greatly influenced by the fluctuating regional water table and accompanying oxidation reduction condition. Texture ranges from loamy or clay at the top to
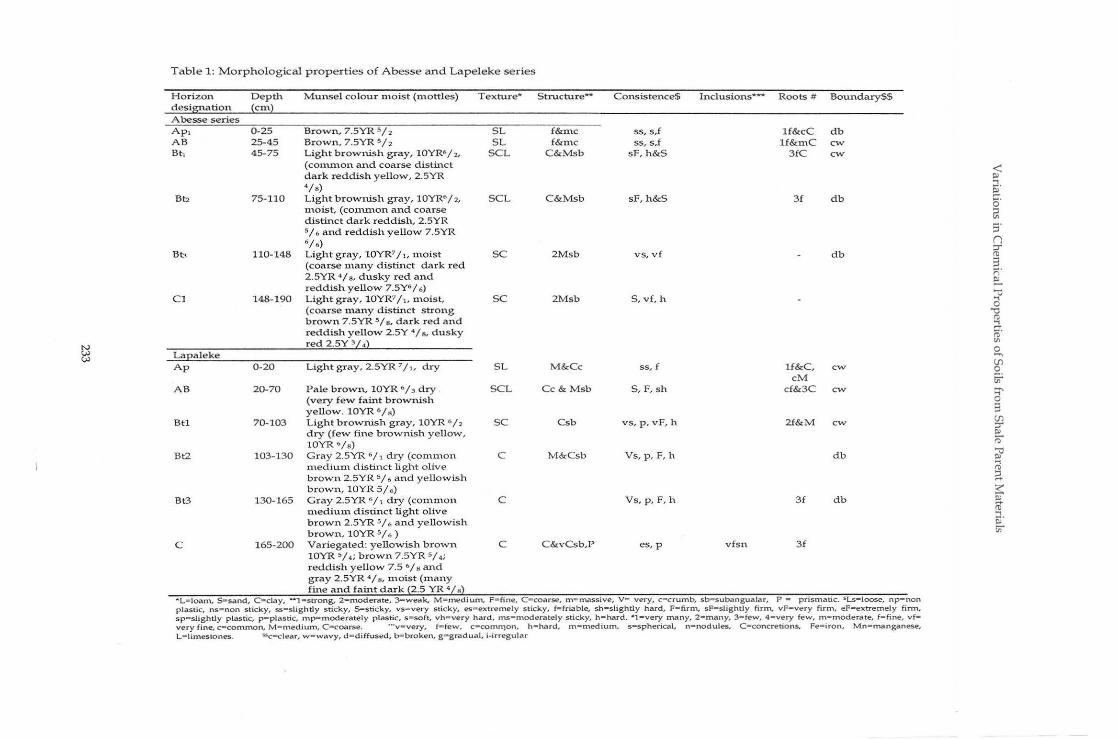
~
Table 1: Morphological properties of Abesse and Lapeleke series
Horizon Depth d esignation (em) Abesse series Ap, AB Bt,
Bt:z
Bb
Cl
Lapale k e Ap
AB
Btl
Bt2
Bt3
c
0-25 25-45 4 5-75
75-110
110-148
148-190
0-20
20-70
70-103
103-130
130-165
165-200
M unse l colour moist (mottles)
Brown, 7 .5YR 5l2 Brown, 7.5YR 5 /2 Light brownish gray, 10YR• I :z,
(contn>on and coarse distin.ct dark reddish yellow, 2.5YR •Is) Light brownish gray, 10YR6 I 2,
n>oist, (con>n>on and coarse distinct dark reddish, 2.5YR 5 I 6 and reddish yellow 7.5YR 61 •> Light gray, IOYR7 j,, m oist (coarse many distinct dark red 2.5YR 4 I 8 , dusky red and re ddish yellow 7.5Y6 I 6 )
Light gray, 10YR7 j,, mois t, (coarse many distinct strong brown 7.5YR 51s, dark re d and reddish yellow 2.5Y 4 I"' dusky red 2.5Y 'I•)
Light gray, 2.5YR 7 I,, dry
Pale brown, lOYR 6 I 3 dry (very few faint brownish yellow. lOYR 61s) Light brownish gray, IOYR •;, dry (few fine brownish yellow, lOYR •Is) Gray 2.5YR 6/t dry (common mediun> distinct light olive brown 2 .5YR 5 I • and yellowish bxown, IOYR 51 •) Gray 2.5YR 6 j, dry (co mmo n m e dium distinct light olive brown 2. 5YR 5 I • a nd yellowish brown, IOYR 5 I • ) Variegated : yellowish brown I OYR 'I 4 ; brown 7.5YR •1 4 ;
reddish yellow 7.5 6 Is and gray 2.5YR •1 8 , moist (m a n y fine and faint dark (2.5 YR •1 .)
Texture* Structur e**
SL SL
SCL
SCL
sc
sc
SL
SCL
sc
c
c
c
f&mc f&mc
C&Msb
C&Msb
2Msb
2Msb
M&Cc
Cc&Msb
Csb
M&Csb
C&vCsb,P
Consistence$
ss, s,f ss, s,f
sF, h&S
sF, h&S
vs, v f
S,vf, h
55, f
5, F,sh
v s, p,vF, h
Vs, p , F, h
Vs,p,F,h
es, p
Inclu sions- Roots # Boundary$$
vfsn
lf&cC lf&mC
3fC
3f
lf&C, eM
cf&3C
2f&M
3f
3f
db cw cw
db
db
CW
cw
CW
db
db
'"L•Ioan1, 5-sand, C•c.ldy, -1 -strong.. 2-n1oderate , 3•weak. M•mediurn. F•fine, C•coarse. m • rnassive, V• very, c • c rumb, sb•subangualar, P • prismatic. sLs-loose .. np• non plastic, ns•non sticky, ss•slightly s ticky, 5-sticky, vs•very sticky, es•extremely sticky, f•friable, sh•slightly hard, F•fi.rm, sF•slightly firm.. v F•very firm. eF-extremely firm. sp•slightly plastic, p•plastic, n1p-moderately plastic, s-soft. vh• very hard. ms•moderately sticky, h•hard. •1-very many, 2-many, 3•few, 4•very few, m•moderate, f•fine, vf• very fine, c•common, M•n,edium, C•coarse. ···v·very. f•few, c•comrl')on, h•hard, m•m.edium. s • spherical, n•nodules. C•concretions, Fe•iron, Mn-manganese, L• llmestones. M.c-clear, w•wavy, d•diffused. b-broken, g•graduaJ, i·irregular
< I» ..., ~s· £il s· n ~ 3 ;:;· e:.. "' ..., 0
'"0 (1) ..., ;J". (1)
"' 0 ....., (f)
2. !:;;'
::r 0 3 (f) ::r I» ro-;;,o ..., (1)
::;. ~ I» it .... ~· !:;;'

Table 2: Morphological properties of Yewa and Ogun series
Horizon Depth Munsel colour moist (mottles) Texture* Structure- Consistence$ Inclusions~ Roots# Boundary$$ desi~tion (em) Yewa Ap 0-15 Black 7.5YR 25/1, m oist L M&Fsb, F,sp,s 2f&vF cw
MICe AB 15-40 Gray 7.5YR 5f, moist (common c C&Msb vs,p,vF,h - CvF,f& cw
m edium distinct strong brown, M 7 .5YR 5 I s)
Btl 40-90 Gray 7.5YR 7 h moist (common SCL Csb S,p ,F,sh fh,Fe&Mn,mC cw m edium distinct dark yellowish brown , 10YR4 I 6)
Bt2 90-125 Gray 7.5YR 6/1 mois t (common c Csb vs,vf,h cw and many fine distinct light gray 7.5YR 7 I 1 and brownish yellow 10YR 6ls)
C1 125-155 Variegated: gray 7.5YR 6h and c Msb vs,p,vf,h cw 10YR 5 I 1 moist (many common 0 medium distinct yellowish :r. brown 10YR 5 Is) ~
~ C2 155-210 Variegated: gray 10YR 6f, a nd c Msb vs,p,v(h ..:~ "'" light brownish gray10YR • /2 N
m o is t (many coarse distinct 0 ..... yellowish brown 10YR 5 b) u.l
0 n Ap 0-10 Gray 2.5YR 6 h dry sc Cc and Fsb S,F,sh 3vf cw AB 10-50 Variegated: gray 2.5YR 61 1 and c Cc, Fsb S,p,F,sh 4M Cw
pale brown 10YR 5f2 dry (common faint yellowish brown 10YR 51 6)
Btl 50-88 Variegated: Gray 2.5YR 61·1, c Csb, vs,p,vF,vh cw strong brown 10YR 5 I 8 and yellowish red 5YR 4 I 6 dry (common distinct yellowish brown 10YR 5 I 8)
Bt2 88-127 Gray 2.5YR 6 I 1 (many coarse and c Cc, Fsb S,p,F,sh Cw m edium distinct brownish yellow IOYR 6b)
BC 127-169 Gral:: 2.5YR • {.1 c C&Msb&P vs,p,eF,vh - 4f • L• Ioarn. S-sand, C • d ay, ·1• strong, 2 - moderate, 3 - weak, M• mediun1, F- fine, C• roarse, n'\• massive, V• very, c•crun,b, sb•subangualar, P • p r ismatic. SLsz loose, npz no n plastic, ns=no n sticky, ss~slightly sticky, S•sticky, vs= very sticky, es=extrem el y sticky, f•friable, sh=sl i ghtly hard , F• fi rm, sF• slightly fi rm. vF=very firm, eF=extremely firm, sp= slightl y p lastic. p .. plastic, mp• moderately plastic, s•soft, vh=very hard, ms=moderately s ticky, h=hard. "1 • ve:-y many, 2• many, 3• few, 4• very few, m• moderate, f• fine, vf• very fine, c-co mmo n, M• mediunl, C• coa.rse. -·v=very. f=-few, C""'"cOn1mon, h- hard, m=mediu~ s• spherical. n• nodules, C =concretions, Fe• iron, Mn• manganese, L• limestones. ssc=clear. w=wavy, d • diffused, b• broken, g-gr adual, i -i rregular

Vl Q) u c; ~ <Jl
·~ 0 u
• • Q) e ~ (j)
• Q) .... c X
~
Varialions in Chemical Properties of Soils from Shale Parent Materials
235
sandy clay loam or clay at the subsoil. Colour ranges from black (7.5 YR 25 I 1 moist) or gray (7.5 YR 5 f 1 moist) at the top changing to gray or variegated and mottled (yellowish brown 10 YR 4/6 moist) with depth (fable 3). They are poorly drained deep clay I sandy clay with fairly deep humus penetration and with mottles that are noticed within AB horizon (15 - 40 em depth). They are classified as Aerie kandiaqualf (Soil Survey Staff, 2006) and Epigleyic lixisol (FAOIIUSS, 2006). This is because in as much as they possess argillic horizon, hydromorphic properties were equally encountered within 100 em of the surface and base saturation of
greater than 50%.
The soils of Ogun series were encountered at lower position of the toposequence adjacent to perennial stream valleys. The soil colour ranges from gray (2.5 YR 6/1 dry), variegated gray (2.5 YR 6/I dry) to s trong brown (10YR 5f 8) and gray, and the texture of the Ap horizon (0 - 10 em) was sandy clay while others were clay. They possess shrinking and swelling characteristics of 2:1 lattice clay (smectite) minerals. There were cracks that are greater than 1 em wide and 50 em deep from the surface which is diagnostic of these groups of soils. Presence of gilgai (microrelief with microbasins and microknolls), absence of calcic or gipsic horizons and base saturation is greater than 50% throughout the upper 125 em. They are classified as Udic haplustert (Soil Survey Staff, 2006) and Eutrihaplic vertisols (FAO/IUSS, 2006). The soils of Ogun series differ from those of Yewa series that equally exist at the lower slope position of the toposequence with the absence of deep humus penetration and weaker mottling at the upper layers of the
pedon.
There was a localized occurrence of Onikoko soil series at the upper slope position in relatively more flat portions of the study area. They are generally sandy, very dark grayish brown (10YR 3/2 moist) and sandy

O bi et al. , 2013
loam on the top portions of the profile and light yellowish brown (10 YR 6/4 dry) sand to sandy loam sub-soil. The profiles are poorly developed as a result of the dominance of sand particle size fractions. They are generally friable, possess argillic horizon, with absence of albic E horizon and hydromorphic properties. They are classified as Typic udipsamment (Soil Survey Staff, 2006) and Luvic arenosols (FAO/IUSS, 2006).
Variation of the soil properties within the soil series
The variability between Abesse, Lapeleke, Yewa, Ogun and Onil<oko series were evaluated with the aid of analysis of covariance (ANCOV A). The sub-surface soil was the dependent and surface soil independent variables (Table 4). Results from this s tudy revealed that there are some degrees of similarities in the properties of different soil series in the study area. In as much as the delineations of the soil groups were reasonable representations of the soil physical and chemical properties, the· similarities that existed indicated that some
Table 4: Variation of some properties of the soil series
of the soil series could be managed as homogeneous units, especially for plant nutrient purposes.
The particle size fractions which influence, to a large extent, the physical properties and subsequently land use and management were morphologically classified as either sandy clay loam or sandy loam (Table 4). The soils of A besse series were classified as sandy loam or sandy clay loam. These are indications that the response of Abesse, Lapeleke, Yewa and Onil<oko to manipulation and transportation of solute (Strock et al., 2001) within the rhizosphere may not vary and, therefore, similar management practices may be adequate for sustainable exploitation of these series. The sand contents of Abesse, Lapeleke and Onil<oko (ranging from 612.7 - 547.1 g kg·l) were not significantly different from each other, and Yewa series was equally not significantly different from Onikoko. A similar trend in variability was observed in the clay content and these may explain their similarity in the morphological classification.
Soil eroeer~ Abesse• Laeeleke Yewa 01r,un On.ikoko cv {%} Sand (g kg·1) 603.6a 612.7a 509.2b 382.9c 547.1ab 13.6 Silt (g kg-1) 209.2c 253.9bc 235.8bc 339.5a 255.3b 25.2 Clay (g kg-') 186.3b 154.9c 256.0a 257.7a 196.04b 41.6 Texture· sci s ci sci Clay loam sci pHI-hO 6.02a 5.55b 4.90c 5.40bc 5.44b 7.9 pHKO 5.3a 4.9ab 4.3c 4.5bc 4.9b 7.9 Available phosphorus (mg kg-1) 9.0a 1.1b 12.8a l.Ob l.Ob 74.4 Total Nitrogen (g kg·1) 0.8c 1.8a 1.2abc l.Obc 1.3ab 55.0 Organic carbon (g kg-1) 30.1a 30.4a 22.9b 31.9a 28.3a 17.3 Calcium (cmol kg-') 14.9a 9.8c 12.2b 11.98b 14.4a 14.9 Magnesium (cmol kg-1) 7.5a 5.5c 6.1b 6.6b 7.1a 10.3 Potassium (cmol kg-1) 1 .6a 1.3b 1.5a 1.4a 1.6a 11.5 Sodium (cmol kg-1) 1.1 0.9 1.0 0.9 1 .0 26.5 Ex. Acidity (cmol kg·1) 0.3b 0.2b O.Sa 0.4ab 0.2b 77.1 ECEC (cmol kg-1) 25.2a 17.8c 21.7b 23.6a 24.2a 12.1 Manganese (mg kg-1) 211.3 203.2 213.5 210.1 200.3 12.7 Iron (mg kg-') 124.9b 115.7bc 142.1a 119.2b 102.5c 11.8 Zinc (mg kg-1) 53.0a 55.1a 55 .Sa 42.5b 48.0b 10.8 CoEeer {mg kg:l} 11.3ab 12.1ab 12.9a 9.3b 10.5b 19.2 •Values on the row followed by same alphabeiS are not signi.ficantly different from each other *sci - sandy clay loam
236
Variations in Chemical Properties of Soils from Shale Parent Materials
The soil of Abesse series was found to have component (chemical) properties that was higher than that of all other soil series with the exception of exchangeable acidity (0.3 cmol kg-t) and extractable iron (124.9 mg kg-1). The properties of Onikoko soil series were not s ignificantly different from those of Abesse series but in pH (5.44 in H20 and 4.90 in KCl) and extractable iron (102.5 mg kg-1) .
These were indications that Abesse and Onikoko soil series were not significantly different from each other at the 0 - 15 em depth. These similarities could only facilitate uniformity in the management of nutrient supplies but not in tillage and other manipulation, especially with heavy equipments and moisture. This is as a result of the fact that in Abesse series, the layer below 45 em depth suddenly decreased in particle sizes (that is, from sandy loam to sandy clay loam and sandy clay) and could easily be compacted. Additionally, the sudden change in the texture of tile soils in the profiles of Abesse series from sandy loam to sandy clay loam and sandy clay is an indication of lithological discontinuity (Obi and Akinbola, 2009) and this could lead to accumulation of water and its leached constituents at the layer below sandy loam depths (Schaetzl, 1998). Lithological discontinuity has been reported as major problem in the understanding of processes of pedogenesis and sustainable soil management (Ande and Senjobi, 2010).
Ogun soil series was found to consistently lag behind other soil series.in majority of the soil properties with the exception of ECEC (23.6 cmol kg-1), potassium (1.4 cmol kg-1) and soil organic carbon content (31.9 g kg·I). In as much as tile properties of Lapeleke and Yewa did not correspond with the properties of any of the other soil series, they did not appear very similar with each other and, therefore, could not equally be managed similarly. Results of tllis study revealed that Abesse and Onikoko series appear to be largely similar in textual and chemical
237
properties and could be managed as a homogeneous unit so long as light tillage and manipulation implements will continue to be utilized, while the other soil series were generally significantly different from each other in tile soil properties studied. There were indications that the morphological properties tllat were used as criteria for delineation of the soil series in the study area (Moss, 1957) actually created boundaries for management of heterogeneous group of soils. Therefore, applications of such delineations in man agement decisions and/ or precise s tatements about the sustainable utilization of these soils are necessary for successful and repeated productivity in these soil series.
CONCLUSION
Abesse and Onikoko soil series were largely similar in texture and chemical properties, which indicated that their potentials for plant nutrient supply could be managed as a single unit while other series must be managed differently. Therefore, the occurrence of these soil series contiguously or their association witllin tile toposequence may not necessarily suggest that they be managed . similarly in plant nutrient management and amelioration, except Abesse and Onikoko series occupying upper portion of the toposequence.
REFERENCES
Ande, 0. T, and Senjobi, B. 2010. Lithological discontinuity and pedogenic characterization on an aberrant toposequance associated with a rock hill in south western Nigeria. International Journal of Physical Sciences, 5(5): 596-604.
Anderson, J. M. and Ingram, J. S. I. 1993. Tropical Soil Biology and Fertility . . A Handbook of Methods 2nd edition. CAB International, 221 pp.
O bi eta/., 2013
Beckett, P. H. f and Webster R. 1971 The development of a system of terrain evaluation over large areas. R. Eng. L 85: 243 -258.
Bremner, J. M. and Mulvaney, C. S. 1982. "Total nitrogen methods of soil analysis. Part II, 2nd Edition. Page, A I. Ed. Agronomy Monograph. No. 9, Agronomy Society of America and Soil Science Society of America," Madison Wisconsin, p. 595-624.
Campbell, B. T. and Bauer, P. J. 2007. Improving the preas10n of cotton performance trials conducted on highly variable soils of the southeastern USA coastal plain. Plant Breeding, 126: 622-627.
Edmonds, W. ]., Baker, J. C. and Simpson, T. W. 1985. Variance and scale influences on classifying and interpreting soil map units. Soil Sci. Soc. Am. J., 49: 957-961.
FAO/IUSS. 2006. World reference base for soil resources A framework for international classification, correlation and communication. Intern. World Soil Resources Reports 103, FAO, Rome.
Gee, G. W. and Bauder, J. W. 1986. Particle size analysis. p. 404-407. In A Klute (ed.) Methods of soil analysis. Part 1. 2nd ed. AgronMonogr. 9. ASA and SSSA, Madison, WI.
Karlen, D. L., Sadler, E. J. and Busscher, W. J. 1990. Crop yield variation associated with Coastal Plain soil map units. Soil Sci. Soc. Am.
J., 54: 859-865.
McCormack, D. E. and Wilding, L. P. 1969. Variation of soil properties within mapping units. Soil Sci. Soc. Am. Proc. 33: 587-593.
I
McLean, E. 0. 1982. "Soil pH and lime requirement In Meth-ods of Soil Analysis, Part II. A. L. Page (ed.), ASA Monogr. No. 9," Madison Wisconsin, Madison, p. 199-223.
238
Mehlick, A 1984. Mehlick 3 Soil Test Extractant: A Modification of Mehlick 2. Comm:unications in Soil Science and Plant Analysis, 15: 1409-1416.
Moss, R. P. 1957. Report on the classification of the soils found over sedimentary materials in Western Nigeria. Soil Survey Report. No. 67. Institute of Agricultural Research and Training, University of Ife, Ibadan.
Nelson, D. W. and Sommer, I. E. 1982. Total carbon, organic carbon and organic matter. Methods of Soil analysis. Part IT, 2nd Edition. Page, A I. Ed. Agronomy Monograph. No 9. Agronomy Society of America and Soil Science Society of America Madison W1. 961 -1010.
Nielsen, D. R., Bigger, J. W. and Erh, K. T. 1973. Spatial variability of field measured soil water properties. Hilgandia, 42: 215-259.
Obi, J. C. and Akinbola, G. E. 2009. Texture contrast in some basement complex soils of southwestern Nigeria. Proceedings of 33rd Annual Conference of Soil Science Society of Nigeria, p . 38-44.
Obi, J. C., Awonuga, A 0 . and Umeojiakor, A 0. 2010. Spatial dependence of some physical properties of a typic plinthudalf on the basement complex in southwestern Nigeria. Journal of Tropical Agriculture, Food,
Environment and Extension, 9(1): 38-46.
Obi, J. C. and Udoh, B. T. 2011. Spatial variability of coastal plain sands soil properties and management factors in southeastern Nigeria. Open Journal of Soil
Science, 1: 25-40.
Obi, J. C., Ogban, P. I. and Utuk, I. I. 2011. Spatial variability of particle sizes of coastal p lain sands soils of southeastern Nigeria. Journal of Tropical Agriculture, Food, Environment and Extension, 10(2): 16-28.
Variations in Chemical Properties of Soils from Shale Parent Materials
Schaetzl, R. ). 1998. Lithological discontinuity in some soils of Drumlins: Theory, detection, and application. Soil Science, 163(7): 570 -590.
SAS. 1996. SAS Systems for Information Delivery for Windows," Release 6.12. SAS Institute, Cary, NC,
Soil Survey Staff. 1993. Soil Survey Manual. United States Dept. of Agriculture, Handbook No. 18. Washington.
Soil Survey Staff. 2006. Keys to Soil Taxonomy. United States Department of Agriculture, Natural Resources Conservation Services. 10th edition, p. 331.
Strock, J. S., Cassel, D. K. and Gumpertz, M. L. 2001. Spatial variability of water and bromide transport through variably saturated soil blocks. Soil Sci. Soc. Am. f., 65: 1607-1617.
Thomas, P. J., Baker, J. C. and Simpson, T. W. 1989. Variability of the Cecil map tu1it in Appomattox County, Virginia. Soil Sci. Soc. A111. ]., 53: 1470-1474.
239
Wilding, L. P. 1985. Spatial variability: Its documentation, accommodation, and implication to soil surveys. In Soil spatial Variability. D. R. Nielsen and J. Bouma (eds). Pudoc. Wageningen, The Netherlands, p. 166 -194.
Wilding, L. P., Schafer, G. M. and Jones, R. B. 1964 Morley and Blount soils: A statistical summary of certain physical and chemical properties of some selected _ profiles from Ohio. Soil Sci. Soc. Am. Proc. 28: 674-679.
Wilding, L. P., Jones, R. B. and Schafer, G. M. 1965. Variation of soil morphological properties within Miami, Celina, and Crosby mapping units in west-central Ohio. Soil Sci. Soc. Am. Proc. 29: 711-717.
Wilding, L. P. and Drees, L. R. 1983. Spatial variability and pedology. p. 83-116. In L.P. Wilding.

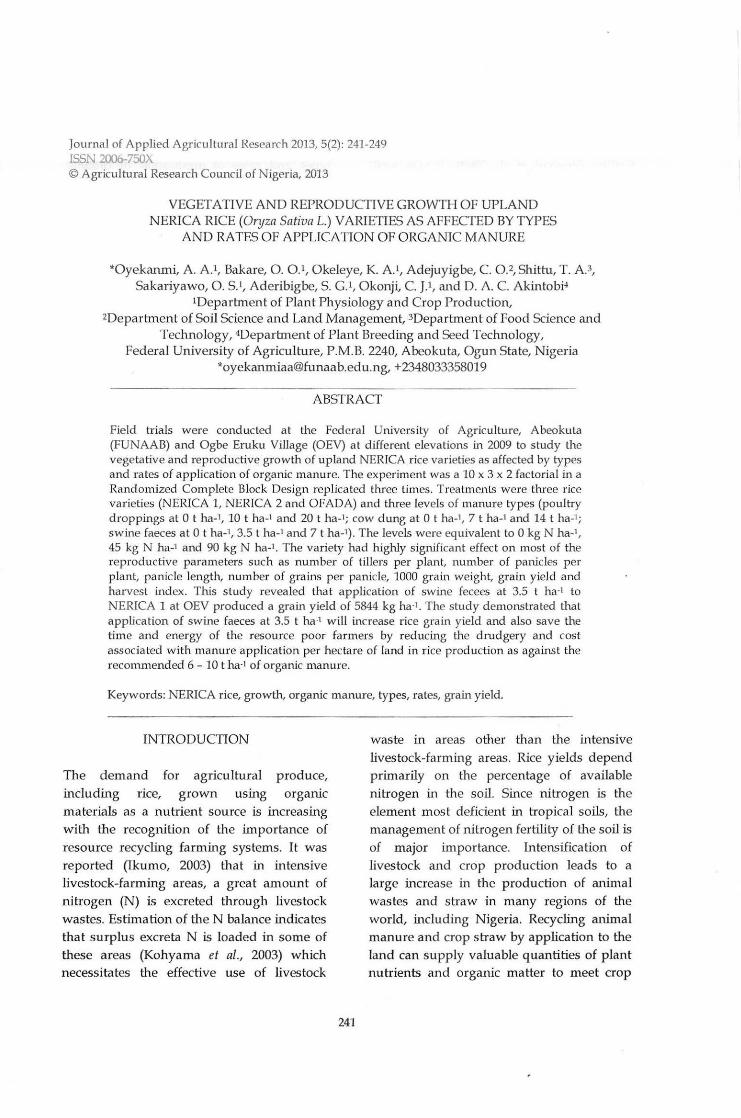
Journal of Applied Ag-ricultural Research 2013, 5(2): 241-249 ISSN 2006-750X © Agricultural Research Council of N igeria, 2013
VEGETATIVE AND REPRODUCTIVE GROWTH OF UPLAND NERICA RICE (Oryza Sativa L.) VARIETIES AS AFFECTED BY TYPES
AND RATES OF APPLICATION OF ORGANIC MANURE
*Oyekanmi, A. A .I, Bakare, 0. 0.1, Okeleye, K. A. I, Adejuyigbe, C. 0.2, Shittu, T. A.3, Sakariyawo, 0. S.l, Aderibigbe, S. G.l, Okonji, C. J.l, and D. A. C. Akintobi~
I Department of Plant Physiology and Crop Production, 2Departrnent of Soil Science and Land Management, 3Departrnent of Food Science and
Technology, 4Departrnent of Plant Breeding and Seed Technology, Federal University of Agriculture, P.M. B. 2240, Abeokuta, Ogun State, Nigeria
*[email protected], +2348033358019
ABSTRACT
Field trials were conducted at the Federal University of Agriculture, Abeokuta (FUNAAB) and Ogbe Eruku Village (OEV) at different elevations in 2009 to study the vegetative and reproductive growth of upland NERICA rice varieties as affected by types and rates of application of organic manure. The experiment was a 10 x 3 x 2 faclorial in a Randomized Complete Block Design replicated three times. Treatments were three rice varieties (NERICA 1, NERICA 2 and OF ADA) and three levels of manure types (poultry droppings at 0 t ha-1, 10 t ha-1 and 20 t ha-1; cow dung at 0 t ha-1, 7 t ha-1 and 14 t ha-1; swine faeces at 0 t ha-l, 3.5 t ha-l and 7 t ha-l). The levels were equivalent to 0 kg N ha-l , 45 kg N ha-1 and 90 kg N ha-l. The variety had highly significant effect on most of the reproductive parameters such as number of tillers per plant, number of panicles per plant, panicle length, number of grains per panicle, 1000 grain weight, grain yield and harvest index. This study revealed that application of swine fecees at 3.5 t ha·l to NERICA 1 at OEV produced a grain yield of 5844 kg ha·l . The study d emonstrated that application of swine faeces at 3.5 t ha-l will increase rice grain yield and also save the time and energy of the resource poor farmers by reducing the dmdgery and cost associated with manure application per hectare of land in rice prod uction as against the recommended 6 - 10 t ha·1 of organic manure.
Keywords: NERICA rice, growth, organic manure, types, rates, grain yield.
INTRODUCTION
The demand for agricultural produce, including rice, grown using organic materials as a nutrient source is increasing with the recognition of the importance of resource recycling fam1ing systems. It was reported (Ikumo, 2003) that in intensive livestock-farming areas, a great amount of nitrogen (N) is excreted through livestock wastes. Estimation of theN balance indicates that surplus excreta N is loaded in some of these areas (Kohyama et al., 2003) which necessitates the effective use of livestock
241
waste in areas other than the intensive livestock-farming areas. Rice yields depend primarily on the percentage of available nitrogen in the soil. Since nitrogen is the element m ost deficient in tropical soils, the management of nitrogen fertility of the soil is
of major importance. Intensification of livestock and crop production leads to a large increase in the production of animal wastes and straw in many regions of the world, including Nigeria. Recycling animal manure and crop straw by application to the land can supply valuable quantities of plant nutrients and organic matter to meet crop

Oyekanmi el a/., 2013
nuh·ition requi rement and maintain soil fertility (Prassad et al ., 2002). It was well documented (Eneji et al., 2001) that the incorporation of organic manure and crop straw into soil improves soil fertility and increases crop yield. Nigerian scientists (Sobulo and Babalola 1992; Olayi.nka et nl., 1998) reported the use of several organic materials, especially cow dung, poultry droppings, refuse compost and farm yard manure as soil amendments suitable for increasing crop produ ction particularly among smallholder farmers in Nigeria. Many scientists have worked on rice (0. sativa) to improve its yield and developed technology that will enhance its production and grain yield.
The New Rice for Africa (NERICA), h owever, is an inter-specific hybrid (0. sativa x 0 . glabberrinlfl} and entirely a new plan t type recently released by WARDA. There is, therefore, the need to examine its performance in an upland environment. Fabiyi and Ogunfowora (1992) reported the use of p oultry droppings and cow dung as sources of plant nutrients in the farming activities of smallholder farmers in southern and northern p arts of Nigeria. Some of the farmers have been apply ing manure on their farms for ages and are aware of its beneficial effects, especially its release of nutrients for good plant growth and development, however, the optimum rate of the manure to be applied is often not known to smallholder farmers. Research work condu cted in recent times indicated that about 6-10 tonnes of m anure (Oyekanmi et al., 2009) is adequate to fertilize one hectare of farmland but the ra tes of cow dung, poultry droppings and swine faeces required for optimum vegetative and reproductive growth of upland NERICAs require further investigation. Findings from this work will be useful to all farmers across the agroecologi.cal zones in Nigeria. The objective of this study, therefore, was to investigate the vegetative and reproductive growth of
242
upland NERICA rice va rieties as affected by typ~ and rates of pphcatlon of organic manure.
MATERIALS AND METHODS
Experimen tal site
Two field trials were conducted at the research farm of the Federal University of Agriculture Abeokuta (FUNA/\B) between May 31 and September 30 in 2009 and Ogbe Eruku Village (OEV), Owode - Egba, Ogun State, Nigeria between July 7 and November 30 in 2009. The agro-ecology of FUNAAB (709'N lat., and 3021' E long.; 140 m asl) is a transition between rainforest and derived savanna while OEV (6057'N lat., and 3031'E long., 107 m asl) is in the rainforest zone. The total rainfall during the period of experimentation in FUNAAB and OEV was 737.7 mm and 439.2 mm, respectively. The average temperature and re lative humidity d urine the period were 26.8°C and 75.7% in FUNAAB and 28.3oC and 85.2% in OEV, respective! y.
Soil and land preparation
Soil samples were collected for nutrient analyses according to Van Averbeke et al. (2007). Soil pH was determined in 1:2:5 (soil: water) and KCI solution (1:1) using glass electrode pH meter. Available p hosphorus was extracted using Olsen's extract while the P in the extract was de termined by the use of spectrophotometer; total nitrogen in the soil was digested and analysed using Kjedahl method. Exchangeable Cation (Na, K) were extracted with 1 N Ammonium Acetate, Na and K in the extract were determined by flame photometry. Hydrometer me thod was utilized in the determination of particle size distribution of the soil. The soil at FUNAAB experimental field was loamy sand with 0.05% total nitrogen while the soil at OEV was sandy clay loam with 0.09% total nitrogen. The land was prepared manually at
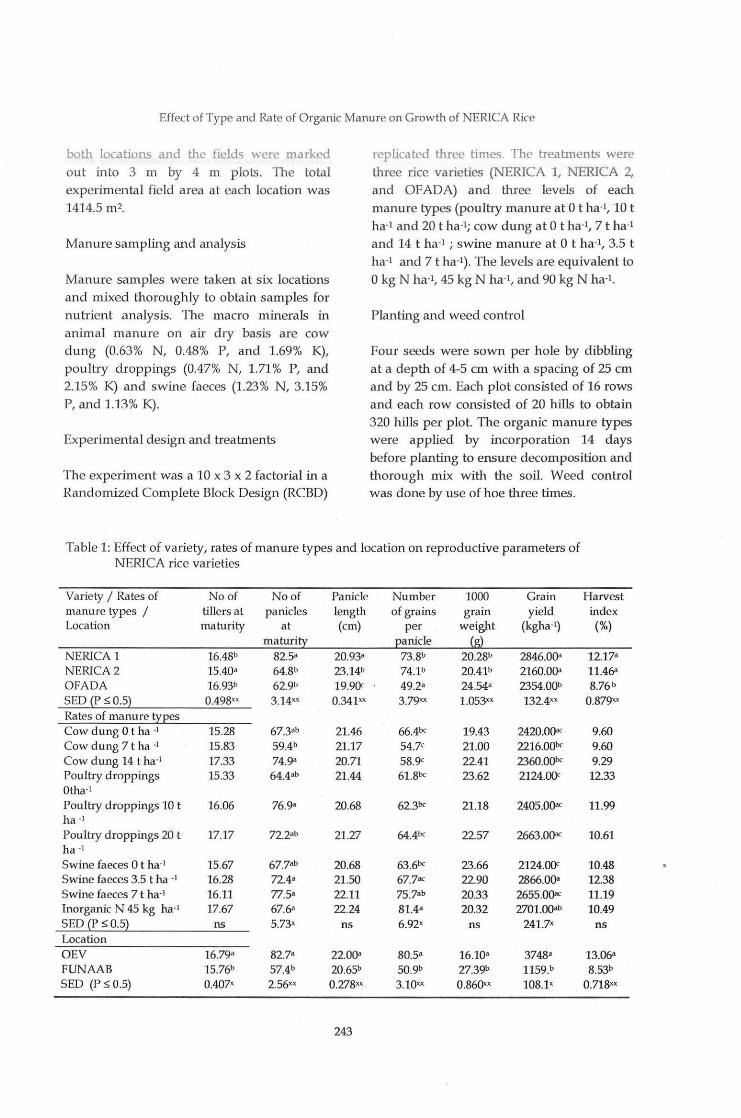
Effect of Type and Rate of Organic Manure on Growth of NERlCA Rice
both locations and the fields were marked
out into 3 m by 4 m plots. The total
experimental field area at each location was 1414.5 m 2.
Manure sampling and analysis
Manure samples were taken at six locations
and mixed thoroughly to obtain samples for
nutrient an alysis. The macro minerals in
animal manure on air dry basis are cow
dung (0.63% N, 0.48% P, and 1.69% K),
poultry droppings (0.47% N, 1.71% P, and
2.15% K) and swine faeces (1.23% N, 3.15% P, and 1.13% K).
Experimental design and treatments
Th e experiment was a 10 x 3 x 2 factorial in a Randomized Complete Block Design (RCBD)
replicated three times. The treatments were
three rice varieties (NERICA 1, NERICA 2,
and OFADA) and three levels of each
manure types (poultry manure at 0 t ha·l, 10 t ha·l and 20 t ha·l; cow dung at 0 t ha·l, 7 t ha·l
an d 14 t ha-l ; swine m anure at 0 t ha·l, 3.5 t
ha·l and 7 t ha-t). The levels are equivalent to
0 kg N ha·l, 45 kg N ha-1, and 90 kg N ha·l.
Planting and weed control
Four seeds were sown per hole by dibbling
a t a depth of 4-5 em with a spacing of 25 em
and by 25 em. Each plot consisted of 16 rows
and each row consisted of 20 h ills to obtain
320 hills per p lot. The organic manure types
were applied by incorporation 14 days
before planting to ensure decomposition and
thorough mix with the soil. Weed contro l was done by use of hoe three times.
Table 1: Effect of variety, rates of m anure types and location on reproductive parameters of NERICA rice varieties
Variety I Rates of No of No of Panicle Number 1000 Grain Harvest manure types I tillers at panicles length of grains grain yield index Location maturity at (em) per weight (kgha-1) (%)
maturi!Y ~anicle {g} NERICA 1 16.48b 82.5• 20.93• 73.8b 20.28b 2846.0()a 12.17• NERICA 2 15.40• 64.8b 23.14b 74.1b 20.41b 2160.0()a 11.4& OF ADA 16.93b 62.9b 19.9()c 49.2• 24.54• 2354.00b 8.76b SED {P ~0.5} 0.498xx 3.14•• 0.341"" 3.79"" 1.053XX 132.4"" 0.879"" Rates of manure !YEes Cow dung 0 t ha -1 15.28 67.3•b 21.46 66.4bc 19.43 2420.0()ac 9.60 Cow dung 7 t ha · l 15.83 59.4b 21.17 54.7< 21.00 2216.00bc 9.60 Cow dung 14 t ha·l 17.33 74.9" 20.71 58.9< 22.41 2360.00bc 9.29 Poultry droppings 15.33 64.4•b 21.44 61.8bc 23.62 2124.()()c 12.33 Otha·1
Poultry droppings 10 t 16.06 76.9• 20.68 62.3bc 21.18 2405.0()ac 11.99 ha ·1
Poultry droppings 20 t 17.17 72.2•b 21.27 64.4bc 22.57 2663.0()ac 10.61 ha ·1
Swine faeces 0 t ha-l 15.67 67.7•b 20.68 63.6bc 23.66 2124.()()c 10.48 Swine faeces 3.5 t ha -1 16.28 72.4• 21.50 67.7ac 22.90 2866.0()a 12.38 Swine faeces 7 t ha·l 16.11 77.5• 22.11 75.7•b 20.33 2655.0()ac 11.19 Inorganic N 45 kg ha-l 17.67 67.6• 22.24 81.4• 20.32 2701.00•b 10.49 SED {P ~ 0.5} ns 5.73• ns 6.92• ns 241.7• ns Location OEV 16.79• 82.7• 22.0()a 80.5• 16.10• 3748• 13.06• FUNAAB 15.76b 57.4b 20.65b 50.9b 27.39b 1159.b 8.53b SED (P ~ 0.5) 0.407• 2.56•• 0.278xx 3.10" 0.860X• 108.1• 0.71SXX
243
Oyekanrni et a/., 2013
Data collection
Data were collected on number of tillers at maturity, number of panicles at maturity, parucle length, number of grains per panicle, 1000 grains weight and grain yield at harvest and harvest index.
Statistical analysis
The combined analysis of the data collected at the two locations were subjected to Analysis of Variance (ANOVA) using GENSTAT Discovery 4 and significan t treatment means were separated using Duncan's Multiple Range Test (DMRT).
RESULTS AND DISCUSSION
Effect of main factors on reproductive parameters of rice
The main factors in this experiment were variety, rates of application of manure types and location. The result in Table 1 shows that variety had a highly significant effect on number of tillers at maturity, number of parucles at maturity, panicle leng th, number of grains per panicle, 1000 grain weight, grain yield and harvest index. NERICA 1 with 73.8 grains per panicle and 20.28 g 1000 grain weight produced the highes t grain yield of 2846 kg ha-l with a harvest index of 12.17%. NERICA 1 and NERICA 2, however, were not significantly different from each other in terms of number of grains per panicle, 1000 grain weight and grain yield while OF ADA with a grain yield of 2354 kg ha-l was significantly different from both of them. The rates of application of manure had significant effect on number of panicles at maturity, number of grains p er panicle and grain yield but h ad no significant effect on number of tillers at maturity, panicle length, 1000 grain weight, and h arvest index. Cow dung applied at 7 t ha-l produced a grain yield of 2216 t ha-1 which was not significantly different from grain yield of
244
2420 t ha-1 and 2360 t ha 1 produced by cow dung applied at 0 t ha-l and 14 t ha-l. Poultry droppings applied at 10 t h a·I also produced a grain yield of 2405 t ha-l higher than 2124 t ha-1 produced by cow dung applied at 0 t ha-l but not significantly different from 2663 t ha-l produced by cow dung applied at 20 t ha-1 . The application of swine faeces at 3.5 t ha-l produced a grain yield of 2866 t ha-l quite higher but not significantly different from 2655 t ha-1 produced by swine faeces applied at 7 t ha-1. The effect of location on the parameters was mos tly highly significant. All the parameters measured at OEV were significantly different from the same parameters measured at FUNAAB. The result also indicated that OEV produced a higher grain yield of 3748 t ha-1 compared to 1159 t ha-l produced at FUNAAB.
Interactions of rates of application of manure types, variety and location on number of tillers a t vegetative s tage
The interactions of rates of application of manure types, variety and location had significant effect on number of tillers at the vegetative s tage. The result (Table 2) indicated that there were no significant differences in number of tillers produced by NERICA 1 and NERICA 2 across the different ra tes of cow dung applied at OEV and FUNAAB. At FUNAAB, application of cow dung at 0 t ha -1, 7 t ha -1 and 14 t ha -1 to NERICA 1 produced a higher number of tillers (10.67, 11.33 and 11.67) compared to 9.33, 9.33 and 11.00 obtained in OEV. The same trend was observed in number of tillers produced by NERICA 2 at FUNAAB and OEV. Application of cow dung at 7 t ha ·1
and 14 t ha ·1 to OF ADA produced 14.67 and 13.33 tillers in OEV and 10.67 and 12.67 tillers in FUNAAB. Application of poultry droppings at 0 t ha-l, 10 t ha-l, and 20 t ha-l to NERICA 1, NERTCA 2 and OFADA at OEV and FUNAAB significantly affected number of tillers at the vegetative stage. Poultry droppings applied at 10 t ha-l produced

Effect of Type and Rate of Organic Manure on Growth of NERIC A Rice
numbers of tillers that were not significantly different across variety and location.
Application of swine faeces at 0 t ha-l, 3.5 t ha-l and 7 t ha·l to NERICA 1, NERICA 2 and OFADA produced higher (13.33, 11.00 and 15.67), (10.00, 9.33 and 11.33) and (12.33, 16.00 and 12.33) numbers of tillers a t FUNAAB and were comparable to 9.00, 11.00 and 12.33, 8.00, 9.33 and 11.67 and 10.33, 11.00 and 12.33 numbers of tillers produced at OEV. The recommended rate of 45 N kg ha-L produced much higher numbers of tillers at vegetative stage than any of the rates of application of manure types.
Number of panicles
The interaction of rates of application of manure types and location (Table 3) had significan t effect on number of panicles of rice at maturity. The numbers of panicles produced at OEV (72.9, 65.8 and 83.8) and at FUNAAB (61.7, 53.0 and 66.0) by application of cow dung at 0 t ha-1, 7 t ha-l and 14 t ha-1
were not significantly different from one another. A similar trend was observed for numbers of panicles produced by application of different rates of poultry droppings and swine faeces.
Table 2: Effect of interactions of rates of manure types, varieties and location on number of tillers of NERICA rice varieties at vegetative stage
Variety I Location I Rates Number of tillers of Nerica rice at vegeta tive stage of manure types NERICA 1 NERICA2 OF ADA
OEV FUNAAB OEV FUNAAB OEV FUNAAB Cow dung 0 t ha -• 9.33&m 10.67•m 8.00km 13.0Qbh 8.33im 7.331m Cow dung 7 tha -I 9.33em 11.33dl 8.0Qkm 9.33gm 14.6'Jbd 10.67•m Cow dung 14 t ha ·1 ll.OOdl 11.67<k 8.67'01 12.33bJ 13.33b& 12.67b• Poultry droppings 0 t ha-l 9.00hm 12.67b• 6.67"' 10.oorm 8.67'"' 11.67<k Poultry droppings 10 t ha·I 11.0Qdl 13.33bg 9.33&01 11.00 13.67b1 11.67<k Poultry droppings 20 t ha-1 11.33dl 12.0Qbk 13.67 9.33gm 13.67b1 14.67be Swine faeces 0 t ha -1 9.00hm 13.33b& 8.00km lO.OOfm 10.33101 12.33bJ Swine faeces 3.5 t ha -1 11.0Qdl 11.0Qdl 9.33&01 9.33&"' 11.00 16.00ab Swine faeces 7 t ha -1 12.33bJ 15.67d( 11 .67<k 11.33d1 12.33bi 12.33bJ Inorganic N 45 kg ha·1 15.00be 19.00• 9.33&01 10.67•m 13.67 12.67bi SED (P :;; 0.5) 1.701•
Table 3: Effect of interactions of rates of manure types and loc:ation on number of panicles of NERICA rice varieties at maturity stage
Rates of manure types I Location
Cow dung 0 t ha ·1
Cow dung 7 t ha -1
Cow dung 14 t ha -I
Poultry droppings 0 t ha·1
Poultry droppings 10 t ha· 1
Poultry droppings 20 t ha·1
Swine faeces 0 t ha ·1
Swine faeces 3.5 t ha ·1
Swine faeces 7 t ha ·• Inorganic N 45 kg ha·• SED (P:::; 0.5)
Number of panicles <>f Nerica rice at maturity stage
OEV FUNAAB 72.9bf 61.7•h 65.8dg 53.0gh 83.8•d 66.0dg 74.0•• 54.8fh 85.4"' 68.4<& 91.9• 52.4&h 90.3•b 45.0h 91.0•b 53.9&h 89.6•b 65.4dg 81.9•d 53.2&h
8.10•
245

Oyekanmi et al., 2013
Number of g rains per panicle
The interactions of rates of a pplication of
manure types, variety and location h ad
significant effect on number of grains per
panicle (fable 4). Application of different
rates of each manure types to NERICA 1,
NERICA 2 and OF ADA a t OEV and UNAAB
produce d grains p er panicle that were n o t
s ignificantly diffe rent from on e another
except in the application of 45 N k g ha-1 and
swine faeces at 7 t ha-l to NERICA 1 at OEV
and FUNAAB that produced high e r
numbers of 133 and 117 g ra ins per panicle,
:espect:Ively. Apphcation of 45 N kg ha·· and
poultry droppings at 20 t ha-l to NERICA 2 at OEV also produced 104 and 112 grains per
panicle.
G rain y ield
The inte ractions o f rates of application of
manure types, variety and location had
s ig nificant effect on grain yield of rice
varieties tested in the experiment (fable 5) . The grain yields at OEV across the
Table 4: Effect of interac tions of rates of manure types and location on .number of grains per panicle of N ERICA rice a t maturity stage
Variety I Location I Rates Number of grains per panicle of Nerica rice at of manure types maturi~ stage
Nerica 1 Nerica 2 OF ADA OEV UNAAB OEV UNAAB OEV UNAAB
Cow dungOtha -I 98.7ae 39.7iq 87.3bh 76.0hl 53.3fq 43.7iq Cow dung 7tha -I 73.Qcm 31.3mq 71.Qcn 70.0do 60.0"'1 22.7pq Cow dwlg 14tha ·I 79.3bk 42.7•q 73.0cm 74.3cl 66.0do 18.Qq Poultry droppings Otha·I 95.0"1 46.7hq 66.Qd0 53.0fq 81.0bJ 29.0nq Poultry droppings 10tha·1 72.3'"' 55.31P 66.7do 74.Qc1 68.0do 37.7kq Poultry droppings 20tha·1 64.0do 51.7&q 104.0•d 72.3cm 59.3"'1 35.31q Swine feaces Otha -I 79.'Jbk 54.71q 116.0•b 44.3"1 58.7"'1 28.3"'1 Swine feaces 3.5tha -I 89.0bh 77.3hl 95.0"1 48.3hq 59.0«1 37.7kq Swine feaces 7tha -I 93.0b& 117.Qab 92.7b& 48.0hq 64.7dp 39.0JP Inorganic N 45 kg ha-l 133.0• 83.0h• 112.Qa< 37.3kq 83.7b• 39.3JP SED ~p ~ 0.5~ 16.95><
TableS: Effect of inte ractions of rates of manure types, varie ty and location on grain yield of NERICA rice a t m a turity s tage
Rates of manure type I Grain }:ield kgha·' Variety I Location NERICA 1 NERICA2 OF ADA
OEV FUNAAB OEV FUNAAB OEV FUNAAB Cow dung Otha ·1 5QOO•b 1257km 2622fk 1454km 3133~ · 1Q54m Cow dung 7tha -1 3444dJ 1Q61m 3067~ 1087m 3600bJ 1Q38m Cow dung 14tha -1 4622•• 1148lm 2333hm 11521m 3867bf 1035m Poultry droppings 0 tha·1 3578bi 119SJm 2222.im 11481m 3533<1 1Q66m Poultry droppings 10 tha·l 4733•• J323km 2400gm 1124m 3756bh 1Q95m Poultry droppings 20 tha·' 3956bf 129J km 4778•d 11411m 3756bh 1055m Swine feaces 0 tha -1 2578" 1203'm 3511CJ 1049m 3311"l 1Q94m Swine feaces 3.5 tha ·1 5844• 11941"' 39J1bf 11831m 3778bg 1285km Swine feaces 7 tha ·1 488g.c 1377km 3822bg 1Q49m 3756bi 1Q38m Inorganic N 45 kg ha·I 5822• 1403km 3067fJ 1088m 3756bh 1Q74m
SED (P ~ 0.5~ "592.3
246
Effect of Type and Rate of Organic Manure on Growth of NERICA Rice
application rates of manure types and varieties were higher than what was obtained at FUNAAB. Application of poultry droppings a t 10 t ha-1 and swine faeces at 3.5 t ha-1 to NERICA 1 at OEV produced values of 4733 kg ha-l and 5844 kg ha-l comparable but not significantly different from 5822 kg ha-l produced by 45 N kg ha-1. Application of swine feaces at 3.5 t ha-l to NERICA 2 and OFADA a t OEV also produced high grain yields of 3911 kg ha·l and 3778 kg ha-l. At FUNAAB, application of swine faeces at 3.5 t ha-l to NERICA 1, NERICA2 and OFADA also produced high grain yields witl1 values of 1194 kg ha·l, 1183 kg ha-l and 1285 kg ha-1, respectively.
Varietal response
The significant effect of variety on panicle length, number of grains per panicle, 1000 grain weight and grain yield at OEV with application of cow dung, poultry droppings and swine faeces was reflected in the early vegetative and reproductive growth of the NERICAs. The variation in the yield component parameters (Muhammad et al.,
2008) could be due to variation in availability of major nutrients. The available and slowly released organic nutrients assisted in enhancing leaf area and high photoassimilates and more dry matter accumulation. These performances and the shorter duration of upland NERICA varieties are some of the major attractions to resource poor farmers (Somado et al., 2008). Early vigorous growth assisted NERlCAs to suppress weed and escape drought and this iri turn assisted farmers to diversify their cn:>pping systems through rotations or intercrops. Tillering is considered as an important trait in rice production. Mirza et al. (2010) reported increase in number of _tillers in . rice plant due to influence of different fertilizer applications; also availability of more tillers per square meter may be as a result of more nitrogen which plays a cru cial role in cell elongation.
247
Organic sources offer more balanced nutrition to the plants (Miller, 2007), especially micro-nutrients which positively affect the number of tillers in rice. At FUNAAB, NERICA 1 produced more tillers at the vegetative s tage considered to be an important phenological stage in rice plant. Some of the advantages of NERICA rice include; early maturity, high yield, high protein content, good taste. and resis tance to biotic. and abiotic stressors such as: drought, blasts, stem borers and termites. The production of significantly high~r grain yield of 5844 kg ha-l by NERICA 1 at OEV with
application of swine faeces at 3.5 t ha·l could be attributed to higher number of tillers per hill at the vegetative stage which resulted in more number of panicles per square metre and h igher number of grams per panicle. This result confirms · the profuse tillering ability of NERICA 1 (Okeleye et al., 2006; Oyekanrni et al., 2009) and its physiological potentials to intercept the mcident solar radiation and convert same to dry matter that are partitioned into the kernels an.d consequently translated ~to higher gram yield compared to other rice varieties tested. The study showed that application of swine faeces at 3.5 t ha·l increased rice grain yield and also saved the time and energy of the resource poor farmers by reducing the drudgery and cost associated with manure application per hectare of land in rice production as against the recornrri.ended 6 -10 -t h a-1 of organic manure.
.CONCLUSION
Among the varieties tested, NERICA 1 displayed better performance as manifes ted . in higher grain yields at OEV and FUNAAB, respectively. The result of this. experiment also revealed that different ma~~re types applied at different rates.contributed ·dir.ectly to grain yield per hec;tare and_ produced more rice . grains per.' :he<;liai'S. ·._a,t OEV compared to what w'a~ ' ;btained at FUNAAB. The reso~rc~ poor fariD.ers may
Oyekanmi et al., 2013
consider adoption and applica tion of swine faeces at 3.5 I ha- because it produced the highest number of productive panicles per square metre and number of grains per panicle with a grain yield of 5844 kg ha-l at OEV. This is the first research work that showed that application of swine faeces at 3.5 t ha-l led to increase in rice grain yield and also saves time and energy of the resource poor farmers by reducing the drudgery and cost associated with manure application p er hectare of land in rice production as against the recommended 6 -10 t ha-l of organic manure.
ACKNOWLEDGEMENTS
The authors wish to acknowledge the support of Dr. 0. Ajayi, Head of Nigeria Station of African Rice, International Institute of Tropical Agriculture, Ibadan, Nigeria for the supply of planting materials. They are also g rateful for the support of Mr. G. F. Olonode of Ogbe Eruku Village who is also the Financial Secretary of Rice Farmers' Association of Nigeria, Ogun State Chapter, for providing the land for the second experiment.
REFERENCES
Eneji, A. E., Yamamot, S. and Hanna, T. 2001.
Rice growth and nutrient update as affected by livestock manure in four Japanese Soils. ]. Pl. Nut., 124: 333-33.
Fabiyi, L. L. and Ogunfowora, 0. 0. 1992
Economics of production and utilization of organic fertilizer in Nigeria agriculture: present and future. 151h Ed. Lagos. Federal Ministry of Science and Technology, p . 138-
144.
Ikumo, H. 2003. Estimation of potential supply of animal waste compos t to replace chemical fertilizer use on prefectural basis in Japan.]. Agric. Sci., 58: 469-474.
248
Kohyama, K., Hojito, M., Sasaki, H. and Miyaji, H_ 2003. Estimation o£ :titrogen load originating from cattle farming using agricultural s tatistics mesh data. jap. f. Soil Sci. and Pl. Nut., 74: 425-433.
Miller, H. B. 2007. Poultry litter induces tillcring in rice. f. Sustain. Agric., 31: 1-12.
Mirza Hasanuzzaaman, K. U., Ahamed, N. M., Rahmatullah, N., Akhter, K. N. and Rahman, M. L. 2010. Plant growth character and productivity of wetland rice (Oryza sativa L.) as affected by application of different manures. Emir. f. Food Agric., 22(1):
46-58.
Muhammad, I. 2008. Response of Wheat growthand yield to various levels of compost and organic manure. Pak. J. Bot., 40(5): 2135-
2141.
Olayinka, A., Adetunji, A. and Adebayo, A. 1998. Effect of organic amendments on nodulation and nitrogen fixation of cowpea. J. Pl. Nut., 21(11): 2455-2464.
Okeleye, K. A., Adeoti, A. Y. A. and Tayo, T. 0. 2006. Farmers' participatory rice variety selection trials at Ibogun Olaogun village, Ogun state, Nigeria. Int. f. Trap. Agric., 24:
634-649.
Oyekanmi, A. A., Okonji, C. J., Odedina, J. N., Atayese, M. 0. and Okeleye, K. A. 2009.
Effect of poultry manure on the .yield components and grain yield of upland rice varieties. Int. f. Trap. Agric., 27: 549-553.
Prassad, P. V. V., Satyana Rayana, V., Murty, V. R. and Broote, K. J. 2002. Maximizing yield in rice groundnut cropping sequence through integrated nutrient management. Field Crop Res., 75: 9-21.
Sobulo, R. A. and Babalola, 0. 1992. Towards efficient fertilizer use in Nigeria. 14U' Ed. Lagos. Federal Ministry of Agriculture,

Effect of Type and Rate of Organic Manure on Growth of NERICA Rice
Water Resources and Rural Development, 90 -110.
Somado, E. A., Guei, R. G. and Keya, S. 0. 2008 NERICA : the New Rice for Africa- a Compendium. 2008 Edition. Cotonou, Benin. Africa Rice Centre (WARDA) Headquarters.
249

Journal of Applied Agricultural Research 2013, 5(2): 251-261 ISSN 200o-750X © Agricultural Research Council of Nigeria, 2013
COMPARATIVE EVALUATION OF RESPONSE OF LOWLAND NERICA® RICE AND IMPROVED Oriza sativa RICE TO NITROGEN AND PHOSPHORUS
RATES IN MOIST SAVANNA OF WEST AFRICA
Aderibigbe, S. G.l, *Okonji, C. J.l.S, Okeleye, K. A.l, Oikeh, S. 0.3, Oyekanmi, A. A.l, Bodunde, G.2, Ajayi, 0.4, Nwilene, F.4and 0. S. Sakariyawo1
1Dept. of Plant Physiology and Crop Production, 2Dept. of Horticulture, Federal University of Agriculture, Abeokuta, Nigeria. 3Africa Agricultural Technology Foundation (AATF),
P. 0. Box 30709-00100, Nairobi, Kenya. 4African Rice Centre (AfricaRice), Ibadan, Nigeria
SDept. of Crop Science and Horticulture, Federal University, Oye-Ekiti, Nigeria *[email protected]
ABSTRACT
Information on the response of lowland NERlCA varieties to Nitrogen (N) and Phosphorus (P) requirements is limited. This study, therefore, examined optimum Nand P requirements for lowland NERlCA in the moist savanna ecology of Nigeria. Field trials were conducted in 2006 and 2007 at the National Cereals Research Institute in Edozhigi, Niger State (09045'N, 0607'E) Nigeria. The trials were laid out in a randomized complete block design in a split-split plot arrangement replicated three times. Main plot consisted of phosphorus at 0, 3, and 6 g P20s m-2; sub-plot consisted of nitrogen 0, 3, 6 and 12 g N m -2; and the sub-sub-plot contained ten lowland rice varieties: five lowland NERlCAs (L-19, -20, -41, -42, -60), four improved sativa (FKR 19, TOX 4004, BW 348-1 and WITA 4) and Ebagichi as a local check (control). The result showed that 6 g N m-2 significantly (P<0.05) improved tiller number, panicle length and grain yield of NERICA L-42. Among NERlCAs, L-42 produced optimum grain yield of 231 g m-2 at 3 g P20s m-2 and 6 g N m-2 suggesting that these N and Prates are adequate for the production of lowland NERICAs and could be recommended for smallholder lowland rice farmers in the moist savanna of Nigeria.
Keyword: lowland NERlCA, nitrogen, phosphorus, yield and yield components
INTRODUCTION
Rice (Oryza sativa L.) is the third most widely consumed staple food crop worldwide, after
wheat and maize (Grist, 1975; De Datta,
1981). It is also the only cultivated cereal
crop adapted to both flooded and non
flooded soil conditions, which provides more calories per hectare than any other
cereal crop worldw ide . Lowland rice is
cropped on approximately 128 million
hectares worldwide under irrigated and rain
-fed conditions (Maclean et al., 2002). In spite
251
of increase in local rice production in Nigeria
from 0.7 million metric tonnes between 1978 to about 3.3 million metric tonnes in 1998
(Ukwungwu, 2000), local demand for rice
has been on the increase due to population
increase. Although Nigeria is the largest
producer of rice in West Africa, producing
an average of 4.2 million metric tonnes as at 2005, local demand stood at 5.0 million metric tonnes leaving a gap of 800,000 metric
tonnes to be augmented via importation
(Fagade, 2000; Abdullahi, 2002; RIFAN,
2006). It is important to note that most of the
Aderibigbe et al., 2013
cultivated varieties of rice in Nigeria are the sativa speaes with a number of inherent productivity problems such as susceptibility to drought, pest and diseases, poor soil conditions as well as poor yielding potential (Okeleye et al., 2006; WARDA, 2006). In solving these multifaceted problems of food shortage, breeding efforts have been made to develop crop varieties with higher yield potentials by the West Africa Rice Development Association (WARDA) known as New Rice for Africa (NERICN~), which are interspecific crosses between the indigenous rice, Oryza glaberrima (African rice) which is tolerant to drought, pests and diseases and the higher yielding Oryza sativa (Asian rice) for both upland and lowland production systems. These varieties (NERICAs) are low-management rice plant types developed for resource-limited, smallholder production systems Gones et al., 1997; Dingkuhn et al., 1998; FAO, 2007). A number of the NERICA varieties have been evaluated through Participatory Varietal Selection (PVS) trials and released with some already adopted by farmers in Nigeria (Okeleye et al., 2006; FAO, 2007; Oikeh et al.,
2008). Information on nutrient requirements . for lowland NERICAs, especially in the savannas is grossly lacking (Oikeh et al.,
2008; Ekeleme et al., 2009). However, some new varieties of lowland NERICAs developed are yet to be widely evaluated in the major agro-ecosystems of Nigeria. Therefore, considering the fact that resource poor farmers in Africa and its sub-regions cannot afford the cost of irrigation equipment and even water for rice irrigation, it is imperative that rain-fed lowland rice production with relatively higher yield potential compared to upland rice in West Africa be given proper attention.
Previous studies showed that proper use of fertilizer can increase the yield and improve the quality of rice significantly (Oikeh et al.,
2008). Several studies have shown that application of N and P fertilizer to rice, leads
252
to increase in plant height, panicle number, leaf size, spikelet number and grain yield (Balasubramanian, 2002; Walker et al., 2008). While information on nitrogen requirements of rain-fed upland rice exists (Rodenburg et
al., 2006; Oikeh et al., 2008), little or no information exists on the N and P fertilizer requirements of rain-fed lowland rice in the savannas of North-east, Nigeria. Given the importance of N and P fertilizer on the grain yield of rice, there is a need to know the appropriate rates for the production of rainfed lowland NERICA in the study area. The objective of this study was to evaluate the grain yield performance of selected rain-fed lowland NERICA varieties under different nitrogen and phosphorus rates in the moist savanna agroecology of Nigeria.
MATERIAlS AND METHODS
Site description
Field experiment was conductl:!d at the WARDA fields in the research farm of National Cereals Research Institute (NCRI) Edozhigi, Bida, Niger State Nigeria (Lat. 09°45'N, long 06°7'E, 70.5 m above sea level) in the moist savanna agroecosystem of Nigeria with unimodal rainfall pattern and annual rainfall of 1200 mm (2006), 1386 mm (2007) and 1448 nun in 2008. The experimental sites were waterlogged acidic soil with pH (H20) 4.6 and classified as Typic Haplusalf (Kowal and Knabe, 1972) with low fertility and textural classification of day-loam.
Experimental design
The fertilizer experiment was laid out in a Randomized Complete Block Design (RCBD) in split-split-plot arrangement and replicated three times. The main plot size was 21.5 x 33 m, consisting of three levels of phosphorus: 0, 3 and 6 g P20 s m-2; the sub-plot size was 5 m x 33 m, consisting of four levels of nitrogen: 0, 3, 6 and 12 g N m-2; and the sub-
., .. *"'..- .. tr--- .
/0~ t( .
Influence of Nitrogen and Phosphorus Rates on Performance of Rice ~· ~~ \ ~~ .. • .1' r;;;· ·~· ~ ~~~j_,:
sub-plot size was 5 m x 3 m consisting of ten Data collection -;! \.r.._' ~ •_,. · ·: rice varieties while net plot size was 3 m x 2 _ >" J / m (6 m2). The following yield parameters were tak~: ... -.~VI
~ '1 ... p.'I'Jl .• Nitrogen was applied as urea (46% N) and phosphorus as triple super phosphate (46% P20 s). Nitrogen was applied in two split doses of 1/3 at mid-tillering and 2/3 at booting stage by broadcasting on the rice plots. Phosphorus was applied by broadcast method at land preparation on all plots with a blanket application of 3 g K20 m-2 as muriate of potash (60% K20).
Crop varieties
Lowland rice varieties were used, five of which were the NERICAs (NERICA L - 19, NERICA L - 20, NERICA L - 41, NERICA L - 42 and NERICA L - 60), and four improved sativa (FKR 19, TOX 4004, BW 348-1 and WITA - 4). A check, one local variety, Ebagichi, was also used. These materials were provided by WARDA. The lowland NERICA varieties used were early maturing, about three months duration (Moussa Sie, WARDA lowland rice breeder, personal communication) . The local rice variety used (Ebagichi) was a sativa indica which matures in about 90 tolOO days.
Land preparation and transplanting
The experimental site was ploughed manually after which the soil was loosened and field marked out with pathway of 1.0 m between replicates and 0.3 m between plots of 5 m x 3 m created. Rice seedlings were transplanted at the rate of two seedlings per hill four weeks after seeding on 13th August, 2006 and 24th July, 2007, with spacing of 20 em x 20 em. In each of the plots, there were 15 rows of rice with 25 hills in the plot size of 5 m x 3 m (15 m2) while the net plot of 3 m x 2m (6m2) had 10 rows of rice with 15 hills in each of the plots. Weeding was done manually about three times to keep the field weed free as much as possible.
253
Number of tillers per hill: Number of tillers per hill was taken at mid-tillering, 50% flowering and at harvest using the tagged plants in each plot and the mean recorded.
Number of panicles perfm2: One meter quadrat was used 2-3 days before harvesting to count the number of panicles per square meter
Panicle length (em): Ten randomly selected hills from the net plot were used. Measurement was done with a meter rule from the last node of the panicle to the tip of the tallest grain on the panicle of the main culm.
Filled and unfilled grains per panicle: Number of filled and unfilled grains per panicle was determined by counting grains from harvested and threshed panicles harvested from ten hills in each net plot and the means were recorded.
Grain yield (Mg ha-l): Grain yield obtained per net plot (3 m x 2 m = 6 m2) was weighed and then extrapolated to Mg ha-l
Statistical analysis
Data collected were subjected to analysis of variance using the mixed model procedure with the Restricted Maximum Likelihood method (REML) for variance estimates over years (SAS Institute, 2001). The mixed model procedure is known to be a more powerful tool for the analysis of data with fixed and random effects compared to the general linear model procedure (SAS Institute, 2001). Fixed effects were years, cultivars and levels of phosphorus and nitrogen, while replications (blocks) were random effects. Where three-way interactions were significant (P<O.OS) between main effects,
,.,.
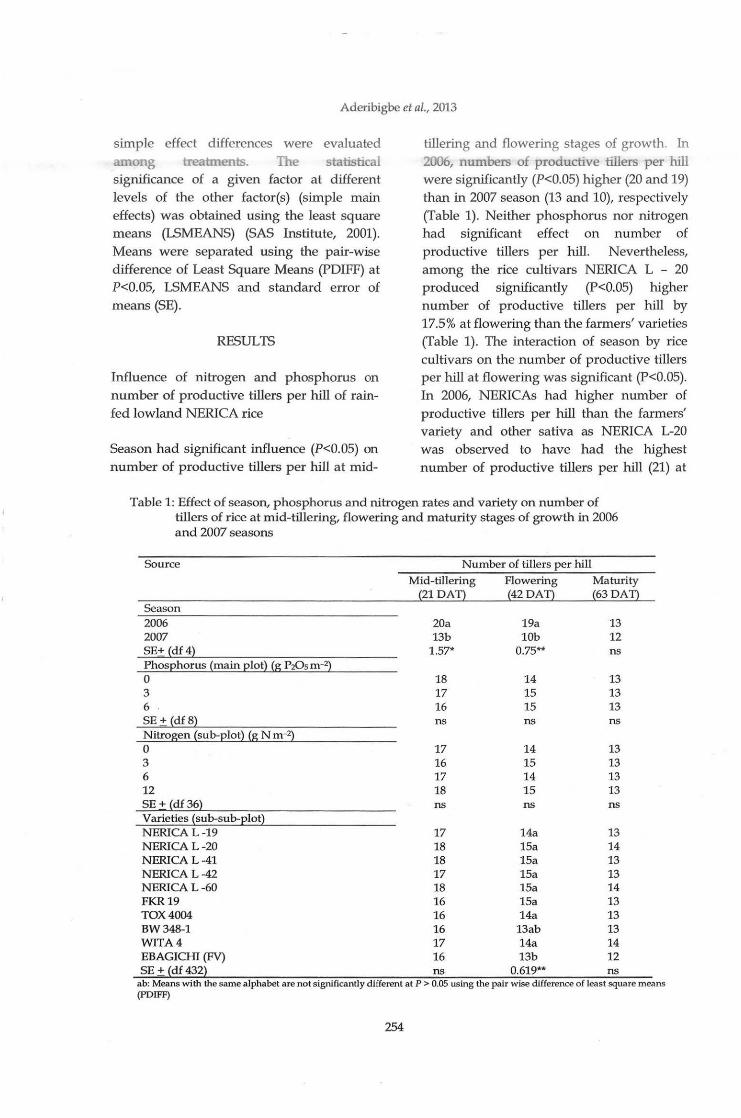
Aderibigbe et al., 2013
simple effect differences were evaluated among treatments. The statistical significance of a given factor at different levels of the other factor(s) (simple main effects) was obtained using the least square means (LSMEANS) (SAS Institute, 2001). Means were separated using the pair-wise difference of Least Square Means (PDIFF) at P<0.05, LSMEANS and standard error of means (SE).
RESULTS
Influence of nitrogen and phosphorus on number of productive tillers per hill of rainfed lowland NERICA rice
Season had significant influence (P<O.OS) on number of productive tillers per hill at mid-
tillering and flowering stages of growth. In 2006, numbers of productive tillers per hill were significantly (P<O.OS) higher (20 and 19) than in 2007 season (13 and 10), respectively (Table 1). Neither phosphorus nor nitrogen had significant effect on number of productive tillers per hill. Nevertheless, among the rice cultivars NERICA L - 20 produced significantly (P<O.OS) higher number of productive tillers per hill by 17.5% at flowering than the farmers' varieties (Table 1). The interaction of season by rice cultivars on the number of productive tillers per hill at flowering was significant (P<O.OS). In 2006, NERICAs had higher number of productive tillers per hill than the farmers' variety and other sativa as NERICA L-20 was observed to have had the highest number of productive tillers per hill (21) at
Table 1: Effect of season, phosphorus and nitrogen rates and variety on number of tillers of rice at mid-tillering, flowering and maturity stages of growth in 2006 and 2007 seasons
Source Number of tillers per hill Mid-tillering Flowering Maturity
(21 DAT) (42 DA1) (63 DA1) Season 2006 20a 19a 13 2007 13b lOb 12 SE+ {df 4} 1.57* 0.75** ns PhosEhorus {main Elot} {g P20s m-2} 0 18 14 13 3 17 15 13 6 16 15 13 SE+{df8} ns ns ns Nitrogen {sub-Elot} {g N m-2} 0 17 14 13 3 16 15 13 6 17 14 13 12 18 15 13 SE + {d.f 36} ns ns ns Varieties {sub-sub-Elot} NERICA L -19 17 14a 13 NERICA L -20 18 15a 14 NERICA L -41 18 15a 13 NERICA L -42 17 15a 13 NERICA L -60 18 15a 14 FKR 19 16 15a 13 TOX 4004 16 14a 13 BW 348-1 16 13ab 13 WITA 4 17 14a 14 EBAGICHI (FV) 16 13b 12 SE + (df 432) ns 0.619** ns
ab: Means with the same alphabet are not significantly different at P > 0.05 using the pair wise difference of least square means (PDIFF}
254
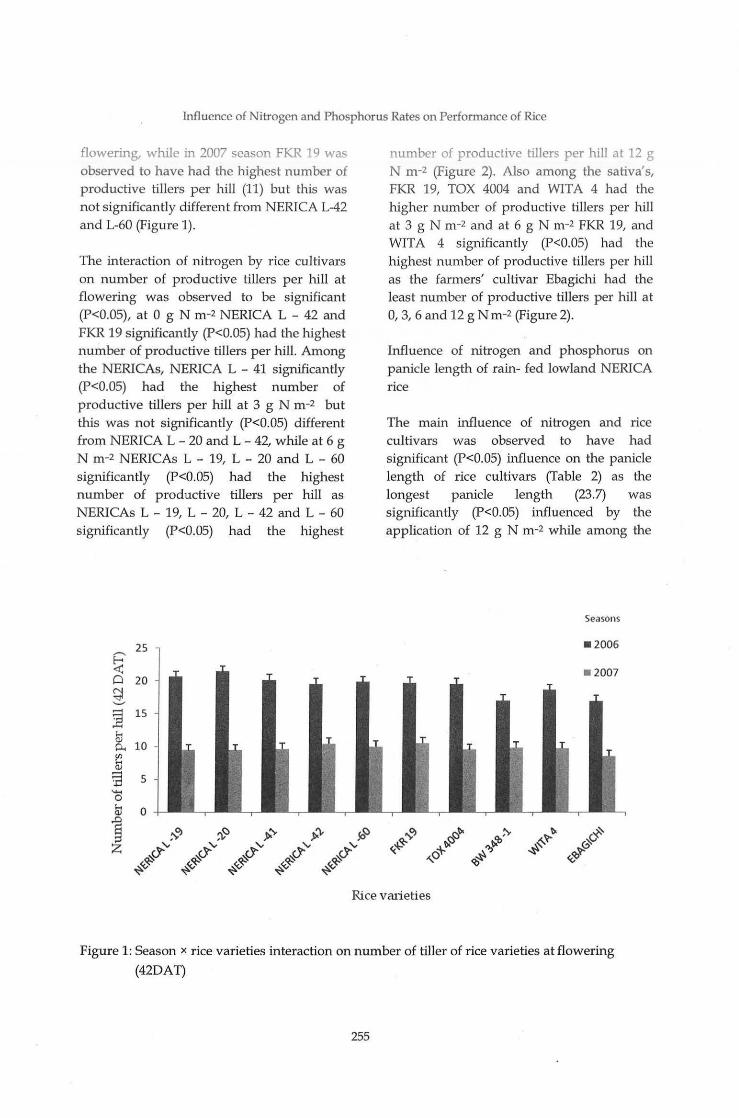
Influence of Nitrogen and Phosphorus Rates on Performance of Rice
flowering, while in 2007 season FKR 19 was observed to have had the highest number of productive tillers per hill (11) but this was not significantly different from NERICA L-42 and L-60 {Figure 1).
The interaction of nitrogen by rice cultivars on number of productive tillers per hill at flowering was observed to be significant (P<0.05), at 0 g N m -2 NERICA L - 42 and FKR 19 significantly (P<O.OS) had the highest number of productive tillers per hill. Among the NERICAs, NERICA L - 41 significantly (P<O.OS) had the highest number of productive tillers per hill at 3 g N m-2 but this was not significantly (P<0.05) different from NERICA L- 20 and L- 42, while at 6 g N m-2 NERICAs L - 19, L- 20 and L - 60 significantly (P<O.OS) had the highest number of productive tillers per hill as NERICAs L - 19, L - 20, L - 42 and L - 60 significantly (P<O.OS) had the highest
25
20
15
10
5
0
number of productive tillers per hill at 12 g N m-2 (Figure 2). Also among the sativa's, FKR 19, TOX 4004 and WITA 4 had the higher number of productive tillers per hill at 3 g N m-2 and at 6 g N m-2 FKR 19, and WIT A 4 significantly (P<O.OS) had the highest number of productive tillers per hill as the farmers' cultivar Ebagichi had the least number of productive tillers per hill at 0, 3, 6 and 12 g N m-2 (Figure 2).
Influence of nitrogen and phosphorus on panicle length of rain- fed lowland NERICA rice
The main influence of nitrogen and rice cultivars was observed to have had significant (P<0.05) influence on the panicle length of rice cultivars (Table 2) as the longest panicle length (23.7) was significantly (P<O.OS) influenced by the application of 12 g N m-2 while among the
Seasons
•2006
• 2007
Rice vcuieties
Figure 1: Season x rice varieties interaction on number of tiller of rice varieties at flowering
(42DAT)
255
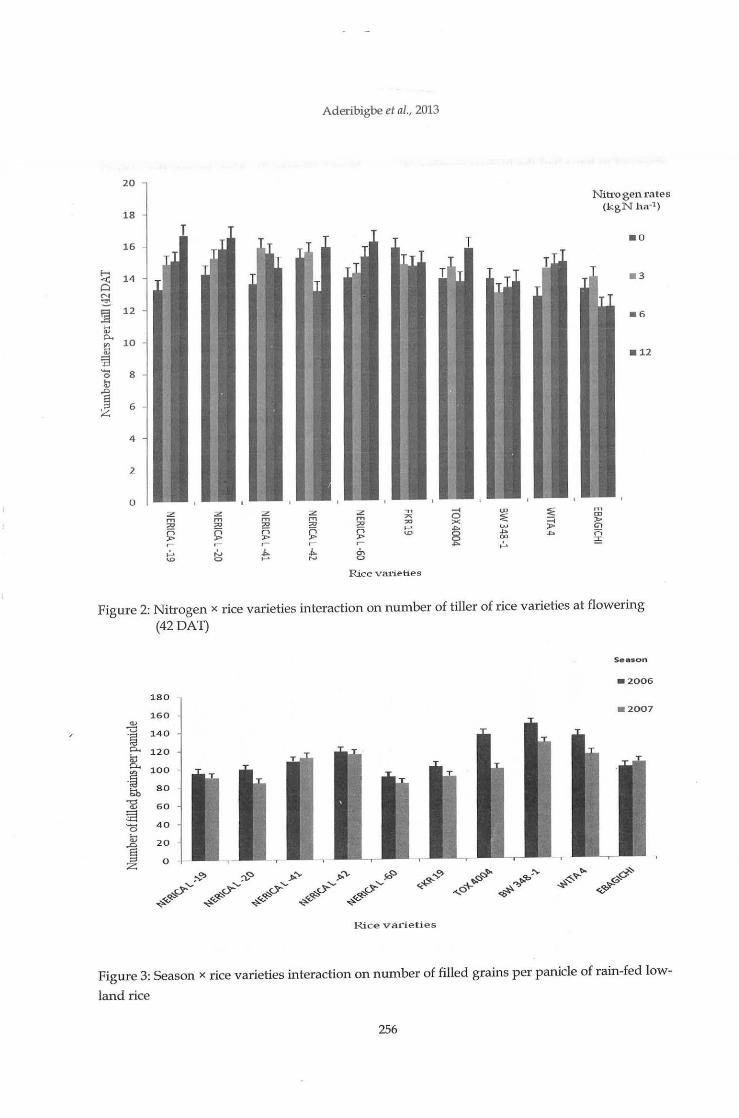
20
1 8
1 6
~ 14 0 " ' ":::!!
~ 12
... C)
p.. 10 ~
C)
13 ..... 8 0
!il .0 s z 6
4
2
u ;;.,: ' ' z ..., ..., ,., ..., "" 21 ::0 "" ~ ~
R ~ )>o .- ,.... .... .:... J,. J,.
"" 0 ,_. .....
Aderibigbe et al., 2013
z ..., "" ~
.... "" :x> ..... \D
~ Rice varie ties
~ U> 0 :E ><
§ w A ()0 ....
~ :::::; )>o ~
Nitt·o gen rates (kgN h a-1 )
ru CD
"" G'l R :;:
Figure 2: Nitrogen x rice varieties interaction on number of tiller of rice varieties at flowering (42 DAT)
Season
• 2 006
180
160 • 200 7
Q) -w 140 •;:::J <a 0.. 1 20 .... Q)
0.. 100
·~ 6b 80
""" 60 Q)
~ 0 40
lil 2 0
~ 0 z
Rice vari e ties
Figure 3: Season x rice varieties interaction on number of filled grains per panicle of rain-fed low
land rice
256
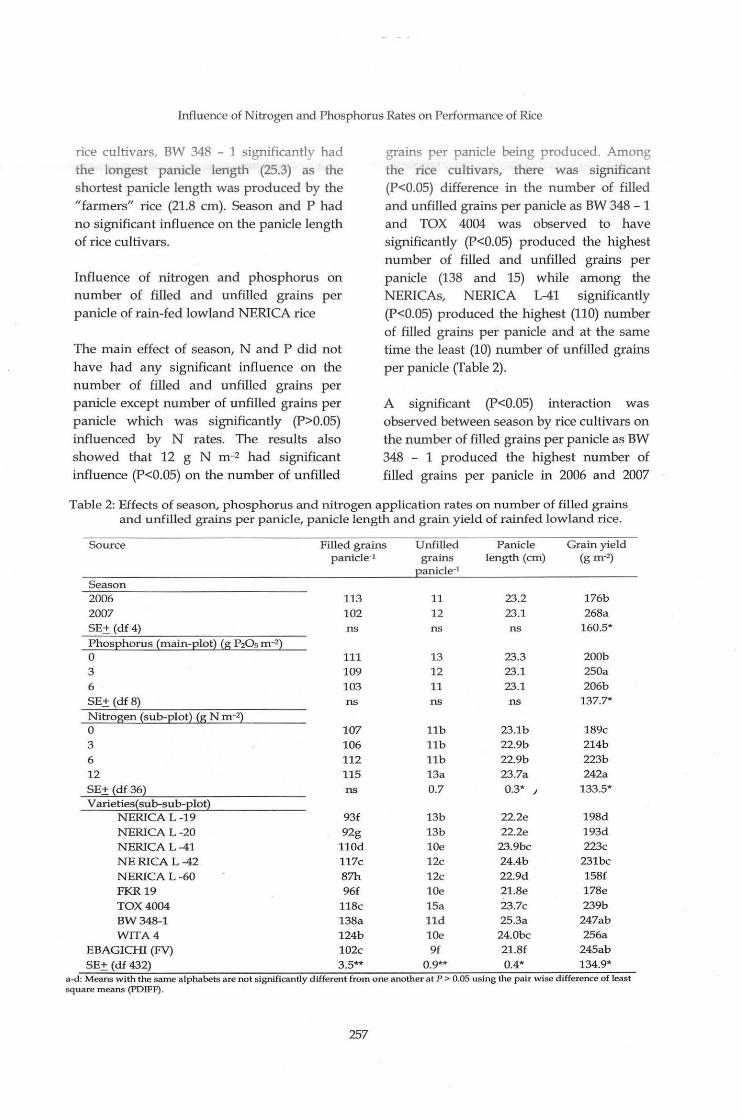
Influence of Nitrogen and Phosphorus Rates on Performance of Rice
rice cultivars, BW 348 - 1 significantly had the longest panicle length (25.3) as the shortest panicle length was produced by the "farmers" rice (21.8 em). Season and P had no significant influence on the panicle length of rice cultivars.
Influence of nitrogen and phosphorus on number of filled and unfilled grains per panicle of rain-fed lowland NERICA rice
The main effect of season, N and P did not have had any significant influence on the number of filled and unfilled grains per panicle except number of unfilled grains per panicle which was significantly (P>0.05) influenced by N rates. The results also showed that 12 g N m-2 had significant influence (P<0.05) on the number of unfilled
grains per panicle being produced. Among the rice cultivars, there was significant (P<0.05) difference in the number of filled and unfilled grains per panicle as BW 348 - 1 and TOX 4004 was observed to have significantly (P<0.05) produced the highest number of filled and unfilled grains per panicle (138 and 15) while among the NERICAs, NERICA L-41 significantly (P<0.05) produced the highest (110) number of filled grains per panicle and at the same time the least (10) number of unfilled grains per panicle (Table 2).
A significant (P<0.05) interaction was observed between season by rice cultivars on the number of filled grains per panicle as BW 348 - 1 produced the highest number of filled grains per panicle in 2006 and 2007
Table 2: Effects of season, phosphorus and nitrogen application rates on number of filled grains and unfilled grains per panicle, panicle length and grain y ield of rainfed lowland rice.
Source Filled grains Unfilled Panicle Grain yield panide·1 grains length (em) (g m-2)
anicle·1
Season 2006 113 11 23.2 176b 2007 102 12 23.1 268a SE± (elf 4) ns ns ns 160.5*
Phose horus (main-elot} (g P20 s m -2} 0 111 13 23.3 200b 3 109 12 23.1 250a
6 103 11 23.1 206b SE+ (elf 8) ns n s ns 137.7*
Nitrogen (sub-elot} (g N m -22 0 107 11b 23.1 b 189c 3 106 11b 22.9b 214b
6 112 11b 22.9b 223b 12 115 13a 23.7a 242a SE+ (elf 36} ns 0.7 0.3* 1 133.5* Varieties(sub-sub-elot}
NERICA L-19 93f 13b 22.2e 198d NERICA L-20 92g 13b 22.2e 193d NERICA L-41 llOd 10e 23.9bc 223c NERICA L-42 117c 12c 24.4b 231bc NERICA L-60 87h 12c 22.9d 158f FKR19 96f 10e 21.8e 178e
TOX4004 118c 15a 23.7c 239b BW348-1 138a lld 25.3a 247ab WITA4 124b 10e 24.0bc 256a
EBAGICHI (FV) 102c 9f 21.8f 245ab
SE+ (df 432) 3.5** 0.9** 0.4* 134.9* a-d: Means with the same alphabets are not significantly different from one another at P > 0.05 using the pair wise difference of least square means (PO IFF).
257
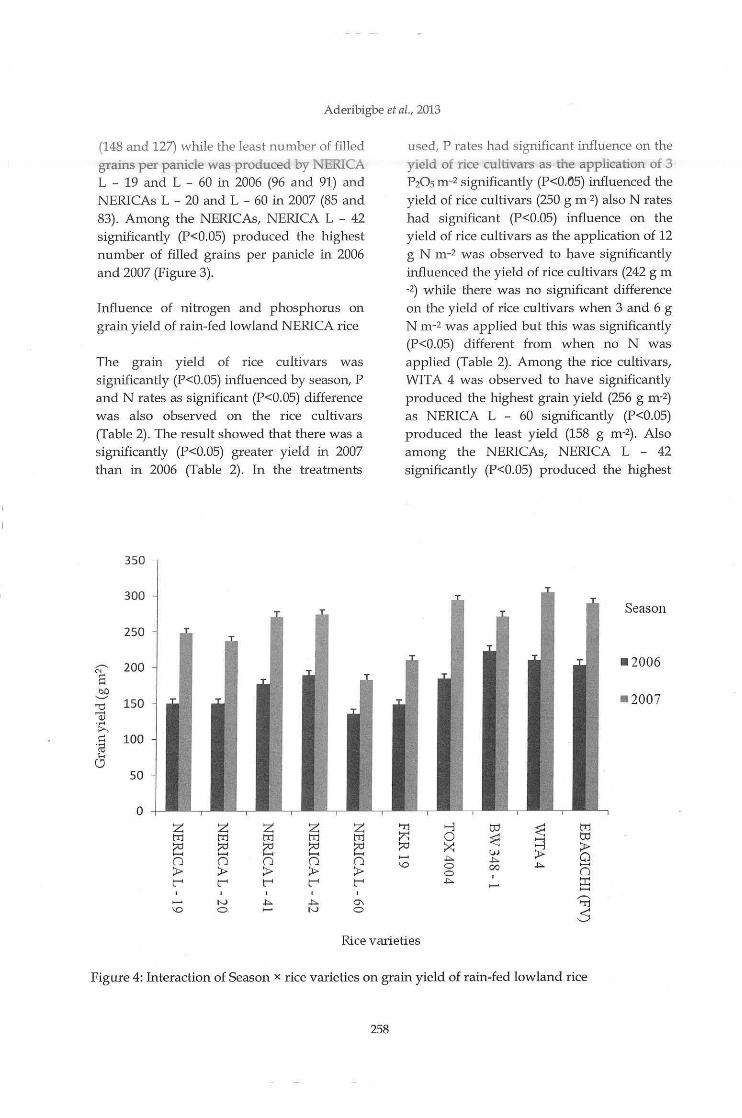
Aderibigbe et al., 2013
(148 and 127) while the least number of filled grains per panicle was produced by NERICA L - 19 and L - 60 in 2006 (96 and 91) and NERICAs L- 20 and L- 60 in 2007 (85 and 83). Among the NERICAs, NERICA L - 42 significantly (P<0.05) produced the highest number of filled grains per panicle in 2006 and 2007 (Figure 3).
Influence of nitrogen and phosphorus on grain yield of rain-fed lowland NERICA rice
The grain yield of rice cultivars was significantly (P<0.05) influenced by season, P and N rates as significant (P<0.05) difference was also observed on the rice cultivars (Table 2). The result showed that there was a significantly (P<0.05) greater yield in 2007 than in 2006 (Table 2). In the treatments
350
300
250
,--... 200 "' s eo ........
'"0 150 .......
Cl! ..... ;>., ::::
•<a ;...., Cl
100
so
0 z z z z z trJ trJ trJ tn trJ :::0 :::0 :::0 :::0 ~ - - - -0 0 0 0 0 >- >- >- ? ? r-' l' r-' l' r-'
t--.J ..,. .!:>. 0\ \0 C> t--.J C>
used, P rates had significant influence on the yield of rice cultivars as the application of 3 P20s m-2 significantly (P<O..fl5) influenced the yield of rice cultivars (250 g m-2) also N rates had significant (P<0.05) influence on the yield of rice cultivars as the application of 12 g N m-2 was observed to l).ave significantly influenced the yield of rice cultivars (242 g m -2) while there was n o significant difference on the yield of rice cultivars when 3 and 6 g N m-2 was applied but this was significantly (P<0.05) different from when no N was applied (Table 2). Among the rice cultivars, WIT A 4 was observed to have significantly produced the highest grain yield (256 g m-2) as NERICA L - 60 significantly (P<0.05) produced the least yield (158 g m-2). Also among the NERICAs, NERICA L - 42 significantly (P<0.05) produced the highest
Season
•2006
• 2007
'Tj ...., t:J:l ~ trJ 7::: 0 ~ - t:J:l :::0 ><: ~ >-w Q .!:>. .!:>. \0 C> 00 .!:>. -C> 0
.!:>. ::r:: -,--._ 'Tj
s Rice varieties
Figure 4: Interaction of Season x rice varieties on grain yield of rain-fed lowland rice
258

Influence of Nitrogen and Phosphorus Rates on Performance of Rice
y ield (231 g m·2) as NERICA L - 60 had the lowest yield (158 g m ). The interaction ot season by rice cultivars as shown in Figure 4 shows that better grain yield was observed in 2007. Among the rice cultivars in 2007,
WIT A 4 and TOX 4004 significantly (P<O.OS)
produced the highest grain yield (304 and 294 g m-2) while in 2006 BW 348 - 1
significantly (P<O.OS) produced the highest grain yield (223 g m·2). NERICAs L- 41 and L - 42 significantly (P<O.OS) produced the highest grain yield (189, 274 and 177, 271 g m-2) among the NERICAs in 2006 and 2007
(Figure 4).
DISCUSSION
This study revealed the responses of lowland rice cultivars to the effects of P and N application rates in the moist savanna of Nigeria. The contribution of rainfall is no doubt a major factor as this is needed in the dissolving of the inorganic fertilizer into forms needed by the rice plant. This could be the reasons why there was better yield performance in 2007 than in 2006. Besides, moisture availability at grain filling stages of development enhanced the grain filling processes. This is also in line with the finding of Okonji et al. (2012) who reported better yield performance as a result of better rainfall dish·ibution. Adequate soil moisture has also been reported to be an important determinant of grain yield and yield component of rice (Okeleye et al., 2002;
Kamara et al., 2011). It can be deduced from the result of the P b·ial that the application of P to lowland rice cultivars never had any s ignificant contribution to the yield components of rice cultivars as this could be attributed to the fact that the soil of the area are inherently high in available P (FPDD 1990). This is also in line with other s tudies that had reported lack of significant conb·ibution of P to lowland rice. Nevertl1eless, the yield of rice cultivars on P application gave a quadratic response in which the highest yield was obtained at
259
moderate P (3 P20s m-2). The yield components ot rice cultivars had a linear response to N application rates and this indicated tl1at the optimum may be achieved when higher dose of N is applied. This might not be favourable to the farmers knowing the cost and difficulties they have in getting ilie fertilizer, although a lot of work has been reported on tile significant contribution of N to crops (Mauad et al., 2003; Meena et al.,
2003; Ahmed et al., 2005; Kamara et al., 2011).
More studies have been reported on ilie performance of NERICA being developed as a low-man agement plant types; sativa performed better ilian ilie NERICAs, aliliough, in Niamey, Niger, NERICA L- 41
had a grain yield of about 6.5 Mg ha-1 (Sido et al., 2006). Kamara eta!. (2011) also reported higher grain yield for NERICA L - 41, L - 12
while Baibi.nge (2006) reported grain yield that ranged from 2.7 to 4.5 Mg ha·1 for lowland NERICAs evaluated i.n DR Congo. The report above conh·ndicts the finding of this trial as the yield of NERICAs ranged from 160 - 230 g m-2, as NERICA L - 42 had the highest grain yield as against the report of Kamara et al. (2011) ti1at reported higher yield for NERICA L- 12 and L- 41.
CONCLUSION
Nitrogen application rates increased the grain yield of rice cultivars as ilie trial has shown iliat the response of NERlCA rice yield to N application was linear. This suggests that the optimum response to N had not been reached. It may then be necessary to investigate the response of NERICA to higher N in the lowland. Also, moderate P had been observed to have contributed to grain yield of rice cultivars. The rice cultivars also responded weU as across N and P application rates among the NERICAs, NERICA L - 42 and L - 41
produced higher grain yield while NERICA L - 60 produced the lowest grain y ield and this suggests that it is not suitable for

Aderibigbe el a/., 2013
production in the lowland ecology. The sativa generally produced the highest grain yteld but among the satwas, WITA 4
produced the highest grain yield while FKR ]9 produced the least grain yield and this also suggests that it is not suitable for lowland rice production.
ACKNOWLEDGEMENTS
The authors gratefully acknowledge the financial support provided by Africa Rice Center (AfricaRice), through African Rice Initiative (ARI) and UNDP-IHP Phase II Project.
REFERENCES
Abdullahi, A. 2002. "Food Importation Worries Government: New African Rice Out". The Guardian Newspaper, Friday 17th May, -[Special Adviser to President Obasanjo on Food Security.
Ahmed, M., Islam, M. M. and Paul, S. K. 2005. Effect of nitrogen on yield and o ther plant characters of local T. Aman Rice, Var. Jatai. Res.]. Agric. Bioi. Sd., 1: 158-161.
BAibinge, J. M. 2006. Preliminary assessment of lowland NERICAs based on agronomic and cooking potential. In L.T. Narteh, D. Miller, and B. Becks (eds.) Abstract: Africa Rice Congress: Beyond the first generation NERICAs in Africa: Paradigms and partnerships for the next decade. Dar es Salam, Tanzania, 31 July- 4 August, 2006, p. 10.
Balasubramanian, R. 2002. Response of hybrid rice (Oryza sativa) to levels and time of application of nitrogen. Indian ]. Agron., 47: 203- 206.
De Datta, S. K. 1981. Principle and Practices in Rice Production. John Willey and Sons Publishers. New York, p. 123- 134.
260
Dingkuhn, M., Jones, M. P., Johnson, D. E. and Sow, A. 1998. Growth and yield potential of 0. sativa and 0. glabemma upland rice cultivars and their interspecific progenies. Field Crops Research, 57: 57-69.
Ekeleme, F., Kamara. A. Y., Oikeh, S. 0., Omoigui, L. 0., Amaza, P., Abdoulaye, T. and Chikoye, D. 2009. Response of upland rice cultivars to weed competition in the savannas of West Africa. Journal of Elsevier crop protection, 28: 90 - 96.
Fagade, S. 0. 2000. Yield gaps and productivity decline in rice production in Nigeria. Intemntio11nl Rice Comm.unications, FAO, Rome, Italy. p. 15.
Food and Agriculture Organization 2007. FAO rice market monitor. No.1. FAO, Rome, Italy. 356 pp.
Fertilizer Procurement and Distribution Division (FPDD). 1990. A Review of Soil and Fertilizer Use Research in Nigeria. In:
Literature Review on Soil Fertility Investigations in Nigeria (Eds Enwezor et nl.), produced in Five Volumes by the Fertilizer Procurement and Distribution Division (FPDD), Federal Ministry of Agriculture and Natural Resources, Lagos, Nigeria. 281 pp.
Grist, D. H. 1975. Rice. 5111 edition, Longman, p. 3-189.
Jones, M. P., Dingkuhn, M., Aluko, K. and . Mande, S. 1997. Interspecific OnJza sativa L x OnJza glnberrimn Steud. Progenies in upland rice improvement. Eutphytica, 92: 237-246.
Kamara. A. Y., Ekeleme, F., Omoigui, L. 0 . and Chikoye, D. 2011. Influence of nitrogen fertilization on yield and yield components of rain-fed lowland NERICA® rice in the northern Guinea savanna of Nigeria African Journal of Agricultural Research, 6(13): 3092-
3097.

Influence of Nitrogen and Phosphorus Rates on Performance of Rice
Kowal, ]. M. and Knabe, D. T. 1972. An agroclimatological atlas of the northern s tates of Nigeria, with explanatory notes. Ahmadu Bello University, Zaria, Nigeria, 71 pp.
Maclean, J. L., Dawe, D. C., Hardy, B. and Hettel, G. P. 2002. Rice Almanac. Wallingford, UK: CABI Publishing. 253 pp.
Mauad, M., Crusciot, C. A. C., foilho, H. G. and Correa, ]. C. 2003. Nitrogen and silicon fertilization of upland rice. Sci. Agricola, 60: 761-765.
Meena, S. L., Surendra, S., Shivay, Y. S. and Singh, S. 2003. Res ponse of hybrid rice (Oryza sativa) to nitrogen and potassium application in sandy clay loam soils. Indian f. Agric. Sci., 73(1): 8-11.
Oi.keh, S. 0., Nwi lene, F., Diatta, S., Osiname, 0., Toure, A. and Okeleye, K. A. 2008a. Responses of Upland NERICA Rice to Nitrogen and Phosph orus in Porest Agroecosystems. Agronomy follmal. 100(3): 735-741.
Okeleye, K. A., Adeoti, A. Y. A. and Tayo, T.
0. 2006. Farmers participatory Rice variety selection trials a t lbogun Olaogun village, Ogun state, N igeria . Intemationa/ jouma/ of Tropical agriculture, 24: 643-649.
Okeleye, K. A., Oyekaruni, A. A., Ariyo, 0 . ].
and Tayo, T. 0. 2002. Performance of rice varieties under upland and low land rainfaU ecologies of southwestern Nigeria. ASSET Series A (2002) 2 (2): 127-140.
Okonji, C. ]., Okeleye, K. A., Oikeh, S. 0., Aderibigbe, S. G., Nwilene, F., Ajayi, 0. and Oyekan.mi, A. A. 2012. Rice yield and yield components as influenced by phosphorus and nitrogen application rates in the moist savanna of West Africa. journal of Agricultural Science and TechnologJ;, 2: 1214-1223.
261
RIFAN. 200b. "Rtce Production in Nige:ia" Rice Farmers' Association of Nigeria (RIFAN). 15pp.
Rodenburg, J., Diagne, A., Oi.keh, S., Futakuchi, K , Kormawa, P. M. and Semon, M. 2006. Achievemen ts and impact of NERICA on sustainable rice production in sub-Saharan Africa. Int Rice Comm. Newsletter, 55:45-58
SAS, Institute, 2001. SAS Technical Report. SAS/Sf AT software: Changes and Enhancements. Release 8.02. SAS Institute, Cary, NC, USA.
Sido, Y. A., Adamou, B., Aboubakar, H., Sidi,
A. and Germaine, I. 2006. Evaluation of intra - and interspecific lines of lowland/ irrigated rice in Niger. In In L.T. Narteh, D. Miller, and B. Becks (eds.) Abs tract: Africa Rice Congress: Beyond the first generation NERICJ\s m Africa: Paradigms an d partnerships for the next decade. Dar es Salam, Tan zania, 31 July-4 August 2006.
Ukwungwu, C. 2000. Rice in Nigeria: My Expe1ieuces . Agrunumy 111 Ntgenn. Umversity
of Ibadan, p. 81- 84.
Walker, T. W., Bond, ]. A., O ttis, B. V., Gerard, P. D. and Harrell, D. L. 2008. Hybrid rice response nitrogen fertilization for Midsouthern United States rice production. Agron. J., 100: 381-386.
West African Rice Development Association (WARDA). 2006. Iron toxicity in rice-based systems in West Africa,(2006) Africa Rice Center (WARDA) Cotonou, Benin, 175 pp.


Journa l of Appl ied Agricullural Research 2013, 5(2): 263-271 lSSN 2006-7SOX © Agricultural Research Council of N igeria, 2013
FUNGAL PATHOGENS AND TOTAL AFLATOXIN CONTENT IN SESAME (Sesamum i11dicum L.) SEEDS MARKETED IN ABUJA, N IGERIA
*Anjorin, S. T. t, Chijioke, C. G.2 and S.C. Ugoh2 1Department of Crop Science, Faculty of Agriculture, University of Ahuja, Ahuja
2 Department of Biological Sciences, Faculty of Science, University of Abuja, Abuja *[email protected]; +23408062242866
ABSTRACT
Sesame seeds marketed in Abuja, Nigeria were evaluated for their mycoflora load by blotter and agar method. The sampled seeds were then assayed for their total aflatoxins (aflatotal) using Enzyme Linked Immunosorbent Assay (ELISA) method. Fung i species isola ted sesame seeds in Abuja were Aspergillus jlavus, A. niger, A. ochraceus and Penicillium rugulosum. All the sesame seed samples from the five locations were found to be infected with Aspergillus niger. Penicillium rugulosum was the least contaminating fungi, infecting only the samples fro m Dobi and Gwagwalada. The samples from Gwagwalada showed the highest contamination w ith three fungi species and a total of 36 colonies, while the samples from Kwali on the other hand showed the least fungal contamination w ith two species of fungi and a total of 22 colonies. The total aflatoxin contents in most of the seeds were below the 4 ppb limit accepted in N igeria. The only exception to this was the sesame seeds from Dobi, with a mean of 8.35 ppb. The aflatotal content of the raw sample from Dobi were significantly (P:>0.01) higher than all other treatments. The aflatotal content in roasted seed s from Gwagwalada, Bwari., Dobi and Abaji were significantly lower (P ::; 0.01) than a ll other treatments. The status of quality of sesa me seeds in Abuja markets in relation to international market standard was discussed.
Keywords: Abuja-Nigeria, fungi, pathogens, sesame seeds, total aflatoxiu
INTRODUCTION
Sesame (Sesamum indicum, Link) is a highly important oil seed widely cultivated and
used in some African and Asiatic countries.
Sesame belongs to Order : Lamiales, Family:
Pedaliaceae and Genus: Sesamttm (Anonymous, 2011). Twenty five percent of the world acreage is cultivated in Africa.
Nigeria, the largest producer after Sudan in
Africa ranked seventh in the world as at 2007 (Cheung et al., 2007). In Nigeria severa l s tates including Benue, Nass arawa, Taraba, Jigawa, Kwara, Kebbi, Kano, Bauchi, Kogi, Pla teau,
Adamawa, Cross Rivers, Ebonyi, Niger, Combe, Katsina, Yobe and Borno produce sesame, with Nassarawa S tate as the leading
263
producer. The World trade of sesame seed is
estimated by FAO a t 3.84 million m etric tons at gross value of $400 million with a growth rate of 2.6% per annum (Adeoye, 2013). Nigeria earned about $20 million from the
exportation of sesame seed, as the leading
globa l producer of the commodity in 2010
(Pete r, 2011).
Sesame is largely produced for its oil. It is
used as a flouring agent in cooking, p roduction of margarine, soaps, pharmaceutics, paints, lubrican ts, eaten as
roasted seeds, confectionary, as medicine
and as cattle feed (Cheung et a/., 2007). Sesame has a ve ry high nutritional value and contains energy, carbohydra tes, sugars,

Anjorin l'l a/., 2013
dietary fibre, fat, protein and minerals (Bedigian, 2006). The oil is used locally for cooking as well as for medicinal purposes such as the treatment of ulcers and burns (N~osu, 2011).
The health of sesame plant is affected by fmtgi causing infection of roof) foliage and seeds. Seed borne mycoflora are carried over by infected seeds. They cause deterioration in seed, while in the soil before germination, causing death and infection of foliage at adu It stage. Fungi including Alternaria, Aspergillus, Fusarium, Penicillium and, Rhizopus spp. have been found to be associated with sesame seed (Nasira et al.,
2004). Aflatoxins are potent toxic secondary metabolites produced mainly by A. Jlavus, A. parnsiticus and rarely A. nomius (Reddy eta/.,
2011; Jonathan et al. , 2012). The aflatoxins arc toxic and carcinogenic. There are four principal types according to their respective innate fluorescent properties (JECFA, 2001).
Aflatoxin B, and 82 produce blue florescence and G, and G2 produce green florescence. B, is the most encountered and most toxic group. Aflatoxigenic fungus not only cause deterioration of food, but a lso causes food borne intoxication in humans and animals because of the secretion of aflatoxins. Aflatoxins have also been found to be associated with sesame seed (Mbah and Akueshi, 2009).
Enzyme-linked imrnunosorbent assay (ELISA) is a biochemical technique used mainly in immunology to detect the presence of an antibody or an antigen in a sample. The ELISA has been used as a diagnostic tool in medicine and plant pathology, as well as a quality-con trol check in various industries. In simple terms, in ELISA, an unknown amount of antigen is affixed to a surface, and then a specific antibody is applied over the surface so that it can bind to the antigen. This antibody is linked to an enzyme, and in the final step a substance is added so that the enzyme can convert to some detectable
264
signal; most commonly a colour change in a chemical substrate (Atehnkcng and Bandyopadbyay, 2010).
Sesame currently ranks second to cocoa i.n terms of agricultural exports in Nigeria and has a potential for earning additional foreign exchange for the country if only opportunities in the European Union could be exploited by meeting their market quality standards. To ascertain the quality of sesame seed marke ted in Abuja, Nigeria, this study was necessitated as little or no information was known about the mycoflora load and total aflatoxin content of sesame seed produced and consumed in Abuja, Nigeria. Sesame seed is economically important to Nigeria, thus the quality of the produced seed is vety paramount. The objectives of this study was to determine the pathogenic fungi load and aflatotal content of sesame seed marketed in Abuja, Nigeria.
Mi\ TERlALS AND METHODS
Sampling of sesame seed
!'he samples used were bought trom the local markets in Bwari, Kwali, Abaji, Gwagawlada and Dobi, in Abuja. Seeds from Gwagwalada, Kwali, Abaji and Dobi were cream to white in colour, while seeds from Bwari had beige colour. Procured samples were packaged in polyethylene bags, tied properly to avoid entry of air after collection and then stored at room temperature (25°C)
until needed.
Identification of fungal pathogens of sesame seed
Fifty seeds from each sample were subjected to standard blotter method (Dawar and Ghaffar, 1990; Abdus and Ansar, 1992) in three replications. Two discs of filter paper of 90 mm size were moistened with d istilled water and placed in 90 mm Petri dish after draining excess water. Seeds were placed at

Fungi Pathogens and Aflatoxin Contents of Sesame
the rate of 10 seeds evenly spread on the paper in each petri dish. Distilled water was poured enough to wet the paper. The plates were incubated at room temperature under alternate cycles of 12 h light and darkness for 96 h.
Agar plate method
The Sabourad Dextrose Agar (SDA) was prepared following the manufacturer's instruction. It was then autoclaved, allowed to cool and poured aseptically and quickly. After gelling, using an inoculating needle, seeds of the infected sesame seed from the blotter method were placed aseptically in Petri dish containing SDA, with respect to the various localities. After seven days of incubation, the fungal colony growth was examined under stereo-binocular micr<?scopc. Microscopic and macroscopic examination was then carried out to identify the mycoflora present in the seed sample. This was by examining the teased wetmount preparation. The identification of fungi was done based on the spore morphology and colony characters of the fungus by referring to the production of food borne fungi manual (Robert et al., 1984; Joanne et nl., 2008).
Preparation of seed for total aflatoxin determination
The same samples for the fungi isolation experiment were used. The samples were mixed properly and 50 seeds were randomly picked. A total of 20 samples was used for the total aflatoxin test. Each sample was divided into two parts; one part was roasted to a light brown colour using dry heat for about 10 mins and the other used as the raw sample. The samples were in three replicates.
Extraction of toxin from seeds
Each sample was ground with an electric blender; 25 ml of methanol water was added
265
to 5 g of the powdered sample. The-samples were then placed in an orbital shaker for '3
mins at 250 rpm and filtered wi"th Whatman No.4 filter paper.
Enzyme Linked Immnosorbent Assay (ELISA)
Twenty four blue-green bordered dilution stripes were placed in a micro-well strip holder, 24 antibody coated micro well strips were placed in a micro-well strip holder. 200 J.d of conjugate from the green capped bottle was measured using the single channel pipettor and added to each blue-green bordered well. Using a single channel pipettor, 100 J.tl of each of the standard and sample was added into the appropriate dilution well, using a fresh tip for each. Using a single channel pipettor with fresh tips each well was mixed carefully, pipetting up and down 3 times. Immediately, 100 J..ll of the contents was transferred into a corresponding antibody coated micro-well. It was then incubated at room temperature for 15 minutes (Reddy et al., 2001).
Alter 15 minutes, the corttents ot the welf was washed away by filling each well with distilled water. This step was repeated 4 times. Micro-well strips were taped on a folded tissue paper to expel residual water as much as possible. One hundred (100) J..ll of the substrate was measured using a single channel pipettor into each micro well and incubated for 5 minutes. After incubation, 100 J..ll of stop solution was measured into each micro-well using a single channel pipettor. The strips were then read using the micro-well reader with a 450 run and 630 run filter. The absorbance measures the amount of light that passes through the sample. The intensity of the blue color measured is inversely proportional to the quantity of aflatoxin. The method directly measures the quantity of aflatoxins present in parts per
"'
billion. The optical densities of the samples ---~ and the standard were recorded . T~~ ._0 P 1 !4.Q ,
t~~~:-:_. ~ ~\,) \ . v
·~ ~(J ''lJ -'.; ·; • ~ • -..I ,, " ,/ ,.r ..
~ ...... -' ..:-

Anjorin et a/. , 2013
method followed the procedure of J\gra Q uant total afla toxin assay of Romer Labs (Atehnkeng and Bandyopadhyay, 2010).
RESULTS
Mycoflora of sesame seed
Statistical analysis of data
The percentage incidence of fungi was found . Data collected were subjected to Analysis of Variance (ANOV A) using SPSS version 16. Separation of total aflatoxin content means was carried out using Duncan Multiple Range Test (DMRT) at 0.01 level of probability.
Tables 1, 2 and 3 show macroscopic and microscopic properties of fungi isolated in this study; locations of occurrence associated colony counts and percent incidence in samples, respectively.
Four (4) species of fungi were identified as associated with sesame seed. They were Aspergillus Jlavrrs, A. niger, A. ochraceus and Penicillium rugulosum.
Table 1: Macroscopic and Microscopic properties of identified fungi
Specie A. jlapus
A. niger
A. ochraceus
r. rttgulosum
Macroscopic Microscopic Colony was deep yellow to Conidial heads were globose to olive brown radiate. Conidiophores are
hyaline and biserate. Sclerotia was present
Colony consisted of a compact to fair ly loose white to faintly yellow basal mycelium covered by a dense layer of dark brown to black conidial heads
Conidiophores were yellow to pale brown in colour
The colonies were initially white and become blue green or gray green.
Sclerotia present, conidial heads were compnct at first, split into two or more loose to reasonably well-defined columns later.
Colony of A. ochraceus radiates have biserrate appendages when young later splitting into two or more creamy sclerotia and their conid iophores were densely packed.
Conidiophores often one-stage branched but also two or three stage branched .
Table 2: Occurrence of fungi in raw sesame seeds from five locations in Ahuja
Location Aspergillus A. niger A. ochraceus Penicillium [Iavus ntgulosum
Dobi + + + Bwari + + Gwagwalada + + + Kwali + + Aba"i + + +
+ indicates the presence of the fw1gus;- indicates the dbsence of the fungus
266
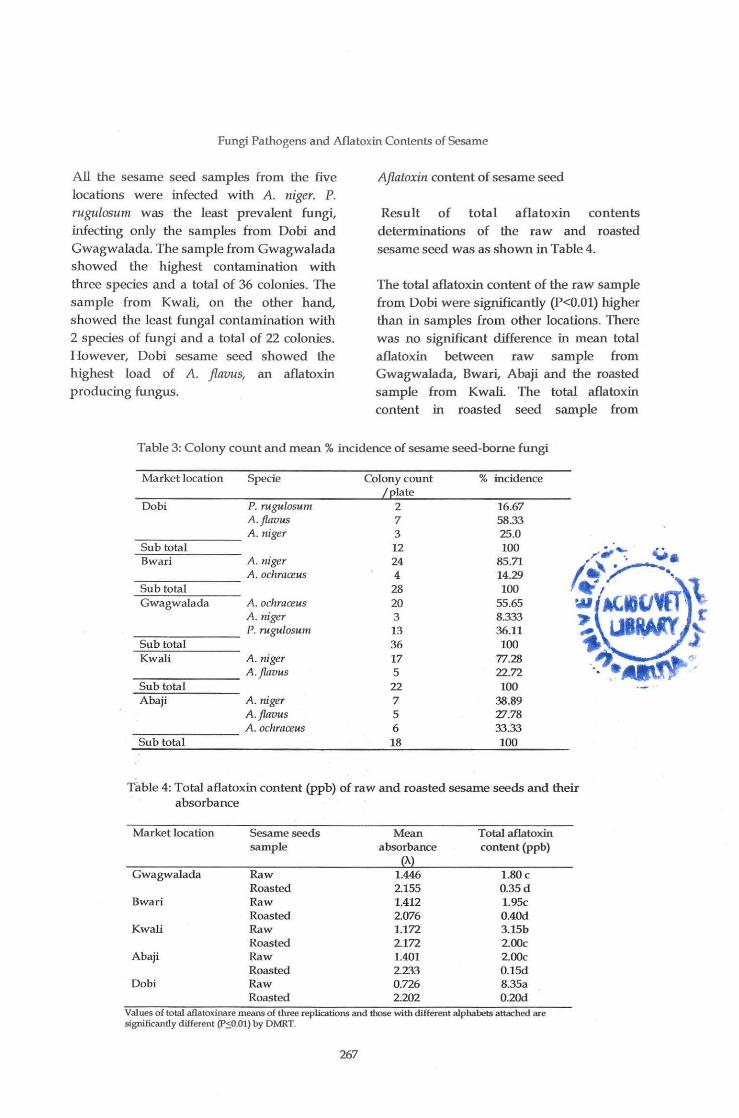
Fungi Pathogens and Aflatoxin Contents of Sesame
All the sesame seed samples from the five
locations were infected with A. niger. P. rugulosum was the least prevalent fungi,
infecting only the samples from Dobi and Gwagwalada. The sample from Gwagwalada showed the highest contamination with
three species and a total of 36 colonies. The sample from Kwali, on the other hand, showed the least fungal contamination with
2 species of fungi and a total of 22 colonies. However, Dobi sesame seed showed the highest load of A. jlavus, an aflatoxin
producing fungus.
Aflatoxin content of sesame seed
Result of total aflatoxin contents
determinations of the raw and roasted
sesame seed was as shown in Table 4.
The total aflatoxin content of the raw sample
from Dobi were significantly (P<O.Ol) higher than in samples from other locations. There
was no significant difference in m ean total
aflatoxin between raw sample from Gwagwalada, Bwari, Abaji and the roasted
sample from Kwali. The total aflatoxin content in roasted seed sample from
Table 3: Colony count and mean % incidence of sesame seed-borne fungi
Market location Specie Colony count % incidence late
Dobi P. rugulosum 2 16.67 A.flauus 7 58.33 A. niger 3 25.0
Sub total 12 100 Bwari A. niger 24 85.71
A. ochraceus 4 14.29 Sub total 28 100 Gwagwalada A. ochraceus 20 55.65
A. niger 3 8.333 P. rugulosum 13 36.11
Sub total 36 100 Kwali A. niger 17 77.28
A.jlavus 5 22.72 Sub total 22 100 Abaji A. niger 7 38.89
A.jlauus 5 Zl.78 A. ochraceus 6 33.33
Sub total 18 100
Table 4: Total aflatoxin content (ppb) of raw and roasted sesame seeds and their absorbance
Market location Sesame seeds Mean Total aflatoxin sample absorbance content (ppb)
)\
Gwagwalada Raw 1.446 1.80 c Roasted 2.155 0.35 d
Bwari Raw 1.412 1.95c Roasted 2.076 0.40d
Kwali Raw 1.172 3.15b Roasted 2.172 200c
Abaji Raw 1.401 2.00c Roasted 2.233 0.15d
Dobi Raw 0.726 8.35a Roasted 2.202 0.20<1
Values of total aflatoxinare means of three replications and those with different alphabets attached are significantly different (P_:::O.Ol) by DMRT.
267
Anjorin et at. , 2013
Gwagwalada, Bwari, Dobi and Abaji were significantly lower (P<0.01) than in samples from all other locations. From these results the roasted seed samples had lower aflatoxin than the raw samples. This was exemplified by the raw sesame sample from Dobi with a mean aflatoxin of 8.35 ppb while the roasted had a mean of 0.2 ppb.
DISCUSSION
The fungi species observed in seeds of sesame from Ahuja markets were known mycotoxigenic fungi. Results o this study are consistent with recent findings in studies on fungi infecting sesame seeds from other parts of the world. In Iran, it was reported that A. Jlavus was the dominant fungus (Basirnia and Baninhashemi, 2004; Habibi and Baninhashemi, 2008). Further, Nasira, et
al. (2004) also identified A. jlavus, A. niger . •· and Penicillium spp. in sesame seeds in
Pakistan and Gouyan et al. (2004) identified A. Jlavus, A. niger, A. ochraceus and Penicillium
spp. in. sesame seeds from Iran. Also, Nasreldeen et al. (2006) identified A. niger
and A. Jlavus in Sudan. However, in
• • addition to the fungal species identified in this study, Abdus and Ansar (1992)
identified Alternaria sesame, Fusarium
OXlJSporum, F. semitectum, F. moniliforme and Macrophormina phaseolina in Punjab, Pakistan. Javed et al. (1995) isolated Alternaria alternate,
A. tongissima, A. sesame, Botn;tis cinerea, Cercospora sesami, Cladosporium spp., Fusarium moniliforme, F. oxysporum, F. solani, Macrophomina phaseolina and Phytophthora
spp. in sesame seed sample from Faisalabad in Pakistan.
Variation in fungal load in sesame seeds may be due to the differences in climatic elements, environmental factors and sesame varieties. Also, the method of investigation may have contributed to variations. Raut (1987) and Sadashivaiah et al. (1986)
recorded higher infection counts of lvl.
phaseolina in in the blotter method as
268
compared to potato dextrose agar method in sunflower s~eds. The total aflatoxin content in the sesame seed as incubated for aflatoxin production were within the EU and US limit which is 20 ppb, WHO/FAO limit for aflatoxin (30 ~g) and the 20 ppb limit level adopted by many countries (Mbah and Akueshi, 2009). The Nigerian limit for aflatoxin is 4 ppb (Bankole et al., 2003). All the roasted seeds had lower values than the raw seeds. Also, only the raw sample from Dobi which had the highest level of Aspergillus Jlavus was above this limit.
Essono et al. (2009) used the direct Enzyme linked immunosorbent assay (ELISA) to determine aflatoxin level in Aspergillus spp. and aflatoxin levels in stored cassava chips and suggested variation in processing practices in Oyo State, Nigeria. Further, fungal pathogens of sesame seed as discovered from this research are similar to the mycoflora of other crops. Seventy-six samples of dried yam chips from markets in Ogun and Oyo states of southwestern Nigeria had Aspergillus and Penicillium as the two prevalent genera of fungi, the mean concentration of aflatoxin B1 in positive samples was 27.1 ppb. !dress et al. (2002)
isolated and identified A. Jlavus, A. ochraceus,
A. niger and Penicillium spp. from food grains in Libya. Amadi and Oso (1996) isolated A. flavus, A. niger, A. ochraceus and Penicillium
spp. from tiger nut seed in Ogun State of Nigeria.
From this study, total aflatoxin contents in the sampled sesame seeds did not exceed 20
ppb, which is the limit or acceptable maximum for aflatoxin, but contrasted with report of Mbah and Akueshi (2009) that aflatoxin B1 content of mould-infested sesame seed from Plateau State was in excess of 20 ppb. The difference in the result might be because the seeds were already mould infested.

Fungi Pathogens and Aflatoxin Contents of Sesame
A study of the occurrence of aflatoxi.ns (AF) m sesame seeds conducted in the Khorasan province of Iran between September 2009
and August 2010 concluded that low levels of AFs occured frequently in sesame from Iran (Mohammed et al., 2011). Out of 182
samples analyzed by liquid chromatography (LC), AFB1 was detected in 33 samples (18_.1% ), at a mean level of 1.62 ± 1.32 ng/ g,
' and a maximum level of 5.54 ng/ g. AFB1 levels exceeded the European Union (EU) maximum tolerated level (MTL, 2 ng/ g) in 9 samples, and the Iran MTL (5 ng/ g) in 1 sample. Regarding total aflatoxins, the mean level was 0.92 ± 1.36 ng/ g, and the maximum level was 5.54 ng/ g. No sesame sample exceeded the Iran MTL (15 ng/ g), but two samples exceeded the EU MTL (4 ng/g) for total aflatoxin.
Several studies have reported that aflatoxin B1 is produced by A. Jlamts in sesame seeds and in tahini, which is the main constituent of helva, a traditional Turkish food (Nilufer and Boyacioglu, 2002; Var et al., 2007). The seeds used in this research when purchased looked healthy and fungi-free macroscopically, but samples were naturally contaminated with mycotoxigenic fungi and potentially capable of production of aflatoxins. Formation of mycotoxin can be controlled to a certain extent by controlling the factors that affect the formation of fungi like moisture content and storage temperature. Also, Reddy et al. (2011)
reported that · mould growth can be prevented through the use of antifungal and consequently, antimycotoxin agents such as assorbic acid, _propionic acid and Nacl. Heat treatm.ents such as microwave, autoclave, sunlight and colour rays were also applicable control of mycoflora and aflatoxin production (Mushtaq and Hashmi, 1997).
Aspergillus niger was the most prevalent fungi, occurring in all the locations and followed by A. flavus present only in Dobi, Kwali and Abaji. There was significant
269
(P<O.Ol) difference in aflatotal content of sesame seeds from different localities of Abuja. Dobi had the highest total aflatoxin content of raw samples with a mean of 8.35
ppb and Gwagwalada had the least of raw sample with a mean of 1 .8 ppb. Samples from Dobi produced the highest quantity of A. Jlavus and also had the highest quantity of aflatoxin.
CONCLUSION
From this research, the possibility and benefit of pretesting of seed samples for fungi load before planting, consumption and export is evident. Proper mycotoxin and aflatoxin tests should be carried out on seeds and grains for sowing, livestock and human consumption, local markets and export. Management strategies for overcoming seed borne infections of sesame seed should be employed. Seed dressing chemicals and proper storage methods will ensure better preservation of healthy seeds. Since roasting reduces the level of aflatoxin, this is a way of detoxifying sesame seed to avoid losses and reduce toxic risk in consumption of sesame seeds.
REFERENCES
Abdus, S. S. and Ansar, M. 1992. Fungi associated with sesame seed. Pakistan Journal of Agriculture, 29(3): 319-320.
Adeoye, A. 2013 . . Sesame farmers and the Nigerian Economy. Agricultural Credit Guarantee Scheme .fund in Nigeria, Sesame farmers Instructional Materials in Teaching. Accessed from GistArea.corn on the 18/12/13.
Amadi, J. E. and Oso, B. A. 19%. Mycoflora of cowpea seeds (Viginaunguiculata L.) & their effects on seed nutrient contents and germination. Nigerian Journal of Sdence, 30: 63
-69.
Anjorin et al. , 2013
Anonymous, 2011. Sesame seed. http:/ j www.wikipedia.com/ sesameseed. Accessed on the 28th, April 2011.
Atehnkeng, J. and Bandyopadhyay, R. 2010. Sampling and Sample Preparation for MycotoxinsAnalysis International Institute of Tropical Agriculture (TIT A). www.iita.org. accessed Nov., 2011.
Bankole, S. A., Mabekoje, 0. 0. and Enikuomehin, 0. A. 2003. Mycoflora and occurrence of aflatoxin B1 in dried yam chips marketed in Nigeria. Mycopatholagia, 157: 151 -155.
Basirnia, T. and Banihashemi, Z. 2004. Study of sesame seed mycoflora with particular emphasis on Aspergillus species in Fars province. In: Proceeding of the 16th Iranian Plant Protection Congress, p. 508. Tabriz University, Tabriz Iran.
Bedigian, D. 2006 Assesment of sesame & its
wild relatives In: Neumann, K., Buller, A. and Kahlheber, S. (Ed). Africa Taxonomy &EcolOgJJ of Africa Plant, the Conservation and sustainable. Africa praehistorica cologne Heinrich. Barth. Institute, 4(6): 481-491.
Cheung, S. C., Szeto, Y. Y. and Benzie, I. F. 2007. Antioxidant protection of edible oils. Plants, Food & Human Nutrition, 62(1): 39-42.
Dawar, S. and Ghaffar, A. 1990. Location of fungi in sunflower seed. Pak. J Bot., 22(2): 119-20.
Essono, G., Ayodele, M., Akoa, A. F. J. and Olembo, S. 2009. Aflatoxin producing Aspergillus spp. and aflatoxins levels in stored cassava chips as affected by processing practices in Oyo state, Nigeria. Food Control, 20: 648-654.
Gouyan, M., Ershadi, D. and Riahi, H. 2004. An investigation on mycoflora of sesame seed in Iran. Rostaniha 2000, 1(4): 27-31.
270
Habibi, A. and Baninhashemi, Z. 2008. Vegetative compatibility groups among isolates of Aspergillusflavus from sesame seed in Iran and mycotoxin production. Phytopathologia Mediterrian, 47:28-34
Idress, H. A., Laith, K. T. A., Mufah, A. K.
and Ibrahim, D. A. B. 2002. Screening of fungi associated with commercial grain & animal feeds in Al-ba yah governorate, Libya. World Applied Science Journal, 9(7): 746-756.
Javed, M. S., Wahid, A. and Idress, M. 1995. Fungi associated with sesamum seed & their frequency. Pakistain Journal of Phytopatholog~j, 7(2): 174-176.
JECFA. 2001. Safety evaluation of certain mycotoxin in food, 51h meeting of the joint FAOJWHO expert committee on food additivies (WHO food additives series 47), Geneva international programme on chemical safety.
Joanne, M. W., Linda, M. S. and Christopher, J. W. 2008. Prescott, Harley and Kleins Microbiolog~J 7th edition. Mcgraw hill publishers, New York. 1028-1048.
Jonathan, S. G, Abdul-Lateef, M. B., Olawuyi, 0. J. and Oyelakin, A. 0. 2012. Studies on bio-deterioration, aflatoxin contamination and food values of fermented, dried and stored Ipomoea batatas chips. Nature and Science, 10(11): 123-128
Mbah, M. C. and Akueshi, C. 0. 2009. Aflatoxin in mould infested sesame seeds. African Journal of BiotechnolOgJJ, 8(3): 381-394.
Mohammed, A., Hamed, R. B. and Javed, F. 2011. A survey of aflatoxins in sesame seed from Iran. Biomedical and Life ScienceMycotoxin and Research, 10(7): 56-63.
Mushtaq, M. and Hashmi, M. H. 1997. Fungi associated with wilt disease of capsicum in Sindh, Pakistain. Pakistain Journal of Botany, 29(2): 21 7-222.
Fungi Pathogens and Aflatoxin Contents of Sesame
Nasira, A., Shahid, A. K., Mushtaq, A.,
Rehana, A. R., Ashiag, A., Shahnum, S. M.
and Saquib, M. 2004. Seedbornemycoflora of sesame seed & their effect on germination &
seedling. Pakistan Journal of Biological Science, 7(2): 243-245.
Nasreldeen, M. A. H. 2006. Survey of seedborne fungi of sesame (SesamunindicumL) seed in Sudan. International Journal of Educational Administration, 2(2): 123-130.
Nilufer, D. D. and Boyacioglu, J. H. 2002.
Comparative study of three different methods for the determination of aflatoxins in tahini. Journal of Agricultural Food Chemistn;, 50: 3375-3379.
Nwosu, C. 2011. Guide to trading & export of sesame seed in Nigeria. http:// www .nigerianmarket.org/ files/sesame-sub sector-overview. Accessed on the 23rd August, 2011.
Peter, D. 2011. Nigeria earns $612 million from sale of sesame seed. http:// www.dailytrust/ allafrica.com.com/ sesame news.Accessed on the 12th August, 2011.
Raut, J. G. 1987. Detection of Macrophomiaphaseolina in sumflower seeds. Seed Research, 15:102-103
Reddy, S. V., Kiram, M. D., Uma, R. M., Thirumala- Devi, K. and Reddy, D. V. R. 2001. Aflatoxins Bl in different grades of chillies (Capsicum comum. 1.) in India as determined by indirect competitive-ELISA. Food Additives and Contaminants, 18: 553-558.
271
Reddy, B. N., Ravindra, K. N., Raghu, R., Baharah, S. and Narsimha, R. B. 2011.
Potential of aflatoxin Bl production by Aspergillusflavus strains on commercially important food grains. International Journal of Food Science & Technologt;, 46: 161-163.
Reddy, E. C. S., Sudhakar, C. and Reddy, E. N. P. 2011. Aflatoxin contamination in groundnut induced by Aspergillusflavus fungi: a critical review. International Journal of Applied Biologt; & Phamwceutical Technologt;, 2 (2): 180-192.
Robert, A. S., Ellen, S. H. and Canira, A. N. 1984. Production of food-borne fungi . Institute of the Royal Netheirlands of Arts & Science Printing Press. p. 24-47.
Sadashivaiah, A. S., Ranganathaiah, K. G.
and Nanja, G. D. 1986. Seed health testing Helianthus anuus with special reference to Macrophomina phaseolina. Indian Phytopathologt;, 39: 445-447
Var, I., Kabak, B. and Gok, F. 2007. Survey of aflatoxin B1 in helva, a traditional Turkish food, by TLC. Food Control, 18:59-62.

~ .. ocO
( (.
~I ~· J.l\ .. , • ~
~r .. ~lf. l ' ..
~ __, .. ~ .
, -r. ~ •"
Journal of Applied Agricultural Research 2013, 5(2): 273-281 ISSN 2006-750X ©Agricultural Research Council of Nigeria, 2013
RESPONSE OF VEGETABLE COWPEA (VIGNA UNGUICULATA (L.) WALP) TO PLANTING DENSITY
IN A HUMID ZONE OF SOUTHEASTERN NIGERIA
Muoneke, C. 0.1, *Ndukwe, 0. 0.2, Akpan, A. U.l and P. I. Okochal 1Department of Agronomy, Michael Okp,ara University of Agriculture,
Umudike, Abia State, Nigeria 2Department of Crop Science and Horticulture,
Nnamdi Azikiwe University, Awka, Anambra State, Nigeria *[email protected]
ABSTRACT
Two vegetable cowpea varieties (IT8ID-1228-12 and IT8ID-1228-14) were evaluated for two cropping seasons (2006 and 2007) to determine a more suitable planting density w ith respect to their growth and yield for sustainable food production in areas where they are cultivated. Four planting densities - 50,000, 66,600, 100,000 and 200,000 plants per hectare were evaluated. These were la id out as a 2 x 4 factorial in randomized complete block design (RCBD) and replicated three times. The two varieties only differed significantly (P<0.05) for leaf area index (LAI) and number of seed s per pod, respectively, in 2006 and 2007. Higher LAI (1.87) and number of seeds per pod (9) were significantly produced by IT8ID-1228-12 and IT8ID-1228-14, respectively. Leaf area index significantly (P-<0.05) increased with increase in p lanting densities, especially in 2007 where the progressive increase was recorded a t 4, 8, 10 and 12 weeks after planting (W AP). The highest number of fresh pods and heaviest fresh pods per plant were attributed to 66,600 plants/ha in both cropping seasons. Fresh pod and seed yields per hectare increased with increase in plant d ensity, the highest (8.20 t/ha and 962.2 kg/ha for fresh pod and seed yield in 2006) being with 200,000 plants/ha. However, highest number of seeds ("'10) and heaviest seeds ("'10 g) per pod in both years were associated with 50,000 plants/ha. In view of the major utilization of the pod and seed of vegetable cowpea in its fresh s tate, 66,600 plants/ ha density of the vegetable cowpea varieties was recommended for higher fresh pod and seed production.
Keywords: vegetable cowpea, variety, plant density, growth, yield.
INTRODUCTION
In the developing countries, the major protein sources in the diets are vegetable legumes, especially for the poor. Most leguminous vegetables are rich in phosphorus, calcium, iron and a number of essential vitamins (ICRISAT, 1991). Both vegetable and grain type of cowpea (Vigna
unguiculata (L.) Walp) provide inexpensive source of protein for the urban and rural poor (Alghali, 1991). The young leaves and immature pods are eaten as vegetables (Dugje et al., 2009). It is a good source of
273
dietary protein for human consumption and for animal feed in the tropics, especially in Africa, Brazil and India. In addition to being high in protein, drought tolerant and high in adaptability; cowpea provides fuel, fodder, improves soil fer tility as well as controls soil erosion for resource poor farmers (Okaka et al., 2002). Over 65% of the cowpea is produced in Africa; Nigeria and Niger producing 50% of the world supply (Henshaw, 2008). In West Africa, it is only in the eastern Nigeria that the fresh pods of this vegetable cowpea are popularly used as vegetable. In this region of Nigeria, the fresh
Muoneke eta/., 2013
pods are mostly used to prepare delicacies with yam, cocoyam and african salad (' tapioca'), fresh corn and umipe plantain. It is also cooked with other grain legumes such as pigeon pea (Cajanus cajan (L.) Millisp) and other vegetables. However, research information on vegetable cowpea is very scanty.
Vegetable cowpea belongs to the group of "neglected legumes" (An o an d Ubochi, 2008). There is dearth of agronomic information on vegetable cowpea (Udealor, 2002; Ano, 2006) because research activity on cowpea in Nigeria is on the grain cowpea. Current p roduction of vegetable cowpea in Nigeria is at subsistence level irrespective of the nutritive value as well as benefit in improving soil fertility. It is mostly landraces that are utilized in the production regions of Nigeria.
Proper planting density and arrangemen ts are essential in optimizing plant growth, development and yield per unit land area (Tayo, 1982).· It is important to plant at spacing or density per unit area, w hich will give the maximum economic yields. The optimum density partly depends on the soil and climate, but will also be influenced by other factors, particularly the variety. For example, the optimum plant density for Mucuna varies with the growth and the time of maturity of the variety (Chikoye and Ekeleme, 1999). Similarly, Ndiaga (2000) concluded that cowpea cultivars with different plant morphology would require different optimum densities to express their full seed yield potential.
Recently, International Institute of Tropical Agriculture (liT A) developed and released improved varieties of vegetable cowpea. It is very pertinent to determine the appropriate plant population of some of these improved varieties . This formed the basis of the present research work.
274
MATERIAlS AND MEfHODS
Experimental site
The experiment was conducted at the eas tern research farm of the Michael Okpara University of Agriculture, Umudike, located at latitude 05° 29'N and longitude 07° 33'E with 122 m altitude. The soil of Umudike is characterized by an ultisol derived from coastal sediments and it is within the forest agro-ecological zone of Nigeria with average rainfall of 2200 mm per annum. Soil samples of the site obtained from 0-20 em depth were collected from ten (10) different points, bulked into composite samples and analysed for physical and chemical characteristics before the application of the treatmen ts. The result of the physicochemical properties as well as the meteorological data during the s tudy is shown in Tables 1 and 2, respectively.
Treatments and experimental design
Two vegetable cowpea varieties with contrasting growth habits were obtained from International Institute of Trop ical Agriculture (liT A), Ibadan, Nigeria. These were IT8ID-1228-12 (semi-erect vine and white coloured seeds) and ITSID-1228-14 (erect vine and white coloured seeds). Each of the two varieties was subjected to four different plant spacing; 50 em x 40 em, 50 em x 30 em, 50 em x 20 em and 50 em x 10 em. These respectively gave the following planting densities; 50,000, 66,666, 100,000 and 200,000 plants/ ha. The experiment was laid out as a 2 x 4 factorial in randomized complete block design (RCBD) with three replications.
Cultural practices
The site was cleared of the existing vegetation, ploughed and harrowed. Planting was done in mid-July on flat during 2006 and 2007 cropping seasons. The plot
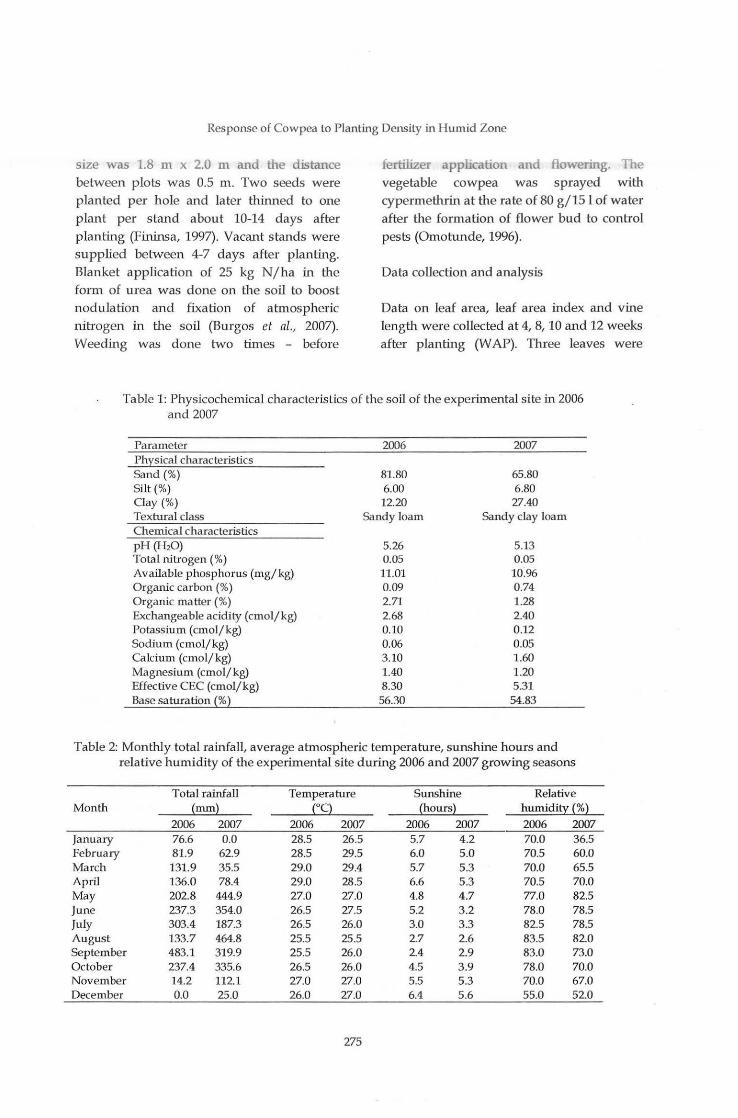
Response of Cowpea to Planting Density in Humid Zone
size was 1.8 m x 2.0 m and the distance
between plots was 0.5 m. Two seeds were planted per hole and later thinned to one
plant per s tand about 10-14 days after planting (Fininsa, 1997). Vacant s tands were
supplied between 4-7 days after planting. Blanket application of 25 kg N/ha in the form of urea was done on the soil to boost
nodulation and fixation of atmospheric
nitrogen in the soil (Burgos et al., 2007). Weeding was done two times - before
fertilizer apphcation and flowermg. The
vegetable cowpea was sprayed with cypermethrin at the rate of 80 g/151 of water after the formation of flower bud to control
pests (Omotunde, 1996).
Data collection and analysis
Data on leaf area, leaf area index and vine
length were collected at 4, 8, 10 and 12 weeks after planting (W AP). Three leaves were
Table 1: Physicochemical characteristics of the soil of the experimental site in 2006 and 2007
Parameter 2006 2007 Physical characteristics Sand(%) 81.80 65.80 Silt(%) 6.00 6.80 Clay (%) 12.20 27.40 Textural class Sandy loam Sandy clay loam Chemical characteristics pH (H20) 5.26 5.13 Total nitrogen(%) 0.05 0.05 Available phosphorus (mg/kg) 11.01 10.96 Organic carbon(%) 0.09 0.74 Organic matter(%) 2.71 1.28 Exchangeable acidity (cmol/kg) 2.68 2.40 Potassium (cmol/kg) 0.10 0.12 Sodium (cmol/kg) 0.06 0.05 Calcium (cmol/ kg) 3.10 1.60 Magnesium (cmol/kg) 1.40 1.20 Effective CEC (cmoljkg) 8.30 5.31 Base saturation(%) 56.30 54.83
Table 2: Monthly total rainfall, average atmospheric temperature, sunshine hours and relative humidity of the experimental site during 2006 and 2007 growing seasons
Total rainfall Temperatme Sunshine Relative Month (mm) cq (hours) humidi~ {%)
2006 2007 2006 2007 2006 2007 2006 2007 January 76.6 0.0 28.5 26.5 5.7 4.2 70.0 36.5 February 81.9 62.9 28.5 29.5 6.0 5.0 70.5 60.0 March 131.9 35.5 29.0 29.4 5.7 5.3 70.0 65.5 April 136.0 78.4 29.0 28.5 6.6 5.3 70.5 70.0 May 202.8 444.9 27.0 27.0 4.8 4.7 77.0 82.5 June 237.3 354.0 26.5 27.5 5.2 3.2 78.0 78.5 July 303.4 187.3 26.5 26.0 3.0 3.3 82.5 78.5 August 133.7 464.8 25.5 25.5 2.7 2.6 83.5 820 September 483.1 319.9 25.5 26.0 2.4 2.9 83.0 73.0 October 237.4 335.6 26.5 26.0 4.5 3.9 78.0 70.0 November 14.2 112.1 27.0 27.0 5.5 5.3 70.0 67.0 December 0.0 25.0 26.0 27.0 6.4 5.6 55.0 52.0
275
Muoneke et al., 2013
sampled per plant at the upper, middle and base portions and leaf area determined by multiplying the length and width of the sampled leaves with the total number of leaves and a constant of 2.325 (Osei-Yeboah et al., 1983). The data on leaf area, leaf area index and vine length were taken from three plants randomly selected from three inner rows of each plot (Njoku and Muoneke, 2008). The leaf area index was obtained by dividing the leaf area of each plant by the ground cover. Fresh pods were picked every 4 to 6 days depending on the frequency of podding. The number of fresh pods per plant was determined by counting the total number of fresh pods from the three sampled plants in the inner rows per plot (Olasantan an~ Aina, 1987). The fresh pod weight per p lant was determined by weighing the fresh pods harvested from three sampled cowpea plants p er plot. However, number of seeds per pod was obtained from counting the seeds from ten dried pods (from the pool of the harvested fresh pods) after threshing. Hundred (100)seed weight was determined by weighing 100 dried seeds per plot The fresh pod and grain yield per hectare were obtained by multiplying fresh pod and seed yields per plant by the plant population, respectively.
All the vegetative and yield data were subjected to analysis of varian ce (ANOV A) according to Obi (1986) for split plot in a randomized complete block design. Mean separation was done using Fisher's least significant difference (F-LSD) at 5% probability level (Gomez and Gomez, 1984).
RESULTS AND DISCUSSION
Leaf area index and vine length
The cowpea varieties significantly differed only for leaf area index (LAI) in 2007 at 10 WAP. The variety, IT8ID-1228-12 produced higher leaf area index {1.867) than IT8ID-1228-14 which had leaf area index of 1.512
276
(fable 3). Thereafter, the LAI of IT81D-1228-14 was higher at 12 W AP but did not differ significantly from the LAI of IT8ID-1228-12. Also, in 2006 from 8 to12 WAP, IT8ID-1228-14 had higher values for LAI but showed no significant difference with the LAI valu es IT8ID-1228-12. Likewise, there was n o statistical difference between the vine lengths of the two varieties a t all stages of data collection in 2006 and 2007. One expected the leaf area and vine length to differ between the two varieties on account of their different vine morphology and growth, but this result did not conform to the expectation.
Both the leaf area index and vine length of the vegetable cowpea were significantly (P<0.05) influenced by planting density in both cropping seasons (fable 3). While the leaf area index increased with increase in plant density, the vine length decreased with increase in plant density. The highest leaf area index was observed with the highest plant density per hectare (200,000 plantsj ha) in both cropping seasons, especially at 4, 8 and 10 WAP. Our result agreed with the general crop trends that increasing plant density increases leaf area index on account of more area occupied by green canopy of plants per unit area (Abuzar et al., 2011). Higher l~af area index was also reported with higher plant density in the work of Njoku and Muoneke (2008).
The longest vines for both varieties were obtained with 50,000 plants/ha while the shortest vines were attributed with 200,000 plantsjha in 2006 and 2007. This could be attributed to the crowding effect with higher plant population, which is capable of limiting the growth of the vines as a result of intra-specific com petition for growth resources. Similar results were obtained with vine length of grain cowpea (Nairn and Jabereldar, 2010; Ndor et al., 2012).
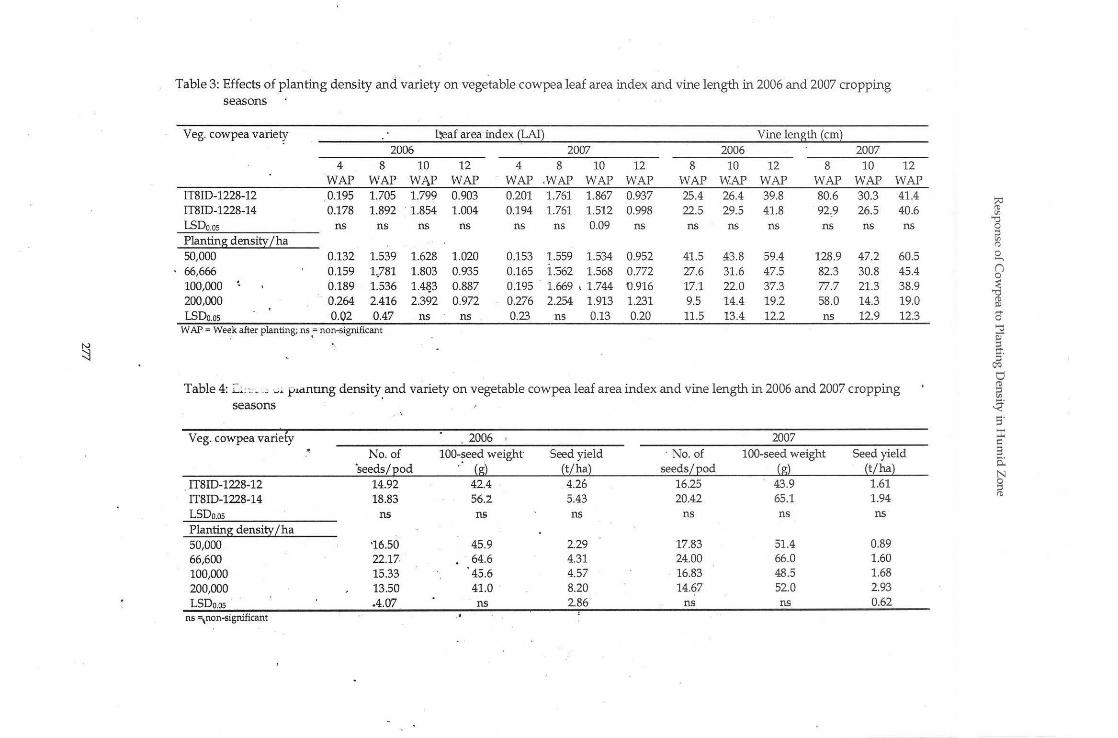
N
~
Table 3: Effects of planting density and variety on vegetable cowpea leaf area index and vine length in 2006 and 2007 cropping seasons
Veg. cowpea variety L-eaf area index {LAI}
IT8ID-1228-12 IT8ID-1228-14 LSDo.os Planting density /ha 50,000 66,666 100,000 200,000 LSDo.os
4 WAP 0.195 0.178
ns
0.132 0.159 0.189 0.264 0.02
2006 8 10
WAP WAP 1.705 1.799 1.892 . 1.854
ns ns
1.539 1.628 1 . .781 1.803 1.536 1.4~3
2.416 2.392 0.47 ns
W AP = Week after planting; ns ,=non-significant
2007 12 4 8 10
WAP WAP .WAP WAP 0.903 0.201 1.761 1.867 1.004 0.194 1.761 1.512
ns ns ns 0.09
1.020 0.153 1.559 1.534 0.935 0.165 1."562 1.568 0.887 0.195 1.669 I 1.744 0.972 0.276 2.254 1.913
ns . 0.23 ns 0.13
Vine length {em} 2006 2007
12 8 10 12 8 10 WAP WAP WAP WAP WAP WAP 0.937 25.4 26.4 39.8 80.6 30.3 0.998 22.5 29.5 41.8 92.9 26.5
ns ns ns ns ns ns
0.952 41.5 43.8 59.4 128.9 47.2 0.772 27.6 31.6 47.5 82.3 30.8 U.916 17.1 22.0 37.3 77.7 21.3 1.231 9.5 14.4 19.2 58.0 14.3 0.20 11.5 13.4 12.2 ns 12.9
12 WAP 41.4 40.6 ns
60.5 45.4 38.9 19.0 12.3
Table 4: L.~-'- _ ·" ,_,;. l-'!c:tnnng density_ and variety on vegetable cowp~a leaf area index and vine length in 2006 and 2007 cropping seasons
Veg. cowpea variety
. IT8ID-1228-12 IT8ID-1228-14 LSDo.os Planting density I ha 50,000 66,600 100,000 200,000 LSDo.os
ns ~non-significant
2006 • 2007 No. of 100-seed weight Seed yield · No. of 100-seed weight Seed yield
"seeds/pod · (g) (t/ha) seeds/pod (g) (t/ha) 14.92 42.4 4.26 16.25 43.9 1.61 18.83 56.2 5.43 20.42 65.1 1.94
ns ns ns ns ns ns
'16.50 45.9 2.29 17.83 51.4 0.89 22.17 64.6 4.31 24.00 66.0 1.60 15.33 45.6 4.57 . 16.83 48.5 1.68 13.50 41.0 . 8.20 14.67 52.0 2.93 .4.07 ns 2.86 ns ns 0.62 .
A! ~
'"0 0
a (1)
~ () 0 ~
'"0 Bl 0
"' §" s·
OQ
0
~ ~-
s· ::r: §. 0.. N
~
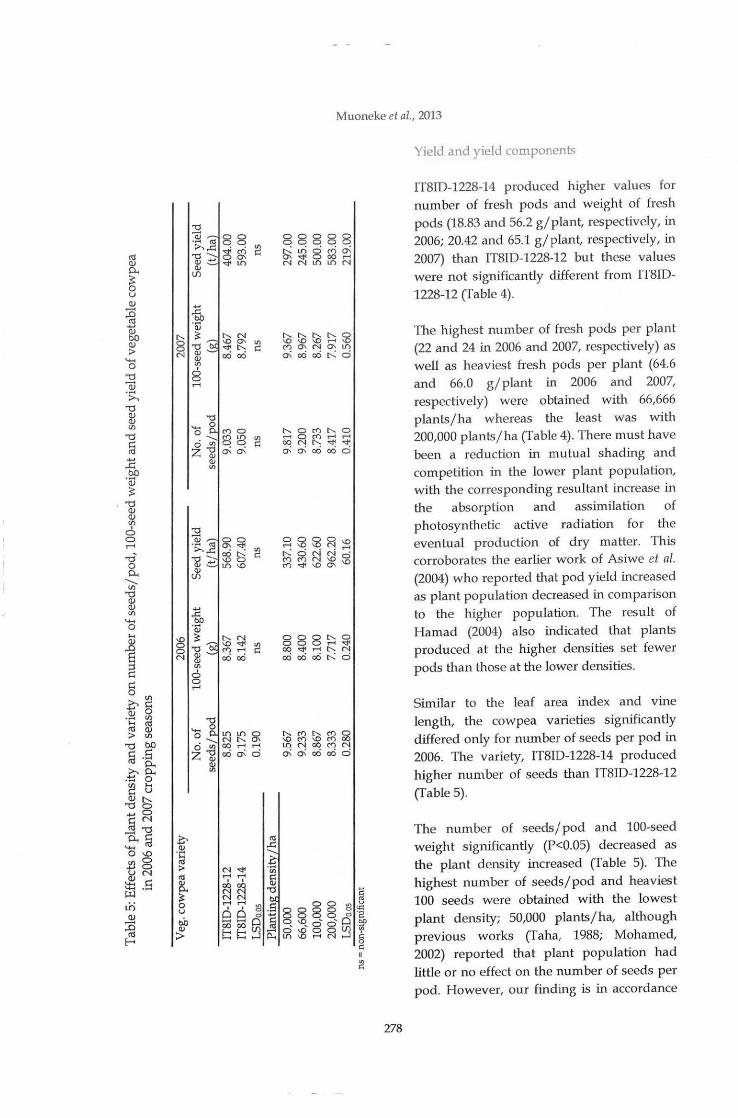
::9 .~ t'tS >....c:: ] .....
Q.J tfl
..... ]o Q.J
1:'-. ~ 8 "d N Q.J
Q.J
"' 8 .......
"d ...... 0 0 . -...... 0 "' Z]
Q.J
"'
88 ~~ "<t' LO
1:'-.N \0 a-"<t'l:'-. cOcO
<') 0
8~ a\ a\
~
"' I:
"' I:
«S ...c::
Muoneke el al., 2013
88888 ~~g~~ NNLOLON
~~~\::<~ <')0'N0'LO o\cc)cc)r:-;c)
1:'-.0<')1:'-.0 ....... 0 <') ............. OONI:'-.-.t'"<t' o\o\cc)cc)c)
888\::<~ 00-.t'rli:'-.N cc)cc)cc)r:-;c)
~~~~~ LONOOC')N o\o\cc)cc)o
278
Yield and yield components
IT8ID-1228-14 produced higher values for number of fresh pods and weight of fresh pods (18.83 and 56.2 g/plant, respectively, in 2006; 20.42 and 65.1 g/ plant, respectively, in 2007) than IT8ID-1228-12 but these values were not significantly different from IT8ID-1228-12 (Table 4) .
The highest number of fresh pods per plant (22 and 24 in 2006 and 2007, respectively) as well as heavies t fresh pods per plant (64.6 and 66.0 g/ plant in 2006 and 2007, respectively) were obtained with 66,666 plantsj ha whereas the least was with 200,000 plantsjha (Table 4). There must have been a reduction in mu tual shading and competition in the lower plant population, with the corresponding resultant increase in the absorption and assimilation of photosynthetic active radiation for the eventual production of dry matter. This corroborates the earlier work of Asiwe et al. (2004) who reported that pod yield increased as plant population decreased in comparison to the higher population. The result of Hamad (2004) also indicated that plants produced at the higher densities set fewer pods than those at the lower densities.
Similar to the leaf area index and vine length, the cowpea varieties significantly differed only for number of seeds per pod in 2006. The variety, IT8ID-1228-14 produced higher number of seeds than IT8ID-1228-12 (Table 5).
The number of seeds/ pod and 100-seed weight significantly (P<0.05) decreased as the plant density increased (Table 5). The highest number of seeds/pod and heaviest 100 seeds were obtained with the lowest plant density; 50,000 plantsj ha, although previous works (Taha, 1988; Mohamed, 2002) reported that plant population had little or no effect on the number of seeds p er pod. However, our finding is in accordance
Response of Cowpea to Plan ting Density in Humid Zone
with the work of Nairn and Jabereldar (2010) who reported that higher number of seeds/ pod and heavier seeds with lower plant density might be as a result of better availability of nutrients and better translocation of photosynthates from source to sink which might be as a result of less inter-specific competition. Low seed weight in high plant population density was probably due to availability of less photosynthates for seed development and filling as a result of low rate of photosynthesis due to enhanced mutual shading (Zamir et nl., 2011) on account of high inter-specific competition.
However, both the fresh pod and seed yield per hectare in both cropping seasons increased with increase in plant density (Tables 4 and 5). For example, fresh pod yield in 2006 significantly increased by 258, 90 and 79% with 200,000 plants/ha when compared with 50,000, 66,666 and 100,000 plants/ha, respectively. This was because the fresh pod yield was obtained by multip lying total fresh pod yield per plant by the plant population. The seed yield per hectare was also calculated as that of fresh pod yield per hectare. Therefore, there is the possibility of obtaining higher to tal fresh pod yield with higher plant density. This implies that higher plant density up to 200,000 plants/ha of vegetable cowpea w ill enhance more yields of fresh pod.
CONCLUSION
Our result showed tl1at 66,666 plants/ ha of vegetable cowpea enhanced the production of highest and heaviest fresh pods/plant; whereas, 50,000 plants/ ha gave highest and heaviest seeds/plant. But at fresh pod and seed yield/ha bases, p lanting at density of 200,000 plants/ h a is best and was recommended in the study area since more fresh pod and seed yields/ ha were enhanced by this plant density.
279
REFERENCES
Abuzar, M. R., Sadozai, G. U., Baloch, M. S., Baloch, A. A, Shah, I. H., Javaid, T. and Hussain, N. 2011. Effect of plant population densities on yield of maize, The Journal of Animal and Plant Sciences, 21(4): 692-695.
Alghali, A. M. 1991. Studies on cowpea farming practices in Nigeria with emphasis on insect pest control. Tropical Pest Management, 37: 71.
Ano, A. 0. 2006. Effect of vegetable cowpea population on component crop yields and productivity of yam, minisett based system. Nigerian Journal of Agriculture, 37: 81-84.
Ano, A. 0. and Ubochi, C. I. 2008. Nutrient composition of climbing and prostrate vegetable cowpea accessions. African Journal of Biotechnology, 7 (20): 3795-3798.
Asiwe, J. A. N., Nokoe, S., Jackai, L. E. N. and Ewete, F. K. 2004. Does varying cowpea spacing provide better protection against cowpea pests? Crop Protection, 24: 465-470.
Burgos, N. R., Brandenberger, L. P., Stiers, E. N., Shivrain, V. K., Motes, D. R. , Wells, L., Eaton, S., Martin, L. W. and Morelock, T. E. 2007. Tolerance of selected advanced cowpea (Vigna unguiculata) breeding lines to fomesafen. Weed TechnolOgJJ, 21(4):863-868.
Chikoye, 0. and Ekeleme, F. 1999. Response of Imperata cylindn·ca to smothering by different Mucuna accessions . Proceedings of workshop organised by llTA and CIEPCA, 26-29 October, 1999, Cotonou, Benin.
Dugje, I. Y., Omoigui, L. 0 , Ekeleme, F., Kamara, A. Y. and Ajeigbe, H. 2009. Farmers' guide to cowpea production in West Africa. International Institute of Tropical Agriculture, Ibadan, Nigeria. 24 pp.
Muoneke et al., 2013
Fininsa, C. 1997. Effects of planting pattern relative planting date and intra-row spacing on a haricot bean/ maize intercrop. African
Crop Science Journal, 5(1): 15-22.
Gomez, K. A. and Gomez, A. A. 1984. Randomized complete block design analysis. In: Statistical procedures for agricultural
research. John Willey and Sons, New York.
Hamad, M. S., 2004. Effect of planting densitt;
on the performance of three cultivars of cawpea,
M.Sc thesis, University of Khartoum, Sudan.
Henshaw, F. 0. 2008. Varietal differences in physical characteristics and proximate composition of cowpea (Vigna unguiculata).
World Journal of Agricultural Sciences, 4: 302-306.
ICRISAT (International Crops Research for the Semi-Arid Tropics) 1991. ICRISA T West
African programs annual report, 1990. ICRISA T Sahelian Centre, Niamey, Niger. 132 pp.
Mohamed, L. z. 2002. The effect of intra-raw
spacing and starter nitrogen fertilizer on grawth and yield of cawpea (Vigna unguiculata L.Walp). M.Sc thesis, University of Khartoum, Sudan.
Nairn, A. M. E and Jabereldar, A. A. 2010. Effect of Plant density and Cultivar on Growth and Yield of Cowpea (Vigna
unguiculata L.Walp). Australian Journal of
Basic and.Applied Sciences, 4(8): 3148-3153.
Ndiaga, C., 2000. Genotype x row spacing and environment interaction of cowpea in semi-arid zones. African Crop Science Journal,
9(2): 359-367.
Ndor, E., Dauda, N. S., Abimuku, E. 0., Azagaku, D. E. and Anzaku, H. 2012. Effect of phosphorus fertilizer and spacing on growth, · nodulation count and yield of cowpea (Vigna unguiculata (L) Walp) in southern guinea savanna agroecological zone, Nigeria. Asian Journal 'of Agricultural
Sciences, 4(4): 254-257.
280
Njoku, D. N. and Muoneke, C. 0. 2008. Effect of cowpea planting density on growth, yield and productivity of component crops in cowpea/ cassava intercropping system. Agro -Science Journal of Tropical Agriculture, Food, Environment and Extension, 7(2): 106-113.
Obi, I. U. 1986. Statistical methods of detecting
difference between treatrnent means. Swap Press, Enugu, Nigeria. 45 pp.
Okaka, J. C., Akobundu, E. N. T. and Okaka, A. N. 2002. Human Nutrition: An Integrated
Approach, 2nd edition, OCJANCO Academic Publishers, Enugu, Nigeria. p. 312-320.
Olasantan, F. 0. and Aina, A. B. J. 1987. Effects of intercropping and population density on the growth and yield of okra (Abelrnoschus esculentus L. Moench). Beit. Z ur.
Trap. Land. Und Vet. Med., 25: 289-299.
Omotunde, C. T. 1996. Growth and yield of okra and cowpea intercropped at different planting patterns. Journal of Agricultural Technolog~;, 4(2): 10-16.
Osei-Yeboah, S. J., Lindsay, J. S. and Gumba, F. H. 1983. Estimating leaf area of cowpea (Vigna unguiculata (L.) Walp) from linear measurement of terminal leaflets. Tropical Agriculture, 60: 149-150.
Taha, M. B. 1988. Effect of population density on the yield of dry beans. Annual
Report, 1988/89. Hudeiba Research Station El Damer, Sudan. p. 47-50.
Tayo, T. 0. 1982. Growth, develop~ent and yield of pigeon pea (Cajanus cajan (L.) Millsp) in the lowland tropic. Journal of Agricultural
Science Cambridge, 98: 71-78.
Udealor, A. 2002. Studies on grawth, yield,
organic matter turnover and soil nutrient changes in cassava (Manihot esculenta Crantz) vegetable cawpea mixtures. PhD 'Thesis, University of Nigeria, Nsukka, Nigeria.

Response of Cowpea to Planting Density in I Iumid Zone
Zarnir, M. S. I., Ahmad, A H., Javeed, H. M. R. and Latif, T. 2011. Growth and yield behaviour of two maize hybrids (Zea mays L.) towards different plant spacing. Cercetiiri Agronomice fn Moldova. 14 (2): 33-40.
281


Journal of Applied Agricultural Resean:h 2Dl3, 5(2): ~288 ISSN 2006-750X © Agricultural Research Council of Nigeria, 2D13
PRODUCTIVI1Y OF CUCUMBER IN A SEMI-ARID SAVANNA OF NIGERIA AS AFFECfED BY ORGANIC FERTILIZER
*Dantata, I. J.1 and F. E. Babatunde2 1Department of Agricultural Education, Undergraduate Studies Programme,
College of Education, P.M. B. 044, Azare, Bauchi, Nigeria. 2Department of Agronomy, College of Agriculture,
University of Osun, P.M.B. 4014, Ejigbo Campus, Nigeria. *[email protected], +2347035897535
ABSfRACf
Field experiments were conducted in Azare, Katagum Local Government Area (KLGA) of Bauchi State, Nigeria, during the 2006 and 2JX17 dry seasons to study the effect of organic fertilizer on some growth and yield attributes of cucumber (Cucumis satiuus) using poultry manure and cow dung manure as sources. The treatments consisted of three levels of poultry manure (0, 60 and 120 kg ha-t) and three levels of cow dung manure (0, 40 and 80 kg ha·t) laid out in a randomized complete block design (RCBD) and replicated four times. The results of the experiments showed that cucumber vine length, number of leaves and fruit yield responded significantly to the application of poultry and cow dung manure up to 60 kg ha-t and 40 kg ha-t, respectively. Beyond this, vine length was similar in 2006 and 'lJ.XJl, and cucumber leaf number in 2006. The leaf number in 2007 as well as fruit yield in both years increased with the application of 120 kg ha-t of poultry and 80 kg ha-t of cow dung manure. Interaction between poultry and cow dung manure on vine length was not significant in all years, but the same mode of interaction on leaf number and fruit yield was significant in the 2-year study. Therefore, it was recommended that application of 120 kg ha·t of poultry manure and 80 kg ha-t of cow dung manure is needed for production of higher yield of cucumber, especially in the semi-arid savanna.
Keywords: productivity, cucumber, savanna, organic nutrition
INTRODUCTION
Cucumber (Cucumis sativus) belongs to the family Cucurbitaceae. It is a warm season vegetable crop and, therefore, prefers relatively high temperatures. Extremely high temperatures (34oC and above) may cause bitterness of the fruit. They grow best during the dry season because the high atmospheric humidity during the wet season promotes leaf diseases. The crop is very susceptible to serious losses from such pests as the silver leaf (or sweet potato) whitefly, the melon fly, leaf miners, mosaic viruses, and to soil-borne and foliar diseases (Bernhard et al., 1988). Cucumbers are
283
consumed sliced and raw preferably as salad or pickles. The fruits can be eaten as a cooked vegetable. Cucumbers are I8Sed' as appetizers or mixed with other veptables because of their distinctive textDR and flavour (Norman, 1992).
The use of animal manure in ..,...hie production has long been reali..a ht recorded information on crop IE:¥JAk$ have been scanty Oa 'a far, 1997). V1llllally any organic material can be a.- • a fertilizer; however, material& vary considerably in the concentration of plant nutrients they contain and the rate at which these nutrients are released for phmt use.
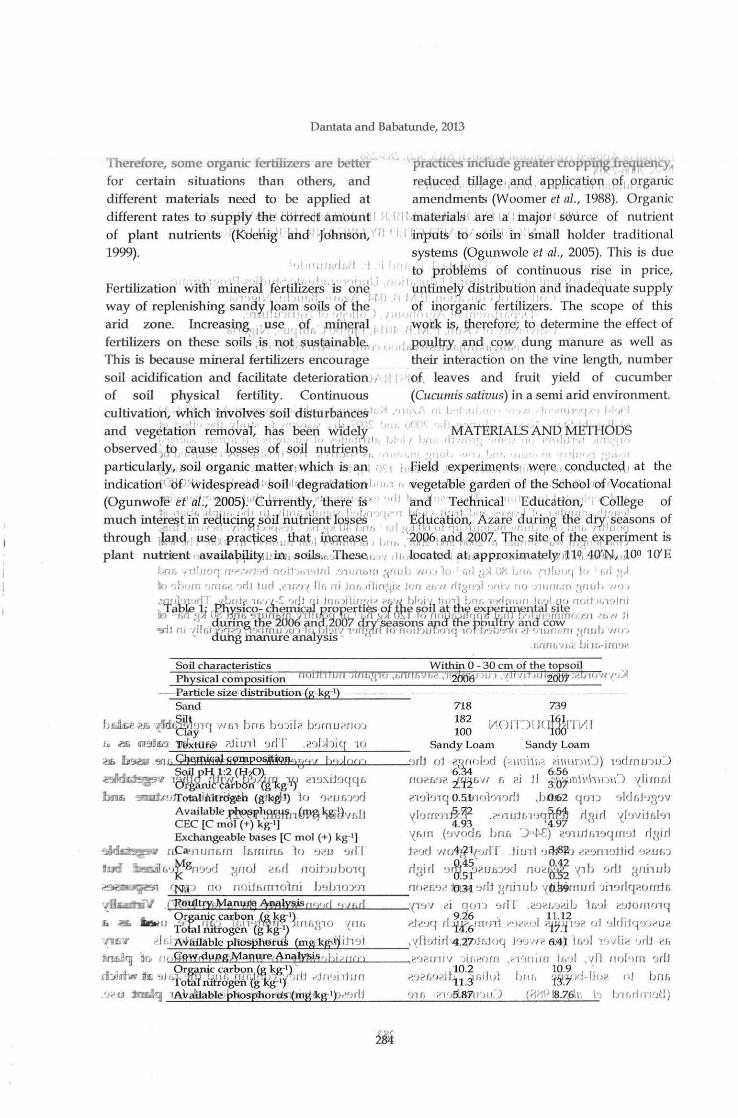
Dantata and Baba tunde, 2013
Therefore, some organic fertilizers are better practices include greater cropp~~ire'iluency, for certain situations than others, and r~'t\\l;ce~ t:iJ!ag!i! ~.aMd, aHpJ!cat;i?ll pf1 organic different materials need to be applied at amendments (Woomer et al., 1988). Organic different rates to supply' .the (:()tiedti ·amoflnt r " · I LmateJiaiS r lltel la' 1 inajon r s'dli.lrce of nutrient of plant nutrients '(kde'rlig1 !ilid' •Johrisorl,VII ! I I mp'Jti ' to ' s6ilsi in . small holder traditional 1999). systems (Ogunwole eta/., 2005). This is due
• 1'l'•' 11·cJ·,II 1 1 ' to prdbie'rns of continuous rise in price,
Fertilization wi'th1 · ~erlli.. ·tf~;tiilie;s is 'O'nJ '' >~' 1 'untim~ly 'distributi~n dnd inadeqhate supply '·~·)l1j, J ~J,J ''·' ,· r.J I I r. I I J. ~ ~ ( I I
way of replenishing san,~z)~arp_,~o¥s ?f ~e l 1
?~ inor&anic {ert~.ers. The scope of this arid zone. Increa~i,q~
1 !,use ., qfr pin~f'l1 1 , 1 •t'Y?I(~ i,s, tj:le.refqr,e; to de~ermine the effect of
fertilizers on these soils ,is tztot $US,tainable. , , 1 ,,,BQ~I:f:y, ,<mF!: ,,c,qw,. dung manure as well as This is because mineral fertilizers encourage their interaction on the vine length, number soil acidification and facilitate deterioration>, 1: ,of. leaves and fruit yield of cucumber of soil physical fertility. Continuous (Cucumis sativus) in a semi arid environment. cultivatiori, which involv'es 'soil diSturbances ' 1 1
• '· I· t '''1' 1 ! ,,
and vege'tatio~ rebo~ai; hks ' be'erl Widely .,r~ I ' MATERIALS ANDMETHdos \ ' •,• . ... • ' ,•' ~ l t. ) . I 1 ' ' It L I ·! . f l 'jl I . 'fl • I ' '-.!id I Jl •I '
observed )Jq H~u.s~ ,l,9.~.se~" 9f , s9il, ~uR:"~~~.. 1 .,, ·'' ., •• 1_ •• , , , • •;• • - 11 ., , 1 •
particular!y,;soil organ;ic -JP.attei,whicl;l is i~i ;. 1 r ,fjeld .rexp~r:i:ITH~ntsJ·.w.~re , con.d,\lcteq , at the indicatioriCof.l'-\.Videsp:readl•soil·f<degFatiatti.@n l, "· ~ " .Vegetable garderi of. fhe.Sch0'ol •o£rV.ocational (Ogunwom et' aZ:; ''200sj.u•C:J'rtenUy, ;there' iS'' '"'1 'IDci "·' Tec:hhicaF·I 'Ediid.tion; 'i ·cbuege of much intJi \ 'il'l i rali<:{rt' ~·6iiWJtiilli{t1' 15Js11 ''v" 'ft;4uc~tioh~''Aziil:e' clu~in' oilii.M d·" 1-'~e~sons of 1J~ .> .. ,-r 1."! ·11 ;9.1 J''f}•''JI ·II<,)( ?,~ ),f () I r} •,,1(). ) u! '!II 'Ill f! .rn <II l1 •t~ <i"<• fX 11 1(1
through ilfl~q,• U~~l' p~~Cp.!;~iU.t;hj}J .j fAm~a,s,b j 11111 '}Q~61,wiq,,f.~p7,., r.gh ~~~te. ,pJ. t-h-.11 e,l<p,f1r.\.ment is plant nutrient navailap~ty. u :U;u , soiJs,h·,Thesc., .. , 11o l.oGatcd. ~ti.app~::q~i.mat~ly,qll\l, 40'N-, ,;J,OO 10'E
Lrrr.) J r( J'Jf] fl'I'J'NJ'_jrj nutt· r-Jl',JnJ ryu llbHJ :~n,:b "''' )u f)d ;~A Ok ,t.h rdfuof~ t J Ld :'~
t() •,f,.,rn 'Hili><. •JriJ Jud ,,'lf,'Jtllf> nJ Jnh,dlf!,'(l~ J'm <!.1>11 rfJ;~rt•Ji '""'no J"ll.tll.rll :lnuJ, "'JJ
.':J:u•1·Jlf.,!J1 : f1JJ'i' 1h'>·£-~ 'Jr!lw ' Jnt.Jihrti,,ff.,. <<;;mb'''in{ Jnrt1 bnr. 1'•d ru,,n t;,·)l oo fJIJif lli1'J'r" . Tab · lVSlCO- cnerruc ~rover o e so ~~ the exverunental s1te ib ,.M 3A C, ljf!b <JtWn~ffb6'1 ~D'B? X! ~ J In nc:r~liCf.~ ~N@ lY'a' ''llfllfiOJ'Jt 'bll )t
"ifiJ ni 1ilr;i ~~~~<)(f~u ;u J ffi.' J l~o~ v 1'Jrt!<;Jyrlfi~,?,W,,':fJmn ~~rf:?~'i',n ~~~~E?~o •>nub 110, · oung manure ana1ysrs · P.' 1
" .l,flflh 'IIIG !Jj J(,-iiii'Jt
- Par-ticle size d-istribution-(g-kg-1) Sand
IJE.fi~ ~s \{G:dlt,~~J;rrq Wfi'l bnfi h~>ilc b~mumo:> h <2llii tn~!f.~· llilxt flfeJ ?Ji rn 1 9 rlT .• d;bi q 10
;&. b~ '91JI, GhElffWi\llii@lpos,J\·ffilq g•w lv 1 d ocn
~~" 1~~fm~~~ofgrkg-'\y 21%iJ0qqc. b71116 5:Clllt:):ffotal iifirti1g.ili (giJ.ogl-1) lo 0c.'JJR>9d
Available ~I!'~Pnmnffi>~ ~~~v r,ll CEC [C mol(+) kg-t] Exchangeable bases [C mol (+) kg-']
~~~ m:::a~nllflfilfl lsrnim; to ~J2U ~11· 1
100 ~(,')rgfl'3'Jd ::snoJ 2nd noi1')Ub01C.j a ~l q<lii ::> no noiJRm1olni b·~tnoYYI
·~lf .("R~I:fYr¥1\nW'$ !!M!w.isw 1•,d 't16rl
"--- 0%anic cru;bon r&,.kg-t) l> a:. - o Total'Ml1oiblt(~1<{h'1rnr,::po {fl~> 'II!."~ .d t.i )\~aiiable p!Wsj:>ntSfui (rna 'I<t{'ij i11 ~1
ttn:£..:!11 ~r.t. rH•HRWrflwmJvian-wer!}~\Y§\§ , .1 , j ;.>ocn . omll.Mc carbon (&kg-1) .
d::.Miw f£ ~J 11-ollit riifi!Bg~Ilf(~ ·!li-t y-1rl1 .-J fl')l'1 1JJ n .'N lUI 1mJtq -tA'lra'ilable;pliosph or<tis t(iffg •kg-1)!,"Jrlj
718 182 100
739
VlOIT:JUC~~lTv1 I Sandy Loam Sandy Loam
LJrJJ o1 ~:Qnol9d (~11\)i\112 ~·1 \l llDII')) 'l'Jdrn u]u:J 6~34 . I 6.56 . \ .,
1•
(!Q2C..'1?. i!fJ.&W r; 21 j 3lb7ln1tr '1\\'.lll J '{ IHlii l
2'J0}.nq 0.51nu1919rl1 ,b0/62 qon ' lldr,J<Jg9v
v..brrr:n:B::¥ .?'.l1JJ1f>1')gl'rPJIJ rlgtrl V..l'Ni1r.l-:n 4.93 4.97
'{firn (9vodr; l;ns J"U:) ~')"J Jil f,l9qm'.lJ rlgirl
1<"Jd ''oi rflprlT .Jim! '.lRJ8~) ~29m'.lJJi d '1<-' U t,)
rlgi d '.l~:??unJ'.ld no2~~~ '(1 b 'J r!J gniwb
no<'69~ ~1•1 <JrU gnhub '{O.Mmuri Jil'.lr!q?.om1s '{1~N <.i qon 'Jfl I' -~')<'C>'J?.ib )t,·JI <"J1ommq " I 9.26 .1 I 11.12 11'1 i'.J<'~q I -\~~6mm <'')<'?() "-J.7_lf i'J<' (J"J 'J ( I '1'D<'U<'
,'{lb1iri·4.:Z_'7J jr,1oq I'HN? 6.<4~ 1c,•)l !'J J!i<: 'J r!J <'f•
202rniv ·>ir,c.orn /I'Jrt i m it.•>l _.,n nohrn 'Jr!J ' · t10.2 .1 , I 10.9 I 1: I ?.')(>{,'J<'I Ih.:?£>1 0 1 Hlh r§r_"f lf- to? OJ Hlfo
em, <'1'.J!3.87u::..u:) (fi0Pl8.7,6ll\ b lnr,rlrn<:tH)
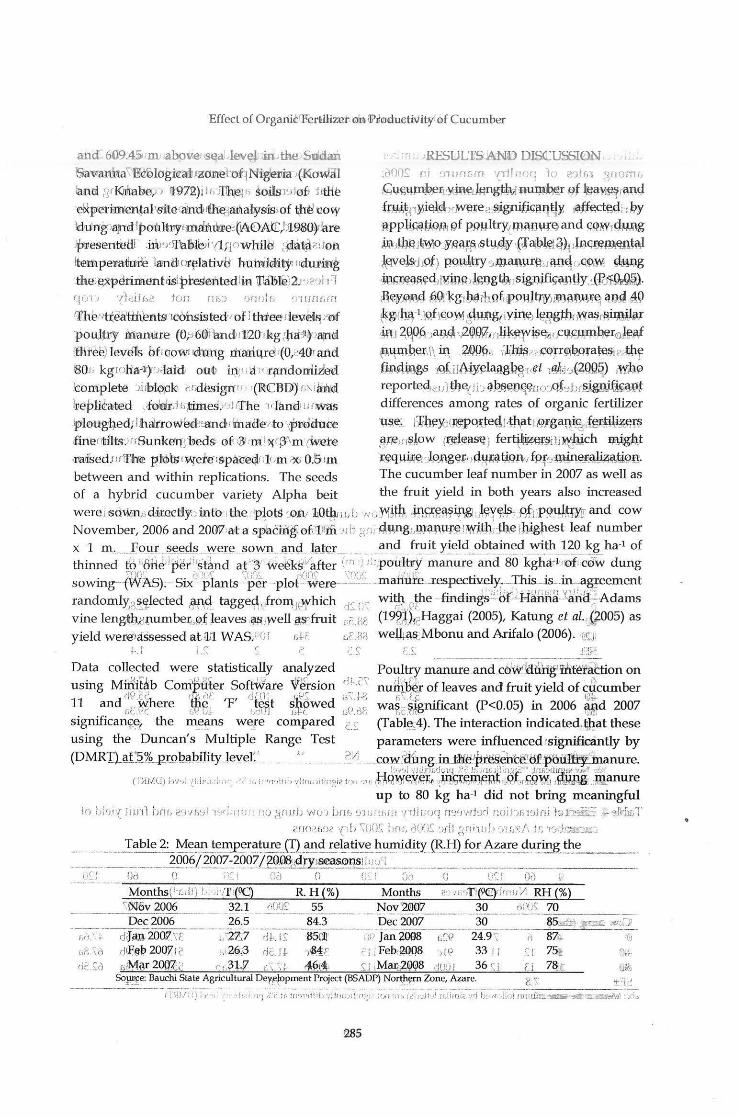
Effect of Organit 1F£rillizer dm ll?n(!)duotivif:¥ of C ucumber
and 609A5 m abov.e.-s~:~a lev~ in the SUdan RESULTS AND DISCUSSION Ba-vanha'i~Iogro:a;JJ EZOl:ll'el-of!Nig'ellia {~mdal ,ofJO~ nr ·nru=r rn ~1tfr:qr1 1n <''rlr., '~n0rn c,
rarttil ~~rKnhabe,n 1l97R)ilr,JITh\,<elh sC>tlsl'Jl0f"~ jrtl{~ ~\J.~l!PW.er,.~~~.fflngiJ;\Jll~ ~f t~av.9~riW<J
ebi:perime~lwilter®t:!Hfih~irulta:lyscrs,of tn~ t2o~ -fmikr)Si~y~~re "-'~gpib§m.}~>r ,i,lj;f~e,dn RY ld<tfflg-,<I!J:l'cl 1po-mltvycmdliuirp~ (V\0 A.tc,bl9g0¥~ue ftPPliJ-f~l:}.~y, ~f P.P»ltry, !:ni\Jl\liE} and l;qiW1<J}Ml.g
lpvesente·(if .ruJ'-.J'll\1 lhi~i '(l fi owh@ ~~1hitcicrion m )tbl:! J!i\YP ;Y.EtBf,~ <17hJ4u ,(rfa;})l~?J q)-! JJPQ!'RW.EIDW
ltempeJ.>atlll>~ lanttorfd_ativg huhlidity Hdu:ri1tft A~ve}.xJ ~f) P-QJli.{Qy •J4J.~\lr!:t,riillqrA~IW 9,.>t¥.)g
lnej~xperiment tislpl:e8e1htedlm '[1<ffii~)2.r·Jc'Jh: f ·i,w;m<l~fi!~ l~m~n!mgtl~nstg;o:jfig@tJY,d.W}"fMl.~· qor' '(h~rlf"~ toll rrr.:) '}ru)Jr. ,, tJHH>rn ~e}'fo.f\4 ~Qrl<g, b:<* ihQf.t:Ji>OJ-lll:fl)'Jil.lll!m\l;Ji~ lill_!j ~~
'11'her ttfea~ni:Si 'Icohsiste&/ of l tkteer Iev.euv 0f ~~d!.~-1\Qf"\(iO~ ,ilW&tiY!n~ ~~~~iWrujr~WJ pou;ipty trmn:are (0;_:~ 6@t\md!lt'20 J~g ~l:ui~9-'J8!fl{l} ·WO ~0-P~& "Jal),~ ,;z~i}J:tm~9"fWQ-~rPllJ.'..WUQqr©.l~a.f (iliret:?)Ieve1s bf,{loWIJdl\in:g rilmiqre r€0/ 40t and ~tttn.b.~•l\ 4\_ -~~qp. ~~.~~ :li'(\ltr9)\Jmaffiti~<'.-Utr ~OJ, kgroHa"'~)'J<laid! ou<t? i.Q.~fi 'a It !t{llldo:r:riioo·d oo~i;I!gs 1~iJ.fri)l~langb~'[(~t 1qA~·J€2QQQ) rWhP 'e:omplete )i rM-Q;aiQ ?rdesignll • (reLBO~ G'-llttir<ll reporte~<'u) t:)}e(Ji A~tl~Wij-(]wnQf•Jbr~~~t Jx;eplid:ated ,<f01dr-l r,,~es.:'J! 1The 11 Iancll 11 rwas differences among rates of organic fertilizer
Jp'l0umedf lhaJtrow9-d':":and>rmade·, to J>r~duc~ '\l$.~ . IJfb~){J (~pQJi.ted l·th.atJ @Jga.ni.<t .furctil.-i.?,:J:f$ .finer>tilts·.Hr8unktrllfbeds 0ti.1~ :m i Wi3''m{Were W~Ht$~Ow ((telellstt) fer~f:lf§rti~j:l!ch ®gktJ: -ratiSedm mhe Rld>lts <~efe ,spa--<!e-ql' •1< 1m ,-x, O.o l.ffi J<~qJ:.Wi~. Jo».g~r-· ~dN-ii;~lji,qn,, fPfsrw!ney~~ti9!!-between and within replications_ The seeds The cucumber leaf number in 2007 as well as of a hybrid cucumber variety Alpha beit the fruit yield in both years also increased
were J•Sd~.fl <iH.e<!tlJ.y,, int0•J the. P!ots •_ol'lll,Uf:hriJJ!J ·Nn )\f~th- ·lrl9i~fV?i,pg•~.).C)}y~i-Bfl :P~~-!J~r and cow November, 2006 and 200V,at a spacmg:ofi.1llffi 'jf t1 gr•; 4,111)1gr,qJ.atwr~i iW,i,th.d:]jl,e rhigpest leaf number x 1 m. __ __f.o_l!Z: . s_e_~ds _ wer~ sown . and la ter and fruit yield obtained with 120 kg ha-l of thinned tf.) r,~-.Hi#1 pet ''stbpd ar,·3: ; web.ks·~aft;r -r_"~-: rt;.poultr.y -~mure ancC86 kghi,i-,@{;~~~ dung
\f1n cJ''''' ,1/)·. ri{JU<' '.1·•·<' _ <Jf:cl~ · 1 This· · sowing---(WAS):-- Si:x- plants- p er -plot ;:were--:...::.:: _manure ..respective Y· -.. _JS_ULag~ement
randomlv , sRlected a .nA tagged from1,which , _ ('"' wi~ Cthe - finding~:::()p_fi~H_l~i{a~Adams J )r),;,.,:; (j\_'fl!" t 1 • ':.rf CJ~ ,l\ (] ;,. . lf
vine lengt):J;m.umberd?.( ~eaves ,(;l&,well frs·fruit r;i:.6~ (19~J.k:Haggai (2005), Katung et aL_(?OOS) as y ield were1c:i5sessed at.Jlil W ASYIJ! r,;.c_ cf$3 welw.\~ Mbonu and Arifalo (2006). (•!:.!
+·. f 1.~ r ~ C ~ L~ ±?J:. · --~-----·-·-··· ·--------
Data collected were statistically analyzed Poultry manure__and.c.o'w!:.la.&ijf.ffiterabion on
using M~'it~b Com~ti!er Sof~~e 1~~sion d!- c\ nu%~:r of leaves and fruit yield of cllcumber 11 d !)(.~St.. rw:''· 'F' CJ[(I{ ~~-· d b\ .Pl r, ,_I .e li)l;..
an tA::.W 'ere r~'D±- :,~~t ~,tpwe ,.C'.&; wa~c.~gnrncant (P<O.OS) in 2006 ~d 2007 significan~~~ the IDF.~s we!e compared c.S: (Tabl~4). The interaction indicated_~at these using the Duncan's Multiple Range Test parameters were influencedisignilicantly by (DMRI)._at'_?JQ_pJ'oQ~b_ility_ lev_~I~-- -~: _______ ?.~ ____ co~cfun~in.J:Jie~preserrce:'ci£l5oiiiftyinanure.
b.;•:,[ '{Jur.ll>Jo1q .}'r"" !& l(lf~ Jl,.l:n:~r.:.> - .... Jti_n:,,lln• t.e 'luf ~--( 1"}11/.(i) b·t·,i (lill•[{.'l' F] ' !<, ''''Jl'Jl!ifJ 'lilm.illf!l~iz l'''' ·nr itj;qw~.v.~~- (m<7~~t\fui·<;>',(nS:.9lMJ rttAA& ,manure
up to 80 kg ha-l did not bring meaningful ·In Li~H{ Ji1n1 bnr) G'i\ff>~l l(::r;;nu.: fHJ grurj_; ViO) fJJth ~/1Ui!t:Hi z-rihrqq n':lcJ'."lJ~;d noiJJfil~JJnj 1-(·>t:'~{ r~frfx;.:l
Cf!O:'.k},> '(if1 \()()5: ilnr:. c\{~)~ ~ff-l ;lf!!liJ!J ·)'!L:-:.1·, 1L "t9dT.;t<.cl.C: ______ .I_~ble ~~~~ t~rn_p~r~~r~Ql_and relative h~_~_!y_(R.H) for~!:~~ during~th::.:e_:__ __ _ ______________ __1Qq_y?._o_0?.:2qQ_?j~Q-~<llr~~~-nsJJ~~::.~I _ __ , ______ - -------------·----o~J Orl o :)' 1 ilcl 0 Ol"! Od u v::! 'Fl r,l
<:1 75! O;J. l:i 78 :- D.~s
P:.: :rl ' ------------·· --· --- - - - ·--{l~D ~~ :) :·_;:•1; '1 ' ~ -·h,d·-·;··i ~"t if, !n·n•.~Hrbv!lJH . .-~~~;~: -:-;~;~~~~·~i~:;-."~jj"4! aAiff~;;~t;~:-~;-~iT-;! (H1.oll;:."'Wmii- "ftt-:.3~·//1 · ,;io
285
•
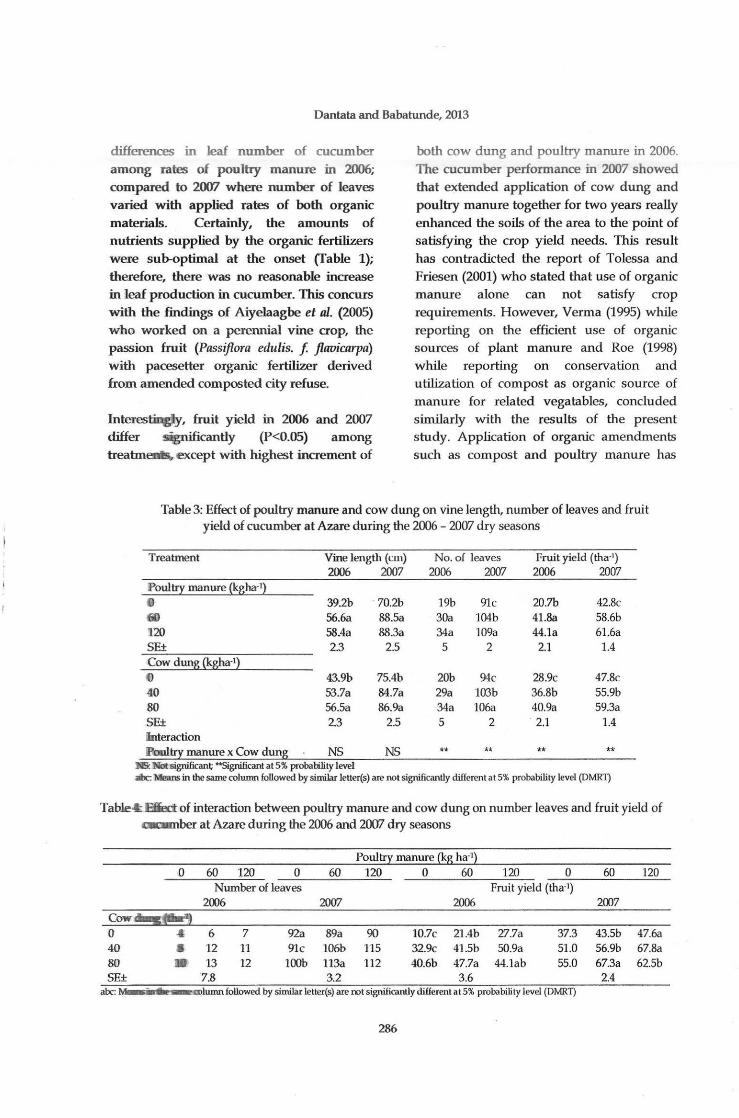
Oantata and Babatunde, 2013
differences in leaf number of cucumber among rates of poultry manure in 2006; compared to 2007 where number of leaves varied with applied rates of both organic materials. Certainly, the amounts of nutrients supplied by the organic fertilizers were sub-optimal at the onset (fable 1); therefore, there was no reasonable increase in leaf production in cucumber. This concurs with the findings of Aiyelaagbe et al. (2005) who worked on a perennial vine crop, the passion fruit (Passijlara edulis. f flavicarpa) with pacesetter organic fertilizer derived from amended composted city refuse.
lnterestiDgly, fruit yield in 2006 and 2007 differ ~cantly (P<O.OS) among treatm~ except with highest increment of
both cow dung and poultry manure in 2006. The cucumber performance in 2007 showed that extended application of cow dung and poultry manure together for two years really enhanced the soils of the area to the point of satisfying the crop yield needs. This result has contradicted the report of Tolessa and Friesen (2001) who stated that use of organic manure alone can not satisfy crop requirements. However, Verma (1995) while reporting on the efficient use of organic sources of plant manure and Roe (1998) while reporting on conservation and utilization of compost as organic source of manure for related vegatables, concluded similarly with the results of the present study. Application of organic amendments such as compost and poultry manure has
Table 3: Effect of poultry manure and cow dung on vine length, number of leaves and fruit yield of cucumber at Azare during the 2006 - 2007 dry seasons
Treatment Vine lengtlt (em) No. of leaves Fruit yield (tha-1) 2006 2007 2006 2007 2006 2007
Poultry manure ~gha-t}
39.2b . 70.2b 19b 91c 20.7b 42.8c (jl) 56.6a 88.Sa 30a 104b 41.8a 58.6b !120 58.4a 88.3a 34a 109a 44.1a 61.6a SE± 2.3 2.5 5 2 2.1 1.4 Cow dWlg ~gha-1} () 43.9b 75.4b 20b 94c 28.9c 47.8c 40 53.7a 84.7a 29a 103b 36.8b 55.9b 80 56 .Sa 86.9a 34a 106a 40.9a 59.3a SE± 2.3 2.5 5 2 . 2.1 1.4 !Interaction iRoultry manure x Cow dung NS NS ** ** ** **
li& Notsignifican~ ~gnificant at 5% probability level *:Means in the same column followed by similar letter(s) are not significantly different a t5% probability level (DMR1)
Table~ Efiem-of interaction between poultry manure and cow dung on number leaves and fruit yield of c.llllllber at Azare during the 2006 and 2001 dry seasons
Poultry manure ~g ha·1~
0 60 120 0 60 120 0 60 120 0 60 120 Number of leaves Fruit yield (tha-1)
2006 2007 2006 2007 Cow I .~ 0 • 6 7 92a 89a 90 10.7c 21.4b 27.7a 37.3 43.5b 47.6a 40 • 12 11 91c 106b 115 32.9c 41.5b 50.9a 51.0 56.9b 67.8a 80 13 12 100b 113a 112 40.6b 47.7a 44.1ab 55.0 67.3a 62.5b SE± 7.8 3.2 3.6 2.4
abc:H - .. m lumn followed by simila:r le tter(s) are rot significantly different al 5% probability level (Dl\IIR1)
286
"· .. .
Effect of Organic Fertilizer on Productivity of Cucumber
been demonstrated to be effective tool to manage soil fertility in vegetable production. These amendments not only supply essential plant nutrients to a crop, but by virtue of their organic fraction, can improve the nutrient holding capacity of soils, nutrient availability, beneficial soil micro-organism activity, soil structure, and crop productivity (Marchesini et al.,l988; Woomer et al., 1988;
Marschner, 1995; Hue and Sobieszczyk, 1999).
CONCLUSION
From the results of this study, cucumber vine length; leaf number and fruit yield were significantly affected by application of poultry manure up to 120 kg ha-l and cow dung manure up to 80 kg ha-1. The interaction of poultry manure and cow dung on vine length for two years was not significant. On the other hand, the same level of interaction on leaf number and fruit yield of cucumber for the same period of time was significant.
REFERENCES
Aiyelaagbe, I. 0. 0., Abiola, I. 0. and Sadiku, M. A 2005. Growth Response of Juvenile Passion Fruit (Passiflora edulis. f jlavicarpa) to Organic and Inorganic Fertilizers in South western Nigeria. Nigeria Journal of Hart. Science, 10:18-22.
AOAC. 1980. Official Method of Analysis Association of Official Analysis Chemist. 13th
Ed, Washington D. C.
Bernhard, E., Dodson, J. and Watterson, J. C. 1988. Cucurbit Diseases. Peto Seed Saticoy, California. 48 pp.
Haggai, P. T. 2005. Effects of Powerplant (liquid) and Conventional (NPK) Fertilizers on Yield Attributes and Yield of Tomato (Lycopersicon esculentum (L) Karst) m Riyom, Plateau State. Hart. Soc. of Nigeria Proc. of the
287
23rrl Annual Conf. held at Rivers State College of Education, Rumuolumeni, Port-Harcourt, 18th - 22nd September, 2005.
Hanna, H. Y. and Adams, A J. 1991. Staking Fresh Market Cucumbers for Higher Yields: A Long Term Research Report. Proc. Fla. State Hort Soc., 104: 237-240.
Hue, N. V. and Sobieszczyk, B. A 1999.
Nutritional Values of some Bio-Wastes as Soil Amendments. Compost Science and Utilization, 7: 34-41.
Jaa'far, U. A 1997 Effect of Nitrogen Sources on the Growth and Yield of Tomarto (Lycopersicon esculentum (L) Karst). B. Agric Tech project Unpublished, 35 pp.
Katung, M. D., Hussibini, I. M. A and Olarewaju, J. D. 2005 Yield and Storability of onion (Allium cepa) as Influenced by Organic and Inorganic Fertilizers in the Sudan Savanna Region of Nigeria. Nigerian Journal of Horticultural Science, 10: 82-86.
Koenig, R and Johnson, M. 1999. Selecting and Using Organic Fertilizers. Utah State University Extension Electronic Publishing. http:// extension.usu .edu/ files/ gardpus/ organic.htm.
Kowal, J. M. and Knabe, D. T. 1972. An Agroclimatological Atlas of the Northern States of Nigeria. Ahmadu Bello University Press, Zaria.
Marchesini, A., Allievi, L., Comotti, E. and Ferrari, A 1988. Long-Term Effects of Quality-Compost Treatment on Soil. Plant and Soil, 106: 253-261.
Marschner, H. 1995. Mineral Nutrition of Higher Plants. Academic Press, INC, San Diego, Ca.
Mbonu, 0. A. and Arifalo, S. 0. 2006.
Growth and Yield of Amaranthus
(4nMnmtlnts crumitus. ~ L.) As Directed by
.<Brganid i -Arttendntcmfsl u tNigflriaO rftm tnn! iof Hart. Science, 11: 4QU1.6,YJd rP·J!CJ••r 1 "·~I - •L;-; f
~ti>Jlntl:inJ \:'P I a h19~2GfJ'Yrdpicalf .f\legetaik1le :0Dbp1 ·AJrt;l;tM H!l 9toUwe:ll rUd,<JilnWatQ"hnbe, Devollr£2f:i2 .pp~p/l rhrr,•J<><J~ rm•Jl ~noJ /\
IHS:-\f.S: :HJI , Hi'"' J·roll 'Jlr,j?
Ogunwole, J. 0., Atabo, J. 0., Yaro, D. T.,
.121lWal,!A. .B. alh~Alabi) rs.f.' CD;.r (;!OOS~ Cl'iwdWJhg
ancklPmiJ.ny i ill..itteJJc.as ·soil~· Alfuehdnn.l€lit.ti;l Jarlt11 \Ja)!b·aatsl·o:ti<Garliq andl Pepperrl:tsrtlnstlaticides
on Caton (Gossypiurrf i---Hi.irs utum: M11.l) Production in the Nigerian Savanna. Journal of:Agniinamy,Y4!~4'):"Q.67~2'Yt2! \PP r I . :_.r , r r, l 'r,h l OJ'fGri!O] to f)i'Ji v' l;nr, d1·nrn,) '.JdJ (!()
Rq¢(\ N1 {3:'11008. ! )Ooni.pdst ,.- (J!JiJ.i2iati0~1J\fO)"
Vegetablerrc,.N:d Fruitrl ~dl~n. Hort!orSr:ikture, 33:934-937. brth ./1. I/, .l ,inid i?;oul J .. U .I·/ ·{{ftl rJf,)l
\o '{l iii rkroJ~ brth LhiY cOOS: _(! I . JJ[~>II'JH>IO
·{d b•nwmllrd ;~h (~>'\'ll '.1\li\\\j ,) rroino
'Hil ni ,...,.,,,ilihl I )inr;~p·>ni hrH. ;!n;,gtO
~\\i'tt·J~~~ \ \..:~ Lil'~\~~!V! iu nui~~J/1 r~tlllh lbr-: nhbu2
_d; .. >s:~: 01 :.~- ~u<r)(' \i1·q~1 \n )\\~ri~ t\~\ in\\~u;,J\
,Wlil'Y_;h.-' _()OP[ L,j JIO<'fldtl! brlh }I .;.;iwm)!
:.dhf.J r[1,]~j f!:J:-.!JiJ·ILJ;J ">iriJ,{{!() ;(rti;>U bnr,
.,'\r: irl.cddu(! ;i fi\J1b)!] nnr<'fl'JJ/,'! .;1i<>·r'rv'i n U
'vuqixtr.;; \ ... 'J_!tt\uh'J u;~iJ . rT • lt<'!!'J lX'..> \ \:qJ:ld
. mJ d .:>inn~fiO
rrA . .C\:(Ji i .C .~dr,n>l Lnr, .l.f l. )r,Ho>i
r• ;·Jrhw/1 'Jdl 1o <>1>!1!. lro"Ji;jolc;Jr,rru lxngt~
(ii<n~JVIrr'J (Jfi'.>i! ul;r,rnrl A .r, i·r'J~~!Vl ·to 2':JJr;J?
.r~i· rr) ·'\ ,C?~"H r l
\ilrl\'-\ .!io~-' w; lr: ·, rnl t;Ttl i?··<Jfll•J~)-·'{JiiF>uQ
I d~>"i"_<; r)fjf ,\'lo?. 1'111H
10 nodi·1! u V lr,I'Htflll .cPvf ! i ,1'Jftfb2"JfiM
m;2 ,=>VII .n. Jl'l ;irf!')brat. _,•Joi rXl ·t9rlgiH
.h:J . ow~iCJ
.rlOOS: .0 .2
<'. IJ rf.J (J fi'l G m/\
,oldn/\ iJ;r r;
to bhiY
I . . () ,mtodli!
br·r, r!Jwo'l ~)
288
Tolessa, D.• and Friesen, [i)_ K. 2001: Effect of
.Eruiohing']Fa~ Maptlm':lWitre •)f1in~lfal lfiel.fliilizer ;I tqq u?.Gfainjoi'JieM)((dJm Maize •rlcl.t !Bako)Wes tetnl rEthi-wia..~wnthr~E:asteni. ' rur<jl. ,Sd>'uthemr_({fuiicall'RegiorlalJMar:zie, Qpmferen~e
!11tfo.+16t\l Fe'blluaty, '?00ilqp) 3~5~~'ii'ti Jr;·;i'tJ w1
lll<'tfi!;;pn-onirn Iio?. IGjJibrr9d ,'i lil!lir-l!r;v:,
·~erma; bdiq ' "Nn 11995.: )[j.Cr0:111S\n'Vatio.{l' i 18\nd J3fUdierit UseJroflcQ>tgBiiitf , $(i)thd:f$ ~o;fhP.la,n;t
.N'¢1'ientslnrp. llOt-14~) lln:.c:~amp>an) ;Pu>K (ed.) Organic Agriculture. Peekay Tree <DfO"ps Development Foundation, Cochin, India.
!lrUfC'U.L>WJ:)
Woom er, P. L., Martin, A. Albrecht, A., Resk,
D (Wr:B! ) m;J.d ·,$oh!arp·eill>eld, JJI! 1 ~w. 'HlS8rnvne ·I•mpottiun.ee rand:I.!Manageme'rit:o£ Sll>Ul G1tlgcrriic Ma tte:ri imlli~:ff,rop#s, p 947 • 8 80. 1Ptl 1 Wootr(~r,
'l~ .rrL.Land rM. 1fJ Bfriith~ ~~d_)J ·t'Iih"E!~.r Biolc!Jgioajl
Managerrle1.1'!'"bf t'Jftopi'cat1Soil; Rer.tility. ;>jrDhir;t ;Wil~ylcllld. BonsrrWestrSt!sf:iexr VKi. noi J:wr~1m
Jon ?.h tl ~·th'J'{ O'NJ l·'t 1!J;;n•Jl •miJ nc
!•.li'·J! Liff!f,2 'JfJj ,bru.d r ,r!Jf, ._,.)} nr l Jn~;:;i";,r;;t<'
bl:J i'{ Ji111l bnc i')d rn!Ji! !r)t;f po nod-;r;·r~:.Ji Ji ·:u <' b·N cH u.it'lo !Jui'J Jt.f 'W! ''". ·;di ·w1<c,tJm 1nu .> h
,u,J ibr;2 bw, .0 .l f, i ~Jidh J) .0 .1 ,'Jdgr,d·wi!\
' Jtinc>Vuf l(J 'H f!!J(j·' ·;}[ dJw01;) .cOOS: ./\ .M
oJ (lli'\W'_,\•;;l\\_ \ . .- 1\;;h mt,l\1< . .-.ll'l.) 1r1rd noi?<-'r/1
ri:iuo2 ••i ,~1 'J:-..i l il1'J.i ·Hnh;portl Lnn "Jirr~>~p(J
.i 10\-\ ~l \ l, \\'lin1. ll\'\'J;.',lV1 .5i 'J9g i V: nDkYN
.S:S:-8 UlJ ,~nli 'J.n2.
pj c·~lhrtl\ J(; bnrf;<j[ 11 lbr:;irt() .08l? r .:)t,()/\
tll[fJ?irw)r[) ci~"{fhrrA lGiJifl() )o nodr;i ·>O<'GA.
:J .0 notgnid?.i>V/ ,b:J
.') .[ , ll0G'l~>l1t>V / bn!> .l ,110<'JJoCJ ,.] )yu,rlrn•J<J
,'(CJ)itG2 b9'J2 oj-;{[ c'J?I>'J~i(l jjcf1JJ:JU'J .88PJ
.<jq RJ:. _r, jmo"liln')
1nnlrp-:; 'IIO'J 1o ?.i nil;_f .cOOS: .'1 (I .ing~til{
?.YJ:>:diJ·t9q ()J'[;.,1) ]r;nodwNr!o:-) brw (bi upil)
oJt>moT 1o bf.Jii bm-. c'31lldi"IH/\ bl9iY no
,fOO'~i51 rii (1?.16)! (.J) l\ \ 11\ 11'.)\\\'i<O~i \\!i;)i~l')t\(fJ\~J)
'll\l \.o .){)'l(l ll.\'\ 'l?,\1;\ -~J .J()(. . \'\()\-\ .".dGJ2 IJWJ£J'f
REVIEW PAPER
289

,. .. . . .., ....
• ,. .. • . l:',v •t \
.t .... '· ... F-. . It! .. ''
Journal of Applied Agricultural Research 2013, 5(2): 291-307 TSSN 2006-750X © Agricultural Research Council of Nigeria, 2013
AGRICULTURAL INNOVATION NETWORKS: FORMS AND APPROPRIATE GOVERNANCE
Ukaejiofo, R. U. Department of Rural Development and Management College of Humanities and Developmental Studies,
China Agricultural University, Beijing [email protected]
ABSTRACT
This paper is focused on innovatio n networks in Agriculture; it exp lored innovation ne tworks by looking at the strategies by which these networks lead to effective agricultural innovation in acquiring technological capabilities, explora tion and exploitation. Since Agricultural innovation is seen as a number of different processes, involving different actors bringing to bear different views for producing innovation in agriculture, the roles of key players are examined, the types of these interaction and a plausible control mechanism put in place. Recently, collabora tion or participation in networks is becoming a strategy to pursue various pro- poor programs in agriculture and these require an in depth understanding on how these responses behave and adopt various schemes to solve rural challenges. It also allows knowledge exchange in an efficient way and to share the costs of development which speeds up the process of innovation. Networks refer to a set of actors connected by a set of repeated interaction of formal and/ or informal ties. The players a re firms, individuals (boundary spanners etc.), knowledge centres (universities and research centres e tc.) and governance (network organizations, governments, special-interest groups, industry organizations etc.). Knowledge exchange is the transfer of knowledge by interaction between different parties through linkages and exchange which usually result in mutual learning.
Keywords: innovation networks, agricultural innovation. R&D partnerships
INTRODUCTION
Revisiting ilmovation
Innovation can be given different meanings in different contexts. Essentially the main characteris tic of. ~ovation is change. Hence, it is difficult to have a theory of innovation because the notion of change is still n ot fully unders tood. The Organisation for Economic Community and' Development defined innovation thus:
Innovation consists of all those scientific, technical, commercial . and financial steps necessan; for the s·itc~;ssful developmen t and marketing of new or improved manufactured
291
products, the commercial use of new or improved processes or equip111ent or the introduction of a new approach to a social service. Research & Development is only one of these steps. OECD (1981)
Innovation is an interactive process which requires the involvement of different actors. These may be located in different units of a single organization, or in different Ol"ganizations. While large enterprises may innovate within the boundaries of the organization, other situations, especially in the agricultural sector - where there are many producers, suppliers and a number of public and private R&D organizations -require the involvement of different
Ukaejiofo, 2013
organizational actors. According to reece (1992) innovation involves bargaining processes between a variety of different actors, some of who have more knowledge, resou rces and political power than others. Technical change and innovation - in agriculture as well as in other sectors - often takes place in a situation of conflict over the nature of the technology, the use of scarce resources, and the distribution of benefits. In such inherently complex and often unstable situations, arrangements between organizations are needed to manage competition and cooperation and to mediate between the different interests of organizations involved in processes, characterized by overlapping and partially objectives.
innovation partially
conflicting
Innovations are new ideas, practices, or products that are successfully introduced into economic or social processes. Innovations can take the form of technologies, organizations, institutions, or policies and involve the extraction of economic, ecological, and social value from knowledge. The process of innovation further involves putting ideas, knowledge, and technology to work in a manner that brings about a significant improvement in performance. It is not just an idea, but a workable idea. In agriculture, innovation can include new knowledge or technologies related to primary production, processing, and commercialization, which can positively affect the productivity, competitiveness, and livelihoods of farmers and others in rural areas. The concept of a system offers a suitable framework for conveying the notion of parts, their interconnectedness, and their interaction, evolution over time, and emergence of novel structures Guma, 2011).
Successful cases of agricultural innovation invariably demonstrate a range of partnerships, alliances and network-like arrangements that connect together
292
knowledge users, knowledge producers and others involved in enabling innovation in the market, policy and civil society arenas (World Bank, 2006). A key implication of taking this systems view of innovation is the realisation that the success of public agricultural research is dependent on how effectively it builds networks and partnerships with a wider set of players from the private and civil society sectors and, of course, farmers themselves. Yet if networks are so important in making agricultural research an effective player in agricultural innovation processes, how can they be developed? Public agricultural extension or advisory services have traditionally played the role of linking farmers to technology. But the role of these agencies does not seem to address the wider set of partnerships that are
now recognised to be involved in innovation. Recent studies point to the importance of a more broadly conceived role referred to as innovation brokering (Klerkx et al., 2009). Specifically, this paper addresses the following questions:
1. What scenario has emerged in agricultural innovation networks, and how have these networks been developed by the players?
2. How do the different players perform, given the constraints imposed by the virtue of the different backgrounds of the players? 3. How can these networks effectively perform, and what type of governance can be operated to promote these networks to acqu ire techno logical capabilities, exploration and exploitation?
The Forum for Agricultural Research in Africa's Experiences in Multi-stakeholder approaches (2012) illustrations show that networks which encourage innovation depend on the initial context and how this changes over time. These networks should not focus first on developing research capacity, but should be developed from the
Agricultural Innovation Networks
start in a wav that encourages interactions
between public, private and civil society organisations. Stakeholders who initiate an
innovation process can be either public or private. The innova tion can be policy- or m arket-driven, either planned or
opportunity-led, bo th of which are characterised by three distinct phases:
1. Stakeholder engagement; 2. Shared plaruting, implementation, learning and assessment; and
3. Ensuring a sustainable and dynamic innovation system.
By the third stage the innovation is unlikely to be either public- or private-led, but to involve a high level of collaboration between all players. This is essential if the sector is to be able to respond to new challenges and new opportunities in economically, s ocially
and environmentally inclusive ways. They should include:
Building and supporting partnerships
Engagement and collaboration between players is an essential component that needs
to build on existing links where participants are already working together, rather than creating completely new ones. Such
engagement is a necessary and consultative process tha t can be time-consuming. It requires the creation of trus t between s takeholders, a willingness to work together, raising awareness of the challenges faced and the creation of a common vision for the future. Joint activities help to build ownership and accountability between
partners.
facijitating or bro~ering networ~s an_d alliances . fs · -a critical role ill enabling ··
innovation and.ditturs an .irid.ispens~ble c~t .. that is often ovetl(')bked. Unfortunately· tfte
competencies required' for this role are SC3!Ce
and in many cases investors are unwilling to fund this crucial role. The market rarely pays
293
for this and support by public funds is often
required as a catalyst.
There exist various forms of facilita tion. Some initiated by farmer organisations, others by private companies or NGOs, with
mos t being initiated by ministries of agr iculture or research institutions. This, however, indicates that it is not the type of
organisation that is important, but rather the need for facilitation and capacity building to create effective networks.
Facilita tion or brokering needs 'champions', either ind ividuals or institutions, who understand the often-complex institutional and regulatory structures, in which alliances
need to be encouraged. This requires individuals with the experience and skills to coordinate networks of actors from public
and private sectors.
Innova tion Platforms or hubs represent a strong approach to empowering
pa rticipating s takeholders, building capacities and identifying opportunities able to analyse and alleviate constraints or add value within a systems chain. However, the hub itself needs to be dynamic and evolve so
that it becom es s tronger and increasingly relevant.
Creating strong fanner organisations
Strong farmer organisations at all levels have a critical role to play in increasing
smallholder productivity and livelihoods,
improving competitiveness and increasing bargaining power for markets, services, and
. enhancing . the policy environment. It is ·e5sential that farmer or~sations are able
to speak-.with an info.~med and, unifi~d voice ·and .. to ~ngage with other stakeholders. At ~·s~; time. they ~us·t- bit repres~ntative and able to communicate with m embers and
other farmers .
Ukaejiofo, 2013
Involving the private sector a11d ensunng market-dnven approaches
Market constraints are successfully dealt with through better understanding and information about demand and supply, market price and its determinants, and in particular market linkages. As such the private agribusiness sector needs to be involved not only in the supply of inputs and purchasing outputs but also in developing market opportunity and capacity -building initiatives.
Understanding the positive role the private agribusiness sector can play in facilitating change at local and national levels is important when considering changes to the enabling environment. The private sector also needs to be well organised and able to speak with an informed and unified voice in engaging with the public sector.
Improving uccess lo information, k~towledge and training
New knowledge from research is only one component required to encourage innovation in agriculture. Improving access to information can create an effective demand for research products. For instance, use of local radio programmes can compliment training, knowledge sh aring and other learning events. The involvement of suppliers, technical experts, farmers, government and NGOs in radio programmes helps to build networks.
Scaling up
Sustainability requires capacity strengthening throughout the process to ensure local people and organisations assume ownership and leadership. This should be continuous and not undertaken as a one-off activity . It requires long-term funding commitments.
294
WHY NETWORKS ARE IMPORT ANT FOR AGRICULTURAL INNOVATION
Innovation networks can provide access to information and resources, new markets and technologies. Using these networks, a programme has the advantages from learning, scale, and scope economies allowing them to achieve strategic objectives, such as sharing risks and ou.tsourcing. Newer approaches in the fields of innovation systems, participatory research, industrial organization and corporate management suggest that innovations come about in systemic setups characterized by agents that develop, diffuse and use innovations, their interactions, and structures and rules. From an innovation systems perspective, innovation occurs in network-like structure of interaction and continuous learning assuring the participation of primary producers, processors, buyers, input providers, local leaders, government officers, local uevelopmenl programmes and NGOs, educational institutions, and many other actors.
The idea of networking in innovation suggests that the farmers' position in social networks determines their access to resources needed to implement the irmovation. The position in the network also accelerates or limits the cognitive processes of anticipation and absorption of new and/ or abstract knowledge and technologies that come from outside the usual farm operations context. This, in parts, may explain why so many efforts of research, extension and development agents promoting new agricultural technologies have failed. This emphas is on interaction and collaboration for innovation is also consistent with the literature on inter-firm alliances aimed at technological learning and new knowledge creation which argue that alliance building and collaboration in R&D is necessary and beneficial given the effects of resource interdependence and complementarities
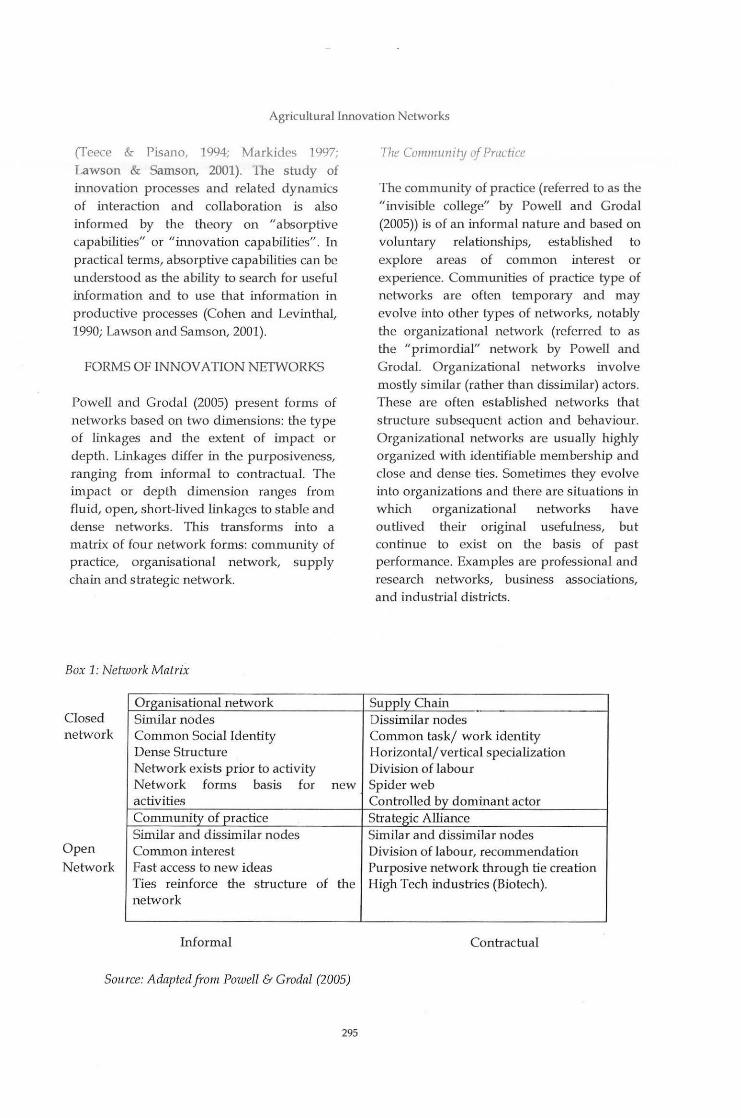
Agricultural Innova tion Networks
(Teece & Pisano, 1994; Markides 1997; Lawson & Samson, 2001). The s tudy of innovation processes and related dynamics of interaction and collaboration is also informed by the theory on "absorptive capabilities" or "innovation capabilities". In practical terms, absorptive capabilities can be understood as the ability to search for useful information and to use that information in productive processes (Cohen and Levinthal, 1990; Lawson and Samson, 2001).
FORMS OF INNOVATION NETWORKS
Powell and Grodal (2005) present forms of networks based on two dimensions: the type of linkages and the extent of impact or depth. Linkages differ in the purposiveness, ranging from informal to contractual. The impact or depth dimension ranges from fluid, open, short-lived linkages to stable and dense networks. This transforms into a matrix of four network forms: community of practice, organisational network, supply chain and strategic network.
Box 1: Network Matrix
Closed network
Organisational network Similar nodes Common Social Identity Dense Structure Network exists prior to activity Network forms basis for new
Open Network
activities Community_ of practice Similar and dissimilar nodes Common interest Fast access to new ideas Ties reinforce the s tructure network
Informal
of the
Source: Adapted from Powell & Grodal (2005)
295
The Community of Practice
The community of practice (referred to as the "invisible college" by Powell and Grodal (2005)) is of an informal nature and based on voluntary relationships, established to explore areas of common interest or experience. Communities of practice type of networks are often temporary and may evolve into other types of networks, notably the organizational network (referred to as the "primordial" network by Powell and Grodal. Organizational networks involve mostly similar (rather than dissimilar) actors. These are often established networks that structure subsequent action and behaviour. Organizational networks are usually highly organized with identifiable membership and close and dense ties. Sometimes they evolve into organizations and there are situations in which organizational networks have outlived their original usefulness, but continue to exist on the basis of past performance. Examples are professional and research networks, business associations, and industrial districts.
Supply Chain Dissimilar nodes Common task/ work identity Horizontal/ vertical specialization Division of labour Spider web Controlled by dominant actor Strategic Alliance Similar and dissimilar nodes Division of labour, recommendation Purposive network through tie creation High Tech industries (Biotech).
Contractual
Ukaejiofo, 2013
The Supply Chain network
The supply chain network is structured around a common task, project or line of business. Supply chain networks are often structured by a lead firm operating as the core actor in the network. The s trategic alliance network is open like the community of practice, but relationships are highly formalized and of a contractual nature. These networks are often found in emerging high-tech areas of innovation such as biotechnology.
Over time, n etworks may evolve from one type to another in a varie ty of ways. Informal community of practice networks may become more highly s tructured with more d osed membership around a certain discipline or line of business. They may also develop into a strategic network: many open research n etworks in the field of biotechnology h ave moved in this direction once it became clear that appropriating the benefits of knowledge required investment in complementary assets and protection of intellectual property. The following paragraphs illus trate the different network forms.
COMMUNITIES OF PRACTICE
Many research networks are networks of individual researchers. Their main purpose is advancing the s tate-of-the-art of knowledge through information exchange and learning. Many of these networks are global in n ature and are truly invisible colleges. Networks can go beyond the collaboration that is required to conduct spe~ific transactions (i.e. supply networks); · or beyond the collaboration that aims to develop new- products or pr'ocesses (innovation .. networks). Learning netw(')rKs involve actors with the main purpose of · know ledge generation or sharing, unrelated· to specific innovative processes or products. Often they are not d irectly associated with
296
anv particular commercia l transaction. Leammg networks can somebmes be seen as the formative, "sensing" stage of innovation networks. They are often more open than innovation or supply networks as there are not yet commercial interests at .stake. Learning networks are often found outside or a t the periphery of the value chain or organizational network. Learning networks also have a s tronger tendency to be networks of individuals (from organizations), rather than networks of organizations.
Organisational networks: Corporate R&D
The R&D network literature comes in two main parts. One group of study reviews the interactions between universities, private or public research organisations and government and recen t models refer to the triple helix or University-industrygovernmen t relations (Leydesdorff, 2005). The m ulti-institutional helix is inheren tly w tstable and subject to disturbance by both internal and external dynamics. The approach allows for complex systems involving different actors and functions to be analysed.
Other s tudies on R&D networks emphasize the spatial organisations of R&D activity within firms and between organisations. Within multi-national enterp rises (MNEs) which are the main international R&D performers, there is con tinuous interplay of forces for centralization an d decentralisation of R&D activities. Centralizing issues may be explained by the h igh cost of R&D, scarcity of qualified manpower, and the desire to reap . the b~efits of. economies of scale. Decentralisation may be explained by the -need to be close to diverse markets, and the need to benefit frpm Ute knowledge base in
host counties (Albert, 1999!. The 21st Century has witnessed a ren·ewed decentralisation process as can be observed as MNEs attempt to source the best global technology irrespective of where it is produced or who

Agricultural Innovation Networks
produces it. The process has brought the birth of the IT revolution and an emergence of countries like China, Brazil and India as important R&D producers. Gassman and von Zedtwitz (1999) present an integrated R&D model which balances decenb:alization and cenh·alization tendencies in organizational R&D networks. The potential benefits of such an approach are obvious: global reach and local specialization can be achieved in the same system. The costs, however, may also be significant in terms of coordination and complexity in a ecision-making processes.
Supply and agro-chain networks
Supply networks and agro-chain networks are vertically integrated networks that link ups tream and downstream activities in a production-marketing-consumption column. The concept has been prominent since the late 1990s and builds upon the fields of valu~ chain analysis, supply chain management, logistics and lean production (Ruben et al.,
2006). A variety of different types of integrated firms and networks can promote growth depending on the specific characteristics of a sector, county and technology. This form of network is important in agricultural innovations for a number of reasons: brings embodied' technology to the farmers, introduces efficiency by linking farmers to trader, processors and exporters and introduces improved production standards, thereby, providing an opportunity for "upgrading" production practices. Upgrading as an innovation strategy may involve product, process and functional upgrading (moving to a different position in the value chain with higher value added), or chain upgrading i.e. moving to a different value chain (Kaplinsky and Morris, 2002).
Innovation networks as strategic alliances
Innovation networks involve collaboration between organisations with the objectives of
297
developing new products or processes. Three stages can be distinguished in the evolution of i.Imovation networks. The first is referred to as sensing, or the development of new ideas. The second is referred to as the response stage as it entails the actual development of products and distribution of new products. The distinction between stages is important as innovation networks tend to evolve over time, from flexible learning and search networks to networks that supply and distribute goods and services or to organisational networks when technologies mature (Gijsbers, 2009).
PLAYERS
Players refers to innovation agent, someone who introduces or uses such knowledge in a process that entails seeking information from various sources and integrating elements of the information into social or economic practices that somehow change the behaviours and practices of individuals, organizations, or society. Innovation agents include various actors. These may include:
public sector entities, like national and subnational research organizations, agricultural extension and education services, State marketing agencies, State-owned enterprises, institutes of higher learning, international research centres, and foreign universities;
traders, brokers, and other entrepreneurial individuals and their associations;
for-profit companies, both domestic and foreign, as well as industry associations;
farmers' organizations, cooperatives, and cooperative unions;
Non governmental organizations, professional associations, and advocacy j lobby groups; civil society organizations, such as community- or solidarity-based groups; and farmers, farm households,
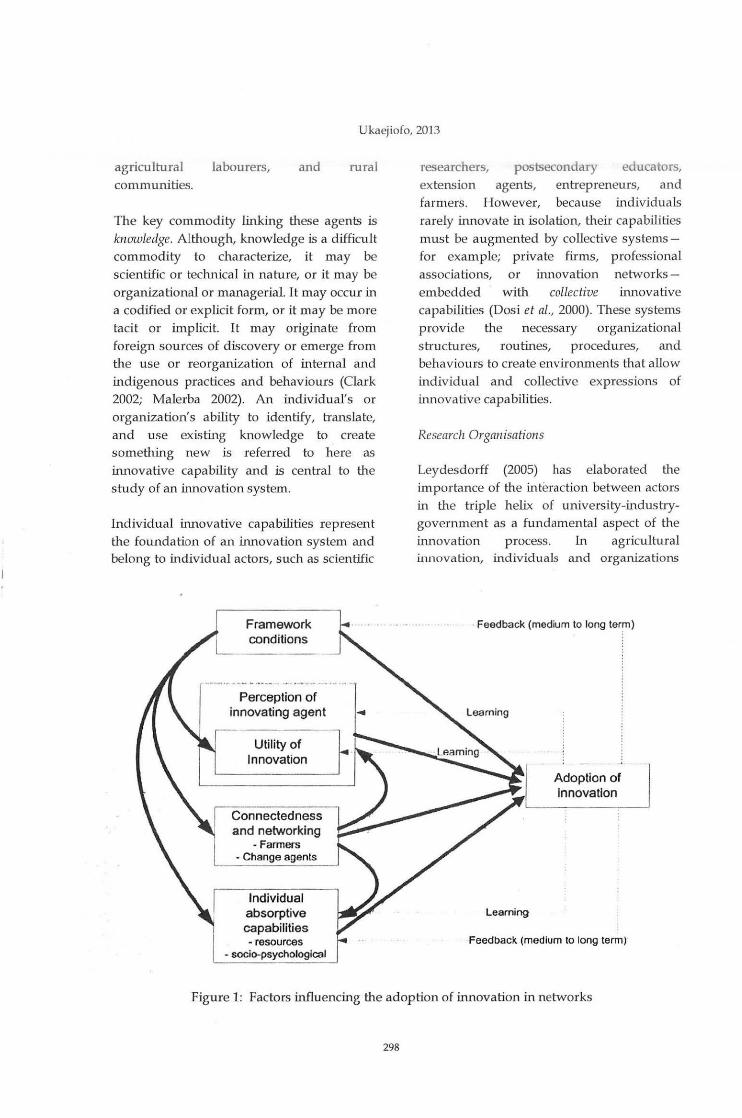
Ukaejiofo, 2013
agricultural communities.
labourers, and rural
The key commodity linking these agents is knawledge. Although, knowledge is a difficult commodity to characterize, it may be scien tific or technical in nature, or it may be organizational or managerial. It may occur in a codified or explicit form, or it may be more tacit or implicit. It may originate from foreign sources of discovery or emerge from the use or reorganization of internal and indigenous practices and behaviours (Clark 2002; Malerba 2002). An individual's or organization's ability to identify, translate, and use existing knowledge to create something new is referred to here as innovative cap ability and is central to the study of an innovation system.
Individual innovative capabilities rep resent the foundation of an innovation system and belong to individual actors, such as scientific
Framework conditions
Perception of innovating agent
Utility of Innovation
~nectedness I ~~d networking
-Farmers - Change agents
Individual absorptive capabilities -resources
- socio-psychological
researchers, postsecondary educators, extension agents, entrepreneurs, and farmers. However, because individuals rarely innovate in isola tion, their capabilities must be augmented by collective systemsfor example; private firms, professional associations, or innovation networksembedded with collective innovative capabilities (Dosi et al., 2000). These systems provide the necessary organiza tiona! s tructures, routines, procedures, and behavioms to create environments that allow individual and collective expressions of inn ovative capabilities.
Research Organisations
Leydesdorff (2005) has elaborated the importance of the interaction between actors in the triple helix of university-industrygovernment as a fundamental aspect of the innovation process. In agricultural innovation, individuals and organizations
· Feedback (medium to long ter~)
Learning
Learning
Adoption of Innovation
Feedback (medium to long term)
Figure 1: Factors influencing the adoption of innovation in networks
298

Agricultural Innovation Networks
(both public and private) are important. For centuries individual farmers experimenting with new seeds and cultivation practices have advanced the state of knowledge. Since the 19th Centuty organizational actors, such agrochemical companies, univers ities, and s tate experiment stations have become responsible for most of the major breakthroughs that have lifted agricultural productivity to unprecedented Levels. The most important actors in the agricultural innovation are: research organizations, univer.sities, input providers, technology users, intermediary organizations, pressure groups, financiers and regulators. Some are public organizations, others private. Some types of organizations, such as seed companies, can be private or public -although there is a strong tendency in most developing countries for state-owned enterprises in agriculture to be privatized.
Agricultural research organizations produce new knowledge and technology. Traditionally, in the linear view of innovation, agricultural research organisations have been seen as the core institutions generating and transferring new technology to a variety of users who are seen as passive recipients. Newer approaches to innovation and the production of knowledge emphasise that innovation is a multischemed, interactive process, and that new insights and innovations may originate in many different places in the network. In many agricultural innovation networks public sector agricultural research organizations can be considered as key players, but the absence of an effective interaction with other actors in the network in the past explains to a large extent why public sector agricultural research has sometimes failed to deliver the goods (Uzuegbunam, 2001). The private sector is increasingly involved in research, but is focusing in particular larger market, appropriable returns and on countries that have a good scientific infrastructure and
299
favourable policies (Pray and Fugile, 2002). Public sector agricultural research organisations are seldom the sole source of formal research. With the exception of the smallest and poorest countries, agricultural research is conducted in number of other research organisations. National and international research financiers increasingly channel funding through universities and or national research organisations, NGOs and foundations, sometimes directly. The role of universities in agricultural research and innovations is strongly country specific depending on the historical evolution of the university as a teaching and or a research institute. Often in agriculture, innovative technology does not come (directly) from research organizations but from input providers. Much agricultural technology is embodied in seed, chemicals and other inputs- as well as in machinery and designs used by farmers and processors (Roseboom,
1999). With the exception of planting material, where public sector seed companies continue to play an important role in many countries, inputs are increasingly provided through private sector companies. Many parastatals have been disbanded or privatized since the beginning of the 1990s, making the private sector an
, increasingly important player in innovation networks.
Intermediaries
These are those organisations that play a role in the dissemination and/ or adaptation of research results to specific groups of technology users. They include governmental extension organisations, rural development programmes and nongovernmental organisations. The issue of research-extension linkages has received considerable attention in the literature (Anderson and Feder, 2003) and is important in studying innovation networks.
Ukaejiofo, 2013
Pressure groups
They attempt to influence the research agenda for a number of reasons: the nature of the technology, the use of resources in agricultural production and the quality of the product The nature of agricultural technology has been a source of conflict throughout history and has been discussed elsewhere in this study. Resources for use in agricultural production (land, water, germplasm) become increasingly scarce and contested with population growth and environmental degradation; and as a result their protection from general use becomes more dominant. Product quality is usually a main concern of consumer organisations in developed countries, though consumer voices are weak in developing countries. While consumer preferences are a primary concern in private sector research efforts, public sector agricultural research has struggled to generate technologies acceptable and profitable to farmers, and has often totally neglected the more complicated question of how to include consumer · preferences in research. Taste, cooking qualities, shelf life and chemical residues are issues of primary concern. A strong lobby has been developed by international NGOs (such as Greenpeace & Grain) to ban production and trade of genetically modified crops. But the area under GMO crops continues to expand rapidly in many developing countries and the life sciences companies (led by Monsanto) are increasingly successful in development and transfer of GM technology packages (Personal discussions).
Technologt; users
They are mos tly farmers, but include processors as well. Criticism has been voiced against agricultural research organisations for being insufficiently relevant and responsive to the needs of farmers and other users (Chambers et al., 1989). When
300
technology users are also the funders of research, as for example, in some plantation crop research institutes, a user orientation comes more naturally, particularly as the number of users is small and well informed. In food crops research that focuses on the needs of millions of smallholders in a variety of ecological and production systems such a user orientation is much more difficult to achieve. Much progress has, however, been made since the 1980s as a result of farming systems and participatory research approaches. With the increasing importance of environmental concerns in agricultural research and donor demands to address poverty through research the issue of identification of users and targeting research has become again more complicated.
Financiers
Financiers of research and innovation are important actors. Food security continu es to be seen as a primary government responsibility. As a result, agricultural research has traditionally been funded primarily by national governments. International donors also provide large sums of money to national and international agricultural research focused on developing countries. Two major changes taking p lace are decreasing funding levels in many countries, and the introduction of different funding mechanisms. Philanthropic organisations have played a major role in financing agricultural research; this includes the Ford and Rockefeller Foundations, which were instrumental in starting the green revolution, promoter and funding of the Consultative Group of International Agricultural Research (CGIAR Consortium) globally, while the Bill and Melinda Gates Foundation has emerged as an important funder since the year 2000.
Government
Besides playing an important role as financier, Government is also the most
Agricultural Innovation N etworks
important policy maker and regulator of research undertaken and technologies developed. Indirectly, governments steer research and innovation activities through prices, subsidies and taxes. Directly, governments play an important role through the provision of quarantine services, seed certification, and rules on the use of agrochemicals, land use and zoning legislations, intellectual property, technology policies, food safety, the use of genetic resources, bio safety, etc.
At the start of the innovation process, responsibility for coordination is often shared, especially where primary production and processing activities had not been linked previously. Often research or another publicsector always took lead, with NGOs playing a support role for farmers, especially during early stages. As the innovation process is continued, coordination often shifts to farmer organisations taking greater interest and sometimes assuming leadership as their capacity for this role increased. Backstopping for weaker partners formed an important service provided by research, NGOs and occasionally the private sector. Local or district government representatives play an increasingly important role, as ·the research lead reduced and local capacity and . capability increased
WHICH GOVERNANCE STYLE IS APPROPRIATE IN INNOVATION
NETWORKS?
The need for governance exists anytime people come together as a group to accomplish an end. As such, governance can be understood broadly as the process through which such a group makes decisions that direct the group's collective efforts (Institute of Governance, 2006). Johnson (2001 ), setting forth a taxonomy of policy measures that aim at fostering innovation, argues that governments can (1) supply incentives for companies (and other
301
productive agents) to engage in innovative work; (2) supply resources such as capital and human resource competence; (3) guide the direction of searches (influence the direction in which actors deploy resources); (4) ensure that actors recognize the potential for growth (identifying technological possibilities and economic viability); (5) facilitate the exchange of information and knowledge; (6) stimulate and create markets for new products and services; (7) reduce social uncertainty (that is, uncertainty about how others will act and react); and (8) counteract the resistance to change that may arise in society when an innovation is introduced (provide legitimacy for the innovation).
Governance is important in public decision making concerning science, technological development, and innovation. The governance of an innovation system can be
. understood as the structures and procedures policy makers set forth to foster innovation and provide incentives to innovating agents and the interaction among them. In many countries, the governance of innovation systems has been characterised by a high degree of departmentalisation, sectionalisation of the political administration, and low inter-ministerial exchange and cooperation ~Smits and Kuhlmann, 2004). There are particularities in the governance of innovation systems that .differentiate it from other governance processes as ably put forth by Hartwich and Baptista (2007):
Innovation systems have complex structures and evolve over time in an unplanned manner based on the principles of diversity, selection, and self-organisation. As the outcomes of the innovation endeavour are only partly predictable, decision makers need to react flexibly and revise their decisions in light of new evidence.

Ukaejiofo, 2013
Decision makers n eed to manage large amounts o information to be able to JUdge the potential effects of innovations.
Because of the many agents and processes involved, centralized control is impossible and innovation policy can influence the spontaneous development of innovations only to a limited extent.
As the outcomes of the innovation endeavours are uncertain, decision makers need to plan for and optimize risk management mechanisms.
Teece (1992) discusses different types of governance and organizational arran gements in situations of rapid technological change. While the importance of competition for innovation has been recognized starting with the early writings of Schumpeter, it provides only a partial explanation for innovation. He argues that innovation is a highly complex process that requires elaborate forms of horizontal and vertical cooperation. Cooperation achieves both operational and strategic coordination. Operational coordination is needed for four main reasons:
To access complementan; assets: Developing a technology is only a first step in the innovation process; a range of complimentary assets need to be accessed. In agriculture these include, for example, marketing, the services of extension agencies need to have access to materials in gene banks, e tc.
To link developers of new technolog~; to users and suppliers: Tight "upstream" and "downstream" linkage and feedback mechanisms with suppliers of new technology and with users as key to the success of the innovation process. von Hippe! (1994) s tresses the role of users in technological innovation.
302
To pravide linkages to competitors. Horizontal linkages are nnportant to establish technica.. standards that are key requirements for innovation. Similarly, both in private and public research, the scale and scope of assets needed lie beyond the capa~ilities of a single firm or organisation. In such situations cooperation (with colleagues or competitors) is the only way forward.
To build connections among technologies. Innovations are not developed in a vacuum. They build on prior technologies and design, they require complementary technologies (e.g. zero tillage management requires the use of herbicides), and they may be linked to generic, enabling technologies (for example, biotechnology).
Williamson (1985) discusses the three key governance structures that facilitate innovation. The first is coordination by the market through the price mechanism. Teece (1992) argues that there is no evidence that the price mechanism allows all of the necessary coordination to take place. The alternative internal coordination in
hierarchies also has serious drawbacks. In most cases, strategic alliances and inter-firm agreements and partnership are essential to achieve innovation effectively. Secondly, are the governance functions: a means to define the conditions under which the innovation process is undertaken and the rules that apply. This network rationale is particularly important when public and private sector participation in innovation is required. Both governments and private enterprises have engaged in the establishment and operation of innovation networks and partnerships. Governments have promoted and supported research partnerships in order to:
Correct market failures in R&D investments, particularly in the presence of highly nonappropriable research, and lack of effective demand;

Agricultural Innovation Networks
Speed up technological ilmovation, aiming at
increased international competitiveness;
Increase technological information exchange
among firms, universities and public research institutes.
Adekunle et al. (2012) opined that private
sector firms may participate in research
partnerships for ilmovation on the basis of a
review of theoretical and empirical literature for the following reasons:
Decrease transaction costs in activities
governed by incomplete contracts;
Broaden the effective scope of activities;
Increase efficiency, synergy and power through the creation of networks;
Access external complementary resources
and capabilities to better exploit existing
resources and develop sustained competitive
advantage;
Promote organizational learning, internalise
core competencies and enhance competitiveness;
Internalise knowledge spillovers and
enhance the appropriability of research
results;
Lower R&D costs and pool risk.
Juma (2011) however, explored the prospects
of using regional bodies as agents of
governing agricultural innovation through
measures such as regional specialisation. He
adopts the view that effective regional
integration is a learning process that
involves continuous institutional adaptation.
These points were buttressed with extensive
examples of initiatives at the national or
cross-border levels, providing cases for
regional programs in Africa. He points out
that since Africa already has a system where
303
meetings of political leaders are convened at
the highest level, and these meetings take
decisions bindmg on member States, and
member States regularly report
performances regarding these decisions and
with the Africa's regional economic
communities establishing and designating
centres of excellence in various areas, that
such was a good platform for shal'ing
information and best practices.
At a Six-Country program workshop held in November, 2003 on New Gavemance for
Innovation? Dietmar Braun of the University
of Lausanne discussed the need for a New
Governance for ilmovation. His main argument, both analytical and normative
contribution, was that the institutional
structures and policy approaches have not
yet adjusted to the radically changing
conditions for innovation policy. He
combined three major concepts: (1) interactive instead of linear models in the
innovation process, (2) mode of the production of knowledge and (3) systems of
innovation approach. The consequences of
these concepts are straightforward:
"Knowledge" must be put in the centre
when thinking about the production and
innovation process, therefore collaborations
between basic research and the technological change is crucial. Furthermore, innovation is
a result of systemic and interactive rather
that linear processes, which means that the
institutional setting, that emerged under the
condition of Mode 1 knowledge production
is put under severe pressure to adjust both
the institutions themselves and the design of
policy.
Above all, however, new governance for
innovation is needed to enable and foster
flexibility throughout the system,
understood as the "capacity to think" in
terms of the whole of problems and solutions
to anticipate the future. Thereby, the system
and its actors are empowered with the ability
and potential to constantly adjust ongoing

Ukaejiofo, 2013
processes and to question existing emerging structures. This list provides a good first description of the scope of innovahon governance. But to see how it applies in a situation, it is worth going a bit further and asking: What question does innovation governance address? Broadly speaking, it deals with both the "content" and the "process" sides of all innovation activities taking place at a particular time.
Defining roles and ways of working around the innovation process,
Defining decision power lines and commitments on innovation,
Defining key responsibilities of the main players,
Establishing the set of values underpinning all innovation efforts,
Making decisions that define expectations,
Defining how to measure innovation,
Making decisions on innovation budgets,
Orchestrating, balancing and prioritizing innovation activities across divisions,
Establishing management routines regarding communications and decisions.
CONCLUSION
In conclusion, applying the concept of networking for innovation to agriculture in developing countries seems promising to current understanding of rural innovation processes with regard to the following aspects:
It sharpens the focus on the capacities farmers exhibit in dealing with innovation. Very valid innovations considered to be beneficial to farmers may turn out to be
304
useless for them because they don't dispose of the necessary innovative capacity marked by mdividual constramtS a...."ld socio
economic framework conditions.
It challenges the linear technology adoption which suggests that innovations can be handed down fiom research and extension to farmers and which primarily propagates investments in research and extension, and shifts the focus to strengthening the capacities of farmers not only through handing them knowledge and technology but also through supporting active learning process in which practical use is trained as well as solutions are adapted.
It stresses that farmers are part of innovation networks in which mechanisms of collective absorptive capabilities take place, people exchange information, discuss experiences of adoption and find solutions for a better adaptation in specific contexts. The strength of ties to other farmers and agents that promote innovation as well as the complementarities and gradient of knowledge between them determines to which extent people absorb innovations.
In general, networks are relevant for innovation for a number of reasons:
Innovation networks allow the inclusion of a variety of dependent, independent or interdependent actors (Ruigrok and van Tulder, 1995). Innovation networks can be seen as institutions that resolve conflicts between actors.
Innovation networks involve both patterns of horizontal cooperation and competition as well as vertical integration (Beije, 1998). Vertical integration is the process of establishing forward and backward linkages throughout the production column or value chain.
Innovation networks include both organisations and institutions: they specify

Agricultural Innovation Networks
both the actors (organizations) and the rules or mechanisms (institutions) that determine interaction.
Innovation networks include both technical and institutional innovation
All players in the National Agricultural Research System (NARS), from policy makers to Agricultural R&D institutions (both public and private) and farmer organisations play a role in agricultural innovation, which involves efforts to improve the current practices in agricultural production, processing, organisation and marketing. Farmer Organizations (FOs) also play a role in collecting and disseminating practical and technical information through formal and informal networks within their structure. In order to be relevant to the clients' formal or generic needs, agricultural research organisations need to become more client-oriented and demand-driven; this can be greatly facilitated if clients are organised and their demands are properly articulated. Innovation involves new products, processes or changes to existing products or processes. The speed with which firms and clients adopt new technology and information, and which largely determines its final impact, depends on its relevance and the constraints of the marketplace (e.g. availability of inputs, access to credit, markets, etc.). Participatory group approaches have become common in
most rural development initiatives. These groups can be self-initiated ('self-help' groups), or initiated with support from government services, AR&D projects, NGOs, commodity-based farmers' groups or producers' associations. Considerable onfarm research and adaptation involving farmers and farmers' groups is often required before an innovation becomes fully relevant and can be easily adopted.
Innovation governance starts with building a vision and strategy for innovation. This high-level strategy will determine the
305
position of the various actors in a value chain, the competitive thrusts that innovation would enable, and its objectives and approach to the creation of new technology, practices and its sustainability. These should concretely answer the "why?", "where?" or "what?" and "how much?" Innovation governance is also concerned with the development of innovationenhancing capabilities, not just hard skills but softer ones as well. In addition, it deals with the organisation of the classic tasks linked with execution. These, in turn, should explicitly answer the "how?", "with whom?" and "who?" questions.
REFERENCES
Adekunle, A. A., Ellis-Jones, J., Ajibefun, I., Nyi.kal, R. A., Bangali, S., Fatunbi, 0. and Ange, A. 2012. Agricultural Innovation in sub
Saharan Africa: Experiences from Multi
stakeholder approaches. Forum for Agricultural Research in Africa (fAl{A), Accra, Ghana.
Albert, B. 1999. The internationalisation of R&D by multinational enterprises: the formulation of some "new" trends. Management Report No. 39-1999.
Rotterdam: Erasmus Universiteit Rotterdam.
Anderson, J. R. and Feder, G. 2003. Rural
extension services. Research Working Paper 2976, Agriculture and Rural Development Department. Washinr;ton DC: World Bank.
Beije, P. 1998. Technological change in the
modern economy. Cheltenham: Edward Elgar Publishing Limited.
Chambers, R., Pacey, A. and Thrupp, L. A. 1989. Famzer First: Farmer innovation and
agricultural research. London: Intermediate Technology Publications.
Clark, N. 2002. Innovation systems, institutional change and the new knowledge market Implications for third world agricultural development. Economics of
Ukaejiofo, 2013
Innauabon and New Teclmologtj, 1(4-5): 353-
368.
Cohen, J. and Levinthal, D. A. 1990.
Absorptive capacity: A new perspective on
learning and innovation. Administrative
Science Quarterly, 35(1): 554-571.
Dosi, G., Nelson, R. R. and Winter, S. G.
2000. Introduction: The nature and dynamics of
organizational capabilities. In The nature and
dynamics of organizational capabilities, ed.
G. Dosi, R.R. Nelson, and S.G. Winter. New
York: Oxford University Press.
Fraunhofer ISI Discussion papers. 2003. New
Governance for Innovation: The need for
Horizontal and systemic Policy Co-ordination.
Innovation System and Policy Analysis.
Karisruhe No 2/2003.
Gassmann, 0. and Von Zedtwitz, M. 1999.
New concepts and trends in international R&D organization. Research Policy, 28: 231-50.
Gijsbers, G. W. 2009. Agricultural Innovation
in Asia: Drivers, Paradigms and performance.
ERIM PhD Series in Research and
Management.
Rotterdam.
Erasmus University,
Hartwich, F. and Baptista, R. 2007.
Innovation systems in Bolivia. IFPRI
Discussion paper. 00732.
Institute of Governance (2006). Governance
basics: What is good governance?
<www.iog.cajboardgovernancejhtmlj
gov _ whagoo.html> accessed September 9,
2012.
Johnson, A. 2001. Functions in innovation
system approaches. In: Proceedings DRUID's
Nelson-Winter Conference. Danish Research
Unit for Industrial Dynamics, Denmark.
Juma, C. 2011. The New Harvest: Agricultural
Innauations in Africa. Oxford. New York pp
51-8�t "� . 0 �, .._ . ,.� , ... �
;'i �\ .� ( J\(,Rlt/�ET c}
I ' - �r - 1
306
Kaplinsky, 1� and Morris, M. 2002. A
handbook for value chain research. Ottawa:
IDRC.
Klerkx, L., Hall, A. and Leeuwis, C. 2009.
"Strengthening agricultural innovation
capacity: are innovation brokers the
answer?" Int. f. Agricultural Resources,
Governance and Ecologtj, 8: 409 - 438.
Lawson, B. and Samson, D. 2001. Developing
Innovation Capability in organisations: A
dynamic capabilities approach. International
Journal of Innovation management, 5(3): 377-
400.
Leydesdorff, L. 2005. The triple helix model
and the study of knowledge-based
innovation systems. Int. Joumal of
Contemporary Sociologtj 42 (1), 2005, 12-27.
Malerba, F. 2002. Sectoral systems of
innovation and production. Research Policy,
31: 247-264.
Markides, C. 1997. Strategic innovation. Sloan
Management Review, Spring, 9-23.
OECD. 1981. The measurement of scientific and
technical activities- Frascati manual 1980".
Paris:OECD.
Powell, W. and Grodal, S. 2005. Networks of
innovators. The Oxford Handbook of
Innovation. Edited by J. Fagerberg, D.
Mowery, and R. R. Nelson: 56-85. Oxford:
Oxford University Press.
Pray, C. and Fuglie, K. 0. 2002. Private
investment in agricultural research and
international technologtj transfer in Asia. Bogor,
Indonesia: International Potato Center,
Rutgers University, and Economic Research
Service.
Roseboom, J. 1999. Technological innovation
in agriculture: the contribution of
agricultural input industries. The Hague:
ISNAR.
Agricultural Innovation Networks
Ruben, R., Slingerland, M. and Nijhoff, H
2006. Agro1ood chains and networks for
development: Issues, approaches and strategies.
Wageningen: Frontis.
Ruigrok, W. and van Tulder, R. 1995. The
logic of international restructuring. London
and New York: Routledge.
Smits, R. and Kuhlman, S. 2004. The rise of
systemic instruments in innovation policy.
International Journal of Foresight and Innovation
PoliClj, 1(2-3): 4-32.
Teece, D. ]. 1992. Competition, cooperation,
and innovation: Organizational
arrangements for regimes of rapid
technological progress. Journal of Economic
Behaviour and Organization, 18: 1-25.
Teece, D. ]. and Pisano, G. 1994. The
dynamic capability of firms: Ail introduction. Industrial and Corporate Change,
3(3): 537-556.
307
Uzuegbunam, C. 0. 2001. Analysis of linkage
between agricultural development programmes and universities in Southeastern Nigeria. PhD
Thesis. Department of Agricultural
Extension, University of Nigeria, Nsukka,
Nigeria, p. 20-50.
Von Hippel, E. 1994. The sources of
innovation. Oxford: Oxford University
Press.
Williamson, 0. E. 1985. The economic
institutions of capitalism firms, markets,
relational contracting. New York: Free Press.
World Bank. 2006. Enhancing agricultural
innovation: H(TW to go beyond the strengthening of research systems. World Bank, Washington,
D.C.

),
I
l