Eddies and variability in the Mozambique Channel
17
Deep-Sea Research II 50 (2003) 1987–2003 Eddies and variability in the Mozambique Channel Mathijs W. Schouten a, *, Wilhelmus P.M. de Ruijter a , Peter Jan van Leeuwen a , Herman Ridderinkhof b a Institute of Marine and Atmospheric Research, Utrecht University, P.O. Box 80.005, 3508 TA Utrecht, Netherlands b Netherlands Institute for Sea Research, P.O. Box 59, Den Burg, Netherlands Accepted 6 January 2003 Abstract Between 1995 and 2000, on average 4 eddies per year are observed from satellite altimetry to propagate southward through the Mozambique Channel, into the upstream Agulhas region. Further south, these eddies have been found to control the timing and frequency of Agulhas ring shedding. Within the Mozambique Channel, anomalous SSH amplitudes rise to 30 cm; in agreement with in situ measured velocities. Comparison of an observed velocity section with GCM model results shows that the Mozambique Channel eddies in these models are too surface intensified. Also, the number of eddies formed in the models is in disagreement with our observational analysis. Moored current meter measurements observing the passage of three eddies in 2000 are extended to a 5-year time series by referencing the anomalous surface currents estimated from altimeter data to a synoptic LADCP velocity measurement. The results show intermittent eddy passage at the mooring location. A statistical analysis of SSH observations in different parts of the Mozambique Channel shows a southward decrease of the dominant frequency of the variability, going from 7 per year in the extension of the South Equatorial Current north of Madagascar to 4 per year south of Madagascar. The observations suggest that frequency reduction is related to the Rossby waves coming in from the east. r 2003 Elsevier Science Ltd. All rights reserved. 1. Introduction For some time, there have been doubts about the nature of the flow through the Mozambique Channel. Several sketches of the circulation give different flow patterns: Harris (1972) found the Channel to be dominated by three large antic- yclonic eddies and attributed observed variability in the Agulhas water characteristics to the non- stationarity of these features. Sætre and Da Silva (1984) described the circulation in the channel by giving two different flow patterns for the winter and summer seasons, both characterized by several eddies. The discrepancies between their findings and those of Harris (1972), all based on non- synoptic hydrographic observations, seems to have resulted from strong time dependence of the circulation. Extensive hydrographic observations enabled Donguy and Piton (1991) to describe a large anticyclonic circulation filling most of the *Corresponding author. Now at College of Oceanic and Atmospheric Science, Oregon State University, 104 Ocean Admin Building, Corvallis, OR 97331, USA. 0967-0645/03/$-see front matter r 2003 Elsevier Science Ltd. All rights reserved. doi:10.1016/S0967-0645(03)00042-0
-
Upload
independent -
Category
Documents
-
view
3 -
download
0
Transcript of Eddies and variability in the Mozambique Channel

Deep-Sea Research II 50 (2003) 1987–2003
Eddies and variability in the Mozambique Channel
Mathijs W. Schoutena,*, Wilhelmus P.M. de Ruijtera,Peter Jan van Leeuwena, Herman Ridderinkhofb
a Institute of Marine and Atmospheric Research, Utrecht University, P.O. Box 80.005, 3508 TA Utrecht, NetherlandsbNetherlands Institute for Sea Research, P.O. Box 59, Den Burg, Netherlands
Accepted 6 January 2003
Abstract
Between 1995 and 2000, on average 4 eddies per year are observed from satellite altimetry to propagate southward
through the Mozambique Channel, into the upstream Agulhas region. Further south, these eddies have been found to
control the timing and frequency of Agulhas ring shedding.
Within the Mozambique Channel, anomalous SSH amplitudes rise to 30 cm; in agreement with in situ measured
velocities. Comparison of an observed velocity section with GCM model results shows that the Mozambique Channel
eddies in these models are too surface intensified. Also, the number of eddies formed in the models is in disagreement
with our observational analysis.
Moored current meter measurements observing the passage of three eddies in 2000 are extended to a 5-year time
series by referencing the anomalous surface currents estimated from altimeter data to a synoptic LADCP velocity
measurement. The results show intermittent eddy passage at the mooring location.
A statistical analysis of SSH observations in different parts of the Mozambique Channel shows a southward decrease
of the dominant frequency of the variability, going from 7 per year in the extension of the South Equatorial Current
north of Madagascar to 4 per year south of Madagascar. The observations suggest that frequency reduction is related to
the Rossby waves coming in from the east.
r 2003 Elsevier Science Ltd. All rights reserved.
1. Introduction
For some time, there have been doubts about
the nature of the flow through the Mozambique
Channel. Several sketches of the circulation give
different flow patterns: Harris (1972) found the
Channel to be dominated by three large antic-
yclonic eddies and attributed observed variability
in the Agulhas water characteristics to the non-
stationarity of these features. Sætre and Da Silva
(1984) described the circulation in the channel by
giving two different flow patterns for the winter
and summer seasons, both characterized by several
eddies. The discrepancies between their findings
and those of Harris (1972), all based on non-
synoptic hydrographic observations, seems to have
resulted from strong time dependence of the
circulation. Extensive hydrographic observations
enabled Donguy and Piton (1991) to describe a
large anticyclonic circulation filling most of the
*Corresponding author. Now at College of Oceanic and
Atmospheric Science, Oregon State University, 104 Ocean
Admin Building, Corvallis, OR 97331, USA.
0967-0645/03/$ - see front matter r 2003 Elsevier Science Ltd. All rights reserved.
doi:10.1016/S0967-0645(03)00042-0

Northern part of the Channel (north of the
narrowest part around 17�S). The surface flow in
the Mozambique Channel also has been estimated
from surface drift observations (Sætre, 1985;
Lutjeharms et al., 2000). They also find strong
variability, and show a mean circulation with a
southward Mozambique Current along the con-
tinental slope, and a northward flow in the eastern
part of the Channel. This is in agreement with an
average over many eddies at different latitudes in
the Channel. Gr .undlingh (1995) analyzed TO-
PEX/Poseidon altimeter data for the presence of
propagating eddies around South Africa. He
found numerous anticyclonic eddies to propagate
westward from the South Indian Ocean into the
Agulhas region, but these could not be followed
once they reach the western boundary regime.
Several cyclonic eddies from the southern tip of
Madagascar and from farther south were seen
to become attached to the offshore side of
the Agulhas. Gr .undlingh (1995) found one cyclo-
nic eddy to propagate southward through the
Mozambique Channel.
Propagation of anticyclonic eddies through the
channel was simulated in a numerical model of the
ocean circulation around Southern Africa by
Biastoch and Krauss (1999). In their model, eddies
are formed by barotropic instability of the South
Equatorial Current north of Madagascar, and
propagate southward along the coast. Their
modeled eddies are strongly surface intensified.
The existence and southward propagation of the
Mozambique Channel Eddies into the Agulhas
source region was confirmed from altimetric data
(Biastoch and Krauss, 1999; Schouten et al.,
2002b). On reaching the southern Agulhas, they
were shown to control the timing and frequency of
Agulhas ring shedding into the Atlantic by two
mechanisms. First, Schouten et al. (2002b) showed
that the eddies may trigger the onset of a Natal
Pulse, a large cyclonic meander in the Agulhas
(Lutjeharms and van Ballegooyen, 1988a, b). The
Natal pulses were shown to precede the shedding
of Agulhas Rings by about 180 days (Van
Leeuwen et al., 2000). Second, the migration of
Mozambique Channel Eddies into the Agulhas
Retroflection region may lead to an early occlu-
sion of the retroflection loop (Schouten et al.,
2002b). Such an occlusion is associated with the
shedding of Agulhas Rings (Ou and De Ruijter,
1986; Lutjeharms and van Ballegooyen, 1988a, b).
In 2000 and 2001, two hydrographic cruises
took place in the Mozambique Channel, during
the Agulhas Current Sources Experiment (ACSEX
(De Ruijter et al., 2000)). This project was aimed
at the determination of the sources of the Agulhas
Current, both from the north (the Mozambique
Channel) and the east (from east of Madagascar).
The nature of the flow in the Mozambique
Channel was investigated qualitatively in terms
of water mass characteristics, quantitatively in
terms of transports of these water masses, and
dynamically in terms of flow pattern character-
istics at the surface and at depth. The dominance
of anticyclonic eddies was confirmed by using a
combination of in situ CTD and lowered ADCP
observations, buoyant drifter tracks and satellite
altimetry (De Ruijter et al., 2002). Also, negative
anomalies in the altimetric anomalous SSH fields
were found to be most likely artifacts of the data
handling: the frequent passage of positive anoma-
lies through the Mozambique Channel leaves a
signal in the mean SSH field, leading to a negative
anomaly when no anticyclone is present. Vessel-
mounted ADCP current measurements and XBT
lines (measuring the upper 400 m temperatures)
through the locations of negative SSH anomalies
showed no sign of cyclonic dynamic features (De
Ruijter et al., 2002). A few cyclones have been
observed farther south (Gr .undlingh, 1995), but
these do not seem to originate from the northern
Mozambique Channel. Based on in situ observa-
tions during the third ACSEX cruise cyclones
(paired with anticyclones) have been shown to be
generated at the southern tip of Madagascar where
the extension of the East Madagascar Current
forms lee eddies when separating from the
continental slope of the island.
A schematic picture of the circulation in the
Mozambique Channel region is shown in Fig. 1.
The total westward transport in the region of the
South Equatorial Current (SEC), concentrated
between 10�S and 20�S; is about 50 Sv (Schott
and McCreary Jr., 2001). This flow bifurcates
around 17�S; and flows northward in the Northeast
Madagascar Current ðB30 SvÞ; and southward
M.W. Schouten et al. / Deep-Sea Research II 50 (2003) 1987–20031988

as the Southeast Madagascar Current ðB20 SvÞ
(Swallow et al., 1988; Schott and McCreary Jr.,
2001). The extension of the SEC northwest of
Madagascar reaches the African coast around
11�S; where it again bifurcates into the northward
East African Coastal Current (EACC) and a
southward flow into the northern Mozambique
Channel. In April 2000, a hydrographic section at
12�S near the African coast yielded a southward
transport in this current of about 30 Sv (De
Ruijter et al., 2002) of water similar to that found
in the EACC. It is unlikely that this strong
southward flow is a permanent feature, but
its strength shows that the time-varying part of
the circulation may have a strong impact on the
large-scale transports. Within the Mozambique
Channel, the circulation is dominated by large
anticyclonic eddies. An average of four of these
eddies per year passing southward through the
channel leads to an estimate of about 15 Sv
southward transport through the channel (De
Ruijter et al., 2002). In April 2000, no evidence
was found for the existence of a western boundary
current along the continental slope (the Mozam-
bique Current, MC), but there may be an extra
southward transport associated with this (possibly
meandering; Donguy and Piton, 1991) current,
consistent with the general southward flow
through the channel (DiMarco et al., 2002). The
seasonal cycle found in several numerical models
(Biastoch et al., 1999; Matano et al., 2001) shows a
minimum in southward transport during April.
These simulated seasonal fluctuations in the
regional model of Biastoch et al. (1999) and the
-6000 m
-5000
-4000
-3000
-2000
-1000
0
SEC
35˚ 40˚ 45˚ 50˚ 55˚
-30˚
-25˚
-20˚
-15˚
-10˚
-5˚
EACC
SEC
NEMC
SEMC
AC
MCE
MCE
MC
Fig. 1. Bathymetry of the region around Madagascar and the Mozambique Channel. Also, the main currents and flow features are
schematically shown. Features shown are the South Equatorial Current (SEC), the Northeast and Southeast Madagascar Currents
(NEMS and SEMC), the East African Coastal Current (EACC), the Agulhas Current (AC), Mozambique Channel Eddies (MCE) and
the Mozambique Current (MC). The latter has been drawn by a dotted line, as its existence and nature are unclear. The same holds for
the connection between the SEMC and the AC, which is possibly formed by eddies formed near the southern tip of Madagascar.
M.W. Schouten et al. / Deep-Sea Research II 50 (2003) 1987–2003 1989

global Parallel Ocean Climate Model studied by
Matano et al. (2001) (20 and 12 Sv; respectively)are large compared to the annual mean flow (0 and
12 Sv). In these two models, the seasonal fluctua-
tions in the transport are separated from the eddy
occurrence: the seasonal signal is found to be a
narrow boundary current along the western
boundary, and the frequency of eddy formation
remains constant throughout the year. In the
observations presented in Section 2 of this paper,
we also find no seasonal effect on the formation of
the eddies, although the process is rather irregular.
It is therefore likely that such a seasonal signal, if
realistic, is found in the Mozambique Current,
rather than in a modulation of the rate of
Mozambique Channel eddy generation. Year long
current measurements obtained recently across the
narrow section of the Mozambique Channel do
not support the existence of a seasonal signal
(Ridderinkhof and De Ruijter, 2003).
Recently, a connection between equatorial wind
variability and eddy formation in the Mozambique
Channel was found (Schouten et al., 2002b). The
analysis showed that Rossby waves seem to carry
variability originating in the equatorial region
across the subtropical gyre, and that the rate of
eddy formation within the Mozambique Channel
of about 4 per year may be related to this remote
forcing. Two spatial bands of variability were
found near the 4 per year frequency. We analyzed
6 years of gridded ERS/TOPEX/Poseidon SSH
data provided by the CLS Physical Oceanography
Division, France (http://www-aviso.cnes.fr). The
variability in the 4 per year frequency band may be
compared to that in the semi-annual frequency
band (Fig. 2). Up till now, only semi-annual and
annual signals have often been shown to propagate
through the subtropical gyre (P!erigaud and
Delecluse, 1992; Morrow and Birol, 1998). Fig.
2b clearly shows that the 4 per year variability has
a significant amplitude in the Mozambique Chan-
nel, and also in the region east of Madagascar. The
northern region between 15�S and 10�S is sig-
nificantly weakened at the Mascarene Ridge
(situated just east of the region plotted). East of
this ridge, the 4 per year annual signal has an
amplitude of 3–5 cm (not shown). This signal,
though weakened, seems to propagate through the
passage in the Ridge around 13�S (Schouten et al.,
2002b). The southern region between 30�S and
20�S shows strong intensification near Madagas-
car, with amplitudes over 10 cm and relatively
small spatial scales.
In this paper, we investigate the formation and
propagation of eddies in the Mozambique Chan-
nel from satellite altimeter observations combined
with in situ observations from the ACSEX
programme. First, we explore the SSH observa-
tions of the 6 years between 1995 and 2001, to
obtain some basic statistics on the number of
40˚E 60˚E
30˚S
20˚S
10˚S
40˚E 60˚E
30˚S
20˚S
10˚S
2 3 4 5 6 9 12 15 (cm)
4 / year
(a) (b)
2 / year
Fig. 2. Variability of 6 years of combined ERS/TOPEX/Poseidon altimeter data in the (a) semi-annual and (b) 4 per year frequency
band.
M.W. Schouten et al. / Deep-Sea Research II 50 (2003) 1987–20031990

eddies, their dimensions and propagation charac-
teristics (Section 2). Here, we also use the altimeter
data to enlarge the timeseries obtained by a
moored current meter in the narrow part of the
Mozambique Channel, where the passage of eddies
into the central part of the channel can be
observed from the in situ current observations
(Ridderinkhof and De Ruijter, 2003). We then
explore the dominant frequencies of the variability
in the Mozambique Channel, and then the possible
interaction between Rossby waves from the east,
the island of Madagascar, and its possible effects
on the propagation and merging of anomalies
from the north.
2. Observations of the Mozambique Channel eddies
In 6 years of combined TOPEX/Poseidon and
ERS1/2 altimeter data, eddies in the Mozambique
Channel have been tracked by manually following
the positive SSH anomalies through the Mozam-
bique Channel. Between 1995 and 2000, 4 eddies
per year (on average) were found to propagate
from the central Mozambique Channel ð15�SÞ
towards the Agulhas retroflection region (35�S;Fig. 3). Sixteen eddies make it all the way into the
retroflection region at 35�S (Fig. 4). The eddy
paths are rather uniform, and follow the African
coastal bathymetry. North of the narrows of the
30˚E 40˚E 50˚E
30˚S
20˚S
10˚S
0
0.1
0.2
0.3
0.4
0.5
0.6
24˚S20˚S16˚S12˚S
Mean SSH anomaly (m)
(a) (b)
Fig. 3. (a) Paths of 25 Mozambique eddies that were altimetrically tracked between 1995 and 2000. (b) Mean SSH expression of the
Mozambique eddies along their way south. The vertical bars show one standard deviation over the observed 25 eddies.
35˚S
30˚S
25˚S
20˚S
15˚S
10˚S
1996 1997 1998 1999 2000
30
20
10
(cm)
Fig. 4. Time/latitude plot of the 25 eddies observed in the Mozambique Channel over the period 1995–2000. The gray scales denote the
maximum SSH anomaly in the center of the eddy (in m). Clearly, this anomaly increases once the eddy has passed the narrow section of
the channel. It is not clear whether the anomalies in the north are already eddies, but in the Mozambique Channel it was shown (from
surface drifters and in situ observations) that they are (De Ruijter et al., 2002).
M.W. Schouten et al. / Deep-Sea Research II 50 (2003) 1987–2003 1991

channel tracking is often problematic due to
interfering anomalies with periods of 50–60 days.
Also, smaller features may merge into larger
ones, especially in the central part of the channel
between 17�S and 20�S: The 0:25� resolution of
the gridded dataset does not reflect the resolution
that can be achieved by the present altimeter
configuration of Topex/Poseidon and ERS. The
scales that are well resolved are larger than
this 25 km resolution, and closer to several
hundred kilometers (Greenslade et al., 1997),
especially in our case of (sometimes relatively
fast) moving anomalies. The spatial scale of
the eddies we are tracking is around 300 km:Consequently, keeping in mind the problems
that may arise due to interpolation procedures,
it is possible to follow eddies from consecu-
tive snapshots, as has been done here for the
Mozambique Channel. Similar studies have
been successfully applying Geosat and TOPEX/
Poseidon altimetry to investigate rings shed by
the North Brazil Current (Didden and Schott,
1993; Fratantoni et al., 1995; Goni, 2001) and
Agulhas Rings in the southeastern Atlantic (Byrne
et al., 1995; Schouten et al., 2000). The sizes
of these eddies are comparable to those in the
Mozambique Channel. Our collection of Mozam-
bique eddy observations enables us to give some
statistics about the mean SSH anomalies of the
eddies, their size and propagation characteristics.
It should be kept in mind, however, that the
anomalous SSH deviations we call ‘maxima’ were
obtained after an interpolation, which leads to
smoothing and thereby always smaller than the
real extrema. They may be considered a lower
bound.
The mean maximum SSH anomaly in the center
of the eddies is plotted in Fig. 3b as a function of
latitude. The eddies appear to strengthen between
12�S and 20�S from 15 to 35 cm: Between 20�S
and 30�S; they fluctuate around this 35 cm SSH
anomaly. Part of the apparent strengthening
between 12�S and 20�S could be accounted for
by the latitudinal displacement of the eddy
through the planetary vorticity gradient. Moving
from 12�S to 20�S; this effect would increase the
SSH anomaly of an eddy with constant rotational
velocity by 60%. This is less than observed (3b).
Moreover, half of this increase should take place
between 12�S and 15�S where the potential
vorticity gradient is strongest. The observed
increase in SSH expression is moderate over this
range, and is strongest between 15�S and 20�S:Here, we observe almost a doubling of the
anomalous SSH values, whereas the effect of the
change in the Coriolis parameter can only account
for a 30% increase. The diameters of the eddies are
very constant, ranging between 300 and 350 km:The southward propagation speed of the 25 eddies
under examination was about 6 km=day between
12�S and 27�S in the Mozambique Channel, with
the exception of the region between 18�S and 21�S;where on average the southward propagation was
only 3–4 km=day (Fig. 4). Between 27�S and 35�S;the eddies seem to feel the advection by the
background inflow into the northern Agulhas, as
they speed up to 8–10 km=day:
2.1. Vertical structure of the Mozambique Channel
eddies
In April 2000, three Mozambique eddies were
hydrographically sampled during the first Agulhas
Current Sources Experiment campaign (ACSEX I;
De Ruijter et al., 2002). Lowered ADCP current
measurements for one eddy at 17�S; in the
narrowest part of the Channel (Fig. 5) show that
the eddy has a strongly barotropic component
with speeds over 10 cm=s reaching to the bottom
around 2000 m depth. The SSH anomaly that was
associated with this eddy was almost 20 cm;determined by satellite altimetry.
State-of-the-art numerical ocean models have
met limited success in realistically reproducing the
Mozambique Eddies. In the Parallel Ocean Cli-
mate Model (POCM) (Semtner and Chervin,
1992), eddies are very regularly shed in the
Mozambique Channel. They are strongly surface
intensified, with meridional velocities up to
50 cm=s in the upper layers, but with velocities
above 5 cm=s only in the upper 1000 m (Fig. 6).
The underrepresentation of the barotropic com-
ponent in modeled eddies as compared to in situ
observations has similarly been observed for the
eddies of the North Brazil Current (Fratantoni
et al., 1995).
M.W. Schouten et al. / Deep-Sea Research II 50 (2003) 1987–20031992

Also, the rate of eddy formation is larger in the
model than it seems to be in reality: for 12 modeled
years between 1986 and 1998, 74 eddies were
identified in the channel. This comes down to a
periodicity of once every 60 days, comparable to
50 days found in the model of Biastoch and
Krauss (1999) and in observations in the South
Equatorial Current (Quadfasel and Swallow,
1986). The eddies in the regional model from
Biastoch and Krauss (1999) are also concentrated
mainly in the upper 400 m; and are formed by
barotropic instability of the South Equatorial
Current north of Madagascar (Biastoch and
Krauss, 1999). Also, earlier studies have attributed
the 55 days periodicity found in this region to
barotropic instability (Quadfasel and Swallow,
1986; Schott et al., 1988). Recently, Warren et al.
(2002) suggested an alternative mechanism for the
generation of this signal. They found the Mascar-
ene Basin (east of Madagascar) to exhibit a
barotropic eigenmode at almost that period. The
difference between the models and observations
presented here is in the number of anomalies
that enter the Mozambique Channel and travel
southward towards the Agulhas retroflection.
Also, in both models the barotropic component
of the Mozambique Eddies is much weaker than
observed.
2.2. Current variability across the narrow section of
the Channel
The passage of four eddies through the narrow
part of the Mozambique Channel was documented
by an array of moored current meters deployed
and recovered during the Agulhas Current Sources
EXperiment (ACSEX) I and III campaigns in 2000
and 2001, respectively (De Ruijter et al., 2000;
Ridderinkhof and De Ruijter, 2003). We have used
data from one of the moorings to verify the
altimeter data. The altimeter data were then used
to extend the current meter time series to a longer
period, and investigate interannual changes. As
the present day geoid models cannot resolve the
mean state of the ocean at mesoscale resolution,
we cannot derive the mean sea surface from the
altimetric measurements. Therefore, only the sur-
face current anomalies can be inferred from
anomalous SSH gradients.
The geostrophic approximation was used to
compute the anomalous surface currents from
the combined ERS/Topex/Poseidon SSH fields.
These flow anomalies, interpolated to the time of
0
0
0-2000
-1000
50 100 150 200 250 300 350
17 S
-30
-20
40
10
(km)
(m)
-10
30
50-50
00
0
Fig. 5. Velocity section through an eddy taken in April 2000 in
the Mozambique Channel near 17�S: Shown are the meridional
velocities (cm/s) observed using a Lowered Acoustic Doppler
Current Profiler (LADCP). Positive values denote northward
flow (from De Ruijter et al., 2002). Station locations are
indicated by black bars on top of the figure.
36˚E 37˚E 38˚E 39˚E 40˚E 41˚E 42˚E 43˚E 44˚E-3000
-2500
-2000
-1500
-1000
-500
-10
-30-50
15
35
50
0
0
-10
-5
0
0
0
0
20
10
5
(m)
Fig. 6. Velocity section through an eddy in the POCMmodel in
the Mozambique Channel at 19�S: Shown are the meridional
velocities (cm/s). Positive values denote northward flow. This
simulated eddy has a much weaker barotropic structure than
those observed.
M.W. Schouten et al. / Deep-Sea Research II 50 (2003) 1987–2003 1993

the ACSEX I cruise, were subtracted from the
total velocity as determined from the LADCP
measurements during the cruise (averaged over the
upper 200 m; see Fig. 5). The resulting ‘back-
ground’ flow was then added to the anomalous
flow velocity timeseries obtained from altimetry.
The sum of these is an approximation of the ‘total’
surface flow at the location of the CTD/LADCP
station.
To check the validity of this method, we have
used the, independent, current measurements from
a moored current meter. This was done for one of
the moorings in the western part of the narrow
section of the Mozambique Channel (Fig. 7).
Although the amplitudes are distinctly different,
the flow directions in general agree very well. The
correlation between the flow as measured by the
mooring and by the altimeter (under geostrophic
assumption) is high: 0.83 and 0.79 for the zonal
and meridional velocities. The amplitude of the
flow at the moored current meter is lower than that
of the combined altimetry/LADCP observations,
because the latter is a measure of the surface flow
and the current meter measurements were taken at
a depth of at least 250 m: Usually, the current
meter was measuring even deeper than 250 m; asthe flow pushes the moored current meter down-
ward, especially during the eddy passages when
strong currents occur. As velocities decrease with
depth (see Fig. 5), this leads to a systematic
underestimation of the current speed. The current
speeds measured by the current meter are about
one-quarter of those at the surface, which is in
agreement with the strong intensification of
the velocity towards the surface that is shown in
Fig. 5.
Apparently, the altimeter estimates combined
with the background flow determined from the
LADCP observations represent the surface flow
reasonably well. This makes it possible to extend
our analysis period from the 1 year of the moored
current meter array, to several years when the
combination of TOPEX/Poseidon and ERS1/2
satellite altimeters has been operational. We do
not attempt to estimate the currents for the period
before 1996, as the Topex/Poseidon measurements
by themselves have too little spatial resolution to
adequately resolve the eddies in this region (there
is only one ascending, and one descending track
crossing the narrowest section of the channel, and
the mooring location is in the middle of a
diamond-shaped region between tracks). The
resulting longer timeseries obtained from the
altimeter data, is shown in Fig. 8.
These altimetry data show that the number of
anticyclonic eddies passing through the narrow
part of the Mozambique Channel is irregular over
the years: from 5 in 1997, 1999 and 2000, down to
: 20 cm/s
: 50 cm/s
Moored current meter AC06at 250 m
Altimeter + LoweredADCP, surface current
40˚ 45˚ 50˚-20˚
-15˚
-10˚
AC06
Jan 2001June 2000 Oct 2000April 2000
Fig. 7. Current measurements from mooring AC06 (upper line, see left panel for the location of the mooring) compared to the result of
the LADCP-referenced geostrophic currents measured by altimetry (lower line). There is good qualitative agreement between the two:
the passage of anticyclonic vortices (of which the western half passes by the mooring) is evident from the clockwise rotation of the
velocity vectors. Although the surface intensification is considerable, the eddies have a notable barotropic component.
M.W. Schouten et al. / Deep-Sea Research II 50 (2003) 1987–20031994

only two in 1998. Extended periods without eddies
also appeared in the first halves of 1998 and 1996,
but also these periods show velocity fluctuations at
a frequency of 5 per year.
3. Southward reduction of the dominant frequency
of variability
The main source of variability in the region
north of Madagascar is probably the barotropic
instability of the South Equatorial Current, which
has a dominant period of 55 days (Schott et al.,
1988; Quadfasel and Swallow, 1986). At this point
it is unclear why this strong signal is not
propagating at that frequency of about 7 per year
through the narrows of the channel: in the former
section, we have shown that the frequency of the
passage of anomalies through the narrows is close
to 5 cycles per year. To explore this further, we
have computed the average SSH spectrum, by
averaging the spectra of all individual points where
SSH is observed by altimetry, in three regions in
the Mozambique Channel. The three regions and
their average SSH spectra are shown in Fig. 9.
The northern region clearly shows a peak in the
spectrum at the 55 days period, consistent with the
earlier observations (Quadfasel and Swallow,
1986; Schott et al., 1988). However, going south-
ward through the Channel, the dominant, eddy
period increases. The southern part of the Channel
is dominated by 4 per year variability. The SSH
variability in the central part of the Channel lies
somewhere in the middle, with a broader peak at
frequencies between 4 and 7 per year. This is
consistent with the 5 eddies or flow pulses per year
that seem to pass through the narrows (Fig. 8). A
possible explanation for the slow change of the
dominant eddy time scale for these three regions is
presented below.
3.1. Variability of the Northern region
We have used altimeter data of a relatively small
region between 40:55�E and 16:5�S (so north of
the narrows of the Mozambique Channel) to focus
Fig. 8. Like the lower panel of Fig. 7, but now extended to
almost 5 years of combined TOPEX/Poseidon and ERS1/2
measurements. Velocity fluctuations at the 5 per year frequency
are dominant, mostly related to passing eddies. During the first
halves of 1996 and 1998, no eddies were formed in this region.
0
0.01
0.02
0.03
0.04
0.05
0.06
10 100 1000
North
Center
South
period (days)
pow
er
Fig. 9. Average SSH spectra over three regions in the
Mozambique Channel. The spectra have been normalized by
their total variance (the interannual signal is about the same for
the three regions).
M.W. Schouten et al. / Deep-Sea Research II 50 (2003) 1987–2003 1995

on the variability of this specific region. A high-
pass filter (a cosine window running mean with a
half-width of 200 days) has been applied to remove
the interannual and annual components. These are
strong in this region (see Fig. 9) and are probably
related to the Indian Ocean Dipole and/or El Nino
events (Webster et al., 1999).
We have applied the multichannel singular
spectrum analysis (MSSA) technique (Plaut and
Vautard, 1994) to extract the oscillatory modes of
variability for this region from the SSH anomaly
fields over the period 1995–2000. This technique is
the extension of the widely used empirical ortho-
gonal functions (EOF) technique, and is more
capable of detecting propagating signals. MSSA is
also known as ‘extended empirical orthogonal
function (EEOF) analysis’, but with MSSA the
number of lagged copies to be included in the data-
matrix is generally an order of magnitude larger.
In EEOF analyses, typically three or four well-
chosen lags are included in the analysis. The
MSSA technique includes a complete timeseries in
the statevector, yielding it spectral properties much
different to EEOF analysis (Venegas, 2001). The
reconstructed components of an MSSA analysis
can be considered strongly band-pass filtered
versions of the data, with the narrowband filter
properties determined from the data themselves.
We use a window-length of 1 year (37 lagged
copies) to ensure the detection of oscillating signals
with periods up to 1 year. The resulting eigenvec-
tors (MSSA-EOFs) describe dominant patterns of
the dataset, but unlike EOFs they may contain
propagating signals. Several MSSA-EOFs with
(almost) equal eigenvalues, and out-of-phase
patterns and time components (MSSA-PCs) may
describe a propagating signal in the data (Plaut
and Vautard, 1994) but one has to be careful in
interpreting these pairs, as Allen and Robertson
(1996) have shown that such pairs may also arise
from red noise. The technique enables one to
separate several processes (at different timescales)
that make up the variability of the dataset, and has
been successfully applied in oceanographic re-
search regarding pacific sea surface temperature
data (Allen and Robertson, 1996) and in SSH
measurements of the North Atlantic Gulf Stream
region (Schmeits and Dijkstra, 2000). A detailed
description of the MSSA technique, its application
and validation of the results can be found in these
papers.
Applying the MSSA technique to the SSH
anomaly fields over the period 1995–2000 in the
region northwest of Madagascar (40–55�E; 16–
5�S) yields a limited number of dominant modes:
The first two MSSA-EOFs describe a semi-
annual cycle along the northern limit of the region.
This semi-annual variability is limited to the
equatorial region. As there is no direct connection
between this semi-annual variability of the equa-
torial band and the variability in the Mozambique
Channel we do not discuss it here. The second and
third pairs of eigenvectors (3–4 and 5–6), however,
seem to describe oceanic signals which are of
relevance to the variability inside the Mozambique
Channel.
The dominant period of the second pair (3–4) is
55 days, a period that has been found to dominate
the variability of the South Equatorial Current
north of Madagascar (Quadfasel and Swallow,
1986). We will refer further to this mode as
the 7 per year mode. The first two EOFs of
this oscillatory mode, describing it almost com-
pletely (Figs. 10a, b), show westward propagating
40˚ 45˚ 50˚
-15˚
-10˚
40˚ 45˚ 50˚(a) (b)
Fig. 10. First two EOFs of the 55 days MSSA mode of the SSH anomalies (a and b) for the region shown. Positive (negative) values
are indicated by solid (dotted) contours. The spectrum of the timeseries associated with these EOFs is plotted in Fig. 12.
M.W. Schouten et al. / Deep-Sea Research II 50 (2003) 1987–20031996

wave-like features in SSH with a length scale of
400 km west of the northern tip of Madagascar,
where the South Equatorial Current separates
from the island and flows westward as a free jet.
The amplitude of these first two EOFs is fully
concentrated in the region between Madagascar
and the African continent, north of the Comores
Islands at 12�S: As they have very little amplitude
east of Madagascar, this 55 days mode most likely
describes a regional phenomenon, related to the
barotropic instability of the free jet (Schott et al.,
1988; Biastoch and Krauss, 1999).
The third pair of MSSA modes that form an
oscillatory signal in the Northern region of the
Mozambique Channel contains variability of long-
er period. Its spectrum is dominated by frequencies
centered around 5 per year (see Fig. 12 for a
comparison of the spectra of the 5 and 7 per year
mode). Fig. 11 shows the two dominant EOFs of
this 5 per year mode. They show propagating
anomalies entering the Mozambique Channel
through the narrows, consistent with the extended
current meter record of Fig. 7.
A secondary maximum in the variability of
the 7 per year mode is found near the entrance
of the central Mozambique Channel (Fig. 13).
This is also the region where the 5 per year mode
has its maximum amplitude. The two modes are
thus not completely separated, and cannot be
considered fully apart from each other. A possible
reason for this secondary maximum is that
anomalies in the SEC extension cause anomalous
transport close to the African coast, which might
not be captured by the altimeter measurements.
Two years of continuous current meter measure-
ments at the mooring section along 17�S show
indications of this 7 per year variability added to
the dominant 5 per year signal of variability
(Ridderinkhof and De Ruijter, 2003). The pattern
of variability of the 5 per year mode also suggests a
connection between anomalies east and west of
Madagascar.
3.2. Variability of the Central region
The 5 per year frequency present in the
dominant MSSA modes of the northern region is
also the frequency with which anomalies were
observed to pass through the mooring array at
17�S (Fig. 8). It is therefore likely that this is also
the frequency at which the anomalies are passing
through the central part of the Channel.
Unlike the region further north, the central
part of the Mozambique Channel shows rather
regular variability. The main process causing the
variability here is the passage of eddies from North
to South. As this process is well captured by
the first two EOFs of the high-pass filtered data,
40˚ 45˚ 50˚
-15˚
-10˚
40˚ 45˚ 50˚(a) (b)
Fig. 11. First two EOFs of the reconstructed MSSA mode with a dominant frequency of 5 per year (a and b). The spectrum of the
timeseries associated with these EOFs plotted in Fig. 12.
0.00
0.01
0.02
0.03
0 2 4 6 8 10 12 14 16 18frequency (cycles per year)
Fig. 12. Frequency spectra of the principal components of the 7
per year eddy mode (solid line) and the 5 per year mode (dotted
line) in the northern region of the Mozambique Channel (see
Fig. 13 for the region).
M.W. Schouten et al. / Deep-Sea Research II 50 (2003) 1987–2003 1997
there is no need to apply the MSSA analysis,
which was needed in the north to separate the two
dominant modes of variability that make the
variability there more complicated than it is in
the central region.
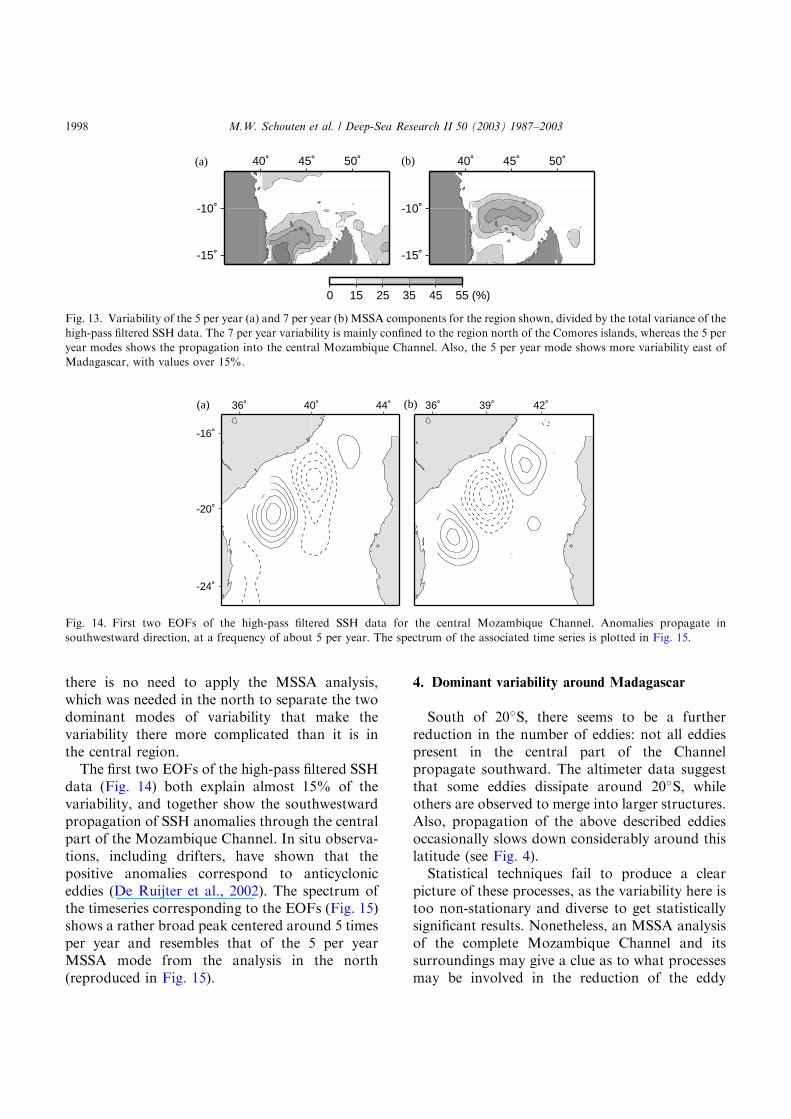
The first two EOFs of the high-pass filtered SSH
data (Fig. 14) both explain almost 15% of the
variability, and together show the southwestward
propagation of SSH anomalies through the central
part of the Mozambique Channel. In situ observa-
tions, including drifters, have shown that the
positive anomalies correspond to anticyclonic
eddies (De Ruijter et al., 2002). The spectrum of
the timeseries corresponding to the EOFs (Fig. 15)
shows a rather broad peak centered around 5 times
per year and resembles that of the 5 per year
MSSA mode from the analysis in the north
(reproduced in Fig. 15).
4. Dominant variability around Madagascar
South of 20�S; there seems to be a further
reduction in the number of eddies: not all eddies
present in the central part of the Channel
propagate southward. The altimeter data suggest
that some eddies dissipate around 20�S; while
others are observed to merge into larger structures.
Also, propagation of the above described eddies
occasionally slows down considerably around this
latitude (see Fig. 4).
Statistical techniques fail to produce a clear
picture of these processes, as the variability here is
too non-stationary and diverse to get statistically
significant results. Nonetheless, an MSSA analysis
of the complete Mozambique Channel and its
surroundings may give a clue as to what processes
may be involved in the reduction of the eddy
40˚ 45˚ 50˚
-15˚
-10˚
40˚ 45˚ 50˚
-15˚
-10˚
0 15 25 35 45 55 (%)
(a) (b)
Fig. 13. Variability of the 5 per year (a) and 7 per year (b) MSSA components for the region shown, divided by the total variance of the
high-pass filtered SSH data. The 7 per year variability is mainly confined to the region north of the Comores islands, whereas the 5 per
year modes shows the propagation into the central Mozambique Channel. Also, the 5 per year mode shows more variability east of
Madagascar, with values over 15%.
36˚ 40˚ 44˚
-24˚
-20˚
-16˚
36˚ 39˚ 42˚(a) (b)
Fig. 14. First two EOFs of the high-pass filtered SSH data for the central Mozambique Channel. Anomalies propagate in
southwestward direction, at a frequency of about 5 per year. The spectrum of the associated time series is plotted in Fig. 15.
M.W. Schouten et al. / Deep-Sea Research II 50 (2003) 1987–20031998

frequency along the channel. The first couple
of MSSA modes (1–2) show the eddy propagation
in the central part of the channel (Fig. 16). South
of Madagascar this mode shows enhanced varia-
bility. The second couple of MSSA modes with
frequencies around 4 per year (5–6) (Fig. 17)
shows the 4 per year variability that is dominant
in a band across the southern Indian Ocean
around 25�S (see Fig. 2 and Birol and Morrow,
2001; Schouten et al., 2002a) reaching Madagas-
car. South of Madagascar, this mode shows
formation and (south) westward propagation of
anomalies. Within the Mozambique Channel, it
shows large meridionally elongated structures
that propagate westward over the full meridional
extent of the Channel. The incoming Rossby
waves from the east, along the southern band
of variability, and maybe also from the northern
band of variability around 12�S (Schouten et al.,
2002a and Figs. 2 and 13), seem to connect to
these elongated anomalies inside the Mozambique
Channel. If and how these elongated structures
play a role in the reduction of the number of
anomalies from the initial 7 per year in the
very north to 4 per year in the south remains
unclear.
The meridionally elongated anomalies are also
observable in the original data: Fig. 18 shows a
sequence of SSH anomalies in the Mozambique
Channel region for February and March 1996. A
meridionally elongated anomaly (with anomalous
SSH values of over 10 cm) has left the coast of
Madagascar in February. A month later (right
panel), it has merged with the eddy at ð39�E; 20�SÞresulting in a strengthening of the eddy in the
central Mozambique Channel. This might (partly)
explain the rather weak correspondence between
the occurrence of anomalies in the central Mo-
zambique Channel, and that of the anomalies in
the north. It also may be an example of a process
of reduction of the number of anomalies and the
associated merging and synchronization of the
signals propagating from the north and east
(Schouten et al., 2002b).
35˚ 40˚ 45˚ 50˚
-30˚
-25˚
-20˚
-15˚
35˚ 40˚ 45˚ 50˚
-30˚
-25˚
-20˚
-15˚
Fig. 16. Two EOFs (together representing over 80% of the variance of the MSSA reconstructed component) of the first MSSA mode
of 6 years of SSH data, with a frequency around 4 per year. Most of the eddy propagation signal through the central Mozambique
Channel (see Fig. 14) is contained in this mode, as well as westward propagation of anomalies south of Madagascar.
0.00
0.01
0.02
0.03
0.04
0 2 4 6 8 10 12 14 16 18
Fig. 15. The spectrum of the principal components shown in
Fig. 14 (solid line), together with the spectrum of the 5 per year
MSSA mode of the northern region shown in Fig. 11 (dotted
line).
M.W. Schouten et al. / Deep-Sea Research II 50 (2003) 1987–2003 1999

5. Summary and discussion
A compilation of 6 years of altimeter data
analyzed for the existence and propagation of
anticyclonic eddies in the Mozambique Channel
shows that about 4 of these eddies per year
propagate southward through the channel. The
average SSH anomaly associated with these eddies
increases from 20 cm in the northern part of the
Channel, to 35 cm in the central and southern
regions. This increase is more than can be
accounted for by the gradient of the potential
vorticity field.
The vertical structure of an in situ observed
Mozambique Channel eddy has been compared to
that of an eddy in the POCM model. The model
seems to generate eddies with realistic horizontal
scales and surface velocity, although the number
of eddies generated is too high, and the eddies are
too strongly surface intensified. Both this surface
35˚ 40˚ 45˚ 50˚
-30˚
-25˚
-20˚
-15˚
35˚ 40˚ 45˚ 50˚
-30˚
-25˚
-20˚
-15˚
Fig. 17. Like Fig. 16, but now for the second MSSA mode with frequencies around 4 per year (mode 5/6). Here the incoming
anomalies from the east (between 20�S and 27�S) can be observed. The southern part of the propagation of the Mozambique eddies,
south of roughly 22�S; is captured by this mode. Also, meridionally elongated features are observed in the Mozambique Channel
propagating westward from the coast of Madagascar.
0.1
0.1
0.1
0.2
40˚ 50˚-30˚
-20˚
-10˚
-0.2
-0.1
-0.1
-0.1
-0.1
0.1
0.10.1
0.1
0.20.3
0.4
40˚ 50˚
-0.2
-0.1
-0.1
Fig. 18. Anomalous SSH elevations for February and March 1996 (contours are 0:1 m apart, the 0 m contour has been left out). In
February (left panel), a meridionally elongated anticyclonic feature is initiated from the west coast of Madagascar. A month later (right
panel), the eddy already present in the channel, and the elongated anomaly, have merged into a stronger Mozambique Channel eddy.
M.W. Schouten et al. / Deep-Sea Research II 50 (2003) 1987–20032000

intensification and unrealistic frequency are likely
simulated by the model of (Biastoch and Krauss,
1999).
Moored current meter observations in the
narrow section of the channel near 17�S show
the passage of three eddies. This timeseries agrees
well with an estimate of the surface velocities from
a combination of altimeter-derived anomalies
velocity and a LADCP-derived background flow.
Using this technique, we extended the timeseries to
5 years, showing intermittency in the passage of
eddies through this region.
An attempt has been made to describe the
variability in several regions around Madagascar,
and to explain the observed reduction of the
number of anomalies found in the north (7 per
year) to about 4 in the south.
Northwest of Madagascar, the instability of the
extension of South Equatorial Current (Schott
et al., 1988) seems to result in large westward
propagating anomalies of the SSH, most likely
associated with meandering of the current. This 7
per year signal seems not to dominate the
variability that propagates southward through
the Mozambique Channel. About 5 strong anoma-
lies per year do enter the Channel from the north.
Once within the Mozambique Channel, their
frequency is further reduced, while the eddies
become more energetic. Even less eddies leave the
Mozambique Channel southward and propagate
into the Agulhas Current region. South of
Madagascar, in situ observations have shown eddy
pairs to be generated. These propagate south-
westward while interacting in a complicated
fashion with the Mozambique Channel eddies.
A factor determining the transmission of Ross-
by waves ‘through’ an island, is in the integral
constraint on the islands’ streamfunction. The
demand of pressure continuity around the island
gives that only one streamfunction value can exist
at the island. An incoming Rossby wave pattern
should fit within this boundary condition on the
island. As a result, a wave emanates from on the
western side of the island (Pedlosky, 2000).
The direct correspondence with theoretical
studies (Pedlosky and Spall, 1999; Pedlosky,
2000) may be non-trivial, as we are dealing with
a dispersive wave field impinging on the island,
and not with a beta plane. However, the 4 per year
forcing by Rossby waves from the east seems to
result in the formation of elongated westward
propagating anomalies over the full meridional
extent of the Mozambique Channel. The asso-
ciated 4 per year fluctuation in the total southward
flow through the channel may form the large-scale
modulation that controls the reduced number of
eddies that enter the Mozambique Channel. In the
north, the link between the SEC anomalies and
the formation of eddies may be dependent on the
strength of the southward background flow. The
modulated southward advection of the anomalies
(conserving potential vorticity) may result in eddy
formation around 16�S (Ridderinkhof and De
Ruijter, 2003). This may explain the high number
of eddies found in the POCM model: this model
also has a stronger mean and seasonal southward
flow (other than that formed by eddy propagation)
than is observed in the observations.
Further study of observations, combined with
theoretical analysis and supported by numerical
simulations is necessary to unravel the complex
interactions between Rossby waves and eddies in
this complex region around Madagascar and the
Mozambique Channel.
Acknowledgements
We thank Robin Tokmakian (Naval Postgrad-
uate School, Monterey (CA)) for making the
POCM data available to the community. Ricardo
Matano and Emilio Beier (Oregon State Univer-
sity, Corvallis (OR)) are thanked for their help in
evaluating these data. We also thank the two
anonymous reviewers for their constructive com-
ments. The work of MWS is supported by the
Netherlands Organisation for Scientific Research
(NWO) under the National Research Program II
contract 013001237-10.
References
Allen, M.R., Robertson, A.W., 1996. Distinguishing modulated
oscillations from coloured noise in multivariate datasets.
Climate Dynamics 12, 775–784.
M.W. Schouten et al. / Deep-Sea Research II 50 (2003) 1987–2003 2001

Biastoch, A., Krauss, W., 1999. The role of mesoscale eddies in
the source regions of the Agulhas Current. Journal of
Physical Oceanography 29, 2303–2317.
Biastoch, A., Reason, C.J.C., Lutjeharms, J.R.E., Boebel, O.,
1999. The importance of flow in the Mozambique Channel
to seasonality in the greater Agulhas Current system.
Geophysical Research Letters 26, 3321–3324.
Birol, F., Morrow, R., 2001. Sources of the baroclinic waves in
the southeast Indian Ocean. Journal of Geophysical
Research 103, 9145–9160.
Byrne, D.A., Gordon, A.L., Haxby, W.F., 1995. Agulhas
eddies: a synoptic view using Geosat ERM data. Journal of
Physical Oceanography 25, 902–917.
De Ruijter, W.P.M., Lutjeharms, J.R.E., Ridderinkhof, H.,
2000. Observations of the Mozambique Current in ACSEX,
the Agulhas Current sources experiment. International
WOCE Newsletter 38, 32–34.
De Ruijter, W.P.M., Ridderinkhof, H., Lutjeharms, J.R.E.,
Schouten, M.W., Veth, C., 2002. Observations of the flow in
the Mozambique Channel. Geophysical Research Letters
29, 1401–1403.
Didden, N., Schott, F., 1993. Eddies in the North Brasil
Current observed by Geosat altimetry. Journal of Geophy-
sical Research 98, 20,121–20,131.
DiMarco, S.F., Chapman, P., Nowlin, W.D., Hacker, P.,
Donohue, K., Luther, M.E., Johnson, G.C., Toole, J.M.,
2002. Volume transport and property distributions of the
mozambique channel. Deep Sea Research II 49, 1481–1511.
Donguy, J.R., Piton, B., 1991. The Mozambique Channel
revisited. Oceanology Acta 14, 549–558.
Fratantoni, D.M., Johns, W.E., Townsend, T.L., 1995. Rings
of the North Brazil Current: their structure and behavior
inferred from observations and a numerical simulation.
Journal of Geophysical Research 100, 10633–10654.
Goni, G.J., 2001. A census of North Brasil Current rings
observed from TOPEX/Poseidon altimetry: 1992–1998.
Geophysical Research Letters 28, 1–4.
Greenslade, D.J.M., Chelton, D.B., Schlax, M.G., 1997. The
midlatitude resolution capability of sea level fields con-
structed from single and multiple satellite altimeter datasets.
Journal of Atmospheric and Oceanic Technology 14,
849–870.
Gr .undlingh, M.L., 1995. Tracking eddies in the southeast
Atlantic and southwest Indian Oceans with TOPEX/
Poseidon. Journal of Geophysical Research 100,
24,977–24,986.
Harris, T.F.W., 1972. Sources of the Agulhas Current in the
spring of 1964. Deep Sea Research 19, 633–650.
Lutjeharms, J.R.E., van Ballegooyen, R.C., 1988a. Anomalous
upstream retroflection in the Agulhas Current. Science 240,
1770–1772.
Lutjeharms, J.R.E., van Ballegooyen, R.C., 1988b. The retro-
flection of the Agulhas Current. Journal of Physical
Oceanography 18, 1570–1583.
Lutjeharms, J.R.E., Wedepohl, P.M., Meeuwis, J.M., 2000. On
the surface drift of the East Madagascar and Mozambique
Currents. South African Journal of Science 96, 141–147.
Matano, R.P., Beier, E.J., Strub, P.T., Tokmakian, R.,
2001. Large-scale forcing of Agulhas variability: the
seasonal cycle. Journal of Physical Oceanography 31,
1228–1241.
Morrow, R., Birol, F., 1998. Variability in the southeast
Indian Ocean from altimetry: forcing mechanisms for the
Leeuwin Current. Journal of Geophysical Research 103,
18,529–18,544.
Ou, H.W., De Ruijter, W.P.M., 1986. Separation of an inertial
boundary current from a curved coastline. Journal of
Physical Oceanography 16, 280–289.
Pedlosky, J., 2000. The transmission of Rossby waves through
basin barriers. Journal of Physical Oceanography 30,
495–511.
Pedlosky, J., Spall, M., 1999. Rossby normal modes in
basins with barriers. Journal of Physical Oceanography
29, 2332–2349.
P!erigaud, C., Delecluse, P., 1992. Annual sea level variations in
the southern tropical Indian Ocean from Geosat and
shallow-water simulations. Journal of Geophysical
Research 97, 20,169–20,178.
Plaut, G., Vautard, R., 1994. Spells of low-frequency oscilla-
tions and weather regimes in the Northern Hemisphere.
Journal of Atmospheric Science 51, 210–236.
Quadfasel, D.R., Swallow, J.C., 1986. Evidence for 50-
day period planetary waves in the South Equatorial
current of the Indian Ocean. Deep Sea Research 33,
1307–1312.
Ridderinkhof, H., De Ruijter, W.P.M., 2003. Moored current
observations in the Mozambique Channel. Deep Sea
Research II, this issue.
Sætre, R., 1985. Surface currents in the Mozambique Channel.
Deep Sea Research 32, 1457–1467.
Sætre, R., Da Silva, J., 1984. The circulation of the
Mozambique Channel. Deep Sea Research 31, 508–585.
Schmeits, M.J., Dijkstra, H.A., 2000. On the physics of the
9-month variability in the Gulf Stream region: combining
data and dynamical systems analyses. Journal of Physical
Oceanography 30, 1967–1987.
Schott, F.A., McCreary Jr., J.P., 2001. The monsoon
circulation of the Indian Ocean. Progress in Oceanography
51, 1–123.
Schott, F., Fieux, M., Kindle, J., Swallow, J., Zantopp, R.,
1988. The boundary currents east to Madagascar 2. Direct
measurements and model comparisons. Journal of Geophy-
sical Research 93, 4963–4974.
Schouten, M.W., De Ruijter, W.P.M., van Leeuwen, P.J.,
Lutjeharms, J.R.E., 2000. Translation, decay and splitting
of Agulhas rings in the south-east Atlantic ocean. Journal of
Geophysical Research 105, 21,913–21,925.
Schouten, M.W., De Ruijter, W.P.M., Van Leeuwen, P.J.,
Dijkstra, H., 2002a. A teleconnection between the equator-
ial and southern Indian Ocean. Geophysical Research
Letters 107, 10.1029/2001GL014542.
Schouten, M.W., De Ruijter, W.P.M., Van Leeuwen, P.J.,
2002b. Upstream control of the Agulhas ring shedding.
Journal of Geophysical Research 10.1029/2001JC000804.
M.W. Schouten et al. / Deep-Sea Research II 50 (2003) 1987–20032002

Semtner, A.J., Chervin, R.M., 1992. Ocean general circulation
from a global eddy-resolving model. Journal of Geophysical
Research 97, 5493–5550.
Swallow, J., Fieux, M., Schott, F., 1988. The boundary currents
east of Madagascar 1. Geostrophic currents and transports.
Journal of Geophysical Research 93, 4951–4962.
Van Leeuwen, P.J., De Ruijter, W.P.M., Lutjeharms, J.R.E.,
2000. Natal pulses and the formation of Agulhas rings.
Journal of Geophysical Research 105, 6425–6436.
Venegas, S.A., 2001. Statistical methods for signal detection in
climate. Technical Report, Danish Center for Earth System
Science, DCESS Report No. 2.
Warren, B.A., Whitworth III, T., LaCasce, J.H., 2002. Forced
resonant undulation in the deep Mascarene Basin. Deep Sea
Research II 49, 1513–1526.
Webster, P.J., Moore, A.M., Loschnigg, J.P., Leben, R.R.,
1999. Coupled ocean-atmosphere dynamics in the Indian
Ocean during 1997–98. Nature 401, 356–360.
M.W. Schouten et al. / Deep-Sea Research II 50 (2003) 1987–2003 2003