ED 041 105 AVAILABLE FROM EDRS PRICE DOCUMENT ... - ERIC
248
ED 041 105 TITLE INSTITUTION SPONS AGENCY PUB DATE NOTE AVAILABLE FROM EDRS PRICE DESCRIPTORS DOCUMENT RESUME VT 010 177 Psychological Assessment of Patrolman Qualifications in Relation to Field Performance; The Identification of Predictors for Overall Performance of Patrolmen and the Relation between Predictors and Specific Patterns 'of Exceptional and Marginal Performance. Chicago Police Dept., Ill. Department of Justice, Washington, D.C. Office of Law Enforcement Assistance. 5 Nov 68 250p. Superintendent of Documents, U.S. Government Printing Office, Washington, D.C. 20402 (J1.2:P27/2, $2.00) EDRS Price MF-$1.00 HC Not Available from EDRS. *Behavioral Science Research, *Behavior Patterns, *Law Enforcement, *Performance Criteria, *Personnel Selection ABSTRACT Behavioral scientists have been slow in the development of effective procedures and in empirical validation of psychological testing instruments for selecting law enforcement personnel. This study involved 253 supervisory sergeants and field lieutenants and 2,327 uniformed patrolmen of the Chicago Police Department (CPD) . Three major performance measures were tenure, a paired-comparison performance rating which stressed field performance, and the CPD semiannual performance rating which stressed administrative as well as field performance, An occupational test battery, which stressed behavioral requirements of the patrolman's job, provided motivational, intellectual, and behavioral measures. The test battery was administered twice, with a 5-month interval, to allow for validation analysis. Patrolmen who scored high on the tests were rated high on performance. The degree of this relationship increased when the subgroup of white patrolmen was treated separately and increased even more significantly when the Negro subgroup was treated separately. It was concluded that ideal attributes of patrolmen are all related to stability (1) in parental and personal family life, (2) in self-confidence and emotional behavior, (3) in maintaining cooperative attitudes, and (4) in developing a realistic orientation toward life. (CH)
-
Upload
khangminh22 -
Category
Documents
-
view
0 -
download
0
Transcript of ED 041 105 AVAILABLE FROM EDRS PRICE DOCUMENT ... - ERIC

ED 041 105
TITLE
INSTITUTIONSPONS AGENCY
PUB DATENOTEAVAILABLE FROM
EDRS PRICEDESCRIPTORS
DOCUMENT RESUME
VT 010 177
Psychological Assessment of Patrolman Qualificationsin Relation to Field Performance; The Identificationof Predictors for Overall Performance of Patrolmenand the Relation between Predictors and SpecificPatterns 'of Exceptional and Marginal Performance.Chicago Police Dept., Ill.Department of Justice, Washington, D.C. Office ofLaw Enforcement Assistance.5 Nov 68250p.Superintendent of Documents, U.S. GovernmentPrinting Office, Washington, D.C. 20402 (J1.2:P27/2,$2.00)
EDRS Price MF-$1.00 HC Not Available from EDRS.*Behavioral Science Research, *Behavior Patterns,*Law Enforcement, *Performance Criteria, *PersonnelSelection
ABSTRACTBehavioral scientists have been slow in the
development of effective procedures and in empirical validation ofpsychological testing instruments for selecting law enforcementpersonnel. This study involved 253 supervisory sergeants and fieldlieutenants and 2,327 uniformed patrolmen of the Chicago PoliceDepartment (CPD) . Three major performance measures were tenure, apaired-comparison performance rating which stressed fieldperformance, and the CPD semiannual performance rating which stressedadministrative as well as field performance, An occupational testbattery, which stressed behavioral requirements of the patrolman'sjob, provided motivational, intellectual, and behavioral measures.The test battery was administered twice, with a 5-month interval, toallow for validation analysis. Patrolmen who scored high on the testswere rated high on performance. The degree of this relationshipincreased when the subgroup of white patrolmen was treated separatelyand increased even more significantly when the Negro subgroup wastreated separately. It was concluded that ideal attributes ofpatrolmen are all related to stability (1) in parental and personalfamily life, (2) in self-confidence and emotional behavior, (3) inmaintaining cooperative attitudes, and (4) in developing a realisticorientation toward life. (CH)

come Ass
I ASSOSSI. 401 Of iian OualOWN to DM to AcI@ PCS10 1

,11M1PRAIMMIIRRIMMIIMIPM....,,
November 5, 1968
c) PSYCHOLOGICAL AS OF PATROLMAN QUALIFICATIONSOIN RELATION TO FIELD PERFORMANCE
The Identification of Predictors for Overall Performance ofPatrolmen and the Relation between Predictors and Specific
Patterns of Exceptional and Marginal Performance
Report Submitted to
Office of Law Enforcement AssistanceUnited States Department of Justice
Melany E. Baehr Ph. D. , Project DirectorJohn E. Furcon, Field Director
Ernest C. Froemel, Statistical CoordinatorThe Industrial Relations Center
The University of Chicago
U.S. DEPARTMENT OF HEALTH, EDUCATION& WELFARE
OFFICE OF EDUCATIONTHIS DOCUMENT HAS BEEN REPRODUCEDEXACTLY AS RECEIVED FROM THE PERSON ORORGANIZATION ORIGINATING IT. POINTS OFVIEW OR OPINIONS STATED DO NOT NECES-SARILY REPRESENT OFFICIAL OFFICE OF EDU-CATION POSITION OR POLICY.
This Project Supported by Grant #046Awarded by the Attorney General
Under The Law Enforcement Assistance Act of 1965to
The Chicago Police DepartmentChicago, Illinois
Persons undertaking such projects under Goverment sponsor-ship are encouraged to express freely their professional judg-ments, findings, and conclusions. Therefore, points of viewor opinions stated in this document do not necessarily repre-sent the official position or policy of the U.S. Department of
Justice.
For sale by the Superintendent of Documents, U.S. Government Printing OfficeWashington, D.C. 20402 - Price $2.00

4*
I
4
ACKNOWLEDGEMENTS
The authors would like to express their sincere thanks to Colonel John
C. Bucher, Director of Personnel, Chicago Police Department, and
Richard A, Heffernan, Assistant Director of Personnel, for their unstint-ing support and encouragement during the conduct of this project. The
study was initiated under the auspices of then-Superintendent Orlando W.
Wilson, and the complete cooperation of the Chicago Police Department
has continued to the present with the support of Superintendent James B.
Conlisk, Jr. The professional support and counsel provided by Frances
M. Burns, David R. Saunders, Ph. D. , Burton A. Grossman, Ph. D. ,
and Charles R. Potkay, Ph. D. , is deeply appreciated. Ronald G.
Franczak, Arnold Oppenheim, and Anthony F. Jurkus were particularly
instrumental in the data collection and analysis phases of the study. The
project could not have been completed without the strong secretarial
support provided by Donna C. Tanzer, Michelle A. Gregorich, Linda
C. Thomas,Elaine Marzal, and Mary Ann Chalupa of the Industrial
Relations Center, and Audrey Griggs of the Chicago Police Department.
A special note of thanks to Robert Emrich, Ph. D. , and Louis A. Mayo,
both of the Office of Law Enforcement Assistance, U. S. Department
of Justice, for their suggestions which added greatly to the value of the
project.

TABLE OF CONTENTS
I. INTRODUCTION
Need for This StudyGoals of the Present ResearchMethods and ProceduresReferences
II. ANALYSIS OF PATROLMAN WORKING ENVIRONMENT
Occupational AnalysisSelection of DistrictsAppendix
Page
1
7
III. APPRAISAL OF PATROLMAN PERFORMANCE 21
The Paired-Comparison TechniqueBackground of the Paired-Comparison Rating TechniqueMeasures Deric.ed from the Paired-Comparison MethodImplementation of the Paired-Comparison Rating in the DistrictsSpecific Rating ProceduresCall for Volunteers and Selection of ParticipantsChicago-Police-Department Performance MeasuresDiscussion of Eight Criterion VariablesReferencesAppendix
IV. SELECTION AND DESCRIPTION OF THE PSYCHOLOGICAL TEST 55BATTERIES
Selection of the TestsDescription of the TestsAppendix
V. RESULTS: PERFORMANCE APPRAISAL 8 7
Results of the Paired-Comparison TechniqueResults of the Call for VolunteersResults of Chicago-Police-Department Appraisal Measures

Page
I. VALIDATION OF THE OCCUPATIONAL TEST BATTERIES 97
The Preliminary Multiple-Regression AnalysisThe Principal Multiple-Regression AnalysisIdentification of Test Variables Most Likely to Predict Patrolman
PerformancePrediction of the Paired-Comparison RatingPrediction of the Chicago-Police-Department RatingPrediction of TenureIdentification of the Important Predictor Variables in the StudyPatterns of Test-Variable Scores Likely to Be Most Predictive
of PerformanceSummaryReferences
VII. VALIDATION OF AN OCCUPATIONAL TEST BATTERY FOR ARACIALLY-MIXED GROUP 131
Historical ReviewBlanket DiscriminationDiscrimination against Racial Subgroups and Techniques to
Prevent ItResults for Chicago Police Patrolmen: Multiple-Regression
ValidationsResponse of White and Negro Patrolmen to the Test (Predictor)
VariablesResponse of White and Negro Patrolmen to the Performance
(Criterion) VariablesDifferential Test Validities for White and Negro SubgroupsSummary and ConclusionReferences
VIII. SPECIFIC PATTERNS OF PATROLMAN FIELD PERFORMANCE 187
MethodDiscussionSubgroup 1Subgroup 2Subgroup 3Subgroup 4Subgroup 5Subgroup 6Subgroup 7Subgroup 8ConclusionReferences

0.s
IX. SUMMARY OF RESULTS
Goals of the StudyImplementationSelection of Performance MeasuresSelection of Patrolmen SamplesValidation ResultsIdentification of Patterns of Good and Poor PerformanceImplications for Future Research and Application
Page
223
X. CHICAGO POLICE DEPARTMENT REVIEW OF THE PATROLMANSTUDY 241
History of the ProjectProject AccomplishmentSignificant Benefits to the Chicago Police DepartmentImplementation of the Test BatteryRecommendation for Future Project

CHAPTER I
Introduction
This is an age of unprecedented technological advances, in which machines and
computers are assuming an increasing share in the work of society. Neverthe-
less, it is the human resources of an organization that remain the most crucial
input in the attainment of that organization's goals. This is particularly true oflaw-enforcement agencies, given their goal of maintaining justice and order
among persons in society. Every man who is part of the "thin blue line" of
police is charged with a responsibility so complex and so overwhelming that it
must always be entrusted to men and not to their machines.
NEED FOR THIS STUDY
In view of the importance of the law-enforcement function, and the great author-
ity and responsibility vested in the individual police officer, it is strange that
behavioral scientists have paid relatively little attention to the manner in which
police candidates are selected. Our surprise at the paucity of meaningful re-search in this area is shared by Blum (1964, pp. 101-102), who makes the
following comment about police selection:
If we restrict the scope of our survey of research to studieswhich have been made by trained social scientists using ac-ceptable scientific methods for observation and treatment ofdata, we find that there has been very little such work di-rected to the evaluation of the usefulness of psychologicaltests for the selection of policemen.
The apparent lack of scientifically acceptable studies, i.e. , studies in which
psychological tests or test batteries have been validated for the population on
1

which they will be used, has not deterred police organizations from using tests.
Narrol and Levitt (1963) conducted a mail survey which focused on patrolman
selection methods of 61 U.S. cities with populations greater than 150,000.
Police departments in all these cities were found to use some instrument which
could be called a psychological test. In spite of this extensive utilization, the
authors concluded that "... there is little or no research being done upon police
selection techniques..." and that "not many psychologists are involved either
in research upon, or in the use of, the selection procedures now employed."
The use of psychological tests without appropriate validation research is not
only totally unwarranted but may be dangerously misleading both to the test user
and to the test respondent. Psychologists have long maintained that validation
research is a necessity for insuring the proper application of tests. Recently,
the federal government moved to support this position through a pamphlet en-titled Guidelines on Employment Testing Procedures, issued by the Equal
Employment Opportunity Commission (1966). In the document, the Commission
states that it adopts the Standards for Educational and Psychological Tests and
Manuals, prepared by a joint committee of the American Psychological Associ-
ation, American Educational Research Association, and National Council on
Measurement in Education, and, in essence, makes the validation of tests a
prerequisite for their use in selection decisions. The need for selection testvalidation can no longer be considered a research "luxury"; it is a legal neces-
sity if tests are to be used at all.
GOALS OF THE PRESENT RESEARCH
This brief commentary on the current status of research on police selection
clearly demonstrates the need for additional work. In light of this need and in
cooperation with the Office of Law Enforcement Assistance and the Chicago
Police Department, we planned a comprehensive research study which would
deal with two closely related aspects of staffing and strengthening a police
organization:
Pt
2

`V
1. The development of effective procedures and the establishment of general
standards for the selection of patrolmen.
2. The identification of distinctive "patrolman types," which would exhibit
distinctive performance styles in the field and would not be adequately
described by the concept of the "average" patrolman.
The first aspect of the study involved a comprehensive validation process to
ensure the appropriateness of the chosen tests and their acceptability as tools
in a systematic procedure for selecting patrolmen. The second aspect wls
even more challenging than the first, since it is clear that the concepts of a
"typical" or "average" patrolman, or of an "ideal" patrolman, are oversim-plifications. A variety of psychological styles may be associated with success
or failure, and no single stereotype will sufficiently account for these various
styles. We anticipated that the identification of distinctive patrolman types and
analysis of their psychological composition and pattern of field performance
would provide a rudimentary framework for placement of patrolmen in assign-
ments that would best utilize their skills and behavior patterns.
The study was focused upon a specific population: Chicago Police Department
patrolmen, in the Patrol Division, who had at least one year of service and who
were currently assigned to uniformed street patrol. This group was thought to
be typical of officers employed in large cities throughout the country.
METHODS AND PROCEDURES
The methods and procedures employed in the study, and the specific areas of
results, are briefly outlined below. Each heading refers to a subsequent
chapter.
Chapter II Analysis of Patrolman Working Environment--a description
of the demands of the field patrolman's job, based on field ob-
servation, and a description of the police districts included
in the study.

Chapter III
Chapter IV
Appraisal of Patrolman Performance--a review of the subjective
and objective performance indicators used to characterize
individual on-the-job performance, including a special 'per-
formance appraisal technique, the paired-comparison method.
Selection and Description of the Psychological Test Batteries--
a description of the tests included in the study and of the actual
test administration procedures,
Chapter V Results: Performance Appraisal - -a discussion of the results
of the implementation of the paired-comparison performance
appraisal technique, and the interrelationships of the major
and minor performance data obtained from departmental files.
Chapter VI Validation of the Occu ational Test Batteries--a presentation ofthe results of the multiple-regression analyses for both the pri-
mary and the cross-validations, a selection of the areas and
tests most predictive of performance, and a description ofcurrently employed patrolmen with respect to the predictive
tests.
Chapter VII Validation of an Occupational Test Battery for a Racially-Mixed
Group--a review of the relevant literature, a discussion ofstrategies to preclude inadvertant discrimination, and a pre-
sentation of the test results and validation findings for white
and Negro officers.
Chapter VIII Specific Patterns of Patrolman Field Performance - -a presenta-
tion of the results of the analysis which identified meaningful
performance subgroups within the patrolman population which
had been assessed.
4

Chapter IX Summary of Results--a complete review of the goals, methods,
and objectives achieved, with implications for future research.
Chapter X Chicago Police Department Review--evaluative comments by
Chicago Police Department personnel.
Anyone wishing to read a brief and fairly non-technical review of the highlights
of this study should see Chapter IX, the summary.
The Industrial Relations Center of The University of Chicago has been active for
almost two decades in manpower-development research and training projects.
Although the bulk of the Center's applied research and training has been in indus-
trial organizations and, to a lesser extent, in hospitals and scientific establish-
ments, the past five years have brought an increasing demand for consultation
and cooperation in projects in government institutions. The present cooperative
research project between the Chicago Police Department and the Industrial
Relations Center is a case in point. It has demonstrated, once again, the large
areas of common organizational concern shared by such diverse institutional
groups as those cited above. More specifically, it illustrates the frequentinterchangeability among these organizations of research techniques and training
procedures of use in the selection, placement, and utilization of their manpower
resources.
This broadly based and far-ranging research project has produced definitive
results in many areas, such as the evaluation of departmental procedures for
rating patrolman performance, the validation of techniques for predicting patrol-
man performance and tenure, the identification of specific patterns of perform-
ance, and the techniques which should be applied to make fair and equitable
selections from among different racial groups. However, caution must be ob-
served in the application of these results. They are specific to the ChicagoPolice Department. Although they can probably be generalized to other large,
urban police departments, their application in any other police department
should be preceded by local validations.
5

-
This research project was largely exploratory. Its greatest contributions are
seen, first, as opening new areas of research and, second, as delineating some
of the procedures and identifying some of the techniques and measures most
likely to be fruitful in future selection-and-placement validation studies. With
regard to the latter, much of the initial exploration, analysis, and fact-finding,
which was necessarily a part of the current project, can probably be greatly
reduced in local validation studies.
As is often the case with exploratory research in a relatively new domain, more
research objectives, both practical and theoretical, suggested themselves than
could feasibly be included within the scope of this report. One of these--the
selection of candidates from different racial groups--was not a part of the
original research proposal but is included here because of its obvious bearing
on the results. Others, including refinements in the delineation of the pa",terns
of patrolman performance and an analysis and consolidation of the many pre-
dictor variables by factorial methods, are under way at present and will be
described in subsidiary reports as time and opportunity permit.
We wish to extend our thanks to the Office of Law Enforcement Assistance for
its support, to the Chicago Police Department for its unstinting cooperation,
and to the faculty and staff of the Industrial Relations Center, who have directed
both interest and enthusiasm to the conduct of this project.
REFERENCES
Blum, Richard H. (Ed.) Police selection. Springfield, Illinois: Charles C.Thomas, Publisher, 1964.
Equal Employment Opportunity Commission. Guidelines on employmenttesting procedures. Washington, D.C.: EEOC, August 24, 1966.
Narrol, Harvey G. and Levitt, Eugene E. Formal assessment proceduresin police selection. Psychological Reports, 1963, 12, 691-694.
6

L2
CHAPTER II
an Workinr Environment
OCCUPATIONAL ANALYSIS
The aim of the job-analysis phase of the study was to identify the specific re-
quirements ta1LsD and personal qualifications necessary for successful performanee of the patrolman's job, Rather than attempting to provide an exhaustive
list of the many duties performed by patrolmen in the city of Chicago, our scope
of inquiry was narrowed to two specific ern,phases,
Our first real exposure to the organization showed us that the 7,000 patrolmen
were by no means a homogeneous group. Rather the great heterogeneity of
assignment, ability, and skills which was evident made it mandatory that we
limit our focus and consider a group within this total patrolman population, It
was decided that the police officers of the Patrol Division who were assigned to
boat patrol would exhibit the needed levels of ability and homogeneity of assign-
ment, More importantly, however, the patrol function is an important commondenominator across all police organizations, and concentrating our efforts in
this common area would provide a greater yield of information to other depart-
ments° Thus, our first emphasis was placed upon the activities of the patrol-
man on the street, rather than on the host of technical, administrative, and
specialist functions performed by other uniformed officers in the department.
Our second emphasis in this phase of the study was on the behavioral rather than
the "formal" or "official" requirements of the job. A patrolman "enforces lawand order," but this phrase lacks real behavioral content, In contrast, stating

that a patrolman must "take charge of a situation, e.g. , a crime or accident
scene, yet not unduly alienate participants or bystanders" describes an element
of the job in behavioral terms. Often in the day-to-day activities of the job, the
organizational job description is discarded in favor of what the job incumbent
"must really do." It was our goal to go beyond the formal job description and
capture as well as possible in the time allotted the essential behavioral attributes
contributing to success as a police officer.
Method
The job analysis combined "armchair" and field observation to gain as broad
and complete an exposure to the police organization and the demands of the
police officer's job as time permitted.
Review of published materials and documents provided an important base for a
thorough understanding of the job. Departmental and civil service job descrip-
tions (see Appendix) were studied, as were a number of training bulletins and
professional journals. Case reports and scenarios of cases which resulted in
departmental awards or suspensions were also reviewed. These reviews pro-
vided an entree into the "culture" of the police organization and also supplied
information for the job analysis.
The field observation began with tours of various facilities in the department, and
with meetings and conversations with patrolmen and supervisors at all levels of
the organization. However, the most important part of the field observation
was the time spent out in the districts and on the street in patrol cars. Four
IRC staff members put in many hours on the street observing the patrolmen and
acquiring an understanding of the demands of the job. These staff members
were exposed to high crime rate, average, and low crime rate districts during
all three watches at various times of the week. Being at the district stations
and directly observing policemen in their day-to-day activities when riding with
patrolmen in beat cars and with supervisors in command cars provided real in-
sight into the behavioral requirements of the patrolman's job. This intensive
8

field exposure was obtained in anticipation of the study and during its early
phases, and the experience was available to be utilized in the selection of psy-
chological tests for later application to the patrolman samples. Our field ex-
posure continued throughout the performance evaluation stage in the districts,
since the IRC staff conducting the patrolman appraisal were able to go out on
the street in many of these districts.
ResultsThe results of the job analysis are presented below in the form of a list of be-
havioral requirements. The list is not thought to be all inclusive. Rather it
contains many of the attributes which are crucial to the successful performance
of the patrolman's job.
It is essential that a patrolman:
1. endure long periods of monotony in routine patrol yet react quickly(almost instantaneously) and effectively to problem situations observedon the street or to orders issued by the radio dispatcher (in much thesame way that a combat pilot must react to interception or a targetopportunity).
2. gain knowledge of his patrol area, not only of its physical character-istics but also of its normal routine of events and the usual behaviorpatterns of its residents.
3. exhibit initiative, problem-solving capacity, effective judgment, andimagination in coping with the numerous complex situations he is calledupon to face, e. g. , a family disturbance, a potential suicide, a robberyin progress, an accident, or a disaster. Police officers themselvesclearly recognize this requirement and refer to it as "showing streetsense.
4. make prompt and effective decisions, sometimes in life and death sit-uations, and be able to size up a situation quickly and take appropriateaction.
5. demonstrate mature judgment, as in deciding whether an arrest iswarranted by the circumstances or a warning is sufficient, or in facinga situation where the use of force may be needed.
6. demonstrate critical awareness in discerning signs of out-of-the-ordinaryconditions or circumstances which indicate trouble or a crime in progress.
9

7. exhibit a number of complex psychomotor skills, such as driving avehicle in normal and emergency situations, firing a weapon accuratelyunder extremely varied conditions, maintaining agility, endurance,and strength, and showing facility in self-defense and apprehension, asin taking a person into custody with a minimum of force.
8. adequately perform the communication and record-keeping functions ofthe job, including oral reports, preparation of formal case reports,and completion of departmental and court forms.
9. have the facility to act effectively in extremely divergent interpersonalsituations. A police officer constantly confronts persons who are actingin violation of the law, ranging from curfew violators to felons. He isconstantly confronted by people who are in trouble or who are victims ofcrimes. Besides his dealings with criminals, he has contact with para-criminals, informers, and people on the border of criminal behavior.(He must also be "alley-wise.") At the same time, he must relate tothe people on his beat -- businessmen, residents, school officials, visi-tors, etc. His interpersonal relations must range up and down a con-tinuum defined by friendliness and persuasion on one end and by firmnessand force at the other.
10. endure verbal and physical abuse from citizens and offenders (as whenplacing a person under arrest or facing day-in and day-out race preju-dice) while using only necessary force in the performance of his function.
11 exhibit a professional, self-assured presence and a self-confident mannerin his conduct when dealing with offenders, the public, and the courts.
12. be capable of restoring equilibrium to social groups, e.g. , restoringorder in a family fight, in a disagreement between neighbors, or in aclash between rival youth groups.
13. be skillful in questioning suspected offenders, victims, and witnesses ofcrimes.
14. take charge of situations, e.g., a crime or accident scene, yet not un-duly alienate participants or bystanders.
15. be flexible enough to work under loose supervision in most of his day-to-day patrol activities (either alone or as part of a two-man team) andalso under the direct supervision of superiors in situations where largenumbers of officers are required.
16. tolerate stress in a multitude of forms, such as meeting the violent be-havior of a mob, arousing people in a burning building, coping with thepressures of a high-speed chase or a weapon being fired at him, ordealing with a woman bearing a child.
10
V

17. exhibit personal courage in the face of dangerous situations which mayresult in serious injury or death.
18. maintain objectivity while dealing with a host of "special interest" groups,ranging from relatives of offenders to members of the press.
19. maintain a balanced perspective in the face of constant exposure to theworst side of human nature.
20. exhibit a high level of personal integrity and ethical conduct, e.g. ,refrain from accepting bribes or "favors," provide impartial lawenforcement, etc.
Conclusions and Relationshi of Occu ational Anal sis to Test Battery
The chief aim of the occupational analysis was to achieve insight into the be-
havioral requirements of the patrolman's job so that psychological tests as-
sessing attributes related to these requirements could be included in the test
battery administered to the volunteer sample of patrolmen. The analysis sup-
plied information which differed from that usually provided by a formal job
description (as well as from a listing of desirable traits, such as "judgment,"
"tact, "honesty," etc.). None of the attributes listed above will be a surpriseto anyone who has served as a law-enforcement officer, but they provided a
quite sufficient basis for selecting of tests for inclusion in the study, as outlined
in Chapter IV.
The battery of tests utilized in the study can be classified into the following
framework:
Motivational Measures
Measures of Intellectual Ability
Behavioral Measures
Motivational measures were thought to be of paramount importance in the study,
since these have apparently found little application in police organizations. In
this area, on the assumption that a man's past performance is the best predictor
of his future performance, an assessment of the individual's background and
experience seemed essential to the prediction of success as a patrolman. In
addition, such biographical information could provide data in the complex areas
11

of maturity, ambition, responsibility, etc. Occupational interests and prefer-
ences were recognized as another component of motivation, and were also
slated for assessment.
A number of the aspects of the patrolman's job indicated that certain mental
abilities would be important determinants of success. Reasoning and problem-
solving ability were obviously relevant, although the Civil-Service-Commission
screei,Ing procedure was in part based on an IQ minimum. The ability to com-
prehend verbal communication seemed important for understanding orders and
properly completing administrative forms. Perceptual ability also appeared
promising as a predictor, particularly the abilities to perceive differences and
details, to organize situations, and to maintain independence of perceptual field.
A test in the area of interpersonal skills' was thought to be essential, since a
patrolman spends a great deal of his time dealing with others in problematical
situations. Therefore, a measure of style of dealing with difficult social sit-
uations in a calculated fashion was included in the battery. The items in this
measure seemed to parallel much of the routine street contact of the patrolman.
The only exception would be extreme emergency situations, which are difficult
to generate by means of a test alone.
Because of the many references to personality characteristics in the general job
requirements, a number of behavioral tests were also included. It seemed
important to include descriptive measures of global behavior patterns such as
temperament or needs as well as measures of specific behavioral attributes
such as reactivity and stress tolerance.
It was not our intention to attempt a perfect match between a test instrument and
each behavioral requirement of the job. Even if this were possible, not all
requirements would be equally predictive of successful performance. Using
our knowledge of the demands of the job, we therefore attempted to assemble a
battery of tests which would broadly cover many of the apparent behavioral re-
quirements identified in the occupational analysis. Further discussion of
12

criteria for selection and an actual description of the instruments utilized arereserved for Chapter IV.
SELECTION OF DISTRICTS
A good deal of attention was devoted to the selection of Chicago Police districtsfor inclusion in the study, since our goal was a full representation of the diverseenvironmental elements facing the police officer. A metropolis such as Chicago
is, in a sense, patrolled by 21 small police forces, each operating within a
fixed geographical area with its own distinctive demographic character. Fromthis point of view, segments of a large city police department may be responsi-ble for policing areas which resemble those patrolled by smaller city and sub-
urban departments. On the other hand, densely populated high crime rate
areas are one of the undesirable characteristics of the big city. In any event,
an attempt was made to select a wide variety of districts for the study so that
patrolmen assigned to a cross section of police work would be participating.
The structure and demographic characteristics of all 21 Chicago Police districts
were carefully reviewed in our selection. The definition and demarcation ofthe districts in Chicago is a complex process, based on a number of factors,such as past workload of each block, natural boundaries (rivers, rail lines,
expressways, etc.), special crime problems (arterial streets, public facilities,etc.), and the telephone exchange system within the city (so that calls for police
service from within a given district are automatically connected to the radio
dispatcher in the Communications Center supervising cars in that district).However, for our purposes, we need only describe the selected districts as theyexisted at the time of the study.
The geographical area, population density, crime rate, configuration of beats,and manpower of the 21 districts served as the principal objective demographic
and structural indices. Districts were selected on the basis of these structuralcharacteristics and of the expert opinion of knowledgeable officials in the depart-ment. The districts were also selected to provide a proper representation of
13

Negro officers in the appraisal and testing phases of the study. A description
of the 12 districts selected in terms of the objective indices is presented inTable 1. These districts were thought to reflect the wide spectrum of big citypolice work, i.e. , "fast" districts as well as "slow" districts.
Our aim was to appraise and test patrolmen working in a heterogeneous set of
districts. The population of these districts varied from 141,000 to 234,000, and
the size ranged from 4.31 to 23.58 square miles. The highest crime rate
district in the city was included, as well as some of the "slower" districts. Theconfiguration of beats in the districts was thought to be important. The 2nd
District (Wabash), for example, is characterized by beats of small area. Thissuggests a very high work load. The 5th District (Kensington) has both small
and large area beats, suggesting a variety of work-load conditions. The 8th
District, on the other hand, is characterized by large area beats which suggestsa lower crime rate and large geographical area. (See "Patrol Division Man-
power Distribution" included in the Appendix.)
Six of the districts were scheduled for inclusion in Wave I (the first sample) of
the study, namely, districts 2, 5, 10, 13, 15, and 19, and the remaining sixdistricts (3, 7, 8, 9, 14, and 21) were included in Wave II. It was not possible
at the time of the study to directly quantify the work demand of a particular
district for inclusion in a performance prediction model. Individual ability,
motivation, and skill are only partial determinants of field performance (although
important), and additional factors, such as work load, formal leadershipstructure, and informal group structure, would ideally be entered in an all-inclusive performance prediction equation. Such an analysis was beyond the
scope of the present investigation. A district-by-district analysis of appraisaland test results was not undertaken. Such an analysis may produce additional
significant findings, and is contemplated as a worthwhile future project.
14

CH
APT
ER
IIT
able
1
Chi
cago
Pol
ice
Dis
tric
ts S
elec
ted
for
Incl
usio
n in
the.
Stu
dyin
Ter
ms
of T
heir
. Pri
ncip
al D
emog
raph
ic a
nd S
truc
tura
l Cha
ract
eris
tics
Dis
tric
tPo
pula
tion
of D
istr
ict*
No.
Ran
k/21
Are
a of
Dis
tric
t*
Sq. M
i. R
ank/
21
*T
otal
Ind
ex C
rim
es**
1964
Ran
k/21
196
5 R
ank/
21
Cri
me
per
Cap
ita
Ran
k/21
No.
of
Bea
t s#
No.
of
Swor
nPe
rson
nel#
2W
abas
h15
4,83
114
4.31
1998
731
8438
12
3046
93
Gra
nd C
ross
ing
179,
628
75.
9014
7070
570
993
927
436
5K
ensi
ngto
n-1
73,3
889
20.0
44
4425
1443
9312
1217
231
7E
ngle
woo
d15
4,80
615
6.53
1266
777
6276
58
2740
78
Chi
cago
Law
n23
4 ,3
742
23.5
83
3690
1737
5014
2015
200
9D
eeri
ng17
4,75
88
13.1
66
4596
1338
2913
1320
250
10M
arqu
ette
169,
549
117.
2411
6574
957
538
1024
347
13W
ood
141,
077
165.
1516
6613
858
127
724
307
14Sh
akes
pear
e18
1,29
36
7.75
1042
3816
3535
1616
2022
615
Aus
tin19
6,74
75
11.9
57
4312
1537
0315
1818
214
19T
own
Hal
l20
2,48
44
5.70
1558
0011
4895
1111
2425
421
Prai
rie
128,
135
184.
8717
7000
652
829
618
309
*Sou
rce:
Chi
cago
Pol
ice
Stat
istic
al R
epor
t, 19
65.
**T
he in
dex
crim
es (
mur
der,
rap
e, r
obbe
ry, a
ggra
vate
d as
saul
t, bu
rgla
ry, t
heft
--$5
0 an
d ov
er, a
nd a
uto
thef
t) a
re th
ose
Part
I o
ffen
ses
sele
cted
by
the
F.B
.I. f
or u
se in
mak
ing
com
pari
sons
am
ong
juri
sdic
tions
.#S
ourc
e: C
PD, 1
966.

CHAPTER IIAPPENDIX_LEL"
CITY OF CHICAGO
Civil Service Commission
announces an examination for
Salary Range:
PATROLMANGrade P1 - Original
$7,128 - $9,000 per year
Date of Examination: An examination will beheld semi-monthly untilfurther notice. Applicationswill be accepted through Fridayafternoon for the examinationsto be held on the second andfourth Saturday of each month,starting August 10, 1968
Scope of Examination: Written Examination 100%
Fee: $3.00
1 1 I
Duties: A Patrolman enforces law and maintains order. Pro-tects life and property and assists in the develop-ment of proper community attitudes and behaviorrelated to crime, delinquency, prejudice, and civicresponsibility. Patrols assigned area by foot orvehicle. Investigates accidents, unusual incidents,and law violations which he observes or which arereported to him. Apprehends persons committingcrimes or wanted for investigation concerning lawviolations. Serves warrants, escorts prisoners tocourt and places of detention, and testifies incourt. May direct pedestrian and vehicular traffic.Performs related duties as required.
NOTE: Candidates may take the Patrolman's examination onlyonce within any 3 month period.
#1030 -- 7/24/68 (over)
16

Minimum Qualifications:
Applicants must possess weight and measurements asprescribed in Rule III, Section 9, Commission Rulesand Regulations, reprinted below and must bephysically qualified to meet standards as determinedby the medical and physical examiners appointed bythe Commission, including these standards of vision:. corrected vision in both eyes combined must be 20/20
Weight
. uncorrected vision in20/50
each eye must
Weight
be at least
Height Min. Max. Height Min. Max.517" 145 190 6'1" 165 Z155'8" 145 190 6.12" 170 2255'9" 145 190 613" 175 23o511o" 150 195 614 n 180 2355'11" 155 205 6'5" 185 2356' 16o 210 616" 190 235
Candidates for this examination must be of good moral character and between20 and 31 years of age. They must have reached their 20th birthday by thedate of examination and must not have reached their 31st birthday by dateof examination.
Persons entitled to military preference under Section 10-1-16 of the IllinoisMunicipal Code (those who have served between September 16, 1940 and July 25,1947, or at any time between June 25, 1950 and January 31, 1955, or sinceJanuary 1, 1961, and who were honorably discharged) must not have reachedtheir 35th birthday. Veterans 31 years or over must submit copies ofmilitary discharge papers showing dates of service at the time of applica-tion.
Applicants for the above original entrance examination must, on the date setfor such examination, be citizens of the United States. Applicants mustpossess a valid Illinois Driver's License at the time of certification.Residency requirements for this examination are waived. Successful candi-dates will be expected to take up residence in the City of Chicago within areasonable period after appointment as Patrolman pursuant to the pro-visions of Section 25-30 of the Municipal Code of Chicago.
APPLICATIONS:
In accordance with the provisions of the Civil Service Act, a fee is chargedby the Civil Service Commission for all examinations. Applicants mustpurchase an Examination Fee Stamp in the office of the City Collector,Room 107, City Hall, to be attached to their applications at the time theyare filed. No refund of fees will be made. Commission office hours are8:30-4:30, weekdays; 9:00-12:00 Noon, Saturdays. The Commission reservesthe right in any section of the above examination to impose written, oral,and performance tests and tests of physical qualifications and health.
BY ORDER OF THE COMMISSION:
#1030 -- 7/24/68 JAMES S. OSBORNE, SECRETARY
17

CHAPTER II-- APPENDIX
CODE: 9161Police Service GroupPolice General Duty Series
CLASS TITLE: Patrolman
CHARACTERISTICS OF THE CLASS: Under general supervision, enforcesstate laws and city ordinances, maintains order, prevents crime, makes arrests;and does related work as required.EXAMPLES OF DUTIES: Patrols a specified beat or district on foot, on amotorcycle, or in a radio cruiser; checks doors and windows of business es-tablishments, and investigates any suspicious conditions, activities, or persons;makes arrests for violations of laws and ordinances, escorts prisoners topolice station, has violators booked on charges, escorts prisoners to court.
Watches for and makes investigations of wanted and missing persons and stolenproperty; enforces traffic laws, directs traffic and gives information concerningthe location of streets, routes and buildings; ohecks cars for overtime parking,checks parking meters and investigates and makes detailed reports of trafficaccidents.
Serves warrants, subpoenas, writs and other court orders as directed andescorts bank messengers and payroll clerks; may supervise clerical personnelperforming duties in the police department, perform specialized technical cler-ical duties such as custody of court evidence, preparation of warrants and sum-mons and instruction work on the firing range with recruits; testifies in courtagainst violators.
DESIRABLE QUALIFICATIONS: Training and Experience. Graduation fromhigh school, preferably with special training in police work; or an equivalentcombination of training and experience.
Knowledge, Abilities and Skill. Working knowledge of locations of streets androutes in the City of Chicago; working knowledge of the rights of prisoners andregulations and mechanics of making arrests; working knowledge of departmen-tal rules and regulations.
Ability to observe situations analytically and objectively and to record themclearly and completely; ability to react quickly and calmly in emergencies;ability to express oneself clearly, concisely, orally and in writing; ability tohandle situations firmly, courteously, tactfully and impartially; ability to under-stand and carry out oral and written instructions; ability to develop skill in theuse of firearms and in the operation of motor vehicles; ability to use goodjudgment in evaluating situations and making decisions; ability to perform workinvolving the necessity for good physical condition and strength.
Elementary skill in the application of modern practices and techniques involvingthe investigation: arrest, detention and treatment of prisoners, and in the careand use of appropriate tools, equipment and facilities.
18

CHAPTER 11APPENDIX
CHICAGO POLICE DEPARTMENT
PATROL DIVISION MANPOWER DISTRIBUTION
In 1962, a system was developed whereby Department manpower resources were allocated to thereorganized Patrol Division in sufficient number to provide approximately four hours for preventive patrol toeach unit per tour of duty. The experience factors that were analyzed indicated that the average call forservice required approximately one hour of patrol unit time. Initially, computations were completed for thethird watch (1600 2400 hours), since it had the heaviest workload of the three watches and required themaximum number of beats, This determined the beat basis for the Communications Center console maps.
Manpower needs are based on the three watch totals. There are generally fewer beats on the firstwatch (0000 0800 hours) and the second watch (0800 1600 hours) than there are on the third watch, andsome beats on these two watches are formed by combining third watch beats. The 1st (Central) District isan exception because of the 300,000 people who enter the "Loop" each business day. This district, onweekdays, has a larger number of beats on the second watch. The total number of calls for service duringlast year's winter or summer season are reduced to a daily average. This average is divided by 4 (thenumber of calls which can be serviced by a unit and allow approximately 4 hours for preventive .patrol duringa tour of duty ), and this indicates the total number of beats required by the Patrol Division during a twentyfour hour period.
Semi-annually, beats are evaluated to make adjustments to assure maximum effectiveness of beatcoverage for either the summer or winter seasons. Among the considerations studied areDoes the trend of total calls for service indicate an increased need for units?
Now effectively did the number of units in the previous summer or winter period satisfy the needs?
Does experience indicate that an excessive number of units were in service?
What is the total number of men and vehicles available for patrol? Should these totals beinc, teased or decreased?
As a result of this evaluation, the total number of units authorized for the Patrol Division isdetermined.
Patrol Divisioh motorized beats are distributed throughout the City of Chicago in proportion to theweighted workload for the same season in the preceding year, The following weights are used in thisdetermination:
Part I Crimes 4Part II Crimes 3Other Calls for Service 1
To lay out the basic beat structure for the City, every call for service is coded for IBM 1410electronic computer input as to classification (Part I, Part II, Other Calls for Service), street location, andtime of occurrence. These codings are weighted by the 4-3-1 system enabling the computer to produce alisting of the weighted workload for each of the 15,000 square blocks in the City on the three basic watches,0000-0800 hours, 0800 1600 hours, and 1600 2400 hours.
The police districts are apportioned a percentage of the patrol force by relating their percentage of thecity-wide weighted workload to the total number of units available for the City. To add to the validity of theallocation of units determined by weighted workload factors, consideration is also given to the number of callsreceived by each district. The percentage of the total department calls for service received by each district iscompared to the percentage of the department weighted workload in terms of units needed. If this comparison isnot reasonably similar, computations are reviewed to identify the cause of the variance.
Also considered is the problem of equating beat size and crime conditions. In the peripheral districts,beats are relatively large while in the core area districts where crime conditions are relatively severe, the beatsare quite small. Thus, a patrol unit operating in a very large beat, with the same amount of time available forpreventive patrol, cannot be as effective as a unit operating in a smaller beat. In an attempt to equalize policeservice in large beats, empirical decisions are made authorizing additional patrol units for the peripheral districtswhen such need is clearly indicated. This process determines the number of patrol beats for each of the 21districts.
The weighted workload fin. each district is then divided by the number of beats available for that districtto determine the average weight of each beat. The total number of beats required for each watch are determinedby applying the percentage of the district workload represented by each watch to the total number of beatsavailable for that district. The patrol beats are laid out to equalize the workload and keep the beat as squareas possible while avoiding artificial barriers which would interfere with easy movement throughout the beat.Cover beats are established for the first and second watches so that some vehicles will patrol two beatsduring hours of reduced activity.
19

As an example; A district is authorized 54 patrol beats, 41% of the district workloadoccurred on the third watch, which reflects a need for 22 beats on that watch. 33% of the districtworkload occurred on the second watch, indicating that 18 beats are required on that watch, 26% ofthe district workload occurred on the first watch, requiting 14 beats, When the total number of beatsin service are reduced, each of the eliminated beats are covered by an adjacent beat car.
Since reported crimes do not coincide exactly with our watch change s, consideration ofoverlapping watches or "power shifts" is dictated. In some districts, the heaviest workload actuallyextends beyond the end of the third watch leaving a two and one-half hour period without adequatepatrol, This is overcome in the nine districts wherein this condition is apparent by instituting twopower shifts. In these districts, the power shifts are superimposed upon the three-watch structureand start at 1030 hours and 1830 hours. By starting the power shifts at this later time, the cars donot leave the street until 0230 hours, thus providing heavier beat coverage as needed.
Conferences are held with District Commanders to determine whether any peculiar patrol, needsexist in their districts. In certain districts, it was decided that the power shifts would start at aneven later hour on weekends (Friday and Saturday nights), so as to provide heavier coverage furtherinto the early morning hours. Some districts may require power shifts on Friday and Saturday nightsonly, but not during the week.
The total number of beat units operating on the five watches (3 basic watches and 2 powershifts), are developed from within the total number of units allotted to the district by the PatrolDivision.
To provide uninterruped police service to the public during watch changes, roll calls arescheduled at staggered hours.
There is need for both two-man and one-man patrol car operations in developing the patrolpattern for the entire City. From the operating standpoint, advantages are gabled by placing oneman in each of two squad cars rather than having two men in one car; the size of beats is reduced;the frequency of patrol is increased; and responses to calls for police service are accelerated.
The determination as to which beats will have two-man cars is dependent upon an analysisof types of arrests in the specific area. Special attention is given in this analysis to the number ofincidents in which resistance is offered the police; the number in which there are multiple arrestees;the number in which a deadly weapon is involved; and the geographical factors affecting ready accessby neighboring squad cars to the area.
The computer produces a priority list, considering these factors, showing the two-man beatsin descending order of hazard the most hazardous listed first. These beats are discussed with theDistrict Commanders so that local factors may also be considered before final decisions are maderelative to two-man and one-man cars. After priority of need for two-man patrol beats has beenidentified, two-man cars are allocated to the extent possible consistent with available manpower.
Prepared by the Planning Division, 29 December 1965.
20

CHAPTER III
Appraisal of Patrolman Performance
An appraisal of job performance is difficult to obtain on any job, and partic-ularly difficult to secure in assessing the field performance of police officers.The patrolman very often works alone, and receives a minimum of super-vision from his Sergeant and Field Lieutenant. These supervisors' knowledgeof an officer's field performance derives primarily from their contact withhim as he responds to calls for service, and from their reviews of the fieldcase reports he prepares for his assignments during the watch. Thissupervisory situation is almost the direct opposite of that found in the factoryor office, where the subordinate is usually in close proximity throughout theday, and where the supervisor has ample opportunity to observe and discussthe conduct of the work on the spot. In addition, the scheduling of work daysand assignments for patrolmen and supervisors makes it unlikely that mostmen in the district will be supervised by the same Sergeant for their fiveworking days of the week. However, in spite of these apparent difficulties,we believed that the supervisory rating would constitute the single mostaccurate source of information on an individual's performance. A number of"subjective" and "objective".performance indices were utilized in the study,but the assessment of patrolman performance by the immediate supervisorsin the district was given greatest credence.
21

THE PAIRED-COMPARISON TECHNIQUE
It has been the experience of the Industrial Relations Center that very few
industrial organizations are completely satisfied with their employee
appraisal procedure. Companies generally have welcomed suggestions for
improving their performance review systems. Actually, the Chicago Police
Department has a quite adequate system of performance evaluation. However,
in planning this phase of the study, it was decided to apply an appraisal system
originally developed by the IRC for use in industry. Three reasons supported
this decision:
1. There was a need to determine whether the paired-comparison rating
system, developed for use in non-law-enforcement organizations,
was appropriate for the appraisal of patrolman performance.
2. To insure as accurate a performance evaluation as possible, it
seemed desirable to use an appraisal system which had no
relevance to the administrative functioning of the department.
The results would be used only for purposes of the study, would
not be reviewed by senior officers in the district, and would have
no bearing on promotions or standing on a promotional list.
3. The comparison of the results of the paired-comparison rating
with the semi-annual CPD administrative rating would provide a
check on the validity of the CPD rating procedure, as well as con-
firming or rejecting the appropriateness of the paired-comparison
appraisal system for police use.
BACKGROUND OF THE PAIRED-COMPARISONRATING TECHNIQUE*
The paired-comparison rating system has been used by the IRC in a number of
industrial and governmental organizations. The method has its origins in the
*Much of the material in this and the following sections has been adapted
from Baehr (1963, 1968).
22

classical experiments conducted by Weber and Fechner about a century ago in
the then-new science of psychophysics. Since that time, many psychologists
have contributed in adapting this method to the measurement of "psychological"
or subjective continua, culminating in L. L. Thurstone's formulation of the
laws of comparative judgment. For the specific purpose of appraising job
performance, this method requires that every individual to be assessed be
compared with every other individual, and an explicit judgment made as to
who is the better performer on the job. The number of comparative judgments
that would be required if six individuals were assessed is given in Figure 1.
The rater would choose the individual in each pair who was the better per-
former. However, the judgments would not be presented to the assessing
supervisor serially as indicated in the figure, but rather in a random order.
1 vs. 2 2 vs. 3
1 vs. 3 2 vs. 4
1 vs. 4 2 vs. 5
1 vs. 5 2 vs. 61 vs. 6
3 vs. 4
3 vs. 5
3 vs. 6
4 vs. 54 vs. 6
Total = 6 x 5 judgments2
5 vs. 6
Figure 1. Comparative Judgments Required by the Method of PairedComparisons in Assessing Performance of Six Employees
While the paired-comparison method has been generally recognized as yielding
the most reliable and valid assessments of any of the contemporary appraisal
techniques, it has not been widely used because of the time and effort required
by the rater in handling large numbers of pairs and because of the computa-
tional labor involved in obtaining the scale values. This is especially true
when there are a sizable number of individuals to be assessed, since the numberof comparisons rises as an exponential function [n (n-1)1 of the number of
individuals (n) being assessed. 2
Because of this problem and the problem of obtaining scale values, the
history of the use of the paired-comparison method has consisted largely
23

of successive innovations in the mechanics of administration and scoring. A
device called The Comparator (1961, 1967) has been developed for appraising
the performance of up to 19 individuals. However, the size of the watches
in the Chicago Police districts required the use of more recently designed
computer-based techniques.
The Industrial Relations Center has developed two interconnected computer
programs to implement the paired-comparison rating procedure in larger
groups. The first, called PAIRS, is designed to pair every individual in thegroup being appraised with every other individual in the group. Each pair of
names is printed on a separate IBM card, and the order of the names in the
deck as a whole is randomized. The prepared decks of IBM cards are given
to the raters with instructions to place a check mark in a box adjacent to the
name of the individual in each pair who is doing the better job. The scoring
of the completed IBM deck is done by another computer program called
COMPARE. Surprisingly little computer time is necessary to produce the
scale measures to be discussed shortly, even in large-scale multi-judge
appraisals.
MEASURES DERIVED FROM THE PAIRED-COMPARISON METHOD
Although a variety of measures can be derived from the paired-comparison
method, three were particularly germane to this study:1. The per cent of consistent judgments for each rater.
2. The per cent of agreement between or among raters.
3. The performance index for each patrolman.
The per-cent-consistent-judgment score, which ranges from 0 to 100 per cent,
represents the consistency of judgments made by each individual rater. The
concept of consistency of judgments is illustrated in Figure 2. For example,
if a rater selects patrolman A over patrolman B, and patrolman B over
24

patrolman C, then, to be consistent,
he should also select A over C. If he
selects C over A, this choice isregarded as an inconsistency. For
any set of "n" subjects, there is amaximum possible number of incon-
sistencies. The per cent of incon-
sistent judgments is the number of
inconsistencies actually found ex-
pressed as a percentage of the number
of possible inconsistencies. This percentage is subtracted from 100 per cent
in order to obtain a positively stated "per cent of consistent judgments. "
A
A
.?fe
Figure 2. Consistency ofJudgments
Consistent
Inconsistent
The per cent of agreement between or among raters applies only when two or
more judges have rated the same group of individuals or a common group
of individuals within two otherwise dissimilar groups. The per cent of
agreement is the ratio (expressed as a percentage) of the number of pairs
of similar judgments, to the total number of judgments made concerning the
individuals being rated in common. With two raters, this score ranges from0 to 100 per cent, and 100 per cent always indicates perfect agreement no
matter how many raters are involved. However, the lower limit of the rangevaries according to the number, of raters contributing to the coefficient.
It should be noted that on the basis of the two indices described above, it waspossible to exclude ratings from those raters who were either internally
inconsistent or in marked disagreement with other raters in the district. It
was also possible to exclude those patrolmen on whom the raters most dis-
agreed--usually subjecth who had only recently joined the department or
who were relatively little known to some of the raters. Such exclusions can
increase the validity of the third measure derived from the paired-compari-
son method--the performance index derived from the ratings, which is
described on the next page.
25

The basic inforMation that was needed to calculate the performance index
was the number of times each patrolman in the group was chosen over all
others by the rater. The distribution of each rater's preference wasconverted to a normalized standard score scale by direct calculation on
the computer. Each patrolman therefore received a standard scoreperformance index figure, which in practice varies between a low of 30 and a
high of 70. A more detailed discussion of normalized standard scores is
presented in the Appendix. Where two or more raters evaluated the per-
formance of a patrolman, their standard score ratings were averaged toprovide a single composite performance index.
IMPLEMENTATION OF THE PAIRED-COMPARISON RATINGIN THE DISTRICTS
The paired-comparison performance rating was conducted by members of
the IRC staff in one district at a time in each of the districts included in
Wave I and Wave II. The usual sequence of events began with, a meeting
in the office of the District Commander, at which time the Director of
Personnel and his Assistant provided a general orientation to the study
and introduced the IRC staff members who would be conducting the appraisal.
The Field Director of the study then provided a more specific outline and
discussed in detail the requirements of the performance appraisal phase.
The objective of these meetings was threefold--to acquaint the District
Comma-Eider with the study, elicit his cooperation, and identify qualified
raters within the district.
It was decided to limit the choice of raters to Supervisory Sergeants and
Field Lieutenants who had at least three months tenure in the district and
who were well acquainted with the performance of at least ten patrolmen.
Limiting the raters to the two above mentioned ranks excluded a number of
Sergeants who worked exclusively in administrative capacities, the Captains
who generally functioned as Watch Commanders, and the District Commander
himself. The bulk of the rating responsibility was therefore placed on
26

supervisors most likely to have had ample opportunity to directly observe aman's field performance. The time limit and the minimum number ofpatrolmen the rater had to be acquainted with excluded supervisors who had
not had sufficient opportunity to gain knowledge of the performance of
patrolmen in the district.
During the performance appraisal in the Wave I districts, supervisors were
individually contacted by IRC staff and given a short briefing on the study.
(Private office space in the district station was provided by the District
Commander.) This briefing concentrated upon five points:'1. The study was sponsored by the Office of Law Enforcement Assis-
tance, U. S. Department of Justice.2. The objective was to identify tests which might be useful in selecting
patrolmen.
3. The supervisory rating was to be the foundation of the study and was
to provide a meaningful standard of patrolman performance to use indeciding which tests had value and which did not.
4. The ratings were for research purposes only, were strictly confidential,and were the property of the IRC. The results of the rating would not
be put into any man's personnel folder and would in no way influence
a patrolman's career in the Department. The supervisory ratingswould not be seen by anyone in the Department, and the supervisor's
own identity as a rater would remain confidential.
5. The actual rating procedure to be followed at the second meeting- -
when the IBM rating cards based on the supervisor's rating listhad been prepared--was described.
After answering any questions the supervisor had, the IRC staff member
presented him with a roster of the watch, and asked him to indicate which men
he felt he know well enough to rate, with the following provisos:
1. Select only patrolmen whose current field performance is known to
you.
27

2, Do not select patrolmen who have been in the district or on the
watch too short a time for proper evaluation.
Select only "outside" men, Le, patrolmen assigned to streetduty. (This requirement excluded patrolmen assigned to desk,
lock-up, review office, or other administration duties.)4. Do not, however, include "outside" men who are not or have not
recently been,assigned to uniformed street patrol. (This requirement
excluded patrolmen who served only on intersection control or public
building assignments, and patrolmen assigned plainclothes duty as
Vice-Dectectives in the district. Members of the District Tactical
Unit, a special unit organized in the districts during the course of
the study, were ordinarily included, since most of these men enteredthis assignment from uniformed patrol duty.)
Specifically the patrolmen included were officers assigned to uniformed patrol
in the vehicles of the district with sufficient tenure to allow for an informed
supervisory evaluation.
The supervisors were encouraged to include as many patrolmen as they knew
well enough to rate, with a desired minimum of 20 and a desired maximum
of 40 officers. A point of clarification occasionally provided was that raters
should not limit their choices to outstanding patrolmen, but should rather
attempt to provide a list which contained a full representation of field per-
formancesuperior, average, and below-average patrolmen. Once thelists of names for rating were completed,arrangements were made to meet
with the supervisor when the IBM rating deck was prepared.
During Wave II, the introductory meetings with supervisors in the districts
were conducted somewhat differently. A great deal of time was spent during
Wave I in providing the basic orientation to supervisors. While arrangements
were being made for implementing the appraisal in Wave II districts, the
Commander of the Third District suggested that we make the orientation and

development of rating lists part of his regular monthly staff meeting. This
procedure enabled us to contact the majority of the supervisors in the districtin a single visit and greatly facilitated communication about the study as well
as preparation of the rating materials. The orientation remained the same,except that there were 20 to 25 supervisors present rather than one or two.All districts in Wave II cooperated in making time available during theircommand staff meetings for presenting the study objectives and obtainingsupervisors, rating lists.
SPECIFIC RATING PROCEDURES
A deck of IBM rating cards was prepared for each supervisor in the district,based on the roster of names obtained from him in the first meeting withthe IRC field worker. As described above, this deck contained a pair-by-pair comparison of all possible combinations of patrolmen on his list inrandom order. Each man on the list was therefore paired with every otherman in the deck. The supervisor was given the following instructions:1. This deck of IBM cards is based on the roster obtained in our first
meeting. Each card contains thenames of two men, and the ratingdeck consists of all possible pairs of names on your list.
2. Try not to consider what you may have heard others say about these
men. Rather, base your judgments upon your own experience withthem.
3. Consider the two men on each card, and ask yourself the following
question: "Which of these two men is the better performer on the
street--which is the better patrolman in terms of performance inthe field?"
4. When you have made your choice, place a check mark in the box
next to the name of the man that you feel is doing the better job.
Make a choice for each card and make only one check mark oneach card.
29

5. This is the only judgment you have to make, You do not have to
rate any specific characteristics or traits of these officers, nor
do you have to justify the choices that you make. All you do is
decide which of the two men on each card is the better patrolman,
and then place a check mark next to his name. Your choice should
be based on (I) the factors you consider important for effective per-
formance as a patrolman, using standards you have developed as a
police officer and as a police supervisor and (2) your knowledge of
the job performance of each man.
6. Work rapidly, and do not spend too much time on any one card. The
rating of a deck of cards based on a list of 30 names can be completed
in approximately 30 minutes.
The above instructions were given to all supervisors participating in the study.
The rating was generally conducted in a private office at the district station on
an individual basis. It was occasionally possible to have two or more raters
work at the same time on their rating decks. In these instances, each
rater's judgments were made independently of the others, and no discussion
of any particular individual was permitted. The results of the paired-com-
parison performance appraisal are given in Chapter V.
CALL FOR VOLUNTEERS AND SELECTIONOF PARTICIPANTS
Several weeks before the scheduled group testing sessions, IRC and Personnel
Division staff met with each of the District Commanders, The Field Director
reviewed the experiences and progress of the IRC staff in conducting the
performance appraisals in the districts, and provided a detailed description
of the testing phase of the study and the proposed "ground rules" for patrol-man participation. Early in the study it had been decided that calling for
paid volunteers to participate on their own time would provide a more meaning-
ful estimate of patrolman ability than ordering a number of men to take part.
It would, of course, have been desirable to have all the patrolmen in a district
30

volunteer, but this was judged unlikely because of secondary employment,
vacations, and mere disinclination to participate.
District Commanders were asked to announce this phase of the study at roll-call meetings (held at the district before the watch went out on patrol), dis-tribute participation forms (Appendix), and request that these forms becompleted and turned in. The IRC provided each District Commander with
an outline for the announcement containing a description of the study in
sufficient detail to answer questions which might be raised by the patrolmen.A copy of this outline is presented in the Appendix.
It should be pointed out that, in addition to the press coverage of the studyat the time of the grant award, patrolmen in the department were exposedto news of the study as early as October of 1966, when an article describingthe project appeared in the Chicago Police Star magazine (Appendix), well
in advance of the Wave I (February, 1967) and the Wave II (July, 1967)
testing. In addition, a notice of the study appeared in the Daily Bulletin
at the same time the roll-call announcements were made at the districts(Appendix).
A deadline was set for the return of the Patrolman Participation Forms,and in most cases the District Commander ts secretary was responsiblefor collecting them, It is important to note that we did not pressure theDistrict Commander to obtain a 100 per cent volunteer response. We feltthat undue pressure to participate would be just as deleterious to meaning-ful test performance as ordering men to participate.
Forms were picked up at the district stations and processed at the IRC.Volunteers were separated from non-volunteers, and were considered forparticipation in the light of three elements of information derived from theperformance appraisal results:1. Evaluation by at least two supervisors in the district.2. Acceptable levels of individual consistency and agreement in the

pooled supervisory ratings. In practice, this meant that raterswere at least 90 per cent consistent, and at least in 60 per centagreement in rating the performance of the individual patrolman
being considered.
3. A performance index less than or equal to 46 (the bottom third of
performance) or greater than or equal to 54 (the top third of per-formance).
Individuals meeting these criteria were selected for inclusion in the study,
scheduled for their preferred location and test session, and notified of
their selection by means of the Patrolman Confirmation Card (Appendix).
CHICAGO POLICE DEPARTMENT PERFORMANCE MEASURES
An extensive review of sources of possible information on patrolman per-
formance available within the Chicago Police Department was made by a
joint CPD-IRC committee. Approximately 160 elements of information
were selected for consideration from three principal categories:1. Civil Service Commission and Background Data
2. Police Training Academy Record
3. Patrolman Performance Data (past and current)
In addition, a number of elements of descriptive data (e. g. , star number,race, etc.) were available.
All selected elements were thought to have some relevance for assessing
the current performance of Chicago patrolmen, but the list was cut in half
by applying three criteria:
1. Accuracy: Some question existed as to the accuracy of some of the
information on file. Marital status best illustrates this problem,
since this information was obtained at the time of recruitment, and
changes via marriage or divorce were not necessarily reported bythe individual officer.
2. Meaningfulness: In the case of civil service scores, for example,
32

data on tests used were sometimes incomplete and thus raw scoreswere uninformative since it was not known how many items they werebased on,
Availability. This was easily the most crucial criterion. Information
did not exist for significant portions of the sample, since record-keep-ing policies and procedures were simply altered over the years. Forexample, the Watson-Glaser Test of Critical Thinking is now routinely
administered in the Training Academy at the present time, However,it is not available for a number of patrolmen who were tested merelybecause it was not administered during their Academy training. The
retrievability of information was also considered, i. e, , the cost ofobtaining a particular element of information in relation to its poten-tial value in the study. Lastly, a certain amount of data was foundto be missing, through filing errors, omissions, or the like.
Approximately 80 elements of detailed performance information on each patrol-man tested were entered into his IRC data file. This information was providedby the Personnel Division upon receipt of the roster of patrolmen tested, andin no way influenced the selection of participants. The data fell into the follow-ing areas:1. Educational preparation2. Prior employment (civilian and military)3. Training Academy ratings and test scores4. Absence and injury record5. Internal Investigation Division and credit complaints6. Performance rating record (1963 through 1966)7. Departmental awards8. Disciplinary actions9. Arrest record (number and type of arrests made in 1966)
Not all of these performance measures seemed equally important. Therefore,the IRC staff attempted to further refine this list to arrive at the measures
33

which would be most suitable for use as criteria in the multiple-regression
analysis. Our refinement was based upon substantive as well as technical
grounds. Items in the final listing, presented in Figure 3, were thought toprovide a comprehensive picture of patrolman performance as assessed in
a number of distinct ways. Technical considerations were also important,
for example, the nature of the distributions of each variable. Missing data
played an important role, since a case would be deleted from the study if
any of the test or performance information was lacking.
DISCUSSION OF ,EIGHT CRITERION VARIABLES
The paired-comparison rating, which yielded a composite performance index
for each patrolman included in the study, was one of the principal criterion
variables. The derivation of this measure as well as its characteristicshave been thoroughly discussed in this chapter, and will not be commented
upon further.
The Chicago-Police-Department performance rating was the second princi-
pal criterion variable. This measure was based on the average of the twototal scores provided by district supervisors in the two semi-annual ratings
(January-June and July-December) conducted during 1966. The Appendix
contains a Department Special Order which describes the rating procedure,
a performance rating checklist developed to assist the supervisor in pre-paring his ratings, and the actual performance rating card. This rating
was available for all patrolmen tested, and was thought to provide a some-
what different type of information than that obtained in the paired-comparison
rating. Both rating procedures were aimed at obtaining a global index
of patrolman performance, but while the paired-comparison rating emphasized
the field performance of the officer, the CPD rating emphasized a more
conventional delineation of job performance in terms of quality and
quantity of work, dependability, personal relationships, and attendance and
promptness. All these elements were given equal weight in determining the
CPD rating, while no specific categorization or weighting of traits was
34

CHAPTER III -- Figure 3
CRITERION VARIABLESUSED FOR MULTIPLE REGRESSION ANALYSES
MEASURE DESCRIPTION
1. Paired-Comparison Rating From the performance appraisal con-ducted by the IRC staff
2. 1966 CPD Performance The average of the two half yearRating totals from the CPD
3. CPD Tenure Years of service on the CPD
4. CPD Total Awards Honorable mentions + commenda-tions + higher awards averaged for1961 through 1966
5. CPD I ID Complaints Ratio of I ID complaints over I IDsustained complaints
6. Disciplinary Actions Disciplinary actions averaged for1961 through 1966 + I ID sustainedcomplaints
7. Number of Arrests, 1966 Total arrest record for 1966
8. Times Absent Total incidence of absence for 1966
35

performed in the paired-comparison rating. Essentially, the paired-com-parison rating focused, on field performance, while the CPD rating empha-
sized the administrative as well as field performance aspects of the job.
The third criterion variable was tenure in the Chicago Police Department.
ThP use of years of service as a standard of performance was important
from the point of view of understanding patrolman turnover. It was also
promising for understanding the stability of employment and the likelihood
of an individual remaining a police officer and serving until retirement.
The awards received by a patrolman during his tenure were thought to be
another important source of information on his performance. The CPDtotal-awards index was based upon the average number of complimentary
letters, honorable mentions, commendations, and higher awards received
from the department in the period 1961 through 1966 The index for patrol-
men with less than six years of tenure was based upon their own length of
servic..%
A review of complaints registered with the Internal Investigation Division
(IID) of the department led to the establishment of the fifth criterion mea-
sure. This index was based upon the ratio of complaints over sustained
complaints registered in the IID during the patrolman's tenure with the
department.
The number of oral and written disciplinary actions received by a patrol-
man were averaged over his years of service (up to and including the last
six years) and added to the number of sustained IID complaints incurred
to consitute the disciplinary-actions index.
The Data Systems Division of the department cooperated in making avail-
able the arrest performance of each officer included in the study. The
figure used for the number-of-arrests criterion variable was the total of
the number of arrests in all categories made during 1966.
36

The eighth criterion variable was the attendance record of the officer during1966. The total incidence of absence in this year constituted the times-absent index.
The eight major criterion variables were thought to provide multi-facetedinformation on patrolman performance. The indices were both meaningfuland useful when used as standards of performance, and were consideredappropriate for use as criteria in the multiple-regression analyses(Chapters VI and VII). These performance measures were also used asthe basis for defining performance subgroups within the general patrolmansample (Chapter VIII).
REFERENCES
Baehr, Melany E. The a..raisal of ob erformanceence to the use of the Comparator). (Occasional Paper Number 27)Chicago, Ill. : Industrial Relations Center, The University of Chicago,1963.
with s ecial refer-
Baehr, Melany E. The a. raisal of ob erformanceuse of the paired-comparison technique for the validation of selectiontest batteries). (Occasional Paper Number 27-R1) Chicago, Ill. :Industrial Relations Center, The University of Chicago, 1968. (In press)
Tierney, John B. and Biggins, Peter A. The Comparator (instrument, 1961,and Test Administration Manual--Revised 1967). Chicago, Ill.:Industrial Relations Center, The University of Chicago.
results of five ears'
37

CHAPTER III--APPENDIX
Discussion of Normalized Standard Scores
A commonly-used way of expressing relative standing in a group is thepercentile. Job performance and test scores are often reported in percentilesto indicate the relative level at which an individual scores as compared to a larg-er normative group scoring below a certain level. For example, a percentilescore of 68 indicates that 68 per cent of the normative group scored below thislevel on the measure.
A number of the results in this report, however, are presented in asomewhat different manner--in the form of normalized standard scores. Standardscores are used because of certain statistical advantages they provide in the analy-sis of the results. For example, they permit the averaging of performance indicesbased on two or more raters, an operation which would be technically incorrectwith percentage figures. Standard scores are easily converted to the more commonpercentile, for those more familiar with this reporting procedure. The standardscore ranges may be described by their equivalent percentile ranges in the follow-ing manner:
Standard Score Range
20-30 (Very Low)
30-40. (Low)
40-45 (Low Average)
45-55 (Average)
55-60 (High Average)
60-70
70-80
Percentile Range1st to 2nd Percentile2nd to 16th Percentile16th to 31st Percentile31st to 69th Percentile69th to 84th Percentile84th to 98th Percentile98th to 99th Percentile
A more detailed conversion table is presented on the following page.
38

CHAPTER III- APPENDIX
CONVERSION TABLE
FOR CONVERTING NORMALIZED STANDARD SCORESINTO PERCENTILES
To convert normalized standard scores into percentiles, locate thestandard score in the column headed Standard Score and read acrossunder the Percentile column to get the equivalent percentile. Thistable is included for the convenience of those test users accustomedto percentiles.
StandardScore Percentile
StandardScore Percentile
72 & higher 99 50 5071 98 49 4670 98 48 4269 97 47 3868 96 46 3467 96 45 3166 95 44 2765 93 43 2464 92 42 2163 90 41 1862 88 40 1661 86 39 1460 84 38 1259 82 37 1058 79 36 857 76 35 7
56 73 34 5
55 69 33 454 66 32 453 62 31 3
52 58 3051 54 29 250 50 28 & below 1
39

CHAPTER III--APPENDIX
PATROLMAN PARTICIPATION FORM
(Please Print)Name
District 3rd Police Period: Watch(2 29 March)
.*104
romeartswootooarovalmow.
Star No.
Voml.,01..-Day-Off Key
I will participate in the U.S. Department of Justice Study, if selected,I understand that payment of fifteen dollars will be made to selectedparticipants. Participants will be notified during the week of 13 March1967.
Indicate preferred test session below, by number:( 1 = first preference, 2 = second preference )
Session 1, Mon, 20 March 1967
2, Mon, 20 March 1967
3, Wed, 22 March 1967
4, Wed, 22 March 1967
5, Thur,23 March 1967
6, Thur,23 March 1967
7, Mon, 27 March 1967
8, Mon, 27 March 1967
II
II
II
II
II
II
0900 hrs Law School, Univ. of Chicago*
1830 hrs
0900 hrs
1830 hrs
0900 hrs Hall of Science, DePaul Univ.
- 1830 hrs
0900 hrs
1830 hrs
(Selected Participants Will Be Notified the Week of 13 March 1967)
I will not participate in the U.S. Department of Justice Study.
Date of Return Signature
(To be returned to District Commander not later than 7 March 1967)
*1111 East 60th Street
*,!c1036 West Belden Avenue (Belden - 2300 North)
LEAA Patrolman Study - 2/67.
40

)1
To:
From:
In Re:
CHAPTER IIIAPPENDIXREVISED OUTLINE
June 19, 1967District Commanders
John FurconField Director, LEAA Patrolman Study
Suggested Outline for Roll Call Announcement ofLEAA Study of Patrolmen and Call for Volunteers
Background of the Project - -This study was proposed by theIndustrial Relations Center of The University of Chicago,and, with the sponsorship of the Chicago Police Department,was submitted to the U.S. Depa.rtment of Justice review board.The study was made possible by a $40, 000 grant through theLaw Enforcement Assistance Act of 1965, which provides forresearch projects which would improve law enforcemznt.
2. Purpose of the Project --The purpose of the study is to iden-tify characteristics or attributes which are related to successas a patrolman. The project essentially explores the followingquestions: What are the qualifications necessary to meet therequirements of the patrolman's job? What are the different"types" of patrolmen--in what ways are patrolmen alike, andin what ways are they different? How are the characteristicsof these similar groups related to their assignments and per-formance?
3. Progress to Date--The project began in August,. 1966, with afield study of the patrolman's job. Observations were madeby "riding along" with patrolmen and sergeants, and on thebasis of this experience, a number of tests were selected as beingappropriate for the police situation. During November andDecember, a performance appi.aisal of the patrolmen was madeby the command personnel of the Districts involved (2, 5, 10,13, 15 and 19) for the later selection of volunteers. A callfor volunteers was made in these Districts during January,1967, but due to the blizzard, the testing which was scheduledfor February was postponed. A second call for volunteerswas made in these Districts during February, and approxi-mately 70% of the patrolmen volunteered to participate. Atotal of 265 volunteers were selected, and approximately 250patrolmen completed the series of tests during March, 1967.The analysis of their scores is still in progress.
41

During April and May, 1967, performance appraisals of pa-trolmen were made by supervisors in a second group of Dis-tricts. A call for volunteers in Districts 3, 7, 8, 9, 14 and21 is planned for June 22-28, 1967, In addition, a call forvolunteers will be made to Task Force Tactical patrolmen.
4. Requirements for P a rti c i ant s- -T he assistance of patrolmenin the District is crucial to the success of the study. The callfor volunteers is being made in this District and in the otherslisted above, with the hope that an even larger percentage ofthe patrolmen will volunteer. The number of participantsactually selected will be much smaller than the anticipatednumber of volunteers, since a representative sample of pa-trolmen in the Department will be selected from among thevolunteers on the basis of the supervisory performance eval-uation. Approximately 50 men, representing a cross sectionof patrolmen, will be selected from each district.
Participants who are selected by the Industrial RelationsCenter will be requested to complete a series of personneltests, requiring approximately four hours to complete.These tests will, in general, be different from the usual"1-Q" tests, and will instead focus on areas such as percep-tual ability, reaction time, and behavioral characteristicsthought to be particularly important for patrolmen. The testswill be administered in group sessions. Some of the testswill have strict time limits; others will allow as much timeas needed for completion.
5. Conditions of Participation--Patrolman participation willtake place under the following conditions:a. All test results are confidential. Individual test book-
lets and scores will be retained by the Industrial Rela-tions Center.
b. Individual test results will not be disclosed to theChicago Police Department. No record of scores willbe placed in a man's personnel file.
c. No administrative action will be based on these results.Since individual scores will not be disclosed, no promo-tion decisions will be based on them. Test results in thisstudy will in no way help or hinder a man's career.
d. Individual identity will not be important. Although thetesting will not be anonymous, individual identity willbe used only to relate test scores to performance evalu-ation. Findings will be presented in terms of grouprather than individual results.
42

-3-
6. Response to Call for Volunteers --Each patrolman in the districtwill be required to complete a patrolman participation form. Ifa patrolman decides to volunteer, he will also indicate his prefer-ences among the scheduled test sessions--either morning or even-ing, North side or South side. Patrolmen who decide not to volun-teer will also indicate their response. The participation formswill be collected and returned to the Industrial Relations Center,and the selected volunteers will be promptly notified.
7. Benefits to Be Derived --A number of individual and departmentalbenefits will be derived from the study:a. Participants will receive a stipend of $15 for their cooper-
ation.b. The successful completion of the study will have a positive
effect on the trend toward professionalization of police work.c. The study is very likely to have national significance in that
findings established in Chicago may result in changes andimprovements in the method of selecting and assigning newpatrolmen in all large police departments throughout thecountry. This national application of results will reflectto the credit of the districts involved, as well as to that ofthe department as a whole.
d. The successful completion of the study will provide anopportunity for the Chicago Police Department to takethe lead in police personnel research--an area whichhas been relatively barren until the present time.
43

TIME SCHEDULE
21 June 1967 Receipt of outline and patrolman participation formsto at each participating districts22 June 1967
22 June 1967 Announcement and discussions of project at roll callsto by District Commanders.28 June 1967
28 June 1967 Patrolman participation forms picked up at districtstations by Industrial Relations Center staff.
3 July 1967 Notification of selected patticipants.
10 July 1967 0900 and 1830 test sessions at University of Chicago,Law School, 1111 E. 60th Street
12 July 1967 0900 and 1830 test sessions at University of Chicago,Law School, 1111 E. 60th Street
14 July 1967 0900 and 1830 test sessions at University of Chicago,Law School, 1111 E. 60th Street
18 July 1967 0900 and 1830 test sessions at De Paul University,Liberal Arts Building, 2322 N. Kenmore
it
7

CHAPTER In--APPENDIX
CHICAGO POLICE STAR
OCTOBER, 1966
THE OFFICIAL PUBLICATION OF THE CHICAGO POLICE DEPARTMENT
Pioneer Study of Patrolmenpage 16

Pioneer Study of PatrolmenTHERE IS NO "IDEAL" policeman,no "typical" policemanand re-searchers are not looking for him.
That statement clarifies one of themisconceptions about a new researchstudy now being made by the Universityof Chicago's Industrial Relations Centerin cooperation with the Police Depart-ment. For the first time, researchersare making an intensive study of policepatrolmen, using techniques alreadyfound to be successful in other govern-ment agencies and in industry. It is apioneer study to determine the require-ments of the patrolmen's job and thequalifications needed to meet them.
The study was made possible by a$40,000 grant under the Law Enforce-ment Assistance Act (LEAA) by theU.S. Department of Justice, Office ofLaw Enforcement Assistance. TheLEAA provides grants of federal fundsto law enforcement agencies for projectswhich 'would improve law enforcement.This study will eventually make animpact on recruitment and assignmentpolicies in police departments through-out the country.
WHAT IS THE OBJECTIVE OF THESTUDY?
1. The most important objective isto ascertain the ,characteristics or at-tributes typical of successful, competentpatrolmen. What are the different typesof policemen which are equated withsuccess? In what ways are patrolmenlike each other, in which ways are theydifferent? And how are these various"sub-groups" within the "police popula-tion" related to their present assign-ments and performances?
2. Once these various groups.of suc-cessful patrolmen are identified anddefined, general standards for officersfar more refined than anything nowexistingcan be set.
3. The tests that will be used in theproject will themselves be "tested? Inother words, which tests are most usefuland effective in the selection and place-ment of patrolmen? Which ones don'treally tell recruiters and personnel menmuch at all, which tell them a greatdeal?
HOW DOES THE STUDY WORK?A staff made up of members of the
Department's Personnel Division andthe Industrial Relations Center aredirecting the study, The University'sresearch team is headed by Dr. MelanyE, Baehr, Director of Measurement Re-search, Industrial Relations Center.Field Director for the project is John
Furcon, and Ernest C. Froemel is incharge of computer processing. Bothmen are graduate students now workingon their Ph.D.'s at the University, andboth also teach at DePaul University.
The testing will be done in two parts.Ten districts in all will be selected. Test-ing in five of them will start nextmonth; testing in another five will beconducted in the spring. Each districtselected will have a good cross-sectionof communitiesfrom quiet, residentialareas to high-crime areas.
Field researchers will go into thesedistricts, interview sergeants and askthem to rate their men. Moreover, re-searchers will ask two or three othersergeants in the district to rate eachman. And in addition, the field lieu-tenants will rate the men.
After the men are rated, volunteerswill be asked to go to the University ofChicago for a half-day session to takea battery of tests. Not all volunteerswill be accepted perhaps 45 to 50from each district, a total of 400 to 450for the entire project. The testing willbe done during the patrolmen's off-dutyhours, and each will be paid $15 forhis time.
All testing will be done on a confi-dential basis. The University of Chicagowill give the tests and process the re-sults. None of the participating officersv,111 be individually identified to theDepartment, and none of the informa-tion will ever be placed in the officer'spersonnel jacket.
Because of the complexity of the pa-trolmen's job, a variety of tests will begivenaptitude tests for specific skillsand 74?ecific mental abilities (not justIQ), for temperament, emotional ad-justment, interests outside the job, etc.
These tests will be scored, punchedon IBM cards and fed into a computerand eventually put on magnetic tapes
46
and discs. Without computers, a studyof this magnitude could never be made.
The two studies, in the fall and in thespring, will be analyzed. Then a cross-check will be made to validate the find-ings. The two studies will then be com-bined and all information obtained willbe analyzed.
WHAT WILL BE THE RESULT OFTHIS PROJECT?
There will be no immediate impact-- -the study is expected to take 16 months,perhaps more, before all data are an-alyzed and a report written.
Again, it will not have any effect onthe individuals who take the testsnotnow or at any time in the future will itin any way help or hurt his career, be-cause this information will be keptconfidential.
But eventually, it is expected to be-come of nationwide importance to po-lice departments. The study will helpclarify the demands made upon and thevariety of tasks required of a patrol-man, and the knowledge and skills hemust have.
Once the various kinds of success,.ful or competent patrolmen can beidentified, and the characteristics andattributes which are typical of themdetermined, these characteristics andattributes would then be pinpointed bymeans of recruitment tests. The teststhat prove to be most effective in defin-ing the various characteristics that aretypical of these "sub-groups" of success-ful patrolmen would be used as selec-tion tools.
With a better understanding of thejob requirements and performance abili-ties needed for that job, men could beassigned to better utilize their specificabilities, aptitudes and skills. Manpowerresources of a department could be used
more effectively.The project is designed so that other
police.departments throughout the coun-try will be able to use the results. It isanother major step forward in the pro-fessionalization of policemen. .0(
OCTOER, 1966 17
Reprinted with permissionof the
Chicago Police Star, 1966
a

CHAPTER III- -A PPENDIX
CHICAGO POLICE DEPARTMENT
11' V112111ACONFIDENTIAL FOR POLICE USE ONLY
VOLUME 8, NUMBER 17525 June 1967
0,W. WILSON, SUPERINTENDENT
MISSING PERSON
JAMES HEDIN1711 Berwyn Ave.
M/W, 16, 5.6, 140, med bld, fair comp,hazel eyes, brn hair. Wearing blue sweaterwith black 'top, blk trousers, blk shoes,blk jacket, blue shirt. May be in Evanstonwhere father lives or around Amundsen HighSchoOl, where he formerly attended. RDF071816. Area 6 Youth Sec.
ARE YOU AWARE?
University of Chicago seeking patrolmenfor police survey. Desire officers fromDistricts 3.7-8-9-14-21 and Task Force.Volunteers will be requested at roll call.Volunteers will be paid $15.00 per day.Survey sponsored by U. S. Dept. of Jus-tice and Industrial Relations Cnr., Uni-versity of Chicago.
MISSING PERSON
NANCY L. BARNSTABLE1025 N. California Ave.
F/W, 15, 5.4, 100, slender build, olive compbrown eyes, dk brown hair. Wearing orangeprint skirt, bright green blouse, white sox,black shoes, green jacket. Having familydifficulties and is roaming neighborhood ofOld Town on Wells St. Missing since 25April 67. RD F 124807. Area 4 Youth Sec.
WANTED FOR THEFT INVESTIGATION:John Terrell Stewart, LKA: 1637 N. TalmanM/W, 16, 56, 140, medium build, mediumcomp, green eyes, brn hair, clean shaven,speaks with southern accent. Wore BrownLevi type trousers & green tee shirt. Want-ed for investigation of theft committed at3204 W. Carmen Ave. R.D. F 181313 Gen.Assgn. Section, Area 5.
TAKEN IN A BURGLARY
11111Misapi.t.q1004*Wat1114040,.-.-..e.71111111PCIONNISL. "M=111111111=4:1411111MIE=RIM
WILLIAM E. BUSSE1038 SO. KOLMAR AVE.CHICAGO, ILL. 60624
AYPTO THE
ORDER OP.
- y - ,,,
C °CICERO STATE BANK
CICERO, ILLINOIS
0 no 7 Low L 2 2 21: Imo 3841108811150
Ill
$..
..?XfrLIOSINIr..a........011111/00r4M:3110111Pr ":',/111NOWZ%."."01.1..*.A.41.1.111rM..:THit.; .....
22 checks, Nos 104 thru 125 'inclusive.Drawn on Cicero State Bank, account ofWilliam E. Busse, 1038 N. Kolmar Ave.Taken in burglary of Kolmar Ave. premises
126
70.1222710
DOLLARS
betw. June 9th & 12th. Also taken, oneRemington Elec Typewriter, Ser 3073224brn, & gray color adding machine. RD F187-209. Area 4 Burglary.
47
MISSING PERSON
CYNTHIA STAPLETON5322 N. Winthrop Ave.
F/W, 16, 5.2, 110, slender build, fair comp,blue eyes, tinted red-brown hair, 2 frontteeth dark, need capping. Wearing dark bluejeans, dk blue tennis shoes, color of blouseunknown. May be with one Edward Sabas-tian M/W, 19, in area of Lawrence & Broad-way. Missing since 13 June 67. RD F189-416. Area 6 Youth Div.
DEATH NOTICES
John Notini, father of Ptlmn. Joseph Notini,TA4 and Ptlmn. Robert Notini, 20th Dist.passed away 24 Jun 67. Waked at MalecFuneral Home 834 N. Ashland after 1200hrs 25 Jun. Funeral at Notre 'Dame Church,1335 W. Harrison St. at 1000 hrs. Tues. 27Jun. Interment Mt. Carmel Cemetery.
Mrs. Marjorie Wilson, mother of Det. OtisWilson, DDA 1 Burglary, passed away Wed.21 Jun 67 in Albion Mich. Waked at BethelA.M.E. Church, 45th & Michigan, from 1900to 2000 hrs only. Funeral Mon. 26 Jun at1100 hrs from chapel. Interment LincolnCemetery. St. Jude League to meet Sun. 25Jun at 1930 hrs.
Patrick Kelly, Rat. Ptlmn., old 36th Dist.passed away Thurs. 22 June 67. Waked atCooney Funeral Home, 3552 N. Southport.'Funeral mass 1000 hrs Mon 26 June 67 atSt. Ann's Home, Techny, Ill. Interment AllSaints Cemetery.
Timothy Breen, brother of Pat Breen, Dis-patcher, Comm. Center, passed away 23 Jun67 in London, England. Services and Inter-ment 26 Jun 67 in London, England.

Nam
e
PAT
RO
LM
AN
CO
NFI
RM
AT
ION
CA
RD
(Sav
e th
is c
ard)
Cod
e N
o.Y
ou h
ave
been
sel
ecte
d fr
om a
mon
g th
e vo
lunt
eers
in y
our
dist
rict
for
par
ticip
atio
nin
the
U. S
. Dep
artm
ent o
f Ju
stic
e st
udy
ofpa
trol
men
, bei
ng c
ondu
cted
by
the
Indu
s-tr
ial R
elat
ions
Cen
ter,
The
Uni
vers
ity o
fC
hica
go. Y
ou h
ave
been
sch
edul
ed to
atte
nd th
e in
dica
ted
sess
ion,
in a
ccor
danc
e w
ithyo
ur p
refe
renc
es.
Sess
ion
1-,
Mon
, 20
Mar
ch 1
967
0900
hrs
Mon
, 20
Mar
ch 1
967
1830
hrs
Law
Sch
ool,
Uni
v. o
f C
hica
go*
t ISe
ssio
n 2,
Sess
ion
3,W
ed, 2
2 M
arch
196
7-
0900
hrs
Wed
, 22
Mar
ch 1
967
1830
hrs
it
it t ISe
ssio
n 4,
Sess
ion
5,T
hur,
23
Mar
ch 1
967
0900
hrs
Hal
l of
Scie
nce,
De
Paul
Uni
v. *
*Se
ssio
n 6,
Thu
r, 2
3 M
arch
196
718
30 h
rs
Mon
, 27
Mar
ch 1
967
- 09
00 h
rsM
on, 2
7 M
arch
196
7-
1830
hrs
it it I I
if I
Sess
ion
7,
Sess
ion
8,
* L
aw S
choo
l, U
nive
rsity
of
Chi
cago
, 111
1 E
ast 6
0th
Stre
et, C
lass
room
4**
Hal
l of
Scie
nce,
DeP
aul U
nive
rsity
, 103
6 W
est B
elde
nA
venu
e, R
oom
300
Plea
se p
lan
to a
rriv
e pr
ompt
ly. T
he te
stin
gse
ssio
n w
ill r
equi
re a
ppro
xim
atel
yfo
ur h
ours
. Thi
s ca
rd w
illse
rve
as y
our
adm
issi
on ti
cket
. Pay
men
t of
volu
ntee
r'sst
ipen
d w
ill b
e m
ade
imm
edia
tely
aft
er th
eco
mpl
etio
n of
the
test
ing
sess
ion.

CHAPTER III-APPENDIX
DEPARTMENT SPECIAL ORDER
DAYS Of ISOUR
4 February 1966
crawly!' *Ay"
4 February 1966
HO,
66-'7
auRIRaT
PERFORMANCE RATINGS
NRiRNRNCS
DIOTNI.CUMIN
A
AMPOOS
NISCINDS
L PURPOSE
This order provides for rating the performance of all members of the Department for the period 1 July to 31 December
1965,
AUTHORITY AND PROCEDURE
A, By authority of the Civil Service Commission, each department must send performance ratings to the Commission
offices twice a year. One report covers the period from 1 January through 30 June; the second report covers the
period from 1 July through 31 December.
B, Salmon colored Performance Rating Cards (CPD-14.270) have been prepared for the rating period 1 July to 31
December 1965.
C. The Director of Personnel will forward to each unit commander prepared rating cards for the members assigned as
of 2 December 1965, a control sheet in duplicate with members' names, and a supply of blank cards.
D. The unit commander will use the control sheet as a work sheet for grading and as an aid in returning all cards to
the Director of Personnel.
E. The unit commander will return all Performance Rating Cards and one copy of the control sheet, with the grades
inserted in the 'grade" column for each member, to the Special Prcijects aid Research Section of the Personnel
Division by 15 March 1966.
IIL RESPONSIBILITIES OF COMMAND PERSONNEL
A. Command personnel are responsible for the administration of the Performance Rating System within units under
their supervision. They will assure that the system is administered fairly; they will assure that large numbers of
men are not set back by a policy of assigning unusually high performance marks to all members of a unit; they
will assire that men deserving of a high grade are not given a low grade because a supervisor does not understand
how the system operates.
B. Command personnel will use the computed averages to assure that the averages for the unit under their supervision
are equitable. For example; watch commander "A" may rate his men and come up with an average of 85. 00.
Watch commander "B" may rate his men and come up with an average of 73.00. The district commander must
be conscious of this variation. If the group under watch commander "A" is obviously superior in its performance
to the group under watch commander "B", the district commander will be aware of this and accept the difference.If, on the other hand, there is no apparent difference in the two groups, it is the district commander's respon-sibility to bring about a more equitable basis of rating between the two watch commanders. In a similar marinc,,r,
commanding officers at higher levels will be responsible for reviewing rating averages under their command to
assure fairness,
IV. RESPONSIBILITIES OF UNIT AND WATCH COMMANDERS
A. A commander may appoint teams of two or three supervisors to rate their subordinates. Each team should operate
under the direction of a higher level supervisor.
B. The captains and lieutenants in a unit are expected'to confer to rate their sergeants. In this manner, the rating of the
sergeants, as one is compared with the other, can be accomplished more equitably than if the rating of each sergeant
was left up to his lieutenant. The same principle applies to higher ranks.
C. Commanders should be aware that the entire range of grades can be used. It can reasonably be expected that the
average grades of each of the three bureaus will fall into the range of "good. "
49

D. Patrol districts will treat each watch (1, 2, 3) as a separate unit and will enter the watch number in the blank area
above the ''final grade" box on the rating card. The watch commander will sign the cards as unit commander.
V. RESPONSIBILITIES OF THE RATER
A. Every rater will study the instructions in the Performance Rating Guide which is issued by the Civil Service Com-
mission before making the performance evaluation.
B. A member will be rated by the supervisors of the unit to which the card is sent if the member was assigned there
for a period of at least thirty calendar days during the rating period. When a member has worked for more than one
supervisor during the rating period indicated, the previous supervisor will be contacted and his opinion of the member's
performance will be considered in the final grade. Any personnel in the unit who were either on leave of absence
or resigned from the Department during the period 1 July to 31 December 1965 will be rated if they were in the unit
for at least thirty days. The unit commander will notify the Personnel Division on Pax 347 if a card is received for a
member who cannot be rated according to this policy.
C. It is pertinent that the rater judge each member under his command according to the same set of fair and impartial
standards.
D. The rater must consider the favorable and unfavorable repetitive characteristics and work habits of the members
being rated. Upon indicating a member's grade for one of the five traits, the rater must determine whether the
member has consistently warranted that grade ( and corresponding appraisal term), or if the member has met the job
requirements only occasionally during the rating period.
E. With reference to the trait of "Attendance and Promptness", the rater should be aware of the fact that a member
taking sick leave is to be considered absent and such practice can considerably lower the performance rating grade.
Excessive sick leave should not only affect the member's grade for "Attendance and Promptness", but it should be
reflected in his grades for the traits of "Dependability" and "Quantity of Work. " The rater will consider grades in
the "Fair or Unsatisfactory" category when the member's sick leave is excessive or there is an indication of sick
leave abuse. (Refer to the memorandum pertaining to sick leave abuse that was sent to all units by the Director
of Personnel on 3 May 1966.)
F. In units where several supervisors have supervised the same member, they will confer with each other to rate the
member. In this manner, the ratings of the member, as he is compared with the others, can be accomplished more
equitably than if the rating of each member was left up to one supervisor.
G. The immediate supervisor will enter the grades on the performance rating card in ink and will sign his name in the
space designated on the card. The rating will be reviewed and signed in the appropriate space by the supervisor at
the next higher level and the unit commander. It will be the duty of the unit commander to insure that the rating
has been given careful consideration and is properly justified.
H. If approval is not indicated by the reviewers' signatures, a new performance card will be prepared with the amended
grade. Both car& will be forwarded to the Personnel Division.
Authenticated b
0. W. WilsonSuperintendent of Police
50

CHAPTER III-APPENDIXPERFORMANCE RATING CHECKLIST/CHICAGO POLICE
E 1P60Y S P=MF'-
GRADE Ti RATING PERIODFROM To
UNIt
Su, ERVISOR
'TU.", " ^
INSTRUCTIONS: This checklist guide has been constructed with a view toward assisting the rater in determining accurate and equitablenumerical values for the five major traits on the Performance Rating Card and the resultant Final Grade,
Below are isted a number of items which could be considered in determining a grade for each of the five traits that comprise the Final Gradeon the Performance Rating Card, Although there may be as many as 20 items for each trait you may select only those that pertain to a ratee'sjob classification in order to determine an average of a final numerical grade for each trait. You are asked to examine the items and selectthose thra best evaluate the type of duties and responsibilities that the person to be rated performs. After the items have been selected, therater should examine the rating values listed at the top of the page. If it is felt that the value of the item being examined falls into a certainrange - - for instance, EXCELLENT (8S-89) --a definite numerical value should be established and indicated iii the column next to the itemrated." After each of the items under a trait have been graded, the values should be added and then divided by the number of items selected inorder to determine an average. This would be the value placed on the Performance Rating Card for the respective major trait (Quality of Work,etc.) You then add the grades for the five traits on the Performance Rating Card, as done in the past, and determine an average mark whichwould be the Final Grade.
An additional number of items for supervisory personnel (preceded by an asterisk) are included below those items to be graded for non- super-visory employees; however, all items in the list should be considered if conducive to evaluating supervisory personnel.
In the rating of non-supervisory personnel those items preceded by an asterisk should be disregarded.
These checklist guides may be retained in your unit as a record for determining performance rating grades. They are not to be returned withthe cards.
rw0I-U4
WI
. I .i 47 WI
L
a
U
0F40
O00
I-2
"I.1
'lW
0zISz4I-IA
;I0
W
7in
rW0I-U4ILWI
I I-247 WI
4a
0I-U
ILWI
.40
00
I-zw-i-IuXW
---
02..raz4rI-70
w0;a70)
cum70
7074
7579
8084
8589
9094
95+
may70
7074
7579
8084
8589
9094
95+
QUALITY OF WORK ABILITY TO EXPLAIN THE REASONSFOR PROCEDURES OR ASSIGNMENTS
ACCURACY* KNOWLEDGE OF, AND CONFORMITY TO
DEPARTMENTAL DIRECTIVES
JUDGMENTREADILY ASSUMES RESPONSIBILITY FOR
,DISCIPLINARY ACTION WHEN NEED ARISES4.
KNOWLEDGE OF DUTIES *ABILITY TO IMPROVISE
SYSTEMATICTOTAL
THOROUGHNESS
ABILITY TO LEARNGRAND TOTAL DIVIDED BY NO, or ITEMS
USEDFINAL GRADE
INTEREST
WILLINGNESS QUANTITY OF WORK
INITIATIVE PRODUCTION
EXTRACURRICULAR STUDY j. ORGANIZATION OF TIME
REPORTS NEAT, GRAMMATICALLYCORRECT INDUSTRIOUSNESS
COMPLIANCE WITH DEPARTMENTPOLICY AND DIRECTIVES L
+
ASSISTANCE, VOLUNTARY ANDWHEN REQUESTED
FELONY CONVICTION RECORDEFFORTS BEYOND BASICREQUIREMENTS
MISDEMEANOR CONVICTION RECORD ACCOMPLISHMENTS
TRAFFIC CONVICTION' RECORD FELONY ARREST RECORD
EMPHASIS ON ALL AREAS OFENFORCEMENT
I -MISDEMEANOR ARREST RECORD
KNOWS AREA TO WHICH ASSIGNED TRAFFIC ENFORCEMENT RECORD
ATTENTION TO PRIMARY FUNCTIONSOF POSITION
CURFEW VIOLATION ARRESTS
ENGAGES IN AGGRESSIVE,PREVENTIVE PATROL
1AMOUNT OF WORK PRODUCED BY UNITf
*
* COORDINATES ACTIVITIES OFSUBORDINATES
* OBTAINS DESIRED WORK RESULTSFROM SUBORDINATES
EXPLANATION OF WORK TO BE DONE*CHECKSCHECKS ADEQUACY AND PROGRESS OF
WORK PRODUCED BY SUBORDINATES
* ALERT TO POSSIBLE PROBLEMSw ARRANGEA TIME OF SUBORDINATES
Se AS T AVOID IDLENESS* SYSTEMATICALLY CHECKS
SUBORDINATES WORKCONTINUED ON REVERSE SIDE)
CPO- 11.259 (6/66) * To be considered with preceeding items in evaluating supervisory personnel.
51

war
70
70
74
44
79 $4
.1
.4
$519
0
4,
9094
Of
04
4.1
g'. i
It
U4N
Xw.1
idu
0
4
IS
1,1aa. ,
95 700 74
75 $079 $4
$5 9009 94
III111
III111
95+
QUANTITY OF WORK(CONTINUED)
ABLE TO GAIN OTHERS' RESPECT EMIRESPECTS RIGHTS OF OTHERS
rIIIIIIIIIIITOTALMAKES FAVORABLE IMPRESSIONS
ACCEPTANCE OF CORRECTION AND IIIGUIDANCE
zwar-ToTAl. IflIED Y NorarTTDArignmotUNIFORM OR DRESS NI.............4.444werm
PROPER APPEARANCE IIIDEPENDABILITY COURTESY III1141%.
RELIABLE CONSIDERATION I........0*.mor,-. .141FIN04.418.0.4***4
REQUIRES LITTLE SUPERVISION OBJECTIVITY MEFOLLOWS INSTRUCTIONS OR ORDERS RESPECT FOR PROPERTY OF OTHERS
ADAPTS TO CHANGE
la
ABILITY TO DEAL WITH THE PUBLIC
ABILITY TO GAIN SUBORDINATES' alIFIEsPEct
IMPARTIALITY
CONSISTENT IN PERFORMANCE
ACCEPTS RESPONSIBILITY111
*INTERESTED IN PROGRESS OFSUONVINATEs 1111
C OPERATIVE --CA S OF DEPARTMENT EQUIPMENT III
MOM
II MAINTAINS HIS PERSONAL APPEARANCE SO aAS TO SERVE AS AN EXAMPLE FOR
1.MAKES FACE -TO -FACE CORRECTIONSWITH EQUANIMITY AND oBJEcTIVITYINTEGRITY
DISCIPLINARY RECORDTOTALATTITUDE TOWARD DEPARTMENT
GOALS AND OBJECTIVES
ADJUSTED PERSONAL LIFEGRAND TOTAL DIVIDED SY NO. of ITEMS
USEDFINAL GRADE
ACCEPTS AND ACTS ON CONSTRUCTIVECRITICISMS OF SUPERIORS
ATTENDANCE AND PROMPTNESS* WILLING TO ASSUME RESPONSIBILITY
*DELEGATES AUTHORITY WHENPOSSIBLE 111111111WILLINGNESS TO TAKE CORRECTIVE MEASUREWITH LAX ON DEFICIENT SUIONDINATIE
REPORTS FOR WORK ON TIME.-...-
DOES NOT LEAVE EARLY
III ABSENTEE RECORD*INSURES THAT SUSORDINATE5 PROPERLY CARE
FON MATERIALS AND EQUIPMENT
NAI"COIXOE
TOTALTAKES ONLY ALLOTTED LUNCHAND REST TIMEDOES NOT USE DUTY TIME FORPERSONAL CHORES OR ERRANDS
YETald -HANDLES OR RESPONDS ToASSIGNMENTS PROMPTLY
.....GRAND TOTAL. Div iarb-11V-Far. Oleyoga
SUBMITS REPORTS PROMPTLY
PERSONAL RELATIONSHIPSPHYSICAL CONDITION WARRANTSAVAILABILITY FOR ANY ASSIGNMENT_ S*
TACTFULSETS A GOOD EXAMPLE FORSUBORDINATES IN THIS AREA-- ..,
TEAM MEMBER - -EXACTS GOOD ATTENDANCE ANDpnoteams FROM UNIT MEMBERS_
EVEN-TEMPEREDIS READILY AVAILABLE WHEN NEEDED- MAKESNO EFFORT TO AVOID UNPLEASANT TASKS
* UNIT COMPLETES ASSIGNMENTSWITHOUT DELAY*.SELF-CONTROL
0 44.. 4.4........
PATIENT
.4* .. *
TOTALREACTION TO STRESS
DIVIDED Y NO. OF ITEMSUSED
FINAL GRADE--- --
DEMEANORGRAND TOTAL
SELF-RESPECT 4 ..---*.mor...v..- ,.., .,=11---.---..--* Tr% hp ennsiciered with nteosedinp items in evaluatinv supervisory personnel.
52

[MPLOYY[ FINAL' 1111 ANO LEAVE SL ANN/ smroyEE NAME
DO NOT FOLD
STAPLE OR MUTILATE
REV. .4 oCRI,ORMANCe RATING CARD
../1111,EACH $U MONTHS bum YOU RATE a REVIEW THE PERFORMANCE RATIN{ SUIOE. FOLLOW CANE- -FULLY ALL INSTRUCTIONS IN THE {UWE.
IN RATINO THE EMPLOYEE ON EACH TRAIT, YOU MAY GIVE HIM ANY {RADE SETWEEN ZERO AND100* DETERMINE WHETHER THE EMPLOYEE IS OUTSTANDINS EXCELL ENT4,11001), FAIR onUNSATISFACTORY IN EACH TRAIT, THEN RATE HIM ACCORDING TO CHART BELOW.
OUTSYANDI NS 90 TO 100EXCELLENT 86 TO 800008 '78 TO 85FAIR 70 TO 75UNSATISFACTORY BELOW 70
GRADE,......,...........
QUALITYor worn(
QUANTITYor woes
DEPENDADILITY
PERSONALRELATIONSHIPS
ATTENDANCE &Pnomr , UMSS
TOTAL
iN onNennt., RATINS8 MAY BE EXPECTED TO FALL RETWEEN 70ANU 85. If YOU GIVE A RATIN{ OF 86 OR WYE OR 1ELOW70 ON ANY TRAIT, YOU MUST WRITE DETAIL ED COMMENTS ONTHE REVERIII; SIDE OF THIS CARD JUSTIFYING THE RATING.GIVE SPECIfq: EXAMPLES OF OUTSTANDINS OR UNSATISFACTORYPERFORMANCE.
SIGNATURES
RATER
DIVIDETOTAL BY 5AND ENTER
HERE
OV D UNI OMMANDER
ISC D5417.9
a
QUALITYOF
WORK
filmmramlandij-- COMMENTS
QUANTITYOF
WORK
DEPENDADILITY
vn
PERSONALRELATIONSHIPS
ATTENDANCEAND
PROMPTNESS

CHAPTER IV
Selection and Description of the Psychological Test Batteries
SELECTION OF THE TESTS
One of the essential requirements for attaining the first objective of the study- -
the prediction of patrolman performance--was the identification and utilization
of psychological tests judged to measure the personal skills and attributes which
have a direct bearing on the success of the patrolman in the performance of his
duties. The selection of the tests was also crucial for the second objective of thestudythe identification of specific patterns of good and poor patrolman per-
formance. In order to use these patterns for practical purposes of selection,
placement, duty assignment, and promotion, definitive and differentiating
psychological descriptions of the patrolmen who exhibit them are needed.
The occupational analysis discussed in Chapter II revealed many of the critical
behavioral requirements of the police officer's job. Also our field experiencewith Chicago police officers provided significant knowledge of the complex de-
mands which confront the patrolman. Our resulting insights supplied a founda-
tion for evaluating the relative merits of each particular test and its appropri-
ateness for inclusion in the test battery. Another source of information for
selection tests was the collective experience of members of the Employee
Appraisal Section of the Chicago Police Department Personnel Division. These
psychologists had extensive experience in the assessment of police officers,
which aided considerably in the decision-making process. A third source of
information was the staff of the Personnel Division itself, specifically the
Director of the Personnel Division and his Assistant.
55.

Thus, the staffs of the Measurement Research Division and the Personnel
Division collaborated on the composition of the test battery, with primary
responsibility resting with Measurement Research Personnel. The strategy
was to consider all possible tests, using the Sixth Mental Measurements
Yearbook (Buros, 1985) and current catalogs of test publishers as sources.
Particular emphasis was placed on tests developed by the Industrial Relations
Center and validated in industrial organizations during the past two decades,
tests currently in use by the Employee Appraisal Section, and tests being
used by other agencies and organizations affiliated with the Department
(e.g. , Chicago Civil Service Commission and The McMurry Company).
In addition to the essential requirement of relevance, a number of other tech-
nical and practical considerations were taken into account in selecting the tests.
In view of the large number of patrolmen to be tested in the study--and the even
larger number who would be involved if the validated battery were used f?r the
selection of recruits by the Chicago Police Department or other police depart-
ments in the country--the following criteria were applied in choosing the tests:
1. Group vs. Individual Administration. Only tests which could be admin-
istered on a group basis were included in the battery. This excluded
such tests as the Wechsler Adult Intelligence. Scale and many of the
projective tests, which must be administered to individuals by highly
trained and specialized psychologists.
Paper-and-Pencil vs. Aaaraus Tests. Paper-and-pencil tests wereused in preference to tests requiring special apparatus for their admin-
istration, such as the peg board or pursuit rotor tests.Objective vs. Subjective Scoring. Tests were selected with a view to
the objectivity of their scoring procedures. Thus, tests which could bedirectly scored with a prepared key were used rather than tests such as
the Rorschach, which are most effeCtive when the obtained indices are
'subjectively interpreted.
56

In general, the tests are practical and fairly economical with respect both to the
subjects' time and to the time and expense incurred by the organization for ad-
ministration and scoring. All of them can be administered and scored by cleri-
cal personnel trained for this purpose. The interpretation of test results, ofcourse, should always be made by professional personnel.
No test construction was attempted for this study. However, it is probable that
battery validity could be improved by the construction of specialized tests for
police-officer selection. It was thought that one of the important contributions
of this study would be to identify those areas which promised to be most fruitful
for the construction of new tests.
Chicago's police officers may differ from those in other municipalities in that
they have passed through an intensive screening procedure (Appendix) before
being appointed to the force. Because of this pre-screening, it was decided toexclude tests specifically aimed at assessment of a global intelligence quotient
(since the Civil Service Commission essentially screened out individuals with
an I.Q. of less than 100) and at direct assessment of emotional health (since
the Department itself utilizes psychiatric screening). We felt that thesescreening procedures were sound and that additional testing in these areas
would add little to our analysis, since those obviously unfit on the score of
I.Q. or adjustment had already been screened out. If the population had not
been pre-screened in these areas, we probably could have improved our
validities by including additional mental ability and adjustment measures.
It would have been ideal, of course, to have been able to include tests which
had demonstrated some validity for the prediction of patrolman performance in
other studies. Unfortunately, positive evidence of this sort was largely lacking.
However, in view of the exploratory nature of this study and keeping in mind the
requirements of relevance, as indicated by the occupational analysis, and the
praCtical considerations previously discussed, we decided we would cover as
57

wide a span of human behavior as possible. The tests chosen can be classified
into the following behavioral areas:
1. Motivational Measures
--Dimensions of objective background data.
--Dimensions of work interests indicating strength, flexibility, andvocational aspiration level of occupational interests.
2. Intellectual Measures--Primary mental abilities in the areas of reasoning, language facility,
and visual perception.--Special aptitudes, such as creative potential and insight in social
situations.
3. Behavioral Measures--Dimensions of the relatively permanent temperament traits or char-
acteristi7J modes of response of individuals in both normal and pres-sure situations.
--Dimensions of personality functioning as measured in tests purportingto represent various personality systems.
The tests used in the selection batteries for the Wave I and Wave II samples of
patrolmen, together with the number of dimensions or variables included in
each test and the administration time for the batteries, are shown in Table 1.
Short descriptions of each of the tests used, including information about the
authors, publishers, definitions of the dimensions measured, time limits, andsample items, are given on the remaining pages of this chapter. The Appendix
contains a description of the test administration procedure, including the
orientation statement given to the participants.
58

CHAPTER IV -- Table 1
Test (Predictor) Variables forWave I and Wave II Samples of Patrolmen
AREA OFMEASUREMENT
TESTUSED
NUMBER OFVARIABLES
WAVE ISAMPLE
WAVE II COMMONSAMPLE TESTS
MOTIVATIONBackground &Experience PHI 15 XX XX XXWork Interest WII 14 XX
INTELLECTUAL SKILLReasoning NVR 1 XXLanguage UC 1 XXPerception CS 1 XX XX XX
CF 1 XX XX XXPS 1 XX XX XX
APTITUDECreative AC 2 XX
CREE 14 XXSocial SI 8 XX XX XX
BEHAVIORTemperament TC 24 XX XX XX
EPPS 15 XXPressureTolerance PRESS 5 XX XX XX
PersonalitySystems BI 1 XX
HAND 8 XXMPI 3 XXA-D I XX XX XX
TOTAL NUMBER OF TESTS 14 11 8
ADMINISTRATION TIME (HOURS) 4 4 3
59

DESCRIPTION OF THE TESTS
TESTS OF MOTIVATION
PERSONAL HISTORY INDEX[PHI]
Melany E. Baehr, Ph.D. , Robert K. Burns, Ph.D.,and Robert N. McMurry, Ph. D., Industrial RelationsCenter, The University of Chicago.
This Index assists in predicting future job success onthe basis of past performance and experience. Pastperformance and experience are evaluated by an analysisof the scores obtained on 15 performance factors. Theseperformance factors are derived from 87 factual items ofinformation concerning family, education, and work his-tory; they were identified through a series of factorialstudies. Their names and interpretations are givenbelow:
School Achievement-academic achievement
- -a liking for, and adjustment to, the schoolenvironment
Higher Educational Achievement-higher-level academic specialization-late vocational start and marriage
Drive-motivation to achieve success
--preference for supervising others
Leadership & Group Participation--desire for interpersonal contact- -interest in influencing others
Financial Responsibility.--satisfactory handling of personal budget- -motivation for financial achievement
60

1
MEASURES: Early...Family Responsibility(cont.) --early marriage and establishment of a family
--interest in family activities
Parental Family Adjustment--development of positive attitudes in childhood-satisfactory relationships in parental family
Stability--established stability through successful work
history-concern for maintenance of status quo
School Activities--academic achievement--participation in athletic and social activities
Professional-Successful Parents- -self-employed or professional successful father--happy, comfortable home life
Educational-Vocational Consistency- -preferred occupations closely related and in line
with education
Vocational Decisiveness- -decisive choice of an occupation- -early qualification and start
Vocational Satisfaction- -satisfaction with occupation-peak performance seen as in the future
Selling Experience- experience in, sales, including door-to-door
selling and real estate transactions
General Health--long-term, better than average health--little lost work time because of illness
SAMPLE ITEMS.:
34. Do you: a. Own a houseb. Rent a house or apartmentc. Rent a roomd. Live with relativese.. Other.
61

SAMPLE ITEMS:(cont.)
65. While in high school, where did you rank a. Upper 10%in scholarship in your class? b. Upper 25%
co Upper 50%d. Lower 50%e. Don't know
TIME LIMITS: Untimed. Approximately 10 to 20 minutes.
A UTHORS:
MEASURES:
WORK INTEREST INDEX (Non-Verbal)[WM
Melany E. Baehr, Ph. D. , Richard Renck, Ph. D. ,
and Robert K. Burns, Ph. D. , Industrial Relations Center,The University of Chicago.
This Index is pictorial and completely non-verbal. Itconsists of 96 pictures, each of which shows a manengaged in a specific occupation. For each picture thesubjects checks whether he would, like "L" or dislike "D"the work shown. The principal purpose of the Index is toassist in determining an individual's pattern of occupa-tional interests through an analysis of th( scores he ob-tains on 12 work interest factors and two work attitudescales (Aspiration Level and Flexibility of Interests).The 12 factors were defined through a series of factorialstudies., They are named and interpreted as follows:
Professional & Technical. Professional and technicalskills used for therapeutic purposes--physical therapist,dentist.
Social & Verbal. tSocial and verbal skills used in teach-ing or counseling and resulting in the esteem of others--school principal, office manager.
Authority & Prestige. Authority and prestige or indepen-dent judgment used in unpredictable or non-routine situ-ations--civil lawyer, newspaper reporter.
Artistic & Interpretative. Artistic and interpretative'talents used in the 'performing arts--actor, composer.
62

MEASURES: Artistic & Stylized. Artistic ability used to make(cont,) stylized productstaxidermist, glassblower.
Artistic & Creative. Artistic or creative talent used inthe communication of ideas--sculptor, commercial de-signer.
Technical & Scientific, Technical and scientific skillsused in the physical or biological sciences--physicist,pharmacist,
Clerical & Routine. Routine clerical skills used in con-crete procedures--general office worker, inventory clerk.Business Contact & Structured, Business contact instructured social situationshotel desk clerk, grocerychecker,
SAMPLE ITEMS:
Personal Service & Persuasive, Personal service forthe advantage or enjoyment of othersship Is purser,welfare director,
Mechanical & Productive, Mechanical skills for produc-ing or repairing a product--automobile mechanic, cabinetmaker,
Control of Massive Equipment. Direction of massiveequipment in largely masculine settings--locomotiveengineer, cable driller.
TIME LIMITS: Untimed Approximately 10 to 15 minutes.
63

TESTS OF INTELLECTUAL SKILL
NON-VERBAL REASONING[NVR]
AUTHOR: Raymond J, Corsini, Ph. D Industrial Relations Center,The University of Chicago.
MEASURES:
SAMPLE ITEMS:
This test measures reasoning ability through the mediumof pictorial problems. Each of the 44 test items consistsof a row of five pictures, The subject is asked to find"the picture that goes best with the first picture in therow, " He then draws a line through the picture he selects.The test yields a single score.
.40.PI°
ifi,,, ,\Alif
II IA
, /TIME LIMITS: Untimed. Approximately 20 minutes.
AUTHOR:
MEASURES:
UNDERSTANDING COMMUNICATIONUC
T. G. Thurstone, Ph. D. , The School of Education, TheUniversity of North Carolina. Published by IndustrialRelations Center, The University of Chicago.
This test measures comprehension of verbal material inthe form of short sentences and phrases. Vocabulary andspeed of reading are of minor importance in achieving agood verbal comprehension Score on it. Test items areincomplete sentences with four alternative completions.The subject selects the word or phrase which correctlycompletes the sentence.
64

SAMPLE MS:When waves hit against rocks, small pieces of the rockare broken off. When these broken pieces rub againstother rocks, they break up again, makingA. rains. B. sand, C. waves. D. floods.If the pilot of an airliner meets too much ice, he can as-cend or descend to different flight levels until he finds awarmer
A. engine. B. transport, C. temperature. D. day,
TIME LIM, ITS: 15 minutes .
AUTHORS:
MEASURES:
SAMPLE ITEMS:
CLOSURE SPEED (Gestalt Completion)[CS]
L. L. Thurstone, Ph. D. , and T. E. Jeffrey, Ph. D. ,
The Psychometric Laboratory, The University of North Carolina,Published by Industrial Relations Center, The Universityof Chicago.
Closure speed is the ability to see an apparently disorganizedor unrelated group of parts or ideas as a meaningful whole orsingle unit, In other words, it is the ability to unify a complexsituation, In this test, the subject is asked to identify objectswhich are only partially or sketchily pictured,
TIME LIMITS: 3 minutes.
65
17.

MEASURES:
SAMPLE ITEMS:
TIME LIMITS:
AUTHORS:
CLOSURE FLEXIBILITY (Concealed Figures)[CFI
I.I. L. Thurstone, Pb.. D. , and T. E. Jeffrey, Ph. D. ,
The Psychometric Laboratory, The University of NorthCarolina. Published by Industrial Relations Center,The University of Chicago.
This is an objective test of the ability to keep a figure inmind in the face of distraction, that is, to see a givenfigure (diagram, drawing, or configuration of some kind)which is "hidden" or embedded in a larger, more complex,drawing, diagram, or configuration. The subject is givena figure followed by four drawings, and asked to indicatein which of the drawings the figure is "concealed. " (Thefigure must retain its size and general spatial orientation. )
Figure
10 minutes.
VIMI111#111.611.X0101MIP
Drawings2 4
(0) (0) (v)
PERCEPTUAL SPEED (Identical Forms)[PS]
(v)
L. L. Thurstone, Ph.D. , and E. Jeffrey, Ph. D. ,
The Psychometric Laboratory, The University of NorthCarolina. Published by Industrial Relations Center,The University of Chicago.
MEASURES: This test measures the ability to identify Pkenesses anddifferences in visual configurations (i.e. , diagrams,drawings, and figures). This ability has been identifiedas a primary one in visual thinking. It requires a mini-mum of thinking in the usual sense, and has very little todo with sharpness of eyesight. The subject is asked toindicate which of five similar .figures is identical with afigure on the left. The test yields a single score.
iia.actattiorafitatistaighniiiiiiiiastoti'`.
66

SAMPLE ITEMS:
TIME LIMITS:
AUTHOR:
MEASURES:
SAMPLE ITEMS:
I
o Ell 121
coo
aetti * SI .3
5 minutes,
TESTS OF APTITUDE
AC TEST OF CREATIVE ABILITY (Revised Short Form A)[AC)
AC Spark Plug Division of General Motors Corporation,Published by Industrial Relations Center, The Universityof Chicago.
The AC Test is an objective test of creative potential. Itassesses both the quantity and the uniqueness of the ideasan individual can produce in a given situation with giventime limits, The total test has five parts and two alternateforms, There are also two alternate short forms containingonly three parts. For the purposes of the Chicago PoliceDepartment study, only Parts II and III of Revised ShortForm A were used. Instructions for these two parts aregiven below with a sample item from each.
II. Below are listed a number of statements which youare to assume are true. Give as many reasons orexplanations as you can to explain the truth of thesestatements.
April is the month when the fewest accidentsof any kind occur in the U.S.
III. Below are listed five common objects. List all thepossible uses to which these, objects might be put(both uses that you have seemand uses that you canimagine),
TIME LIMITS: Part IIPart III
A wooden ruler
10 minutes15 minutes
67
oa1.4/14.4441.:4iins44444444.4

UTHORS:
MEASURES:
CREE QUESTIONNAIRE[CREE]
T. G. Thurstone, Ph. D. and J. J. Mellinger, Ph.D.,The Psychometric Laboratory, The University of North Carolina.Published by Industrial Relations Center, The Universityof Chicago.
This questionnaire was developed specifically to assesssome of the significant aspects of temperament and person-ality which distinguish between creative and non-creativeindividuals. There are 145 questions, which the subjectanswers by circling "Y" (Yes), "N" (No), or "?" (Undecided).Results yield an overall creativity score plus scores on 13creativity factors which are classified into four generalareas of life functioning.
Social Orientation
Dominance vs. Submission --social dominance expressedthrough social leadership, a liking for communicating informalized situations where the speaker is in control, andself-confidence.
Indifference vs. Involvementasocial behavior, lack ofsocial involvement, and nonparticipation in sports.
Independence vs. Conformity--independence, antisociabil-ity, a serious outlook, and a sense of being different.
Work Orientation
Unstructured vs. Structured Situation--preference for un-systematic, unstructured work situations where autonomousbehavior is possible.Unsystematic, Selective vs. Systematic, PrescribedActivityindividualistic approach to work, unsystematicwork habits, and a low level of activity.
Personally Involved vs. Detached Attitude--deep involve-ment with job at hand and a disinclination for making quickdecisions.
Pressure vs. Relaxed Situation--ability to produce ideasbetter while working under pressure.
68
Ci
aramarlia6.

MEASURES:(cont.)
Internal Functioning
High Energy, Low gmay Level--hyperactive, doesthings faster than most people, and usually in a hurry.
Fast vs. Slow Reaction--decisive, quick-thinking behavior.
High Ideational vs. Low Ideational S onta,neityconstantlybeset by ideas in almost every situation.
Interests & Skills
High vs. Low Scientific & Theoretical
High vs. Low Artistic
High vs. Low Mechanical
SAMPLE ITEMS:79. Do you like to work with theoretical ideas ?. ? N
101. Does working under pressure bother you?...Y N123. Do you enjoy promoting a new project 9 i ? N
TIME LIMITS: Untimed. Approximately 10 to 15 minutes.
TEST OF SOCIAL, INSIGHT (Adult Edition)[SI}
AUTHOR: Russell N. Cassel, Ed. D. Published by Martin M. Bruce,New Rochelle, New York.
MEASURES: This test appraises the characteristic mode of reaction anindividual exhibits in dealing with interpersonal or socialproblems. It consists. of 60 items, each of which describesan interperonal problem and offers five alternative actionsto take in handling it. The five alternatives cover the fol-
.
lowing five modes of resolving such problems:
Withdrawal--avoiding or escaping the problen by leavingthe situation.
Passivity--remaining in the situation but taking no actionto solve the problem.
Cooperation--initiating an active endeavor to solve theproblem.
Competition drawing the attention of others, attemptingto deal with the problem by excelling or outdoing others.
69
mtilint.loarn,...11431.010...114.64.16. N.Miaufinm are.x.11.1,. uftliulk

MEASURES:(cont.)
SAMPLE ITEM:
Aggressiondirecting little effort to the problem but ex-pressing hostility or strong feelings in response to it.
The frequency with which an individual selects each modeestablishes his characteristic pattern in dealing with socialand interpersonal problems.
After waiting in a very crowded restaurant for 20 minutesfor the waitress to bring your order, she arrives with thewrong order. What do you do?a. Insist that she make the correction immediately.b. Walk out, leave the wrong order on table, and do
not pay for it.c. Say nothing and accept the order.d. Report the error to the manager.e. See if you can make satisfactory exchanges at your
table.
TIME LIMITS: Untimed. Approxiriiately 35 minutes.
TESTS OF BEHAVIOR
TEMPERAMENT COMPARATOR[TC]
AUTHORS: Melany E. Baehr, Ph. D. , and R. W. Pranis, IndustrialRelations Center, The University of Chicago.
MEASURES: The Temperament Comparator measures the relativelypermanent temperament traits of the individual. It yieldsmeasures of 18 temperament traits and of five tempera-ment factors, all within the normal range of behavior.
70

MEASURES:(cont.)
The traits are:Calm PerseveringCautious Prompt StarterDecisive Quick WorkerDemonstrative Seeks CompanyEmotionally Stable Self-ConfidentEnergetic SeriousEnthusiastic Socially at EaseEven-Tempered Steady WorkerLively Talkative
The five temperament factors are based on weighted com-binations of different sets of these traits. The five factorsare defined as follows:
I. Controlled (vs. Outgoing. Persons scoring high onthis factor are cautious, serious, and undemonstrativeand show steady application and perseverance in all theyundertake. The opposite pole of this factor describespersons who are impulsive, happy-go-lucky, and demon-strative. They tend to do well in persuasive fields in-volving contact with other people and poorly in routinework or work requiring long periods of steady concentra-tion.
II. Stable (vs. Unstable). Persons scoring high on thisfactor are calm, even-tempered, and of a generally cheer-ful disposition. They are cool and, considered in theirjudgment and can be relied upon to keep their heads intrying conditions. Research has not clearly defined theopposite pole of this factor, although there is some indi-cation of a behavior pattern characterized by nonadjustiveemotional responses.
III. Self-ReliDependent). Persons scoring highon this factor are usually decisive and self-confident.Because of their perseverance and vigor, they often suc-ceed in achieving their objectives. However, they arerelatively unconcerned about the opinions of others andindifferent to contacts with them. The opposite pole ofthis factor describes persons who are characterized byindecision, lack of self-confidence, and emotionaldependence.
IV. Excitable (vs. Placid). Persons scoring high onthis factor are lively and full of energy, but this energyis splintered or dissipated through changeable and oftenerratic behavior. The opposite pole of the factor describes
71
ve04Neal

SAMPLE ITEMS:
Circle withTemperament Traits
persons with a generally low level of physical activity andof emotional response.
V. Sociable (vs, Solitary). Persons scoring high on thisfactor seek social contacts but are slow to get down to thejob on hand. The opposite pole of the factor describespersons who are often ill at ease in social situations butwho are prompt starters and quick workers in the rightenvironment. They may adjust well to work that is"solitary" and does not involve many social contacts.
The items in the Comparator consist of all possible pair-ings of the 18 temperainent traits. The subject rotates adisc to successive positions within a circle which has thetraits printed on its circumference. Bars on the disc linkpairs of traits. The subject examines each pair of traitsand places a mark in a hole on the disc near the trait whichhe has selected as more descriptive of his behavior. TheComparator also yields a Coefficient of Consistency whichindicates the extent to which the subject was consistent inhis selections or judgments.
Seci.11y hLit
Sorloo
ConfiMni
Iftwly %O.,
(laid M.r4n
0
Tolistive
Oe tlet Cooper.
Calm
Promoi Stow '
72
.PereetwitIng Wool,
.
0O
CeoPeoll
L. Timor./
lemeo1WeilO
Nmetwooliv
rs
1.
4

SAMPLES:(cont.)
Cardboard Disc
THE COMPARATOR
CoolcogIO Mil b W.W.I Nolo.. Como. The .... et Cho...
1101641 ITinTf
Circle and Disc Assembled
0. Not CANPIPOO
Sim* %two_ urt
!« r «t CHNI.1.
Ness.oreolve
folaus.
JSW.Conliesni
ItCootionel4yPOW
THE COMPARATOR
CfOoroglat Ibf ir I . ... rtelleleliehe The Ueoweriliff C.
1.1,1. woo.
' Prompt Pow
P ..... verin. L ly
!v. Teamed leI
a t
I I I
TIME LIMITS: Untimed. Approximately 15 to 20 minutes.

A UTHOR :
MEASURES:
EDWARDS PERSONAL PREFERENCE SCHEDULE[EPPS]
Allen L. Edwards, University of Washington. Publishedby The Psychological Corporation, New York, N. *Y
This schedule serves as a measure of the relative strengthin the individual of 15 "needs" adapted from Murray's basicneed system. It yields a score for each of these needs,which are defined as follows:
Achievement--to accomplish something difficult; to rivaland surpass others.Deference--to admire and support a superior; to yield tothe influence of another.
Order--to achieve organization, tidiness, and precision.Exhibition--to make an impression; to entertain or shockothers.
*Autonom/--to resist coercion and restriction; to be inde-pendent and free to act according to impulse.
Affiliation--to cooperate; to please; to remain loyal.
Intraceptionto analyze and understand the feelings andbehavior of others;' to put oneself in the place of others.
Succorance--to be nursed, supported, protected, guided,consoled.
Dominance--to influence or direct the behavior of othersby suggestion, persuasion, or command.
Abasement--to submit to external force; to admit erroror defeat; to seek punishment or misfortune.
Nurturanee--,to gratify the needs of the inexperienced, de-feated, lonely, or sick; to support, protect, or heal.Change--to seek new places, people, or ideas; to be flex-ible, open-minded, and progressive.
Endurance7-to,be able to.withstand pain or hardship; topersist in an action despite opposition or setbacks.
Heterosexuality--to form and further erotic relationshipswith members of%the opposite sex.
Aggressionto overnorne opposition forcefully; to takerevenge; to attack and injure others.
74
3aLt ALAiS.1.4

MEASURES: The schedule itself consists of 210 pairs of statements in(cont.) a forced choice format. The subject is asked to select
the one from each pair which he considers better describeswhat he likes or feels.
SAMPLE ITEMS:A I like to have my work organized and planned before
beginning it.
B I like to travel and to see the country.
A I like to share things with my friends.
B I like to analyze my own motives and feelings.
TIME LIMITS: Untimed. Approximately 45 minutes.
THE PRESS TEST[PRESS]
AUTHORS: Melany E. Baehr, Ph. D. , and Raymond J. Corsini, Ph. D. ,
Industrial Relations Center, The University of Chicago.
MEASURES:
SAMPLE ITEMS:
This is an objective test of personality, developed to mea-sure an individual's ability to work under stress. It yieldsthree main scores, one from each of its three parts:Part I. Speed of reaction to verbal stimuliPart II. Speed of reaction to color stimuliPart III. Speed of reaction to color stimuli in
a stress situation caused by the inter-ference of distracting verbal stimuli.
Two further scores which can be derived are the figuresfor Part I minus Part II and for Part II minus Part III.Directions for each part, with sample items, are givenbelow.
Part IPut the first letter of each word in the correspondingcircle.
1 2 3 4 1 2 3 4
Red Green Yellow Blue 0 (4) ® ®Yellow Blue Red Green ® 0
75

SAMPLE ITEMS:(cont.)
Part IIPut the first letter of the colors of the dots in the corre-sponding circles,
1 2 3 4
BIZE YEZDW fe)GIN B/Z YCJOW
(1-.) I D 6OD 0 ® 0
car_ t III
Write the first letter of the color of the ink in which theword is printed in the corresponding circles.
1 2 3 4
Red Blue Green Yellow
Blue Yellow Red Green
TIME LIMITS:
AUTHORS:
MEASURES:
SAMPLE ITEMS:
Part IPart IIPart III
90 seconds.90 secondS.90 seconds.
BEHAVIOR INVENTORYRill
1 2
® e*C) ®
3 4
The McMurry Company, 645 N. Michigan, Chicago, Ill.Published by Industrial Relations Center, The Univer-sity of Chicago.
In the Chicago Police Department Study, this inventory wasreferred to as the FTQ Scale or "Fail to Qualify" Scale. Itis a very short form of the Minnesota Multiphasic Personal-ity Inventory, and its 30 true-false items have been validatedagainst investigations of personal background. It yields asingle score which is predictive of whether or not an individual will successfully pass a personal-background investiga-tion.
In school I was sometimes sent to the principalfor cutting up.
I have never been in trouble with the law.
76
T F
T F

IG
TIME LIMITS: Untimed. Approximately 10 minutes.
HAND TEST[HAND]
AUTHOR: Edwin E. Wagner, Ph. D, Published by The Mark JamesCo. , Publishers, Akron, Ohio.
MEASURES: The Hand Test is a projective test measuring an individual'scharacteristic modes of behavioral response to all facets ofhis environment. It yields eight basic scores:
Interpersonal Responsethe tendency to relate to otherindividuals in an outgoing, active, and even aggressivemanner, or else in a way that is receptive and inner-directed but not passive.
Environmental Response--the tendency to control, influ-ence, or directly manipulate the external environment inorder to alter objects or obtain goals.
Maladjustive Response--the unhealthy reaction of perceiv-ing the environment as hostile and dangerous to one's phys-ical well-being, with a corresponding concern about injuryand disease,
Withdrawal Response--inability to meet the demands ofthe immediate environment, failure to adapt to it construc-tively and productively,
Inner-Directed Responseintroversion, or the tendencyto respond to others mainly in accord with one's own needsand wishes; undue concern with one's own mental state,
Outer-Directed Responseextroversion, or the tendencyto direct behavior and interests strongly outward and toobtain satisfaction from things outside one's own self.
Acting Out Ratio--a measure of the degree to which an in-dividual can absorb and control his own anti-social impulses;a predictor of the probability of maladaptive, overly aggres-sive behavior,
Pathological Score--a score which combines the Maladjustiveand the Withdrawal Responses to the environment; an index ofsevere behavioral disturbance.
77

SAMPLE ITEM:
The test consists of nine pictures showing hands in variouspositions and a blank page where the subject is to supply ahand position of his own choice. The instructions are tolook at each picture and then provide two descriptions ofwhat the hand might be doing, such as "Waving to a friend---a greeting" or "Policeman saying stop. "
WHAT MIGHT THE HAND BE DOING?
111111111111.,
TIME LIMITS: 8 minutes.
AUTHOR
THE MAUDSLEY PERSONALITY INVENTORY[MPIJ
H. J. Eysenck, Ph. D. , Institute of Psychiatry, Universityof London. Published by Educational and Industrial TestingService, San Diego, California,
78

MEASURES:
SAMPLE ITEMS:
This inventory measures two relatively independent di-mensions of personality or ranges of personality type:extroversion-introversion and neuroticism - stability. Itconsists of 48 questions to which the subject responds bymarking "Yes, " "7, " or "No. " For the Chicago PoliceDepartment study, the inventory yielded three scores:
Extroversion- - extent to which the individual is outgoing,uninhibited, impulsive, and sociable.
Neuroticismextent to which the individual is emotionallyunstable, emotionally overresponsive, and liable to neuroticbreakdown under stress.Undecided--frequency with which the individual cannot de-cide on either the positive or the negative response to aquestion.
Would you be very unhappy if you were Yesprevented from making numerous socialcontacts ?
No
Do you like work that requires Y ? Noconsiderable attention?
TIME LIMITS: Untimed. Approximately 10 minutes.
ARROW-DOT TEST[A -D]
AUTHORS: Lawrence A. Dombrose, Ph. D. , and Morton S. Slobin, Ph. D.
MEASURES:
Published by Psychological Test Specialists, Missoula, Mon-tana, and Industrial Relations Center, The University ofChicago.
This projective test is an adaptation of one part of a four-part battery called The IES Test. Its 30 items each set arelatively simple perceptual-motor task--to draw a linefrom the point of aY arrow to a dot. Arrow and dot areseparated by a number of barriers in the form of solid ordotted lines and black bars. The instructions explain howvarious combinations of these are to be handled. The testyields three scores:
79

MEASURES:(cont. )
SAMPLE ITEMS:
Example A
The I Score--a measure of the tendency to uncontrolledimpulsive behavior through which needs are satisfiedimmediately and directly without any regard for realisticrestrictions or moral issues.The E Scoreessentially a measure of the ability tofunction realistically, of the degree of ego strength andcontrol.
The S Score--a measure of superego strength, especiallyin circumstances where the demands of the superego arenot experienced consciously but are viewed as externalrestrictions.
TIME LIMITS: 6 minutes.
REFERENCES
Example C
Buros, Oscar Krisen (Ed.). The sixth mental measurements earbook.Highland Park, N.J.: The Gryphon Press, 1955.
80

CHAPTER IVAPPENDIX
The Psychological and Psychiatric Evaluation ProcedureUsed in the Chicago Police Department
Initially all candidates are given a test of general intelligence (prepared by the
Civil Service Commission) similar to the Army General Classification Test,
and three other psychological instruments: a sentence completion test, a
modified form of the Minnesota Multiphasic Personality Inventory, and a bio-
graphical form.
During this initial phase, applicants are eliminated only if they fail the I.Q. test
(with a cut-off of an I.Q. of about 100). The other psycholological measures are
used later to assist detectives during the background investigation which is
conducted prior to acceptance into the Training Academy. This background
investigation procedure, which is the second phase of processing consists of the
following steps:
1. Fingerprint and name record
2. Employment history
3. Educational and military service records
4. Credit and neighborhood standing
5. Medical, psychological, psychiatric, and polygraph examinations
6. Personal family visits
During this phase, in rare instances, a man's background will be clear, but
his psychological tests may indicate that he lacks the desired emotional stability.
When this occurs, he will be evaluated by the Psychiatric Board (three psychia-
trists) to determine his suitability for service as a police officer. This pro-
cedure is applied infrequently, since in nearly every instance the school, work,
military, or criminal record confirm the questionable psychological pattern,
and no difficulty is experienced in eliminating the unsatisfactory candidate.
Because of the large volume of applicants-2000-2500 candidates screened each
year--it is impossible to use a polygraph or oral examination for each candi-
date. The Polygraph and Oral Boards are used to a limited extent when
81

required on certain unusual cases. (The Oral Board, made up of psychologists,
psychiatrists, and command personnel represents the ideal final screening de-
vice before employment.)
In phase three, when the successful candidates are admitted to the Academy,
a battery of more sophisticated psychological tests is administered. Currently
in use are: a Rorschach test, the Hand Test, the Picture Title test, and thePicture Memory test. In addition, a number of tests utilized in the present
Department of Justice study are now routinely administered to Academy trainees,
including the Personal History Index, Closure Speed, Closure Flexibility, Test
of Social Insight, Press Test, Arrow-Dot Test, and Temperament Comparator.
Recruits in the Academy are also given an Otis I.Q. test, the California Testof Mental Maturity, the Watson-Glaser test, and the Emo Questionnaire.
A number of these tests require interpretation and, in some cases, administra-tion by trained psychologists. Personal interviews are conducted by the psy-
chologists when testing indicates the existence of a problem area.
All this test material is evaluated by department psychologists, and their con-
clusions on each man are sent to the Director of Training and the Director of
Personnel for analysis and possible action. When the probationer's psycho-
logical test results are unsatisfactory, or his actions deemed questionable
during his three months in the Training Academy or remaining three months
probation working as a patrolman, he is brought before the Psychiatric Boards
This is seldom necessary because of the earlier elaborate screening describedabove.
82

CHAPTER IV--APPENDIX
Test Administration Procedures
Following the introduction c" the staff members who would be administering the
test battery, the participants were given a general orientation statement about
the study. The statement was made in an informal manner rather than read,
but the following paragraphs contain the principal points covered:
"The purpose of this testing is to study the characteristics ofsuccessful police officers as an aid in the selection and place-ment of candidates for the position of patrolman. We are notsearching for an ideal type of person. Many types of personcan and do perform successfully as patrolmen.
"The study is sponsored by the Office of Law Enforcement As-sistance, U.S. Department of Justice. [At this point, Wave IIsubjects were told that this was the second half of the study, andthat 250 Chicago patrolmen had already been tested.] Our workiS not directly sponsored or paid for by the Chicago Police De-partment. This is very important for you, since your individualtest results will not be made available to the Department. Notest results from this study will be placed in your personnelfolder, and our final report will be submitted to the Departmentof Justice. Your test performance here will have no bearing onyour career as a police officer, in either a positive or a nega-tive way. You are here on your own time, being paid by TheUniversity of Chicago.
"We are trying to establish that these tests may haVe value forscreening applicants for the patrolman's job. However, wewould like you to take the tests as if they really counted. Toinsure meaningful results, we would like you to try and do yourbest.
"All of you have probably had considerable exposure to testing,in the service as well as in your career as a police officer.From this point of view, you are fairly 'test sophisticated.'However, many of the tests that you will work through todaymay be different from anything you have seen before.
83
, A mor

"Some of the tests have strict time limits, and it is very' impor-tant that the group start and stop together. If someone starts toosoon, or does not stop when the signal is given, those particularresults will have to be discarded. In this situation, the personhas taken the test under conditions different from those for theother members in the group, and his results would be invalid.The need for standard time limits is obvious, and much of yourexperience with testing has probably been under these conditions.On the other hand, some of the tests for today are ' untimed.'Their time limits are not strictly set, and all members of thegroup are allowed to complete the test. However, keep in mindthat we have a fixed number of tests to complete, and the timewhen the group will finish depends on how long is taken for theuntimed tests."A general rule to follow when you receive the test materialsis 'Don't open the test booklet until told to do so!' Otherwise,your results on a particular test may be invalidated.
"We feel that the results of this study will have implicationsfor police departments across the country. The findings weestablish here in Chicago will be disseminated by the Depart-ment of Justice to the officials of all the larger departmentsand many of the smaller organizations. Thus your cooperationhere today will have far-reaching repercussions for the pro-fessional advancement of police work."
Participants were encouraged to ask questions during this orientation statement
and at its conclusion. Administrative details concerning rest breaks, the serv-
ing of coffee and rolls, the location of rest room facilities, and the arrange-
ments for payment of the $15.00 volunteer's stipend were then discussed.
The administration procedure for each test followed the instructions contained
in the particular test manual. The actual test administration began with
Perceptual Speed, a timed test. The sequence of administration called for the
alternation of timed and untimed tests to provide variety and a break from the
pressure of the timed tests.. There proved to be wide individual differences in
the time required to complete particular untimed tests. In such instances,
patrolmen who had completed their tests were allowed to leave the room for a
brief, rest until all members of the group were finished.
' ,
8.4
--",7""-

The last test in the four-hour session was one of the longer untimed personality
tests. As patrolmen finished this test, they brought their materials to the frontof the room, signed the payment roster, and received the $15.00 volunteer
stipend in cash.
The actual length of the group sessions was very close to the planned four-
hours' duration. A few men completed the test battery in less than four hours
and most completed it in just a few minutes over this time, while a few required
an additional 30 to 40 minutes to finish the last untimed test.
1 .3

CHAPTER V
Results: Performance Appraisal
RESULTS OF THE PAIRED-COMPARISON TECHNIQUE
The paired comparison performance appraisal technique was well received bythe Supervisory Sergeantr4 and Field Lieutenants participating in the study. Thegreat majority felt that the rating procedure was meaningful and provided an
accurate, assessment of patrolman performance. From the point of view of the
police supervisors therefore the method had face validity for assessing pa-trolmen.
Figure 1 gives the frequency distribution of supervisors selecting a giveit
number of patrolmen for rating. When obtaining rating rosters, IRC fieldworkers encouraged supervisors to select between 20 and 40 names. They weretold that they could rate as many as 30 men in half an hour, as compared withthe somewhat longer time needed to rate patrolmen in the CPD performance ap-
praisal. As indicated in Figure 1, most of the supervisors felt that they knew the
field performance of between 26 and 35 patrolmen well enough to rate them.
Thee. extent of the "coverage" of the performance rating is suggested by the re-sults given in Figure 2. A total of 253 supervisors participated in the study,108 in Wave I and 145 in Wave II. The District Supervisors rated an estimated80 per cent of the patrolmen in the Wave I districts and an estimated 85 per centof the patrolmen in the Wave II districts. The remaining 15 to 20 per cent ofthe patrolman contingent in these districts fall either into the assignment cate-gories excluded from the study (see Chapter III) or into the category of recentarrivals in the district.
V , , , +4- , -,41 twos

covzik
uawim
ed Jo siaqwnN
asaqi fifes siosrAipdns Jo Jaqw
nN
ff
rt,

CHAPTER V Figure 2
SELECTION OF PATROLMAN SAMPLES
FOR WAVE I AND WAVE I I TEST ADMINISTRATION
WAVE I
DISTRICTS
2 5 10 13 15 19 Total
I No. in Watches 273 170 227 238 163 183 1254
II No. Rated 173 143 166 191 131 143 947
II I No. Tested 44 29 40 42 19 68 242
IV No. of Raters 21 17 19 15 15 21 108
WAVE IIDISTRICTS
3 7 8 9 14 .21 Total
I No. in Watches 392 377 169 232 194 284 1648
II No. Rated 316 294 158 192 174 246 1380
I No. Tested 33 32 20 53 55 55 248*
IV No. of Raters 27 24 21 23 26 24 145
* In addition to these district patrolmen, a total of 60 Task Force patrolmenwere tested during Wave II. Their results are not given in this report,but.will be detailed in a subsequent publication.
89
1_, rag t

The distribution of the per cent consistent judgments is given in Figure 3 for
the raters of Wave I and Wave II, as well as for raters in 20 industrial validationstudies conducted by the IRC. The consistency of the judgments made in the
study was quite highs with over 90 per cent of the police supervisors in both
Waves achieving a consistency score of 90 per cent or more. These results
compare quite favorably with the consistency results obtained in industrial
studies. After a review of the results of the appraisal, raters with a con-sistency score lower than 80 per cent were ordinarily excluded from the study.
Figure 4 contains the results of the analysis of the agreement of raters within a
watch. Once again, the results of Wave I and Wave II are contrasted with the
results of the industrial validation studies. The results of the two testing Waves
are quite comparable, but the police supervisor group exhibits a much wider
range and a somewhat lower average level of agreement than does the industrial
group. This difference may be the result, in part, of the generally larger sizeof the groups rated by CPD supervisors. Of greater consequence, however,
are the closer day-to-day contacts which industrial supervisors ordinarily have
with the employees they rate and the greater diversity and complexity of the
patrolman's job as compared with many industrial cccupations. The average
level of agreement exhibited by industrial raters is in the 70 to 75 per cent
range. The average level shown by the District Supervisors was in the 65 to 70
per cent range, which, under the circumstances, is regarded as a very favorableresult. Police supervisors exhibiting an agreement index of less than 60 percent were excluded from the study.
The performance index derived for each patrolman included in the study was
therefore based on supervisory ratings which were internally consistent for
each individual rater and also exhibited an acceptable degree of agreement among
raters. Under these conditions, it was considered that the index would provide
a reasonably accurate measure of patrolman performance and could serve as
one of the major performance criteria for the study.
90'

90 go1.
1.1
t
tiw
70
060
Zs3
50
U o:C
40
v)30
~O
atu
20IA
.
I&0
010 0
CH
APT
ER
V -
- Fi
gure
3
CO
MP
AR
ISO
N O
F P
ER
CE
NT
CO
NS
IST
EN
T J
UD
GM
EN
TS
OB
TA
INE
D B
Y R
AT
ER
S IN
TH
E C
HIC
AG
O P
OLI
CE
DE
PA
RT
ME
NT
AN
D IN
TW
EN
TY
IND
US
TR
IAL
VA
LID
AT
ION
ST
UD
IES
95-1
00
va...
ww
ip
Res
ults
of 2
0 In
dust
rial
Val
idat
ion
Stu
dies
Chi
cago
Pol
ice
Dep
t, R
ater
sW
AV
E I
Chi
cago
Pol
ice
Dep
t. R
ater
sW
AV
E II
..F
itr-
--11
ffF
INN
Iim
ar-1
90-9
4.9
85-8
9.9
80-8
4.9
75-7
9.9
70-7
4.9
65-6
9.9
60-6
4.9
% C
ON
SIS
TE
NT
JU
DG
ME
NT
S (
RA
TIN
GS
)

CH
APT
ER
V -
- Fi
gure
4
CO
MP
AR
ISO
N O
F P
ER
CE
NT
SIM
ILA
R J
UD
GM
EN
TS
OB
TA
INE
D B
Y P
AIR
S O
F R
AT
ER
S IN
TH
E C
HIC
AG
OP
OLI
CE
DE
PA
RT
ME
NT
AN
D IN
TW
EN
TY
IND
US
TR
IAL
VA
LID
AT
ION
ST
UD
IES
Res
ults
of 2
0 In
dust
rial
Val
idat
ion
Stu
dies
(86
pairs
of r
ater
s)
Chi
cago
Pol
ice
Dep
t. R
ater
sW
AV
E I
(278
pai
rs o
f rat
ers)
Chi
cago
Pol
ice
Dep
t. R
ater
sW
AV
E 1
1(4
61 p
airs
of r
ater
s)
90-9
4. 9
85
-89.
9 80
-84.
9 7
5-79
. 9 7
0-74
. 965
-69.
9 6
0-64
. 9 5
5-59
. 9 5
0-54
. 9 4
5-49
.9
40-4
9. 9
35-
39. 9
% S
IMIL
AR
JU
DG
ME
NT
S (
RA
TIN
GS
)

One of the wider implications of the kacce3stul implementation of the paired-comparison technique in the Chicago Police Department is the interchangeabilityof behavioral science procedures and techniques among different institutionalsettings. During the past two decades, the Industrial Relations Center has im-plemented test validation and performance appraisal procedures largely inindustrial organizations. However, in recent years, these procedures haveincreasingly been applied in other institutions, such as schools, hospitals, anddepartments of the government. In general, the paired-comparison technique
has been well received by raters and is economical of their time, since a ratercan ordinarily assess 30 subjects in 30 to 40 minutes. In addition, it yields avariety of objective information concerning both the people rated and the r' tors.For these reasons, it should be seriously considered by law-enforcement agenciesnot only for specialized research purposes but also as part of the performance -
review procedure aimed at the development of the individual.
RESULTS OF THE CALL FOR VOLUNTEERS
The results of the call for volunteers to participate in the study were deemedsatisfactory. Eighty to 85 per cent of the patrolmen in the districts returnedtheir participation forms, and of these approximately 60 per cent indicatedwillingness to participate. (It is estimated that approximately 10 per cent to15 per cent of the complement of a district will be off duty during a given time
interval because of furloughs, utilization of accumulated "time due," leaves ofabsence, illness, injury on duty, or suspension. Thus an 80 to 85 per centreturn was the maximum anticipated.) Since the design of the study called for
a carefully designed sample composed of some of the better and some of the
poorer performers from each district, ample representation of these ranges ofperformance was available within the volunteer group.
Better than 90 per cent of the patrolmen invited to participate in the study actual-ly attended the group testing sessions. As indicated previously, the tests wereadministered in two "Waves," Wave I during February of 1967 and Wave II during
93

July of 1967. The testing was scheduled in this way to allow sufficient time for
the conduct of the paired-comparison performance appraisal in the districts
and for analysis of Wave I test results so that the test battery, could be refined,
if necessary, for use during Wave II.
A total of 490 district patrolmen were tested in the study, as indicated in the
district-by-district breakdown contained in Figure 2. Participants were selected
and notified as described in Chapter III, The sessions were conducted by the
IRC staff at two locations in the city, using the classroom facilities of De Paul
University on the North side, and The University of Chicago Law School on the
South side. The actual test administration procedures have been described in
the Appendix to Chapter IV.
RESULTS OF CHICAGO-POLICE-DEPARTMENT APPRAISAL MEASURES
In implementing selection validation procedures in organizations, the Industrial
Relations Center's policy is to use both subjective and objective indices of per-
formance available in the organization in addition to those obtained from the
paired-comparison technique. This has the double advantage of affording a
comparison between the results obtained from the paired-comparison technique
and from the appraisal indices used by the organization, and of investigating test
validity for objective, operational indices regarded as important by the organ-
ization.
The second major criterion measure used in the study was the supervisoryperformance rating, conducted semi-annually in the department. This subjec-
tive measure and the six objective performance indices were described in
Chapter III. The intercorrelations of these measures are presented in Table 1.
Intercorrelations based on Wave I data are presented above the diagonal. Wave II
intercorrelations are presented below the diagonal. These intercorrelations aregenerally consistent across the two Waves, both in magnitude and in direction.
The highest correlations and hence greatest overlap occur between the paired-
comparison and CPD ratings. As discussed in Chapter III, both indices are
94

CHAPTER V -- Table 1
Intercorrelations of the Eight Major Patrolman Performance Criteria
for Wave I (N=175) and Wave II (N=192)*
Variable 21
PCRating(21)
CPDRating(372)
CPDTenure(308)
CPDAwards(373)
IIDComplaints(375)
DisciplinaryActions(374)
No. ofA i.rests(359)
TimesAbsent(314)
. 66
. 16
. 27
. 02
-.10
372 308 373
.64 . 12 .33
.17 .23
.22 -.23
.24 .07
.08 .13 .27
-.04 .34 .18
375
.08
-.07
.10
.11
374 359 314
-.19 .36 .14
-.28 .06 -.07
.08 -.01 .03
-.04 .11 -.05
.29 .42 .02
.48 .09
. 9 .21 .05 . 48 .23 .23
-.06 .04 .20 .01 . 12 .34 . 01
* Wave I intercorrelations are presented above and Wave II intercorrelationsbelow the diagonal line. For 175 cases, r of .17 or greater is statisticallysignificant at the .01 level, and an r of .12 or greater is statistically signi-ficant at,the .05 level.
95
"*".. '440 ",""*, f ,

global measures of patrolman performance, and a fairly high (but not perfect)
correlation would be expected between them. These results evidence both the
basic soundness of the CPD rating, and the utility and validity of the paired-
comparison rating. Since the overlap is considerable but not outstanding, the
results are thought to support the contention made in Chapter III that the paired-
comparison and CPD ratings assess patrolman performance in this study from
slightly different points of view--field performance vs. field as well as admin-istrative performance.
As might be expected from their high intercorrelation, the paired-comparison
and CPD ratings show similar relationships with the six objective measures.
Both show a significantly positiire but not striking relationship with tenure, and
a more substantial relationship with CPD awards. There is virtually no re-lationship between the results of the two supervisory ratings and either the IID-
complaints or times-absent criteria. A negative relationship exists between the
'Iwo ratings and disciplinary actions, but these correlations are significant only
in the Wave I results. The total-number-of-arrests index is positively relatedto both the paired-comparison and CPD ratings.
The relationship between CPD tenure and the remaining indices is more mixed,
with a negative relationship with awards in Wave I, and positive relationships
with complaints, disciplinary actions, and times absent in Wave II. Depart-
mental awards do not correlate significantly with any of the remaining Wave I
indices, but show positive relationships with complaints and disciplinary actions,
and a strong positive relationship with total number of arrests. Complaints
are significantly related to disciplinary actions and arrest total in both Wave Iand Wave II. In Wave II, disciplinary actions are significantly related to both
arrests and times absent. The general direction and strength of associationsmet our expectations, and were thought to verify the anticipated relationships
between some of the indices and the expected independence of others.
96'

CHAPTER VI
Validation of the Occupational Test Batteries
The basic question to be answered in the validation of the occupational test bat-
teries is to what extent the test (predictor) variables can account for differences
in the performance (criterion) variables. To achieve a significant relationship
betaen these predictor and criterion measures, the tests used in the battery
should yield reliable measures of some of the personal attributes which are es-
sential for successful performance and the criterion measures should reliably
assess this performance. The basis for the selection of the tests is described
in Chapter II, which analyzes the patrolman's working environment; the actual
tests selected and the criteria for selection are described in Chapter IV. Equal
care was exercised in the selection of the criterion measures. An appraisal of
patrolman performance, using the paired-comparison technique, was specifical-
ly implemented for this study, and its results are described in Chapter V. In
addition, seven other criterion measures were drawn from available records
kept by the Chicago Police Department. The most important of these were the
regularly implemented departmental appraisal and tenure. All of the criterion
measures are described in Chapter III.
Before the basic question of the predictability of these performance measures
could be answered, two subsidiary questions relating to the experimental design
had to be dealt with. Two separate samples of patrolmen, called the Wave I
and the Wave II samples, were used in this study; the basis for their selection
is described in Chapter III. A common core of tests was administered to both
samples. However in order to investigate as many predictor variables as
97

7 L.
possible within the necessary limitations of time, some tests used for the Wave I
sample were dropped and others substituted for the Wave II sample. One ques-
tion, therefore, was whether the contribution of Wave-specific tests could im-
prove predictions based only on Wave-common tests. If it could; then Wave-
specific validations were in order. The second question in relation to experi-
mental design concerned the validation technique which would be used. In
making this decision, the fact that both samples in thi study were composed of
a racially-mixed group of subjects had to be considered.
Should we succeed in selecting an appropriate validation technique and in
demonstrating a significant degree of association between the test and the per-
formance measures, we shall have reached the statistical objective of the val-
idation. Thereafter, it is necessary to identify those areas of measurement and
the specific test variables which contribute most heavily to the prediction. This
will establish the groundwork for a predictive validation study, which should
ordinarily follow the concurrent validation model employed here. Furthermore,
for purposes of test interpretation, currently employed patrolmen should be
described in terms of the predictive test variables identified in the validation.
The first approach to achieving these objectives and to answering the subsidiary
questions posed in this study was through a preliminary multiple-regression
analysis.
THE PRELIMINARY MULTIPLE REGRESSION ANALYSIS
The objective of the, multiple-regression analysis is to select those test variables
-- together with the proper weights which should be applied to them, called beta-
weights--which will best predict the criteria. Thereafter, the prediction forany individual is made by summing his properly weighted scores for each se-
lected test variable. In this analysis, the Wave I and Wave II samples were
treated separately. In addition each sample was subdivided by race into white
and Negro groups.
98
,,41

Multiple regressions on each of the eight criteria were calculated twice for each
subsample. The first analysis considered all possible variables for inclusion
in the model, while the second was restricted to those variables common to
both Waves. In each analysis, the test variable making the largest contribution
to the criterion variance was selected first for inclusion in the model. Its
effect was then partialled from the remaining variables, and the next largest
contributor was added. This selection process continued until the multiple cor-
relation corrected for statistical bias (R') failed to increase with a newly in-
cluded variable. The results of this preliminary analysis are summarized inTable 1,
The coefficients of multiple correlation (R) indicate the strength of the relation-
ship between the observed criterion measures and a prediction of those measures
based on the proper weighting of the test variables. The number of variables (m)
used to generate the prediction and the estimate of R corrected for statistical
bias (R') are also given. A further explanation of these measures may be found
in Chapter 16 of Guilford (1956).
Table 1 shows that for both the Wave I and the Wave II samples the magnitudes
of R' indicate significant relationships across the board for all criteria contrib-uting to the study. In general, however, the highest corrected correlations (inthe neighborhood of .6) were obtained for the first three criterion measures (the
paired-comparison rating, the CPD performance rating, and tenure) which are
regarded as the major criterion measures of the study. These results encourageus to believe that the tests selected for this study are significantly related to
many of the important aspects of police patrolman performance. Given the mag-nitudes of it should also be possible to select a smaller set of test variables
which will effectively predict the criterion measures. Of further interest is thefact that the magnitudes of R' based on tests common to both Waves tend to be
smaller than those based on Wave-specific tests. This discrepancy is moreevident for the Wave II sample than for the Wave I sample, suggesting that the
variables unique to Wave H may be important for police selection. In any event,

TE
ST B
AT
TE
RIE
S G
roup
sW
AV
E I
SA
MPL
E
Wav
e I
Tes
ts
Tls
ts in
Com
mon
o to
Bot
h Sa
mpl
es
Tot
alW
hite
Neg
roT
otal
Whi
teN
egro
WA
VE
II
SAM
PLE
Wav
e II
Tes
tsT
otal
Whi
teN
egro
Tes
ts in
Com
mon
Tot
alto
Bot
h Sa
mpl
esW
hite
Neg
ro
175
128 47 175
128 47
192
126 66
192
126 66
CH
APT
ER
VI
-- T
able
1
Mul
tiple
Cor
rela
tions
of
Tes
t Bat
teri
esw
ith C
rite
rion
Mea
sure
s
P.*
4O
-)C
,* .- 0
x>
fi
4S,
RR
mR
RR
RR
Rm
RR
mR
RR
mR
Ri
m.6
0.5
025
.67
.61
23.7
2.6
721
.57
.48
20.5
3.4
614
.47
.38
16.5
3.4
615
.55
.43
25.6
2.5
319
.66
.57
22.7
4.6
722
.59
.47
20.6
4.5
324
.51
.38
la.6
3.5
124
.67
.55
26.9
2.8
522
.90
.83
17.9
2.8
813
.85
.74
18.9
1.8
221
-89
.75
24.8
4.7
119
.96
.83
33.5
8.4
923
.65
.59
20.6
7.6
316
.47
.39
14.4
8.4
114
.44
.36
13.4
5.3
812
.50
.40
18.6
1.5
120
.63
.56
16.6
8.6
216
.47
.37
12.5
8.4
619
.43
.33
11.5
4.4
712
.59
.49
19.9
0.8
021
.94
.87
24.9
9.9
633
.86
.75
18.9
2.8
027
.93
.85
23.9
4.8
624
.85
.73
18
.67
.60
27.6
3.5
527
.81
.78
19.5
7.5
020
.61
.52
28.6
6.5
733
.54
.47
19.6
0.5
026
.77
.65
37.6
9.5
629
.84
.81
16.6
0.5
315
.65
.53
24.7
7.6
633
.55
.44
17.7
4.6
332
.98
.93
41.8
8.7
1926
.97
.93
37.8
8.7
928
.95
.89
36.8
8.7
729
.88
.80
24.9
5.8
643
.54
.48
16.5
0.4
317
.80
.78
15.4
9.4
117
.51
.43
16.5
8-5
119
.44
.37
12.3
8.2
913
.67
.57
24.5
9.4
819
.84
.81
14.4
5.3
611
.57
.50
13.6
5.5
719
.44
.33
12.5
0.4
113
.81
.73
18.9
3.8
535
.92
.88
20.8
7.7
925
.85
.76
23.8
6.7
526
.74
.62
17.7
5.6
021

this result prompted the decision to continue the multiple-regression analysesseparately for each Wave.
It should also be noted that for both the Wave I and the Wave II samples, and forboth the Wave-specific batteries and the tests common to both Waves, the mul-tiple correlations obtained for separate racial groups are higher than that ob-tained for the racially-mixed total group. For example, for the paired-comparison performance rating, the corrected multiple correlations for thetotal, white, and Negro groups in the Wave I sample are .60, .62, and .92respectively. In the Wave II sample the corresponding coefficients are .67, .77,and .98. Table 1 shows that the most spectacular increases and the greatestabsolute values of R' for all criteria studied were obtained for the Negro group.These results led to the decision to continue the two Wave analyses separatelyfor each racial group. Further results of these separate racial validations,together with a discussion of the recommendations for test usage made by theEqual Employment Opportunity Commission and also of the implications forfurther recruitment and selection, are presented in detail in the following Chapter.
THE PRINCIPAL MULTIPLE-REGRESSION ANALYSIS
The decision to partition the data by Waves and by racial groups forced a revi-sion in the proposed two-way cross-validation design. We had originally intendedto determine test variable beta-weights on the criteria for each Wave separatelyand then apply these weights to the other Wave. The sample used to derive beta-weights is considered the primary validation sample. The other sample towhich those weights are applied is referred to as the cross-validation sample.The correlations between the observed criteria and the predictions based on thebetas from the other Wave would have represented cross-validation indicesand would have shown how well the predictions fared across samples.
The major revision to this design was a result of the redefinition of the samples.The members of each Wave were randomly assigned to one of two parts, and eachpart was then divided into total. white, and Negro subsamples. Hence, there
101

were six subsamples per Wave, and, as a result, each Wave could provide its
own primary and cross-validation samples. For example, within each Wave, a
set of beta-weights was first generated using data from the Part 1, White sample
and then used to predict the criterion in the Part 2, White sample. In this case,
the Part 1 group would represent the primary validation sample while the Part 2
group would be the cross-validation sample. The correlation between the pre-
diction and the observed criterion value in the Part 1 data is equivalent to R and
is sometimes called the primary validation index. The same correlation, when
generated for the Part 2 data, can be called the cross-validation index. This
two-way feature is retained, since we treat the Part 2 sample as a primary
validation sample, derive the beta:mweights within it, and apply these to the Part 1
sample. In addition, this procedure is repeated in the given Wave for the Negro
subsamples, and for the total sample. Finally, the entire operation is carried
out in the other Wave. To accomodate this expanded design, the number of
criteria treated was reduced. It was felt that the paired-comparison rating,
the 1966 CPD rating, and CPD tenure represented the broad performance
measures pertinent to this study and that the other five more-narrowly-defined
measures could be dropped from consideration without loss of generality.
It was also decided to use more stringent controls in selecting variables for
the principal regression analysis. The previously described preliminary
regression procedure selected an unwieldy number of predictors, some of which
appeared to be adding very little to the model while others appeared to be acting
as suppressors. Both situations are unstable for cross validation.
The major considerations in selecting predictors are significance and direction-
ality. "Significance" refers to whether or not the magnitude of the simple cor-
relation (r) between any test variable and the criterion statistically exceeds zero
in a primary sample. These values of r depend on the sample size and can be
found in, tables such as those in Guilford (1956). "Directionality" refers to
whether or not a test variable which had a significant r in the primary sample
carried the same sign in the cross sample, irrespective of magnitude. Hence,
102;

a variable was selected for inclusion in the regression analysis if its correlation
with the criterion was significantly different from zero in the primary sample and
did not change its sign in the cross-validation sample. All variables thus selected
for any criterion in any primary sample were forced into the regression model,
the beta-weights were calculated, and the regression equation applied to the
cross-validation sample. The correlation between observation and predictionthen represented the cross-validation index.
Some investigators will consider that this procedure Jrw) the selection of the
variables introduces spurious effects into the cross-validation coefficients.
However, there seemed to be some good reasons for pursuing this approach.The data collected for the study restrict the approach to validation of concurrent
validation models. This means that any beta-weights derived from these datashould be expected only to predict current performance in new samples. Ofcourse, it may be of little practical value to use tests to predict current per-formance, since this can be more easily appraised by direct measurement.
However, it would be of immense value to be able to predict a person's futureperformance on the basis of present test results. If a variable shows consistent
and significant correlations with a criterion across four separate samples fromthe population of Chicago patrolmen, it seems reasonable to assume that thisvariable will show significant correlations with other samples of patrolmen.The identification of groups of variables showing such criterion correlations
should provide information on the areas of measurement covered in the battery
and the types of test which could be most fruitfully utilized in a predictive val-idation. Since the identification of such variables was one of the major objec-tives of this exploratory study, the approach taken was considered to be ofgreater ultimate benefit than the classically pure cross-validation procedure.
The results of this analysis are summarized in Tables 2 through 7. TheseTables present the information on the multiple correlation and the predictorvariables and an approximation of the cross validations. In the first section,the designation of the primary validation sample heads each column.
103

Immediately beneath this information is the size of the sample (N), the number
of predictor variables (m), the multiple correlation (R), and the R corrected
for statistical bias (R'). The predictor section presents the simple correlation
(r) of predictors with the specified criterion and their beta-weights (p) as cal-
culated for that primary sample. Wave-specific predictors are marked by an
asterisk. For the cross-validation section, the weights in the columns are
applied to data from the various samples indicated by the row headings. For
the cross-validation section of these Tables, the numbers presented,are the
correlations between predictions and observations of the criteria. Again, the
predictions are made by applying the beta-weights derived from the data of
the column to the data named in the row heading. The sets of four correlations
enclosed in the boxes represent the usual validation and cross-validation coef-
ficients with the restrictions imposed on the latter as discussed earlier. The
correlations based on beta-weights derived and applied to the same sample
represent primary validation indices and should agree with the R at the head of
the column. The other two numbers in each box show the results when weights
derived in one sample are used to generate predictions in another sample.
The chief focus of this Chapter is the within-Wave, within-race results. The
latter regressions, in general, produce the highest cross-validity coefficients,
as shown by the additional information given in the Tables for comparative pur-
poses. This fact tends to support our earlier decision to continue separate
validations for each subgroup.
IDENTIFICATION OF TEST VARIABLESMOST LIKELY TO PREDICT PATROLMAN PERFORMANCE
The first step in analyzing the results presented inthe Tables is to examine the
multiple correlations. The magnitude of R will indicate how well these variables
combine to predict the criteria. Secondly, the cross-validation results provide
information as to how far such predictions can be generalized across different
samples. Once the predictions generated are thus evaluated, the relative
104

importance of the predictor variables for the prediction of each criterion can be
determined. There are several considerations in making this determination. ,A
set of predictors with high primary and cross-validation indices may be ranked
by the absolute value of their beta-weights. However, since there are several
sets of predictors for each criterion, other rules must aid in this ranking. It
seems reasonable to attribute predictive importance to a variable that occurs
in several of the data sets available for that criterion. In addition, we may
state rules that would decrease the value of a variable used for predictions. If
a variable has a beta-weight opposite in sign to the correlation shown, that
variable may be considered to be a suppressor and not a predictor. In other
words, it is aiding prediction not by adding but by suppressing or subtracting
variance from the regression model. It has been our experience that although
suppressors aid in the primary validations, they are unstable between samples
and so hinder effective cross-validation. Hence, suppressors as well as pre-dictors with beta-weights of less than .10 will not be considered in this discus-
sion unless they occur consistently across different data sets.
PREDICTION OF THE PAIRED-COMPARISON RATING
Tables 2 and 3 show that the area of background and experience, as measured by
variables from the Personal History Index, contributes heavily to the prediction
of this criterion. The variable Early Family Responsibility appears in a posi-tive direction in three of the four possible within-race regressions for the Wave I
sample and may thus be regarded vs relevant to both racial groups. The only
other variable in this area with a possibility of overlap between the racial groups
is the negative prediction of Selling Experience, which occurs once each for the
Wave I and Wave II samples. The remaining variables are race-specific and,in the case of the white group, appear only in one or the other of the two possible
race-specific, within-Wave regressions. One would thus place less confidence
in their predictive validity. However, for the sake of completeness they are
listed here for the white group as positive weights for Parental Family Adjust-ment and Professional Successful Parents and a negative weight for School
105

CH
APT
ER
VI-
Tab
le 2
Val
idat
ion
and
Cro
ss-V
alid
atio
n R
esul
ts f
or P
CR
atin
g w
ithin
Wav
e I
(tot
al N
= 1
81)
MU
LT
IPL
E C
OR
RE
LA
TIO
NPA
RT
GR
OU
P1
TO
TA
L2
TO
TA
LN
8010
1m
54
R.3
8.4
1.3
0.3
6PR
ED
ICT
OR
Sva
r #
rPH
I1
Scho
ol A
chie
vem
ent
1
5 Fi
nanc
ial R
espo
nsib
ility
5
6E
arly
Fam
ilyR
espo
nsib
ility
6.2
4.`
19.20
13 V
ocat
iona
l Sat
isfa
ctio
n13
14 S
ellin
g E
xper
ienc
e14
19-.
18-.
2515
Gen
eral
Hea
lth15
AC
_11
Rea
soni
ng23
*. 1
9T
CIV
Exc
itabl
e34
V S
ocia
ble
35-.
19
-.11
b C
autio
usg
Ent
husi
astic
37 42-.
22
HA
ND
Inte
rper
sona
l. R
espo
nse
70*
Path
olog
ical
Sco
re83
*M
PIU
ndec
ided
86*
-. 2
4SI
With
draw
al88
-.19
-.08
Pass
ivity
89-.
17-.
00C
oope
ratio
n90
.23
.20
.26
.23
.20
Com
petit
ion
92-.
23A
-DI
Scor
e96
-.24
-.25
Num
ber
of R
espo
nseS
= 9
9-.
20-.
16
*Uni
que
to W
ave
I
CR
OSS
-VA
LID
AT
ION
PAR
T G
RO
UP
1T
otal
2 1W
hite
2
Neg
ro
.38
.23
.27
.41
.37
.17
.33
.42
-7;4
1-.4
414
.40
1W
HIT
E58 7
.59
.50
r -. 2
1
.17
=24
-.32 .3
0
-.28
-. 2
a--.
21
-.19 18
.11
.24
-.18
-.24
-.18
.36
.24
L.59 .2
1
-.02 .2
9
2W
HIT
E73
8.5
3.4
4 p-.
15
-. 3
2
1
NE
GR
O22 7
.73 .55
2N
EG
RO
286
.66 .52
-.50
-.30
-.30
.22
.33
.00
.34
.17
-.34
-.31
.34
.16
-.35
-. 4
0
-. 3
3 28-.
22
-.07
-.32
-.16
.03
.20
.33
.31
.30
.29
-.27
-.25
29-.
15
.21
.47
.21
.53
.25
.37
.22
.26
.05
.19 .73
.46
19 .29
.12
.19 .36
.66

CH
APT
ER
VI-
Tab
le 3
Val
idat
ion
and
Cro
ss V
alid
atio
n R
esul
ts f
or P
C R
atin
g w
ithin
Wav
e II
(tot
al N
=19
2)M
UL
TIP
LE
CO
RR
EL
AT
ION
PAR
T1
21
21
2
GR
OU
PT
OT
AL
TO
TA
LW
HIT
EW
HIT
EN
EG
RO
NE
GR
ON
9795
6165
3630
m6
59
77
7
R.4
9,4
6.5
9.61
.66
.75
R'
.43
.41
.49
.54
.54
.65
PRE
DIC
TO
RS
var
#re
rA
r A
_ _r
___A
_r
A_r
____
__A
PHI
1 Sc
hool
Ach
ieve
men
t1
-.27
-.21
Lea
ders
hip
and
Gro
up4
4Pa
rtic
ipat
ion
Ear
ly F
amily
66
Res
pons
ibili
tyPa
rent
al F
amily
77
.22
.15
Adj
ustm
ent
9 Sc
hool
Act
iviti
es9
Prof
essi
onal
-Suc
cess
ful
1010
Pare
nts
1.0
14 S
ellin
g E
xper
ienc
e14
0C
LO
SUR
E S
PEE
D18
.1T
CII
I Se
lf-R
elia
nt33
c D
ecis
ive
38i L
ivel
y44
j Per
seve
ring
45n
Self
-Con
fide
nt49
SIC
ompe
titio
n92
Tot
al95
Wit
4 A
rtis
tic a
nd I
nter
pret
ativ
e644
*-.
22-.
16
Asp
irat
ion
Lev
el65
4*C
RE
ET
otal
656*
Indi
ffer
ence
vs.
265
8*In
volv
emen
tU
nsys
tem
atic
, Sel
ectiv
e vs
.5
Syst
emat
ic, P
resc
ribe
d66
1*A
ctiv
ity12
Hig
h vs
. Low
Art
istic
668*
-. 2
8-.
18
-. 4
8-.
24E
PPS
Def
eren
ce67
1*.2
5.1
5.3
9.2
9
-.32
.10
.20
.14
.37
.11
-. 4
2-.
18
.28
.26
-. 3
6.05
-.38
-.19
.20
-. 2
6.2
8.2
4-.
24
-.24
.22
.27
.31
.21
-.27
-.32
-. 3
4-.
44-.
23.0
4-.
21-.
22-.
26.1
7-.
43
-. 2
5-.
20
-.24
.20
.28
-.20
-. 1
7
Aut
onom
y67
4*-.
22-.
12N
urtu
ranc
e68
0*A
ggre
ssio
n68
4**U
niqu
e to
Wav
e II
-.21
-.19
-.26
-.21
.23
.17
.21
.19
-.20
-. 3
6
-. 3
6-.
23
-.44
-. 1
0.4
4.2
1
.43
.23
-. 3
7-.
19
-. 3
4-.
10
.36
.3?

CR
OSS
-V
AL
IDA
TIO
N
+ea CO
PAR
TG
RO
UP
1T
otal
.49
.25
2,2
4.4
61
Whi
te.3
6.
332
.11
.48
1N
egro
.57
.15
2.4
9.4
6
4 I
.35
.05
.46
.32
.19
.40
.01
.12
g.59
.12
.24
.61
-. 0
5-.
11
.04
.08
.25
-. 1
4.2
2-.
17

Achievement. For the Negro group, we have the rather anomalous situation ofnegative weights for Financial Responsibility in two regressions and negative
correlations for Leadership & Group Participation in two regressions, but thebeta-weights have inconsistent signs. In addition, one regression for a Negro
group shows a negative weight on School Activities and Vocational Satisfactions
and a positive weight on General Health.
Another set of variables which contribute heavily to the prediction of the paired-
comparison rating are those derived from the Test of Social Insight. The var-iable Cooperativeness predicts positively in two sets of both white and Negro
regressions and, consistent with this, the variable Withdrawal predicts neg-
atively and occurs in one regression for each racial group. In addition to this,
Competitiveness appears in two white regressions only and predicts negatively.
In the area of behavior attributes as measured by the Temperament Comparator,the temperament trait Self-Confident predicts in a positive direction in both awhite and a Negro regression. The remaining variables are race-specific, withthe Negro groups showing negative weights on such traits as Enthusiastic andPersevering and on the factor Excitable, and the white group showing negative
weights on the traits Cautious and Lively but positive on Decisive.
On the Arrow-Dot Test, the total number of responses predicts negatively onboth white and Negro regressions and the Id dimension also predicts negativelyfor the white group.
Of the Wave-specific tests, those for Wave II tend to contribute more to pre-diction. These are the Edwards Personal Preference Schedule, the Cree
Questionnaire, and the Work Interest Index, but these results will not be dis-
cussed in detail although they are given in the Tables.
PREDICTION OF THE CHICAGO-POLICE-DEPARTMENT RATING
It will be seen from Tables 4 and 5 that the predictor variables which emerged
for this zriterion range across all the areas of measurement in the battery.
However, the most fruitful area from which to select predictors appears, again,
109

CH
APT
ER
VI-
Tab
le 4
Val
idat
ion
and.
Cro
ss-V
alid
atio
n R
esul
ts f
or C
PD R
atin
g w
ithin
Wav
e I
MU
LT
IPL
E C
OR
RE
LA
TIO
NPA
RT
GR
OU
PN m R R
#
1
TO
TA
L2
TO
TA
L1
WH
ITE
8010
158
114
9-
63.5
3.6
1.5
4.5
0.5
0
21
2W
HIT
EN
EG
RO
NE
GR
O73
2228
65
7.5
4. 6
5.
71.4
8.4
9.5
8PR
ED
ICT
OR
Sva
r #
La
EA
_i-
-p_
._sL
1._-
,_2:
____
__A
_PH
I2
Hig
her
Edu
catio
nal
Ach
ieve
men
t3
Dri
ve5
Fina
ncia
l Res
pons
ibili
tyE
arly
Fam
ily6
Res
pons
ibili
ty9
Scho
ol A
ctiv
ities
12 V
ocat
iona
l Dec
isiv
enes
sC
LO
SUR
E S
PEE
DA
C ,
II R
easo
ning
PRE
SS I
I-II
I_T
CI
Con
trol
led
V S
ocia
ble
d D
emon
stra
tive
k Pr
ompt
Sta
rter
m S
eeks
Com
pany
n Se
lf-C
onfi
dent
p So
cial
ly A
t Eas
eq
Stea
dy W
orke
rH
AN
DA
ctin
g O
ut R
atio
"Pat
holo
gica
l Sco
reB
EH
AV
IOR
IN
VE
NT
OR
YSI
-W
ithdr
awal
Pass
ivity
Coo
pera
tion
ESc
ore
S Sc
ore
2 3.2
1.3
2
. 17
.20
5-.
41-.
32
638
.31
.37
.33
.20
.13
9.2
2.2
212
.29
.29
18.4
3.1
423
*. 3
4.2
829
.21
.10
.20
.21
31.3
8. 1
535
-.22
-.23
-.21
-.06
39-.
19
-.21
-. 3
3-.
31
-. 3
4-.
22-.
2701
46.1
9-.
16. 3
2.2
6.2
5.1
1. 3
1.2
048
-.11
.04
49.2
5.2
251
-.42
-. 6
952
.28
11.3
7.2
580
*.4
0.2
083
*-.
19
-.19
-.20
-.25
87*
-. 1
8-.
0388
-.23
-.18
89-.
25-.
,18
-.19
-.10
-.35
-.34
90. 3
2.0
8.2
6.2
297
. 20
. 11
. 50
.21
98-.
28-.
08-.
51-.
39*U
niqu
e to
Wav
e I
CR
OSS
-VA
LID
AT
ION
PAR
T G
RO
UP
1T
otal
2 -.
Whi
te
. 63
.19
.20
.
.54
.25
Neg
ro.6
7-.
03
. 53
.10
.25
.38
.52
-.10.5
2.2
4.4
5.0
7.1
8.3
9.0
2-3
7.6
1.2
8.2
1.5
4.2
4.0
1-.
01.2
3
.
It.1
9.6
535
-.03

CH
APT
ER
VI-
Tab
le 5
Val
idat
ion
and
Cro
ss-V
alid
atio
n R
esul
ts f
or C
PD R
atin
g w
ithin
Wav
e II
MU
LT
IPL
E C
OR
RE
LA
TIO
N'
PAR
TG
RO
UP
N m RI
PRE
DIC
TO
RS
PHI
1 Sc
hool
Ach
ieve
men
t5
Fina
ncia
l Res
pons
ibili
ty8
Stab
ility
Prof
essi
onaI
-Suc
cess
ful
Pare
nts
15 G
ener
al H
ealth
CL
OSU
RE
SPE
ED
PER
CE
PTU
AL
SPE
ED
PRE
SS I
-U
TC
j Per
seve
ring
n Se
lf-C
onfi
dent
SIPa
ssiv
ityC
oope
ratio
nC
ompe
titio
nA
ggre
ssio
nT
OT
AL
WII
3 A
utho
rity
& P
rest
ige
4 A
rtis
tic a
nd I
nter
pret
ativ
e5
Art
istic
and
Sty
lized
6 A
rtis
tic a
nd C
reat
ive
11 M
echa
nica
l & P
rodu
ctiV
eC
RE
E T
OT
AL
1 D
omin
ance
vs.
Sub
mis
sion
12 H
igh
vs. L
ow A
rtis
ticE
PPS
Ach
ieve
men
tD
efer
ence
Nur
tura
nce
End
uran
ceH
eter
osex
ualit
y
CR
OSS
-VA
LID
AT
ION
PAR
T1 2
var
#
12
TO
TA
LT
OT
AL
9795
65
.54 49
.39
12
WM
TE
WH
ITE
6165
105
. 62
.39
51.2
9.
701N
EG
RO
36 11 . 80
2N
EG
RO
30 6. 7
4. 6
5
1-.
23-.
215 8
.28
.25
10 15 18 20 28-.
22-.
19
45
.23
.20
.20
.23
.21
-. 2
6-.
24-.
31
-. 2
6
.17
.25
.20
.02
-.20
-. 1
3-.
25
.40
.21
5232
49.2
1.2
289
-.20
-.07
.35
.26
90.2
0.
1920
. 11.
.26
. 12
92-.
29-.
38
94-.
36
-.20
95-.
20. 1
764
3*-.
33
-.09
644*
-. 3
1-.
23-.
51
-.03
645*
-. 4
4-.
2264
6*-.
.30
-.15
-. 2
012
-. 3
8-.
00
651*
-. 4
0-.
2165
6*. 2
2.
1665
7*-.
38
-. 1
466
8*27
-.04
-.37
.04
-.35
-.24
670*
-. 2
1-.
19.
-. 4
1-.
20
671*
.33
.41
.43
.17
680*
.20
.13
.43
.29
682*
.22
.24
683*
-. 3
5-.
06*U
niqu
e to
Wav
e II
GR
OU
PT
otal
.54
.25
. 39
-.07
. 35
.24
.23
.44
.24
.25
. 10
.29
1W
hite
1N
egro
2 2
.44
.12 . 57
. 37
.33
.38
.62
.25
. 15
. 39
. 17
.63
.20
.20
-. 4
6-.
05
.06
.03
.08
. 10
. ao
34.3
7.7
4

to be background and experience as measured by the dimensions of the Personal
History Index. The variable Early Family Responsibility, which occurred across
racial groups in predicting the paired-comparison performance rating, occurs
again with a positive weight for the CPD rating but only in two sets of regressions
for white groups. A new variable, Stability, has positive weights in both white
and Negro regressions. The remaining predictors are race-specific, withpositive weights shown by white groups for the variables Professional-Successful
Parents, which also occurred for the paired-comparison criterion, and General
Health, and with additional positive weights for the variables School Activities
and Higher Educational Achievement, One Negro group Ghows a positive weight
for Vocational Decisiveness, and the variable Financial Responsibility, which
occurred previously with rather anomalous negative weights, again appears on
two Negro groups but with inconsistent signs»
The Test of Social Insight also provides some useful predictors for the Chicago-
Police-Department rating. The variable Cooperativeness appears again with a
positive weight in three out of the four sets of regressions for the white group.
Competitiveness again appears in a white regression with a negative weight. A
new variable, Aggression, appears with a negative weight for a Negro group.
Although Passivity occurs across racial groups, its signs are inconsistent for the
Negro grbup but negative for the white group.
The behavioral measures derived from the Temperament Comparator appear to
be more important for differential prediction for the racial groups. Eight
variables emerge as predictors, but of these only two, the traits PromptStarter with positive weights and Demonstrative with negative weights, predict
in both white and Negro regressions. 'The remaining predictors with positive
weights for the white group are the traits Self-Confident and Steady Worker and
with negative weights, the trait Persevering and the factor Sociable. TheNegro group shows a positive Weight on the factor Controlled and a negative
weight on the trait Socially Ft Ease.
112

The Arrow-Dot Test provides predictors only for the Negro group with a positive
weight on Ego Control and a consistent negative weight on the Superego variable.
In the area of mental abilities, both the Closure Speed and Perceptual Speed
tests are predictors for the white group but in a negative direction. The
Closure Speed test does, however, predict positively for a Negro group. The
results in the mental ability area will need to be analyzed further, since these
are the ones most likely to be affected by the civil service screening of patrol-men.
Of the Wave-specific tests, the most useful appear to be the Work Inten'est Index,
the Edwards Personal Preference Schedule, and the Cree Questionnaire.
PREDICTION OF TENURE
In attempting to predict tenure, we are predicting a rather different dimension
of patrolman behavior than that represented in the paired-comparison and CPD
performance ratings. One may thus expect rather different variables to appear
as predictors. Another way in which the tenure criterion differs from the per-
formance ratings is in the obtained validity coefficients. Although the within-
race coefficients are still greater than those obtained from racially-mixedgroups, the disparity between them is much less. Therefore, one may expect
a greater interchangeability in the test variables which predict this criterion
for the two racial groups.
It will be seen from Tables 6 and 7 that the Personal History Index again pro-
duces a sizable number of predictors , seven. Of these seven, four have consis-
tent weightings across racial group regressions. These are positive weightsfor Stability, Financial Responsibility, and Higher Educational Achievement,
and negative weights for Vocational Satisfaction. In addition, the white groups
show positive weights on Early Family Responsibility and Parental Family Ad-
justment and a negative weight on Leadership & Group Participation. These
results are in accordance with those obtained in predicting tenure for other
113

CH
APT
ER
VI-
Tab
le 6
Val
idat
ion
and
Cro
ss V
alid
atio
n R
esul
ts f
or T
enur
e w
ithin
Wav
e I
MU
LT
IPL
E C
OR
RE
LA
TIO
NPA
RT
GR
OU
PN m R It
°PR
ED
ICT
OR
Sva
r #
Hig
her
Edu
catio
nal
PHI
22
Ach
ieve
men
t5
Fina
ncia
l Res
pons
ibili
ty5
6 E
arly
Fam
ily R
espo
nsib
ility
63
Stab
ility
13 V
ocat
iona
l Sat
isfa
ctio
nN
ON
-VE
RB
AL
RE
ASO
NIN
GU
ND
ER
STA
ND
ING
CO
MM
.C
LO
SUR
E S
PEE
DPE
RC
EPT
UA
L S
PEE
DA
C I
II O
rigi
nalit
yPR
ESS
I U
TC
I C
ontr
olle
db
Cau
tious
d D
emon
stra
tive
kPro
mpt
Sta
rter
HA
ND
Env
iron
men
tal
MPI
Ext
rove
rsio
nA
-DI
Scor
eE
Sco
re
CR
OSS
-VA
LID
AT
ION
PAR
T1 2 1 2 1 2
8 13 16*
17*
18 20 24*
25 26 27 29 31 37 39 46 71*
84*
96 97
12
12
TO
TA
LT
OT
AL
WH
ITE
WH
ITE
8010
158
7311
127
14.6
9.6
8.7
0.6
6.6
2.6
2.6
5.5
5r
_a_
.L ,:
.A
_,.
.28
.17
.39
.33
.29
.14
.39
.31
.30
.22
.42
.10
-.23
-.11
-.23
-. 1
6
-.22
-.03
-.42
-.14
.29
.24
.26
.19
.29
-.04
-.32
-z 2
6*U
niqu
e t4
:- W
ave
I
GR
OU
PT
otal
Whi
te
Neg
ro
.31
.15
.25
.11
.56
.21
-.40
-.18
-. 1
8.1
1-.
26-.
04-.
26-.
06-.
27.0
5
-.30
.1,*
-.33
-.07
-.38
-.16
.30
.24
.27
.13
.26
.21
.40
.06
.47
.02
-.34
-.09
-.30
.14
-.26
.01
-.34
-.02
-.29
-.15
-.30
.27
-.46
-.31
-.36
-.30
.31
.17
.23
-.06
-.24
.16
.72
.50
.70
.77
.52
.62 62 .89
.28
.24
-.33
-.28 .6
7.5
1.70
.45
.62
.69
-.21
-.21 .4
7.6
6.4
7.6
6
1
NE
GR
O2
NE
GR
O22
286
8-8
0.9
4.7
0.9
2
.32
.08
.39
.40
.44
.16
.45
.23
.70
.50
.85
.51
-.59
-.24
-.43 -.37
-.10
.30
.15
-.30
-.22
.38
.08
-.39
-.21
-.46
.08
.53
.50
.57
.65
.51
.49
.48
.62
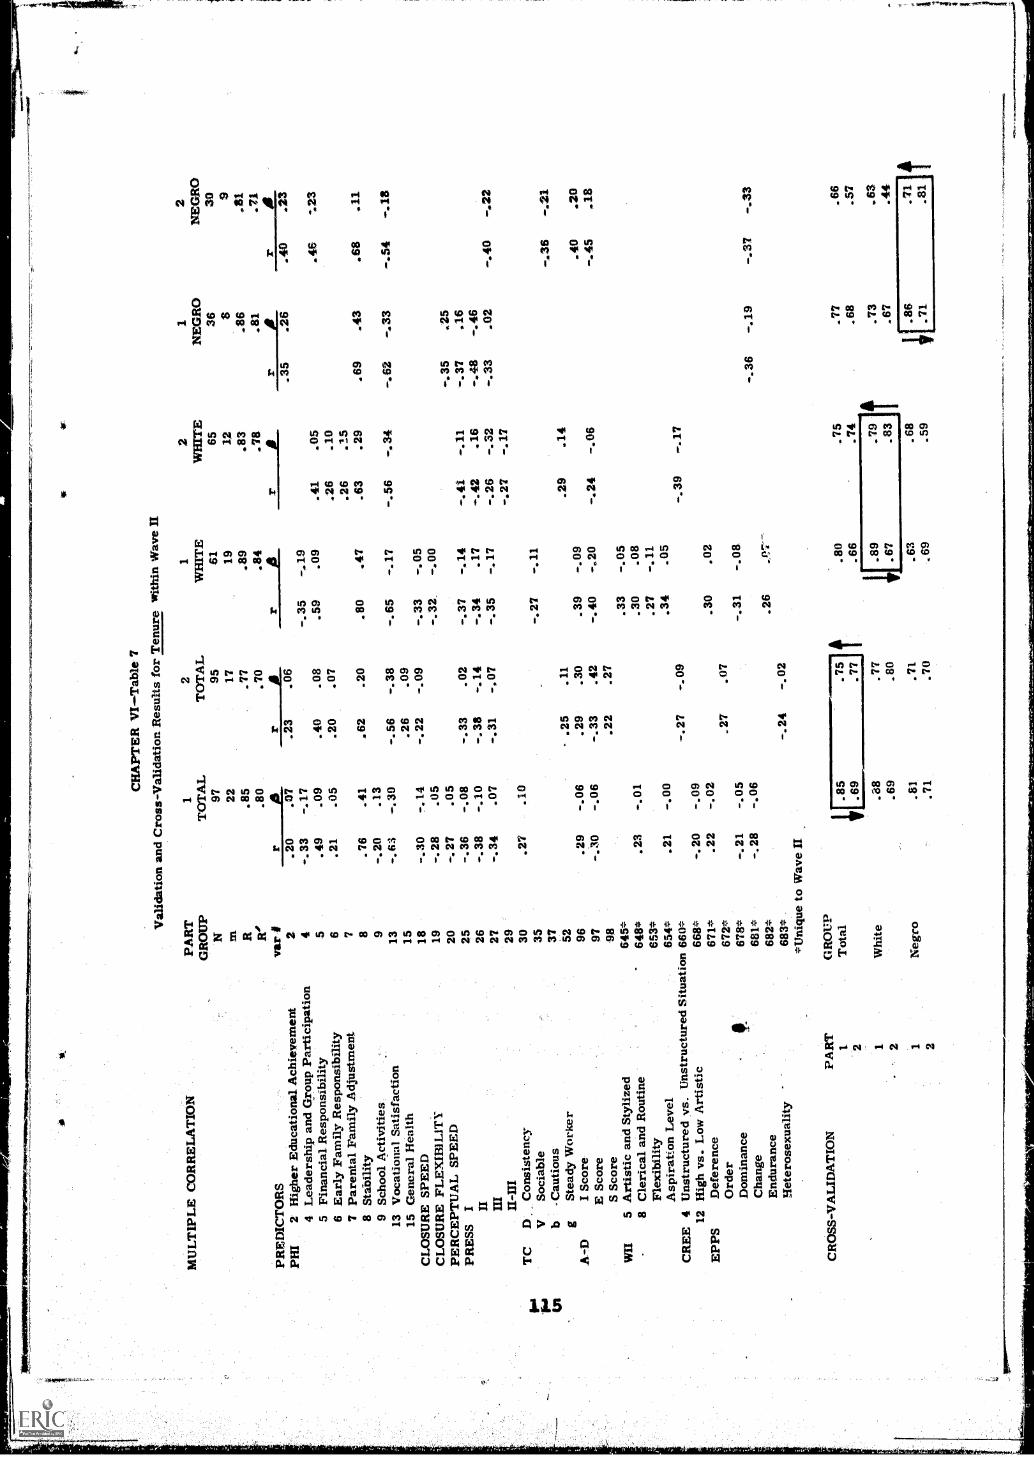
CH
APT
ER
VI-
Tab
le 7
Val
idat
ion
and
Cro
ss-V
alid
atio
n R
esul
ts f
or T
enur
e w
ithin
Wav
eH
MU
LT
IPL
E C
OR
RE
LA
TIO
NPA
RT
GR
OU
P1
TO
TA
L2
TO
TA
LN
9795
m22
17R
.85
.77
R°
.80
.70
PRE
DIC
TO
RS
vas.
1ai.i
PHI
2 H
ighe
r E
duca
tiona
l Ach
ieve
men
t2
.20
.07
.23
.06
4 L
eade
rshi
p an
d G
roup
Par
ticip
atio
n4
-.33
-.17
5 Fi
nanc
ial.
Res
pons
ibili
ty5
.49
.09
.40
.08
6 E
arly
Fam
ily R
espo
nsib
ility
6.2
1.0
5.2
0.0
7
7 Pa
rent
al F
amily
Adj
ustm
ent
7
8 St
abili
ty8
.76
.41
.62
.20
9 Sc
hool
Act
iviti
es9
-.20
.13
13 V
ocat
iona
l Sat
isfa
ctio
n13
-.63
-.30
-.56
-.38
15 G
ener
al H
ealth
15.2
6.0
9C
LO
SUR
E S
PEE
D18
-.30
-.14
-.22
-.09
CL
OSU
RE
FL
EX
IBIL
ITY
19-.
28.0
5PE
RC
EPT
UA
L S
PEE
D20
-.27
.05
PRE
SS I
25-.
36-.
08-.
33.0
2II
26-.
38-.
10-.
38-.
14II
I27
-.34
.07
-.31
-.07
11-I
ll29
TC
DC
onsi
sten
cy30
.27
.10
liaa
VSo
ciab
le35
IPb
-Cau
tious
37
gSt
eady
Wor
ker
52-
.25
.11
A-D
I Sc
ore
96.2
9-.
06.2
9.3
0E
Sco
re97
-.30
-.06
-.33
.42
S Sc
ore
98.2
2.2
7W
II5
Art
istic
and
Sty
lized
645*
8 C
leri
cal a
nd R
outin
e64
8*.2
3-.
01Fl
exib
ility
653*
Asp
irat
ion
Lev
el65
4*.2
1-.
00C
RE
E 4
Uns
truc
ture
d vs
. Uns
truc
ture
dSi
tuat
ion
660*
-.27
-.09
12 H
igh
vs. L
ow A
rtis
tic66
8*-.
20-.
09E
PPS
Def
eren
ce67
1*.2
2-.
02O
rder
672*
_27
.07
Dom
inan
ce67
8*-.
21-.
05C
hang
e68
1*-.
28-.
06E
ndur
ance
682*
Het
eros
exua
lity
683*
-.24
-.02
*Uni
que
to W
ave
II
CR
OSS
-VA
LID
AT
ION
PAR
TG
RO
UP
1T
otal
.75
2[.
85 .69
.77
1W
hite
.38
.77
2.6
9.8
0
1N
egro
.81
.71
2.7
1.7
0
1W
HIT
E61 19 .89
.84
....2
.
-.35
-.19
.59
.09
.80
.47
-.65
-.17
-.33
-.05
-.32
.-.
00
-.37
-.14
-.34
.1?
-.35
-.17
-.2?
-.11
.39
-.09
-.40
-.20
.33
-.05
.30
.08
.27
-.11
.34
.05
.30
.02
-.31
-.08
.26
_0.7
--
.80
.66
I.8
9.6
7.6
3.6
9
2W
HIT
E65 12 .83
.78
1N
EG
RO
368
.86
.81
2N
EG
RO
30 9.8
1.7
1r
rr
A.3
5.2
6.4
0.
.41
.05
.46
.23
.26
.10
.26
.15
.63
.29
.69
.43
.68
.11
-.56
-.34
-.62
-.33
-.54
-.18
-.35
.25
-.41
-.11
-.37
.16
-.42
.16
-.48
-.46
-.26
-.32
-.33
.02
-.40
-.22
-.27
-.17
-.36
-.21
.29
.14
.40
.20
-.24
-.06
-.45
.18
-.39
-.17
-.36
-.19
-.37
-.33
.75
.66
.74
.68
.5?
.79
.73
.83
.67
.44
.68
.86
.71
.59
.71
.81

occupational groups. However, a word of caution must be introduced here. The
use of the variable Stability for the prediction of tenure for currently employed
personnel will cause a spurious increase in the magnitude of the obtained coef-
ficients. This variable was designed and intended for use in predictive validity
studies.
The Press Test also produces some predictors for this criterion. Part III of the
test is consistent in its negative weightings in seven out of the eight possible
white and Negro regressions, and Part I may aid in the white regressions. Thefairly frequent changes in sign between the zero order correlations and their
corresponding beta-weights suggest that Part II may be acting as a suppressor
variable in this system of test variables.
The Temperament Comparator is of less importance in the prediction of tenure,
and only a few scattered variables appear. On the Arrow-Dot Test, there are
some negative weights on the Ego Control variable for the white group but the
Negro group shows fluctuations in the beta-weight signs.
Of the Wave-specific tests, 'the Edwards Personal Preference Schedule produces
one variable each for the white and Negro groups and the Cree Questionnaire
a variable for the white group There are a number of variables from the Work
Interest Index,, but they have low beta-weights in this concurrent validation
dealing with currently employed patrolmen.
IDENTIFICATION OF THE IMPORTANT PREDICTOR VARIABLESIN THE STUDY
The important predictor variables which have emerged from the eight sets of
multiple-regression analyses, performed for each of the three major criterionmeasures in the study, cover all the areas of measurement included in the test
batteries.
116

Motivational MeasuresfO1M1.11YM ..
The motivational measures of background and experience, derived from the
Personal History Index, are more important than those of work interests. In
fact, the Personal History Index variables contribute more to the prediction of
all three criteria than do any others inthe study. However, work interests, asmeasured by the Work Interest Index, cannot be ignored since they do make some
contributions to all three criteria. Although their beta-weights are low for the
prediction of tenure, one could reasonably expect that these work-interest var-
iables would increase in importance in the selection of new recruits, especially
those who have not had much prior work experience to be assessed by the
Personal History Index.
Intellectual Measures
The intellectual measures include both specific mental abilities and special
aptitudes. Of the specific mental abilities, those dealing with visual perception
appear to the most important. However, for groups of white patrolmen the beta-
weights on Closure Speed and Perceptual Speed are negative. Negro patrolmen
show conflicting positive and negative weights on Closure Speed. Actually, the
whole mental abilities area is the one most likely to have been affected by the
civil service screening of patrolmen, which eliminates candidates with IQs
of less than 100. Thus, in testing currently employed patrolmen, we are dealing
only with a curtailed sample with respect to intelligence. Final conclusions
concerning the required mental abilities for success; as a patrolman must await
a predictive validation study based on unscreened applicants to the police force.
Of the special aptitudes, those dealing with social insight, as measured by the
Test of Social Insight, are the most important. In fact, the Test of Social Insight
ranks second only to the Personal History Index in the prediction of the perfor
mance criterion measures, although it does not contribute to the prediction of
tenure. The Cree Questionnaire, a measure of creative potential, is anotheruseful aptitude. test for the prediction of performance. However, its inclusion
in a battery would depend upon the other tests selected and the time available
for testing.
117

Behavioral Measures
The most useful test in this third area is the Temperament Comparator, which
ranks with the Test of Social Insight in the prediction of the performance criteria.
It also has scattered variables which make some contribution to the prediction
of tenure. Of the remaining tests in the behavioral area, those which contribute
somewhat to all three criteria are the Press Test, the Arrow-Dot Test, and the
Edwards Personal Preference Schedule. The Press Test and the Arrow-Dot
Test have time limits of five and six minutes respectively. The Edwards
Personal Preference Schedule is untimed, and patrolmen took between 30 and 40
minutes to complete it. Thus, the Press Test and the Arrow-Dot Test make
greater contributions relative to expended testing time and are therefore to be
preferred in the battery.
Some of the important areas of measurement and the specific variables con-
tributing to them have been identified by the multiple-regression analyses. The
"mortality rate" of tests selected for try-out in the batteries was gratifyingly low,
indicating an initially relevant selection of tests for the Wave I sample. Further-
more, tests which were substituted in the Wave II sample were generally more
predictive than those dropped from the Wave I sample. Hopefully, this is a
result of the experience gained from the initial validations. We should be in a
very good position to select tests for a predictive validation study.
PATTERNS OF TEST-VARIABLE SCORESLIKELY TO BE MOST PREDICTIVE OF PERFORMANCE
Our next aim in this Chapter is to describe the patterns of test-variable scores
likely to be most predictive of good performance on the part of currently em-
ployed patrolmen. The first step in arriving at these patterns was to combine each
racial group from Wave I with the similar group from Wave II. Then the respective
mean scores for the test variables were calculated and converted to a normalized
standard score scale as described in the Appendix of Chapter III. In order to
keep the sample constant, only tests which were common to both Wave samples
118

were used. The converted scores were profiled separately for the white and
Negro groups. An examination of the profiles will show that there are some dif-
ferences between the white and Negro mean scores. Significant racial dif-
ferences, not only for the total sample but for the Wave I and Wave II samples
separately, and their implications are discussed fully in the following Chapter.
Our focus here is a general description of the "highs" and "lows" which may be
expected in the profile of each racial group,
The profiles for the dimensions of the Personal History Index are shown in
Figure 1. The General Industrial Norms developed by the Industrial Relatioais
Center over the past two decades were used here in making the conversion to
normalized standard scores. It is of interest to note that the profiles for the
patrolman groups fall approximately at the level which would be expected for
first-line supervisors in industrial organizations.
In discussing the profiles, the two performance criteria will be treated together
whenever possible, since there is a fair amount of overlap in the variables which
predict them. The tenure criterion will be dealt with separately. The results of
the multiple regressions indicate that, for good performance, both racial groups
should score relatively high (positive beta-weights) on the dimensionEarly FamilyResponsibility and relatively low (negative beta-weights) on Selling Experience.
In addition, white groups should score higher in relation to the group mean on
the dimensions Parental Family Adjustment and Professional-Successful parents.
Negro groups should score higher on the dimension General Health, and it is
acceptable for them ti.-; score lower on the dimension Financial Responsibility and
possibly also on School, Activities and Vocational Satisfaction.
In predicting tenure, one would look for relatively higher scores for both racial
groups on the dimensions Higher Educational Achievement, Financial Responsi-
bility, and Stability and lower scores on Vocational Satisfaction. The negative
weight for Vocational Satisfaction is not inconsistent with the definition of this
dimension which indicates that satisfaction has been derived not from achieving

CHAPTER VI Figure 1
Profiles Based on Mean Scores*of the Combined White (N=358) and Combined Negro (N=154) Subgroups
on Dimensions of the Personal History Index
1.10110111111111111111111111111
1111111111 OMNI OM
White SubgroupNegro Subgroup
Variable
1. School Achievement
2. Higher Ed. Achievement
3. Drive
4. Leadership & Group Part
5. Financial Responsibility
6. Early Family Responsibility-
7. Parental Family Adjust.
8. Stability
9. School Activities
10. Prof. Successful Parents
11. Educ. -Voc. Consistency
12. Vocational Decisiveness-
13. Vocational Satisfaction-
14. Selling Experience
15. General Health
Normalized Standard Scores .
35
r Low
Low Average40 45
Average50 55
HighAverage
60
High65
2 e .0'.0' 47
. iE" . 47
9
44./45
40r
421
4
4
44
44
46 %
I 49
5146
46
oe,1/*
.6
49
4944 t
47
4950
49
Conversion by General Industrial Norms
120

high goals but rather from an easy acceptance of the occupational requirementsto be met. In addition, white groups should show higher scores on Early FamilyResponsibility and Parental Family Adjustment but lower scores on Leadership& Group Participation.
The profiles on the three mental ability tests common to both Wave samples areshown in Figure 2. Here again the General Industrial Norms were used forconversion, and apart from' Perceptual Speed, where first-line supervisorsscore at the median, the patrolman profiles tend to be higher than those of thefirsts-line supervisor and to approximate the level expected for industrialsalesmen. This fairly high level of mental abilities is probably a result of thecivil service screening procedure. It is possible that perceptual skills areamong the more important of the mental abilities for patrolmen. However, sincethe mental abilities area is the one most likely to be affected by civil service'screening, a more definitive interpretation of the worth of these measures mustawait a predictive validation study.
The profiles for the Test of Social Insight are shown in Figure 3. Since thistest has not been previously used by the Industrial Relations Center, the con-version was made using the Adult Male Norms supplied in the test manual. Thusa comparison of patrolmen with the general industrial population is not possible.The results of the multiple-regression analyses indicate that for successfulperformance both racial groups should score higher on Cooperativeness andlower on Withdrawal and Competitiveness in social situations. In predictingthe CPD performance rating, there are indications that a low score on Passivitywould be desirable.
The profiles for the factor scores and the trait scores from the Temperament
Comparator are shown in Figures 4 and 5. The first observation of importanceis that although there are some differences in level between the profiles for thewhite and Negro subgroups, there is a perceptible similarity in the shapes of thetwo profiles. Since both groups are employed patrolmen, this finding in itselfattests to the stability or reality of this occupational profile. The GeneralIndustrial
121

IBM MIR flogO
CHAPTER V I -- Fig! ire 2
Profiles Based on Mean Scores*of the Combined White (N=358, 355, 346) andCombined Negro (N=154, 153, 151) Subgroups
on Tests of Specific Mental Abilities
White SubgroupNegro Subgroup
PERCEPTUAL SKILLS
1 Closure Speed2 Closure Flexibility3 Perceptual Speed
Normalized Standard Scores J35
Low
40
I Low
Average45
Average50 55
HighAverage
60
High65
491 r4
4
46asmrismusa*

CHAPTER VI Figure 3
Profiles Based on Mean Scores*of the Combined White (N--355) and Combined Negro (N=152) Subgroups
on Dimensions of the Test of Social Insight
Normalized Standard Scores
Withdrawal
Passivity
Cooperation
Competition
Aggression
TOTAL
Conversion by adult Male Norms sup lied in the test m 'n ration
4
rs4,

CHAPTER VI -- Figure 4
Profiles Based on Mean Scoresof the Combined White (N=330) and Combined Negro (Nia139) Subgroups
on the Factor Scores from the Temperament Comparator
White Subgroup.--- Negro Subgroup
FACTORS
1 Controlled
2 Stable
Normalized Standard ScoresLow High
Low Average Average Average High
35 40 45 50 55 60 65
49
3 Self-Reliant
4 Excitable
5 Sociable
48
4
5253
47
4
49
53
51
* Conversion by General Industrial Norms
124.

CHAPTER VI -- Figure 5
Profiles based on Mean Scores*of the Combined White (N=330) and Combined Negro (N=139) Subgroups
on the Trait Scores from the Temperament Comparator
- -- White SubgroupNegro Subgroup
TRAITSa. Calmb. Cautiousc. Decisived. Demonstrativee. Emotionally Stablef. Energeticg. Enthusiastich. Even-Temperedi. Livelyj. Perseveringk. Prompt StarterI. Quick Worker
m. Seeks Companyn. Self-Confidento. Seriousp. Socially at Easeq. Steady Worker ----r. Talkative
Consistency ,11,0.11.
Normalized Standard Scores
1
35
Low
Low
Average0 45
Average50 55
High'Average
6
High65
Al54
49
451
46
47 KM49
49
r` 5V11111d
46148
46%.
501
50
PrmaiimUlli47.
* Conversion by General Industrial Norms
li
125

Norms were used for conversion, and again the patrolman samplers are closer tothe scores of the first-line supervisor than they are to those of other industrialgroups, such as hourly, sales, or executives. The general characteristic ofthe patrolman profiles, like that of the first-line supervisors, is a lack of ex-
treme variations in the factor scores and a tendency to score above the mean on
the factors Controlled and Stable and below on the factors Excitable and Sociable.
The major discrepancy between the patrolman and supervisor profiles is that
the supervisors are even less socially and more work oriented than are the pa-trolmen. Since the factor scores are based on combinations of trait scores,
scores above the mean on such traits as Calm and Cautious, which contribute
to the Controlled and Stable factors, are to be expected.
Results of the multiple regressions indicate that it is desirable for the Negro
group to score relatively lower (negative beta-weight) on the factors Excitableand Sociable. In predicting the CPD rating, it is desirable for the white group
to score lower on the factor Sociable and the Negro group higher on the factorControlled. In addition, the multiple regressions indicate that for purposes ofpredicting the performance criteria, both white and Negro groups should score
higher on the trait Self-Confident. The only other regression weights in common
to the racial groups occur in predicting the CPD rating, where it is desirable to
show a lower score on the trait Demonstrative--which is in accordance with therequirement of a high score for the factor Stable--and higher scores on the
trait Prompt Starter, indicative of a work rather than a social orientation. Theremaining regression weights are race-specific but largely in accordance withthe general interpretation of the profiles.
Profiles for the Press Test, a test of pressure tolerance, are shown in Figure 6.The differences between the racial group means are more evident here and arediscussed in detail in the following Chapter. However, once again the generalshape of the profiles for the two racial groups is similar. There is someevidence from the regression analyses that Parts I and III of the test may be
126

CHAPTER VI Figure 6
Profiles Based on Mean Scores*of the Combined White (N=353) and Combined Negro (N=154) Subgroups
on Dimensions of a Test of Pressure Tolerance
- -- White SubgroupNegro Subgroup
Part I
Part I I
Part i I I
Part I II
Part II -III
ow
Normalized Standard Scores
35
Low
40
Low
Average45
Average50 55
HighAverage
60
High65
44// 46,
4501 4
45
4
50
54
* Conversion by General Industrial Norms
127

predictive of tenure for both racial groups. There is also evidence that thederived scores may be predictive of the CPD rating for the white subgroup.With respect to the interpretation of the scores, it should be pointed out thatscores below the median for the first three parts of the Press Test have beenfound to be' associated with high scores on the Controlled and Stable factors ofthe Temperament Comparator. The results of this objective test of tempera-ment are, therefore, used as a check on the subjective assessments obtained
from the Temperament Comparator. In this study, these two tests are con-sistent with respect to the behavior characteristics ascribed to the patrolmen.
Figure 7 shows the profiles for the Arrow-Dot Test. The raw scores were e
converted by means of norms based on the total patrolman sample in this study.
A shorter version of this test had previously been used in research conducted by
the Employee Appraisal Section of the Chicago Police Department's Personnel
Division. The profile for the white subgroup is similar to that identified by th'Appraisal Sectio I's research as representing successful patrolman performance.
This profile exhibits a relatively lower score on the Id dimension, which
measures the tendency to uncontrolled, impulsive behavior, a lower score on theSuperego dimension, which measures interior controls viewed as external re-strictions, and a higher score on the Ego dimension, which is essentially a mea-sure of the ability to function realistically. The results of the regression analy-ses accord with these interpretations. Thus, in predicting the paired-comparison
performance rating, it is desirable for the white group to score low on the Id
dimension, and in predicting the CPD rating, it is desirable for the Negro group
to score low on the Superego dimension and high on the Ego dimension.
SUMMARY
The basic objective of the validation of the occupational test batteries was to
determine the extent to which the selected tests could account for differences in
the performance of patrolmen. The results of the preliminary regression analy-sis indicated significant and acceptably high relationships between the tests and
all eight of the performance criterion measures used in the study. These
128

CHAPTER VI -- Figure 7
Profiles Based on Mean Scores*of the Combined White IN=358) and Combined Negro IN=154) Subgroups
on Dimensions of the Arrow-Dot Test
5
MIMI 1=1111
White SubgroupNegro Subgroup
Normalized Standard ScoresLow Hign
Low Average Average Average High35 40 45 50 55 60 65
I. Id / 5 3
Ego
3. Superego
* Conversion by Norms Based on the Total Patrolman Sample
129

relationships were increased slightly by the substitution of some additional
tests in the battery used for the second sample of patrolmen.
The preliminary analysis also revealed that higher validity coefficients (or more
significant relationships) were obtained for the racial groups treated separately
than for the racially-mixed total group. As a result of this finding, the original
experimental design was revised for the validation and cross-validation study
conducted for the three major criterion measures--the paired-comparisonperformance appraisal, the Chicago-Police-Department performance rating,
and tenure. The cross-validation, as revised, demonstrated stability on a num-ber of the test variables across patrolman groups and led to the identification
of the areas of measurement and the tests likely to be most effective in the pre-
dictive validation study which would ordinarily follow the concurrent validation
undertaken here.
Finally, some of the attributes of currently employed patrolmen were described
through the interpretation of group profiles on the predictive tests. A consistent
picture emerged of the personal background characteristics, some of the special
skills required in social situations, and of the behavior attributes which were
likely to contribute to the successful performance of police officers.
REFERENCES
Equal Employment Opportunity Commission. Guidelines on employment testingprocedures. Washington, D.C.: EEOC, August 24, 1966.
Guilford, J.P. Fundamental statistics in psychology and education. (3rd ed.)New York: McGraw-Hill Book Company, Inc., 1956.
130

CHAPTER VII
Validation of an Occupational Test Batterfor a JiaciallyMxed Group,
The total occupational group of beat patrolmen in the Chicago Police Department
comprises two major racial subgroups. At the present time, about three quar-ters of its membership is drawn from the white population and the remaining
quarter from the Negro. Early in the study, it became clear that the racially-mixed composition of the group would require the use of special procedures and
techniques, particularly during the validation of the occupational test battery.
The problems thus introduced were not unique to this project. They are insep-
arable from larger issues and controversies which have only recently risen to a
prominent place in psychology and in society at large. Below is a brief histori-
cal review of the major developmentsall within the last decade--which supply
the framework for the validation section of the Chicago Police Department study.
HISTORICAL REVIEW
Two primary lines of events will be traced in this review. The first is an attackupon psychologically-designed methods for the selection of personnel including,
but not confined to, the use of psychological tests. The second is the passage of
the Civil Rights Act of 1964, particularly its Title VII, which deals with fair
employment practices and equal employment opportunity.
The attacks upon psychologically-based personnel selection .methods began slowly
but grew to storm proportions in a series of much-publicized and bitter criti-
cisms of testing written by such laymen as William H. Whyte, Jr. (1956),
131

Martin L. Gross (1962), and Hillel Black (1963). The substance of these criti-
cisms was varied--tests discriminated against the creative, or against the
intelligent, or against the culturally deprived; test questions were offensive or
intrusive; test interpretations were inaccurate or arbitrary or otherwise preju-
dicial to the persons tested. Eventually, the whole issue came to the attention
of the Congress, and the controversy was climaxed in June, 1965, by a full-scale Congressional investigation, involving committees of both the Senate and
the House, of the use of psychological tests. The two major bases for the leg-
islators' criticisms of testing stemmed from two political orientations. Con-servatives and right-wingers concentrated on the issue of invasion of privacy,
while liberals and leftists attacked tests because they might discriminate against
disadvantaged groups in the labor market.
It is the question of discrimination which concerns us here. The 1964 Civil
Rights Act expressly prohibits discrimination of many different forms and in a
variety of contexts. Title VII of the Act focuses on the context of employment.
Its provisions forbid employers, labor unions, and employment agencies to dis-
criminate on the basis of race, color, religion, sex, or national origin, exceptas specified in Section 703 (e), that is, except in instances where religion, sex,
or national origin can be demonstrated to be a bona fide occupational qualifica-
tion.
Of particular interest is a clause in Section 703 (h) of Title VII, known as the
Tower amendment. This amendment was designed to protect the right of man-
agement to use tests for purposes of employment, placement, and promotion. It
was directly related to the renowned and then current case of Myart vs. Motorola,
which was heard in 1963 by the Illinois Fair Employment Practices Commission.*
In the amendment's final form, it reads essentially as follows:
Notwithstanding any other provision of this title, it shall not bean unlawful employment practice for an employer to .give and to
The Commission's findings in favor of Myart were later reversed by a March 24,1966 decision of the Illinois Supreme Court.
132

11
ij
act upon the results of any professionally developed ability test,provided that such test, its administration or action upon the re-sults is not designed, intended or used to discriminate becauseof race, color, religion, sex or national origin.
In short, employment tests may be used, but they must not be intended to dis-
criminate against any subgroup within the population. They must be used prop-erly and professionally. As a result of the Tower amendment, the proper andprofessional use of tests has become a subject for,much hard thought and muchcareful research. Two principal interested parties have been responsible forthe extensive literature on this topic which has been developing steadily since1964. First, of course, are the professional psychologists in academic andorganizational settings, the people responsible for developing and using psycho-logical tests. Second are the groups and individuals charged with the actual ad-ministration and enforcement of Title VII, most importantly the Equal Employ-ment Opportunity Commission.
This Commission, established by Title VII and appointed by the Presid Int, beganits operation shortly after the Act was passed. A task of immediate importance
was to assist employers in implementing both the letter and the spirit of the new
laws. In this project the hotly-argued issue of testing was crucialCommission set out to establish sound and practical guidelines for using tests inemployment procedures. During the formulation of these guidelines, the Com-mission made a point of consulting closely with a panel of professional psychol-ogists and drawing heavily on their thinking and research. For example theMarch 1966 research report by Wallace, Kissinger, and Reynolds (1966),
Testing Of Minority GrouP Applicants for Emplomierit, drew on durrent'studiesby Krug, Ash, Campbell Short, and Brayfield.
In the more popularly oriented EEOC Guidelines on Employment Testing Proce-dures (1966), the Commission based its specific recommendations for the use otesting on the points advocated by this panel and by other consultants (Baxter,
Docter Elias, and Fein). The suggestions in this Guidelines report will bediscussed below in till, course of a review of various types of discrimination

which can arise during employment testing. Two broad classes of discrimina-
tion will be described. The first is blanket discrimination, which can affect
anyone. The second is specific discrimination, which can operate against par-
ticular subgroups within the total population. The 1965 Congressional investiga-
tion of testing called attention to both these classes, Title VII of the 1964 Civil
Rights Act is directed at the latter.
BLANKET DISCRIMINATION
Blanket discrimination can take a number of forms, and may be either inten-
tional or unintentional.
Deliberate Discrimination
It is obvious that test results can be used to discriminate against any individual
or group if they are deliberately falsified or misreported. Standards for passing
tests can also be deliberately shifted and set impossibly high for "unwanted"
individuals or groups. However, tests are not unique as tools of discrimination,
Other aspects of the selection process, such as the personal interview or the
type of educational qualifications demanded, can be exploited as easily and
probably more "safely." Such practices are of course illegal and fortunately
not only fairly readily detectable but also, in practice, rare. Of far greater
concern is discrimination resulting from carelessness or ignorance.
ro er inistratm ion of Tests
Test scores are useful and valid only when they are obtained under standard
conditions. For example, slipshod administration of tests may lead to varia-
tions in time limits for timed tests, which would plainly discriminate against
those applicants who performed under the shorter time limits. Similarly., any
variations in test instructions or in the handling of questions about such instruc-
tions can result in scores which are not comparable from one applicant or group
of applicants to another.
3.34

jjf
1
The unintentional discrimination which can result from such practices is easilyeliminated by careful training of all personnel involved in the selection proce-dure. Adequate profee:sional training is particularly important for everyoneresponsible for, actual interpretation of tests or for the overall administrationof a selection and placement program. The necessity for professionalism hasbeen a watchword of psychologists for many years, and national, regional, andstate psychological associations both set and enforce requirements as to thequalifications, training, and ethical standards of their members.
The EEOC Guidelines particularly stress the need for qualified personnel."...it is essential that tests be administered by personnel who are skilled notonly in technical details, but also in establishing proper conditions for testtaking." (1966, p. 4.) They further suggest that if, in spite of all precautions,there is any possibility that a failing applicant was overly anxious about the testsituation or misunderstood the instructions in some way, he should be retested.
Inappropriate Use of Tests
There are two senses in which the use of a test may be inappropriate. First,the test itself may be technically unsound as a measuring instrument, yieldingfaulty or unreliable measures. For judging the appropriateness of a test in thissense, the EEOC Guidelines suggest using the "Standards for Educational and
Psychological Tests and Manuals," published jointly by the American Psycholog-
ical Association, the American Educational Research Association, and The
National Council on Measurement in Education (1966).
Second, a test may be technically sound and yield consistent measures, but beused for a purpose for which it was not designed or intended. For example,there are in existence a number of excellent tests of mechanical aptitude, yet
it would probably be inappropriate to include one of them in a test battery for tL3selection of female clerical employees. However, an analogous situation could
and does exist where applicants for semi-skilled or skilled mechanical jobs arerequired to pass tests--such as reasoning testswhich call for high levels of
135

verbal comprehension, verbal fluency, or other linguistic skills, It is unlikely
that results on such tests reveal the man's actual competence or incompetence
as a mechanic, just as it is unlikely that a test of mechanical aptitude would
reveal a stenographer's competence or incompetence in taking dictation.
Such inappropriate use of tests can be avoided by directly investigating the re-
lationship between scores on a test and independent measures of performance on
the job. This investigation gives information on the validity of the test for that
occupation. In the EEOC Guidelines, the Commission encourages the use of "job-
related ability tests" and recommends that tests be judged in relation to actual
job performance rather than in relation to whatever abstract or concrete attri-
bute they were designed to measure. Professional psychologists have long ad-
vocated that tests be validated specifically for the occupational groups with which
they will be used.
Nevertheless, even if an employer observes all of the safeguards outlined above,
he may still, with the best of intentions, inadvertantly discriminate against
specific subgroups in the population, such as women or the culturally deprived.
Since the latter are predominantly Negroes or foreign language groups, racial
and/or national discrimination would be occurring. Indeed, such inadvertant
discrimination will occur unless certain recently developed, specialized tech-
niques are used.
DISCRIMINATION AGAINST RACIAL SUBGROUPSAND TECHNIQUES TO PREVENT IT
Theoretically, for a test to be racially non-discriminatory in its selection of
applicants for any particular occupation, a given test score should have the
same meaning in relation to performance for candidates of all races. In practice,
it has been empirically demonstrated in recent years that different racial groups
may score differently both on the test (predictor) measures and on the perfor-
mance (criterion) measures. Note, however, that if a criterion measure actually
reflects performance on the job (possible bias in criterion measures will be
136
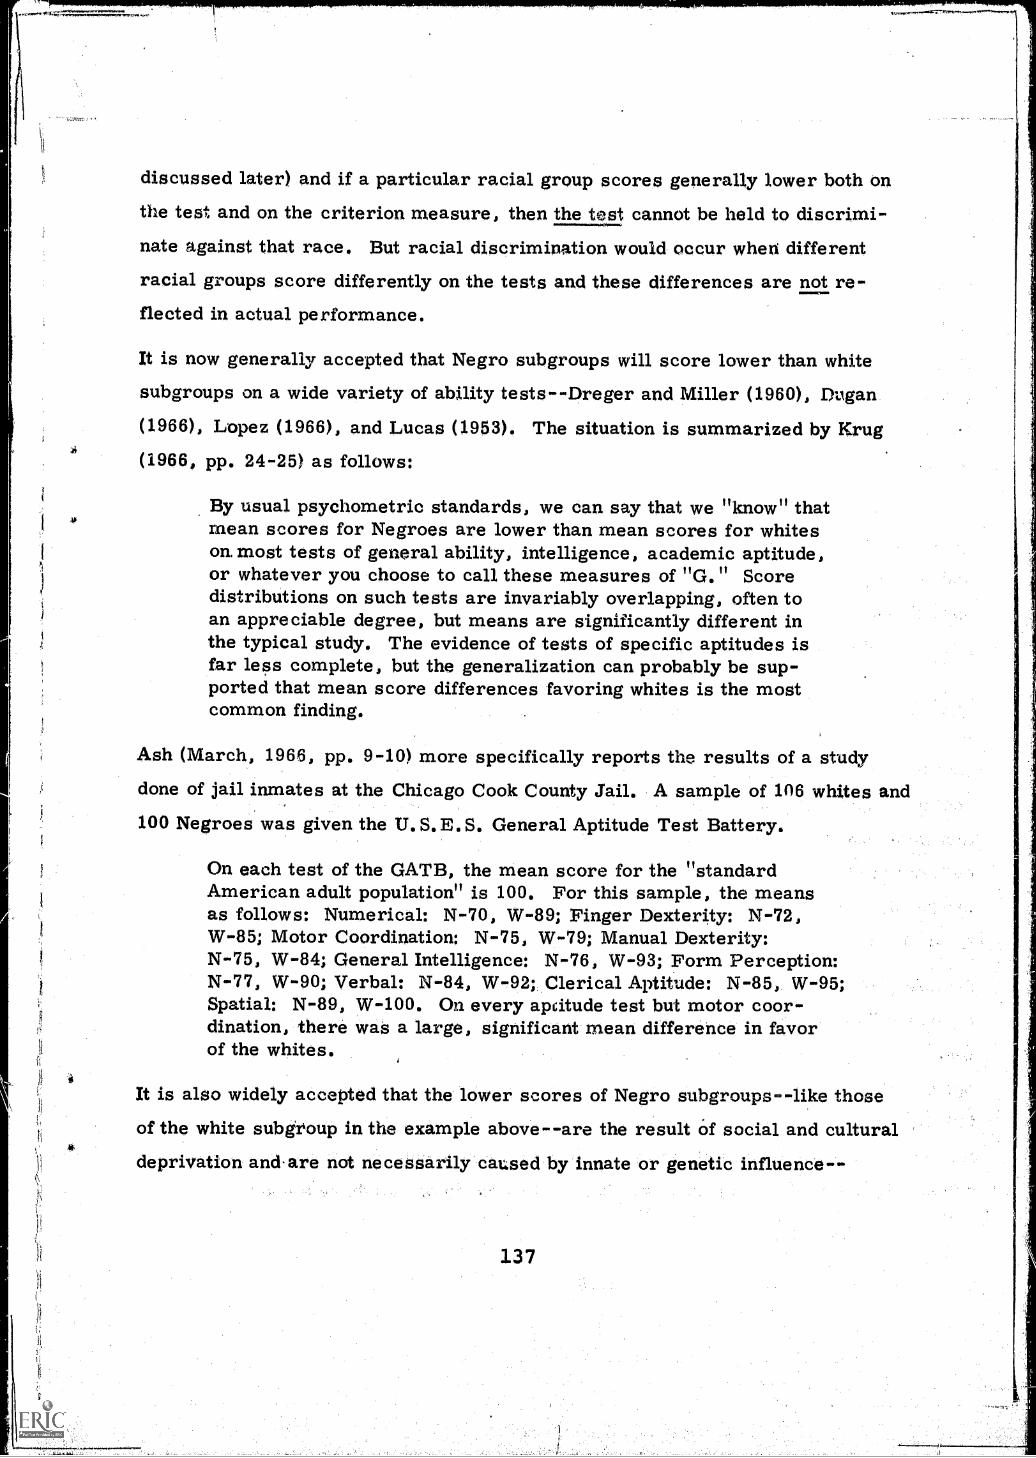
discussed later) and if a particular racial group scores generally lower both on
the test and on the criterion measure, then the test cannot be held to discrimi-nate against that race. But racial discrimination would occur when different
racial groups score differently on the tests and these differences are not re-flected in actual performance.
It is now generally accepted that. Negro subgroups will score lower than white
subgroups on a wide variety of ability tests -- Dreger and. Miller (1960), .Dugan
(1966), Lopez (1966), and Lucas (1953). The situation is summarized by Krug(1966, pp. 24-25) as follows:
By usual psychometric standards, we can say that we "know" thatmean scores for Negroes are lower than mean scores for whiteson. most tests of general ability, intelligence, academic aptitude,or whatever you choose to call these measures of "G." Scoredistributions on such tests are invariably overlapping, often toan appreciable degree, but means are significantly different inthe typical study. The evidence of tests of specific aptitudes isfar less complete, but the generalization can probably be sup-ported that mean score differences favoring whites is the mostcommon finding.
Ash (March, 1966, pp. 9-10) more specifically reports the results of a study
done of jail inmates at the Chicago Cook County Jail. A sample of 106 whites and
100 Negroes was given the U. S.E.S. General Aptitude Test Battery.
On each test of the GATB, the mean score for the "standardAmerican adult population" is 100. For this sample, the meansas follows: Numerical: N-70, W-89; Finger Dexterity: N-72,W-85; Motor Coordination: N-75, W-79; Manual Dexterity:N-75, W-84; General Intelligence: N-76, W-93; Form Perception:N-77, W-90; Verbal: N-84, W-92; Clerical Aptitude: N-85, W-95;Spatial: N-89, W-100. On every aptitude test but motor coor-dination, there was a large, significant mean difference in favorof the whites.
It is also widely accepted that the lower scores of Negro subgroups--like those
of the white subgroup in the example above--are the result Of social and cultural
deprivation and.are not necessarily cat:sed by innate or genetic influence--
137

Campbell (1965), Klineberg (1963), Lockwood (1963, 1966), and Mayfield
(1964). Some psychologists have tackled the problem of differential test re-
sponse of different racial groups by using non-verbal tests which make 'less 'call
on the language skills so obviously lacking in the educationally and culturally
deprived.
However, there is some evidence that Negroes, as compared with the white
population, do no better on non-verbal tests than they do on verbal ones (Bragg,
1967) and that non-verbal tests are not necessarily better predictors of per-
formance for Negro groups (Kirkpatrick, 1967).
The attempt to use non-verbal tests to measure basic skills or abilities without
the contaminating influence of educational or cultural deprivation was an early
and not very successful approach to the problem of test discrimination against
specific subgroups within the population. Other possibly more fruitful ap-
proaches which warrent further study are described below.
"Culture Free," "Culture Fair," and "Culture Equivalent" Tests
At this stage of the effort to develop procedures and techniques which will pre-
vent test discrimination against specific population subgroups, the concept of a
"culture free" test has been thoroughly repudiated. The task of constructing
test items which will be equally novel and equally meaningful to people of all
cultures is difficult to the point of impossibility. Even if such items could be
produced, it is hard to see how performance on them could be meaningfully re-
lated to performance in specific cultural and occupational settings.
A more promising approach is the development of "culture fair" or "culture
equivalent" tests. An excellent example of this approach is found in Schwarz
who, for the past four years, has headed a West African project for the devel-
opment of aptitude tests to be used for selection purposes. As described by Krug
(1966), the "culture fair" test is designed for use with culturally disparate groups.
Its items are based on stimuli or referents with which members of both cultures
are equally familiar. Krug suggests that "culture common" might be a good
138

it
term for such a test. With "cultural equivalent" tests, the approach is some-
what different. Here there is a different form of the test for each cultural group.Test items in each form are appropriate and meaningful for the group in ques-
tion. A test of this sort for gauging the mechanical aptitude of West Africans
used "cultural counterparts" for the tools, machines, and mechanical princi-
ples which would be familiar to the average American. The test proved to have
good validity in predicting performance of West Africans in mechanical training
programs.
However, it is probable that the chances of success in constructing "culture
equivalent" tests would increase with the degree of disparity between the cultures.
That is, eo:75tructing culture equivalent tests for West Africans and white
Americans--where there is both ideational and geographical separation--might
be simpler than constructing equivalent tests for Negro Americans and white
Americans--where, in spite of differences, there is considerable cultural over-lap. In view. of this probability, a better approach might be to use some of the
procedures discussed below.
The Role of Suppressor and Moderator Variables in Test Validation
The use of so-called "suppressor" and "moderator" variables becomes possible
whenever we have a battery of several distinguishable tests at our disposal, but
must use this battery as if it were a single test to make decisions concerning a
single criterion. There will be an infinite number cf ways to combine the scores,
on the separate tests into an overall composite index, and some of these ways
will be more appropriate than others. The problem is to find the method of
combination that maximizes the "cross-validity" of the test battery, and to
demonstrate that this increment in cross-validity is large enough to be distin-
guished from a statistical illusion. "Cross-validity" refers to the correlation
that will exist in a new sample between the composite index of potential perfor-
mance based on the test battery and measures of actual job -performance in the
real work situation.
139

The most straightforward and often the safest way to proceed is simply to dis-card any test in the battery, or any item in a test, that cannot demonstrate cross-validity on its own merits. Total scores obtained by summing such items or testscannot fail to work at least as well as the best single item or test entering thecomposite, and the EEOC Guidelines are founded on this fact.
Only slightly more complex, and still a safe way to proceed, is to combine the
component items or tests using weights suggested by multiple-regression analy-sis. The weights derived from such analysis can compensate for any possibleimbalance in the content of a test battery that is being used to predict a multi-faceted criterion; abilities that are underrepresented in the test battery aremultiplied by larger weights' than those that are overrepresented, so that thesum of weighted scores will display a larger correlation in cross-validation.
This is a "safe" procedure so long as the indicated weights remain positive ormerely approach zero. It is not uncommon, however, for one or more of the
indicated weights to become negative, which leads to the paradox that we sub-tract something from the overall battery score because of good performance onsome item or test. The item or test assigned the negative weight is known as a"suppressor variable, although its function is still that of compensating for im-balances in the content of the test battery. In particular, suppressor variablesare useful in situations where Test A is correlated with some criterion and Test
B is correlated with Test A but not with that criterion. Test B becomes a sup-
pressor variable and serves the function of cancelling out contaminating influ-
ences in the raw scores on Test A. Thus, while suppressor variables arelogically defensible, their use is valid primarily in the context of poor test
construction and even then it is relatively unsafe unless unusually largesamples have been studied to determine all the proper weights. If possible, itis preferable to invest this effort in better test construction.
So far, we have considered only additive techniques for combining the component
test scores into a single composite. Multiplication provides another possible
way of dovetailing the information in the test battery with the specifications of a
140

criterion. The criterion itself may be of such a nature that there is more than
one way to perform with complete success, whereas with an additive test battery
there can be only one way to attain a maximum score If multiplication of one
score by another is allowed, this inequity can be corrected. In effect, this mul-tiplication makes the score on one test--called a "moderator" variable-- deter-
mine the weight that will be given to another test. The test whose weight is thus
controlled may actually be used as a predictor for some individuals and as a
suppressor for others. Using the moderator approach, the number of ways of
obtaining the maximum composite score will be 2m, where "m" is the number of
"moderator" variables used.
If, in a given situation, there really is only one best way, or one possible way, to
go about the job, the moderator approach can only lead to a bit of extra analysis;
the methodology incorporates the means for its own invalidation when this is ap-
propriate. On the other hand, in situations where the moderator is appropriatebut untried, the results that will be obtained will at best be a compromiso that
does no one justice, and there will be nothing to flag this fact. Thus, if there is
so much as the possibility, as there certainly is in respect to groups of interestto the EEOC, moderator methodology would seem to be a must. Examples in
which the moderator contribution is significant have been presented by
Kirkpatrick et al. (1967).
In one special case, the moderator methodology can be bypassed. This is the
case in which the moderator "variable" is simply membership or non-membership
in a group, e.g. , an ethnic group. In this special case, the moderator method-
ology may be expected to yield results that are numerically indistinguishable from
the results obtainable by studying the two groups separately from each other.
However, even in this case, the moderator approach can lend a unity to the re-
sults that is otherwise lacking, and can be of benefit for using the total sample
as a single sample for determination of the best weights.

Separate Multiple-Regression Validations for Different Racial Grou s
In the report by Kirkpatrick et al. (1967, p. 94), a series of, studies dealing with
separate validations for different ethnic groups are summarized. One of the
conclusions is that "The results clearly indicate the existence of differential
patterns of validity for different ethnic groups. That is, the test scores may
predict job performance for one ethnic group but not for others."
This conclusion is best illustrated by their description of a study of 125 cultur-
ally deprived and unemployed males belonging to three different ethnic groups
(white, Negro, and Spanish). These men were being trained for heavy vehicle
driving through the Basic Essential Skills Training program sponsored by the
Port of New York Authority and the City of New York. For purposes of; guid-
ance and development, all subjects were given tests of numerical and of reading
ability when they entered the program. However, all were accepted into the
program regardless of their scores on these tests.
At the conclusion of the program, a proficiency test was given to serve as a
measure of performance and as one criterion in the study. On this performance
measure, there were no significant differences among the three ethnic groups.
On the other hand, on the pre - program tests, the white group had scored signif-
icantly higher than either the Negro or the Spanish. Furthermore, calculation of
multiple-regression validity coefficients showed the numerical test had signif-
icant validities for the white and Negro groups but not for the Spanish. In
contrast, the test of reading ability showed significant validity only for the
Spanish group. Clearly if these tests had been used to select participants for
the program they would not,have been equally predictive. for the three groups
in' question.
There is a further point of interest in the results of this study. Both of the pre-program tests showed significant validity for the total sample. This finding
would have been extremely misleading if there had been no further step of cal
culating separate validities for each of the subgroups within the total sample.
I

In connection with this point, it should be noted that there is some conceptual
confusion in the validation procedures suggested in the EEOC Guidelines state-xnent that "The sample population (norms) used in validating the tests should
include representative members of the minority groups to which the tests willbe applied." (1966, p. 4) Representation of all subgroups in the norms willnot, in fact, clarify the relationship between test scores and performance forthe different ethnic groups involved. However, the intent of the Commission
seems to be clear when they state, "Only a test which has been validated forminorities can be assumed to be free of iriadvertant bias." (1966, p.. 4) Inview of the emerging consensus of opinion regarding the necessity for separatevalidations, the separate-validation approach was taken in analyzing the dataobtained in the Chicago 'Police Patrolmen study.
RESULTS FOR CHICAGO POLICE PATROLMEN:MULTIPLE REGRESSION VALIDATIONS
Two independently selected samples of beat patrolmen, referred to as Wave I
and Wave II, have been used throughout this study. In selecting these samples,every attempt was made to ensure that they were each representative of Chicago
Police patrolmen with respect to:
1. Demographic and racial characteristics,2. The varying operational conditions in different districts in the
Department, and
The full range of performance on the job, as measured by the majorperformance criterion used in the study.
Details on the selection of the samples are given in Chapter III.
A discussion of the selection of the test battery administered to each sample and
a definition of the test variables contributing to these batteries are given in
Chapter IV. The tests were selected with a view to providing:
As wide, coverage as possible of the essential skills in patrolmanperformance, previously identified in the occupational analysis,
143
.,;

-1
As wide coverage as possible of general human behavior, skills, andtraits, andObjectivity and standardization of both administration and scoring pro-cedures. (All tests used were 'of the "paper-and-pencil" variety, suitablefor group administration, and amenable to objective scoring by non-professional personnel.)
A summary statement of the tests used for the two samples is given in Table 1.
The selection and definition of the eight criterion (performance) measures,which hopefully can be predicted by test battery results, are described inChapter III. Chapter VI analyzes the predictor (test battery) variables which
best predict these criterion measures and discusses the details of the primaryand cross va.lida.tions for both samples. Results of the primary validation only
are discussed here, with special emphasis on a comparison of findings for the
white and Negro subgroups in the total sample. These results are shown inTable 2.
In Table 2, the left-hand column of figures (R) under each criterion measuregives the raw estimates obtained for the total sample and for the white and Negro
subgroups. li)wever, these estimates are based on different sample sizes, asshown kr the number of cases listed in column "N," and on different numbers of
test baitery variables contributing to the correlation, as shown in. column "m'
for each criterion measure. Such raw estimates tend to be inflated, especiallywhen using small samples utilizing a disproportionately large number ofvariables.yielded the
A correction was made for this bias (Guilford, 1956, p. 399)
corrected estimates given in the second column (R').
In general, slightly higher coefficients were obtained for the Wave II sample.
However these increases are not statistically significant, and the resultsfrom Wave I were essentially replicated in Wave II. The tentative conclusionsgiven below apply to both samples.
The final unbiased estimates of the multiple correlations are at generally ac-ceptable leveig, after allowing for the expected decreases when they are based
144
1.4...alkLtbs.12:111: IL 1.,141:11. dA..V.2$11, '

AREA OFMEASUREMENT
MOTIVATIONBackground &Experience
Work Interest
CHAPTER VII -- Table 1
Test (Predictor) Variables forWave I and Wave II Samples of Patrolmen
INTELLECTUAL SKILLReasoningLanguagePerception
APTITUDECreative
Social
BEHAVIORTemperament
PressureTolerance
PersonalitySystems
TESTUSED
NUMBER OF WAVE IVARIABLES 'SAMPLE
WAVE II COMMONSAMPLE 'PESTS
PHI 15 XX XX XXWII 14 XX
IsTVR 1 XXUC 1 XXCS 1 XX XX XXCF 1 XX XX XXPS 1 XX XX XX
AC 2 XXCREE 14 XXSI 8 XX XX XX
TC 24 XX XX XXEPPS 15 XX
PRESS 5 XX XX XX
BI 1 XXHAND 8 XXMPI 3 XXA ...r1 7 XX XX XX
TOTAL NUMBER OF TESTS 14 11 8
ADMINISTRATION TIME (HOURS)
145
4 4 3
a.

TE
ST B
AT
TE
RIE
S G
roup
sW
AV
E I
SA
MPL
E
Wav
e I
Tes
tsT
otal
175
i-g
AN
.W
hite
128
Neg
ro47
Tes
ts in
Com
mon
Tot
al17
5to
Bot
h Sa
mpl
esW
hite
128
Neg
ro47
CH
APT
ER
VII
--
Tab
le 2
Mul
tiple
Cor
rela
tions
of
Tes
t Bat
teri
esw
ith C
rite
rion
Mea
sure
s
CR
ITE
RIO
N M
EA
SUR
ES
WA
VE
11
SAM
PLE
Wav
e 11
Tes
tsT
otal
192
Whi
te12
6N
egro
66
Tes
ts in
Com
mon
Tot
al19
2to
Bot
h Sa
mpl
esW
hite
126
Neg
ro66
00"
%43
4,ez
r
eve
G49
xfo
-6-c
z4-
i-ct
r e,
0-.
.,"_.0
4,9
c:7
RR
Iin
.3R
RI
mR
RI
mR
Rt m
I R
RI
mi R
mR
R..i
.60
.50
25.6
7.6
123
.72
.67
21.5
7.4
820
.53
.46
14.4
7, 3
816
1.53
.46
15.5
5.4
325
.62
.53
19.6
6.5
722
.74
.67
22.5
9.4
720
.64
.53
24.5
1.3
818
.63
.51
24.6
7.5
526
.92
.85
22.9
0.8
317
.92
.88
13.8
5.7
418
.91
.82
21.8
9.7
524
.84
.71
19.9
6.8
333
.58
.49
2Z,
.65
.59
20.6
7.6
316
.47
.39
14.4
8.4
114
.44
.36
13 .4
5.3
812
.50
.40
18.6
1.5
120
.63
.56
16.6
8.6
216
.47
.37
12.5
8.4
619
.43
.33
11 .5
4.4
712
.59
.49
19.2
0.8
021
.94
.87
24.9
9.9
633
.86
.75
18.9
2.8
027
.93
.85
23.9
4.8
624
.85
.73
18
.67
.60
27.6
3.5
527
.81
.78
19.5
7.5
020
.61
.52
28.6
6.5
733
.54
.47
19.6
0.5
026
.77
.65
37.6
9.5
629
.84
.81
16.6
0.5
315
.65
.53
24.7
7.6
633
.55
.44
17.7
4.6
332
.98
.93
41.8
8.7
926
.97
.93
37.8
8.7
928
.95
.89
36.8
8.7
729
.88
.80
24.9
5.8
643
.54
.48
16.5
0.4
317
.80
.78
15.4
9.4
117
.51
.43
16.5
8.5
119
.44
.37
128
.29
13.6
7.5
724
.59
.48
19.8
4.8
114
.45
.36
11.5
7.5
013
.65
.57
19.4
4.3
312
.50
.41
13.8
1.7
318
1.93
.85
35.9
2.8
820
.87
.79
25.8
5.7
623
.86
.75
26.7
4.6
217
.75
.60
21

on the restricted test battery common to both samples. For the paired-comparison performance rating, which is the major criterion measure in thestudy, the unbiased correlation estimates are all statistically significant at the.01 level of confidence or better. Throughout, however, the highest correla-tions were obtained for the tenure criterion. Thus, for the two samples ofbeat patrolmen, the test battery scores seem to be significantly related both tolevel of job performance and to tenure.
When the multiple correlations are calculated separately for the two racial sub-groups, that obtained for the white subgroup increases slightly over the estimateobtained for the total sample, and that for the Negro subgroup more spectacularly.A t-test of the significance of the difference between the corrected correlationcoefficients obtained for the two subgroups indicates that for both the Wave I andthe Wave II samples the difference is significant beyond the .01 level of confi-dence. These results underline the necessity for a general procedure of sep-arate validations for different racial groups. With regard to this particularstudy, the results indicate that the test battery has higher validity for the Negrosubgroup. An explanation of the different validity estimates obtained for thewhite and Negro subgroups was sought in a comparison of their scores on boththe test and the criterion measures.
RESPONSE OF WHITE AND NEGRO PATROLMENTO THE TEST (PREDICTOR) VARIABLES
Responses of the white and Negro subgroups will be discussed for each of themajor areas of the test battery. The first of these is personal background andexperience.
Personal Backs round and Ex erience
Objective measures of dimensions of personal background are obtained throughthe Personal History Index. Table 3 shows the mean scores for the subgroupson each of the 15 dimensions of the instrument, the standard deviations of these
means (S. D.), and the probability (p) of the significance of the difference
147

CH
APT
ER
VII
Tab
le 3
T-T
ests
for
the
Sign
ific
ance
of
the
Dif
fere
nces
betw
een
the
Mea
n Sc
ores
for
Whi
te a
nd N
egro
Subg
roup
son
Dim
ensi
ons
of th
e Pe
rson
al H
isto
ry I
ndex
Wav
e I
Sam
ple
Var
iabl
eD
imen
sion
Whi
te G
roup
(N =
170
)M
ean
S.D
.
Neg
ro G
roup
(N =
62)
Mea
nS.
D.
1Sc
hool
Ach
ieve
men
t1.
551.
242.
161.
492.
85.0
05**
(N)
2H
ighe
r E
duca
tiona
l Ach
ieve
men
t3.
281.
643.
001.
391.
29.1
943
Dri
ve4.
141.
833.
901.
730.
88.6
194
Lea
ders
hip
& G
roup
Par
ticip
atio
n2.
141.
572.
341.
570.
84.5
965
Fina
ncia
l Res
pons
ibili
ty2.
361.
402.
161.
251.
02.3
076
Ear
ly F
amily
Res
pons
ibili
ty6.
192.
816.
102.
550.
25.7
997
Pare
ntal
Fam
ily A
djus
tmen
t6.
342.
375.
732.
071.
89.0
568
Stab
ility
4.01
2.40
4.27
2.18
0.80
.571
.9
Scho
ol A
ctiv
ities
2.36
1.60
2.76
1.36
1.8?
. 060
10Pr
ofes
sion
al S
ucce
ssfu
l Par
ents
3.33
1.45
3,00
1.26
1.68
.090
11E
duca
tiona
l Voc
atio
nal C
onsi
sten
cy1.
790.
861.
730.
900.
47.6
4412
Voc
atio
nal D
ecis
iven
ess
2.05
1.11
2.06
1.23
0.10
.919
13V
ocat
iona
l Sat
isfa
ctio
n4.
881.
784.
131.
902.
67.0
08**
(W)
14Se
lling
Exp
erie
nce
5.28
1.54
5.03
1.59
1.04
.300
15G
ener
al H
ealth
2.59
1.18
2.63
1.10
0.24
.803
Wav
e II
Sam
ple
Whi
te G
roup
Neg
ro G
roup
= 1
88)
(N =
92)
Var
iabl
eD
imen
sion
Mea
nS.
D.
Mea
nS.
D.
p1
Scho
ol A
chie
vem
ent
1.31
1.14
2.41
1.50
6.21
.000
***(
N)
2H
ighe
r E
duca
tiona
l Ach
ieve
men
t2.
861.
482.
721.
560.
73.5
303
Dri
ve4.
391.
843.
831.
792.
44.0
15-4
(W)

CH
APT
ER
VII
--
Tab
le 3
con
t.
4L
eade
rshi
p &
Gro
up P
artic
ipat
ion
2.05
1.44
2.15
1.43
0.57
.577
5Fi
nanc
ial R
espo
nsib
ility
2.10
1.36
1.65
1.15
2.88
005*
*(W
)6
Ear
ly F
amily
Res
pons
ibili
ty5.
493.
024.
742.
512.
2002
7*-(
W)
7Pa
rent
al F
amily
Adj
ustm
ent
6.30
2.23
5.49
2.28
2.79
.005
* (W
)8
Stab
ility
3.31
2.37
3.15
2.03
0.57
.577
9Sc
hool
Act
iviti
es2.
341.
602.
461.
590.
60.5
5910
Prof
essi
onal
Suc
cess
ful P
aren
ts3.
291.
463.
131.
440.
8861
511
Edu
catio
nal-
Voc
atio
nal C
onsi
sten
cy1.
710.
831.
660.
850.
46.6
5112
Voc
atio
nal D
ecis
iven
ess
2.05
1.20
2.07
1.20
0.08
.93
513
Voc
atio
nal S
atis
fact
ion
4.93
1.77
4.75
2.03
0.70
.51
114
Selli
ng E
xper
ienc
e5.
291.
594.
681.
662.
8800
5**(
W)
15G
ener
al H
ealth
2.67
1.20
2.83
1.07
1.10
.274
Tot
al S
ampl
e
Var
iabl
eD
imen
sion
Whi
te G
roup
(N =
358
)M
ean
S.D
.
Neg
ro G
roup
= 1
54)
Mea
nS.
D.
t
1Sc
hool
Ach
ieve
men
t1.
421.
202.
311.
506.
48.0
00**
*(N
)2
Hig
her
Edu
catio
nal A
chie
vem
ent
3.06
1.57
2.83
1.50
1.56
.114
3D
rive
4.27
1.84
3.86
1.76
2.38
.017
*(W
)4
Lea
ders
hip
& G
roup
Par
ticip
atio
n2.
091.
502.
231.
490.
94.6
485
Fina
ncia
l Res
pons
ibili
ty2.
221.
391.
861.
212.
9900
3**(
W)
6E
arly
Fam
ily R
espo
nsib
ility
5.83
2.94
5.29
2.61
2.06
.037
*(W
)7
Pare
ntal
Fam
ily A
djus
tmen
t6.
322.
295.
582.
203.
3900
1**(
W)
8St
abili
ty3.
642.
413.
602.
160.
1786
39
Scho
ol A
ctiv
ities
2.35
1.60
2.58
1.51
1.56
.116
10Pr
ofes
sion
al S
ucce
ssfu
l Par
ents
3.31
1.46
3.08
1.37
1.72
.082
11E
duca
tiona
l-V
ocat
iona
l Con
sist
ency
1.75
0.84
1.69
0.87
0.72
.523
12V
ocat
iona
l Dec
isiv
enes
s2.
051.
152.
061.
210.
1389
413
Voc
atio
nal S
atis
fact
ion
4.90
1.77
4.50
2.00
2.15
.030
*(W
)14
Selli
ng E
xper
ienc
e5.
281.
564.
821.
642.
93.0
04**
(W)
15G
ener
al H
ealth
2.63
1.19
2.75
1.08
1.07
.285
* p
< .0
5**
p <
0 1
***
p <
. 00
1(N
) =
Neg
ro g
roup
mea
n hi
gher
(W)
= W
hite
gro
up m
ean
high
er

between the means of the two groups. One, two, and three asterisks indicate
significance levels of .05, .01, and .001 respectively. A superscript W or N
following the final asterisk indicates whether the white or the Negro group mean
is higher.
The first eight dimensions of the Index are generally the most predictive and the
ones scored for operational use. For Wave I, the only significant difference on
these eight dimensions occurs in favor of the Negro group on School Achieve-
ment. This result is repeated for Wave II, with the addition of significant dif-ferences in favor of the white group on dimensions dealing with personal drive,
financial responsibility, and family responsibility and adjustment. Results for
the total sample--the sum or combination of Wave I and Wave II--are the same
as those obtained for Wave II.
It seems a tenable hypothesis that the Negro group's generally lower scores in
this background area are the result of educational, vocational, and social depri-
vation. This hypothesis would also explain the single instance in which the
Negro group scored significantly higher--the dimension of School Achievement.
If educational standards are generally lower in predominantly Negro schools,
the Negro patrolmen applicants would need a higher educational grade level to
pass the civil service screening procedure than would their white counterparts.
It is possible that in this study we are dealing with a relatively more highly
selected Negro group.
Work Interests
The Work Interest Index (a non-verbal, check-mark-response instrument)
measures the strength of interests in 12 work areas, as well as the flexibility
of these interests and the individual's vocational aspiration level. Table 4
shows these results. Except for the white group's stronger interest in occu-
pations designated "Authority & Prestige," all significant differences were in
favor of the Negro group, which showed higher interest in social, creative and
artistic, clerical, and theoretical and scientific occupations.
150

CH
APT
ER
VII
- T
able
4
T-T
ests
for
the
Sign
ific
ance
of
the
Dif
fere
nces
betw
een
the
Mea
n Sc
ores
for
Whi
te a
nd N
egro
Subg
roup
son
Dim
ensi
ons
of th
e W
ork
Inte
rest
Ind
ex
Wav
e II
Sam
ple
Var
iabl
eD
imen
sion
Whi
te G
roup
(N18
8)M
ean
S.D
.
Neg
ro G
roup
(N a
92)
Mea
n.S.
D.
t64
1Pr
ofes
sion
al &
Tec
hnic
al3.
862.
694,
032.
700.
51.6
1664
2So
cial
& V
erba
l4.
942.
195.
572.
142.
26. 0
23*(
N)
643
Aut
hori
ty &
Pre
stig
e5.
891.
595.
471.
662.
01. 0
42*(
W)
644
Art
istic
& I
nter
pret
ativ
e2.
492.
343.
132.
342.
13.0
32*(
N)
645
Art
istic
& S
tyliz
ed2.
232.
281.
922.
101.
10.2
7064
6A
rtis
tic &
Cre
ativ
e3.
342.
674.
372.
882.
88.0
05**
(N)
647
Tec
hnic
al &
Sci
entif
ic4.
342.
245.
122.
242.
7500
6**(
N)
648
Cle
rica
l & R
outin
e2.
572.
593.
802.
963.
4000
1'*'
(N
)64
9B
usin
ess
Con
tact
& S
truc
ture
d1.
762.
362.
342.
561.
82.0
6665
0Pe
rson
al S
ervi
ce &
Per
suas
ive
3.26
2.10
3.15
2.06
0.39
.700
651
Mec
hani
cal &
Pro
duct
ive
4.39
2.89
4.15
2.93
0.63
.535
652
Con
trol
of
Mas
sive
Equ
ipm
ent
4.09
2.98
3.68
2.93
1.08
.282
653
FLE
XIB
ILIT
Y43
.14
18.4
646
.74
18.5
21.
52.1
2565
4A
SPIR
AT
ION
LE
VE
L28
.29
2.29
28.1
22.
110.
62.5
43
* p<
.05
**p
<.0
1(N
) =
Neg
rogr
oup
mea
n hi
gher
(W)
= W
hite
grou
p m
ean
high
er

The Work Interest Index was administered only to the Wave II sample. Further
discussion of the different vocational interests of the two groups will be presented
later.
Intellectual Skill
Five tests, each designed to measure a specific mental ability, were adminis-
tered to the Wave I sample. As shown in Table 5, the white group scored
higher on all five tests and significantly higher on three of them. These results
accord with those obtained in other studies of this nature. Only one a the tests- -Understanding Communication, which deals specifically with language facility- -
is verbal. The remaining four are non-verbal, and on these four, there appears
to be a fairly systematic relationship between significance level and the time
limit for the test. Arranging them from longest to shortest time limit, we find
the following:
Test Time Limit
Non-Verbal ReasoningClosure FlexibilityPerceptual SpeedClosure Speed
Untimed, approx. 20 mins.15 minutes5 minutes3 minutes
ProbabilityValue
.09
.10
.02
.00
With the three tests which were retained in the battery -- Closure Flexibility,
Perceptual Speed, and Closure Speed--this relationship repeated for the Wave II
sample and for the total sample. This result suggests that the more speeded
the test, the greater the likelihood that the Negro group will, have a significantly
lower mean score. In view of this tentative hypothesis, the Press Test, ordi-narily included in the "Behavior" section of the battery, will be discussed next.
Pressure ToleranceThe three parts of the Press Test measure reaction time to verbal stimuli(Part 1), to color stimuli (Part II), and to color stimuli under pressure of verbal,
distraction (Part III). There are also two derived scores, which contrast theindividual's own reaction times to verbal and to color stimuli (Part I minus
152

CH
APT
ER
VII
--
Tab
le 5
T-T
ests
for
the
Sign
ific
ance
of
the
Dif
fere
nces
betw
een
the
Mea
n Sc
ores
for
Whi
te a
nd N
egro
Sub
grou
ps
on T
ests
of
Spec
ific
Men
tal A
bilit
ies
Wav
e I
Sam
ple
Var
iabl
eT
est
NW
hite
Gro
upM
ean
S.D
.N
Neg
ro G
roup
Mea
nS.
D.
t
16N
on-
Ver
bal.
Rea
soni
ng17
031
.89
5.23
6230
.63
4.83
1.71
.085
17U
nder
stan
ding
. Com
mun
icat
ion
170
-29.
755.
0162
28.0
05.
662.
1403
2*(W
)18
Clo
sure
Spe
ed17
012
.65
5.13
6210
.26
4.13
3.63
001*
**(W
)19
Clo
sure
Fle
xibi
lity
170
54.1
526
.72
6248
.37
22.2
51.
64.0
9820
Perc
eptu
al S
peed
160
51.6
813
.83
6147
.11
12.2
72.
37.0
18=
(W)
Var
iabl
eT
est
Wav
e II
Sam
ple
Whi
te G
roup
Mea
nS.
D.
Neg
ro G
roup
NM
ean
S.D
.
18C
losu
re S
peed
188
12.9
24.
6992
19C
losu
re F
lexi
bilit
y18
559
.05
24.2
891
20Pe
rcep
tual
Spe
ed18
653
.32
12.1
390
Var
iabl
eT
est
Tot
al S
ampl
e
Whi
te G
roup
Mea
nS.
D.
t
11.1
44.
563.
02.0
03*
*(W
)56
.88
24.5
30.
69.5
0250
.06
15.3
21.
76.0
76
Neg
ro G
roup
NM
ean
S.D
.
18C
losu
re S
peed
358
12.7
94.
9115
419
Clo
sure
Fle
xibi
lity
355
56.7
025
.59
153
20Pe
rcep
tual
Spe
ed34
652
.56
12.9
7-
151
*p
<.0
5**
p<
.01
***
p< .0
01(W
) =
Whi
te g
roup
mea
n hi
gher
t
10.7
94.
424.
55.00
0***
(W)
53.4
324
.00
1.38
.166
48.8
714
.24
2.72
.007
**(W
)

Part II) and the individual's own reaction times to color stimuli with and without
stress (Part II minus Part III) . The Press Test is the most speeded one in the
battery, the time limit for each of the three parts being exactly 90 seconds.
As shown in Tab]: 6, the test yields consistent and significant differences be-
tween the racial group means for all three samples. The white group scores
significantly higher on each of the three separate parts and on reaction time
under pressure (Part II minus Part III). In contrast, the Negro group has a
significantly higher mean score for Part I minus Part II. In other words, the
Negro group shows a relatively faster reaction to color than to verbal stimuli
than does the white group. The direct scores' for reaction time to verbal stimuli,and to color stimuli with and without stress, support the suggestion made in the
previous section that Negro group scores compare most poorly with those of the
white group in speeded or pressure test situations.
Aptitude
This section .of the test battery covers two broad areas of behavior--the creative
potential of the individual and insight in social situations. Table 7 shows results
for the two tests of creative potential, Table 8 results for the Test of Social
Insight. In contrast to findings on the background and ability measures, a far
smaller proportion of the dimensions yield significant differences between the
racial group means. Furthermore, such significant differences as do exist are
in favor of the Negro group.
On the total scores for these tests, there are no significant differences between
the racial g-l'oups. However, certain dimensions of the Cree Questionnaire show
the Negro group to have significantly greater interest in the artistic, scientific,and theoretical occupations. These results accord with those obtained from the
Work Interest Index. As further points, the Negro group is less involved in the
work situation and has a greater tendency to withdraw in social situations.
154

CH
APT
ER
VII
--
Tab
le 6
T-T
ests
for
the
Sign
ific
ance
of
the
Dif
fere
nces
betw
een
the
Mea
n Sc
ores
for
Whi
te a
nd N
egro
Sub
grou
ps
on a
Tes
t of
Pres
sure
Tol
eran
ce
Var
iabl
ePR
ESS
. TE
ST
25 26 27 28 29
Part
IPa
rt I
IPa
rt I
IIPa
rt I
- I
IPa
rt I
I -
III
Var
iabl
e PR
ESS
TE
ST25
Part
I26
Part
II
27Pa
rt I
II28
Part
I -
II29
Part
II
- II
I
Wav
e I
Sam
ple
Whi
te G
roup
NM
ean
S.D
.
165
165
164
165
164
73.5
270
.79
57.4
43.
4713
.38
16.5
615
.41
15.3
48.
9010
.26
Wav
e II
Sam
ple
Whi
te G
roup
Neg
ro G
roup
NM
ean
S.D
.
6270
.34
16.6
362
62.3
714
.93
6252
.74
13.0
362
8.29
13.
3762
9.63
8.76
Neg
ro G
roup
NM
ean
S.D
.N
Mea
nrS.
D.
188
77.7
118
874
.89
188
60.1
918
33.
1218
814
.02
14.9
214
.19
13.4
99.
109.
60
Tot
al S
ampl
e
Whi
te G
roup
Mea
nS.
D.
75.7
5 15
.85
72.9
7 14
.92
59.2
314
.48
3.28
9.01
13.7
29.
92
Var
iabl
e PR
ESS
TE
ST25
Part
I26
Part
II
27Pa
rt I
II28
Part
I -
II
29Pa
rt I
I -
9270
.68
17.3
192
66.7
8 15
.72
9155
.22
14.1
092
4.79
7.58
9111
.22
8.98
Neg
ro G
roup
NM
ean
S.D
.
1.28
.200
3.73
.00
0***
(W)
2.28
.02
2*(W
)2.
61.01
0**(
N)
2.72
. 007
**(W
)
tp
3.32
.00
1**(
W)
4.16
.000
***(
W)
3.12
.00
2**(
W)
1.61
.104
2.38
.01
1*(W
)
154
70.5
5 17
.04
3.22
.00
2**(
W)
154
65.0
115
.56
5.35
.000
***(
W)
153
54.2
213
.73
3.70
.00
0***
(W)
154
6.20
10.4
53.
00.0
03**
(N)
153
10.5
88.
933.
51.00
1***
(W)
p <
. 05
**p<
.01
***
p <
.001
(W)
= W
hite
gro
up m
ean
high
er(N
) =
Neg
ro g
roup
mea
n hi
gher

CH
APT
ER
VII
Tab
le 7
T-T
ests
for
the
Sign
ific
ance
of
the
Dif
fere
nces
betw
een
the
Mea
n Sc
ores
for
Whi
te a
nd N
egro
Sub
grou
ps
on T
ests
of
Cre
ativ
e. P
oten
tial
AC
Tes
t of
Cre
ativ
e A
bilit
y
Wav
e I
Sam
ple
Whi
te G
roup
Neg
ro G
roup
Var
iabl
eD
imen
sion
NM
ean
S.D
.N
Mea
nS.
D.
p
23Pa
rt I
I16
911
.44
5.23
6210
.66
4.48
1.11
.269
24Pa
rt I
II17
024
.44
9,43
6223
.79
8.39
0.50
.622
Cre
e Q
uest
ionn
aire
Wav
e II
Sam
ple
Whi
te G
roup
Neg
ro G
roup
(N =
188
)(N
= 9
2)V
aria
ble
Dim
ensi
onM
ean
S.D
.M
ean
S.D
.
656
Tot
al S
core
66.5
612
.79
67.6
8 12
.24
0.71
.512
657
Dom
inan
ce5.
133.
235.
052.
820.
19.8
4165
8In
diff
eren
ce3.
631.
733.
921.
751.
30.1
9065
9In
depe
nden
ce5.
552.
136.
272.
282.
54.01
1*(N
)66
0U
nstr
uctu
red
Situ
atio
n3.
542.
043.
381.
890.
63.5
3466
1U
nsys
tem
atic
Sel
ectiv
e A
ctiv
ity4.
591.
904.
972-
.14
1.43
.150
662
Pers
onal
ly I
nvol
ved
Atti
tude
3.72
1.98
3.62
2.00
0.39
.702
663
Pres
sure
Situ
atio
n2.
201.
352.
081.
170.
77.5
4966
4H
igh
Ene
rgy
Lev
el5.
342.
304.
832.
301.
75.0
7766
5Fa
st R
eact
ion
5.34
1.75
4.96
1.78
1.70
1)87
666
Hig
h Id
eatio
nal S
pont
anei
ty4.
111.
644.
501.
591.
89.0
5766
7H
igh
Scie
ntif
ic &
The
oret
ical
3.59
2.14
4.14
2.13
2.04
.04
0='.=
(N)
668
Hig
h A
rtis
tic2.
221.
612.
771.
732.
56.01
1*(N
)66
9H
igh
Mec
hani
cal
3.56
1.76
3.17
1.73
1.73
.081
* p<
.05
(N)
= N
egro
gro
up m
ean
high
er

CH
APT
ER
VII
Tab
le 8
T -
Tes
ts f
or th
e Si
gnif
ican
ce o
f th
e D
iffe
renc
es
betw
een
the
Mea
n Sc
ores
for
Whi
te a
nd N
egro
Sub
grou
ps
on th
e T
est o
f So
cial
Ins
ight
Wav
e I
Sam
ple
Whi
te G
roup
(N =
170
)N
egro
Gro
up(N
= 6
2)V
aria
ble
Dim
ensi
onM
ean
S.D
.M
ean
S.D
.t
p
88W
ithdr
awal
4.58
2.36
5.03
2.28
1.31
.18
989
Pass
ivity
8.71
3.31
8.92
3.36
0.43
.673
90C
oope
rativ
enes
s33
.62
4.63
32.9
44.
171.
06.2
89(7
192
Com
petit
iven
ess
6.32
2.24
6.56
2.17
0.75
.542
94A
ggre
ssio
n6.
762.
646.
602.
830.
39.6
9995
Tot
al22
.81
5.12
23.0
55.
320.
30.7
62
Wav
e II
Sam
ple
Whi
te G
roup
(NV
= 1
85)
Neg
ro G
roup
(N =
90)
Var
iabl
eD
imen
sion
Mea
nS.
D.
Mea
nS.
D.
tp
88W
ithdr
awal
4..3
12.
025.
002.
202.
48.
013*
(N)
89Pa
ssiv
ity9.
093.
418.
603.
611.
0728
490
Coo
pera
tiven
ess
33.3
14.
8733
.37
4.64
0.10
.920
92C
ompe
titiv
enes
s5.
942.
156.
012.
120.
28.
779
94A
ggre
ssio
n7.
312.
646.
972.
591.
01.3
1395
Tot
al22
.56
4.94
22.3
64.
830.
32.
748

CH
APT
ER
VII
--
Tab
le 8
con
t.T
otal
Sam
ple
Whi
te G
roup
(N =
355
)N
egro
Gro
up(N
= 1
52)
Var
iabl
eD
imen
sion
Mea
nS.
D.
Mea
nS.
D.
t
88W
ithdr
awal
4.44
2.19
5.01
2.23
2.64
.008
**(N
)
89Pa
ssiv
ity8.
913.
378.
733.
520.
52.6
07
90C
oope
rativ
enes
s33
.46
4.76
33.1
94.
460.
60.5
5692
Com
petit
iven
ess
6.12
2.20
6.24
2.16
0.56
.582
94A
ggre
ssio
n7.
052.
666.
822.
700.
88.6
16
95T
otal
22.6
85.
0322
.64
5.05
0.08
.003
* p<
. 05
** p
< .
01(N
) =
Neg
ro g
roup
mea
n hi
gher

Behavior
The Temperament Comparator (Tables 9 and 10) was administered to both pa-
trolman samples. This instrument was developed by the Industrial Relations
Center to measure some of the relatively permanent behavior attributes of theindividual. It yields comparative measures of 18 temperament traits and five
temperament factors. The latter were determined by factor analysis, and eachfactor score is a composite of five trait scores. These factor scores are there-fore the most reliable ones derived from this instrument. Racial group means
for the factor scores differed significantly only for the factor Controlled. The
Negro group mean was lower, indicating greater impulsiveness, demonstra-
tiveness, and behavioral variability. The higher white group mean indicatesgreater caution, control, and perseverance. Group differences on the traitscores were significant for some of the traits contributing to the factor Con-
trolled. Thus, the Negro group scores higher on Demonstrative, the whitegroup on Persevering and Steady Worker. In addition, the Negro group scores
higher on Talkative and Emotionally Stable, the white group on Energetic,
Enthusiastic, and Quick Worker.
On four other personality questionnaires, the two groups are relatively similar,as shown in Table 11. In fact, the group means differ significantly on only two
out of a total of 28 widely divergent behavior dimensions. One of these is a
composite score from selected MMPI items. The other is the Intraception score
on the Edwards Personal Preference Schedule. The higher score of the Negro
group on the latter indicates that they are better able to analyze the feelings and
behavior of others and to put themselves in the place of others.
The final personality measure, the Arrow-Dot Test (Table 12), differs from the
other, untimed instruments in this area in that it is a high-speed, objective,performance test. A full description of it is given in Chapter IV. It provides
three scores. One is called the Id score, defined as a measure of the tendency
to uncontrolled, impulsive behavior. The second is the Ego score, which es-sentially is a measure of the ability to function realistically and of the degree of
159

CH
APT
ER
VII
--
Tab
le 9
T-T
ests
for
the
Sign
ific
ance
of
the
Dif
fere
nces
betw
een
the
Mea
n Sc
ores
for
Whi
te a
nd N
egro
Sub
grou
ps
on th
e Fa
ctor
Sco
res
from
the
Tem
pera
men
t Com
para
tor
Wav
e I
Sam
ple
Whi
te G
roup
(N =
148
)N
egro
Gro
up(N
= 5
4)V
aria
ble
Fact
orM
ean
S.D
.M
ean
S.D
.t
p31
Con
trol
led
54.0
010
.27
50.0
78.
982.
62.0
09**
(W)
32St
able
54.4
811
.65
54.2
612
.71
0.11
.908
33Se
lf-R
elia
nt52
.95
11.9
254
.50
14.3
00.
71.5
1334
Exc
itabl
e37
.48
12.2
135
.39
11.3
71.
12.2
6135
Soci
able
43.3
911
.04
43.7
49.
420.
22.8
20
Wav
e II
Sam
ple
Whi
te G
roup
(N =
182
)N
egro
Gro
up(N
= 8
5)V
aria
ble
Fact
orM
ean
S.D
.M
ean
S.D
.t
p
31C
ontr
olle
d52
.26
9.28
50.5
110
.80
1.28
.198
32St
able
54.9
611
.41
55.3
611
.70
0.26
.789
33Se
lf-R
elia
nt55
.25
12.3
256
.07
11.8
90.
52.6
1134
Exc
itabl
e37
.13
12.2
834
.79
13.0
31.
39.1
6335
Soci
able
43.5
112
.89
45.9
89.
241.
78.0
73
Tot
al S
ampl
e
Var
iabl
e
Whi
te G
roup
(N =
330
)Fa
ctor
Mea
nS.
D.
Neg
ro G
roup
(N =
139
)M
ean
S.D
.t
p30
Con
sist
ency
53.9
936
.92
50.4
240
.91
0.89
.621
31C
ontr
olle
d53
.04
9.78
50.3
410
.13
2.66
,008
**(W
)32
Stab
le54
.75
11.5
254
.94
12.1
10.
16.8
7033
Self
-Rel
iant
54.2
212
.20
55.4
612
.90
0,97
.664
34E
xcita
ble
37.2
912
.25
35.0
212
.42
1.81
.068
35So
ciab
le43
.45
12.1
045
.11
9.38
1.59
.108
** p
<.0
1(W
) =
Whi
te g
roup
mea
n hi
gher

CH
APT
ER
VII
--
Tab
le 1
0
T-T
ests
for
the
Sign
ific
ance
of
the
Dif
fere
nces
betw
een
the
Mea
n Sc
ores
for
Whi
te a
nd N
egro
Sub
grou
ps
on th
e T
rait
Scor
es f
rom
the
Tem
pera
men
t Com
para
tor
Wav
e I
Sam
ple
Var
iabl
eT
empe
ram
ent T
rait
Whi
te G
roup
(N =
148
)M
ean
S.D
.
Neg
ro G
roup
(N =
54)
Mea
nS.
D.
t13
36C
alm
10.5
44.
0510
.07
3.98
0.73
.526
37C
autio
us10
.80
4.08
10.6
74.
470.
20.8
3938
Dec
isiv
e8.
813.
728.
694.
030.
20.8
3739
Dem
onst
rativ
e3.
773.
495.
203.
702.
45.0
14*(
N)
40E
mot
iona
lly S
tabl
e9.
863.
9010
.72
3.67
1.43
.149
41E
nerg
etic
8.44
3.59
8.22
3.67
0.37
.712
42E
nthu
sias
tic8.
593.
537.
963.
391.
15.2
5043
Eve
n-T
empe
red
9.97
4.62
11.0
04.
231.
49.1
3544
Liv
ely
6.29
3.53
6.93
3.91
1.04
.300
45Pe
rsev
erin
g6.
994.
235.
613.
772.
20.0
27*(
W)
46Pr
ompt
Sta
rter
8.43
4.28
8.50
4.34
0.10
.919
47Q
uick
Wor
ker
7.22
4.05
6.46
4.06
1.16
.246
48Se
eks
Com
pany
5.25
4.32
4.06
4.38
1.71
.085
49Se
lf-C
onfi
dent
10.7
94.
2611
.81
4.22
1.51
.128
50Se
riou
s10
.94
3.84
10.5
94.
520.
50.6
2551
Soci
ally
At E
ase
9.01
3.86
8.63
3.67
0.63
.535
52St
eady
Wor
ker
11.9
73.
0611
.22
3.62
1.35
.177
53T
alka
tive
5.26
4.58
6.67
5.77
1.60
.108
30C
onsi
sten
cy55
.46
40.9
146
.04
36.8
11.
55.1
19

CH
APT
ER
VII
Tab
le 1
0 co
nt.
Wav
e II
Sam
ple
Var
iabl
eT
empe
ram
ent T
rait
Whi
te G
roup
= 1
82)
Mea
nS.
D.
Neg
ro G
roup
(N=
85)
Mea
nS.
D.
36C
alm
10.1
94.
0410
.86
3.82
1.31
.188
37C
autio
us.
10.5
94.
0410
.82
4.09
0.44
.66
638
Dec
isiv
e9.
123.
959.
793.
721.
33.1
8139
Dem
onst
rativ
e4.
013.
604.
933.
851.
84.0
6340
Em
otio
nally
Sta
ble
10.4
53.
8011
.08
3.67
1.30
.191
41E
nerg
etic
8.77
3.83
7.62
3.80
2.28
022*
(W)
42E
nthu
sias
tic8.
853.
507.
873.
642.
0603
8*(W
)43
Eve
n-T
empe
red
10.7
64.
3310
.53
4.12
0.41
683
44L
ivel
y6.
723.
816.
733.
690.
0298
245
Pers
ever
ing
6.79
3.81
6.11
3.81
1.35
.175
46Pr
ompt
Sta
rter
7.73
4.36
7.05
3.86
1.29
.196
47Q
uick
. Wor
ker
7.32
3.98
6.26
3,41
2.23
. 025
*(W
)48
Seek
s C
ompa
ny4.
544.
424.
493.
920.
08.9
3249
Self
-Con
fide
nt11
.47
4.19
12.0
03.
691.
04.3
0150
Seri
ous
10.9
03.
8111
.25
4.23
0.64
.531
51So
cial
ly A
t Eas
e8.
544.
019.
084.
121.
00.6
8052
Stea
dy W
orke
r11
.01
3.60
10.1
13.
911.
79.0
7153
Tal
kativ
e5.
274.
426.
425.
481.
69.0
8830
Con
sist
ency
52.8
033
.27
53.2
043
.09
0.07
.938

CH
APT
ER
VII
--
Tab
le 1
0 co
nt.
Tot
al S
ampl
e
Var
iabl
eT
empe
ram
ent T
rait
Whi
te G
roup
(N =
330
)M
ean
- S.
D.
Neg
ro G
roup
(N =
139
)M
ean
S.D
.
36C
alm
10.3
54.
0510
.55
3.90
0.52
.609
37C
autio
us10
.68
4.06
10.7
64.
240.
18.8
4938
Dec
isiv
e8.
983.
859.
363.
880.
96.6
6239
Dem
onst
rativ
e3.
903.
565.
043.
803.
00.0
03**
(N)
40E
mot
iona
lly S
tabl
e10
.18
3.86
10.9
43.
672.
00. 0
43*(
N)
41E
nerg
etic
8.62
3.73
7.86
3.76
2.01
. 042
*(W
)
42E
nthu
sias
tic8.
733.
517.
913.
552.
40. 0
20*(
W)
43E
ven-
Tem
pere
d10
.40
4.48
10.7
14.
170.
71.5
1844
Liv
ely
6.53
3.69
6.81
3.78
0.73
.528
45Pe
rsev
erin
g6.
884.
015.
913.
802.
45. 0
14*(
W)
46Pr
ompt
Sta
rter
8.05
4.34
7.61
4.11
1.02
.307
47Q
uick
Wor
ker
7.27
4.01
6.34
3.67
2.44
.014
*(W
)48
Seek
s C
ompa
ny4.
864.
394.
324.
111.
26.2
0749
Self
-Con
fide
nt11
.17
4.24
11.9
33.
911.
87.0
5850
Seri
ous
10.9
23.
8210
.99
4.36
0.18
.856
51So
cial
ly A
t Eas
e8.
753.
958.
913.
960.
39.7
0252
Stea
dy W
orke
r11
.44
3.40
10.5
43.
842.
39.0
16*(
W)
53T
alka
tive
5.27
4.49
6.52
5.60
2.33
.019
*(N
)30
Con
sist
endy
53.9
936
.92
50.4
240
.91
0.89
.621
*p<
.05
**p
< .0
1
(N)
= N
egro
gro
up m
ean
high
er(W
) =
Whi
te g
roup
mea
n hi
gher

CH
APT
ER
VII
--
Tab
le 1
1
T-T
ests
for
the
Sign
ific
ance
of
the
Dif
fere
nces
betw
een
the
Mea
n Sc
ores
for
Whi
te a
nd N
egro
Sub
grou
ps
on F
our
Pers
onal
ity I
nven
tori
es
Edw
ards
Per
sona
l Pre
fere
nce
Sche
dule
Wav
e II
Sam
ple
ch
Var
iabl
e
670
671
672
673
674
Dim
ensi
on
Ach
ieve
men
tD
efer
ence
Ord
erE
xhib
ition
Aut
onom
y
Whi
te G
roup
= 1
88)
Mea
nS.
D.
16.2
14.
0213
.26
3.64
12.9
04.
4014
.69
3.76
13.1
04.
22
Neg
ro G
roup
(N =
92)
Avl
ean
S.D
.
16.8
23.
9213
.53
3.69
13.9
54.
6414
.07
3.97
13.9
64.
43
1.19
0.59
1.79
1.24
1.53
.232
.563
.070
.212
.122
675
Aff
iliat
ion
12.6
53.
8911
.65
4.38
1.84
.063
676
Intr
acep
tion
15.3
44.
5717
.28
4.08
3.58
.601
***(
N)
677
Succ
oran
ce9.
404.
118.
894.
240.
95.6
5467
8D
omin
ance
16.2
44.
6516
.39
3.81
0.29
.770
679
Aba
sem
ent
12.1
25.
1111
.97
7.98
0.17
.860
680
Nur
tura
nce
13.3
04.
6812
.58
4.53
1.23
.218
681
Cha
nge
15.2
84.
5715
.05
4.42
0.40
.693
682
End
uran
ce16
.53
4.73
16.4
15.
030.
19.8
4568
3H
eter
osex
ualit
y15
.81
6.42
16.5
96.
760.
92.6
3668
4A
ggre
ssio
n13
.18
4.03
12.8
55.
140.
53.6
0068
5C
onsi
sten
cy4.
235.
033.
822,
340.
94.6
47
Beh
avio
r In
vent
ory
Wav
e I
Sam
ple
Whi
te G
roup
Neg
ro G
roup
Var
iabl
eD
imen
sion
= 1
70)
(N =
.62)
Mea
n.S.
D.
Mea
nS.
D.
87T
otal
Sco
re13
.62
2.82
15.0
62.
663.
57.0
01**
*(N
)

CH
APT
ER
VII
--
Tab
le 1
1 co
nt.
Han
d T
est
Wav
e I
Sam
ple
Var
iabl
eD
imen
sion
Whi
te G
roup
(N =
170
)M
ean
S.D
.
Neg
ro G
roup
(N =
62)
Mea
nS.
D.
tp
70In
terp
erso
nal R
espo
nse
9.12
2.94
9.27
3.23
0,32
.749
71E
nvir
onm
enta
l Res
pons
e6.
742.
616.
693.
020.
11.9
0972
Mal
adju
sted
Res
pons
e2.
381.
782.
531.
570.
62.5
4673
With
draw
al R
espo
nse
0.65
1.09
1.16
2.48
1.55
.118
78In
ner
Dir
ecte
d4.
902
;31
5.32
2.47
1.17
.243
79O
uter
Dir
ecte
d3.
481.
843.
111.
751.
39.1
6180
Act
ing
Out
Rat
io1.
751.
431.
921.
470.
78.5
6083
Path
olog
ical
Sco
re3.
692.
854.
905.
071.
77.0
48*(
N)
Var
iabl
eD
imen
sion
Mau
dsl
Pers
onal
ity I
nven
t=W
ave
I Sa
mpl
e
Whi
te G
roup
(N =
170
)M
ean
S.D
.
Neg
ro G
roup
(N =
62)
Mea
nS.
D.
tp
84E
xtro
vers
ion
85N
euro
ticis
m86
Und
ecid
ed (
?)
*
29.6
27.
7818
.04
10.4
91.
992.
50
29.2
16.
6216
.97
8.86
2.03
2.91
0.40
0.77
0.10
.693
.55
2.9
13
p <
.05
***
p <
001
(N)
= N
egro
gro
up m
ean
high
er

CH
APT
ER
VII
--
Tab
le 1
2
T-T
ests
for
the
Sign
ific
ance
of
the
Dif
fere
nces
betw
een
the
Mea
n Sc
ores
for
Whi
te a
nd N
egro
Sub
grou
ps
on th
e A
rrow
-Dot
Tes
t
Var
iabl
e
96Id
97E
go98
Supe
rego
Var
iabl
e
96Id
97E
go98
Supe
rego
Var
iabl
e
96Id
97E
go98
Supe
rego
Dim
ensi
on
Dim
ensi
on
Dim
ensi
on
** p
< .0
1(N
) =
Neg
ro g
roup
mea
n hi
gher
(W)
= W
hite
gro
up m
ean
high
er
Wav
e I
Sam
ple
Whi
te G
roup
(N =
170
)M
ean
S.D
.
Neg
ro G
roup
(N =
62)
Mea
nS.
D.
tp
4.51
4.66
5.02
4.79
0.72
.519
20.4
86.
4719
.47
6.11
1.09
.277
4.24
3.30
4.89
3.50
1.25
.208
Wav
e II
Sam
ple
Whi
te G
roup
iN =
188
)M
ean
S.D
.
Neg
ro G
roup
(N =
92)
Mea
nS.
D.
tp
3.80
4.34
6.27
6.65
3.22
.002
**(N
)21
.79
6.14
18.7
87.
843.
22.0
02**
(W)
4.04
3.45
4.61
3.60
1.26
.207
Tot
al S
ampl
e
Whi
te G
roup
(N =
358
)M
ean
S.D
.
Neg
ro G
roup
(N =
154
)M
ean
S.D
.t
p
4.14
4.51
5.77
6.00
3.01
. 003
**(N
)21
.16
6.33
19.0
57.
203.
15. 0
02**
(W)
4.13
3.38
4.72
3.56
1.73
.080

a
ego strength and control. Finally, there is the Superego score, a measure ofsuperego strength, especially in circumstances where its demands are notconsciously experienced but are viewed as external restrictions. For Wave IIand for the total sample, there are significant differences between the group
means. The Negro group scores Wgher on the Id and Superego measures, thewhite group higher on the Ego score. These differential behavior characteris-tics accord with other findings of the battery. However, they must be regardedwith caution in view of the evidence that differences between the two racial groupsmay be exaggerated in high-speed or pressure test situations.
Summar and Discussion of the Res onse of White and Negro Patrolmen to theTest (Predictor) VariablesThis analysis has concentrated on obtained differences of response, and thustends to overstress such differences. Actually, the two racial groups are simi-lar on more dimensions than they are different. Another important fact to beborne in mind is that the distributions for the two groups overlap on all varia-bles. That is, if a Negro group mean is the lower, there will be some Negroeswho score higher than most of the whites. Conversely, if the Negro group meanis the higher, there will be some whites who score higher than most of theNegroes.
I.
With these considerations in mind, we can say that in the background area, theNegroes show higher educational achievement but are lower in the dimensions ofpersonal drive, financial responsibility, and family responsibility and adjust-ment.
In the work interest area, the Negro group are consistently high in their interestin creative and artistic-interpretative occupations. There is also some evidenceof higher interest in the theoretical, scientific, and clerical areas. On the otherhand, the white group showed higher interest only in the prestige and statusoccupations.
167

There were no generalized differences in either creative potential or social in-
sight, but the Negro group scores lower on all mental ability, tests and most
markedly so on the speeded and pressure tests.
In the behavior area, the Negro group is more impulsive, demonstrative, andgenerally outgoing. There is a more immediate expression of emotion, espe-
cially in the absence of external controls, and t? more subjective and feeling-
oriented approach to life. 1: y contrast, the white group is more controlled,
resistent to stress, and more pragmatically and realistically oriented.
It is not the purpose of this report to determine the reasons for these differ-
ences. They may be the result of cultural factors, genetic influences, mo-
tivational values, experience in test-taking, or any combination of these and
still other forces. According to the results, however, these groups do differin some important respects, and this differential response to the tests partially
\.explains the observed differences in test validity for the two groups.
Our next steps in this report are first to investigate group differences on theperformance. (criterion) measures, and second to relate test scores to actual
performance in the most realistic and meaningful way possible.
RESPONSE OF WHITE AND NEGRO PATROLMENTO THE PERFORMANCE (CRITERION) VARIABLES
The differences between the white and Negro subgroups for the eight criterion
measures used in the study are shown in Table 13. The first three of these are
regarded as the major criteria. The paired-comparison performance ratingdiffers from the others in that it was specially instituted for this study and was
not taken from records kept available by the Chicago Police Department.
The Three Ma'or Criterion VariablesThe white subgroup is rated higher (more favorably) on the paired-comparison
performance rating, but for the Wave I sample the difference between the sub-
groups is not significant. However, this differences does reach statistical
166

CH
APT
ER
VII
-T
able
13
T-T
ests
for
the
Sign
ific
ance
of
the
Dif
fere
nces
betw
een
the
Mea
n Sc
ores
for
Whi
te a
nd N
egro
Sub
grou
ps
on th
e Pe
rfor
man
ce (
Cri
teri
on)
Mea
sure
s
Var
iabl
eC
rite
rion
Wav
e I
Sam
ple
Whi
te G
roup
NM
ean
S.D
.N
egro
Gro
upN
Mea
nS.
D.
tp
0
2137
230
837
337
53.
7435
931
4
PC R
atin
g19
66 C
PD R
atin
gC
PD T
enur
eC
PD A
war
dsII
D C
ompl
aint
sD
isci
plin
ary
Act
ions
Num
ber
of A
rres
tsT
imes
Abs
ent
170
170
167
170
170
170
170
170
51.0
285
.72
9.32
1.05
1.68 .85
40.4
23.
25
11.8
63.
347.
461.
382.
571.
2028
.74
3.58
62 61 60 62 62 62 62 62
50.0
384
.67
9.37
0.64
2.98
2.57
80.6
62.
94
11.8
23.
983.
990.
752.
842.
4260
.54
2.65
0.56
1.83
0.06
2.90
3.16
5.33
4.99
0.73
.580
.065
.954
.004
**(1
0.0
02**
(N)
.000
***(
N).
.000
***(
N)
.525
Wav
e II
Sam
ple
Var
iabl
eC
rite
rion
Whi
te G
roup
Mea
nS.
D.
N
Neg
ro G
roup
Mea
nS.
D.
t
21PC
Rat
ing
144
52.1
011
.21
8448
.25
11.3
82.
47.01
4*(W
)37
219
66 C
PD R
atin
g18
486
.39
3.91
9083
.58
4.11
5.37
.000
***(
W)
308
CPD
Ten
ure
188
6.62
5.17
927.
435.
181.
23.2
1837
3C
PD A
war
ds18
80.
840.
9491
0.73
0.74
1.03
.305
375
IID
Com
plai
nts
188
1.54
2.72
922.
162.
971.
68.0
9137
4D
isci
plin
ary
Act
ions
188
3.46
4.28
917.
276.
984.
76.00
0***
(N)
359
Num
ber
of A
rres
ts18
848
.18
39.7
790
68.1
451
.76
3.22
.00
2**(
N)
314
Tim
es A
bsen
t18
72.
482.
4789
3.20
3.33
1.81
.068

CH
APT
ER
VII
--
Tab
le 1
3 co
nt.
Tot
al S
ampl
e
Var
iabl
eC
rite
rion
NW
hite
Gro
upM
ean
S.D
.N
Neg
ro G
roup
Mea
nS.
D.
21PC
Rat
ing
314
51.5
211
.57
146
49.0
011
.60
2.16
.029
*(W
)37
219
66 C
PD R
atin
g35
486
.07
3.66
151
84.0
24.
095.
29.0
00**
*(W
)30
8C
PD T
enur
e35
57.
896.
4915
28.
204.
840.
58.5
6837
3C
PD A
war
ds35
80.
941.
1715
30.
700.
752.
84.00
5**(
W)
375.
IID
Com
plai
nts
358
1.61
2.65
154
2.49
2.94
3.21
. 002
**(N
)37
4D
isci
plin
ary
Act
ions
358
2.22
3.46
153
5.37
6.06
6.00
.000
***(
N)
359
Num
ber
of A
rres
ts35
844
.49
35.1
815
273
.25
55.8
55.
85. 0
00**
*(N
)31
4T
imes
Abs
ent
357
2.85
3.08
151
3.09
3.07
0.82
.580
* p<
.05
**p
<.O
1**
* p<
.001
(W)
= W
hite
gro
up m
ean
high
ero
(N)
= N
egro
gro
up m
ean
high
er

significance for the Wave II sample (.02 level) and for the total sample (,03
level). Much the same pattern appears in the only other subjective .supervisory
rating used in the study--the one currently used and maintained by the Chicago
Police Department--but at somewhat higher levels of significance. On this
criterion, the difference between the white and Negro subgroups almost achieves
significance for the Wave I sample (.07) and is significant beyond the .001 level
of confidence both for the Wave IX and for the total sample. It might be con-
cluded from these supervisory rating figures that the white patrolman tends tobe a better performer than his Negro counterpart. However, the possibility of
supervisor bias in favor of the white patrolman must be considered. Such bias
could easily cause greater differences between the subgroups on the CPD
rating--which uses the traditional rating-scale techniques--than are round on thepaired-comparison rating--which employs a technique generally recognized asreducing the effects of conscious or unconscious bias (Guilford, 1954, p. 174;Taylor & Wherry, 1951).
In contrast to these results, there are no significant differences between the
subgroups for any of the samples on the tenure criterion. It seems safe toconclude that white and Negro patrolmen do not differ in departmental turnoverrate.
The Six RemaiirDA. Criterion Variables
For these six variables, it is only on the absence record--as on the major cri-terion of tenure--that the subgroups show no significant differences. In general,the pattern for the remaining variables is that the white subgroup scores higheron the number of CPD awards made over their period of tenure and the Negro
subgroup scores higher on file number of arrests made, the number of disci-
plinary actions taken against them, and the number of IID complaints sustainedagainst them.
One feasible explanation for these differences is that Negro patrolmen tend more
often to be assigned to predominantly Negro districts, which would include the
171

ghetto areas. Since the crime rate in these districts is usually higher, it isnatural that more arrests will be made. It also seems likely that patrolmenwho are constantly "where the action is" will have more complaints made
against them and, possibly, have more of these sustained.
DIFFERENTIAL TEST VALIDITIES FOR WHITE AND NEGRO SUBGROUPS
The foregoing analyses have established that white and Negro patrolmen do
respond differently on many of the predictor and criterion measures used in
this study. This differential response almost certainly explains the signifi-
cantly different test battery validities obtained. for the two groups as discussed
in the multiple-regression-validation section of this Chapter and reported inTable 2.
The question now arises as to the most equitable and efficient way of predicting
performance for this racially-mixed group of patrolmen. An analysis of thisproblem was pursued only for the three major performance or criterion var-iables, namely, the paired-comparison performance rating, the Chicago Police
Department performance appraisal, and tenure. Various types of predictionmodel have been succinctly defined by Krug (1966). One of these, illustrated in
Figure 1, might apply when there are no subgroup differences on some per-formance criterion but significant differences on certain test or predictor vari-ables. In this study, tenure is the only major performance criterion where this
model might apply. Clearly, if a particular selection standard is set with re-spect to such a criterion, the corresponding cut-off points on the predictor var-
iables would be lower for Negro than for white applicants. Under these circum-
stances, use of different predictor-variable standards for the subgroups shouldnot result in any change in the criterion variable for the total sample. Such a
procedure is not an innovation in psychological measurement. In the past, dif-
ferent standards for specific predictor variables have often been applied to
various subgroups in the population, such as those defined by age and sex. For
example, different, sex norms are frequently found in the manuals of psy-
chological tests.
172

CHAPTER VII -- Figure 1
PREDIC1ION OF SIMILAR PERFORMANCEFOR GROUPS WITH DIFFERENT TEST SCORES
iI
Test Battery ScoreN
173

There is the possibility that the prediction of both supervisory ratings may con-
form to the model shown in Figure 2. However, it would be necessary to
demonstrate that the criterion variables were free from bias and that the same
tests predicted performance for both the white and the Negro subgroups. Under
these circumstances, a lower test score could justifiably be regarded as in-
dicating a lower level of performance. Setting a given selection standard for
performance, as indicated in Figure 2, would then result in the exclusion of a
far greater proportion of Negro than of white applicants. Since such a conclu-
sion would have far-reaching technical, administrative, and social implications,
a careful study was made to determine the degree of overlap among the tests
which were predictive for white and Negro patrolmen.
This study used a multiple-regression analysis on each of the three major cri-
teria, done separately for the Wave I and Wave II samples. Within each sample,
the total group and the white and Negro subgroups were divided into random parts,
and the multiple-regression weights established for each part were used to pre-
dict performance in all the other parts. For example, the results for the paired-
comparison performance criterion are shown in Table 14. Since there is a total
of six parts when the subgroups in each sample are divided, there are six col-
umns of multiple-regression correlations. In addition, the number of cases (N)
and the number of variables (m) used for the prediction are shown for each part.
Because each sample was divided into six parts, the numbers utilized in the re-
gressions are necessarily smaller and the estimates of the correlations less
stable. However, certain trends appear which are consistent for, each criterion
studied and for both the Wave I and the Wave II samples.
The Paired-Comparison Performance CriterionIn Table 14, the multiple correlations between the parts of each group are shown
in blocks bordered with solid lines. Correlations corresponding to those ob-
tained in the preliminary validation reported in Table 2 are given,in the diagonal
entries in each block. Table 2 results are repeated here in that the primary
174

CHAPTER VII -- Figure 2
ONE PREDICTION MODELFOR GROUP DIFFERENCES
ON BOTH PERFORMANCE AND TESTS
A
-JP- Test Battery Score --ac sualwar

CHAPTER VII -- Table 14
Analysis of Within-Wave Multiple Correlations
for Paired-Comparison Performance Criterion
Subgroup
N
Subgroup
T1
T2
W1
W2N1
N2
Subgroup
N
m
Subgroup
T1
Tn
W1
W2
N1
N2
Total Group(T)
Wave I Sample
White Group(W) Negro Group(N)
Part 1
80
5
Part 2
101
4
Part 1 Part 2
58 73
7 8
Part 1
22
7
.38 .23 .36 .21 22
.27 .41 . 24 . 47 . 26"MI
.37 . 17 .59 .21 . 05
.33 .42 .21 .53 .19
.41 .44 -. 02 25 .73
.14 .40 29 .37 461.1111
Wave II Sample
97 95 61 65 36
6 5 9
.49 .25 .35 .05 . 46
.24 .,46 . 19 40 . 01
. 36 . 33 . 59 12 .25
.11 .48 24 .61 -. 14
.57 .15 05 -.11 .66
. 49 46 . 04 .08 . 34
176
Part' 2
28
6
. 19
.29
. 12
,19
36
66
MOM*
30
. 32
. 12
. 22
-. 17
. 51
. 75
ONMIIIM MINIMA

validation coefficients for the racially mixed total group (.38, .41) are lower
than those obtained for either racial group treated separately (white--.59, . 53;
Negro - -. 7,3, .66). These results are repeated for the Wave II sample, withmoderate coefficients for the racially-mixed total group (.49, .46), increasing
for the white group (.59, .66), and increasing even further for the Negro group
(.66, .75).
The cross-validation coefficients between the parts of each group are shown in
the off-diagonal entries in the solid-outline blocks. In both samples, the best
cross-validations were obtained for the Negro group. In the Wave I sample,
Negro-group primary coefficients of .73 and .66 shrink, to .46 and .36. In the
Wave II sample, Negro primary coefficients of .66 and .75 shrink to .34 and .51.
The cross-validation coefficients for the white group show little improvement as
compared with those for the total group but do, at least, remain relatively
stable.
In contrast to these results, the poorest validity coefficients were obtained
when predicting the performance of Negroes from weights established on white
samples and vice versa. These coefficients are shown in blocks bordered by
broken lines. All are at a low level, and some sink to zero or even become
negative.
If the validity coefficients for either the white or the Negro group are based on
weights obtained on the total racially-mixed group, they are inconsistent. Thus,
the coefficient for one part of the white group is .33 as compared with .11 for
the other part. Again, the coefficient for one part of the Negro group is 49
as compared with .15 for the other.
The Chica o-Police-De artment-Ratin Performance CriterionTable 15 shows the results for this criterion. They are not quite as clear-cutas those obtained for the paired-comparison performance appraisal, but they
follow the same trends for both the Wave I and the Wave II samples, as shown
in the diagonals of the solid-line blocks. Thus, the primary validity coefficients
177

CHAPTER VII -- Table 15
Analysis of Within-Wave Multiple Correlations
for C. P. D. Performance Rating Criterion
Total Group(T)
Part 1
Subgroup
N
mSubgroup
80
11
T1 63
T2 .19
W1 .54
W2 .25
N1 .67
N2 -.03
Subgroup
97
m 6
Subgroup1.01000..."
T1 .54
T2 23
W144
2
Wave I Sample
White Group(W) Negro Group(N)
Part 2 Part 1 Part 2 Part 1
101 58 73 22
4 9 6 5
.20 .52 .24 45
.53 .18 .39 .02
.10 . 61 . 21 . 24
.53 .28 . 54 -.01
.25 .38 . 19 .65
.52 -.10 -. 03 . 11
Wave II Sample
95 '61 65 36
5 10 5 11
.25 .39 -.07 . 35
. 44 .24 .25 . 10
33 .62 .15. . 06
.38 .25 39 . 03
.17 .20 . 46 .80
. 63 .20 -.05 .37.
. 12
,57
. 371
178
Part 2
28
.07
.37
701 7.23
; 71
; 35
30
6
24
.29
08
. 10
.34
.74

1
for the racially mixed total group in the Wave I sample (.63, 53) remain at
about the same level for the white group (.61, .54) but show a more perceptible
increase for the Negro group (.65, .71). The same pattern holds for the Wave II
sample, with an even more spectacular increase in the Negro-group coefficients
(.80, .74).
The cross-validation coefficients between the parts of each group (shown in the
off-diagonal entries in the solid-outline blocks) are generally lower for this
criterion than for the paired-comparison appraisal. However, with the excep-
tion of a coefficient of .11 for Part 2 of the Negro group, the highest cross-
validation coefficients 'are obtained when predicting the performance of Negro
patrolmen from weights established on Negro groups.
For this criterion again, poor validity coefficients are obtained when attempting
to predict performance across racial groups, i.e., when attempting to predictNegro performance from weights established on white groups or vice versa.
Nine out of 16 of these coefficients are essentially zero, and one swings to
negative .46.
Results of attempts to predict performance for white and Negro groups from
weights based on a racially-mixed group are contradictory as they were for the
paired-comparison criterion. Thus, coefficients obtained for the two white
groups were .33 and .12, for the two Negro groups .37 and .17.
The Tenure Performance CriterionTable 16 gives the results for this criterion. These present a contrast to thosepresented in the two previous tables in that all the coefficients, both primary and
cross, are, at generally high levels. However, the trend for cross-validitycoefficients to be higher within racial groups and especially within the Negro
groups is evident here too.
179

Subgroup
N
Subgroup
Ti
CHAPTER VII -- Table 16
Analysis of Within-Wave Multiple Correlations
for Tenure Performance Criterion
Total Group(T)
Part 1 Part 2
Wave I Sample
White Group(W)
Part 1 Part 2
Negro Group(N)
Part 1 Part 2
80 101 58 73 22 28
11 12 7 14 6 8
69 ,52
57 .68
. 67 .47 .53 .50
. 51 .66 . 57 .65.11100..
72 . 52
. 50 .62
70 62
77 . 89
. 51 .49
. 49 . 57
48 .80 .70
. 83 . 94
Subgroup
N 97 95 61 65 36 30
m 22 17 19 12
.80 . 75
66 . 74
. 89 .79
. 67 . 87
. 63 . 68
. 69 .59
. 77 66
. 68 . 57
. 73 .63
. 67 .44
. 86 .71
. 71 .81

SUMMARY AND CONCLUSION
This Chapter opened with an historical review of the events which led up to the
heated public controversies of the past decade concerning the use of
psychologically-based methods of personnel selection. A major concern in
these controversies was that the use of tests might discriminate against dis-advantaged groups in the labor market. This concern was given legal support
and sanction by Title VII of the 1964 Civil Rights Act, which forbids discrim-
ination by employers, labor unions, and employment agencies on the basis of
race, color, religion, sex, or national origin. However, one clause in Section703 (h) of Title VII, known as the Tower Amendment, was inserted to protect
the right of employers to use tests for purposes of employment, placement, and
promotion, provided their intention was not to practice discrimination as de-
fined by the Act. As a further aid to employers, Title VII also established the
Equal Employment Opportunity Commission whose primary initial task was to
help employers in implementing both the letter and the spirit of the new law.
Following this historical review was a discussion of the various types of dis-
crimination which can occur when tests are used. In this discussion, the prin-cipal focus was on the means of preventing such test-related discrimination,
particularly or means recommended by the EEOC in its publications on this
question. Those types of discrimination which can affect any member of the
population can usually be eliminated if test administration, scoring, and inter-
pretation are performed by people specially trained and, in the case of inter-pretation, professionally qualified for this work. Other types of discrimination,
which are most likely to operate specifically against racial subgroups, can be
prevented by using specialized techniques for the validation of tests and the
implementation of selection programs. In this instance again, professionally
trained personnel are essential.
Pressures from those Civil Rights groups which maintain that "all tests dis-criminate against the Negro, " threats to complain to state Fair Employment
Practices Commissions, and the seeming complexity of some of the

requirements for guarding against discrimination have occasionally so intimi-
dated employers as to cause them to abandon all use of tests. Some psycholo-
gists (e.g. t Ash, March, 1966, p.11) have stated that this action is the equiv-
alent of throwing out the baby with the bath water. Perhaps an even more apt
analogy is that abandoning the use of tests is like throwing away a scalpel be-
cause it bared a malady. It would be ironic if the very instruments which first
drew attention to the far-reaching effects of economic, social, and cultural
deprivation were not now used to minimize these effects in the job market by
diagnosing the exact training needs of an applicant so that he can be placed in
an occupational situation where he is likely to succeed.
As a further irony, it is, of course, within the letter of the law for an organiza-
tion indiscriminately to hire large numbers of individuals from, so-called disad-
vantaged groups. The usual result of such indiscriminate hiring is that thosehired either leave or are fired within a short time because they are unable to
perform to their own or the company's satisfaction. This upshot is not only
expensive and disruptive for the hiring organization but is also disastrous for
the individuals in question. In the opinion of this investigator, a history of
repeated occupational failure is the major cause of the attitudes of despair and
resentment held by the disadvantaged seeking employment and of distrust and
reluctance held by their potential employers. Proper selection can do much in
the long run to ameliorate this situation. It is particularly important where the
removal of a.n unsatisfactory employee is difficult after an initial probationary
period has elapsed.
The results of the present investigation indicate that equitable and effective
selection and placement are possible with multi-racial groups and that onemethodfor achieving this goal, and probably one of the most effective, is to use
specifically validated tests interpreted by professionally qualified personnel.
Parenthetically, it should be noted that for effective interpretation of test re-
sults, the sex, age, and race of the individual must be known to the interpreter.Deliberate omission of this information can lead to discrimination against either
182

sex in particular occupations, against the aged in many instances where speeded
tests are used, and against the disadvantaged in most circumstances,
Specifically, our investigation has shown that the subgroups of white and Negro
patrolmen included in the study differ significantly on certain of the test (pre-dictor) variables and on six of the eight performance (criterion) variables. Onthe latter variables, many of the differences may be a result of disparate con-ditions for performance, such as assignment to districts, etc. However, sig-nificant differences on the test variables occur in all areas of the test battery,ranging from background data through work interests to intellectual abilities,special aptitudes, and behavior attributes. Whatever the origin of these differ-ences (genetic, environmental, or a combination of these), they do exist andprobably account for the differential test validities obtained.
The multiple regression analyses, done separately for the two samples in thestudy (Wave I and Wave II), both yielded higher validity coefficients ik)r raciallyseparate groups than for racially-mixed groups. Further, in predicting thetwo most significant performance criteria, the best cross-validation coefficientswere obtained when the racial groups were treated separately, i.e. , when
weights based on Negro subjects were applied in predicting the performance ofNegroes and vice versa. In contrast, the lowest cross-validation coefficients
were obtained when predicting across racial groups, i.e., when weights basedon Negro groups were applied in predicting the performance of white groups andvice versa. When weights derived from a racially-mixed group were used topredict the performance of either white or Negro groups, the results were in-consistent and contradictory. Interestingly enough, for each of the three majorcriterion measures, the highest validity and cross-validity coefficients wereobtained for the Negro group.
On the basis of these results, separate validations for different racial groupsare recommended as a routine procedure in the selection of patrolmen. Fur-thermore, this procedure should not be limited to the case of white and Negro
183

groups but should be extended to any other minority groups, e.g. , the Spanish-
speaking, whenever there are a sizable number of such applicants. Under these
conditions, the Police Department should be selecting the most suitable candi-
dates from all races*, and each candidate, regardless of race or national origin,
will be provided with an equal opportunity to utilize his particular skills and
abilities in achieving occupational success.
REFERENCES
Ash, Philip. Race, employment test, and equal opportunity. IndustrialManagement, March, 1966, 8, 8-12.
Ash, Philip. The implications of the Civil Rights Act of 1964 for psychologicalassessment in industry. AEesican12syshologist, August, 1966, 21,797-803.
Black, Hillel. They shall not pass. New York: Murrow, 1963.Bragg, Emma W. ti ,study of the in-put212.LacteLAsticsaf the OMPER roproject
trainees at Tuskeze institute, Alabama. A re ort submitted to the officersof the OMPER project. Research, Experimentation and DemonstrationProject, Contract No. 82-01-66-35, Project No. Ala. (M) 6082-000, June,1967. aVlultilithed report)
Campbell, 3. The problem of cultural bias in selection: I. Background andliterature. In. The Executive Study Conference, Selecting and trainingNegroes fox' managerial positions. Princeton, N.J.: Educational TestingService, 1965, 57-64.
Dreger, R.M, and Miller, K.S. Comparative psychological studies of Negroesand whites in the United States. Psychological Bulletin, 1960, 57, 361-402.
Dugan, Robert D. Current problems in test performance of job applicants: II.Personnel Psychology, Spring, 1966, 19, 18-24.
Equal Employment Opportunity Commission. Guidelines on employment testingprocedures. Washington, D.C.: EEOC, August 24, 1966.
Gross, Martin L. The brain watchers. New York: Random House, 1962.Guilford, J.P. Psychometric methods. (2nd ed.) New York: McGraw -Hill
Book Company, Inc. , 1954.
Guilford, S.P. Fundamental statistics in psychology and education. (3rd ed.)brew York: McGraw-Hill Book Company, Inc., 1956.
184

Kirkpatrick, James J. et al. Differential selection am on applicants firfromdifferent sociometric or elhnic background. Final Report to The FordFoundation, May, 1907. (Unpublished)
Klineberg, 0. Negro-white differences in intelligence test performance: Anew look at an old problem. American Psychologist, 1963, 18, 198-203. .3
Krug, Robert E. Some suggested approaches for test development and measure-ment. Personnel Psychology, Spring, 1966, 19, 24-35.
Lockwood, Howard C. Testing minority applicants for employment. PersonnelJournal, July-August, 1965, 44, 356ff.
Lockwood, Howard C. Critical problems in achieving equal employmentopportunity. Personnely,o , Spring, 1966, 19, 3-10.
Lopez, Felix M., Jr. Current problems in test performance of job applicants:I. Personnel cholo Spring, 1966, 19, 10-18.
Lucas, C.M. Survey of the literature relating to the effects of cultural back-ground on aptitude scores. Research Bulletin, 15-13. Princeton, N.J.;Educational Testing Service, 1953. (Multilithed report)
Mayfield, Harold. Equal employment opportunity: Should hiring standards berelaxed? Personnel, September-October, 1964, 41, 8-17.
Standards for educational and psychological tests and manuals. Prepared by ajoint committee of the American Psychological Association, AmericanEducational Research Association, and The National Council on Measure-ment in Education (co-chairmen: John W. French and William B. Michael).Washington, D. C. : 1966.
Taylor, Erwin K. and Wherry, Robert J. A study of leniency in two ratingsystems. Personnel Ps Tc11, Spring, 1951, 4, 39-47.
Wallace, Phyllis, Kissinger, Beverly, and Reynolds, Betty. Testing ofminority group applicants for employment. Equal Employment OpportunityCommission, Office of Research and Reports (Research Report 1966 -7),March, 1966.
Whyte, William H. , Jr. The organization man. New `York: Simon andSchuster, 1956.
185

CHAPTER VIII
Specific Patterns of Patrolman Field Performance
An organization which makes diversified demands of its members and allowsfor individuality of style in meeting these demands will not be composed of
behaviorally and psychologically homogeneous personnel. Rather, it willconsist of a variety of subgroups, differing among themselves but markedby a general internal similarity in the performance of their members. Apolice department is such an organization. Therefore, it is reasonable totry to search out its various performance groups.
METHOD
In this study, such groups were located by a statistical method known asnodal analysis. This method was applied to each testing Wave separately,using the eight major criterion or performance measures described inChapter III.
The specific technique of nodal analysis used followed the four steps sug-gested by Saunders and Schucman (1962). First, relationships betweenindividuals are determined by squaring the differences of the scores ofeach separate pair of cases and adding these squares across the perfor-mance variables. In the second step, "clusters" are derived by combining,one at a time, those cases with the smallest differences. Thus, individualsare matched on the basis of similarity of performance patterns. The clus-tering procedure continues until no further ,lusters are grouped about thatcluster's "node" or point representation, and mean scores are calculated
iy, /187'

:..m.
for the criterion or performance variables. Finally, each case's distance
from its node is calculated. The resulting clusters of patrolmen exhibit
patterns of performance which are similar within each group (internally
homogeneous) but which differ more markedly from group to group and
from the general average of the patrolman population as a whole (externally
distinct).
The mean performance scores for each node, identified by the nodal anal-
ysis specific to each testing Wave, were analyzed by means of a second
nodal analysis to determine which performance styles were common to
patrolmen in both Waves and which were unique to one Wave only. This
procedure identified four subgroups with membership in both Waves. In
a sense, the identification of matching nodal groups across the two Waves
confirms the significance of that performance pattern. Two further nodal
groups were found to have members unique to Wave I, and two others
membership unique to Wave II. These unique groups have fewer members
than the cross-Wave groups and may simply represent patterns of per-
formance which are less common in the department.
Since the nodal analysis technique did not force every test case into a node,
there remained a certain number of unassigned cases which could be con-
sidered only as representative of the total sample originally drawn from
the 12 districts.. As a check, the mean scores of this group were compared
with those of the original sample and found to be equivalent. Hence, this
group represents what might be called the "basic performance pattern" of
the Patrol Division of the Department.
As an aid in interpreting the performance subgroups, the differences be-
tween the basic pattern group and each subgroup on the defining perform-
ance criteria and on all available psychological scores were tested for
significance with t-tests. The discussion which follows considers only
those variables which exhibited statistically significant differences equal to or
better than the five per cent level of confidence. That is, the difference observed
188

between the subgroup and the basic performance group could be expected,
on the basis of chance, to occur only about five times out of 100.
DISCUSSION
The eight nodal subgroups identified in the analysis were thought to pro-
vide a significant basis for analyzing field performance and its relation to
the psychological dimensions assessed by the tests. To facilitate the anal-
ysis, the subgroups were organized into a framework (Table 1) which
clearly points up the differences in performance.
Our discussion will begin with the three patrolman subgroups which consist
of relative newcomers to the police force, Subgroup 1 being rated high on
performance, Subgroup 2 exhibiting average performance, and Subgroup 3
being rated low in performance. Next, three performance patterns char-
acterizing patrolmen with average tenure will be discussed. Subgroup 4
exhibited desirable performance, while Subgroups 5 and 6 are disciplineproblems for the department. Finally, the two groups with longest average
tenure will be examined. Here, the old-timers of Subgroup 7 appear to
maintain a higher level of activity in the department than the patrolmen in
Subgroup 8.
In the ensuing discussion, all subgroups are compared and contrasted to the
"basic performance" group, which is probably representative of the average
Chicago patrolman. The organization of the discussion by tenure (i. e. ,
newcomers, established patrolmen, and old-timers) takes advantage of
certain similarities and differences between the patterns of performance
exhibited by the subgroups. While it might be desirable to contrast the testresults of each subgroup with those of every other subgroup, time and space
do not permit such a presentation.
Figures 1 through 3 crYntain the performance criterion profiles of the eight
subgroups. The scores have been standardized and are presented on the
189
.4.11.4fitek.'orierwine"!af-aswars,..1.

CHAPTER VIII -- Table 1
Eight Performance Pattern Subgroups
Successful Performance Unsuccessful Performance
NEWCOMERS TO THE DEPARTMENT
Subgroup 1Low Tenure - Excellent Performance
Subgroup 2Low Tenure Good Performance
Subgroup 3Low Tenure -.Poor Performance
ESTABLISHED PATROLMEN
Subgroup 4Average Tenure - Excellent
PerformanceSubgroup 5
Average Tenure - Poor Performancewith DisciplinaryActions
Subgroup 6Average Tenure Conflicting Ratings
& General Disci-plinary Problems
OLD-TIMERS
Subgroup 7Long Tenure Excellent Performance
Subgroup 8Long Tenure - Good Performance

equal-interval normalized standard score grid. Note that the average of
the basic performance patrolman group is a standard score of 50 on each
of the performance criteria. The performance of ea.c subgroup may
therefore be readily compared to that of the basic group. Table 2 gives the
raw score means and standard deviations for all groups on the performance
variables.
Criteria
SUBGROUP 1
Newcomers with Excellent Performance
The first subgroup consists of low-tenure officers who seem to be extreme-
ly active and effective. Although the majority of these officers are assigned
to districts with an average index crime rate, their arrest and award recordsare in the very high range, significantly higher than those of the basic pat-
tern group or of the other nodal groups. Their supervisors feel they are
doing a good job as shown by their high-average ratings on both the paired-
comparison and the department ratings, but they are not the highest-rated
subgroup on these subjective measures. They show significantly fewer
absences than the average, and an average level of disciplinary actions and
complaints, Thus, Subgroup .1 certainly typifies a desirable pattern of
patrolman performance.
Motivational Measures
Their background pattern tends to follow that of the basic pattern group
with the two notable exceptions of Drive and Vocational Satisfaction as mea-
sured by the Personal History Index. Subgroup 1, scoring in the average
range on these variables, is significantly higher than the basic group in
both instances.
71

co
R.1
CH
APT
ER
VII
IT
able
2
Raw
Sco
re M
eans
and
Sta
ndar
d D
evia
tions
for
the
Subg
roup
s an
d
the
Bas
ic P
erfo
rman
ce G
roup
on
the
Perf
orm
ance
Mea
sure
s
GR
OU
PB
asic
Per
for-
man
ceN
ewco
mer
sE
stab
lishe
d Pa
trol
m6n
Old
-Tim
ers
Subg
roup
1Su
bgro
up 2
Subg
roup
3Su
bgro
up 4
Subg
roup
5Su
bgro
up 6
Subg
roup
Subg
roup
8:
CR
ITE
RIA
N20
226
5859
3524
1811
13
P. C
.M
ean
48. 6
0R
atin
gS.
D.
10. 8
261
.24*
**
8. 3
656
. 37*
**8.
0739
. 74*
*5.
05
63. 9
4***
4.02
41. 4
4***
8. 6
052
. 16
10. 0
1.6
3. 6
8***
5. 1
760
.158
***
10.3
0
Ten
ure
Mea
n8.
66(y
rs. )
S. D
.5.
10
4. 8
5***
3. 0
86.
36 *
*4.
64
4.54
* *
*4.
12
10.1
1*3.
64
9.62
3. 4
19.
004.
07
23. 0
9**
17.2
616
.15
* **
5.27
Abs
ence
sM
ean
3.23
S.D
.2.
56
2. 2
3*1.
801.
59*
**1.
42
3. 7
75.
36
1. 6
3***
1. 9
33.
. 33
2. 6
76.
44*
*4.
57
3. 9
12.
313.
082.
06
Arr
ests
Mea
n56
. 87
(num
ber)
S.D
.44
. 43
105.
88*
*72
. 13
31. 0
8***
21.2
129
. 60*
**20
. 00
70. 4
937
. 38
39. 4
2*30
. 76
87.6
7*53
. 10
29. 9
1**
_26.
05
:79.
38.4
7. 7
2
CPD
Mea
n84
. 64
Rat
ing
S.D
.3.
72
87. 6
2***
2. 6
685
. 86*
*2.
71
82. 6
8***
3. 1
090
, 19*
**2.
87
82. 6
2**
3. 4
385
.39
2. 6
691
. 09*
**2.
50
87.8
5 **
3.49
Aw
ards
Mea
n0.
72
S.D
.0.
67
3. 5
0***
1. 9
00.
34*
**0.
400.
26*
**0.
351.
20*
**0.
74
0. 5
70.
691.
26*
1. 0
20.
38**
0.36
1. 6
7***
0. 7
6
tD
isc.
Mea
n3:
54A
ctio
nsS.
D.
5. 0
72.
693.
34
0.71
* *
*1.
19
1.24
***
1. 6
21.
36 *
**
1. 7
15.
38 *
**
1. 7
813
.10
* **
7. 5
90.
32 *
**
0. 7
27.
51 *
*4.
49
Com
plai
nts
Mea
n2.
43
S. D
.2.
71
1. 5
20.
31*
**0.
63*
**-
2. 2
20.
93
1. 0
71.
06*
** :
2. 1
97.
87*
**1.
79
=0.
98
5. 4
60.
73*
*1.
54
1. 9
5i
1.92
The
dif
fere
nce
betw
een
this
sub
grou
p m
ean_
and
the
basi
c gr
oup
mea
n co
uld
occu
r by
cha
nce
5 tim
es p
er 1
00.
The
dif
fere
nce
betw
een
this
sub
grou
p m
ean
and
the
basi
c gr
oup
mea
n co
uld
occu
r by
cha
nce
1 tim
e pe
r 10
0.T
he d
iffe
renc
e be
twee
n th
is s
ubgr
oup
mea
n an
d th
e ba
sic
grou
p m
ean
coul
d oc
cur
by c
hanc
e 1
time
per
1000
..

tr
11111 NM MIS SIMI
CHAPTER VIII Figure 1
Newcomers to the Department
Subgroup 1-- Excellent Performance (N.26)
Subgroup 2--Good Performance (N=58)
Subgroup 3--Poor Performance (N.59)
PC RATING
CPD RATING
TENURE
AWARDS
COMPLAINTS
DISC. ACTIONS
ARRESTS
ABSENCES
Normalized Standard Scores
20
VeryLow
30
Low
40Low
Av.
Average--1
50
High
I HighA%-1.60 70
I VeryI High
80
. 00
Iil

The work interest responses of this subgroup suggest a stronger interest
in artistic and stylized production, and a higher level of vocational aspira-tion.
Intellectual Measures
Patrolmen in Subgroup 1 have slightly higher levels of reasoning abilityand language facility. Their perceptual ability on Closure Speed and Per-
ceptual Speed :Ls significantly better than that of the average patrolman.
This indicates a stronger capacity on their part to meaningfully organize
an ambiguous situation, and to rapidly and accurately discriminate sim-
Rarities and differences in their perceptual field. Their scores on the
AC Test of Creative Ability are significantly higher than those of the basic
pattern group. Their ability to provide creative solutions to problems
involving the generation of ideas and novel applications ranges from
average to higher than average.. This suggests that they are, probably in
novative and adaptive in solving problem situations on the job.
Special Aptitudes
Analysis of the scores on the lest of Social Insight shows that Subgroup 1
patrolmen are significantly less inclined to use withdrawal as a solution
in a problematical social situation. They show a significantly greater ten-
dency to adopt a cooperative approach in dealing with such situations and
are more inclined to be active rather than passive but this latter differenceis not statistically signigicant.
Behavioral Measures
There were no significant differences between Subgroup 1 and the basic
pattern patrolmen on the Arrow-Dot Test. On the Press Test Subgroup 1showed a significantly faster reaction time to both verbal and color stimuli,
but their reaction under stress conditions (Part III), although somewhat
faster, was not significa.ntly different. In general, they showed a higher
level of reactivity in all parts of the test.
194

Only one signficant difference was found in reviewing the performance oftie two groups on three other behavioral tests. On the Hand Test, theSubgroup 1 patrolmen were significantly lower on Withdrawal. This sug-gests that their contact with reality is acceptable and satisfying.
The two patrolmen groups do not differ appreciably in creative potential asmeasured by the Cree Questionnaire, although Subgroup 1 patrolmen aresignificantly more conforming, and significantly less interested in scien-tific and theoretical work.
Subgroup 1 shows several significant differences on the behavior factors ofthe Temperament Comparator. As described in Chapter IV, these factorsare composites based upon combinations of the 18 trait scores developedfrom the subject's self-description of his own behavior. Subgroup 1 officersare more outgoing (i. e extroverted) and significantly less stable than thebasic pattern patrolman group. Individuals scoring low on Stable are aptto exhibit a range of emotions and to be less predictable than their morestable counterparts. At the same time, such individuals are likely to bemore active and more successful in creating enthusiasm in others. The
significantly higher score of Subgroup 1 on the Excitable factor suggeststhat these men are lively and full of energy. However, they are signifi-cantly lower on Sociable, indicating that they are less socially inclinedthan patrolmen in general, and may be comfortable in solitary work notrequiring many social contacts. This does not mean that they are anti-social, rather than they are more "work-oriented" than "person-oriented. "
The Subgroup 1 patrolmen show significant departures from the basic pat-tern patrolmen in three of the 15 need areas measured by the Edwards
Personal Preference Schedule. They are significantly lower on need Auto-
nomy (to be independent, to feel free, to be able to come and go as desired),need Intraception (to analyze one's own and others' feelings and motives),and significantly higher on need Succorance (to receive support from others).These results suggest that they need direction and guidance in their workactivity, are not overly concerned about, or sensitive to, -interpersonal
195

needs and functioning, and need some modicum of psychological support
from other persons.
Summary
Subgroup 1 consists of younger patrolmen who react quickly yet correctly
to situations presented to them. They are comfortable working in solitary
situations, and, although disinclined to ponder the subtleties of human in-
teraction, are enthusiastic, persuasive, and able to seek and obtain thecooperation of those they deal with. Rather than withdrawing from diffi-
cult situations, they are inclined to spontaneously meet and resolve them
with solutions which are both creative and practical. In general, theyaccept the authority of those placed over them, and are effectively reward-
ed by the praise and encouragement of their supervisors. These men are
highly rated and satisfied with their career choice. They exhibit the de-
sire and the drive to achieve success and advancement. In spite of their
low tenure and relative youth, they have exhibited a highly successful
pattern of performance as patrolmen.
SUBGROUP 2
Newcomers with Good Performance
Criteria
Patrolmen assigned to the second subgroup by the nodal analysis procedure
were significantly lower than the basic pattern patrolman group in length of
service. Interestingly enough, in spite of the fact that they fall significantly
below the average number of arrests and departmental awards, they were
rated significantly higher than the basic patrolman group by their district
supervisors in both the departmental and the paired-comparison ratings.
Their attendance is significantly better than that of the basic group, and
they received significantly fewer disciplinary actions and complaints. The
high supervisory rating suggests that they are not guilty of inactivity.
Therefore, the low number of arrests is probably not particularly undesir-
able in itself, although these men are assigned to districts with a slightly
higher-than-average index crime rate.
196

N
Motivational Measures
The patrolmen in Subgroup 2 exhibit a pattern of background and experience
scores which generally conforms to that of the basic pattern patrolman group,
with three notable exceptions. First, they show a signficantly lower level of
financial responsibility. This is no doubt related to their youth, but clearly
they have not yet developed a high degree of skill in the management of their
personal financial affairs. Another significant difference is in the area of
parental family adjustment, which reflects the developthent of realistic and
constructive attitudes towards the family, based upon early childhood exper-
iences, Subgroup 2's score in this area suggests a better basis for emotion-
al adjustment than that enjoyed by the basic group. Finally, this subgroup
also exhibits a level of vocational satisfaction significantly higher than that
of the basic group.
The occupational interests and aspirations of the members of Subgroup 2
do not differ significantly from those of the basic pattern patrolmen.
Intellectual Measures
This subgroup did not differ significantly from the basic group on reason-
ing ability, language facility, or visual perception. Their creative pr(blem-
solving ability is close to the average.
Special Aptitudes
The results of the Test of Social Insight suggest that this subgroup conforms
to the average patrolman group in social orientation.
Behavioral Measures
In reviewing the results of the eight psychological tests which assessed the
patrolmen's behavioral status, a suprising similarity was found between
the members of this subgroup and the basic pattern patrolman group. Re-
latively few significant differences were identified. The reaction time of
Subgroup 2 members was slightly higher but not significantly so. There
197

were no differences between the two groups on the Arrow-Dot Test, the
Maudsley Personality Inventory, or the Behavior Inventory. Three signi-
ficant differences were found, however, on the Hand Test. Subgroup 2
patrolmen were less withdrawn (and hence in better contact with reality)
and showed a significantly lower level of possible emotional pathology but
a higher score on the Acting-Out ratio.
There were no significant differences on the Temperament Comparator,
and the only difference. on the Cree was a significant disinclination toward
scientific and theoretical work situations on the part of the Subgroup 2 pa-
trolmen. These patrolmen were also significantly lower on need Autonomy
on the Edwards Personal Preference Schedule.
Summary
Although they are not outstanding on awards or number of arrests, the
men included in Subgroup 2 are rendering good performance on the job.
They are very similar to the basic pattern patrolman group in psychological
make-up. Their childhood experiences have apparently laid the foundation
for quite good adult emotional adjustment, as shown by the significantly
lower pathology scores on the Hand Test. Their low level if financial ex-
perience might be considered a sign of personal irresponsibility and thus
an area of concern, but since the group is characterized by significantly
fewer complaints and disciplinary actions, their financial state apparently
has not led to unethical or illegal behavior on their part. These men do
not withdraw from reality, yet do not have any strong need for independence
or autonomy. In all likelihood, they are able patrolmen who can function
as part of a team, which may explain why their supervisory rating exceeds
the objective performance measures of arrests and awards.
198

f-t
Criteria
SUBGROUP 3
Newcomers with Poor Performance
The third subgroup has, like the first, and second, a low level of tenure, butthey do not appear to be enjoying the success of the groups already discussed.It is true that they have significantly fewer complaints and disciplinary actions
against them, but inactivity rather than good performance appears to be thecause. The two supervisory rating categories place them significantly below
average in performance. They made significantly fewer arrests than the
basic pattern patrolman group, and received significantly fewer departmental
awards. Their attendance is somewhat better than average, but they do not
differ significantly from the basic pattern group in this respect. These patrol-
men have the lowest average age of any of the subgroups (as suggested by their
low tenure), and a majority of these officers are assigned to districts with
higher-than-average crime rates.
Motivational Measures
Patrolmen in Subgroup 3 reveal a significantly lower level of family involve-
ment and responsibility. They also show a significantly lower level of occu-
pational or job stability. Low scores in these areas are partially a functionof their relative youth; nevertheless, these scores suggest a disclination toundertake responsibilities, either of a family or job. These patrolmen aresignificantly higher than the basic pattern group on satisfaction with their
vocational choice. However, such satisfaction is sometimes indicative oflow aspiration and acceptance, rather than of a drive for achievement. The
work interests of Subgroup 3 do not differ significantly from those of thebasic pattern group.
19 9

Intellectual Measures
Subgroup 3 patrolmen are higher than the basic group in reasoning ability,
and at the same level in the area of verbal comprehension. Their percep-
tual ability differs significantly from that of the basic group only in their
Closure Speed performance. They show a higher level of ability in organ-
izing a perceptual field. Their creative problem-solving ability does not
differ from that of the basic group.
Special Aptitudes
Patrolmen in Subgroup 3 respond to problematical social situations in the
same style as the basic patrolman group.
Behavioral Measures
Officers in Subgroup 3 exhibited a faster reaction speed and were signi-
ficantly higher than the basic group in their reaction to color stimuli and
in their reaction under the stress conditions produced in Part III of the
Press Test.
These men score significantly higher than the average on Ego in the Arrow-
Dot test, thought to be a measure of realistic control over impulsivity.
They do not differ from the basic pattern patrolman group in the other areas
of this test or in their responses to the Hand Test, Maudsley, and Behavior
Inventories.
Their responses to the Cree Questionnaire suggest that they have a signi-
ficantly lower level of creative potential and are inclined to a submissive
social orientation. As to work orientation, they show a significant prefer-
ence for unstructured work situations.
Although these men tend to be more outgoing and expressive in their be-
havior (Temperament Comparator, Factor I), they do not show any signi-
ficant differences from the basic pattern group on this particular test.
200

(
Their results on the Edwards Personal Preference Schedule reveal no signifi-
cant deviations from those of the basic patrolman group, except (perhaps) theirsignificantly lower level of consistency. However, their responses are not soinconsistent as to be of questionable validity.
r
The patrolmen included in Subgroup 3 are relatively new to the job, but
are already not well esteemed by their supervisors. They are close tothe average patrolman in many respects, but their departures from this
average provide insights into their psychological functioning and job per-
formance. They are more satisfied than most patrolmen with their vo-cational choice, but it is apparent that good performance does .not, in
this instance, spring from such satisfaction. They show a lack of respon-
sibility in the family situation and in occupational outlook. Their perfor-mance data suggest that they do not get into much trouble, and show good
attendance, but do not do much on the street. Their mental endowment
and aptitudes are average to above average. They have the ability to reason
and to react quickly to situations, but apparently are not motivated to do so.
They might be characerized as putting in what they' consider the bare mini-
mum of performance, a result perhaps of their lack of responsibility, In
short, they have not been reached by their supervisors or by the intrinsic
responsibilities of the job of police officer. These men have many accept-
able qualities, and are well satisfied with their jobs, but this satisfactionis by no means shared by their supervisors. Many of these men are assign-ed to higher crime-rate districts, and, without speculating on whether or not
their specific assignment may be one of the causes of their poor performance,
it should be noted that these difficult districts are probably the last places
they should be assigned.

,==
SUBGROUP 4
Established Patrolmenwith Excellent Performance
Criteria
The patrolmen included in Subgroup 4 have significantly higher than aver-age service tenure, Their performance is rated quite significantly above
average by their district supervisors, and they have received an appreci-able number of departmental awards. Their attendance is good, and they
have received a significantly lower than average number of complaints anddisciplinary actions. The number of arrests they made is also significant-ly higher than average. In general, this subgroup seems to represent avery desirable pattern of field performance. Officers in this subgroup areassigned to districts which represent the spectrum of law enforcement,
e. , high crime rate as well as lower-than-average crime rate areas.
Motivational Measures
On background and experience, Subgroup 4 differs on several points fromthe basic pattern patrolman group. They scored significantly lower on
achievement in, and adjustment to, the school situation and also on spe-cial or technical accomplishment. Their scores in these two areas sug-gest that members of this group did not care very much for school,
entered into marriage early, and did not pursue additional technical pre-paration or education. This is in part verified by a significantly higherscore in the area of Early Family Responsibility, which reflects early
assumption of family responsibilities and involvement in familY activities.
Subgroup 4 patrolmen also score higher than average in the area of occu-pational stability. This finding suggests that they are more concerned
than the average patrolman with maintaining security and stability in their
employment. They also had a significantly higher score on the General
202

CHAPTER VIII Figure 2
Established. Patrolmen
Subgroup 5-Poor Performance with Disciplinary Actions(N=24)
60111/111 Subgroup 6"Conflicting Ratings and General Disciplinary
Normalized Standard Scores
Very T Low 40---Averagee. High VeryLow
Lov.w I HighHigh
20 30 40 A 50 A;;.60
.PC RATING
CPD 'RATING .
TENURE
AWARDS
COMPLAINTS1,,,
DISC. ACTIONS'
ARRESTS
ABSENCES.
* Subgroup is unique to Wave I.** Subgroup is .Unique to Wave II.

Health factor, which points to a better than average freedom from physi-
cal ailments and from lost work time resulting from illness.
Although the occupational interests of this subgroup in some cases differ
slightly from those of the basic pattern group, none of these differences
was found to be statistically significant.
Intellectual Measures
In general, members of Subgroup 4 did not differ from the basic pattern
patrolman group on reasoning ability, language facility, or visual per-
ception. The only exception was their signficantly lower ability to keep a
configuration in mind despite distraction (measured by Closure Flexibility).
Their creative problem-solving ability was slightly below the average lev-el but not markedly so.
Special Aptitudes
On the Test of Social Insight, Subgroup 4 did not differ significantly from
the basic pattern patrolmen.
Behavioral Measures
There were relatively few differences in the behavioral area between Sub-
group 4 and the basic pattern group. No significant differences were found
on the Hand Test, Maudsley Personality Inventory, Behavior Inventory, or
Press Test. However, Subgroup 4 patrolmen were significantly higher on
ego functioning, thought to reflect realistic impulse control, and lower on
impulsivity. In their response to the Cree Questionnaire, they showed a
considerably stronger preference for involvement in social activities.
Their Temperament Comparator results suggested that they are signifi-
cantly less demonstrative and somewhat more talkative.than the basic
pattern groups They also showed a significantly lower level need Autonomy,
as measured by the Edwards Personal Preference Schedule, and a higher
level of need Aggression.
204

The patrolmen who consitute Subgroup 4 exhibit a good to excellent
performance pattern, as indicated by both the objective and the subjective
performance criteria. These men had a low level of academic accomplish-
ment and an early assumption of family responsibilities with close involve-
ment in family activities. They enjoy good health, and have a realistic
control of their impulses and little inclination to demonstrate their feelings.
They are socially involved and talkative, and are probably quite conventional
and concerned with meeting the expectations of others. Their aggressive
needs are significantly higher than those of the basic pattern patrolmen,
but these needs appear to be constructively channeled. Their low scores
on complaints and disciplinary actions support the validity of this interpre-
tation. This group seems to represent middle-aged patrolmen, interestedin the security of their job, who more than meet the expectations of their
supervisors. Because of their poor academic preparation, they may havedifficulty rising in the organization beyond their current status. However,
they are not likely to leave the department for another position, and there-
fore in many ways represent a quite desirable component in the manpower
of the organization.
SUBGROUP 5
Established Patrolmen with Poor Performanceand Disciplinary Actions
Criteria
The performance record of this subgroup is clearly marginal comparedwith that of the basic pattern group. Members of Subgroup 5 were rated
significantly lower in performance by their district supervisors in both
the paired-comparison and the departmental ratings. They show an ex-
ceptionally high number of disciplinary actions. At the same time, their
productivity, as expressed in number of arrests, falls significantly below
205

that of the basic group. They show slightly more complaints and slightlyfewer awards, Their tenure and attendance record fall within the average
range, Obviously, this group's members are held in low esteem by their
supervisors, and represent an undesirable pattern of field performance.Patrolmen in Subgroup 5 are assigned to high crime rate as well as lower-
than-average crime rate districts.
Motivational Measures
On background and experience, there is only one area, vocational stability,
in which this subgroup differs significantly From the basic pattern group.
They are concerned with establishing security and stability in the work
situation and with maintaining what has been achieved. Members of this
group scored slightly lower in their drive to achieve success and advance-
ment and slightly higher on parental family adjustment. Since this sub-
group was specific to Wave I, no data on occupational interests were
available.
Intellectual Measures
The patrolmen in Subgroup 5 did not differ from the average on reasoning
ability, but were significantly lower on verbal comprehension (i. e. , the
ability to read and comprehend written material). Their scores in the
perceptual area were generally slightly below average, and they were
significantly below average in their ability to rapidly organize a set of
apparently unrelated 'elements into a meaningful whole. However, these
patrolmen were not significantly different in creative problem-solving
ability.
Special Aptitudes
On the Test of Social Insight, this group showed a slightly less coopera-
tive and slightly more passive orientation, but none of the differences
was significant.
206

Behavioral Measures
The Press Test responses of this subgroup tended toward a slower reaction
time than the average, but this tendency was not significant. Their scores
on the Arrow-Dot test were close to the average. However, it is interest-
ing to note that the group exhibits a profile pattern of impulsivity identified
by the Employee Appraisal Section of the Personnel Division and thought to be
associated with poor performance.
The group's scores on the Hand Test were not significantly different from
those of the basic pattern group, but there was a tendency to score above the
average in the area of withdrawal and pathological responses. The same
situation obtains in the responses to the MaucIsley Personality Inventory.
There were no significant differences but a tendency to score higher in
neuroticism.
The patrolmen in this subgroup scored significantly higher than average
on the Behavior Inventory, an instrument specifically validated against a
criterion of pass /fail on the personal background investigation conducted
by the department.
The Temperament Comparator scores of Subgroup 5 did not differ markedly
from those of the basic pattern patrolman group, although this subgroup
tended to be somewhat more outgoing and sociable but somewhat less
self - confident.
Summary,
The patrolmen in Subgroup 5 exhibit a pattern of performance which is
decidedly marginal. Their background scores indicate a concern for
maintaining the status quo, and a corresponding lack of interest in self-
development. Their tendency to score lower on achievement drive may
be related to this. They are weak in one area essential to patrolman perfor-
mancethe ability to understand written material. They also demonstrate
207

a significantly lower level of ability to rapidly and correctly organize theirperceptual field. The trends of the behavioral tests suggest, adjustmentproblems, but the only clear-cut problem indicator was found in the resultsfrom the Behavior Inventory. These patrolmen report positive attitudesconcerning their early developmental experiences, which should provide agood basis for emotional adjustment. Their tendency toward maladjustmentpresents an interesting contradiction to this premise. Apparently thesepatrolmen are marginal in both the language and the behavioral areas.They may in fact be "false positives, " i, e. , individuals who erroneously
passed the screening of the Civil Service Commission and the department.
SUBGROUP 6
Established Patrolmen with Conflicting Performance Ratingsand General Disciplinary Problems
Criteria
Patrolmen in Subgroup 6 have average tenure and receive average perfor-mance ratings from their supervisors. However, on the remaining per-formance criteria they present an interesting contrast. They are signifi-cantly above the basic pattern patrolman group in numbers of arrests madeand departmental awards, but are even more significantly above the aver-age on absenteeism, disciplinary actions, and complaints. Apparentlythe good work done by these men is overshadowed by the problems they
cause the public and the department. They seem to attempt to do what isexpected of them, as indicated by the arrests and awards criteria, but arein some way inept in their performance, in that complaints and dit. ciplinaryactions follow. Their attendance record suggests that they are less thanresponsible about reporting for duty. This subgroup is the only one which
differs significantly from the basic patrolman performance group in thearea of rater agreement. The supervisors who provided the paired-com-parison performance ratings on these patrolmen were found to show lower
'208

overall agreement on the performance of these men. In general, this pat-tern of performance seems undesirable, since the field supervisor, do
not recognize or else disagree on the true caliber of these officers, and maygive them assignments beyond their competence, which they are therefore
unable to handle. Officers in this subgroup are not found in any one type
of district, but rather are assigned to high crime rate, average, and low
crime rate districts,
Motivational Measures
The background and experience scores of Subgroup 6 patrolmen are quite
similar to those of the basic pattern patrolman group. The only exception
is on Early Family Responsibility, where Subgroup 6 scores lower. This
suggests that many of these men have not yet assumed family responsibil-
ities (even though their average age is 35) and are not involved in the
activities of their own immediate families.
In the main the work interests of this group closely parallel those of the
basic pattern patrolman group. The only exception is their significantly
greater preference for work situations involving authority over others
and prestige.
Intellectual Measures
The patrolmen in Subgroup 6 tend to score below the basic pattern group
in the\perceptual area, and were significantly lower on Closure Speed.
This suggests an inferior ability in rapidly organizing an apparently un-
related set of elements into a meaningful whole.
Special Aptitudes
Although no statistically significant differences exist between this group
and the basic pattern, members of Subgroup 6 exhibit an interesting ten-
dency to.utilize withdrawal as a means of coping with problematical
social situations,
209

Behavioral Measures*
The Subgroup 6 patrolmen tend to react slightly faster than members of
the basic pattern group. Furthermore, as measured by the Arrow-Dot
Test, they exhibit contrasting, equally strong levels of impulsivity and of
moralistic control of impulse. This mode of adjustment suggests that a
strong conflict exists between what these men may want to do'and what they
know is the ideal thing to do. They do not achieve a realistic resolution to
this conflict, but rather alternate between the two extremes.
Their responses to the Cree Questionnaire show a significantly stronger
orientation toward systematic and prescribed activity on the job. They
also describe themselves as having a significantly faster level of react4on
speed.
In the temperament area, the most noteworthy finding is the significantly
lower score shown by these men on self-reliance. This suggests that they
find it difficult to initiate and enforce decisions, are influenced by the
wishes and desires of others, and are in need of social support. They are
significantly less even-tempered than the basic pattern patrolmen and
significantly more talkative. However, on the Edwards Personal Prefer-
ence Schedule their scores conform to the average.
Summary
This subgroup's results on the performance, criteria present an interesting
contradiction. Subgroup 6 patrolmen show quite good performance, in the
areas of number of arrests and awards, and exceptionally poor performance
in the areas of departmental disciplinary actions, IID complaints, and at-
tendance. Essentially they are undependable and unpredictable, sometimes
*This subgroup was specific to Wave IL Hence, only Wave II test battery
results are available for discussion.
210

quite good, sometimes quite bad. This erratic performance is the probable
cause of the relatively lower agreement shown by field supervisors in rating
these patrolmen. Some supervisors may have been exposed to inadequate
performance while others may not. Several points in the test data may
account for this erratic performance. These men have not yet assumed
family responsibilities, and may have entered police work for the authority
and prestige it could bring them. Their low level of self-reliance suggests
a need for some sort of ego support, and the badge and revolver may fillthis need. They were below average in their ability to cope effectively
with the ambiguity in the Closure Speed Test, and they were prone to use
withdrawal in the Social Insight Test. These results suggest an inabilityto deal effectively and realistically with concrete problem situations.
This inability is also reflected in the results on the Arrow-Dot Test, wherethere is a conflict between impulsivity and moral control. These patrolmen
do not seem to possess the "street sense" of a good police officer in dealing
with job problems. They may at times enter a situation impulsively, andat other times needlessly withdraw when they are needed. This behavior
is probably rooted in their lack of self-confidence and responsibility, in
their inability to realistically handle the problems which constantly con-
front a police officer, and in their own lack of impulse control. Because
they are able to function acceptably for a certain percentage of the time,
their performance ratings emerge as "average. " From a broader perspec-tive, they are by no ,means average and should be recognized as the marginalpatrolmen they actually are.
211

SUBGROUP 7
Old-Timerswith Excellent Performance
Criteria
Patrolmen assigned to Subgroup 7 have quite significantly higher tenure
than the basic group patrolmen, the highest tenure of any of the nodal
subgroups. Their paired-comparison and departmental supervisoryratings are also considerably above average. Although these men are
significantly lower in disciplinary actions and complaints, they are also
significantly lower in number of arrests and in departmental awards.
Their attendance record is average. This subgroup is composed of older
patrolmen who may not be as active in the field as they once were (their
paired-comparison or field rating is lower than their departmental or
total one), but who are nonetheless considered to be excellent patrolmen
by their supervisors. They are not highly productive in the sense of making
many arrests or earning many awards, but are thought to provide good per-
formance on the job. They are assigned to districts representing the entire
range of ind97.: crime rate.
Motivational Measures
Officers in Subgroup 7 score significantly higher than the basic pattern pa-
trolman in the area of Higher Educational Achievement. This suggests
more education than the basic group and a later vocational start, combined
with an interest in professional development. These men also exhibit a
significantly high level of Financial Responsibility, reflecting mature man-
agement of their own personal resources. Furthermore, they score sig-nificantly higher on early assumption of family responsibilities and involve-
ment in family acitivities. They have now established occupational stability,
and are more concerned with the maintenance of what they have already at-
tained than with plans for further development. Their level of Vocational
212

Subgroup 7'2-Excellent Performance (N=11)
Subgroup 8"Good Performance (N=13)
PC RATING
CPD RATING
TENURE
AWARDS
COMPLAINTS
DISC. ACTIONS
ARRESTS
ABSENCES
Normalized Standard Scores
20
VeryLow
30
Low
40
.-- Average''"Average
Low I HighAv. 50 Av.60
High
70
VeryHigh
80
i--
II
i
II
* Subgroup is unique to Wave I.** Subgroup is unique to Wave II.
0111113Keital.

Decisiveness is significantly below that of the basic pattern patrolmen,
indicating that they did not make a decisive occupational choice early in life
but rather had a late start in their police careers.
Intellectual Measures
These officers did not differ significantly from the basic pattern group in
the areas of reasoning ability, language facility, visual perception, and
creative problem-solving. This is somewhat, striking, since advancing
age usually has a tendency to inhibit performance on several of these tests.
However, the obviously older men in this subgroup readily, match the
younger basic patrolman group in all the mental ability areas.
Special Aptitudes
No significant differences in social orientation were found between Sub-
group 7 and average officers.
Behavioral Measures
Relatively few differences appeared on the behavioral measures. Subgroup
7 officers scored significantly lower on the Behavior Inventory, suggesting
that their resr.onses on this test closelY follow the pattern associated with
passing the Department's personal background investigation. The remain-
ing differences were in the area of temperament, where the Subgroup 7
officers were significantly higher on the trait Prompt Starter and lower on
the trait Socially at. Ease and on Sociable (Temperament Comparator-Fac-
tor V). These findings suggest a "work" rather than a "person" orientation
in their day-to-day activities.
n if
214
Cart.,

Summary
The performance criteria suggest that patrolmen in this subgroup are lessactive in the field than basic pattern patrolmen (a result, perhaps, of theirage) yet maintain the high esteem of their supervisors, probably a conse-quence of many years of good service. These men assumed family respon-
sibilities early and established good financial management of their affairs.
This mature behavior was also demonstrated in their continuation of tech-
nical or professionaltraining after completing academic studies. Although
Subgroup 7 patrolmen did not show a strong early commitment to a law en-
forcement career, they have nevertheless established themselves securely,
with a record of good performance over the years. These officers show a
good level of mental endowment, especially when one remembers that they
are much older than the basic pattern patrolman group. They do not appear
to differ very much from this latter group in their aptitude or behavioral
characteristics, but are clearly differentiated by the Behavioral InveiAory
screening procedure, and sholk a "work" orientation in their temperament.
Despite their long tenure, these patrolmen have remained at a high level
of effectiveness, and are thoiight to represent a successful pattern ofpatrolman performance.
SUBGROUP 8
Old-Timerswith Good Performance
Criteria
The patrolmen in this subgroup have a quite high level of tenure. Both of
their supervisory ratings are significantly higher than average. They aresignificantly higher than the basic pattern men on awFrds but also on dis-ciplinary actions. Their attendance, arrest, and complaint records werewithin the average range. Except for the disciplinary actions, they appear
215
.,.,;.:

to be a quite successful patrolman group. Although it might be expected
that older patrolmen would tend to be found working in slow crime rate
areas, these men are assigned to both high and low crime rate districts.
Motivational Measures
On motivation, Subgroup 8 patrolmen exhibited a number of significant de-
partures from the average of the basic pattern group. They showed a
marked disinclination to parti?Apate in group activities, as evidenced by
a significantly lower score in the area of School Activities (reflecting
group participation in school) and in Leadership & Group Participa-
tion (reflecting group participation in adulthood). As a group, they
show a significantly lower level of selling experience in their past
employment. However, they showed a signficantly higher level of
vocational stability, suggesting more concern with establishing security
in the work situation than with improvement or development. Yet the
patrolmen in this group indicate a signficantly lower level of satisfaction
with their vocational choice.
The: work interest profile of Subgroup 8 does not differ from that of the
basic pattern group, except that their level of socio-economic aspira-
tion is significantly lower.
Intellectual Measures
These men had lower scores in the perceptual area and significantly lower
ones on the tests of Closure Speed and Closure Flexibility included in this
area Since these patrolmen are a good deal older than the average, their
intellectual functioning may be somewhat hampered by deterioration result-
ing from

Special Aptitudes
The results of the Test of Social Insight suggest one important differencein social orientation from the basic patrolman group. Subgroup 8 patrol-men were significantly less apt to utilize an aggressive approach to resolve
the problematical social situations described in the test.
Behavioral Measures
There were no significant differences on either the Press Test or the
Arrow-Dot Test. However, Subgroup 8 patrolmen scored significantlylower on the total score for the Cree Questionnaire, indicating a lower
potential for creative work and a greater degree of conformity than shown
by the basic pattern patrolmen. In the area of temperament, these men
were significantly less sociable than the basic group, that is, they are
probably less concerned with seeking out and enjoying the company of
others. A number of significant differences were identified on the Edwards
Personal Preference Schedule. Subgroup 8 patrolmen were significantly
higher on need Order, need. Affiliation, and need Nurtuvance, and signifi-
cantly lower on need Autonomy. This suggests that they have to be told
what to do by others, must perform in a precise and organized way, and
are cooperative and loyal and enjoy assisting the unexperienced or troubled.
Summary
The patrolmen in Subgroup 8 present a pattern of good performance, with
the exception of a higher-than-expected level of disciplinary actions.
Three areas in tne Personal History Index support a finding in the tempera-
ment area which suggests that these officers are socially aloof and not in-
clined to seek out and enjoy the company of other persons. While they are
quite concerned with maintaining job stability and security, they are dis-
satisfied with their occupational choice and pessimistic about improving
their socio-economic level. This pessimism may account for the need
for disciplinary actions in a group that is providing an otherwise acceptable
217

level of performance, Age may play an underlying role in the above find-
ings, as well as in the relatively lower level of mental prowess ethibited
by the subgroup and in a disinclintion to use aggression in solving diffi-
cult social situations. The members of the group may in part reflect the
stereotype of the old-time beat patrolman, who was told specifically what
to do and expected to carry out orders to the letter, who was loyal to the
organization while at the same time giving aid to the underdog, The cur-
ious twist is the social disinvolvement of these patrolmen, which may be
a result of constant exposure to the worst side of human nature,
CONCLUSION
The aim of this chapter was to identify and provide a description of mean-
ingful performance subgroups contained within the patrolman population
assessed and tested. The performance criteria scores had been subjected
to a form of multivariate analysis which in essence measured the differences
in the scores of each pair of individuals in the sample, and then assigned
these individuals to subgroups on the basis of similarity of performance
pattern. An extensive discussion of the differences in job performance and
test results contrasted the basic performance pattern patrolman subgroup
(the "average" patrolman, whose performance on the eight criteria was
within average limits) with the eight emergent subgroups (whose perfor-
mance pattern was distinctively different from the average).
The aim of this phase of the study is felt to have been accomplished, since
subgroups were identified and since the psychological tests did provide ade-
quate description and at least minimal differentiation from the average.
This is not to say that we believe we have identified all possible perfor-
mance subgroups. All of the subgroups discussed in this chapter were
thought to be significant, but the utilization of additional performance cri-
teria might very well result in the identification of additional meaningful
218

subgroups. It is hoped that the subgroups discussed in this chapter will
provide insight into the psychological make-up of the patrolman, and serveas strong evidence to support the hypothesis that over and above general
requirements for suitability, there will be identifiable areas of 'individual
difference between patrolmen which determine their success or failure onthe various measures of performance in the field.
The bulk of our discussion has been concerned with contrasting the sub-
groups with the basic patrolman group. It was thought that this contrast
would provide maximum definition of the psychological functioning of each
type, and facilitate understanding and maximum utilization of the results?
The value of this work is to be realized in the early identification of patrol-
men who resemble members of a given subgroup, and in the proper place-
ment (or rejection) of these individuals. Early identification may be im-
portant, since proper training and development of Subgroup 1 patrolmen,
for example, would qualify these men for the advancement they obviously
have merited by their performance. Proper placement is another question,and the presence of Subgroup 3 patrolmen in high crime rate areas is givenas an example of apparent misplacement.
The specific manner in which these results may aid a particular departmentis an open question. A number of techniques are available, but immediate
generalization of the results obtained in Chicago to other departments wouldseem to be premature. Continuing study of the significance of these groups
and of the effects of factors not discussed in this chapter (e. g. , effect of
training, specific assignment, race, etc. ) is indicated. The areas ofpsychological functioning in which the subgroup differs from the basic pa-
trolman group would seem to provide a first step in identification for pur-poses of decision-making. The next stage of analysis would be to contrast the
score of each subgroup with those of every other subgroup, in order to
determine the specific differences between each pair of groups with re-spect to all test variables. This procedure would provide a direct answer
219
1

to the question of how to differentiate among subgroups, for example, Subgroups1, 2, and 3. The results of such an analysis could be used to determine thepsychological test variables to be used in a conventional multiple discriminantanalysis for assigning patrolmen to the eight emergent subgroups.
We feel it desirable to conclude this chapter with some summary statementon the tests which seem most adequate in differentiating between performance
subgroups. The specific differences discussed throughout the chapter pro-vide the best answer to this q,uestion, but a listing of the tests thought to have
the greatest likelihood of differentiating between the subgroups is presentedin Table 3. These tests were identified through the use of an analysis of
variance design, and, on the basis of present information, recommended
for inclusion in further research on the performance subgroups aimed atthe question of job placement and assignment.
REFERENCES
Saunders, D. R. and Schucman, H. Syndrome analysis: An efficient pro-cedure for isolating meaningful sampleof a population. A paper read at the third annual meeting of thePsychonomic Society in St. Louis, September 1, 1962.
220

CHAPTER VIII - Table 3Tests Identified by Analysis of Variance as Discriminatory
Among Performance Subgroups
AREA OF MEASUREMENT TEST
Motivation
Intellectual Ability
Behavior
221
Personal History Index(especially factors 2, 5, 6,8, and 13)
Closure Speed
Closure Flexibility
Perceptual Speed
Press TestTemperament Comparator
Arrow-Dot Test
Behavior Inventory
Edwards Personal PreferenceSchedule

CHAPTER (X
Ste_pmm of Resultsfor
Psychological sments:111)alulman Qualificationsin Relation to Field Performance
GOALS OF THE STUDY
The issue of law and order vs. crime in the streets is likely to become one of
the hallmarks of the late 19601s. Given the importance of the law-enforcement
function, the importance of the individual police officer performing that function
is patently obvious. Few occupations in recent years have been the object of somuch public attention, debate, and controversy as that of the police officer.
Police organizations have made impressive technical advances in such areasas communications systems and non-lethal weaponry but surprisingly few ad-vances in the area of personnel selection. Since the individual police officer
remains the single most important law-enforcement representative in society,
it is unfortunate that contributions to his function made by the physical sciences
have not been mat.,,hed by the behavioral sciences. In the long run, we feel that
better police officers are of greater importance than police tools for improvedlaw enforcement.
The value of psychological testing in selecting police officers has long been recog-nized. However, the necessity for empirical validation of the tests has by no
means met with the same recognition. We therefore thought that there was an
essential need for a comprehensive research study in the police selection area.Three basic requirements had to exist before such a study could be initiated:
A.A.,/223

1 A group of behavioral scientists interested in addressing the problem,
2, The availability of financial support, and, perhaps most important,
3, A law-enforcement organization at a stage of development which would
permit scientific access and freedom of inquiry while at the same time
providing complete support and commitment to the project.
These requirements were met by the interests of the Industrial Relations Center
staff, the support available through the Office of Law Enforcement Assistance,
United States Department of Justice, and the interest and commitment of the
Chicago Police Department.
The resultink research study had two primary goals:
1. The development of effective procedures and the establishment of
general standards for patrolman selection.
2. The identification of distinctive "patrolman types," defined on the basis
of field performance, which would not be adequately described by the
concept of the "average" patrolman.
The first goal of the study called for a comprehensive validation process to
insure the appropriateness and empirical acceptability of the tests as tools in
a systematic procedure for selecting patrolmen. The second goal was more
challenging as well as more exploratory, since we attempted to go beyond the
oversimplified concept of a single common performance criterion and show
that there are a variety of successful and unsuccessful patterns of field per
:ormance. The second goal has implications for the area of placement as well
as for the achievement of a more accurate appraisal of the complexities in the
psychological make-up of police officers. A third goal, unstated until now,
was the hope that our work would stimulate further research and refinement of
procedures in the area of police-officer selection, and would create an aware-
ness of the need for this research in the police community as well as in our
own academic one,
224
vsv-WIVVFt-.",41YvVit
etl

IMPLEMENTATION
In order to implement the first goal of the research project, it was necessary toshow a significant relationship between the scores of patrolmen on selectedpsychological tests (predictor variables) and measures of their actual perfor-mance on the job (criterionvariables). For such a relationship to be established,the tests should yield reliable measures of some of the personal attributes whichare essential for successful performance and the criterion measures in turnshould provide reliable assessments of such performance.
Our first task, therefore, was to analyze the patrolman's working environment inorder to identify some of the essential skills required for the job. This wasdone with the assistance and cooperation of members of the Chicago PoliceDepartment. Our attention focused on the work of police officers assigned tobeat patrol rather than on the host of technical, administrative, and specializedfunctions performed by other uniformed officers in the department. Thisfocus provided us with a police function exhibiting the necessary levels of abilityand homogeneity, and, more important, one which all police organizations havein common. In analyzing the beat patrolman's job, our emphasis was on the"behavioral' rather than the "formal" or officially stated requirements of thejob. A list of what were considered to be some of the essential behavioral
requirements for patrolman performance was developed and is given in ChapterII. These requirements served as the basis for selecting the tests.
In addition to the essential requirement of relevance, a number of other tech-nical and practical considerations were taken into account in compiling the testbattery:
1. Group vs. Individual Administration. All tests included in the batterycould be administered to groups of subjects.
Paper -and- Pencil vs. Apparatus Tests. Tests requiring special ap-paratus for their administration were excluded from the battery.Objective vs. Subjective Scoring. All selected tests could be directlyscored with a prepared key.
225
sl

In general, the tests are practical and economical. The administration time for
the initial battery was between three and a half and four hours. Administration
and scoring can be done by clerical personnel specially trained for the purpose,
but the interpretation of test results must, of course, always be made by
professional psychologists.
In view of the exploratory nature of this study, and keeping in mind the require-
ments of relevance and practicality, we decided to cover as wide a span of
human behavior as possible. The tests chosen are described in detail in Chapter
IV. They can be classified into the following behavioral areas:
1. Motivational Measures
--Dimensions of objective background data.
--Dimensions of work interests indicating strength, flexibility, andvocational aspiration level of occupational interests.
2. Intellectual Measures--Primary mental abilities in the areas of reasoning, language facility,
and visual perception.--Special aptitudes, such as creative potential and insight in social
situations.
Behavioral Measures
- -Dimensions of the relatively permanent temperament traits or char-acteristic modes of response of individuals in both normal and pres-sure situations.
- -Dimensions of personality functioning as measured in tests purportingto represent various personality systems.
SELECTION OF PERFORMANCE MEASURES
Obtaining an accurate index of employee performance is one of the more dif-
ficult tasks facing organizations. As the requirements of any job become more
complex, it becomes increasingly difficult to quantify on-the-job performance,
and certainly the police officer's job qualifies as one of the more complex in
our society. The Chicago Police Department compiles information in a number
of significant areas of patrolman performance. However, we decided to utilize
226

not only the information already on file but also the paired-comparison appraisaltechnique developed by the IRC. This method yields a composite performanceindex based upon the pooled ratings of supervisors who are familiar with anindividual's performance. Furthermore, it provides several checks on themeaningfulness and accuracy of the ratings, including measures of the internalconsistency of each rater and his agreement with others rating the same men.
The principal Chicago Police-Department performance measure utilized wasthe semi-annual performance rating, prepared by district supervisors for theadministrative purposes of the department. Although both the paired-comparisonand CPD ratings were aimed at a global measure of patrolman performance, theyprovided somewhat different types of information, since instructions for thepaired-comparison rating stressed field performance and instructions for theCPD rating stress administrative as well as field performance.
In addition to these two "subjective" measures, a number of more "objective"measures were included. Information on tenure, departmental awards, com-plaints registered in the Internal Investigation Division, departmental discipli-nary actions, attendance, and number of arrests made was obtained for eachpatrolman tested. These objective indices provided a more comprehensivepicture of the many facets of patrolman performance, but the two subjective
ratings were given greatest credence in the study. We felt that in making their
performance ratings, experienced police supervisors would be in the bestposition to take account of the complexities of patrolman performance. Thus,the eight performance measures chosen were judged to provide a wide range
of information. They are described in detail in Chapter III. These measuresserved as criterion standards in the test-validation phase of the study, and alsoas defining variables in the identification of meaningful performance subgroupswithin the patrolman population.
SELECTION OF PATROLMEN SAMPLES
The paired-comparison performance appraisal of patrolmen was conducted byIRC staff in 12 Chicago Police districts: A total of 253 Supervisory Sergeants
227

and Field Lieutenants rated the performance of 2327 menabout 85 per cent
of the uniformed patrol officers in these districts. On the average, each man
was rated by three supervisors, and each supervisor rated the, performance of
30 men. The results of the rating were used to select officers for the testing
phase of the study.
District Commanders issued a call for volunteers, and approximately 60 per
cent of the men in the 12 districts indicated a willingness to participate. Vol-
unteers who had been rated in the top or bottom third of performance in the
watch by two or more supervisors exhibiting acceptable consistency and agree-
ment were selected for participation. In. all, 490 district officers were tested,
242 during Wave I (February, 1967) and 248 during Wave II (July, 1967). (Sixty
Task Force Tactical Unit patrolmen were also tested during Wave II, and their
results will be given in a subsequent report.) These men completed a four-
hour battery of tests (14 tests in Wave I and 11 tests in Wave II) during off-duty
hours, and received a $15 volunteer's stipend for their assistance.
VALIDATION RESULTS
Since there was an interval of about five months between the administration of
the test batteries to the two selected samples of patrolmen, we were able to
approach the problem of validating the occupational test battery by first com-
pleting an analysis for the Wave I sample. As a result of this analysis, we
dropped tests from the battery which appeared to be least predictive and sub-
stitutd others in those areas which promised to be most predictive of perfor-
mance. The findings for the Wave II sample justified these substitutions, in
that they resulted generally in increases in the predictive efficiency of the bat-
tery. However, except for these small differences in the level of efficiency,
the results for the Wave II sample essentially replicated those for Wave I, and
no distinctions between the samples will be made in the following discussion.
The first conclusion which could be drawn from the primary analysis was that,
for the total group of patrolmen, there was an acceptably high and statistically

significant relationship between the test battery scores and independent mea-sures of performance. This was especially true of the three major performancecriteria--the paired-comparison performance rating, the Chicago-Police-
Department performance rating, and tenure--but also held for all other per-formance measures used in the study. This indicates that the tests selectedwere relevant and that the measures of present performance were appropriate.
The second result was less expected. While significant relationships between
test scores and performance could he demonstrated for the total group of patrol-men, the degree of this relationship increased when the subgroup of white
patrolmen was treated separately and increased even more spectacularly and
significantly when the Negro subgroup was treated separately. These resultsare given in Table, 1 of Chapter VI. These findings caused a revision in the
original experimental design for the cross-validation, in which weights estab-lished on one sample of employees are applied to a different sample in an attemptto predict their performance.
In the cross-validation analysis, sets of weights were established on randomly
selected parts of the total racially-mixed group and on the white and Negro sub-
groups separately. The results of this analysis indicated that the best predic-tion of performance was obtained when weights based on a specific racial groupwere applied to members of the same group, and that this was particularly true
of the Negro group. By contrast, the poorest predictions (sometimes at the
pure chance level or even negatives) were obtained when weights based on one
racial group were applied to another. Applying weights based on the total
racially-mixed group to the separate racial groups produced inconsistent results,
sometimes yielding reasonably acceptable predictions and at other times pre-dictions at no more than chance level. These results led .the research project
to an investigation of validation models which could be applied to racially-mixed
groups. These are discussed in Chapter VII. The recommendation of separate
validations for difference racial groups is in accordance with the thinking of a
growing body of professional workers in this field and with the suggestions of the

Equal Employment Opportunity Commission, Since the completion of this
research, an order issued by Labor Secretary Wirtz requires that validation
results be reported separately for minority and nonminority groups wherevertechnically feasible. Separate validations should result in an equitable selection
of candidates from all racial groups involved without loss of efficiency in the
organization since the same performance standards will be applied to all candi-dates. The fact that the Chicago Police Department has a multi-racial forcewith a patrolman composition of about one quarter Negro and three-quarterswhite has given this research project the opportunity to make a worthwhile con-
tribution to the general body of knowledge in this field.
The results of the analyses also allowed us to identify the areas of psychological
measurement and the specific tests which assessed characteristics likely to be
most predictive of patrolman success. The next step was to describe attributesof currently employed patrolmen who participated in this study through the inter-
pretation of group profiles on the predictive tests. This is done in Chapter VI.
Since these predictive tests come from each of the three broad areas of measure-ment, a multi-faceted picture emerges of desirable skills and attributes on manydimensions of human behavior.
For patrolmen of both races, it is desirable that they assume family responsibility
early by establishing a family and a home and that they evidence some stability
both in their family and their occupational environments. A history of generally
better than average good health is also helpful.
In the area of personal skills and qualifications, apart from an at least averagelevel of functioning intelligence, some of the most important attributes for success
are the characteristic modes of behavior exhibited in dealing with interpersonal
and social problems. The desirable response is one of cooperation and an activeendeavor to solve the problem rather than withdrawal from the situation, undue
competitiveness in attempting to resolve it by outdoing others, or an expressionof hostility toward it.
230

In the area of temperament and personality functioning, the desirable attributes
are those which make for control of purely impulsive and emotional responses
and for a "work" rather than a "social" orientation, Other important character
/sties would be personal self-confidence, resistance to stress, and a realistic
rather than a subjective and feeling-oriented approach to life.
Although deviant groups of patrolmen undoubtedly exist in police forces through-
out the country, and are likely to attract attention because their behavior is
constantly open to public scrutiny, the results of this study are in direct contra-
diction to the statements made by those who maintain that sociopathic tendencies
are required for patrolman success, or that you have to "set a thief to catch a
thief. " The desirable attributes mentioned here are measured by the tests, andpatrolmen who scored high on these attributes were, in general, those who were
independently given high ratings for performance by their supervisors, There-fore, it must be concluded that the ideal attributes for success are all related
to stability--stability in the parental and personal family situations, stabilitystemming from personal self-confidence and the control of emotional impulses,
stability in the maintenance of cooperative rather than hostile or competitive
attitudes, and stability deriving from a resistance to stress and a realisticrather than a subjective orientation toward life.
IDENTIFICATION OF PATTERNS OF GOOD AND POOR PERFORMANCE
The identification of a test profile describing the behavioral attributes which are
predictive of an overall criterion of performance for a given occupational group
is an essential but only initial step in the selection and placement of personnel.
As the complexity of an occupation increases, its demands become more diverse,
There is growing room for individuality of style in meeting these demands. Under
these circumstances, the occupational group will no longer be composed exclu-
sively of Individuals approXimating a given behavioral prototype, all performing
with varying degrees of success along a unified dimension or criterion. Instead,
occupational subgroups will b egin to emerge, internally homogeneous but differing
231

among themselves in style of performance, It was our belief that such differingsubgroups would be found in the case of the uniformed beat patrolmen in thePatrol Division of the Chicago Police Department.
As a result of the analysis described in Chapter VIII, it appeared that this beliefwas fully justified. Sophisticated computer programming and equipment made itpossible to distinguish eight such subgroups, with performance patterns defined interms of the objective and subjective criterion measures used in this study.These eight subgroups were distinct from each other and also from the "basicperformance pattern" which characterized the patrolman occupational group takenas a whole. Four of these subgroups were unique to one or the other of the testingWaves, but the remaining four were replicated in both Waves, a finding which at-tests to the generality of these latter performance patterns in the department.The ultimate objective in studying the performance subgroups was to identify thebehavioral attributes characterizing the members of each, as measured by thevalidated test battery. Such information can be used to locate potential membersof each group at the time they enter the department and can thus be of great valuefor purposes of selection and placement.
Of the eight subgroups identified, five may be regarded as showing desirable oracceptable performance patterns, while ,the remaining three are characterizedby generally poor performance. In fact, two of these last three exhibit perfor-mance patterns which could be detrimental to the department and to the public.Successful and less than successful performance patterns occur at all stages oftenure, as showin in Table 1. Thus, there are three low-tenure subgroupswhich may be regarded as relative newcomers to the department. The perfor-mance of these three groups exhibits a complete range from excellent throughpoor. There are also three groups of established, average-tenure patrolmen,one of which shows excellent performance, while the other two show the poorestof the performance patterns identified. The latter of these -'with conflicting su-pervisory ratings--has the highest number of complaints, the second highestnumber of disciplinary actions, and the poorest attendance record, This group
232

CHAPTER IX Table 1
Eight Performance Pattern Subgroups
Successful Performance
1
Unsuccessful Performance
NEWCOMERS TO THE DEPARTMENT
Subgroup 1Low Tenure - Excellent Performance
Subgroup 2Low Tenure - Good Performance
Subgroup 3Low Tenure - Poor Performance
ESTABLISHED PATROLMEN
Subgroup 4Average Tenure - Excellent
Performance
Subgroup 7Long Tenure Excellent Performance.
Subgroup .8Long Tenure - Good Performance
S
Subgroup 5Average Tenure - Poor Performance
with DisciplinaryActions
Subgroup 6Average Tenure - Conflicting Ratings
& General Disci-plinary Problems
OLD-TIMERS
233

=
may represent a real problem for the department and one which does not appear
to be fully recognized by all their supervisors. The final two identified sub-
groups are composed of long-tenure old-timers, showing excellent or good
performance, although this last group may not be as actively involved in the
specifics of beat patrol as the other.
Analysis of the psychological test scores of the eight subgroups shown in Table
1 indicated that there were tests in the areas of personal background, work
interests, mental abilities, aptitude, temperament, and personality whichsuccessfully differentiated them from the "basic performance pattern" patrolman
group. In addition, some of the measures held promise for differentiating among
the eight subgroups themselves, It may thus be possible to establish benchmarks
by which patrolmen can be categorized according to the performance patterns
they are likely to exhibit. The advantages of such categorization for selection
and placement are evident. For example, a follow-up on the performance of the
eight subgroups may indicate that certain performance profiles are character-
istic of patrolmen who move on to other basic functions in the department, such
as the supervisory or investigatory. For purposes of immediate placement at
the time of entry into the department, it would be desirable to identify patrolmen
who may rapidly achieve the highly successful performance pattern of the Low
Tenure - Excellent Performance subgroup. Similarly, it would be valuable to
be able to pinpoint and perhaps refuse entry to men who are likely to exhibit the
undesirable performance pattern of the Average Tenure - Conflicting Ratings
subgroup.
Comparison of the test scores for the "basic" patrolman group and those for
Subgroup 1, the Low Tenure Excellent Performance subgroup, shows that in
the area of background and experience, the profiles are similar on the basic
requirements of stability in the parental and family situations. However, the
subgroup scores significantly higher on Drive and Vocational Satisfaction. On
mental abilities, the subgroup is slightly higher in reasoning ability and language
facility, but they are significantly higher on tests of visual perception and have a
234

t:
generally faster reaction time. In style of dealing with interpersonal and social
problems, this subgroup shows the same desirable profile as the "basic" group,
that is, a pattern of cooperation and an active endeavor to resolve social problem
situations rather than withdrawing from them. However, the subgroup profile is
exaggerated, with a higher score for cooperation and a lower one for withdrawal.
A thumbnail sketch of this Low Tenure Excellent Performance subgroup would
show good background coupled with high drive, good mental abilities, with special
facility in speed and accuracy of visual perception, a faster reaction time, well-
developed skills in dealing with social problems, and a generally greater behav-
ioral reactivity.
A very different picture appears in the test profile of Subgroup 6, characterized
by Average Tenure and Conflicting Ratings, which has a conspicuously high number
of complaints and disciplinary actions and the poorest attendance record in the
department. In the background area, this group scores signficantly lower than the
"basic" group on the dimension Early Family Responsibility, indicating the absence
of the family involvement which would be expected of men with an average age of
35. Their mental abilities are slightly lower than those of the basic group, but
they score significantly lower on the test of visual perception which measures the
ability to rapidly organize an apparently unrelated visual field into a meaningful
whole. This subgroup combines lower self-reliance, as measured in the behav-
ioral area, with a significantly higher liking for occupations with attendant
authority and prestige. This potential conflict between what these patrolmen are
capable of handling and what they would like to do is reflected in other behavior
score deviations from the basic group. The basic group scores higher on ego
control, or the ability to function realistically, and lower on uncontrolled im-
pulsivity and the tendency to regard moral codes of behavior as purely external
restrictions. In contrast, the Subgroup 6 profile is the reverse of this, with the
lowest score on ego control and equally strong levels of impulsivity and a
moral 3tia control of impulse. These patrolmen do not achieve a realistic
solution to this conflict but rather alternate between the two extremes.
' f
tastet4itikatcraathha t.g.4 t. itr.ot

The test results of Subgroups 1 and 6, discussed above; may be summarized
by saying that the first--Low-Tenure - Excellent Performance--is similar to
the basic group but often scores higher on desirable dimensions or else adds
high scores on attributes which logically would seem to contribute to superior
performance. On the other hand, the second subgroup--Average Tenure - Con-
flicting Ratingsscores below the basic group on a number of important dimen-
sions. In some cases, their profile is actually the reverse of that of the basic
group. These results provide additional evidence for the validity of the profile
established for the "basic performance pattern" group, and are encouraging in
that they point the way to the possibility of identifying patrolmen--at the time
they apply for entry to the department--who are likely to show good or pbor
patterns of occupational performance.
IMPLICATIONS FOR FUTURE RESEARCH AND APPLICATION
As is frequently the case with exploratory research projects, more researchobjectives, both practical and theoretical, suggested themselves than could
feasibly be included within the scope of this report. One such ancillary project-
the separate racial validationsis included in this report because of its obvious
bearing on the results. Others are presently under way and will be reported
when time and opportunity permit. However, in addition to these "by-products"
researches, there are some very logical follow-ups to a study of this scope and
nature.
1. Local Validation Studies. The specific implementation of the test
battery itself is probably of foremost interest to the police adminis-trator. Although we have not attempted to make this report a case-book in tests and measurements, we have attempted to show the
necessity for, and logic behind, a test validation study. If these
results are to be utilized elsewhere, it is essential that a techni-cally sound validation study precede or at least be conducted con-
currently with the use of any of these tests. The specific findings
236

of this study should be generalized quite cautiously. The precise
meaning of a man's score on a test in one of these areas should be
something to be determined locally. A definite standard appropri-
ate in the Chicago Police Department may be inappropriate in
other departments.2. Predictive Validation Study. A concurrent validation model of the
type employed in this research is ordinarily followed up by a pre-
dictive validation study in which tests administered at a particularpoint in time (e, g. , application to join the police force) must prove
predictive of performance at a later point in time (e, g. , after one
year's full-time service). The present research has providedvaluable information concerning the areas of measurement and the
types of test likely to be most fruitful in a predictive study. It
would be desirable to deal with applicants who were not prescreened
for intelligence at the time of entry or for emotional health during
their time of training. The test batteries would then lay more stress
on these areas and would be of more general application in other po-
lice departments where such efficient screening of applicants is
not readily available.
3. Construction of S ecialized Instruments for Patrolman Selection.
The present research has identified areas likely to be most produc-
tive for the construction of specialized instruments. The most ob-
vious example of this is the area of background expei-ience, which
was highly predictive despite the intensive background checks
which are a regular part of the screening process of the Chicago
Police Department. Such a specialized instrument would not only
have general application but would also be very valuable in depart-
ments where systematic background screening was not as intensely
applied as in the Chicago Police Department where it is aimed at the
elimination of candidates of unstable background or sociopathic ten-
dencies.
237

yr
Ex ans ion of the Research to Include Other Basic Functional Grou s
in a Police Department. On the basis of our experience in industrialand other organizations, a sizable proportion of a basic test battery
given at the time of entry into the organization and combined with
specialized tests can be used for predicting performance at salient
points of progression and promotion in the organization. In the
police organizational structure, this would ordinarily include investi-
gatory and supervisory personnel. When personal development takes
the form of progression from the time of entry into the organization
rather than of distinct and separate hurdles to be overcome at the time
of each promotion, there is a great increase in the efficiency of the
manpower operation with concomitant time utilization and financial
saving.
The Effects of Organizational Structure on Personal Performance.
The identification of subgroups with different degrees of successful
performance under varying operational conditions should continue
as a longitudinal study to determine the eventual placement pro--
motion, and success or failure of the members of these subgroups in
the organizational structure.
6. Training for Specialist Functions. Our increased knowledge of the
functioning of police departments and the results of this research
have suggested at least three areas of specialized training:
a. Training of Patrolmen. The research has identified someof the important attributes for successful patrolman per-formance, and training can be instituted with a view to de-veloping these attributes. While much systematic trainingis available for the development of technical skills, onesuggestion here is training in the human relations areas,especially in the solution of interpersonal and social problems.
Training of Supervisory Personnel. Since training and thedevelopment of manpower resources devolves ultimately onthe supervisory personnel in the organization, these personnelshould themselves be well trained not only in the technical butalso in the managerial skills aspects of their job.
238

c. Trainin _ for Administrators of Selection and Placement Pro-grams. Since the ultimate success of a professionally devel-oped selection and placement procedure depends on the quali-fications, know-how, and experience of those people who willbe responsible for its implementation, departments shouldseek professionally qualified personnel within or outside theorganization. In addition, such personnel would benefit fromtraining specifically directed toward the use and interpretationof the validated test battery.

CHAPTER X
Chicago Police Department Reviewof the Patrolman Study
HISTORY OF THE PROJECT
In "The Challenge of Crime in a Free Society, " the President's Commissionreported that more than 50, 000 police recruits are needed to bring all lawenforcement departments in the United States up to their authorized strength.This poses a problem with regard to attaining authorized strength whilemaintaining the level of moral, physical, and mental qualifica.tions considereddesirable for patrolmen.
The Chicago Police Department meets this problem by utilizing severalselection methods:1. A mental test developed by the. Civil Service, Commission;
A battery of psychological tests analyzed by an outside psychologicalfirm;
A thorough background investigation conducted by detectives, of theChicago Police Department and backed up by
a psychiatric evaluation board when indicated.
All these procedures serve to eliminate persons who do not meet the standards,set for police officers in Chicago.
The foregoing screening procedure is far more stringent than that employedby industry and, because of the inclusion of psychological tests, more extensive than that employed by most police departments. It serves to eliminate

persons who have demonstrated unsuitability or who lack the desired emotional
stability. Although this procedure exceeds the screening standards prescribed
by the President's Commission, it does not provide a means for predicting thefuture success of the candidate.
The selection procedures used by the Civil Service System and the Chicago
Police Department were considered adequate. However, both organizations
were responsive to any method of identifying and measuring the personal char-
acteristics that contribute to good police work. Therefore, conferences were
arranged with faculty members of local universities, psychological consultants,
agencies, and psychiatrists who were specialists in testing and in the behavioral
sciences in an effort to obtain more sophisticated testing procedures. In these
meetings many ideas were explored. The Chicago Police Department empha-
sized that it was interested in any method of improving its screening procedure.
Normally sufficient money would not be available to our Department for this type
of research. However, the Law Enforcement Assistance Act of 1965 provided
a means of achieving our goal. Qualified persons and organizations were re-quested to submit proposals.
Many proposals were submitted, and it was decided after careful evaluation
that the project with the most merit was the one proposed by the Industrial
Relations. Center of The University of Chicago. The Measurement Research
Division of the Center developed a research proposal that was submitted to the
Chicago Police Department in early 1966. After some discussion and modifi-
cation, it was approved by the Department Head at that time, Superintendent
Orlando W. Wilson.
On June 28, 1966 the Chicago Police Department was granted an award for this
project entitled "Predictor Variables and Their Relation to Patterns of Patrol-
man Performance " Its more popular title was "Predicting Patrolman
Performance."

The Industrial Relations Center performed many preliminary functions in
preparation for the grant. Upon approval by the U.S. Department of Justice,
they immediately began to implement the program. From the inception of the
project, the relationship between the Chicago Police Department and Industrial
Relations Center has been excellent, There has been frequent and adequatecommunIcation throughout the life of the project, and a free exchange of ideas.
Through the sponsorship of Superintendent James B. Conlisk, who was then the
Deputy Superintendent, Bureau of Field Services, and the efforts of command
personnel, the representatives of the Industrial Relations Center were well
received in every unit they visited. Field Force Commanders were directly
involved because this study was concentrated in their command areas and
required the time of many men at all levels. Although implementing this
project necessitated that Department members spend many valuable hours away
from their regular assignments, the Field Force Commanders recognized the
merits of the program and gave it personal support in all its phases. This top-level sponsorship and close command support resulted in excellent cooperation
from all personnel involved.
In preparation for the final selection of tests, the project staff met with a num-
ber of .esting authorities. The persons responsible for testing in the ChicagoCivil Service Commission and the Chicago Police Department, as well as other
psychological consultants, were contacted prior to making the final determina-
tion of the test battery.
Considerable analysis went into the selection of the districts to be included in
the study to make certain that a good cross section of the Department was
included. Districts were chosen based on their incidence of crime, size,neighborhoods, kinds of population, number and size of beats, etc.
243

PROJECT ACCOMPLISHMENT
There were a number of milestones reached as a result of this project:
1. The results of this study gave us;
a. an improved method for screening patrolmen;
b. an improved method for selecting patrolmen for specialassignments; and
c. the capability of meeting the guidelines set up by the FederalGovernment with regard to test validation.
2. A close relationship was established between an education center such
as The University of Chicago and a major police department with a
desire to participate in research. This program demonstrated thebenefits to be obtained by law-enforcement agencies which establish
rapport with their local universities.3. A working relationship was developed in both organizations at all levels
down to and including patrolmen. One example that may be cited was
that patrolmen who ordinarily are cautious and skeptical cooperated
fully during the testing phase, making the results of the study more
significant.
There were a number of other accomplishments in the study that should be
mentioned:
1. The paired-comparison method of evaluating personnel proved to be
reliable and accurate and should be considered by law enforcement
agencies seeking to establish better evaluation procedures.
2. The study indicated that there are many areas to consider when
assessing patrolman applicants other than the ordinary intelligence
tests. It confirmed the value of considering behavior and aptitude
when measuring a man's ability to perform on the job.
The study confirmed the value of stable home life and environment being
present in the background of better patrolmen, validating our long-established
practice of conducting a thorough background investigation of each applicant.
244

This is in direct contradiction to those who maintain that sociopathic tendencies
are characterisvl of many patrolmen.
SIGNIFICANT BENEFITS TO THE CHICAGO POLICE DEPARTMENT
There were significant benefits derived from this study. We have listed below
the ones that were most advantageous:
It provided a battery of tests that should assist in determining the
potential value of recruits entering the Training Academy.
It established a base for further research and validation of psy-
chological tests as a screening method.
It verified the value of our performance rating system. There was
strong agreement between our performance rating system and the
paired-comparison system used by. The University of Chicago.
It provided an opportunity for personnel of the Chicago Police Depart-
ment to receive the benefits of training and experience while working
with the staff of The University of Chicago.
IMPLEMENTATION OF THE TEST BATTERY
We do not anticipate too many problems with our own implementation of this
test battery in Chicago because the prbfessional psychologists in the Civil
Service Commission and the Chicago Police Department are well qualified to
administer, score, and evaluate the test battery and utilize the results. In
smaller law-enforcement agencies, it will probably be necessary to obtain the
help of professional psychologists to start the program and to check periodi-
cally to evaluate its operation.
We would not suggest that this or any other battery of psychological tests be
the sole screening device for law-enforcement organizations, but rather that
it should be used in conjunction with established screening .procedures.
245

RECOMMENDATION FOR FUTURE PROJECT
The success of this project in predicting the performance of patrolmen suggests
that further research would provide a method, of predicting the performance of
specialists such as detectives or youth officers. Even more important would
be a method of selecting supervisors.
Currently personnel are selected for promotions in many departments by a
series of examinations, oral boards, or other procedures. A battery of tests
developed to predict successful police supervisors or leaders would provide a
valuable replacement for, or supplement to, the current procedures and fill a
void recognized by all police administrators.
It is our belief that utilization of the current battery of tests developed by the
Industrial Relations Center of The University of Chicago and a continuation in
this productive field of research will provide a major step toward up-grading
police personnel and achieving the desired goal of professionalization of law-
enforcement organizations in the United States.
* l.f. GOVERNIARNT PRINTING OFFICE 1111111 0-3311-4I3