Ecosystem processes of the Tonle Sap Lake
14
Full paper for 1 st Workshop of Ecotone Phase II, 2003 in Phnom Penh and Siem Reap, Cambodia Ecosystem processes of the Tonle Sap Lake Juha SARKKULA 1 , Mikko KIIRIKKI 1 , Jorma KOPONEN 2 , and Matti KUMMU 2&3 INTRODUCTION The Tonle Sap Lake and floodplains in the heart of Cambodia contain the largest continuous areas of natural wetlands habitats remaining in the Mekong system, while being the largest permanent freshwater body in Southeast Asia (Figure 1). Tonle Sap is a crucially important source for food and living in Cambodia. More than one million people live in the immediate surroundings of the Tonle Sap Lake and wetlands, being the poorest ones in Cambodia, and highly dependent on agriculture and fisheries. Figure 1. Lower Mekong Basin with Tonle Sap Lake. Dry season lake (~1.5 m above the mean sea level [a.m.s.l.]) is presented as dark blue while the flood plain of the year 2000 flood is presented as lighter blue (~10.3 m a.m.s.l.). The 2-year project “Modelling of the Flow Regime and Water Quality of the Tonle Sap” (MRCS/WUP-FIN) has helped the MRC to assess and evaluate the impacts of physical and environmental changes in the Lake Tonle Sap in relation to the whole Mekong basin, as well as more locally in Cambodia. The aim has been to assist in maintaining sustainable conditions of 1 Finnish Environment Institute 2 Environmental Impact Assessment Centre of Finland (EIA Ltd.) 3 Helsinki University of Technology, Finland Contacts: [email protected] / [email protected] / [email protected] / [email protected] Web: www.eia.fi/wup-fin
-
Upload
independent -
Category
Documents
-
view
2 -
download
0
Transcript of Ecosystem processes of the Tonle Sap Lake
Full paper for 1st Workshop of Ecotone Phase II, 2003 in Phnom Penh and Siem Reap, Cambodia
Ecosystem processes of the Tonle Sap Lake Juha SARKKULA1, Mikko KIIRIKKI1, Jorma KOPONEN2, and Matti KUMMU2&3
INTRODUCTION The Tonle Sap Lake and floodplains in the heart of Cambodia contain the largest continuous areas of natural wetlands habitats remaining in the Mekong system, while being the largest permanent freshwater body in Southeast Asia (Figure 1). Tonle Sap is a crucially important source for food and living in Cambodia. More than one million people live in the immediate surroundings of the Tonle Sap Lake and wetlands, being the poorest ones in Cambodia, and highly dependent on agriculture and fisheries.
Figure 1. Lower Mekong Basin with Tonle Sap Lake. Dry season lake (~1.5 m above the mean sea
level [a.m.s.l.]) is presented as dark blue while the flood plain of the year 2000 flood is presented as lighter blue (~10.3 m a.m.s.l.).
The 2-year project “Modelling of the Flow Regime and Water Quality of the Tonle Sap” (MRCS/WUP-FIN) has helped the MRC to assess and evaluate the impacts of physical and environmental changes in the Lake Tonle Sap in relation to the whole Mekong basin, as well as more locally in Cambodia. The aim has been to assist in maintaining sustainable conditions of
1 Finnish Environment Institute 2 Environmental Impact Assessment Centre of Finland (EIA Ltd.) 3 Helsinki University of Technology, Finland Contacts: [email protected] / [email protected] / [email protected] /
[email protected] Web: www.eia.fi/wup-fin
2
Tonle Sap system. A WUP-FIN project has set up a three-dimensional (3D) EIA Flow Model and 3D EIA Water Quality Model for the Tonle Sap Lake.
A dominant feature of the Tonle Sap system is that the sediment flux to the Tonle Sap Lake in the flood season (June-September) is manifold compared to the outflow flux in the dry season (October-May). Sedimentation studies show that net sedimentation to the Tonle Sap Lake proper has been in the range of 0.1-0.16 mm/year since about 5500 years before present (Tsukawaki 1997, Penny 2002). According to WUP-FIN modelling results the main sedimentation areas are in the flooded forest and flood plains are in the Tonle Sap delta area and in the vicinity of the lake proper and the tributaries. Dissolved oxygen conditions in the lake are characterized by well oxygenated waters in the lake proper and strongly oxygen depleted or even anoxic waters in large areas of the floodplain.
The Mekong Upstream developments, like construction of dams and reservoirs may lead to significant trapping of sediments and nutrients and reduction of the fertility of the Tonle Sap system. An important phosphorus source of the mainly phosphorus limited aquatic ecosystem is the sediment carried by the flood. Any significant changes in the flood regime and the suspended solids concentration may have influence in the productivity of the lake Tonle Sap.
TONLE SAP LAKE The Tonle Sap Lake and floodplains in the heart of Cambodia contain the largest continuous areas of natural wetlands habitats remaining in the Mekong system, while being the largest permanent freshwater body in Southeast Asia. The Tonle Sap River connects the lake to the Mekong River and joins it at Chaktomuk junction near Phnom Penh, after which the river immediately splits into the smaller Bassac River and the larger Mekong River. The area is globally unique and the lake has an extraordinary hydrological system. In the wet season, the Tonle Sap River changes its direction and flows to the Tonle Sap Lake instead from the lake because of the flooding of the Mekong River. The lake functions as a natural flood water reservoir for the Mekong system.
1.00
2.00
3.00
4.00
5.00
6.00
7.00
8.00
9.00
10.00
11.00
Jan Feb Mar Apr May Jun Jul Aug Sep Oct Nov Dec
Wat
er L
evel
in T
onle
Sap
Lak
e [m
] (a.
m.s
.l.) 1992
199319941995199619971998199920002001
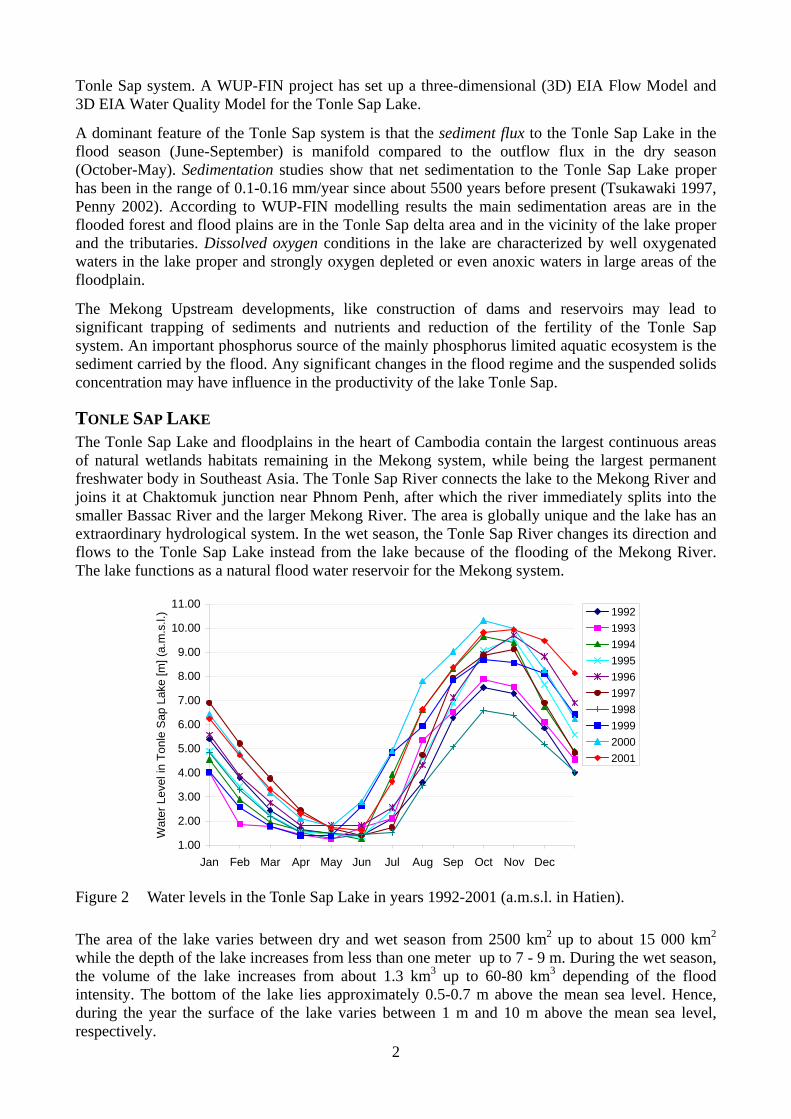
Figure 2 Water levels in the Tonle Sap Lake in years 1992-2001 (a.m.s.l. in Hatien).
The area of the lake varies between dry and wet season from 2500 km2 up to about 15 000 km2 while the depth of the lake increases from less than one meter up to 7 - 9 m. During the wet season, the volume of the lake increases from about 1.3 km3 up to 60-80 km3 depending of the flood intensity. The bottom of the lake lies approximately 0.5-0.7 m above the mean sea level. Hence, during the year the surface of the lake varies between 1 m and 10 m above the mean sea level, respectively.

3
Figure 3 Fisherman at the Tonle Sap Lake during the flood time (Photo: Veronika Koponen, 2002)
The lake provides about 60 % of Cambodia’s total supply of protein. The Tonle Sap ecosystem is believed to be one of the most productive inland waters and one of the most fish-abundant lakes in the world. Flooded forests and shrubs offer shelter and breeding grounds for fish and other aquatic animals (Bonheur, 2001). The annual flood creates also good conditions to cultivate floating and recession rice. Hence, the Tonle Sap Lake is a crucially important source for food and living in Cambodia. More than one million people live in the immediate surroundings of the lake and wetlands, being the poorest ones in Cambodia, and highly dependent on agriculture and fisheries (Figure 3). According to Bonheur (2001) approximately half of Cambodia’s present population (13.8 million) benefits directly or indirectly from lake’s resources. Cambodia’s history revolves around the Tonle Sap Lake and the Mekong River and it is no coincidence that Angkor, one of greatest ancient civilizations in the Asia, developed in proximity to the lake (Keskinen, 2003; and Kummu, 2003).
WUP-FIN MODELLING TOOLS The 2-year project “Modelling of the Flow Regime and Water Quality of the Tonle Sap” (MRCS/WUP-FIN) has helped the MRC to assess and evaluate the impacts of physical and environmental changes in the Lake Tonle Sap in relation to the whole Mekong basin, as well as more locally in Cambodia. The aim has been to assist in ensuring the sustainable use of natural resources in Tonle Sap.
The models applied for the Tonle Sap Lake were 3-dimensional (3D) EIA Flow Model for the detailed current and sedimentation studies, 3D EIA Water Quality Model for calculating the transport and processes of a selected set of water quality indicators and hazardous materials, and two watershed models for simulating the hydrology on the watershed and sub-watershed scale. The models have been developed by Technical Research Centre of Finland and EIA Ltd. (Environmental Impact Assessment Centre of Finland) during the last 20 years. So far, they have been applied in over 230 major modelling projects.
3D Model Package The 3D Flow Model has been set up for the lake for simulating elements such as water levels and currents, inundation of the floodplain, and suspended sediments rates. The model can be classified as a 3-dimensional baroclinic z-level model (e.g. Virtanen et al., 1998) and is based on the standard Navier-Stokes equations in a rectangular grid. The complicated hydrodynamic and sedimentological characteristics of the Tonle Sap Lake system necessitate the use of a versatile model system. It is possible to calculate also 2D solutions although usually 3D solutions are more appropriate for erosion and sediment transport studies (Koponen et al., 2003).
3D Water Quality Model has been set up for the lake for simulating the transport and processes of selected set of water quality indicators and hazardous materials. Water quality is modelled with known water flow, which is used to compute the dispersion of nutrients and other substances from
4
given sources. In addition to moving along with the water the modelled substances may diffuse, sediment, re-suspend, decay and react with each other. The water quality model also includes three algae models that introduce biological reactions of algae and bottom sediment into the computation.
Watershed models Two watershed models have been applied for the watersheds: a simplified lumped rainfall-runoff HBV model (e.g. Bergström, 1995) for basic hydrological modelling, and a more detailed grid-based distributed VMod watershed model (Lauri & Virtanen, 2002), including water resources management, river water quality, erosion control and land use planning. The watershed models have been set up to study the hydrological conditions on the Tonle Sap Catchment. Those allow predicting impacts of land use changes, to provide versatile basis for water resources management and to give material loads (sediments, nutrients) for the lake model
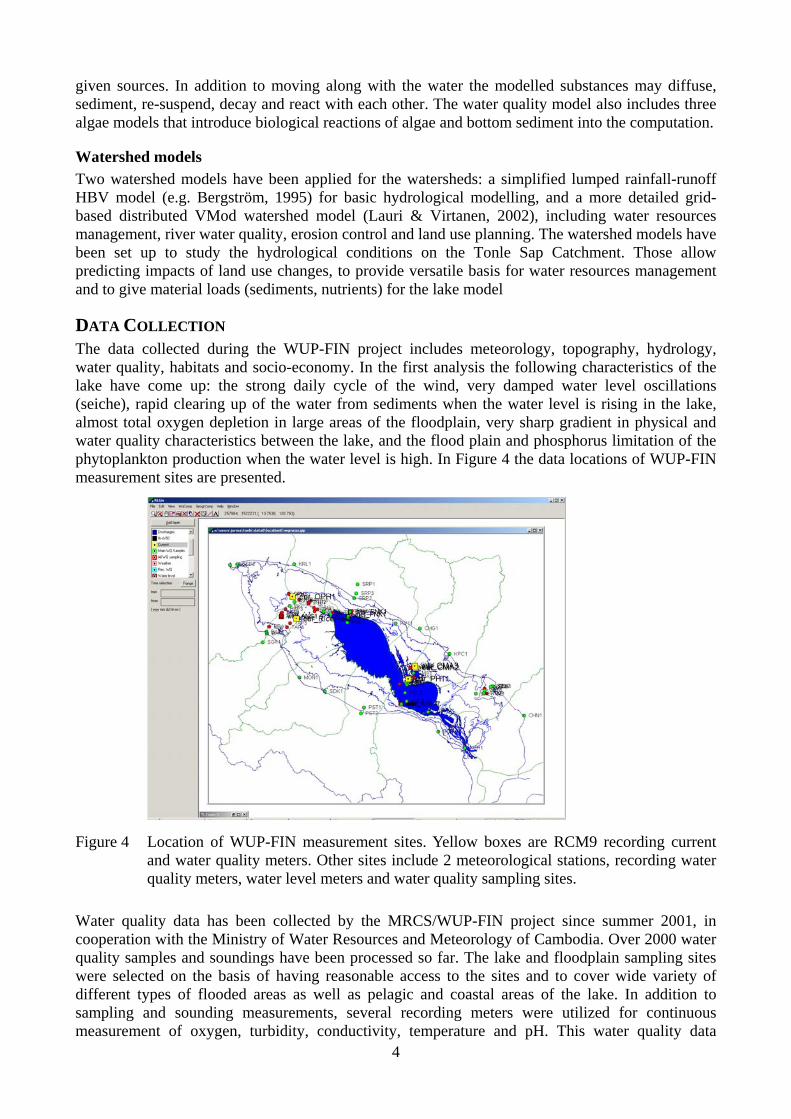
DATA COLLECTION The data collected during the WUP-FIN project includes meteorology, topography, hydrology, water quality, habitats and socio-economy. In the first analysis the following characteristics of the lake have come up: the strong daily cycle of the wind, very damped water level oscillations (seiche), rapid clearing up of the water from sediments when the water level is rising in the lake, almost total oxygen depletion in large areas of the floodplain, very sharp gradient in physical and water quality characteristics between the lake, and the flood plain and phosphorus limitation of the phytoplankton production when the water level is high. In Figure 4 the data locations of WUP-FIN measurement sites are presented.
Figure 4 Location of WUP-FIN measurement sites. Yellow boxes are RCM9 recording current
and water quality meters. Other sites include 2 meteorological stations, recording water quality meters, water level meters and water quality sampling sites.
Water quality data has been collected by the MRCS/WUP-FIN project since summer 2001, in cooperation with the Ministry of Water Resources and Meteorology of Cambodia. Over 2000 water quality samples and soundings have been processed so far. The lake and floodplain sampling sites were selected on the basis of having reasonable access to the sites and to cover wide variety of different types of flooded areas as well as pelagic and coastal areas of the lake. In addition to sampling and sounding measurements, several recording meters were utilized for continuous measurement of oxygen, turbidity, conductivity, temperature and pH. This water quality data

5
collection was supplemented with recording flow, water level and meteorological measurements and regular MRCS monitoring data. Microscopic counting of phytoplankton and zooplankton, sampled both in the lake and in the flood plain, were carried out at the University of Turku, Finland.
PHYSIC-CHEMICAL CONDITIONS AND AQUATIC ECOSYSTEM The weather in the lake area is dominated by the monsoon. During the wet season in May – October winds are predominantly from south-west and during the dry season in November – April from north-east. Wind velocities are typically low, on the average 2 – 3 m/s, except during short storms. The low wind velocities combined with the sheltering effect of vegetation make the inundated forest quite calm environment. Calm physical conditions facilitate net sedimentation and decrease aeration. Average yearly precipitation varies from 1300 mm in the south to 1500 mm in the northern part of the area. Precipitation distribution is characteristically heterogeneous so that drought and flooding can occur at the same time in nearby areas. Lake water temperature varies between 28 and 33 °C.
The lake water is well oxygenated because of the effective wind and wave induced mixing. During the flood, inundated areas are to a large extent anoxic. Sediment rich water enters the Tonle Sap Lake from the Mekong through the Tonle Sap River or as an overland flow and to some extent from tributaries. During the dry season, mixing and resuspension are effective and the lake water is quite turbid limiting phytoplankton growth. However, high dissolved oxygen over-saturation values are encountered in the dry season lake which indicates active phytoplankton growth near the surface. During the high flood, the near surface waters clear especially in the floodplains due to effective sedimentation.
A preliminary analysis of the Tonle Sap Lake and flood plain ecosystem reveals that it is naturally mesotrophic and its primary production is probably phosphorus limited most of the time. During the low water period, there are clear signs of active nitrogen fixation in the phytoplankton community indicating that nitrogen could be occasionally the limiting nutrient. However, most of the phytoplankton biomass is produced during the phosphorus limited high water period.
Total suspended solids (TSS) showed clear difference between the floodplain and the open lake. The mean value for forest (23 mg·dm-3) was only one third of the value for the open lake (77 mg·dm-3). The highest TSS values were measured during the low water period, when the concentration level was in the open lake over 1000 mg·dm-3 and in the floodplain tributaries 100-200 mg·dm-3. During the high water period typical values for the open lake were 5-20 and for the flood forest 1-10 mg·dm-3 (Figure 5).
Figure 5 Total suspended solids (TSS) in open lake and flooded forest.
6
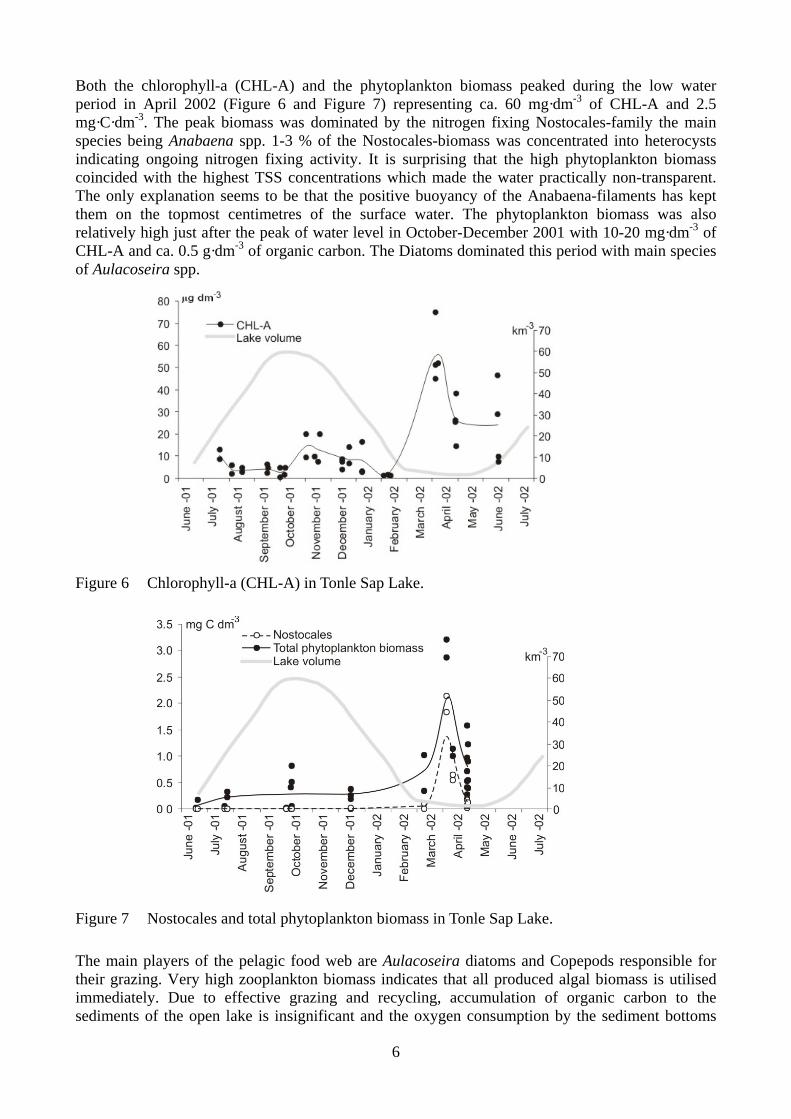
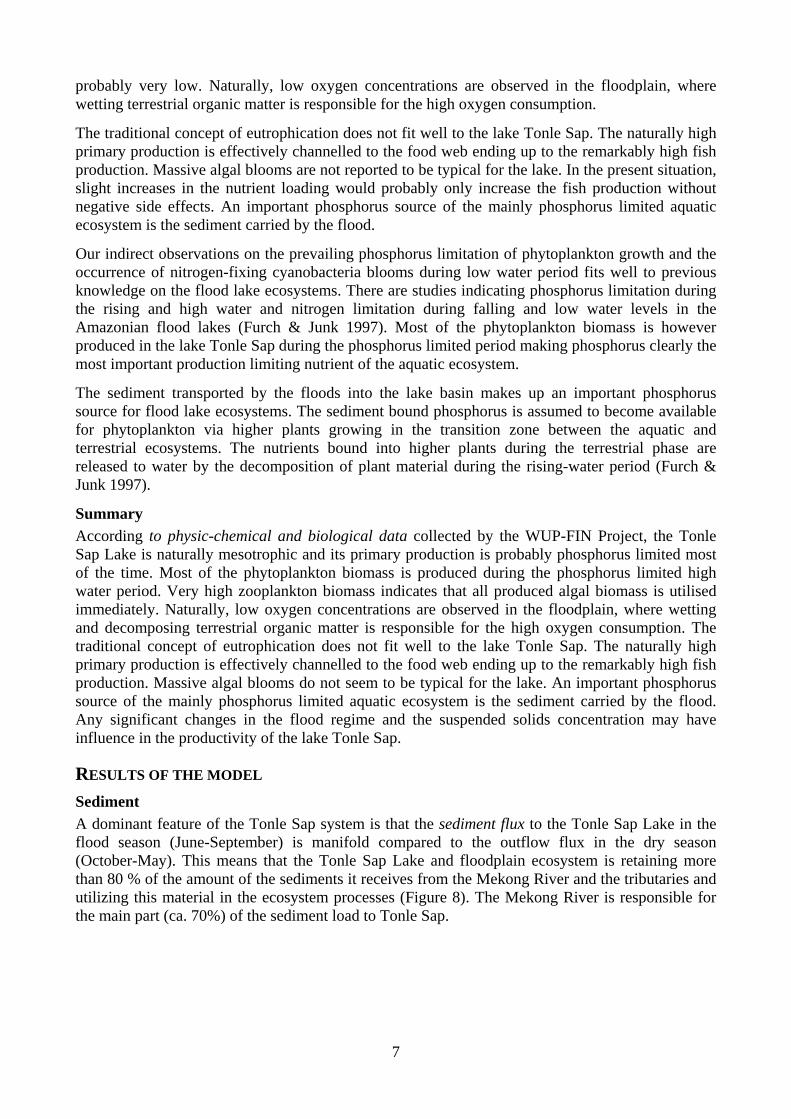
Both the chlorophyll-a (CHL-A) and the phytoplankton biomass peaked during the low water period in April 2002 (Figure 6 and Figure 7) representing ca. 60 mg·dm-3 of CHL-A and 2.5 mg·C·dm-3. The peak biomass was dominated by the nitrogen fixing Nostocales-family the main species being Anabaena spp. 1-3 % of the Nostocales-biomass was concentrated into heterocysts indicating ongoing nitrogen fixing activity. It is surprising that the high phytoplankton biomass coincided with the highest TSS concentrations which made the water practically non-transparent. The only explanation seems to be that the positive buoyancy of the Anabaena-filaments has kept them on the topmost centimetres of the surface water. The phytoplankton biomass was also relatively high just after the peak of water level in October-December 2001 with 10-20 mg·dm-3 of CHL-A and ca. 0.5 g·dm-3 of organic carbon. The Diatoms dominated this period with main species of Aulacoseira spp.
Figure 6 Chlorophyll-a (CHL-A) in Tonle Sap Lake.
Figure 7 Nostocales and total phytoplankton biomass in Tonle Sap Lake.
The main players of the pelagic food web are Aulacoseira diatoms and Copepods responsible for their grazing. Very high zooplankton biomass indicates that all produced algal biomass is utilised immediately. Due to effective grazing and recycling, accumulation of organic carbon to the sediments of the open lake is insignificant and the oxygen consumption by the sediment bottoms
7
probably very low. Naturally, low oxygen concentrations are observed in the floodplain, where wetting terrestrial organic matter is responsible for the high oxygen consumption.
The traditional concept of eutrophication does not fit well to the lake Tonle Sap. The naturally high primary production is effectively channelled to the food web ending up to the remarkably high fish production. Massive algal blooms are not reported to be typical for the lake. In the present situation, slight increases in the nutrient loading would probably only increase the fish production without negative side effects. An important phosphorus source of the mainly phosphorus limited aquatic ecosystem is the sediment carried by the flood.
Our indirect observations on the prevailing phosphorus limitation of phytoplankton growth and the occurrence of nitrogen-fixing cyanobacteria blooms during low water period fits well to previous knowledge on the flood lake ecosystems. There are studies indicating phosphorus limitation during the rising and high water and nitrogen limitation during falling and low water levels in the Amazonian flood lakes (Furch & Junk 1997). Most of the phytoplankton biomass is however produced in the lake Tonle Sap during the phosphorus limited period making phosphorus clearly the most important production limiting nutrient of the aquatic ecosystem.
The sediment transported by the floods into the lake basin makes up an important phosphorus source for flood lake ecosystems. The sediment bound phosphorus is assumed to become available for phytoplankton via higher plants growing in the transition zone between the aquatic and terrestrial ecosystems. The nutrients bound into higher plants during the terrestrial phase are released to water by the decomposition of plant material during the rising-water period (Furch & Junk 1997).
Summary According to physic-chemical and biological data collected by the WUP-FIN Project, the Tonle Sap Lake is naturally mesotrophic and its primary production is probably phosphorus limited most of the time. Most of the phytoplankton biomass is produced during the phosphorus limited high water period. Very high zooplankton biomass indicates that all produced algal biomass is utilised immediately. Naturally, low oxygen concentrations are observed in the floodplain, where wetting and decomposing terrestrial organic matter is responsible for the high oxygen consumption. The traditional concept of eutrophication does not fit well to the lake Tonle Sap. The naturally high primary production is effectively channelled to the food web ending up to the remarkably high fish production. Massive algal blooms do not seem to be typical for the lake. An important phosphorus source of the mainly phosphorus limited aquatic ecosystem is the sediment carried by the flood. Any significant changes in the flood regime and the suspended solids concentration may have influence in the productivity of the lake Tonle Sap.
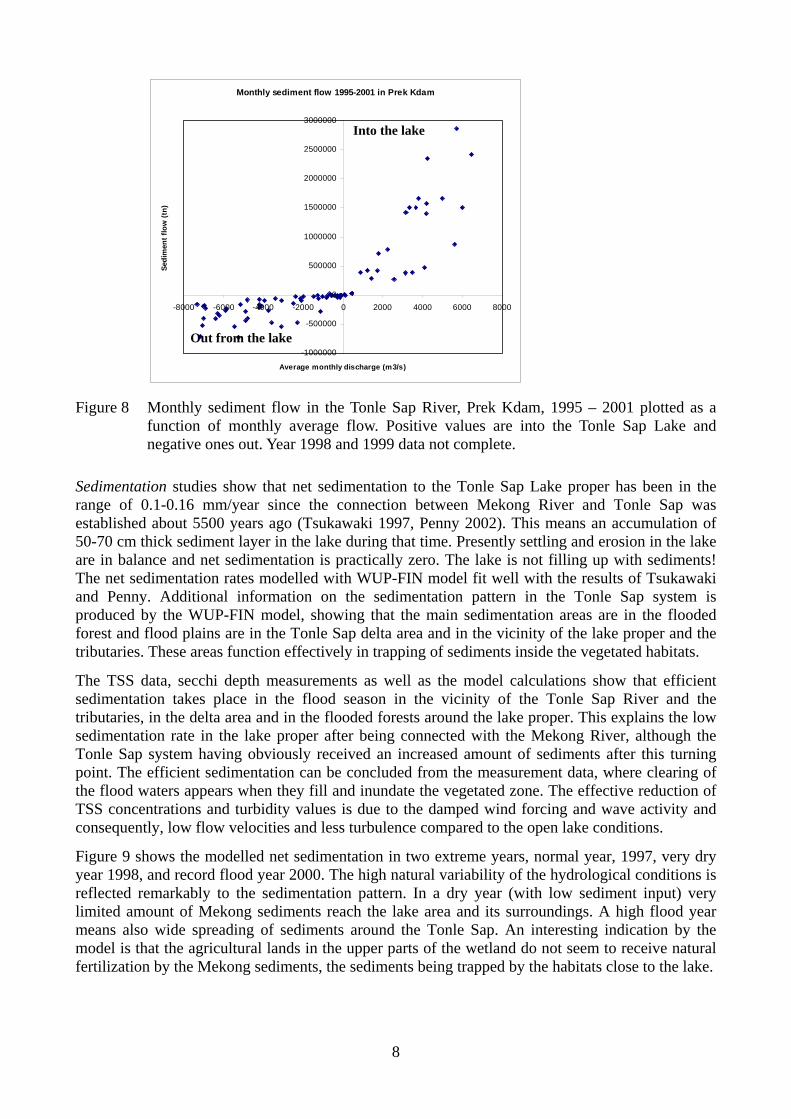
RESULTS OF THE MODEL Sediment A dominant feature of the Tonle Sap system is that the sediment flux to the Tonle Sap Lake in the flood season (June-September) is manifold compared to the outflow flux in the dry season (October-May). This means that the Tonle Sap Lake and floodplain ecosystem is retaining more than 80 % of the amount of the sediments it receives from the Mekong River and the tributaries and utilizing this material in the ecosystem processes (Figure 8). The Mekong River is responsible for the main part (ca. 70%) of the sediment load to Tonle Sap.
8
Monthly sediment flow 1995-2001 in Prek Kdam
-1000000
-500000
0
500000
1000000
1500000
2000000
2500000
3000000
-8000 -6000 -4000 -2000 0 2000 4000 6000 8000
Average monthly discharge (m3/s)
Sedi
men
t flo
w (t
n)
Figure 8 Monthly sediment flow in the Tonle Sap River, Prek Kdam, 1995 – 2001 plotted as a
function of monthly average flow. Positive values are into the Tonle Sap Lake and negative ones out. Year 1998 and 1999 data not complete.
Sedimentation studies show that net sedimentation to the Tonle Sap Lake proper has been in the range of 0.1-0.16 mm/year since the connection between Mekong River and Tonle Sap was established about 5500 years ago (Tsukawaki 1997, Penny 2002). This means an accumulation of 50-70 cm thick sediment layer in the lake during that time. Presently settling and erosion in the lake are in balance and net sedimentation is practically zero. The lake is not filling up with sediments! The net sedimentation rates modelled with WUP-FIN model fit well with the results of Tsukawaki and Penny. Additional information on the sedimentation pattern in the Tonle Sap system is produced by the WUP-FIN model, showing that the main sedimentation areas are in the flooded forest and flood plains are in the Tonle Sap delta area and in the vicinity of the lake proper and the tributaries. These areas function effectively in trapping of sediments inside the vegetated habitats.
The TSS data, secchi depth measurements as well as the model calculations show that efficient sedimentation takes place in the flood season in the vicinity of the Tonle Sap River and the tributaries, in the delta area and in the flooded forests around the lake proper. This explains the low sedimentation rate in the lake proper after being connected with the Mekong River, although the Tonle Sap system having obviously received an increased amount of sediments after this turning point. The efficient sedimentation can be concluded from the measurement data, where clearing of the flood waters appears when they fill and inundate the vegetated zone. The effective reduction of TSS concentrations and turbidity values is due to the damped wind forcing and wave activity and consequently, low flow velocities and less turbulence compared to the open lake conditions.
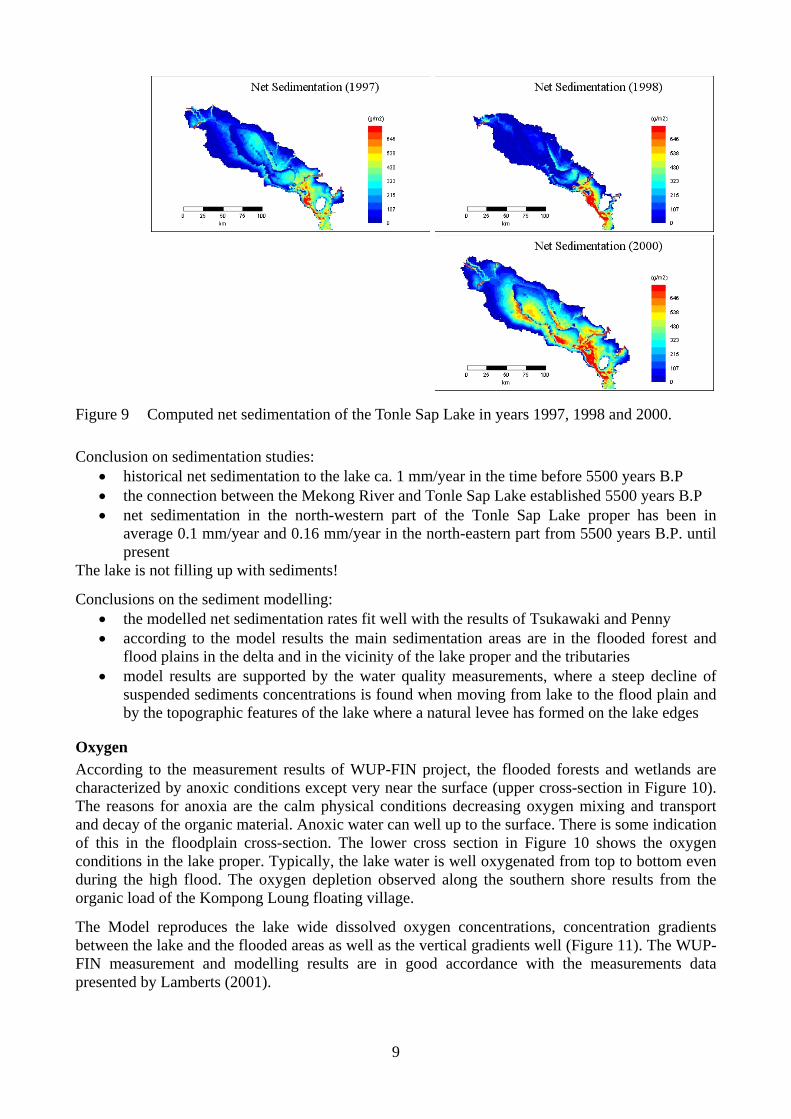
Figure 9 shows the modelled net sedimentation in two extreme years, normal year, 1997, very dry year 1998, and record flood year 2000. The high natural variability of the hydrological conditions is reflected remarkably to the sedimentation pattern. In a dry year (with low sediment input) very limited amount of Mekong sediments reach the lake area and its surroundings. A high flood year means also wide spreading of sediments around the Tonle Sap. An interesting indication by the model is that the agricultural lands in the upper parts of the wetland do not seem to receive natural fertilization by the Mekong sediments, the sediments being trapped by the habitats close to the lake.
Out from the lake
Into the lake
9
Figure 9 Computed net sedimentation of the Tonle Sap Lake in years 1997, 1998 and 2000.
Conclusion on sedimentation studies: • historical net sedimentation to the lake ca. 1 mm/year in the time before 5500 years B.P • the connection between the Mekong River and Tonle Sap Lake established 5500 years B.P • net sedimentation in the north-western part of the Tonle Sap Lake proper has been in
average 0.1 mm/year and 0.16 mm/year in the north-eastern part from 5500 years B.P. until present
The lake is not filling up with sediments!
Conclusions on the sediment modelling: • the modelled net sedimentation rates fit well with the results of Tsukawaki and Penny • according to the model results the main sedimentation areas are in the flooded forest and
flood plains in the delta and in the vicinity of the lake proper and the tributaries • model results are supported by the water quality measurements, where a steep decline of
suspended sediments concentrations is found when moving from lake to the flood plain and by the topographic features of the lake where a natural levee has formed on the lake edges
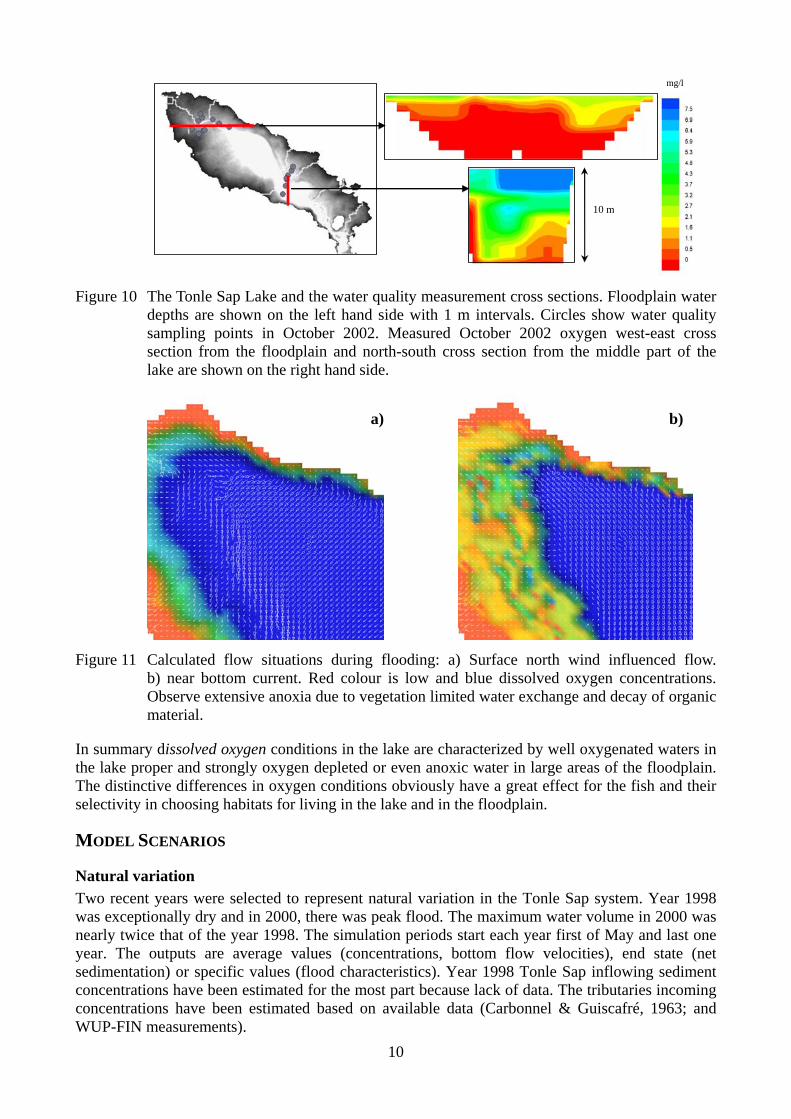
Oxygen According to the measurement results of WUP-FIN project, the flooded forests and wetlands are characterized by anoxic conditions except very near the surface (upper cross-section in Figure 10). The reasons for anoxia are the calm physical conditions decreasing oxygen mixing and transport and decay of the organic material. Anoxic water can well up to the surface. There is some indication of this in the floodplain cross-section. The lower cross section in Figure 10 shows the oxygen conditions in the lake proper. Typically, the lake water is well oxygenated from top to bottom even during the high flood. The oxygen depletion observed along the southern shore results from the organic load of the Kompong Loung floating village.
The Model reproduces the lake wide dissolved oxygen concentrations, concentration gradients between the lake and the flooded areas as well as the vertical gradients well (Figure 11). The WUP-FIN measurement and modelling results are in good accordance with the measurements data presented by Lamberts (2001).
10
10 m
mg/l
Figure 10 The Tonle Sap Lake and the water quality measurement cross sections. Floodplain water
depths are shown on the left hand side with 1 m intervals. Circles show water quality sampling points in October 2002. Measured October 2002 oxygen west-east cross section from the floodplain and north-south cross section from the middle part of the lake are shown on the right hand side.
Figure 11 Calculated flow situations during flooding: a) Surface north wind influenced flow.
b) near bottom current. Red colour is low and blue dissolved oxygen concentrations. Observe extensive anoxia due to vegetation limited water exchange and decay of organic material.
In summary dissolved oxygen conditions in the lake are characterized by well oxygenated waters in the lake proper and strongly oxygen depleted or even anoxic water in large areas of the floodplain. The distinctive differences in oxygen conditions obviously have a great effect for the fish and their selectivity in choosing habitats for living in the lake and in the floodplain.
MODEL SCENARIOS
Natural variation Two recent years were selected to represent natural variation in the Tonle Sap system. Year 1998 was exceptionally dry and in 2000, there was peak flood. The maximum water volume in 2000 was nearly twice that of the year 1998. The simulation periods start each year first of May and last one year. The outputs are average values (concentrations, bottom flow velocities), end state (net sedimentation) or specific values (flood characteristics). Year 1998 Tonle Sap inflowing sediment concentrations have been estimated for the most part because lack of data. The tributaries incoming concentrations have been estimated based on available data (Carbonnel & Guiscafré, 1963; and WUP-FIN measurements).
a) b)

11
Figure 12 3D model flood and water quality results. Comparison between dry year 1998 (left side)
and wet year 2000 (right side).
12
The dominant features of comparison between years 1998 and 2000 in the Figure 9 are: • clear separation of processes and big differences in output parameter values between the
lake and the floodplain • effective sedimentation and clearance of the waters in the floodplain, especially near the
lake shore and the rivers • strong dissolved oxygen depletion in the floodplain (even anoxia in large areas • large differences between different years.
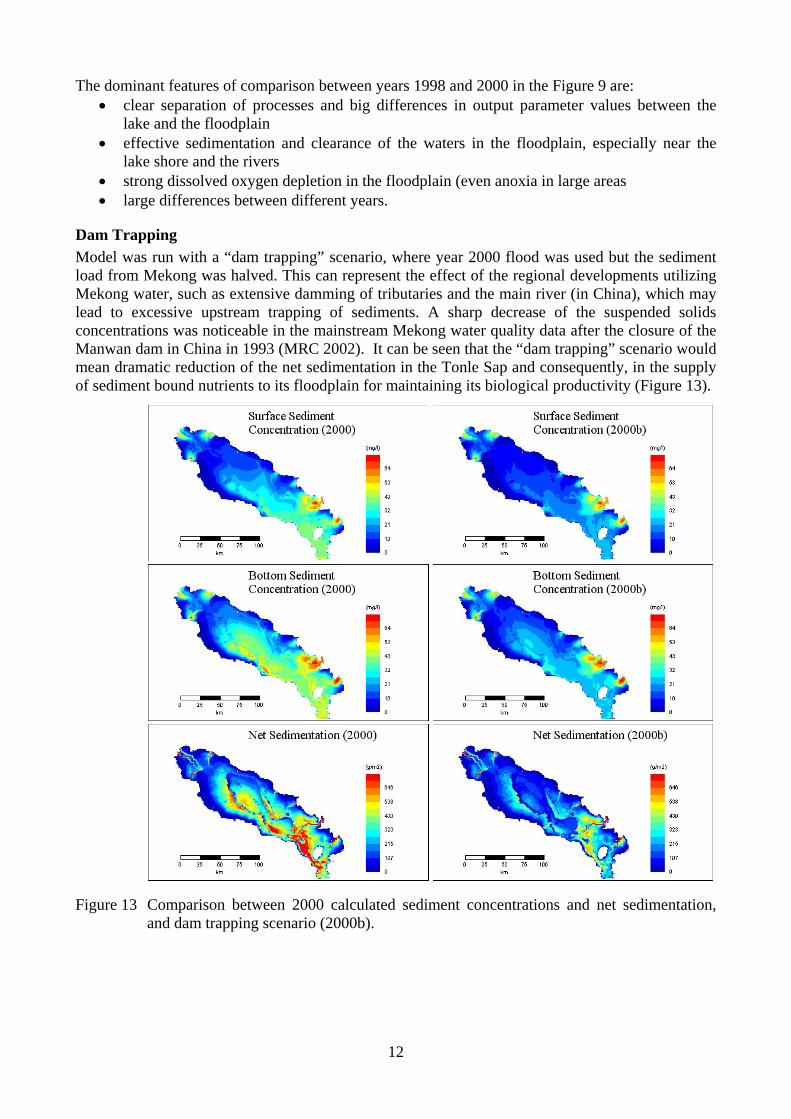
Dam Trapping Model was run with a “dam trapping” scenario, where year 2000 flood was used but the sediment load from Mekong was halved. This can represent the effect of the regional developments utilizing Mekong water, such as extensive damming of tributaries and the main river (in China), which may lead to excessive upstream trapping of sediments. A sharp decrease of the suspended solids concentrations was noticeable in the mainstream Mekong water quality data after the closure of the Manwan dam in China in 1993 (MRC 2002). It can be seen that the “dam trapping” scenario would mean dramatic reduction of the net sedimentation in the Tonle Sap and consequently, in the supply of sediment bound nutrients to its floodplain for maintaining its biological productivity (Figure 13).
Figure 13 Comparison between 2000 calculated sediment concentrations and net sedimentation,
and dam trapping scenario (2000b).
13
DISCUSSION Observations on the bagnet (Dai) fishery for migrating fish in the Tonle Sap River indicate that year-to-year variations in maximum Mekong river flood levels and related Tonle Sap floodplain inundation strongly affect the yield of this fishery, which is dominated by short-lived species. The effect of the variations in the height of the flood on the fish yield and on the average size of some major species were studied in the light of indicators and processes affecting the productivity of the lake, such as sedimentation and floodplain dissolved oxygen conditions. It is hypothesized that sediments carried by the Mekong waters to the Tonle Sap Lake bring in the essential nutrients that feed into the lake’s food webs. The higher the flood the more sediment is brought in. This leads to improved survival and growth of fish and hence of improved fishery yields.
Combined effect of sedimentation, favourable oxygen conditions and drifting of the spawn and larvae form the basic matrix for fish production. Future research should clarify their role so that the critical issues for lake management could be defined more precisely.
Floating rice cultivation has been applied traditionally in the Tonle Sap floodplain. In the recent years floating rice farming has been seriously hampered by high floods and steeply rising water levels. Big part, if not all of the harvest has been destroyed. Floating rice cultivation is important for the poorest population due to its cost-efficiency. On the other hand, as shown by the WUP-FIN model results, natural fertilization by flood waters does not seem to reach the floating rice fields which may partly explain the often claimed nutrient poor soil quality in those areas. A shift towards recession rice as an alternative to cultivate the flooded rice fields might be a safer solution and better guarantee for the harvest. This necessitates infrastructure developments (dams, dikes, channels, ponds) for taking effective use of the flood waters for irrigation and improved productivity.
Areas of high sedimentation rate and favourable oxygen conditions in the floodplain are coinciding. When defining the conditions for an acceptable reverse wet season flow to Tonle Sap, both water quantity and quality impacts need to be taken into account. The Mekong Upstream developments, like construction of dams and reservoirs may lead to significant trapping of sediments and nutrients and reduce the fertility of the Tonle Sap system. An important phosphorus source of the mainly phosphorus limited aquatic ecosystem is the sediment carried by the flood. Any significant changes in the flood regime and the suspended solids concentration may have influence in the productivity of the lake Tonle Sap. However, our present knowledge does not permit quantitative estimation of the effect.

14
REFERENCES Bergström, S. 1995. The HBV model. In Computer Models of Watershed Hydrology, edited by
Singh, V. P. Water Resources Publications, Colorado, U.S.A. pp. 443-476. ISBN 0-918334-91-8.
Bonheur, N. 2001. Tonle Sap Ecosystem and Value, Technical Coordination Unit for Tonle Sap, Ministry of Environment, Phnom Penh, Cambodia. Available online at www.mekoninfo.org.
Carbonnel, J. P., and Guiscafré, J. (1963), Grand Lac du Cambodge: Sedimentologie et Hydrologie, Final Report, Paris.
Furch, K. and Junk W.J. (1997). Physicochemical conditions in the floodplains. In: Junk (ed.) The Central Amazon floodplain. Ecology of a pulsing system. Ecological Studies 126: 69-108.
JICA, 1999. Cambodia Reconnaissance Survey Digital Data. Ministry of Public Works and Transportation (MPWT), Kingdom of Cambodia. Japan International Cooperation Agency (JICA), Japan, March 1999.
Keskinen, M. 2003. The Great Diversity of Livelihoods – Socio-economic survey of the Tonle Sap Lake. WUP-FIN Socio-economic Studies on Tonle Sap 8, MRCS/WUP-FIN, Phnom Penh.
Koponen, J., M. Virtanen, H. Lauri, N. van Zallinge, and J. Sarkkula. 2003. Modelling Tonle Sap Basin for Sustainable Resources Management. (will be published in, The 1st Yellow River Conference, China).
Kummu, M. 2003. The Historical Water Management of Angkor, Cambodia. The Fifth World Archaeological Congress. Washington DC, June 2003.
Lamberts, D. 2001. Tonle Sap Fisheries: A case study on floodplain gillnet fisheries, Asia-Pacific. Fishery Commission, FAO, Bangkok, Thailand.
Lauri, H. and M. Virtanen. 2002. Distributed modelling of lake Tonle Sap catchment. Environmental Software 2002, Eds. C. A. Brebbia et al., WIT Press, Swansea, 7 pages.
Mildenhall, D.C. (1996) Palynology of Holocene and Last Glaciation Samples from Lake Tonle Sap, Cambodia.
MRC 2002. Report on informal donor meeting. Phnom Penh, 28 May 2002. 40 pages.
MRSC/WUP-FIN, 2003. Modelling Tonle Sap Watershed and Lake Processes for Environmental Change Assessment. Model Report. MRCS/WUP-FIN, Phnom Penh, Cambodia. Draft, January 2003.
Penny, D. 2002. Sedimentation rates in the Tonle Sap, Cambodia. Report to the Mekong River Commission.
Tsukawaki, S. (1997). Lithological features of cored sediments from the northern part of The Tonle Sap Lake, Cambodia. In: The International Conference on Stratigraphy and Tectonic Evolution of Southeast Asia and the South Pacific. Bangkok, Thailand, 19-24 August, 1997: 232-239.
Virtanen, M., J. Koponen, and O. Nenonen. 1998. Modelling the systems of three reservoirs, rivers, lakes, coastal area and the sea in northern Finland. International Review of Hydrobiology 83, pp. 705 - 712.