Future Solutions Now - The Tonle Sap Initiative November 2005
12
The Tonle Sap and Mekong Interface The Tonle Sap basin has an area of 85,000 square kilometers (km 2 ), of which 95% lie in Cambodia (5,000 km 2 lie in Thailand). It extends over 44% of Cambodia’s total land area, and is home to 32% of Cambodia’s population, or about 3.6 million people (1998 figure). It constitutes a critical part of the lower Mekong basin: it supplies 6% of the average annual flow of the Mekong but, more significantly, makes up 16% of its dry season flow (thereby helping to control salinity intrusion and conserve mangrove in the Mekong delta). Its greatest contribution to the Mekong basin, however, is undoubtedly its central role in the lower Mekong basin’s overall ecology and, in particular, in sustaining its fisheries. The Mekong boasts of 1,000 fish species (of which a large number is endemic), and a great variety of mollusks, crustaceans, amphibians, reptiles, water birds, and plant species. The Mekong River Commission estimates yearly fish production from the lower Mekong basin at more than 3 million tons, 80% of which come from capture fisheries and the remainder from reservoir fisheries and aquacul- ture. Not surprisingly, fisheries provide livelihoods for 85% of the people there and contribute 50–80% of their animal protein intake, in a region where milk and dairy products are practically nonexistent. Fish are also the main source of dietary calcium. Indeed, with an average consumption of about 55 kilograms (kg) per person per year, The Tonle Sap and Its Fisheries THE TONLE SAP INITIATIVE Future Solutions Now
-
Upload
thechicagoschool -
Category
Documents
-
view
3 -
download
0
Transcript of Future Solutions Now - The Tonle Sap Initiative November 2005

The Tonle Sap and Mekong InterfaceThe Tonle Sap basin has an area of85,000 square kilometers (km2), of which95% lie in Cambodia (5,000 km2 lie inThailand). It extends over 44% ofCambodia’s total land area, and is hometo 32% of Cambodia’s population, orabout 3.6 million people (1998 figure).It constitutes a critical part of the lowerMekong basin: it supplies 6% of theaverage annual flow of the Mekong but,more significantly, makes up 16% of itsdry season flow (thereby helping tocontrol salinity intrusion and conservemangrove in the Mekong delta). Itsgreatest contribution to the Mekongbasin, however, is undoubtedly itscentral role in the lower Mekong basin’soverall ecology and, in particular, insustaining its fisheries.
The Mekong boasts of 1,000 fishspecies (of which a large number isendemic), and a great variety ofmollusks, crustaceans, amphibians,reptiles, water birds, and plant species.The Mekong River Commissionestimates yearly fish production fromthe lower Mekong basin at more than3 million tons, 80% of which come fromcapture fisheries and the remainderfrom reservoir fisheries and aquacul-ture. Not surprisingly, fisheries providelivelihoods for 85% of the people thereand contribute 50–80% of their animalprotein intake, in a region where milkand dairy products are practicallynonexistent. Fish are also the main
source of dietary calcium. Indeed,with an average consumption
of about 55 kilograms (kg) perperson per year,
The Tonle Sapand Its Fisheries
THE TONLE SAP INITIATIVEFuture Solutions Now

and considerably more in the case ofpeople living along riverbanks, commu-nities living in the lower Mekong basinenjoy some of the highest rates of fishconsumption in the world.
The richness of fisheries is a directresult of the seasonal pattern offlooding that facilitates the transfer ofnutrients, sediments, and energy in theriver system and supports one of thehighest levels of aquatic biodiversityin the world. Most fish of the Mekongmigrate seasonally, either laterallybetween the mainstream and flood-plains or longitudinally along themainstream, and the study of fishmigrations has emerged as a key areaof research. The timing of migrations istuned to the annual flood pulse in waysthat vary across species. In general,however, the rise in water levels causesmany fish to move out of dry seasonrefuge habitats toward floodplains,where they feed throughout the rainyseason. Some species spawn on or nearfloodplains, while others spawn inrapids and deep pool systems upstreamat the beginning of the rainy seasonand rely on the current to carry eggsand fry into feeding and rearingfloodplains such as the Tonle Sap.
At the beginning of the rainyseason, the swelling waters of theMekong reverse the flow of the TonleSap River and cause the Tonle Sap toexpand 4–6 times, creating vast areasof flooded forest and floodplains inwhich many fish grow before returningto the Mekong when the waters declinein the dry season.
Land and WaterIn 1998, about 80% of all floodedforests in Cambodia were locatedaround the Tonle Sap.1 The area offlooded forest is however rapidlydeclining. In 1997, satellite imageryrevealed less than 20,000 hectares (ha)of flooded forest, compared with about370,000 ha in 1992 and about 795,000 hain 1985. Although this assessment isbased on different sets of data ofvarying accuracy and levels ofsegregation between forest, shrubs,and brushes, the decline of floodedforest cover sensu stricto is indisput-
The Water Utilization Program-Finland (WUP-FIN) is a flexible consortium centering on the Finnish Environ-ment Institute, the Environmental Impact Assessment Center of Finland, and the Helsinki University ofTechnology. WUP-FIN Phase I (2001–2003) and Phase II (2004–2006) complement the Water UtilizationProgram of the Mekong River Commission (MRC). Phase I created means to understand physical, chemical,and biological processes in the Tonle Sap. Phase II aims to expand the experience to other subbasins in theGreater Mekong Subregion. It focuses on integrating hydrodynamic and socioeconomic data, tools, andresults into the Commission’s decision support framework, training associated staff members of theCommission and the national Mekong committees, estimating environmental and socioeconomic impacts ofdevelopment projects, and devising ways to mitigate harmful effects.
The changing dimensions of the Tonle Sap
Land use in the Tonle Sap’s floodplains, 1999

ably alarming. It owes mainly to ricecultivation and fuel wood collection.
A recent study2 of the Tonle Sap’swater balance established that Mekongflow, Tonle Sap basin runoff, andoverland flow from the Mekongthrough the bridges of the KompongCham road represent 50%, 40%, and10%, respectively, of the Tonle Sap’stotal annual inflow.
Many believe that the clearance ofthe flooded forest for rice cultivation
and for firewood has increased sedi-mentation. However, a new study hasdetermined that average sedimentationis limited to 0.1–0.9 millimeters per year.3This means a maximum accumulation of4 centimeters in the past 40 years. Thissuggests that the Tonle Sap is notfilling up since net sedimentation in thelake is almost nil. Settling andresuspension appear to be in balance,as suggested too by an early study.4
However, these findings relate to themain water body and sedimentation canbe relatively high at the mouth of theTonle Sap’s 12 tributaries and at SnocTrou.
PopulationThe population of the Tonle Sapnumbers 1.18 million inhabitants andcan be detailed by altitudinal level,which determines inundation, landcover, and dominant occupation.5
The total population is lower thanthat identified in 1995 (1.2 million
Area and population by altitudinal level, 2003
Zone 4Zone 1 Zone 2 Zone 3 10 meters up to Zone 5
Altitude 0–6 meters 6–8 meters 8–10 meters Highways 5 and 6 urban All zones
Area [square kilometer (km2)] 8,531 2,407 2,292 1,574 73 14,876Villages 88 82 313 554 121 1,158Households 14,674 10,516 53,267 88,444 52,720 219,621Population 84,742 56,690 283,104 470,196 291,460 1,186,192Population density
(persons/km2) 10 24 124 299 4,017 80Average village size 963 691 904 849 2,409 1,024Average household size 5.8 5.4 5.3 5.3 5.5 5.4Source: 2003. Keskinen.
Types of land and water resources that support inland fisheries inCambodia (hectares)
Natural resource 1985/87 1992/93
Permanent water 567,100 411,100Flooded forest 795,400 370,700Flooded secondary forest 28,200 259,800Flooded grassland 80,800 84,900Receding and floating rice fields 17,500 29,300Seasonally flooded crop fields 366,800 529,900Swamp 12,200 1,400
Total 1,868,000 1,687,100Source: 1998. Ahmed et al.
Basic demographic indicators,2003
Age range Percentage
0–4 years 12.70–19 years 55.920–39 years 25.840–59 years 13.360+ years 5.0Females 52.0Literacy 52.9Source: 2003. Keskinen.

SedimentationThe Mekong River is responsible forabout 75% of the sediments deliveredto the Tonle Sap, based on measure-ments taken by the Mekong RiverCommission at Prek Kdam on the TonleSap River during 1996–2002 andmeasurements of suspended sedimentstaken by the Water Utilization Program-Finland (WUP-FIN) from tributariesduring 2001–2003. The average flux ofsuspended sediments into the Tonle Sapfrom the Mekong River and the TonleSap’s tributaries is 7 million tons and 2million tons, respectively. The outflowfrom the lake is only 1.6 million tons.Thus, more than 80% of the sedimentsthe system receives from the MekongRiver and the Tonle Sap’s tributaries isstored in the Tonle Sap’s floodplains.
It is often claimed, as a result, thatthe Tonle Sap is filling up. However,rapid rates of infilling of the dry seasonlake area have not been demonstratedand recent studies show that netsedimentation there has been in therange of 0.1–0.16 millimeters perannum for the last 5,500 years.This means an accumulation of only0.5–0.7 m of sediments in the lake sincethe middle of the Holocene period. Thisdata and WUP-FIN model-based resultsindicate that the rate of sedimentaccumulation in the dry season lakearea is low and that it is not acceleratingwith respect to the long-term sedimentdynamics of the system. (The sedimentsthat are deposited in the floodplains arepartly used by the ecosystem and partlystay there.) However, even though theoverall net sedimentation within theTonle Sap is not an immediate problem,there are many instances of localproblems associated with high sedi-mentation and erosion rates. Most ofthe villages around the lake are locatedclose to the lake’s tributaries and thesituation there calls for investigations.
Source: 2005. WUP-FIN.
Simulated net sedimentation, 1997
Simulated net sedimentation, 1998
Simulated net sedimentation, 2000

Average bottom layer dissolved oxygen concentration, 1997
Average bottom layer dissolved oxygen concentration, 1998
Average bottom layer dissolved oxygen concentration, 2000
OxygenationThe Tonle Sap’s water is well oxygen-ated during the dry season, thanks towind mixing. In the rainy season,however, its floodplains are character-ized by large-scale anoxia, except nearthe surface. This is caused by the decayof organic material.6 Thus, duringseveral weeks each year, the Tonle Sap’sfloodplains are covered with waterwhose oxygen content is close to zero,and are therefore not accessible to mostfish species. The implications of thislarge-scale phenomenon, not least ofall vis-à-vis fish production, are not yetunderstood.
The Changing Dimensionsof the Tonle SapIn the dry season, the Tonle Sapis 160 kilometers (km) long and35 km wide, has a depth of 1–2meters (m), and extends over2,500–3,000 square kilometers(km2). In the rainy season, theTonle Sap is 250 km long and 100km wide, has a depth of 8–11 m,and extends over 15,000–16,000km2. Its area is more or less equalto that of Lake Ontario. It is twicethat of Lake Titicaca and 25 timesthat of Lake Geneva.
The Character of Floodson the Tonle Sap1997 was an average flood yearand the maximum water level ofthe Tonle Sap reached 9.4 meters(m) above mean sea level (amsl).(The maximum level of water in thelake averaged 9.0 m amsl between1996 and 2003.) In contrast, 1998was a dry year and the water levelin the lake peaked at only 6.8 mamsl. In further contrast, the waterlevel in the lake peaked at 10.3 mamsl in 2000, when record floodsinundated more than 50% ofCambodia. And so the lake’svolume varied from 35 km3 in1998 to 75 km3 in 2000. Theflooded area varied from 8,100 km2
to 12,400 km2 in the same years.
inhabitants in 1995 in fishingcommunes around the Tonle Sap);indeed a negative migration rate of1–6% has been experienced7 in all theprovinces bordering the lake (exceptKompong Chhnang). The reasonsgiven are the decreasing fish catch,drought, irregular rain or flood thatimpact rice yields, and increasedsedimentation in rivers that degradeswater quality.
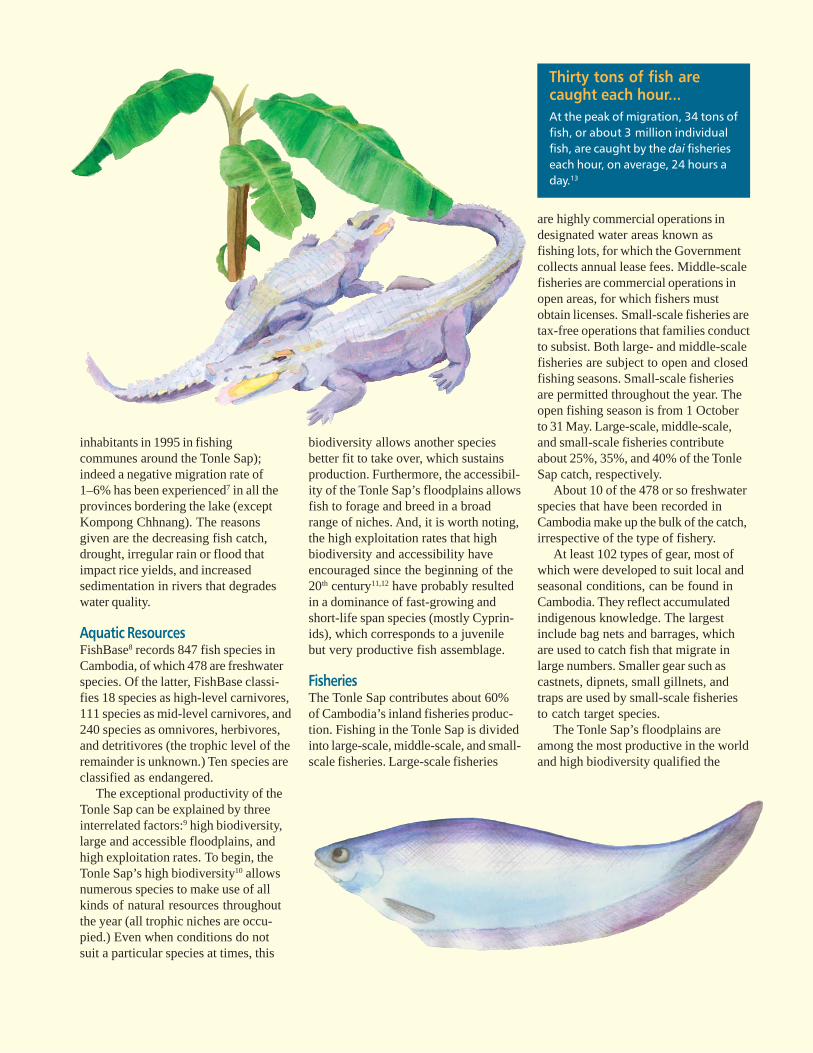
Aquatic ResourcesFishBase8 records 847 fish species inCambodia, of which 478 are freshwaterspecies. Of the latter, FishBase classi-fies 18 species as high-level carnivores,111 species as mid-level carnivores, and240 species as omnivores, herbivores,and detritivores (the trophic level of theremainder is unknown.) Ten species areclassified as endangered.
The exceptional productivity of theTonle Sap can be explained by threeinterrelated factors:9 high biodiversity,large and accessible floodplains, andhigh exploitation rates. To begin, theTonle Sap’s high biodiversity10 allowsnumerous species to make use of allkinds of natural resources throughoutthe year (all trophic niches are occu-pied.) Even when conditions do notsuit a particular species at times, this
biodiversity allows another speciesbetter fit to take over, which sustainsproduction. Furthermore, the accessibil-ity of the Tonle Sap’s floodplains allowsfish to forage and breed in a broadrange of niches. And, it is worth noting,the high exploitation rates that highbiodiversity and accessibility haveencouraged since the beginning of the20th century11,12 have probably resultedin a dominance of fast-growing andshort-life span species (mostly Cyprin-ids), which corresponds to a juvenilebut very productive fish assemblage.
FisheriesThe Tonle Sap contributes about 60%of Cambodia’s inland fisheries produc-tion. Fishing in the Tonle Sap is dividedinto large-scale, middle-scale, and small-scale fisheries. Large-scale fisheries
are highly commercial operations indesignated water areas known asfishing lots, for which the Governmentcollects annual lease fees. Middle-scalefisheries are commercial operations inopen areas, for which fishers mustobtain licenses. Small-scale fisheries aretax-free operations that families conductto subsist. Both large- and middle-scalefisheries are subject to open and closedfishing seasons. Small-scale fisheriesare permitted throughout the year. Theopen fishing season is from 1 Octoberto 31 May. Large-scale, middle-scale,and small-scale fisheries contributeabout 25%, 35%, and 40% of the TonleSap catch, respectively.
About 10 of the 478 or so freshwaterspecies that have been recorded inCambodia make up the bulk of the catch,irrespective of the type of fishery.
At least 102 types of gear, most ofwhich were developed to suit local andseasonal conditions, can be found inCambodia. They reflect accumulatedindigenous knowledge. The largestinclude bag nets and barrages, whichare used to catch fish that migrate inlarge numbers. Smaller gear such ascastnets, dipnets, small gillnets, andtraps are used by small-scale fisheriesto catch target species.
The Tonle Sap’s floodplains areamong the most productive in the worldand high biodiversity qualified the
Thirty tons of fish arecaught each hour...At the peak of migration, 34 tons offish, or about 3 million individualfish, are caught by the dai fisherieseach hour, on average, 24 hours aday.13

Tonle Sap ecosystem as a biospherereserve in 1997. The fishery resourcesof the Tonle Sap rank first in the worldfor their productivity and fourth fortheir total catch despite the small sizeof the country. Their contribution toincome, employment, and food securityis higher than in any other country.With rising demand for high-valuefreshwater fish in Thailand and VietNam, inland fisheries are becoming asignificant source of foreign exchange.
Total catch in the Tonle Sap areaincreased by 46% between the 1940sand 1995.14 However, the size of thepopulation has tripled in the meanwhileand thus catch per fisher has declinedfrom 347 kg to 192 kg per person peryear.
A recurring claim is that fish catchis now close to a maximum and containsan increasing share of small fish, fewermedium-sized fish, and only rarely largefishes. While this hypothesis isimpossible to test in the absence oflong-term fish length monitoringprograms, it is consistent with thecomments that all fishers make. Achange in the composition of speciesis a common trend in heavily exploitedfisheries.
Livelihoods and NutritionFisheries play an important role in rurallivelihoods:15 they diversify livelihoodactivities and thereby insure against therisk of agricultural failures; they provideeasy access to income generatingactivities with very little capital invest-ment and no land; and they play a vitalrole in food security, maintaining andimproving nutrition. Because of theopen access nature of fishery re-sources, and because fishing typicallydoes not require land ownership, itoften becomes the employer of last
resort, attracting people who have noother means of subsistence. In terms ofnumbers, fishing and fishing-relatedactivities are the primary source ofemployment for 17% of rural house-holds, a part-time income generatingactivity for almost 30% of rural house-holds, and key to the livelihoods ofover 90% of rural households.
Fish cannot easily be replaced in thediet of Cambodians. It provides about75% of the animal protein requirementsof households. In 1995/96, in fishinghouseholds, the average fresh fishconsumption per capita (based onweekly consumption) amounted to 43.5kg per year; adding up processed fish(equivalent to 32.1 kg of fresh fish perperson and per year) resulted in a totalfish consumption of 75.6 kg per personper year. In comparison, consumptionof other animal proteins from chicken,pork, beef, and duck reached 8 kg perperson per year. In 2002, the averageconsumption of prahoc (fermented fishpaste) amounted to 62 kg per house-hold, or 10.1 kg per person18. The costof prahoc was $0.09 per kg, whereaslow quality pork was worth $1–2 per kg.Its cost also rose by 60% from 2001 to2003 due to low fish catch. If similarrises follow food security for manyCambodians could be severely threat-ened as no substitute for prahoc exists.Small fish, which may be of littlecommercial value, provide dietarycalcium, other essential minerals suchas iron and zinc, and vitamins as theirsoft bones are chewed and eaten. Otheraquatic organisms such as shrimps,crabs, mollusks, and frogs also supple-ment fish. This latter component of thediet of rural Cambodians has beenestimated at 4.5–5.2 kg per person peryear.19
...but the catchper fisher isdeclining
Fish yields inthe Tonle Sap’sfloodplains areexceptionallyhigh
The Productivity of the Tonle SapThe Amazon and the Congo have very high biodiversity and accessiblefloodplains but are characterized by low exploitation rates. The Brahmaputrahas high biodiversity, very high exploitation rates, but often poorly accessiblefloodplains. Large European rivers display low biodiversity and no longer haveaccessible floodplains. The Tonle Sap combines high biodiversity, large andaccessible floodplains, and high exploitation rates.

Species composition and value of commercial inlandfisheries, 1995/9616
Scientific name Total catch Total value Type(%) (%) of fish
Henicorhynchus spp. 21 9 CyprinidChanna micropeltes 9 19 SnakeheadCyclocheilichthys enoplos 9 8 CyprinidDangila spp. 6 2 CyprinidOsteochilus spp. 4 2 CyprinidCirrhinus microlepis 3 4 CyprinidPangasius spp. 3 3 CatfishBarbodes goniontus 3 2 CyprinidParalaubuca typus 3 1 CyprinidChanna striata 2 6 Snakehead
Weight of 10 species 63 56Source: 2001. Lieng and van Zalinge.
Comparison of floodplain fish yield estimatesfrom various countries (kilograms/hectare/year)16
Location Fish yield
Tonle Sap floodplains 139–230Amazonian floodplains 24Nam Ngum Reservoir, Lao PDR 40–173Bangladeshi natural floodplains 104–130Bangladeshi modified floodplains 51–81Indonesian floodplains 72–118Thai floodplains 25–52Source: 2001. Lieng and van Zalinge.
Catch per fisher over time in the Tonle Sap area13
Population Fishing Catch of Catch of Catch perTonle Sap in Cambodia community subsistence rice field Overall fisher
production (million (Tonle Sap fisheries fisheries catch (kilograms/Period (tons) habitants) area, million) (tons) (tons) (tons) person/year)
1940s 100,000 3.2 0.36 21,500 3,900 125,000 3471970s 85,000 6.3 0.71 42,300 7,700 135,000 1901990s 145,600 10.7 1.20 71,500 12,900 230,000 192Source: 2001. Baran et al.
Estimated annual inland fish catch in the Tonle Sap and in Cambodia, 1994–1997 (tons)16, 17
Annual catch Share of the Tonle SapType of fishery Tonle Sap Cambodia in national production (%)
Large-scale
Fishing lot 25,000–75,000 25,000–75,000 100Dai (bag net) 9,000–16,000 14,000–16,000 64–100
Middle-scale 65,400 85,000–100,000 65–77Small-scale 73,600 115,000–140,000 53–64Rice field 6,500–16,000 50,000–100,000 13–16
Total 179,500–246,000 289,000–431,000 57–62Source: Tonle Sap: 2001. Lieng and van Zalinge. Cambodia: 2000. van Zalinge et al.

ConclusionsThe fisheries of the Tonle Sap are ofvital importance in terms of livelihoodsand food security. They provide theonly insurance against catastrophe andtheir sustainable management isintimately linked to the quality of life ofmillions of people.
The fisheries of the Tonle Sap faceunprecedented challenges.Overexploitation is a serious threat,given population and developmentpressures, and this problem is exacer-bated by loose management and policyenforcement, as well as the paucity ofresearch initiatives. At the same time,development of built structures such asdams, roads, weirs, and flood controlworks modifies flows. This impacts fishmigrations, fragments habitats, andultimately threatens all aquatic re-sources and those who live from them.
Given the importance of the TonleSap and its fisheries to vast andgrowing numbers of poor people, keyactions to secure sustainable liveli-hoods include, in no order of impor-tance:• Shifting the focus from fish produc-
tion to putting people first.• Assessing better the value of
aquatic resources and reflecting it inmarkets.
• Improving trade policies for aquaticresources, with special attention totransactions in fresh fish andprahoc.
• Developing and orienting demand-driven research that bridges commu-nities and policy makers.
• Enhancing the role of women ininland fisheries.
• Controlling the harvesting effort.• Driving, coordinating, and streamlin-
ing infrastructure development andnatural resource management in theTonle Sap basin through integratedbasin planning and management.
• Formulating approaches, methods,and processes so that the design,number, and operation of builtstructures in the Tonle Sap’sfloodplains maximize economicreturns from investment withoutimpacting the environment or thecommunities that depend on theTonle Sap.
• Promoting and developing anaquaculture sector that is indepen-dent from capture fish supply.
• Diversifying livelihood opportuni-ties.
• Improving the regulatory frameworkfor water, land, and biotic resources.
• Endorsing the Code of Conduct forResponsible Fisheries.
• Practicing the tenets of biospherereserve zonation.Any of these key actions, effectively
implemented, would go a long waytoward securing the future of the mostintense fishery in the world and thefood security needs of very poorpeople both in the Tonle Sap basin andin its Mekong interface.
References1 Ahmed, M.; Navy, H.; Vuthy, L.; and
Tiongco, M. 1998. SocioeconomicAssessment of Freshwater CaptureFisheries in Cambodia: Report on aHousehold Survey. Phnom Penh:Mekong River Commission.
2 MRC/WUP-JICA. 2004. Study onNatural Reverse Flow in the Tonle SapRiver. Phnom Penh: DHI.
3 Kummu, M.; Koponen, J.; andSarkkula, J. 2005. Modeling SedimentTransportation in Tonle Sap Lake forImpact Assessment. Proceedings ofthe 2005 International Conference onSimulation and Modeling.SimMod’05. Bangkok.
4 Carbonnel, J. P. and Guiscafré, J. 1963.Le Grand Lac du Cambodge:Sédimentologie et Hydrologie.Muséum National d’Histoire Naturellede Paris.
10 Puy, L.; Sovan, L.; Touch, S.; Sam OnnMao; and Borin, C. 1999. Diversityand Spatial Distribution of FreshwaterFish in the Great Lake and Tonle SapRiver (Cambodia, Southeast Asia).Aquatic Living Resources 6, 12.
11 Petillot, L. 1911. La Pêche et lesPoissons. Une Richesse du Cambodge.Augustin Challamel Ed. LibrairieMaritime et Coloniale.
12 Chevey, P. 1934. La Pêche au GrandLac du Cambodge. Publication de laSociété des Etudes Indochinoises.Saigon.
13 Baran, E.; Van Zalinge, N.; Ngor PengBun; Baird, I.G.; and Coates, D. 2001.Fish Resource And HydrobiologicalModelling Approaches in the MekongBasin. ICLARM, Penang, Malaysia andthe Mekong River CommissionSecretariat, Phnom Penh.
5 Keskinen, M. 2003. The GreatDiversity of Livelihoods? Socio-Economic Survey of the Tonle SapLake. WUP-FIN Socio-economicStudies on the Tonle Sap Nº8, MRC/WUP-FIN, Phnom Penh.
6 Koponen, J.; Sarkkula, J.; Keskinen, M.;Varis, O.; Hellsten, S.; Järvenpää, E.;and Dubrovin, T. 2003. Tonle SapDevelopment Scenario Impacts andGuidelines. Water Utilization Pro-gram—Modeling of the Flow Regimeand Water Quality of the Tonle Sap.MRC/WUP-FIN, Phnom Penh.
7 Haapala, U. 2003. Where Do You Go?Migration and Urbanization inCambodia. WUP-FIN Socio-economicStudies on the Tonle Sap Nº9. MRC/WUP-FIN, Phnom Penh.
8 FishBase. 2005. Available:www.fishbase.org.
9 Baran, E. 2005. Cambodian InlandFisheries: Facts, Figures And Context.WorldFish Center and Inland FisheriesResearch and Development Institute,Phnom Penh.

14 Baran, E.; Van Zalinge, N.; and NgorPeng Bun. 2001. Floods, Floodplainsand Fish Production in the MekongBasin: Present and Past Trends.
15 McKenney, B. and Tola, P. 2002.Natural Resources and Rural Liveli-hoods in Cambodia: a BaselineAssessment. Cambodian Develop-ment Resource Institute, WorkingPaper 23.
16 Lieng Sopha and Van Zalinge, N.2001. Fish Yield Estimation in theFloodplains of the Tonle Sap GreatLake and River, Cambodia. In: IFREDI(ed.) Cambodia Fisheries TechnicalPaper Series,Vol. III. MRC and Depart-ment of Fisheries, Phnom Penh.
Acknowledgments
This brochure draws on: Baran, E.2005. Cambodian Inland Fisheries:Facts, Figures And Context.WorldFish Center and InlandFisheries Research and Develop-ment Institute, Phnom Penh,Cambodia.
The maps in this brochure wereprepared by Matti Kummu. Thewatercolors are reproduced bykind permission of María VictoriaCaramés, an animation artist. Herhobbies include traveling andpainting. She can be contacted [email protected].
Eric Baran and Keech Hidalgohelped design this brochure.
17 Van Zalinge, N.; NaoThuok;TouchSeangTana; and Deap Loeung. 2000.Where There is Water, There is Fish?Cambodian Fisheries Issues in aMekong River Basin Perspective. In:Ahmed M. and Hirsch P. (eds.)Common Property in the Mekong:Issues of Sustainability and Subsis-tence. ICLARM Studies and Reviews26.
18 McKenney, B. and Tola, P. 2004.Prahoc and Food Security: anAssessment of the Dai Fisheries.Cambodia Development Review, Vol.8 (1), Phnom Penh: CDRI.
19 Hortle, K.G.; Lieng, S.; and Valbo-Jorgensen, J. 2004. An Introduction toCambodia’s Inland Fisheries. MekongDevelopment Series No. 4. Vientiane:Mekong River Commission.

For more information on the Tonle Sap Initiative, contact
Urooj Malik, DirectorOlivier Serrat, Senior Project Economist
Agriculture, Environment, and Natural Resources DivisionMekong DepartmentAsian Development Bank6 ADB Avenue, Mandaluyong City1550 Metro Manila, PhilippinesTel +63 2 632 6175Fax +63 2 636 [email protected]/Projects/Tonle_Sap/
Shyam Bajpai, Country DirectorPaulin Van Im, Project Implementation/Program Officer
Cambodia Resident Mission93/95 Norodom Boulevard, Sangkat Boeung RaingKhan Daun Penh, Phnom Penh, CambodiaP.O. Box 2436Tel +855 23 215805, 215806, 216417Fax +855 23 [email protected]/CARM November 2005
© 2005 Asian Development Bank
This publication was prepared by staff and consultantsof the Asian Development Bank. The analyses andassessments contained herein do not necessarily reflectthe views of the Asian Development Bank, or its Board ofDirectors, or the governments its members represent.The Asian Development Bank does not guarantee theaccuracy of the data included in this publication andaccepts no responsibility for any consequences of theiruse.