Economics Development Analysis Journal
14
484 Economics Development Analysis Journal Vol (4) (2021) Economics Development Analysis Journal http://journal.unnes.ac.id/sju/index.php/edaj Strategic Planning Analysis of Grand Design of Population Development Andjar Prasetyo 1 , 2 Dewi Gartika 1 Research and Development Agency – Magelang City, Indonesia 2 Research and Development Agency – West Java, Indonesia Article Information ________________ History of Article Received July 2021 Accepted September 2021 Pusblished November 2021 ________________ Keywords: Strategic, Planning, Grand Design, Population, Development.. __________________ Abstract _________________________________________________________________ The purpose of this study is to identify and analyze population data based on population structure and five population aspects, as well as regional areas in Kebumen Regency in 2020. Then prepare recommendations and plans to integrate population problems into development planning mechanisms and develop a 2020 Population Grand Design Model. The method of analysis used quantitative and qualitative descriptions with a locular in Kebumen Regency. The research was conducted using secondary data sources from the Central Bureau of Statistics of Kebumen Regency, the Department of Social Affairs and Population Control and Family Planning in Kebumen, the Ministry of Education and Culture. Primary data comes from the results of discussions with the Head of Service and structural officials at the Department of Social Affairs and Population Control and Family Planning in Kebumen, the results of the discussion become one of the qualitative indicators for analysis. The analysis was mainly carried out using SWOT and to complement the ARIMA method. The results are based on an administrative and substantive approach with the integration of five population aspects, namely Population Quantity Control, Population Quality Improvement, Population Mobility Direction, Family Development and Population Database Development, which are expected in the form of regional regulations. © 2021, Universitas Negeri Semarang Corresponding author : Address: Research and Development Agency – Magelang City, Indoensia E-mail: [email protected]. ISSN 2252-6560
-
Upload
khangminh22 -
Category
Documents
-
view
1 -
download
0
Transcript of Economics Development Analysis Journal
484
Economics Development Analysis Journal Vol (4) (2021)
Economics Development Analysis Journal
http://journal.unnes.ac.id/sju/index.php/edaj
Strategic Planning Analysis of Grand Design of Population Development
Andjar Prasetyo1 , 2Dewi Gartika 1Research and Development Agency – Magelang City, Indonesia 2Research and Development Agency – West Java, Indonesia
Article Information
________________ History of Article
Received July 2021
Accepted September 2021
Pusblished November 2021
________________ Keywords:
Strategic, Planning, Grand
Design, Population,
Development..
__________________
Abstract
_________________________________________________________________ The purpose of this study is to identify and analyze population data based on population structure
and five population aspects, as well as regional areas in Kebumen Regency in 2020. Then prepare
recommendations and plans to integrate population problems into development planning
mechanisms and develop a 2020 Population Grand Design Model. The method of analysis used
quantitative and qualitative descriptions with a locular in Kebumen Regency. The research was
conducted using secondary data sources from the Central Bureau of Statistics of Kebumen
Regency, the Department of Social Affairs and Population Control and Family Planning in
Kebumen, the Ministry of Education and Culture. Primary data comes from the results of
discussions with the Head of Service and structural officials at the Department of Social Affairs
and Population Control and Family Planning in Kebumen, the results of the discussion become
one of the qualitative indicators for analysis. The analysis was mainly carried out using SWOT
and to complement the ARIMA method. The results are based on an administrative and
substantive approach with the integration of five population aspects, namely Population Quantity
Control, Population Quality Improvement, Population Mobility Direction, Family Development
and Population Database Development, which are expected in the form of regional regulations.
© 2021, Universitas Negeri Semarang
Corresponding author :
Address: Research and Development Agency – Magelang City, Indoensia
E-mail: [email protected].
ISSN 2252-6560
Andjar Prasetyo / Economics Development Analysis Journal Vol (4) (2022)
485
INTRODUCTION
The implementation of population policy
in Kebumen regency until now has not been
maximal, especially when viewed in terms of
population quantity. This can be seen from the
rate of population growth in Kebumen Regency
which still reaches 2.87% or 33,386 people during
the period 2010-2018, where in 2016 the
population of Kebumen reached 1,161,706 and
in 2018 the population of Kebumen Regency has
reached 1,195,092 people sourced from BPS
Kebumen Regency. In addition, the total birth
rate or Total Fertility Rate (TFR) is still more
than 2.1% which means it has not been directed
or controlled optimally. Another strategic issue
related to the development of population
quantity in Kebumen regency is the change in
population composition, especially according to
age (see : (Ariteja, 2017); (Azhar, Badriah and
Bambang, 2020); (Yunistria, 2020). With the
trend of changing population composition
according to age in the past, it is estimated that
Kebumen district does not get windows of
opportunity, so that if the management of
population quantity, especially fertility, is carried
out in earnest, then Kebumen Regency needs to
accelerate the achievement of development goals
in Kebumen. In addition, indicators that are
generally used are still not maximally in
accordance with the expected development
results. Another population problem faced by
Kebumen Regency is the problem of inequality of
population distribution between regions and
population mobility. The number of kebumen
population that continues to increase quite
rapidly every year is also inseparable from the
role of migration both outgoing migration and
especially in-out migration.
In addition to quantity and mobility
problems, the population conditions faced by
Kebumen District become more complex
because they are also faced with problems of
population quality (especially in the fields of
education, health, welfare, and economic
equality). This can be seen in the achievement of
population quality indicators using the Human
Development Index (HDI). Although from year
to year the achievement of HDI Kebumen
increased even though it is still below central Java
Province, but the increase is seen to be slow.
During the 5-year period from 2014 - 2018, HDI
Kebumen only increased by an average of 1.17
per year, thus requiring an effective acceleration
strategy to achieve better HDI.
To overcome population management in
Kebumen and various problems that may arise
due to uncontrolled population growth, a
reference is needed for population development
in Kebumen, especially the general policy and
strategy direction contained in the Master Plan or
Grand Design of District Population
Development (GDPD) Kebumen Year 2020 -
2055 with clear, directed and precise indicators.
This plan is a follow-up or operationalization of
Law No. 52 of 2009 on Population Development
and Family Development, Law No. 23 of 2014
on Local Government, Presidential Regulation
No. 153 of 2014 on Grand Design of National
Population Development.
As an effort to carry out the preparation of
the GDPD, at least a team can be formed through
the Regent's Decree on the Establishment of a
Coordination Team for the Implementation of
Population Development of GDPD of Kebumen
Regency in 2020-2045. The coordination team
consists of five working groups to develop the
GDPD, each of which is responsible for drawing
up a grand design including a population
development roadmap in accordance with its
field. The five working groups are as follows: 1)
Working Group on Population Quantity Control
(Working Group I); 2) Working Group on
Improving Population Quality (Working Group
II); 3) Working Group on Distribution
Arrangement and Population Mobility
Arrangement (Working Group III); 4) Working
Group on Family Development (Working Group
IV); and 5) Working Group on Population
Database Development (Working Group V).
In the search for references related to the
study of The GDPD, scientific publications have
not been found much but the results of the
preparation of the GDPD have been widely
carried out by several regions in Indonesia, for
example Karanganyar Regency which has been
Andjar Prasetyo / Economics Development Analysis Journal Vol (4) (2022)
486
liquidated in the form of Regional Regulation
No. 6 of 2019 on Population Control and Family
Development that has been ratified on February
6, 2019. Furthermore, in Wonogiri Regency that
has been done since 2013 with the results of the
GDPD Quantity Control Wonogiri Year 2010-
2035. GDPD of Lampung Province in order to
provide a frame of thought and guidance to
integrate various population variables into
various development processes, harmonization
between population dynamics and other
socioeconomic conditions dynamics and help
strengthen the preparation and implementation
of development planning in Lampung Province.
With the drafting of the GDPD of Lampung
Province, it is expected to improve the political
will and commitment of the local government to
the population as well as be able to increase the
concern of policy makers on the link between
population issues and development.
This Master Plan is a policy direction in
the five-year stage of population development of
Kebumen Regency by looking at the
achievement target until 2045. Therefore, in this
document also listed a roadmap containing the
necessary policies for every five years until 2045,
so that a clear picture can be obtained with regard
to the efforts that need to be taken by each
sectoral institutions in term of supporting the
implementation of population development in
Kebumen District. It is expected that by using
these references, the resulting master plan is a
comprehensive, accommodating, and structured
document. Preliminary Study of The GDPD
with the following objectives; first, Identification
and analysis of population data based on the
structure and five aspects of population
incluiding: (Population Quantity Control,
Population Quality Improvement, Population
Mobility Direction, Family Development and
Population Data Base Development), as well as
regional areas in Kebumen Regency; second,
Preparation of recommendations and plans for
integrating integrated populations issues into the
development planning mechanism; and the last is
Preparation of Population Grand Design model.
RESEARCH METHODS
This study identifies and analyzes
qualitatively derived from the results of
interactions with population data managers
which are then narrated in the results of the
analysis. Quantitative population data is also
used in describing data based on the structure and
five aspects of population (Population Quantity
Control, Population Quality Improvement,
Population Mobility Direction, Family
Development and Population Base Data
Development), as well as regional areas in
Kebumen Regency. Furthermore, the
preparation of recommendations and plans for
the integration of population issues into the
mechanism of development planning and the
preparation of the Model GDPD. The study is
described with the results of population
identification and analysis. Secondary data
sources come from:
Central Statistics Agency (CSA) of
Kebumen Regency in the form of Population
data, Perkapita Income, Human Development
Index Kebumen Regency. Social Services and
Population Control & Family Planning
Kebumen in the form of Family Planning Data
and Integrated Data on Social Welfare.
Ministry of Education and Culture in the
form of Data Rough Participation Figures and
Pure Participation Figures Kebumen Regency.
The Primary data in this study are the
results of interviews with the Head of Service and
structural officials in the Social Service and
Population Control & Family Planning
Kebumen, the results of the discussion became
one of the qualitative indicators for analysis.
Data and information collection techniques in
this study using library study techniques and
documentation focus on five aspects of
population (Population Quantity Control,
Population Quality Improvement, Population
Mobility Direction, Family Development and
Population Data Base Development). The
SWOT calculation scale is broken down by
adjusting the existing quadrant. In each quadrant
is given indicators with different quantities to
sharpen the analysis. The four quadrants are then
Andjar Prasetyo / Economics Development Analysis Journal Vol (4) (2022)
487
made into one in the baseline quadrant to see the
overall quadrant result. The data obtained were
analyzed using SWOT with instruments in each
quadrant which were then described. This data
analysis can be used by relevant policy makers in
the future. Tools used in quantitative data
analysis techniques in the form of ARIMA. The
ARIMA model is a model that completely
ignores independent variables in making
forecasting. ARIMA uses past and present values
from dependent variables to produce accurate
short-term forecasting. ARIMA is suitable if
observations fromtime seriesare statistically
related to each other (dependent), which is used
to project some analyzed data. ARIMA is often
also called the Box-Jenkins time-running method
with very good accuracy for the short-term short
term refer from (Djoni, 2011), this model is used
to Per Capita Expenditure of Kebumen Regency
year 2010-2018 and ForecastIng Results of Per
Capita Expenditure of Kebumen Regency year
2019-2030.
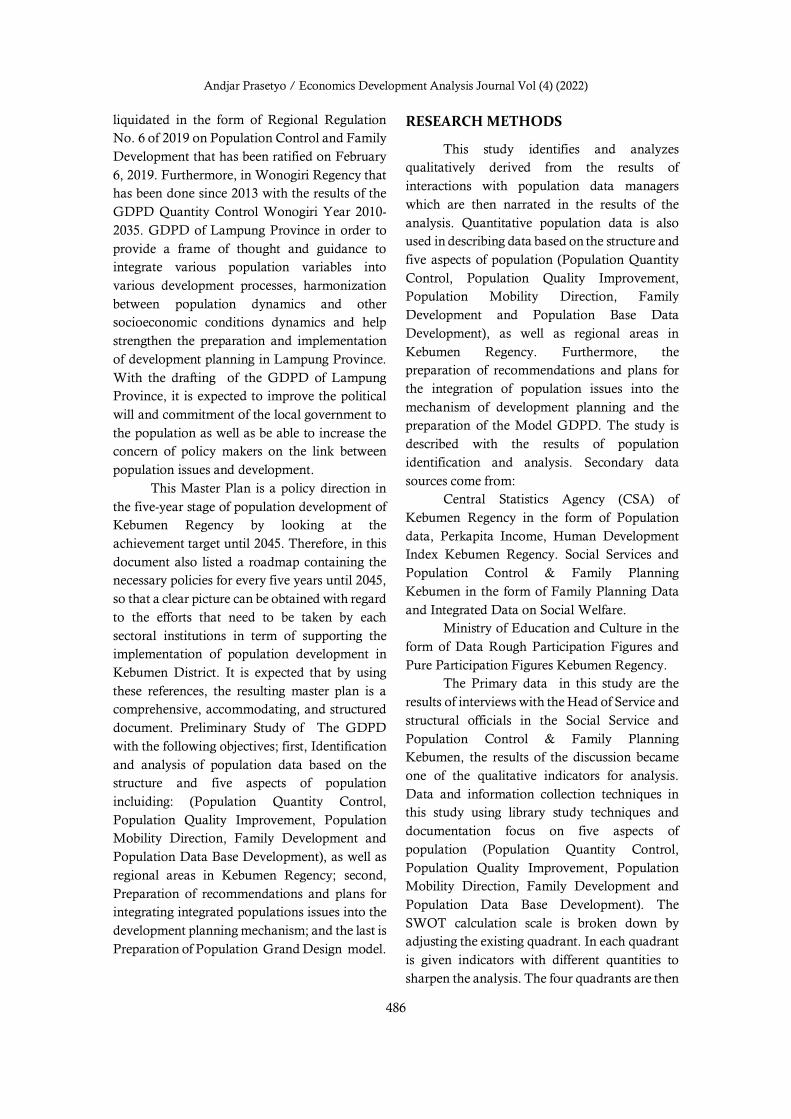
GDPD is a formulation document of
regional population development planning for
the next 25 years and described every 5 years,
which contains about the tendency of population
parameters, important issues of population and
population development programs that include
population quantity control, population quality
improvement, distribution arrangement and
population mobility arrangement, family
development and development of database
management and population information.
Figure 1. The Framework of GDPD Source: Primary Data Processed, 2021
GDPD is an integral part of national
development and District Regional
Development. Therefore, the GDPD is prepared
based on the ideals of the community in
achieving its welfare with indicators of improving
the Human Development Index through the
development of education, health and economy
that is in line with the population policy with
reference to population quantity control,
improving the quality of the population,
structuring the distribution and regulation of
population mobility, family development and
development of database management and
population information, which are further
described in the program in each policy.
Schematically the frame of mind formulation of
the GDPD district is presented in the following
figure (Fig.1).
RESULTS AND DISCUSSION
In some population literature commonly
referred to as demographics has several
definitions. There are several definitions that can
be conveyed in this sub chapter related to
demographics, summarized in (Burch, 2017)
described as follows Demographics are the
natural and social history of the human species or
the mathematical knowledge of populations,
their general changes, and their physical, civil,
intellectual, and moral conditions in Guillard's
(1855) sitasis in (Burch, 2017).
Further defined Demographics is a
scientific study of the human population,
especially with regard to its size, structure, and
development in the International Union for the
Scientific Study of Population. Then also
mentioned Demographics is a study of the size,
distribution of regions, and population
composition, changes in them, and components
of such changes, which can be identified as birth,
death, regional movement (migration), and
social mobility (change of status) in Hauser and
Duncan (1959: 31) and several articles defining
demographics (see Bogue (1969: 1–2), Shryock,
Siegel and Associates (1973: 2), Wunsch and
Termote (1978: 1), Hinde (1998: 1), Preston et al.
(2001: Preface), Weinstein and Pillai (2001: 5),
Siegel and Swanson (2004: 1) in (Burch, 2017).
There are two impacts that must be
considered and mitigated properly. First, the

Andjar Prasetyo / Economics Development Analysis Journal Vol (4) (2022)
488
increase in the birth rate will be directly
proportional to the provision of education
services, so it will encourage increased
government spending / budget in the field of
education. Control of this impact is very
important especially in areas with inadequate
budget conditions and education services, they
are required to make careful calculations in the
provision of educational infrastructure and
education assurance schemes for school age
groups. Second, efforts to convert large
populations due to high birth rates to the superior
quality of competitive human resources in this
era which requires improvement of schools with
technical and vocational specifications. The
effort to capitalize the age structure of the
population into quality development capital will
have implications for the increasing
competitiveness of the regional economy.
However, failure to manage it will also have
severe impacts, increasing regional fiscal burden,
increasing social pressures, economic pressures,
and security that are directly proportional to
population pressures.
In (Guli, Bal and Cori, 2014) it is
mentioned that there are various views and
understandings of the term "public health" by
different countries and cultures. There are
countries where public health is equivalent to
health protection and the need to enter the field
of policy analysis and policy impact analysis is
not very felt. Important public health functions
defined first by the CDC
(http://www.cdc.gov/nphpsp/essential
services.html) and later adopted by who
(Bettcher et al. 1998) serve as a worldwide
unifying element on public health content.
Recently WHO Europe changed the terminology
into an important public health operation
(http://www.euro.who.int/ en/what-we-do/
healthtopics/ Health systems / public health
services / policies / operations-10-essential-
publichealth-) and updated the list. Ten essential
health surgeries as presented below.
Population Quantity, in the long term, the
desired population condition of Kebumen
Regency is the achievement of a stable
population in numbers in accordance with the
ability of regional supporting capacity. To
achieve this condition, the number of babies born
and inward migration is expected to be balanced
by the number of deaths and outgoing migrations
so that the population becomes stationary. In
other conditions the life expectancy as presented
in the previous chapter is increasing and there is
a positive net migration, so the decrease in the
number of births is the main indicator to achieve
a balanced population. Therefore, the Total
Fertility Rate (TFR) which is an indicator of the
achievement of a balanced population that needs
to be targeted in the Regional Medium Term
Development Plan gradually and which is to be
achieved until the end of planning is below the
number 2, where in the National Medium Term
Development Plan in 2035 the target of TFR is
1.85.
Smallwood (2017) explains about TFR,
describing fertility dynamics over time,
demographic experts distinguish between group
size and period. Cohort measurements apply to
the lifetime of people born at the same time,
while period measurements are cross-
sectional,and apply across the ages of people
living at the same time. The cohort steps are more
"real" in the sense of summarizing the lifelong
experience of a group of individuals. But period
measurements are also important, in terms of
birth rates at any given moment in determining
the opening of the demographic history seen in
the age structure of the population. The total
fertility rate of the period is the most commonly
used fertility measure.
Kebumen regency with coverage area
bordering Cilacap Regency, Banyumas District,
Banjarnegara Regency, Wonosobo District,
Purworejo Regency and Indian Ocean has an
area consisting of 26 subdistricts. In the
subdistrict, has a different population, in the
publication of the Central Statistics Agency
(CSA) of Kebumen District in 2019, the total
population of Kebumen regency reached
1,197,982 people. This number increased when
compared to 2018.
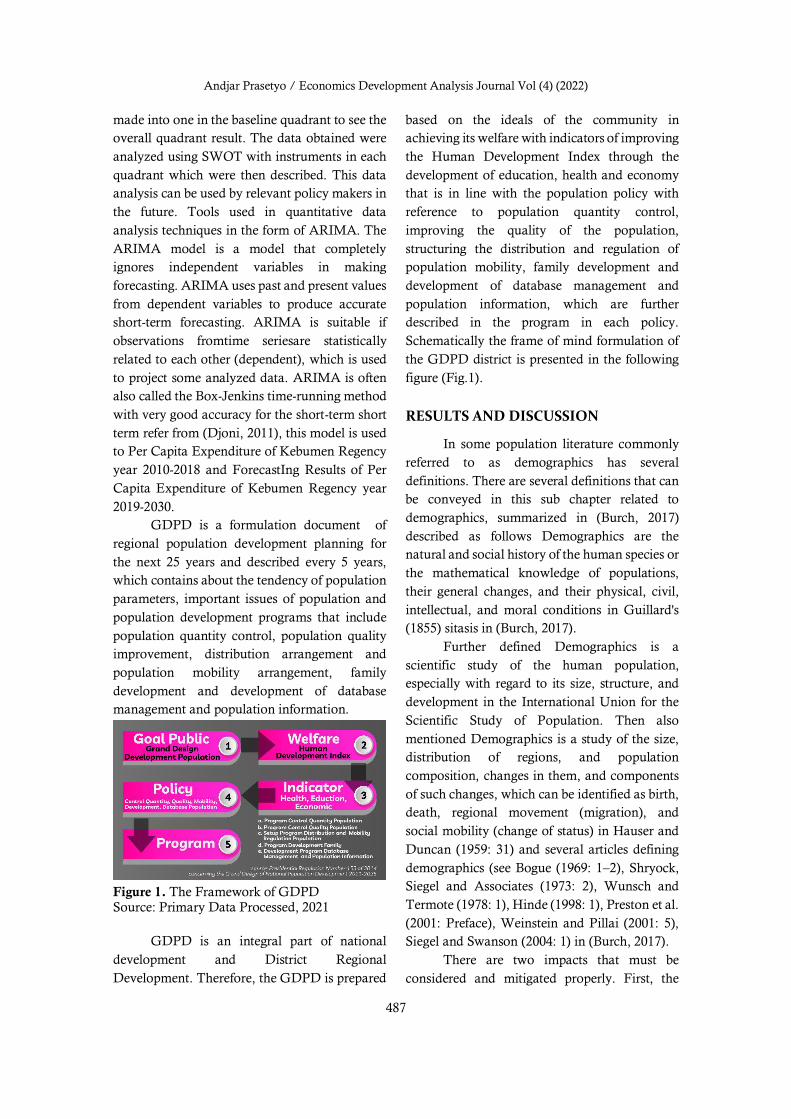
The inclusion of number marks and color
maps in each region in order gives an overview of
the large number of residents of the subdistrict in
Andjar Prasetyo / Economics Development Analysis Journal Vol (4) (2022)
489
Kebumen Regency. The smallest number is a
sub-district with a large population and the
largest number is a picture of the smallest
population quantity compared to other
subdistricts in Kebumen Regency. Furthermore,
the red color gives a sign of the population in one
sub-district numbering more than 60,000 people,
namely Kebumen District. Then in dark green is
the district with a population distribution of
between 50,000 people to 59,999 people, namely
Karanggayam District, Pejagoan District,
Buluspesantren District, Puring District,
Sruweng District, Petanahan District, Alian
District, Buayan District, Klirong District,
Ambal District and Dad's District and Sempor
District. Furthermore, the light blue color is a
sub-district with a population distribution of
between 40,000 people to 49,999 people,
consisting of Karangsambung District,
Kutowinangun District, Rowokele District, Mirit
District, Kuwarasan District and Gombong
District.
Figure 2. Population Map of Kebumen Regency in 2019. Source: CSA Kebumen, 2020
While the light green color is a sub-district
with a population of 20,000 to 39,999 people,
including Bonorowo District, Prembun District,
Karanganyar District, Adimulyo District. Lastly,
on the map of Kebumen Regency for districts that
are given light brown color is an area that has a
population of under 20,000 people, namely
Padureso District, Poncowarno District and
Sadang District.
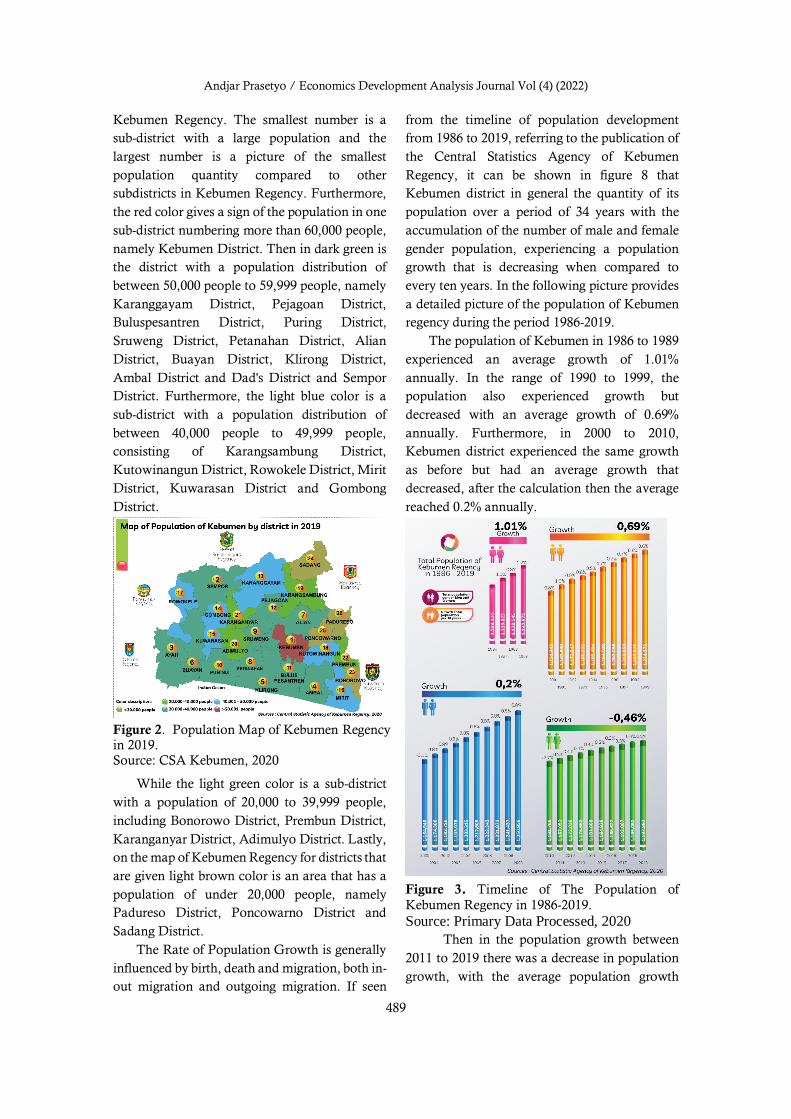
The Rate of Population Growth is generally
influenced by birth, death and migration, both in-
out migration and outgoing migration. If seen
from the timeline of population development
from 1986 to 2019, referring to the publication of
the Central Statistics Agency of Kebumen
Regency, it can be shown in figure 8 that
Kebumen district in general the quantity of its
population over a period of 34 years with the
accumulation of the number of male and female
gender population, experiencing a population
growth that is decreasing when compared to
every ten years. In the following picture provides
a detailed picture of the population of Kebumen
regency during the period 1986-2019.
The population of Kebumen in 1986 to 1989
experienced an average growth of 1.01%
annually. In the range of 1990 to 1999, the
population also experienced growth but
decreased with an average growth of 0.69%
annually. Furthermore, in 2000 to 2010,
Kebumen district experienced the same growth
as before but had an average growth that
decreased, after the calculation then the average
reached 0.2% annually.
Figure 3. Timeline of The Population of
Kebumen Regency in 1986-2019.
Source: Primary Data Processed, 2020
Then in the population growth between
2011 to 2019 there was a decrease in population
growth, with the average population growth
Andjar Prasetyo / Economics Development Analysis Journal Vol (4) (2022)
490
reaching -0.46% per year. The success of the
government in suppressing population growth
figures shows the success of the government in
raising public awareness about the importance of
good family planning. In the long term, the
success of suppressing the rate of population
growth can at least reduce various social
problems that arise in the future.
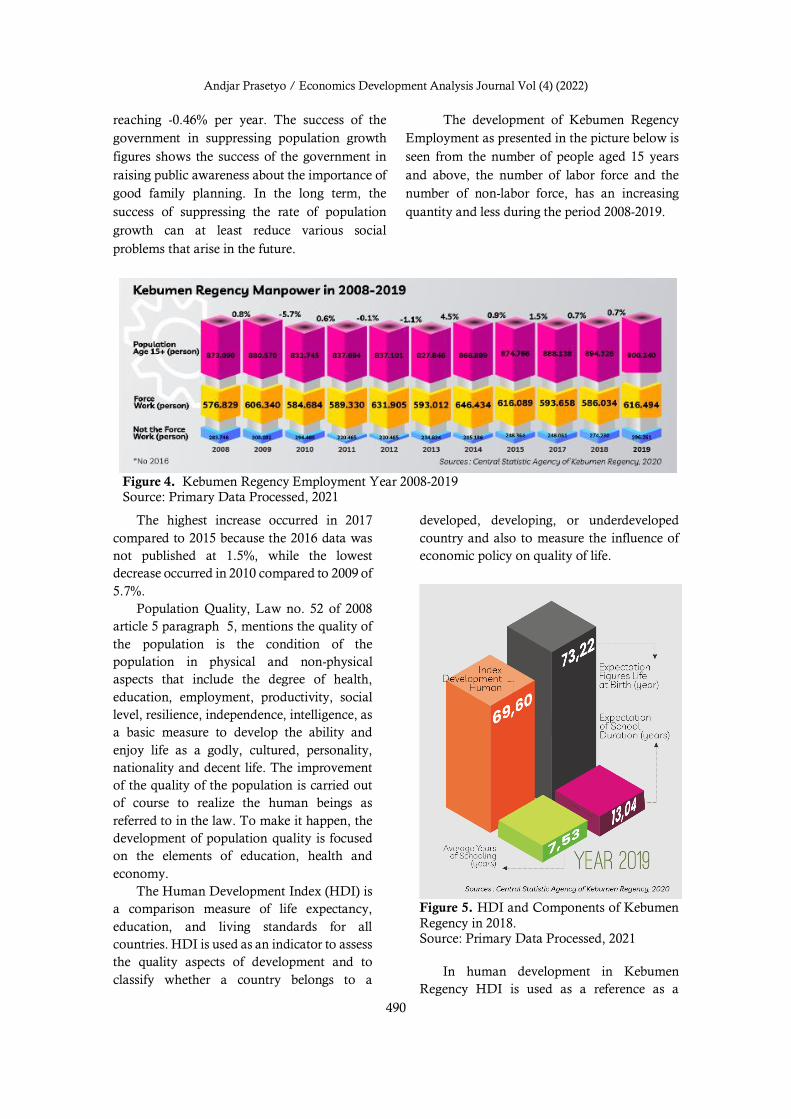
The development of Kebumen Regency
Employment as presented in the picture below is
seen from the number of people aged 15 years
and above, the number of labor force and the
number of non-labor force, has an increasing
quantity and less during the period 2008-2019.
Figure 4. Kebumen Regency Employment Year 2008-2019 Source: Primary Data Processed, 2021
The highest increase occurred in 2017
compared to 2015 because the 2016 data was
not published at 1.5%, while the lowest
decrease occurred in 2010 compared to 2009 of
5.7%.
Population Quality, Law no. 52 of 2008
article 5 paragraph 5, mentions the quality of
the population is the condition of the
population in physical and non-physical
aspects that include the degree of health,
education, employment, productivity, social
level, resilience, independence, intelligence, as
a basic measure to develop the ability and
enjoy life as a godly, cultured, personality,
nationality and decent life. The improvement
of the quality of the population is carried out
of course to realize the human beings as
referred to in the law. To make it happen, the
development of population quality is focused
on the elements of education, health and
economy.
The Human Development Index (HDI) is
a comparison measure of life expectancy,
education, and living standards for all
countries. HDI is used as an indicator to assess
the quality aspects of development and to
classify whether a country belongs to a
developed, developing, or underdeveloped
country and also to measure the influence of
economic policy on quality of life.
Figure 5. HDI and Components of Kebumen
Regency in 2018. Source: Primary Data Processed, 2021
In human development in Kebumen
Regency HDI is used as a reference as a
Andjar Prasetyo / Economics Development Analysis Journal Vol (4) (2022)
491
measure of the quality of human development
which is basically the same as other regions in
Indonesia. Components measured in HDI:
1.Income (per capita income) 2. Expectation
of life 3. Years of scholly (education) 4.
Elitaration rate. HDI Kebumen regency is
included in the category of High human
development because it is between 48 to 94
points.
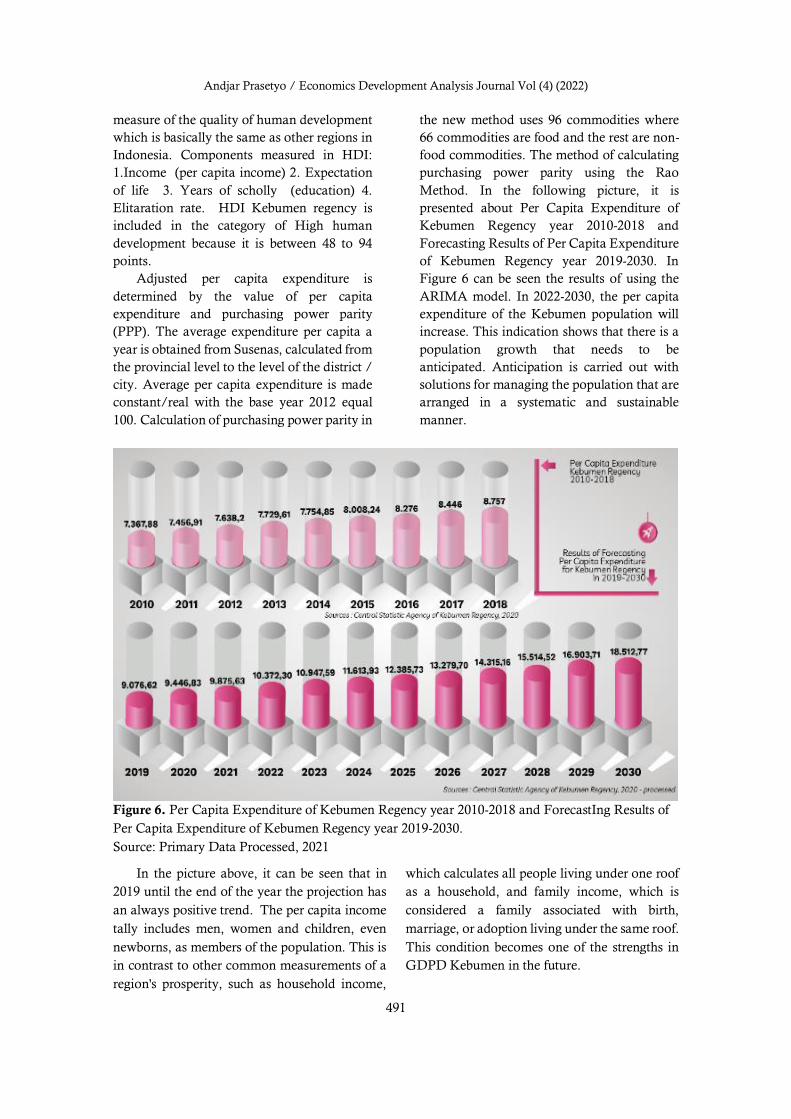
Adjusted per capita expenditure is
determined by the value of per capita
expenditure and purchasing power parity
(PPP). The average expenditure per capita a
year is obtained from Susenas, calculated from
the provincial level to the level of the district /
city. Average per capita expenditure is made
constant/real with the base year 2012 equal
100. Calculation of purchasing power parity in
the new method uses 96 commodities where
66 commodities are food and the rest are non-
food commodities. The method of calculating
purchasing power parity using the Rao
Method. In the following picture, it is
presented about Per Capita Expenditure of
Kebumen Regency year 2010-2018 and
Forecasting Results of Per Capita Expenditure
of Kebumen Regency year 2019-2030. In
Figure 6 can be seen the results of using the
ARIMA model. In 2022-2030, the per capita
expenditure of the Kebumen population will
increase. This indication shows that there is a
population growth that needs to be
anticipated. Anticipation is carried out with
solutions for managing the population that are
arranged in a systematic and sustainable
manner.
Figure 6. Per Capita Expenditure of Kebumen Regency year 2010-2018 and ForecastIng Results of
Per Capita Expenditure of Kebumen Regency year 2019-2030.
Source: Primary Data Processed, 2021
In the picture above, it can be seen that in
2019 until the end of the year the projection has
an always positive trend. The per capita income
tally includes men, women and children, even
newborns, as members of the population. This is
in contrast to other common measurements of a
region's prosperity, such as household income,
which calculates all people living under one roof
as a household, and family income, which is
considered a family associated with birth,
marriage, or adoption living under the same roof.
This condition becomes one of the strengths in
GDPD Kebumen in the future.
Andjar Prasetyo / Economics Development Analysis Journal Vol (4) (2022)
492
Population Distribution and Mobility, the
desired population distribution condition at the
end of the planning year is an even distribution of
the population in accordance with the potential
and carrying capacity of the environment, which
can also be called proportional population
distribution. Thus there is no longer a population
buildup in one area exceeds its carrying capacity,
so it can lead to unhealthy, rundown and
uncomfortable environments. In (Szabo, 2016)
explains that the term close to mobility is
urbanization. Furthermore still in (Szabo, 2016)
mentioned straditionalecara, the city has become
the core of business and politics, and thus often
represents the center of power and distribution of
welfare of the state when applicable. Then it is
also explained in (Szabo, 2016) that
diversification of urban areas includes the size
and density of the city center as well as the social
class and socialabilities of the city residents. The
concept of mobility was discussed by (Burch,
2017)who explained that the mobility of
territorial, or spatial population occurs on
various scales. (Szabo, 2016) some approaches
to migration studies focus not on individuals, but
on net population aggregates; if, after taking into
account births and deaths, the population of a
region has increased or decreased in size
compared to some time before, an increase or
decrease in the number of people who normally
live in that area because migration is assumed to
have occurred. Then in (Caballero-Anthony et
al., 2013) explained that mobility is much wider
than migration. It concerns movement, and
mobility studies seek to link "forms of movement
across scales and with areas of research that are
often held separately. it is further conveyed that
power, identity, and everyday are the main areas
of research in geography today. it was conveyed
that the impact of new communication and
movement technologies attracted the attention of
researchers working in several sub-plots.
The population of Kebumen in 2019
amounted to 1,197,982 people with the number
of men as many as 596,388 people and the
number of women as many as 60,1594 people,
spread in the subdistrict with uneven distribution.
Population distribution depends heavily on the
condition of the sub-district, both on land use, the
number of facilities and economic conditions of
the region. In sub-districts where land use is
mostly Agriculture, Forestry, and Fisheries with
limited facilities, the population tends to be less
than in urban areas that have more complete
facilities.
Family Conditions, in as conveyed (Kim,
2006) that demographics, there are not many
discursive theories related to age and sex
structure. In contrast, demographic experts are
renowned for their formal (Kim, 2006) theories
and have developed some of the most
mathematical formal theories in social sciences.
Age and gender, especially age, are central to
formal theories in demographics. The desired
family condition through family development
until the end of the planning year is the
realization of a quality, prosperous and socially
sustainable family. The main indicators are
declining troubled families, rising incomes and
family welfare, where each family has an ideal
number of children according to their family's
abilities.
Most of the families in Indonesia are still not
able to perform the role and function of the
family optimally, both economic, educational
and health functions. Economic function is
expected to encourage families to be able to foster
the quality of family economic life, as well as be
realistic and responsible for family welfare. The
function of education is not only related to
intelligence, but also includes emotional
education and spiritual education. Health
function is indicated that each family can
implement a healthy way of life and understand
about reproductive health, including an
understanding of contraceptives and knowledge
of family life preparation for teenagers.
Population Data base, Bloothooft et al.,
(2015) states that each country has its own source
containing microdata, also known as nominative
data, derived from national statistics agencies or
public administration. Overall, these sources
have the same kind of information about citizens,
such as name, address, age, occupation and civil
status, which makes it clear to use this data in
comparative analysis. The way sources are

Andjar Prasetyo / Economics Development Analysis Journal Vol (4) (2022)
493
created and then digitized has resulted in the
need to standardize metadata using numerical
code to address the huge differences in expressing
the same entities and barriers created by language
diversity. The standardization process must be
done locally due to different languages, but the
principles behind standardization and standards
used can and have been discussed internationally
in workshops and conferences. The desired
condition in the development of population data
base until the end of the planning year is certainly
the establishment of a population database
system, so that it is expected to obtain reliable,
accurate, real, accessible population dataand can
be used as basic data in planning and decision-
making materials quickly or become part of the
decision support system (Kim, 2006). With the
management of an adequate database, it is
expected to improve the service of population
documents to the community, so that at the end
of the year the planning of all the needs of public
documents can be met starting from the Family
Card, e-Identity Card and civil registration
documents.
In the development of population,
population administration as a system, is an
integral part of government administration and
state administration in order to provide
protection of the individual rights of residents,
through public services in the form of issuance of
population documents such as Identity Cards,
Family Cards and Civil Registry Deed
documents.
With Law No. 23 of 2016 on Population
Administration as amended by Law No. 24 of
2013 as the legal basis for the implementation of
population administration policy and basic
database of population, it is expected that the
orderly administration of population will in turn
be utilized for the purposes of formulation of
government policies and development planning
based on population administration. The law
also guarantees that population data is accurate
and accountable. The development of
population database has been implemented
through the implementation of the regulation,
which is in fact orderly documents of residence
or orderly administration of the population is not
only supervision of the procurement of blanks -
blanks required in the issuance of documents, but
must be systemic and pragmatic means easy to
understand by the population and is believed to
be legally meaningful to protect, recognize /
population is a series of activities of structuring
and controlling, in the issuance of documents and
population data through population registration,
civil registration, management of population
administration information and utilization of the
results for public services and development of
other sectors.
Some criteria that need to be considered in
the development of population databases include
Truth Criteria, strict application of data type
rules, data domains, data uniqueness and
relationships between data and others, can
suppress inaccuracies in data entry / storage. In
addition, the selection of data types must be in
accordance with existing conditions. Consistency
Criteria, is an aspect of engineering, whether all
aspects in the model are free from contradictions.
Aspects of consistency and correctness are
essential to measure whether the schema is
accepted by the user or not. This resulted in a
duplication of data because each section manages
the data on its own. Relevance Criteria Is an
aspect of engineering, whether aspects of
engineering aspects in the relevant database are
used. In the database design all tables and
columns used are relevant to the needs of the
system. Completeness Criteria is an assessment
of the database design to the completeness of the
required data. This aspect is important to know
whether the database design is acceptable to the
user or not. Measurement can be done from the
aspect of range and level of detail. Minimalist
Criteria It is said to be minimalist, by using the
database of information retrieval can be done
quickly and easily. Databases have the ability to
group, sort. With the correct design, the
presentation of information can be done quickly
and easily.
Substantive Population Database
development is directed at the implementation of
government activities in population affairs in
Kebumen Regency which is focused on efforts to
improve the quality of population. The

Andjar Prasetyo / Economics Development Analysis Journal Vol (4) (2022)
494
development of the Kebumen Regency
Population Database can use existing systems,
including Family Data Collection and Integrated
Social Welfare Data. Family Data describes a
complete range of population information that
has 40 population information with the first data
collection carried out in 2015. Integrated Social
Welfare Data provides more specific information
specifically on welfare issues containing 26
indicators. With these two data sources can be
built integrated data sources involving Regional
Development Research, Development and
Planning Agency in planning, Social Services
and Population Control & Family Planning
Kebumen provides Family Data and Integrated
Social Welfare Data data support because the
data collection process is carried out in the
regional devices, the Health Office supports
health data, the Education Office supports
education data, the Civil Records Office supports
population data and the Communication and
Informatics Office builds a Population Database.
Technical involvement is supported through 26
subdistricts in Kebumen Regency. The concept
of Taxonomy of The Population Database of
Kebumen Regency can be described as follows
Figure 7. Concept of Taxonomy of Population
Database GDPD of Kebumen Regency
Source: Primary Data Processed, 2021
In the concept refers to the database that has
been done by the Social Services and Population
Control & Family Planning with the first period
of August 11, 2015-December 21, 2015, the
second period of July 14, 2016-November 6,
2016, the third period of November 7, 2016 -
March 31, 2017, the fourth period of June 20,
2017 - March 31, 2018, the fifth period of April 2,
2018 - June 30, 2018, the sixth period of August
2, 2018 - December 31, 2018 , the seventh period
of February 1, 2019 - December 31, 2019 and the
eighth period of February 1, 2020 - December 31,
2020. The substance of the Population Database
contained in the data collection process can be
categorized into 9 useful aspects in the GDPD of
Kebumen Regency. These aspects are based on
Region, Age, Education, Type of Employment,
Marital Status, Health Insurance, Fertile Age
Couples, Family Planning and Family
Development.
SWOT methods, strengths, weaknesses,
opportunities and threats are used primarily to
obtain informationas the basis for creating
strategies. This strategy appears in the interface
between mapping and evaluating the
opportunities and challenges facing a project or
organization in the context of its operations, as
well as taking into account its strengths and
weaknesses (Samset, 2010). In this study SWOT
analysis is described as below which covers five
aspects studied, in each aspect swot analysis is
carried out separately and at the end of the
analysis is carried out a combination of five
aspects.
Figure 8. Identification of SWOT Instruments Aspects of GDP Population of Kebumen Regency.
Source: Primary Data Processed, 2021
The total instruments used as many as 302
instruments divided into five aspects analyzed
by SWOT include Aspects of Population
Quality, Aspects of Population Quantity,
Aspects of Mobility and Population
Distribution,Aspects of Family Development
and Aspects of Population Database. In the
instrument described for strength as many as 94
instruments, weaknesses as many as 83
Andjar Prasetyo / Economics Development Analysis Journal Vol (4) (2022)
495
instruments, opportunities as many as 60
instruments and 65 instruments for challenges.
The source of the instrument comes from a
description of the five aspects that have been
presented before. Each instrument is assigned an
identity code for the ease and importance of the
description of the presentation of the data
analyzed. The analysis process is carried out with
qualitatively bounded with a weighted value of 1
for the value of no / disagree, 2 for the value may
/ do not know and 3 for the value there / agree
assisted by a simple application using Excell.
Once found the calculation results are then
presented with a radar curve to get the results of
the analysis is easier to understand and
informative.
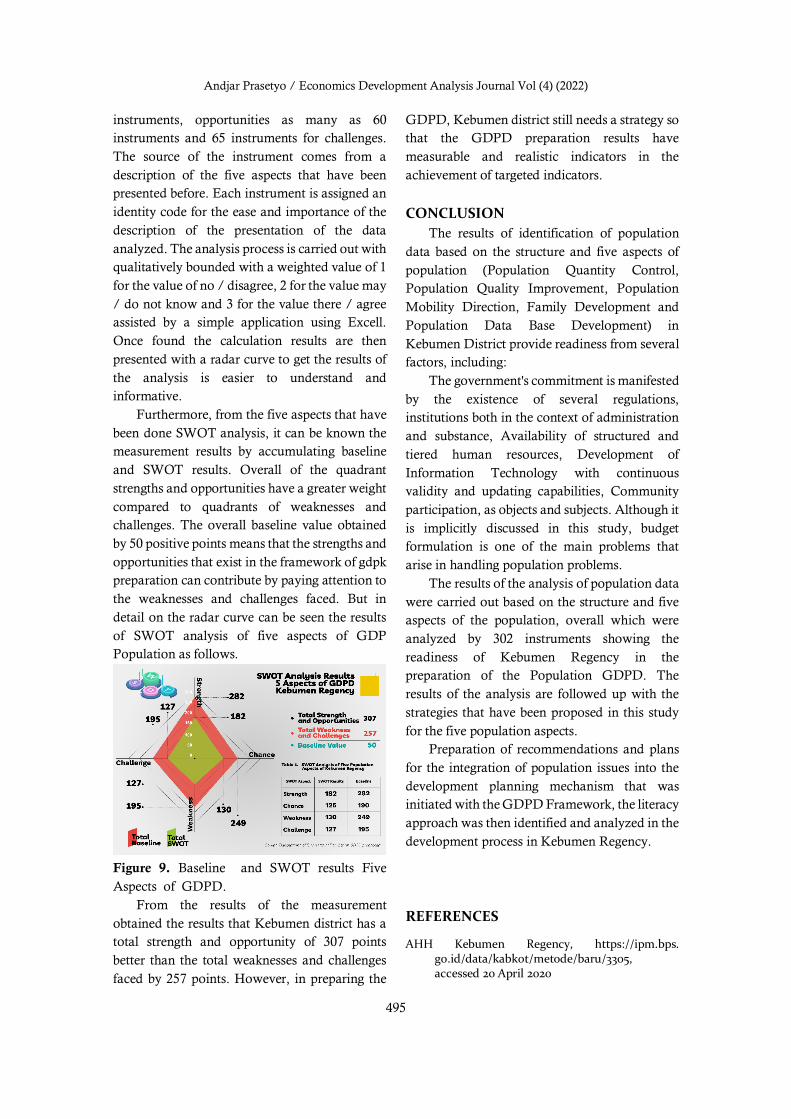
Furthermore, from the five aspects that have
been done SWOT analysis, it can be known the
measurement results by accumulating baseline
and SWOT results. Overall of the quadrant
strengths and opportunities have a greater weight
compared to quadrants of weaknesses and
challenges. The overall baseline value obtained
by 50 positive points means that the strengths and
opportunities that exist in the framework of gdpk
preparation can contribute by paying attention to
the weaknesses and challenges faced. But in
detail on the radar curve can be seen the results
of SWOT analysis of five aspects of GDP
Population as follows.
Figure 9. Baseline and SWOT results Five
Aspects of GDPD.
From the results of the measurement
obtained the results that Kebumen district has a
total strength and opportunity of 307 points
better than the total weaknesses and challenges
faced by 257 points. However, in preparing the
GDPD, Kebumen district still needs a strategy so
that the GDPD preparation results have
measurable and realistic indicators in the
achievement of targeted indicators.
CONCLUSION
The results of identification of population
data based on the structure and five aspects of
population (Population Quantity Control,
Population Quality Improvement, Population
Mobility Direction, Family Development and
Population Data Base Development) in
Kebumen District provide readiness from several
factors, including:
The government's commitment is manifested
by the existence of several regulations,
institutions both in the context of administration
and substance, Availability of structured and
tiered human resources, Development of
Information Technology with continuous
validity and updating capabilities, Community
participation, as objects and subjects. Although it
is implicitly discussed in this study, budget
formulation is one of the main problems that
arise in handling population problems.
The results of the analysis of population data
were carried out based on the structure and five
aspects of the population, overall which were
analyzed by 302 instruments showing the
readiness of Kebumen Regency in the
preparation of the Population GDPD. The
results of the analysis are followed up with the
strategies that have been proposed in this study
for the five population aspects.
Preparation of recommendations and plans
for the integration of population issues into the
development planning mechanism that was
initiated with the GDPD Framework, the literacy
approach was then identified and analyzed in the
development process in Kebumen Regency.
REFERENCES
AHH Kebumen Regency, https://ipm.bps. go.id/data/kabkot/metode/baru/3305, accessed 20 April 2020
Andjar Prasetyo / Economics Development Analysis Journal Vol (4) (2022)
496
APK and PAM Kebumen Regency Year 2019, http://apkapm.data.kemdikbud.go.id/- accessed September 2, 2020, processed.
Ariteja, S. (2017) ‘Demographic Bonus for Indonesia: Challenges and Policy Implications of Promoting Universal Health Coverage’, Jurnal Perencanaan Pembangunan: The Indonesian Journal of Development Planning, 1(3), pp. 265–274. doi: 10.36574/jpp.v1i3.24.
Azhar, L. F., Badriah, L. S. and Bambang, B. (2020) ‘Family Hope Program Evaluation in Poverty Alleviation: Benefit Incidence Analysis’, Economics Development Analysis Journal, 9(1), pp. 97–110. doi: 10.15294/edaj.v9i1.38471.
Bloothooft, G. et al. (2015) Population reconstruction, Population Reconstruction. doi: 10.1007/978-3-319-19884-2.
PS Kebumen, 2020. Kebumen 2008-2019 data https://kebumenkab.bps.go.id/site/resultTab. Retrieved July 22, 2020
BPS Kebumen, 2020. Population of Kebumen Regency in 1986-2019, https://kebumenkab .bps.go.id/site/resultTab. Retrieved July 31, 2020
Burch, T. K. (2017) Fundamentals of Demographic Analysis: Concepts, Measures, and Methods, Canadian Studies in Population. doi: 10.25336/p6tw25.
Caballero-Anthony, M. et al. (2013) Forced migration, Non-Traditional Security in Asia: Issues, Challenges and Framework for Action. doi: 10.4324/9781315623757-1.
Djoni, H. (2011) ‘Penerapan Model Arima Untuk Memprediksi Application Of Arima To Forecasting Stock Price Of PT . Telokm Tbk .’, Jurnal Ilmiah Sains, 11(1), pp. 117–119.
Guli, G., Bal, O. M. and Cori, L. (2014) Assessment of Population Health Risks of Policies, Assessment of Population Health Risks of Policies. doi: 10.1007/978-1-4614-8597-1.
Kebumen Data 2018 (New Method), (https://ipm.bps.go.id/data/kabkot//new/3305 method). Retrieved June 20, 2020.
Kebumen Regency Population Aggregate Data for 2019 https://kependudukan.kebumenkab.go.id/index.php/web, accessed 20 August 2020
Kebumen Regency Family Data Collection Report 2019,http://pk.bkkbn.go.id/PK/Laporan/Default.aspx, accessed August 26, 2020
Kim, D.-S. (2006) Handbook of Population, Contemporary Sociology: A Journal of Reviews. doi: 10.1177/009430610603500533.
Law No. 1 of 1974 on the Principles of Marriage; Law No. 4 of 1997 on Persons with Disabilities; Law No. 13 of 1998 on Elderly Welfare; Law No. 39 of 1999 on Human Rights; Law No. 23 of 2002 on Child Protection; Law of the Republic of Indonesia Number 13 Year
2003 concerning Employment;
Law No. 20 of 2003 on the National Education System;
Law No. 7 of 2004 on the Elimination of Discrimination against Women;
Law No. 23 of 2004 on the Elimination of Domestic Violence(KDRT);
Law No. 25 of 2004 on National Development Planning;
Law No. 23 of 2006 on Population Administration; Law No. 17/2007 on the National Long-Term
Development Plan (RPJPN) 2005-2025; Law No. 26 of 2007 on Spatial Planning; Law No. 11 of 2009 on Social Welfare; Law No. 36 of 2009 on Health; Law No. 52 of 2009 on Population Development and
Family Development; Law No. 23 of 2014 on Local Government; Law No. 13 of 2011 on the Handling of the Poor; Law No. 35 of 2010 on Narcotics; AHH Kebumen Regency, https://ipm.bps.
go.id/data/kabkot/metode/baru/3305, accessed 20 April 2020
APK and PAM Kebumen Regency Year 2019, http://apkapm.data.kemdikbud.go.id/- accessed September 2, 2020, processed.
Ariteja, S. (2017) ‘Demographic Bonus for Indonesia: Challenges and Policy Implications of Promoting Universal Health Coverage’, Jurnal Perencanaan Pembangunan: The Indonesian Journal of Development Planning, 1(3), pp. 265–274. doi: 10.36574/jpp.v1i3.24.
Azhar, L. F., Badriah, L. S. and Bambang, B. (2020) ‘Family Hope Program Evaluation in Poverty Alleviation: Benefit Incidence Analysis’, Economics Development Analysis Journal, 9(1), pp. 97–110. doi: 10.15294/edaj.v9i1.38471.
Bloothooft, G. et al. (2015) Population reconstruction, Population Reconstruction. doi: 10.1007/978-3-319-19884-2.
PS Kebumen, 2020. Kebumen 2008-2019 data https://kebumenkab.bps.go.id/site/resultTab. Retrieved July 22, 2020
BPS Kebumen, 2020. Population of Kebumen Regency in 1986-2019, https://kebumenkab .bps.go.id/site/resultTab. Retrieved July 31, 2020
Burch, T. K. (2017) Fundamentals of Demographic Analysis: Concepts, Measures, and Methods, Canadian Studies in Population. doi: 10.25336/p6tw25.
Caballero-Anthony, M. et al. (2013) Forced migration, Non-Traditional Security in Asia: Issues, Challenges and Framework for Action. doi: 10.4324/9781315623757-1.
Djoni, H. (2011) ‘Penerapan Model Arima Untuk Memprediksi Application Of Arima To Forecasting Stock Price Of PT . Telokm Tbk .’, Jurnal Ilmiah Sains, 11(1), pp. 117–119.
Guli, G., Bal, O. M. and Cori, L. (2014) Assessment of Population Health Risks of Policies, Assessment
Andjar Prasetyo / Economics Development Analysis Journal Vol (4) (2022)
497
of Population Health Risks of Policies. doi: 10.1007/978-1-4614-8597-1.
Kebumen Data 2018 (New Method), (https://ipm.bps.go.id/data/kabkot//new/3305 method). Retrieved June 20, 2020.
Kebumen District Regulation Number 1 Year 2010 concerning Long-Term Development Plan of Kebumen Regency Year 2005-2025 (Kebumen District Gazette Number:1 Year 2010 Series:E Number:1)
Kebumen District Regulation Number 6 Year 2016 concerning Medium Term Development Plan of Kebumen Regency Year 2016-2021.
Kebumen Regency Population Aggregate Data for 2019 https://kependudukan.kebumenkab.go.id/index.php/web, accessed 20 August 2020
Kebumen Regency Family Data Collection Report 2019,http://pk.bkkbn.go.id/PK/Laporan/Default.aspx, accessed August 26, 2020
Kim, D.-S. (2006) Handbook of Population, Contemporary Sociology: A Journal of Reviews. doi: 10.1177/009430610603500533.
Law No. 1 of 1974 on the Principles of Marriage; Law No. 4 of 1997 on Persons with Disabilities; Law No. 13 of 1998 on Elderly Welfare; Law No. 39 of 1999 on Human Rights; Law No. 23 of 2002 on Child Protection; Law of the Republic of Indonesia Number 13 Year
2003 concerning Employment; Law No. 20 of 2003 on the National Education
System; Law No. 7 of 2004 on the Elimination of
Discrimination against Women; Law No. 23 of 2004 on the Elimination of Domestic
Violence(KDRT); Law No. 25 of 2004 on National Development
Planning; Law No. 23 of 2006 on Population Administration; Law No. 17/2007 on the National Long-Term
Development Plan (RPJPN) 2005-2025; Law No. 26 of 2007 on Spatial Planning; Law No. 11 of 2009 on Social Welfare; Law No. 36 of 2009 on Health; Law No. 52 of 2009 on Population Development and
Family Development; Law No. 23 of 2014 on Local Government; Law No. 13 of 2011 on the Handling of the Poor; Law No. 35 of 2010 on Narcotics; Presidential Regulation No. 153 of 2014 concerning
Grand Design of National Population Development Year 2011-2035;
Presidential Instruction No. 1 of 2010 on the Acceleration of Implementation of National Development Priorities;
Presidential Instruction No. 3 of 2010 on Equitable Development;
Samset, K. (2010) Early Project Appraisal Making the Initial Choices. Basingstoke, Hampshire RG21
6XS: Palgrave Macmillan in the UK is an imprint of Macmillan Publishers Limited.
Smallwood, S. (2017) Dynamic Demographic Analysis, Population Studies. doi: 10.1080/00324728.2016.1269973.
Szabo, S. (2016) Urbanisation and Intra-urban Inequalities in Nutritional Outcomes. doi: 10.1007/978-3-319-26571-1_5.
The Constitution of 1945 (Preanding, Article 28B, article 33 and article 34);
Yunistria, G. P. (2020) ‘Targeting and Impact of National Health Insurance Program in Indonesia Galih’, Economics Development Analysis Journal, 9(4), pp. 446–455.