Economic impact assessment of the classical biological control of papaya mealybug in Ghana
18
Researchjournali’s Journal of Agriculture Vol. 2 | No. 5 May | 2015 1 Mark Kwame Offei Programme Officer (Crop, Agribusiness and Policy), Food and Agriculture Organisation of the United Nations, Representation in Ghana, P.O. Box GP 1628, Accra, Ghana Dr Lamourdia Thiombiano FAO Deputy Regional Representative for Africa and Country Representative to Ghana , Food and Agriculture Organisation of the United Nations, Regional Office for Africa, P.O. Box GP 1628, Accra, Ghana Amélie Solal-Céligny Monitoring and Evaluation Officer, Food and Agriculture Organisation of the United Nations, Regional Office for Africa, P.O. Box GP 1628, Accra, Ghana Economic Impact Assessment Of The Classical Biological Control Of Papaya Mealybug In Ghana
Transcript of Economic impact assessment of the classical biological control of papaya mealybug in Ghana
Researchjournali’s Journal of Agriculture Vol. 2 | No. 5 May | 2015
1
Mark Kwame Offei Programme Officer (Crop, Agribusiness and Policy), Food and Agriculture Organisation of the United Nations, Representation in Ghana, P.O. Box GP 1628, Accra, Ghana
Dr Lamourdia Thiombiano FAO Deputy Regional Representative for Africa and Country Representative to Ghana , Food and Agriculture Organisation of the United Nations, Regional Office for Africa, P.O. Box GP 1628, Accra, Ghana
Amélie Solal-Céligny
Monitoring and Evaluation Officer, Food and Agriculture Organisation of the United Nations, Regional Office for Africa, P.O. Box GP 1628, Accra, Ghana
Economic Impact
Assessment Of The
Classical Biological
Control Of Papaya
Mealybug In Ghana
Researchjournali’s Journal of Agriculture Vol. 2 | No. 5 May | 2015
2
ABSTRACT
Empirical evidence shows that Classical Biological Control (CBC) is among the most cost-effective methods
used for pest control. This paper is an ex-post assessment done to validate the impact of the adoption of the
Classical Biological Control of papaya mealybug (Paracoccus marginatus) infestation in Ghana. The
Economic Surplus Model was used to quantify the total economic gains generated due to yield gains and unit
production cost reduction. The study used production data from Statistics, Research and Information
Directorate (SRID) of the Ministry of Food and Agriculture (MoFA) together with data obtained by
conducting a questionnaire survey of 60 beneficiary papaya farmers from 13 districts across 5 regions in
Ghana. The results of the study showed that the adoption of the CBC intervention within the period 2011 and
2013 yielded an aggregate level total economic surplus of GHS 6.10 million, with producers and consumers
benefiting to a tune of GHS 3.20 million and GHS 2.90 million respectively at an estimated intervention cost
of GHS 359,831.34. The NPV of the total economic gains was estimated to be GHS 3.22 million at discount
rate of 25%, resulting in a BCR of 15.36:1 and a high IRR of 295%. Policy implications are distilled from the
study.
Keywords: Classical biological control, Papaya mealybug, Economic surplus model, Ghana
1. INTRODUCTION
Papaya is one of the few non-traditional agricultural commodities that has been selected and promoted for
food security and as a strategy to diversify exports in Ghana (MoFA, 2002, METASIP 2011). In 2009, papaya
plants in Ghana were attacked by a new invasive species known as the papaya mealybug (Paracoccus
marginatus), which severely devastated the papaya plants both on the cultivated fields and those in the
wild.As a result of this infestation, about 85% of cultivations in 2009 were destroyed and 1,734 employees in
the sector lost their jobs. The mealybug infestation also threatened food security in the pest affected regions,
as fruits for private consumptions were not available on local markets (FAO, 2011).
In response to the excessive complaints received from farmers, a nationwide survey was undertaken in the ten
administrative regions of Ghana and came out the infestation was severe in the Eastern, Central, Volta and
Greater Accra Regions and parts of the Ashanti region.
The Plant Protection and Regulatory Services Directorate of the Ministry of Food and Agriculture sent
mealybug samples collected from papaya fields at Nsawam in the Eastern region to the International Institute
for Tropical Agriculture (IITA) Benin for identification. IITA in collaboration with the Plant Pest Diagnostic
Centre of California Department of Food and Agriculture, Sacramento, USA identified the papaya mealybug
as (Paracoccus marginatus) which originated from Mexico. Since its identification on papaya plants it was
Researchjournali’s Journal of Agriculture Vol. 2 | No. 5 May | 2015
3
also observed on other host plants and is highly polyphagus. Besides papaya it was also attacking
economically important fruits and vegetables such as guava, avocado, jack fruit, chillie pepper, cassava, etc.
IITA after the pest identification recommended the use of a biological control agent namely Acerophagus
papayae and Anagyrus loecki as a better alternative to the rampant usage of pesticides by farmers which
proved futile, costly and unsustainable.
The Food and Agriculture Organization of the United Nations (FAO) in its quest to support government
efforts in reducing hunger and poverty upon request by the Government of Ghana made a budget contribution
of US$ 195, 000 under its Technical Cooperation Programme (TCP) in support of the biological control
process to effectively control and manage the invasive pest as it could pose a multi-million dollar loss to the
numerous non-traditional crops.
Biological control is a component of an integrated pest management strategy. It involves the introduction of
exotic natural enemies to suppress pest population and has continually proven very effective in eliminating
pest problems (Van Driesche & Bellows 1996; Hoffmann & Frodsham 1993).There are abundant empirical
evidence that show that biological control is among the most cost-effective methods and should be the first
pest control option because of its highly positive social, environmental and economic benefits(Bellows &
Fisher 1999; Mackauer et al. 1990; Wellings 1998; Van Driesche et al., 2008; Godfray et al., 2010; Pretty et
al., 2011).This approach has successfully been used to control Papaya mealybug in several countries in the
Caribbean, Guam and in the states of Florida and Hawaii in the United States (Meyerdirk et al. 2004;
Muniappan et al. 2006; Hue et al. 2007) and Tamil Nadu, India in recent times (Myrick et al. 2013).
This paper focuses essentially on impact of the adoption of the Classical Biological Control on the yields and
revenues of the papaya mealybug infested farmers. We employ the use of a welfare model (the economic
surplus approach) as a tool to determine the “With” and “Without” project intervention benefits to the papaya
farmers and consumers. A number of counterfactual analysis methods including the econometric approach
and programming techniques have been used to conduct impact assessment analysis in many project
interventions (Bellù & Pansini 2009).However, our choice of methodology emanates from the fact that the
economic surplus approach is universally accepted, requires the least data, is relatively flexible to use and
yields reliable results.
2. METHODOLOGY
2.1 ECONOMIC SURPLUS MODEL
The economic surplus approach permits the estimation of the economic benefits generated by adoption of
technological innovations, compared to the situation before (without) the adoption, where only traditional
technology was available (Peahin & Dhawam, 2009). The technique has been used by many experts in
Researchjournali’s Journal of Agriculture Vol. 2 | No. 5 May | 2015
4
assessing the ex-ante and ex-post impacts of research and development programmes around the world. For
instance, Kristjanson et al. 1999, 2001 and Elasha et al. 1999 used the approach to assess the impact of
Trypanosomosis vaccine on livestock, the adoption of genetically improved dual-purpose cowpea and plant
forages in West Africa respectively.
The impact analysis is based on the premise that, changes in plant health have an effect on the supply of the
commodity being produced. The method quantifies the impact that this change in plant health will have on
both the producers and consumers of the commodity. This necessitates the estimation of the producer and
consumer surpluses.
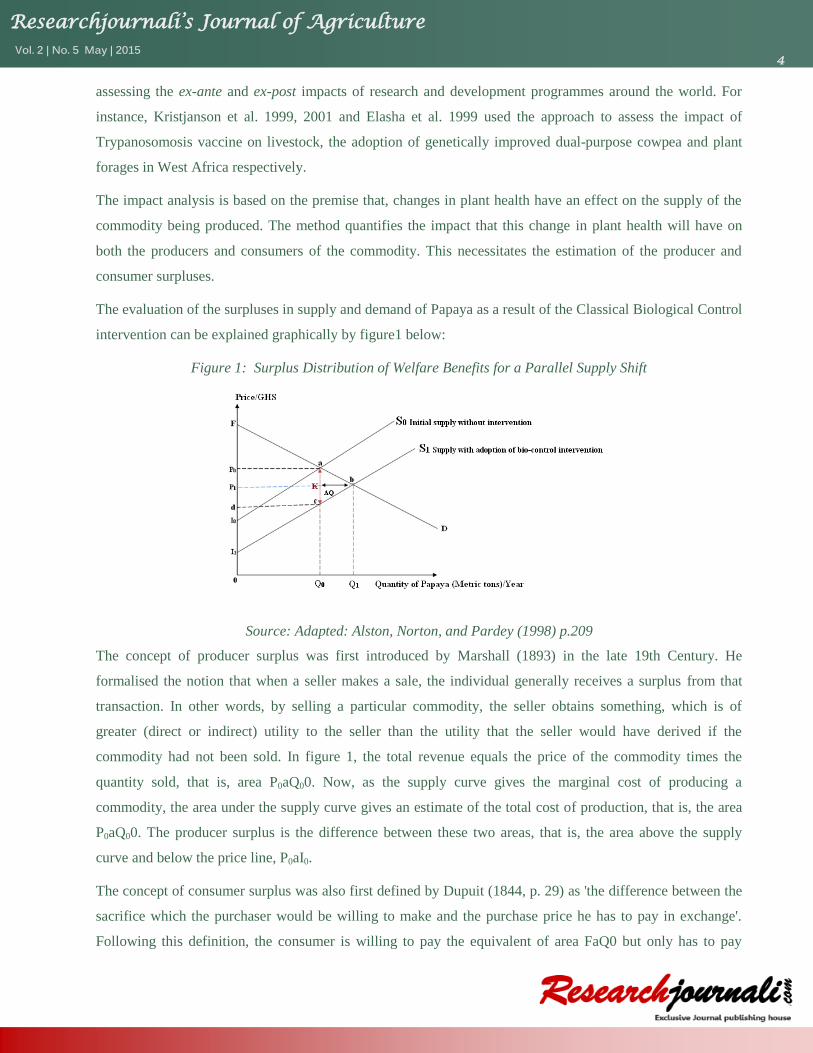
The evaluation of the surpluses in supply and demand of Papaya as a result of the Classical Biological Control
intervention can be explained graphically by figure1 below:
Figure 1: Surplus Distribution of Welfare Benefits for a Parallel Supply Shift
Source: Adapted: Alston, Norton, and Pardey (1998) p.209
The concept of producer surplus was first introduced by Marshall (1893) in the late 19th Century. He
formalised the notion that when a seller makes a sale, the individual generally receives a surplus from that
transaction. In other words, by selling a particular commodity, the seller obtains something, which is of
greater (direct or indirect) utility to the seller than the utility that the seller would have derived if the
commodity had not been sold. In figure 1, the total revenue equals the price of the commodity times the
quantity sold, that is, area P0aQ00. Now, as the supply curve gives the marginal cost of producing a
commodity, the area under the supply curve gives an estimate of the total cost of production, that is, the area
P0aQ00. The producer surplus is the difference between these two areas, that is, the area above the supply
curve and below the price line, P0aI0.
The concept of consumer surplus was also first defined by Dupuit (1844, p. 29) as 'the difference between the
sacrifice which the purchaser would be willing to make and the purchase price he has to pay in exchange'.
Following this definition, the consumer is willing to pay the equivalent of area FaQ0 but only has to pay
Researchjournali’s Journal of Agriculture Vol. 2 | No. 5 May | 2015
5
P0aQ00. Therefore, consumer surplus is the difference between these two areas: that is, the area below the
demand curve and above the market price line, FaP0.
Total economic surplus is simply the sum of producer surplus (P0aI0) and consumer surplus (FaP0) which is
FaI0. This area gives the initial economic surplus “WITHOUT” the biological control intervention, when there
was rampant usage of chemical pesticides and farmer generated methods to control the mealybug.
However, with the introduction and adoption of new yield-enhancing and cost-reducing biological control
intervention, the supply curve is expected to shift rightward to S1.This results in a new equilibrium price and
quantity P1 and Q1 respectively. The change in consumer surplus ( ) is then given by the area P0abP1. The
area P1bI1- P0aI0 which is equal to the area P1bcd represents the change in producer surplus ( ).In effect,
consumers gain, since they consume more papaya at a relatively lower price. Also, producers benefit because
they can produce the same amount at a lower cost or more at the same cost.
However, the net welfare effect on papaya farmers may be positive or negative depending on the supply and
demand elasticities and the nature of the technology-induced supply shift (Alston et al. 1998). For example, if
demand is inelastic, a rightward shift of the supply curve will result in farmers selling more papaya but at a
lower price. This will lead to a decrease in farmers‟ revenue in this instance as supply increases.
Following Alston et al. (1998), the change in total economic surplus ( ) is the sum of the changes in
producer and consumer surpluses which in this case is the area abI1I0. This analysis is a closed economy case
which considers only domestic trade without any international effect on prices due to phytosantary restrictions
during the period of mealybug infestation.
The changes in economic welfare can be expressed algebraically as follows:
Where, K is equal to the vertical bio-control-induced shift in the supply curve measured as a proportion of the
initial equilibrium price, Z = Kε/ (ε+η) and ε and η are the elasticity of supply and the absolute value of the
elasticity of demand of fresh papaya, respectively (Alston, Norton and Pardey 1998, p. 210).
The measure of surpluses can be carried out through either a Spreadsheet Approach or by a Computer
Application Software, Dream© (Dynamic Research Evaluation for Management) both of which are reliable
but differ in the extent of details. The present analysis demonstrates the use of the Spreadsheet Approach in
quantifying the surpluses.

Researchjournali’s Journal of Agriculture Vol. 2 | No. 5 May | 2015
6
2.2 ESTIMATION OF NET COST AND BENEFIT OF THE CBC PROGRAM
The information derived through economic surplus model is used in the estimation of the Net Present Value
(NPV), Internal Rate of Return (IRR) and the Benefit Cost Ratio (BCR) of the Classical Biological Control
intervention using equations (4), (5) and (6) respectively.
Net Present Value (NPV)
Net present value is computed by finding the difference between the present worth of benefit stream less the
present worth of cost stream accrued from the introduction and adoption of the classical biological control.
The intervention is deemed economical if the calculated NPV is positive when discounted at the opportunity
cost of capital. This would reflect an intervention where the present value of net benefits exceeds the present
value of all fixed and variable costs. The final result is a numerical value in Ghana cedis (GHS).
Where:
= cash flow in year of the intervention, B = Total Economic Surplus in each year of the project
C = Cost of classical biological control program in each year of the project, Interest (discount) rate
1, 2 and 3 (time of the project life in years), Number of years in the project, in this case 3 years.
Internal Rate of Return (IRR)
Internal Rate of Return (IRR) is that discount rate which just makes the net present value (NPV) of the cash
flow equal zero. It represents the average earning power of the money used in the project over the project life.
It is also sometimes called yield of the investment. A project is profitable or feasible for investment when the
internal rate of return is higher than the opportunity cost of capital.
Benefit Cost Ratio (BCR)
It is the ratio of present worth of benefit stream to present worth of cost stream.
The classical biological control investment is said to be worthy when the BCR is one or greater than 1.
Researchjournali’s Journal of Agriculture Vol. 2 | No. 5 May | 2015
7
2.3 SENSITIVITY ANALYSIS
A sensitivity analysis is conducted to systematically test what would happen to the earning capacity of a
project, here, the Classical Biological Control intervention, if events change from that used in the initial
planning of the project. This is done as a means of dealing with uncertainty about future events and values
(Gittenger, 1982). Thus, a sensitivity analysis contributes to the risk assessment by identifying the variables
that most influence a project‟s net benefits and quantifying the extent of their influence (Belli et al., 2001).
The sensitivity analysis was carried out by varying the costs and benefits parameters of the Classical
Biological Control programme and the effect on the outcome of the project‟s worth was determined. In
conducting the sensitivity analysis, the following key parameters were deemed relevant for consideration:
Probability of programme success, reduction in yields and low prices per tonne of fresh papaya received by
producer.
Probability of program success declining from 99% to 50%
The probability of success is critical to achieving the desired results intended from the CBC intervention.
Efforts were made in ensuring the smooth implementation of the program, such as training of technical
officers as well as sensitising farmers of the rate of operation of the CBC program. However, some farmers
continued spraying strong chemical fungicides and pesticides which has the possibility of killing the
parasitoids or prolonging their rate of attack on the mealybug. In view of this uncertainty, a sensitivity
analysis was done by reducing the probability of program success to 50%.
Yield Losses by 50% and probability of program success declining by 50%
Yield loss could minimise the total economic surplus by reducing the producer and consumer surpluses in
each particular year. Thus, prior to the adoption of CBC some farmers had reported cutting down their papaya
trees which were severely attacked by mealybugs to avoid further spread to other clean trees. This act led to a
significant reduction in yield while production cost remained high. A sensitivity analysis was done to jointly
reduce papaya yields per year by 50% and declining the probability of program success by 50%.
Lowering price per tonne of fresh papaya by 50% and probability of program success declining by 50%
Lowering the price of fresh papaya had implications on the producer and consumer surpluses, which is
directly linked to the elasticity of demand and supply of fresh papaya. Thus, in the event of the mealybug
infestation, the rampant usage of pesticides and discolouring nature of fruits drastically reduced its
marketability. That is, some health conscious consumers were sceptical of fruits being freed from pesticides
residues. As such, some producers had no option than to reduce prices significantly to sell owing to its
perishability. Hence a sensitivity analysis was conducted in a pessimistic scenario to where price per tonne
lowers by 50% and the probability of program success is 50%.

Researchjournali’s Journal of Agriculture Vol. 2 | No. 5 May | 2015
8
2.4 DATA REQUIREMENT AND SOURCE
This assessment relied on primary and secondary data. Primary data was compiled through field visits, focus
group discussion (farmer-fora) and random dissemination of 60 farmer questionnaires across 13 districts in
five regions in Ghana where the mealybug infestation was severe. Details of regions and districts of
respondents are presented in Appendix 1. It would be noticed that about 60% of the respondents came from
the eastern region. This was so because unlike the Greater Accra and Volta regions where we had fewer but
larger commercial farms, the eastern region had many smallholder papaya farms.
From equations (1), (2) and (3) and figure 1 above, the calculation of the economic surplus requires the
estimation of certain necessary parameters using available data. This includes the following:
Parameter A: The time frame of Project (Years): The time frame of this project impact analysis was
considered to be 3 years (2011 – 2013). Time frame for undertaking impact assessment is very critical as most
developmental programmes and project interventions do not yield immediate measurable results. Although,
papaya mealybug infestation became severe in the year 2009/2010, some respondents had experienced it in
the year 2008.The introduction and adoption of the Classical Biological Control intervention was in the year
2011. It was expected that within 21 - 60 days of adoption of the bio-control technology, mealybug
population should significantly be reduced. Hence a period of 12 -24 months of adoption of technology was
adequate to assess changes in the control of the papaya mealybug. Therefore, the period 2011 -2013 was
sufficient to assess the impact attributable to the introduction and adoption of the CBC intervention using the
Economic Surplus Model.
Parameter B: Elasticity of supply (ε): is a measure of responsiveness of quantity supplied to price changes.
The supply elasticity as well as the demand elasticity are approximations. Data on the supply elasticity is hard
to calculate; therefore the estimates are borrowed from other relevant studies about the same crop and country
if available. The elasticity of supply is a problem if linear supply and demand curves are used because when
the function is inelastic at the equilibrium a negative intercept at the price axis is implied. Therefore various
authors have criticized the use of linear supply curves with point elasticity of less than one (Alston, Norton,
and Pardey 1998, pp.63). To avoid this type of problem and due to limited information about the actual
supply elasticity of papaya, the supply elasticity was assumed to be 1. The demand elasticity was obtained
from previous studies.
Parameter C: Elasticity of demand (η): is the measure of responsiveness of quantity demanded to price
changes. In this analysis η is used in absolute terms. The data on the price elasticity of demand was adopted
from Osei-Asare and Eghan (2013). The authors demonstrate that the uncompensated (Marshallian) price
elasticity of demand for fruits in Ghana is -1.0919. This is relevant for adoption for the current analysis since
papaya is one of the few fruits that has been selected and promoted for food security in Ghana.
Researchjournali’s Journal of Agriculture Vol. 2 | No. 5 May | 2015
9
Parameter D: Proportionate yield change (ΔQ): is the percentage yield change per hectare. It measures the
percentage changes in yield per hectare due to adopting the CBC intervention.
Parameter E: Gross proportionate reduction in marginal cost per ton of output: Parameter D /Parameter B,
converts the proportional yield change to proportionate gross reduction in marginal cost per ton of output.
Parameter F: Proportionate change in variable input cost per hectare, if any, to achieve the expected yield
change.
Parameter G: Proportionate change in variable input cost per ton: Parameter F / (1 + Parameter D), the
proportionate input cost change per hectare is converted to the proportionate input cost change per ton.
Parameter H: Net change: Parameter E – Parameter G, provides the net effects of the variable input changes
associated with the yield change resulting in the maximum potential net change in marginal cost per ton of
output.
Parameter I: Probability of success: measures the probability that the biological control intervention will
achieve the yield change in Parameter D. This was considered at 99% (0.99) probability of success because
several activities by farmers could minimise the success level. Although, farmers were sensitized through
farmer fora and radio talk shows about the activities of the parasitoids (Acerephagus papaya), the desperation
of some farmers could not wait for the “seemingly” slow acting of the parasitoids than to spray which could
kill the parasitoids or prolong their cycle of operation.
Parameter J: Adoption rate: Provides the adoption rate relative to the years from the Commencement of
project. Farmers had gone through struggle of trying different chemical pesticides which was to no avail;
hence the initiation of the CBC programme was to be a last resort and hence was fully embraced. The present
analysis therefore assumed 100% (1.0) adoption rate as parasitoids released in one field has the potential to
spread to other field within a few months. Thus, Shylesha et al (2010a) reports that parasitoids released in one
hectare can spread to 50 ha within three months.
Parameter K: Proportionate supply shift per year of the K shift: Parameter H * Parameter I *Parameter J,
gives the proportionate shift down of the supply curve.
Parameter L: Proportionate reduction in price or Z shift relative to its initial value, due to the supply shift: in
the case of closed economy the Z shift is obtained by (Parameter B *Parameter K) / (Parameter B + Parameter
C).
Parameter M: Price: is the average price, the time over which prices are averaged differs for each economic
surplus analysis depending on the time frame and the data available. The present analysis used farm gate
Researchjournali’s Journal of Agriculture Vol. 2 | No. 5 May | 2015
10
prices obtained from farmer questionnaire survey. For a fresh papaya fruit of 0.3kg - 0.7kg, the mean price
was estimated at GHS 730/ton.
Parameter N: Quantity: is the average quantity over a period of time. Production data (Quantity and Area
under cultivation per year) was obtained from Statistical, Research and Information Services Directorate
(SRID) of the Ministry of Food and Agriculture (MoFA) for the years under consideration.
Parameter O: Producer surplus: (Parameter M * Parameter N) * (Parameter K – Parameter L) * (1+ 0.5
Parameter L * Parameter C).
Parameter P: Consumer surplus: In the closed economy case (Parameter L * Parameter M *Parameter N) *
(1 + 0.5 Parameter L * Parameter C).
Parameter Q: Total surplus: It adds the producer and consumer surplus: Parameter O + Parameter P
Parameter R: Cost: the annual CBC programme/intervention cost corresponding to the yield change was
obtained from the FAO Representation in Ghana who had the general oversight responsibility in the
implementation of the programme (Appendix 2).
Parameter S: Benefits: it gives the difference between the total surplus and the cost: Parameter Q –
Parameter R.
Parameter T: Net present value (NPV) was calculated using the Excel embedded formula with 25% discount
rate. The choice of a discount rate is essential in concluding on the worth of a potential investment
alternatives. Thus, Improper setting of the discount rate can cause an organization either to forgo investment
opportunities that should have been pursued or to commit resources to projects, when these resources could
have been used elsewhere with more beneficial effect.
In most public or social investment programmes, the recommended real discount rate is usually set between
3% - 5%, low enough to make the investment attractive. However, Stewart et al (1995) recommends that in
personal financial decisions the discount rate might be thought of as simply the going interest rate on loans at
the local bank.
Hence for this analysis the discount rate was an approximation of the mean base rate of 23 bank base rates in
Ghana. The results were further used to calculate Internal Rate of Return (IRR) and the Benefit to Cost Ratio
(BCR). Appendix 3 presents analysis of the economic surplus using the Excel Sheet Approach.
3. RESULTS AND DISCUSSIONS
3.1 SOCIO-ECONOMIC CHARACTERISTICS OF BENEFICIARY PAPAYA FARMERS
The 60 respondents interviewed were made up of 6.7 % (4) female farmers and 93.3% (56) male farmers.
Very few females were noted to own papaya farms. This was expected as most women are involved in the
Researchjournali’s Journal of Agriculture Vol. 2 | No. 5 May | 2015
11
domestic marketing stage of the papaya value chain and also offer support during the harvesting and sorting
of the papaya fruits. Of the total respondent interviewed, 5 males (no female) fell within the age band of 21-
30 years, representing 8.3%, followed by age groups 31-40 years representing 21.7% (1 female, 12 males) of
the total. Age groups 41-50 years and 51-60 years contributed 26.7% (2 females, 12 males) and 35 %( 21
males, no female) respectively. Age groups 61years and above contributed 8.3 % (1 female, 4 males). It was
noted that majority of papaya farmers had formal education. Thus, 11.7%, 38.3%, 23.3% and 15% of
respondents had primary education, Junior/Middle school education, Senior Secondary education and tertiary
education respectively. While 10% had no education and 1.7% had professional training.
Basically, all the respondents were papaya farmers; either fulltime or part-time. However, 90% of the
respondents indicated that papaya farming is their full time occupation and cultivate other crops such as
maize, cassava, cocoa, coconut, palm tree etc. Majority of papaya farmers across the regions do not own the
land they operate on. In the survey, about 75% of the respondents did not own the land they were operating on
and had acquired it either through rent or squatting on public/private lands; 25 % of the farmers indicated they
owned the land and had acquired it mainly through family inheritance or outright purchase.
Majority of the respondents (35%) indicated that they have between 6-10 years‟ experience in papaya
farming, 10% were new entrants with between 1-2 years of experience in papaya farming. They indicated,
they had joined the papaya industry after the mealy bug menace having perceived it to be a profitable
diversified venture. 26.7% of the respondents had between 3-5 years of experience and 28.3% of respondent
having 11years and above experience in papaya farming. About 45% of the respondents had between 1-5
acres of papaya farm, 33.3% cultivated 6-10 acres, and 10% cultivate 11-20 acres and 11.7% of respondent
cultivating 21 acres and above. On the average, the farmers grow between 750 – 1200 stands of papaya per
acre.
Agricultural extension services are rare in papaya farming as majority of respondents (63.3 %) seldom receive
extension services. It was noted that all (100%) of papaya farmers grow the solo variety which has high
domestic and export demand. About 85% of respondents get their seed from family and friends or own
previous harvest. About 51.7% of respondent are in groups while 61.7% of respondents kept farm records on
input cost, yield, prices, income etc., this may be due to the fact that majority (88.3%) of papaya respondent
had formal education and are in groups. However, it was noted that data on farm record were not consistent
over time. About 86.7% of respondents finance their farm through personal savings and family and friend,
while 11.7% had bank and micro-finance loans to augment their personal savings.
In general, papaya farmers harvest throughout the year. However, August –January is the major season and
February – May being minor season. About 91.7% of respondents sell at the farm-gate to retailers,
wholesalers and market-queens, while 8.3% sell to supermarket, local processor and engage in export.
Researchjournali’s Journal of Agriculture Vol. 2 | No. 5 May | 2015
12
3.2 MEALYBUG INFESTATION, FARMER MANAGEMENT PRACTICES AND THE CLASSICAL
BIOLOGICAL CONTROL
In Ghana, the papaya mealybug infestation got to its epitome between the years 2009-2010 (PPRSD 2011),
however, about 30.1% of the respondent indicated they experienced the infestation in the year 2008 and
earlier. Papaya mealybug infestation appears on above ground parts on leaves, stem and fruits as clusters of
cotton-like masses (Tanwar et al, 2010). The infestation results in chlorosis, plant stunting, leaf deformation
or crinkling, early leaf and fruit drop, and eventual death of plants. At the peak of the infestation, papaya
fruits were rendered inedible due to the build-up of thick white waxy coating.
At the spur of desperation, prior to the introduction of the classical biological control, papaya farmers resorted
to all available conventional and traditional control measures. These included profuse spray of chemicals
(fungicides and insecticides), local detergent (“alata semina”), chilled and boiled water, powdered pepper etc.
with the view of killing or discomforting the mealybug build-up. Nevertheless, these approaches as indicated
by the respondents had no effect over the mealybug except increasing the operational cost of production. For
instance, a farmer at Ewutu Senya District (Central Region) who had 77 acres(about 77,000 papaya stands)
had to cut down his severely infested farm to about 10 acres. Other farmers abandoned their farms after
several attempts proved futile.
In the latter part of the year 2011, papaya farmers were introduced to the Classical Biological Control as
assistance from the Food and Agriculture Organisation of the United Nations (FAO) to the Government of
Ghana through the Plant Protection and Regulatory Services Directorate of the Ministry of Food And
Agriculture (PPRSD-MoFA).The PPRSD was adequately resourced with the laboratory equipment and
technical expertise to rear and to mass produce effective bio-agents and awareness raised among farmers
through farmer-fora, radio and television talk shows. A total release of 3,940 bio-agents (Acerophagus
Papayae) was made directly to selected farms at vantage locations across the five regions (Ashanti, Central,
Eastern, Greater Accra and Volta Region) from 2011 to 2013 at no cost to farmer. This was strategic because
bio-agents spread easily from one location to the other as long as there is mealybug. From the survey,
majority of the respondents (70%) indicated they had experienced the bio-agent on their farms through spread
from nearby farms. However, 30% of respondents had received the bio-agent by direct release on their farms.
It is worth-noting that 73.3% of respondents as of July, 2013 had indicated, they had a clean farm (no
mealybug on their farms as a result of the bio-agent). Meanwhile, 26.7% of farmers had indicated they had
pockets of lifeless mealybugs on the stems and leaves. All respondents (100%) had indicated, they had no bad
effect at all on their farms as results of the bio-agent release. The survey had revealed that most farmers,
especially those who experienced the bio-agent from nearby farms were not aware at the earlier stages that
they had the bio-agents (Acerophagus Papayae) on their farms. Therefore, they kept spraying strong
Researchjournali’s Journal of Agriculture Vol. 2 | No. 5 May | 2015
13
chemicals which adversely affected the activities of the bio-agents thereby prolonging the expected results of
mealybug control. However, due to the periodic monitoring and radio programs they became aware.
Majority of the respondents (65%) had rated the performance of the biological control as excellent, while
33.3% and 1.7% had rated the performance as very good and good respectively, adding that it was not quick
acting as it took between 15 -21 days before seeing the results. Meanwhile, most of the respondents (83.3%)
had indicated their willingness to pay for the bio-agent as an alternative pesticide if made available. However,
16.7 % of respondent indicated their unwillingness to pay as it should be the responsibility of the government
to sponsor such an activity. They also noted it does not take any effort for the bio-agent to migrate from a
nearby farm to theirs so there would not be any need to pay for them.
3.3 ECONOMIC SURPLUS ANALYSIS
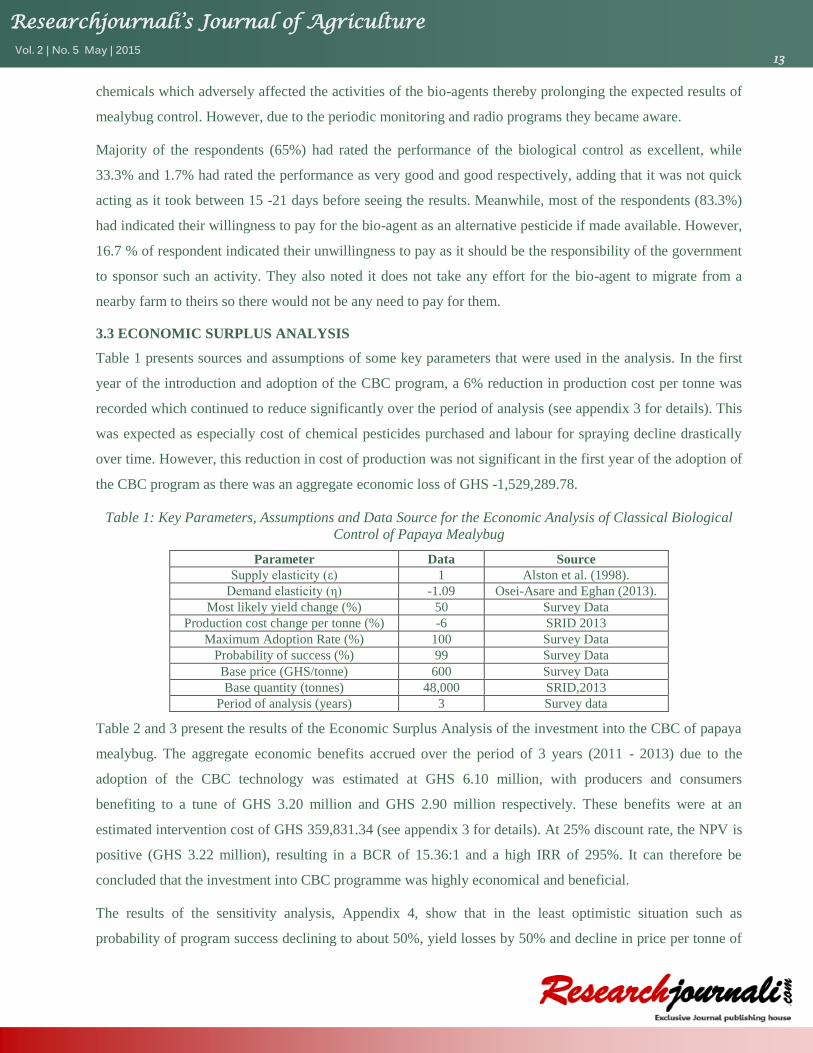
Table 1 presents sources and assumptions of some key parameters that were used in the analysis. In the first
year of the introduction and adoption of the CBC program, a 6% reduction in production cost per tonne was
recorded which continued to reduce significantly over the period of analysis (see appendix 3 for details). This
was expected as especially cost of chemical pesticides purchased and labour for spraying decline drastically
over time. However, this reduction in cost of production was not significant in the first year of the adoption of
the CBC program as there was an aggregate economic loss of GHS -1,529,289.78.
Table 1: Key Parameters, Assumptions and Data Source for the Economic Analysis of Classical Biological
Control of Papaya Mealybug
Parameter Data Source
Supply elasticity (ε) 1 Alston et al. (1998).
Demand elasticity (η) -1.09 Osei-Asare and Eghan (2013).
Most likely yield change (%) 50 Survey Data
Production cost change per tonne (%) -6 SRID 2013
Maximum Adoption Rate (%) 100 Survey Data
Probability of success (%) 99 Survey Data
Base price (GHS/tonne) 600 Survey Data
Base quantity (tonnes) 48,000 SRID,2013
Period of analysis (years) 3 Survey data
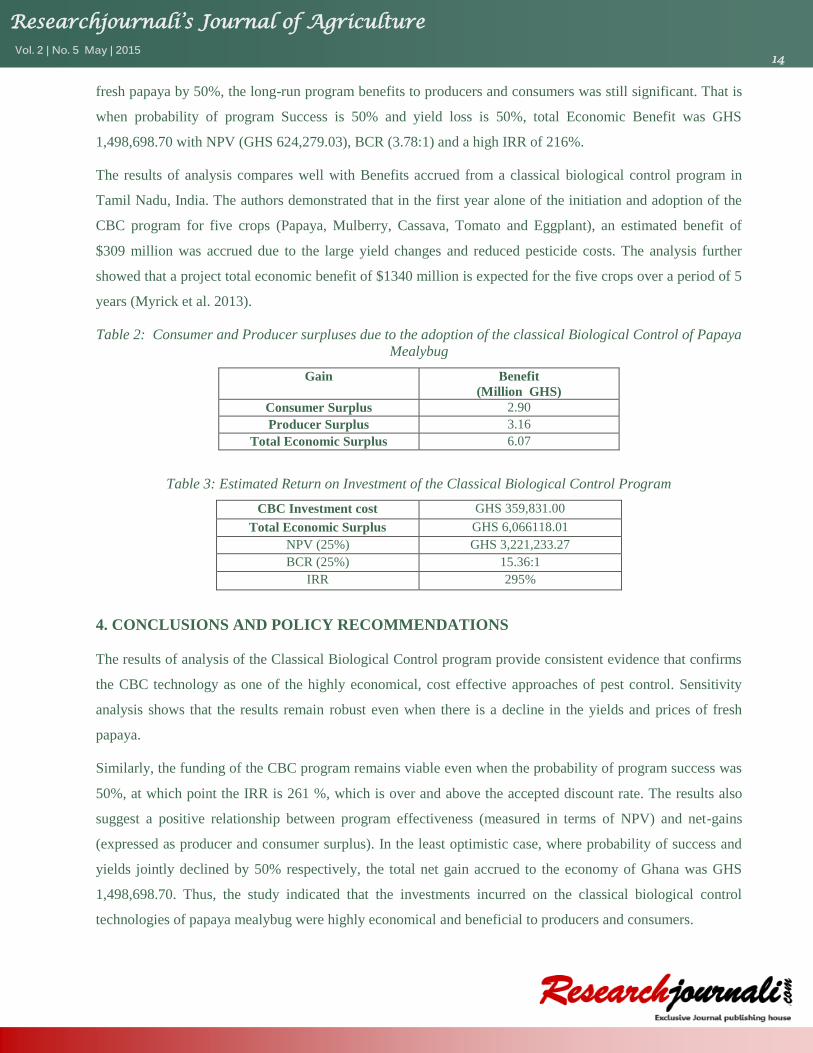
Table 2 and 3 present the results of the Economic Surplus Analysis of the investment into the CBC of papaya
mealybug. The aggregate economic benefits accrued over the period of 3 years (2011 - 2013) due to the
adoption of the CBC technology was estimated at GHS 6.10 million, with producers and consumers
benefiting to a tune of GHS 3.20 million and GHS 2.90 million respectively. These benefits were at an
estimated intervention cost of GHS 359,831.34 (see appendix 3 for details). At 25% discount rate, the NPV is
positive (GHS 3.22 million), resulting in a BCR of 15.36:1 and a high IRR of 295%. It can therefore be
concluded that the investment into CBC programme was highly economical and beneficial.
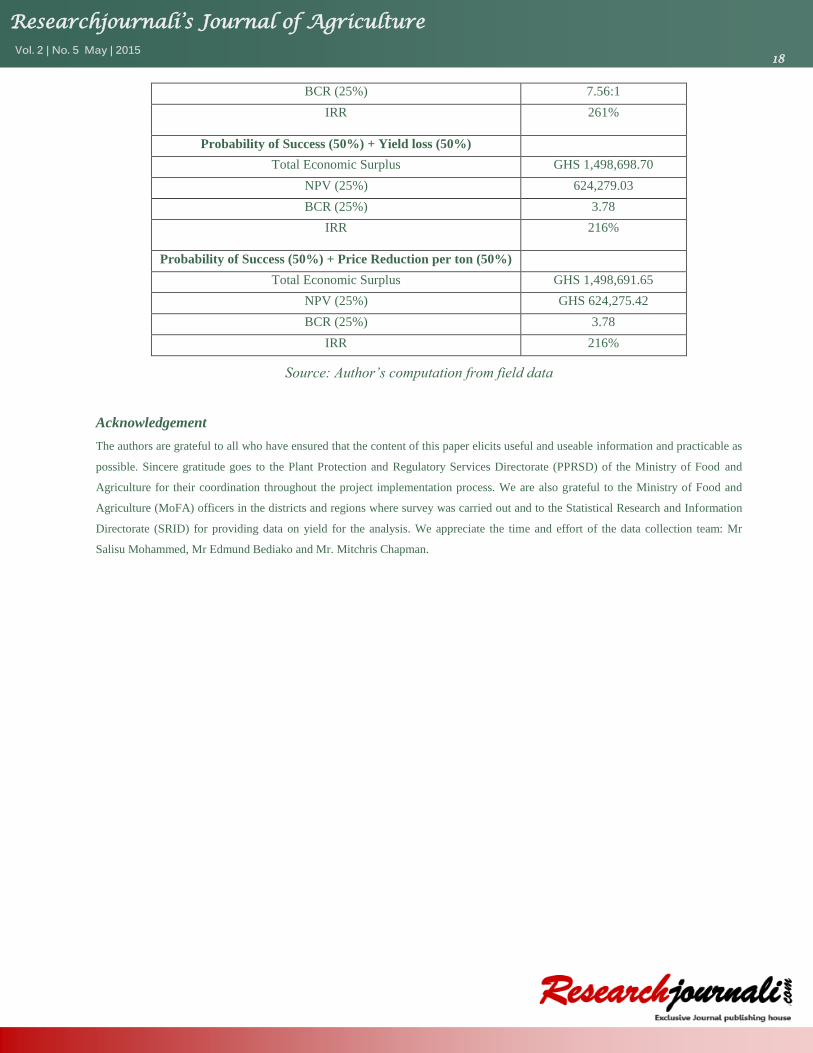
The results of the sensitivity analysis, Appendix 4, show that in the least optimistic situation such as
probability of program success declining to about 50%, yield losses by 50% and decline in price per tonne of
Researchjournali’s Journal of Agriculture Vol. 2 | No. 5 May | 2015
14
fresh papaya by 50%, the long-run program benefits to producers and consumers was still significant. That is
when probability of program Success is 50% and yield loss is 50%, total Economic Benefit was GHS
1,498,698.70 with NPV (GHS 624,279.03), BCR (3.78:1) and a high IRR of 216%.
The results of analysis compares well with Benefits accrued from a classical biological control program in
Tamil Nadu, India. The authors demonstrated that in the first year alone of the initiation and adoption of the
CBC program for five crops (Papaya, Mulberry, Cassava, Tomato and Eggplant), an estimated benefit of
$309 million was accrued due to the large yield changes and reduced pesticide costs. The analysis further
showed that a project total economic benefit of $1340 million is expected for the five crops over a period of 5
years (Myrick et al. 2013).
Table 2: Consumer and Producer surpluses due to the adoption of the classical Biological Control of Papaya
Mealybug
Gain Benefit
(Million GHS)
Consumer Surplus 2.90
Producer Surplus 3.16
Total Economic Surplus 6.07
Table 3: Estimated Return on Investment of the Classical Biological Control Program
CBC Investment cost GHS 359,831.00
Total Economic Surplus GHS 6,066118.01
NPV (25%) GHS 3,221,233.27
BCR (25%) 15.36:1
IRR 295%
4. CONCLUSIONS AND POLICY RECOMMENDATIONS
The results of analysis of the Classical Biological Control program provide consistent evidence that confirms
the CBC technology as one of the highly economical, cost effective approaches of pest control. Sensitivity
analysis shows that the results remain robust even when there is a decline in the yields and prices of fresh
papaya.
Similarly, the funding of the CBC program remains viable even when the probability of program success was
50%, at which point the IRR is 261 %, which is over and above the accepted discount rate. The results also
suggest a positive relationship between program effectiveness (measured in terms of NPV) and net-gains
(expressed as producer and consumer surplus). In the least optimistic case, where probability of success and
yields jointly declined by 50% respectively, the total net gain accrued to the economy of Ghana was GHS
1,498,698.70. Thus, the study indicated that the investments incurred on the classical biological control
technologies of papaya mealybug were highly economical and beneficial to producers and consumers.
Researchjournali’s Journal of Agriculture Vol. 2 | No. 5 May | 2015
15
Although survey results indicated that the technology came in as a last option for consideration, it is highly
recommended that the CBC is a socially acceptable, environmentally humane and economically sound
technology that‟s needs to be promoted, awareness created and supported by the government of Ghana as a
first line of action to best control. That is, papaya and other food security crops suffer attacks continually from
pest and diseases which can biologically be controlled to reduce the incidence of pesticide resistance.
The survey results also show that, with the youthful age range of 15 – 35 years (MoYS, 2010), the industry
offers a lot of opportunities for the youth in agriculture business as about 8.3% of producers are between the
ages 21 – 30 years. Although majority (88.3%) of papaya producers had formal education, it was noted that
data on farm record were not consistent over time. This could be due to the seldom agriculture extension
service delivery in the papaya industry. It is therefore recommended that capacity building activities be
promoted among farmers in the sector to enhance their farm business management skills for a profitable
engagement in the sector.
5. REFERENCES
Alston, J., Norton, G., Pardey, P. (1998). Science under Scarcity: Principles and Practice for Agricultural Research Evaluation and
Priority Setting. CAB International, Cambridge.
Belli, P., Anderson J. R., Barnum H. N., Dixon J. A. and J. P. Tan. (2001). Economic Analysis of Investment Operations: Analytical
Tools and Practical Applications. Washington, D.C.: World Bank.
Bellows, T. S. and Fisher, T. W. (1999). Hand Book of Biological Control: Principles and Applications of Biological Control.
Academic Press, San Diego, CA. 1046 pp.
Bellù, L.G. and Pansini, R. V. (2009).Quantitative Socio-Economic Policy Impact Analysis: A Methodological
Introduction, EASYPol Series FAO UN
Dupuit, J. (1844). „On the measurement of the utility of public works‟, Annales des Pontset Chaussees, Second Series, Vol. 8;
translation reprinted in D. Munby, Transport, 1968.
Elbasha, E., Thomton, P. K. and Tarawali, G. (1999). An Ex Post economic impact assessment of planted forages in West Africa,
ILRI (interventions International Livestock Research Institute), Nairobi, Kenya
FAO (2011). Support for the Control of New Invasive Papaya Mealybug (Paracoccus Marginatus) by Classical Biological Control in
Ghana, FAO Representation in Ghana, TCP/GHA/3404.
Gittinger, J.P. (1982). Economic Analysis of Agricultural project, Second edition, the John Hopkins University Press; Baltimore,
USA.
Godfray, H.C.J., Beddington J. R., Crute I. R., Haddad L., Lawrence D., Muir J. F., Pretty J., Robinson S., Thomas S. M. and Toulmin
C. (2010). Food security: the challenge of feeding 9 billion people. Science 327, 812–817.
Heu, R. A., Fukada M. T. and Conant, P. (2007). Papaya mealybug, Paracoccusmarginatus Williams and Granara de Willink
(Hemiptera: Pseudococcidae). State of Hawaii New Pest Advisory No. 04-03, 2 pp. Updated March 2007,
http://www.hawaiiag.org/hdoa/ npa/npa04-03-PMB.pdf.
Hoffmann, M.P. and Frodsham, A.C. (1993).Natural Enemies of Vegetable Insect Pests.Cooperative Extension, Cornell University,
Ithaca, NY.63 pp.
Researchjournali’s Journal of Agriculture Vol. 2 | No. 5 May | 2015
16
Kristjanson, P., Rowlands J., Swallow B., Kruska R. L., de Leeuw P. and Nagda S. (1999). Using the economic surplus model to
measure potential returns to international livestock research. The case of trypanosomosis vaccine research, ILRI impact assessment
series 4.ILRI (interventions International Livestock Research Institute), Nairobi, Kenya
Kristjanson, P., Tarawali S., Okike I., Singh B. B.,Thomton, P.K., Manyong, V. M., Kruska, R. L. and Hoogenboom, G. (2001).
Genetically improved dual-purpose cowpea: assessment of adoption and impact in the dry savanna region of west Africa.ILRI impact
assessment series 9.ILRI (interventions. International Livestock Research Institute), Nairobi, Kenya.
Mackauer, M., Ehler L. E. and Roland, J. (1990).Critical Issues in Biological Control. Intercept Ltd., Andover, UK. 330 pp.
Maitima, J. M., Rodroguiz, L.C., Kshatrija, M. and Mugtha, S. (2007).Guidelines for assessing environmental and socio-economic
impacts of tsetse and trypanosomiasisinterventions.International Livestock Research Institute (ILRI), Nairobi, Kenya.
Marshall, A. (1893) „On Rent‟, Economic Journal, 3 March.
METASIP (2011). Medium Term Agriculture Sector Investment Plan (2011 -2015), Ministry of Food and Agriculture, Ghana (2010)
ISBN: 978 - 9988 - 1 - 4656 – 6.
Meyerdirk, D. E., Muniappan, R, Warkentin, R., Bamba, J. and Reddy, G. V. P. (2004). Biological control of the papaya mealybug,
Paracoccusmarginatus (Hemiptera: Pseudococcidae) in Guam. Plant Prot. Quart. 19: 110-114.
Ministry of Food and Agriculture (2002). Agriculture in Ghana: Facts and Figures. PPMED, Accra.
Ministry of Youth and Sports (2010). National Youth Policy of Ghana. Accra.
Muniappan, R., Meyerdirk, D. E, Sengebau, F. M., Berringer, D. D. and Reddy, G. V. P. (2006). Classical biological control of the
papaya mealybug, Paracoccusmarginatus (Hemiptera: Pseudococcidae) in the Republic of Palau. Florida Entomol. 89: 212–217.
Myrick, S., Norton, G. W., Selvaraj, K.N., Natarajan, K. and Muniappan, R. (2013) Economic impact of classical biological control of
papaya mealybug in India. Elsevier, Crop Protection 56 (2014) 82 – 86.
Osei-Asare, Y. B and Eghan, M. (2013). Food Price Inflation and Consumer Welfare in Ghana. International Journal of Food and
Agricultural Economics, 1(1): 27-39
Peahin, R. and Dhawam, A. K. (2009). Integrated pest management: Volume 2, dissemination and impact.
PPRSD (2011). National Mealybug Survey Report. Plant Protection and Regulatory Services Directorate of Ministry of Food and
Agriculture, Pokuase, Accra.
Pretty, J., Toulmin, C. and Williams, S. (2011). Sustainable intensification in African agriculture, International Journal of Agricultural
Sustainability 9, 5–24
Shylesha, A.N., Joshi, S., Rabindra, R.J and Bhumannavar, B.S., (2010a) Classical biological control of the papaya mealybug. In:
Shylesha, A.N., Joshi, S., Rabindra, R.J., Bhumannavar, B.S. (Eds.), Classical Biological Control of Papaya (Paracoccus marginatus)
in India, Proceedings of the National Consultation Mtg.on Strategies for Deployment and Impact of the Imported Parasitoids of
Papaya Mealybug, pp. 73e78. Bangalore, India.
Stewart, R.D, Wyskida, R.M., Johannes, J.D. (1995). Cost estimator‟s reference manual, John Wiley and Sons, New York.
Tanwar, R.K., Jeyakumar, P. and Vennila, S. (2010). Papaya mealybug and its management strategies Technical Bulletin 22 National
Centre for Integrated Pest Management, New Delhi
Van Driesche, R. G. and Bellows, T. S. (1996). Biological Control. Chapman and Hall, NY. 539 pp.
Van Driesche, R., Hoddle, M. and Center, T., (2008). Control of Pests and Weeds by Natural Enemies: An Introduction to Biological
Control. Blackwell, Malden, MA, USA.473 pp.
Wellings, P. (1998). Biological Control Kluwer Academic Publishers Group. 192 pp.
Researchjournali’s Journal of Agriculture Vol. 2 | No. 5 May | 2015
17
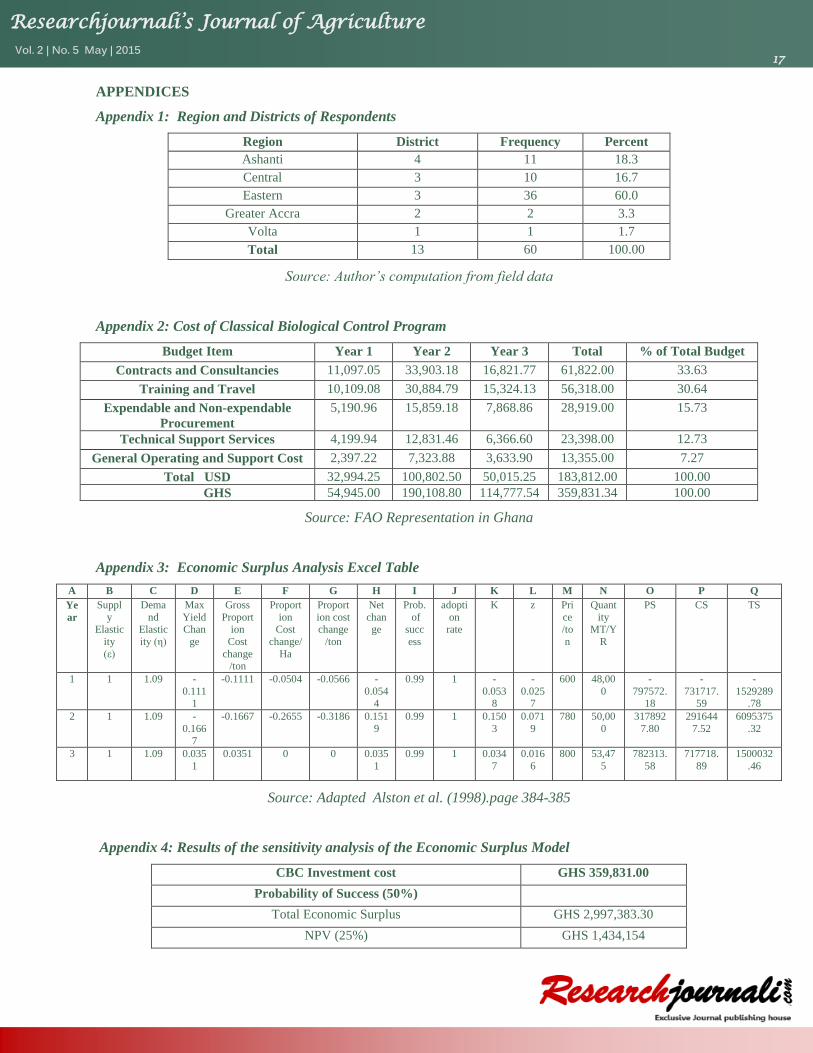
APPENDICES
Appendix 1: Region and Districts of Respondents
Region District Frequency Percent
Ashanti 4 11 18.3
Central 3 10 16.7
Eastern 3 36 60.0
Greater Accra 2 2 3.3
Volta 1 1 1.7
Total 13 60 100.00
Source: Author’s computation from field data
Appendix 2: Cost of Classical Biological Control Program
Source: FAO Representation in Ghana
Appendix 3: Economic Surplus Analysis Excel Table
A B C D E F G H I J K L M N O P Q
Ye
ar
Suppl
y Elastic
ity
(ε)
Dema
nd Elastic
ity (η)
Max
Yield Chan
ge
Gross
Proportion
Cost
change /ton
Proport
ion Cost
change/
Ha
Proport
ion cost change
/ton
Net
change
Prob.
of succ
ess
adopti
on rate
K z Pri
ce /to
n
Quant
ity MT/Y
R
PS CS TS
1 1 1.09 -
0.1111
-0.1111 -0.0504 -0.0566 -
0.0544
0.99 1 -
0.0538
-
0.0257
600 48,00
0
-
797572.18
-
731717.59
-
1529289.78
2 1 1.09 -
0.166
7
-0.1667 -0.2655 -0.3186 0.151
9
0.99 1 0.150
3
0.071
9
780 50,00
0
317892
7.80
291644
7.52
6095375
.32
3 1 1.09 0.035
1
0.0351 0 0 0.035
1
0.99 1 0.034
7
0.016
6
800 53,47
5
782313.
58
717718.
89
1500032
.46
Source: Adapted Alston et al. (1998).page 384-385
Appendix 4: Results of the sensitivity analysis of the Economic Surplus Model
CBC Investment cost GHS 359,831.00
Probability of Success (50%)
Total Economic Surplus GHS 2,997,383.30
NPV (25%) GHS 1,434,154
Budget Item Year 1 Year 2 Year 3 Total % of Total Budget
Contracts and Consultancies 11,097.05 33,903.18 16,821.77 61,822.00 33.63
Training and Travel 10,109.08 30,884.79 15,324.13 56,318.00 30.64
Expendable and Non-expendable
Procurement
5,190.96 15,859.18 7,868.86 28,919.00 15.73
Technical Support Services 4,199.94 12,831.46 6,366.60 23,398.00 12.73
General Operating and Support Cost 2,397.22 7,323.88 3,633.90 13,355.00 7.27
Total USD 32,994.25 100,802.50 50,015.25 183,812.00 100.00
GHS 54,945.00 190,108.80 114,777.54 359,831.34 100.00
Researchjournali’s Journal of Agriculture Vol. 2 | No. 5 May | 2015
18
BCR (25%) 7.56:1
IRR 261%
Probability of Success (50%) + Yield loss (50%)
Total Economic Surplus GHS 1,498,698.70
NPV (25%) 624,279.03
BCR (25%) 3.78
IRR 216%
Probability of Success (50%) + Price Reduction per ton (50%)
Total Economic Surplus GHS 1,498,691.65
NPV (25%) GHS 624,275.42
BCR (25%) 3.78
IRR 216%
Source: Author’s computation from field data
Acknowledgement
The authors are grateful to all who have ensured that the content of this paper elicits useful and useable information and practicable as
possible. Sincere gratitude goes to the Plant Protection and Regulatory Services Directorate (PPRSD) of the Ministry of Food and
Agriculture for their coordination throughout the project implementation process. We are also grateful to the Ministry of Food and
Agriculture (MoFA) officers in the districts and regions where survey was carried out and to the Statistical Research and Information
Directorate (SRID) for providing data on yield for the analysis. We appreciate the time and effort of the data collection team: Mr
Salisu Mohammed, Mr Edmund Bediako and Mr. Mitchris Chapman.