Ecological traits affect the response of tropical forest bird species to land-use intensity
9
doi: 10.1098/rspb.2012.2131 , 280 2013 Proc. R. Soc. B Hollie Booth and Drew W. Purves Tim Newbold, Jörn P. W. Scharlemann, Stuart H. M. Butchart, Çagan H. Sekercioglu, Rob Alkemade, species to land-use intensity Ecological traits affect the response of tropical forest bird Supplementary data tml http://rspb.royalsocietypublishing.org/content/suppl/2012/11/15/rspb.2012.2131.DC1.h "Data Supplement" References http://rspb.royalsocietypublishing.org/content/280/1750/20122131.full.html#ref-list-1 This article cites 40 articles, 9 of which can be accessed free Subject collections (180 articles) environmental science (1208 articles) ecology Articles on similar topics can be found in the following collections Email alerting service here right-hand corner of the article or click Receive free email alerts when new articles cite this article - sign up in the box at the top http://rspb.royalsocietypublishing.org/subscriptions go to: Proc. R. Soc. B To subscribe to on November 21, 2012 rspb.royalsocietypublishing.org Downloaded from
-
Upload
independent -
Category
Documents
-
view
0 -
download
0
Transcript of Ecological traits affect the response of tropical forest bird species to land-use intensity
doi 101098rspb20122131 280 2013 Proc R Soc B
Hollie Booth and Drew W PurvesTim Newbold Joumlrn P W Scharlemann Stuart H M Butchart Ccedilagan H Sekercioglu Rob Alkemade species to land-use intensityEcological traits affect the response of tropical forest bird
Supplementary data
tml httprspbroyalsocietypublishingorgcontentsuppl20121115rspb20122131DC1h
Data Supplement
Referenceshttprspbroyalsocietypublishingorgcontent280175020122131fullhtmlref-list-1
This article cites 40 articles 9 of which can be accessed free
Subject collections
(180 articles)environmental science (1208 articles)ecology
Articles on similar topics can be found in the following collections
Email alerting service hereright-hand corner of the article or click Receive free email alerts when new articles cite this article - sign up in the box at the top
httprspbroyalsocietypublishingorgsubscriptions go to Proc R Soc BTo subscribe to
on November 21 2012rspbroyalsocietypublishingorgDownloaded from
on November 21 2012rspbroyalsocietypublishingorgDownloaded from
rspbroyalsocietypublishingorg
ResearchCite this article Newbold T Scharlemann
JPW Butchart SHM Sekercioglu CH Alkemade
R Booth H Purves DW 2013 Ecological traits
affect the response of tropical forest bird
species to land-use intensity Proc R Soc B 280
20122131
httpdxdoiorg101098rspb20122131
Received 11 September 2012
Accepted 19 October 2012
Subject Areasecology environmental science
Keywordsbirds functional traits land-use change
likelihood-based model tropical forest
Author for correspondenceTim Newbold
e-mail timnewboldunep-wcmcorg
daggerPresent address School of Life Sciences
University of Sussex Brighton BN1 9QG UK
Electronic supplementary material is available
at httpdxdoiorg101098rspb20122131 or
via httprspbroyalsocietypublishingorg
amp 2012 The Author(s) Published by the Royal Society All rights reserved
Ecological traits affect the responseof tropical forest bird species toland-use intensity
Tim Newbold12 Jorn P W Scharlemann1dagger Stuart H M Butchart3Cagan H Sekercioglu45 Rob Alkemade6 Hollie Booth1 and Drew W Purves2
1United Nations Environment Programme World Conservation Monitoring Centre 219 Huntingdon RoadCambridge CB3 0DL UK2Computational Science Laboratory Microsoft Research Cambridge 7 JJ Thomson AvenueCambridge CB3 0FP UK3BirdLife International Wellbrook Court Cambridge CB3 0NA UK4Department of Biology University of Utah 257 South 1400 East Salt Lake City UT 84112 USA5KuzeyDoga Dernegi Istasyon Mahallesi Ismail Aytemiz Caddesi 36200 Kars Turkey6Netherlands Environmental Assessment Agency (PBL) PO Box 303 3720 Bilthoven The Netherlands
Land-use change is one of the main drivers of current and likely future biodi-
versity loss Therefore understanding how species are affected by it is crucial
to guide conservation decisions Species respond differently to land-use
change possibly related to their traits Using pan-tropical data on bird occur-
rence and abundance across a human land-use intensity gradient we tested
the effects of seven traits on observed responses A likelihood-based approach
allowed us to quantify uncertainty in modelled responses essential for apply-
ing the model to project future change Compared with undisturbed habitats
the average probability of occurrence of bird species was 78 per cent
and 314 per cent lower and abundance declined by 37 per cent and
192 per cent in habitats with low and high human land-use intensity respect-
ively Five of the seven traits tested affected the observed responses
significantly long-lived large non-migratory primarily frugivorous or insec-
tivorous forest specialists were both less likely to occur and less abundant
in more intensively used habitats than short-lived small migratory non-
frugivorousinsectivorous habitat generalists The finding that species
responses to land use depend on their traits is important for understanding
ecosystem functioning because speciesrsquo traits determine their contribution
to ecosystem processes Furthermore the loss of species with particular
traits might have implications for the delivery of ecosystem services
1 IntroductionAnthropogenic conversion of natural habitats presents one of the greatest
threats to biodiversity land-use change will probably remain a greater threat
than climate change over the coming decades especially in the tropics [1ndash3]
Habitat loss caused by land-use change limits speciesrsquo ability to move in
response to climate change and hence will probably exacerbate the effects of
climate change by increasing species extinctions [4] Moreover with global
human population expected to reach approximately 93 billion by 2050 [5]
coupled with increased wealth and demand for more varied diets the extent
of land-use change is likely to increase rapidly In order to reduce biodiversity
loss and to ensure the continued functioning of ecosystems we need to
understand how present and future land-use change will impact species
While the densities of most species are reduced in human-dominated land-
scapes [67] different species show widely varying responses to environmental
change and the extent and form of the response often depends on speciesrsquo eco-
logical and morphological traits For example the responses of a number of
taxamdashmeasured by extinction risk [8ndash11] population trends [1213] range
Figure 1 Location of studies included in analyses (white circles) based on geographical coordinates provided in the publication or georeferenced as accurately aspossible from the description of the study areas provided Therefore these provide an overview of the geographical coverage of studies included here rather thanaccurate locations The extent of tropical and sub-tropical forest biomes is shown (grey shading) as used in the IMAGE [31] based on the BIOME model [32] Allgridded data are at 058 resolution Shown in the World Geodetic System 1984 projection
rspbroyalsocietypublishingorgProcR
SocB28020122131
2
on November 21 2012rspbroyalsocietypublishingorgDownloaded from
shifts [1415] or sensitivity to specific drivers such as land-
use change [16] habitat fragmentation [17ndash21] disturbance
[22] and infrastructure [23]mdashto recent environmental changes
correlate with a variety of traits including body size fecund-
ity diet diet breadth habitat breadth natural abundance and
range size However we are still a long way from a general
understanding of how traits determine the response of
species to land-use change
For birds the best understood class of organisms
extinction risk correlates with body size habitat and diet
specialization migratory status and generation length
[2425] For understanding changes in the structure and func-
tion of ecosystems it will be important to understand how
the structure of local communities responds to environmental
change Local and regional studies have shown that sensi-
tivity to habitat loss and habitat fragmentation is associated
variously with body size reproductive rate diet and diet
breadth range size and population size [72026ndash28] An
informal comparison among these studies suggests that
species which are large-bodied slow-breeding sedentary
habitat and dietary specialistsmdashespecially frugivores and
insectivoresmdashwith small ranges and small population sizes
have shown the greatest declines in modified and fragmented
habitats These studies typically focused on species compo-
sition measured as the presence or the absence of species
and relatively few have considered changes in the abundance
of species that persist in modified habitats [7] However
abundance changes are known to have important effects on
the structure of communities and on the functioning of eco-
systems [29] Furthermore these studies generally focused
on particular regions or on a relatively small number of traits
We present a pan-tropical meta-analysis of the occurrence
and abundance of birds under different anthropogenic land-
use intensities to our knowledge the first such to consider the
effect traits on observed responses Using data from studies
spanning five continents (North and South America Africa
Asia and Oceania figure 1) we simultaneously test the
effect of seven traits body mass generation length range
size trophic level diet migratory status and forest habitat
specialization We focus on tropical and sub-tropical forest
biomes as these contain a large proportion of all bird species
[30] and because human populations are projected to
increase rapidly in these biomes during the rest of this cen-
tury The result is a set of conclusions about whether and
how different traits affect the response of bird species to
land-use change a quantification of the magnitude of unex-
plained variation in response that remains after the effect
traits have been accounted for and a simple model that
could be used in future studies to make projections of the
potential effects of land-use change in bird communities at
local regional or pan-tropical scales
2 Material and methods(a) Study areaThe meta-analysis included studies from all tropical and sub-
tropical areas (408 Nndash408 S) where the potential vegetation is
forest Potentially forested areas were defined according to the
classification used in the Integrated Model to Assess the Global
Environment (IMAGE [31]) which is based on the BIOME
model [32] (figure 1)
(b) Abundance dataEstimates of local population density (4685 records for
1317 species 22 of 6041 bird species whose range maps [33]
intersected the study area) were collated from 24 studies in
23 peer-reviewed publications covering sites distributed through-
out tropical and sub-tropical forests (figure 1) These were found
using a Thomson Reuters Web of Knowledge search in April
2008 using the following search term species diversity biodiversity
richness or abundance land use or habitat conversion and pristine
primary undisturbed or original and supplemented by an
additional search focused on the tropics in January 2010 using
the following search term [species] AND [tropic] AND [ primaryforest OR mature forest OR intact forest OR old growth forest ORvirgin forest OR pristine forest] AND [conversion OR degradationOR land use OR habitat type OR agro-forestry OR secondary forestOR plantation OR cropland OR urban area] AND [diversity ORbiodiversity OR richness OR abundance] (a full list of references is
given in the electronic supplementary material appendix S1
for details of the methods used to select the papers see [6]) To
check that the one study from sub-tropical forests in Australia
did not bias the results since it is likely to be environmentally
distinct from the other studies we repeated the models excluding
all data from this study
Records consisted of direct estimates of population density
eg using distance sampling methods (194 records in four studies)
counts of individuals or of groups (2917 records in 17 studies)
or as the frequency of occurrence across a number of samples of
a site (1574 records in four studies) The latter two measures of
density depend on sampling effort which in some cases differed
lightintensive
land use
presence presence presence
undisturbed
1 ndash PU 1 ndash PL 1 ndash PI
no
PU
yes no yes
PL PI
no yes
1 lnmL sL lnmI sI
probabilityof presence
relativeabundance
Figure 2 Model structure relating the presence or the absence and givenpresence local abundance of a species in three classes of land-use intensity(undisturbed light use and intensive use) In each class the species was definedas being present with probability PU PL and PI Abundances were normalized to1 in the undisturbed land-use class Observed abundances in the light andintensive land-use intensity classes were assumed to follow a lognormaldistribution (denoted lnfg) with mean (mL and mI) and sd (sL and sI) Thusthe basic model estimated seven parameters highlighted in grey
rspbroyalsocietypublishingorgProcR
SocB28020122131
3
on November 21 2012rspbroyalsocietypublishingorgDownloaded from
among samples in the same study We adjusted records that used
these two measures according to the relative sampling effort
assuming that perceived population density would increase line-
arly with sampling effort The implications of using frequency of
occurrence which is based on the presence and absence of species
as a proxy for abundance warrants further testing with a larger
dataset However for the main purpose of this study which was
to test the effect of speciesrsquo traits on responses to land-use intensity
a problem will only arise if traits have very different effects on
occurrence and abundance of species
Each record was assigned to one of three broad land-use inten-
sity classes based on human impacts on the vegetation at the site
as described in the paper from which the data were taken lsquoundis-
turbed habitatrsquo for sites in primary vegetation with very little
human disturbance lsquolightly used habitatrsquo for sites with intact natu-
ral vegetation but impacted to some degree by human activities
such as selective logging or harvesting of non-timber products
and including secondary vegetation or lsquointensively used habitatrsquo
for sites where the vegetation had been cleared for human use
including sites used for timber plantations perennial tree crops
agroforestry (agriculture intercropped with trees) low-input
arable agriculture high-input arable agriculture irrigated arable
agriculture and pasture A list of the specific local habitat
types included in each of the classes is given in the electronic
supplementary material appendix S2
The land-use intensity classes used were necessarily coarse
given the size of the dataset One of the distinctions excluded by
this classification was between vegetation where vertical structure
remained intact for example in forest plantations and vegetation
with no vertical structure such as some agricultural land uses
Vertical structure may play a role in determining the abundance
of species and the dominant traits in communities In the future
when larger datasets are available including the effect of vertical
structure on species with different traits may enable a better
understanding of community responses to land-use change
Where species were sampled several times in different
locations within one land-use intensity class within one study
we took the average of all non-zero densities across these samples
If a species was not recorded in a sampled land-use intensity class
then it was assigned a density of zero Differences among species
in absolute recorded densities may be at least partly owing to
differences in detectability [34] To avoid this source of bias we
compared the relative abundance of each species among any
land-use intensity classes sampled within each study
(c) Trait dataWe compiled data on seven traits body mass generation length
range size migratory status habitat affinity diet and trophic
level Data on the first five of these came from BirdLife Interna-
tionalrsquos World Bird Database (available online at httpwww
birdlifeorgdatazone) The data on body mass were compiled
primarily from Dunning [35] supplemented from a wide range
of field guides family monographs and other ornithological lit-
erature Data on generation length were based on published
and unpublished estimates for age at first breeding survival
and longevity applied to the formulae recommended by the
International Union for Conservation of Nature (IUCN) Stan-
dards and Petitions Subcommittee [36] Where species-specific
values of body mass and generation length were not available
for 36 and 26 species respectively we used estimates based on
mean values for congeners
Species were assigned to four migratory classes non-migrants
nomads altitudinal migrants and latitudinallongitudinal
migrants using data from the ornithological literature applied to
definitions developed by BirdLife International as follows Noma-
dic species move in response to resources that are sporadic and
unpredictable in distribution and timing and may congregate
but not predictably in terms of location and timing Altitudinal
migrants regularly or seasonally make cyclical movements to
higher or lower elevations with predictable timing and destinations
Latitudinallongitudinal migrants are species for which a substan-
tial proportion of the global or regional population makes regular or
seasonal cyclical movements beyond the breeding range with pre-
dictable timing and destinations This includes species that may be
migratory only in part of their rangepopulation short-distance
migrants and migrants that occasionally respond to unusual
conditions in a semi-nomadic way
Habitat preferences for each species were coded using the
IUCN Habitats Classification Scheme (httpwwwiucnredlist
orgtechnical-documentsclassification-schemeshabitats-classi-
fication-scheme-ver3) based on information in the ornithological
literature and reviewed by relevant experts The upper level
of the scheme as used in the analyses classifies habitats
as forest savannah shrubland grassland inland wetlands rocky
areas caves desert marine neritic marine oceanic marine coastal
marine intertidal artificial terrestrialaquatic and introduced
exotic vegetation The importance of each habitat inhabited by a
species was classified as major suitable marginal or unknown
(see httpwwwbirdlifeorgdatazoneinfospchabalt) For the
purposes of this study species were considered as forest specialists
if forest was recorded as being of major importance to the species
or as generalists otherwise
Range sizes were extracted from global distribution maps of
bird species [33] Diet data were compiled by one of us (CHS)
from the literature with most of the data from the Handbook ofthe birds of the world ([37] for a detailed description and a complete
list of sources see [38]) Species diet was classified into six groups
according to their primary diet fruit nectar other plant material
invertebrates vertebrates and mixed We also pooled these classes
by trophic level herbivores (fruit- nectar- and plant-eaters)
carnivores (invertebrate- and vertebrate-eaters) or omnivores
(d) Statistical analysisWe analysed the response of bird species to land use by using the
data described above to parametrize simple models using a like-
lihood-based model The models all had the same overall structure
(figure 2) defining first presence (and detection) in each land-use
intensity class and second given presence relative abundance
defined as local abundance relative to the abundance in
undisturbed light intensive
PP
light intensive
AR
land-use intensity
03
05
07
09(a)
04
08
12
16(b)
Figure 3 For 1317 tropical and sub-tropical bird species modelled estimatesof (a) the probability of presence (and detection PP) of any species in eachof the three land-use intensities considered and (b) given presence the ratioof abundance (AR) in light and intensive land use relative to undisturbed Thehorizontal line ( y frac14 1) indicates no difference in abundance compared withundisturbed land use Probabilities of presence and ratios of abundance wereestimated using Bayesian analysis with a MCMC sampling process anduninformative priors Error bars show 67 credible intervals
rspbroyalsocietypublishingorgProcR
SocB28020122131
4
on November 21 2012rspbroyalsocietypublishingorgDownloaded from
undisturbed habitat (ie no change in abundance compared with
undisturbed means a relative abundance of 1 a reduction in
abundance meant relative abundance of less than 1 increased
abundance meant a relative abundance above 1) These relative
abundance ratios were log-transformed in all analyses Observed
relative abundance ratios were assumed to follow a lognormal dis-
tribution The models were used to estimate seven parameters
(figure 2) probabilities of presence in primary light and intensive
land use (PU PL and PI) and the mean (mL and mI) and sd
(sL and sI) of abundance ratios in light and intensive land use
To analyse the effect of species traits on responses to land
use an additional set of parameters was included to modify
the probabilities of presence and abundance ratios according to
speciesrsquo traits The effects of mass and generation length were
treated as continuous functions having either a linear or quadra-
tic effect (quadratic effects required more parameters but did not
improve model fit and so are not discussed further here)
Trophic level diet migratory status and habitat specificity were
treated as categorical variables
We parametrized models containing every possible combi-
nation of traits separately against the data using standard
methods based on Markov Chain Monte Carlo (MCMC)
sampling This in turn allowed us to use a standard method
based on Akaike Information Criterion (AIC) values to (i) calcu-
late an overall measure of explanatory power for each trait by
weighting across the set of models according to their level of sup-
port given the data following [39] (ii) select the single best
model from the set of models and (iii) inspect parameter esti-
mates and confidence intervals on parameter estimates in
order to draw conclusions about the direction and magnitude
of the effects of traits on occurrence and abundance
The results of analyses comparing responses across species
may be biased because of phylogenetic non-independence Clo-
sely related species may respond similarly to land-use intensity
owing to some factor not captured in the model Including an
effect of phylogeny in the models was complicated by the multi-
factorial likelihood-based analysis used and because there is not
currently a fully resolved species-level phylogeny for birds
Instead we tested whether a phylogenetic signal in the response
of the bird species to land-use change remained unaccounted for
in our models by estimating Pagelrsquos l statistic for the residuals
of each of the parameters in our best model (see the electronic
supplementary material appendix S3 for full details)
The response of species to land-use intensity might vary
among the different studies included in the meta-analysis
owing to factors not accounted for in the models and this may
bias the perceived effect of traits on observed responses To
check that this was not the case we repeated the best model
and models fitting each of the traits individually with the
addition of study as a factor We did not run the full set of
models with study as a factor because the large number of free
parameters required (up to 182) was larger than justified by
the number of occurrence and abundance data and resulted in
long convergence times for the models
The data and code used to construct the models in this paper
are available on request from the corresponding author
3 ResultsThe probability of presence declined on average by 78 per cent
and 314 per cent in lightly and intensively used habitat respect-
ively compared with undisturbed habitat (figure 3a) Given
presence abundance was on average 37 per cent lower in
lightly used habitat and 192 per cent lower in intensively
used habitat compared with undisturbed habitat (figure 3b)
However there was considerable variation among species in
observed responses to land-use intensity
Including traits of species improved the ability to explain
observed changes in probability of presence and abundance
Of the 98 models with different combinations of traits con-
sidered the null model (including no traits) ranked 88th in
terms of its fit to the data (measured using the AIC)
Except range size and trophic level all traits had a substantial
effect (sum of AIC weights 03) on observed responses to
land-use intensity (figure 4 and table 1) and were contained
in at least one of the four highest ranked models in terms
of fit to the data (table 2) Bird species that are non-migratory
dependent on forest habitat andor that have diets primarily
of fruits and invertebrates occur with lower probability and at
lower abundances in intensively used habitats than migratory
habitat generalists with primary diets other than fruit and
invertebrates (figure 4andashf ) Furthermore probability of occur-
rence and abundance were relatively lower in intensively
used habitats compared with lightly used and undisturbed
habitats for species with larger body masses andor longer
generation lengths compared with small andor fast-breeding
species (figure 4gndash j)Even in the best modelmdashwhich included the effects of
generation length migratory behaviour diet and habitat
specializationmdashunexplained variation in observed responses
to land-use intensity remained substantial The parameters
describing the standard deviation in observed log-transformed
abundance ratios were 096 and 121 in light and intensively
used habitat respectively An sd of 1 in log-space corresponds
to variation in abundance change from a 65 per cent decline to a
27-fold increase
Including the study from which data were taken as a
factor in the models substantially improved the fit but
04
08
12
16
body mass (g)
0 2000 4000 600003
05
07
09
0 2000 4000 6000
body mass (g)
primary light intensive
04
08
12
16
0 5 10 15 20 25generation length (years)
03
05
07
09
0 5 10 15 20 25generation length (years)
primary light intensive
04
08
12
16
light intensive
land-use intensity
invertebrates vertebrates varied
03
05
07
09
undisturbed light intensive
land-use intensity
fruit nectar plants (other)
04
08
12
16
light intensive03
05
07
09
undisturbed light intensive
non -migratory migratory
04
08
12
16
light intensive
AR
AR
AR
AR
AR
03
05
07
09
undisturbed light intensive
PPPP
PPPP
PP
habitat generalists forest specialists(a)
(c) (d )
( f )(e)
(g)(h)
( j)(i)
(b)
Figure 4 For 1317 tropical and sub-tropical bird species modelled estimates of probabilities of presence (PP) in each of three land-use intensities (acegi) and givenpresence ratios of abundance (AR) in light relative to undisturbed and in intensive relative to undisturbed land use (bdfhj ) Probabilities of presence and ratios ofabundance were modelled as functions of speciesrsquo traits Traits shown here are those for which the sum of AIC weights of all models containing them was greater than03 (see [39] for more details) (ab) forest habitat specificity (AIC weight sum 1) (cd ) migratory status (AIC weight sum 1) (ef ) diet (AIC weight sum frac14 0997)(gh) generation length (AIC weight sum frac14 0689) and (ij ) body mass (AIC weight sumfrac14 0336) Methods were the same as used in figure 3
rspbroyalsocietypublishingorgProcR
SocB28020122131
5
on November 21 2012rspbroyalsocietypublishingorgDownloaded from
did not qualitatively alter the effect of traits on observed
responses (see the electronic supplementary material
appendix S4) Dropping data from the Australian sub-tropical
study similarly did not alter the results (see the electronic
supplementary material appendix S5) The phylogenetic
signal in the residuals of the model was weak (l 009)
and significant ( p 005) only for two of the five
residual types (see the electronic supplementary material
appendix S3 for full details)
4 DiscussionOverall the results show a substantial global impact of land
use on the local abundance of bird species in tropical forests
Table 1 The relative ability of each of six functional traits to explainobserved responses of 1317 tropical and sub-tropical bird species to land-use intensity Explanatory power was estimated as the sum of AIC weights[1] of all models containing a given trait from a set of models fitting allpossible combinations of traits Response to land-use intensity wasmodelled as the probability of presence of species in each of three land-useintensity classesmdashundisturbed light and intensivemdashand given presencethe abundance ratio in light relative to undisturbed and intensive relativeto undisturbed land use AIC weights were calculated following [1]
trait sum of AIC weights
mass 0336
generation length 0689
range size 0150
migratory status 1000
trophic level 0003
diet 0997
forest specialization 1000
rspbroyalsocietypublishingorgProcR
SocB28020122131
6
on November 21 2012rspbroyalsocietypublishingorgDownloaded from
consistent with the results of several previous studies on a
wide range of species including birds [1364041] Compared
with undisturbed land use both the probability of species
occurrence and abundance given occurrence was slightly
lower in land-use classes impacted by humans but where the
native vegetation remains largely intact In land-use classes
involving clearance of the natural vegetation species
occurrence and abundance were both markedly reduced
The effect of land-use intensity on tropical forest bird
species differed among species with different ecological
traits species that are large-bodied slower-breeding non-
migratory that depend on forest habitat andor that feed
primarily on fruit and invertebrates showed greater declines
than other species The effect of habitat specialization on
the response to land-use intensity has been shown previously
to affect the extinction risk of birds [2425] as well as their
response to habitat fragmentation [21] Species that are
dependent on forest habitat are likely to be more adversely
impacted by forest clearance or degradation of forest habitat
than species with broader habitat preferences Reproductive
rate for which generation length was used here as a proxy
probably affects the ability of populations to recover after per-
turbations and probably also correlates with population
abundance which might affect speciesrsquo vulnerability Repro-
ductive rate is known to correlate with extinction risk [24]
and minimum habitat requirements of bird species [27] but
is only available for a small minority of tropical bird species
Although migratory bird species are 26 times less likely to be
threatened or near threatened with extinction [25] the effect
of migratory status on response to land-use change has not
been shown before In fact it is often migratory bird species
that decline the most in response to habitat fragmentation
[18] In our analysis migratory species tend also to be habitat
generalists (x2 frac14 6336 p 00001) being adapted to cope
with a broader suite of habitats on migration
It has been suggested that species at higher trophic levels
should be more vulnerable to environmental changes because
they occur at lower densities [18] However we found no evi-
dence of an effect of trophic position on the response of birds
to land-use change On the other hand diet had a very strong
effect with insectivores and frugivores declining most consist-
ently in human-impacted land-use classes The sensitivity of
frugivorous and insectivorous birds to habitat fragmentation
and to land-use change has been shown before (and may
result from a reduction in the abundance of fruiting trees
and invertebrates [2126]) but this is to our knowledge the
first analysis to show this effect using a global dataset Large
body size often correlates with increased extinction risk and
sensitivity to human activities in a wide variety of animal taxo-
nomic groups including birds [112426283842] This is
probably because body size correlates with traits that directly
affect speciesrsquo vulnerability such as reproductive rate abun-
dance and trophic level [1823] In this study the effect of
body mass on response to land-use intensity was weak and
was not included in the best model Bird species with small
range sizes have been shown to be more sensitive to habitat
fragmentation than more wide-ranging species [42] However
we failed to detect an effect of range size on the response to
land-use intensity Range size probably affects vulnerability
indirectly because species with small range sizes typically
occur at lower densities [43] and probably have more specific
habitat requirements than more widespread species It is also
possible that species with small ranges and low density were
missed in the studies included here and that an effect of
range size was thus missed Range size may also correlate
with other traits that we considered here such as reproductive
rate and body mass which might account for the failure to
detect an effect of range size on observed responses
The results of analyses like this one can be biased
by sampling artefacts and issues of detectability [34]
Abundance will differ among species and will also vary geo-
graphically for a single species Furthermore reported
abundance will differ among species because of differences
in detectability [34] We avoided most of these issues by com-
paring the abundance among land-use classes of each species
within each study thus comparing abundances for the same
species in a very similar geographical location Nevertheless
issues of detectability may have remained For example it is
likely that birds are more easily detected where vegetation
has been cleared than in intact natural vegetation As a
result the estimated overall response of bird species to
land-use intensity would be an underestimate On the other
hand there may have been a bias towards the publication
of papers that showed a significant effect of land use on
bird abundance although species that did not respond to
land use will also have been included because most studies
sampled whole bird assemblages The perceived association
between traits and responses to land-use intensity will only
have been biased if the effect of traits and land use on the
detectability of species covary with one another
This study focused on the direct effects that local land-use
intensity has on local bird communities However at
landscape and regional scales land use can result in fragmen-
tation and reduction in area of remaining natural habitat (see
[19] for a review) In future analyses the effect of habitat frag-
mentation could be considered assuming that accurate
locations and associated environmental data for the individ-
ual sites sampled were available Abundance could then be
related to the size of habitat patches and the nature of the
habitat in the surrounding landscape derived for example
from remotely sensed data
Although traits improved our ability to explain observed
changes in the occurrence and abundance of tropical bird
Table 2 The four best models for explaining the response of 1317 tropical and sub-tropical bird species to land-use intensity (The fit of each model to thedata was measured using the AIC shown here as the difference between the AIC of the model in question and lowest AIC of all models Traits included inthese models were GL generation length MIGR migratory status DIET dietary guild FORSPEC whether the species was a forest specialist MASS body massResponse to land-use intensity was modelled as the probability of presence of species in each of three land-use intensitiesmdashundisturbed light and intensivemdashand given presence the abundance ratio in light relative to undisturbed and intensive relative to undisturbed land use AIC weights reflect the relative supportfor each model in terms of AIC values and were calculated following [1])
rank model AIC difference AIC weight
1 GLthorn MIGRthorn DIETthorn FORSPEC 0 0455
2 MASSthorn GLthorn MIGRthorn DIETthorn FORSPEC 2235 0131
3 MASSthorn MIGRthorn DIETthorn FORSPEC 2253 0124
4 MIGRthorn DIETthorn FORSPEC 2260 0057
rspbroyalsocietypublishingorgProcR
SocB28020122131
7
on November 21 2012rspbroyalsocietypublishingorgDownloaded from
species considerable unexplained variation remained in the
model The four most obvious sources of this variability
are (i) an effect of traits of the species not captured in the
models (ii) a degree of subjectivity in the assignment of
records to land-use classes because these were based on the
assessments of individual authors (iii) changes in abundance
in response to other pressures including habitat fragmenta-
tion and vegetation structure and (iv) local and regional
differences in the impact of different land-use regimes The
latter explanation is supported by the fact that fitting study
as a factor in the models substantially improved the fit of
the models The effect of traits was consistent in spite of
this spatial variation in observed responses and the causes
of the variation would make an interesting topic for future
study In practical terms the consequence of unexplained
variation in the models is that it will not be possible to
make a precise prediction about the occurrence and abun-
dance of a specific species in a specific location However
the models can be used to make predictions of which species
are more or less likely to be vulnerable to land-use change
and of change in the overall structure of bird communities
in response to changes in land-use intensity
More closely related species could be expected to respond
more similarly to land-use intensity than more distantly
related species which could bias the apparent effect of traits
on response to land-use intensity since the traits are also
likely to covary with relatedness We tested for phylogenetic
signal in the residuals of the best-fitting model finding a sig-
nificant signal for only two of the five residual types
namely for the probability of occurrence in lightly and inten-
sively used habitats The effect of traits was strong and
consistent for both probabilities of occurrence and abun-
dances Therefore the main result of our study was not
affected by phylogenetic non-independence
Overall land-use change presents a serious threat
to forest birds especially for species with particular
combinations of ecological traits As well as allowing the
identification of species of particular conservation concern
differences in the response of species with different sets of
traits also have implications for the functioning of ecosystems
and for the delivery of ecosystem services [38] Dispropor-
tionate declines in the abundance of species with particular
traits will reduce the functional diversity of biological com-
munities which will probably impair the functioning of
ecosystems and make them less resilient to other environ-
mental changes [44] The loss of species with particular
traits will also affect the delivery of specific ecosystem ser-
vices For example insectivorous birds play an important
role in pest control in ecosystems [45] while frugivores are
essential for seed dispersal especially in the tropics [4647]
We show that both of these guilds show consistently negative
responses to forest clearance in sites throughout the tropics
potentially having serious implications for agriculture The
novel likelihood-based approach to analysing responses to
land use allows uncertainty in the observed responses to be
quantified which will be crucial when projecting future
changes to biological communities
We thank the volunteers and students (Felicity Bedford Vicki PowellJulie Day Alexandra Robinson and Jake Simpson) who assisted withthe compilation of the data and Andy Purvis for invaluable adviceon the project and comments on a draft of the manuscript CHSthanks the University of Utah for its support and is grateful toSherron Bullens Debbie Fisher David Hayes and especially BethKarpas and Kathleen McMullen for their dedicated help with theworld bird ecology database We also thank two anonymousreviewers for valuable comments on an earlier draft of this paperThe data used in this study are available on request from TN
References
1 Jetz W Wilcove DS Dobson AP 2007 Projectedimpacts of climate and land-use change on theglobal diversity of birds PLoS Biol 5 e157 (doi101371journalpbio0050157)
2 Green RE Cornell SJ Scharlemann JPW Balmford A2005 Farming and the fate of wild natureScience 307 550 ndash 555 (doi101126science1106049)
3 Gibson L et al 2011 Primary forests areirreplaceable for sustaining tropicalbiodiversity Nature 478 378 ndash 381 (doi101038nature10425)
4 Sekercioglu CH Schneider SH Fay JP Loarie SR2008 Climate change elevational range shifts andbird extinctions Conserv Biol 22 140 ndash 150(doi101111j1523-1739200700852x)
5 United Nations Population Division 2011 WorldPopulation Prospects The 2010 Revision PopulationDatabase See httpwwwunorgesapopulation
6 Alkemade R van Oorschot M Miles L Nellemann CBakkenes M ten Brink B 2009 GLOBIO3 aframework to investigate options for reducingglobal terrestrial biodiversity loss Ecosystems 12374 ndash 390 (doi101007s10021-009-9229-5)
rspbroyalsocietypublishingorgProcR
SocB28020122131
8
on November 21 2012rspbroyalsocietypublishingorgDownloaded from
7 Phalan B Onial M Balmford A Green RE 2011Reconciling food production and biodiversityconservation land sharing and land sparingcompared Science 333 1289 ndash 1291 (doi101126science1208742)
8 Koh LP Sodhi NS Brook BW 2004 Ecologicalcorrelates of extinction proneness in tropicalbutterflies Conserv Biol 18 1571 ndash 1578 (doi101111j1523-1739200400468x)
9 Jones KE Purvis A Gittleman JL 2003 Biologicalcorrelates of extinction risk in bats Am Nat 161601 ndash 614 (doi101086368289)
10 Kotiaho JS Kaitala V Komonen A Paivinen J 2005Predicting the risk of extinction from sharedecological characteristics Proc Natl Acad Sci USA102 1963 ndash 1967 (doi101073pnas0406718102)
11 Davidson AD Hamilton MJ Boyer AG Brown JHCeballos G 2009 Multiple ecological pathways toextinction in mammals Proc Natl Acad Sci USA 10610 702 ndash 10 705 (doi101073pnas0901956106)
12 Kotze DJ OrsquoHara RB 2003 Species declinemdashbutwhy Explanations of carabid beetle (ColeopteraCarabidae) declines in Europe Oecologia 135138 ndash 148 (doi101007s00442-002-1174-3)
13 Murray KA Rosauer D McCallum H Skerratt LF2011 Integrating species traits with extrinsic threatsclosing the gap between predicting and preventingspecies declines Proc R Soc B 278 1515 ndash 1523(doi101098rspb20101872)
14 Mattila N Kaitala V Komonen A Kotiaho JSPaivinen J 2006 Ecological determinants ofdistribution decline and risk of extinction in mothsConserv Biol 20 1161 ndash 1168 (doi101111j1523-1739200600404x)
15 Mattila N Kaitala V Komonen A Paivinen JKotiaho JS 2011 Ecological correlates of distributionchange and range shift in butterflies Insect ConservDivers 4 239 ndash 246 (doi101111j1752-4598201100141x)
16 Barragan F Moreno CE Escobar F Halffter GNavarrete D 2011 Negative impacts of human landuse on dung beetle functional diversity PLoS ONE 6e17976 (doi101371journalpone0017976)
17 Davies KF Margules CR Lawrence JF 2000 Whichtraits of species predict population declines inexperimental forest fragments Ecology 81 1450 ndash1461 (doi1018900012-9658(2000)081[1450WTOSPP]20CO2)
18 Henle K Davies KF Kleyer M Margules C Settele J2004 Predictors of species sensitivity tofragmentation Biodivers Conserv 13 207 ndash 251(doi101023BBIOC0000004319916439e)
19 Ewers RM Didham RK 2006 Confounding factors inthe detection of species responses to habitatfragmentation Biol Rev 81 117 ndash 142 (doi101017S1464793105006949)
20 Barbaro L van Halder I 2009 Linking bird carabidbeetle and butterfly life-history traits to habitatfragmentation in mosaic landscapes Ecography 32321 ndash 333 (doi101111j1600-0587200805546x)
21 Vetter D Hansbauer MM Vegvari Z Storch I 2011Predictors of forest fragmentation sensitivity inNeotropical vertebrates a quantitative review Ecography34 1 ndash 8 (doi101111j1600-0587201006453x)
22 Bernhardt-Romermann M et al 2011 Functionaltraits and local environment predict vegetationresponses to disturbance a pan-European multi-siteexperiment J Ecol 99 777 ndash 787 (doi101111j1365-2745201101794x)
23 Rytwinski T Fahrig L 2011 Reproductive rate andbody size predict road impacts on mammalabundance Ecol Appl 21 589 ndash 600 (doi10189010-09681)
24 Owens IPF Bennett PM 2000 Ecological basis ofextinction risk in birds habitat loss versus humanpersecution and introduced predators Proc NatlAcad Sci USA 97 12 144 ndash 12 148 (doi101073pnas200223397)
25 Sekercioglu CH 2007 Conservation ecology areatrumps mobility in fragment bird extinctions Curr Biol17 R283 ndash R286 (doi101016jcub200702018)
26 Cleary DFR Boyle TJB Setyawati T Anggraeni CDVan Loon EE Menken SBJ 2007 Bird species andtraits associated with logged and unlogged forest inBorneo Ecol Appl 17 1184 ndash 1197 (doi10189005-0878)
27 Vance MD Fahrig L Flather CH 2003 Effect ofreproductive rate on minimum habitat requirementsof forest-breeding birds Ecology 84 2643 ndash 2653(doi10189002-0159)
28 Tscharntke T Sekercioglu CH Dietsch TV Sodhi NSHoehn P Tylianakis JM 2008 Landscape constraintson functional diversity of birds and insects intropical agroecosystems Ecology 89 944 ndash 951(doi10189007-04551)
29 Gaston KJ Fuller RA 2008 Commonness populationdepletion and conservation biology Trends EcolEvol 23 14 ndash 19 (doi101016jtree200711001)
30 Sekercioglu CH 2012 Bird functional diversity andecosystem services in tropical forests agroforestsand agricultural areas J Ornithol 153 S153 ndash S161(doi101007s10336-012-0869-4)
31 Bouwman AF Kram T Klein Goldwijk K (eds) 2006Integrated modelling of global environmentalchange an overview of IMAGE 24 Bilthoven TheNetherlands Netherlands EnvironmentalAssessment Agency
32 Prentice IC Cramer W Harrison SP Leemans RMonserud RA Solomon AM 1992 A global biomemodel based on plant physiology and dominancesoil properties and climate J Biogeogr 19117 ndash 134 (doi1023072845499)
33 Birdlife International and NatureServe 2011 Birdspecies distribution maps of the world See httpwwwbirdlifeorgdatazoneinfospcdownload
34 Thornton D Branch L Sunquist M 2011 Passivesampling effects and landscape location alterassociations between species traits and responseto fragmentation Ecol Appl 21 817 ndash 829(doi10189010-05491)
35 Dunning JB 1993 CRC handbook of avian bodymasses Boca Raton FL CRC Press
36 IUCN Standards and Petitions Subcommittee 2010Guidelines for Using the IUCN Red List Categories andCriteria v 80 See httpintranetiucnorgwebfilesdocSSCRedListRedListGuidelinespdf
37 Del Hoyo J Elliott A Sargatal J 1992 Handbook ofthe birds of the world Barcelona Spain LynxEdicions
38 Sekercioglu CcedilH Daily GC Ehrlich PR 2004Ecosystem consequences of bird declines Proc NatlAcad Sci USA 101 18 042 ndash 18 047 (doi101073pnas0408049101)
39 Burnham KP Anderson DR 2002 Model selectionand multimodel inference a practical information-theoretic approach New York NY Springer
40 Sala OE et al 2000 Global biodiversity scenarios forthe year 2100 Science 287 1770 ndash 1774 (doi101126science28754591770)
41 Pimm S Raven P Peterson A Sekercioglu CcedilHEhrlich PR 2006 Human impacts on the rates ofrecent present and future bird extinctions ProcNatl Acad Sci USA 103 10 941 ndash 10 946 (doi101073pnas0604181103)
42 Renjifo LM 1999 Composition changes in aSubandean avifauna after long-term forestfragmentation Conserv Biol 13 1124 ndash 1139(doi101046j1523-1739199998311x)
43 Gaston KJ Blackburn TM Lawton JH 1997Interspecific abundance-range size relationshipsan appraisal of mechanisms J Anim Ecol 66579 ndash 601 (doi1023075951)
44 Hooper DU et al 2005 Effects of biodiversity onecosystem functioning a consensus of currentknowledge Ecol Monogr 75 3 ndash 35 (doi10189004-0922)
45 Van Bael SA Brawn JD Robinson SK 2003 Birdsdefend trees from herbivores in a Neotropical forestcanopy Proc Natl Acad Sci USA 100 8304 ndash 8307(doi101073pnas1431621100)
46 Sekercioglu CH 2006 Increasing awareness of avianecological function Trends Ecol Evol 21 464 ndash 471(doi101016jtree200605007)
47 Wenny DG DeVault TL Johnson MD Kelly DSekercioglu CH Tomback DF Whelan CJ 2011 Theneed to quantify ecosystem services provided bybirds Auk 128 1 ndash 14 (doi101525auk201110248)

on November 21 2012rspbroyalsocietypublishingorgDownloaded from
rspbroyalsocietypublishingorg
ResearchCite this article Newbold T Scharlemann
JPW Butchart SHM Sekercioglu CH Alkemade
R Booth H Purves DW 2013 Ecological traits
affect the response of tropical forest bird
species to land-use intensity Proc R Soc B 280
20122131
httpdxdoiorg101098rspb20122131
Received 11 September 2012
Accepted 19 October 2012
Subject Areasecology environmental science
Keywordsbirds functional traits land-use change
likelihood-based model tropical forest
Author for correspondenceTim Newbold
e-mail timnewboldunep-wcmcorg
daggerPresent address School of Life Sciences
University of Sussex Brighton BN1 9QG UK
Electronic supplementary material is available
at httpdxdoiorg101098rspb20122131 or
via httprspbroyalsocietypublishingorg
amp 2012 The Author(s) Published by the Royal Society All rights reserved
Ecological traits affect the responseof tropical forest bird species toland-use intensity
Tim Newbold12 Jorn P W Scharlemann1dagger Stuart H M Butchart3Cagan H Sekercioglu45 Rob Alkemade6 Hollie Booth1 and Drew W Purves2
1United Nations Environment Programme World Conservation Monitoring Centre 219 Huntingdon RoadCambridge CB3 0DL UK2Computational Science Laboratory Microsoft Research Cambridge 7 JJ Thomson AvenueCambridge CB3 0FP UK3BirdLife International Wellbrook Court Cambridge CB3 0NA UK4Department of Biology University of Utah 257 South 1400 East Salt Lake City UT 84112 USA5KuzeyDoga Dernegi Istasyon Mahallesi Ismail Aytemiz Caddesi 36200 Kars Turkey6Netherlands Environmental Assessment Agency (PBL) PO Box 303 3720 Bilthoven The Netherlands
Land-use change is one of the main drivers of current and likely future biodi-
versity loss Therefore understanding how species are affected by it is crucial
to guide conservation decisions Species respond differently to land-use
change possibly related to their traits Using pan-tropical data on bird occur-
rence and abundance across a human land-use intensity gradient we tested
the effects of seven traits on observed responses A likelihood-based approach
allowed us to quantify uncertainty in modelled responses essential for apply-
ing the model to project future change Compared with undisturbed habitats
the average probability of occurrence of bird species was 78 per cent
and 314 per cent lower and abundance declined by 37 per cent and
192 per cent in habitats with low and high human land-use intensity respect-
ively Five of the seven traits tested affected the observed responses
significantly long-lived large non-migratory primarily frugivorous or insec-
tivorous forest specialists were both less likely to occur and less abundant
in more intensively used habitats than short-lived small migratory non-
frugivorousinsectivorous habitat generalists The finding that species
responses to land use depend on their traits is important for understanding
ecosystem functioning because speciesrsquo traits determine their contribution
to ecosystem processes Furthermore the loss of species with particular
traits might have implications for the delivery of ecosystem services
1 IntroductionAnthropogenic conversion of natural habitats presents one of the greatest
threats to biodiversity land-use change will probably remain a greater threat
than climate change over the coming decades especially in the tropics [1ndash3]
Habitat loss caused by land-use change limits speciesrsquo ability to move in
response to climate change and hence will probably exacerbate the effects of
climate change by increasing species extinctions [4] Moreover with global
human population expected to reach approximately 93 billion by 2050 [5]
coupled with increased wealth and demand for more varied diets the extent
of land-use change is likely to increase rapidly In order to reduce biodiversity
loss and to ensure the continued functioning of ecosystems we need to
understand how present and future land-use change will impact species
While the densities of most species are reduced in human-dominated land-
scapes [67] different species show widely varying responses to environmental
change and the extent and form of the response often depends on speciesrsquo eco-
logical and morphological traits For example the responses of a number of
taxamdashmeasured by extinction risk [8ndash11] population trends [1213] range
Figure 1 Location of studies included in analyses (white circles) based on geographical coordinates provided in the publication or georeferenced as accurately aspossible from the description of the study areas provided Therefore these provide an overview of the geographical coverage of studies included here rather thanaccurate locations The extent of tropical and sub-tropical forest biomes is shown (grey shading) as used in the IMAGE [31] based on the BIOME model [32] Allgridded data are at 058 resolution Shown in the World Geodetic System 1984 projection
rspbroyalsocietypublishingorgProcR
SocB28020122131
2
on November 21 2012rspbroyalsocietypublishingorgDownloaded from
shifts [1415] or sensitivity to specific drivers such as land-
use change [16] habitat fragmentation [17ndash21] disturbance
[22] and infrastructure [23]mdashto recent environmental changes
correlate with a variety of traits including body size fecund-
ity diet diet breadth habitat breadth natural abundance and
range size However we are still a long way from a general
understanding of how traits determine the response of
species to land-use change
For birds the best understood class of organisms
extinction risk correlates with body size habitat and diet
specialization migratory status and generation length
[2425] For understanding changes in the structure and func-
tion of ecosystems it will be important to understand how
the structure of local communities responds to environmental
change Local and regional studies have shown that sensi-
tivity to habitat loss and habitat fragmentation is associated
variously with body size reproductive rate diet and diet
breadth range size and population size [72026ndash28] An
informal comparison among these studies suggests that
species which are large-bodied slow-breeding sedentary
habitat and dietary specialistsmdashespecially frugivores and
insectivoresmdashwith small ranges and small population sizes
have shown the greatest declines in modified and fragmented
habitats These studies typically focused on species compo-
sition measured as the presence or the absence of species
and relatively few have considered changes in the abundance
of species that persist in modified habitats [7] However
abundance changes are known to have important effects on
the structure of communities and on the functioning of eco-
systems [29] Furthermore these studies generally focused
on particular regions or on a relatively small number of traits
We present a pan-tropical meta-analysis of the occurrence
and abundance of birds under different anthropogenic land-
use intensities to our knowledge the first such to consider the
effect traits on observed responses Using data from studies
spanning five continents (North and South America Africa
Asia and Oceania figure 1) we simultaneously test the
effect of seven traits body mass generation length range
size trophic level diet migratory status and forest habitat
specialization We focus on tropical and sub-tropical forest
biomes as these contain a large proportion of all bird species
[30] and because human populations are projected to
increase rapidly in these biomes during the rest of this cen-
tury The result is a set of conclusions about whether and
how different traits affect the response of bird species to
land-use change a quantification of the magnitude of unex-
plained variation in response that remains after the effect
traits have been accounted for and a simple model that
could be used in future studies to make projections of the
potential effects of land-use change in bird communities at
local regional or pan-tropical scales
2 Material and methods(a) Study areaThe meta-analysis included studies from all tropical and sub-
tropical areas (408 Nndash408 S) where the potential vegetation is
forest Potentially forested areas were defined according to the
classification used in the Integrated Model to Assess the Global
Environment (IMAGE [31]) which is based on the BIOME
model [32] (figure 1)
(b) Abundance dataEstimates of local population density (4685 records for
1317 species 22 of 6041 bird species whose range maps [33]
intersected the study area) were collated from 24 studies in
23 peer-reviewed publications covering sites distributed through-
out tropical and sub-tropical forests (figure 1) These were found
using a Thomson Reuters Web of Knowledge search in April
2008 using the following search term species diversity biodiversity
richness or abundance land use or habitat conversion and pristine
primary undisturbed or original and supplemented by an
additional search focused on the tropics in January 2010 using
the following search term [species] AND [tropic] AND [ primaryforest OR mature forest OR intact forest OR old growth forest ORvirgin forest OR pristine forest] AND [conversion OR degradationOR land use OR habitat type OR agro-forestry OR secondary forestOR plantation OR cropland OR urban area] AND [diversity ORbiodiversity OR richness OR abundance] (a full list of references is
given in the electronic supplementary material appendix S1
for details of the methods used to select the papers see [6]) To
check that the one study from sub-tropical forests in Australia
did not bias the results since it is likely to be environmentally
distinct from the other studies we repeated the models excluding
all data from this study
Records consisted of direct estimates of population density
eg using distance sampling methods (194 records in four studies)
counts of individuals or of groups (2917 records in 17 studies)
or as the frequency of occurrence across a number of samples of
a site (1574 records in four studies) The latter two measures of
density depend on sampling effort which in some cases differed
lightintensive
land use
presence presence presence
undisturbed
1 ndash PU 1 ndash PL 1 ndash PI
no
PU
yes no yes
PL PI
no yes
1 lnmL sL lnmI sI
probabilityof presence
relativeabundance
Figure 2 Model structure relating the presence or the absence and givenpresence local abundance of a species in three classes of land-use intensity(undisturbed light use and intensive use) In each class the species was definedas being present with probability PU PL and PI Abundances were normalized to1 in the undisturbed land-use class Observed abundances in the light andintensive land-use intensity classes were assumed to follow a lognormaldistribution (denoted lnfg) with mean (mL and mI) and sd (sL and sI) Thusthe basic model estimated seven parameters highlighted in grey
rspbroyalsocietypublishingorgProcR
SocB28020122131
3
on November 21 2012rspbroyalsocietypublishingorgDownloaded from
among samples in the same study We adjusted records that used
these two measures according to the relative sampling effort
assuming that perceived population density would increase line-
arly with sampling effort The implications of using frequency of
occurrence which is based on the presence and absence of species
as a proxy for abundance warrants further testing with a larger
dataset However for the main purpose of this study which was
to test the effect of speciesrsquo traits on responses to land-use intensity
a problem will only arise if traits have very different effects on
occurrence and abundance of species
Each record was assigned to one of three broad land-use inten-
sity classes based on human impacts on the vegetation at the site
as described in the paper from which the data were taken lsquoundis-
turbed habitatrsquo for sites in primary vegetation with very little
human disturbance lsquolightly used habitatrsquo for sites with intact natu-
ral vegetation but impacted to some degree by human activities
such as selective logging or harvesting of non-timber products
and including secondary vegetation or lsquointensively used habitatrsquo
for sites where the vegetation had been cleared for human use
including sites used for timber plantations perennial tree crops
agroforestry (agriculture intercropped with trees) low-input
arable agriculture high-input arable agriculture irrigated arable
agriculture and pasture A list of the specific local habitat
types included in each of the classes is given in the electronic
supplementary material appendix S2
The land-use intensity classes used were necessarily coarse
given the size of the dataset One of the distinctions excluded by
this classification was between vegetation where vertical structure
remained intact for example in forest plantations and vegetation
with no vertical structure such as some agricultural land uses
Vertical structure may play a role in determining the abundance
of species and the dominant traits in communities In the future
when larger datasets are available including the effect of vertical
structure on species with different traits may enable a better
understanding of community responses to land-use change
Where species were sampled several times in different
locations within one land-use intensity class within one study
we took the average of all non-zero densities across these samples
If a species was not recorded in a sampled land-use intensity class
then it was assigned a density of zero Differences among species
in absolute recorded densities may be at least partly owing to
differences in detectability [34] To avoid this source of bias we
compared the relative abundance of each species among any
land-use intensity classes sampled within each study
(c) Trait dataWe compiled data on seven traits body mass generation length
range size migratory status habitat affinity diet and trophic
level Data on the first five of these came from BirdLife Interna-
tionalrsquos World Bird Database (available online at httpwww
birdlifeorgdatazone) The data on body mass were compiled
primarily from Dunning [35] supplemented from a wide range
of field guides family monographs and other ornithological lit-
erature Data on generation length were based on published
and unpublished estimates for age at first breeding survival
and longevity applied to the formulae recommended by the
International Union for Conservation of Nature (IUCN) Stan-
dards and Petitions Subcommittee [36] Where species-specific
values of body mass and generation length were not available
for 36 and 26 species respectively we used estimates based on
mean values for congeners
Species were assigned to four migratory classes non-migrants
nomads altitudinal migrants and latitudinallongitudinal
migrants using data from the ornithological literature applied to
definitions developed by BirdLife International as follows Noma-
dic species move in response to resources that are sporadic and
unpredictable in distribution and timing and may congregate
but not predictably in terms of location and timing Altitudinal
migrants regularly or seasonally make cyclical movements to
higher or lower elevations with predictable timing and destinations
Latitudinallongitudinal migrants are species for which a substan-
tial proportion of the global or regional population makes regular or
seasonal cyclical movements beyond the breeding range with pre-
dictable timing and destinations This includes species that may be
migratory only in part of their rangepopulation short-distance
migrants and migrants that occasionally respond to unusual
conditions in a semi-nomadic way
Habitat preferences for each species were coded using the
IUCN Habitats Classification Scheme (httpwwwiucnredlist
orgtechnical-documentsclassification-schemeshabitats-classi-
fication-scheme-ver3) based on information in the ornithological
literature and reviewed by relevant experts The upper level
of the scheme as used in the analyses classifies habitats
as forest savannah shrubland grassland inland wetlands rocky
areas caves desert marine neritic marine oceanic marine coastal
marine intertidal artificial terrestrialaquatic and introduced
exotic vegetation The importance of each habitat inhabited by a
species was classified as major suitable marginal or unknown
(see httpwwwbirdlifeorgdatazoneinfospchabalt) For the
purposes of this study species were considered as forest specialists
if forest was recorded as being of major importance to the species
or as generalists otherwise
Range sizes were extracted from global distribution maps of
bird species [33] Diet data were compiled by one of us (CHS)
from the literature with most of the data from the Handbook ofthe birds of the world ([37] for a detailed description and a complete
list of sources see [38]) Species diet was classified into six groups
according to their primary diet fruit nectar other plant material
invertebrates vertebrates and mixed We also pooled these classes
by trophic level herbivores (fruit- nectar- and plant-eaters)
carnivores (invertebrate- and vertebrate-eaters) or omnivores
(d) Statistical analysisWe analysed the response of bird species to land use by using the
data described above to parametrize simple models using a like-
lihood-based model The models all had the same overall structure
(figure 2) defining first presence (and detection) in each land-use
intensity class and second given presence relative abundance
defined as local abundance relative to the abundance in
undisturbed light intensive
PP
light intensive
AR
land-use intensity
03
05
07
09(a)
04
08
12
16(b)
Figure 3 For 1317 tropical and sub-tropical bird species modelled estimatesof (a) the probability of presence (and detection PP) of any species in eachof the three land-use intensities considered and (b) given presence the ratioof abundance (AR) in light and intensive land use relative to undisturbed Thehorizontal line ( y frac14 1) indicates no difference in abundance compared withundisturbed land use Probabilities of presence and ratios of abundance wereestimated using Bayesian analysis with a MCMC sampling process anduninformative priors Error bars show 67 credible intervals
rspbroyalsocietypublishingorgProcR
SocB28020122131
4
on November 21 2012rspbroyalsocietypublishingorgDownloaded from
undisturbed habitat (ie no change in abundance compared with
undisturbed means a relative abundance of 1 a reduction in
abundance meant relative abundance of less than 1 increased
abundance meant a relative abundance above 1) These relative
abundance ratios were log-transformed in all analyses Observed
relative abundance ratios were assumed to follow a lognormal dis-
tribution The models were used to estimate seven parameters
(figure 2) probabilities of presence in primary light and intensive
land use (PU PL and PI) and the mean (mL and mI) and sd
(sL and sI) of abundance ratios in light and intensive land use
To analyse the effect of species traits on responses to land
use an additional set of parameters was included to modify
the probabilities of presence and abundance ratios according to
speciesrsquo traits The effects of mass and generation length were
treated as continuous functions having either a linear or quadra-
tic effect (quadratic effects required more parameters but did not
improve model fit and so are not discussed further here)
Trophic level diet migratory status and habitat specificity were
treated as categorical variables
We parametrized models containing every possible combi-
nation of traits separately against the data using standard
methods based on Markov Chain Monte Carlo (MCMC)
sampling This in turn allowed us to use a standard method
based on Akaike Information Criterion (AIC) values to (i) calcu-
late an overall measure of explanatory power for each trait by
weighting across the set of models according to their level of sup-
port given the data following [39] (ii) select the single best
model from the set of models and (iii) inspect parameter esti-
mates and confidence intervals on parameter estimates in
order to draw conclusions about the direction and magnitude
of the effects of traits on occurrence and abundance
The results of analyses comparing responses across species
may be biased because of phylogenetic non-independence Clo-
sely related species may respond similarly to land-use intensity
owing to some factor not captured in the model Including an
effect of phylogeny in the models was complicated by the multi-
factorial likelihood-based analysis used and because there is not
currently a fully resolved species-level phylogeny for birds
Instead we tested whether a phylogenetic signal in the response
of the bird species to land-use change remained unaccounted for
in our models by estimating Pagelrsquos l statistic for the residuals
of each of the parameters in our best model (see the electronic
supplementary material appendix S3 for full details)
The response of species to land-use intensity might vary
among the different studies included in the meta-analysis
owing to factors not accounted for in the models and this may
bias the perceived effect of traits on observed responses To
check that this was not the case we repeated the best model
and models fitting each of the traits individually with the
addition of study as a factor We did not run the full set of
models with study as a factor because the large number of free
parameters required (up to 182) was larger than justified by
the number of occurrence and abundance data and resulted in
long convergence times for the models
The data and code used to construct the models in this paper
are available on request from the corresponding author
3 ResultsThe probability of presence declined on average by 78 per cent
and 314 per cent in lightly and intensively used habitat respect-
ively compared with undisturbed habitat (figure 3a) Given
presence abundance was on average 37 per cent lower in
lightly used habitat and 192 per cent lower in intensively
used habitat compared with undisturbed habitat (figure 3b)
However there was considerable variation among species in
observed responses to land-use intensity
Including traits of species improved the ability to explain
observed changes in probability of presence and abundance
Of the 98 models with different combinations of traits con-
sidered the null model (including no traits) ranked 88th in
terms of its fit to the data (measured using the AIC)
Except range size and trophic level all traits had a substantial
effect (sum of AIC weights 03) on observed responses to
land-use intensity (figure 4 and table 1) and were contained
in at least one of the four highest ranked models in terms
of fit to the data (table 2) Bird species that are non-migratory
dependent on forest habitat andor that have diets primarily
of fruits and invertebrates occur with lower probability and at
lower abundances in intensively used habitats than migratory
habitat generalists with primary diets other than fruit and
invertebrates (figure 4andashf ) Furthermore probability of occur-
rence and abundance were relatively lower in intensively
used habitats compared with lightly used and undisturbed
habitats for species with larger body masses andor longer
generation lengths compared with small andor fast-breeding
species (figure 4gndash j)Even in the best modelmdashwhich included the effects of
generation length migratory behaviour diet and habitat
specializationmdashunexplained variation in observed responses
to land-use intensity remained substantial The parameters
describing the standard deviation in observed log-transformed
abundance ratios were 096 and 121 in light and intensively
used habitat respectively An sd of 1 in log-space corresponds
to variation in abundance change from a 65 per cent decline to a
27-fold increase
Including the study from which data were taken as a
factor in the models substantially improved the fit but
04
08
12
16
body mass (g)
0 2000 4000 600003
05
07
09
0 2000 4000 6000
body mass (g)
primary light intensive
04
08
12
16
0 5 10 15 20 25generation length (years)
03
05
07
09
0 5 10 15 20 25generation length (years)
primary light intensive
04
08
12
16
light intensive
land-use intensity
invertebrates vertebrates varied
03
05
07
09
undisturbed light intensive
land-use intensity
fruit nectar plants (other)
04
08
12
16
light intensive03
05
07
09
undisturbed light intensive
non -migratory migratory
04
08
12
16
light intensive
AR
AR
AR
AR
AR
03
05
07
09
undisturbed light intensive
PPPP
PPPP
PP
habitat generalists forest specialists(a)
(c) (d )
( f )(e)
(g)(h)
( j)(i)
(b)
Figure 4 For 1317 tropical and sub-tropical bird species modelled estimates of probabilities of presence (PP) in each of three land-use intensities (acegi) and givenpresence ratios of abundance (AR) in light relative to undisturbed and in intensive relative to undisturbed land use (bdfhj ) Probabilities of presence and ratios ofabundance were modelled as functions of speciesrsquo traits Traits shown here are those for which the sum of AIC weights of all models containing them was greater than03 (see [39] for more details) (ab) forest habitat specificity (AIC weight sum 1) (cd ) migratory status (AIC weight sum 1) (ef ) diet (AIC weight sum frac14 0997)(gh) generation length (AIC weight sum frac14 0689) and (ij ) body mass (AIC weight sumfrac14 0336) Methods were the same as used in figure 3
rspbroyalsocietypublishingorgProcR
SocB28020122131
5
on November 21 2012rspbroyalsocietypublishingorgDownloaded from
did not qualitatively alter the effect of traits on observed
responses (see the electronic supplementary material
appendix S4) Dropping data from the Australian sub-tropical
study similarly did not alter the results (see the electronic
supplementary material appendix S5) The phylogenetic
signal in the residuals of the model was weak (l 009)
and significant ( p 005) only for two of the five
residual types (see the electronic supplementary material
appendix S3 for full details)
4 DiscussionOverall the results show a substantial global impact of land
use on the local abundance of bird species in tropical forests
Table 1 The relative ability of each of six functional traits to explainobserved responses of 1317 tropical and sub-tropical bird species to land-use intensity Explanatory power was estimated as the sum of AIC weights[1] of all models containing a given trait from a set of models fitting allpossible combinations of traits Response to land-use intensity wasmodelled as the probability of presence of species in each of three land-useintensity classesmdashundisturbed light and intensivemdashand given presencethe abundance ratio in light relative to undisturbed and intensive relativeto undisturbed land use AIC weights were calculated following [1]
trait sum of AIC weights
mass 0336
generation length 0689
range size 0150
migratory status 1000
trophic level 0003
diet 0997
forest specialization 1000
rspbroyalsocietypublishingorgProcR
SocB28020122131
6
on November 21 2012rspbroyalsocietypublishingorgDownloaded from
consistent with the results of several previous studies on a
wide range of species including birds [1364041] Compared
with undisturbed land use both the probability of species
occurrence and abundance given occurrence was slightly
lower in land-use classes impacted by humans but where the
native vegetation remains largely intact In land-use classes
involving clearance of the natural vegetation species
occurrence and abundance were both markedly reduced
The effect of land-use intensity on tropical forest bird
species differed among species with different ecological
traits species that are large-bodied slower-breeding non-
migratory that depend on forest habitat andor that feed
primarily on fruit and invertebrates showed greater declines
than other species The effect of habitat specialization on
the response to land-use intensity has been shown previously
to affect the extinction risk of birds [2425] as well as their
response to habitat fragmentation [21] Species that are
dependent on forest habitat are likely to be more adversely
impacted by forest clearance or degradation of forest habitat
than species with broader habitat preferences Reproductive
rate for which generation length was used here as a proxy
probably affects the ability of populations to recover after per-
turbations and probably also correlates with population
abundance which might affect speciesrsquo vulnerability Repro-
ductive rate is known to correlate with extinction risk [24]
and minimum habitat requirements of bird species [27] but
is only available for a small minority of tropical bird species
Although migratory bird species are 26 times less likely to be
threatened or near threatened with extinction [25] the effect
of migratory status on response to land-use change has not
been shown before In fact it is often migratory bird species
that decline the most in response to habitat fragmentation
[18] In our analysis migratory species tend also to be habitat
generalists (x2 frac14 6336 p 00001) being adapted to cope
with a broader suite of habitats on migration
It has been suggested that species at higher trophic levels
should be more vulnerable to environmental changes because
they occur at lower densities [18] However we found no evi-
dence of an effect of trophic position on the response of birds
to land-use change On the other hand diet had a very strong
effect with insectivores and frugivores declining most consist-
ently in human-impacted land-use classes The sensitivity of
frugivorous and insectivorous birds to habitat fragmentation
and to land-use change has been shown before (and may
result from a reduction in the abundance of fruiting trees
and invertebrates [2126]) but this is to our knowledge the
first analysis to show this effect using a global dataset Large
body size often correlates with increased extinction risk and
sensitivity to human activities in a wide variety of animal taxo-
nomic groups including birds [112426283842] This is
probably because body size correlates with traits that directly
affect speciesrsquo vulnerability such as reproductive rate abun-
dance and trophic level [1823] In this study the effect of
body mass on response to land-use intensity was weak and
was not included in the best model Bird species with small
range sizes have been shown to be more sensitive to habitat
fragmentation than more wide-ranging species [42] However
we failed to detect an effect of range size on the response to
land-use intensity Range size probably affects vulnerability
indirectly because species with small range sizes typically
occur at lower densities [43] and probably have more specific
habitat requirements than more widespread species It is also
possible that species with small ranges and low density were
missed in the studies included here and that an effect of
range size was thus missed Range size may also correlate
with other traits that we considered here such as reproductive
rate and body mass which might account for the failure to
detect an effect of range size on observed responses
The results of analyses like this one can be biased
by sampling artefacts and issues of detectability [34]
Abundance will differ among species and will also vary geo-
graphically for a single species Furthermore reported
abundance will differ among species because of differences
in detectability [34] We avoided most of these issues by com-
paring the abundance among land-use classes of each species
within each study thus comparing abundances for the same
species in a very similar geographical location Nevertheless
issues of detectability may have remained For example it is
likely that birds are more easily detected where vegetation
has been cleared than in intact natural vegetation As a
result the estimated overall response of bird species to
land-use intensity would be an underestimate On the other
hand there may have been a bias towards the publication
of papers that showed a significant effect of land use on
bird abundance although species that did not respond to
land use will also have been included because most studies
sampled whole bird assemblages The perceived association
between traits and responses to land-use intensity will only
have been biased if the effect of traits and land use on the
detectability of species covary with one another
This study focused on the direct effects that local land-use
intensity has on local bird communities However at
landscape and regional scales land use can result in fragmen-
tation and reduction in area of remaining natural habitat (see
[19] for a review) In future analyses the effect of habitat frag-
mentation could be considered assuming that accurate
locations and associated environmental data for the individ-
ual sites sampled were available Abundance could then be
related to the size of habitat patches and the nature of the
habitat in the surrounding landscape derived for example
from remotely sensed data
Although traits improved our ability to explain observed
changes in the occurrence and abundance of tropical bird
Table 2 The four best models for explaining the response of 1317 tropical and sub-tropical bird species to land-use intensity (The fit of each model to thedata was measured using the AIC shown here as the difference between the AIC of the model in question and lowest AIC of all models Traits included inthese models were GL generation length MIGR migratory status DIET dietary guild FORSPEC whether the species was a forest specialist MASS body massResponse to land-use intensity was modelled as the probability of presence of species in each of three land-use intensitiesmdashundisturbed light and intensivemdashand given presence the abundance ratio in light relative to undisturbed and intensive relative to undisturbed land use AIC weights reflect the relative supportfor each model in terms of AIC values and were calculated following [1])
rank model AIC difference AIC weight
1 GLthorn MIGRthorn DIETthorn FORSPEC 0 0455
2 MASSthorn GLthorn MIGRthorn DIETthorn FORSPEC 2235 0131
3 MASSthorn MIGRthorn DIETthorn FORSPEC 2253 0124
4 MIGRthorn DIETthorn FORSPEC 2260 0057
rspbroyalsocietypublishingorgProcR
SocB28020122131
7
on November 21 2012rspbroyalsocietypublishingorgDownloaded from
species considerable unexplained variation remained in the
model The four most obvious sources of this variability
are (i) an effect of traits of the species not captured in the
models (ii) a degree of subjectivity in the assignment of
records to land-use classes because these were based on the
assessments of individual authors (iii) changes in abundance
in response to other pressures including habitat fragmenta-
tion and vegetation structure and (iv) local and regional
differences in the impact of different land-use regimes The
latter explanation is supported by the fact that fitting study
as a factor in the models substantially improved the fit of
the models The effect of traits was consistent in spite of
this spatial variation in observed responses and the causes
of the variation would make an interesting topic for future
study In practical terms the consequence of unexplained
variation in the models is that it will not be possible to
make a precise prediction about the occurrence and abun-
dance of a specific species in a specific location However
the models can be used to make predictions of which species
are more or less likely to be vulnerable to land-use change
and of change in the overall structure of bird communities
in response to changes in land-use intensity
More closely related species could be expected to respond
more similarly to land-use intensity than more distantly
related species which could bias the apparent effect of traits
on response to land-use intensity since the traits are also
likely to covary with relatedness We tested for phylogenetic
signal in the residuals of the best-fitting model finding a sig-
nificant signal for only two of the five residual types
namely for the probability of occurrence in lightly and inten-
sively used habitats The effect of traits was strong and
consistent for both probabilities of occurrence and abun-
dances Therefore the main result of our study was not
affected by phylogenetic non-independence
Overall land-use change presents a serious threat
to forest birds especially for species with particular
combinations of ecological traits As well as allowing the
identification of species of particular conservation concern
differences in the response of species with different sets of
traits also have implications for the functioning of ecosystems
and for the delivery of ecosystem services [38] Dispropor-
tionate declines in the abundance of species with particular
traits will reduce the functional diversity of biological com-
munities which will probably impair the functioning of
ecosystems and make them less resilient to other environ-
mental changes [44] The loss of species with particular
traits will also affect the delivery of specific ecosystem ser-
vices For example insectivorous birds play an important
role in pest control in ecosystems [45] while frugivores are
essential for seed dispersal especially in the tropics [4647]
We show that both of these guilds show consistently negative
responses to forest clearance in sites throughout the tropics
potentially having serious implications for agriculture The
novel likelihood-based approach to analysing responses to
land use allows uncertainty in the observed responses to be
quantified which will be crucial when projecting future
changes to biological communities
We thank the volunteers and students (Felicity Bedford Vicki PowellJulie Day Alexandra Robinson and Jake Simpson) who assisted withthe compilation of the data and Andy Purvis for invaluable adviceon the project and comments on a draft of the manuscript CHSthanks the University of Utah for its support and is grateful toSherron Bullens Debbie Fisher David Hayes and especially BethKarpas and Kathleen McMullen for their dedicated help with theworld bird ecology database We also thank two anonymousreviewers for valuable comments on an earlier draft of this paperThe data used in this study are available on request from TN
References
1 Jetz W Wilcove DS Dobson AP 2007 Projectedimpacts of climate and land-use change on theglobal diversity of birds PLoS Biol 5 e157 (doi101371journalpbio0050157)
2 Green RE Cornell SJ Scharlemann JPW Balmford A2005 Farming and the fate of wild natureScience 307 550 ndash 555 (doi101126science1106049)
3 Gibson L et al 2011 Primary forests areirreplaceable for sustaining tropicalbiodiversity Nature 478 378 ndash 381 (doi101038nature10425)
4 Sekercioglu CH Schneider SH Fay JP Loarie SR2008 Climate change elevational range shifts andbird extinctions Conserv Biol 22 140 ndash 150(doi101111j1523-1739200700852x)
5 United Nations Population Division 2011 WorldPopulation Prospects The 2010 Revision PopulationDatabase See httpwwwunorgesapopulation
6 Alkemade R van Oorschot M Miles L Nellemann CBakkenes M ten Brink B 2009 GLOBIO3 aframework to investigate options for reducingglobal terrestrial biodiversity loss Ecosystems 12374 ndash 390 (doi101007s10021-009-9229-5)
rspbroyalsocietypublishingorgProcR
SocB28020122131
8
on November 21 2012rspbroyalsocietypublishingorgDownloaded from
7 Phalan B Onial M Balmford A Green RE 2011Reconciling food production and biodiversityconservation land sharing and land sparingcompared Science 333 1289 ndash 1291 (doi101126science1208742)
8 Koh LP Sodhi NS Brook BW 2004 Ecologicalcorrelates of extinction proneness in tropicalbutterflies Conserv Biol 18 1571 ndash 1578 (doi101111j1523-1739200400468x)
9 Jones KE Purvis A Gittleman JL 2003 Biologicalcorrelates of extinction risk in bats Am Nat 161601 ndash 614 (doi101086368289)
10 Kotiaho JS Kaitala V Komonen A Paivinen J 2005Predicting the risk of extinction from sharedecological characteristics Proc Natl Acad Sci USA102 1963 ndash 1967 (doi101073pnas0406718102)
11 Davidson AD Hamilton MJ Boyer AG Brown JHCeballos G 2009 Multiple ecological pathways toextinction in mammals Proc Natl Acad Sci USA 10610 702 ndash 10 705 (doi101073pnas0901956106)
12 Kotze DJ OrsquoHara RB 2003 Species declinemdashbutwhy Explanations of carabid beetle (ColeopteraCarabidae) declines in Europe Oecologia 135138 ndash 148 (doi101007s00442-002-1174-3)
13 Murray KA Rosauer D McCallum H Skerratt LF2011 Integrating species traits with extrinsic threatsclosing the gap between predicting and preventingspecies declines Proc R Soc B 278 1515 ndash 1523(doi101098rspb20101872)
14 Mattila N Kaitala V Komonen A Kotiaho JSPaivinen J 2006 Ecological determinants ofdistribution decline and risk of extinction in mothsConserv Biol 20 1161 ndash 1168 (doi101111j1523-1739200600404x)
15 Mattila N Kaitala V Komonen A Paivinen JKotiaho JS 2011 Ecological correlates of distributionchange and range shift in butterflies Insect ConservDivers 4 239 ndash 246 (doi101111j1752-4598201100141x)
16 Barragan F Moreno CE Escobar F Halffter GNavarrete D 2011 Negative impacts of human landuse on dung beetle functional diversity PLoS ONE 6e17976 (doi101371journalpone0017976)
17 Davies KF Margules CR Lawrence JF 2000 Whichtraits of species predict population declines inexperimental forest fragments Ecology 81 1450 ndash1461 (doi1018900012-9658(2000)081[1450WTOSPP]20CO2)
18 Henle K Davies KF Kleyer M Margules C Settele J2004 Predictors of species sensitivity tofragmentation Biodivers Conserv 13 207 ndash 251(doi101023BBIOC0000004319916439e)
19 Ewers RM Didham RK 2006 Confounding factors inthe detection of species responses to habitatfragmentation Biol Rev 81 117 ndash 142 (doi101017S1464793105006949)
20 Barbaro L van Halder I 2009 Linking bird carabidbeetle and butterfly life-history traits to habitatfragmentation in mosaic landscapes Ecography 32321 ndash 333 (doi101111j1600-0587200805546x)
21 Vetter D Hansbauer MM Vegvari Z Storch I 2011Predictors of forest fragmentation sensitivity inNeotropical vertebrates a quantitative review Ecography34 1 ndash 8 (doi101111j1600-0587201006453x)
22 Bernhardt-Romermann M et al 2011 Functionaltraits and local environment predict vegetationresponses to disturbance a pan-European multi-siteexperiment J Ecol 99 777 ndash 787 (doi101111j1365-2745201101794x)
23 Rytwinski T Fahrig L 2011 Reproductive rate andbody size predict road impacts on mammalabundance Ecol Appl 21 589 ndash 600 (doi10189010-09681)
24 Owens IPF Bennett PM 2000 Ecological basis ofextinction risk in birds habitat loss versus humanpersecution and introduced predators Proc NatlAcad Sci USA 97 12 144 ndash 12 148 (doi101073pnas200223397)
25 Sekercioglu CH 2007 Conservation ecology areatrumps mobility in fragment bird extinctions Curr Biol17 R283 ndash R286 (doi101016jcub200702018)
26 Cleary DFR Boyle TJB Setyawati T Anggraeni CDVan Loon EE Menken SBJ 2007 Bird species andtraits associated with logged and unlogged forest inBorneo Ecol Appl 17 1184 ndash 1197 (doi10189005-0878)
27 Vance MD Fahrig L Flather CH 2003 Effect ofreproductive rate on minimum habitat requirementsof forest-breeding birds Ecology 84 2643 ndash 2653(doi10189002-0159)
28 Tscharntke T Sekercioglu CH Dietsch TV Sodhi NSHoehn P Tylianakis JM 2008 Landscape constraintson functional diversity of birds and insects intropical agroecosystems Ecology 89 944 ndash 951(doi10189007-04551)
29 Gaston KJ Fuller RA 2008 Commonness populationdepletion and conservation biology Trends EcolEvol 23 14 ndash 19 (doi101016jtree200711001)
30 Sekercioglu CH 2012 Bird functional diversity andecosystem services in tropical forests agroforestsand agricultural areas J Ornithol 153 S153 ndash S161(doi101007s10336-012-0869-4)
31 Bouwman AF Kram T Klein Goldwijk K (eds) 2006Integrated modelling of global environmentalchange an overview of IMAGE 24 Bilthoven TheNetherlands Netherlands EnvironmentalAssessment Agency
32 Prentice IC Cramer W Harrison SP Leemans RMonserud RA Solomon AM 1992 A global biomemodel based on plant physiology and dominancesoil properties and climate J Biogeogr 19117 ndash 134 (doi1023072845499)
33 Birdlife International and NatureServe 2011 Birdspecies distribution maps of the world See httpwwwbirdlifeorgdatazoneinfospcdownload
34 Thornton D Branch L Sunquist M 2011 Passivesampling effects and landscape location alterassociations between species traits and responseto fragmentation Ecol Appl 21 817 ndash 829(doi10189010-05491)
35 Dunning JB 1993 CRC handbook of avian bodymasses Boca Raton FL CRC Press
36 IUCN Standards and Petitions Subcommittee 2010Guidelines for Using the IUCN Red List Categories andCriteria v 80 See httpintranetiucnorgwebfilesdocSSCRedListRedListGuidelinespdf
37 Del Hoyo J Elliott A Sargatal J 1992 Handbook ofthe birds of the world Barcelona Spain LynxEdicions
38 Sekercioglu CcedilH Daily GC Ehrlich PR 2004Ecosystem consequences of bird declines Proc NatlAcad Sci USA 101 18 042 ndash 18 047 (doi101073pnas0408049101)
39 Burnham KP Anderson DR 2002 Model selectionand multimodel inference a practical information-theoretic approach New York NY Springer
40 Sala OE et al 2000 Global biodiversity scenarios forthe year 2100 Science 287 1770 ndash 1774 (doi101126science28754591770)
41 Pimm S Raven P Peterson A Sekercioglu CcedilHEhrlich PR 2006 Human impacts on the rates ofrecent present and future bird extinctions ProcNatl Acad Sci USA 103 10 941 ndash 10 946 (doi101073pnas0604181103)
42 Renjifo LM 1999 Composition changes in aSubandean avifauna after long-term forestfragmentation Conserv Biol 13 1124 ndash 1139(doi101046j1523-1739199998311x)
43 Gaston KJ Blackburn TM Lawton JH 1997Interspecific abundance-range size relationshipsan appraisal of mechanisms J Anim Ecol 66579 ndash 601 (doi1023075951)
44 Hooper DU et al 2005 Effects of biodiversity onecosystem functioning a consensus of currentknowledge Ecol Monogr 75 3 ndash 35 (doi10189004-0922)
45 Van Bael SA Brawn JD Robinson SK 2003 Birdsdefend trees from herbivores in a Neotropical forestcanopy Proc Natl Acad Sci USA 100 8304 ndash 8307(doi101073pnas1431621100)
46 Sekercioglu CH 2006 Increasing awareness of avianecological function Trends Ecol Evol 21 464 ndash 471(doi101016jtree200605007)
47 Wenny DG DeVault TL Johnson MD Kelly DSekercioglu CH Tomback DF Whelan CJ 2011 Theneed to quantify ecosystem services provided bybirds Auk 128 1 ndash 14 (doi101525auk201110248)
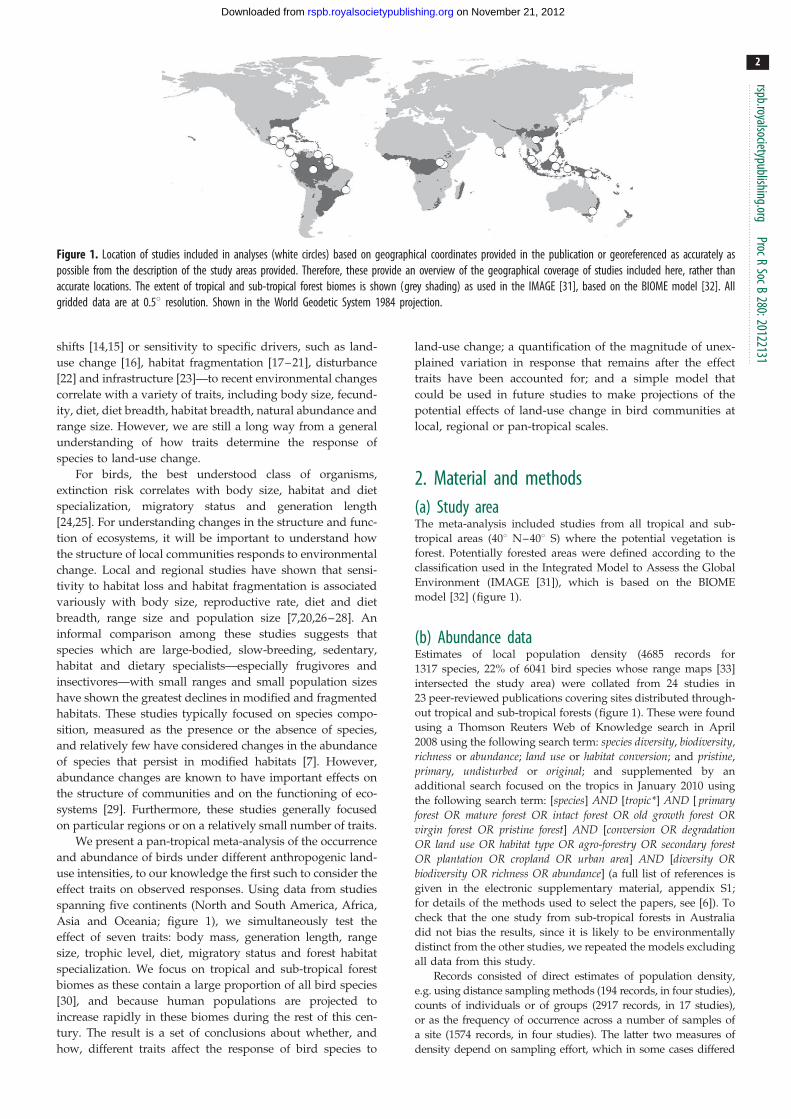

undisturbed light intensive
PP
light intensive
AR
land-use intensity
03
05
07
09(a)
04
08
12
16(b)
Figure 3 For 1317 tropical and sub-tropical bird species modelled estimatesof (a) the probability of presence (and detection PP) of any species in eachof the three land-use intensities considered and (b) given presence the ratioof abundance (AR) in light and intensive land use relative to undisturbed Thehorizontal line ( y frac14 1) indicates no difference in abundance compared withundisturbed land use Probabilities of presence and ratios of abundance wereestimated using Bayesian analysis with a MCMC sampling process anduninformative priors Error bars show 67 credible intervals
rspbroyalsocietypublishingorgProcR
SocB28020122131
4
on November 21 2012rspbroyalsocietypublishingorgDownloaded from
undisturbed habitat (ie no change in abundance compared with
undisturbed means a relative abundance of 1 a reduction in
abundance meant relative abundance of less than 1 increased
abundance meant a relative abundance above 1) These relative
abundance ratios were log-transformed in all analyses Observed
relative abundance ratios were assumed to follow a lognormal dis-
tribution The models were used to estimate seven parameters
(figure 2) probabilities of presence in primary light and intensive
land use (PU PL and PI) and the mean (mL and mI) and sd
(sL and sI) of abundance ratios in light and intensive land use
To analyse the effect of species traits on responses to land
use an additional set of parameters was included to modify
the probabilities of presence and abundance ratios according to
speciesrsquo traits The effects of mass and generation length were
treated as continuous functions having either a linear or quadra-
tic effect (quadratic effects required more parameters but did not
improve model fit and so are not discussed further here)
Trophic level diet migratory status and habitat specificity were
treated as categorical variables
We parametrized models containing every possible combi-
nation of traits separately against the data using standard
methods based on Markov Chain Monte Carlo (MCMC)
sampling This in turn allowed us to use a standard method
based on Akaike Information Criterion (AIC) values to (i) calcu-
late an overall measure of explanatory power for each trait by
weighting across the set of models according to their level of sup-
port given the data following [39] (ii) select the single best
model from the set of models and (iii) inspect parameter esti-
mates and confidence intervals on parameter estimates in
order to draw conclusions about the direction and magnitude
of the effects of traits on occurrence and abundance
The results of analyses comparing responses across species
may be biased because of phylogenetic non-independence Clo-
sely related species may respond similarly to land-use intensity
owing to some factor not captured in the model Including an
effect of phylogeny in the models was complicated by the multi-
factorial likelihood-based analysis used and because there is not
currently a fully resolved species-level phylogeny for birds
Instead we tested whether a phylogenetic signal in the response
of the bird species to land-use change remained unaccounted for
in our models by estimating Pagelrsquos l statistic for the residuals
of each of the parameters in our best model (see the electronic
supplementary material appendix S3 for full details)
The response of species to land-use intensity might vary
among the different studies included in the meta-analysis
owing to factors not accounted for in the models and this may
bias the perceived effect of traits on observed responses To
check that this was not the case we repeated the best model
and models fitting each of the traits individually with the
addition of study as a factor We did not run the full set of
models with study as a factor because the large number of free
parameters required (up to 182) was larger than justified by
the number of occurrence and abundance data and resulted in
long convergence times for the models
The data and code used to construct the models in this paper
are available on request from the corresponding author
3 ResultsThe probability of presence declined on average by 78 per cent
and 314 per cent in lightly and intensively used habitat respect-
ively compared with undisturbed habitat (figure 3a) Given
presence abundance was on average 37 per cent lower in
lightly used habitat and 192 per cent lower in intensively
used habitat compared with undisturbed habitat (figure 3b)
However there was considerable variation among species in
observed responses to land-use intensity
Including traits of species improved the ability to explain
observed changes in probability of presence and abundance
Of the 98 models with different combinations of traits con-
sidered the null model (including no traits) ranked 88th in
terms of its fit to the data (measured using the AIC)
Except range size and trophic level all traits had a substantial
effect (sum of AIC weights 03) on observed responses to
land-use intensity (figure 4 and table 1) and were contained
in at least one of the four highest ranked models in terms
of fit to the data (table 2) Bird species that are non-migratory
dependent on forest habitat andor that have diets primarily
of fruits and invertebrates occur with lower probability and at
lower abundances in intensively used habitats than migratory
habitat generalists with primary diets other than fruit and
invertebrates (figure 4andashf ) Furthermore probability of occur-
rence and abundance were relatively lower in intensively
used habitats compared with lightly used and undisturbed
habitats for species with larger body masses andor longer
generation lengths compared with small andor fast-breeding
species (figure 4gndash j)Even in the best modelmdashwhich included the effects of
generation length migratory behaviour diet and habitat
specializationmdashunexplained variation in observed responses
to land-use intensity remained substantial The parameters
describing the standard deviation in observed log-transformed
abundance ratios were 096 and 121 in light and intensively
used habitat respectively An sd of 1 in log-space corresponds
to variation in abundance change from a 65 per cent decline to a
27-fold increase
Including the study from which data were taken as a
factor in the models substantially improved the fit but
04
08
12
16
body mass (g)
0 2000 4000 600003
05
07
09
0 2000 4000 6000
body mass (g)
primary light intensive
04
08
12
16
0 5 10 15 20 25generation length (years)
03
05
07
09
0 5 10 15 20 25generation length (years)
primary light intensive
04
08
12
16
light intensive
land-use intensity
invertebrates vertebrates varied
03
05
07
09
undisturbed light intensive
land-use intensity
fruit nectar plants (other)
04
08
12
16
light intensive03
05
07
09
undisturbed light intensive
non -migratory migratory
04
08
12
16
light intensive
AR
AR
AR
AR
AR
03
05
07
09
undisturbed light intensive
PPPP
PPPP
PP
habitat generalists forest specialists(a)
(c) (d )
( f )(e)
(g)(h)
( j)(i)
(b)
Figure 4 For 1317 tropical and sub-tropical bird species modelled estimates of probabilities of presence (PP) in each of three land-use intensities (acegi) and givenpresence ratios of abundance (AR) in light relative to undisturbed and in intensive relative to undisturbed land use (bdfhj ) Probabilities of presence and ratios ofabundance were modelled as functions of speciesrsquo traits Traits shown here are those for which the sum of AIC weights of all models containing them was greater than03 (see [39] for more details) (ab) forest habitat specificity (AIC weight sum 1) (cd ) migratory status (AIC weight sum 1) (ef ) diet (AIC weight sum frac14 0997)(gh) generation length (AIC weight sum frac14 0689) and (ij ) body mass (AIC weight sumfrac14 0336) Methods were the same as used in figure 3
rspbroyalsocietypublishingorgProcR
SocB28020122131
5
on November 21 2012rspbroyalsocietypublishingorgDownloaded from
did not qualitatively alter the effect of traits on observed
responses (see the electronic supplementary material
appendix S4) Dropping data from the Australian sub-tropical
study similarly did not alter the results (see the electronic
supplementary material appendix S5) The phylogenetic
signal in the residuals of the model was weak (l 009)
and significant ( p 005) only for two of the five
residual types (see the electronic supplementary material
appendix S3 for full details)
4 DiscussionOverall the results show a substantial global impact of land
use on the local abundance of bird species in tropical forests
Table 1 The relative ability of each of six functional traits to explainobserved responses of 1317 tropical and sub-tropical bird species to land-use intensity Explanatory power was estimated as the sum of AIC weights[1] of all models containing a given trait from a set of models fitting allpossible combinations of traits Response to land-use intensity wasmodelled as the probability of presence of species in each of three land-useintensity classesmdashundisturbed light and intensivemdashand given presencethe abundance ratio in light relative to undisturbed and intensive relativeto undisturbed land use AIC weights were calculated following [1]
trait sum of AIC weights
mass 0336
generation length 0689
range size 0150
migratory status 1000
trophic level 0003
diet 0997
forest specialization 1000
rspbroyalsocietypublishingorgProcR
SocB28020122131
6
on November 21 2012rspbroyalsocietypublishingorgDownloaded from
consistent with the results of several previous studies on a
wide range of species including birds [1364041] Compared
with undisturbed land use both the probability of species
occurrence and abundance given occurrence was slightly
lower in land-use classes impacted by humans but where the
native vegetation remains largely intact In land-use classes
involving clearance of the natural vegetation species
occurrence and abundance were both markedly reduced
The effect of land-use intensity on tropical forest bird
species differed among species with different ecological
traits species that are large-bodied slower-breeding non-
migratory that depend on forest habitat andor that feed
primarily on fruit and invertebrates showed greater declines
than other species The effect of habitat specialization on
the response to land-use intensity has been shown previously
to affect the extinction risk of birds [2425] as well as their
response to habitat fragmentation [21] Species that are
dependent on forest habitat are likely to be more adversely
impacted by forest clearance or degradation of forest habitat
than species with broader habitat preferences Reproductive
rate for which generation length was used here as a proxy
probably affects the ability of populations to recover after per-
turbations and probably also correlates with population
abundance which might affect speciesrsquo vulnerability Repro-
ductive rate is known to correlate with extinction risk [24]
and minimum habitat requirements of bird species [27] but
is only available for a small minority of tropical bird species
Although migratory bird species are 26 times less likely to be
threatened or near threatened with extinction [25] the effect
of migratory status on response to land-use change has not
been shown before In fact it is often migratory bird species
that decline the most in response to habitat fragmentation
[18] In our analysis migratory species tend also to be habitat
generalists (x2 frac14 6336 p 00001) being adapted to cope
with a broader suite of habitats on migration
It has been suggested that species at higher trophic levels
should be more vulnerable to environmental changes because
they occur at lower densities [18] However we found no evi-
dence of an effect of trophic position on the response of birds
to land-use change On the other hand diet had a very strong
effect with insectivores and frugivores declining most consist-
ently in human-impacted land-use classes The sensitivity of
frugivorous and insectivorous birds to habitat fragmentation
and to land-use change has been shown before (and may
result from a reduction in the abundance of fruiting trees
and invertebrates [2126]) but this is to our knowledge the
first analysis to show this effect using a global dataset Large
body size often correlates with increased extinction risk and
sensitivity to human activities in a wide variety of animal taxo-
nomic groups including birds [112426283842] This is
probably because body size correlates with traits that directly
affect speciesrsquo vulnerability such as reproductive rate abun-
dance and trophic level [1823] In this study the effect of
body mass on response to land-use intensity was weak and
was not included in the best model Bird species with small
range sizes have been shown to be more sensitive to habitat
fragmentation than more wide-ranging species [42] However
we failed to detect an effect of range size on the response to
land-use intensity Range size probably affects vulnerability
indirectly because species with small range sizes typically
occur at lower densities [43] and probably have more specific
habitat requirements than more widespread species It is also
possible that species with small ranges and low density were
missed in the studies included here and that an effect of
range size was thus missed Range size may also correlate
with other traits that we considered here such as reproductive
rate and body mass which might account for the failure to
detect an effect of range size on observed responses
The results of analyses like this one can be biased
by sampling artefacts and issues of detectability [34]
Abundance will differ among species and will also vary geo-
graphically for a single species Furthermore reported
abundance will differ among species because of differences
in detectability [34] We avoided most of these issues by com-
paring the abundance among land-use classes of each species
within each study thus comparing abundances for the same
species in a very similar geographical location Nevertheless
issues of detectability may have remained For example it is
likely that birds are more easily detected where vegetation
has been cleared than in intact natural vegetation As a
result the estimated overall response of bird species to
land-use intensity would be an underestimate On the other
hand there may have been a bias towards the publication
of papers that showed a significant effect of land use on
bird abundance although species that did not respond to
land use will also have been included because most studies
sampled whole bird assemblages The perceived association
between traits and responses to land-use intensity will only
have been biased if the effect of traits and land use on the
detectability of species covary with one another
This study focused on the direct effects that local land-use
intensity has on local bird communities However at
landscape and regional scales land use can result in fragmen-
tation and reduction in area of remaining natural habitat (see
[19] for a review) In future analyses the effect of habitat frag-
mentation could be considered assuming that accurate
locations and associated environmental data for the individ-
ual sites sampled were available Abundance could then be
related to the size of habitat patches and the nature of the
habitat in the surrounding landscape derived for example
from remotely sensed data
Although traits improved our ability to explain observed
changes in the occurrence and abundance of tropical bird
Table 2 The four best models for explaining the response of 1317 tropical and sub-tropical bird species to land-use intensity (The fit of each model to thedata was measured using the AIC shown here as the difference between the AIC of the model in question and lowest AIC of all models Traits included inthese models were GL generation length MIGR migratory status DIET dietary guild FORSPEC whether the species was a forest specialist MASS body massResponse to land-use intensity was modelled as the probability of presence of species in each of three land-use intensitiesmdashundisturbed light and intensivemdashand given presence the abundance ratio in light relative to undisturbed and intensive relative to undisturbed land use AIC weights reflect the relative supportfor each model in terms of AIC values and were calculated following [1])
rank model AIC difference AIC weight
1 GLthorn MIGRthorn DIETthorn FORSPEC 0 0455
2 MASSthorn GLthorn MIGRthorn DIETthorn FORSPEC 2235 0131
3 MASSthorn MIGRthorn DIETthorn FORSPEC 2253 0124
4 MIGRthorn DIETthorn FORSPEC 2260 0057
rspbroyalsocietypublishingorgProcR
SocB28020122131
7
on November 21 2012rspbroyalsocietypublishingorgDownloaded from
species considerable unexplained variation remained in the
model The four most obvious sources of this variability
are (i) an effect of traits of the species not captured in the
models (ii) a degree of subjectivity in the assignment of
records to land-use classes because these were based on the
assessments of individual authors (iii) changes in abundance
in response to other pressures including habitat fragmenta-
tion and vegetation structure and (iv) local and regional
differences in the impact of different land-use regimes The
latter explanation is supported by the fact that fitting study
as a factor in the models substantially improved the fit of
the models The effect of traits was consistent in spite of
this spatial variation in observed responses and the causes
of the variation would make an interesting topic for future
study In practical terms the consequence of unexplained
variation in the models is that it will not be possible to
make a precise prediction about the occurrence and abun-
dance of a specific species in a specific location However
the models can be used to make predictions of which species
are more or less likely to be vulnerable to land-use change
and of change in the overall structure of bird communities
in response to changes in land-use intensity
More closely related species could be expected to respond
more similarly to land-use intensity than more distantly
related species which could bias the apparent effect of traits
on response to land-use intensity since the traits are also
likely to covary with relatedness We tested for phylogenetic
signal in the residuals of the best-fitting model finding a sig-
nificant signal for only two of the five residual types
namely for the probability of occurrence in lightly and inten-
sively used habitats The effect of traits was strong and
consistent for both probabilities of occurrence and abun-
dances Therefore the main result of our study was not
affected by phylogenetic non-independence
Overall land-use change presents a serious threat
to forest birds especially for species with particular
combinations of ecological traits As well as allowing the
identification of species of particular conservation concern
differences in the response of species with different sets of
traits also have implications for the functioning of ecosystems
and for the delivery of ecosystem services [38] Dispropor-
tionate declines in the abundance of species with particular
traits will reduce the functional diversity of biological com-
munities which will probably impair the functioning of
ecosystems and make them less resilient to other environ-
mental changes [44] The loss of species with particular
traits will also affect the delivery of specific ecosystem ser-
vices For example insectivorous birds play an important
role in pest control in ecosystems [45] while frugivores are
essential for seed dispersal especially in the tropics [4647]
We show that both of these guilds show consistently negative
responses to forest clearance in sites throughout the tropics
potentially having serious implications for agriculture The
novel likelihood-based approach to analysing responses to
land use allows uncertainty in the observed responses to be
quantified which will be crucial when projecting future
changes to biological communities
We thank the volunteers and students (Felicity Bedford Vicki PowellJulie Day Alexandra Robinson and Jake Simpson) who assisted withthe compilation of the data and Andy Purvis for invaluable adviceon the project and comments on a draft of the manuscript CHSthanks the University of Utah for its support and is grateful toSherron Bullens Debbie Fisher David Hayes and especially BethKarpas and Kathleen McMullen for their dedicated help with theworld bird ecology database We also thank two anonymousreviewers for valuable comments on an earlier draft of this paperThe data used in this study are available on request from TN
References
1 Jetz W Wilcove DS Dobson AP 2007 Projectedimpacts of climate and land-use change on theglobal diversity of birds PLoS Biol 5 e157 (doi101371journalpbio0050157)
2 Green RE Cornell SJ Scharlemann JPW Balmford A2005 Farming and the fate of wild natureScience 307 550 ndash 555 (doi101126science1106049)
3 Gibson L et al 2011 Primary forests areirreplaceable for sustaining tropicalbiodiversity Nature 478 378 ndash 381 (doi101038nature10425)
4 Sekercioglu CH Schneider SH Fay JP Loarie SR2008 Climate change elevational range shifts andbird extinctions Conserv Biol 22 140 ndash 150(doi101111j1523-1739200700852x)
5 United Nations Population Division 2011 WorldPopulation Prospects The 2010 Revision PopulationDatabase See httpwwwunorgesapopulation
6 Alkemade R van Oorschot M Miles L Nellemann CBakkenes M ten Brink B 2009 GLOBIO3 aframework to investigate options for reducingglobal terrestrial biodiversity loss Ecosystems 12374 ndash 390 (doi101007s10021-009-9229-5)
rspbroyalsocietypublishingorgProcR
SocB28020122131
8
on November 21 2012rspbroyalsocietypublishingorgDownloaded from
7 Phalan B Onial M Balmford A Green RE 2011Reconciling food production and biodiversityconservation land sharing and land sparingcompared Science 333 1289 ndash 1291 (doi101126science1208742)
8 Koh LP Sodhi NS Brook BW 2004 Ecologicalcorrelates of extinction proneness in tropicalbutterflies Conserv Biol 18 1571 ndash 1578 (doi101111j1523-1739200400468x)
9 Jones KE Purvis A Gittleman JL 2003 Biologicalcorrelates of extinction risk in bats Am Nat 161601 ndash 614 (doi101086368289)
10 Kotiaho JS Kaitala V Komonen A Paivinen J 2005Predicting the risk of extinction from sharedecological characteristics Proc Natl Acad Sci USA102 1963 ndash 1967 (doi101073pnas0406718102)
11 Davidson AD Hamilton MJ Boyer AG Brown JHCeballos G 2009 Multiple ecological pathways toextinction in mammals Proc Natl Acad Sci USA 10610 702 ndash 10 705 (doi101073pnas0901956106)
12 Kotze DJ OrsquoHara RB 2003 Species declinemdashbutwhy Explanations of carabid beetle (ColeopteraCarabidae) declines in Europe Oecologia 135138 ndash 148 (doi101007s00442-002-1174-3)
13 Murray KA Rosauer D McCallum H Skerratt LF2011 Integrating species traits with extrinsic threatsclosing the gap between predicting and preventingspecies declines Proc R Soc B 278 1515 ndash 1523(doi101098rspb20101872)
14 Mattila N Kaitala V Komonen A Kotiaho JSPaivinen J 2006 Ecological determinants ofdistribution decline and risk of extinction in mothsConserv Biol 20 1161 ndash 1168 (doi101111j1523-1739200600404x)
15 Mattila N Kaitala V Komonen A Paivinen JKotiaho JS 2011 Ecological correlates of distributionchange and range shift in butterflies Insect ConservDivers 4 239 ndash 246 (doi101111j1752-4598201100141x)
16 Barragan F Moreno CE Escobar F Halffter GNavarrete D 2011 Negative impacts of human landuse on dung beetle functional diversity PLoS ONE 6e17976 (doi101371journalpone0017976)
17 Davies KF Margules CR Lawrence JF 2000 Whichtraits of species predict population declines inexperimental forest fragments Ecology 81 1450 ndash1461 (doi1018900012-9658(2000)081[1450WTOSPP]20CO2)
18 Henle K Davies KF Kleyer M Margules C Settele J2004 Predictors of species sensitivity tofragmentation Biodivers Conserv 13 207 ndash 251(doi101023BBIOC0000004319916439e)
19 Ewers RM Didham RK 2006 Confounding factors inthe detection of species responses to habitatfragmentation Biol Rev 81 117 ndash 142 (doi101017S1464793105006949)
20 Barbaro L van Halder I 2009 Linking bird carabidbeetle and butterfly life-history traits to habitatfragmentation in mosaic landscapes Ecography 32321 ndash 333 (doi101111j1600-0587200805546x)
21 Vetter D Hansbauer MM Vegvari Z Storch I 2011Predictors of forest fragmentation sensitivity inNeotropical vertebrates a quantitative review Ecography34 1 ndash 8 (doi101111j1600-0587201006453x)
22 Bernhardt-Romermann M et al 2011 Functionaltraits and local environment predict vegetationresponses to disturbance a pan-European multi-siteexperiment J Ecol 99 777 ndash 787 (doi101111j1365-2745201101794x)
23 Rytwinski T Fahrig L 2011 Reproductive rate andbody size predict road impacts on mammalabundance Ecol Appl 21 589 ndash 600 (doi10189010-09681)
24 Owens IPF Bennett PM 2000 Ecological basis ofextinction risk in birds habitat loss versus humanpersecution and introduced predators Proc NatlAcad Sci USA 97 12 144 ndash 12 148 (doi101073pnas200223397)
25 Sekercioglu CH 2007 Conservation ecology areatrumps mobility in fragment bird extinctions Curr Biol17 R283 ndash R286 (doi101016jcub200702018)
26 Cleary DFR Boyle TJB Setyawati T Anggraeni CDVan Loon EE Menken SBJ 2007 Bird species andtraits associated with logged and unlogged forest inBorneo Ecol Appl 17 1184 ndash 1197 (doi10189005-0878)
27 Vance MD Fahrig L Flather CH 2003 Effect ofreproductive rate on minimum habitat requirementsof forest-breeding birds Ecology 84 2643 ndash 2653(doi10189002-0159)
28 Tscharntke T Sekercioglu CH Dietsch TV Sodhi NSHoehn P Tylianakis JM 2008 Landscape constraintson functional diversity of birds and insects intropical agroecosystems Ecology 89 944 ndash 951(doi10189007-04551)
29 Gaston KJ Fuller RA 2008 Commonness populationdepletion and conservation biology Trends EcolEvol 23 14 ndash 19 (doi101016jtree200711001)
30 Sekercioglu CH 2012 Bird functional diversity andecosystem services in tropical forests agroforestsand agricultural areas J Ornithol 153 S153 ndash S161(doi101007s10336-012-0869-4)
31 Bouwman AF Kram T Klein Goldwijk K (eds) 2006Integrated modelling of global environmentalchange an overview of IMAGE 24 Bilthoven TheNetherlands Netherlands EnvironmentalAssessment Agency
32 Prentice IC Cramer W Harrison SP Leemans RMonserud RA Solomon AM 1992 A global biomemodel based on plant physiology and dominancesoil properties and climate J Biogeogr 19117 ndash 134 (doi1023072845499)
33 Birdlife International and NatureServe 2011 Birdspecies distribution maps of the world See httpwwwbirdlifeorgdatazoneinfospcdownload
34 Thornton D Branch L Sunquist M 2011 Passivesampling effects and landscape location alterassociations between species traits and responseto fragmentation Ecol Appl 21 817 ndash 829(doi10189010-05491)
35 Dunning JB 1993 CRC handbook of avian bodymasses Boca Raton FL CRC Press
36 IUCN Standards and Petitions Subcommittee 2010Guidelines for Using the IUCN Red List Categories andCriteria v 80 See httpintranetiucnorgwebfilesdocSSCRedListRedListGuidelinespdf
37 Del Hoyo J Elliott A Sargatal J 1992 Handbook ofthe birds of the world Barcelona Spain LynxEdicions
38 Sekercioglu CcedilH Daily GC Ehrlich PR 2004Ecosystem consequences of bird declines Proc NatlAcad Sci USA 101 18 042 ndash 18 047 (doi101073pnas0408049101)
39 Burnham KP Anderson DR 2002 Model selectionand multimodel inference a practical information-theoretic approach New York NY Springer
40 Sala OE et al 2000 Global biodiversity scenarios forthe year 2100 Science 287 1770 ndash 1774 (doi101126science28754591770)
41 Pimm S Raven P Peterson A Sekercioglu CcedilHEhrlich PR 2006 Human impacts on the rates ofrecent present and future bird extinctions ProcNatl Acad Sci USA 103 10 941 ndash 10 946 (doi101073pnas0604181103)
42 Renjifo LM 1999 Composition changes in aSubandean avifauna after long-term forestfragmentation Conserv Biol 13 1124 ndash 1139(doi101046j1523-1739199998311x)
43 Gaston KJ Blackburn TM Lawton JH 1997Interspecific abundance-range size relationshipsan appraisal of mechanisms J Anim Ecol 66579 ndash 601 (doi1023075951)
44 Hooper DU et al 2005 Effects of biodiversity onecosystem functioning a consensus of currentknowledge Ecol Monogr 75 3 ndash 35 (doi10189004-0922)
45 Van Bael SA Brawn JD Robinson SK 2003 Birdsdefend trees from herbivores in a Neotropical forestcanopy Proc Natl Acad Sci USA 100 8304 ndash 8307(doi101073pnas1431621100)
46 Sekercioglu CH 2006 Increasing awareness of avianecological function Trends Ecol Evol 21 464 ndash 471(doi101016jtree200605007)
47 Wenny DG DeVault TL Johnson MD Kelly DSekercioglu CH Tomback DF Whelan CJ 2011 Theneed to quantify ecosystem services provided bybirds Auk 128 1 ndash 14 (doi101525auk201110248)

04
08
12
16
body mass (g)
0 2000 4000 600003
05
07
09
0 2000 4000 6000
body mass (g)
primary light intensive
04
08
12
16
0 5 10 15 20 25generation length (years)
03
05
07
09
0 5 10 15 20 25generation length (years)
primary light intensive
04
08
12
16
light intensive
land-use intensity
invertebrates vertebrates varied
03
05
07
09
undisturbed light intensive
land-use intensity
fruit nectar plants (other)
04
08
12
16
light intensive03
05
07
09
undisturbed light intensive
non -migratory migratory
04
08
12
16
light intensive
AR
AR
AR
AR
AR
03
05
07
09
undisturbed light intensive
PPPP
PPPP
PP
habitat generalists forest specialists(a)
(c) (d )
( f )(e)
(g)(h)
( j)(i)
(b)
Figure 4 For 1317 tropical and sub-tropical bird species modelled estimates of probabilities of presence (PP) in each of three land-use intensities (acegi) and givenpresence ratios of abundance (AR) in light relative to undisturbed and in intensive relative to undisturbed land use (bdfhj ) Probabilities of presence and ratios ofabundance were modelled as functions of speciesrsquo traits Traits shown here are those for which the sum of AIC weights of all models containing them was greater than03 (see [39] for more details) (ab) forest habitat specificity (AIC weight sum 1) (cd ) migratory status (AIC weight sum 1) (ef ) diet (AIC weight sum frac14 0997)(gh) generation length (AIC weight sum frac14 0689) and (ij ) body mass (AIC weight sumfrac14 0336) Methods were the same as used in figure 3
rspbroyalsocietypublishingorgProcR
SocB28020122131
5
on November 21 2012rspbroyalsocietypublishingorgDownloaded from
did not qualitatively alter the effect of traits on observed
responses (see the electronic supplementary material
appendix S4) Dropping data from the Australian sub-tropical
study similarly did not alter the results (see the electronic
supplementary material appendix S5) The phylogenetic
signal in the residuals of the model was weak (l 009)
and significant ( p 005) only for two of the five
residual types (see the electronic supplementary material
appendix S3 for full details)
4 DiscussionOverall the results show a substantial global impact of land
use on the local abundance of bird species in tropical forests
Table 1 The relative ability of each of six functional traits to explainobserved responses of 1317 tropical and sub-tropical bird species to land-use intensity Explanatory power was estimated as the sum of AIC weights[1] of all models containing a given trait from a set of models fitting allpossible combinations of traits Response to land-use intensity wasmodelled as the probability of presence of species in each of three land-useintensity classesmdashundisturbed light and intensivemdashand given presencethe abundance ratio in light relative to undisturbed and intensive relativeto undisturbed land use AIC weights were calculated following [1]
trait sum of AIC weights
mass 0336
generation length 0689
range size 0150
migratory status 1000
trophic level 0003
diet 0997
forest specialization 1000
rspbroyalsocietypublishingorgProcR
SocB28020122131
6
on November 21 2012rspbroyalsocietypublishingorgDownloaded from
consistent with the results of several previous studies on a
wide range of species including birds [1364041] Compared
with undisturbed land use both the probability of species
occurrence and abundance given occurrence was slightly
lower in land-use classes impacted by humans but where the
native vegetation remains largely intact In land-use classes
involving clearance of the natural vegetation species
occurrence and abundance were both markedly reduced
The effect of land-use intensity on tropical forest bird
species differed among species with different ecological
traits species that are large-bodied slower-breeding non-
migratory that depend on forest habitat andor that feed
primarily on fruit and invertebrates showed greater declines
than other species The effect of habitat specialization on
the response to land-use intensity has been shown previously
to affect the extinction risk of birds [2425] as well as their
response to habitat fragmentation [21] Species that are
dependent on forest habitat are likely to be more adversely
impacted by forest clearance or degradation of forest habitat
than species with broader habitat preferences Reproductive
rate for which generation length was used here as a proxy
probably affects the ability of populations to recover after per-
turbations and probably also correlates with population
abundance which might affect speciesrsquo vulnerability Repro-
ductive rate is known to correlate with extinction risk [24]
and minimum habitat requirements of bird species [27] but
is only available for a small minority of tropical bird species
Although migratory bird species are 26 times less likely to be
threatened or near threatened with extinction [25] the effect
of migratory status on response to land-use change has not
been shown before In fact it is often migratory bird species
that decline the most in response to habitat fragmentation
[18] In our analysis migratory species tend also to be habitat
generalists (x2 frac14 6336 p 00001) being adapted to cope
with a broader suite of habitats on migration
It has been suggested that species at higher trophic levels
should be more vulnerable to environmental changes because
they occur at lower densities [18] However we found no evi-
dence of an effect of trophic position on the response of birds
to land-use change On the other hand diet had a very strong
effect with insectivores and frugivores declining most consist-
ently in human-impacted land-use classes The sensitivity of
frugivorous and insectivorous birds to habitat fragmentation
and to land-use change has been shown before (and may
result from a reduction in the abundance of fruiting trees
and invertebrates [2126]) but this is to our knowledge the
first analysis to show this effect using a global dataset Large
body size often correlates with increased extinction risk and
sensitivity to human activities in a wide variety of animal taxo-
nomic groups including birds [112426283842] This is
probably because body size correlates with traits that directly
affect speciesrsquo vulnerability such as reproductive rate abun-
dance and trophic level [1823] In this study the effect of
body mass on response to land-use intensity was weak and
was not included in the best model Bird species with small
range sizes have been shown to be more sensitive to habitat
fragmentation than more wide-ranging species [42] However
we failed to detect an effect of range size on the response to
land-use intensity Range size probably affects vulnerability
indirectly because species with small range sizes typically
occur at lower densities [43] and probably have more specific
habitat requirements than more widespread species It is also
possible that species with small ranges and low density were
missed in the studies included here and that an effect of
range size was thus missed Range size may also correlate
with other traits that we considered here such as reproductive
rate and body mass which might account for the failure to
detect an effect of range size on observed responses
The results of analyses like this one can be biased
by sampling artefacts and issues of detectability [34]
Abundance will differ among species and will also vary geo-
graphically for a single species Furthermore reported
abundance will differ among species because of differences
in detectability [34] We avoided most of these issues by com-
paring the abundance among land-use classes of each species
within each study thus comparing abundances for the same
species in a very similar geographical location Nevertheless
issues of detectability may have remained For example it is
likely that birds are more easily detected where vegetation
has been cleared than in intact natural vegetation As a
result the estimated overall response of bird species to
land-use intensity would be an underestimate On the other
hand there may have been a bias towards the publication
of papers that showed a significant effect of land use on
bird abundance although species that did not respond to
land use will also have been included because most studies
sampled whole bird assemblages The perceived association
between traits and responses to land-use intensity will only
have been biased if the effect of traits and land use on the
detectability of species covary with one another
This study focused on the direct effects that local land-use
intensity has on local bird communities However at
landscape and regional scales land use can result in fragmen-
tation and reduction in area of remaining natural habitat (see
[19] for a review) In future analyses the effect of habitat frag-
mentation could be considered assuming that accurate
locations and associated environmental data for the individ-
ual sites sampled were available Abundance could then be
related to the size of habitat patches and the nature of the
habitat in the surrounding landscape derived for example
from remotely sensed data
Although traits improved our ability to explain observed
changes in the occurrence and abundance of tropical bird
Table 2 The four best models for explaining the response of 1317 tropical and sub-tropical bird species to land-use intensity (The fit of each model to thedata was measured using the AIC shown here as the difference between the AIC of the model in question and lowest AIC of all models Traits included inthese models were GL generation length MIGR migratory status DIET dietary guild FORSPEC whether the species was a forest specialist MASS body massResponse to land-use intensity was modelled as the probability of presence of species in each of three land-use intensitiesmdashundisturbed light and intensivemdashand given presence the abundance ratio in light relative to undisturbed and intensive relative to undisturbed land use AIC weights reflect the relative supportfor each model in terms of AIC values and were calculated following [1])
rank model AIC difference AIC weight
1 GLthorn MIGRthorn DIETthorn FORSPEC 0 0455
2 MASSthorn GLthorn MIGRthorn DIETthorn FORSPEC 2235 0131
3 MASSthorn MIGRthorn DIETthorn FORSPEC 2253 0124
4 MIGRthorn DIETthorn FORSPEC 2260 0057
rspbroyalsocietypublishingorgProcR
SocB28020122131
7
on November 21 2012rspbroyalsocietypublishingorgDownloaded from
species considerable unexplained variation remained in the
model The four most obvious sources of this variability
are (i) an effect of traits of the species not captured in the
models (ii) a degree of subjectivity in the assignment of
records to land-use classes because these were based on the
assessments of individual authors (iii) changes in abundance
in response to other pressures including habitat fragmenta-
tion and vegetation structure and (iv) local and regional
differences in the impact of different land-use regimes The
latter explanation is supported by the fact that fitting study
as a factor in the models substantially improved the fit of
the models The effect of traits was consistent in spite of
this spatial variation in observed responses and the causes
of the variation would make an interesting topic for future
study In practical terms the consequence of unexplained
variation in the models is that it will not be possible to
make a precise prediction about the occurrence and abun-
dance of a specific species in a specific location However
the models can be used to make predictions of which species
are more or less likely to be vulnerable to land-use change
and of change in the overall structure of bird communities
in response to changes in land-use intensity
More closely related species could be expected to respond
more similarly to land-use intensity than more distantly
related species which could bias the apparent effect of traits
on response to land-use intensity since the traits are also
likely to covary with relatedness We tested for phylogenetic
signal in the residuals of the best-fitting model finding a sig-
nificant signal for only two of the five residual types
namely for the probability of occurrence in lightly and inten-
sively used habitats The effect of traits was strong and
consistent for both probabilities of occurrence and abun-
dances Therefore the main result of our study was not
affected by phylogenetic non-independence
Overall land-use change presents a serious threat
to forest birds especially for species with particular
combinations of ecological traits As well as allowing the
identification of species of particular conservation concern
differences in the response of species with different sets of
traits also have implications for the functioning of ecosystems
and for the delivery of ecosystem services [38] Dispropor-
tionate declines in the abundance of species with particular
traits will reduce the functional diversity of biological com-
munities which will probably impair the functioning of
ecosystems and make them less resilient to other environ-
mental changes [44] The loss of species with particular
traits will also affect the delivery of specific ecosystem ser-
vices For example insectivorous birds play an important
role in pest control in ecosystems [45] while frugivores are
essential for seed dispersal especially in the tropics [4647]
We show that both of these guilds show consistently negative
responses to forest clearance in sites throughout the tropics
potentially having serious implications for agriculture The
novel likelihood-based approach to analysing responses to
land use allows uncertainty in the observed responses to be
quantified which will be crucial when projecting future
changes to biological communities
We thank the volunteers and students (Felicity Bedford Vicki PowellJulie Day Alexandra Robinson and Jake Simpson) who assisted withthe compilation of the data and Andy Purvis for invaluable adviceon the project and comments on a draft of the manuscript CHSthanks the University of Utah for its support and is grateful toSherron Bullens Debbie Fisher David Hayes and especially BethKarpas and Kathleen McMullen for their dedicated help with theworld bird ecology database We also thank two anonymousreviewers for valuable comments on an earlier draft of this paperThe data used in this study are available on request from TN
References
1 Jetz W Wilcove DS Dobson AP 2007 Projectedimpacts of climate and land-use change on theglobal diversity of birds PLoS Biol 5 e157 (doi101371journalpbio0050157)
2 Green RE Cornell SJ Scharlemann JPW Balmford A2005 Farming and the fate of wild natureScience 307 550 ndash 555 (doi101126science1106049)
3 Gibson L et al 2011 Primary forests areirreplaceable for sustaining tropicalbiodiversity Nature 478 378 ndash 381 (doi101038nature10425)
4 Sekercioglu CH Schneider SH Fay JP Loarie SR2008 Climate change elevational range shifts andbird extinctions Conserv Biol 22 140 ndash 150(doi101111j1523-1739200700852x)
5 United Nations Population Division 2011 WorldPopulation Prospects The 2010 Revision PopulationDatabase See httpwwwunorgesapopulation
6 Alkemade R van Oorschot M Miles L Nellemann CBakkenes M ten Brink B 2009 GLOBIO3 aframework to investigate options for reducingglobal terrestrial biodiversity loss Ecosystems 12374 ndash 390 (doi101007s10021-009-9229-5)
rspbroyalsocietypublishingorgProcR
SocB28020122131
8
on November 21 2012rspbroyalsocietypublishingorgDownloaded from
7 Phalan B Onial M Balmford A Green RE 2011Reconciling food production and biodiversityconservation land sharing and land sparingcompared Science 333 1289 ndash 1291 (doi101126science1208742)
8 Koh LP Sodhi NS Brook BW 2004 Ecologicalcorrelates of extinction proneness in tropicalbutterflies Conserv Biol 18 1571 ndash 1578 (doi101111j1523-1739200400468x)
9 Jones KE Purvis A Gittleman JL 2003 Biologicalcorrelates of extinction risk in bats Am Nat 161601 ndash 614 (doi101086368289)
10 Kotiaho JS Kaitala V Komonen A Paivinen J 2005Predicting the risk of extinction from sharedecological characteristics Proc Natl Acad Sci USA102 1963 ndash 1967 (doi101073pnas0406718102)
11 Davidson AD Hamilton MJ Boyer AG Brown JHCeballos G 2009 Multiple ecological pathways toextinction in mammals Proc Natl Acad Sci USA 10610 702 ndash 10 705 (doi101073pnas0901956106)
12 Kotze DJ OrsquoHara RB 2003 Species declinemdashbutwhy Explanations of carabid beetle (ColeopteraCarabidae) declines in Europe Oecologia 135138 ndash 148 (doi101007s00442-002-1174-3)
13 Murray KA Rosauer D McCallum H Skerratt LF2011 Integrating species traits with extrinsic threatsclosing the gap between predicting and preventingspecies declines Proc R Soc B 278 1515 ndash 1523(doi101098rspb20101872)
14 Mattila N Kaitala V Komonen A Kotiaho JSPaivinen J 2006 Ecological determinants ofdistribution decline and risk of extinction in mothsConserv Biol 20 1161 ndash 1168 (doi101111j1523-1739200600404x)
15 Mattila N Kaitala V Komonen A Paivinen JKotiaho JS 2011 Ecological correlates of distributionchange and range shift in butterflies Insect ConservDivers 4 239 ndash 246 (doi101111j1752-4598201100141x)
16 Barragan F Moreno CE Escobar F Halffter GNavarrete D 2011 Negative impacts of human landuse on dung beetle functional diversity PLoS ONE 6e17976 (doi101371journalpone0017976)
17 Davies KF Margules CR Lawrence JF 2000 Whichtraits of species predict population declines inexperimental forest fragments Ecology 81 1450 ndash1461 (doi1018900012-9658(2000)081[1450WTOSPP]20CO2)
18 Henle K Davies KF Kleyer M Margules C Settele J2004 Predictors of species sensitivity tofragmentation Biodivers Conserv 13 207 ndash 251(doi101023BBIOC0000004319916439e)
19 Ewers RM Didham RK 2006 Confounding factors inthe detection of species responses to habitatfragmentation Biol Rev 81 117 ndash 142 (doi101017S1464793105006949)
20 Barbaro L van Halder I 2009 Linking bird carabidbeetle and butterfly life-history traits to habitatfragmentation in mosaic landscapes Ecography 32321 ndash 333 (doi101111j1600-0587200805546x)
21 Vetter D Hansbauer MM Vegvari Z Storch I 2011Predictors of forest fragmentation sensitivity inNeotropical vertebrates a quantitative review Ecography34 1 ndash 8 (doi101111j1600-0587201006453x)
22 Bernhardt-Romermann M et al 2011 Functionaltraits and local environment predict vegetationresponses to disturbance a pan-European multi-siteexperiment J Ecol 99 777 ndash 787 (doi101111j1365-2745201101794x)
23 Rytwinski T Fahrig L 2011 Reproductive rate andbody size predict road impacts on mammalabundance Ecol Appl 21 589 ndash 600 (doi10189010-09681)
24 Owens IPF Bennett PM 2000 Ecological basis ofextinction risk in birds habitat loss versus humanpersecution and introduced predators Proc NatlAcad Sci USA 97 12 144 ndash 12 148 (doi101073pnas200223397)
25 Sekercioglu CH 2007 Conservation ecology areatrumps mobility in fragment bird extinctions Curr Biol17 R283 ndash R286 (doi101016jcub200702018)
26 Cleary DFR Boyle TJB Setyawati T Anggraeni CDVan Loon EE Menken SBJ 2007 Bird species andtraits associated with logged and unlogged forest inBorneo Ecol Appl 17 1184 ndash 1197 (doi10189005-0878)
27 Vance MD Fahrig L Flather CH 2003 Effect ofreproductive rate on minimum habitat requirementsof forest-breeding birds Ecology 84 2643 ndash 2653(doi10189002-0159)
28 Tscharntke T Sekercioglu CH Dietsch TV Sodhi NSHoehn P Tylianakis JM 2008 Landscape constraintson functional diversity of birds and insects intropical agroecosystems Ecology 89 944 ndash 951(doi10189007-04551)
29 Gaston KJ Fuller RA 2008 Commonness populationdepletion and conservation biology Trends EcolEvol 23 14 ndash 19 (doi101016jtree200711001)
30 Sekercioglu CH 2012 Bird functional diversity andecosystem services in tropical forests agroforestsand agricultural areas J Ornithol 153 S153 ndash S161(doi101007s10336-012-0869-4)
31 Bouwman AF Kram T Klein Goldwijk K (eds) 2006Integrated modelling of global environmentalchange an overview of IMAGE 24 Bilthoven TheNetherlands Netherlands EnvironmentalAssessment Agency
32 Prentice IC Cramer W Harrison SP Leemans RMonserud RA Solomon AM 1992 A global biomemodel based on plant physiology and dominancesoil properties and climate J Biogeogr 19117 ndash 134 (doi1023072845499)
33 Birdlife International and NatureServe 2011 Birdspecies distribution maps of the world See httpwwwbirdlifeorgdatazoneinfospcdownload
34 Thornton D Branch L Sunquist M 2011 Passivesampling effects and landscape location alterassociations between species traits and responseto fragmentation Ecol Appl 21 817 ndash 829(doi10189010-05491)
35 Dunning JB 1993 CRC handbook of avian bodymasses Boca Raton FL CRC Press
36 IUCN Standards and Petitions Subcommittee 2010Guidelines for Using the IUCN Red List Categories andCriteria v 80 See httpintranetiucnorgwebfilesdocSSCRedListRedListGuidelinespdf
37 Del Hoyo J Elliott A Sargatal J 1992 Handbook ofthe birds of the world Barcelona Spain LynxEdicions
38 Sekercioglu CcedilH Daily GC Ehrlich PR 2004Ecosystem consequences of bird declines Proc NatlAcad Sci USA 101 18 042 ndash 18 047 (doi101073pnas0408049101)
39 Burnham KP Anderson DR 2002 Model selectionand multimodel inference a practical information-theoretic approach New York NY Springer
40 Sala OE et al 2000 Global biodiversity scenarios forthe year 2100 Science 287 1770 ndash 1774 (doi101126science28754591770)
41 Pimm S Raven P Peterson A Sekercioglu CcedilHEhrlich PR 2006 Human impacts on the rates ofrecent present and future bird extinctions ProcNatl Acad Sci USA 103 10 941 ndash 10 946 (doi101073pnas0604181103)
42 Renjifo LM 1999 Composition changes in aSubandean avifauna after long-term forestfragmentation Conserv Biol 13 1124 ndash 1139(doi101046j1523-1739199998311x)
43 Gaston KJ Blackburn TM Lawton JH 1997Interspecific abundance-range size relationshipsan appraisal of mechanisms J Anim Ecol 66579 ndash 601 (doi1023075951)
44 Hooper DU et al 2005 Effects of biodiversity onecosystem functioning a consensus of currentknowledge Ecol Monogr 75 3 ndash 35 (doi10189004-0922)
45 Van Bael SA Brawn JD Robinson SK 2003 Birdsdefend trees from herbivores in a Neotropical forestcanopy Proc Natl Acad Sci USA 100 8304 ndash 8307(doi101073pnas1431621100)
46 Sekercioglu CH 2006 Increasing awareness of avianecological function Trends Ecol Evol 21 464 ndash 471(doi101016jtree200605007)
47 Wenny DG DeVault TL Johnson MD Kelly DSekercioglu CH Tomback DF Whelan CJ 2011 Theneed to quantify ecosystem services provided bybirds Auk 128 1 ndash 14 (doi101525auk201110248)