ECOLOGICAL PROFILE 2020 - Ormoc City Government
63
ECOLOGICAL PROFILE 2020 City Planning and Development Office i TABLE OF CONTENTS
-
Upload
khangminh22 -
Category
Documents
-
view
4 -
download
0
Transcript of ECOLOGICAL PROFILE 2020 - Ormoc City Government

ECOLOGICAL PROFILE 2020
City Planning and Development Office i
TABLE OF CONTENTS

ECOLOGICAL PROFILE 2020
City Planning and Development Office 1
CHAPTER I
HISTORY
ECOLOGICAL PROFILE 2020
City Planning and Development Office 2
CITY SEAL
Meaning of the Official Seal of Ormoc City
Upper Portion - Symbol of the City’s Industrialization
Left Portion - Depicts Tongonan Hot Springs National Park, major tourist
attraction of the city.
Right Portion - Denotes the famous Leyte Landing on October 20, 1944,
Battle of Ormoc Corridor (or Yamashita Line) in 1947,
and the Liberation of Leyte.
ECOLOGICAL PROFILE 2020
City Planning and Development Office 3
HISTORY OF ORMOC
400 years ago, in the depressed plains in the western part of the island of Leyte, there was a village called “Ugmok”. The place was large enough to sustain a large settlement of several families. Blessed with fertile soils, the natives called Kaugmokanos, labored and toiled the land, and produced a bountiful harvest.
The early civilization had a well-developed system of living, with proofs of trade and commerce among Asian neighbors, even long before the Spanish explorers arrived.
As years passed by, the lives of the natives began to change when Spaniards came in.
Ugmok is the third Jesuit mission in Leyte, after Carigara and Dulag. The Jesuits arrived in May 1597 to spread Christianity. Converting the natives into Christians did not seem to be much of a problem to the early Jesuit priests. Many of the natives embraced Christianity and its practices in time.
This rosy picture, however, was not without trials. In 1605, barely 8 years after the Jesuit’s evangelization of Ugmok, Moro pirates from at least three tribal groups from Mindanao started to pillage and constantly harassed the Christianized settlement.
In 1768, the Jesuits went home and Augustinians took over the missions in Leyte. Ugmok then was just a visita under the parish of Palompon in 1778-1850, or a period of 72 years.
Ugmok, or Ormoc, only became a separate parish on December 21, 1850, with Rev. Fr. Luciano Bibiano as the first curate.
The name ORMOC, evidently, is the variation of the original name and came into use with the coming of the Spanish conquistadores and the migration of people from neighboring towns and islands to settle in its fertile plains.
The last three decades of the 19th century saw commercial agriculture expanding in Leyte. Hemp or abaca was the island’s most important export in 1870s. Ormoc was one of the main collection sites for hemp in Leyte, along with Tacloban, Carigara, Malitbog, and Palompon.
The Yrastorzas and Aboitizes were 2 of the families of Spanish descent, together with the Tans of Chinese origins, who played big roles in the hemp trading industry.
Some important infrastructures were also built during this period, like Puente de la Reina, an old stone bridge that people used to cross to get to the shore at Candalong. Since there was no pier yet on those years, boats would dock some hundred meters from the shore where they would be met by smaller bancas from Candalong. Another bridge, the Tulay de Perdon, was built by Capitan Municipal Segundo Esmero who was penalized by Spanish authorities for failing to meet the quota of tributos.
Just like any place in the country, by the late 1800s, Ormoc also was a hotbed of revolutionaries seeking independence from the Spanish authorities. Faustino Ablen would become a fabled revolutionary leader, inspiring other locals to join the Pulahan Movement.

ECOLOGICAL PROFILE 2020
City Planning and Development Office 4
His daughter, Rosa, would later marry a Spaniard, Don Felipe Larrazabal, whose family would figure prominently in the growth of Ormoc after World War II.
Modern Ormoc traces the roots of its progress from the sugar industry started by the Aboitiz family. The shift from abaca came in the 1920s after sugar was included in the list of products that enjoyed privileges in the US market, formalized under tariff agreements. The Ormoc Sugar Company (OSCO) sugar mill in Ipil was built in 1919. It was a golden age for the city, growing sugar, which was then a sunrise industry.
The city continued to progress by leaps and bounds, immediately rebounding after it was almost leveled to the ground in World War II. While Leyte Landing is known as the start of the fall of the Japanese occupation, the last stand of the invaders was done in Ormoc, which saw the deadliest aerial and naval battle ever fought in the island. The war in Leyte officially ended in Ormoc City, on December 10, 1944, when the Japanese surrendered to the Allied Forces.
Ormoc was a blazing inferno of bursting white phosphorus shells, burning houses, and exploding ammunition dumps after the shelling. But it quickly recovered.
The Republic of the Philippines became a sovereign and independent nation on July 4, 1946. Ormoc also became a city through Republic Act No. 179, authored by Congressman Domingo Veloso, and was approved on June 21, 1947. The first President of the Philippine Republic Manuel A. Roxas proclaimed Ormoc a City on September 4, 1947 and by virtue of Presidential Proclamation No. 42, Ormoc was formally inaugurated as a city on October 20, 1947, exactly three years after Leyte Landing.
44 years later, Ormoc and its people would again be tested. A flashflood spawned by Typhoon Uring in November 5, 1991 brought death and destruction right in the middle of the city. An estimated 8,000 people lost their lives, and thousands of families were left homeless.
With the help of humanitarian organizations, Ormoc City struggled to its feet. With the help of the Japan International Cooperation Agency (JICA), a Flood Mitigation Project was implemented, helping the local economy and more importantly, protecting the city from another deadly flood.
In the mid-90’s, Ormoc City would play an important role in the country’s overcoming a national power crisis. The location of the world’s second largest geothermal steam fields, it became the host to multinationals that came for Build-Operate-Transfer schemes with the government.
The city would continue to progress. With its strategic geographical location that serves as a gateway to Eastern Visayas, more economic activities have taken place evident in the rapid growth of business establishments, financial institutions, and infrastructures.
But its trials have not ended. On November 8, 2013, Ormoc would once face a challenge after super-typhoon Yolanda clobbered the city. However, Ormocanons refused to be cowed. While other areas experienced pillaging and riots for food, the ever-enduring Ormocanons banded together to help each other, in the meantime

ECOLOGICAL PROFILE 2020
City Planning and Development Office 5
waiting for outside help. Five days after the typhoon struck, the first restaurant opened to serve hot and hearty meals.
Today, Ormoc City is a picture of steady progress and stability. From a small town with dirt roads and a few asphalt streets in the 1940s, Ormoc has metamorphosed into an expanding concrete jungle. Feast or famine, Ormoc will thrive.

ECOLOGICAL PROFILE 2020
City Planning and Development Office 6
CHAPTER II
GEO-PHYSICAL
ENVIRONMENT

ECOLOGICAL PROFILE 2020
City Planning and Development Office 7
A. MAPS
Map 1. Ormoc City Geographical Location

ECOLOGICAL PROFILE 2020
City Planning and Development Office 8
Map 2. Ormoc City Political Boundary Map

ECOLOGICAL PROFILE 2020
City Planning and Development Office 9
Map 3. Ormoc City Zoning Map
ECOLOGICAL PROFILE 2020
City Planning and Development Office 10
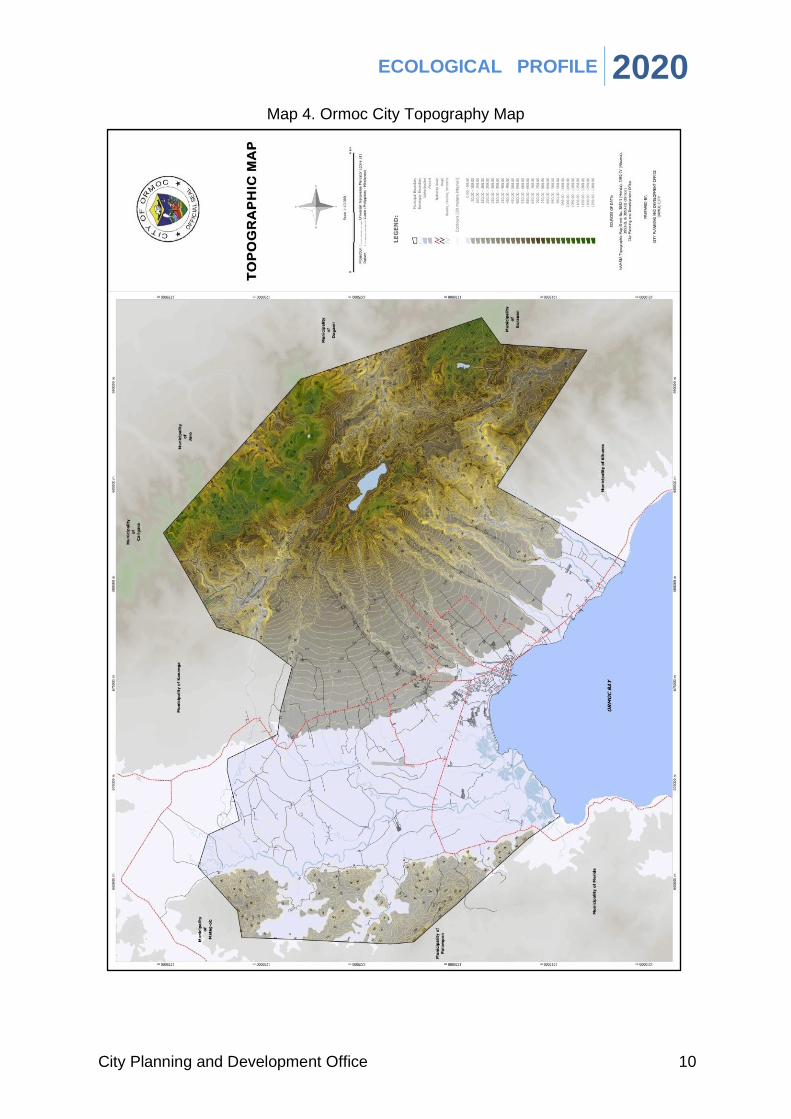
Map 4. Ormoc City Topography Map
ECOLOGICAL PROFILE 2020
City Planning and Development Office 11
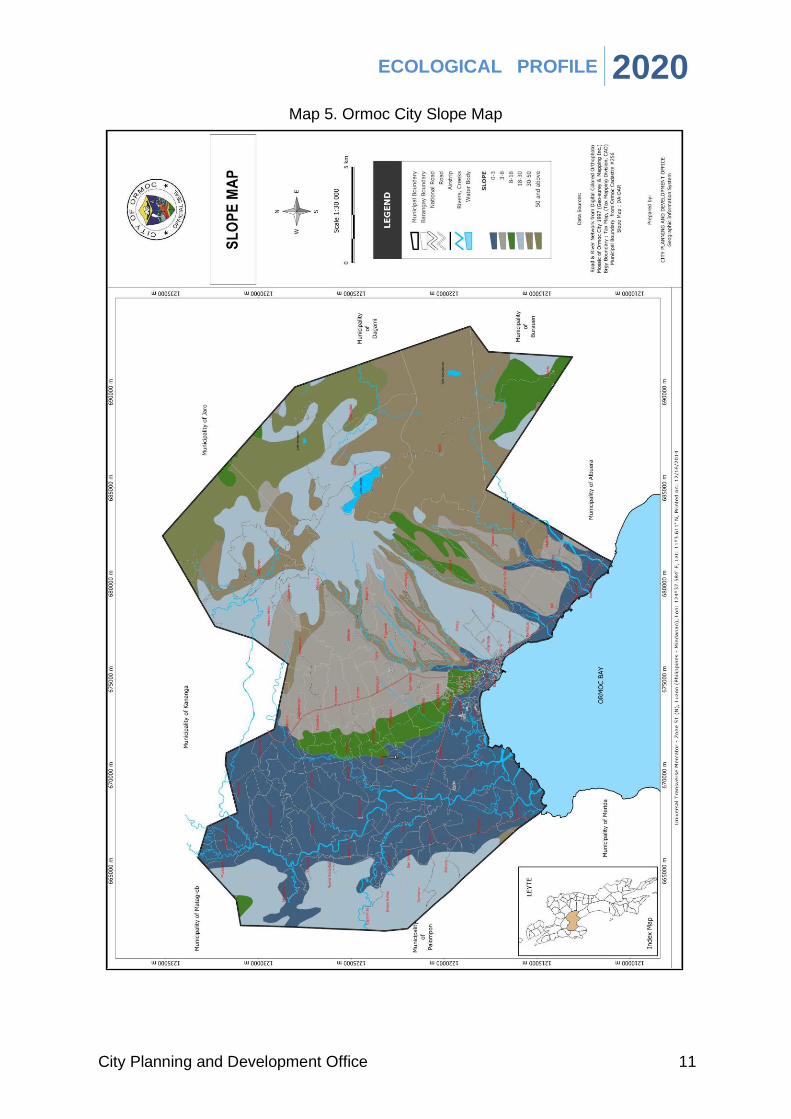
Map 5. Ormoc City Slope Map

ECOLOGICAL PROFILE 2020
City Planning and Development Office 12
Map 6. Flood Hazard Map

ECOLOGICAL PROFILE 2020
City Planning and Development Office 13
Map 7. Landslide Hazard Map

ECOLOGICAL PROFILE 2020
City Planning and Development Office 14
Map 8. Ground Shaking Hazard Map
ECOLOGICAL PROFILE 2020
City Planning and Development Office 15
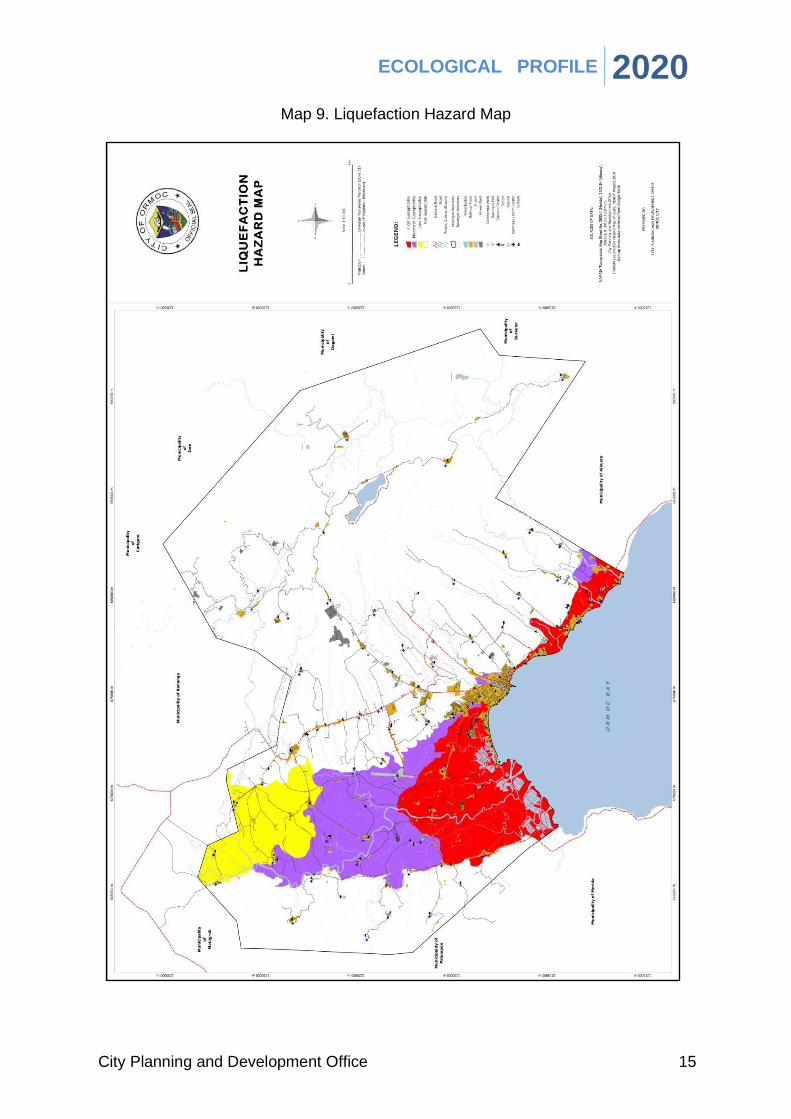
Map 9. Liquefaction Hazard Map
ECOLOGICAL PROFILE 2020
City Planning and Development Office 16
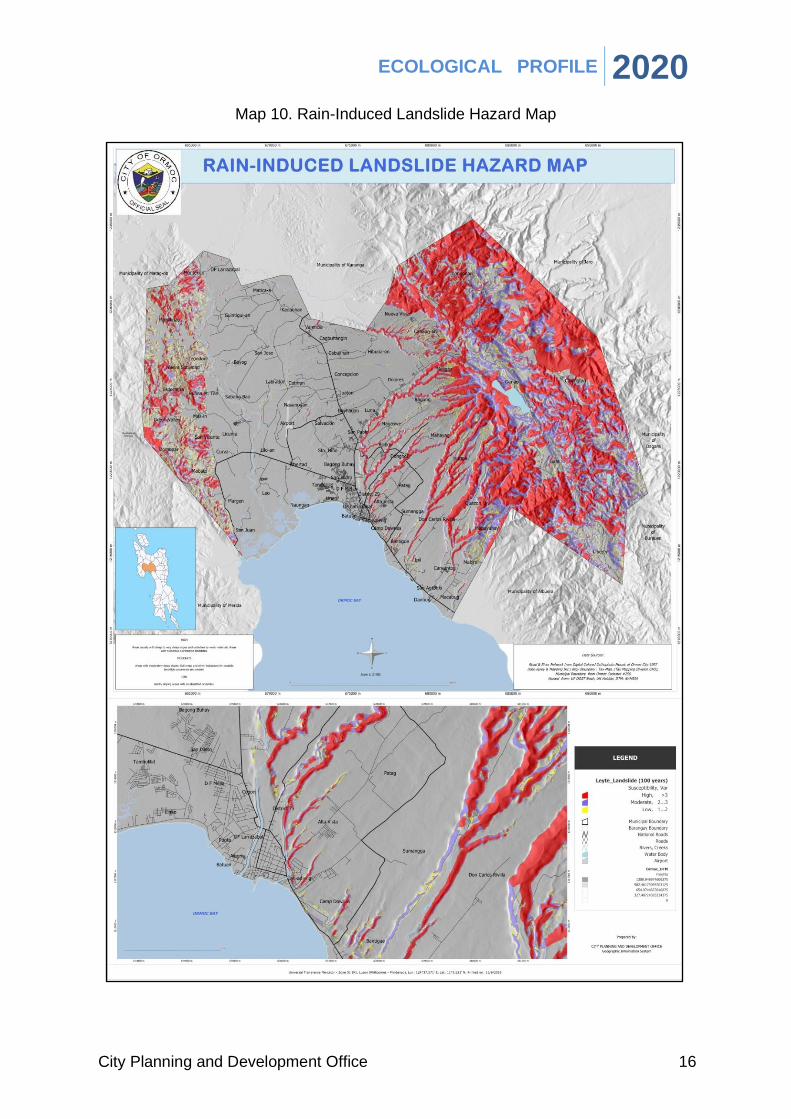
Map 10. Rain-Induced Landslide Hazard Map
ECOLOGICAL PROFILE 2020
City Planning and Development Office 17
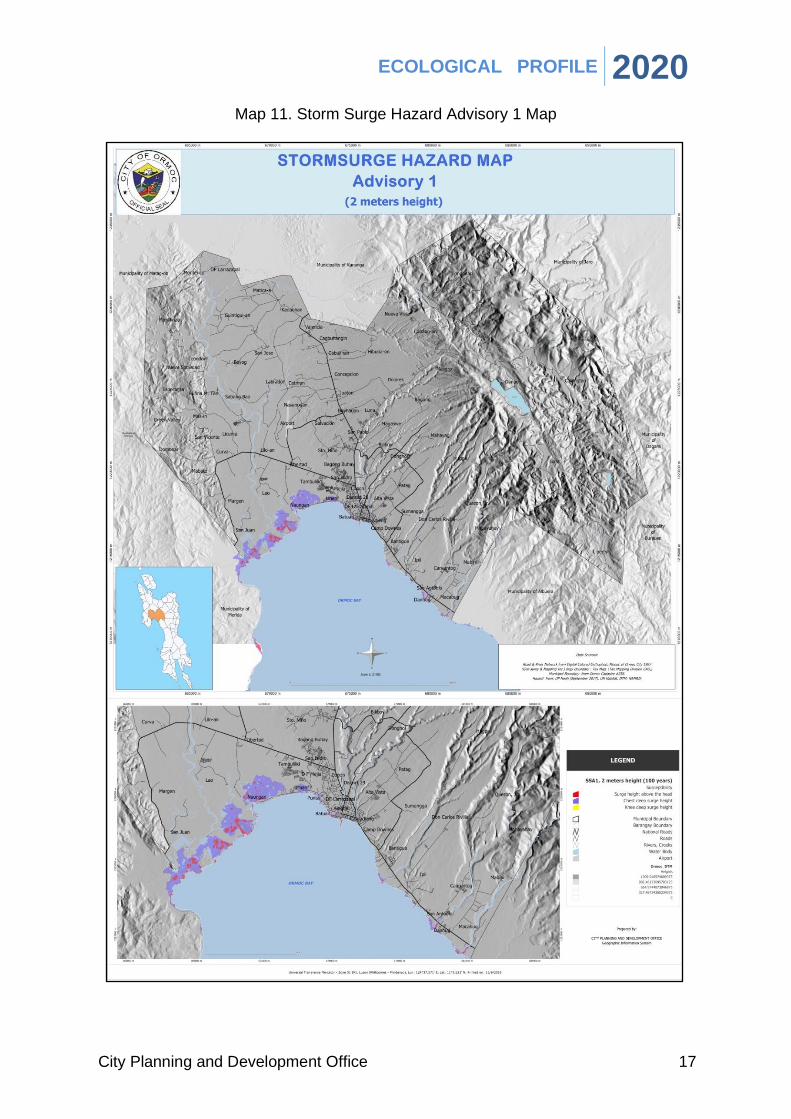
Map 11. Storm Surge Hazard Advisory 1 Map

ECOLOGICAL PROFILE 2020
City Planning and Development Office 18
Map 12. Storm Surge Hazard Advisory 2 Map

ECOLOGICAL PROFILE 2020
City Planning and Development Office 19
Map 13. Storm Surge Hazard Advisory 3 Map

ECOLOGICAL PROFILE 2020
City Planning and Development Office 20
Map 14. Storm Surge Hazard Advisory 4 Map

ECOLOGICAL PROFILE 2020
City Planning and Development Office 21
B. GEOGRAPHIC INFORMATION
The City of Ormoc is situated on the northwestern coastal plain of Leyte Island
frequently visited and directly hit by tropical cyclones formed from the West Pacific
Ocean. It is bordered in the east by Amandiwing mountain range, particularly by Mt.
Mindiwin, with hilly and mountainous landscape peaking at 1,304 masl and slopes
ranging from 30% to 50% (Class Q) classified as protected forestlands comprising
29.20% of the total land area of 46, 430 hectares. However, these forest lands fall
within the critical watersheds of Bao River, Pongso River, Mainit River, and Binhaan
River. This connects with Anonang-Lobi Mountain Range of the Eastern Visayas
Biodiversity Corridor, a key biodiversity area.
The forest ecosystem includes the NIPAS-declared Lake Danao Natural Park with total
land area of 140 hectares. There are two smaller lakes both situated within the
Tongonan Geothermal Reservation Field: Lake Kasudsuran (12.83 ha) in Barangay
Ga-as in the southeast, while Lake Janagdan (2.88 ha) in Barangay Cabintan in the
northeast. Northeastern and western portions of the city are characterized by rolling
to moderately steep (Class P) lands with slope ranging from 18% to 30% account for
20.35% (9,448.51 hectares) of land area. These areas are with detected risk to
landslide.
The remaining 6.68% (3,101.52 hectares) in the central and eastern region of the city
are moderately sloping to rolling (Class O) lands with slope ranging from 8% to 18%
appropriate for seasonal and permanent crop production. Basaltic hills have well-
drained soils with moderate to high fertility. Gently sloping volcanic piedmont and
meta-volcanic hills have soils with very low fertility. Other landform categories have
fine loamy and well-drained soils. These areas are susceptible to flooding.
Coastal plains have poor to well-drained soils with high organic matter content. The
broad alluvial plains have fine to medium fine clayey soils that are poorly drained but
fertile, such as the Luisiana Clay, the Guimbalaon Clay, the Palompon Clay and the
Madellin Clay.
Several rivers and streams traverse the plains of Ormoc and serve as water sources
for the vast agricultural lands. Potable water sources include Bao River in the north,
Pagsangaan River in the east, Bagongbong River and Panilahan River in the south,
and Anilao River and Malbasag River that border the eastern and western portion of
the city proper.
The Anilao River and the Malbasag River are the two major rivers that drain the Ormoc
Watershed. In the northern part of the watershed is the 13-kilometer Anilao river
system with three main tributaries, namely Panagbongon, Magasue and Matutugnaw.
In the southern part is the 10-kilometer Malbasag river system with a small tributary

ECOLOGICAL PROFILE 2020
City Planning and Development Office 22
upstream called Ogmok. All in all, the river network spans approximately 64
kilometers.
Irrigation canals are integrated in Ormoc’s network of waterways. These canals are
constructed and maintained by the National Irrigation Administration (NIA) in order to
cater to the rice-producing barangays in the northeast of city.
Western and southwestern portions are nearly level to undulating lands forming the
Ormoc Valley. Level to nearly level (Class M) lands and very gently sloping to
undulating (Class N) lands constitute around 22.77% (10,572.11 hectares) and
22.08% (10,251.74 hectares) of the total land area, respectively. Suitable
Ormoc City Local Climate Change Action Plan 2019-2030 | 9
for urban and residential development and lowland rice production, lands of these
categories represent the central, western, and southwestern portions of the city.
Areas beyond the city center are large highly restricted agricultural lands that are
irrigated and covered by the Comprehensive Agrarian Reform Program (CARP).
As per records of the City Agriculture Office – Fisheries Division, there are 226.58
hectares of marine reserve areas and fish sanctuaries declared from 2003 to 2006 by
the local government in 9 barangays protecting seagrasses and reefs. Mangrove
forests covers 945 hectares in barangays of Naungan, Lao, and San Juan with 17
species.
Ormoc City is prone to floods (riverine and flashfloods), rain-induced landslides,
typhoons and storm surges, ground rupture, and earthquakes that may result to
liquefaction and tsunamis. Areas that are most at exposed are the barangays along
the coast, including the city center, and the production areas.
C. LAND RESOURCES
In Ormoc City, agricultural land is the dominant land resources used. The following
are the land area classification (in hectares):
ECOLOGICAL PROFILE 2020
City Planning and Development Office 23
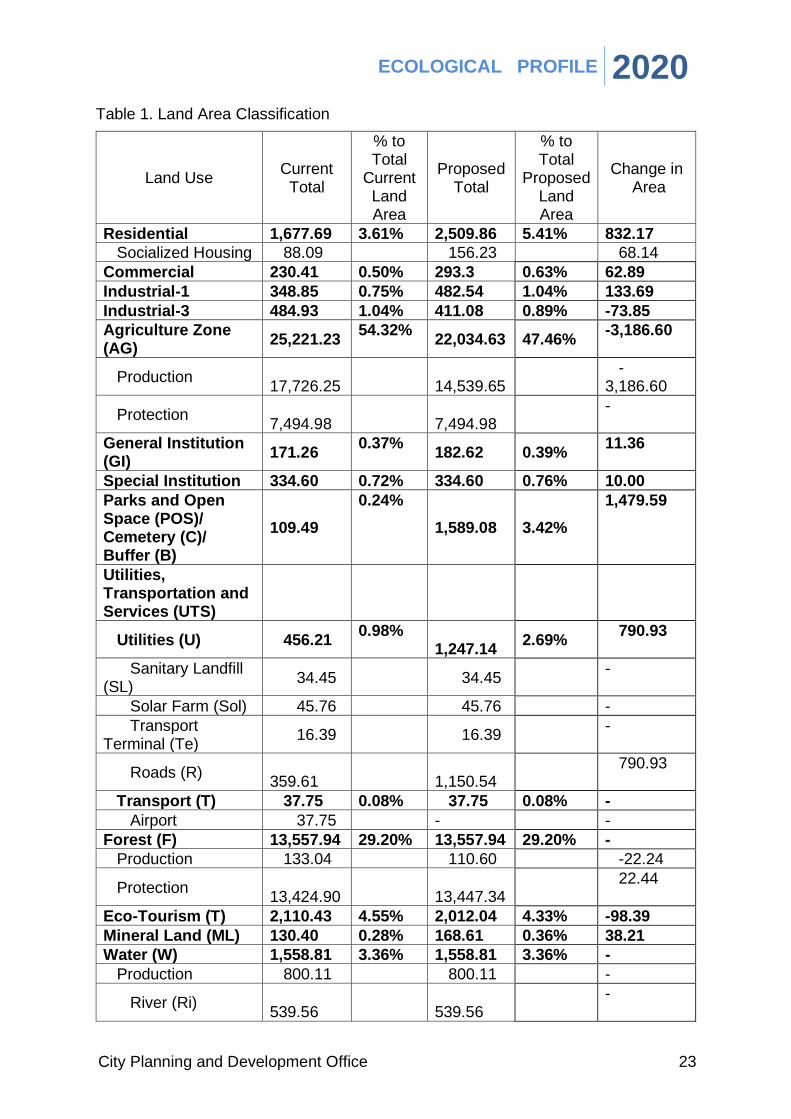
Table 1. Land Area Classification
Land Use Current
Total
% to Total
Current Land Area
Proposed Total
% to Total
Proposed Land Area
Change in Area
Residential 1,677.69 3.61% 2,509.86 5.41% 832.17
Socialized Housing 88.09 156.23 68.14
Commercial 230.41 0.50% 293.3 0.63% 62.89
Industrial-1 348.85 0.75% 482.54 1.04% 133.69
Industrial-3 484.93 1.04% 411.08 0.89% -73.85
Agriculture Zone (AG)
25,221.23 54.32%
22,034.63 47.46% -3,186.60
Production 17,726.25
14,539.65
- 3,186.60
Protection 7,494.98
7,494.98
-
General Institution (GI)
171.26 0.37%
182.62 0.39% 11.36
Special Institution 334.60 0.72% 334.60 0.76% 10.00
Parks and Open Space (POS)/ Cemetery (C)/ Buffer (B)
109.49
0.24%
1,589.08 3.42%
1,479.59
Utilities, Transportation and Services (UTS)
Utilities (U) 456.21 0.98%
1,247.14 2.69%
790.93
Sanitary Landfill (SL)
34.45
34.45 -
Solar Farm (Sol) 45.76 45.76 -
Transport Terminal (Te)
16.39
16.39 -
Roads (R) 359.61
1,150.54
790.93
Transport (T) 37.75 0.08% 37.75 0.08% -
Airport 37.75 - -
Forest (F) 13,557.94 29.20% 13,557.94 29.20% -
Production 133.04 110.60 -22.24
Protection 13,424.90
13,447.34
22.44
Eco-Tourism (T) 2,110.43 4.55% 2,012.04 4.33% -98.39
Mineral Land (ML) 130.40 0.28% 168.61 0.36% 38.21
Water (W) 1,558.81 3.36% 1,558.81 3.36% -
Production 800.11 800.11 -
River (Ri) 539.56
539.56
-
ECOLOGICAL PROFILE 2020
City Planning and Development Office 24
Aquaculture 260.55
260.55
-
Protection 758.70 758.70 -
Mangrove (Mn) 602.99
602.99
-
Lake (La) 155.71
155.71
-
Total Land Area 46,430.00 46,430.00 3,388.94
ORMOC BAY 8,345.80 8,345.80
Marine Reserve Area
10.00
15.00
Fish Sanctuary 50.00 50.00
Municipal Water 8,285.80
8,280.80
Source: City Planning and Development Office, 2020
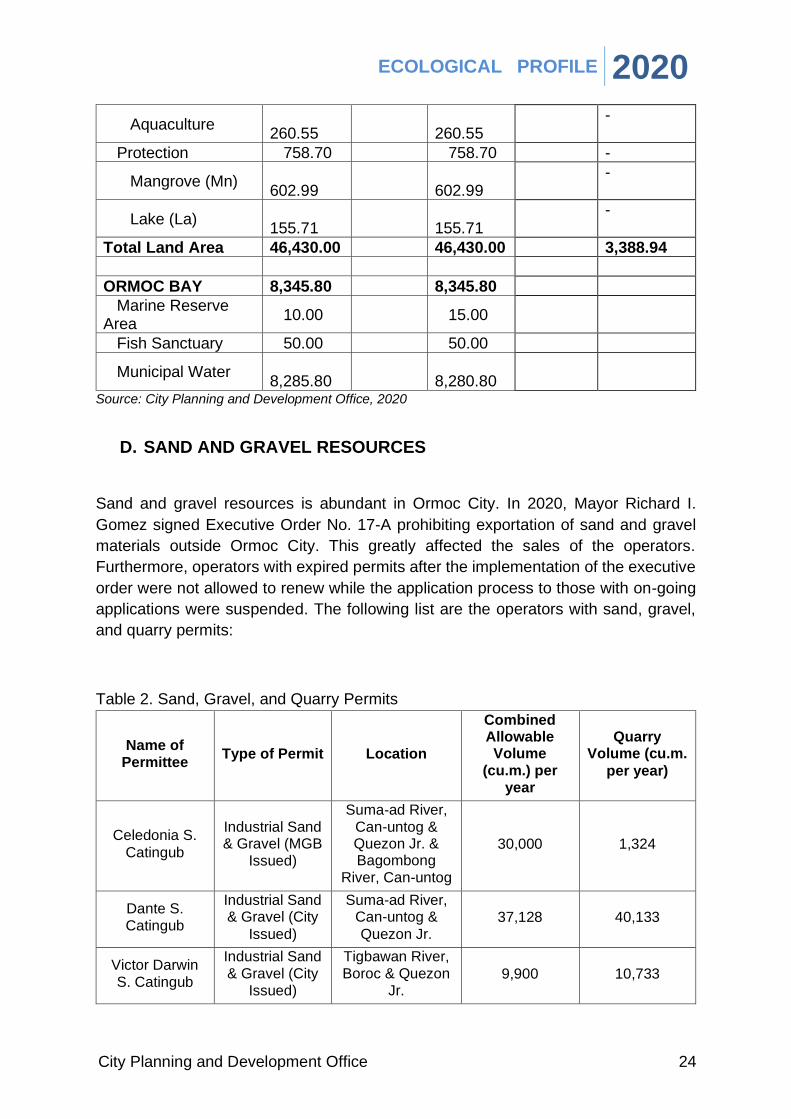
D. SAND AND GRAVEL RESOURCES
Sand and gravel resources is abundant in Ormoc City. In 2020, Mayor Richard I.
Gomez signed Executive Order No. 17-A prohibiting exportation of sand and gravel
materials outside Ormoc City. This greatly affected the sales of the operators.
Furthermore, operators with expired permits after the implementation of the executive
order were not allowed to renew while the application process to those with on-going
applications were suspended. The following list are the operators with sand, gravel,
and quarry permits:
Table 2. Sand, Gravel, and Quarry Permits
Name of Permittee
Type of Permit Location
Combined Allowable Volume
(cu.m.) per year
Quarry Volume (cu.m.
per year)
Celedonia S.
Catingub
Industrial Sand & Gravel (MGB
Issued)
Suma-ad River, Can-untog & Quezon Jr. & Bagombong
River, Can-untog
30,000 1,324
Dante S. Catingub
Industrial Sand & Gravel (City
Issued)
Suma-ad River, Can-untog &
Quezon Jr. 37,128 40,133
Victor Darwin S. Catingub
Industrial Sand & Gravel (City
Issued)
Tigbawan River, Boroc & Quezon
Jr. 9,900 10,733

ECOLOGICAL PROFILE 2020
City Planning and Development Office 25
Doroteo S. Catingub
Industrial Sand & Gravel (City
Issued)
Tigbawan River, Boroc
6,171
Ma. Adelfa Tan Industrial Sand & Gravel (City
Issued)
Panali-an River, Ipil &
BantigueSpecial Permit to
Dispose (SAG) Issued by the
City
9,900 13,152
Ernesto B. Rizzarri
Special Permit to Dispose
(SAG) Issued by the City
Macabug 11,678
Pantaleon Larrazabal
Industrial Sand & Gravel (MGB
Issued)
Panilahan River, Mabini
30,000 8,000
Antonio T. Santiago
Industrial Sand & Gravel (MGB
Issued)
Panilahan River, Mabini
30,000 11,312
Rogelio Allosa
Special Permit to Dispose
(SAG) Issued by the City
Macabug 1,432
Ormoc Rock,
Inc.
Industrial Sand & Gravel (City
Issued)
Panilahan River,
Mabini 9,900 401
Rolando Villasencio
Industrial Sand & Gravel (City
Issued)
Panali-an River, Mabini
9,900 2,816
Jerlyn Joyce Baltonado
Industrial Sand & Gravel (City
Issued)
Suma-ad River, Quezon Jr. & Mahayahay
9,900 34,622
Emmanuel Francisco Tan
Industrial Sand & Gravel (City
Issued)
Suma-ad River, Quezon Jr. & Mahayahay
9,900 22,000
Marcelo B.
Racho
Industrial Sand & Gravel (City
Issued)
Panali-an River, SUmangga &
Bantigue 9,900 3,981
Joann Torres Industrial Sand & Gravel (City
Issued)
Panali-an River, Sumangga &
Hugpa 9,900 30,599
Felixberta R. Ubay
Industrial Mountain
Quarry (City Issued)
San Juan 9,900 84,475
1st Global Alliance
Industrial Mountain
Curva 20,000 32,090

ECOLOGICAL PROFILE 2020
City Planning and Development Office 26
Quarry (City Issued)
Lorenzo Baltonado Jr.
Industrial Mountain
Quarry (City
Issued)
Domonar 20,000 8,461
Manuel Villabermosa
Industrial Mountain
Quarry (City Issued)
Domonar 8,000 4,755
Concrete Stone
Industrial Mountain
Quarry (City
Issued)
San Juan 37,030
Source: Environment and Natural Resources Office, 2020
E. COASTAL ECOSYSTEM
Ormoc Bay comprises 8, 345.8 hectares classified as municipal waters, with coastal
length of 18.635 kilometer across 15 barangays. The mangrove areas in Naungan,
Lao, and San Juan are considered ecotourism node and protected area based on its
spatial strategy.
There are 226.58 hectares of marine reserve areas and fish sanctuaries declared from
2003 to 2006 by the local government in 9 barangays protecting seagrasses and reefs.
Mangrove forests covers 945 hectares in barangays of Naungan, Lao, and San Juan
with 17 species. Reforestation efforts in the 1990s through Family Approach
Reforestation covered 191 hectares, while the National Greening Program expanded
its coverage, however reported to have 95% damage after typhoon.
The Naungan-San Juan Mangrove Planters managed 191 hectares under
Community-based Forest Management Program of the DENR. The City Tourism
Office is set to develop a tourist hub in the area. Previous studies identified Sonneratia
and Avicennia as suitable species for rehabilitation programs.
However, the occupancy of informal settlers in these areas, particularly in Sitio Quinto
Limbo with 231 households of which 70% are fisher folks, posts environmental
degradation and water coliform contamination due to improper solid waste disposal.
F. FOREST ECOSYSTEM
The protected forest zone includes the delineated Lake Danao Natural Park under the
NIPAS Act with 2, 1103.43 hectares as ecotourism zone. The area falls within the Bao

ECOLOGICAL PROFILE 2020
City Planning and Development Office 27
River Watershed considered critical in status by the DENR together with other 8 legally
delineated watersheds in the region. The forest production area is located mostly
located in the central portion of the city, with vast track of private ownership. This area
also includes the solar farms in Dolores, and geothermal power plant in Tongonan. All
remaining forest lands are classified as protected forest with total area of 15, 508 ha.
This includes the Lake Danao Natural Park under the NIPAS Act with total land area
of 2, 110.43 ha, currently being developed for eco-tourism activities. However, the
water quality of the lake is being rehabilitated from the coliform breakout in 2010. There
is a total of 103.07 ha with high risk to rain-induced landslide.
The remaining forest of the city was classified to be residual forest, highly affected by
logging activities in the 1950s to 1960s. This is second growth forest is highly classified
as open forest, with low capacity of holding rainwater. This is observed within the
vicinity of the Danao Lake where landslide is detected at 810 masl. Dense forest areas
are observed within the lower elevation between 280 masl to 450 masl in Tongonan
and Dolores. Lake water is currently being rehabilitated from the coliform breakout in
2010 coming from domestic waste of people residing near it. The lake is considered a
potential for tourism activity currently inviting local tourists, and with city plans on its
further development. The same is considered source of water supply in the city.
ECOLOGICAL PROFILE 2020
City Planning and Development Office 28
CHAPTER III
POPULATION AND
SOCIAL PROFILE
ECOLOGICAL PROFILE 2020
City Planning and Development Office 29
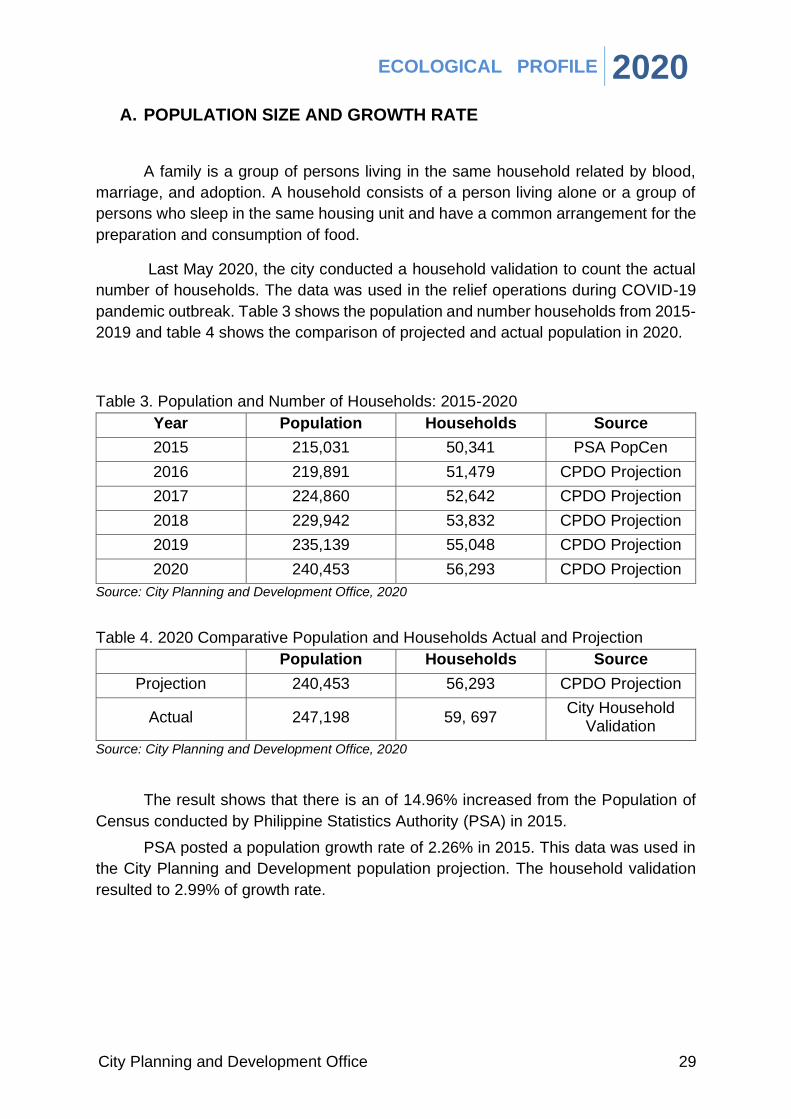
A. POPULATION SIZE AND GROWTH RATE
A family is a group of persons living in the same household related by blood,
marriage, and adoption. A household consists of a person living alone or a group of
persons who sleep in the same housing unit and have a common arrangement for the
preparation and consumption of food.
Last May 2020, the city conducted a household validation to count the actual
number of households. The data was used in the relief operations during COVID-19
pandemic outbreak. Table 3 shows the population and number households from 2015-
2019 and table 4 shows the comparison of projected and actual population in 2020.
Table 3. Population and Number of Households: 2015-2020
Year Population Households Source
2015 215,031 50,341 PSA PopCen
2016 219,891 51,479 CPDO Projection
2017 224,860 52,642 CPDO Projection
2018 229,942 53,832 CPDO Projection
2019 235,139 55,048 CPDO Projection
2020 240,453 56,293 CPDO Projection
Source: City Planning and Development Office, 2020
Table 4. 2020 Comparative Population and Households Actual and Projection
Population Households Source
Projection 240,453 56,293 CPDO Projection
Actual 247,198 59, 697 City Household
Validation
Source: City Planning and Development Office, 2020
The result shows that there is an of 14.96% increased from the Population of
Census conducted by Philippine Statistics Authority (PSA) in 2015.
PSA posted a population growth rate of 2.26% in 2015. This data was used in
the City Planning and Development population projection. The household validation
resulted to 2.99% of growth rate.

ECOLOGICAL PROFILE 2020
City Planning and Development Office 30
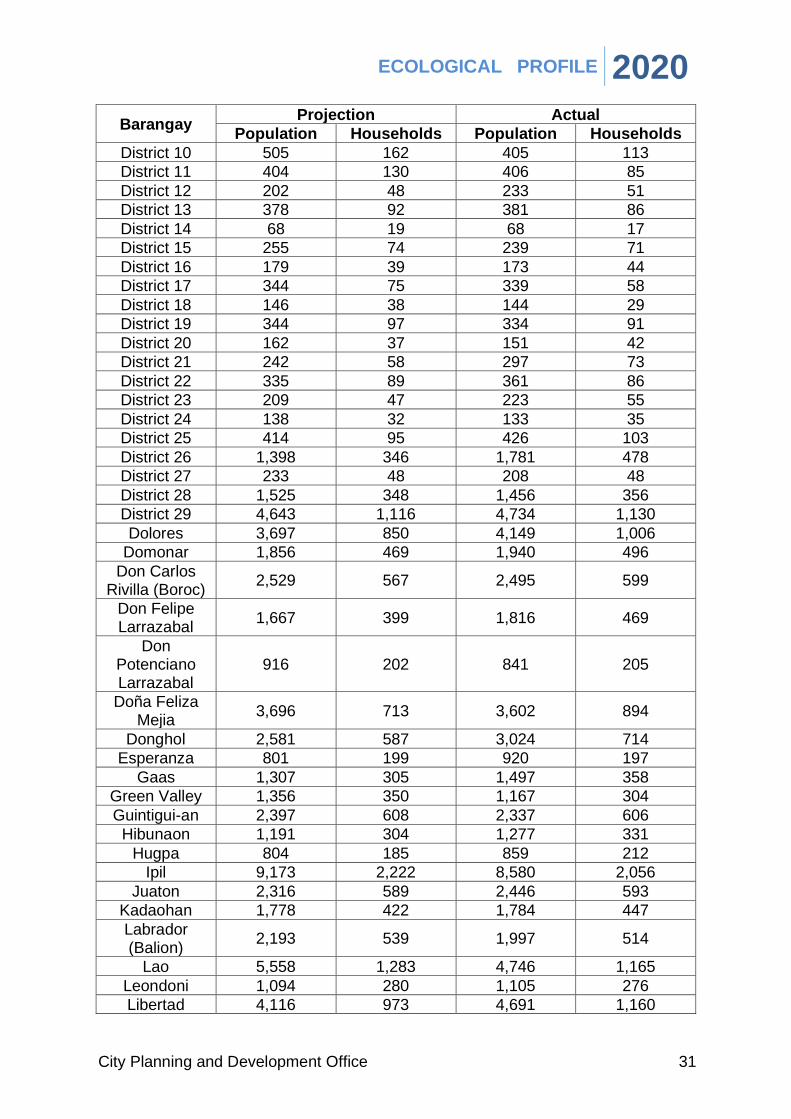
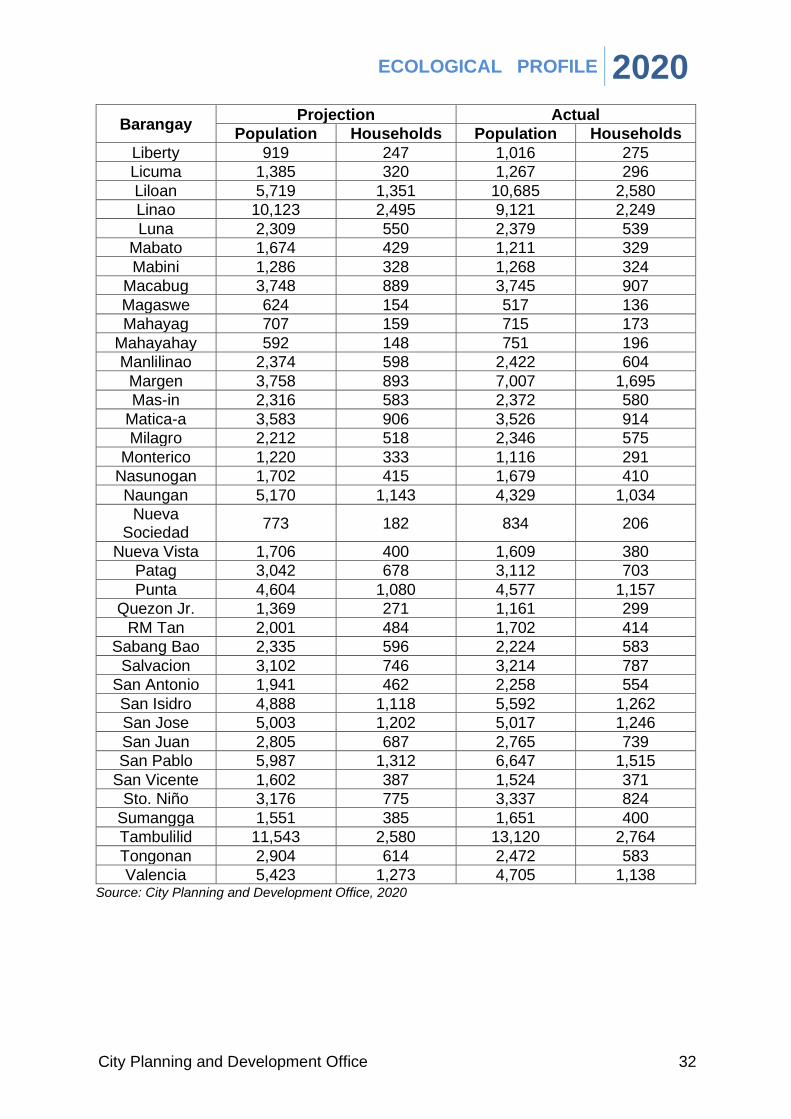
B. GROWTH OF BARANGAY POPULATION
Barangays Tambulilid, Linao and Ipil were projected to be the most populated
barangay in Ormoc City. The household validation result shows that the top three most
populated barangays are Tambulilid, Liloan and Linao. The sudden increase in the
population of Barangay Liloan can be attributed to the relocated families greatly
affected by Typhoon Yolanda. Furthermore, Barangay Margen also had an abrupt
increase of population due to relocated families from high-risk areas.
Table 5. Projected and Actual Comparative per Barangay: 2020
Barangay Projection Actual
Population Households Population Households
Airport 1,415 372 1,437 378
Alegria 1,595 362 1,321 303
Alta Vista 5,005 1,075 5,532 1,255
Bagong Buhay 6,637 1,292 5,958 1,355
Bagong 835 199 892 243
Bantigue 3,294 804 3,322 808
Batuan 707 169 685 154
Bayog 1,464 343 1,218 308
Biliboy 816 217 820 227
Cabaon-an 499 115 538 128
Cabingtan 2,459 541 2,844 651
Cabulihan 2,343 545 2,100 518
Cagbuhangin 1,979 450 2,846 679
Camp Downes 3,163 711 2,761 650
Can-adieng 2,705 618 2,524 570
Can-untog 3,252 789 2,770 674
Catmon 1,126 304 1,714 434
Cogon 7,573 1,473 6,385 1,564
Concepcion 2,859 718 1,880 450
Curva 3,973 1,004 4,077 1,041
Danao 1,772 424 2,048 511
Danhug 1,378 295 1,279 307
Dayhagan 2,052 472 2,095 501
District 1 191 46 153 34
District 2 34 11 29 7
District 3 25 3 43 15
District 4 621 121 509 123
District 5 36 9 110 26
District 6 26 7 34 9
District 7 107 31 270 36
District 8 100 22 102 25
District 9 89 26 144 28
ECOLOGICAL PROFILE 2020
City Planning and Development Office 31
Barangay Projection Actual
Population Households Population Households
District 10 505 162 405 113
District 11 404 130 406 85
District 12 202 48 233 51
District 13 378 92 381 86
District 14 68 19 68 17
District 15 255 74 239 71
District 16 179 39 173 44
District 17 344 75 339 58
District 18 146 38 144 29
District 19 344 97 334 91
District 20 162 37 151 42
District 21 242 58 297 73
District 22 335 89 361 86
District 23 209 47 223 55
District 24 138 32 133 35
District 25 414 95 426 103
District 26 1,398 346 1,781 478
District 27 233 48 208 48
District 28 1,525 348 1,456 356
District 29 4,643 1,116 4,734 1,130
Dolores 3,697 850 4,149 1,006
Domonar 1,856 469 1,940 496
Don Carlos Rivilla (Boroc)
2,529 567 2,495 599
Don Felipe Larrazabal
1,667 399 1,816 469
Don Potenciano Larrazabal
916 202 841 205
Doña Feliza Mejia
3,696 713 3,602 894
Donghol 2,581 587 3,024 714
Esperanza 801 199 920 197
Gaas 1,307 305 1,497 358
Green Valley 1,356 350 1,167 304
Guintigui-an 2,397 608 2,337 606
Hibunaon 1,191 304 1,277 331
Hugpa 804 185 859 212
Ipil 9,173 2,222 8,580 2,056
Juaton 2,316 589 2,446 593
Kadaohan 1,778 422 1,784 447
Labrador (Balion)
2,193 539 1,997 514
Lao 5,558 1,283 4,746 1,165
Leondoni 1,094 280 1,105 276
Libertad 4,116 973 4,691 1,160
ECOLOGICAL PROFILE 2020
City Planning and Development Office 32
Barangay Projection Actual
Population Households Population Households
Liberty 919 247 1,016 275
Licuma 1,385 320 1,267 296
Liloan 5,719 1,351 10,685 2,580
Linao 10,123 2,495 9,121 2,249
Luna 2,309 550 2,379 539
Mabato 1,674 429 1,211 329
Mabini 1,286 328 1,268 324
Macabug 3,748 889 3,745 907
Magaswe 624 154 517 136
Mahayag 707 159 715 173
Mahayahay 592 148 751 196
Manlilinao 2,374 598 2,422 604
Margen 3,758 893 7,007 1,695
Mas-in 2,316 583 2,372 580
Matica-a 3,583 906 3,526 914
Milagro 2,212 518 2,346 575
Monterico 1,220 333 1,116 291
Nasunogan 1,702 415 1,679 410
Naungan 5,170 1,143 4,329 1,034
Nueva Sociedad
773 182 834 206
Nueva Vista 1,706 400 1,609 380
Patag 3,042 678 3,112 703
Punta 4,604 1,080 4,577 1,157
Quezon Jr. 1,369 271 1,161 299
RM Tan 2,001 484 1,702 414
Sabang Bao 2,335 596 2,224 583
Salvacion 3,102 746 3,214 787
San Antonio 1,941 462 2,258 554
San Isidro 4,888 1,118 5,592 1,262
San Jose 5,003 1,202 5,017 1,246
San Juan 2,805 687 2,765 739
San Pablo 5,987 1,312 6,647 1,515
San Vicente 1,602 387 1,524 371
Sto. Niño 3,176 775 3,337 824
Sumangga 1,551 385 1,651 400
Tambulilid 11,543 2,580 13,120 2,764
Tongonan 2,904 614 2,472 583
Valencia 5,423 1,273 4,705 1,138 Source: City Planning and Development Office, 2020

ECOLOGICAL PROFILE 2020
City Planning and Development Office 33
C. POPULATION DENSITY
It was expected that the population density of Ormoc City will increase since
the pattern of the population is increasing. Hence, the projected population density of
the city was 5.18 or five (5) person per square kilometer or 518 people per hectares in
2020. But with using the actual number of population, it yielded a density of 5.32 per
square kilometer or 532 people per hectares.
D. URBAN – RURAL DISTRIBUTION
Ormoc City is composed of 110 barangays. Sixty-nine (69) barangays were
classified as rural and 41 were urban. There were 10 barangays classified as urban
coastal and six (6) barangays classified as rural coastal since Ormoc City is along the
coastal area. With the projected population, there are 64,004 people living in urban
barangays compared to 176,449 people living in rural barangays. This is quite higher
than the distribution using the validation conducted by the city. People living in urban
barangays are 61,550 and 185,648 in rural. The population of the district barangays
are dwindling for years due to construction of commercial establishments.
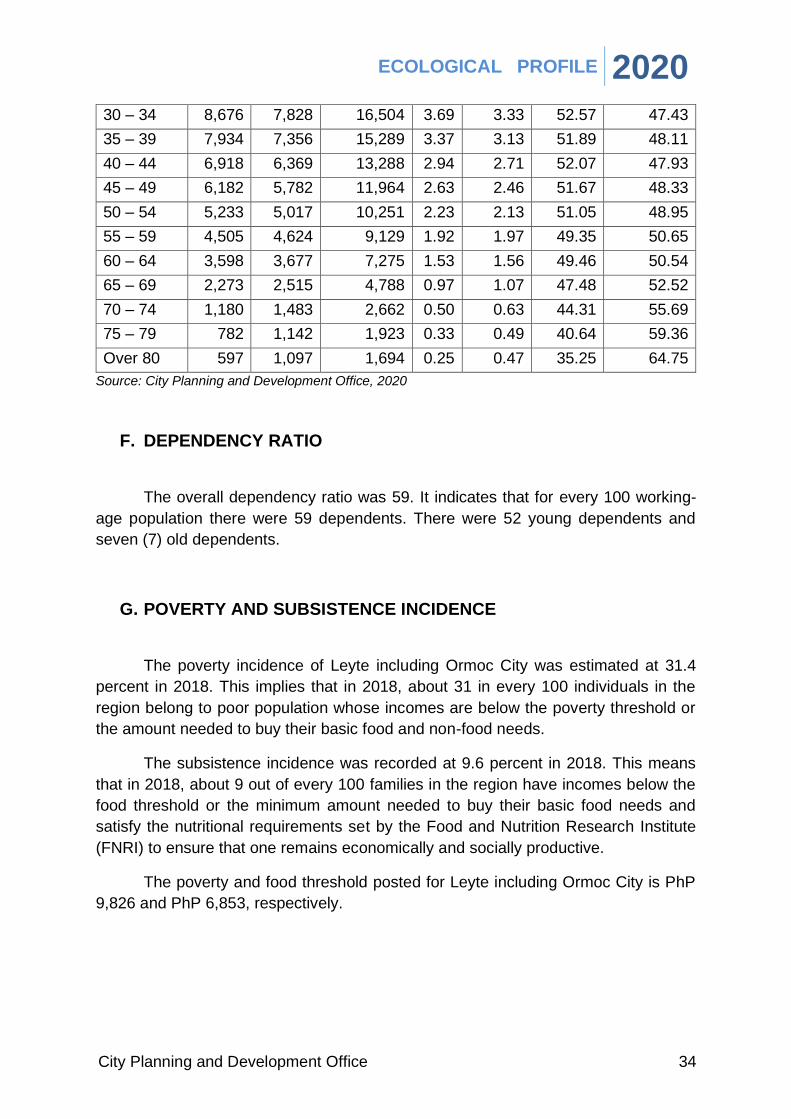
E. AGE – SEX DISTRIBUTION
The projected total population of Ormoc City for 2020 was 240,453. The
dominant ages in the population ranged from five (5) to nine (9) years old. There were
approximately 51 males in every 100 people in Ormoc City.
Table 6. Total Population by Age Group and Sex: 2020 Projection
Year Group
Male Female Both
Sexes
% to Total % to Total Age
Group
Male Female Male Female
Below 1 yr. 2,807 2,529 5,336 1.19 1.08 52.60 47.40
1 – 4 11,226 10,429 21,654 4.77 4.44 51.84 48.16
5 – 9 13,572 12,666 26,238 5.77 5.39 51.73 48.27
10 – 14 13,222 12,277 25,499 5.62 5.22 51.85 48.15
15 – 19 12,990 12,313 25,303 5.52 5.24 51.34 48.66
20 – 24 11,872 11,214 23,086 5.05 4.77 51.43 48.57
25 – 29 9,621 8,947 18,568 4.09 3.80 51.82 48.18
ECOLOGICAL PROFILE 2020
City Planning and Development Office 34
30 – 34 8,676 7,828 16,504 3.69 3.33 52.57 47.43
35 – 39 7,934 7,356 15,289 3.37 3.13 51.89 48.11
40 – 44 6,918 6,369 13,288 2.94 2.71 52.07 47.93
45 – 49 6,182 5,782 11,964 2.63 2.46 51.67 48.33
50 – 54 5,233 5,017 10,251 2.23 2.13 51.05 48.95
55 – 59 4,505 4,624 9,129 1.92 1.97 49.35 50.65
60 – 64 3,598 3,677 7,275 1.53 1.56 49.46 50.54
65 – 69 2,273 2,515 4,788 0.97 1.07 47.48 52.52
70 – 74 1,180 1,483 2,662 0.50 0.63 44.31 55.69
75 – 79 782 1,142 1,923 0.33 0.49 40.64 59.36
Over 80 597 1,097 1,694 0.25 0.47 35.25 64.75
Source: City Planning and Development Office, 2020
F. DEPENDENCY RATIO
The overall dependency ratio was 59. It indicates that for every 100 working-
age population there were 59 dependents. There were 52 young dependents and
seven (7) old dependents.
G. POVERTY AND SUBSISTENCE INCIDENCE
The poverty incidence of Leyte including Ormoc City was estimated at 31.4
percent in 2018. This implies that in 2018, about 31 in every 100 individuals in the
region belong to poor population whose incomes are below the poverty threshold or
the amount needed to buy their basic food and non-food needs.
The subsistence incidence was recorded at 9.6 percent in 2018. This means
that in 2018, about 9 out of every 100 families in the region have incomes below the
food threshold or the minimum amount needed to buy their basic food needs and
satisfy the nutritional requirements set by the Food and Nutrition Research Institute
(FNRI) to ensure that one remains economically and socially productive.
The poverty and food threshold posted for Leyte including Ormoc City is PhP
9,826 and PhP 6,853, respectively.

ECOLOGICAL PROFILE 2020
City Planning and Development Office 35
H. PRESENT STATUS OF WELL-BEING
1. Health
a. Health Facilities
There are five (5) hospitals in Ormoc City, four (4) of which are private hospitals.
The City Health Department of Ormoc City was decentralized by creating six (6)
District Health Centers. These are Curva District Health Center, Doña Feliza Mejia
District Health Center, Ipil District Health Center, Linao District Health Center, San
Pablo District Health Center and Valencia District Health Center.
In the height of the pandemic, the city established “Ligtas Covid Center” to
serve as an isolation area. The Dolores NHA Project was temporarily converted as an
isolation center. It has 699 housing units. Half of the area caters the locally stranded
individuals and returning overseas Filpino workers, and the other half is for positive
individuals that are asymptomatic or mild symptoms.
The Danhug Evacuation Center was used as an isolation center for
uncoordinated arrivals. In addition, the barangays were mandated to establish a
barangay isolation center for returning residents within the region.
The city launched a 30-bed city unified hospital for COVID-19. It is a
collaboration between the Ormoc Doctors’ Hospital, OSPA Farmers’ Medical Center
and Clinica Gatchalian & Hospital. The LGU provided the building, rooms, and
furniture, while the private hospitals provide the medical front liners.
b. Ten Leading Causes of Morbidity
Morbidity is analogous with everyday terms such as illness, sickness, or
disease. Noncommunicable diseases remain the leading cause of sickness in the city.
Upper Respiratory Tract Infection remains to be the number one cause of morbidity in
Ormoc. Table 7 shows the to ten leading cause of morbidity in 2020
Table 7. Ten Leading Cause of Morbidity per 100,000 Population: 2020
Causes Male Female Total Rate
Upper Respiratory Tract Infection 1,490 1,815 3,305 1,423.0
Animal Bites 1,337 1,259 2,596 1,117.8

ECOLOGICAL PROFILE 2020
City Planning and Development Office 36
Wound (All types) 1,170 691 1,861 801.3
Hypertension 551 816 1,367 588.6
Pneumonia 399 401 800 344.5
Acute Respiratory Infection 306 417 723 311.3
Urinary Tract Infection 125 358 483 208.0
COVID-19 255 213 468 201.5
Pulmonary Tuberculosis 267 152 419 180.4
Diarrhea & Gastroenteritis 193 173 366 157.6
Source: City Health Department, 2020
c. Ten Leading Causes of Mortality
Cardiovascular Disease is the leading cause of mortality in the city for 2020. All
the leading causes of mortality are non-communicable disease. Table 8 shows the top
ten leading causes of mortality.
Table 8. Ten Leading Causes of Mortality per 1,000 per Population: 2020
Causes Male Female Total Rate
Cardiovascular Diseases 139 95 234 1.01
Kidney/Renal Diseases 93 54 147 0.63
Pneumonia 68 63 131 0.56
Cancer (All Forms) 58 67 125 0.54
Diabetes Mellitus 38 37 75 0.32
Hypertension 39 33 72 0.31
Hypertensive Cardiovascular Disease 40 24 64 0.28
Undetermined Cause of Death 29 31 60 0.26
Pulmonary Tuberculosis 32 9 41 0.18
Chronic Obstructive Pulmonary Disease 20 6 26 0.11
Source: City Health Department, 2020
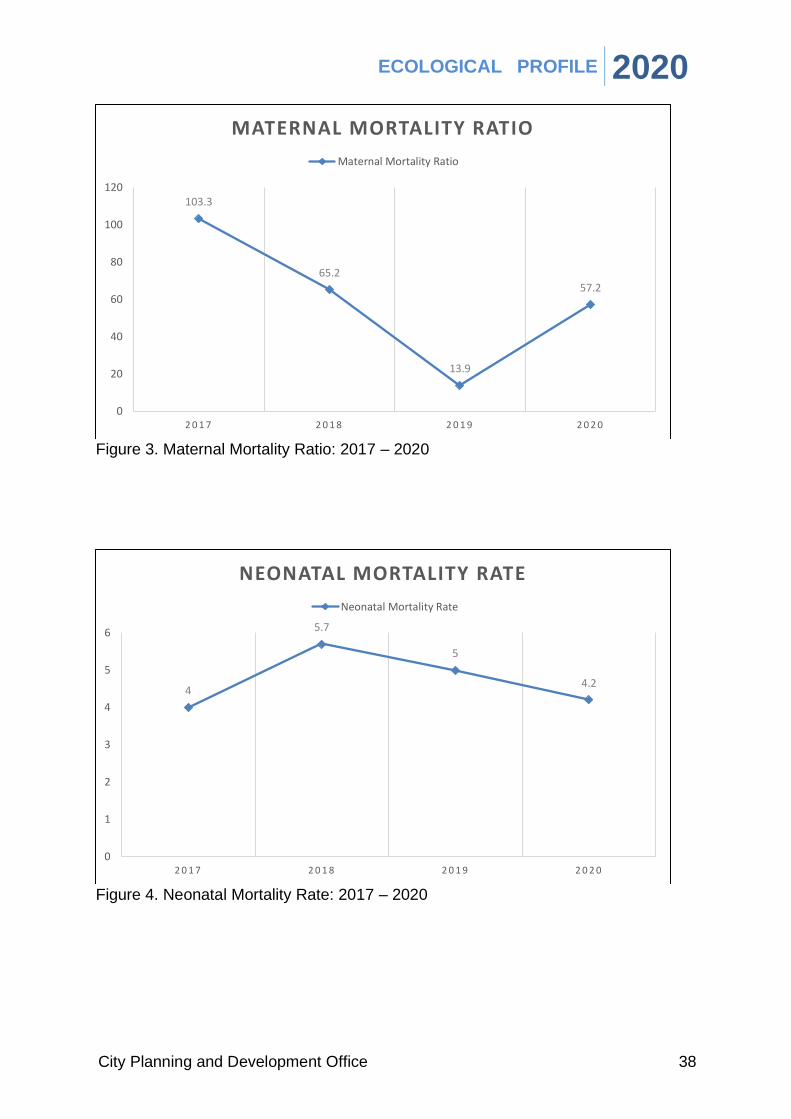
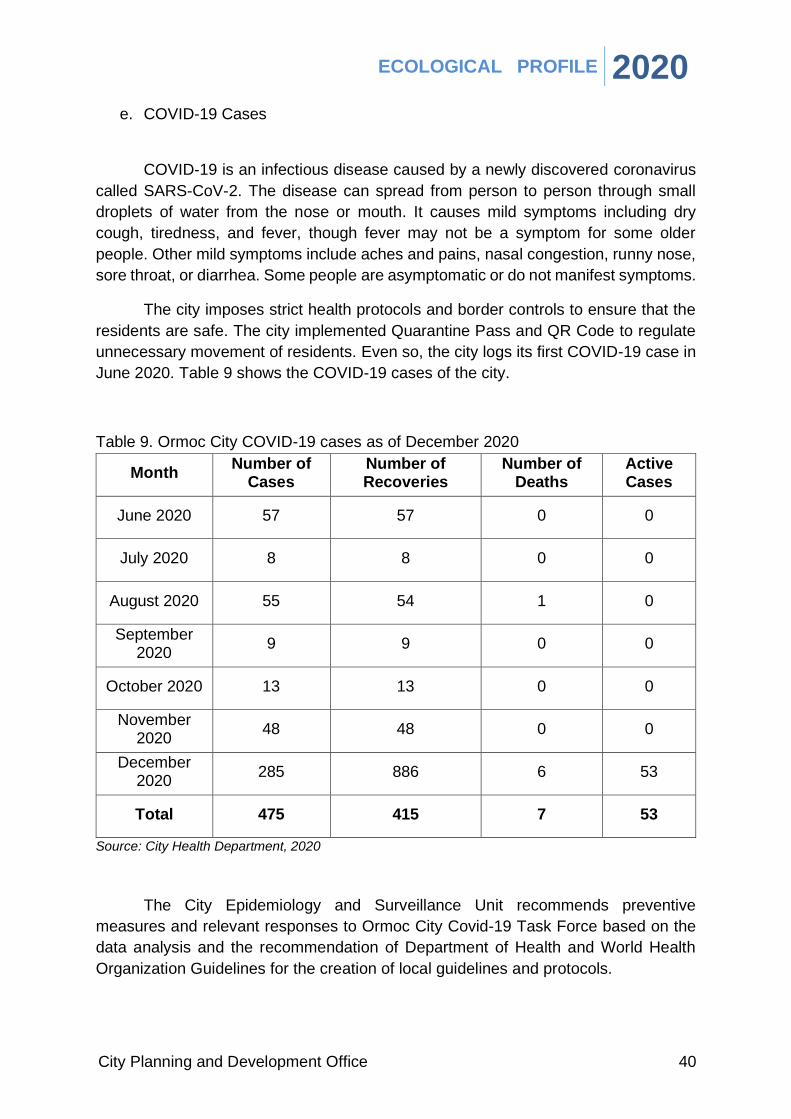
d. Health Situation
The crude birth rate and crude death rate decreased to 22.6 and 6.4,
respectively, in 2020. Other vital heath indicators such as neonatal mortality, infant
mortality and under five mortality rates decreased. However, the maternal mortality
rate relatively increased. From 13.9 in 2019, it jumps to 57.2 in 2020. Figure 1 to 6
shows the comparison from 2017 to 2020.

ECOLOGICAL PROFILE 2020
City Planning and Development Office 37
Figure 1. Crude Birth Rate: 2017 – 2020
Figure 2. Crude Death Rate: 2017 – 2020
30.5
27.1
31.2
22.6
0
5
10
15
20
25
30
35
2 0 1 7 2 0 1 8 2 0 1 9 2 0 2 0
CRUDE BIRTH RATE
Crude Birth Rate
7.5
6.5
7.5
6.4
5.8
6
6.2
6.4
6.6
6.8
7
7.2
7.4
7.6
2 0 1 7 2 0 1 8 2 0 1 9 2 0 2 0
CRUDE DEATH RATE
Crude Death Rate
ECOLOGICAL PROFILE 2020
City Planning and Development Office 38
Figure 3. Maternal Mortality Ratio: 2017 – 2020
Figure 4. Neonatal Mortality Rate: 2017 – 2020
103.3
65.2
13.9
57.2
0
20
40
60
80
100
120
2 0 1 7 2 0 1 8 2 0 1 9 2 0 2 0
MATERNAL MORTALITY RATIO
Maternal Mortality Ratio
4
5.7
5
4.2
0
1
2
3
4
5
6
2 0 1 7 2 0 1 8 2 0 1 9 2 0 2 0
NEONATAL MORTALITY RATE
Neonatal Mortality Rate

ECOLOGICAL PROFILE 2020
City Planning and Development Office 39
Figure 5. Infant Mortality Rate: 2017 – 2020
Figure 6. Under Five Mortality Rate: 2017 – 2020
6.8
8.3
7.2
5.9
0
1
2
3
4
5
6
7
8
9
2 0 1 7 2 0 1 8 2 0 1 9 2 0 2 0
INFANT MORTALITY RATE
Infant Mortality Rate
9.4
11.4
9.4 9.3
0
2
4
6
8
10
12
2 0 1 7 2 0 1 8 2 0 1 9 2 0 2 0
UNDER FIVE MORTALITY RATE
Under Five Mortality Rate
ECOLOGICAL PROFILE 2020
City Planning and Development Office 40
e. COVID-19 Cases
COVID-19 is an infectious disease caused by a newly discovered coronavirus
called SARS-CoV-2. The disease can spread from person to person through small
droplets of water from the nose or mouth. It causes mild symptoms including dry
cough, tiredness, and fever, though fever may not be a symptom for some older
people. Other mild symptoms include aches and pains, nasal congestion, runny nose,
sore throat, or diarrhea. Some people are asymptomatic or do not manifest symptoms.
The city imposes strict health protocols and border controls to ensure that the
residents are safe. The city implemented Quarantine Pass and QR Code to regulate
unnecessary movement of residents. Even so, the city logs its first COVID-19 case in
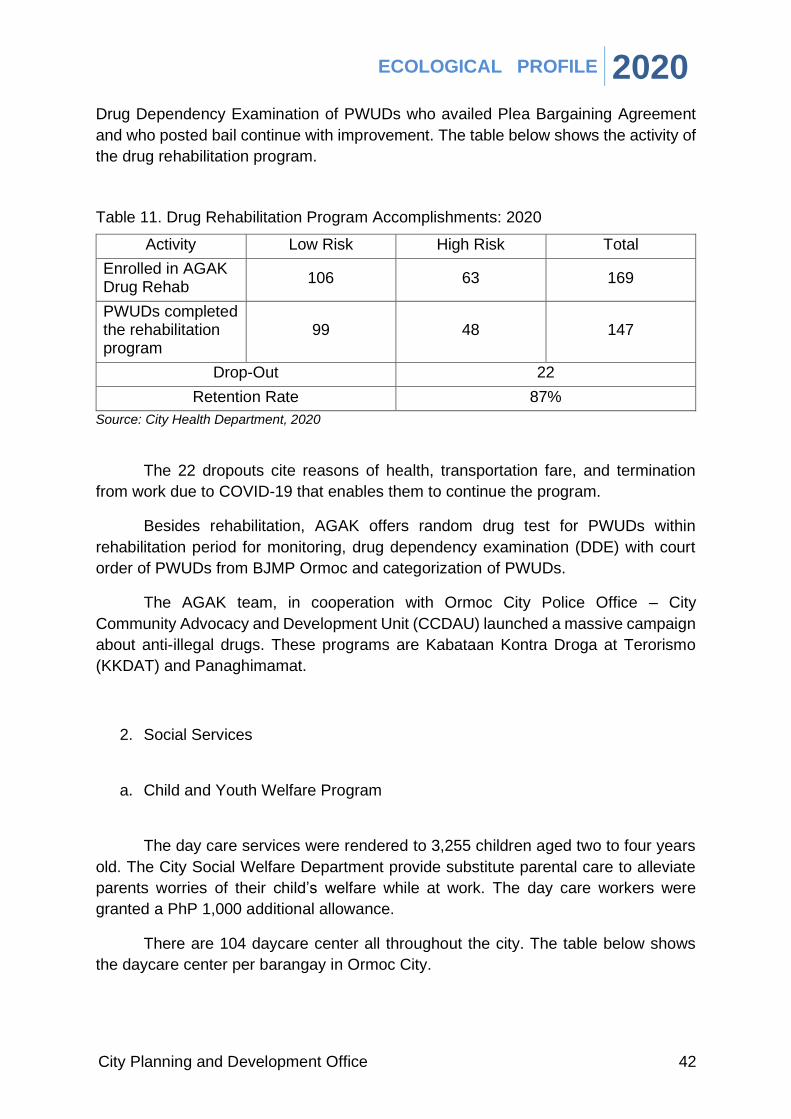
June 2020. Table 9 shows the COVID-19 cases of the city.
Table 9. Ormoc City COVID-19 cases as of December 2020
Month Number of
Cases Number of Recoveries
Number of Deaths
Active Cases
June 2020 57 57 0 0
July 2020 8 8 0 0
August 2020 55 54 1 0
September 2020
9 9 0 0
October 2020 13 13 0 0
November 2020
48 48 0 0
December 2020
285 886 6 53
Total 475 415 7 53
Source: City Health Department, 2020
The City Epidemiology and Surveillance Unit recommends preventive
measures and relevant responses to Ormoc City Covid-19 Task Force based on the
data analysis and the recommendation of Department of Health and World Health
Organization Guidelines for the creation of local guidelines and protocols.

ECOLOGICAL PROFILE 2020
City Planning and Development Office 41
f. Mental Health Program
LamdagOrmoc: An Online Psychosocial Support during COVID-19 is
developed to fight the impact of COVID-19 pandemic to mental health. It adheres to
COVID-19 protocol as well as an accessible platform to everyone.
It has proactive and reactive features. The proactive feature is when personnel
of LamdagOrmoc reach out to the LSIs, APORs and Returning OFWs. The reactive
feature is a hotline provided for those individuals in need of psychosocial support and
will be the one calling the service provider. Table 10 shows the accomplishment of the
mental health program.
Table 10. Overall Accomplishment of LamdagOrmoc: 2020
Activities
Lamdag Ormoc: Online
Psychosocial Support
Walk-in Group PSS
Training/ Orientation on Lamdag Ormoc,
MHPSS and PFA
In house/ face to
face Virtual
Psychological First Aid
21 - - - -
Processing 2,335 149 205 - 8
Referred - 23 - - -
Training - - - 338 299
Follow-up 301 55 - - -
Total 2,791 227 205 338 307
Source: City Health Department, 2020
There were 41 reported suicidal cases in 2020. There were nine individuals who
were thinking of committing suicide or having suicidal thoughts. There were 24
individuals who attempted suicide and eight who died from suicide. Reasons for this
were triggered by COVID19, confinement and changes in education, economic and
religious systems.
g. AGAK Drug Rehabilitation Program and Support Services
The pandemic has slowed down the rehabilitation of person who use drugs
(PWUDs). Despite this, the AGAK Team constantly reminds the PWUDs to stay sober
on illegal drugs, alcohol, and smoke. The rehabilitation schedules were changed,
physical structure on rehabilitation was transformed to follow the COVID-19 protocols.
ECOLOGICAL PROFILE 2020
City Planning and Development Office 42
Drug Dependency Examination of PWUDs who availed Plea Bargaining Agreement
and who posted bail continue with improvement. The table below shows the activity of
the drug rehabilitation program.
Table 11. Drug Rehabilitation Program Accomplishments: 2020
Activity Low Risk High Risk Total
Enrolled in AGAK Drug Rehab
106 63 169
PWUDs completed the rehabilitation program
99 48 147
Drop-Out 22
Retention Rate 87%
Source: City Health Department, 2020
The 22 dropouts cite reasons of health, transportation fare, and termination
from work due to COVID-19 that enables them to continue the program.
Besides rehabilitation, AGAK offers random drug test for PWUDs within
rehabilitation period for monitoring, drug dependency examination (DDE) with court
order of PWUDs from BJMP Ormoc and categorization of PWUDs.
The AGAK team, in cooperation with Ormoc City Police Office – City
Community Advocacy and Development Unit (CCDAU) launched a massive campaign
about anti-illegal drugs. These programs are Kabataan Kontra Droga at Terorismo
(KKDAT) and Panaghimamat.
2. Social Services
a. Child and Youth Welfare Program
The day care services were rendered to 3,255 children aged two to four years
old. The City Social Welfare Department provide substitute parental care to alleviate
parents worries of their child’s welfare while at work. The day care workers were
granted a PhP 1,000 additional allowance.
There are 104 daycare center all throughout the city. The table below shows
the daycare center per barangay in Ormoc City.

ECOLOGICAL PROFILE 2020
City Planning and Development Office 43
Table 12. Day Care Center per Barangay
Barangay Center Barangay Center
Airport Emio Aguinaldo Juaton Topaz
Alegria Sr. San Roque Kadaohan Opal
Alta Vista Uranus Labrador Dr. Jose Rizal
Bagong St. Vincent Lao Fr. Lethen Gomez
Bagong Buhay
Red Cross Leondoni Andres Bonifacio
Marcelo H. Del Pilar Libertad Gregorio H. Del
Pilar
Hope Liberty Holy Trinity
Bantigue Rose 1 Licuma Gabriela Silang
Rose 2 Lilo-an
Jose Burgos
Batuan Sta. Cruz Tzu Chi
Bayog Coral
Linao
St. Mark 1
Biliboy St. Dominic St. Mark 2
Boroc Gumamela 1 St. Mark 3
Gumamela 2 Luna Holy Child
Cabaon-an San Isidro Labrador Mabato Antonio Luna
Cabingtan Immaculate Concepcion
Mabini Dahlia
Cabulihan Ruby Macabug
Daisy 1
Cagbuhangin Sapphire Daisy 2
Camp Downes Venus Magaswe Emmanuel
Can-adieng Tulip Mahayag Star
Can-untog Santan Mahayahay Calachuchi
Catmon Garnet Manlilinao Emilio Jacinto
Child Minding Child Minding Center Margen Manuel L. Quezon
Cogon St. Therese Mas-in Apolinario Mabini
Fatima Matica-a Amethyst
Concepcion Jade Milagro St. Joseph
Curva Juan Luna Monterico Bronze
Danao Sacred Heart 1 Nasunogan Pearl
Sacred Heart 2 Naungan
St. Rafael 1
Danhug Orchid St. Rafael
2/Maharlika
Dayhagan Crystal Nueva
Sociedad Francisco Balagtas
District 28 Earth Nueva Vista Sto. Niño
St. Scholastica Patag Mercury
District 29 Neptune Punta St. Francis Xavier
Dolores San Pablo Hermitaño Quezon Jr. Marigold

ECOLOGICAL PROFILE 2020
City Planning and Development Office 44
Domonar Emilio Jacinto Rufina M.
Tan Lapu-Lapu
Don Felipe Larrazabal Pluto Sabang Bao Aquamarine
Don Potenciano Larrazabal
Don Potenciano Larrazabal
Salvacion Blue Zircon
Doña Feliza Mejia Victory San Antonio Adelfa
Donghol Mars 1 San Isidro Melchora Aquino
Mars 2 San Jose Rose
Esperanza Miguel Malvar San Juan Agoncillo
Gaas San Isidro San Pablo San Pablo
Holy Cros San Vicente Jacinto Zamora
Green Valley Diego Silang Sto. Niño Jupiter
Guintigui-an Emerald Sumangga Lily
Hibunaon Red Coral Tambulilid
Queen Esther 1
Hugpa Rosal Queen Esther 2
Ipil
Everlasting Tongonan St. John
Sampaguita Valencia
Diamond 1
Sunflower Diamond 2
St. Benedict Carnation
Source: City Social Welfare Department, 2020
Educational assistance through Strategic Helpdesk for Information, Education,
Livelihood, and other Developmental Interventions (SHIELD), a national program,
were provided to indigent students and child laborers in Barangay Patag and
Sumangga. These barangays are the pilot areas for the program.
The Protective Services Unit (PSU) recorded a total of 106 acts of violence
against women and children (VAWC). The CSWD is strengthening its program to give
the support and assistance to the victim.
Subsequently, the office reported 38 victims of trafficking. Recovery and
reintegration program set for the trafficked persons to enhance the psychosocial,
social, and economic needs for the victims.
The street-based program design to assess and assist the street dwellers,
street children and homeless individuals and families. The program was able to
support 190 street-based individuals in 2020.
There are two residential care facilities in the city. The Lingap Center provides
shelter for girls and the Social Development Center for Children & Youth for boys.
Currently, the Lingap Center and SDCCY houses 93 girls and 150 boys, respectively.

ECOLOGICAL PROFILE 2020
City Planning and Development Office 45
They were provided temporary shelter, protective custody, and basic needs of
children.
The celebration of the National Children’s Month focuses on upholding the
rights of children during the pandemic with the theme “Sama-samang Itaguyod and
Karapatan ng Bawat Bata sa Panahon ng Pandemya”.
b. Women’s Welfare Program
The Kalipunan ng Liping Pilipina (KALIPI) Nasyonal is an organization that aims
to strengthen and institutionalize national and local programs for women. To assist the
organization, a total of 350 KALIPI ID were provided to be identified as members.
KALIPI members were oriented regarding nutrition, health and safety protocols and
information regarding VAWC cases.
Women Volunteers were organized for Zoning Containment Strategy that will
assist in reporting, monitoring and distribution of food packs and monitor the
movement of residents in the barangay.
22 women were trained in sewing craft to gain skills and knowledge in order to
help gain extra income.
c. Senior Citizen’s Welfare Program
Senior Citizen ID were issued to 1,645 new applicants to avail discounts and
other privileges. They were issued medicine and grocery booklets as required for
discounts of medicines and basic prime commodities.
Birthday gift were provided to 15,329 senior citizens amounting to PhP
1,500.00. Social pension to 6,188 indigent senior citizens as a monthly stipend
amounting to PhP 500.00. A total of 16,412 senior citizen were provided annual cash
incentives.
One (1) senior citizen who reached 100 years old received a tax-free cash
benefit amounting to PhP 100,000.00 from national government and PhP 20,000.00
from the local government.
1,301 senior citizens were given financial assistance for unexpected crisis such
as medical, hospitalization and burial assistance.

ECOLOGICAL PROFILE 2020
City Planning and Development Office 46
d. Persons with Disability Welfare Program
Twenty-five (25) assistive devices were given to OCPDAO members. These
assistive devices were donated by Kiwanis Club of Geo-Ormoc and Tzu Chi
Foundation.
918 PWD IDs were issued to members to avail discounts mandated by law.
There are 2,585 applications were updated for data banking.
e. Emergency Assistance Program
There were 7,745 clients benefited the food assistance. These clients were in
crisis situation and needs food and other basic needs. Assistance was also extended
to PUI/PUM, LSIs and Typhoon victims. There were 7 stranded individuals that were
provided with transportation assistance. Coffins were provided to 111 clients for the
corpse of their love ones.
Financial and medical assistance were given to 1,273 clients served as part of
the assistance to family in crisis situation program. The 1,123 clients who were able
to avail the Hospitalization Assistance Program (HAP) funded by the LGSF-PA.
Financial and medical assistance were also given to 814 clients funded by the DSWD.
This assistance was given to individuals in crisis situation due to COVID-19.
f. Family Welfare Program
Solo Parent ID were given to 1,800 solo parents to identify their membership in
the organization.
Empowerment and Reaffirmation of Paternal Abilities (ERPAT) were
reorganized and election of ERPAT officers in different barangays.
There was an orientation on the Men Oppose Violence Everywhere (MOVE)
and Republic Act 11313 or the Bawal Bastos Law to increase on their roles and
functions in the family and importance of MOVE.

ECOLOGICAL PROFILE 2020
City Planning and Development Office 47
g. Livelihood Development Program
Table 13. Livelihood Programs
Livelihood Program Beneficiaries Amount (in PhP)
Sustainable Livelihood Program
3,123 -
Livelihood Assistance Grant (LAG)
349 3,495,000.00
Kabuhayan Enhancement 130 1,300,000.00
Kabuhayan for ATIP Survivor
5 100,000.00
Source: City Social Welfare Department, 2020
3. Education
a. Enrolment
Table 14. Enrolment in Private and Public Schools: SY 2020-2021
Type Number of Enrollees Total No. of
Teachers
Total No. of
Classrooms Male Female Total
PRIVATE
Pre-School 142 144 286 39 132
Elementary 839 816 1,655 131
Secondary 642 640 1,282 61
154 Senior High
School 1,610 2,077 3,687 125
PUBLIC
Pre-School 2,548 2,341 4,889 120 1,068
Elementary 14,655 13,180 27,835 966
Secondary 8,978 9,045 18,023 678
625 Senior High
School 2,540 2,879 5,419 205
Source: Department of Education – Ormoc City Division, 2020
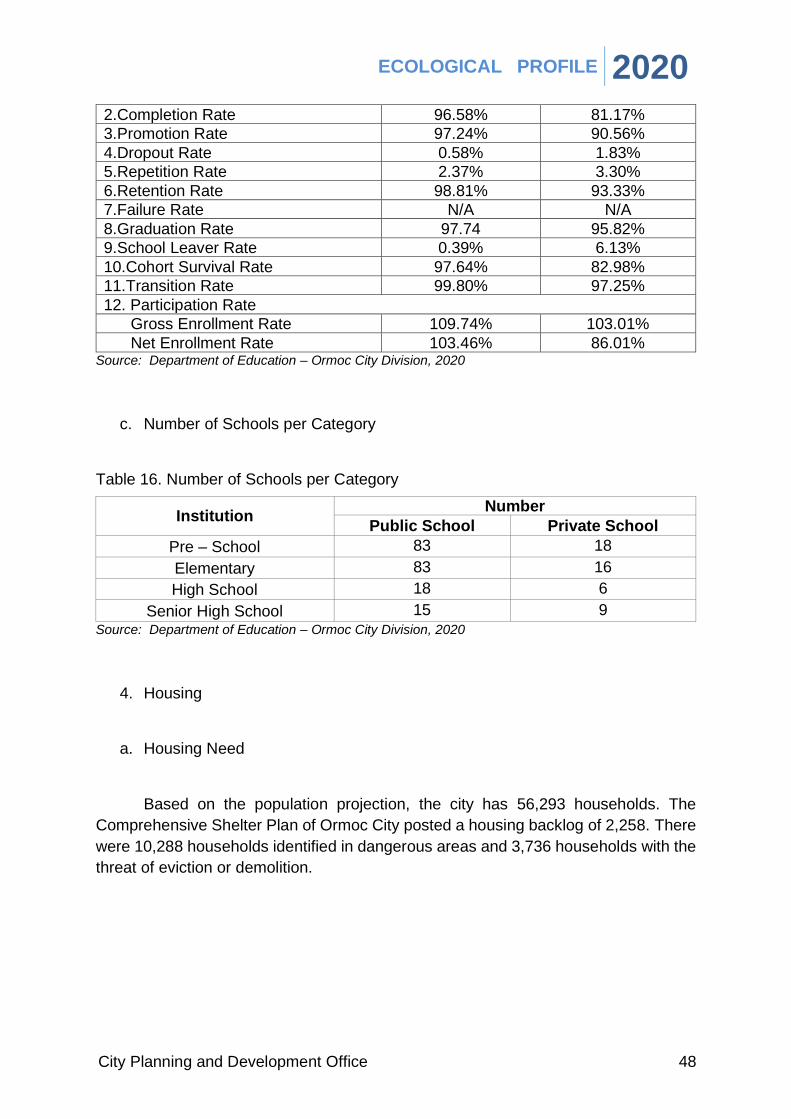
b. Performance Indicators
Table 15. Performance Indicators: SY 2020-2021
Public and Private Schools Elementary (%) Secondary (%)
1.Achievement/NAT Rate 97.32% (MPS) 90.60% (MPS)
ECOLOGICAL PROFILE 2020
City Planning and Development Office 48
2.Completion Rate 96.58% 81.17%
3.Promotion Rate 97.24% 90.56%
4.Dropout Rate 0.58% 1.83%
5.Repetition Rate 2.37% 3.30%
6.Retention Rate 98.81% 93.33%
7.Failure Rate N/A N/A
8.Graduation Rate 97.74 95.82%
9.School Leaver Rate 0.39% 6.13%
10.Cohort Survival Rate 97.64% 82.98%
11.Transition Rate 99.80% 97.25%
12. Participation Rate
Gross Enrollment Rate 109.74% 103.01%
Net Enrollment Rate 103.46% 86.01% Source: Department of Education – Ormoc City Division, 2020
c. Number of Schools per Category
Table 16. Number of Schools per Category
Institution Number
Public School Private School
Pre – School 83 18
Elementary 83 16
High School 18 6
Senior High School 15 9
Source: Department of Education – Ormoc City Division, 2020
4. Housing
a. Housing Need
Based on the population projection, the city has 56,293 households. The
Comprehensive Shelter Plan of Ormoc City posted a housing backlog of 2,258. There
were 10,288 households identified in dangerous areas and 3,736 households with the
threat of eviction or demolition.

ECOLOGICAL PROFILE 2020
City Planning and Development Office 49
b. Upgrading Need
Based on the Comprehensive Shelter Plan of Ormoc City for 2017 – 2025, there
are households in need of tenure, infrastructure, and structural improvement
upgrading. The table below shows the figure of the needed upgrading.
Table 17. Summary of Upgrading Needs
Upgrading Needs Number of Households
Tenure Needs 2,550
Infrastructure Needs
a. Without electricity 6,244
b. Without adequate water supply 4,163
c. Without adequate sanitation 20,815
d. Without drainage system 24,978
e. Without adequate access 12,589
f. Without regular garbage collection
20,815
Structural Improvement Needs 4,163 Source: Comprehensive Shelter Plan Ormoc City, 2017 - 2025
c. Inventory of Residential Subdivision
The residential subdivisions are classified into two categories: the BP 220 and
PD 957. The Batas Pambansa Bilang 220 (BP 220) are housing units within the
affordability level of the average and low-income earners. Presidential Decree 957 (PD
957) are open market and medium-cost subdivision and condominium projects. The
table below shows the inventory of subdivision in Ormoc City.
Table 18. Inventory of Residential Subdivision
Name of Subdivision
Classification Area sq. m. Location
Villa Theresa Heights
Subdivision
BP 220 (1993-2003)
70,160 Brgy. San Isidro
Sunview Subdivision
BP 220 (1993-2003)
25,519 Brgy. Bagong
Buhay
Pacific Bay Villas – Leyte Gulf Land
Corp.
BP 220 (1993-2003)
16,065 Brgy. San Pablo

ECOLOGICAL PROFILE 2020
City Planning and Development Office 50
Camella Homes Ormoc –
Communities Leyte Inc.
BP 220 (1993-2003)
67,841 Brgy. Tambulilid
JS Tan Ormoc Royale
Estates/Stephanie Homes Cons.
BP 220 (1993-2003)
122,213 Brgy. San Pablo
Ruvinieu Mendola/ Ruvi Village III
BP 220 (1993-2003)
19,731 Brgy. Tambulilid
Buenavida Heights Subdivision
BP 220 (1993-2003)
27,962 Brgy. San Pablo
Katambisan Urban Poor Homeowner’s
Association, Inc.
BP 220 (1993-2003)
9,232 Brgy. Salvacion
Macabug Women’s Urban Poor
Homeowner’s Association, Inc.
BP 220 (1993-2003)
7,349 Brgy. Salvacion
Linao Homeowner’s
Association, Inc.
BP 220 (1993-2003)
20,375 Brgy. Tambulilid
Villa Enecio Homeowner’s
Association, Inc.
BP 220 (1993-2003)
19,901 Brgy. Tambulilid
Monte De Luna Subdivision/Familia
Homes Inc.
BP 220 (2004-Present)
47,992 Brgy. Luna
Tan-Martinez Corp. BP 220 (2004-
Present) 9,980 Brgy. San Antonio
Purok Chrysanthemum
Urban Poor Homeowner’s
Association, Inc.
BP 220 (2004-Present)
10,000 Brgy. Dayhagan
Sea View Subdivision
BP 220 (2004-Present)
49,944 Brgy. Bantigue
United Village 1 & 2 Subdivision
BP 220 (2004-Present)
31,716 Brgy. Juaton
San Nicolas Subdivision
BP 220 (2004-Present)
4,020 Brgy. Dayhagan
Sea View Subdivision Phase
II
BP 220 (2004-Present)
76,825 Brgy. Bantigue

ECOLOGICAL PROFILE 2020
City Planning and Development Office 51
Ocean View Homeowner’s
Association, Inc.
BP 220 (2004-Present)
21,020 Brgy. Alta Vista
San Antonio Homeowner’s
Association, Inc.
BP 220 (2004-Present)
30,389 Brgy. San Antonio
Communities Leyte Inc. (Lessandra
Heights)
BP 220 (2004-Present)
9,923 Brgy. Tambulilid
Fatima Homeowners Association
BP 220 (2004-Present)
10,000 Brgy. Salvacion
Can-untog Valley Homeowner’s
Association, Inc.
BP 220 (2004-Present)
14,181 Brgy. Can-untog
Bellas Survivor Homeowners
Association, Inc.
BP 220 (2004-Present)
23,856 Brgy. Can-untog
Uptown Village Homeowner’s
Association, Inc.
BP 220 (2004-Present)
14,880 Brgy. Alta Vista
San Roque Homeowner’s
Association, Inc.
BP 220 (2004-Present)
13,631 Brgy. Alta Vista
Juaton-Ormoc Self-Help HOAI
BP 220 (2004-Present)
39,864 Brgy. Juaton
Laura Ville Homeowner’s
Association, Inc.
BP 220 (2004-Present)
25,000 Brgy. Valencia
Sea View Subdivision
BP 220 (2004-Present)
76,405 Brgy. Hibunaon
Holy Family Homeowner’s
Association, Inc.
BP 220 (2004-Present)
65,610 Brgy. Luna
Gregstone Homeowner’s
Association, Inc.
BP 220 (2004-Present)
40,114 Brgy. Cabulihan
NHA Bagong Pag-asa Subdivision
BP 220 (2004-Present)
113,831 Brgy. Margen
MOCMPC (OCCCI Dolores)
BP 220 (2004-Present)
38,910 Brgy. Dolores
Salvacion Go Homeowners
BP 220 (2004-Present)
38,636 Brgy. Bantigue

ECOLOGICAL PROFILE 2020
City Planning and Development Office 52
San Pablo Holy Child
BP 220 (2004-Present)
44,974 Brgy. San Pablo
OCCCI Margen BP 220 (2004-
Present) 6,155 Brgy. Margen
Deo Homes Ormoc City Residences II
BP 220 (2004-Present)
56,199 Brgy. Salvacion
Camella Ormoc North
BP 220 (2004-Present)
149,820 Brgy. Dolores
Deca Homes Gregoria
Residences
BP 220 (2004-Present)
57,657 Brgy. Concepcion
National Housing Authority (NHA
Highlands 1
BP 220 (2004-Present)
19,161 Brgy. Gaas
National Housing Authority (NHA)
Highlands 2
BP 220 (2004-Present)
78,961 Brgy. Dolores
Yntosan Valley – GGC Land, Inc.
BP 220 (2004-Present)
24,642 Brgy. Concepcion
Casa Mira/ Cebu Land Masters
BP 220 (2004-Present)
91,065 Brgy. Luna
Camella Ormoc North (Alteration)
BP 220 (2004-Present)
647 Brgy. Dolores
La Pradera Subdivision
PD 957 14,000 Brgy. Tambulilid
San Nicolas Subdivision
PD 957 18,678 Brgy. Dayhagan
Communities Leyte, Inc. (Lessandra
Heights)
PD 957 28,278 Brgy. Tambulilid
Villa Guadalupe PD 957 12,146 Brgy. Salvacion
Sabin Heights Subdivision
PD 957 106,208.41 Brgy. Biliboy
D. Espina Builders Corporation
PD 957 27,401 Brgy. Alta Vista
Camella Ormoc North
PD 957 149,820 Brgy. Dolores
Zulia Residences PD 957 34,754 Brgy. Valencia
Esperanza Estate Subdivision (GGC
Land, Inc.) PD 957 62,361 Brgy. San Pablo

ECOLOGICAL PROFILE 2020
City Planning and Development Office 53
Camella Ormoc North (Alteration)
PD 957 647 Brgy. Dolores
Source: City Planning and Development Office, 2020
d. Inventory of Potential Lands for Housing
The land needed for housing is 269.81 hectares. Approximately 130.16
hectares was identified for housing use. The city still needs 139.65 hectares to ensure
that the Ormocanons are in a safe dwelling unit. The table below enumerates the
potential land for proposed resettlement areas.
Table 19. Land Inventory for Proposed Resettlement Areas
Location Landowner OCT/TCT Number
Lot Number
Tax Declaration
Number
Lot Area (sq. m.)
Mas-in (now Green Valley)
Eriberto Guillemer &
Beatriz Oquias
TH-745 6621-D-2 00058-00103
40,406
Dayhagan
Concepcion Tan, Jorge
Tan, Gregorio
Tan, Oscar Tan,
Eduardo Tan,
Reynaldo Tan, Letecia Tan, Manuel
Tan & Benjamin
Tan
12953 5686 00076-00738
13,958
Dayhagan
Concepcion Tan, Jorge
Tan, Gregorio
Tan, Oscar Tan,
Eduardo Tan,
Reynaldo Tan, Letecia Tan, Manuel
Tan &
12955 5696 00076-00740
10,354

ECOLOGICAL PROFILE 2020
City Planning and Development Office 54
Benjamin Tan
Dayhagan Concepcion Vda de Tan
12882 5689 00076-00743
37,589
San Pablo
Ronaldo Tan,
Roberto Tan,
Roderico Tan, Meliton
Tan, Angelica
Tan, Antonio Tan
Jr., Elvis Patrick Tan
& Alma Bonita Tan
32187 5550 00076-00802
35,708
San Pablo Manuel Tan 29896 Lot 3 70,132
Curva City
Government of Ormoc
35520 6225-F-15-
D 00021-00352
18,512
Curva City
Government of Ormoc
T-2029 6225-G-11 00021-00116
42,911
Lilo-an
Nicolasa Tan &
Lourdes Desvarro
25122 6547 00047-00591
493,696
Alta Vista Feliza Angulo
19019 1364-A 00084-00004
28,992
Alta Vista Virginia
Maglasang No TCT 1364-B
00084-00101
28,992
Alta Vista Clarissa Con-ui
19021 1364-C 00084-00156
28,992
Alta Vista Arsenio Con-ui
19022 1364-D 00084-00157
28,992
Alta Vista Damaiana
Con-ui Pedraza
19023 1364-E 00084-00158
28,992
Alta Vista Teodosia
Con-ui Cornel
19024 00084-00159
28,992
Alta Vista Teodosia
Con-ui Cornel
25559 1364-G 00084-00087
28,991
Bantigue Dionesio Eamiguel
20686 1884 00000-00453
41,294

ECOLOGICAL PROFILE 2020
City Planning and Development Office 55
Concepcion Corazon Gaquit
24203 Lot 1 00013-00055
40,114
Concepcion Victor Gaquit
24204 Lot 2 00013-00058
40,113
Concepcion Peter R. Gaquit
24205 Lot 3 00013-00057
40,114
Concepcion Milagros G. Evangelista
24207 Lot 5 40,114
Milagro Patrocino Soquez
16886 7446 00060-00200
78,336
Milagro Patrocino Soquez
16559 7452-B 00060-00198
150,000
Milagro Jose Marie
Duarte 22164 7474
00060-00049
150,482
Milagro Margaret Fructuoso
21708 7464 00000-26343
15,804
Milagro Rose Marie Fructuoso
22157 7448-B 00060-00057
41,311
Milagro Patrocino Soquez
18218 7452-A-2 00060-00197
150,000
Milagro Rose Marie Fructuoso
22156 7473 00060-00056
47,231
Milagro Margaret Fructuoso
21709 7452-A-1-
B 00060-00051
35,839
Milagro Margaret Fructuoso
21708 7467 00000-26341
9,972
Milagro Margaret Fructuoso
21708 7465 00000-00054
5,260
Milagro Margaret Fructuoso
21708 7466 00060-00051
11,711
Milagro Mario M.
Rodriguez 22057 Lot 2
00000-28403
25,277
Milagro
Delia Tan, Jose Luis Tan, Irene Manuela
Tan, Angela T. Ly,
Maridel Tan & Monica
Tan
T-51690 Lot 1 25,276
Mas-in (now Green Valley)
Romulo Arcuino
TH-327 6621-D-3 00058-00017
10,406
Dayhagan
Concepcion Tan, Jorge
Tan, Gregorio
Tan, Oscar
12954 5687 00076-00779
30,639

ECOLOGICAL PROFILE 2020
City Planning and Development Office 56
Tan, Eduardo
Tan, Reynaldo
Tan, Letecia Tan, Manuel
Tan & Benjamin
Tan
Dayhagan
Concepcion Tan, Jorge
Tan, Gregorio
Tan, Oscar Tan,
Eduardo Tan,
Reynaldo Tan, Letecia Tan, Manuel
Tan & Benjamin
Tan
122936 5688 00076-00739
20,127
San Pablo
Ronaldo Tan,
Roberto Tan,
Roderico Tan, Meliton
Tan, Angelica
Tan, Antonio Tan
Jr., Elvis Patrick Tan
& Alma Bonita Tan
32189 5548 00076-00800
17,954
Dayhagan George P.
Tan 31225 5690
00076-00775
20,238
San Pablo Loreto Chu 14494 5570 00078-00031
111,280
Macabug Luis D. Tan 50455 Lot 1 00051-00187
138,258
Macabug Luis D. Tan 21731 Lot 2 00051-00131
166,889
Macabug Alicia B. Tan 30579 3540-A 00052-00280
105,000
Macabug Celina B.
Tan 30580 3540-B
00052-00281
83,126
ECOLOGICAL PROFILE 2020
City Planning and Development Office 57
Macabug Vicente M. Rodriguez
22338 3533-C-1 00052-00129
19,380
Macabug Rita M.
Rodriguez 22339 3533-C-2
00052-00128
19,380
Source: Comprehensive Shelter Plan Ormoc City, 2017 – 2025
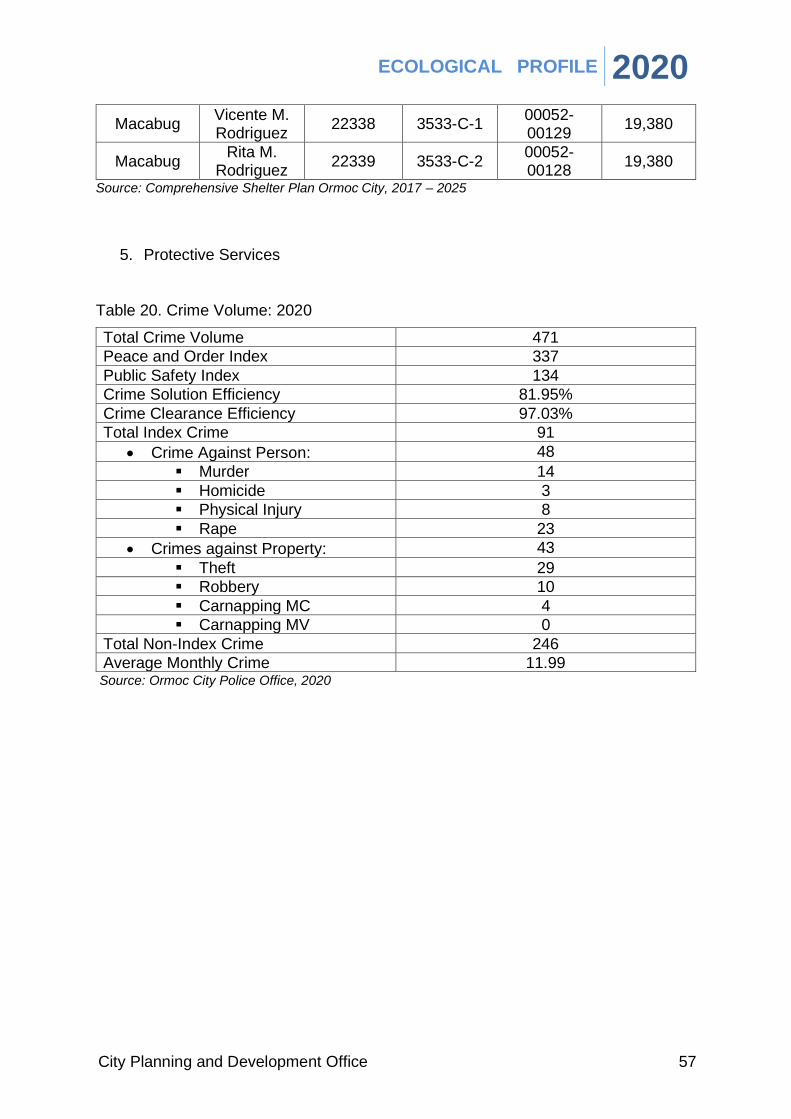
5. Protective Services
Table 20. Crime Volume: 2020
Total Crime Volume 471
Peace and Order Index 337
Public Safety Index 134
Crime Solution Efficiency 81.95%
Crime Clearance Efficiency 97.03%
Total Index Crime 91
• Crime Against Person: 48
▪ Murder 14
▪ Homicide 3
▪ Physical Injury 8
▪ Rape 23
• Crimes against Property: 43
▪ Theft 29
▪ Robbery 10
▪ Carnapping MC 4
▪ Carnapping MV 0
Total Non-Index Crime 246
Average Monthly Crime 11.99 Source: Ormoc City Police Office, 2020
ECOLOGICAL PROFILE 2020
City Planning and Development Office 58
CHAPTER IV
LOCAL
ECONOMY

ECOLOGICAL PROFILE 2020
City Planning and Development Office 59
A. PRIMARY SECTOR
1. Agricultural Crops
Year 2020 was a challenging year for agriculture not only because of the
pandemic but due to hydrological abnormalities. Market prices of agricultural produces
drop dramatically that projected net income was severely affected. However, the city
productivity of local agri-products is better compared to last year. Figure 7 shows the
comparison of priority crop production in metric tons.
Figure 7. Comparison of Priority Crop Production: 2019 and 2020
A dry spell occurred during the year, specifically in February. Fortunately,
majority of the rice crop were in the dough stage and only those established in mid-January and later were affected.
Compared to the previous year (39,514 MT), there is a better production (though not good enough) in 2020 (49,766 MT). Crop harvested in the later part of the cropping season was found to be significantly reduced due to neck rot.
The City Agriculture Office prompted to distribute various types of corn seeds from Department of Agriculture Regional Field Office 8 (DA RFO8) under Yolanda Reconstruction Rehabilitation Program YRRP. These were: GMO hybrid yellow, hybrid white Filipina, and OPV white seeds. The corn seeds were distributed to 768 Ormoc City corn farmers cultivating 866 hectares in 76 barangays.
39,515
2,258.30
6,278.80
49,766
4,464.35 4,650.36
0
10,000
20,000
30,000
40,000
50,000
60,000
Rice Corn Vegetable
PRIORITY CROP PRODUCTION
2019 2020
ECOLOGICAL PROFILE 2020
City Planning and Development Office 60
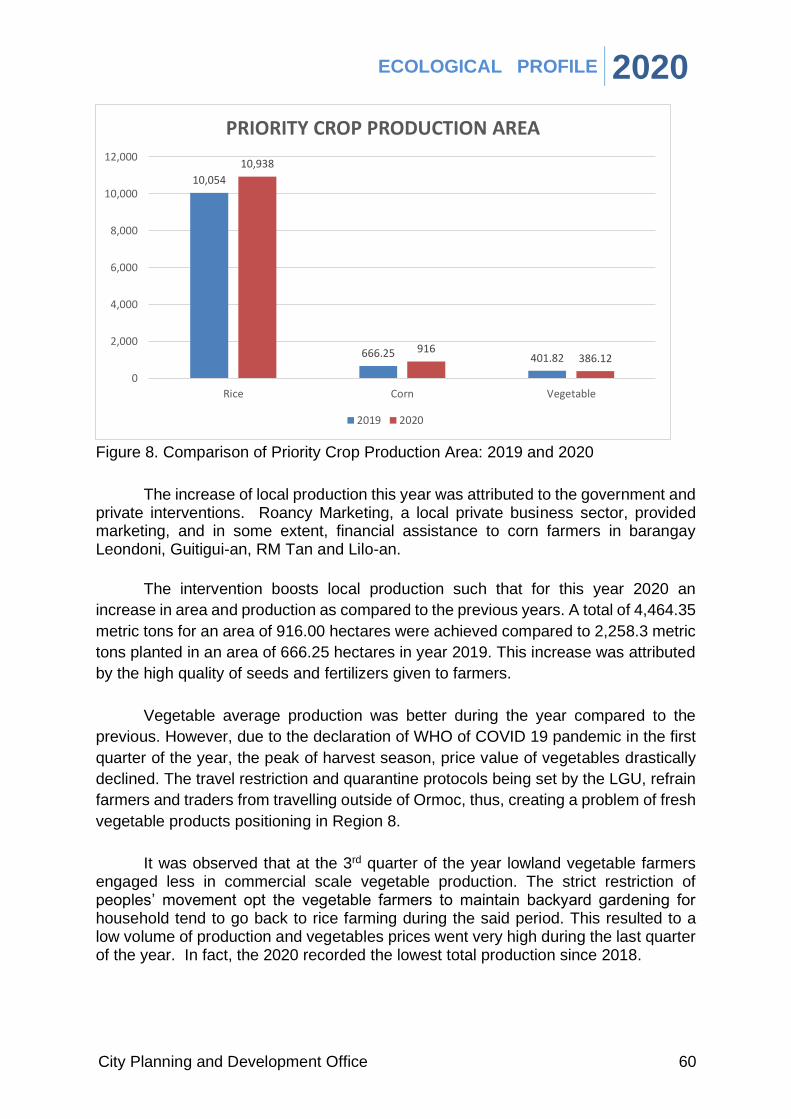
Figure 8. Comparison of Priority Crop Production Area: 2019 and 2020
The increase of local production this year was attributed to the government and private interventions. Roancy Marketing, a local private business sector, provided marketing, and in some extent, financial assistance to corn farmers in barangay Leondoni, Guitigui-an, RM Tan and Lilo-an.
The intervention boosts local production such that for this year 2020 an
increase in area and production as compared to the previous years. A total of 4,464.35
metric tons for an area of 916.00 hectares were achieved compared to 2,258.3 metric
tons planted in an area of 666.25 hectares in year 2019. This increase was attributed
by the high quality of seeds and fertilizers given to farmers.
Vegetable average production was better during the year compared to the
previous. However, due to the declaration of WHO of COVID 19 pandemic in the first
quarter of the year, the peak of harvest season, price value of vegetables drastically
declined. The travel restriction and quarantine protocols being set by the LGU, refrain
farmers and traders from travelling outside of Ormoc, thus, creating a problem of fresh
vegetable products positioning in Region 8.
It was observed that at the 3rd quarter of the year lowland vegetable farmers engaged less in commercial scale vegetable production. The strict restriction of peoples’ movement opt the vegetable farmers to maintain backyard gardening for household tend to go back to rice farming during the said period. This resulted to a low volume of production and vegetables prices went very high during the last quarter of the year. In fact, the 2020 recorded the lowest total production since 2018.
10,054
666.25 401.82
10,938
916386.12
0
2,000
4,000
6,000
8,000
10,000
12,000
Rice Corn Vegetable
PRIORITY CROP PRODUCTION AREA
2019 2020
ECOLOGICAL PROFILE 2020
City Planning and Development Office 61
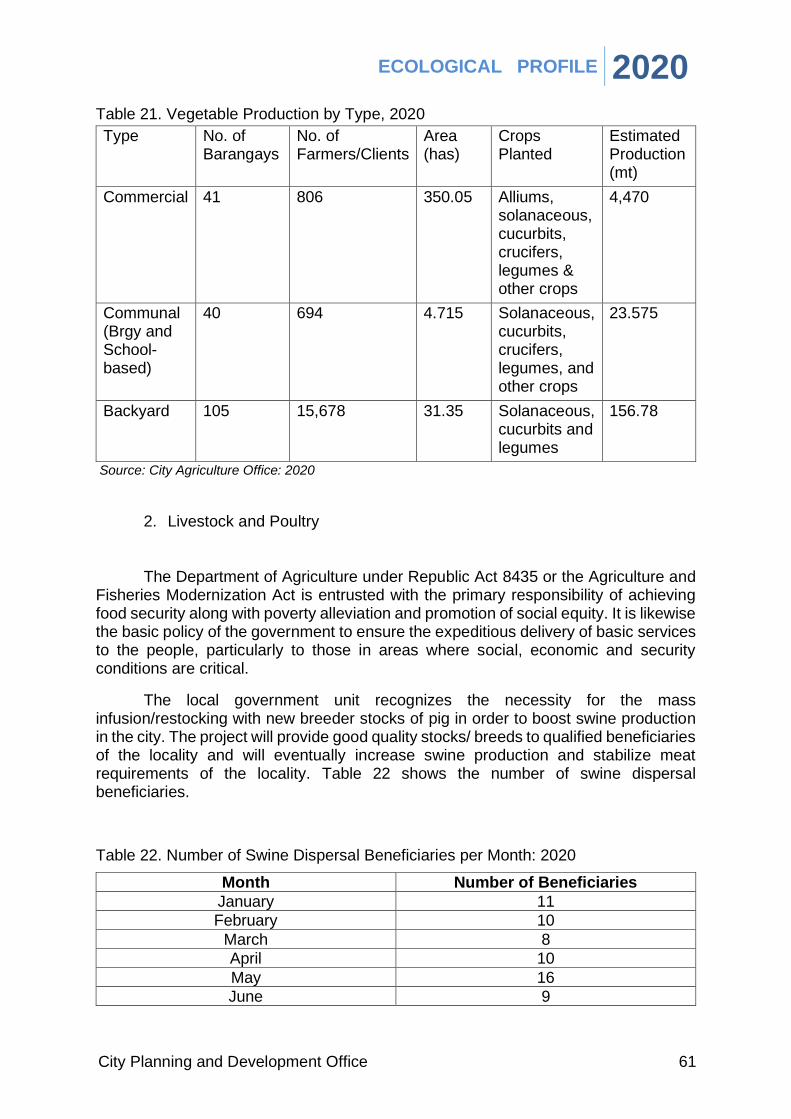
Table 21. Vegetable Production by Type, 2020
Type No. of Barangays
No. of Farmers/Clients
Area (has)
Crops Planted
Estimated Production (mt)
Commercial 41 806 350.05 Alliums, solanaceous, cucurbits, crucifers, legumes & other crops
4,470
Communal (Brgy and School-based)
40 694 4.715 Solanaceous, cucurbits, crucifers, legumes, and other crops
23.575
Backyard 105 15,678 31.35 Solanaceous, cucurbits and legumes
156.78
Source: City Agriculture Office: 2020
2. Livestock and Poultry
The Department of Agriculture under Republic Act 8435 or the Agriculture and Fisheries Modernization Act is entrusted with the primary responsibility of achieving food security along with poverty alleviation and promotion of social equity. It is likewise the basic policy of the government to ensure the expeditious delivery of basic services to the people, particularly to those in areas where social, economic and security conditions are critical.
The local government unit recognizes the necessity for the mass infusion/restocking with new breeder stocks of pig in order to boost swine production in the city. The project will provide good quality stocks/ breeds to qualified beneficiaries of the locality and will eventually increase swine production and stabilize meat requirements of the locality. Table 22 shows the number of swine dispersal beneficiaries.
Table 22. Number of Swine Dispersal Beneficiaries per Month: 2020
Month Number of Beneficiaries
January 11
February 10
March 8
April 10
May 16
June 9
ECOLOGICAL PROFILE 2020
City Planning and Development Office 62
July 22
August 12
September 11
October 7
November 3
December 11
Total 130 Source: City Veterinary Office: 2020
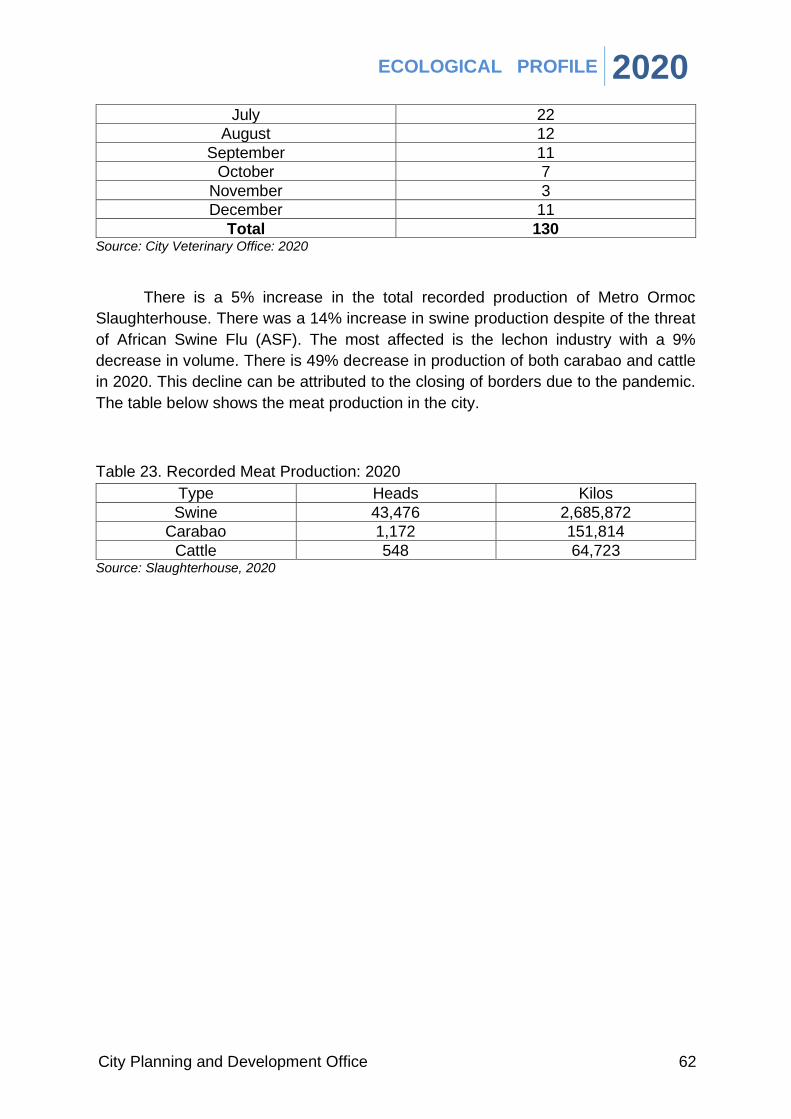
There is a 5% increase in the total recorded production of Metro Ormoc
Slaughterhouse. There was a 14% increase in swine production despite of the threat
of African Swine Flu (ASF). The most affected is the lechon industry with a 9%
decrease in volume. There is 49% decrease in production of both carabao and cattle
in 2020. This decline can be attributed to the closing of borders due to the pandemic.
The table below shows the meat production in the city.
Table 23. Recorded Meat Production: 2020
Type Heads Kilos
Swine 43,476 2,685,872
Carabao 1,172 151,814
Cattle 548 64,723 Source: Slaughterhouse, 2020