Ecological coherence of marine protected area networks: a spatial assessment using species...
9
Ecological coherence of marine protected area networks: a spatial assessment using species distribution models Go¨ran Sundblad 1,2 *, Ulf Bergstro¨ m 1 and Alfred Sandstro¨m 3 1 Swedish Board of Fisheries, Institute of Coastal Research, Skolgatan 6, SE-74242 O ¨ regrund, Sweden; 2 Department of Limnology, Evolutionary Biology Centre (EBC), Uppsala University, Norbyva ¨gen 18D, SE-75236 Uppsala, Sweden; and 3 Swedish Board of Fisheries, Institute of Freshwater Research, Sta ˚ ngholmsva ¨gen 2, SE-17893 Drottningholm, Sweden Summary 1. The juvenile stages of fish are often dependent on specific habitat types for their survival. Protect- ing these habitats may be crucial for maintaining strong adult stocks. The Natura 2000 network of the European Union offers protection of marine habitats that are essential for the recruitment of many fish species. By protecting these critical habitats the network may be important for maintain- ing the stocks of these fish species. 2. We present a spatially explicit, GIS-based, assessment of two important components of the eco- logical coherence of Marine Protected Area (MPA) networks: representativity and connectivity. Representativity can be measured as the proportion of each conservation feature that is protected, whereas connectivity assesses the spatial configuration of the network. We apply these analyses to study the ecological coherence of the Natura 2000 network in a 30 000-km 2 archipelago in the Baltic Sea, with respect to a coastal fish assemblage and associated habitats. The analyses are based on fish distribution maps that have been constructed by statistically relating life stage specific occurrence to environmental variables, and thereafter making spatial predictions based on maps of the environ- mental variables. 3. The map-based analyses show that both the representativity and the connectivity of the network are poor with respect to the studied fish species. In total, 3 5% (11 km 2 ) of the assemblage recruit- ment habitat was protected and 48% of the potentially connected habitats were included in the MPA network. 4. The assessment explicitly identified geographical areas, visually communicated using maps, where the network should be improved to ensure ecological coherence. 5. Synthesis and applications. Many MPA networks around the world, such as the Natura 2000 network in Europe, have recently come into effect. Establishment of the networks has often been governed by opportunity rather than by strict ecological analyses, primarily because distribution maps of species and habitats have been unavailable. Map-based assess- ments of the strengths and weaknesses of evolving MPA networks, such as the one presented here, are needed in adaptive management. They can provide an efficient tool for visualising and communicating the results to stakeholders and policy makers in the process of working towards ecological coherence. Key-words: Baltic Sea, connectivity, essential fish habitats, habitat modelling, habitats direc- tive, marine reserves, Natura 2000 Introduction The overexploitation of many fish species and their habitats is one of the key reasons for the increased world-wide interest in *Correspondence author. E-mail: goran.sundblad@fiskeriverket.se Journal of Applied Ecology 2011, 48, 112–120 doi: 10.1111/j.1365-2664.2010.01892.x Ó 2010 The Authors. Journal of Applied Ecology Ó 2010 British Ecological Society
-
Upload
independent -
Category
Documents
-
view
1 -
download
0
Transcript of Ecological coherence of marine protected area networks: a spatial assessment using species...
Ecological coherence of marine protected area
networks: a spatial assessment using species
distribution models
Goran Sundblad1,2*, Ulf Bergstrom1 and Alfred Sandstrom3
1Swedish Board of Fisheries, Institute of Coastal Research, Skolgatan 6, SE-74242 Oregrund, Sweden; 2Department
of Limnology, Evolutionary Biology Centre (EBC), Uppsala University, Norbyvagen 18D, SE-75236 Uppsala, Sweden;
and 3Swedish Board of Fisheries, Institute of Freshwater Research, Stangholmsvagen 2, SE-17893 Drottningholm,
Sweden
Summary
1. The juvenile stages of fish are often dependent on specific habitat types for their survival. Protect-
ing these habitats may be crucial for maintaining strong adult stocks. The Natura 2000 network of
the European Union offers protection of marine habitats that are essential for the recruitment of
many fish species. By protecting these critical habitats the network may be important for maintain-
ing the stocks of these fish species.
2. We present a spatially explicit, GIS-based, assessment of two important components of the eco-
logical coherence of Marine Protected Area (MPA) networks: representativity and connectivity.
Representativity can be measured as the proportion of each conservation feature that is protected,
whereas connectivity assesses the spatial configuration of the network. We apply these analyses to
study the ecological coherence of theNatura 2000 network in a 30 000-km2 archipelago in the Baltic
Sea, with respect to a coastal fish assemblage and associated habitats. The analyses are based on fish
distributionmaps that have been constructed by statistically relating life stage specific occurrence to
environmental variables, and thereafter making spatial predictions based on maps of the environ-
mental variables.
3. The map-based analyses show that both the representativity and the connectivity of the network
are poor with respect to the studied fish species. In total, 3Æ5% (11 km2) of the assemblage recruit-
ment habitat was protected and 48% of the potentially connected habitats were included in the
MPA network.
4. The assessment explicitly identified geographical areas, visually communicated using maps,
where the network should be improved to ensure ecological coherence.
5. Synthesis and applications. Many MPA networks around the world, such as the Natura
2000 network in Europe, have recently come into effect. Establishment of the networks has
often been governed by opportunity rather than by strict ecological analyses, primarily
because distribution maps of species and habitats have been unavailable. Map-based assess-
ments of the strengths and weaknesses of evolving MPA networks, such as the one presented
here, are needed in adaptive management. They can provide an efficient tool for visualising
and communicating the results to stakeholders and policy makers in the process of working
towards ecological coherence.
Key-words: Baltic Sea, connectivity, essential fish habitats, habitat modelling, habitats direc-
tive, marine reserves, Natura 2000
Introduction
The overexploitation of many fish species and their habitats is
one of the key reasons for the increased world-wide interest in*Correspondence author. E-mail: [email protected]
Journal of Applied Ecology 2011, 48, 112–120 doi: 10.1111/j.1365-2664.2010.01892.x
� 2010 The Authors. Journal of Applied Ecology � 2010 British Ecological Society
Marine Protected Areas (MPAs) as a management tool (Pauly
et al. 2002; Airoldi & Beck 2007). In many regions, fisheries
management and nature conservation have traditionally been
governed separately (Sissenwine & Symes 2007). However,
implementation of an ecosystem-based approach to manage-
ment means that conservation and fisheries issues need to be
integrated (e.g. Leathwick et al. 2008). Fish play a central role
in ecosystem functioning (Eriksson et al. 2009), and are impor-
tant in maintaining viable systems withinMPAs. As many fish
species depend on specific habitats to complete their life cycle
(Mumby et al. 2004), MPAs that protect habitats may also
benefit fish and fisheries (Roberts et al. 2001). The early larval
and juvenile life stages are often especially sensitive and even
small changes in the environment may result in large variation
in recruitment success (Juanes 2007). These recruitment habi-
tats are often situated in shallow, coastal areas (Karas 1996;
Snickars et al. 2009) under pressure from human activities
(Eriksson et al. 2004; Airoldi & Beck 2007). This suggests that
adequate protection is essential to manage important fish
stocks andmaintain ecosystem functioning.
In northern Europe, member states of the Helsinki and
Oslo-Paris commissions (HELCOMandOSPAR) have agreed
to establish a coherent network of MPAs by 2010 covering the
north-east Atlantic and the Baltic Sea (JMM 2003), based
upon areas within the Natura 2000 network. According to the
European Union Habitats Directive, favourable conservation
status of the selected habitat types and species should be main-
tained or restored within this network (92 ⁄43 ⁄EEC). However,
the Natura 2000 network in marine areas has been developed
with relatively scarce data and without explicit consideration
of the habitat needs of most fish species, although some rare
species are included in Annex 2 of the Habitats Directive.
Nevertheless, it may still serve to protect species indirectly as
many of the habitats listed inAnnex 1 of theHabitatsDirective
are important spawning and nursery areas for a variety of spe-
cies (Bergstrom et al. 2007; Pedersen et al. 2009). For example,
many coastal fish species in the Baltic Sea are dependent on
shallow vegetated areas for their recruitment (Sandstrom et al.
2005), i.e. habitats that are explicitly protected by the Direc-
tive. Thus, by including habitats important for fish spawning
and feeding, Natura 2000 sites may support the productivity of
not only the rare species included in the Directive, but also
many of the common species that are central to the ecological
functioning of the area (Eriksson et al. 2009).
An ecologically coherent network of MPAs should (i) inter-
act with and support the wider environment, (ii) maintain the
processes, functions and structures of the protected features
across their natural range, (iii) function synergistically as a
whole, such that individual sites benefit from the wider net-
work and (iv) be resilient to changing conditions (Ardron
2008a; Piekainen & Korpinen 2008). There are four major cri-
teria that can be quantified when assessing the ecological
coherence of a network, i.e. adequacy, representativity, replica-
tion and connectivity (Ardron 2008a). Ensuring adequacy
involves determining an appropriate size, shape and location
of the protected areas tomaintain ecosystem services and func-
tioning. The level of representativity can be determined by the
proportion of each conservation feature that is protected,
whereas replication is measured by the number of each conser-
vation feature protected. Finally, connectivity reflects the spa-
tial configuration of the network and the potential for
organisms to move between the individual MPAs. Connectiv-
ity can be measured at different levels, from genetic connectiv-
ity to species, assemblage and seascape habitat components.
Despite the existence of advanced tools for zoning and MPA
designation (e.g. Mumby 2006; Moilanen, Leathwick & Elith
2008; Watts et al. 2009) and the fact that ecological coherence
is stated as the main objective for the majority of MPA net-
works world-wide, there have been few attempts to assess the
level of network coherence (Ardron 2008b; Johnson et al.
2008; HELCOM 2009). This is probably due to the scarcity of
detailed and reliable maps of marine habitats and the lack of
suitable evaluationmethods.
Recent advances in marine habitat mapping techniques and
the rapid development of GIS-based tools for predicting habi-
tat and species distributions (Elith& Leathwick 2009) facilitate
more detailed and accurate assessment of the ecological coher-
ence of MPA networks (Ardron 2008b). We present two
straightforward GIS-based analyses that allow quantitative
assessments to be made. The basis for these analyses is spatial
predictive modelling to identify essential habitats for the
species ⁄assemblage under study. We constructed maps of
recruitment habitats for an assemblage of coastal fish species
in a 30 000-km2 archipelago in the northern Baltic Sea. An
assessment of the ecological coherence of the Natura 2000
network was conducted by combining the habitat maps with
knowledge of the migratory behaviour of the species in the
assemblage. We show how two major criteria of ecological
coherence, representativity and connectivity, can be evaluated
in a spatially explicit context. The resultingmaps of representa-
tivity and connectivity are used to identify weak spots in the
network of protected areas and target areas for future MPA
establishment.
Materials and methods
STUDY AREA AND SPECIES
The field study was conducted in the northern Baltic Sea, in the exten-
sive, topographically complex archipelago between Sweden and Fin-
land. The northern Baltic Sea is a non-tidal, brackish water basin
with a near shore salinity range of 3–7 ppt. The Swedish–Finnish
archipelago is rich in islands and small islets and is substantially influ-
enced by a land-uplift of 4–6 mm per year. The shallow coastal areas
are normally characterized by soft sediment bottoms with a macro-
phyte community mainly consisting of submerged species including
pondweedsPotamogeton spp., stonewortsChara spp., milfoilsMyrio-
phyllum spp. and reed Phragmites australis L., as well as bladder-
wrack Fucus vesiculosus L., on harder substrates (Appelgren &
Mattila 2005).
To map the distribution of recruitment habitats of an assemblage
of common fish species, we constructed spatial predictive models for
four species: Eurasian perch Perca fluviatilis L., northern pike Esox
lucius L., pikeperch Sander lucioperca L. and roach Rutilus rutilus L.
These are central species in the coastal system of the Baltic Sea and,
Assessing eco-coherence of MPA networks 113
� 2010 The Authors. Journal of Applied Ecology � 2010 British Ecological Society, Journal of Applied Ecology, 48, 112–120
all except roach, are also top predators and among the most impor-
tant fish species for both the commercial and recreational fishery.
Despite some dissimilarity in their life-history, all four species utilize
specific near-shore habitats during their early life stages (Karas
1996; Sandstrom et al. 2005; Snickars et al. 2009, 2010; Sundblad
et al. 2009). By predicting the distribution of early life stages of these
species, we also predict the distribution of a diverse set of other ani-
mals and plants associated with similar habitats (Snickars et al.
2009).
Perch spawn in shallow water where they normally attach their sin-
gle egg strand to structurally complex objects such as submerged veg-
etation. An area of 66 000 m2 was surveyed for perch egg strands
three times during a period from late April to mid June 2003, with
intervals of 14–20 days (see Snickars et al. 2010). Egg strands were
mapped by snorkelling along parallel transects (length 20–480 m, 4–8
lines per site) c. 50–100 m apart. All visible egg strands within 1 m on
both sides of the transect lines were registered.
Sampling of fish was conducted in August–early September 2005–
2006, a period when the majority of young-of-the-year (YOY) of
spring-spawning fish have undergone metamorphosis and aggregate
in shallow, vegetated and near-shore areas. The field sampling sites
were randomized in different wave exposure and depth strata, within
a depth range of 0–6 m. Sampling sites were dispersed over the
entire archipelago gradient and covered the full distribution range of
the studied species. All study sites were in areas with a limited degree
of anthropogenic disturbance. Fish were surveyed by point abun-
dance sampling with small underwater detonations (described by
Snickars et al. 2007), with the addition of 10 g Nobel Prime explo-
sives to increase sampling area. The underwater detonations stun
and kill small fish (14–150 mm) within an area of c. 80 m2 and
allows quantitative sampling of fish with swim bladders in all shal-
low habitats, including dense vegetation, without severely affecting
the habitat (Snickars et al. 2007 and references therein). All stunned
and killed individuals (floating and sinking) were collected via snor-
kelling for determination of species, abundances and individual
lengths.
PREDICTIVE SPECIES DISTRIBUTION MODELS
Three environmental variables were used as predictors in the models:
depth, wave exposure and water clarity (measured as Secchi depth;
Preisendorfer 1986). These variables have been shown to influence
juvenile fish and perch egg strand distribution and were available as
high resolution (25 m) continuous maps for the entire study area
(Sandstrom et al. 2005; Florin, Sundblad&Bergstrom 2009; Snickars
et al. 2009, 2010). Depth was sampled simultaneously in both the sur-
veys of juvenile fish and perch egg strands, and bathymetrymapswere
acquired from sea charts and limited tomaximum6 mdepth in accor-
dance with field sampling. Wave exposure estimates, log10-trans-
formed, were derived from the software WaveImpact (Isæus 2004),
which uses fetch and algorithms incorporating refraction and diffrac-
tion in a step-wise procedure. Wave exposure has previously been
used to model the distribution of both Natura 2000 habitats (Bekkby
& Isæus 2008), and larval and YOY fish habitat characteristics (Flo-
rin, Sundblad & Bergstrom 2009; Sundblad et al. 2009). In addition,
wave exposure can also have an indirect effect on YOY fish distribu-
tion via its relationships with water exchange, temperature and vege-
tation (Bekkby et al. 2008). A proxy variable for water clarity was
produced in a GIS using water distance from the baseline of the
territorial sea (connecting the outermost islands and thereby defining
the archipelago zone) and the wave exposure estimates using the
equation;
Proxy for Secchi depth ¼ log10ðwave exposureÞffiffiffiffiffiffiffiffiffiffiffiffiffiffiffiffiffiffiffiffiffiffiffiffiffiffiffiffiffiffilog10ðdistanceÞ
p:
eqn 1
High proxy values indicate clear water. Evaluation of the index
was made against 293 in situ measurements of Secchi depth (range
0Æ3–10 m), from different years but the same season, from both the
Swedish and Finnish parts of the study area. There was a significant
positive correlation between the index and field measurements of Sec-
chi depth (P = 0Æ54, P < 0Æ001). Although the level of unexplained
variation was high the precision was deemed adequate (root mean
square error 1Æ87), as the index acceptably described both the large
scale gradients in water clarity that are found from near to offshore
areas and the smaller scale gradients that are found from open bays
to small sheltered inlets, which are important for the distribution of
juvenile fish (e.g. Sandstrom&Karas 2002).
Separate models with presence ⁄ absence of YOY of northern pike,
pikeperch and roach, as well as spawning of perch as response
variables were fitted using generalized additive models and the three
predictor variables (above). Models and look-up tables, for produc-
ing the spatial predictions in a GIS, were based on the generalized
regression and spatial prediction work package (Lehmann, Overton
& Leathwick 2002) using S-PLUS version 6Æ0 [Insightful Corp., Seat-tle, WA, USA]. Binomial error distributions and smoother spline
functions with three degrees of freedomwere used to avoid overfitting
the models (Sandman et al. 2008). Model performance was evaluated
by the area under the curve values of receiver-operating-characteristic
(ROC) plots and five-fold cross-validated ROC (cvROC)-plots
(Fielding & Bell 1997). ROC gives an estimate of model fit and
cvROC is an indication of model stability in new situations (Maggini
et al. 2006; Sandman et al. 2008). The area under the curve value of
ROC-plots ranges between 0Æ5 and 1Æ0, and following the classifica-
tion of Maggini et al. (2006) values below 0Æ7 were regarded as poor,
0Æ7–0Æ9 as reasonable and above 0Æ9 as having a very good discrimina-
tory ability. The resulting maps, showing probability of presence,
were dichotomized into maps of suitable and unsuitable habitat for
each response variable using the true-skill statistic (Allouche, Tsoar &
Kadmon 2006), where the sum of specificity and sensitivity, i.e.
correctly predicted absences and presences, is maximized (Fielding &
Bell 1997). In addition, the predicted distribution of suitable habitats
was externally validated using independent data sets of juvenile fish
distribution collected between 2001 and 2003 that covered the entire
western (Swedish) part of the study area (these data are reported in
Sandstrom et al. 2005).
SPATIAL ANALYSES
The coherence analyses weremade using aGIS [ArcGIS 9Æ1; Environ-mental Systems Research Institute, Redlands, CA, USA]. To assess
representativity and connectivity, a habitat map for the species assem-
blage was produced by combining the habitat maps of each species
and classifying areas where the habitat of at least three species
occurred as an assemblage habitat. Representativity was measured
on two local scales, i.e. within 10 · 10 and 20 · 20 km squares, and
calculated as the amount of the predicted assemblage habitat that was
protected by the Natura 2000 network in each square. Square size
should be ecologically relevant, yet can be considered a trade-off
between level of detail and interpretability and should also be chosen
to aid communication. Alternative grid sizes, which are easily pro-
duced in a GIS, could therefore be appropriate depending on the pur-
pose of the analysis. The 20 km scale represented the longest typical
migration distance of the studied assemblage (see below), while the
114 G. Sundblad, U. Bergstr€om & A. Sandstr€om
� 2010 The Authors. Journal of Applied Ecology � 2010 British Ecological Society, Journal of Applied Ecology, 48, 112–120
10 km scale provided amore detailed picture of local representativity,
at the same time providing a measure of sensitivity to grid resolution.
In an attempt to meet the adequacy criterion, only predicted assem-
blage habitat patches larger than 1 ha were included in the analyses.
This threshold was applied to ensure that only patches with a signifi-
cant production of juveniles were included. Determining an appropri-
ate level of connectivity is dependent on the aim of the network of
protected areas, as well as the target organisms within it. Fish are
mobile organisms with large differences in dispersal capability. The
species in this study are relatively sedentary also as larvae (Swedish
Board of Fisheries, unpublished data) and the assessment of connec-
tivity was based on the longest typical migration distance of the most
mobile of them, i.e. pikeperch. Marking studies from the region have
shown a 75% recapture rate of pikeperch within 16 km of the tagging
location (reviewed in Saulamo &Neuman 2002) so the migration dis-
tance was set to 20 km to allow for a more conservative estimate of
connectivity between the reserves. The connectivity assessment was
made in two steps. First, to assess the level of connectivity between all
habitat patches, regardless of the level of protection, the water dis-
tance between separate patches in the assemblage habitat map was
calculated using the cost distance procedure in the GIS software, thus
simulating fish movement by moving around islands. Secondly, to
assess the level of connectivity between protected habitats, we calcu-
lated the water distance between habitat patches currently within Na-
tura 2000 areas. Both distance data sets were cut at 20 km, thus
assessing potential connectivity within the set migration distance. To
evaluate connectivity between currently protected habitats, the sec-
ond distance data set was cut also at 10 km. Thus, when two 10 km
zones meet, the protected habitats are directly connected by fish
migrating 20 km. For all analyses only Natura 2000 areas as defined
by the EU Habitats Directive, i.e. Special Areas of Conservation
(SAC), were included in the analyses, whereas Special Protection
Areas (EU Birds Directive 79 ⁄ 409 ⁄EEC) that aim to support wild
birds and their habitats, were excluded.
Results
PREDICTIVE SPECIES DISTRIBUTION MODELS
The performance of the distribution models was highest for
the pikeperch model, intermediate for the roach and perch
spawning models and lowest for the pike model. The ROC-
values were relatively high, indicating reasonable to very good
model fit for all models. The cross-validated ROC-values were
in the same range as the ROC-values and indicated reasonable
model stability, except for pike (Table 1). An external vali-
dation of the predicted distribution of pike was therefore
performed, using an independent data set from previous
studies (data reported in Sandstrom et al. 2005). As a smaller
sampling unit size had been used when collecting the indepen-
dent data set, the degree of uncertainty in observed absences
was inflated and specificity (correct classification of absences)
could not be calculated (Lobo 2008). However, the external
validation of model sensitivity resulted in 88% correct classifi-
cation of predicted presences (n = 91), which can be consi-
dered high since the predicted suitable area for pike only
covered 593 km2 (of the total predicted area 0–6 m deep,
3042 km2). Based on the external validation, the pike model
was judged to be useful for the coherence analyses.
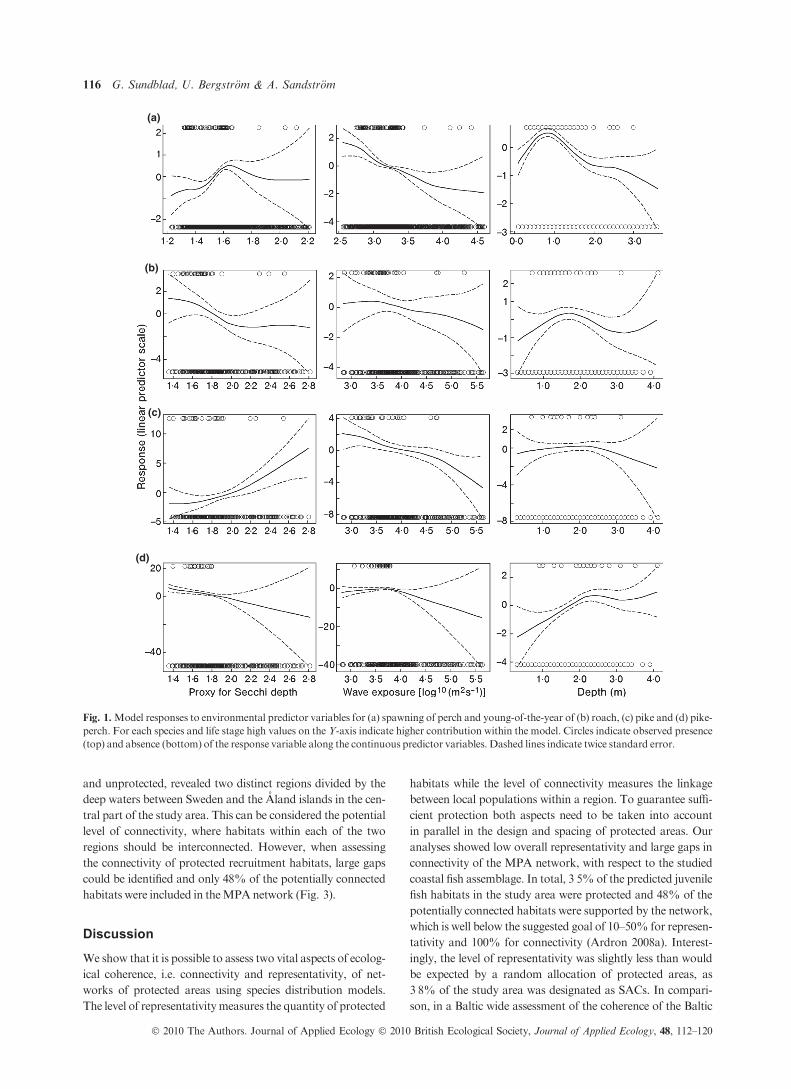
The partial response curves for the generalized additive
models illustrate how each explanatory variable affects the dis-
tributions of the species and life stages modelled (Fig. 1). In
general there was a negative effect of high wave exposure for
all species and life stages, while the responses to depth and
water visibility were species-specific, reflecting differences in
life-history characteristics (e.g. Lehtonen, Hansson &Winkler
1996; Sandstrom & Karas 2002; Snickars et al. 2009, 2010).
The predicted recruitment areas of the separate species consti-
tuted only a small proportion of the total water area (Table 1).
Therewas a strong overlap between the recruitment areas, con-
firming earlier results (Snickars et al. 2009) showing that these
species to a large extent utilize a common nursery habitat
(Table 1).
COHERENCE ANALYSES
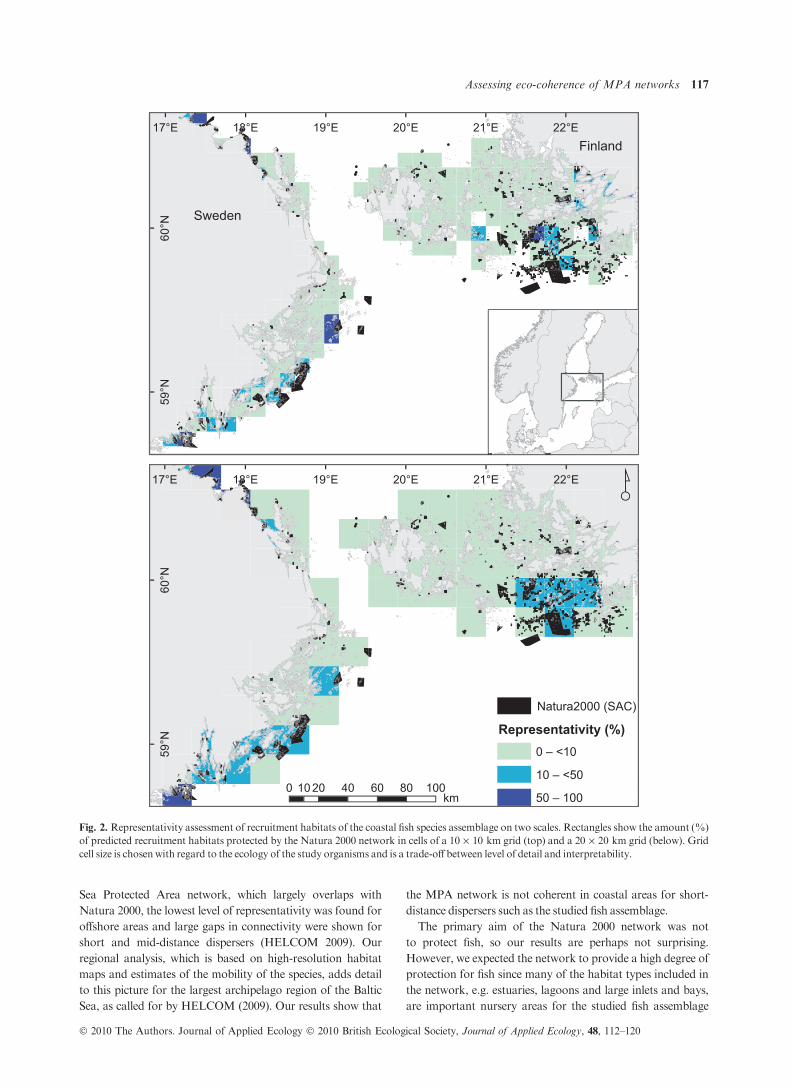
The coherence of the network was assessed with respect to rep-
resentativity and connectivity using predicted assemblage habi-
tats of adequate size. The representativity analysis illustrated
the level of protection of predicted recruitment habitats for
the studied fish assemblage at local scales (10 · 10 and
20 · 20 km squares). Both analyses identified similar areas
with a representativity of over 10%. The main difference
between the two scales was in the level of detail for specific
areas, see for example the inner part of the Finnish archipelago
(Fig. 2). In total, only 3Æ5% (11 km2) of the assemblage
recruitment habitat was protected by the Natura 2000 net-
work.
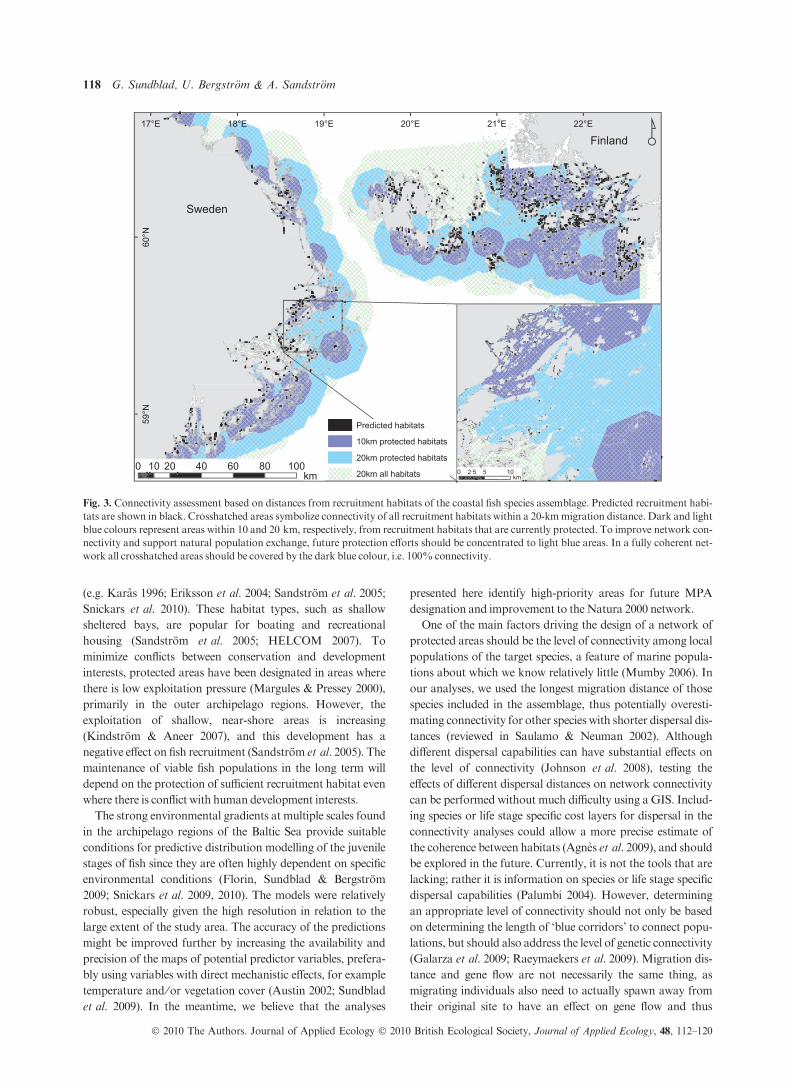
Connectivity between protected habitats should support
natural dispersal and ensure a network resilient to changes.
The connectivity between all predicted habitats, both protected
Table 1. Sample size (N), prevalence, model performance (ROC and cvROC) for the species distribution models, area coverage of the predicted
distribution and proportion of predicted distribution in the assemblage recruitment habitat. The total area of the assemblage recruitment habitat
was 322 km2 and the total water area was 28 761 km2
Species ⁄ statistic N
Prevalence
(% occurrence) ROC cvROC
Predicted distribution
area (km2)
Proportion in
assemblage habitat (%)
Perch spawning 3242 8 0Æ78 0Æ77 126 93
Pike YOY 296 8 0Æ77 0Æ66 593 52
Pikeperch YOY 296 9 0Æ91 0Æ87 628 41
Roach YOY 296 13 0Æ80 0Æ71 782 41
ROC, receiver-operating-characteristic; cvROC, cross-validated ROC; YOY, young-of-the-year.
Assessing eco-coherence of MPA networks 115
� 2010 The Authors. Journal of Applied Ecology � 2010 British Ecological Society, Journal of Applied Ecology, 48, 112–120
and unprotected, revealed two distinct regions divided by the
deep waters between Sweden and the Aland islands in the cen-
tral part of the study area. This can be considered the potential
level of connectivity, where habitats within each of the two
regions should be interconnected. However, when assessing
the connectivity of protected recruitment habitats, large gaps
could be identified and only 48% of the potentially connected
habitats were included in theMPAnetwork (Fig. 3).
Discussion
We show that it is possible to assess two vital aspects of ecolog-
ical coherence, i.e. connectivity and representativity, of net-
works of protected areas using species distribution models.
The level of representativitymeasures the quantity of protected
habitats while the level of connectivity measures the linkage
between local populations within a region. To guarantee suffi-
cient protection both aspects need to be taken into account
in parallel in the design and spacing of protected areas. Our
analyses showed low overall representativity and large gaps in
connectivity of the MPA network, with respect to the studied
coastal fish assemblage. In total, 3Æ5% of the predicted juvenile
fish habitats in the study area were protected and 48% of the
potentially connected habitats were supported by the network,
which is well below the suggested goal of 10–50% for represen-
tativity and 100% for connectivity (Ardron 2008a). Interest-
ingly, the level of representativity was slightly less than would
be expected by a random allocation of protected areas, as
3Æ8% of the study area was designated as SACs. In compari-
son, in a Baltic wide assessment of the coherence of the Baltic
(a)
(b)
(c)
(d)
Fig. 1.Model responses to environmental predictor variables for (a) spawning of perch and young-of-the-year of (b) roach, (c) pike and (d) pike-
perch. For each species and life stage high values on the Y-axis indicate higher contribution within the model. Circles indicate observed presence
(top) and absence (bottom) of the response variable along the continuous predictor variables. Dashed lines indicate twice standard error.
116 G. Sundblad, U. Bergstr€om & A. Sandstr€om
� 2010 The Authors. Journal of Applied Ecology � 2010 British Ecological Society, Journal of Applied Ecology, 48, 112–120
Sea Protected Area network, which largely overlaps with
Natura 2000, the lowest level of representativity was found for
offshore areas and large gaps in connectivity were shown for
short and mid-distance dispersers (HELCOM 2009). Our
regional analysis, which is based on high-resolution habitat
maps and estimates of the mobility of the species, adds detail
to this picture for the largest archipelago region of the Baltic
Sea, as called for by HELCOM (2009). Our results show that
the MPA network is not coherent in coastal areas for short-
distance dispersers such as the studied fish assemblage.
The primary aim of the Natura 2000 network was not
to protect fish, so our results are perhaps not surprising.
However, we expected the network to provide a high degree of
protection for fish since many of the habitat types included in
the network, e.g. estuaries, lagoons and large inlets and bays,
are important nursery areas for the studied fish assemblage
22°E21°E20°E19°E18°E17°E
60°N
59°N
22°E21°E20°E19°E18°E17°E
60°N
59°N
Sweden
Finland
0 20 40 60 80 10010km
Natura2000 (SAC)
Representativity (%)0 – <10
10 – <50
50 – 100
Fig. 2. Representativity assessment of recruitment habitats of the coastal fish species assemblage on two scales. Rectangles show the amount (%)
of predicted recruitment habitats protected by the Natura 2000 network in cells of a 10 · 10 km grid (top) and a 20 · 20 km grid (below). Grid
cell size is chosenwith regard to the ecology of the study organisms and is a trade-off between level of detail and interpretability.
Assessing eco-coherence of MPA networks 117
� 2010 The Authors. Journal of Applied Ecology � 2010 British Ecological Society, Journal of Applied Ecology, 48, 112–120
(e.g. Karas 1996; Eriksson et al. 2004; Sandstrom et al. 2005;
Snickars et al. 2010). These habitat types, such as shallow
sheltered bays, are popular for boating and recreational
housing (Sandstrom et al. 2005; HELCOM 2007). To
minimize conflicts between conservation and development
interests, protected areas have been designated in areas where
there is low exploitation pressure (Margules & Pressey 2000),
primarily in the outer archipelago regions. However, the
exploitation of shallow, near-shore areas is increasing
(Kindstrom & Aneer 2007), and this development has a
negative effect on fish recruitment (Sandstrom et al. 2005). The
maintenance of viable fish populations in the long term will
depend on the protection of sufficient recruitment habitat even
where there is conflict with human development interests.
The strong environmental gradients at multiple scales found
in the archipelago regions of the Baltic Sea provide suitable
conditions for predictive distribution modelling of the juvenile
stages of fish since they are often highly dependent on specific
environmental conditions (Florin, Sundblad & Bergstrom
2009; Snickars et al. 2009, 2010). The models were relatively
robust, especially given the high resolution in relation to the
large extent of the study area. The accuracy of the predictions
might be improved further by increasing the availability and
precision of the maps of potential predictor variables, prefera-
bly using variables with direct mechanistic effects, for example
temperature and ⁄or vegetation cover (Austin 2002; Sundblad
et al. 2009). In the meantime, we believe that the analyses
presented here identify high-priority areas for future MPA
designation and improvement to theNatura 2000 network.
One of the main factors driving the design of a network of
protected areas should be the level of connectivity among local
populations of the target species, a feature of marine popula-
tions about which we know relatively little (Mumby 2006). In
our analyses, we used the longest migration distance of those
species included in the assemblage, thus potentially overesti-
mating connectivity for other species with shorter dispersal dis-
tances (reviewed in Saulamo & Neuman 2002). Although
different dispersal capabilities can have substantial effects on
the level of connectivity (Johnson et al. 2008), testing the
effects of different dispersal distances on network connectivity
can be performed without much difficulty using a GIS. Includ-
ing species or life stage specific cost layers for dispersal in the
connectivity analyses could allow a more precise estimate of
the coherence between habitats (Agnes et al. 2009), and should
be explored in the future. Currently, it is not the tools that are
lacking; rather it is information on species or life stage specific
dispersal capabilities (Palumbi 2004). However, determining
an appropriate level of connectivity should not only be based
on determining the length of ‘blue corridors’ to connect popu-
lations, but should also address the level of genetic connectivity
(Galarza et al. 2009; Raeymaekers et al. 2009). Migration dis-
tance and gene flow are not necessarily the same thing, as
migrating individuals also need to actually spawn away from
their original site to have an effect on gene flow and thus
22°E21°E20°E19°E18°E17°E
60°N
59°N
Sweden
Finland
0 20 40 60 80 10010km
Predicted habitats
10km protected habitats
20km protected habitats
20km all habitats 0 5 102·5km
Fig. 3. Connectivity assessment based on distances from recruitment habitats of the coastal fish species assemblage. Predicted recruitment habi-
tats are shown in black. Crosshatched areas symbolize connectivity of all recruitment habitats within a 20-kmmigration distance. Dark and light
blue colours represent areas within 10 and 20 km, respectively, from recruitment habitats that are currently protected. To improve network con-
nectivity and support natural population exchange, future protection efforts should be concentrated to light blue areas. In a fully coherent net-
work all crosshatched areas should be covered by the dark blue colour, i.e. 100% connectivity.
118 G. Sundblad, U. Bergstr€om & A. Sandstr€om
� 2010 The Authors. Journal of Applied Ecology � 2010 British Ecological Society, Journal of Applied Ecology, 48, 112–120
genetic connectivity (Laikre, Palm & Ryman 2005). Studies
of the genetic structure of our target species show that genetic
differentiation exists over relatively small spatial scales
(1–100 km), even in environments without apparent migration
barriers that may limit the exchange between populations
(Laikre et al. 2005; Bergek, Sundblad & Bjorklund 2010). If
connectivity is to be maintained within a network, it follows
that species with local populations or short dispersal distances
will require more closely spaced protected areas than more
migratory species (Johnson et al. 2008). Yet, determining
dispersal distances is not an easy task. However, as new
information on genetic structure and dispersal capabilities of
organisms with different life histories becomes available,
re-assessment of the ecological coherence of the network can
be carried out using the approach presented in this study.
We believe that a better knowledge of the distribution of
essential habitats of ecologically important species is crucial
to the effectiveness of MPA networks, and that a key tool for
efficient mapping of conservation values is predictive species
distribution modelling. As shown in this study, species distri-
bution maps based on modelling may also serve as the basis
for spatially explicit assessments of ecological coherence of
MPA networks, aiding the identification of areas in need of
further protection.
Conclusions
There is a strong political will in Europe to preserve and restore
the structure and functioning of the marine environment by
establishing protected areas in ecologically coherent networks
(e.g. HELCOM, OSPAR conventions). A crucial step for the
long term success of these networks is the mapping of key fea-
tures, such as habitat types required by ecologically important
species. Detailed maps of habitat distribution are central to
marine spatial planning, e.g. to minimize disturbance of sensi-
tive marine habitats. In this study, we have shown that only
small amounts (3Æ5%) of important juvenile fish habitat are
protected by the current designations and that about half of
the potentially connected habitats were included in the MPA
network. The spatially explicit analyses identified geographical
areas where the network needs to be expanded to improve its
ecological coherence. The low level of existing protection indi-
cates that the traditional way of managing fish and fisheries
separately from nature conservation has not been successful
and calls for an integrated approach in the future development
of the Natura 2000 network. We advocate this kind of map-
based analysis of ecological coherence as an efficient tool in
adaptive management, both for assessing the relative strengths
and weaknesses of evolving MPA networks, and for visualiz-
ing and communicating the results to stakeholders and policy
makers.
Acknowledgements
This study was in part funded by BSR INTERREG IIIB Neighbourhood
Programme project BALANCE and by the PREHAB project funded under
BONUS+ call. We are grateful to the BALANCE partners for stimulating
discussions on this work, all the people involved in collecting data from the field
and to Dr Stefan Palm, five anonymous referees and the Editor for valuable
comments on themanuscript.
References
Agnes, J., Jean-Paul, L., Nicolas, R., Christophe, D., Pascal, A. & Pierre, J.
(2009) Assessing landscape connectivity with calibrated cost-distance model-
ling: predicting toad distribution in a context of spreading agriculture. Jour-
nal of Applied Ecology, 46, 833–841.
Airoldi, L. &Beck,M.W. (2007) Loss, status and trends for coastalmarine hab-
itats of Europe. Oceanography and Marine Biology: An Annual Review, 45,
345–405.
Allouche, O., Tsoar, A. &Kadmon, R. (2006) Assessing the accuracy of species
distribution models: prevalence, kappa and the true skill statistic (TSS).
Journal of Applied Ecology, 43, 1223–1232.
Appelgren, K. &Mattila, J. (2005) Variation in vegetation communities in shal-
low bays of the northern Baltic Sea.Aquatic Botany, 83, 1–13.
Ardron, J.A. (2008a) Three initial OSPAR tests of ecological coherence: heuris-
tics in a data-limited situation. ICES Journal of Marine Science, 65, 1527–
1533.
Ardron, J.A. (2008b) The challenge of assessing whether the OSPAR network
ofmarine protected areas is ecologically coherent.Hydrobiologia, 606, 45–53.
Austin, M.P. (2002) Spatial prediction of species distribution: an interface
between ecological theory and statistical modelling. Ecological Modelling,
157, 101–118.
Bekkby, T. & Isæus, M. (2008) Mapping large, shallow inlets and bays: model-
ling a Natura 2000 habitat with digital terrain and wave-exposure models.
ICES Journal ofMarine Science, 65, 238–241.
Bekkby, T., Rinde, E., Erikstad, L., Bakkestuen, V., Longva, O., Christensen,
O., Isæus, M. & Isachsen, P.E. (2008) Spatial probability modelling of
eelgrass (Zostera marina) distribution on the west coast of Norway. ICES
Journal ofMarine Science, 65, 1093–1101.
Bergek, S., Sundblad, G. & Bjorklund, M. (2010) Population differentiation in
Eurasian perch: environmental effects on gene flow? Journal of Fish Biology,
76, 1159–1172.
Bergstrom, L., Korpinen, S., Bergstrom, U. & Andersson, A. (2007) Essential
Fish Habitats and Fish Migration Patterns in the Northern Baltic Sea. BAL-
ANCE Interim Report No. 29, pp. 1–33. Balance, Copenhagen, Denmark.
Available at: http://balance-eu.org/publications/index.html, accessed 28
June 2010.
Elith, J. & Leathwick, J.R. (2009) Species distribution models: ecological
explanation and prediction across space and time.Annual Review of Ecology,
Evolution, and Systematics, 40, 677–697.
Eriksson, B.K., Sandstrom, A., Isæus, M., Schreiber, H. & Karas, P. (2004)
Effects of boating activities on aquatic vegetation in the Stockholm archipel-
ago, Baltic Sea.Estuarine, Coastal and Shelf Science, 61, 339–349.
Eriksson, B.K., Ljunggren, L., Sandstrom, A., Johansson, G., Mattila, J.,
Rubach, A., Raberg, S. & Snickars,M. (2009)Declines in predatory fish pro-
mote bloom-formingmacroalgae.Ecological Applications, 19, 1975–1988.
Fielding, A.H. & Bell, J.F. (1997) A review of methods for the assessment of
prediction errors in conservation presence ⁄ absence models. Environmental
Conservation, 24, 38–49.
Florin, A.-B., Sundblad, G. & Bergstrom, U. (2009) Characterisation of juve-
nile flatfish habitats in the Baltic Sea. Estuarine, Coastal and Shelf Science,
82, 294–300.
Galarza, J.A., Carreras-Carbonell, J., Macpherson, E., Pascual, M., Roques,
S., Turner, G.F. & Rico, C. (2009) The influence of oceanographic fronts
and early-life-history traits on connectivity among littoral fish species. Pro-
ceedings of the National Academy of Sciences of the United States of America,
106, 1473–1478.
HELCOM (2007) HELCOM lists of threatened and ⁄ or declining species and
biotopes ⁄ habitats in the Baltic Sea area. Baltic Sea Environmental Proceed-
ings, No 113 (edsD. Boedeker&H. vonNordheim), pp. 1–18.Helsinki Com-
mission,Helsinki, Finland.
HELCOM (2009) Biodiversity in the Baltic Sea – an integrated thematic assess-
ment on biodiversity and nature conservation in the Baltic Sea. Baltic Sea
Environmental Proceedings, No 116B, pp. 1–188. Helsinki Commission,
Helsinki, Finland.
Isæus, M. (2004) Factors Structuring Fucus Communities at Open and Complex
Coastlines in the Baltic Sea. PhD thesis, Stockholm University, Stockholm,
Sweden.
JMM (2003) Declaration of Joint Ministerial Meeting of the Helsinki and
OSPAR Commissions. Convention of the Protection of the Marine Environ-
Assessing eco-coherence of MPA networks 119
� 2010 The Authors. Journal of Applied Ecology � 2010 British Ecological Society, Journal of Applied Ecology, 48, 112–120
ment of the Baltic Sea Area (Helsinki Convention) and OSPAR Convention
for the Protection of the Marine Environment of the North-East Atlantic,
25–26 June 2003, Bremen. JMM2003 ⁄ 3.Available at: http://www.ospar.org,
accessed 25 June 2009.
Johnson, M.P., Crowe, T.P., McAllen, R. & Allcock, A.L. (2008) Characteriz-
ing themarine Natura 2000 network for theAtlantic region.Aquatic Conser-
vation:Marine and Freshwater Ecosystems, 18, 86–97.
Juanes, F. (2007) Role of habitat in mediating mortality during the post-settle-
ment transition phase of temperate marine fishes. Journal of Fish Biology, 70,
661–677.
Karas, P. (1996) Basic abiotic conditions for production of perch (Perca fluvia-
tilis L.) young-of-the-year in the Gulf of Bothnia. Annales Zoologici Fennici,
33, 371–381.
Kindstrom, M. & Aneer, G. (2007)What is Happening to Our Shores? Balance
InterimReport, No. 26, pp. 1–28. Balance, Copenhagen,Denmark. Available
at: http://balance-eu.org/publications/index.html, accessed 28 June 2010.
Laikre, L., Palm, S. &Ryman, N. (2005) Genetic population structure of fishes:
implications for coastal zonemanagement.Ambio, 34, 111–119.
Laikre, L., Miller, L.M., Palme, A., Palm, S., Kapuscinski, A.R., Thoresson,
G. & Ryman, N. (2005) Spatial genetic structure of northern pike (Esox
lucius) in the Baltic Sea.Molecular Ecology, 14, 1955–1964.
Leathwick, J., Moilanen, A., Francis, M., Elith, J., Taylor, P., Julian, K.,
Hastie, T. &Duffy, C. (2008)Novelmethods for the design and evaluation of
marine protected areas in offshorewaters.ConservationLetters, 1, 91–102.
Lehmann, A., Overton, M.J. & Leathwick, J. (2002) GRASP: generalized
regression analysis and spatial prediction. Ecological Modelling, 157, 189–
207.
Lehtonen, H., Hansson, S. & Winkler, H. (1996) Biology and exploitation of
pikeperch, Stizostedion lucioperca (L.), in the Baltic Sea area.Annales Zolog-
ici Fennici, 33, 525–535.
Lobo, J.M. (2008) More complex distribution models or more representative
data?Biodiversity Informatics, 5, 14–19.
Maggini, R., Lehmann, A., Zimmerman, N.E. & Guisan, A. (2006) Improving
generalized regression analysis for the spatial prediction of forest communi-
ties. Journal of Biogeography, 33, 1729–1749.
Margules, C.R. & Pressey, R.L. (2000) Systematic conservation planning.Nat-
ure, 405, 243–253.
Moilanen, A., Leathwick, J. & Elith, J. (2008) A method for spatial freshwater
conservation prioritization. Freshwater Biology, 53, 577–592.
Mumby, P.J. (2006) Connectivity of reef fish between mangroves and coral
reefs: algorithms for the design of marine reserves at seascape scales.Biologi-
cal Conservation, 128, 215–222.
Mumby, P.J., Edwards, A.J., Arias-Gonzalez, J.E., Lindeman, K.C., Black-
well, P.G., Gall, A., Gorczynska, M.I., Harborne, A.R., Pescod, C.L., Ren-
ken, H., Wabnitz, C.C.C. & Llewellyn, G. (2004) Mangroves enhance the
biomass of coral reef fish communities in the Carribean. Nature, 427, 533–
536.
Palumbi, S.R. (2004) Marine reserves and ocean neighbourhoods: the spatial
scale of marine populations and their management. Annual Review of Envi-
ronment and Resources, 29, 31–68.
Pauly, D., Christensen, V., Guenette, S., Pitcher, T.J., Sumaila, U.R., Walters,
C.J., Watson, R. & Zeller, D. (2002) Towards sustainability in world fisher-
ies.Nature, 418, 689–695.
Pedersen, S.A., Fock, H., Krause, J., Pusch, C., Sell, A.L., Bottcher, U., Rog-
ers, S.I., Skold, M., Skov, H., Podolska, M., Piet, G.J. & Rice, J.C. (2009)
Natura 2000 sites and fisheries in German offshore waters. ICES Journal of
Marine Science, 66, 155–169.
Piekainen, H. & Korpinen, S. (eds) (2008) Towards an Assessment on Ecologi-
cal Coherence of the Marine Protected Areas Network in the Baltic Sea
Region. BALANCE Interim Report No. 25, pp. 1–140. Balance, Copen-
hagen, Denmark. Available at: http://balance-eu.org/publications/index.
html, accessed 15 September 2009.
Preisendorfer, R.W. (1986) Secchi disk science: visual optics of natural waters.
Limnology and Oceanography, 31, 909–926.
Raeymaekers, J.A.M., Raeymaekers, D., Koizumi, I., Geldof, S. & Volckaert,
F.A.M. (2009) Guidelines for restoring connectivity around water mills: a
population genetic approach to the management of riverine fish. Journal of
Applied Ecology, 46, 562–571.
Roberts, C.M., Bohnsack, J.A., Gell, F., Hawkins, J.P. & Goodridge, R.
(2001) Effects of marine reserves on adjacent fisheries. Science, 294,
1920–1923.
Sandman, A., Isæus, M., Bergstrom, U. & Kautsky, H. (2008) Spatial predic-
tions of Baltic phytobenthic communities: measuring robustness of general-
ized additive models based on transect data. Journal of Marine Systems, 74
(Suppl. 1), S86–S96.
Sandstrom, A. & Karas, P. (2002) Effects of eutrophication on young-of-the-
year freshwater fish communities in coastal areas of the Baltic.Environmental
Biology of Fishes, 63, 89–101.
Sandstrom, A., Eriksson, B.K., Karas, P., Isæus, M. & Schreiber, H. (2005)
Boating and navigation activities influence the recruitment of fish in a Baltic
Sea archipelago area.Ambio, 34, 125–130.
Saulamo, K. & Neuman, E. (2002) Local management of Baltic fish stocks –
significance ofmigrationsReport from the Swedish Board of Fisheries, ISSN
1404-8590. Finfo, 9, 1–19.
Sissenwine, M. & Symes, D. (2007)Reflections on the Common Fisheries Policy.
Report to the general directorate for fisheries and maritime affairs of the
European commission, pp. 1–75.
Snickars, M., Sandstrom, A., Lappalainen, A. & Mattila, J. (2007) Evaluation
of low impact pressure waves as a quantitative sampling method for small
fish in shallow water. Journal of Experimental Marine Biology and Ecology,
343, 138–147.
Snickars, M., Sandstrom, A., Lappalainen, A., Mattila, J., Rosqvist, K. &
Urho, L. (2009) Fish assemblages in coastal lagoons in land-uplift succes-
sion: the relative importance of local and regional environmental gradients.
Estuarine, Coastal and Shelf Science, 81, 247–256.
Snickars, M., Sundblad, G., Sandstrom, A., Ljunggren, L., Bergstrom, U., Jo-
hansson, G. & Mattila, J. (2010) Habitat selectivity of substrate spawning
fish: modelling requirements of the Eurasian perch, Perca fluviatilis. Marine
Ecology Progress Series, 398, 235–243.
Sundblad, G., Harma, M., Lappalainen, A., Urho, L. & Bergstrom, U. (2009)
Transferability of predictive fish distribution models in two coastal systems.
Estuarine, Coastal and Shelf Science, 83, 90–96.
Watts, M.E., Ball, I.R., Stewart, R.S., Klein, C.J., Wilson, K., Steinback, C.,
Lourival, R., Kircher, K. & Possingham, H.P. (2009) Marxan with Zones:
software for optimal conservation based land- and sea-use zoning. Environ-
mentalModelling & Software, 24, 1513–1521.
Received 25March 2010; accepted 4 October 2010
Handling Editor: Chris Frid
120 G. Sundblad, U. Bergstr€om & A. Sandstr€om
� 2010 The Authors. Journal of Applied Ecology � 2010 British Ecological Society, Journal of Applied Ecology, 48, 112–120