ECO 102 - School Drillers
98
-
Upload
khangminh22 -
Category
Documents
-
view
2 -
download
0
Transcript of ECO 102 - School Drillers


COURSE MANUAL
Introductory EconomicsIntroductory EconomicsIntroductory EconomicsIntroductory Economics IIIIIIII ECOECOECOECO102102102102
University of Ibadan Distance Learning Centre
Open and Distance Learning Course Series Development Version 1.0 v1

Copyright © 2009, 2013 by Distance Learning Centre, University of Ibadan, Ibadan.
All rights reserved. No part of this publication may be reproduced, stored in a retrieval system, or transmitted in any form or by any means, electronic, mechanical, photocopying, recording or otherwise, without the prior permission of the copyright owner.
ISBN: 978-021-365-1
General Editor: Prof. Bayo Okunade
Page layout and instructional design by EDUTECHportal, www.edutechportal.org
University of IbadUniversity of IbadUniversity of IbadUniversity of Ibadan Distance Learning Centrean Distance Learning Centrean Distance Learning Centrean Distance Learning Centre University of Ibadan,
Nigeria
Telex: 31128NG
Tel: +234 (80775935727) E-mail: [email protected]
Website: www.dlc.ui.edu.ng

Vice-Chancellor’s MessageThe Distance Learning Centre is building on a solid tradition of over two decades of service in the provision of External Studies Programme and now Distance Learning Education in Nigeria and beyond. The Distance Learning mode to which we are committed is providing access to many deserving Nigerians in having access to higher education especially thosnature of their engagement do not have the luxury of full time education. Recently, it is contributing in no small measure to providing places for teeming Nigerian youths who for one reason or the other could not get admission into the convent
These course materials have been written by writers specially trained in ODL course delivery. The writers have made great efforts to provide up to date information, knowledge and skills in the different disciplines and ensure that the m
In addition to provision of course materials in print and eTechnology input has also gone into the deployment of course materials. Most of them can be downloaded from the DLC website and are availadownload into your mobile phones, IPod, MP3 among other devices to allow you listen to the audio study sessions. Some of the study session materials have been scripted and are being broadcast on the university’s Diamocaptured in audio-visual format in a classroom environment for use by our students. Detailed information on availability and access is available on the website. We will continue in our efforts to provide and review course materials for our courses.
However, for you to take advantage of these formats, you will need to improve on your I.T. skills and develop requisite distance learning Culture. It is well known that, for efficient and effective provision of Distance learning education, availability of appropriate and relevant course materials is a sine qua nonconvenience of our students. It is in fulfillment of this, that series of course materiwritten to enable our students study at their own pace and convenience.
It is our hope that you will put these course materials to the best use.
Prof. Isaac Adewole
Vice-Chancellor
Chancellor’s Message The Distance Learning Centre is building on a solid tradition of over two decades of service in the provision of External Studies Programme and now Distance Learning Education in Nigeria and beyond. The Distance Learning mode to which we are committed is providing access to many deserving Nigerians in having access to higher education especially thosnature of their engagement do not have the luxury of full time education. Recently, it is contributing in no small measure to providing places for teeming Nigerian youths who for one reason or the other could not get admission into the conventional universities.
These course materials have been written by writers specially trained in ODL course delivery. The writers have made great efforts to provide up to date information, knowledge and skills in the different disciplines and ensure that the materials are user-friendly.
In addition to provision of course materials in print and e-format, a lot of Information Technology input has also gone into the deployment of course materials. Most of them can be downloaded from the DLC website and are available in audio format which you can also download into your mobile phones, IPod, MP3 among other devices to allow you listen to the audio study sessions. Some of the study session materials have been scripted and are being broadcast on the university’s Diamond Radio FM 101.1, while others have been delivered and
visual format in a classroom environment for use by our students. Detailed information on availability and access is available on the website. We will continue in our
ide and review course materials for our courses.
However, for you to take advantage of these formats, you will need to improve on your I.T. skills and develop requisite distance learning Culture. It is well known that, for efficient and
of Distance learning education, availability of appropriate and relevant sine qua non. So also, is the availability of multiple plat form for the
convenience of our students. It is in fulfillment of this, that series of course materiwritten to enable our students study at their own pace and convenience.
It is our hope that you will put these course materials to the best use.
The Distance Learning Centre is building on a solid tradition of over two decades of service in the provision of External Studies Programme and now Distance Learning Education in Nigeria and beyond. The Distance Learning mode to which we are committed is providing access to many deserving Nigerians in having access to higher education especially those who by the nature of their engagement do not have the luxury of full time education. Recently, it is contributing in no small measure to providing places for teeming Nigerian youths who for one
ional universities.
These course materials have been written by writers specially trained in ODL course delivery. The writers have made great efforts to provide up to date information, knowledge and skills in
format, a lot of Information Technology input has also gone into the deployment of course materials. Most of them can be
ble in audio format which you can also download into your mobile phones, IPod, MP3 among other devices to allow you listen to the audio study sessions. Some of the study session materials have been scripted and are being
nd Radio FM 101.1, while others have been delivered and visual format in a classroom environment for use by our students. Detailed
information on availability and access is available on the website. We will continue in our
However, for you to take advantage of these formats, you will need to improve on your I.T. skills and develop requisite distance learning Culture. It is well known that, for efficient and
of Distance learning education, availability of appropriate and relevant . So also, is the availability of multiple plat form for the
convenience of our students. It is in fulfillment of this, that series of course materials are being
Foreword As part of its vision of providing education for “Liberty and Development” for Nigerians and the International Community, the University of Ibadan, Distance Learning Centre has recently embarked on a vigorous repositioning agenda which aimed at embracing a holistic and all encompassing approach to the delivery of its Open Distance Learning (ODL) programmes. Thus we are committed to global best practices in distance learning provision. Apart from providing an efficient administrative and academic support for our students, we are committed to providing educational resource materials for the use of our students. We are convinced that, without an up-to-date, learner-friendly and distance learning compliant course materials, there cannot be any basis to lay claim to being a provider of distance learning education. Indeed, availability of appropriate course materials in multiple formats is the hub of any distance learning provision worldwide.
In view of the above, we are vigorously pursuing as a matter of priority, the provision of credible, learner-friendly and interactive course materials for all our courses. We commissioned the authoring of, and review of course materials to teams of experts and their outputs were subjected to rigorous peer review to ensure standard. The approach not only emphasizes cognitive knowledge, but also skills and humane values which are at the core of education, even in an ICT age.
The development of the materials which is on-going also had input from experienced editors and illustrators who have ensured that they are accurate, current and learner-friendly. They are specially written with distance learners in mind. This is very important because, distance learning involves non-residential students who can often feel isolated from the community of learners.
It is important to note that, for a distance learner to excel there is the need to source and read relevant materials apart from this course material. Therefore, adequate supplementary reading materials as well as other information sources are suggested in the course materials.
Apart from the responsibility for you to read this course material with others, you are also advised to seek assistance from your course facilitators especially academic advisors during your study even before the interactive session which is by design for revision. Your academic advisors will assist you using convenient technology including Google Hang Out, You Tube, Talk Fusion, etc. but you have to take advantage of these. It is also going to be of immense advantage if you complete assignments as at when due so as to have necessary feedbacks as a guide.
The implication of the above is that, a distance learner has a responsibility to develop requisite distance learning culture which includes diligent and disciplined self-study, seeking available administrative and academic support and acquisition of basic information technology skills. This is why you are encouraged to develop your computer skills by availing yourself the opportunity of training that the Centre’s provide and put these into use.

In conclusion, it is envisaged that the course materials would also be useful for the regular students of tertiary institutions in Nigeria who are faced with a dearth of high quality textbooks. We are therefore, delighted to present these titles to both our distance learning students and the university’s regular students. We are confident that the materials will be an invaluable resource to all.
We would like to thank all our authors, reviewers and production staff for the high quality of work.
Best wishes.
Professor Bayo Okunade
Director

Course Development Team
Course Writer Abiodun O. Folawewo, Ph.D.
Content Editor
Production Editor
Learning Design & Technologist
Managing Editor
General Editor
Prof. Remi Raji-Oyelade
Dr. Gloria O. Adedoja
Folajimi Olambo Fakoya
Ogunmefun Oladele Abiodun
Prof. Bayo Okunade


ECOECOECOECO102102102102 Introductory Economics II
ContentsContentsContentsContents
About this course manualAbout this course manualAbout this course manualAbout this course manual 1111
How this course manual is structured .................................................................................................................... 1
Course OverviewCourse OverviewCourse OverviewCourse Overview 3333
Welcome to Introductory Economics II ECO102 ................................................................................................ 3
Course outcomes .............................................................................................................................................................. 3
Timeframe ........................................................................................................................................................................... 3
How to be successful in this course ......................................................................................................................... 4
Need help? ........................................................................................................................................................................... 5
Academic Support ............................................................................................................................................................ 5
Activities .............................................................................................................................................................................. 5
Assessments ....................................................................................................................................................................... 6
Bibliography ....................................................................................................................................................................... 6
Getting around this course Getting around this course Getting around this course Getting around this course manualmanualmanualmanual 8888
Margin icons ....................................................................................................................................................................... 8
Study Session 1Study Session 1Study Session 1Study Session 1 9999
The Field of Macroeconomics ..................................................................................................................................... 9
Introduction .......................................................................................................................................................... 9
Learning Outcomes ............................................................................................................................................ 9
Terminologies ...................................................................................................................................................... 9
1.1 What is Macroeconomics? .................................................................................................................... 10
1.2 The Distinction between Micro and Macroeconomics ............................................................. 11
Study Session Summary ............................................................................................................................................. 12
Assessment ...................................................................................................................................................................... 12
Bibliography .................................................................................................................................................................... 13
Study Session 2Study Session 2Study Session 2Study Session 2 13131313
National Income: Concepts and Measurement................................................................................................. 14
Introduction ....................................................................................................................................................... 14
Learning Outcomes ......................................................................................................................................... 14
2.1 Concepts of National Income ............................................................................................................... 14
2.1.1 Gross Domestic Product (GDP) .......................................................................................... 15
A. Market Value ........................................................................................................................ 15
B. Final Goods and Services ................................................................................................ 15
C. Produced within a Country during a given Period .............................................. 18
GDP at Factor Cost .................................................................................................................. 22
2.1.2 Gross National Product (GNP) ........................................................................................... 22
2.1.3 Net National Product (NNP) ............................................................................................... 23
2.1.4 Domestic Income ..................................................................................................................... 23
2.1.5 Personal Income ...................................................................................................................... 24

Contents ii
2.1.6 Per Capita Income / GDP Per Capita ............................................................................... 24
2.1.7 Disposable Income .................................................................................................................. 24
2.2 Measuring GDP .......................................................................................................................................... 25
2.2.1 The Value-Added Approach ................................................................................................ 25
2.2.2 The Income Approach ........................................................................................................... 26
2.2.3 The Expenditure Approach ................................................................................................. 28
2.3 National Income Measurement Problems ..................................................................................... 29
Study Session Summary ............................................................................................................................................. 31
Assessment ...................................................................................................................................................................... 31
Study Session 3Study Session 3Study Session 3Study Session 3 Error! Bookmark not defined.
Aggregate Demand and Aggregate Supply ......................................................................................................... 32
Introduction ....................................................................................................................................................... 32
Learning Outcomes ......................................................................................................................................... 32
3.1 Aggregate Demand................................................................................................................................... 32
3.1.1 The Aggregate Demand Curve ........................................................................................... 32
3.1.2 Reasons for the Downward Slope of the AD Curve ................................................... 33
3.2 Aggregate Supply ...................................................................................................................................... 34
3.2.1 The Aggregate Supply Curve .............................................................................................. 35
3.2.2 Aggregate Supply in the Short-Run ................................................................................. 35
3.2.3 Reasons for the Shape of the Short-Run as Curve ..................................................... 36
A. The Fairly Flat Shape ........................................................................................................ 36
B. The Nearly Vertical/Vertical Shape............................................................................ 37
3.2.4 The Long-Run Aggregate Supply Curve ......................................................................... 37
3.3 Shifts in the Aggregate Demand Curve ............................................................................................ 38
3.3.1 Changes in Monetary Authority’s Policy Reaction Function ................................. 39
3.3.2 Change in Spending ................................................................................................................ 40
3.4 Shifts in the Aggregate Short-Run Supply Curve ........................................................................ 41
3.4.1 Economic Fluctuations .......................................................................................................... 41
Study Session Summary ............................................................................................................................................. 41
Assessment ...................................................................................................................................................................... 41
Bibliography .................................................................................................................................................................... 42
Study Session 4Study Session 4Study Session 4Study Session 4 43434343
Money, Monetary Policy and Economic Activity ............................................................................................. 43
Introduction ....................................................................................................................................................... 43
Learning Outcomes ......................................................................................................................................... 43
4.1 The Meaning of Money ........................................................................................................................... 43
4.1.1 Definition of Money ................................................................................................................ 43
4.2 Functions of Money ................................................................................................................................. 44
4.2.1 Medium of Exchange .............................................................................................................. 44
4.2.2 Store of Value ............................................................................................................................ 44
4.2.3 Unit of Account/Unit of payment ..................................................................................... 45
4.3 Money and the Banking System ......................................................................................................... 45
4.3.1 The Banking System ............................................................................................................... 45
4.3.2 Money Supply and Control .................................................................................................. 45
Banks and Creation of Money ............................................................................................ 46
4.3.3 Money Supply with Currency and Deposit ................................................................... 47
4.3.4 Monetary Policy and its Instruments .............................................................................. 47

ECOECOECOECO102102102102 Introductory Economics II
Reserve Requirements .......................................................................................................... 47
Discount Window .................................................................................................................... 48
Open Market Operation (OMO) ......................................................................................... 48
Study Session Summary ............................................................................................................................................. 49
Bibliography .................................................................................................................................................................... 50
Study Session 5Study Session 5Study Session 5Study Session 5 51515151
Government and the Economy ................................................................................................................................ 51
Introduction ....................................................................................................................................................... 51
5.1 Government Spending ............................................................................................................................ 51
5.1.1 Government Consumption Spending Expenditure on Goods and Services .... 51
5.1.2 Transfer Payment .................................................................................................................... 52
5.2 Government Revenue ............................................................................................................................. 52
5.3 The Budget Balance ................................................................................................................................. 53
5.3.1 Revenue and Expenditure functions ............................................................................... 54
5.4 Fiscal Policy and Aggregate Demand ............................................................................................... 54
Study Session Summary ............................................................................................................................................. 59
Assessment ......................................................................................................... Error! Bookmark not defined.
Bibliography .................................................................................................................................................................... 59
Study Session 6Study Session 6Study Session 6Study Session 6 60606060
Open Economy Transaction ..................................................................................................................................... 60
Introduction ....................................................................................................................................................... 60
Learning Outcomes ......................................................................................................................................... 60
6.1 International Trade ................................................................................................................................. 60
6.1.1 Net Export ................................................................................................................................... 60
Net Export Function ............................................................................................................... 61
6.1.2 Prices for International Transaction ............................................................................... 62
6.2 Equilibrium in the Open Economy .................................................................................................... 64
Study Session Summary ............................................................................................................................................. 65
Assessment ...................................................................................................................................................................... 65
Bibliography .................................................................................................................................................................... 66
Study Session 7Study Session 7Study Session 7Study Session 7 67676767
Income Determination in the Long-Run ............................................................................................................. 67
Introduction ....................................................................................................................................................... 67
7.1 Production and Growth ......................................................................................................................... 67
7.2 Determinants of Labour Productivity.............................................................................................. 68
7.2.1 Human Capital .......................................................................................................................... 68
7.2.2 Physical Capital ........................................................................................................................ 69
7.2.3 Land and other Natural Resources .................................................................................. 69
7.2.4 Technology ................................................................................................................................. 70
7.2.5 Entrepreneurship and Management ............................................................................... 70
7.2.6 The Political and Legal Environment .............................................................................. 70
7.3 Public Policy and Economic Growth ................................................................................................ 71
7.3.1 Public Policy and Human Capital ...................................................................................... 71
7.3.2 Public Policy and Physical Capital Accumulation ...................................................... 72
7.3.3 Public Policy and Legal and Political Framework ..................................................... 72
7.3.4 Public Policy and Technological Improvement .......................................................... 73

Contents iv
Study Session Summary ............................................................................................................................................. 73
Assessment ...................................................................................................................................................................... 74
Bibliography .................................................................................................................................................................... 74
ReferencesReferencesReferencesReferences 85858585

About this course manual
1
AboutAboutAboutAbout this this this this course manualcourse manualcourse manualcourse manual
Introductory Economics II ECO102 has been produced by University of Ibadan Distance Learning Centre. All course manuals produced by University of Ibadan Distance Learning Centre are structured in the same way, as outlined below.
How this How this How this How this course manualcourse manualcourse manualcourse manual is is is is
structuredstructuredstructuredstructured The course overview The course overview gives you a general introduction to the course. Information contained in the course overview will help you determine:
� If the course is suitable for you.
� What you will already need to know.
� What you can expect from the course.
� How much time you will need to invest to complete the course.
The overview also provides guidance on:
� Study skills.
� Where to get help.
� Course assignments and assessments.
� Activity icons.
� Study Sessions.
We strongly recommend that you read the overview carefully before starting your study.
The course content The course is broken down into Study Sessions. Each Study Session comprises:
� An introduction to the Study Session content.
� Study Session outcomes. � Core content of the Study Session with a variety of learning activities. � A Study Session summary. � Assignments and/or assessments, as applicable. � Bibliography

ECO102ECO102ECO102ECO102 Introductory Economics II
2
Your comments After completing Introductory Economics II we would appreciate it if you would take a few moments to give us your feedback on any aspect of this course. Your feedback might include comments on:
� Course content and structure.
� Course reading materials and resources.
� Course assignments.
� Course assessments.
� Course duration.
� Course support (assigned tutors, technical help, etc.)
Your constructive feedback will help us to improve and enhance this course.
CourseCourseCourseCourse
Welcome toWelcome toWelcome toWelcome to Introductory Introductory Introductory Introductory
Economics IIEconomics IIEconomics IIEconomics II ECO102ECO102ECO102ECO102
Eco 102, as an introductory macroeconomic course, addresses economic problems on an economyincome, aggregate demand and supply, money and monetary policy and international trade
Course Course Course Course outcomesoutcomesoutcomesoutcomes
Upon completion ofto:
OutcomesOutcomesOutcomesOutcomes
� � � � �
TimeframeTimeframeTimeframeTimeframe
How long?How long?How long?How long?
This is a 15 week course. It requires a formal study time of 45 hours. The formal studyour course facilitator / academic advisor to facilitate your learning. Kindly see course calendar on your course website for scheduled dates. You will still require independent/personal study tistudying your course materials.
CourseCourseCourseCourse OverviewOverviewOverviewOverview
Introductory Introductory Introductory Introductory
ECO102ECO102ECO102ECO102
Eco 102, as an introductory macroeconomic course, addresses economic problems on an economy-wide level. Topics in focus income, aggregate demand and supply, money and monetary policy and international trade.
outcomesoutcomesoutcomesoutcomes
Upon completion of Introductory Economics II ECO102
discuss the scope of macroeconomic analysis. point out the different components of national income and output. highlight the basic ideas of aggregate demand and supply. present the basic elements of money and monetary policy. outline the rudiments of international trade through the basic
concepts of exports and imports.
This is a 15 week course. It requires a formal study time of 45 hours. The formal study times are scheduled around online discussions / chats with your course facilitator / academic advisor to facilitate your learning. Kindly see course calendar on your course website for scheduled dates. You will still require independent/personal study time particularly in studying your course materials.
Course Overview
3
Eco 102, as an introductory macroeconomic course, addresses economic wide level. Topics in focus include national
income, aggregate demand and supply, money and monetary policy and
ECO102 you will be able
the different components of national income and output. the basic ideas of aggregate demand and supply.
the basic elements of money and monetary policy. the rudiments of international trade through the basic
This is a 15 week course. It requires a formal study time of 45 hours. The y times are scheduled around online discussions / chats with
your course facilitator / academic advisor to facilitate your learning. Kindly see course calendar on your course website for scheduled dates.
me particularly in

ECO102ECO102ECO102ECO102 Introductory Economics
4
How to be successful in this How to be successful in this How to be successful in this How to be successful in this
coursecoursecoursecourse
As an open and distance learner your approach to learning will be different to that from your school days, where you had onsite education. You will now choose what and/or personal motivation for doing so and you will most likely be fitting your study activities around other professional or domestic responsibilities.
Essentially you will be taking control of your learningconsequence, you will need to consider performance issues related to time management, goal setting, stress management, etc. Perhaps you will also need to reacquaint yourself in areas such as essay planning, coping with exams and using th
We recommend that you take time nowstudyexcellent resources on the web. A few suggested links are:
� http://www.dlc.ui.edu.ng/resources/studyskill.pdf
This is a resource of the UIDLC pilot course module. You will find sections on building study skills, time scheduling, basic concentration technessays for analysis and memory skills (“remembering”).
� http://www.ivywise.com/newsletter_march13_how_to_self_study.html
This site provides how to master selftechnologies.
� http://www.howtostudy.org/resources.php
Another “Howmanagement, efficient reading, questioning/listening/observing skills, getting the most out of doing (“handstips for staying motivated, developing a learning plan.
The above linof writing these web links were active. If you want to look for more, go to www.google.comstudy skills”
Introductory Economics II
How to be successful in this How to be successful in this How to be successful in this How to be successful in this
As an open and distance learner your approach to learning will be different to that from your school days, where you had onsite education. You will now choose what you want to study, you will have professional and/or personal motivation for doing so and you will most likely be fitting your study activities around other professional or domestic responsibilities.
Essentially you will be taking control of your learningconsequence, you will need to consider performance issues related to time management, goal setting, stress management, etc. Perhaps you will also need to reacquaint yourself in areas such as essay planning, coping with exams and using the web as a learning resource.
We recommend that you take time now—before starting your selfstudy—to familiarize yourself with these issues. There are a number of excellent resources on the web. A few suggested links are:
http://www.dlc.ui.edu.ng/resources/studyskill.pdf
This is a resource of the UIDLC pilot course module. You will find sections on building study skills, time scheduling, basic concentration techniques, control of the study environment, note taking, how to read essays for analysis and memory skills (“remembering”).
http://www.ivywise.com/newsletter_march13_how_to_self_study.html
This site provides how to master self-studying, with bias to emerging technologies.
http://www.howtostudy.org/resources.php
Another “How to study” web site with useful links to time management, efficient reading, questioning/listening/observing skills, getting the most out of doing (“hands-on” learning), memory building, tips for staying motivated, developing a learning plan.
The above links are our suggestions to start you on your way. At the time of writing these web links were active. If you want to look for more, go to www.google.com and type “self-study basics”, “self-study skills” or similar phrases.
As an open and distance learner your approach to learning will be different to that from your school days, where you had onsite education.
you want to study, you will have professional and/or personal motivation for doing so and you will most likely be fitting your study activities around other professional or domestic
Essentially you will be taking control of your learning environment. As a consequence, you will need to consider performance issues related to time management, goal setting, stress management, etc. Perhaps you will also need to reacquaint yourself in areas such as essay planning, coping
e web as a learning resource.
before starting your self-to familiarize yourself with these issues. There are a number of
excellent resources on the web. A few suggested links are:
http://www.dlc.ui.edu.ng/resources/studyskill.pdf
This is a resource of the UIDLC pilot course module. You will find sections on building study skills, time scheduling, basic concentration
iques, control of the study environment, note taking, how to read essays for analysis and memory skills (“remembering”).
http://www.ivywise.com/newsletter_march13_how_to_self_study.htm
studying, with bias to emerging
to study” web site with useful links to time management, efficient reading, questioning/listening/observing skills,
on” learning), memory building, tips for staying motivated, developing a learning plan.
ks are our suggestions to start you on your way. At the time of writing these web links were active. If you want to look for more, go to
-study tips”, “self-

Need help?Need help?Need help?Need help?
HelpHelpHelpHelp
As earlier noted, this course manual complements and supplements ECO102
You may contact any of the following units for resources and library services.
Distance Learning Centre (DLC)University of Ibadan, NigeriaTel: (Student Support Officers) Email: Information Centre20 Awolowo Road, Bodija,Ibadan.
For technical issues please send mail to [email protected].
Academic SupportAcademic SupportAcademic SupportAcademic Support
HelpHelpHelpHelp
A course facilitator is commissioned for this course. You have also been assigned an academic advisor to provide learning support. The contacts of your course facilitator and academic advisor for this course are available at [email protected]
ActivitiesActivitiesActivitiesActivities
AAAActivitiesctivitiesctivitiesctivities
This NOT activities, you will answering questions) befobe provided with answers to every activity question. Therefore, your emphasis when workanswers. It is more important that you understand why every answer is correct.
As earlier noted, this course manual complements and supplements ECO102at UI Mobile Class as an online course.
You may contact any of the following units for information, learning resources and library services.
Distance Learning Centre (DLC) University of Ibadan, Nigeria Tel: (+234) 08077593551 – 55 (Student Support Officers) Email: [email protected]
Head OfficeMorohundiya Complex, Ilorin ExpresswayIbadan.
Information Centre 20 Awolowo Road, Bodija, Ibadan.
Lagos OfficeSpeedwriting House, No. 16 Ajanaku Street, Off Salvation Bus Stop, Awuse Estate, Opebi, Ikeja, Lagos.
For technical issues (computer problems, web access, and etcetera), please send mail to [email protected].
Academic SupportAcademic SupportAcademic SupportAcademic Support
A course facilitator is commissioned for this course. You have also been assigned an academic advisor to provide learning support. The contacts of your course facilitator and academic advisor for this course are available
This manual features “Activities,” which may present material that is NOT extensively covered in the Study Sessions. When completing these activities, you will demonstrate your understanding of basic material (by answering questions) before you learn more advanced conceptbe provided with answers to every activity question. Therefore, your emphasis when working the activities should be on understandinanswers. It is more important that you understand why every answer is correct.
Course Overview
5
As earlier noted, this course manual complements and supplements
information, learning
Head Office Morohundiya Complex, Ibadan-Ilorin Expressway, Idi-Ose,
Lagos Office Speedwriting House, No. 16 Ajanaku Street, Off Salvation Bus Stop, Awuse Estate, Opebi, Ikeja, Lagos.
(computer problems, web access, and etcetera),
A course facilitator is commissioned for this course. You have also been assigned an academic advisor to provide learning support. The contacts of your course facilitator and academic advisor for this course are available
present material that is s. When completing these
demonstrate your understanding of basic material (by re you learn more advanced concepts. You will
be provided with answers to every activity question. Therefore, your ing the activities should be on understanding your
answers. It is more important that you understand why every answer is

ECO102ECO102ECO102ECO102 Introductory Economics
6
AssessmentsAssessmentsAssessmentsAssessments
AssessmentsAssessmentsAssessmentsAssessments
There are three basic forms of assessment in this course: in(ITQs) and self assessment questions (SAQs), and tutor marked assesSAQs. Feedbacks to the ITQs are placed immediately after the questions, while the feedbacks to SAQs are at the back of manual. You will receive your TMAs as part of online class activities at thFeedbacks to TMAs will be provided by your tutor in not more than 2 weeks expected duration. Schedule dates for submitting assignments and engaging in course / class activities is available on the course website. Kindly visit your courswebsite often for updates.
BibliographyBibliographyBibliographyBibliography
ReadingReadingReadingReading
For those interested in learning morea list of additional resources be books, articles or websites.
Introductory Economics II
There are three basic forms of assessment in this course: in(ITQs) and self assessment questions (SAQs), and tutor marked assessment (TMAs). This manual is essentially filled with ITQs and SAQs. Feedbacks to the ITQs are placed immediately after the questions, while the feedbacks to SAQs are at the back of manual. You will receive your TMAs as part of online class activities at the UI Mobile Class. Feedbacks to TMAs will be provided by your tutor in not more than 2 weeks expected duration. Schedule dates for submitting assignments and engaging in course / class activities is available on the course website. Kindly visit your courswebsite often for updates.
For those interested in learning more on this subject, we provide you with a list of additional resources at the end of this course manual
books, articles or websites.
There are three basic forms of assessment in this course: in-text questions (ITQs) and self assessment questions (SAQs), and tutor marked
sment (TMAs). This manual is essentially filled with ITQs and SAQs. Feedbacks to the ITQs are placed immediately after the questions, while the feedbacks to SAQs are at the back of manual. You will receive
e UI Mobile Class. Feedbacks to TMAs will be provided by your tutor in not more than 2
Schedule dates for submitting assignments and engaging in course / class activities is available on the course website. Kindly visit your course
, we provide you with course manual; these may


8
ECO102ECO102ECO102ECO102 Introductory Economics
Getting around this Getting around this Getting around this Getting around this
Margin Margin Margin Margin iconsiconsiconsicons
While working through this use of text, a new task or change in activity; they have been included to help you to find your way around this
A complete icon set is shown below. We suggest that you famyourself with the icons and their meaning before starting your study.
DiscussionDiscussionDiscussionDiscussion
SummarySummarySummarySummary
Introductory Economics II
Getting around this Getting around this Getting around this Getting around this course manualcourse manualcourse manualcourse manual
While working through this course manual you will use of margin icons. These icons serve to “signpost” a particular piece of text, a new task or change in activity; they have been included to help you to find your way around this course manual.
A complete icon set is shown below. We suggest that you famyourself with the icons and their meaning before starting your study.
ActivityActivityActivityActivity AssessmentAssessmentAssessmentAssessment AssignmentAssignmentAssignmentAssignment
DiscussionDiscussionDiscussionDiscussion Group ActivityGroup ActivityGroup ActivityGroup Activity HelpHelpHelpHelp
NoteNoteNoteNote ReflectionReflectionReflectionReflection ReadingReadingReadingReading
SummarySummarySummarySummary TerminologyTerminologyTerminologyTerminology TimeTimeTimeTime
course manualcourse manualcourse manualcourse manual
ll notice the frequent “signpost” a particular piece of
text, a new task or change in activity; they have been included to help you
A complete icon set is shown below. We suggest that you familiarize yourself with the icons and their meaning before starting your study.
Case studyCase studyCase studyCase study
OutcomesOutcomesOutcomesOutcomes
Study skillsStudy skillsStudy skillsStudy skills
TipTipTipTip

Study SessionStudy SessionStudy SessionStudy Session
The The The The Field of MacroeconomicsField of MacroeconomicsField of MacroeconomicsField of Macroeconomics
IntroductionIntroductionIntroductionIntroduction In this Study Session, you will examine the meaning of macroeconomics as well as its subject matter. You shall be exposed to similarities and differences between the microeconomics.
Learning OutcomesLearning OutcomesLearning OutcomesLearning Outcomes
LearningLearningLearningLearning OutcomesOutcomesOutcomesOutcomes
When you have studied this session, you should be able to: 1.1
1.2
TerminologiesTerminologiesTerminologiesTerminologies
MacroeconomicsMacroeconomicsMacroeconomicsMacroeconomics
EconomyEconomyEconomyEconomy
PoliciesPoliciesPoliciesPolicies
GovernmentGovernmentGovernmentGovernment
MicroeconomicsMicroeconomicsMicroeconomicsMicroeconomics
Study Session 1 The Field of Macroeconomics
Study SessionStudy SessionStudy SessionStudy Session 1111
Field of MacroeconomicsField of MacroeconomicsField of MacroeconomicsField of Macroeconomics
In this Study Session, you will examine the meaning of macroeconomics as well as its subject matter. You shall be exposed to similarities and differences between the macroeconomics and a related field, microeconomics.
Learning OutcomesLearning OutcomesLearning OutcomesLearning Outcomes
When you have studied this session, you should be able to: point how the importance of macroeconomics as a separate field of study.
distinguish between microeconomics and macroe
MacroeconomicsMacroeconomicsMacroeconomicsMacroeconomics The part of economics that examines large
or general economic factors, such as interest
rates and national productivity.
EconomyEconomyEconomyEconomy The wealth and resources of a country or
especially in terms of production and consumption
of goods and services. This of course consists of
all of the activities involved in the production
and distribution of these goods and services.
PoliciesPoliciesPoliciesPolicies A plan or course of action, by a government
intended to influence and determine decisions and
actions in a bid to facilitate expediency and
achievement of long term goals.
GovernmentGovernmentGovernmentGovernment An institutional framework of rule in a state, and it
consists of the legislature, executive and judiciary.
MicroeconomicsMicroeconomicsMicroeconomicsMicroeconomics The part of economics that analyzes single factors
and the effects of individual decisions.
The Field of Macroeconomics
9
Field of MacroeconomicsField of MacroeconomicsField of MacroeconomicsField of Macroeconomics
In this Study Session, you will examine the meaning of macroeconomics as well as its subject matter. You shall be exposed to similarities and
macroeconomics and a related field,
When you have studied this session, you should be able to: how the importance of macroeconomics as a separate field of
between microeconomics and macroeconomics.
The part of economics that examines large-scale
or general economic factors, such as interest
rates and national productivity.
The wealth and resources of a country or region,
especially in terms of production and consumption
of goods and services. This of course consists of
all of the activities involved in the production
and distribution of these goods and services.
A plan or course of action, by a government,
intended to influence and determine decisions and
actions in a bid to facilitate expediency and
achievement of long term goals.
An institutional framework of rule in a state, and it
consists of the legislature, executive and judiciary.
The part of economics that analyzes single factors
and the effects of individual decisions.
10
ECO102ECO102ECO102ECO102 Introductory Economics II
1.1 1.1 1.1 1.1 What What What What iiiis Macroeconomics?s Macroeconomics?s Macroeconomics?s Macroeconomics?
Macroeconomics Macroeconomics Macroeconomics Macroeconomics
The part of economics
that examines large-scale
or general economic
factors, such as interest
rates and national
productivity.
Economy Economy Economy Economy The wealth
and resources of a
country or region,
especially in terms of
production and
consumption of goods and
services. This of course
consists of all of the
activities involved in the
production and
distribution of these
goods and services.
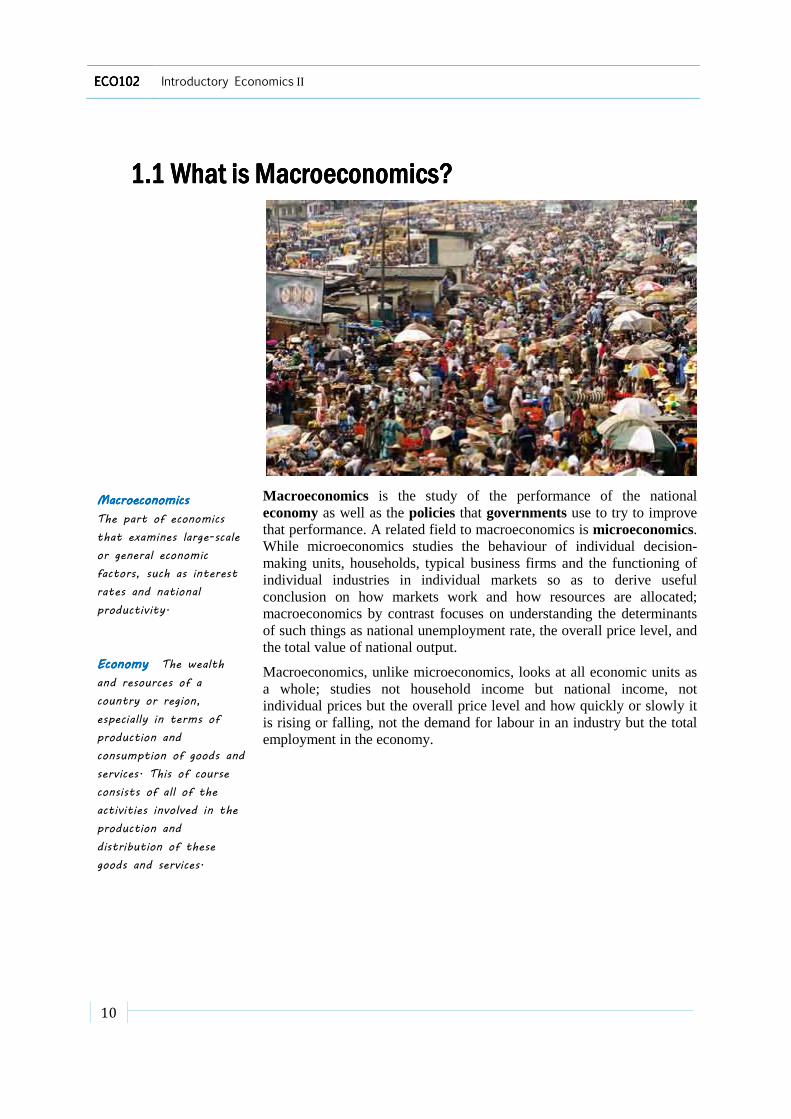
Macroeconomics is the study of the performance of the national economy as well as the policies that governments use to try to improve that performance. A related field to macroeconomics is microeconomics. While microeconomics studies the behaviour of individual decision-making units, households, typical business firms and the functioning of individual industries in individual markets so as to derive useful conclusion on how markets work and how resources are allocated; macroeconomics by contrast focuses on understanding the determinants of such things as national unemployment rate, the overall price level, and the total value of national output.
Macroeconomics, unlike microeconomics, looks at all economic units as a whole; studies not household income but national income, not individual prices but the overall price level and how quickly or slowly it is rising or falling, not the demand for labour in an industry but the total employment in the economy.

Study Session 1 The Field of Macroeconomics
11
ITQ
Question
o What are the issues/problems that macroeconomics attempt to resolve?
Feedback
• Macroeconomics as a field of economics attempts to resolve issues or problem that relate, affect or concern the totality of the economy as a whole, such as inflation, economic growth, unemployment, and national income.
1.21.21.21.2 The Distinction The Distinction The Distinction The Distinction bbbbetween Micro etween Micro etween Micro etween Micro aaaand nd nd nd MacroeconomicsMacroeconomicsMacroeconomicsMacroeconomics
It should be noted that there is not “water-tight” distinction between microeconomics and macroeconomics as macroeconomics has microeconomic foundation. First, this is because both are concerned with the decisions of households and firms. In this regard, aggregation is commonly used in macroeconomics to refer to ‘sums’, ‘total’, and ‘addition’. Therefore, when we speak of aggregate investment or aggregate consumption; we mean total investment and total consumption in the economy.
Secondly, although microeconomics and macroeconomics take different perspectives on the economy, the basic tools of analysis are much the same, and also macroeconomists apply the same core principles that are used in microeconomics in their efforts to understand and predict economic behaviour. In addition, macroeconomic behaviour is the sum of all the microeconomic decisions made by individual households and firms. If the movements of macroeconomic aggregates such as total output or total employment reflect decisions made by individual firms and households, we cannot understand the former without some knowledge of the factors that influence the latter.
Macroeconomics is concerned mainly with four basic issues; that is, it seeks to provide answer to the question of what is happening to:
1. Inflation or prices
2. Economic/ output growth
3. Unemployment
4. Balance of Payments
Government as policy maker would like to have low inflation, high output growth, low unemployment and trade or external balance and uses three kinds of policies to influence the economy. These are fiscal policy, monetary policy and the growth or supply-side policies. Macroeconomics deals with analysis of the outcomes of such policies on the economy.

12
ECO102ECO102ECO102ECO102 Introductory Economics
TipTipTipTip
While microeconomics focuses on the behaviour of
(the households, the firms, the industries), macroeconomics focuses
on the aggregation of these behaviours in the economy.
ITQ
Question
Feedback
Study Session SummaryStudy Session SummaryStudy Session SummaryStudy Session Summary
SummarySummarySummarySummary
In this Study Session, you learnt that macroeconomics is the study of the aggregate outcomes of economic behaviour. The word Macro is derived from the Greek word makro, which meanseconomyanalysing how each individual person, household or business firm behaves or what they produce or earn major branch of economic analysfocuses on a selected few outcomes at the aggregate level and is rightly considered to be the study of employment, output and inflation in an international context.
AssessmentAssessmentAssessmentAssessment
AssessmentAssessmentAssessmentAssessment
SAQ 1.1 (tests Learning Outcome
Discuss the significance of macroeconomics as a field of economics
SAQ 1.
Make a distinction between macroeconomics and microeconomics
Introductory Economics II
While microeconomics focuses on the behaviour of
(the households, the firms, the industries), macroeconomics focuses
on the aggregation of these behaviours in the economy.
ITQ
Question
o What differentiate macroeconomics from microeconomics?
Feedback
• The difference between macroeconomics and microeconomics lies on the aspect of the economy each of them Macroeconomics examines the general or aggregate performance of the economy, while microeconomics examines the individual performance within the economyeconomic unit.
Study Session SummaryStudy Session SummaryStudy Session SummaryStudy Session Summary
In this Study Session, you learnt that macroeconomics is the study of the aggregate outcomes of economic behaviour. The word Macro is derived from the Greek word makro, which means large and so we take an economy-wide perspective. Macroeconomics is not concerned with analysing how each individual person, household or business firm behaves or what they produce or earn – that is the terrain of the other major branch of economic analysis, microeconomics. Macroeconomics focuses on a selected few outcomes at the aggregate level and is rightly considered to be the study of employment, output and inflation in an international context.
SAQ 1.1 (tests Learning Outcome 1.1)
Discuss the significance of macroeconomics as a field of economics
SAQ 1.2 (tests Learning Outcome 1.2)
Make a distinction between macroeconomics and microeconomics
While microeconomics focuses on the behaviour of individual units
(the households, the firms, the industries), macroeconomics focuses
on the aggregation of these behaviours in the economy.
What differentiate macroeconomics from microeconomics?
The difference between macroeconomics and microeconomics of the economy each of them studies.
Macroeconomics examines the general or aggregate performance of the economy, while microeconomics examines
e economy, i.e. individual
In this Study Session, you learnt that macroeconomics is the study of the aggregate outcomes of economic behaviour. The word Macro is derived
large and so we take an wide perspective. Macroeconomics is not concerned with
analysing how each individual person, household or business firm that is the terrain of the other
is, microeconomics. Macroeconomics focuses on a selected few outcomes at the aggregate level and is rightly considered to be the study of employment, output and inflation in an
Discuss the significance of macroeconomics as a field of economics.
Make a distinction between macroeconomics and microeconomics

Study Session 1 The Field of Macroeconomics
13
BibliographyBibliographyBibliographyBibliography
ReadingReadingReadingReading
Read introduction to macroeconomics lecture notes by R. Kunst at
• homepage.univie.ac.at/robert.kunst/macro1.pdf
You may also study the pages at
• www.investopedia.com/terms/m/microeconomics.asp
• www.whatiseconomics.org/microeconomics
14
ECO102ECO102ECO102ECO102 Introductory Economics
Study Session 2Study Session 2Study Session 2Study Session 2
National Income: ConceptNational Income: ConceptNational Income: ConceptNational Income: Concept
IntroductionIntroductionIntroductionIntroduction In the previous Study Session, we noted that macroeconomics is the study of the aggregate outcomes of economic behaviour. Macroeconomics focuses on a selected few outcomes at the aggregate level, one of which is national income. In this Study Session, we sconcepts in National Income (NI) and the different approaches to measuring it.
Learning OutcomesLearning OutcomesLearning OutcomesLearning Outcomes
LearningLearningLearningLearning OutcomesOutcomesOutcomesOutcomes
When you have studied this session, you should be able to: 2.1 2.2 2.3
2.1 2.1 2.1 2.1 Concepts Concepts Concepts Concepts ooooWe all have an understanding of the concept of income on an individual level and/or what our own income is. But how should we measure the income of a whole economy? To find the nation’s income do we just add up the incomes of the household, business, and ghow does the rest
National Incomesuch terms as national output, national expenditure, and national dividend. produced annually in a country. It is the total amount of income earned by a country from economic activities in a given year. It includes payments made to all factors of production in the forms of wages, interest, rent, and profits.
There are several concepts pertaining to national income. Such concepts include Gross Domestic Product (GDP), Gross National Income (GNP), Net National Product (NNP), Net National Income (NNI), Disposable Income (DI), Real Income (RI), GDP at factor cost, anprice and so on.
Introductory Economics II
Study Session 2Study Session 2Study Session 2Study Session 2
National Income: ConceptNational Income: ConceptNational Income: ConceptNational Income: Conceptssss and and and and MeasurementMeasurementMeasurementMeasurement
In the previous Study Session, we noted that macroeconomics is the study of the aggregate outcomes of economic behaviour. Macroeconomics focuses on a selected few outcomes at the aggregate level, one of which is national income. In this Study Session, we shall examine various concepts in National Income (NI) and the different approaches to measuring it.
Learning OutcomesLearning OutcomesLearning OutcomesLearning Outcomes
When you have studied this session, you should be able to: highlight the differences among various NI concepts. measure NI. present the problems associated with NI computation.
oooof National Incomef National Incomef National Incomef National Income We all have an understanding of the concept of income on an individual level and/or what our own income is. But how should we measure the income of a whole economy? To find the nation’s income do we just add up the incomes of the household, business, and government sectors? And how does the rest-of-the-world enter the picture?
National Income (NI) is a term that can be used interchangeably with such terms as national output, national expenditure, and national dividend. General, NI is the total value of all produced annually in a country. It is the total amount of income earned by a country from economic activities in a given year. It includes payments made to all factors of production in the forms of wages, interest, rent, and profits.
ere are several concepts pertaining to national income. Such concepts include Gross Domestic Product (GDP), Gross National Income (GNP), Net National Product (NNP), Net National Income (NNI), Disposable Income (DI), Real Income (RI), GDP at factor cost, anprice and so on.
and and and and
In the previous Study Session, we noted that macroeconomics is the study of the aggregate outcomes of economic behaviour. Macroeconomics focuses on a selected few outcomes at the aggregate level, one of which
hall examine various concepts in National Income (NI) and the different approaches to
When you have studied this session, you should be able to: ces among various NI concepts.
the problems associated with NI computation.
We all have an understanding of the concept of income on an individual level and/or what our own income is. But how should we measure the income of a whole economy? To find the nation’s income do we just add
overnment sectors? And
(NI) is a term that can be used interchangeably with such terms as national output, national expenditure, and national
goods and services produced annually in a country. It is the total amount of income earned by a country from economic activities in a given year. It includes payments made to all factors of production in the forms of wages,
ere are several concepts pertaining to national income. Such concepts include Gross Domestic Product (GDP), Gross National Income (GNP), Net National Product (NNP), Net National Income (NNI), Disposable Income (DI), Real Income (RI), GDP at factor cost, and GDP at market

Study Session 2 National Income: Concepts and Measurement
15
2.1.1 Gross Domestic Product (GDP)2.1.1 Gross Domestic Product (GDP)2.1.1 Gross Domestic Product (GDP)2.1.1 Gross Domestic Product (GDP)
The most frequently used measure of an economy’s output or national income is the gross domestic product (GDP). GDP measures how much an economy produces in a given period usually quarter of a year (3 months), half-yearly (six months), or a year. It is the market value of all the final goods and services that are produced in a country during a given period of time, usually in year by all factors of production located within a country. In order to understand this definition, it is important that we examine each of the key words in the definition. These key words are “market value”, “final goods and services”, “produced within a country during a given period of time.”
A. A. A. A. Market ValueMarket ValueMarket ValueMarket Value
National income/GDP is an aggregation of the market values of all the goods and services produced in the economy in a given period. Goods and services that are not sold in the markets such as unpaid house works are not counted in GDP. Important exceptions to this regard are goods and services provided by the government (they do not have market value) which are included in GDP as the government’s cost of providing them.
B. B. B. B. Final Goods and ServicesFinal Goods and ServicesFinal Goods and ServicesFinal Goods and Services
It should however be noted that not all goods and services that have a market value are counted in GDP. GDP includes only those goods and
Reading Reading Reading Reading ActivityActivityActivityActivity
Allow 15 minutes
Importance of National Income Analysis
1. National income data is useful for research purposes. Researchers make use of national income data such as output, savings, consumption, income, and employment data. They study and analyse these data and use the trend to make appropriate policy recommendations.
2. National income statistics enables us to know the distribution of income in a country. From wages, rents, profit data, we can see income disparity of different sectors of the society and regard distribution of income. It is only on the basis of these that the government can adopt measures to remove income inequality and restore regional equilibrium. In addition, with a view to removing these personal and regional disequilibria, the decisions to levy more taxes and increase public expenditure also rest on national statistics.
3. National income data is useful for calculating a country’s per capital income which reflects the welfare level of the country.
4. National income data is useful for planning: for economic planning, data on a country gross income, output, saving, and consumption from different sources are needed. Also, long-run and short-run economic models are propounded by economists based on national income data.
5. It tells us the aggregation of a nation’s output, income and product resulting from the income of different individuals, product of industries and transactions of international trade.
6. National income data form the basis of national policy, such as employment policy

16
ECO102ECO102ECO102ECO102 Introductory Economics II
services that are the end product of the production process which are called final goods and services.
Many goods are used in the production process. For example, in order for a baker to produce a loaf of bread, grain must be planted and harvested, the grains must thereafter be milled into fine flour, mixed with other ingredients, and then baked into bread. Out of these three goods (grain, flour and bread) that are produced during this process it is only bread that is used by consumers, since the production of the bread is the ultimate aim of the process, the bread is therefore called a final good.
It can therefore be seen that a final good or service is the end product of the production process, or the product or service that consumers actually use. The goods and services produced in the process of making the final product (in our example, the grain and the flour) are called intermediate goods and services.
Since we are only interested in measuring items that are of direct economic value, only final goods and services are therefore included in the calculation of GDP. Intermediate goods and services which are used up in the production of final goods and services are not counted.
HintHintHintHint
Some goods can either be intermediate or final. A special type of good that is difficult to class as intermediate or final is a capital good. Capital goods do not fit into the definition of final goods since their purpose is to produce other goods. A capital good is a long-lived good which is itself produced and used in producing other goods and services, e.g., factories, equipments and machines. Also, they are not intermediate goods, because they are not used up during the production process except over a very long period of time. Thus, for the purpose of measuring GDP, economists have agreed to classify newly produced capital goods as final goods so as to avoid double counting.
To illustrate the distinction between final goods and intermediate goods, let us consider the following examples:
Illustration 1
Suppose that a bag of grain has a market value of N5 (five naira, the price the milling company paid for the grain). If the grain then is milled into flour, which has a market value of N10.00 (the price the baker paid for the flour). The flour is then made into a loaf of bread worth N30.00 in the market.
In calculating the contribution of these activities to GDP, we cannot add together all the values of the grain, flour and bread, this is because the grain
and flour are only intermediate goods used in the production of bread. So, the total contribution to GDP is N30.00 which is the market value of the loaf of bread, the final product.

Study Session 2 National Income: Concepts and Measurement
17
Illustration 2
A tailor charges N500.00 for each cloth that he makes. The tailor pays her shop apprentice N50.00 per cloth made in return for sweeping the floor and other chores. For each clothe sown, what is the total contribution of the tailor and her apprentice to GDP?
Answer: The answer to this question is simply N500.00 which is the market value of each cloth sown. This service is counted in GDP because it is the final service, the one that actually has value to the final user. The services the apprentice provided are intermediate services and have value only because the services contributed to the production of the making of the cloth; thus, they are not counted in GDP.
Illustration 3
A farmer produces N1,000 worth of cattle milk. He sold N300 worth of milk to his friends and uses the rest of the milk to feed his livestock, which he at the end sold to his friends for N1,500. What is the farmer’s contribution to GDP?
Answer:
The milk the farmer produced serves as an intermediate good and part as a final good. The N700 (N1,000 minus N300) worth of cattle milk that was fed to the livestock is an intermediate good, thus, it is not counted as part of GDP. Whereas, the N300 worth of cattle milk sold to his friend is a final good. So, it is counted. Thus, final goods in the examples above are the N300 worth of cattle milk and the N1, 500 worth of livestock that the farmer sold to his friend. Adding N300 to N1, 500 makes N1, 800 which is the farmer’s contribution to GDP.
18
ECO102ECO102ECO102ECO102 Introductory Economics II
As earlier pointed out, intermediate goods are not counted in GDP to avoid double counting. Double counting can also be avoided by counting only the value added to a product by each firm in the production process; the value added method would be explained later in the course of the study.
ITQ
Question
o What are the items that constitute intermediate goods?
Feedback
• Intermediate goods are goods and services produced that are not meant for immediate consumption, rather they are meant to facilitate the production of other goods.
C. C. C. C. ProducProducProducProductiontiontiontion within a Country during a given Periodwithin a Country during a given Periodwithin a Country during a given Periodwithin a Country during a given Period
The word ‘domestic’ used in the definition of gross domestic product tell us that GDP is a measure of economic activities within a given country. Therefore, only goods and services produced with the country’s borders are counted.
• The GDP of Nigeria includes the market value of all goods and services produced within the Nigerian borders even if they are made in foreign-owned industries or are produced by foreigners. Also, goods and services produced in Ghana by a Nigerian based company like Globacom, etc. are not counted. In addition, only goods and services produced during the current year, or the portion of the value produced during the current year, are counted as part of the current year’s GDP.
• Also, profits earned in Nigeria by foreign-owned companies are counted in Nigeria’s GDP. For example, while the output of foreigners working in Shell, Exxon, Mobil, etc are counted as part of GDP, output produced by Nigerians abroad are not counted.
Illustration 4

Study Session 2 National Income: Concepts and Measurement
19
Suppose a 10 year old house is sold to Mr. A for N5 million and Mr. A pays the real estate agent in charge of the sales a commission of one per cent which is N50,000 (1/100 x N5 million).
The contribution of this economic activity to GDP is only N50, 000. Generally, purchases and sales of existing assets such as old houses or used cars, do not contribute to the current year’s GDP.
Since the house was not produced during the current year, its value (N5, million) is not counted in this year’s GDP. This is so because the value of the house has already been included in the GDP 10 years ago which was the year the house was built. However, the N50, 000 will be included in GDP because the N50, 000 fee paid to the real estate agent represents the market value of the agent’s services in helping Mr. A to find and purchase the house.
On the whole, the followings are not included in the calculation of GDP:
a. Goods and services that have no market value are not included in GDP because it would be impossible to have a correct estimate of their market prices. Such goods and services that have no market value include those rendered free of charge. Examples include the bringing up of a child by the mother, songs recited to friends by a musician etc.
b. Intermediate goods and services are not included in GDP. This is because many of the intermediate goods pass through a number of production stages or processes before they are finally purchased or consumed. If these products are now counted at every production stage, they would be included many times in GDP leading to the problem of double counting, and as a result, the GDP would increase too much or be overstated. Therefore, to avoid double counting, only the market value of the final products and not the intermediate products should be included in GDP.
c. The transactions that do not arise from current year product or which do not contribute in any form to production are excluded in GDP. Thus, the sale and purchase of old goods, fairly used goods, and of shares, bonds and assets of existing companies are all excluded in GDP because they do not make any addition to national product, and the goods are simply transferred.
d. Likewise, transferred payments (monies that you do not work for) such as payments received under social security e.g., unemployment insurance allowance, scholarship, bursary, gifts and bequests, old age pension, and disability pension are also not included in GNP because the recipients do not provide any service for them.
e. The profits earned or losses incurred on account of changes in capital assets as a result of the fluctuations in market prices are not included in GDP if and only if they are not responsible for the current year’s production or current year’s economic activity. For example if the price of a house increases due to inflation, the profit earned by selling such a house will not be part of GDP, but if a portion of the house is constructed anew during the current year, the increase in the value of the house (after deduction of the cost of the newly constructed portion) will be included in GDP. Similarly,
20
ECO102ECO102ECO102ECO102 Introductory Economics
f.
HintHintHintHint
There are several reasons for the exclusion of illegal activities and black market transactions from GDP. First, it is uncertain whether or not these products were produced during the current year or the preceding years.smuggling are foreign made products and are smuggled into the country; thus, are not included in GDP because they are not produced within the border of the domestic country.
ReflectionReflectionReflectionReflection
Nominal versus Real
GDP of a country may rise or fall due to an increase or decrease in prices. The rise or fall of the GDP may, however, not be real. That is, GDP might not increase or fall in the real sense. To guide against erring on this account, calculated using the prices of goods and services that prevailed in a base year rather than in the current year. Real GDP is that has been adjusted for inflation. In other words, inflation has been removed or taken care ofactivities at different times should be done using real GDP and not nominal GDP because using nominal GDP to compare economic activities at two or more different points in time may give a misleading answer.
Nomingoods and services. In other words, it is calculated using current year prices. It can increase or decrease, but it does not tell us if the increase or decrease is as a result of rise or fall also called GDP is called
TipTipTipTip
Real GDP is calculated using the prices of goods and services that prevailed in a base year rather than GDP is the GDP measured in the current market prices of the goods and services
Introductory Economics II
variations in the value of assets which can be ascertained beforehand and that are therefore insured against uncertainties such as flood, fire, etc, are not include in GDP. Note however that the depreciation of machines, plants and other capital goods is not deducted from GDP.
Income earned through illegal activities such as smuggling, drug trafficking, children trafficking, prostitution etc are not included in GDP. Also, goods sold in the black market, are excluded although they are priced (they have market value) and fulfil the needs of the people but from the social point of view, they are not useful, and thus, the income received from their sales and purchases inot included in GDP.
There are several reasons for the exclusion of illegal activities and black market transactions from GDP. First, it is uncertain whether or not these products were produced during the current year or the preceding years. Secondly, many of the products involved in smuggling are foreign made products and are smuggled into the country; thus, are not included in GDP because they are not produced within the border of the domestic country.
Nominal versus Real GDP
GDP of a country may rise or fall due to an increase or decrease in prices. The rise or fall of the GDP may, however, not be real. That is, GDP might not increase or fall in the real sense. To guide against erring on this account, real GDP has to be calculated. Real GDP is calculated using the prices of goods and services that prevailed in a base year rather than in the current year. Real GDP is that has been adjusted for inflation. In other words, inflation has been removed or taken care of in real GDP. Thus, comparisons of economic activities at different times should be done using real GDP and not nominal GDP because using nominal GDP to compare economic activities at two or more different points in time may give a misleading answer.
Nominal GDP is the GDP measured in the current market prices of the goods and services. In other words, it is calculated using current year prices. It can increase or decrease, but it does not tell us if the increase or decrease is as a result of rise or fall in inflation or price level. It is also called GDP at market or current prices. On the other hand, real GDP is called GDP at constant prices.
Real GDP is calculated using the prices of goods and services that prevailed in a base year rather than in the current year; while Nominal GDP is the GDP measured in the current market prices of the goods and services.
variations in the value of assets which can be ascertained beforehand and that are therefore insured against uncertainties such as flood,
de in GDP. Note however that the depreciation of machines, plants and other capital goods is not deducted from
Income earned through illegal activities such as smuggling, drug trafficking, children trafficking, prostitution etc are not included in
. Also, goods sold in the black market, are excluded although they are priced (they have market value) and fulfil the needs of the people but from the social point of view, they are not useful, and thus, the income received from their sales and purchases is always
There are several reasons for the exclusion of illegal activities and black market transactions from GDP. First, it is uncertain whether or not these products were produced during the current year or the
Secondly, many of the products involved in smuggling are foreign made products and are smuggled into the country; thus, are not included in GDP because they are not produced
GDP of a country may rise or fall due to an increase or decrease in prices. The rise or fall of the GDP may, however, not be real. That is, GDP might not increase or fall in the real sense. To guide against
lculated. Real GDP is calculated using the prices of goods and services that prevailed in a base year rather than in the current year. Real GDP is nominal GDP that has been adjusted for inflation. In other words, inflation has been
in real GDP. Thus, comparisons of economic activities at different times should be done using real GDP and not nominal GDP because using nominal GDP to compare economic activities at two or more different points in time may give a misleading
is the GDP measured in the current market prices of the goods and services. In other words, it is calculated using current year prices. It can increase or decrease, but it does not tell us if the increase
in inflation or price level. It is . On the other hand, real
Real GDP is calculated using the prices of goods and services that in the current year; while Nominal
GDP is the GDP measured in the current market prices of the goods

Study Session 2 National Income: Concepts and Measurement
21
ITQ
Question
o Examine the difference between nominal GDP and real GDP
Feedback
• Nominal GDP is the measured in terms of current market prices, while real GDP is measured in terms of base year market prices and not current prices.
Illustration 5
Let us assume that Nigeria produces only two commodities: beans and cassava. The prices and quantities of these two goods in 1990 and 1991 are presented in Table 2.1.
Table 2.1: Prices, Quantities and GDP in 1990 and 1991
Year
Quantity of
Beans
Prices of
Beans (N)
Quantity of
Cassava
Price of
Cassava (N)
1990 20 5 30 4
1991 40 10 60 5
A. Calculating Nominal GDP
If we calculate GDP in each of the two years as the market value of production, then,
������1990 = (20�� ����� �5) + (30�� ���� ����4)
= �220
������1999 = (40�� ����� �5) + (30�� ���� ����4)
= �700
These values (N220 and N700) are referred to by economists as GDP valued at current year prices or nominal GDP. If we compare GDP for 1990 with GDP for 1991, we might conclude that the GDP in 1991 is 3.3 times greater than 1990 GDP, that is (700 > 220).
As shown from the example, if we want to use GDP in comparing economic activity at different point in time, there is need to exclude the effects of price changes that is, we need to adjust for inflation.
To adjust for inflation, economists usually use a common set of prices to value quantities produced in different years. A particular year when prices are normal or stable is called the base year is usually selected, and the price from that year is then used in calculating the market value of output. Thus, real GDP is calculated using the prices from a base year; rather than the current year’s prices.
22
ECO102ECO102ECO102ECO102 Introductory Economics II
B. Calculating Real GDP
Still using the data contained in Table 2.2, and assuming 1990 as the base year, the real GDP for years 1990 and 1991 can be calculated. Here, with real GDP, we are interested in knowing by how much real output grew between 1990 and 1991.
Answer:
To calculate real GDP for 1991, the quantities produced in 1991 must be valued using the prices in the base year (1990)
1991������� = (1991������������� �1990����������
+((1991������������ ����1990��������� ���)
= (40x5) + (60x4)
The real GDP for 1990 equals year 1990 quantities valued at base year prices. Since the base year is year 1990, therefore the real GDP for 1990 equals (year 1990 quantities valued at year 1990 prices which is the same as nominal GDP for 1990. In general, in the base year, real GDP and Nominal GDP are the same.
Now, having known how to determine the real GDP, we can now determine how much real production has actually grown over the two years period. Since real GDP was 220 in 1990 and 440 in 1991, we can clearly see that the physical volume of production doubled between 1990 and 1991. This conclusion makes good sense as we can see in Table 2.1 that he production of both beans and cassava exactly doubled over the two years period. In sum, using real GDP, we have eliminated the effects of price changes and have gotten a reasonable measure of the actual change in physical production over the two years period.
GDP at Factor CostGDP at Factor CostGDP at Factor CostGDP at Factor Cost
In national income accounting, it is usual to also find terms like GDP at factor cost. GDP at factor cost is the sum of the monetary value of all goods and services produced by the factors of production or the income accruing to the various factors of production in one year in a country.
2.1.2 2.1.2 2.1.2 2.1.2 Gross National Product (GNP)Gross National Product (GNP)Gross National Product (GNP)Gross National Product (GNP)
Gross national product is the market value of all goods and services produce by all the nationals (citizens) of a given country, irrespective of whether they reside within the domestic country or abroad. It includes the output or income of only the citizens of country resident in the domestic country, as well as the output or income of the citizens of a country who are abroad. The income of citizens of a country living abroad is termed factor income from the rest of the world. Unlike GDP, it excludes the output from foreigners residing in the domestic country. Thus, it subtracts the income of the foreigners living in the domestic country that is called payments of factor income to the rest of the world.
GNP therefore takes account of three components which are: the income or output of citizens of a country residing in the country (GDP), the income or output of citizens residing abroad (factor income from the rest of the world) and excludes the income or output of foreigners residing in the domestic country (factor income to the rest of the world)

TipTipTipTip
GNP takes account of three components which are: the income or output of citizens of a country residing in the country (GDP), the income or output of citizens residing abroad (factor income from the rest of the world) and residing in the domestic country (factor income to the rest of the world).
Because GNP considers only the output of nationals of a country, GNP is GDP plus receipts of factor income from the rest of the world payments of factor income to the rest of the world.between the receipts of factor income from the rest of the world and the payments of factor income to the rest of the world is termed income from abroad (Nf)from abroad:
ITQ
Question
Feedback
2.12.12.12.1
It can be recalled that GNP includes the value of the total output of a country. In the productimachineries, equipments etc are used. Some of these equipments wear out, their component are damaged or destroyed, and others become obsolete (out of fashion) through technological improvement. All these are termed fixed capital is subject to depreciation.
To calculate NNP, we subtract depreciation from GNP because the word ‘net’ refers to the exclusion of the part of total output that has depreciatdepreciation, that is,
2.1.4 Domestic Income2.1.4 Domestic Income2.1.4 Domestic Income2.1.4 Domestic Income
Domestic income Domestic income Domestic income Domestic income The sum of all income earned while producing goods and services within a nation's borders during a specified period
Domestic incomeon the output produced. Domestic income is the income earned or generated by all the factors of production (land, labour, capital, entrepreneurship) within a given country from its own resources.
Study Session 2 National Income: Concepts and Measurement
GNP takes account of three components which are: the income or output of citizens of a country residing in the country (GDP), the income or output of citizens residing abroad (factor income from the rest of the world) and excludes the income or output of foreigners residing in the domestic country (factor income to the rest of the world).
Because GNP considers only the output of nationals of a country, GNP is GDP plus receipts of factor income from the rest of the world payments of factor income to the rest of the world. between the receipts of factor income from the rest of the world and the payments of factor income to the rest of the world is termed income from abroad (Nf). GNP is therefore GDP plus net factor income from abroad:
GNP = GDP + (Nf).
ITQ
Question
o What is the difference between GDP and GNP?
Feedback
• GDP measures the value of goods and services produced within a particular country by their citizens and nonmeasures goods and services produced by their citizens both home and away over a given period of time.
2.12.12.12.1.3.3.3.3 Net National Product (NNP)Net National Product (NNP)Net National Product (NNP)Net National Product (NNP)
It can be recalled that GNP includes the value of the total output of a country. In the production of these output or goods, capital goods such as machineries, equipments etc are used. Some of these equipments wear out, their component are damaged or destroyed, and others become obsolete (out of fashion) through technological improvement. All these re termed depreciation or capital consumption allowance
fixed capital is subject to depreciation.
To calculate NNP, we subtract depreciation from GNP because the word ‘net’ refers to the exclusion of the part of total output that has depreciated. Thus, net national product is gross national product minus depreciation, that is,
NNP = GNP – D
2.1.4 Domestic Income2.1.4 Domestic Income2.1.4 Domestic Income2.1.4 Domestic Income
Domestic income is similar to GDP but is particular about income earned on the output produced. Domestic income is the income earned or generated by all the factors of production (land, labour, capital, entrepreneurship) within a given country from its own resources.
National Income: Concepts and Measurement
23
GNP takes account of three components which are: the income or output of citizens of a country residing in the country (GDP), the income or output of citizens residing abroad (factor income from the
excludes the income or output of foreigners residing in the domestic country (factor income to the rest of the
Because GNP considers only the output of nationals of a country, GNP is GDP plus receipts of factor income from the rest of the world less the
Where the difference between the receipts of factor income from the rest of the world and the payments of factor income to the rest of the world is termed net factor
is therefore GDP plus net factor income
What is the difference between GDP and GNP?
GDP measures the value of goods and services produced within non-citizen, while GNP
measures goods and services produced by their citizens both home and away over a given period of time.
It can be recalled that GNP includes the value of the total output of a on of these output or goods, capital goods such as
machineries, equipments etc are used. Some of these equipments wear out, their component are damaged or destroyed, and others become obsolete (out of fashion) through technological improvement. All these
capital consumption allowance. In essence,
To calculate NNP, we subtract depreciation from GNP because the word ‘net’ refers to the exclusion of the part of total output that has
ed. Thus, net national product is gross national product minus
is similar to GDP but is particular about income earned on the output produced. Domestic income is the income earned or generated by all the factors of production (land, labour, capital, entrepreneurship) within a given country from its own resources.

24
ECO102ECO102ECO102ECO102 Introductory Economics II
HHHHintintintint In some literatures, domestic income is referred to as Gross Domestic Income (GDI). The sum of all income earned while producing goods and services within a nation's borders.
Domestic income includes: (i) wages and Salaries earned by labour; (ii) rent, including imputed house rents earned by land; (iii) interest on capital; (iv) dividends,; (v) undistributed corporate profits including the surpluses of public sector undertakings; (vi) other incomes consisting of profits of unincorporated firms, partnerships, self-employed, and (vii) direct taxes.
Domestic income does not include the income earned abroad and so, it is the difference between national income and net income earned from abroad.
���� ���������
= ��������������– ��������������!����"���!
�� = ��– ��
Note however that net income earned from abroad can be positive or negative. It is positive if income earned on exports is greater than the payment made on imports. In this case, national income will be greater than domestic income. Whereas, if payments made on imports exceed the receipts from exports, net income earned from abroad will be negative, thus domestic income will be greater than national income. Note that domestic income can also be gross or net.
2.1.5 2.1.5 2.1.5 2.1.5 Personal IncomePersonal IncomePersonal IncomePersonal Income
This refers to an individual's total earnings from wages, investment enterprises, and other ventures. It is the total income received by the individuals of a country from all sources in one year before it is subjected to direct taxes.
2.1.6 Per Capita Income /2.1.6 Per Capita Income /2.1.6 Per Capita Income /2.1.6 Per Capita Income / GDP Per CapitaGDP Per CapitaGDP Per CapitaGDP Per Capita
Per capita income is defined as the ratio of a country’s income to its population, while GDP per capita is defined as the ratio of a country’s GDP to the population of the country. Per capita GDP or per capita income gives the value of the average income per person in the country. If the value is high, it shows that the standard of living of an average person is high, and if the value is low, it indicates that the standard of living per head is low.
?Percapitaincome =./0123/4536278
920/4:2;<4/0123
PercapitaGDP =GDP
TotalPopulation
2.1.7 Disposable Income 2.1.7 Disposable Income 2.1.7 Disposable Income 2.1.7 Disposable Income
Disposable income or personal disposable income is the actual income which an individual spent on consumption. It is the income that remains after direct taxes have been deducted from one’s personal income. Thus,

Study Session 2 National Income: Concepts and Measurement
25
DisposableIncome = PersonalIncome– DirectTaxes.
ITQ
Question
o Personal income minus taxes (direct) is best known as?
Feedback
• It is best known as Disposable income.
2.2 2.2 2.2 2.2 Measuring Measuring Measuring Measuring GDPGDPGDPGDP There are three basic approaches to the measurement of GDP. These are: the value-added approach, the income approach and the expenditure approach.
2.2.1 The Value2.2.1 The Value2.2.1 The Value2.2.1 The Value----Added ApproachAdded ApproachAdded ApproachAdded Approach
The value added by any given firm equals the market value of its product or services minus the cost of the inputs the firm purchased from other firms.
NoteNoteNoteNote The summing-up of the value added by all firms (including the producers for both intermediate and final goods and services) gives the same answer as simply adding together the value of all final goods and service.
The major advantage of the value added approach is that it eliminates the problem of dividing the value of a final good or services between two periods and thus, prevents the double counting problems.
Illustration 6
Let us now illustrate the value added method by revisiting the example of bread making as given in illustration 1. We have already determined that the total contribution of this production process to GDP is N30.00, which is the value of the bread. It can be shown that we can get the same answer (N30.00) by summing up the value added. Suppose that bread baking is the ultimate product of these three firms (Dangote Grain Company produces grain; Lister Flour produces flour; and Agege Bread Making Firm produces the bread).
Given the market value of the grain, the flour and the bread, what is the value added by each of these three companies?
Answer:
Value added for any firm is the market value of its product or service minus the cost of inputs purchased from other firms. So, for these three firms, their value added can be calculated thus:
Dangote Grain Company:
Dangote Grain Company produces N5.00 worth of grain using no inputs from other companies. Since it purchased no input from other companies, therefore, the cost of inputs purchased is zero naira. Dangote’s value added is therefore N5.00 [which is the market value of its product less the cost of inputs purchased]. Thus, Dangote Grain Company’s Value added = N5.00 – N0.00, that is, N5.00.

26
ECO102ECO102ECO102ECO102 Introductory Economics II
Lister Flours Company:
Lister Flour purchased N5.00 worth of (input) grain from Dangote and used it to produce N15.00 worth of flour. The value added by Lister Flours company is thus the market value of its product (N15.00) less the cost of the inputs it purchased (N5.00), which gives N10.00. That is, N15.00 – N5.00 =
N10.00
Agege Bread Making Firm:
Finally, Agege bread making firm buys N15.00 worth of flour from Lister Flours and used it to produce N30.00 worth of bread. So, the value added by Agege bread making firm is the market value of its product minus the cost of inputs it purchased from Lister Flours Company. That is, Agege Bread Making Firm’s Value Added = 30.00 –15.00 = N15.00. The total value added by all the firms is 5 + 10.00 + 15.00 = N30.00
The calculations are summarized in Table 2.2.
Table 2.2: Value Added in Bread Production
Company Market Value
of Products (N)
Cost of Purchasing
Inputs (N)
Value
Added (N)
Dangote Grain 5 0 5
Lister Flours 15 5 10
Agege Bread 30 15 5
Note that the summation of the value added by each company gives the same answer as the method of calculation of final goods and services that is shown in illustration 1. Thus, summing the value added by all the firms in the economy gives the total value of final goods and services, or GDP.
2.2.2 The Income Approach 2.2.2 The Income Approach 2.2.2 The Income Approach 2.2.2 The Income Approach
The income approach to the calculation of GDP measures GDP in terms of who receives it as income. According to this approach, national income is the sum of eight income items which are:
i. Compensation of Employees: this is the largest of the eight items and includes wages and salaries paid to households by firms and by the government, as well as the various supplements to wages and salaries such as contributions that employers make to pension funds and social insurance.
ii. Proprietors’ Income: this is the income of unincorporated businesses.
iii. Rental Income: is the income received by property owners such as houses in the form of rent.
iv. Corporate Profits: this is the income of corporations. v. Net Interest: is the interest paid by business (note that interest paid
by households and the government is not counted in GDP because it is not assumed to flow from the production of goods and services).
vi. Indirect Taxes minus Subsidies: this includes taxes such as sales taxes, licence fees, custom duties etc less subsidies that the government pays for which it receives no goods or services in return (note that subsidies are like negative taxes). The value of indirect

Study Session 2 National Income: Concepts and Measurement
27
taxes minus subsidies is therefore the net income received by the government.
vii. Net Business Transfer Payments: these are the net transfer payments by businesses to others and are therefore the income of others.
viii. Surplus of Government Enterprises: this is the income from government enterprises.
An example of the income approach is given in Table 2.3.
Table 2.3 Table 2.3 Table 2.3 Table 2.3 National Income
National Income (NI) Million Naira (N’m)
Compensation of Employees xxx
+ Proprietors’ Income xxx
+ Rental Income xxx
+ Corporate Profits xxx
+ Net Interest xxx
+ Indirect Taxes minus Subsidies xxx
+ Net Business Transfer Payments xxx
+ Surplus of Government Enterprises xxx
= National Income xxxx
However, it should be noted that NI is the total income of the country but it is not quite the GDP. The NI is GDP less net factor income from abroad (which is equal to GNP) less depreciation (which is equal to NNP) less statistical discrepancy. This is illustrated in Table 2.4.
Table 2.4 Table 2.4 Table 2.4 Table 2.4 GDP, GNP, NNP and National Income
National Income Million Naira
(N’m)
GDP xxx
Plus: Receipts of factor income from the rest of the world xxx
Less: Payments of factor income to the rest of the world xxx
Equals: GNP xxx
Less: Depreciation xxx
Equals: Net National Product (NNP) xxx
Less: Statistical Discrepancy xxx
Equals: National Income xxxx
The NI is the income of the country’s citizens and not the income of the residents of the country and therefore, we need to move from GDP to GNP. After subtracting depreciation from GNP, what we get is called net national product (NNP). The NNP and NI are the same except for a

28
ECO102ECO102ECO102ECO102 Introductory Economics II
statistical discrepancy (data measurement error), which may lead to differences between the two. If the government is absolutely accurate in its data collection, this statistical discrepancy would be zero. However, data collection is not perfect and the statistical discrepancy is the measurement error in each period. Therefore, NI is NNP less statistical discrepancy.
2.2.3 The Expenditure Approach2.2.3 The Expenditure Approach2.2.3 The Expenditure Approach2.2.3 The Expenditure Approach
The expenditure approach considers GDP in terms of expenses incurred on purchases of goods and services produced by a country. The expenditure approach sums the expenditure from the four main economic agents in the country which are the households, the firms, the government and the rest of the world. There are four main categories of expenditure and these are:
i. Personal Consumption Expenditure: this includes household spending on consumer goods, it is denoted by C.
ii. Gross Private Domestic Investment (I) : this includes spending by firms and households on new capital such as plants and machineries, equipment, inventory, and new residential structures.
iii. Government Consumption and Government Gross investment (G): government also makes some purchases and consumes. Government consumption can be on current expenditure (such as the payment of salaries) or capital expenditure (which are like investment).
iv. Net Exports (X – M): this is the net spending by the rest of the world, or exports minus imports.
You should study further the components of GDP.
Table 2.4 Table 2.4 Table 2.4 Table 2.4 Components of the Expenditure Approach
National Income Million Naira
Personal Consumption Expenditure 50
Durable goods
Nondurable goods
Services
20
25
5
Gross Private Domestic Investment (I) 100
Non-residential
Residential
Change in business inventories
40
45
15
Government Consumption & Gross Invest 80
Federal
State and Local
49
31
Net Exports (X – M) 30
Exports (X) 50

Study Session 2 National Income: Concepts and Measurement
29
Imports (M) 20
Gross Domestic Product 200
The expenditure approach calculates GDP by adding together all these four component of spending. In equation form, GDP = C + I + G +
(X − M)
ITQ
Question
o What are the methods of measuring national income?
Feedback
• There are three (3) methods of measuring national income, these are: i. Output approach
ii. Income approach, and iii. Expenditure approach
2.3 National Income Measurement 2.3 National Income Measurement 2.3 National Income Measurement 2.3 National Income Measurement ProblemsProblemsProblemsProblems There are several problems that are encountered in the computation of NI, some of these problems are:
1. Problem of double counting: the greatest difficulty in measuring national income is that of double counting, which arises from the improper distinction between final and an intermediate product. There is always the possibility of a good or a service being included more than once.
2. There is also the difficulty of defining “nation” in national income. Although every nation has its political boundaries, the income earned by nationals of a country in a foreign country beyond the territorial boundaries of that country is also included in national income.
3. The problem of measuring non-market or domestic activities: national income is always measured in monetary value, but there are a number of goods and services that are difficult to measure or assess in terms of money and are therefore excluded. Such activities include house works, child care, driving one’s car etc., they are excluded in GDP, though they amount to real production. However, if one decides to send his/her children to the day-care, or hire a cleaner or a chauffeur to drive his/her car, GDP will increase because the salaries of day-care staff, cleaners and chauffeurs would be counted in GDP whereas, the time spent by individuals in doing the same activities is not counted. Excluding all such activities will make national income to be less than what it should actually be.
4. Income earned through illegal activities also makes national income to be less, because they are excluded from GDP.

30
ECO102ECO102ECO102ECO102 Introductory Economics II
5. Measuring national income in monetary terms leads to the underestimation of real national income. This is because national income measured in monetary value does not include the leisure forgone in the process of production of a commodity. For instance, if two individuals earn the same amount as income but if one of them works for longer hours than the other, it would be right to state that the real income of this individual has been understated.
6. Some public services cannot be estimated correctly. For example, how should police and military services be estimated? In days of war, the forces are active but during peace, they rest in their cantonment. Also, measuring the contribution of profits earned on certain projects such as power project and irrigation to national income in terms of money is a difficult task.
ITQ
Question
o The most common problem associated with national income measurement is?
Feedback
• It is the problem of double counting resulting from inability to differentiate between intermediate goods and final goods.
Study Session SummaryStudy Session SummaryStudy Session SummaryStudy Session Summary
SummarySummarySummarySummary
In this Study Session, you explored various concepts that are embedded in national income. You alsousing valueLastly, you examined various problems facing the computation of national income.
AssessmentAssessmentAssessmentAssessment
AssessmentAssessmentAssessmentAssessment
SAQ 2.1Write short notes on the following:
I.II.
III.IV.V.
VI.VII.
SAQ 2What are the methods of measuring GDP?
SAQ 2
Highlightmeasurement.
BibliographyBibliographyBibliographyBibliography
ReadingReadingReadingReading
http://tutor2u.net/economics/revisionincome.html
http://www.yourarticlelibrary.com/economics/3measuring
Study Session 2 National Income: Concepts and Measurement
Study Session SummaryStudy Session SummaryStudy Session SummaryStudy Session Summary
In this Study Session, you explored various concepts that are embedded in national income. You also learnt how to calculate national income using value-added approach, income approach, and expenditure approach. Lastly, you examined various problems facing the computation of national income.
SAQ 2.1 (tests Learning Outcome 2.1) Write short notes on the following:
I. Gross Domestic Product (GDP), II. Gross National Income (GNP),
III. Net National Product (NNP), IV. Disposable Income (DI), V. Personal Income (PI),
VI. GDP at factor cost, and VII. GDP at market price.
SAQ 2.2 (tests Learning Outcome 2.2) at are the methods of measuring GDP?
SAQ 2.3 (tests Learning Outcome 2.3)
Highlight some of the inherent problems associated with GDP measurement.
http://tutor2u.net/economics/revision-notes/as-macroincome.html retrieved August, 2013.
http://www.yourarticlelibrary.com/economics/3-importantmeasuring-national-income/2792/ retrieved August, 2013.
National Income: Concepts and Measurement
31
In this Study Session, you explored various concepts that are embedded learnt how to calculate national income
added approach, income approach, and expenditure approach. Lastly, you examined various problems facing the computation of
some of the inherent problems associated with GDP
macro-national-
important-methods-for-retrieved August, 2013.

32
ECO102ECO102ECO102ECO102 Introductory Economics
Study Study Study Study
Aggregate Demand and Aggregate SupplyAggregate Demand and Aggregate SupplyAggregate Demand and Aggregate SupplyAggregate Demand and Aggregate Supply
IntroductionIntroductionIntroductionIntroduction One of the most government is the determination of the overall price level which in turn is determined by the interaction of aggregate demand and aggregate supply. Thus, it is important to study the behaviour of aggregate demaaggregate supply. This Study Session examines concepts of aggregate demand and supply.
Learning OutcomesLearning OutcomesLearning OutcomesLearning Outcomes
Learning OutcomesLearning OutcomesLearning OutcomesLearning Outcomes
When you have studied this session, you should be able to: 3.1 3.2 3.3 3.4
3.1 3.1 3.1 3.1 Aggregate DemandAggregate DemandAggregate DemandAggregate DemandAggregate demand is the total demand for goods and services in the economy. AggregAggregate demand is national income denoted as expenditure is the addition of consumption expenditure ((I) and government consumption expenditure (
K =
3.1.3.1.3.1.3.1.
The aggregate demand curve shows the relationship between shortequilibrium output , ‘Y’, (which equals planned aggregate spending) and price level, ‘that an and vice versa. The name of the curve reflects the fact that shortequilibrium output is determined by total planned spending or demand in the economy. The relationship between the shoand price level is shown in Fig 3.1 where the overall price level is on the vertical axis and the aggregate output is on the horizontal axis.
It could be seen that the AD curve is downwardnegative relationshincrease in the price level will reduce shortAD curve can be either straight or curving.
Introductory Economics II
Study Study Study Study SessionSessionSessionSession 3333
Aggregate Demand and Aggregate SupplyAggregate Demand and Aggregate SupplyAggregate Demand and Aggregate SupplyAggregate Demand and Aggregate Supply
One of the most important issues in macroeconomics and to the government is the determination of the overall price level which in turn is determined by the interaction of aggregate demand and aggregate supply. Thus, it is important to study the behaviour of aggregate demaaggregate supply. This Study Session examines concepts of aggregate demand and supply.
Learning OutcomesLearning OutcomesLearning OutcomesLearning Outcomes
When you have studied this session, you should be able to: outline the nature of aggregate demand curve. outline the nature of aggregate supply curve. describe the causes of shift in aggregate demand. what are the factors responsible for a shift in aggregate supply
Aggregate DemandAggregate DemandAggregate DemandAggregate Demand Aggregate demand is the total demand for goods and services in the economy. Aggregate demand is usually equal to planned expenditure. Aggregate demand is national income denoted as expenditure is the addition of consumption expenditure (
) and government consumption expenditure (G).
= L + � + �
3.1.3.1.3.1.3.1.1111 The Aggregate Demand CurveThe Aggregate Demand CurveThe Aggregate Demand CurveThe Aggregate Demand Curve
The aggregate demand curve shows the relationship between shortequilibrium output , ‘Y’, (which equals planned aggregate spending) and price level, ‘P’ or inflation. The relationship is a negative one, implying that an increase in price level will lead to a decrease in aggregate output and vice versa. The name of the curve reflects the fact that shortequilibrium output is determined by total planned spending or demand in the economy. The relationship between the short-run equilibrium output and price level is shown in Fig 3.1 where the overall price level is on the vertical axis and the aggregate output is on the horizontal axis.
It could be seen that the AD curve is downward-slopping; depicting a negative relationship between output and price level (or inflation). An increase in the price level will reduce short-run equilibrium output. The AD curve can be either straight or curving. The AD curve shows a
Aggregate Demand and Aggregate SupplyAggregate Demand and Aggregate SupplyAggregate Demand and Aggregate SupplyAggregate Demand and Aggregate Supply
important issues in macroeconomics and to the government is the determination of the overall price level which in turn is determined by the interaction of aggregate demand and aggregate supply. Thus, it is important to study the behaviour of aggregate demand and aggregate supply. This Study Session examines concepts of aggregate
When you have studied this session, you should be able to:
. are the factors responsible for a shift in aggregate supply.
Aggregate demand is the total demand for goods and services in the ate demand is usually equal to planned expenditure.
Aggregate demand is national income denoted as Y and planned expenditure is the addition of consumption expenditure (C), investment
The aggregate demand curve shows the relationship between short-run equilibrium output , ‘Y’, (which equals planned aggregate spending) and
’ or inflation. The relationship is a negative one, implying increase in price level will lead to a decrease in aggregate output
and vice versa. The name of the curve reflects the fact that short-run equilibrium output is determined by total planned spending or demand in
run equilibrium output and price level is shown in Fig 3.1 where the overall price level is on the vertical axis and the aggregate output is on the horizontal axis.
slopping; depicting a ip between output and price level (or inflation). An
run equilibrium output. The The AD curve shows a
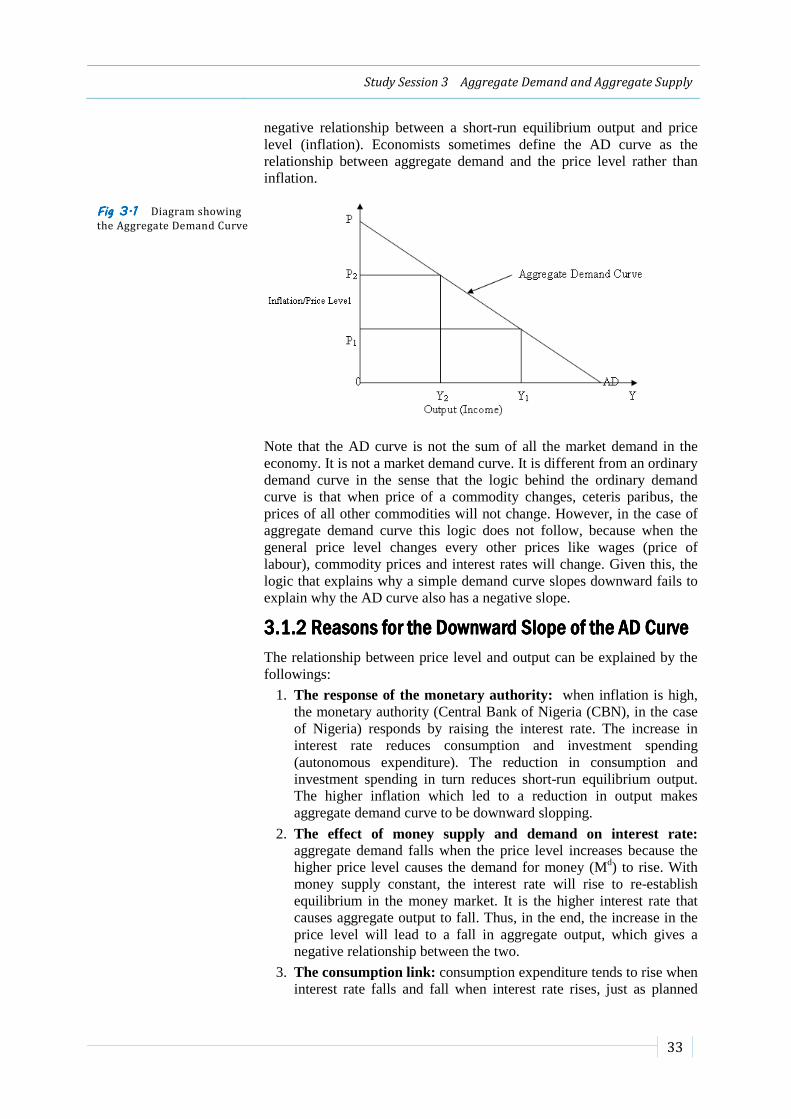
Study Session 3 Aggregate Demand and Aggregate Supply
33
negative relationship between a short-run equilibrium output and price level (inflation). Economists sometimes define the AD curve as the relationship between aggregate demand and the price level rather than inflation.
Fig 3.1 Fig 3.1 Fig 3.1 Fig 3.1 Diagram showing
the Aggregate Demand Curve
Note that the AD curve is not the sum of all the market demand in the economy. It is not a market demand curve. It is different from an ordinary demand curve in the sense that the logic behind the ordinary demand curve is that when price of a commodity changes, ceteris paribus, the prices of all other commodities will not change. However, in the case of aggregate demand curve this logic does not follow, because when the general price level changes every other prices like wages (price of labour), commodity prices and interest rates will change. Given this, the logic that explains why a simple demand curve slopes downward fails to explain why the AD curve also has a negative slope.
3.1.2 Reasons for the Downward Slope of the AD Curve3.1.2 Reasons for the Downward Slope of the AD Curve3.1.2 Reasons for the Downward Slope of the AD Curve3.1.2 Reasons for the Downward Slope of the AD Curve
The relationship between price level and output can be explained by the followings:
1. The response of the monetary authority: when inflation is high, the monetary authority (Central Bank of Nigeria (CBN), in the case of Nigeria) responds by raising the interest rate. The increase in interest rate reduces consumption and investment spending (autonomous expenditure). The reduction in consumption and investment spending in turn reduces short-run equilibrium output. The higher inflation which led to a reduction in output makes aggregate demand curve to be downward slopping.
2. The effect of money supply and demand on interest rate: aggregate demand falls when the price level increases because the higher price level causes the demand for money (Md) to rise. With money supply constant, the interest rate will rise to re-establish equilibrium in the money market. It is the higher interest rate that causes aggregate output to fall. Thus, in the end, the increase in the price level will lead to a fall in aggregate output, which gives a negative relationship between the two.
3. The consumption link: consumption expenditure tends to rise when interest rate falls and fall when interest rate rises, just as planned

34
ECO102ECO102ECO102ECO102 Introductory Economics II
investment does. The consumption link is another reason for the downward slopping shape of AD curve. An increase in general price level increases the demand for money, which in turn leads to an increase in the interest rate. A rise in interest rate causes a decrease in consumption as well as planned investment, which consequently leads to a decrease in output or income.
4. The real wealth effect: consumption depends on wealth (that is, holding of money, shares, housing, stocks, etc) other things being equal, the more wealth households we have, the more they consume. If household wealth decreases, the result will be less consumption now and in the future. The price level has an effect on some kinds of wealth. For example, an increase in the price level leads to decrease in purchasing power and lowers the real value of some types of wealth such as stocks, housing etc. however, the effect of a rise in general price level on wealth depends on what happens to stock prices and housing prices when the overall price level rises. If these two prices rise by the same percentage as the overall price level. The real value of stocks and housing will remain unchanged and this will lead to a decrease in consumption, which leads to a decrease in aggregate output. Thus, there is a negative relationship between the price level and output through this real balance effect.
5. Uncertainty: during period of inflation, aggregate demand falls because in uncertain economic environment both households and firms may become more cautious and reduce their spending.
6. Foreign price of domestic goods: a final link between the price level and total spending operates through the prices of domestic goods and services sold abroad. The foreign price of domestic goods depends in part on the rate at which the domestic currency exchanges for foreign currencies. However, for constant exchange rate between currencies, a rise in domestic inflation causes the prices of domestic goods in foreign markets to rise more quickly. As domestic goods become relatively more expensive to prospective foreign purchasers, export sales decline. Since net exports are part of aggregate expenditure, so we find that increased inflation tends to reduce spending and cause the AD curve to slope downward.
ITQ
Question
o Why is aggregate demand curve different from a market demand curve?
Feedback
• Aggregate demand curve (AD) is not the same thing with market demand curve because in a market demand curve, a change in the price of that commodity, all things been equal will not affect the price of other commodity. But for an aggregate demand curve, an increase in the price level affects other prices like wages (price of labour), commodity prices and interest rates will change.
Study Session 3 Aggregate Demand and Aggregate Supply
35
3.2 Aggregate Supply3.2 Aggregate Supply3.2 Aggregate Supply3.2 Aggregate Supply Aggregate supply is the total supply of goods and services in an economy. Although economists have little disagreement about the logic behind the aggregate demand curve, there is a great deal of disagreement about the logic behind the aggregate supply curve and its shape.
3.2.1 The Aggregate Supply Curve3.2.1 The Aggregate Supply Curve3.2.1 The Aggregate Supply Curve3.2.1 The Aggregate Supply Curve
The aggregate supply (AS) curve shows the relationship between the aggregate quantity of output supplied by all firms in an economy and the overall price level. The short-run aggregated supply curve usually gives a positive relationship between aggregate supply and the overall price level. This implies that an increase in price level will lead to an increase in aggregate supply and vice versa.
The aggregate supply curve is not a market supply curve, and it is not the simple sum of all the individual supply curves in the economy. One of the reasons for this is that most firms do not simply respond to prices determined in the market but instead, they actually set prices (it is only in perfectly competitive markets that firms simply react to prices determined by market forces. In contrast, firms in imperfect competitive industries make both output and price decisions based on their perceptions of demand and costs). Price setting firms (imperfect competitive firms) do not have individual supply curves and this is because these firms are choosing both output and price at the same time and if supply curves do not exist for these imperfect markets, we certainly cannot add them together to get an aggregate supply curve
For the reason stated above, it is helpful to think of the AS curve as a “price-output response” curve – that is, a curve that traces out the price and output decisions of all the markets and firms in the economy under a given set of circumstances.
3.2.2 3.2.2 3.2.2 3.2.2 Aggregate Supply Aggregate Supply Aggregate Supply Aggregate Supply iiiin n n n the Shortthe Shortthe Shortthe Short----RunRunRunRun
Although it is generally opined that the AS curve has a positive slope, the shape of the short-run AS curve is a source of much controversy in macroeconomics. It is often argued that at very low levels of aggregate output (for example, when the economy is in a recession, the aggregate supply curve is fairly flat, and at high levels of output (for example, when the economy is experiencing a boom), the curve is vertical or nearly vertical. Thus, we have the AS curve sloping upward and becoming vertical when the economy reaches its capacity or maximum output. Such a curve is shown below in Fig 3.2.

36
ECO102ECO102ECO102ECO102 Introductory Economics II
Fig 3.2 Fig 3.2 Fig 3.2 Fig 3.2 The Short Run
Aggregate Supply Curve
In the short run, the aggregate supply curve has a positive slope. At low levels of aggregate output, the curve is fairly flat, but as the economy approaches full capacity, the curve becomes nearly vertical. At full capacity, the curve is vertical.
In Fig 3.2, aggregate output is considerably higher at point B than at point A but the price level at point B is only slightly higher than it is at point A. Along these points, aggregate output is low and the resulting aggregate supply curve is fairly flat. Between points C and D, there is no increase in aggregate output because the economy is already in full capacity (that is utilising all its available resources and producing at its maximum level of output), but there is a large increase in the price level. Thus, point C is the point where the economy begins to operate at full capacity. As the economy approaches full capacity (point C), the curve becomes nearly vertical but between points C and D when the economy is at full capacity, the curve becomes vertical.
3.2.3 3.2.3 3.2.3 3.2.3 Reasons Reasons Reasons Reasons ffffor or or or tttthe Shape he Shape he Shape he Shape oooof f f f the Shortthe Shortthe Shortthe Short----Run Run Run Run asasasas CurveCurveCurveCurve
Several reasons accounted for the shape of the short-run AS curve. Some of the reasons associated with the shape of the AS curve are given below:
A. A. A. A. The Fairly Flat ShapeThe Fairly Flat ShapeThe Fairly Flat ShapeThe Fairly Flat Shape
At low levels of output in the economy, firms are likely to be producing at levels of output which are below their existing capacity constraints. That is, they are likely to be holding excess capital and labour, and it is also likely that there will be cyclical unemployment in the economy as a whole in periods of low output.
Suppose now that there is an increase in aggregate demand when the economy is operating at low levels of output. The firms will respond to this increase in aggregate demand by increasing output (much more than they increase price) with little or no increase in the overall price level. This is because firms are already operating below capacity, so, the extra cost of producing more output is likely to be small. This is because firms can hire more labour from the ranks of the unemployed workers without much, if any, increase in wage rates. This makes the aggregate supply curve to be fairly flat at low levels of aggregate output.
Study Session 3 Aggregate Demand and Aggregate Supply
37
In Fig 3.2, if the economy is operation at a low level of output such as at point A that is below full capacity, and then, suppose now that there is an increase in aggregate demand from point A to B, one can see from the curve that the movement from point A to B makes the curve to become fairly flat as the increase in aggregate demand results in an increase in output with a small increase in overall price level. Thus, the aggregate supply curve is likely to be fairly flat at low levels of aggregate output.
B. B. B. B. The Nearly VerticThe Nearly VerticThe Nearly VerticThe Nearly Vertical/Vertical Shapeal/Vertical Shapeal/Vertical Shapeal/Vertical Shape
If aggregate output continues to expand, the firms and the economy as a whole will begin to move closer and closer to full capacity. Firm’s response to the increase in aggregate output is likely to change from mainly increasing output to increasing prices. This is so because as firms continue to increase their output, they will begin to bump into their short-run capacity constraint. In addition, unemployment will be falling as firms hire more workers to produce the increased output so the economy will be approaching its full capacity.
As aggregate output rises, the prices of labour and capital will begin to rise more rapidly, leading firms to increase their output prices. But at full capacity (when all sectors in the economy are fully utilising their existing factories and equipment and factors of production, where there is little or no cyclical unemployment) when it is virtually impossible for firms to expand any further, firms will respond to any further increase in demand only by raising prices, since they are unable to expand output any further. At full capacity and with output remaining unchanged, the aggregate supply curve becomes vertical.
In Fig 3.2, moving from points C to D results in no increase in aggregate output but a large increase in the price level, so, the economy is at full capacity at point C. It can be seen that a little below point C, as the economy approaches point C or as the economy approaches full capacity, the aggregate supply curve becomes nearly vertical but at full capacity which is at point C, the curve assume a vertical shape.
3.2.4 3.2.4 3.2.4 3.2.4 The LongThe LongThe LongThe Long----Run Aggregate Supply CurveRun Aggregate Supply CurveRun Aggregate Supply CurveRun Aggregate Supply Curve
It is interesting to know that whether or not the economy is producing at a level of output close to full capacity, there must be a time lag between changes in input prices and changes in output prices for the aggregate supply curve to slope upward. Therefore, if input prices change at exactly the same rate as output prices, the AS curve will be vertical. For example, all output and input prices increase by 10 per cent, no firm will find it advantageous to change its level of output because the output level that maximized profits before the 10 per cent increase will be the same as the level that maximizes profits after the 10 per cent increase. Thus, if input prices adjusted immediately to output prices, the aggregate supply curve would be vertical.
It is precisely the above that leads to an important distinction between the AS curve in the short-run and the AS curve in the long-run. As noted earlier, for the AS curve to be vertical, input prices must change at exactly the same rate as output prices and for the AS curve not to be vertical, some costs must lag behind increases in the overall price level. If

38
ECO102ECO102ECO102ECO102 Introductory Economics II
all prices (both input and output prices) change at the same rate, the level of aggregate output will not change.
In the short-run (a period when at least one input varies and the others are fixed), at least changes in some costs lag behind changes in price level. This is because the short-run is a period too short for input price to quickly adjust to overall macroeconomic changes. Thus, in the short-run, wage rates (price of labour) tend to adjust slowly to overall macroeconomic changes and the AS curve cannot be vertical. In the short-run, the wage rate may increase at exactly the same rate as the overall price level if increase in the price level is fully anticipated. However, most employees do not usually receive automatic pay rises as the overall price level rises, and sometimes, increases in the price level are unanticipated. Therefore, in the short-run, changes in costs lag behind price level changes, but ultimately move with the overall price level.
In the long-run, however, which is a time sufficient for adjustments to be made such that costs and price level change at the same rate, the AS curve is best modelled as a vertical curve. In other words, in the short-run, if the wage rates and other costs adjust fully to changes in prices, and if all prices (both input and output prices) change at the same rate and the level of aggregate output does not change, thus, the long-run AS curve is vertical. The long-run AS curve is shown in Fig 3.3.
Fig 3.3 Fig 3.3 Fig 3.3 Fig 3.3 The Long-Run
Aggregate Supply Curve
ITQ
Question
o What makes Aggregate supply (AS) vertical in the long run?
Feedback
• Aggregate Supply (AS) will be vertical in the long run, if and only if, input prices change at exactly the same rate as output prices.
3.3 3.3 3.3 3.3 Shifts Shifts Shifts Shifts iiiin n n n tttthe Aggregate Demand Curvehe Aggregate Demand Curvehe Aggregate Demand Curvehe Aggregate Demand Curve The aggregate demand curve in Fig 3.1 is based on the assumption that the government policy variables G (government), T (taxes), and Ms

Study Session 3 Aggregate Demand and Aggregate Supply
39
(money supply) are fixed. If any of these variables changes, the aggregate demand curve will shift. In a nutshell, an expansionary policy will make the aggregate demand curve to shift to the right and a contractionary policy will shift the curve to the left. These shifters are discussed below:
3.3.1 3.3.1 3.3.1 3.3.1 Changes Changes Changes Changes iiiin Monetary Authority’s Policy Reaction n Monetary Authority’s Policy Reaction n Monetary Authority’s Policy Reaction n Monetary Authority’s Policy Reaction FunctionFunctionFunctionFunction
These can be in the form of the monetary authority choosing an expansionary or contractionary monetary policy either through changing money supply or through changing the interest rate.
A. Change in money supply: an increase in the quantity of money supply in the economy at any given price level will make interest rate to fall thereby causing planned investment spending to rise. The increased in planned investment spending will result into an increase in output at the given price level. Thus, an increase in the quantity of money supplied at a given price level will shift the aggregate demand curve to the right and vice versa.
Fig 3.4 Fig 3.4 Fig 3.4 Fig 3.4 The Effect of a
Change in Money Supply on the AD Curve
An increase in the money supply shifts the aggregate demand curve to the right from AD0 to AD1, leading to an increase in output at each possible price level, while a decrease in the money supply shifts the curve to the left from AD0 to AD2, leading to a decrease in output at each possible price level.
B. Change in the interest rate: for a given rate of inflation, occasionally, the monetary authority may choose an expansionary or contractionary monetary policy. At a very high inflation which has refused to decline, the authority might embark on a contractionary monetary policy by setting the real interest rate higher than normal at each rate of inflation. When the interest rate is set higher than normal at each given rate of inflation reduces investment and planned expenditure and the short-run equilibrium output at each rate of inflation. This makes the AD curve to shift to the left as shown in figure 3.5a.

40
ECO102ECO102ECO102ECO102 Introductory Economics II
Fig 3.5 Fig 3.5 Fig 3.5 Fig 3.5 The Effect of the
Change of Interest Rate on the AD Curve
Likewise, if the economy is experiencing an unusual severe recession, the monetary authority may change its policies by setting the real interest rate to be lower than normal, at the given rate of inflation. This behaviour will lead to decrease in investment leading to higher levels of planned expenditure and short-run equilibrium output. This causes the AD curve to shift to the right as shown in Fig 3.5b.
3.3.2 Change in Spending3.3.2 Change in Spending3.3.2 Change in Spending3.3.2 Change in Spending
Many factors other than output or real interest rate can affect planned expenditure or spending and can be referred to as exogenous changes in spending. These factors include changes in the level of government purchases, decrease in net taxes, changes in consumer confidence that affect consumption spending, and new technological opportunities may lead firms to increase their planned investment etc. Since these factors increase output at each level of inflation, an exogenous increase in spending will shift the AD curve to the right and vice versa. These are explained below:
i. Change in net taxes: a change in net taxes also shifts the AD curve. A decrease in net taxes results in a rise in consumption; and since consumption is also a part of aggregate expenditure; this makes planned aggregate expenditure to increase, leading to an increase in output. A decrease in net taxes therefore shifts the aggregate demand curve to the right. A direct opposite reasoning applies to an increase in net taxes which shifts the aggregate demand curve to the left.
ii. Change in government purchases: an increase in government purchase at each possible price level, [although some of the increase will be crowded (wiped out) if the money supply is held constant], will directly increase planned aggregate expenditure since government purchases is a component of aggregate demand. This leads to an increase in output. The reverse is the case for a decrease in government purchases.
iii. New technological opportunities: this can also shift the AD curve to the right. This is so because new technological opportunities may make firms to increase their planned investment. The increase in planned investment which is also a component of planned aggregate

iv.
3.4 Shifts in the Aggregate Short3.4 Shifts in the Aggregate Short3.4 Shifts in the Aggregate Short3.4 Shifts in the Aggregate Short3.4.1 3.4.1 3.4.1 3.4.1
Output or GDP does not usually increase over timeto ecoover time) is termed cycle is divided into period of recession (or doom) and expansion (or boom)
Study Session SummaryStudy Session SummaryStudy Session SummaryStudy Session Summary
SummarySummarySummarySummary
In this Study Session, you examined thecurveyou explored
AssessmentAssessmentAssessmentAssessment
AssessmentAssessmentAssessmentAssessment
SAQ 3.1 Explain the concept of aggregate demand curve.
SAQ 3.2 (tests Learning Outcome 3.2Discuss the meaning of aggregate supply curve.
SAQ 3.3 (tests Learning Outcome 3.3What brings about shift in aggregate demand curve?
SAQ 3.4
What factors account for a shift in aggregate supply?
Study Session 3 Aggregate Demand and Aggregate Supply
expenditure will lead to an increase in aggregate expenditure and thus, output will increase. This will shift the AD curve to the right.
iv. Changes in consumers’ confidence: changes confidence for a set of commodities will shift the AD curve. A significant increase in consumers’ confidence in some commodities will lead to an increase in aggregate expenditure and aggregate output. Thus, increase in aggregate output will sthe right. The reverse is the case for a decrease in consumers’ confidence.
3.4 Shifts in the Aggregate Short3.4 Shifts in the Aggregate Short3.4 Shifts in the Aggregate Short3.4 Shifts in the Aggregate Short----Run SupplyRun SupplyRun SupplyRun Supply3.4.1 3.4.1 3.4.1 3.4.1 Economic FluctuationsEconomic FluctuationsEconomic FluctuationsEconomic Fluctuations
Output or GDP does not usually increase over time, to economic fluctuation. The fluctuation (increase or decrease in GDP over time) is termed economic fluctuation or business cycle.cycle is divided into period of recession (or doom) and expansion (or boom).
1. Recession: this is a persistent fall in output growth over a period of three consecutive quarters.
2. Expansion: this is a continuous rise in output.
Study Session SummaryStudy Session SummaryStudy Session SummaryStudy Session Summary
In this Study Session, you examined the nature of aggregate demand curve. You also examined the nature of aggregate supply curveyou explored the short-run and long-run aggregate demand and supply.
SAQ 3.1 (tests Learning Outcome 3.1) Explain the concept of aggregate demand curve.
SAQ 3.2 (tests Learning Outcome 3.2) Discuss the meaning of aggregate supply curve.
SAQ 3.3 (tests Learning Outcome 3.3) What brings about shift in aggregate demand curve?
SAQ 3.4 (tests Learning Outcome 3.4)
What factors account for a shift in aggregate supply?
Aggregate Demand and Aggregate Supply
41
expenditure will lead to an increase in aggregate expenditure and thus, output will increase. This will shift the AD curve to the right.
changes in consumers’ confidence for a set of commodities will shift the AD curve. A significant increase in consumers’ confidence in some commodities will lead to an increase in aggregate expenditure and aggregate output. Thus, increase in aggregate output will shift the AD curve to the right. The reverse is the case for a decrease in consumers’
Run SupplyRun SupplyRun SupplyRun Supply CurveCurveCurveCurve
but falls or rises due nomic fluctuation. The fluctuation (increase or decrease in GDP
economic fluctuation or business cycle. Business cycle is divided into period of recession (or doom) and expansion (or
t growth over a period
this is a continuous rise in output.
nature of aggregate demand nature of aggregate supply curve. Finally,
run aggregate demand and supply.

42
ECO102ECO102ECO102ECO102 Introductory Economics II
BibliographyBibliographyBibliographyBibliography
ReadingReadingReadingReading
https://www.khanacademy.org/economics-finance-domain/macroeconomics/aggregate-supply-demand-topic retrieved August, 2013.
http://www.s-cool.co.uk/a-level/economics/aggregate-demand-and-aggregate-supply/revise-it/aggregate-demand retrieved August, 2013.
http://www.s-cool.co.uk/a-level/economics/aggregate-demand-and-aggregate-supply/revise-it/aggregate-demand retrieved August, 2013.

Study Session 4Study Session 4Study Session 4Study Session 4
Money, Monetary Policy and Economic Money, Monetary Policy and Economic Money, Monetary Policy and Economic Money, Monetary Policy and Economic
IntroductionIntroductionIntroductionIntroduction This Study Session focuses on money and its importance in the economy. Money plays an important role in the economy; even though the role it plays is controversial. On one hand, money allows those who have it to buy goods and services, which imply that thegreater the amount of goods and services he/she can buy. On the other hand, the amount of money does not guarantee the volume of goods and services to be purchased. This is because the total amount of goods and services available fproduced, and not on the amount of money. To this end, it is important to understand the concept of money, why is money necessary in the first place? How does money evolve and what are monetary policies and hcan the usage of each one affect economic activity.
Learning OutcomesLearning OutcomesLearning OutcomesLearning Outcomes
LearningLearningLearningLearning OutcomesOutcomesOutcomesOutcomes
When you have studied this session, you should be able to: 4.1 4.2 4.3
4.1 The Meaning4.1 The Meaning4.1 The Meaning4.1 The Meaning
4.1.1 Definition of Money4.1.1 Definition of Money4.1.1 Definition of Money4.1.1 Definition of Money
Moneyof exchange in an economy. When we say a medium of exchange, we are referring to anything thacommunity, a society or specifically a country, in exchange for goods and services. This definition incidentally, is the primary function of money.
In a loose language, money can be defined as anything/object thaccepted either by law, constitution or decree, and generally recognized by a sovereign country as a means through which goods and services can be exchanged.
Study Session 4 Money, Monetary Policy and Economic Activity
Study Session 4Study Session 4Study Session 4Study Session 4
Money, Monetary Policy and Economic Money, Monetary Policy and Economic Money, Monetary Policy and Economic Money, Monetary Policy and Economic ActivityActivityActivityActivity
This Study Session focuses on money and its importance in the economy. Money plays an important role in the economy; even though the role it plays is controversial. On one hand, money allows those who have it to buy goods and services, which imply that the more money one has, the greater the amount of goods and services he/she can buy. On the other hand, the amount of money does not guarantee the volume of goods and services to be purchased. This is because the total amount of goods and services available for everyone to buy depends on the total output produced, and not on the amount of money. To this end, it is important to understand the concept of money, why is money necessary in the first place? How does money evolve and what are monetary policies and hcan the usage of each one affect economic activity.
Learning OutcomesLearning OutcomesLearning OutcomesLearning Outcomes
When you have studied this session, you should be able to: discuss the concept of money. highlight the functions of money in the economy. outline how money is supplied into the economy.
4.1 The Meaning4.1 The Meaning4.1 The Meaning4.1 The Meaning of Moneyof Moneyof Moneyof Money
4.1.1 Definition of Money4.1.1 Definition of Money4.1.1 Definition of Money4.1.1 Definition of Money
Money can be defined as any item that is generally accepted as medium of exchange in an economy. When we say a medium of exchange, we are referring to anything that will be widely or generally accepted in a community, a society or specifically a country, in exchange for goods and services. This definition incidentally, is the primary function of money.
In a loose language, money can be defined as anything/object thaccepted either by law, constitution or decree, and generally recognized by a sovereign country as a means through which goods and services can be exchanged.
Money, Monetary Policy and Economic Activity
43
Money, Monetary Policy and Economic Money, Monetary Policy and Economic Money, Monetary Policy and Economic Money, Monetary Policy and Economic
This Study Session focuses on money and its importance in the economy. Money plays an important role in the economy; even though the role it plays is controversial. On one hand, money allows those who have it to
more money one has, the greater the amount of goods and services he/she can buy. On the other hand, the amount of money does not guarantee the volume of goods and services to be purchased. This is because the total amount of goods and
or everyone to buy depends on the total output produced, and not on the amount of money. To this end, it is important to understand the concept of money, why is money necessary in the first place? How does money evolve and what are monetary policies and how
When you have studied this session, you should be able to:
unctions of money in the economy. .
can be defined as any item that is generally accepted as medium of exchange in an economy. When we say a medium of exchange, we are
t will be widely or generally accepted in a community, a society or specifically a country, in exchange for goods and services. This definition incidentally, is the primary function of money.
In a loose language, money can be defined as anything/object that is accepted either by law, constitution or decree, and generally recognized by a sovereign country as a means through which goods and services can

44
ECO102ECO102ECO102ECO102 Introductory Economics II
4.2 4.2 4.2 4.2 Functions of MoneyFunctions of MoneyFunctions of MoneyFunctions of Money Money performs many functions, but the most important ones are listed below:
• Medium of exchange
• Store of value
• Unit of payment
4.2.1 4.2.1 4.2.1 4.2.1 Medium of ExchangeMedium of ExchangeMedium of ExchangeMedium of Exchange
Consider a country where there were three people but no money. How would each person get what he needs? Perhaps he will have to possess what one of the rest needs, and at the same time that person will posses what he needs. This was exactly the means of exchange in the olden days. In such a system it is clear that exchange becomes cumbersome as population increases and this may even lead to frustration! In economic parlance, this exchange system implies that each transaction requires a double coincidence of wants; anyone who specialized in producing one commodity will have to spend a great deal of time searching for satisfactory transactions. This was a serious problem.
The use of money as a medium of exchange lessens this problem. In an economy where money serves as a means of exchange (payment), sellers can sell/exchange their output for money, and subsequently use the money to buy whatever they wish from others. Also, buyers can purchase/exchange what they want and enjoy the worth of their money. The implication of monetised economy is that it requires exchange of goods and services for money and of money for goods, but not goods for goods as in the case of barter economy.
UESUESUESUES ITQ
Question
o What was the main problem associated with barter system?
Feedback
• Barter system is mostly associated with the problem of double coincidence of wants.
4.2.2 4.2.2 4.2.2 4.2.2 Store of ValueStore of ValueStore of ValueStore of Value
Assuming that there is no money, it means payment has to be made through barter system. When paying with simple commodities, the value of the good one has received may change without any external influence. In the money economy, the value of money will not change unless prices change. Therefore, money, apart from being a means of exchange, is also a store of value. It guarantees that other things being equal; the value of what is received now will be the same until the time of exchanging it for a desirable good or service.

Study Session 4 Money, Monetary Policy and Economic Activity
45
4.2.3 4.2.3 4.2.3 4.2.3 Unit of Account/Unit of paymentUnit of Account/Unit of paymentUnit of Account/Unit of paymentUnit of Account/Unit of payment
The use of money as unit of payment means that it is a means of counting. When we look at a shoe and a flower we can say that six flowers can be exchanged for one shoe. When there is another commodity, say, a toothbrush, we can count all goods in terms of one of the goods, say flowers. Hence, three toothbrushes can be exchanged for one shoe. You can imagine how difficult it all becomes when we have many goods. Using money as a numeraire (means of counting) provides a way of circumventing such problems. It means that we measure all goods in terms of money units. By implication, we assume that money in itself is not a good like, say flowers, which are desirable in themselves. In a nutshell, money as a unit of account allows us to compare the prices of different goods, and attach monetary value to the goods.
4.3 4.3 4.3 4.3 Money and Money and Money and Money and tttthe Banking Systemhe Banking Systemhe Banking Systemhe Banking System
4.3.1 The Banking System4.3.1 The Banking System4.3.1 The Banking System4.3.1 The Banking System
The banking system consists of commercial banks, merchant banks, development banks, and community banks. However, commercial banks form the largest component of banking system in any economy, and there are 25 of them in Nigeria. Commercial banks are business organisations owned by private individuals. Commercial banks accept deposit from individuals, businesses and government and use those deposits to make loans. That is, commercial banks are financial intermediaries, by extending credit to borrowers with the fund raised from savers.
Banks on one hand help savers by eliminating their need to gather information about potential borrowers and by directing their savings toward high return and more productive investments. On the other hand, they help borrowers by providing access to credit that might otherwise not be available.
Another important function that the banks perform is making payments by depositors easier. Most banks deposits allow the holder to write a cheque against them or draw on them using withdrawal forms or ATM cards.
ITQ
Question
o How do commercial banks perform the role of financial intermediaries?
Feedback
• Commercial banks perform the role of financial intermediaries by allocating money from the surplus consumption units to the deficit consumption unit.

46
ECO102ECO102ECO102ECO102 Introductory Economics
4.3.2 4.3.2 4.3.2 4.3.2
In any economymonetary authority. The Central Bank regulates the activities of other banks and financial institutions in the economy. Central Bank is responsible for supplying money into the economy. The money supeffort of the Central Bank is usually complemented by creation of money by commercial banks.
Banks and Creation of MoneyBanks and Creation of MoneyBanks and Creation of MoneyBanks and Creation of Money
If the economy’s supply of money consists of entirely of currency, then money supply is the value of currency created and circulatgovernment. However, cheques give the banks permission to transfer cash from the account of the person paying by cheque to the account of the person to whom the cheque is issued. With a system of payments based on checks, the cash never leave theflow from one bank to another as a depositor of one bank makes a payment to a depositor in another bank.
The assets of commercial banking system are the cash in the vaults of all individual banks, the habitation are the deposCash or similar assets held by banks are called bank reserves. If all banks reserve of 100% of bank their deposits this is called 100 percent reserve banking. Banking reserves are not counted as part of the money supply, bank dcounted as part of money supply. It is possible that not all bank deposits are treated as bank reserve. That is, it is only a proportion of the deposit that makes up bank reserve. This is callecalculated thus
From the above, bank deposits can be solved for. To do so, cross multiply the above equation and divide through by reserveyields the followin
Let deposits be 1,000,000, while reserve0.10 (10% of total deposit). Then, bank deposit can be calculated thus:
TipTipTipTip
It is clear from the above that the higher the reservesmaller the bank deposit. Conversely, the smaller the reserveratio the larger the bank deposits.
ry Economics II
4.3.2 4.3.2 4.3.2 4.3.2 Money Supply and ControlMoney Supply and ControlMoney Supply and ControlMoney Supply and Control
In any economy, the Central Bank is the apex bank and it represents the monetary authority. The Central Bank regulates the activities of other banks and financial institutions in the economy. Central Bank is responsible for supplying money into the economy. The money supeffort of the Central Bank is usually complemented by creation of money by commercial banks.
Banks and Creation of MoneyBanks and Creation of MoneyBanks and Creation of MoneyBanks and Creation of Money
If the economy’s supply of money consists of entirely of currency, then money supply is the value of currency created and circulatgovernment. However, cheques give the banks permission to transfer cash from the account of the person paying by cheque to the account of the person to whom the cheque is issued. With a system of payments based on checks, the cash never leave the banking system, although they flow from one bank to another as a depositor of one bank makes a payment to a depositor in another bank.
The assets of commercial banking system are the cash in the vaults of all individual banks, the habitation are the deposits of the banks’ customers. Cash or similar assets held by banks are called bank reserves. If all banks reserve of 100% of bank their deposits this is called 100 percent reserve banking. Banking reserves are not counted as part of the money supply, bank deposit balances, which can be used in making transactions, are counted as part of money supply. It is possible that not all bank deposits are treated as bank reserve. That is, it is only a proportion of the deposit that makes up bank reserve. This is called reserve-deposit ratio and it is calculated thus
Reserve I depositratio �Bankreserve
Deposits
From the above, bank deposits can be solved for. To do so, cross multiply the above equation and divide through by reserveyields the following
Bankdeposits �Bankreserves
Desiredreserve I Deposit
Let deposits be 1,000,000, while reserve-deposit ratio desired by banks be 0.10 (10% of total deposit). Then, bank deposit can be calculated thus:
Bankdeposit �1,000,000
0.1� 10,000
It is clear from the above that the higher the reservesmaller the bank deposit. Conversely, the smaller the reserveratio the larger the bank deposits.
the Central Bank is the apex bank and it represents the monetary authority. The Central Bank regulates the activities of other banks and financial institutions in the economy. Central Bank is responsible for supplying money into the economy. The money supply effort of the Central Bank is usually complemented by creation of money
If the economy’s supply of money consists of entirely of currency, then money supply is the value of currency created and circulated by the government. However, cheques give the banks permission to transfer cash from the account of the person paying by cheque to the account of the person to whom the cheque is issued. With a system of payments
banking system, although they flow from one bank to another as a depositor of one bank makes a
The assets of commercial banking system are the cash in the vaults of all its of the banks’ customers.
Cash or similar assets held by banks are called bank reserves. If all banks reserve of 100% of bank their deposits this is called 100 percent reserve banking. Banking reserves are not counted as part of the money supply,
eposit balances, which can be used in making transactions, are counted as part of money supply. It is possible that not all bank deposits are treated as bank reserve. That is, it is only a proportion of the deposit
deposit ratio and it is
reserve
Deposits
From the above, bank deposits can be solved for. To do so, cross multiply the above equation and divide through by reserve-deposit ratio. This
Depositratio
deposit ratio desired by banks be 0.10 (10% of total deposit). Then, bank deposit can be calculated thus:
000,000
It is clear from the above that the higher the reserve-deposit ratio, the smaller the bank deposit. Conversely, the smaller the reserve-deposit
Study Session 4 Money, Monetary Policy and Economic Activity
47
ITQ
Question
o What determines the extent to which commercial banks can create money within an economy?
Feedback
• The extent to which commercial banks can create money in an economy depends on the value of reserve-deposit ratio.
4.3.3 4.3.3 4.3.3 4.3.3 Money SMoney SMoney SMoney Supply with Currency and Depositupply with Currency and Depositupply with Currency and Depositupply with Currency and Deposit
In most cases, citizens keep part of their money hidings in form of bank accounts and hold the rest in the form of cash. Let us assume that 500,000 is held as cash while 500,000 is deposited. Then bank deposit is now
�500,000
0.1= 5,000,000
The money supply is the sum of currency in the hands of the public (currency in circulation) and bank deposits. Since bank deposit is 5,000,000 and currency in circulations 5,000,000, money supply is
5,000,000 + 500,000 = 5,500,000
Hence, the general relationship that captures money supply with currency and deposits can be conceptualized. First we can write out the fact that the money supply equals currency plus bank deposits.
Moneysupply = currencyincirculation + Bankdeposits
Moneysupply =Currencyincirculation + Bankreserves
Desired − Depositsratio
4.3.4 4.3.4 4.3.4 4.3.4 Monetary PolicyMonetary PolicyMonetary PolicyMonetary Policy and its Instruments and its Instruments and its Instruments and its Instruments
The apex bank of a country has the primary responsibility of making monetary policy. Monetary policy involves decisions about the appropriate size of the nation’s money supply. In the case of Nigeria, central Bank of Nigeria (CBN) is the only bank that makes monetary policy.
There are three monetary policy instruments that can be used to control money supply. These are reserve requirements, discount ratio and open market operations (OMO).
Reserve RequirementsReserve RequirementsReserve RequirementsReserve Requirements
Recall that the economy’s money supply depends on three factors: the amount of currency held by the public, the supply of bank reserves and the reserve-deposit ratio. Also, note that increase in reserve-deposit ratio reduces bank deposit and hence, money supply. A higher reserve-deposit ratio implies that banks lend out a smaller share of their deposits in a particular period, thereby limiting the overall expansion of loans and deposits.

48
ECO102ECO102ECO102ECO102 Introductory Economics II
Commercial banks are free to set the reserve-deposit ratio they desire to maintain. However, CBN has the statutory authority to set minimum values of the reserve-deposit ratio for commercial banks. Reserve requirement is the minimum values of the ratio of bank reserves to bank deposits that commercial banks are allowed to maintain. This reserves requirement is set by the CBN.
Discount WindowDiscount WindowDiscount WindowDiscount Window
The second instrument used by the central bank to control reserves and the money supply is the use of discount window. In some cases, individual commercial banks can be short of reserves from the central bank. Lending of reserves by the Central Bank to commercial banks is referred to as discount window lending. When the Central Bank lends out to any commercial banks, it charges interest. The interest rate charged is called the discount rate. When the central bank lends out from it reserves to commercial banks reserve, this will ultimately increase bank deposits and hence money supply.
Central Bank can control money supply by charging the discount rate. For instance, if the central bank intends to increase money supply, it can reduce discount rate so that commercial banks find it easy to borrow money from actual bank reserve. Conversely, Central Bank decreases money supply by raising discount rate.
Note that this instrument is also an indirect way of controlling money supply in the sense that a change in discount rate will lead to a change in bank deposit and hence, money supply. That is:
Discount rate bank deposit money supply
Open Market Operation (OMO)Open Market Operation (OMO)Open Market Operation (OMO)Open Market Operation (OMO)
Open market operation (OMO) is an important monetary instrument used by the central bank to control money supply. Assuming that the Central Bank wants to raise money supply, using OMO, the process goes thus; the Central Bank buys financial assets, that is, government bond from the public. To simplify things, let us assume that the central bank pays for the purchases with newly printed money. If the public who own the financial instrument already holds the currency, it will deposit the cash they receive in commercial banks. This increases the reserves of commercial banks by the amount equal to the value of the bonds purchased by the Central Bank. The increase in bank reserves will lead in turn, through the process of lending and redeposit discussed earlier to an expansion of bank deposits and the money supply.
Conversely, if the Central Bank wants to reduce money supply, it will sell financial assets to the public, receives money equal to the value of the bond sold. This payment will be made by withdrawing money from commercial banks. This will lead to decrease in money supply. The Central Banks’ sale (purchase) of government bonds from the public, with the result that bank reserves and the money supply are decreased (increased) is called an Open Market Operations. The sale of instrument is called Open Market Sale, while the purchase of instrument is called Open Market Purchase. It turns out that OMO appears to be the

commercial and flexible tool that the Central Bank has for affecting the money supply.
ITQ
Question
Feedback
Study Session SummaryStudy Session SummaryStudy Session SummaryStudy Session Summary
SummarySummarySummarySummary
In the course of this Study Session, you examined the concept and functions of money. You also learnt how economy
Study Session 4 Money, Monetary Policy and Economic Activity
commercial and flexible tool that the Central Bank has for affecting the money supply.
ITQ
Question
o What are the commonest monetary policy the Central bank to regulate the volume of money in an economy?
Feedback
• The three commonest policy instruments employed by the apex bank to regulate the amount of money in circulation are:i. Open market operation (OMO)
ii. Discount rate, and iii. Reserve ratio or Liquidity ratio
Study Session SummaryStudy Session SummaryStudy Session SummaryStudy Session Summary
In the course of this Study Session, you examined the concept and functions of money. You also learnt how money is suppeconomy.
Money, Monetary Policy and Economic Activity
49
commercial and flexible tool that the Central Bank has for affecting the
What are the commonest monetary policy instruments used by the Central bank to regulate the volume of money in an
The three commonest policy instruments employed by the apex bank to regulate the amount of money in circulation are:
In the course of this Study Session, you examined the concept and money is supplied into the

50
ECO102ECO102ECO102ECO102 Introductory Economics
AssessmentAssessmentAssessmentAssessment
AssessmentAssessmentAssessmentAssessment
SAQ 4.1 (Define the term “money”.
SAQ 4.2 (What are the functions performed by money in an economy?
SAQ 4.3 (
Discuss the processes by which money is made available in an economy
BibliographyBibliographyBibliographyBibliography
ReadingReadingReadingReading
http://economicsandliberty.wordpress.com/whatAugust, 2013.
http://www.preservearticles.com/201104115268/4money.html
Introductory Economics II
SAQ 4.1 (tests Learning Outcome 4.1) Define the term “money”.
SAQ 4.2 (tests Learning Outcome 4.2) What are the functions performed by money in an economy?
SAQ 4.3 (tests Learning Outcome 4.3)
Discuss the processes by which money is made available in an economy
http://economicsandliberty.wordpress.com/what-is-money/August, 2013.
http://www.preservearticles.com/201104115268/4-essentialmoney.html retrieved August, 2013.
What are the functions performed by money in an economy?
Discuss the processes by which money is made available in an economy
money/ retrieved
essential-functions-of-

Study Session 5Study Session 5Study Session 5Study Session 5
Government and the EconomyGovernment and the EconomyGovernment and the EconomyGovernment and the Economy
IntroductionIntroductionIntroductionIntroduction Government affects economic activities through its spending and revenue decisions. government spending and the reason for such spending. We will assume that government is not a producing agent, and thus, it is important to examine how government finance its spending outlay. We wilthe various sources of government revenue. It will also be important to examine what happens when government spending is higher than government revenue. The Study Session will end by looking at various fiscal policy instruments that government caactivity.
Learning OutcomesLearning OutcomesLearning OutcomesLearning Outcomes
LearningLearningLearningLearning OutcomesOutcomesOutcomesOutcomes
When you have studied this session, you should be able to: 5.1 5.2 5.3 5.4
5.1 5.1 5.1 5.1 Government SpendingGovernment SpendingGovernment SpendingGovernment SpendingGovernment spending is the spending activities carried out by the government of a country. There are essential services that government provides. These include national defence, provision of education, health, public roads, policing, internal and external provision of social and so on. These set of government spending can be categorized into two viz:
5.1.1 5.1.1 5.1.1 5.1.1 and Servicesand Servicesand Servicesand Services
This takes the formstreet light, public roads, and purchases of material for public office use, purchase of labour services and so on.
Study Session 5 Government and the Economy
Study Session 5Study Session 5Study Session 5Study Session 5
Government and the EconomyGovernment and the EconomyGovernment and the EconomyGovernment and the Economy
Government affects economic activities through its spending and revenue decisions. In this Study Session, we will examine various classes of government spending and the reason for such spending. We will assume that government is not a producing agent, and thus, it is important to examine how government finance its spending outlay. We wilthe various sources of government revenue. It will also be important to examine what happens when government spending is higher than government revenue. The Study Session will end by looking at various fiscal policy instruments that government can use to control economic activity.
Learning OutcomesLearning OutcomesLearning OutcomesLearning Outcomes
When you have studied this session, you should be able to: identify the different forms of government spending. discuss how government revenues are generated. explain the term “budget” describe how government revenue and expenditure activities affect aggregate demand.
Government SpendingGovernment SpendingGovernment SpendingGovernment Spending Government spending is the spending activities carried out by the government of a country. There are essential services that government provides. These include national defence, provision of education, health, public roads, policing, internal and external securities, and possibly provision of social security’s – unemployment benefits, pension schemes and so on. These set of government spending can be categorized into two
5.1.1 5.1.1 5.1.1 5.1.1 Government Government Government Government Consumption Consumption Consumption Consumption Expenditure on Goods Expenditure on Goods Expenditure on Goods Expenditure on Goods and Servicesand Servicesand Servicesand Services
This takes the form of the expenditure on public health, public education, street light, public roads, and purchases of material for public office use, purchase of labour services and so on.
Government and the Economy
51
Government and the EconomyGovernment and the EconomyGovernment and the EconomyGovernment and the Economy
Government affects economic activities through its spending and revenue In this Study Session, we will examine various classes of
government spending and the reason for such spending. We will assume that government is not a producing agent, and thus, it is important to examine how government finance its spending outlay. We will examine the various sources of government revenue. It will also be important to examine what happens when government spending is higher than government revenue. The Study Session will end by looking at various
n use to control economic
When you have studied this session, you should be able to: nt forms of government spending.
vernment revenues are generated.
how government revenue and expenditure activities affect
Government spending is the spending activities carried out by the government of a country. There are essential services that government provides. These include national defence, provision of education, health,
securities, and possibly unemployment benefits, pension schemes
and so on. These set of government spending can be categorized into two
Expenditure on Goods Expenditure on Goods Expenditure on Goods Expenditure on Goods
of the expenditure on public health, public education, street light, public roads, and purchases of material for public office use,

52
ECO102ECO102ECO102ECO102 Introductory Economics II
5.1.2 5.1.2 5.1.2 5.1.2 Transfer PaymentTransfer PaymentTransfer PaymentTransfer Payment
Transfer payments are government expenditure that is not made in return for currently produced goods and services. If government makes a payment to old-age pensioners, or pays pensioners’ gratuity, the government is not purchasing any currently produced goods or services from the retired people. The payment itself adds neither to employment nor to total output. Other examples of transfer include unemployment benefit, student grants, and interest paid on the national debt.
Government spending is spelt out in the budget, and so it is assumed to be predetermined. This means that government expenditure/spending is autonomous.
ITQ
Question
o Government expenditures can be categorised into how many groups?
Feedback
• Government expenditure can be categorized into three main groups, these are: i. Current expenditure (Government Consumption Spending
Expenditure) ii. Capital expenditure, and iii. Transfer payments
5.2 5.2 5.2 5.2 Government RevenueGovernment RevenueGovernment RevenueGovernment Revenue How does the government finance its predetermined expenditure? Of course from the revenue it can generate. The sources of government revenue are:
a. Sales of government bonds or treasury bills.
b. Borrowing from the rest of the world.
c. Taxes.
Government can source for fund through the sale of government securities called Treasury Bills (T-bill). Government sells the treasury bills to the private individuals who have more than enough money to hold. Thus, they buy government security and pay with cash.
Government can also decide to raise fund by borrowing from international institutions like African Development Bank (AfDB), International Monetary Fund (IMF), World Bank (WB) and so on.
Finally, government can generate revenue by imposing taxes. Taxes can be indirect or direct. Indirect taxes are taxes that do not depend on level of income. Such taxes include tariff, poll tax, sales tax and value added tax,. This type of tax can also be called lump-sum tax.
Direct taxes are taxes levied on the level of income. There are three of such. These are proportional tax, progressive tax and regressive tax..
Study Session 5 Government and the Economy
53
Proportional tax is a flat rate of tax which is paid by every worker. It is a share of one’s income that must be set aside as tax. The higher one’s income, the greater the tax paid. We can write proportional tax as follows:
W(K) � ��
where the LHS implicitly describes tax as a function of income. The RHS say that tax (t) takes a proportion of income Y. Thus, increase in income will increase the amount of T(Y).
Progressive tax on the other hand is a system where the rate of tax itself depends on the income earned. In this case, rate of tax is no more the same across income category. In fact, the higher the income, the higher the tax rate. Discussion about the appropriate tax to adopt is beyond the scope of this study. However, it is useful to have this basic understanding of what distinguishes them.
In terms of modelling the economy, knowing the position of the tax function in the demand for consumption should allow a straight forward incorporation of any form of tax functions. In the case of Nigeria, it is reasonable to incorporate both lump – sum tax and proportional tax in the tax function because government generates revenue both from lump – sum tax and proportional tax.
ITQ
Question
o What are the sources of government revenue?
Feedback
• Sources of government revenue include: i. Taxation ii. Borrowing, and
iii. Selling of bonds and bills
5.3 5.3 5.3 5.3 The Budget BalanceThe Budget BalanceThe Budget BalanceThe Budget Balance Budget is a document that explicitly describe the spending decision of the government vis-à-vis the projected revenue and the source. Budget balance is the difference between total government expenditure, that is, taxes minus government expenditure. If government expenditure is denoted by G and government revenue by T, then budget balance can be written as:
W � �orW– � = 0
In most cases, revenue may be greater than expenditure, in which case the government is running budget surplus. If government owes some debts, it can reduce the debt by the surplus. In another case, expenditure may be greater than revenue. This implies that government intends to spend more than it can generate revenue. The case where the government expenditure is greater than revenue is a case of budget deficit. This implies that the

54
ECO102ECO102ECO102ECO102 Introductory Economics
government must add to the national debt, since it must borrow to cover its deficit (with sale of government bonds discussed earlier)
5.3.1 5.3.1 5.3.1 5.3.1
Government expenditure is treated athat government has decided on how much it wishes to spend and hold to these plans whatever the level of income (GDP). Tax rate, in some sense, is also autonomous because government sets its tax rates and does not vary thwith given tax rates, the tax revenue will rise. The other part of tax function is purely exogenous. The Table 1 below indicates that government ran budget deficit in the first two rounds of which it began to run budget surplus.
Table 5.1 Table 5.1 Table 5.1 Table 5.1 Tax Revenue,
Government Expenditure and Budget Balance
GDP (
2000
4000
9500
10000
15000
20000
ReflectionReflectionReflectionReflection
How does government expenditure and tax revenue affect economic activity?
ITQ
Question
Feedback
5.4 5.4 5.4 5.4 Fiscal Policy and Aggregate DemandFiscal Policy and Aggregate DemandFiscal Policy and Aggregate DemandFiscal Policy and Aggregate DemandKeynesian economic model opines that recession occurs as a result of low spending brought about by low income. Hence, to fight caused by low demand, government should find ways of reducing or even eliminating this recession. Policies that are used to affect aggregate demand with the objective of eliminating output gaps are called stabilization policies.
Introductory Economics II
government must add to the national debt, since it must borrow to cover its deficit (with sale of government bonds discussed earlier)
5.3.1 5.3.1 5.3.1 5.3.1 Revenue and Expenditure functionsRevenue and Expenditure functionsRevenue and Expenditure functionsRevenue and Expenditure functions
Government expenditure is treated as autonomous because it is assumed that government has decided on how much it wishes to spend and hold to these plans whatever the level of income (GDP). Tax rate, in some sense, is also autonomous because government sets its tax rates and does not vary them as GDP varies. Thus, tax revenue is endogenous: as GDP rises, with given tax rates, the tax revenue will rise. The other part of tax function is purely exogenous. The Table 1 below indicates that government ran budget deficit in the first two rounds of which it began to run budget surplus.
GDP (Y) Government
Expenditure
Net Taxes
T = 10 + 0.1 Y
2000 500 210
4000 500 410
9500 500 960
10000 500 1010
15000 500 1510
20000 500 2010
How does government expenditure and tax revenue affect economic activity?
ITQ
Question
o When does government runs a balanced budget?
Feedback
• A balanced budget implies a situation when government proposed expenditure is equal to its expected revenue.
Fiscal Policy and Aggregate DemandFiscal Policy and Aggregate DemandFiscal Policy and Aggregate DemandFiscal Policy and Aggregate Demand Keynesian economic model opines that recession occurs as a result of low spending brought about by low income. Hence, to fight caused by low demand, government should find ways of reducing or even eliminating this recession. Policies that are used to affect aggregate demand with the objective of eliminating output gaps are called stabilization policies.
government must add to the national debt, since it must borrow to cover its deficit (with sale of government bonds discussed earlier)
Revenue and Expenditure functionsRevenue and Expenditure functionsRevenue and Expenditure functionsRevenue and Expenditure functions
s autonomous because it is assumed that government has decided on how much it wishes to spend and hold to these plans whatever the level of income (GDP). Tax rate, in some sense, is also autonomous because government sets its tax rates and does not
em as GDP varies. Thus, tax revenue is endogenous: as GDP rises, with given tax rates, the tax revenue will rise. The other part of tax function is purely exogenous. The Table 1 below indicates that government ran budget deficit in the first two rounds of income after
Budget Balance
(T-G)
-200
-90
460
510
1010
1510
How does government expenditure and tax revenue affect economic
When does government runs a balanced budget?
situation when government proposed expenditure is equal to its expected revenue.
Keynesian economic model opines that recession occurs as a result of low spending brought about by low income. Hence, to fight recession that is caused by low demand, government should find ways of reducing or even eliminating this recession. Policies that are used to affect aggregate demand with the objective of eliminating output gaps are called
Study Session 5 Government and the Economy
55
There are two types of stabilization policies: monetary policies and fiscal policies. Monetary policy has been dealt with earlier (Study Sessions Three and Four). Fiscal policies refer to decisions about the government’s budget. The fiscal policy instruments used by the government to stabilize the economy are government expenditure policy and government tax policy.
Keynes argued that changes in government spending were probably the most effective instrument for offsetting recession. According to him, government purchases of goods and services are a component of aggregate demand, so aggregate demand is directly affected by changes in government purchases. In a case of output gap (recession or depression) where there is too much AD or too little AD, the government can be helpful in reducing or filling the gap. For simplicity, let us assume that aggregate demand (AD) function is given by
"� � L + � + �
Where C, I, G are planned private consumption, planned private investment and planned government expenditure. Let G = 300, T = 250. Also let C = 620 + 0.8Yd, I = 250, where Yd is after-tax disposable income. This implies that Yd = (Y-T). Substituting all these information into AD function we have
"� � 620 + 0.8K[250 + 300
But K[ = K − W
Therefore, AD = [620 + 0.8 (Y – 250)] + 220 + 300
= 620 + 0.8Y – 200 + 220 + 300
AD = 940+ 0.8Y
This is what is called Aggregate Demand function.
According to the short-run equilibrium output, AD = Y
Thus we have Y = 940 + 0.8Y
Y – 0.8Y = 940
Y (1- 0.8) = 940
0.2Y = 940
Y = 940/0.2 = 4700
What this implies is that for the economy to be at equilibrium, planned aggregate expenditure must equal to aggregate output/income. The equilibrium output can be graphically plotted as follows:

56
ECO102ECO102ECO102ECO102 Introductory Economics II
Fig 5.1 Fig 5.1 Fig 5.1 Fig 5.1
To appreciate the importance of government spending, assuming that private consumption dropped by 10 units. So the new specification becomes
"� � L + � + �
I = 220, T = 250, C = 610 + 0.8, G = 300
Substitute for each of the four components into the AD function AD = 610 + [0.8 (Y – 250)] + 220 + 300
= 610 + 0.8Y – 200 + 220 + 300
= 830 + 0.8Y
since AD = Y, then we have
Y = 830 + 0.8Y
Simplifying this, we have Y = 830/0.2 = 4150
Fig 5.2 Fig 5.2 Fig 5.2 Fig 5.2
Due to consumer willingness to reduce consumption by 10 units, equilibrium AD fell by 550. We conclude that the fall in consumer spending has led to a recession. This is shown graphically above. Now let government intervene by increasing its expenditure by 10 units, so that G = 310.
As before the first step is to write the relationship between aggregate demand AD and output Y.
"� � L + � + �
trailing the steps given earlier,

Study Session 5 Government and the Economy
57
AD = 610 + (0.8 (Y – 250)) + 220 + 310
= 940 + 0.8Y
since AD = Y
then Y = 4700
This value is the same for the assumed potential output. Thus, in this simple example, the increase in government purchases eliminates the necessary output gap. This simple example shows that through changes in government expenditure, which is one of the fiscal policy instruments of government, output gap can be affected.
Through its policy, government also determines the level of tax collections and transfer payments. From the Keynesian’s point of view, changes in the level of taxes or transfer can be used to affect aggregate demand and thus to reduce or eliminate output gap. Meanwhile, the effect of tax policy on aggregate demand is indirect. Changes in taxes affect aggregate demand by first of all changing private disposable income. For instance, a reduction in tax or an increase in transfer payments will increase disposable income. What this turns out to mean is that more money is available for consumption by the private sector. It thus appears that changes in taxes and transfer will affect aggregate output to the extent that consumers/private sector change the level of spending.
Let us continue to use our earlier example to demonstrate how tax cut or increase in transfer payment can be used to reduce or eliminate output gap. Assume that government decides not to increase expenditure to close the gap created by the reduction in private consumption of 10 units. Suppose that fiscal policymakers decide to restore potential AD by changing the level of tax collections. Note that reducing tax by 10 units cannot fully eliminate the gap as it does for government expenditure. This is so because if tax is reduced by 10 units, only 8 units will be spent, since marginal propensity to consume (MPC) is 0.8. So consumption spending increases by only 0.8 times the amount of the tax cut. To eliminate the output gap completely, tax has to be reduced by 12.5 units so that the new tax revenue is 237.5. How? To get the value, we divide 10 (the unit by which aggregate demand is reduced) by 0.8 (the MPC). The answer you get (12.5) is the amount by which tax must be reduced. We can then write out our new consumption function as follows
C = 610 + 0.8 (Y – 237.5)
Using the values for I and G, AD function becomes
AD = [610 + 0.8 (Y – 237.5)] + 220 + 300
AD = 940 + 0.8Y
At equilibrium, AD =Y
Hence Y = 960 + 0.8Y
Simplifying, Y = 4700
which give the potential output, we therefore conclude that a tax cut of 12.5 will eliminate the necessary gap and restore full employment in this example.
58
ECO102ECO102ECO102ECO102 Introductory Economics II
Thus far, we have demonstrated that fiscal policy affects economic activity. When the economy is in recession, government fiscal policy can be used to help the economy out of recession. Conversely, if the economy is perceived to be very strong, when aggregate demand appears to be greater than full employment output, fiscal policy can be used to reverse the situation.
However, it must be noted that practically, this does not produce immediate result as demonstrated in our example. One significant reason for this is that in true life situation, changes in fiscal policy go through lengthy legislative process. What must be understood here is that fiscal policymakers can use any of the instruments discussed to change economic activities.
ITQ
Question
o What are the major tools of stabilization policy?
Feedback
• The major tools of stabilization policy are: - the monetary policy and - fiscal policy.

Study Session SummaryStudy Session SummaryStudy Session SummaryStudy Session Summary
SummarySummarySummarySummary
In this short Study Session, spending. We also discussedand how government revenue and expenditure activities affect aggregate demand
AssessmentAssessmentAssessmentAssessment
AssessmentAssessmentAssessmentAssessment
SAQ 5
Discuss the various forms of government spending
SAQ 5
What are
SAQ 5
How will you e
SAQ 5.3 (Tests Learning Outcome In what way do government revenue and expenditure activitiesaggregate demand
BibliographyBibliographyBibliographyBibliography
ReadingReadingReadingReading
http://www.wisegeek.org/whatAugust, 2013.
http://www.medwelljournals.com/fulltAugust, 2013.
http://www.revenuewatch.org/countries/africa/nigeria/overviewAugust, 2013
Study Session 5 Government an
Study Session SummaryStudy Session SummaryStudy Session SummaryStudy Session Summary
In this short Study Session, we highlighted different forms of government spending. We also discussed how government revenues are generated,
how government revenue and expenditure activities affect aggregate demand.
SAQ 5.1 (tests Learning Outcome 5.1)
Discuss the various forms of government spending.
SAQ 5.2 (Tests Learning Outcome 5.2)
What are the sources of government revenue?
SAQ 5.3 (Tests Learning Outcome 5.3)
How will you explain the term “budget”?
AQ 5.3 (Tests Learning Outcome 5.4) In what way do government revenue and expenditure activitiesaggregate demand?
http://www.wisegeek.org/what-is-government-revenue.htmAugust, 2013.
http://www.medwelljournals.com/fulltext/?doi=ibm.2009.54.60August, 2013.
http://www.revenuewatch.org/countries/africa/nigeria/overviewAugust, 2013
Government and the Economy
59
nt forms of government vernment revenues are generated,
how government revenue and expenditure activities affect aggregate
In what way do government revenue and expenditure activities affect
revenue.htm retrieved
ext/?doi=ibm.2009.54.60 retrieved
http://www.revenuewatch.org/countries/africa/nigeria/overview retrieved

60
ECO102ECO102ECO102ECO102 Introductory Economics
Study Study Study Study
Open Economy TransactioOpen Economy TransactioOpen Economy TransactioOpen Economy Transactio
IntroductionIntroductionIntroductionIntroduction Up to this moment, nothing has been said about the transaction that exists between countries. This was deliberate in order to enable you grasp the basic mechanics of output determination analysis. In this Study Session, we will relax the assumption of no implication on national output determination.
Learning Learning Learning Learning OutcomesOutcomesOutcomesOutcomes
LearningLearningLearningLearning OutcomesOutcomesOutcomesOutcomes
When you have studied this session, you should be able to: 6.16.2
6.1 6.1 6.1 6.1 International TradeInternational TradeInternational TradeInternational TradeThere are two ways by which international transactions take place. These are through export and imports. Sales of domestic goods to the rest of the world (or outflow of goods to the rest of the world) are called exports, while the purchase of foreign goodfrom the rest of the world) is called imports.
There are series of theories propounded for the justification of engaging in international transactions. These include theories like comparative advantage, new world trade tthese theories is beyond the scope of this course. Therefore, we will take it as given that each country knows why and what to export and import, and from where.
6.1.1 Net Export6.1.1 Net Export6.1.1 Net Export6.1.1 Net Export
Export and import activities of a current accountswhen the value of its purchases of foreign goods and services is equal to the value of goods and services sold to foreign countries, that is, when exports equals imports. When export is greater than imports, we say the country has current account surplus. Conversely, when export is less than imports, we say the country has current account deficit. The difference between export and import demand is extend the aggregate demand to include net export component as follows:
Introductory Economics II
Study Study Study Study SessionSessionSessionSession 6666
Open Economy TransactioOpen Economy TransactioOpen Economy TransactioOpen Economy Transactionnnn
Up to this moment, nothing has been said about the transaction that exists between countries. This was deliberate in order to enable you grasp the basic mechanics of output determination analysis. In this Study Session, we will relax the assumption of no foreign trade, and examine its implication on national output determination.
OutcomesOutcomesOutcomesOutcomes
When you have studied this session, you should be able to: 6.1 discuss what international trade stands for. 6.2 explain how an economy attains equilibrium in an open economy.
International TradeInternational TradeInternational TradeInternational Trade There are two ways by which international transactions take place. These are through export and imports. Sales of domestic goods to the rest of the world (or outflow of goods to the rest of the world) are called exports, while the purchase of foreign goods (or inflow of goods and services from the rest of the world) is called imports.
There are series of theories propounded for the justification of engaging in international transactions. These include theories like comparative advantage, new world trade theory and so on. The analysis of each of these theories is beyond the scope of this course. Therefore, we will take it as given that each country knows why and what to export and import, and from where.
6.1.1 Net Export6.1.1 Net Export6.1.1 Net Export6.1.1 Net Export
Export and import activities of a country are recorded in a book called current accounts. A country’s current accounts is said to be balanced when the value of its purchases of foreign goods and services is equal to the value of goods and services sold to foreign countries, that is, when xports equals imports. When export is greater than imports, we say the
country has current account surplus. Conversely, when export is less than imports, we say the country has current account deficit. The difference between export and import demand is called net exportextend the aggregate demand to include net export component as follows:
nnnn
Up to this moment, nothing has been said about the transaction that exists between countries. This was deliberate in order to enable you grasp the basic mechanics of output determination analysis. In this Study Session,
foreign trade, and examine its
When you have studied this session, you should be able to:
how an economy attains equilibrium in an open economy.
There are two ways by which international transactions take place. These are through export and imports. Sales of domestic goods to the rest of the world (or outflow of goods to the rest of the world) are called exports,
s (or inflow of goods and services
There are series of theories propounded for the justification of engaging in international transactions. These include theories like comparative
heory and so on. The analysis of each of these theories is beyond the scope of this course. Therefore, we will take it as given that each country knows why and what to export and import,
country are recorded in a book called . A country’s current accounts is said to be balanced
when the value of its purchases of foreign goods and services is equal to the value of goods and services sold to foreign countries, that is, when xports equals imports. When export is greater than imports, we say the
country has current account surplus. Conversely, when export is less than imports, we say the country has current account deficit. The difference
net export. We can then extend the aggregate demand to include net export component as follows:

The term in the bracket gives the value of net export demand.
ITQ
Question
Feedback
TipTipTipTip
When an economy is running current account deficit (that is, when net export is negative), the value of aggregate demand will fall. If the economy is running is positive, the value of aggregate demand will rise. It then follows that any factor that affects net export will automatically affect aggregate demand. If this is the case, then it is important to edeterminants of net export.
Net Export FunctionNet Export FunctionNet Export FunctionNet Export Function
Exports depend on spending decisions made by foreign consumers or overseas firms that purchase domestic goods and services. The spending decisions are guided by the level of income, price of the foreign consumers. We will therefore assume that exports are determined by factors outside the control of the home economy. This allows us to treat it as an exogenous variable.
Imports on one hand depend on the spending deconsumers and on the other hand domestic firms using foreign raw materials, capital goods and intermediate goods. The latter is treated to be exogenous because in most cases firms know the amount of intermediate goods or capital goods In fact, we can say that this set of goods is basic for production to take place. We will then assume that this aspect of import is also exogenous.
Another aspect of import demand is the one that changes as income changes. When income rises, this aspect of import demand rises as well and when income falls, it falls. Therefore, we have two components of import demand, the one that is fixed, and the one that varies with income.
Because export is function of income, net exports are negatively related to national income/national output. Let represents imported basic investment good, while of import that changes with income, that is, marginal propensity to import. Finally let plus be written algebrai
Study Session 6 Open Economy Transaction
AD = C + I + G + (X-M)
The term in the bracket gives the value of net export demand.
ITQ
Question
o What are the components of international trade?
Feedback
• There are two components of international trade, these arei. import, and
ii. export.
When an economy is running current account deficit (that is, when net export is negative), the value of aggregate demand will fall. If the economy is running current account surplus, a situation where net export is positive, the value of aggregate demand will rise. It then follows that any factor that affects net export will automatically affect aggregate demand. If this is the case, then it is important to edeterminants of net export.
Net Export FunctionNet Export FunctionNet Export FunctionNet Export Function
Exports depend on spending decisions made by foreign consumers or overseas firms that purchase domestic goods and services. The spending decisions are guided by the level of income, price level, taste and fashion of the foreign consumers. We will therefore assume that exports are determined by factors outside the control of the home economy. This allows us to treat it as an exogenous variable.
Imports on one hand depend on the spending deconsumers and on the other hand domestic firms using foreign raw materials, capital goods and intermediate goods. The latter is treated to be exogenous because in most cases firms know the amount of intermediate goods or capital goods they will need for their production. In fact, we can say that this set of goods is basic for production to take place. We will then assume that this aspect of import is also exogenous.
Another aspect of import demand is the one that changes as income nges. When income rises, this aspect of import demand rises as well
and when income falls, it falls. Therefore, we have two components of import demand, the one that is fixed, and the one that varies with income.
Because export is exogenous while a part of import is an increasing function of income, net exports are negatively related to national income/national output. Let X0 represent planned export demand, represents imported basic investment good, while M1
of import that changes with income, that is, marginal propensity to import. Finally let M represent total import demand so that plus M1Y, where Y is national income. Therefore, net export function can be written algebraically as follows:
Open Economy Transaction
61
The term in the bracket gives the value of net export demand.
What are the components of international trade?
of international trade, these are:
When an economy is running current account deficit (that is, when net export is negative), the value of aggregate demand will fall. If the
current account surplus, a situation where net export is positive, the value of aggregate demand will rise. It then follows that any factor that affects net export will automatically affect aggregate demand. If this is the case, then it is important to examine the
Exports depend on spending decisions made by foreign consumers or overseas firms that purchase domestic goods and services. The spending
level, taste and fashion of the foreign consumers. We will therefore assume that exports are determined by factors outside the control of the home economy. This
Imports on one hand depend on the spending decisions of domestic consumers and on the other hand domestic firms using foreign raw materials, capital goods and intermediate goods. The latter is treated to be exogenous because in most cases firms know the amount of
they will need for their production. In fact, we can say that this set of goods is basic for production to take place. We will then assume that this aspect of import is also exogenous.
Another aspect of import demand is the one that changes as income nges. When income rises, this aspect of import demand rises as well
and when income falls, it falls. Therefore, we have two components of import demand, the one that is fixed, and the one that varies with income.
of import is an increasing function of income, net exports are negatively related to national
represent planned export demand, Mo M1 represents an aspect
of import that changes with income, that is, marginal propensity to represent total import demand so that M equals M0
is national income. Therefore, net export function can
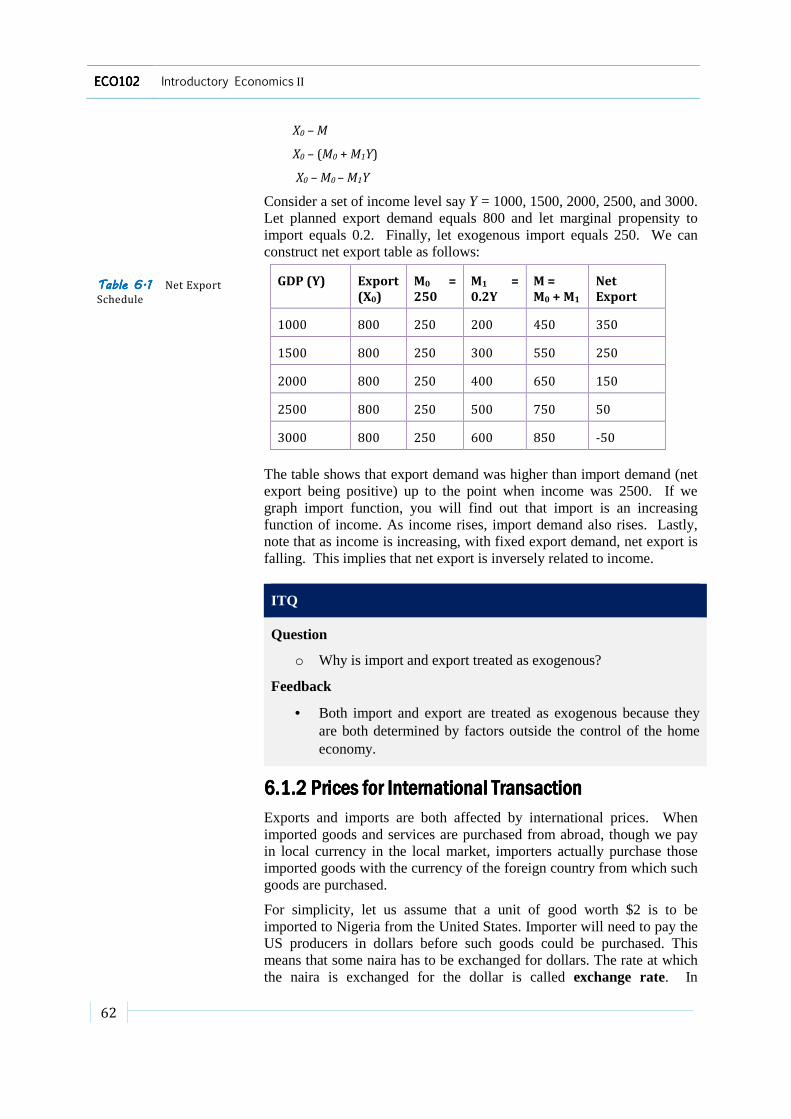
62
ECO102ECO102ECO102ECO102 Introductory Economics II
X0 – M
X0 – (M0 + M1Y)
X0 – M0 – M1Y
Consider a set of income level say Y = 1000, 1500, 2000, 2500, and 3000. Let planned export demand equals 800 and let marginal propensity to import equals 0.2. Finally, let exogenous import equals 250. We can construct net export table as follows:
Table 6.1 Table 6.1 Table 6.1 Table 6.1 Net Export
Schedule
GDP (Y) Export
(X0)
M0 =
250
M1 =
0.2Y
M =
M0 + M1
Net
Export
1000 800 250 200 450 350
1500 800 250 300 550 250
2000 800 250 400 650 150
2500 800 250 500 750 50
3000 800 250 600 850 -50
The table shows that export demand was higher than import demand (net export being positive) up to the point when income was 2500. If we graph import function, you will find out that import is an increasing function of income. As income rises, import demand also rises. Lastly, note that as income is increasing, with fixed export demand, net export is falling. This implies that net export is inversely related to income.
ITQ
Question
o Why is import and export treated as exogenous?
Feedback
• Both import and export are treated as exogenous because they are both determined by factors outside the control of the home economy.
6.1.2 6.1.2 6.1.2 6.1.2 Prices for International TransactionPrices for International TransactionPrices for International TransactionPrices for International Transaction
Exports and imports are both affected by international prices. When imported goods and services are purchased from abroad, though we pay in local currency in the local market, importers actually purchase those imported goods with the currency of the foreign country from which such goods are purchased.
For simplicity, let us assume that a unit of good worth $2 is to be imported to Nigeria from the United States. Importer will need to pay the US producers in dollars before such goods could be purchased. This means that some naira has to be exchanged for dollars. The rate at which the naira is exchanged for the dollar is called exchange rate. In

Study Session 6 Open Economy Transaction
63
particular, exchange rate is the quantity of domestic currency that can be exchanged for a unit of foreign currency in order to allow international transactions to take place. Let the unit price of Nigeria currency be N (naira), while that of the US is $, then exchange rate of naira to dollar will be:
ER = naira/dollar or N /$
To compute the amount of naira needed when we want to buy $10 worth of US products given that ER is N50, we proceed thus:
ER = naira/dollar
50 = N /10 = 50 x 10
After simplifying, we see that the amount of naira needed is N500.00.
Let us assume that exchange rate now falls to 25, and then the amount needed to purchase a $10 US product is N250.00.
What this implies is that as exchange rate falls, import demand becomes cheaper and as it rises, import demand becomes more expensive. A fall in exchange rate (when domestic currency falls relative to foreign currency) is called exchange rate appreciation. A rise in exchange rate (when domestic currency rises relative to foreign currency), is called exchange rate depreciation.
What is the implication of exchange rate on export demand? Consider a US consumer that intends to buy Nigeria products worth N1000.00, how much dollars does he need for the transaction? Given that exchange rate is 50, we proceed thus:
50 = 1000/$
$ = 1000/50 = $20.
This means that the consumer needs $20. Now let the exchange rate be 25
25 = 1000/$ = $40
That is, the foreign consumer need $40 (an extra $20) to purchase the same basket of good. What this implies is that all other things being equal, appreciation of domestic currency relative to foreign currency makes export expensive and makes import cheaper. Conversely, if other things remain the same, depreciation makes export cheaper and makes import expensive. Hence, any factor that changes exchange rate will cause net export to change. If exchange rate appreciates, export falls, import rises and net export function shifts downwards and to the left, such that aggregate demand falls. If exchange rate depreciates, export rises, import falls and net export function shifts upwards and to the right such that aggregate demand rises.
Another factor that can affect trade flows is the changes in domestic price level relative to foreign price level. Consider first a rise in domestic price. On the one hand, foreigners will now see domestic-produced goods as more expensive relative to both goods produced in their country and to goods imported from other countries. On the other hand, domestic residents will see imports from foreign countries become cheaper relative to the prices of home-produced goods. As a result, they will buy more

64
ECO102ECO102ECO102ECO102 Introductory Economics II
foreign goods, and imports will rise. Both of these responses will cause the net export function to shift downwards. As it shifts downward, aggregate demand falls. Thus, increase in domestic price will cause net export to fall.
Consider a situation whereby domestic price level falls relative to foreign price level. Domestic good exported will look cheaper in foreign country relatively to home-produced goods, and to goods imported from say other countries. As a result, home country exports will rise. On the other hand, the same change in relative prices – home-made goods become cheaper relative to foreign-made goods – will cause domestic country’s import to fall. Thus, the net export function will shift upwards in exactly the opposite way to the previous situation.
Thus far, we have established the fact that changes in foreign GDP, changes in exchange rate, and international differences in inflation rates cause net export function to shift. What is the implication of these factors on the equilibrium aggregate output/aggregate income? This is the question we provide answer to in the next section.
ITQ
Question
o What does the word “exchange rate” connotes?
Feedback
• Exchange rate is the rate at which a country’s currency is exchanged for another country’s currency.
6.2 6.2 6.2 6.2 Equilibrium in the Open EconomyEquilibrium in the Open EconomyEquilibrium in the Open EconomyEquilibrium in the Open Economy The aggregate demand will now include net export (X-M) component. However, equilibrium output is still the level of output at which desired aggregate demand equals national output/income.
To establish equilibrium in an open economy, let us rewrite our aggregate demand function and incorporate net export component. To put the matter very simple, let us assume that planned aggregate demand is given by:
AD = C + I + G + NX
Let C = 610 + 0.8Y; I = 220; and G = 300; NX = 10 and T = 250
Note that planned private consumption has fallen by 10-unit but this has been taken care of by NX which is 10. Equilibrium output can be achieved as follows:
AD = 610 + 0.8 (Y – 250) + 220 + 300 + 10
= 610 + 0.8Y – 200 + 220 + 300 + 10
= 940 + 0.8Y
at equilibrium, AD = Y

hence
This implies that the equilibrium has been restored but in this case through net export surplus.
From this simple example above, it is clear that positive net export (currenrecession, while negative net export (current account deficit) can also plunge the economy into recession. In particular, exchange rate policy, domestic inflation and foreign inflation have implicaperformance of the domestic economy. A rise in domestic inflation can plunge the economy into recession through a fall in net export. While a fall in domestic inflation will help economy recover from recession through increase in net expeconomy that is in recession can recover by reducing import demand and increasing export supply which can be achieved through exchange rate manipulation or reduction in domestic price level.
ITQ
Question
Feedback
Study Session SummaryStudy Session SummaryStudy Session SummaryStudy Session Summary
SummarySummarySummarySummary
In this Study Session, we We explored the importance of international transactions in the determination of national income and analysed exchange rate.
AssessmentAssessmentAssessmentAssessment
AssessmentAssessmentAssessmentAssessment
SAQ 6.1 (Tests Learning Outcome 6.1)
Discuss briefly the
SAQ 6.2 (Tests Learning Outcome 6.2)
Under what condition economy?
Study Session 6 Open Economy Transaction
hence, Y = 940/0.2 = 4700.
This implies that the equilibrium has been restored but in this case through net export surplus.
From this simple example above, it is clear that positive net export (current account surplus) can be used to recover the economy from recession, while negative net export (current account deficit) can also plunge the economy into recession. In particular, exchange rate policy, domestic inflation and foreign inflation have implicaperformance of the domestic economy. A rise in domestic inflation can plunge the economy into recession through a fall in net export. While a fall in domestic inflation will help economy recover from recession through increase in net export. Specifically, this analysis implies that an economy that is in recession can recover by reducing import demand and increasing export supply which can be achieved through exchange rate manipulation or reduction in domestic price level.
ITQ
Question
o Under what condition will an economy be at equilibrium?
Feedback
• An economy, either closed or open will be at equilibrium when its desired aggregate demand equals national output/income.
Study Session SummaryStudy Session SummaryStudy Session SummaryStudy Session Summary
In this Study Session, we discussed the meaning of international trade. We explored the importance of international transactions in the determination of national income and analysed exchange rate.
AQ 6.1 (Tests Learning Outcome 6.1)
Discuss briefly the term “international trade”.
AQ 6.2 (Tests Learning Outcome 6.2)
Under what condition will a country attain equilibrium in an open economy?
Open Economy Transaction
65
This implies that the equilibrium has been restored but in this case
From this simple example above, it is clear that positive net export t account surplus) can be used to recover the economy from
recession, while negative net export (current account deficit) can also plunge the economy into recession. In particular, exchange rate policy, domestic inflation and foreign inflation have implication on the output performance of the domestic economy. A rise in domestic inflation can plunge the economy into recession through a fall in net export. While a fall in domestic inflation will help economy recover from recession
ort. Specifically, this analysis implies that an economy that is in recession can recover by reducing import demand and increasing export supply which can be achieved through exchange rate
Under what condition will an economy be at equilibrium?
An economy, either closed or open will be at equilibrium when desired aggregate demand equals national output/income.
discussed the meaning of international trade. We explored the importance of international transactions in the determination of national income and analysed exchange rate.
attain equilibrium in an open

66
ECO102ECO102ECO102ECO102 Introductory Economics II
BibliographyBibliographyBibliographyBibliography
ReadingReadingReadingReading
http://www.suu.edu/faculty/hamlin/MGMT3050/ppt/Wild_IB5e_PPT_Instructor_05.ppt retrieved August, 2013.
http://faculty.washington.edu/jwh/349lec03.htm retrieved August, 2013.

Study Session 7Study Session 7Study Session 7Study Session 7
Income Determination in the LongIncome Determination in the LongIncome Determination in the LongIncome Determination in the Long
IntroductionIntroductionIntroductionIntroduction You will recall that all our analysis up to this point centres on how cyclical fluctuations can be taken care of. As noted, cyclical fluctuation the ups and downs of the economy explore income determination in the long
LearningLearningLearningLearning OutcomesOutcomesOutcomesOutcomes
When you have studied this session, you should be able to: 7.1 7.2
7.1 7.1 7.1 7.1 Production and GrowthProduction and GrowthProduction and GrowthProduction and GrowthProductivityproduced per person. This is also called GDP per person. GDP per person or productivity can be perceived as a product of two terms: average labour productivity and the share of the population thworking. To fix ideas about what productivity is, let aggregate output (or national income) measured by real GDP, let L represent the number of employed workers and let population. Real GDP per person by definition
Average labour productivity or output per employed worker equals while the share of working population from total population is relationship between these three variables is:
That is the basic labour productivity multiplied by share of population employed. If we think of output produced per person being equal to output consumed per person, then, the above expression implies that the quantitservices that each person can consume depends on:
a.
b.
The higher each worker can produce, the greater is GDP per person and the more abundant goods and services are available for consumption. Also, the more we have people working in the economy, the more there will be goods and services available for consumption. That is, real GDP
Study Session 7 Income Determination in the Long
Study Session 7Study Session 7Study Session 7Study Session 7
Income Determination in the LongIncome Determination in the LongIncome Determination in the LongIncome Determination in the Long
You will recall that all our analysis up to this point centres on how cyclical fluctuations can be taken care of. As noted, cyclical fluctuation the ups and downs of the economy – is a short-run phenomenon. We will explore income determination in the long-run in this Study Session.
When you have studied this session, you should be able to: discuss the concept of productivity. discuss the determinants of labour productivity.
Production and GrowthProduction and GrowthProduction and GrowthProduction and Growth Productivity is defined as the amount of goods and services that can be produced per person. This is also called GDP per person. GDP per person or productivity can be perceived as a product of two terms: average labour productivity and the share of the population thworking. To fix ideas about what productivity is, let aggregate output (or national income) measured by real GDP, let L represent the number of employed workers and let population. Real GDP per person by definition can be written as:
Q/N
Average labour productivity or output per employed worker equals while the share of working population from total population is relationship between these three variables is:
Q/N = Q/L* L/N
That is the basic relationship is that real GDP per person equals average labour productivity multiplied by share of population employed. If we think of output produced per person being equal to output consumed per person, then, the above expression implies that the quantitservices that each person can consume depends on:
how much each worker can produce; and
b. the number of people working (the share of working people from total population)
The higher each worker can produce, the greater is GDP per person and e more abundant goods and services are available for consumption.
Also, the more we have people working in the economy, the more there will be goods and services available for consumption. That is, real GDP
Income Determination in the Long-Run
67
Income Determination in the LongIncome Determination in the LongIncome Determination in the LongIncome Determination in the Long----RunRunRunRun
You will recall that all our analysis up to this point centres on how cyclical fluctuations can be taken care of. As noted, cyclical fluctuation –
run phenomenon. We will run in this Study Session.
When you have studied this session, you should be able to:
is defined as the amount of goods and services that can be produced per person. This is also called GDP per person. GDP per person or productivity can be perceived as a product of two terms: average labour productivity and the share of the population that is working. To fix ideas about what productivity is, let Q represent aggregate output (or national income) measured by real GDP, let L represent the number of employed workers and let N represent the total
can be written as:
Average labour productivity or output per employed worker equals Q/L, while the share of working population from total population is L/N. The
relationship is that real GDP per person equals average labour productivity multiplied by share of population employed. If we think of output produced per person being equal to output consumed per person, then, the above expression implies that the quantity of goods and
the number of people working (the share of working people from
The higher each worker can produce, the greater is GDP per person and e more abundant goods and services are available for consumption.
Also, the more we have people working in the economy, the more there will be goods and services available for consumption. That is, real GDP

68
ECO102ECO102ECO102ECO102 Introductory Economics II
per person can grow only to the extent that there is growth in workers’ productivity (each worker producing more) and/or the fraction of the population that is employed.
It turns out that the long-run increase in output per person arises primarily from increases in average labour productivity. Therefore, it is important to examine the determinants of average labour productivity.
ITQ
Question
o What determines the long run output per person?
Feedback
• Output per person in the long run is determined by average labour productivity.
7.2 7.2 7.2 7.2 Determinants of Determinants of Determinants of Determinants of Labour ProductivityLabour ProductivityLabour ProductivityLabour Productivity Some traditional economists argue that workers’ productivity depends on the willingness of workers to work hard. According to this line of thought, a culture that promotes hard work certainly tends to increase workers’ productivity. However, empirical evidence shows that hard work alone cannot account for large variations in average labour productivity that is observed across countries over time. For example, average labour productivity in the United States is 100 times what it is in Bangladesh, even though Bangladeshis work harder than Americans! Also, average labour productivity in Nigeria today is more than 100 times what it was 50 years ago even though workers then worked harder than workers of nowadays.
Modern economists have probed into this issue and came out with six possible factors that determine labour productivity. The factors are: human capital, physical capital, land and other natural resources, technology, entrepreneurship and management, and the political and legal environment.
Human CapitalHuman CapitalHuman CapitalHuman Capital
Human capital comprises of talents, education, training and skills. Workers with a large stock of human capital appear to be more productive than workers with less. Human capital helps to develop one’s skill level which can be used to produce more than when such skill is lacking. For example, a secretary who knows how to use a word processing program will be able to type more document than one who does not. Also, an auto-mechanic equipped with skill of computerized diagnostic equipments will be able to detect engine fault and be able to fix the problem more quickly than less well-trained mechanics.
It must be noted that human capital acquisition is not without cost. For instance, one needs to create time, energy and money for the acquisition of such skill. All these are opportunity costs to be considered. However,

Study Session 7 Income Determination in the Long-Run
69
the benefit of such acquisition is the increase in wages that will be earned after the acquisition of such skill. It turns out that what motivates workers to want to acquire extra skill is the difference between wages of the skilled and unskilled workers. If the difference is positive, workers tend to acquire more skill and this invariably increases their productivity and hence output.
ITQ
Question
o What accounts for the tendency of people to acquire more skills so as to improve their productivity?
Feedback
• The urge to acquire more skills by people is driven by the difference between wages of the skilled and unskilled workers. If the difference is positive, workers tend to acquire more skill and vice versa.
Physical CapitalPhysical CapitalPhysical CapitalPhysical Capital
Workers’ productivity also depends on the available equipments, machines and tools. The most skilled Building Engineer cannot build a 50-storey glass building without sophisticated building and engineering equipment. A most talented musician will not be able to develop his potential with limited musical instruments. These examples illustrate the importance of physical capital such as factories and machines in the production of goods and services. In a nutshell, more and better capital allows workers to produce more efficiently and effectively.
However, continuous increase in physical capital may not lead to continuous increase in output. When labour and other input are held constant, the greater the amount of capital already in use, the less an additional unit of capital adds to production. That is, physical capital is subject to diminishing returns. Diminishing returns to capital tells us how to stimulate economic growth. First, increasing the amount of capital available to the workforce will tend to increase output and average labour productivity. The more adequately equipped workers are, the more productive they will be. Second, the degree to which productivity can be increased by an expanding stock of capital is limited. Because of diminishing returns to capital, an economy in which the quantity of capital available to each worker is already very high will not benefit much from further expansion of the capital stock.
Land and other Natural Land and other Natural Land and other Natural Land and other Natural ResourcesResourcesResourcesResources
Other factor inputs necessary for increasing workers’ productivity are land, energy, and raw materials. In general, an abundance of natural resources increase the productivity of the workers who use them. For instance, fertile land is essential to agriculture. A farmer can produce as much large crop in a land-rich country like United States and Nigeria

70
ECO102ECO102ECO102ECO102 Introductory Economics II
than in a country where the soil is poor or arable land is limited in supply as in Iraq.
That a country lacks some natural resources does not mean that it cannot increase its production. As long as natural resources like crude oil, petroleum, metals, and chemicals can be obtained through trade, countries with limited natural resources can raise production by obtaining necessary natural resource inputs through international market.
TechnologyTechnologyTechnologyTechnology
Ability to develop and use new technologies will go a long way to increase output per person. Technology is defined as a scientific means of producing large amount of goods and services within a short period of time and or per unit of labour. In the olden days, the horse driven wagon was the primary means of transportation. This method, no doubt, is not only costly but also very slow. In the nineteenth century, technological advances such as steam engine supported the expansion of river-borne transportation and the development of national rail network. Nowadays, the invention and development of international network of an extensive infrastructure of roads and airports have produced increasingly rapid, cheap, and reliable transport. Rapid technological transition has also occurred in construction, financial institutions and telecommunications. Technological change has also contributed immensely to the sectoral revolution of the economy.
Entrepreneurship and ManEntrepreneurship and ManEntrepreneurship and ManEntrepreneurship and Managementagementagementagement
The productivity of workers depends in part on the people who help to decide what to produce and how to produce it. Entrepreneur is defined as people who create new economic activities. Entrepreneurs tend to be creative and always introduce new products, new services, new technological processes and new production techniques. To this extent, entrepreneurs are critical to dynamic, matured and improved economy. In fact, the more people are enterprising, the healthier the economy becomes. Not only that, since entrepreneurs created new enterprises, it means the more they are present in the country, the greater new things are discovered, made use of and the more output grows.
The Political and Legal EnvironmentThe Political and Legal EnvironmentThe Political and Legal EnvironmentThe Political and Legal Environment
All the factors mentioned above describe the roles played by the private sector in increasing average productivity of labour. If an economy operates a mixed economic system, it follows that government also has a role to play in improving productivity. One important contribution of government to productivity is to provide political and legal environment that encourages people to behave in economically productive ways whereby they are taught to work hard, save and invest wisely, acquire useful information and skills, and provide goods and services that the public demands.
Another important contribution of government to productivity and growth is in the area of providing well-defined property rights. By property

Study Session 7 Income Determination in the Long-Run
71
rights, we are referring to the provision of clear rules for determining who owns what resources and how those resources can be used
Government should also ensure political stability. It has been unanimously agreed upon that political instability is inimical to economic growth. This is true because investors and savers may not be willing to invest or save in a country fraught with financial uncertainty brought about by unstable government policy or unstable political terrain, particularly if the struggle for power involves civil unrest, terrorism and the likes.
On the other hand, a political system that supports and operates free and open exchange of ideas will create incentives for investment to thrive, will speed the development of new technologies, and will ascertain protection of lives and properties. With these in place, production will take place dramatically, output will increase steadily and economic growth will be achieved.
7.7.7.7.2.12.12.12.1 Public Policy and Economic GrowthPublic Policy and Economic GrowthPublic Policy and Economic GrowthPublic Policy and Economic Growth
The primary objective of an economy is to be able to increase production in a continuous manner such that goods and services can be available for consumption and possibly for exports. There are some policy measures that government can apply in order to make this fundamental objective realizable. Based on the discussion of the factors that necessitate growth in labour productivity, the policy measures that can be taken include policies to increase human capital, policies to promote physical capital and policies to improve legal and political framework.
Public Policy and Human CapitalPublic Policy and Human CapitalPublic Policy and Human CapitalPublic Policy and Human Capital
We have demonstrated the importance of human capital development in economic growth. Governments of most countries try to increase human capital of their citizens by supporting education and training programs. In Nigeria, government provides public education by making schooling free for students up to JSS III. Also, government encourage people to attain tertiary education by subsidizing the financial outlays of tertiary education. Government also provides scholarships to outstanding students through Educational Trust Fund (ETF) in furtherance of their education. In some advanced countries like the United States, government funds job training for unskilled youths and retraining for workers whose skills have become obsolete. In Nigeria, the National Industrial Training (NIT) was set up by the government to provide basic skills for some intending Nigerians. This is in a view to making them highly skilful so that their productivity can increase.

72
ECO102ECO102ECO102ECO102 Introductory Economics II
ITQ
Question
o In what way can government promote human capital development?
Feedback
• Government can facilitate development of human capital through its support toward education and training programs.
Public Policy and Physical Capital AccumulationPublic Policy and Physical Capital AccumulationPublic Policy and Physical Capital AccumulationPublic Policy and Physical Capital Accumulation
Average labour productivity increases when workers can utilize a sizeable and modern capital stock. To support the creation of new capital, government can encourage high rate of saving and create conducive environment for investment in the private sector. In the United States, one of the policy measures to encourage saving is the US tax code. In this case, a household that opens an Individual Retirement Account (IRA) is able to save for retirement without paying taxes on either the funds deposited in the IRA or the interest earned on the account. The intent of IRA legislation is to make saving more financially attractive to American households. A similar scheme like that of the US also exist in Nigeria, this is called Pension Scheme legislation. This government policy requires all Nigerian workers to save part of their monthly earnings in their pension account. The essence of this is to inculcate the habit of saving, and also to divert money to its most efficient use (investment).
Government can also contribute to capital formation through public investment. Public investment includes the building of roads, rural and urban electrification, and creation of bridges, dams, irrigation, energy, and communication networks. In the area of transportation, construction and or rehabilitation of motor roads, rail, roads, sea ports and airways are some ways through which public policy affect physical capital accumulation.
That Nigeria has developed to the use of computers and communications for business transaction is not new. It must be noted that the involvement of Nigeria in e-business is not unconnected with government funding. In fact, many research studies have confirmed that government investment in the provision of infrastructure, the capital that supports private-sector economic activities, is a significant source of growth.
Public Policy and Legal and Political FrameworkPublic Policy and Legal and Political FrameworkPublic Policy and Legal and Political FrameworkPublic Policy and Legal and Political Framework
Government provides framework within which the private sector operates productively. In our earlier discussion, we mentioned the fact that the establishment of property rights, a well functioning legal system and political stability are crucial to labour productivity and hence growth. Hence, government policymakers should, as a matter of importance, also consider the potential effects of tax and regulatory policies on activities that increase productivity, such as investment, innovation and risk taking.
Public Policy and Technological ImprovementPublic Policy and Technological ImprovementPublic Policy and Technological ImprovementPublic Policy and Technological Improvement
As demonstrated earlier, average labour productivity rises with technological improvement. Teresearch and development (R&D). Individual firms whose intention is to maximize profit will set up its private research and development section. For instance, Cadbury Nigeria Plc has a R&D department that helps with the invention of new products. However, government policy can also be useful in national development. This is so because society in general, rather than individual may receive much of the benefit research.
Nigeria government has a policy that supports basic R&D. There are many research institutes that are established and financed by the government of Nigeria. Among them are National Institute of Economic and Social Research (NISER), Na(NIHORT) and so on. All these are aimed at providing general discoveries that will help private firms strive.
ITQ
Question
Feedback
Study Session SummaryStudy Session SummaryStudy Session SummaryStudy Session Summary
SummarySummarySummarySummary
In this Study Session, you learnt that the economy’s fullachieved in the longallow time for the automatic adjustment mechanisms to return economic activity to equilibrium after it has been disturbed by an exogeneous shock. We began by examinieconomic growth. A key conclusion from the analysis is that improvements in average labour productivity are the primary source of rising living standards. Lastly, we examined the consequence of public policy on economic
Study Session 7 Income Determination in the Long
Public Policy and Technological ImprovementPublic Policy and Technological ImprovementPublic Policy and Technological ImprovementPublic Policy and Technological Improvement
As demonstrated earlier, average labour productivity rises with technological improvement. Technology is being produced through research and development (R&D). Individual firms whose intention is to maximize profit will set up its private research and development section. For instance, Cadbury Nigeria Plc has a R&D department that helps with
development of new technique of producing old products and the invention of new products. However, government policy can also be useful in national development. This is so because society in general, rather than individual may receive much of the benefit research.
Nigeria government has a policy that supports basic R&D. There are many research institutes that are established and financed by the government of Nigeria. Among them are National Institute of Economic and Social Research (NISER), National Institute of Horticulture (NIHORT) and so on. All these are aimed at providing general discoveries that will help private firms strive.
ITQ
Question
o What is the essence of embarking on various Research and Development programs by government?
Feedback
• Government embarks on Research and Development programs with the aim of enhancing technological improvement toward increasing the productivity of labour.
Study Session SummaryStudy Session SummaryStudy Session SummaryStudy Session Summary
In this Study Session, you learnt that the economy’s fullachieved in the long-run. Specifically, long-run is a period sufficient to allow time for the automatic adjustment mechanisms to return economic activity to equilibrium after it has been disturbed by an exogeneous shock. We began by examining the causes and consequences of economic growth. A key conclusion from the analysis is that improvements in average labour productivity are the primary source of rising living standards. Lastly, we examined the consequence of public policy on economic growth.
Income Determination in the Long-Run
73
Public Policy and Technological ImprovementPublic Policy and Technological ImprovementPublic Policy and Technological ImprovementPublic Policy and Technological Improvement
As demonstrated earlier, average labour productivity rises with chnology is being produced through
research and development (R&D). Individual firms whose intention is to maximize profit will set up its private research and development section. For instance, Cadbury Nigeria Plc has a R&D department that helps with
development of new technique of producing old products and the invention of new products. However, government policy can also be useful in national development. This is so because society in general, rather than individual may receive much of the benefit from basic
Nigeria government has a policy that supports basic R&D. There are many research institutes that are established and financed by the government of Nigeria. Among them are National Institute of Economic
tional Institute of Horticulture (NIHORT) and so on. All these are aimed at providing general
What is the essence of embarking on various Research and
embarks on Research and Development programs with the aim of enhancing technological improvement toward
In this Study Session, you learnt that the economy’s full potential is run is a period sufficient to
allow time for the automatic adjustment mechanisms to return economic activity to equilibrium after it has been disturbed by an exogeneous
ng the causes and consequences of economic growth. A key conclusion from the analysis is that improvements in average labour productivity are the primary source of rising living standards. Lastly, we examined the consequence of public

74
ECO102ECO102ECO102ECO102 Introductory Economics
AssessmentAssessmentAssessmentAssessment
BibliographyBibliographyBibliographyBibliography
ReadingReadingReadingReading
Karl E. Case and Ray C. Fair, ed.
Robert. H. Frank and Ben S. Bernanke, McGraw
http://economics.adelaide.edu.au/downloads/servicesworkshop/Definitionretrieved August, 2013.
http://econ.la.psu.edu/~bickes/income.pdf
http://econsiseasy.blogspot.com/2006/08/keynesianincome.html
http://home.cogeco.ca/~pcreighton/Economics/Module%2014.htmretrieved August, 2013.
http://www.ijhssnet.com/journals/Vol_3_No_4_Special_Issue_February_2013/21.pdf
AssessmentAssessmentAssessmentAssessment
SAQ 7.1 (tests Learning Outcome How will e
SAQ 7.2 (tests Learning Outcome What are the factors that determine labour productivity?
Introductory Economics II
Karl E. Case and Ray C. Fair, Principles of Economics
Robert. H. Frank and Ben S. Bernanke, (2007) Principles of Economics,McGraw-Hill Irwin, 3 rd ed.
http://economics.adelaide.edu.au/downloads/servicesworkshop/Definition-Importance-And-Determinants-retrieved August, 2013.
http://econ.la.psu.edu/~bickes/income.pdf retrieved August, 2013.
http://econsiseasy.blogspot.com/2006/08/keynesian-modelincome.html retrieved August, 2013.
http://home.cogeco.ca/~pcreighton/Economics/Module%2014.htmretrieved August, 2013.
http://www.ijhssnet.com/journals/Vol_3_No_4_Special_Issue_February_2013/21.pdf retrieved August, 2013.
Q 7.1 (tests Learning Outcome 7.1) How will explain the concept of productivity?
Q 7.2 (tests Learning Outcome 7.2) What are the factors that determine labour productivity?
Principles of Economics, Prentice Hall, 6th
Principles of Economics,
http://economics.adelaide.edu.au/downloads/services--Of-Productivity.pdf
retrieved August, 2013.
model-of-
http://home.cogeco.ca/~pcreighton/Economics/Module%2014.htm
http://www.ijhssnet.com/journals/Vol_3_No_4_Special_Issue_February_
What are the factors that determine labour productivity?
Feedback on Self Assessment Questions
75
Feedback on Self Assessment QuestionsFeedback on Self Assessment QuestionsFeedback on Self Assessment QuestionsFeedback on Self Assessment Questions
SAQ 1.1
The importance of macroeconomics to any nation cannot be overemphasised. Below are some of the significance of macroeconomics to any nation:
1) It helps to understand the functioning of a complicated modern economic system. It describes how the economy as a whole functions and how the level of national income and employment is determined on the basis of aggregate demand and supply.
2) It helps to achieve the goal of economic growth, higher level of GDP and higher level of employment. It analyses the forces which determine economic growth of a country and explain how to reach the highest state of economic growth and sustain it.
3) It helps to bring stability in price level and analyses fluctuations in business activities. It suggests policy measures to control inflation and deflation.
4) It explains factors which determine balance of payment. At the same time, it identifies causes of deficit in balance of payment and suggests remedial measures.
5) It helps to solve economic problems like poverty, unemployment, inflation, deflation etc, whose solution is possible at macro level only, i.e. at the level of the whole economy.
6) With detailed knowledge of functioning of an economy at the macro level, it has possible to formulate correct economic policies and also coordinate international economic policies.
SAQ 1.2
Macroeconomics: is about the performance of the economy in general. It deals with the larger aspects of a nation's economy, such as the sectors of agriculture, industry, and service. It is a branch of economics that deals with the performance, structure, behaviour and decision-making of the entire economy, be that a national, regional, or the global economy. Macroeconomists study aggregated indicators such as GDP, unemployment rates, and price indices to understand how the whole economy functions. Macroeconomists develop models that explain the relationship between such factors as national income, output, consumption, unemployment, inflation, savings, investment, international trade and international finance.
It aims to (a) speed up the economy's growth rate and increase total production; (b) increase the rate of employment; (c) keep the prices of commodities stable so that they remain affordable; and (d) have sufficient reserves for foreign exchange for importing goods and paying off loans. Economists help in solving problems like unfair wages, rapid population growth, people migration to city centers, high crime incidence, and loss of human resources due to overseas migration.
76
ECO102ECO102ECO102ECO102 Introductory Economics II
Microeconomics: is about smaller and more specific things such as how families and households spend their money. It is a branch of economics that deals with the personal decisions of consumers and entrepreneurs. It is a branch of economics that studies how the individual parts of the economy, the household and the firms, make decisions to allocate limited resources, typically in markets where goods or services are being bought and sold. Microeconomics also deals with the effects of national economic policies (such as changing taxation levels) on individuals and firms.
Its primary concern is to help consumers and investors make their lives better by increasing their earnings and satisfying their needs despite limited resources. Also included in its study are the consumers' decisions on what products to buy and how the cost of commodities is determined.
SAQ 2.1 1. Gross Domestic Product (GDP): This represents the market
value of the final goods and services produced in the country during a particular period. Thus, GDP measures how much of goods and services an economy produces in a given period usually quarter of a year (3 months), half-yearly (six months), or a year. Here, only final goods and services are included while intermediate goods are excluded.
2. Gross National Product (GNP): This represents the totality of market value of all goods and services produce by all the citizens of a given country, irrespective of whether they reside within the domestic country or abroad. GNI describes the output or income of only the citizens of country resident in the domestic country, as well as the output or income of the citizens of a country who are abroad. Thus, gross national product equals GDP plus factor income from abroad.
3. Net National Product (NNP): This describes the output or income of only the citizens of country resident in the domestic country, as well as the output or income of the citizens of a country who are abroad minus depreciation. Depreciation here connotes wearing out of some equipment, damaged or condemned equipment as well as those that are obsolete. Thus, NNP= GNP₋ depreciation.
4. Domestic Income (DI): This describes the income received on output produced within the country. It is the income received by the owners of factors of production within a given country. Domestic Income is somehow similar with Gross Domestic Product (GDP) but DI is much particular about income receive or earn on goods and services produced domestically.
5. Personal Income (PI): This describes total earnings of individual's from various activities such as wages, investment enterprises, and other ventures before taxes (direct tax). It is the total income received by the individuals of a country from all sources in one year before it is subjected to direct taxes.
6. GDP at factor Price: This explains the sum of the monetary value of all goods and services produced by the factors of production or the income accruing to the various factors of production in one year in a country. GDP at factor price describes

Feedback on Self Assessment Questions
77
the value of output in terms of the resources used to produce them.
7. GDP at market Price: This represents the sum of gross added value of the various institutional sectors of the various branches of activity plus taxes minus the subsidies on products (which are not attributed to the sector and branches of activity.
SAQ 2.2
SAQ 2.3
There exist several plaguing the computation of NI, though we don’t know exactly what you may think of but you may consider some of the following problems:
1. Problem of double counting.
2. There is also the difficulty of defining “nation” in national income.
3. The problem of measuring non-market or domestic activities.
4. Income earned through illegal activities also makes national income to be less, because they are excluded from GDP.
5. Problem of measuring national income in monetary terms which leads to the underestimation of real national income.
6. Some public services cannot be estimated correctly.
SAQ 3.1
The aggregate demand curve is a curve showing the relationship between short-run equilibrium outputs, ‘Y’ and the price level, ‘P’ or inflation. It is a curve that represents the total quantity of all goods services demanded by the economy at different price levels. AD curve like the demand curve for individual goods is downward sloping, implying that there is an inverse relationship between the price level and the quantity demanded of real GDP.
The reasons for the downward sloping of aggregate demand curve are different from the reasons given for the downward sloping demand curves for individual goods and services. Some of the reasons for downward sloping of aggregate demand curve include:
• Response of the monetary authority. • Effects of money supply and demand on interest rate. • The consumption link • Effect of the real wealth • Uncertainty • Foreign price of domestic goods etc.
SAQ 3.2
The aggregate supply (AS) is a curve that shows the relationship between the aggregate quantity of output supplied by all firms in an economy and the overall price level. Aggregate supply depicts the quantity of GDP that is supplied by the economy at different price levels. The reasoning used to construct the aggregate supply differs from the reasoning used to construct the supply curve for individual goods and services.

78
ECO102ECO102ECO102ECO102 Introductory Economics II
The supply curve for an individual good is drawn under the assumption that input prices remain constant. As the price of good X rises, sellers per unit cost of providing good X do not change, and so sellers are willing to supply more of good X-hence, the upward slope of the supply curve for good X. The aggregate supply curve, however, is defined in terms of the price level. Increases in the price level will increase the price that producers can get for their products and thus induce more output. But an increase in price will also have a second effect; it will ill eventually lead to increase in input prices as well, ceteri paribus, will cause producers to cut to cut back. Thus, the AS curve in the short run is sloping upward and becoming vertical when the economy reaches its capacity or maximum. However, the AS curve remains vertical in the long run.
Several factors are responsible for the behaviour of the aggregate supply, some of these factors include:
• The fairly flat shape • The nearly vertical/ vertical shape
SAQ 3.3
Several factors are responsible for the shift of the aggregate curve from its original position to a new position entirely. A change in any of the components of the aggregate demand will definitely lead to a shift in the aggregate demand curve. Thus, a change in any of the macroeconomic variable like G (government), T (taxes), and Ms (money supply) will result in a shift of the AD curve. However, these changes can be grouped into two, namely:
• Changes in Monetary Authority’s Policy Reaction Function, and • Change in Government Spending.
Changes in Monetary Authority’s Policy Reaction Function
Monetary regulatory authority may choose either an expansionary or contractionary monetary policy through changing money supply or through changing the interest rate.
Change in money supply: When there is an increase in the quantity of money supply in the economy at any given price level, interest rate will fall thereby causing planned investment spending to rise. The increased in planned investment spending will result into an increase in output at the given price level, and this makes the aggregate demand curve to shift to the right.
Change in the interest rate: When the interest rate is set over above the normal price level, it reduces investment and planned expenditure. Thus, this makes the AD curve to shift to the left
Change in Government Spending
This may take various forms which include:
Change in net taxes: a change in net taxes shifts the AD curve. A decrease in net taxes results in a rise in consumption which brings about increase in the planned aggregate expenditure, leading to an increase in output.
Feedback on Self Assessment Questions
79
Change in government purchases: an increase in government purchase at each possible price level, been part of aggregate demand, will directly increase planned aggregate expenditure. This leads to an increase in output. The reverse is the case for a decrease in government purchases.
New technological opportunities: Introduction of new technological opportunities makes firms to increase their planned investment. The increase in planned investment been a component of aggregate demand will lead to an increase in aggregate expenditure and thus, output will increase. This will shift the AD curve to the right.
Changes in consumers’ confidence: An important increase in consumers’ confidence in some commodities will lead to an increase in aggregate expenditure and aggregate output. Thus, increase in aggregate output will shift the AD curve to the right. The reverse is the case for a decrease in consumers’ confidence.
SAQ 3.4
Unlike the aggregate demand, aggregate supply otherwise known as GDP or Output or does not usually increases over time, but falls or rises due to economic fluctuation. This fluctuation is termed economic fluctuation or business cycle. Business cycle is divided into period of recession (or doom) and expansion (or boom).
• Recession: this is a persistent fall in output growth over a period of three consecutive quarters.
• Expansion: this is a continuous rise in output.
SAQ 4.1
Money can be defined as anything that is generally acceptable as medium of exchange for making payment, settlement of debts and other business obligations. Money can also be defined as a good that acts as a medium of exchange in transaction. To some, money is defined as any object or record that is generally accepted as payment for goods and services and repayment of debt in a given socio-economic context or country.
SAQ 4.2
The role and importance of money in any economy cannot be over-emphasised. Money performs several functions that are not only peculiar but inevitable in every society. Some of the functions performs by money are discussed below
Medium of exchange
When money is used to intermediate the exchange of goods and services, it’s performing a function as a medium of exchange. It thereby avoids the inefficiencies of a barter system such as the problem of “double coincidence of wants”.
Unit of Account
A unit of account is a standard numerical unit of measurement of the market value of goods, services, and other transactions. Also known as a “measure” or “standard” of relative worth and deferred payment, a unit of account is a necessary prerequisite for the formulation of commercial agreements that involve debt. To function as a unit of account, whatever is being used as money must be;
80
ECO102ECO102ECO102ECO102 Introductory Economics II
• Divisible into smaller units without loss of value. • Fungible: that is, a unit or piece must be perceived as equivalent
to any other. • It must carry or bear a specific weight, measure, and size.
Store of Value
To act as a store of value, money must be able to be reliably saved, stored, and retrieved- and be predictably usable as medium of exchange when it’s retrieved. The value of money must remain stable overtime.
Standard of deferred payment
A “standard of deferred payment” is an accepted way to settle a debt- a unit in which debts are denominated, and the status of money as legal tender, in those jurisdictions which have this concept, states that it may function for the discharge for debts.
Measurement of value
Money acts as a standard measure and common denomination of trade. It’s thus a basis for quoting and bargaining of prices. It’s necessary for developing efficient account systems. But , its most important usage is a method for comparing the value of dissimilar objects.
SAQ 4.3
In any economy, the Central Bank is the apex bank and it’s the only bank that has the power to issue currencies within the economy. The Central Bank regulates the activities of other banks and financial institutions in the economy. Central Bank is responsible for supplying money into the economy. The money supply effort of the Central Bank is usually complemented by creation of money by commercial banks.
Commercial banks ability to create money is not like that of the central bank. Thus, commercial banks create money such a way that they generate money from the surplus consumption units and make them available to the deficit consumption unit. Surplus consumption unit characterises those set of people that have money over and above their present financial up-keepings and decided to keep their excesses with the commercial banks. Deficit surplus consumption unit on the other hand, are those who to have enough or required amount of money to keep up with their present financial obligations.
How Commercial banks create Money
When commercial banks collect money from the members of the public as deposits, it’s not all the money received as deposits that remain in their custody as cash otherwise known as bank deposit balances (Reserves). However, some parts of the deposits received from the members of the public are given out to people as loans that yield some interests for the bank. Thus, not all bank deposits are treated as bank reserve. That is, it is only a proportion of the deposit that makes up bank reserve. This is called reserve-deposit ratio and it is calculated thus
Reserve − depositratio =Bankreserve
Deposits

Feedback on Self Assessment Questions
81
From the above, bank deposits can be solved for. To do so, cross multiply the above equation and divide through by reserve-deposit ratio. This yields the following
Bank deposits =Bank reserves
Desired reserve − Deposit ratio
Let deposits be 2,000,000, while reserve-deposit ratio desired by banks be 0.10 (10% of total deposit). Then, bank deposit can be calculated thus:
Bank deposit =2,000,000
0.1= 20,000,000
SAQ 5.1 Government spending represents expenses or costs carried out by the government of a country. These include expenditure on provision of goods and services, internal and external securities, provision of social security’s – unemployment benefits, pension schemes etc.
There are various forms of government spending, these include:
Current Expenditure: This form of government spending takes care of expenditure on public health, public education, street light, public roads, and purchases of material for public office use, purchase of labour services and so on. It is otherwise known as government consumption expenditure on goods and services.
Capital Expenditure: This form of spending deals with expenses that creates future benefits. A capital expenditure is incurred when the government spends money either to buy fixed assets or to add to the value of an existing fixed assets with a useful life extending beyond the taxable years. Examples are expenditures on Capital projects like, construction of Refineries, Dams Electricity etc.
Transfer payments: This represents government expenditure that is not made in return for currently produced goods and services. This covers activities like the payment of old-age pensioners, pensioners’ gratuity, unemployment benefit, student grants, and interest paid on the national debt the government is not purchasing any currently produced goods or services from all these activities, hence they are recognised as “transfer payments”.
SAQ 5.2 There are three (3) major sources of government revenue, these are:
• Taxation • Borrowing, and • Selling of bonds and bills.
Taxation: This is a compulsory payments made by individual, firms and corporate organizations to government to settle its expenses. Taxes can be indirect or direct. Indirect taxes are taxes that do not depend on level of income. Such taxes include tariff, poll tax, sales tax and value added tax,. This type of tax can also be called lump-sum tax.
Direct taxes are taxes levied on the level of income. There are three of such. These are proportional tax, progressive tax and regressive tax. Proportional tax is a flat rate of tax which is paid by every worker. It is a share of one’s income that must be set aside as tax. The higher one’s
82
ECO102ECO102ECO102ECO102 Introductory Economics II
income, the greater the tax paid. Progressive tax on the other hand is a system where the rate of tax itself depends on the income earned. In this case, rate of tax is no more the same across income category. In fact, the higher the income, the higher the tax rate. However, it’s worthy to note that the bulk of government revenue comes from taxation.
Borrowing: Government also generate lots of money through borrowing. This can either be internal or external borrowing. Internal borrowings are borrowing made by government from individuals and corporate organizations within the economy. External borrowings are borrowing made by government outside its own economy. This form of borrowing involves borrowing from international organizations like World Bank, International Monetary Fund (IMF), African Development Bank (AFDB), United Nations etc.
Selling of bonds and bills: Government can also source for fund through the sale of government securities such as Treasury Bills (T-bill) and other government bonds. Government sells the treasury bills to the private individuals who have more than enough money to hold. Thus, they buy government security and pay with cash. This is also a means of regulating the amount of money in circulation.
SAQ 5.3
A budget can be defined as a financial statement of a proposed expenditure and the expected revenue of government over a given period of time which can be monthly, quarterly, or yearly basis. The term “budget” simply refers to a financial statement made by the government explaining the details in terms of planned expenditure to be expended by government as well as the expected revenue (income) over a given period of time.
Therefore, budget balance is the difference between total government expenditure, that is, taxes minus government expenditure. Budget can either be surplus, deficit or balanced budget. Surplus budget implies a situation whereby government expected revenue is greater than its expected income. On the other hand, deficit budget explains a situation whereby government proposed expenditures outweigh its expected revenue. However, when these two are equal, we say the government plans a balanced budget.
SAQ 5.3
There are two forms of stabilization policies; these are the monetary policy and the fiscal policy. Thus, the fiscal policy instruments used by the government to stabilize the economy are government expenditure policy and government tax policy. Changes in government spending were probably the most effective instrument for offsetting recession, according to John Keynes. Remember, that the components of aggregate demand are consumption, investment, government expenditure for a closed economy. Government purchases of goods and services are a component of aggregate demand, so aggregate demand is directly affected by changes in government purchases. Thus, the increase in government purchases eliminates the necessary output gap. Also, through changes in

Feedback on Self Assessment Questions
83
government expenditure, which is one of the fiscal policy instruments of government, output gap can be affected.
In the same way, government also determines the level of tax collections and transfer payments. From the Keynesian’s point of view, changes in the level of taxes or transfer can be used to affect aggregate demand and thus to reduce or eliminate output gap. Meanwhile, the effect of tax policy on aggregate demand is indirect. Changes in taxes affect aggregate demand by first of all changing private disposable income. For instance, a reduction in tax or an increase in transfer payments will increase disposable income. What this turns out to mean is that more money is available for consumption by the private sector. It thus appears that changes in taxes and transfer will affect aggregate output to the extent that consumers/private sector change the level of spending.
SAQ 6.1
International trade is a trade between two or more countries. It’s a trade across the borders of a country. International trade can also be described as a form of relationship between two or more countries such that goods and services are being traded in the form of exchange through the use of money. Several reasons account for why there is need for international trade. Some of these reasons are highlighted below:
• No country is self- complacent or self-satisfied with the goods and services produced only in his country.
• Resources, both natural and human resources are not evenly distributed. Hence, the variation in goods and services each country can produce.
• Levels of technology are not the same across countries. • No country can produced all the goods and services needed for
survival.
There are two strains or components of international trade. These are export and imports. Sales of domestic goods to the rest of the world (or outflow of goods to the rest of the world) are called exports, while the purchase of foreign goods (or inflow of goods and services from the rest of the world) is called imports. There are series of theories propounded for the justification of engaging in international transactions. These include theories like comparative advantage, new world trade theory and so on. Terms used in international trade include terms of trade, balance of trade and balance of payment.
SAQ 6.2
An open economy is an economy that allows for inflow and outflow of goods and services. It is an economy who relates with the rest of the world by exchanging their goods and services with other economies in the world. To attain equilibrium in an open economy, the aggregate demand which were Consumption, Investment and Government purchase in a closed economy will now include net export (X-M) component. However, equilibrium output is still the same level of output at which desired aggregate demand equals national output/income.
To establish equilibrium in an open economy using the previous example in the text, let us rewrite our aggregate demand function and incorporate
84
ECO102ECO102ECO102ECO102 Introductory Economics II
net export component. To put the matter very simple, let us assume that planned aggregate demand is given by:
AD = C + I + G + NX
Let C = 610 + 0.8Y; I = 220; and G = 300; NX = 10 and T = 250
Note that planned private consumption has fallen by 10-unit but this has been taken care of by NX which is 10. Equilibrium output can be achieved as follows:
AD = 610 + 0.8 (Y – 250) + 220 + 300 + 10
= 610 + 0.8Y – 200 + 220 + 300 + 10
AD = 940 + 0.8Y
at equilibrium, AD = Y, thus, 940+0.8Y= Y
collect like terms such that Y–0.8Y = 940
Y(1–0.8)= 940
Y(0.2) = 940
0.2Y= 940
hence, Y = 940/0.2 = 4700.
This implies that the equilibrium has been restored but in this case through net export surplus.
SAQ 7.1 (tests Learning Outcome 7.1)
How will explain the concept of productivity?
Answer:
Productivity is the ratio of output to input in production. It is an average measure of the efficiency of production. Productivity can also be defined as a measure of efficiency of a person, machine, factory system etc in converting inputs into output. Common to these two definitions is the term efficiency of production. Thus, efficiency of production mans production’s capability to create income which is measured by the formula real output value minus real input value. Thus, productivity is about the effective and efficient use of all resources which include time, people, knowledge and mineral resources.
SAQ 7.2
Several factors serve as determinants of labour productivity. These factors include:
• Human Capital • Physical Capital • Land and other Natural Resources • Technology • Entrepreneurship and Management • The Political and Legal Environment

Feedback on Self Assessment Questions
85
You may see section 7.2 for further details on how these factors help to promote and ensure the efficiency of labour and improve labour productivity.
86
ECO102ECO102ECO102ECO102 Introductory Economics II
ReferencesReferencesReferencesReferences
Dasoupta; Partha, Amartya Sen and Stephen Bardin, (1972). Guideline for Project Evaluation, UNIDO, New York: Vienna, Series No.2.
Ekpenyong, B.E. (1993). Fundamentals of Project Analysis-An Integrated Approach, Heinemann Educational Books (Nigeria) Plc.
Inanga, E.L. (1985). Principles of Accounting, Heinemann Educational Books Ibadan (Nig.) Ltd., Nigeria.
Karl E. Case and Ray C. Fair, Principles of Economics, Prentice Hall, 6th ed.
Kayode, M.O. (1979). The Art of Project Evaluation, Ibadan: University Press, Ibadan.
Little, I.M.D and J.A. Mirrless (1980). Project Appraisal and Planning for Developing Countries, London: Heinemann Educational Books.
OECD (Organisation for Economic Co-operation and Development) 2001, OECD Productivity Manual: A Guide to the Measurement of Industry – level and Aggregate Productivity Growth, OECD, Paris.
Olaoye, C.O., 2006. Analysis of Government Finance. 1st Edn., Clemart Publishing, Kwara State.
Parham, D. and Zheng, S. 2006, ‘Aggregate and Industry Productivity Estimates for Australia’, Australian Economic Review, vol. 39, no. 2, pp. 216 – 226
Robert. H. Frank and Ben S. Bernanke, (2007) Principles of Economics, McGraw-Hill Irwin, 3rd ed.
Smith, Charles (2007). International Trade and Globalisation, 3rd edition. Stocksfield: Anforme.