Eastern Mediterranean La Revue de Santé de la ... - Sign in
125
La Revue de Santé de la Méditerranée orientale Eastern Mediterranean Health Journal Volume 26 / No. 4 April/Avril 4 دون / عددس والعلساجلد ا ايسان أبريل / ن2020 World Health Day celebrates the role of nurses and midwives and highlights the central role of these professions in advancing universal health coverage, achieving health-related sustainable development goals, and the Eastern Mediterranean Region Vision 2023: Health for All by All
-
Upload
khangminh22 -
Category
Documents
-
view
0 -
download
0
Transcript of Eastern Mediterranean La Revue de Santé de la ... - Sign in
La Revue de Santé de la Méditerranée orientale
Eastern Mediterranean Health Journal
Volume 26 / No. 4April/Avril
املجلد السادس والعرشون / عدد 42020 أبريل / نيسان
World Health Day celebrates the role of nurses and midwives and highlights the central role of these professions in advancing universal health coverage, achieving health-related sustainable development goals, and the Eastern Mediterranean Region Vision 2023: Health for All by All

Eastern Mediterranean Health Journal
IS the official health journal published by the Eastern Mediterranean Regional Office of the World Health Organization. It is a forum for the presentation and promotion of new policies and initiatives in public health and health services; and for the exchange of ideas, concepts, epidemiological data, research findings and other information, with special reference to the Eastern Mediterranean Region. It addresses all members of the health profession, medical and other health educational institutes, interested NGOs, WHO Collaborating Centres and individuals within and outside the Region.
املجلة الصحية لرشق املتوسط هى املجلة الرسمية التى تصدر عن املكتب اإلقليمى لرشق املتوسط بمنظمة الصحة العاملية. وهى منرب لتقديم السياسات واملبادرات اجلديدة يف الصحة العامة واخلدمات الصحية والرتويج هلا، ولتبادل اآلراء واملفاهيم واملعطيات الوبائية ونتائج األبحاث وغري ذلك من املعلومات، وخاصة ما يتعلق منها بإقليم رشق املتوسط. وهى موجهة إىل كل أعضاء املهن الصحية، والكليات الطبية وسائر املعاهد التعليمية، وكذا املنظامت غري احلكومية املعنية، واملراكز املتعاونة مع منظمة
الصحة العاملية واألفراد املهتمني بالصحة ىف اإلقليم وخارجه.
La Revue de Santé de la Méditerranée Orientale
EST une revue de santé officielle publiée par le Bureau régional de l’Organisation mondiale de la Santé pour la Méditerranée orientale. Elle offre une tribune pour la présentation et la promotion de nouvelles politiques et initiatives dans le domaine de la santé publique et des services de santé ainsi qu’à l’échange d’idées, de concepts, de données épidémiologiques, de résultats de recherches et d’autres informa-tions, se rapportant plus particulièrement à la Région de la Méditerranée orientale. Elle s’adresse à tous les professionnels de la santé, aux membres des instituts médicaux et autres instituts de formation médico-sanitaire, aux ONG, Centres collaborateurs de l’OMS et personnes concernés au sein et hors de la Région.
Correspondence
Editor-in-chief
Eastern Mediterranean Health JournalWHO Regional Office for the Eastern MediterraneanP.O. Box 7608 Nasr City, Cairo 11371 Egypt Tel: (+202) 2276 5000 Fax: (+202) 2670 2492/(+202) 2670 2494 Email: [email protected]
Members of the WHO Regional Committee for the Eastern Mediterranean Afghanistan . Bahrain . Djibouti . Egypt . Islamic Republic of Iran . Iraq . Jordan . Kuwait . Lebanon Libya . Morocco . Oman . Pakistan . Palestine . Qatar . Saudi Arabia . Somalia . Sudan . Syrian Arab RepublicTunisia . United Arab Emirates . Yemen
البلدان أعضاء اللجنة اإلقليمية ملنظمة الصحة العاملية لرشق املتوسط األردن . أفغانستان . اإلمارات العربية املتحدة . باكستان . البحرين . تونس . ليبيا . مجهورية إيران اإلسالمية
اجلمهورية العربية السورية . جيبويت . السودان . الصومال . العراق . ُعامن . فلسطني . قطر . الكويت . لبنان . مرص . املغرباململكة العربية السعودية . اليمن
Membres du Comité régional de l’OMS pour la Méditerranée orientale Afghanistan . Arabie saoudite . Bahreïn . Djibouti . Égypte . Émirats arabes unis . République islamique d’Iran Iraq . Libye . Jordanie . Koweït . Liban . Maroc . Oman . Pakistan . Palestine . Qatar . République arabe syrienne Somalie . Soudan . Tunisie . Yémen
Subscriptions and Permissions
Publications of the World Health Organization can be obtained from Knowledge Sharing and Production, World Health Organization, Regional Office for the Eastern Mediterranean, PO Box 7608, Nasr City, Cairo 11371, Egypt (tel: +202 2670 2535, fax: +202 2670 2492; email: [email protected]). Requests for permission to reproduce, in part or in whole, or to translate publications of WHO Regional Office for the Eastern Mediterranean – whether for sale or for noncommercial distribution – should be addressed to WHO Regional Office for the Eastern Mediterranean, at the above address; email: [email protected].
EMHJ is a trilingual, peer reviewed, open access journal and the full contents are freely available at its website: http://www/emro.who.int/emhj.htm
EMHJ information for authors is available at its website: http://www.emro.who.int/emh-journal/authors/
EMHJ is abstracted/indexed in the Index Medicus and MEDLINE (Medical Literature Analysis and Retrieval Systems on Line), ISI Web of knowledge, the Cumulative Index to Nursing and Allied Health Literature (CINAHL), Embase, Lexis Nexis, Scopus and the Index Medicus for the WHO Eastern Mediterranean Region (IMEMR).
© World Health Organization (WHO) 2020. Open Access. Some rights reserved.This work is available under the CC BY-NC-SA 3.0 IGO licence (https://creativecommons.org/licenses/by-nc-sa/3.0/igo).
Disclaimer The designations employed and the presentation of the material in this publication do not imply the expression of any opinion whatsoever on the part of WHO concerning the legal status of any country, territory, city or area or of its authorities, or concerning the delimitation of its frontiers or boundaries. Dotted and dashed lines on maps represent approximate border lines for which there may not yet be full agreement.
The mention of specific companies or of certain manufacturers’ products does not imply that they are endorsed or recommended by WHO in preference to others of a similar nature that are not mentioned. Errors and omissions excepted, the names of proprietary products are distinguished by initial capital letters.
All reasonable precautions have been taken by WHO to verify the information contained in this publication. However, the published material is being distributed without warranty of any kind, either expressed or implied. The responsibility for the interpretation and use of the material lies with the reader. In no event shall WHO be liable for damages arising from its use.
The authors alone are responsible for the views expressed in this publication and they do not necessarily represent the views, decisions or policies of the institutions with which they are affiliated.
If authors are staff members of the World Health Organization, the authors alone are responsible for the views expressed in this publication and do not necessarily represent the decisions, policy or views of the World Health Organization.
ISSN 1020-3397
Cover 26-02.indd 4-6Cover 26-02.indd 4-6 2/23/2020 10:30:31 AM2/23/2020 10:30:31 AM

Vol. 26.04 – 2020
La Revue de Santé de la Méditerranée orientale
Eastern Mediterranean Health Journal
Editorial
2020 – the year of the nurse and midwife: a call for action to scale up and strengthen the nursing and midwifery workforce in the Eastern Mediterranean RegionAhmed Al-Mandhari, F Gulin Gedik, Awad Mataria, Arwa Oweis and Rana Hajjeh .......................................................................................370
Commentary
Do WHO pharmaceutical pricing guidelines help low- and middle-income countries to price medicines rationally?Mehrnaz Kheirandish ............................................................................................................................................................................................................372
Research articles
Food safety knowledge, attitudes and self-reported practices among food handlers in Sohag Governorate, EgyptAhmed Hamed and Nesreen Mohammed.......................................................................................................................................................................374
Household disaster preparedness in the Islamic Republic of Iran: 2015 estimationAli Ardalan, Homa Yusefi, Narges Rouhi, Ahad Banar and Sanaz Sohrabizadeh ...............................................................................................382
Profile of risk factors for noncommunicable diseases in major cities of Afghanistan: WHO STEPwise approachKhwaja Mir Islam Saeed, Mohammad Rasooly and Malalai Nejaby ................................................................................................................... 388
Developing a national minimum data set for hospital information systems in the Islamic Republic of IranZahra Rampisheh, Mohammad Kameli, Javad Zarei, Akram Vahedi Barzaki, Marziyhe Meraji and Ali Mohammadi ......................400
Life satisfaction and its contributors among noninstitutionalized older people in Tabriz, Islamic Republic of IranAkbar Zeinalhajlou, Mahasti Alizadeh, Mohammad Sahebihagh, Asghar Mohammadpoorasl and Hossein Matlabi ........................410
Myths about modern and traditional contraceptives held by women in Minia, Upper EgyptEhab Eshak ................................................................................................................................................................................................................................. 417
Impact of the 2017 American College of Cardiology/American Heart Association Hypertension Guideline on the prevalence of hypertension in young Saudi womenMaha Al-Mohaissen, Qumasha Al-Obaid, Wafa AlGhamdi, Haneen Al-Alyani, Sheima Dahman, Nora Al-Wahhabi, Noura Al-Awaji and Terry Lee ........................................................................................................................................................ 426
Knowledge and attitudes towards Middle East respiratory sydrome-coronavirus (MERS-CoV) among health care workers in south-western Saudi ArabiaAhmed Asaad, Rehab El-Sokkary, Mahdi Alzamanan and Maher El-Shafei ........................................................................................................435
Complementary and alternative medicine use for weight management among females in Jordan; a community-based surveyMayadah Shehadeh, Ghadeer Suaifan, Alaa Abu-Odeh and Rula Darwish ......................................................................................................... 443
Baseline survey for malaria prevalence in Khyber Pakhtunkhwa Province, PakistanHumera Qureshi, Muhammad Imran Khan, Henock Ambachew, Hai-Feng Pan and Dong-Qing Ye ........................................................453
Prevalence of hepatitis B and anti-hepatitis C virus antibody among people who inject drugs in the Lebanese populationAntoine Abou Rached, Mary Nakhoul, Carine Richa, Afif Jreij, Pierre Abi Hanna and Walid Ammar .......................................................461

Reviews
The public health care system and primary care services in Saudi Arabia: a system in transitionMushabab Al Asmri, Mohammed J. Almalki, Gerry Fitzgerald and Michele Clark ......................................................................................... 468
Factors associated with tuberculosis diagnosis and treatment delays in Middle East and North Africa: a systematic reviewDalya Eltayeb, Elize Pietersen, Mark Engel and Leila Abdullahi ..............................................................................................................................477
WHO events addressing public health priorities
Findings of the midterm review of the implementation of the global health sector strategy and regional action plan for viral hepatitis .................................................................................................................................................................... 487
Ahmed Al-Mandhari Editor-in-ChiefArash Rashidian Executive EditorAhmed Mandil Deputy Executive EditorPhillip Dingwall Managing Editor
Editorial BoardZulfiqar Bhutta Mahmoud Fahmy Fathalla Rita Giacaman Ahmed Mandil Ziad Memish Arash Rashidian Sameen Siddiqi Huda Zurayk
International Advisory Panel Mansour M. Al-Nozha Fereidoun Azizi Rafik Boukhris Majid Ezzati Hans V. Hogerzeil Mohamed A. Ghoneim Alan Lopez Hossein Malekafzali El-Sheikh Mahgoub Hooman Momen Sania Nishtar Hikmat Shaarbaf Salman Rawaf
Editorial assistantsNadia Abu-Saleh, Suhaib Al Asbahi (graphics), Diana Tawadros (graphics)
Editorial supportGuy Penet (French editor)Eva Abdin, Fiona Curlet, Cathel Kerr, Marie-France Roux (Technical editors)Ahmed Bahnassy, Abbas Rahimiforoushani, Manar El Sheikh Abdelrahman (Statistics editors)
Administration Iman Fawzy, Marwa Madi
Web publishingNahed El Shazly, Ihab Fouad, Hazem Sakr
Library and printing supportHatem Nour El Din, Metry Al Ashkar, John Badawi, Ahmed Magdy, Amin El Sayed
Cover and internal layout designed by Diana Tawadros and Suhaib Al AsbahiPrinted by WHO Regional Office for the Eastern Mediterranean, Cairo, Egypt
EMHJ – Vol. 26 No. 4 – 2020Editorial
370
2020 – the year of the nurse and midwife: a call for action to scale up and strengthen the nursing and midwifery workforce in the Eastern Mediterranean Region
1Regional Director; 2Coordinator, Health workforce Development; 3Director, Health Systems and Innovation; 4Regional Advisor, Nursing and Midwife-ry; 5Director of Programme Management; World Health Organization Regional Office for the Eastern Mediterranean, Cairo, Egypt. (Correspondence to: F Gulin Gedik: [email protected]).
Citation: Al-Mandhari A; Gedik FG; Mataria A; Oweis A; Hajjeh R. 2020 – the year of the nurse and midwife: a call for action to scale up and strengthen the nursing and midwifery workforce in the Eastern Mediterranean Region. East Mediterr Health J. 2020;26(4):370–371 https://doi.org/10.26719/2020.26.4.370
Copyright © World Health Organization (WHO) 2020. Open Access. Some rights reserved. This work is available under the CC BY-NC-SA 3.0 IGO license (https://creativecommons.org/licenses/by-nc-sa/3.0/igo).
The World Health Organization (WHO) has declared 2020 as the Year of the Nurse and the Midwife. World Health Day on 7 April is dedicated to supporting nurses and mid-wives and highlights the central role of these professions in advancing universal health coverage, achieving health-related sustainable development goals, and the Eastern Mediterranean Region Vision 2023: Health for All by All (1).
This year, we sadly mark World Health Day in the face of the devastating COVID-19 pandemic, which has brought to attention more than ever the crucial and invaluable role of health workers, who are working tirelessly day and night to care for patients and save lives. In fighting COVID-19, not only might they become infected and put their own lives at risk, but they also face distress and burnout because of long working hours. In addition, many health workers have to be away from their homes for prolonged periods, for fear of putting their own families at risk of acquiring the infection. Even before the pandemic, the safety and security of health workers in the Eastern Mediterranean Region has been a significant concern, as more than half of the countries of the Region face acute and protracted crises, and 70-80% of total recorded attacks on health facilities globally occur in the Eastern Mediterranean Region.
Nurses and midwives make up more than 50% of the health workforce. Multiple studies have revealed the important role of well-educated nurses to address the rise in infectious as well as chronic noncommunicable diseases, in addition to their substantial contribution to improve maternal, infant and child health (2–5). Commitments to strengthen nursing and midwifery have been provided over the years by the World Health Assembly and the Eastern Mediterranean Regional Committee. However, despite this high-level commitment, the Region continues to face deep challenges in ensuring adequate nursing capacity. The State of World Nursing 2020 Report (6), launched on World Health Day, highlights the global shortage of 5.9 million nurses, with the Eastern Mediterranean Region accounting for 17% of this global shortage. While the
global density of nurses is 36.9 per 10 000 population, for the Region it is only 15.6 nurses (6).
Although the number of nursing education programmes and nursing graduates have increased over the past few decades, the density of nurses in the Region has not changed in the majority of Member States, and has even declined in 11 out of 22 countries since 2010. Compared to a global average of 22.6 nurse graduates per 100 000 population, there are only 7.1 nurse graduates per 100 000 population in the Eastern Mediterranean Region – the lowest among all WHO regions. Moreover, in many countries medical graduates outnumbered nursing and midwifery graduates in 2016, thus exacerbating the gap in the skills mix (7).
In order to address the shortage by 2030, the total number of nurse graduates needs to increase by 10% per year on average. In addition, there needs to be an improved capacity to employ and retain these graduates by providing them with adequate incentives (6). The Report on the State of World Nursing 2020 estimates that an additional investment of US$ 10 per capita is needed for nursing education in low- and middle-income countries, a small price to pay for such a highly needed health care skill set.
Advocacy is important to improve the numbers as well as the public perception for nurses and midwives. A three-year global Nursing Now campaign (2018–2020) has been initiated to raise the profile and status of nurses, and influence policy-makers to support nurses and build a global movement (8). Promoting nursing and midwifery as a career choice is also expected to lead to improved public perception, attractiveness and increased enrolment in the nursing and midwifery professions (9).
Despite the continued global and regional efforts to address these challenges, progress in scaling up nursing and midwifery has been slow in the Eastern Mediterranean Region. Therefore, in 2019 the Regional Committee for the Eastern Mediterranean adopted a resolution calling for action to strengthen the nursing workforce in the Region. This call for action, based on a systematic comprehensive approach, emphasized
Ahmed Al-Mandhari,1 F Gulin Gedik,2 Awad Mataria,3 Arwa Oweis 4 and Rana Hajjeh 5

371
EMHJ – Vol. 26 No. 4 – 2020Editorial
primary care nursing by defining and expanding nurses’ roles and scope of practice in order to maximize the utilization of their capacities. Thus, nursing education requires reorientation to respond to countries’ needs and governments must be committed to invest in education, employment and retention of nurses and midwives. Since health systems in the Region are overburdened by growing demands resulting from population increase, ageing and decreased funding, it is important that nurses and midwives become central members of health teams and key promoters of health and well-being. For this
to happen, we need relevant regulatory frameworks, appropriate financing systems and adequate information systems.
In the midst of the COVID-19 pandemic that has already affected the lives of so many health workers, acknowledging and investing in the health workforce, especially nurses and midwives, is crucial (10). The Year of the Nurse and the Midwife provides immense opportunity to take forward the call for action in the Region and enhance the health workforce development agenda.
References1. World Health Organization Regional Office for the Eastern Mediterranean (WHO/EMRO). Eastern Mediterranean Region
Vision 2023: Health for all by all -a call for solidarity and action, Cairo: WHO/EMRO; 2018 (http://www.emro.who.int/about-who/vision2023/vision-2023.html, accessed 1 April 2020).
2. United Nations Children’s Fund (UNICEF). At least one in four children live in poverty in the Middle East and North Africa. Ge-neva: UNICEF; 15 May 2017. (https://www.unicef.org/press-releases/least-one-four-children-live-poverty-middle-east-and-north-africa, accessed 27 March 2020).
3. Speybroeck N, Kinfu Y, Dal Poz MR, Evans DB. Reassessing the relationship between human resources for health, intervention coverage and health outcomes. Geneva: World Health Organization; 2006 (https://pdfs.semanticscholar.org/fb21/eb31a783e802b-2869f291ad29c80bf26ff04.pdf, accessed 27 March 2020).
4. Discoll A, Currey JGM, Davidson PM. Changes in health service delivery for cardiac patients: implications for workforce plan-ning and patient outcomes. Aust Crit Care. 2013;26(2):55–7. https://doi.10.1016/j.aucc.2012.08.001.
5. Persson LÅ, Nga NT, Målqvist M, Hoa DTP, Eriksson L, Wallin L, et al. Effect of facilitation of local maternal-and-newborn stakeholder groups on neonatal mortality: cluster-randomized controlled trial. PLoS Med. 2013;10(5):e1001445. https://doi.10.1371/journal.pmed.1001445.
6. World Health Organization. State of the world’s nursing 2020 report. Geneva, World Health Organization; 2020.
7. World Health Organization Regional Office for the Eastern Mediterranean (WHO/EMRO). Regional health observatory. Data repository. Health workforce: nursing and midwifery by country. Cairo: WHO/EMRO; 2020. (http://www.emro.who.int/entity/statistics/regional-health-observatory.html, accessed 20 March 2020).
8. Nursing Now [website] (www.nursingnow.org, accessed 28 March 2020).
9. Masih S, Gulzar L. Nurses’ self-perception about their public image in a metropolitan city, Karachi. J Dow Uni Health Sci. 2016;10(2):70–74.
10. Editorial, COVID-19: protecting health-care workers. Lancet, Vol 395 March 21, 2020. (http://www.thelancet.com, accessed 1 April 2020).

372
EMHJ – Vol. 26 No. 4 – 2020Commentary
Do WHO pharmaceutical pricing guidelines help low- and middle-in-come countries to price medicines rationally?Mehrnaz Kheirandish 1
1Director-General, Department for Assessment and Control of Prescribing and Use of Medicines and Health Products, Food and Drug Administration, Ministry of Health and Medical Education, Tehran, Islamic Republic of Iran. (Correspondence to: Mehrnaz Kheirandish: [email protected]).
Citation: Kheirandish M. Do WHO pharmaceutical pricing guidelines help low- and middle-income countries to price medicines rationally? East Medi-terr Health J. 2020;26(4):372–373. https://doi.org/10.26719/2020.26.4.372Received: 15/06/19; accepted: 06/11/19Copyright © World Health Organization (WHO) 2020. Some rights reserved. This work is available under the CC BY-NC-SA 3.0 IGO license (https://creativecommons.org/licenses/by-nc-sa/3.0/igo).
Pharmaceutical expenditure accounts for a large share of health expenditure, and one of the main challenges in the countries with limited resources is selection of the most appropriate pharmaceutical pricing method. There are many approaches to pharmaceutical pricing as well as a variety of pharmaceutical production technologies; therefore, health systems often face difficulties in select-ing the best methods that fit their goals. For developing countries, setting affordable medicine prices to ensure people can access the medicines they need, while at the same time supporting the domestic pharmaceutical in-dustry to ensure a sustainable supply chain is a challenge for their health systems (1). Therefore, practical guide-lines are needed that can help low- and middle-income countries by explaining steps for pharmaceutical pricing (2). Equitable access to medicines is a global concern and will not be guaranteed unless medicines are available at a price that the consumer can afford (3). Health systems should ensure that people are able access and buy essen-tial medicines when they need them and in the quanti-ty they need. Hence, not only is rational pharmaceutical pricing required, but also other supportive policies such as insurance coverage or subsidy.
Because of the variety, ambiguity and complexity of the different pharmaceutical pricing methods, countries of the World Health Organization (WHO) Eastern Mediterranean Region need guidelines to explain each of these methods, including their implementation, strengths, limitations and requirements in different country settings. In 2015, WHO developed its guidelines on country pharmaceutical pricing policies to help countries, especially low- and middle-income countries, make appropriate decisions on methods for pricing medicines (4). However, there are still unanswered questions.
First, the high expenditure on pharmaceuticals is not only because of the high cost of medicines, but also because of high consumption (5). Therefore, the total pharmaceutical expenditure needs to be separated from the price of medicines, as each requires different policies. High consumption of medicines could occur because of the irrational use of medicines as a result of self-medication or over-prescribing by physicians. The
routinely adopted pricing policies, such as the cost plus method, are usually more effective if the main aim is to control expenditure. Implementation of an essential medicines list and evidence-based guidelines which are not directly linked to pricing policies (6,7) should be complemented with pricing policies when the main concern is high and irrational consumption.
Second, consideration of the technology for the production of medicines is important in choosing the pricing method. For example, most of the expensive medicines are new and/or specialized medicines with no available generic forms. Controlling the price of these medicines through generally recommended policies such as cost plus or reference pricing is difficult because often valid reference prices are limited and the production costs are unclear to policy-makers (8).
Third, some defined methods, such as generic substitution or health technology assessment, can be used to control medicines prices indirectly (9). These methods have no clear role in setting the price of medicines directly. Therefore, they should not be listed as pricing strategies, but rather as price control strategies. For example, a country might use health technology assessment to reduce the medicine price when the stated price is more than its value according to the results of health technology assessment (10).
Fourth, it is important to distinguish between value-based pricing, mentioned in the WHO guideline, from health technology assessment (4). Defining the value of a medicine is difficult and not a useful way of pricing medicine. For example, if a medicine is life-saving, should it be priced highly? If yes, then this will have major implications for the health system. Also, it is worth noting that value-based pricing can lead to companies determining a high price for their products.
Fifth, one of the pricing methods recommended in the WHO guideline and which is widely used globally is external reference-based pricing. In most countries, especially European countries, external reference-based pricing has been used to first control parallel imports and then pharmaceutical pricing (11). However, for low- and middle-income countries, particularly countries in the Eastern Mediterranean Region, the main goal of using
373
Commentary EMHJ – Vol. 26 No. 4 – 2020
References1. Kheirandish M, Rashidian A, Kebriaeezade A, Cheraghali AM, Soleymani F. A review of pharmaceutical policies in response to
economic crises and sanctions. J Res Pharm Pract 2015;4(3):115–22. http://dx.doi.org/10.4103/2279-042X.162361
2. Nguyen TA, Knight R, Roughead EE, Brooks G, Mant A. Policy options for pharmaceutical pricing and purchasing: issues for low-and middle-income countries. Health Policy Plan. 2015;30(2):267–80. https://doi.org/10.1093/heapol/czt105
3. Cameron AM. Understanding access to medicines in low- and middle-income countries through the use of price and availability indicators. Utrecht University; 2013 Jan 10.
4. WHO guideline on country pharmaceutical pricing policies. Geneva: World Health Organization; 2015 (https://apps.who.int/iris/bitstream/handle/10665/153920/9789241549035_eng.pdf?sequence=1, accessed 1 April 2020).
5. Pharmaceutical expenditure. In: Health at a glance: Europe 2010. Paris: OECD Publishing; 2010. http://dx.doi.org/10.1787/health_glance-2010-en
6. Tele P, Groot W. Cost containment measures for pharmaceuticals expenditure in the EU countries: a comparative analysis. Open Health Services Policy J. 2009;2(1):71–83.
7. Hogerzeil HV. The concept of essential medicines: lessons for rich countries. BMJ. 2004;329(7475):1169–72. http://dx.doi.org/10.1136/bmj.329.7475.1169
8. Connors J. Future sustainability of pharmaceutical expenditure. Spending review 2017. Dublin: Department of Public Expendi-ture & Reform; 2017 (https://assets.gov.ie/7270/e95c3f767abb40c2acca72e81bd94184.pdf, accessed 1 April 2020).
9. Paris V, Belloni A. Value in pharmaceutical pricing. OECD Health Working Paper, No. 63. Paris: OECD Publishing; 2013. http://dx.doi.org/10.1787/5k43jc9v6knx-en
10. Koh L, Glaetzer C, Li SC, Zhang M. Health technology assessment, international reference pricing, and budget control tools from China’s perspective: what are the current developments and future considerations? Value Health Reg Issues. 2016;9:15–21. http://dx.doi.org/10.1016/j.vhri.2015.06.004
11. Geng D, Saggi K. External reference pricing policies, price controls, and international patent protection. Nashville: Department of Economics, Vanderbilt University; 2015 (https://my.vanderbilt.edu/kamalsaggi/files/2011/08/ERP-Geng-Saggi-Sept-16.pdf, accessed 1 April 2020).
this method is to price medicines. Therefore, the correct implementation of this method is critical due to the many different country settings. For example, choosing reference countries, determining valid prices and maintaining the same price in neighbouring countries are important considerations. In addition, having adequate cooperation and coordination between countries in the same region is necessary if using this method.
In conclusion, a guideline on pharmaceutical pricing methods, to be more useful, should provide clear step-by-step advice on how to implement pricing approaches in practice, so that the dos and don’ts of each approach
are clear. Such a guideline should also avoid general recommendation of methods that are subject to wide interpretation and misuse, for example, value-based pricing. In addition, it is important to separate the discussion of tools and resources that can help price setting (for example, health technology assessment) from the pricing approaches. Ideally, a guideline on pharmaceutical pricing methods should help countries with different health system capacity and resources select pricing approaches that assist them in enhancing access to medicines and improving universal health coverage.
EMHJ – Vol. 26 No. 4 – 2020Research article
374
Food safety knowledge, attitudes and self-reported practices among food handlers in Sohag Governorate, EgyptAhmed Hamed 1 and Nesreen Mohammed 1
1Department of Public Health and Community Medicine, Faculty of Medicine, Sohag University, Sohag, Egypt. (Correspondence to: Nesreen Moham-med: [email protected]).
Introduction Safe food is defined as not causing harm or illness to the consumer (1). Changing lifestyles and living and working conditions have given rise to a greater number of work-ing women relying on convenience foods (fast foods) and greater negligence of food safety and hygiene. Lack of attention to food safety and hygiene causes an increase in foodborne diseases (2,3), which are important public health problems worldwide (4). These illnesses are gen-erally transmitted by ingestion of viable pathogens or their toxins in amounts that are enough to cause illness (5). Low- and middle-income countries are much more af-fected by foodborne diseases because of poor food safety training, noncompliance with hygiene practices, inade-quate potable water and unhygienic storage (6).
The World Health Organization determined five factors connected to the occurrence of foodborne illnesses including unhygienic practices and insufficient sanitation by food handlers, inadequate cooking
procedures, improper storage without considering temperature requirements, cross-contamination, and sourcing food from unsafe places (3). Most of these factors are the responsibility of food handlers who are involved in food production and preparation. Food handling includes all steps of storing, preparing and preserving food until it reaches final consumption (7).
Studies have found pathogenic microbes on food handlers’ hands, and therefore these workers are a source of foodborne diseases (8,9). Furthermore, previous studies have demonstrated an association between inadequate knowledge, attitudes, and practices among food handlers and the occurrence of food poisoning (10–12). In addition, food handlers’ attitudes have an important effect on their practices (13).
This study determined the knowledge, attitudes and self-reported practices of food handlers in Sohag Governorate, Egypt, with regard to food safety, and the sociodemographic and work-related factors associated with their knowledge, attitudes and practices.
AbstractBackground: Foodborne diseases are of public health importance worldwide. Most of the factors related to their occur-rence are the responsibility of food handlers.Aims: This study aimed to determine the knowledge, attitudes and self-reported practices of food handlers in Sohag Gov-ernorate about food safety and the factors affecting their knowledge, attitudes and practices.Methods: A cross-sectional study was done from May 2016 to March 2017 with food handlers working in cafeterias, restaurants, food establishments and roadside food stands from four randomly selected districts in Sohag Governorate. A questionnaire was used to collect data on their sociodemographic characteristics – age, sex, residence (urban, rural), education (illiterate, primary, preparatory, secondary, university) and job (cook, assistant) – and food safety knowledge, attitudes and practices.Results: Of the 994 food handlers included in the study, 39.2% had good knowledge of food safety, 61.2% had positive atti-tudes and 56.3% reported good food safety practices. In univariate logistic regression, most of the variables were signifi-cantly associated with participants’ knowledge. Only residence and education were significantly associated with positive attitudes. None of the variables was significantly associated with participants’ practices. In multivariable logistic regres-sion analysis, age, male sex, urban residence, higher education and working as a cook were strongly associated with good knowledge. Residence and education significantly influenced positive attitudes.Conclusion: Food handlers in our sample had poor knowledge of food safety and inadequate compliance with food safety practices. Educational and training programmes should be implemented to improve their knowledge, attitudes and prac-tices.Keywords: food safety, food handlers, hygiene, foodborne diseases, Egypt
Citation: Hamed A; Mohammed N. Food safety knowledge, attitude and self-reported practices among food handlers in Sohag Governorate, Egypt. East Mediterr Health J. 2020;26(4):374–381. https://doi.org/10.26719/emhj.19.047
Received: 24/12/17; accepted: 25/07/18
Copyright © World Health Organization (WHO) 2020. Open Access. Some rights reserved. This work is available under the CC BY-NC-SA 3.0 IGO license (https://creativecommons.org/licenses/by-nc-sa/3.0/igo).

Research article
375
EMHJ – Vol. 26 No. 4 – 2020
MethodsStudy designThis was a cross-sectional study conducted from May 2016 to March 2017 in Sohag Governorate. The target population was food handlers in cafeterias, restaurants, food establishments and roadside food stands in selected districts of the governorate.
Study setting and sample selectionSohag Governorate has an estimated population of 4.9 million and 12 districts. Multistage sampling was used to select the sample. Four districts – Sohag, Akhmim, Girga, and Tama – were selected by simple random sampling out of the 12 districts. From each district, four regions were randomly chosen: one urban and three rural regions because of the smaller number of food establishments in rural regions compared with urban regions.
All food handlers (involved in preparing and serving food) in the selected areas who consented to participate after the purpose of the research had been explained to them were included. Food handlers who declined to participate in the study were excluded. There were no other exclusion criteria.
Questionnaire and data collection An interview questionnaire in Arabic was prepared
based on validated questionnaires of previous studies (14,15) to gather data about sociodemographic characteristics, food safety knowledge (15 items), attitude (15 items) and self-reported practices (19 items) of the participants.
Correct responses were scored 2 while incorrect answers were scored 0. The score range was 0–30. Food safety attitudes and self-reported practices were evaluated with a five-point Likert scale. For items under the attitudes section, positively worded questions were scored as follows: strongly agree (4), agree (3), neutral (2), disagree (1) and strongly disagree (0). In contrast, for negatively worded items, “strongly agree” was scored 0 and “strongly disagree” was scored 4. The scores ranged from 0 to 60. For positively worded self-reported practices, “always” was scored 4 with “never” scoring 0. Again, this was reversed for the negatively worded questions and the score range was 0–76.
Total scores equal to or more than 50% of the maximum scores of knowledge, attitude or practices were categorized as good, while lower scores were considered poor or unsatisfactory.
Data analysis SPSS, version 22 (16) was used for data entry and analysis. Categorical data are presented as numbers and percent-ages. The data were tested for normality using the Shap-iro–Wilk test. As the data were not normally distributed, nonparametric tests were used to test difference between variables: Mann–Whitney, Kruskal–Wallis and Spear-man correlation. The association between good knowl-edge, attitudes and practices and the studied variables
were examined using bivariate and multivariable logistic regression analyses, and odds ratios (ORs) and 95% con-fidence intervals (95% CI) are presented. The variables were: age, sex, residence (urban/rural), education (illiter-ate, primary, preparatory, secondary, university) and job, (cook/assistant). A P-value less than 0.05 was considered statistically significant.
Ethical considerationsThe study was approved by the Research Ethics Commit-tee of the Faculty of Medicine, Sohag University, Egypt. Informed verbal consent was obtained from all respond-ents. The questionnaires used in information gathering were anonymous and confidentiality of data was guaran-teed.
ResultsOur study included 994 food handlers. Those who de-clined to participate were not counted. The mean age (standard deviation, SD) of the participants was 31.7 (SD 9.9) years (range 16–55 years). Most were males (805, 81.0%) and 531 (53.4%) were rural residents. About one-fifth of the participants (189, 19.0%) were illiterate, 318 (32.0%) had primary education, 184 (18.5%) had preparato-ry and 227 (22.8%) had secondary education; only 76 (7.6%) had university education. About one third (346, 34.8%) of the respondents were cooks and 648 (65.2%) were assis-tants. The mean of years of experience was 9.6 (SD 6.3) years.
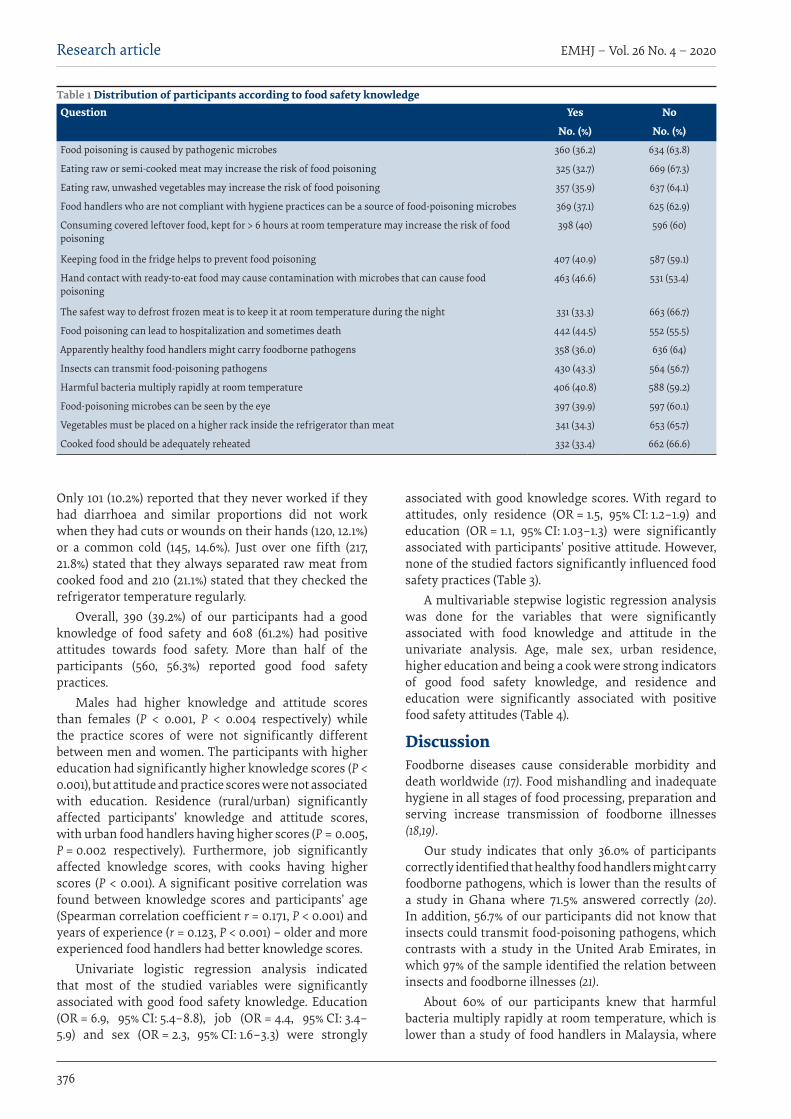
Only about one third of the participants correctly answered the knowledge questions about the increased risk of food poisoning from eating raw or semi-cooked meat (325, 32.7%), raw unwashed vegetables (357, 35.9%), and covered leftover food kept for more than 6 hours at room temperature (398, 40.0%). Just over half of the food handlers (56.7%) did not know that insects can transmit food-poisoning pathogens (564, 56.7%) and that harmful bacteria multiply rapidly at room temperature (588, 59.2%) (Table 1).
Regarding the participants’ food safety attitudes, 435 (43.8%) considered that safe food handling is an essential part of their job; an approximate proportion (426, 42.9%) thought that food safety training courses are necessary; 43.6% (433) agreed that raw and cooked foods should be separated; and 334 (33.6%) did not agree that wiping vegetables or fruit makes them safe to eat. Nearly one third of the participants did not think that food handlers could be a source of outbreaks of food poisoning (311, 31.3%) and did not agree that thorough washing of vegetables and fruits is mandatory to prevent food poisoning (325, 32.7%). Less than half of the participants (447, 45.0%) agreed that vegetables and raw meat should not be cut on the same chopping board, 448 (45.1%) considered that long nails could be a source of pathogens and (466, 46.9%) agreed that food handlers should have a medical examination twice a year.
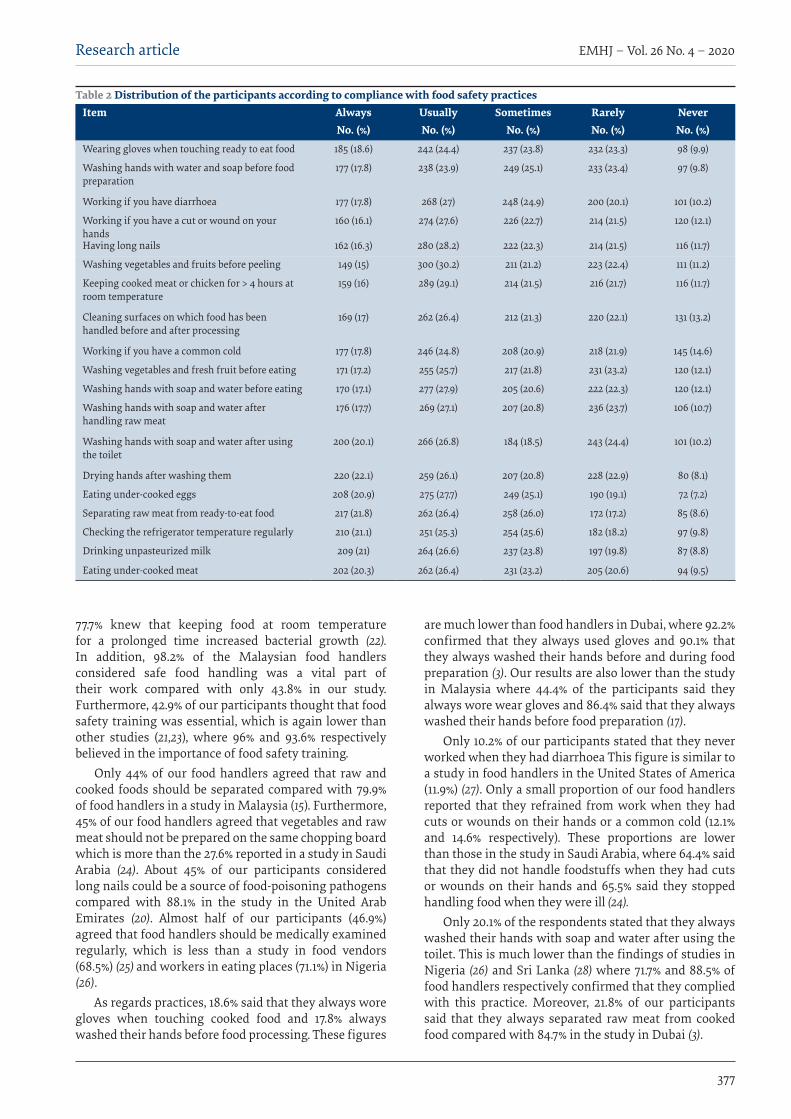
Table 2 shows that only 185 (18.6%) of the participants always wore gloves when touching cooked food and 177 (17.8%) always washed their hands before food processing.
EMHJ – Vol. 26 No. 4 – 2020Research article
376
Only 101 (10.2%) reported that they never worked if they had diarrhoea and similar proportions did not work when they had cuts or wounds on their hands (120, 12.1%) or a common cold (145, 14.6%). Just over one fifth (217, 21.8%) stated that they always separated raw meat from cooked food and 210 (21.1%) stated that they checked the refrigerator temperature regularly.
Overall, 390 (39.2%) of our participants had a good knowledge of food safety and 608 (61.2%) had positive attitudes towards food safety. More than half of the participants (560, 56.3%) reported good food safety practices.
Males had higher knowledge and attitude scores than females (P < 0.001, P < 0.004 respectively) while the practice scores of were not significantly different between men and women. The participants with higher education had significantly higher knowledge scores (P < 0.001), but attitude and practice scores were not associated with education. Residence (rural/urban) significantly affected participants’ knowledge and attitude scores, with urban food handlers having higher scores (P = 0.005, P = 0.002 respectively). Furthermore, job significantly affected knowledge scores, with cooks having higher scores (P < 0.001). A significant positive correlation was found between knowledge scores and participants’ age (Spearman correlation coefficient r = 0.171, P < 0.001) and years of experience (r = 0.123, P < 0.001) – older and more experienced food handlers had better knowledge scores.
Univariate logistic regression analysis indicated that most of the studied variables were significantly associated with good food safety knowledge. Education (OR = 6.9, 95% CI: 5.4–8.8), job (OR = 4.4, 95% CI: 3.4–5.9) and sex (OR = 2.3, 95% CI: 1.6–3.3) were strongly
associated with good knowledge scores. With regard to attitudes, only residence (OR = 1.5, 95% CI: 1.2–1.9) and education (OR = 1.1, 95% CI: 1.03–1.3) were significantly associated with participants’ positive attitude. However, none of the studied factors significantly influenced food safety practices (Table 3).
A multivariable stepwise logistic regression analysis was done for the variables that were significantly associated with food knowledge and attitude in the univariate analysis. Age, male sex, urban residence, higher education and being a cook were strong indicators of good food safety knowledge, and residence and education were significantly associated with positive food safety attitudes (Table 4).
Discussion Foodborne diseases cause considerable morbidity and death worldwide (17). Food mishandling and inadequate hygiene in all stages of food processing, preparation and serving increase transmission of foodborne illnesses (18,19).
Our study indicates that only 36.0% of participants correctly identified that healthy food handlers might carry foodborne pathogens, which is lower than the results of a study in Ghana where 71.5% answered correctly (20). In addition, 56.7% of our participants did not know that insects could transmit food-poisoning pathogens, which contrasts with a study in the United Arab Emirates, in which 97% of the sample identified the relation between insects and foodborne illnesses (21).
About 60% of our participants knew that harmful bacteria multiply rapidly at room temperature, which is lower than a study of food handlers in Malaysia, where
Table 1 Distribution of participants according to food safety knowledge Question Yes No
No. (%) No. (%)Food poisoning is caused by pathogenic microbes 360 (36.2) 634 (63.8)
Eating raw or semi-cooked meat may increase the risk of food poisoning 325 (32.7) 669 (67.3)
Eating raw, unwashed vegetables may increase the risk of food poisoning 357 (35.9) 637 (64.1)
Food handlers who are not compliant with hygiene practices can be a source of food-poisoning microbes 369 (37.1) 625 (62.9)
Consuming covered leftover food, kept for > 6 hours at room temperature may increase the risk of food poisoning
398 (40) 596 (60)
Keeping food in the fridge helps to prevent food poisoning 407 (40.9) 587 (59.1)
Hand contact with ready-to-eat food may cause contamination with microbes that can cause food poisoning
463 (46.6) 531 (53.4)
The safest way to defrost frozen meat is to keep it at room temperature during the night 331 (33.3) 663 (66.7)
Food poisoning can lead to hospitalization and sometimes death 442 (44.5) 552 (55.5)
Apparently healthy food handlers might carry foodborne pathogens 358 (36.0) 636 (64)
Insects can transmit food-poisoning pathogens 430 (43.3) 564 (56.7)
Harmful bacteria multiply rapidly at room temperature 406 (40.8) 588 (59.2)
Food-poisoning microbes can be seen by the eye 397 (39.9) 597 (60.1)
Vegetables must be placed on a higher rack inside the refrigerator than meat 341 (34.3) 653 (65.7)
Cooked food should be adequately reheated 332 (33.4) 662 (66.6)
Research article
377
EMHJ – Vol. 26 No. 4 – 2020
77.7% knew that keeping food at room temperature for a prolonged time increased bacterial growth (22). In addition, 98.2% of the Malaysian food handlers considered safe food handling was a vital part of their work compared with only 43.8% in our study. Furthermore, 42.9% of our participants thought that food safety training was essential, which is again lower than other studies (21,23), where 96% and 93.6% respectively believed in the importance of food safety training.
Only 44% of our food handlers agreed that raw and cooked foods should be separated compared with 79.9% of food handlers in a study in Malaysia (15). Furthermore, 45% of our food handlers agreed that vegetables and raw meat should not be prepared on the same chopping board which is more than the 27.6% reported in a study in Saudi Arabia (24). About 45% of our participants considered long nails could be a source of food-poisoning pathogens compared with 88.1% in the study in the United Arab Emirates (20). Almost half of our participants (46.9%) agreed that food handlers should be medically examined regularly, which is less than a study in food vendors (68.5%) (25) and workers in eating places (71.1%) in Nigeria (26).
As regards practices, 18.6% said that they always wore gloves when touching cooked food and 17.8% always washed their hands before food processing. These figures
are much lower than food handlers in Dubai, where 92.2% confirmed that they always used gloves and 90.1% that they always washed their hands before and during food preparation (3). Our results are also lower than the study in Malaysia where 44.4% of the participants said they always wore wear gloves and 86.4% said that they always washed their hands before food preparation (17).
Only 10.2% of our participants stated that they never worked when they had diarrhoea This figure is similar to a study in food handlers in the United States of America (11.9%) (27). Only a small proportion of our food handlers reported that they refrained from work when they had cuts or wounds on their hands or a common cold (12.1% and 14.6% respectively). These proportions are lower than those in the study in Saudi Arabia, where 64.4% said that they did not handle foodstuffs when they had cuts or wounds on their hands and 65.5% said they stopped handling food when they were ill (24).
Only 20.1% of the respondents stated that they always washed their hands with soap and water after using the toilet. This is much lower than the findings of studies in Nigeria (26) and Sri Lanka (28) where 71.7% and 88.5% of food handlers respectively confirmed that they complied with this practice. Moreover, 21.8% of our participants said that they always separated raw meat from cooked food compared with 84.7% in the study in Dubai (3).
Table 2 Distribution of the participants according to compliance with food safety practicesItem Always Usually Sometimes Rarely Never
No. (%) No. (%) No. (%) No. (%) No. (%)
Wearing gloves when touching ready to eat food 185 (18.6) 242 (24.4) 237 (23.8) 232 (23.3) 98 (9.9)
Washing hands with water and soap before food preparation
177 (17.8) 238 (23.9) 249 (25.1) 233 (23.4) 97 (9.8)
Working if you have diarrhoea 177 (17.8) 268 (27) 248 (24.9) 200 (20.1) 101 (10.2)
Working if you have a cut or wound on your hands
160 (16.1) 274 (27.6) 226 (22.7) 214 (21.5) 120 (12.1)
Having long nails 162 (16.3) 280 (28.2) 222 (22.3) 214 (21.5) 116 (11.7)
Washing vegetables and fruits before peeling 149 (15) 300 (30.2) 211 (21.2) 223 (22.4) 111 (11.2)
Keeping cooked meat or chicken for > 4 hours at room temperature
159 (16) 289 (29.1) 214 (21.5) 216 (21.7) 116 (11.7)
Cleaning surfaces on which food has been handled before and after processing
169 (17) 262 (26.4) 212 (21.3) 220 (22.1) 131 (13.2)
Working if you have a common cold 177 (17.8) 246 (24.8) 208 (20.9) 218 (21.9) 145 (14.6)
Washing vegetables and fresh fruit before eating 171 (17.2) 255 (25.7) 217 (21.8) 231 (23.2) 120 (12.1)
Washing hands with soap and water before eating 170 (17.1) 277 (27.9) 205 (20.6) 222 (22.3) 120 (12.1)
Washing hands with soap and water after handling raw meat
176 (17.7) 269 (27.1) 207 (20.8) 236 (23.7) 106 (10.7)
Washing hands with soap and water after using the toilet
200 (20.1) 266 (26.8) 184 (18.5) 243 (24.4) 101 (10.2)
Drying hands after washing them 220 (22.1) 259 (26.1) 207 (20.8) 228 (22.9) 80 (8.1)
Eating under-cooked eggs 208 (20.9) 275 (27.7) 249 (25.1) 190 (19.1) 72 (7.2)
Separating raw meat from ready-to-eat food 217 (21.8) 262 (26.4) 258 (26.0) 172 (17.2) 85 (8.6)
Checking the refrigerator temperature regularly 210 (21.1) 251 (25.3) 254 (25.6) 182 (18.2) 97 (9.8)
Drinking unpasteurized milk 209 (21) 264 (26.6) 237 (23.8) 197 (19.8) 87 (8.8)
Eating under-cooked meat 202 (20.3) 262 (26.4) 231 (23.2) 205 (20.6) 94 (9.5)

EMHJ – Vol. 26 No. 4 – 2020Research article
378
In our study, 39.2% of the food handlers had good food safety knowledge, 61.2% had positive attitudes to food safety and 56.3% reported good practices. In a study in Borneo in food vendors, a lower proportion of participants had good knowledge (36.8%), attitudes (19.1%) and practices (10.8%) (29). The study in Nigeria found that 81% had good knowledge, 71% had positive attitudes and 37% had good practices (25).
Age, male sex, urban residence, higher education and being a cook were indicators of good food safety knowledge in our study. This is consistent with the study in Malaysia which found that age, sex and education significantly influenced food safety knowledge (17).
However, another study in Malaysia reported that none of these factors significantly influenced food handlers’ knowledge (14). Residence and education were significantly associated with positive attitudes in our study. The study in Malaysia also found that education was significantly associated with the attitude of food handlers (14). However, a study in India found that only age and sex significantly influenced participants’ attitudes (30).
None of the studied variables affected participants’ practices, which concurs with the findings of other studies (17,30–32) that indicated that age, sex and education had no effect on practices. On the other hand, a study
Table 3 Univariate logistic regression analysis of factors affecting (good) knowledge, attitudes, practices of the participantsVariable Crude odds ratio (95% confidence interval) P-value
Knowledge
Age 1.01 (1.001–1.03) 0.034*
Sex (male) 2.3 (1.6–3.3) < 0.001*
Residence (urban) 1.3 (1.04–1.7) 0.024*
Education 6.9 (5.4–8.8) < 0.001*
Job (cook) 4.4 (3.4–5.9) < 0.001*
Years of experience 1.003 (0.98–1.02) 0.783
Attitudes
Age 1.004 (0.9–1.02) 0.512
Sex (male) 1.4 (0.9–1.9) 0.055
Residence (urban) 1.5 (1.2–1.9) 0.002*
Education 1.1 (1.03–1.3) 0.013*
Job (cook) 0.9 (0.7–1.2) 0.719
Years of experience 1.01 (0.9–1.03) 0.512
Self-reported practice
Age 1.002 (0.9–1.02) 0.776
Sex (male) 1.1 (0.8–1.5) 0.466
Residence (urban) 0.9 (0.7–1.1) 0.380
Education 1.01 (0.9–1.12) 0.869
Job (cook) 1.12 (0.9–1.4) 0.415
Years of experience 1 (0.9–1.02) 0.988
*Statistically significant at P < 0.05.
Table 4 Multivariable logistic regression analysis of factors significantly affecting (good) knowledge, attitude, practices of the participantsVariable Adjusted odds ratio (95% confidence
interval)P-value
Knowledge
Education 12.2 (8.8–16.9) < 0.001*
Job (cook) 20.2 (11.2–36.4) < 0.001*
Age 1.04 (1.01–1.06) 0.004*
Sex (male) 1.9 (1.09–3.4) 0.024*
Attitude
Residence (urban) 1.5 (1.1–1.9) 0.005*
Education 1.1 (1.005–1.3) 0.033*
*Statistically significant at P < 0.05.
Research article
379
EMHJ – Vol. 26 No. 4 – 2020
in northern Nigeria reported that age and education had a significant effect on food vendors practices (33). A study in Belgaum City, India, also found that education significantly affected the knowledge and attitudes of food handlers but that it had no effect on their practices (34).
Our participants self-reported their food safety practices which is a limitation of our study as they may have been subject to social desirability bias and reported that they followed correct practices when they may not have. Direct observation of the hygiene practices is needed to draw an accurate conclusion on the compliance of the participants with food safety practices.
ConclusionOur study highlights the poor knowledge of food handlers in Sohag about food safety and the high level of non-com-pliance with food safety practices. Such non-compliance could result in outbreaks of foodborne illnesses. There-fore, there is an urgent need to raise interest in food safe-ty. Education and training programmes should be imple-mented to improve food handlers’ attitude, knowledge and practices. In addition, licensing and maintaining supervision should be mandated.
Funding: None.
Competing interests: None declared.
Connaissances et attitudes vis-à-vis de la sécurité sanitaire des aliments et pratiques auto-déclarées des manipulateurs de denrées alimentaires dans le gouvernorat de Sohag (Égypte)RésuméContexte : Les maladies d’origine alimentaire constituent un enjeu de santé publique majeur dans le monde entier. La plupart des facteurs liés à leur survenue relève de la responsabilité des personnes qui manipulent des denrées alimentaires.Objectifs : La présente étude avait pour objectif de déterminer les connaissances, les attitudes et les pratiques auto‑déclarées des manipulateurs de denrées alimentaires dans le gouvernorat de Sohag en matière de sécurité sanitaire des aliments et les facteurs affectant ces éléments. Méthodes : Une étude transversale a été réalisée entre mai 2016 et mars 2017 auprès des manipulateurs de denrées alimentaires dans des cafétérias, des restaurants, des établissements de restauration et sur des stands alimentaires en bordure de route de quatre districts du gouvernorat de Sohag, sélectionnés de façon aléatoire. Un questionnaire a été utilisé pour recueillir les données portant sur les caractéristiques sociodémograhiques – âge, sexe, lieu de résidence (urbain, rural), niveau d’éducation (analphabète, niveau primaire, collège, lycée, enseignement supérieur et profession (cuisinier, commis) – ainsi que sur les connaissances, les attitudes et les pratiques en matière de sécurité sanitaire des aliments.Résultats : Sur les 994 personnes qui manipulent des denrées alimentaires ayant participé à l’étude, 39,2 % avaient une bonne connaissance de la sécurité sanitaire des aliments, 61,2 % montraient une attitude positive et 56,3 % faisaient état de pratiques satisfaisantes à cet égard. Dans la régression logistique univariée, la plupart des variables étaient fortement associées aux connaissances des participants. Seuls la résidence et le niveau d’éducation étaient nettement associés à des attitudes positives. Aucune des variables n’était significativement associée aux pratiques des participants. À l’analyse de régression logistique multivariée, l’âge, l’appartenance au sexe masculin, la résidence en milieu urbain, un niveau d’éducation supérieur et un emploi de cuisinier étaient fortement associés à une bonne connaissance. Le lieu de résidence et le niveau d’éducation avaient une influence significative sur les attitudes positives.Conclusions : Dans notre échantillon, les manipulateurs de denrées alimentaires avaient des connaissances limitées en matière de sécurité sanitaire des aliments et ne respectaient pas les bonnes pratiques dans ce domaine. Des programmes d’éducation et de formation devraient être mis en œuvre afin d’améliorer les connaissances, les attitudes et les pratiques.
معلومات واجتاهات وسلوكيات مناويل األغذية جتاه سالمة األغذية بمحافظة سوهاج، مرصأمحد حامد، نرسين حممد
اخلالصةاخللفية: إن األمراض املنقولة عن طريق األغذية هلا أمهية للصحة العامة يف مجيع أنحاء العامل. وتقع مسؤولية أغلب العوامل املرتبطة بحدوث تلك
األمراض عىل عاتق مناويل األغذية.األهداف: هدفت هذه الدراسة إىل حتديد معلومات واجتاهات وسلوكيات مناويل األغذية يف حمافظة سوهاج جتاه سالمة األغذية، والعوامل التي
تؤثر عليها.طرق البحث: ُأجريت دراسة مقطعية من مايو/أيار 2016 وحتى مارس/آذار 2017 شملت مناويل األغذية من العاملني يف الكافترييات، واملطاعم،
EMHJ – Vol. 26 No. 4 – 2020Research article
380
واملؤسسات الغذائية، وأكشاك الطعام عىل جانب الطريق يف أربع مناطق خمتارة عشوائيا يف حمافظة سوهاج. واْسُتخدم استبيان جلمع البيانات حول ابتدائي، متعلم، )غري التعليمي واملستوى الريف(، )احلرض، اإلقامة ومكان والنوع، العمر، أي - املناولني هلؤالء السكانية االجتامعية السامت
إعدادي، ثانوي، جامعي( والوظيفة )طّباخ، مساعد( – واملعلومات واالجتاهات والسلوكيات جتاه سالمة األغذية.النتائج: من بني مناويل األغذية الذين شملتهم الدراسة، والبالغ عددهم 994 مناوال، كان لدى %39 منهم إملام جيد بسالمة األغذية، وكان لدى %61.2 مواقف إجيابية، وأبلغ %56.3 منهم بسلوكيات جيدة تتعلق بسالمة األغذية. ويف حتليل االنحدار اللوجستي أحادي املتغري، أظهرت غالبية التعليم. ومل اإلقامة ومستوى باملوقف اإلجيايب سوى ملكان ارتباط قوي للمشاركني. ومل يكن هناك املعريف باملستوى ارتباطا جوهريا املتغريات يقرتن أي من املتغريات بصورة جوهرية بسلوكيات املشاركني. أما يف حتليل االنحدار اللوجستي املتعدد املتغريات، فقد اقرتن كل من العمر، والنوع )الذكور(، واإلقامة يف منطقة حرضية، وارتفاع مستوى التعليم، والعمل بمهنة الطّباخ بقوة بوجود معلومات جيدة عن سالمة األغذية. وأثر مكان
اإلقامة ومستوى التعليم بصورة كبرية عىل املوقف اإلجيايب.االستنتاج: اتسم مناولو األغذية يف العينة بتدين املعلومات واالمتثال غري الكايف بسلوكيات سالمة األغذية، لذا ينبغي تنفيذ برامج تعليمية وتدريبية
من أجل حتسني معلوماهتم واجتاهاهتم وسلوكياهتم.
References1. Zeeshan M, Shah H, Durrani Y, Ayub M, Jan Z, Shah M. A questionnaire-based survey on food safety knowledge during food-han-
dling and food preparation practices among university students. J Clin Nutr Diet. 2017;3(2):1–8. http://doi.org/10.4172/2472-1921.100052
2. Santos M-J, Nogueira JR, Patarata L, Mayan O. Knowledge levels of food handlers in Portuguese school canteens and their self-re-ported behaviour towards food safety. Int J Environ Health Res. 2008;18(6):387–401. http://doi.org/10.1080/09603120802100212.
3. Al Suwaidi A, Hussein H, Al Faisal W, El Sawaf E, Wasfy A. Hygienic practices among food handlers in Dubai. Int J Prev Med Res. 2015;1(3):101–8.
4. WHO estimates of the global burden of foodborne diseases: foodborne disease burden epidemiology reference group 2007–2015. Geneva: World Health Organization; 2015.
5. Al-Sakkaf A. Evaluation of food handling practice among New Zealanders and other developed countries as a main risk factor for campylobacteriosis rate. Food Control. 2012;27(2):330–7. http://doi.org/10.1016/j.foodcont.2012.04.011
6. Sanlier N. The knowledge and practice of food safety by young and adult consumers. Food control. 2009;20(6):538–42.
7. Carvalho MLR, Morais TB, Amaral DF, Sigulem DM. Hazard analysis and critical control point system approach in the evalua-tion of environmental and procedural sources of contamination of enteral feedings in three hospitals. J Parenter Enteral Nutr. 2000;24(5):296–303. http://doi.org/10.1177/0148607100024005296
8. Ferreira JS, Cerqueira ES, Carvalho JS, Oliveira LC, Costa WLR, Almeida RCC. Conhecimento, atitudes e práticas em segurança alimentar de manipuladores de alimentos em hospitais públicos de Salvador, Bahia [Food safety knowledge, attitudes and prac-tices of food handlers in public hospitals of Salvador, Bahia]. Revista Baiana de Saúde Pública. 2013;37(Suppl 1):35–55.
9. Soares LS, Almeida RCC, Cerqueira ES, Carvalho JS, Nunes IL. Knowledge, attitudes and practices in food safety and the presence of coagulase-positive staphylococci on hands of food handlers in the schools of Camaçari, Brazil. Food Control. 2012;27(1):206–13. http://doi.org/10.1016/j.foodcont.2012.03.016
10. Yarrow L, Remig VM, Higgins MM. Food safety educational intervention positively influences college students’ food safety attitudes, beliefs, knowledge, and self-reported practices. J Environ Health. 2009;71(6):30–5.
11. Martins RB, Hogg T, Otero JG. Food handlers’ knowledge on food hygiene: the case of a catering company in Portugal. Food Control. 2012;23(1):184–90.
12. Chapman B, Eversley T, Fillion K, MacLaurin T, Powell D. Assessment of food safety practices of food service food handlers (risk assessment data): testing a communication intervention (evaluation of tools). J Food Prot. 2010;73(6):1101–7.
13. Al-Shabib NA, Mosilhey SH, Husain FM. Cross-sectional study on food safety knowledge, attitude and practices of male food handlers employed in restaurants of King Saud University, Saudi Arabia. Food Control. 2016;59(Suppl C):212–7. https://doi.org/10.1016/j.foodcont.2015.05.002
14. Abdul-Mutalib N-A, Abdul-Rashid M-F, Mustafa S, Amin-Nordin S, Hamat RA, Osman M. Knowledge, attitude and practices regarding food hygiene and sanitation of food handlers in Kuala Pilah, Malaysia. Food Control. 2012;27(2):289–93. http://doi.org/10.1016/j.foodcont.2012.04.001
15. Son R, Mohhiddin O, Toh P, Chai L. Food court hygiene assessment and food safety knowledge, attitudes and practices of food handlers in Putrajaya. Int Food Res J. 2015;22(5):1843–54.
16. IBM SPSS Statistics for Windows, version 22.0. Armonk (NY): IBM Corp.; 2013.
17. Woh PY, Thong KL, Behnke JM, Lewis JW, Zain SNM. Evaluation of basic knowledge on food safety and food handling practices amongst migrant food handlers in Peninsular Malaysia. Food Control. 2016;70:64–73. http://doi.org/10.1016/j.foodcont.2016.05.033
Research article
381
EMHJ – Vol. 26 No. 4 – 2020
18. Abera B, Biadegelgen F, Bezabih B. Prevalence of Salmonella typhi and intestinal parasites among food handlers in Bahir Dar Town, Northwest Ethiopia. Ethiopian J Health Dev. 2010;24(1):46–50. http://doi.org/10.4314/ejhd.v24i1.62944
19. Rall V, Sforcin J, Augustini V, Watanabe M, Fernandes Jr A, Rall R, et al. Detection of enterotoxin genes of Staphylococcus sp isolated from nasal cavities and hands of food handlers. Braz J Microbiol. 2010;41(1):59–65. https://doi.org/10.1590/S1517-838220100001000011
20. Akabanda F, Hlortsi EH, Owusu-Kwarteng J. Food safety knowledge, attitudes and practices of institutional food-handlers in Ghana. BMC Public Health. 2017;17(1):40. https://doi.org/10.1186/s12889-016-3986-9
21. Afifi HS, Abushelaibi AA. Assessment of personal hygiene knowledge, and practices in Al Ain, United Arab Emirates. Food Con-trol. 2012;25(1):249–53. https://doi.org/10.1016/j.foodcont.2011.10.040
22. Sani NA, Siow ON. Knowledge, attitudes and practices of food handlers on food safety in food service operations at the Universi-ti Kebangsaan Malaysia. Food Control. 2014;37:210–7.
23. Zhang H, Lu L, Liang J, Huang Q. Knowledge, attitude and practices of food safety amongst food handlers in the coastal resort of Guangdong, China. Food Control. 2015;47:457–61. https://doi.org/10.1016/j.foodcont.2014.07.048
24. Al-Shabib NA, Mosilhey SH, Husain FM. Cross-sectional study on food safety knowledge, attitude and practices of male food handlers employed in restaurants of King Saud University, Saudi Arabia. Food Control. 2016;59:212–7.
25. Iwu AC, Uwakwe KA, Duru CB, Diwe KC, Chineke HN, Merenu IA, et al. Knowledge, attitude and practices of food hy-giene among food vendors in Owerri, Imo State, Nigeria. Occup Dis Environ Med. 2017;5(1):11–5. https://doi.org/10.4236/odem.2017.51002
26. Bamidele J, Adebimpe W, Oladele E, Adeoye O. Hygiene practices among workers in local eateries of Orolu community in south Western Nigeria. Ann Med Health Sci Res. 2015;5(4):235–40. https://doi.org/10.4103/2141-9248.160176
27. Sumner S, Brown LG, Frick R, Stone C, Carpenter LR, Bushnell L, et al. Factors associated with food workers working while expe-riencing vomiting or diarrhea. J Food Prot. 2011;74(2):215–20. https://doi.org/10.4315/0362-028X.JFP-10-108.
28. Galgamuwa LS, Iddawela D, Dharmaratne SD. Knowledge and practices of food hygiene among food handlers in plantation sector, Sri Lanka. Int J Sci Rep. 2016;2(12):304-11. http://doi.org/10.18203/issn.2454-2156.IntJSciRep20164307
29. Rahman MM, Arif MT, Bakar K, Tambi Z. Food safety knowledge, attitude and hygiene practices among the street food vendors in Northern Kuching city, Sarawak. Borneo Science. 2012;31:107–16.
30. Anuradha M, Dandekar R. Knowledge, attitude and practice among food handlers on food borne diseases: a hospital based study in tertiary care hospital. Int J Biomed Adv Res. 2014;5(04):196–8.
31. Dun-Dery EJ, Addo HO. Food hygiene awareness, processing and practice among street food vendors in Ghana. Food Public Health. 2016;6(3):65–74. http://doi.org/10.5923/j.fph.20160603.02
32. Kibret M, Abera B. The sanitary conditions of food service establishments and food safety knowledge and practices of food han-dlers in Bahir Dar town. Ethiop J Health Sci. 2012;22(1):27–35.
33. Afolaranmi TO, Hassan ZI, Bello DA, Misari Z. Knowledge and practice of food safety and hygiene among food vendors in prima-ry schools in Jos, Plateau State, North Central Nigeria. J Med Res. 2015;4(2):16–22.
34. Pokhrel B, Pokhrel K, Chhetri M, Awate R, Sah N. Knowledge, attitude and practice regarding food hygiene among food handlers: a cross-sectional study. Janaki Medical College J Med Sci. 2016;3(1):14–9. https://doi.org/10.3126/jmcjms.v3i1.15370
EMHJ – Vol. 26 No. 4 – 2020Research article
382
Household disaster preparedness in the Islamic Republic of Iran: 2015 estimationAli Ardalan,1,2 Homa Yusefi,1,3 Narges Rouhi,3 Ahad Banar 3 and Sanaz Sohrabizadeh 4
1Department of Disaster and Emergency Health, School of Public Health, Tehran University of Medical Sciences, Tehran, Islamic Republic of Iran. 2Harvard Humanitarian Initiative, Harvard University, Cambridge, United States of America. 3Disaster Risk Management Office, Department of Public Health, Ministry of Health and Medical Education, Tehran, Islamic Republic of Iran. 4 Department of Health in Disasters and Emergencies, School of Public Health and Safety, Shahid Beheshti University of Medical Sciences, Tehran, Islamic Republic of Iran (Correspondence to: Ali Ardalan: [email protected]; [email protected]).
IntroductionThe Islamic Republic of Iran is at high risk of natural disasters. The Global Assessment Report on disaster risk reduction of 2009 put the country in the high multiple mortality risk class (8 out of 10) (1). Each year on aver-age, natural disasters kill about 90 000 people and affect 160 million people (2). Earthquakes, floods, drought and storms are the main natural disasters that affect the lives and livelihood of Iranians. To mitigate the risk of disas-ters, the country needs a national disaster preparedness programme that enables the community, including in-dividuals, households, organizations and societies, to respond and recover effectively when disasters strike (3).
Lessons learnt from Iranian disasters and those learnt from other countries highlight the need for individual responsibility in disaster preparedness (3). Local people are the first who need to take protective actions when a disaster occurs. In addition, before the arrival of any professional response team, local people are the first
responders to help their own families and neighbours, especially those with special needs and disabilities (4). Furthermore, studies have shown that citizen involvement is a key component in the natural hazard risk reduction (5), and that improving local preparedness will be effective only if people at risk know how to react appropriately (6).
In the past decade, the Islamic Republic of Iran has invested considerable effort to develop policies and infrastructure for disaster preparedness, including the establishment of the National Disaster Management Organization and strengthening of relief organizations (7). Nevertheless, the preparedness of local people is still a real concern and data on their level of preparedness are needed.
The aim of this study, therefore, was to estimate the level of disaster preparedness of Iranian households, in order to provide baseline figures for future assessment. We focused on the household as this is the most basic and fundamental unit of society.
AbstractBackground: The Islamic Republic of Iran is at high risk of natural disasters. Households are the basic unit of society and they need to be prepared for disasters. Aims: This study assessed disaster preparedness among Iranian households in 2015. Methods: Using multistage cluster sampling, 2968 households in the catchment area of 53 public health departments in all 30 provinces of the Islamic Republic of Iran were surveyed on the disaster preparedness measures they had taken in the past year. The data collection questionnaire included 15 disaster preparedness measures. The mean preparedness score was calculated and its association with residence (urban versus rural), house ownership (owner versus renter) and educa-tion level of the head of the household (illiterate, elementary school, middle school, high school, university) was evaluated.Results: The mean score for household disaster preparedness was 9.3 out of 100 (95% confidence interval: 8.3–10.3). Mul-tivariate analysis showed higher preparedness among rural than urban households (P = 0.02). Higher education level was positively associated with a higher preparedness score (P < 0.001), as was house ownership (P < 0.001).Conclusion: The level of household disaster preparedness in the Islamic Republic of Iran in 2015 was low. In line with the first priority for action of the Sendai Framework for Disaster Risk Reduction, the current study provides an overall picture of household disaster preparedness in the Islamic Republic of Iran. This estimation can be used as a baseline value for policy-making, planning, and evaluation of public awareness of disasters in the country.Keywords: disasters, risk reduction behaviour, preparedness, households, Iran
Citation: Ardalan A; Yusefi H; Rouhi N; Banar A; Sohrabizadeh S. Household disaster preparedness in the Islamic Republic of Iran: 2015 estimation. East Mediterr Health J. 2020;26(4):382–387. https://doi.org/10.26719/emhj.19.048
Received: 08/01/17; accepted: 25/07/18
Copyright © World Health Organization (WHO) 2020. Open Access. Some rights reserved. This work is available under the CC BY-NC-SA 3.0 IGO license (https://creativecommons.org/licenses/by-nc-sa/3.0/igo).
Research article
383
EMHJ – Vol. 26 No. 4 – 2020
Methods Study design and sample selectionA cross-sectional survey was conducted in December 2015 covering the catchment area of 54 public health de-partments in all 30 provinces of the Islamic Republic of Iran. Responses were received from 53 out of 54 (98.2%) public health departments.
The household was the survey unit and was defined as a group of individuals living together under one roof. Multistage cluster sampling was used to select the sample of households. In the first stage, one district was randomly selected from each public health department. Then, two urban and two rural areas were randomly selected from the selected district. Finally, in each selected area, two random clusters of seven households were chosen using registries of households available at the corresponding primary health care centre. This resulted in the selection of 424 clusters including 2968 households.
Survey tool and data collectionData collection was done using a questionnaire includ-ing 15 disaster preparedness measures. Households were asked if they had taken any of the measures over the past year with yes or no answers.
The questionnaire, called the household disaster preparedness index, was developed and validated for face and content validity by experts in health systems and disaster management. The content and face validity of the questionnaire was assessed and the Cronbach alpha for the awareness and readiness questions was 0.78.
The survey protocol was piloted in four clusters (28 households) in one public health department, and was then revised according to the results of the pilot phase. Study variables were household disaster preparedness as the dependent variable, and residence (urban versus rural), house ownership status (owner versus renter), and education level of the head of the household (illiterate, elementary school, middle school, high school, university) as the independent variables.
A score of 1 was given for each preparedness activity undertaken. Unanswered questions answers were coded as 0 by default. Equal weight was given to each question. A raw score was calculated for preparedness questions by summing of all scores. Finally, preparedness raw scores were normalized on a 100-point scale. In the case of missing data, the field collection teams were sent back for clarification.
The survey was administered by the staff of disaster risk management offices at the public health departments. These staff were trained on the questionnaire, study protocol and interview skills. Each interview lasted about 20 minutes. Most often, the person interviewed was the head of the household, unless he or she was not available, in which case, another person older than 18 years of age was interviewed. If an appropriate household member was not at home at the time of the attempted interview, up to two further visits were made.
Statistical analysis A complex sampling design was applied for the strata and clusters; urban and rural areas were considered as differ-ent strata. Mean and standard deviation of preparedness score were calculated along with the 95% confidence in-terval (CI). Independent t-test and ANOVA were applied to compare scores between and within the subgroups. Line-ar regression models were applied to assess the adjusted effects of variables on disaster preparedness. P < 0.05 was considered statistically significant. SPSS, version 22.0 was used for statistical analysis.
Ethical considerationsThis study was reviewed by the Disaster Risk Manage-ment Office of the Iranian Ministry of Health and Medi-cal Education and considered exempt as no intervention was carried out and no sensitive data were collected.
ResultsIn this national survey, 2968 households (50% urban and 50% rural) were assessed for disaster preparedness; 2527 households (85.1%) were the owner of the houses they were living in, while 441 (14.9%) were living in a rented house. The education level of the head of the household was as follows: 482 (16.2%) illiterate, 738 (24.9%) elemen-tary school, 611 (20.6%) middle school, 712 (24.0%) high school and 425 (14.3%) university.
The mean score of household disaster preparedness was at 9.3 out of 100 (95% CI: 8.3–10.3). Table 1 presents the frequency of preparedness measures reported by the households that they had carried out over the past year.
The mean preparedness score was higher among rural households than urban households (9.5 versus 9.1, P = 0.02) (Table 2). A slightly higher but statistically significant preparedness score was found in households that were the owners of the property they lived in compared with those who were living in a rented house (9.4 versus 9.3, P < 0.001). A higher level of education of the head of the household was positively associated with a higher preparedness score (P < 0.001) (Table 2). The multivariate analysis also showed that all background variables were significantly associated with preparedness score (P < 0.001) (Table 2).
DiscussionOur results indicate that household disaster preparedness is low in the Islamic Republic of Iran; only about 10 out of 100 households, on average, had taken any preparedness measures. Since this is the first national estimation, it is difficult to assess trends that have occurred over the past few years. Nevertheless, we speculate that household dis-aster preparedness has improved in the country in the past decade through improved public awareness facilitat-ed by the media and community-based initiatives such as annual school drills.
Local people are on the frontline in a response to disasters. They are the first responders before the arrival of any professional team to the affected area.

EMHJ – Vol. 26 No. 4 – 2020Research article
384
Furthermore, preparedness of local people reduces the effect of disasters and associated risks of death and injuries. Such local preparedness includes having an emergency kit ready, conducting regular drills, assisting vulnerable people and having a communications plan. Lessons learnt from disasters around the world highlight the need for individual responsibility and local coordination in response to and recovery from disasters (3). The literature highlights the importance of household and individual preparedness for natural disasters (8,9). Enhanced awareness of people and involvement of citizens in disaster planning is also a strategy that must be incorporated into public values to improve the sustainability of decisions (10). This is why national governments initiate plans to enhance disaster
preparedness at the community level (3). A household, by definition, is a place where a group
of individuals lives under the same roof. As an important component of the community preparedness for disasters, we focused on households. This is because a household, mostly shaped by members of a family, is the basic unit of society and is a place where members support each other and learn from one another. Each individual interacts with other family members and can both affect others and/or be affected by them. These characteristics can be utilized for community disaster preparedness.
Because of the frequent devastating natural disasters in the Islamic Republic of Iran and the coverage by the media, we can expect the Iranian community to be well-
Table 1 Disaster preparedness activities carried out over the past year by Iranian households Activity No. (n = 2968) %Holding a family meeting for disaster planning 532 17.9
Drawing a household disaster risk map 107 3.6
Assessing structural safety of the house 146 4.9
Taking structural safety measures 93 3.1
Assessing non-structural safety of the house (e.g. furnishing, equipment, electrical and mechanical fixtures)
167 5.6
Taking non-structural safety measures 125 4.2
Preparing an emergency kit 257 8.6
Having a disaster communication plan 230 7.7
Having a disaster evacuation plan 346 11.6
Planning for vulnerable members of the family 433 14.6
Being aware of early warning for hydroclimatic hazards (e.g. flooding) 496 16.7
Having a fire extinguisher in the house 376 12.7
At least one of the household member being trained on medical first aid 427 14.4
Contributing to neighbourhood disaster planning 194 6.5
Carrying out a disaster exercise 206 6.9
Table 2 Comparison of mean score of household disaster preparedness between study subgroupsGroup Mean (SD) Bivariate analysis Multivariate analysis
P-valuea B t P-valuea
Residence
Urban 9.1 (9.01) 0.02 0.079 3.021 < 0.001
Rural 9.5 (9.04)
House ownership
Owner 9.4 (9.02) < 0.001 0.001 0.072 < 0.001
Rental 9.3 (9.04)
Education of family head
Illiterate 8.1 (8.31) < 0.001 0.002 6.047 < 0.001
Elementary 9.1 (9.14)
Middle 9.2 (8.23)
High school 9.3 (9.33)
University 10.3 (9.52)
SD: standard deviation. aP values are calculated based on the complex sampling design.

Research article
385
EMHJ – Vol. 26 No. 4 – 2020
sensitized and informed about the risks of disasters, especially earthquakes and floods. However, the low preparedness we found, measured as the practical steps taken by the households, shows there is still a gap between what people know and what they do (11). This requires further studies to investigate factors that contribute to this gap.
Preparedness of households for emergency situations depends on complex and multifaceted factors (12). Having sufficient knowledge of how to prepare for emergencies does not guarantee that people will implement self-protection measures (13). The positive association between past disaster experience and preparedness of households has been found in several studies (14,15). However, other research suggests that past disaster experience is not the prime factor that enhances awareness and that school education can provide useful information as a knowledge base for earthquakes (16).
Risk perception is another key factor that determines if people undertake preparedness measures (9,14). Risk perception also affects how people think about sharing responsibility with governmental organizations (9). Research suggests that some households may not be able to prepare for disasters because of a lack of resources (3). This vulnerability may be associated with income, education, ethnicity, age and linguistic isolation. Other research has suggested that those most likely to engage in self-protective behaviour for earthquakes are those living in safer and structurally sounder houses (17). Two studies in Tehran suggest that in order to promote disaster preparedness behaviour, there needs to be a focus on people of low socioeconomic background (11,15). Factors such as income influence access to safe housing, insurance and other resources required for safety measures, such as preparation of emergency kits (3,18). Therefore, limitations on household resources should be taken into consideration when advocating safety measures (17).
People may also overestimate their preparedness (8,19). A study in Queensland, Australia, found that while two out of every three households believed they were prepared or very prepared for a natural disaster, their responses to more detailed questions on preparedness suggested otherwise (19). In our study, the participants expressed low basic preparedness.
Following the 2003 earthquake in Bam, the Islamic Republic of Iran invested considerably in public awareness through the national media. Iranian television and radio channels have produced programmes, such as reports, expert interviews and animations, and have presented them on special occasions, including the anniversary of the Bam earthquake and the National Day of Disaster Reduction. Moreover, an annual earthquake drill is held at schools by the Ministry of Education and the International Institute of Earthquake Engineering and Seismology (20,21). In addition, a neighbourhood disaster preparedness programme has also been developed by the Tehran Disaster Prevention and Management Organization and expanded to other cities (22).
According to the National Disaster Management Organization, the Iranian Red Crescent Society is the lead agency for the disaster public awareness. While the Iranian Red Crescent Society has carried out many activities, including training volunteers and conducting community drills, raising public awareness of disaster management is a difficult task to be managed entirely by one agency. The working group has to make use of the capacities of all governmental bodies and civil societies to create better preparedness.
The Iranian public health system, led by the Ministry of Health and Medical Education, is a key and trusted partner in community disaster preparedness (23,24). Not only has it taken an initiative to measure household disaster preparedness, but it has also utilized the capacity of the primary health care system to educate households in collaboration with community health volunteers. As a result of this initiative, over 500 000 households had received training by the end of 2015 (25). The programme continued in 2016 and is now well integrated into the primary health care system in the Islamic Republic of Iran. Under this programme, each household should have a household disaster preparedness index form in their respective health centre files. Quantifying household disaster preparedness, as presented in this article, provided supporting evidence and was a driving force behind the creation of this programme.
ConclusionIn line with the first priority for action of the Sendai Framework for Disaster Risk Reduction, which is un-derstanding the risk (26), our study provides an overall picture of household disaster preparedness in the Islam-ic Republic of Iran. Although the findings of our study support the first priority for action in the Sendai Frame-work, it can indirectly influence the other three prior-ities namely: strengthening disaster risk governance, investing in disaster risk reduction for resilience and enhancing disaster preparedness for effective response and to “Build Back Better” in recovery. For example, our estimation of household disaster preparedness can help communities to identify and fill their preparedness gaps and enhance disaster preparedness. This estimation can be used as a baseline value for policy-making, planning and evaluation of disaster public awareness and help strengthen disaster risk governance in the country. As-sessment of household disaster preparedness should be repeated on a regular basis, preferably annually, to moni-tor the effectiveness of interventions to improve prepar-edness. Further research is needed to explore different aspects of household disaster preparedness, including political sensitivities and legal frameworks to support community preparedness, risk analysis, evacuation plans and community safety, health sector community prepar-edness and environmental health.
Funding: The survey was supported by the Ministry of Health and Medical Education of the Islamic Republic of Iran.
Competing interests: None declared.
EMHJ – Vol. 26 No. 4 – 2020Research article
386
Préparation des ménages en cas de catastrophe naturelle en République islamique d’Iran : estimation pour l’année 2015RésuméContexte : La République islamique d’Iran est exposée à un risque élevé de catastrophes naturelles. Les ménages constituent la cellule de base de la société et ils doivent être prêts à faire face à des catastrophes de ce type. Objectifs : La présente étude a évalué la préparation des ménages iraniens en cas de catastrophe naturelle en 2015. Méthodes : En utilisant un sondage en grappes à plusieurs degrés, 2968 ménages appartenant à la zone couverte par 53 départements de santé publique dans les 30 provinces de la République islamique d’Iran ont été interrogés sur les mesures de préparation face aux catastrophes naturelles qu’ils avaient mises en place au cours de l’année précédente. Le questionnaire de collecte de données comprenait 15 mesures de préparation aux catastrophes. Le score moyen de préparation a été calculé et son association avec le lieu de résidence (milieu urbain ou rural), le fait d’être propriétaire de son logement (propriétaire ou locataire) et le niveau d’éducation du chef de ménage (analphabète, primaire, collège, lycée, université) a été évaluée.Résultats : Le score moyen de préparation des ménages aux catastrophes était de 9,3 sur 100 (intervalle de confiance à 95 % : 8,3-10,3). L’analyse multivariée a montré un niveau de préparation plus élevé parmi les ménages des milieux ruraux que parmi ceux vivant en milieu urbain (p = 0,02). Le niveau d’éducation plus élevé était associé de façon positive à un score de préparation supérieur (p < 0,001) de même que le fait d’être propriétaire de son logement (p < 0,001).Conclusion : En 2015, le niveau de préparation des ménages face aux catastrophes naturelles en République islamique d’Iran était faible. En ligne avec la première priorité d’action du Cadre de Sendai pour la réduction des risques de catastrophe, la présente étude offre une vue d’ensemble de la préparation des ménages aux catastrophes en République islamique d’Iran. Cette estimation pourrait constituer une base de référence en vue de l’élaboration des politiques, de la planification et de l’évaluation du niveau de sensibilisation du public face aux catastrophes naturelles dans le pays.
التأهب األرسي للكوارث يف مجهورية إيران اإلسالمية : تقييم عام 2015 عيل أردالن، مها يوسفي، نرجس روحي، احد بنار، ساناز سهرايب زادة
اخلالصةتواجه مجهورية إيران اإلسالمية خطرا مرتفعا جّراء التعرض للكوارث الطبيعية. وتشكل األرسة الوحدة األساسية للمجتمع، لذا فهي اخللفية:
بحاجة إىل التأهب للكوارث. األهداف: قيمت هذه الدراسة درجة التأهب للكوارث لدى األرس اإليرانية يف عام 2015.
طرق البحث: باستخدام أسلوب املعاينة العنقودية املتعددة املراحل، جرى مسح 2968 أرسة يف منطقة اخلدمة الطبية التي ضمت 53 إدارة للصحة العامة تغطي مجيع أقاليم مجهورية إيران اإلسالمية البالغ عددها 30 إقليام، وذلك لبيان تدابري التأهب للكوارث التي اختذهتا تلك األرس خالل العام السابق. وتضمن استبيان مجع املعلومات 15 تدبريا متعلقا بالتأهب للكوارث. تم حساب متوسط درجة التأهب وجرى تقييم مدى ارتباطها بمكان اإلقامة )احلرض يف مقابل الريف(، وملكية املنزل )متليك يف مقابل استئجار( واملستوى التعليمي لرب األرسة )غري متعلم، تعليم ابتدائي، تعليم
متوسط، تعليم ثانوي، تعليم جامعي(.النتائج: كان متوسط درجة تأهب األرس 9.3 من 100 درجة )CI =8.3 –10.3 %95) . وأظهر التحليل املتعدد املتغريات تأهبا لدى األرس يف األماكن التأهب ارتفاع درجة التعليمي وبني املستوى ارتباط إجيايب بني املناطق احلرضية )P = 0.02(. وكان هناك الريفية أعىل من نظريه لدى األرس يف
.)P< 0.001( وكذلك ملكية املنزل ،)P < 0.001(االستنتاج: مستوى التأهب األرسي للكوارث يف مجهورية إيران اإلسالمية يف عام 2015 كان منخفضا. ومتاشيا مع األولوية األوىل للعمل وفق إطار سينداي للحد من خماطر الكوارث، تقدم الدراسة احلالية تصورا عاما حول تأهب األرس للكوارث يف مجهورية إيران اإلسالمية. ويمكن استخدام
هذا التقييم ملا حيمله من قيمة أساسية لراسمي السياسات، والقائمني عىل التخطيط، وتقييم الوعي العام بالكوارث يف البالد.
References1. United Nations International Strategy for Disaster Reduction (UNISDR). Global assessment report on disaster reduction. Gene-
va: United Nations; 2009.
2. Environmental health in emergencies. Natural events [webpage]. World Health Organization (https://www.who.int/environmen-tal_health_emergencies/natural_events/en/, accessed 11 September, 2018).
3. Sutton J, Tierney K. Disaster preparedness: concepts, guidance, and research. 2006. (http://www.fritzinstitute.org/pdfs/whitepa-per/disasterpreparedness-concepts.pdf, accessed 11 August, 2016).
Research article
387
EMHJ – Vol. 26 No. 4 – 2020
4. Uscher-Pines L, Hausman AJ, Powell S, DeMAra P, Heake G, Hagen MG. Disaster preparedness of households with special needs in southeastern Pennsylvania. Am J Prev Med. 2009;37(3):227–30. https://doi.org/10.1016/j.amepre.2009.04.028
5. Household natural hazards preparedness survey. Eugene: Oregon Natural Hazards Workgroup; 2006 (accessed 24 September 2019).
6. Liu S, Quenemoen LE, Malilay J,Noji E, Sinks T, Mendlein J. Assessment of a severe-weather warning system and disaster prepar-edness, Calhoun county, Alabama, 1994. Am J Public Health. 1996;86(1):87–9. https://doi.org/10.2105/ajph.86.1.87
7. Ardalan A, Masoomi GR, Goya M, Ghaffari M, Miadfar J, Sarvar MR, et al. Disaster health management: Iran’s progress and challenges. Iranian J Public Health. 2009;38(suppl 1):93–7.
8. Kapucu N. Culture of preparedness: household disaster preparedness. Disaster Prev Manag. 2008;17(4):526–35. https://doi.org/10.1108/09653560810901773
9. Terpstraa T, Guttelinga JM. Households’ perceived responsibilities in flood risk management in the Netherlands. Int J Water Resour Dev. 2008;24(4):555–65. https://doi.org/10.1080/07900620801923385
10. Beierle T. Using social goals to evaluate public participation in environmental decisions. Political Stud. Rev. 1999;16(3/4):75–103. https://doi.org/10.1111/j.1541-1338.1999.tb00879.x
11. Ostadtaghizadeh A, Hosseini M, Navidi I, Asghar Mahaki A, Ammari H, Ardalan A. Knowledge, attitude and practice of Tehran’s inhabitants for an earthquake and related determinants. PLoS Curr. 2012;4:e4fbbbe1668eef. https://doi.org/10.1371/4fbbbe1668eef.
12. Kohn S, Eaton JL, Feroz S, Bainbridge AA, Hoolachan J, Barnett DJ. Personal disaster preparedness: An integrative review of the literature. Disaster Med Public Health Prep. 2012;6(03):217–31. https://doi.org/10.1001/dmp.2012.47.
13. Diekman ST, Kearney SP, O’Neil ME, Mack KA. Qualitative study of homeowners’ emergency preparedness: Experiences, percep-tions, and practices. Prehospital Disaster Med. 2007;22(06):494–501.
14. Ardalan A, Holakouie Naieni K, Mahmoud M, Zanaganeh A-M. Flash flood preparedness in Golestan province of Iran: a commu-nity intervention trial. Am J Disaster Med. 2010;5(4):197–214.
15. Najafi M, Ardalan A, Akbarisari A,Noorbala AA, Jabbari H. Demographic determinants of disaster preparedness behaviors amongst Tehran inhabitants, Iran. PLoS Curr. 2015;7. https://doi.org/10.1371/currents.dis.976b0ab9c9d9941cbbae3775a6c5fbe6
16. Shaw R, Kobayashi KSH, Kobayashi M. Linking experience, education, perception and earthquake preparedness. Disaster Prev Manag. 2004;13(1):39–49. https://doi.org/10.1108/09653560410521689
17. Edwards ML. Social location and self-protective behavior: Implications for earthquake preparedness. Int J Mass Emergencies Disasters. 1993;11(3):293–303.
18. Ardalan A, Sohrabizadeh S. Assessing households preparedness for earthquakes: an exploratory study in the de-velopment of a valid and reliable Persian-version tool. PLOS Curr. 2016;8. https://doi.org/10.1371/currents.dis.cc-c8697279713e66887b928b839d0920.
19. Queensland Regional Household Survey, May 2012. Queensland: Office of Economic and Statistical Research; 2012 (https://www.disaster.qld.gov.au/dmp/Archive/Documents/QRHS-May-2012-EMQ-Survey-Report-FINAL-VERSION-04-10-12.pdf.
20. Izadkhah YO, Hosseini M. Towards resilient communities in developing countries through education of children for disaster preparedness. Int J Emerg Manag. 2005;2(3):138–48. https://doi.org/10.1504/IJEM.2005.007355
21. Parsizadeh F, Ghafory‐Ashtiany M. Iran public education and awareness program and its achievements. Disaster Prev Manag. 2010;19(1):32–47. https://doi.org/10.1108/09653561011022126
22. Tehran neighbourhood emergency response volunteers. Tehran: Tehran Disaster Mitigation and Management Organization; 2012. (http://en.tehran.ir/Portals/0/Document/Tehran%20Neighbourhood%20Emergency%20Response%20Volunteers.pdf, ac-cessed 11 August, 2016).
23. Ardalan A, Mowafi H, Burkle FM Jr. Iran’s disaster risk: now is the time for community-based public health preparedness. Pre-hosp Disaster Med. 2013;28(5):421–2. https://doi.org/10.1017/S1049023X13008820.
24. Ardalan A, Mowafi H, Malekafzali H, Abolhasani F. Effectiveness of a primary health care program on urban and rural com-munity disaster preparedness, Islamic Republic of Iran: a community intervention trial. Disaster Med Public Health Prep. 2013;7(5):481–90. https://doi.org/10.1017/dmp.2013.93.
25. Ardalan A, Yousefi H, Rouhi N, Banar A. National report on household disaster preparedness. Tehran: Disaster Risk Management Office, Ministry of Health and Medical Education; 2015.
26. United Nations International Strategy for Disaster Reduction. Sendai framework for disaster risk reduction 2015-2030. Geneva: United Nations; 2015 (http://www.unisdr.org/we/inform/publications/43291, accessed 11 August, 2016).
EMHJ – Vol. 26 No. 4 – 2020Research article
388
Profile of risk factors for noncommunicable diseases in major cities of Afghanistan: WHO STEPwise approachKhwaja Mir Islam Saeed,1 Muhammad Hafiz Rasooly 2 and Malalai Nejaby 3
1Grant and Contract Management Unit; 2Influenza Surveillance Unit, Evaluation and Health Information System, Ministry of Public Health, Kabul, Afghanistan (Correspondence to: Khwaja M.I. Saeed: [email protected]). 3Helping Mothers and Children Thrive Project (HEMAYAT), Johns Hopkins Program for International Education in Gynaecology and Obstetrics, Kabul, Afghanistan.
IntroductionAfghanistan is a landlocked country in south central Asia. Administratively, the country is divided into 8 ge-ographical regions, 34 provinces and 398 administrative districts. The 2014/15 estimated population of the country was 26.5 million (1). The most recent figures from 2015, though better than the previous (2003) data, estimate a total fertility rate of 5.3 children per women and an in-fant mortality rate of 55 per 1000 live births (2). About 4 decades of war in Afghanistan has devastated the coun-try’s infrastructure, economy and social services, result-ing in a low quality of life. The Taliban rule compounded the suffering of women by curtailing their access to al-ready limited health services. Almost 75% of the districts in Afghanistan lacked maternal and child health services and most women gave birth devoid of the presence of a skilled birth attendant (3,4). Moreover, opiate production increased in the country significantly and led to destabi-lization of the formal economy and the political situation of Afghanistan. According to a 2015 UN report, opium production in Afghanistan accounted for an estimated 85% of global production (5).
Despite improvement in the health situation, Afghanistan’s health indicators are the worst in the region. Above all, about 37% of Afghan adults die due to
noncommunicable disease (NCD) (6). Noncommunicable diseases are medical conditions with long duration and slow progression. Currently, NCDs constitute a major challenge with adverse social and economic consequences, particularly in low- and middle-income countries (7). The 4 priority NCDs are cardiovascular diseases, cancer, chronic respiratory disease and diabetes (8). For many years the world has been expending efforts to prevent and control infectious diseases, malnutrition and maternal and perinatal conditions whereas the epidemiological transition indicates the decline of infectious diseases and the upsurge in chronic NCDs (9).
Mortality due to NCDs contributed to 70% of global deaths in 2017 and the documented prevalence in 2008 was 63% (10–12). Recently, the World Health Organization (WHO) has reported that NCDs kill 40 million people a year, and almost 80% of NCD deaths (32 million) occur in low- and middle-income countries. Cardiovascular diseases account for most of these deaths at 17.7 million annually, followed by cancer (8.8 million), respiratory diseases (3.9 million) and diabetes (1.6 million). These 4 groups of diseases account for 82% of all NCD deaths. Tobacco use, physical inactivity, the harmful use of alcohol and unhealthy diets together increase the risk of dying from an NCD (13). Furthermore, beyond the health
AbstractBackground: Noncommunicable diseases (NCDs) are a major public health problem worldwide. Despite improvement in the health situation, Afghanistan’s health indicators are the worst in the Region. About 37% of Afghan adults die due to NCDs.Aims: We aimed to estimate the proportion of major risk factors for NCDs in Afghanistan.Methods: We analysed the dataset of studies conducted in 5 provinces, Kabul, Balkh, Hirat, Nangarhar and Kandahar, during 2013–2015, using the WHO STEPwise approach to NCD surveillance. This involved multistage cluster sampling from urban citizens aged 25–70 years. EpiInfo, version 7, and SPSS, version 20, were used for data management.Results: In total, 5897 records were included in the analysis; 54% were females. Mean age was 39.56 (standard devia-tion12.29) years; illiteracy rate was 61.5% and 83.2% were married. Smoking and snuff use was 8% and 11.1% respectively. On average the subjects were consuming fruits 2.76 and vegetable 3.85 days per week. Overweight, general and abdominal obesity was 19%, 33.7% and 57.1% respectively. Typically, 32.4% had high blood pressure and 12.5% had high blood sugar.Conclusions: The modifiable risk factors of NCDs were prevalent in the major cities of the country. Their identification is vital in attempting to focus on prevalence of NCDs in urban cities. Tailored interventions are needed to focus on NCDs in Afghanistan.Keywords: noncommunicable diseases, risk factors, Afghanistan, STEPwise
Citation: Saeed K; Rasooly M; Nejaby M. Profile of risk factors for noncommunicable diseases in major cities of Afghanistan: WHO STEPwise ap-proach. East Mediterr Health J. 2020;26(4):388–399. https://doi.org/10.26719/emhj.20.005
Received: 12/10/17; accepted: 28/11/18
Copyright © World Health Organization (WHO) 2020. Open Access. Some rights reserved. This work is available under the CC BY-NC-SA 3.0 IGO license (https://creativecommons.org/licenses/by-nc-sa/3.0/igo).
Research article
389
EMHJ – Vol. 26 No. 4 – 2020
impact, NCDs impose an economic burden on health systems, skewed towards the low-income countries (14–15). In countries of the WHO Region for the Eastern Mediterranean, up to 50% of deaths due to NCDs occur before the age of 60 years compared with less than 10% in Western Europe (16). Nearly 54% of deaths occur due to NCDs in the South-East Asia Region (17). Key factors that greatly contribute to the progress of NCDs have been identified and considered (18). The health goal is to reduce mortality from NCDs by 25% by 2025; this is “the 25 by 25 goal” (19).
According to WHO, NCDs are estimated to account for 62% of total deaths in Tajikistan, 79% in Uzbekistan, 50% in Pakistan and 76% in the Islamic Republic of Iran and Turkmenistan, all countries neighbouring Afghanistan, conversely NCDs account for 37% of total deaths in our country (20). Similar results were found in the 2010 Afghanistan mortality survey: 33.3% of all deaths in the country were attributed to NCDs (6). Furthermore, WHO estimates the number with diabetes, for instance, is expected to rise nearly threefold in 2030 compared with 2000 (21). Among men aged ≥ 15 years in Kabul, the prevalence of smoking was 35% (22), while a 2012 report on prevalence and risk factors of NCDs among the older adult population (aged ≥ 40 years) in Kabul reported the prevalence of diabetes mellitus as 13.3%, obesity 31.2% and hypertension 46.2% (23). The national policy for NCDs has recently been developed by Ministry of Public Health (24).
This study aimed to estimate the prevalence of risk factors for chronic NCDs in the urban population in 5 main cities in Afghanistan.
Methods Study setting and designUsing the WHO STEPwise approach, a series of cross-sec-tional studies were conducted in urban settings of ma-jor provinces in Afghanistan: Jalalabad city (May–June, 2013), Mazar-e-Sharif (April to May, 2015), Herat city (May–June, 2015), Kandahar city (October–November, 2015) and Kabul city (November 2015). All permanent residents and household members aged 25–70 years, including men and women, who gave consent to partic-ipate were included in the study. Temporary residents (< 6 months), inhabitants of institutionalized settings and insecure areas were excluded. We used an adapted WHO STEPwise instrument; this prescribes 3 steps for measur-ing NCD risk factors: STEP I measures behavioural risk factors, STEP II covers physical measurements and STEP III measures biological risk factors (25–27). The WHO STEPS tool was adapted for the Afghanistan context. For instance, the part regarding alcohol consumption was re-moved and some questions regarding use of mouth snuff (called naswar locally), which is common in the country, were added. The addition of liquid and solid cooking oil, which is used in the kitchen, was another modification. Some other questions were also modified to easily reflect the meaning without losing the content. The research team translated the data collection tools into local lan-
guages (Dari and Pashto). The tools were tested in Kabul before actual data collection were started.
Sampling techniques and strategyCluster sampling was used as a suitable strategy to ap-proach the households. Assuming the highest proportion (50%), 95% confidence interval (CI) and margin of error of 5%, a sample size of 385 was calculated. However, consid-ering the frequency of risk factors such as smoking, phys-ical activity, dietary habits and other factors and the de-sign effect of cluster sampling, the final sample size was increased to 600 and finally to 1200 (deff = 2 × 600) for each city. After completion of data collection and cleaning of the data, 1200 participants in Jalalabad, 1231 in Mazar-e-Sharif, 1129 in Hirat, 1165 in Kandahar and 1172 in Kabul were included in the final analysis.
For more than 4 decades no census has been conducted in the country and a complete list of villages was not available. The 2015 Expanded Programme on Immunization (EPI) lists of clusters were obtained from EPI unit in provinces and were used as the sampling frame. This frame was used for immunization by the Ministry of Public Health in Afghanistan. Two-stage cluster sampling was used. In the first stage, random sampling was accomplished using Excel; from the EPI list, 4 clusters were selected in Jalalabad, 5 in Mazar-e-Sharif, 16 in Hirat, 7 in Kandahar and 5 in Kabul using random numbers from Excel. In the second stage, the overall sample of 1200 households was divided among these selected areas proportionate to the number of households in each cluster/area. Based on the frequency and size of each selected cluster, households were selected using a systematic random sampling technique.
Variables and data collectionThe STEPwise approach has a standard questionnaire, which was adapted and used by the interviewers and which covered information on demographic, behavioural and physical measurements. The study variables includ-ed sociodemographic characteristics such as age, sex, lev-el of education, occupation, income and marital status;, behavioural factors such as physical activity, consump-tion of fruits and vegetables, use of cooking oil, smok-ing and naswar (tobacco snuff) use; and physical meas-urements such as blood pressure, weight, height, waist circumference and body mass index (BMI), biological components such as blood sugar, triglycerides and cho-lesterol. From height and weight, BMIs was calculated: ≥30.0 kg/m2 was considered obese, 25.0–29.9 kg/m2 over-weight and 18.5–24.9 kg/m2 normal weight (28). A waist circumference of 94 cm for men and 80 cm for women was defined as central obesity (29). Systolic blood pres-sure ≥ 140 mmHg and/or diastolic pressure ≥ 90 mmHg were considered as hypertensive. Furthermore, systolic blood pressure of < 120 mmHg and diastolic pressure of < 80 mmHg were considered normal while the group be-tween these 2 limits was considered as prehypertensive (30). Those who smoked at the time of the survey were considered smokers and included in proportion. Alco-

EMHJ – Vol. 26 No. 4 – 2020Research article
390
hol consumption was removed from the questionnaire due to the very low prevalence and high sensitivity for respondents. Strong and moderate physical activity was defined as those activities which increase the heart rate and breathing intensively and moderately for 10 minutes (see the STEPS approach for details). Local health workers were recruited and trained as data collectors. A field test was conducted and glitches during data collection were identified and rectified. Anthropometric measurements were determined using an electronic weighing scale and plastic measuring tape. Blood pressure was measured using an aneroid sphygmomanometer 3 times and the average was used for proportion. Finally, blood samples were collected on the spot or the next morning after the respondent had fasted for 10–12 hours. They were trans-ported in cold boxes (2–8°C) from the field to the Central Public Health Laboratory in Kabul using Cryovials. The samples were coded with the ID number of the question-naire. On arrival in the Central Public Health Laborato-ry, all serum samples were stored at –80 °C and later on were tested for triglyceride, cholesterol and glucose us-ing spectrophotometric method. A fasting blood sugar of ≥ 126 mg/dL was considered as diabetes mellitus (31). The cut-off for total biochemical markers was determined as: cholesterol 190 mg/dL, low density lipoprotein (LDL) 100 mg/dL, high density lipoprotein (HDL) for males 40 mg/dL and for females 50 mg/dL, and triglycerides 150 mg/dL. Data management and analysis were carried out us-ing EpiInfo, version 7 and SPSS, version 20.
According to the plan, 2 days training was conducted for those administering the survey followed by a field-based session where they had a chance to complete the questionnaire, measure blood pressure and waist circumference and practise taking blood samples from adults under field conditions.
A household was defined as a group of people who share the same food pot (not the same roof). In each household the interviewer enumerated all persons who were eligible for our study based on the inclusion criteria. In households with more than one eligible person, we used a lottery system to select the respondent for this survey. In cases of refusal, which was less than 5%, the interviewer approached the next household. This method provided an equal chance of each member of the household being selected.
Ethical considerations The protocol was reviewed by the Institutional Review Board of the Ministry of Public Health and a blanket ap-proval was issued. Informed consent was obtained from each individual before the interview. The results of phys-ical and biochemical measurements were communicated to the participants and the confidentiality of the infor-mation was maintained. All blood samples were stored at –80 °C in the Central Public Health Laboratory after com-pleting biochemical measurements for further testing. All collected data, hard and soft, were kept confidential in a locked cupboard and a password-protected computer.
Data analysisDescriptive analysis was done using mean and propor-tions to explain and describe the NCDs and risk factors. Statistical tests such as Student t-test and chi-squared were used to identify statistical significance whenever needed. The available dataset from each urban setting was used to identify the proportion of related risk fac-tors for NCDs in each of the 5 cities. Later on the data-sets were integrated and the pooled proportion was cal-culated from all datasets. The studies were conducted in a series of time intervals but the research team, data collection tool and protocols remained the same. Howev-er, as it is not conducted in a snapshot of time, this com-bined frequency should be interpreted cautiously. Fur-thermore, we weighted the data to make it comparable with the original population, which is published by the Central Statistical Office in Afghanistan. Both weighted unweighted results are presented for comparison.
ResultsBehavioural risk factors: STEP 1Of the total of 5897 respondents recruited in 5 cities, 2712 were male (46%). The average age of respondents was 39.6 [standard deviation (SD) 12.3] years. Overall, 38% of participants were literate; the highest literacy level (50%) was recorded in Kabul and the lowest (27%) in Kandahar. Around a quarter of the study participants were earning ≥ 10 000 Afghanis (US$ 175) a month (Table 1). The major-ity (83.5%) were married; only 7.7% were single. On aver-age, the selected households comprised 3.1 adults eligible for this study, of whom one in each selected household was interviewed. It should be noted that due to missing values (responses) in some variables the subtotals do not always reflect the total number of participants.
We found overall 8.0% of the participants were cigarette smokers and 11.1% were using naswar, however, usage was very low in females (2.7% and 2.5% respectively) compared with males (14.1% and 21.1% respectively). There was a statistically significant difference in tobacco use between males and females (P < 0.01). The highest level of naswar use was in the older population (55+ years) while the younger generation were more likely to smoke cigarettes.
On average, the participants consumed fruits 2.76 days per week and vegetables 3.85 days per week. On a typical day they consumed 1.4 servings of fruits and 1.9 servings of vegetables. More than two thirds (71.1%) consumed fruits ≤ 3 days per week and close to half (49.5%) consumed vegetables ≤ 3 days per week. Generally, consumption of fruits was slightly higher in the youngest and oldest groups (Table 2). The highest proportion of adult citizens consuming vegetables ≤ 3 days a week was in Jalalabad (in all age groups); the lowest percentage was recorded in Hirat.
For other food groups (data not shown), 10.5% of all study participants consumed red meat less than 2 days per week; 4.6% consumed chicken and 35.9% consumed rice more than 3 days per week. The use of table salt was
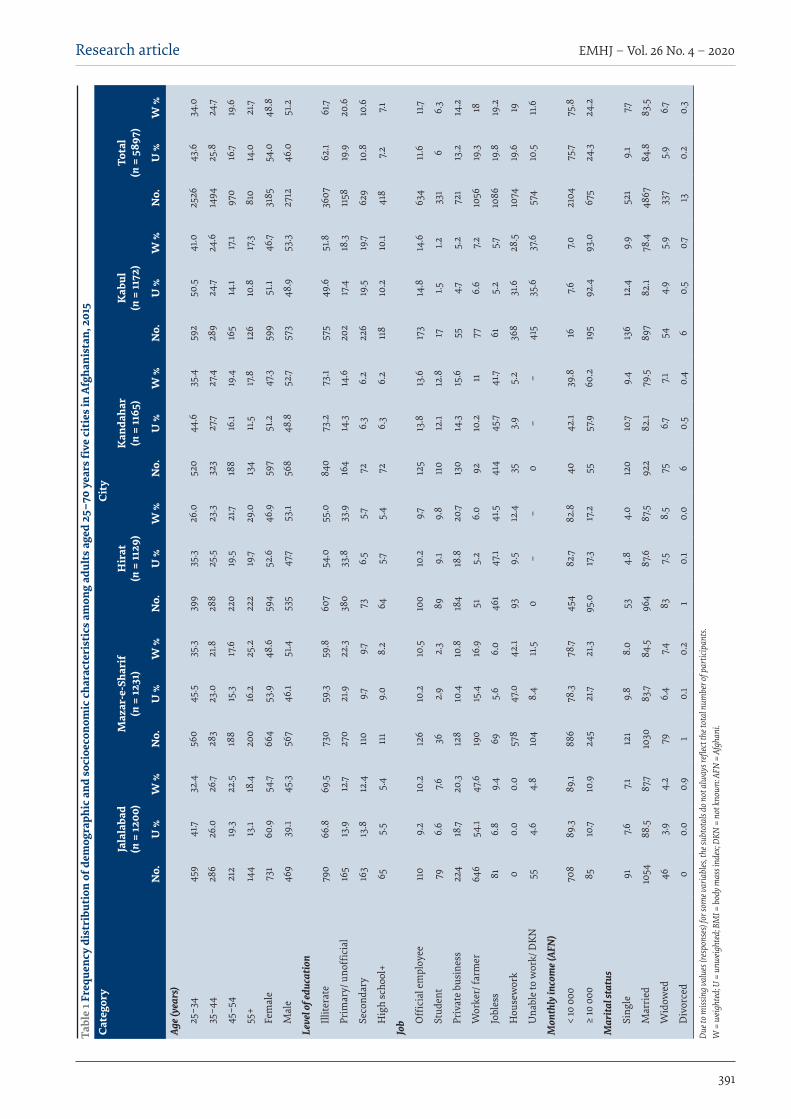
Research article
391
EMHJ – Vol. 26 No. 4 – 2020
Tabl
e 1 F
requ
ency
dis
trib
utio
n of
dem
ogra
phic
and
soci
oeco
nom
ic c
hara
cter
isti
cs a
mon
g ad
ults
age
d 25
–70
year
s five
cit
ies i
n Af
ghan
ista
n, 2
015
Cate
gory
City
Jala
laba
d
(n =
1200
)M
azar
-e-S
hari
f (n
= 12
31)
Hir
at
(n =
1129
)K
anda
har
(n =
1165
)K
abul
(n
= 11
72)
Tota
l (n
= 5
897 )
No.
U %
W %
No.
U %
W %
No.
U %
W %
No.
U %
W %
No.
U %
W %
No.
U %
W %
Age (
year
s)
25–3
445
941
.732
.456
045
.535
.339
935
.326
.052
044
.635
.459
250
.541
.025
2643
.634
.0
35–4
428
626
.026
.728
323
.021
.828
825
.523
.332
327
.727
.428
924
.724
.614
9425
.824
.7
45–5
421
219
.322
.518
815
.317
.622
019
.521
.718
816
.119
.416
514
.117
.197
016
.719
.6
55+
144
13.1
18.4
200
16.2
25.2
222
19.7
29.0
134
11.5
17.8
126
10.8
17.3
810
14.0
21.7
Fem
ale
731
60.9
54.7
664
53.9
48.6
594
52.6
46.9
597
51.2
47.3
599
51.1
46.7
3185
54.0
48.8
Mal
e46
939
.145
.356
746
.151
.453
547
.753
.156
848
.852
.757
348
.953
.327
1246
.051
.2
Leve
l of e
duca
tion
Illite
rate
790
66.8
69.5
730
59.3
59.8
607
54.0
55.0
840
73.2
73.1
575
49.6
51.8
3607
62.1
61.7
Prim
ary/
uno
ffici
al16
513
.912
.727
021
.922
.338
033
.833
.916
414
.314
.620
217
.418
.311
5819
.920
.6
Seco
ndar
y 16
313
.812
.411
09.7
9.773
6.5
5.772
6.3
6.2
226
19.5
19.7
629
10.8
10.6
Hig
h sc
hool
+65
5.5
5.4
111
9.0
8.2
645.7
5.4
726.
36.
211
810
.210
.141
87.2
7.1
Job O
ffici
al e
mpl
oyee
110
9.2
10.2
126
10.2
10.5
100
10.2
9.712
513
.813
.617
314
.814
.663
411
.611
.7
Stud
ent
796.
67.6
362.
92.
389
9.1
9.8
110
12.1
12.8
171.5
1.233
16
6.3
Priv
ate
busi
ness
224
18.7
20.3
128
10.4
10.8
184
18.8
20.7
130
14.3
15.6
554.7
5.2
721
13.2
14.2
Wor
ker/
farm
er64
654
.147
.619
015
.416
.951
5.2
6.0
9210
.211
776.
67.2
1056
19.3
18
Jobl
ess
816.
89.
469
5.6
6.0
461
47.1
41.5
414
45.7
41.7
615.
25.7
1086
19.8
19.2
Hou
sew
ork
00.
00.
057
847
.042
.193
9.5
12.4
353.9
5.2
368
31.6
28.5
1074
19.6
19
Una
ble
to w
ork/
DKN
554.
64.
810
48.
411
.50
––
0–
–41
535
.637
.657
410
.511
.6
Mon
thly
inco
me (
AFN
)
< 10
000
708
89.3
89.1
886
78.3
78.7
454
82.7
82.8
4042
.139
.816
7.67.0
2104
75.7
75.8
≥ 10
000
8510
.710
.924
521
.721
.395
.017
.317
.255
57.9
60.2
195
92.4
93.0
675
24.3
24.2
Mar
ital s
tatu
s
Sing
le91
7.67.1
121
9.8
8.0
534.
84.
012
010
.79.
413
612
.49.
952
19.
17.7
Mar
ried
1054
88.5
87.7
1030
83.7
84.5
964
87.6
87.5
922
82.1
79.5
897
82.1
78.4
4867
84.8
83.5
Wid
owed
463.9
4.2
796.
47.4
837.5
8.5
756.7
7.154
4.9
5.9
337
5.9
6.7
Div
orce
d0
0.0
0.9
10.
10.
21
0.1
0.0
60.
50.
46
0.5
0.713
0.2
0.3
Due t
o miss
ing v
alue
s (re
spon
ses)
for s
ome v
aria
bles
, the
subt
otal
s do n
ot al
way
s refl
ect t
he to
tal n
umbe
r of p
artic
ipan
ts.
W =
weig
hted
; U =
unw
eight
ed; B
MI =
body
mas
s ind
ex; D
KN =
not
know
n: A
FN =
Afg
hani
.
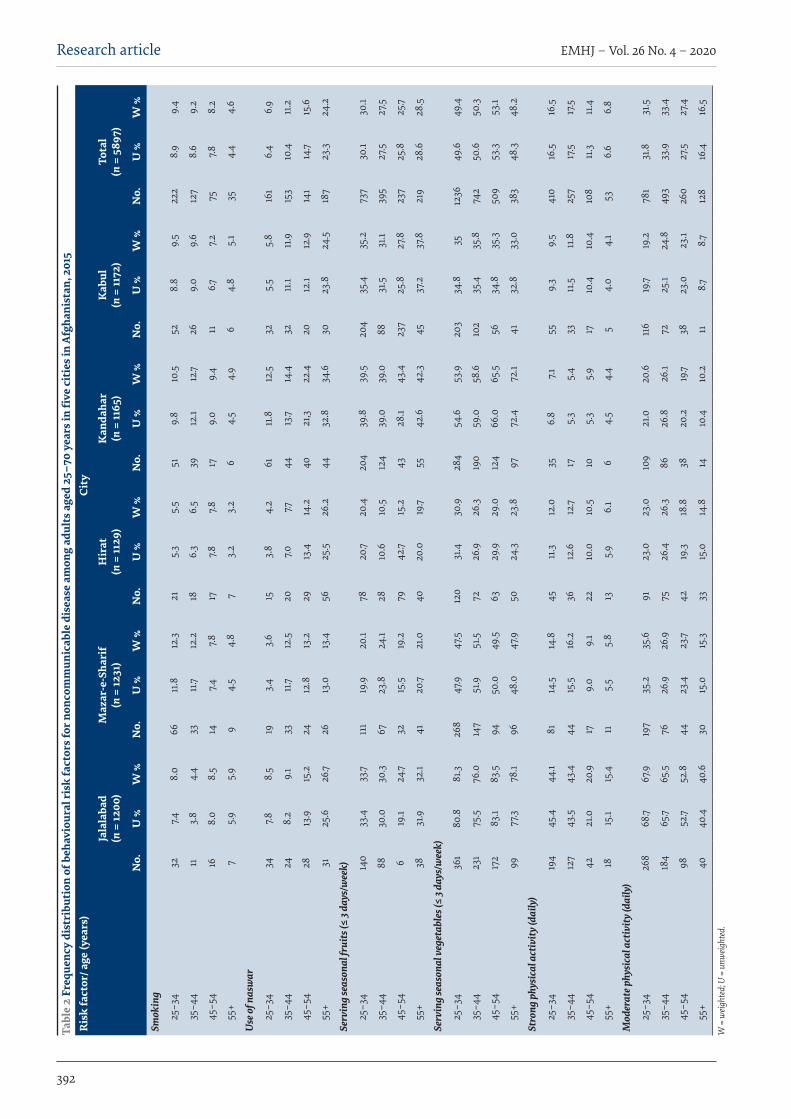
EMHJ – Vol. 26 No. 4 – 2020Research article
392
Tabl
e 2
Freq
uenc
y di
stri
buti
on o
f beh
avio
ural
risk
fact
ors f
or n
onco
mm
unic
able
dis
ease
am
ong
adul
ts a
ged
25–7
0 ye
ars i
n fi
ve c
itie
s in
Afgh
anis
tan,
201
5R
isk
fact
or/ a
ge (y
ears
)Ci
ty
Jala
laba
d
(n =
1200
)M
azar
-e-S
hari
f (n
= 12
31)
Hir
at
(n =
1129
)K
anda
har
(n =
1165
)K
abul
(n
= 11
72)
Tota
l (n
= 5
897 )
No.
U %
W %
No.
U %
W %
No.
U %
W %
No.
U %
W %
No.
U %
W %
No.
U %
W %
Smok
ing
25–3
432
7.48.
066
11.8
12.3
215.
35.
551
9.8
10.5
528.
89.
522
28.
99.
4
35–4
411
3.8
4.4
3311
.712
.218
6.3
6.5
3912
.112
.726
9.0
9.6
127
8.6
9.2
45–5
416
8.0
8.5
147.4
7.817
7.87.8
179.
09.
411
6.77.2
757.8
8.2
55+
75.
95.
99
4.5
4.8
73.
23.
26
4.5
4.9
64.
85.
135
4.4
4.6
Use
of n
asw
ar
25–3
434
7.88.
519
3.4
3.6
153.
84.
261
11.8
12.5
325.
55.
816
16.
46.
9
35–4
424
8.2
9.1
3311
.712
.520
7.07.7
4413
.714
.432
11.1
11.9
153
10.4
11.2
45–5
428
13.9
15.2
2412
.813
.229
13.4
14.2
4021
,322
.420
12.1
12.9
141
14.7
15.6
55+
3125
.626
.726
13.0
13.4
5625
.526
.244
32.8
34.6
3023
.824
.518
723
.324
.2
Serv
ing
seas
onal
frui
ts (≤
3 da
ys/w
eek)
25–3
414
033
.433
.711
119
.920
.178
20.7
20.4
204
39.8
39.5
204
35.4
35.2
737
30.1
30.1
35–4
488
30.0
30.3
6723
.824
.128
10.6
10.5
124
39.0
39.0
8831
.531
.139
527
.527
.5
45–5
46
19.1
24.7
3215
.519
.279
42.7
15.2
4328
.143
.423
725
.827
.823
725
.825
.7
55+
3831
.932
.141
20.7
21.0
4020
.019
.755
42.6
42.3
4537
.237
.821
928
.628
.5
Serv
ing
seas
onal
veg
etab
les (
≤ 3 d
ays/
wee
k)
25–3
436
180
.881
.326
847
.947
.512
031
.430
.928
454
.653
.920
334
.835
1236
49.6
49.4
35–4
423
175
.576
.014
751
.951
.572
26.9
26.3
190
59.0
58.6
102
35.4
35.8
742
50.6
50.3
45–5
417
283
.183
.594
50.0
49.5
6329
.929
.012
466
.065
.556
34.8
35.3
509
53.3
53.1
55+
9977
.378
.196
48.0
47.9
5024
.323
.897
72.4
72.1
4132
.833
.038
348
.348
.2
Stro
ng p
hysi
cal a
ctiv
ity (d
aily
)
25–3
419
445
.444
.181
14.5
14.8
4511
.312
.035
6.8
7.155
9.3
9.5
410
16.5
16.5
35–4
412
743
.543
.444
15.5
16.2
3612
.612
.717
5.3
5.4
3311
.511
.825
717
.517
.5
45–5
442
21.0
20.9
179.
09.
122
10.0
10.5
105.
35.
917
10.4
10.4
108
11.3
11.4
55+
1815
.115
.411
5.5
5.8
135.
96.
16
4.5
4.4
54.
04.
153
6.6
6.8
Mod
erat
e phy
sica
l act
ivity
(dai
ly)
25–3
426
868
.767
.919
735
.235
.691
23.0
23.0
109
21.0
20.6
116
19.7
19.2
781
31.8
31.5
35–4
418
465
.765
.576
26.9
26.9
7526
.426
.386
26.8
26.1
7225
.124
.849
333
.933
.4
45–5
498
52.7
52.8
4423
.423
.742
19.3
18.8
3820
.219
.738
23.0
23.1
260
27.5
27.4
55+
4040
.440
.630
15.0
15.3
3315
.014
.814
10.4
10.2
118.7
8.712
816
.416
.5
W =
weig
hted
; U =
unw
eight
ed.
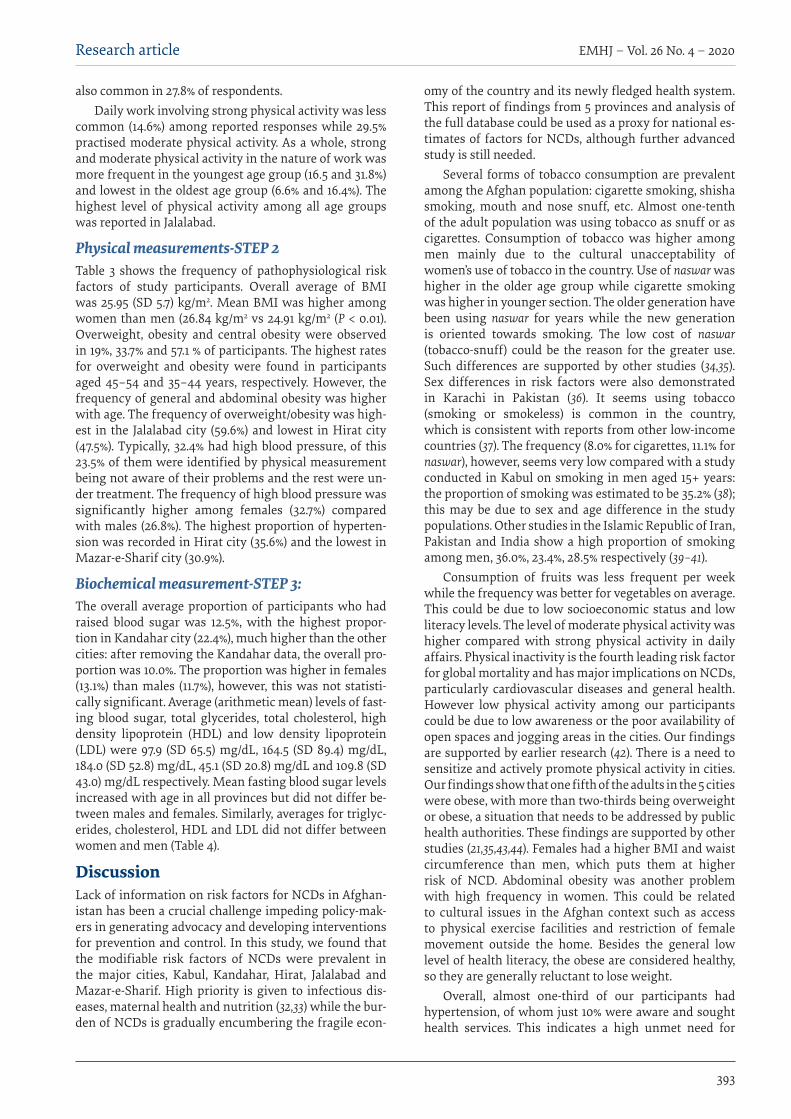
Research article
393
EMHJ – Vol. 26 No. 4 – 2020
also common in 27.8% of respondents. Daily work involving strong physical activity was less
common (14.6%) among reported responses while 29.5% practised moderate physical activity. As a whole, strong and moderate physical activity in the nature of work was more frequent in the youngest age group (16.5 and 31.8%) and lowest in the oldest age group (6.6% and 16.4%). The highest level of physical activity among all age groups was reported in Jalalabad.
Physical measurements-STEP 2Table 3 shows the frequency of pathophysiological risk factors of study participants. Overall average of BMI was 25.95 (SD 5.7) kg/m2. Mean BMI was higher among women than men (26.84 kg/m2 vs 24.91 kg/m2 (P < 0.01). Overweight, obesity and central obesity were observed in 19%, 33.7% and 57.1 % of participants. The highest rates for overweight and obesity were found in participants aged 45–54 and 35–44 years, respectively. However, the frequency of general and abdominal obesity was higher with age. The frequency of overweight/obesity was high-est in the Jalalabad city (59.6%) and lowest in Hirat city (47.5%). Typically, 32.4% had high blood pressure, of this 23.5% of them were identified by physical measurement being not aware of their problems and the rest were un-der treatment. The frequency of high blood pressure was significantly higher among females (32.7%) compared with males (26.8%). The highest proportion of hyperten-sion was recorded in Hirat city (35.6%) and the lowest in Mazar-e-Sharif city (30.9%).
Biochemical measurement-STEP 3:The overall average proportion of participants who had raised blood sugar was 12.5%, with the highest propor-tion in Kandahar city (22.4%), much higher than the other cities: after removing the Kandahar data, the overall pro-portion was 10.0%. The proportion was higher in females (13.1%) than males (11.7%), however, this was not statisti-cally significant. Average (arithmetic mean) levels of fast-ing blood sugar, total glycerides, total cholesterol, high density lipoprotein (HDL) and low density lipoprotein (LDL) were 97.9 (SD 65.5) mg/dL, 164.5 (SD 89.4) mg/dL, 184.0 (SD 52.8) mg/dL, 45.1 (SD 20.8) mg/dL and 109.8 (SD 43.0) mg/dL respectively. Mean fasting blood sugar levels increased with age in all provinces but did not differ be-tween males and females. Similarly, averages for triglyc-erides, cholesterol, HDL and LDL did not differ between women and men (Table 4).
DiscussionLack of information on risk factors for NCDs in Afghan-istan has been a crucial challenge impeding policy-mak-ers in generating advocacy and developing interventions for prevention and control. In this study, we found that the modifiable risk factors of NCDs were prevalent in the major cities, Kabul, Kandahar, Hirat, Jalalabad and Mazar-e-Sharif. High priority is given to infectious dis-eases, maternal health and nutrition (32,33) while the bur-den of NCDs is gradually encumbering the fragile econ-
omy of the country and its newly fledged health system. This report of findings from 5 provinces and analysis of the full database could be used as a proxy for national es-timates of factors for NCDs, although further advanced study is still needed.
Several forms of tobacco consumption are prevalent among the Afghan population: cigarette smoking, shisha smoking, mouth and nose snuff, etc. Almost one-tenth of the adult population was using tobacco as snuff or as cigarettes. Consumption of tobacco was higher among men mainly due to the cultural unacceptability of women’s use of tobacco in the country. Use of naswar was higher in the older age group while cigarette smoking was higher in younger section. The older generation have been using naswar for years while the new generation is oriented towards smoking. The low cost of naswar (tobacco-snuff) could be the reason for the greater use. Such differences are supported by other studies (34,35). Sex differences in risk factors were also demonstrated in Karachi in Pakistan (36). It seems using tobacco (smoking or smokeless) is common in the country, which is consistent with reports from other low-income countries (37). The frequency (8.0% for cigarettes, 11.1% for naswar), however, seems very low compared with a study conducted in Kabul on smoking in men aged 15+ years: the proportion of smoking was estimated to be 35.2% (38); this may be due to sex and age difference in the study populations. Other studies in the Islamic Republic of Iran, Pakistan and India show a high proportion of smoking among men, 36.0%, 23.4%, 28.5% respectively (39–41).
Consumption of fruits was less frequent per week while the frequency was better for vegetables on average. This could be due to low socioeconomic status and low literacy levels. The level of moderate physical activity was higher compared with strong physical activity in daily affairs. Physical inactivity is the fourth leading risk factor for global mortality and has major implications on NCDs, particularly cardiovascular diseases and general health. However low physical activity among our participants could be due to low awareness or the poor availability of open spaces and jogging areas in the cities. Our findings are supported by earlier research (42). There is a need to sensitize and actively promote physical activity in cities. Our findings show that one fifth of the adults in the 5 cities were obese, with more than two-thirds being overweight or obese, a situation that needs to be addressed by public health authorities. These findings are supported by other studies (21,35,43,44). Females had a higher BMI and waist circumference than men, which puts them at higher risk of NCD. Abdominal obesity was another problem with high frequency in women. This could be related to cultural issues in the Afghan context such as access to physical exercise facilities and restriction of female movement outside the home. Besides the general low level of health literacy, the obese are considered healthy, so they are generally reluctant to lose weight.
Overall, almost one-third of our participants had hypertension, of whom just 10% were aware and sought health services. This indicates a high unmet need for
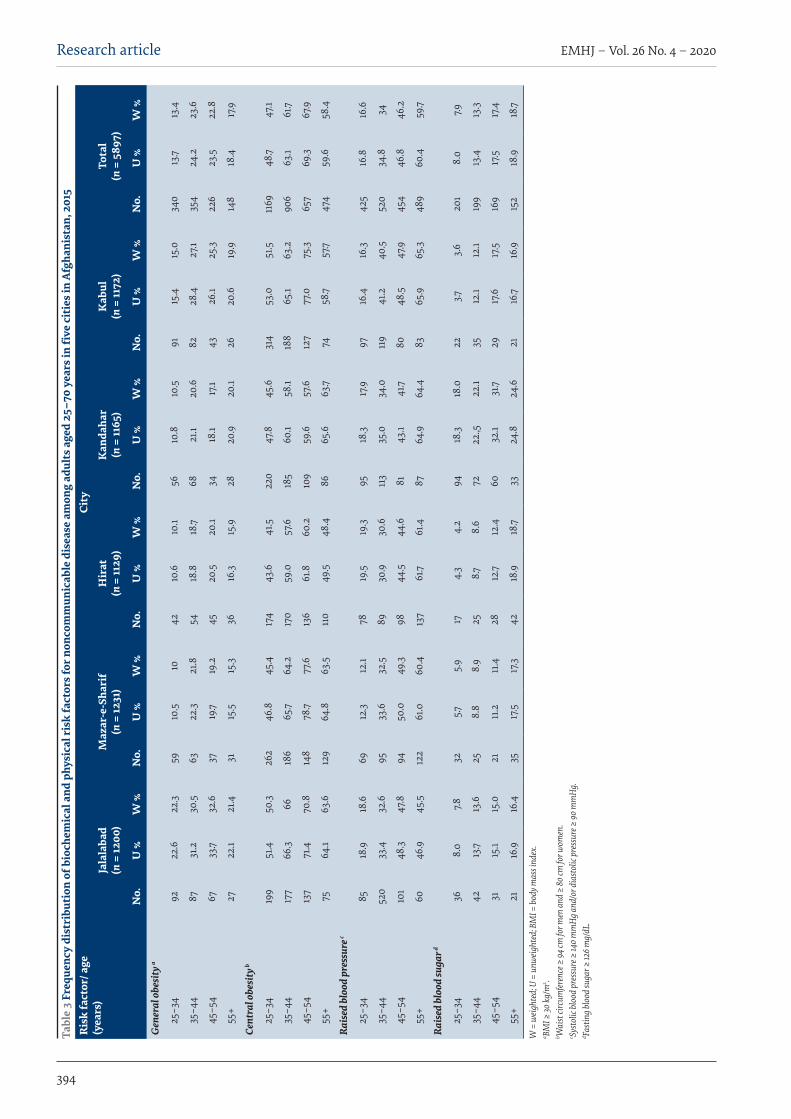
EMHJ – Vol. 26 No. 4 – 2020Research article
394
Tabl
e 3
Freq
uenc
y di
stri
buti
on o
f bio
chem
ical
and
phy
sica
l ris
k fa
ctor
s for
non
com
mun
icab
le d
isea
se a
mon
g ad
ults
age
d 25
–70
year
s in
five
cit
ies i
n Af
ghan
ista
n, 2
015
Ris
k fa
ctor
/ age
(y
ears
)Ci
ty
Jala
laba
d
(n =
1200
)M
azar
-e-S
hari
f (n
= 12
31)
Hir
at
(n =
1129
)K
anda
har
(n =
1165
)K
abul
(n
= 11
72)
Tota
l (n
= 5
897 )
No.
U %
W %
No.
U %
W %
No.
U %
W %
No.
U %
W %
No.
U %
W %
No.
U %
W %
Gen
eral
obe
sity
a
25–3
492
22.6
22.3
5910
.510
4210
.610
.156
10.8
10.5
9115
.415
.034
013
.713
.4
35–4
487
31.2
30.5
6322
.321
.854
18.8
18.7
6821
.120
.682
28.4
27.1
354
24.2
23.6
45–5
467
33.7
32.6
3719
.719
.245
20.5
20.1
3418
.117
.143
26.1
25.3
226
23.5
22.8
55+
2722
.121
.431
15.5
15.3
3616
.315
.928
20.9
20.1
2620
.619
.914
818
.417
.9
Cent
ral o
besi
ty b
25–3
419
951
.450
.326
246
.845
.417
443
.641
.522
047
.845
.631
453
.051
.511
6948
.747
.1
35–4
417
766
.366
186
65.7
64.2
170
59.0
57.6
185
60.1
58.1
188
65.1
63.2
906
63.1
61.7
45–5
413
771
.470
.814
878
.777
.613
661
.860
.210
959
.657
.612
777
.075
.365
769
.367
.9
55+
7564
.163
.612
964
.863
.511
049
.548
.486
65.6
63.7
7458
.757
.747
459
.658
.4
Rais
ed b
lood
pre
ssur
e c
25–3
485
18.9
18.6
6912
.312
.178
19.5
19.3
9518
.317
.997
16.4
16.3
425
16.8
16.6
35–4
452
033
.432
.695
33.6
32.5
8930
.930
.611
335
.034
.011
941
.240
.552
034
.834
45–5
410
148
.347
.894
50.0
49.3
9844
.544
.681
43.1
41.7
8048
.547
.945
446
.846
.2
55+
6046
.945
.512
261
.060
.413
761
.761
.487
64.9
64.4
8365
.965
.348
960
.459
.7
Rais
ed b
lood
suga
r d
25–3
436
8.0
7.832
5.75.
917
4.3
4.2
9418
.318
.022
3.73.
620
18.
07.9
35–4
442
13.7
13.6
258.
88.
925
8.78.
672
22.,5
22.1
3512
.112
.119
913
.413
.3
45–5
431
15.1
15.0
2111
.211
.428
12.7
12.4
6032
.131
.729
17.6
17.5
169
17.5
17.4
55+
2116
.916
.435
17.5
17.3
4218
.918
.733
24.8
24.6
2116
.716
.915
218
.918
.7
W =
weig
hted
; U =
unw
eight
ed; B
MI =
body
mas
s ind
ex.
a BMI ≥
30 kg
/m2 .
b Wai
st cir
cum
feren
ce ≥
94 cm
for m
en an
d ≥
80 cm
for w
omen
. c Sy
stolic
bloo
d pr
essu
re ≥
140
mm
Hg a
nd/o
r dia
stol
ic pr
essu
re ≥
90 m
mH
g.
d Fasti
ng bl
ood
suga
r ≥ 12
6 mg/
dL.
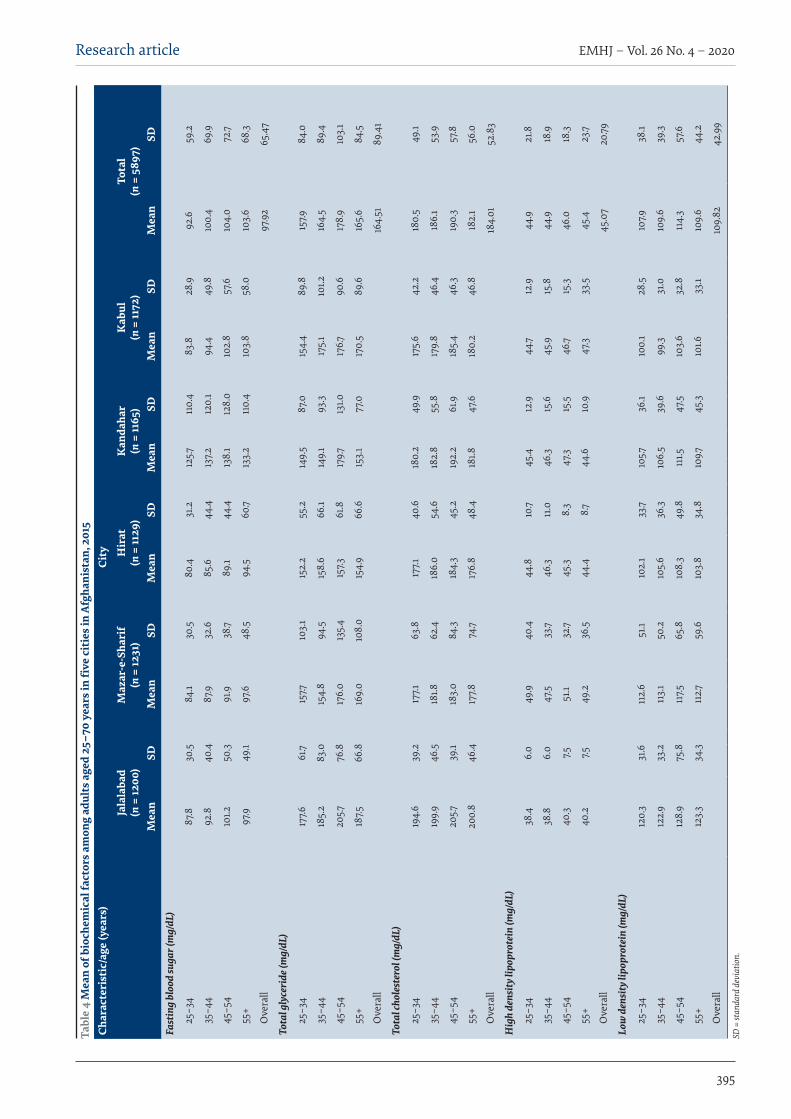
Research article
395
EMHJ – Vol. 26 No. 4 – 2020
Tabl
e 4
Mea
n of
bio
chem
ical
fact
ors a
mon
g ad
ults
age
d 25
–70
year
s in
five
cit
ies i
n Af
ghan
ista
n, 2
015
Char
acte
rist
ic/a
ge (y
ears
)Ci
ty
Jala
laba
d
(n =
1200
)M
azar
-e-S
hari
f (n
= 12
31)
Hir
at
(n =
1129
)K
anda
har
(n =
1165
)K
abul
(n
= 11
72)
Tota
l (n
= 5
897 )
Mea
nSD
Mea
nSD
Mea
nSD
Mea
nSD
Mea
nSD
Mea
nSD
Fast
ing
bloo
d su
gar (
mg/
dL)
25–3
487
.830
.584
.130
.580
.431
.212
5.711
0.4
83.8
28.9
92.6
59.2
35–4
492
.840
.487
.932
.685
.644
.413
7.212
0.1
94.4
49.8
100.
469
.9
45–5
410
1.250
.391
.938
.789
.144
.413
8.1
128.
010
2.8
57.6
104.
072
.7
55+
97.9
49.1
97.6
48.5
94.5
60.7
133.
211
0.4
103.
858
.010
3.6
68.3
Ove
rall
97.9
265
.47
Tota
l gly
ceri
de (m
g/dL
)
25–3
417
7.661
.715
7.710
3.1
152.
255
.214
9.5
87.0
154.
489
.815
7.984
.0
35–4
418
5.2
83.0
154.
894
.515
8.6
66.1
149.
193
.317
5.1
101.2
164.
589
.4
45–5
420
5.776
.817
6.0
135.
415
7.361
.817
9.713
1.017
6.790
.617
8.9
103.
1
55+
187.5
66.8
169.
010
8.0
154.
966
.615
3.1
77.0
170.
589
.616
5.6
84.5
Ove
rall
164.
5189
.41
Tota
l cho
lest
erol
(mg/
dL)
25–3
419
4.6
39.2
177.1
63.8
177.1
40.6
180.
249
.917
5.6
42.2
180.
549
.1
35–4
419
9.9
46.5
181.8
62.4
186.
054
.618
2.8
55.8
179.
846
.418
6.1
53.9
45–5
420
5.739
.118
3.0
84.3
184.
345
.219
2.2
61.9
185.
446
.319
0.3
57.8
55+
200.
846
.417
7.874
.717
6.8
48.4
181.8
47.6
180.
246
.818
2.1
56.0
Ove
rall
184.
0152
.83
Hig
h de
nsity
lipo
prot
ein
(mg/
dL)
25–3
438
.46.
049
.940
.444
.810
.745
.412
.944
.712
.944
.921
.8
35–4
438
.86.
047
.533
.746
.311
.046
.315
.645
.915
.844
.918
.9
45–5
440
.37.5
51.1
32.7
45.3
8.3
47.3
15.5
46.7
15.3
46.0
18.3
55+
40.2
7.549
.236
.544
.48.7
44.6
10.9
47.3
33.5
45.4
23.7
Ove
rall
45.0
720
.79
Low
den
sity
lipo
prot
ein
(mg/
dL)
25–3
412
0.3
31.6
112.
651
.110
2.1
33.7
105.7
36.1
100.
128
.510
7.938
.1
35–4
412
2.9
33.2
113.
150
.210
5.6
36.3
106.
539
.699
.331
.010
9.6
39.3
45–5
412
8.9
75.8
117.5
65.8
108.
349
.811
1.547
.510
3.6
32.8
114.
357
.6
55+
123.
334
.311
2.759
.610
3.8
34.8
109.7
45.3
101.6
33.1
109.
644
.2
Ove
rall
109.
8242
.99
SD =
stan
dard
dev
iatio
n.
EMHJ – Vol. 26 No. 4 – 2020Research article
396
AcknowledgementsWe would like to thank the Surveillance Department at the Ministry of Public Health and the WHO Kabul Office for sup-porting the series of studies conducted at provincial level.
Funding: The funding for the primary studies in each province was provided by the WHO Country Office, but this study, which used the dataset of the primary studies, has not been funded by any organization.
Competing interests: None declared.
prevention and management of hypertension in the country. Raising awareness on hypertension and a screening programme should be encouraged when adults come to health centres for any other health problem. This finding is supported by an earlier study conducted in Kabul (22), and is consistent with studies in the Islamic Republic of Iran, Pakistan and Nepal (45–48). High level of raised blood sugar is another risk factor for other NCDs which was found as a result of this study. It is consistent with other studies within and outside the country (22,47). Likewise, the high proportion of people in Kandahar with high blood sugar is a point for consideration. After removing the Kandahar data, the overall proportion was 10.0%, thus, more advanced study is required in this city to identify the actual situation (the data were checked and the questionnaire reviewed for errors, however the possibility of non-fasting blood collection cannot be ruled out). Robust studies for diabetes are required in this southern city of the country.
This was a cross-sectional survey, therefore, it is not possible to establish causation. In addition, the surveys were conducted only in the urban setting of the provinces surveyed, therefore, our findings are representative only of the urban area of Afghanistan. The integrated and combined results, although reflected, are not adequately generalized to the general urban adult population as they were conducted over different time periods. Furthermore, the data were not standardized so caution should be used in interpretation of the findings. More than half the study participants (52.2%) had ≥ 1 of the 4 main risk factors (obesity, hypertension, smoking and high blood
sugar). Therefore, taking into account the major findings of provincial as well as general overall estimates of risk factors, we encourage the introduction of education campaigns to raise awareness on physical activity and a healthy diet as protective factors against all NCDs.
Urbanization is expanding in Afghanistan and cities are progressively becoming overcrowded, however they have very limited facilities for jogging and other aerobic sports. The establishment of such facilitates, particularly for women, is recommended. As a number of risk factors may be present simultaneously in an individual, interventions are needed to target groups of risk factors rather than just one at a time. Although all provincial findings as well as the overall findings are alarming and will be useful as a baseline for future studies, the financial constraints which prevented listing of the households ahead of the study, the overestimation of the NCD burdens due to free checking of blood pressure and blood testing and the poor security situation, which forced the teams to exclude some areas, are further limitations to be taken into consideration.
Nonetheless, the findings of this study undoubtedly fill some of the gaps in the information for policy development and the design of interventions. Our findings pave the way for a nationwide study on NCDs using the WHO STEPwise approach to provide full information at country level. The establishment of behavioural surveillance using the STEPwise approach will place the Ministry of Public Health in a better position to take appropriate action.
Profil des facteurs de risque de maladies non transmissibles dans les principales villes d’Afghanistan : Approche STEPwise de l’OMS pour la surveillanceRésuméContexte : Les maladies non transmissibles (MNT) constituent un problème de santé publique majeur dans le monde. Malgré l’amélioration de la situation sanitaire, les indicateurs de santé de l’Afghanistan sont les pires de la Région. Près de 37 % d’adultes afghans décèdent du fait de MNT.Objectifs : La présente étude avait pour objectif d’estimer la proportion des principaux facteurs de risque des MNT en Afghanistan. Méthodes : Nous avons analysé l’ensemble de données des études menées dans cinq provinces (Balkh, Hirat, Kaboul, Kandahar et Nangarhar) au cours de la période comprise entre 2013 et 2015, en utilisant l’approche STEPwise de l’OMS pour la surveillance des MNT. Cela impliquait un échantillonnage en grappes à plusieurs degrés auprès de citoyens urbains âgés de 25 à 70 ans. Les logiciels EpiInfo, version 7, et SPSS, version 20, ont été utilisés pour la gestion des données.Résultats : Au total, 5897 fiches ont été incluses dans l’analyse ; 54 % concernaient des femmes. L’âge moyen était de 39,56 ans (écart type 12,29) ; le taux d’analphabétisme était de 61,5 % et 83,2 % étaient mariés. Le tabagisme et l’usage du
Research article
397
EMHJ – Vol. 26 No. 4 – 2020
References1. Population estimation 2014/15. Kabul: Central Statistics Organization; 2015 (http://cso.gov.af/en/ page/demography-and-socile-sta-
tistics/demograph-statistics/3897, accessed 29 July 2015).
2. Afghanistan Demographic and Health Survey 2015. Kabul: Central Statistics Organization, Ministry of Public Health; 2015.
3. Maurice J. WHO heads efforts to restore Afghanistan’s shattered health. Bull World Health Organ. 2001;79(12):1174. PMID:11799458
4. Mayhew M, Hansen PM, Peters DH, Edward A, Singh LP, Dwivedi V, et al. Determinants of skilled birth attendant utilization in Afghanistan: A cross-sectional study. Am J Public Health. 2008 Oct;98(10):1849–56. doi:10.2105/AJPH.2007.123471
5. World drug report – executive summary. New York: United Nations Office on Drugs and Crime; 2015:42.
6. Afghanistan mortality survey 2010. Calverton, Maryland: Afghan Public Health Institute, Ministry of Public Health, Central Statistics Organization (Afghanistan), ICF Macro, Indian Institute of Health Management Research, World Health Organization Regional Office for the Eastern Mediterranean; 2011 (http://dhsprogram.com/pubs/pdf/FR248/FR248.pdf, accessed 20 December 2019).
7. Horton R. Non-communicable diseases: 2015–2025. Lancet. 2013 Feb 16;381(9866):509–10. doi:10.1016/S0140-6736(13)60100-2
8. Global status report on noncommunicable diseases 2014. Geneva: World Health Organization; 2014.
9. Foucard L. Transition épidémiologique et développement: l’essor des maladies non transmissibles est-il une fatalité? [Epidemi-ological transition and development: is the increase in non-communicable diseases inevitable?] Médecine Tropicale: revue du corps de santé colonial. 2007;67(6):543–4.
10. 2008–2013 action plan for the global strategy for the prevention and control of noncommunicable diseases. Geneva: World Health Organization; 2008 (World Health Assembly document A61/8).
11. Global Health Observatory data: NCD mortality and morbidity. Geneva: World Health Organization; 2017 (www.who.int/gho/ncd/mortality_morbidity/en/, accessed 29 January 2018).
tabac à priser étaient de 8 % et 11,1% respectivement. En moyenne, les sujets consommaient des fruits et des légumes 2,76 et 3,85 jours par semaine et le surpoids, l’obésité générale et abdominale étaient de 19 %, 33,7 % et 57,1 %, respectivement. En règle générale, 32,4 % avaient une pression artérielle élevée et 12,5 % avaient une glycémie élevée.Conclusions : Les facteurs de risque modifiables des MNT étaient répandus dans les principales villes du pays. Leur identification est vitale pour tenter de se concentrer sur la prévalence de ces maladies dans les villes urbaines. Des interventions sur mesure sont nécessaires pour se concentrer sur les MNT en Afghanistan.
مرتسم عوامل اخلطر املتعلقة باألمراض غري السارية يف املدن الكربى يف أفغانستان: هنج منظمة الصحة العاملية للرتصد التدرجييخواجه مری اسالم سعید، حممد حفیظ رسولی، ماللی نجابی
اخلالصةن الوضع الصحي، فإن املؤرشات اخللفية: متثل األمراض غری السارية مشكلة كبریة من مشكالت الصحة العامة يف العامل أمجع. وعىل الرغم من حتسُّ
الصحیة يف أفغانستان هي األسوأ يف اإلقلیم. وتتسبب األمراض غری السارية يف وفاة نحو %37 من البالغني األفغان.األهداف: هدفنا إىل تقدير نسبة عوامل اخلطر الرئیسیة لألمراض غری السارية يف أفغانستان.
طرق البحث: أجرينا حتلیاًل ملجموعة البیانات امُلستقاة من دراسات ُأجريت يف 5 واليات، أال وهي كابول وبلخ وهرات وننكرهار وقندهار، خالل د األمراض غری السارية. وانطوى ذلك الفرتة من عام 2013 إىل عام 2015، باستخدام النهج التدرجيي الذي تتبعه منظمة الصحة العاملیة يف ترصُّعىل أخذ عینات عنقودية عىل مراحل متعددة من مواطنني يعیشون يف مناطق حرضية ويرتاوح سنهم بني 25 و70 سنة. واسُتخدم يف إدارة البیانات
.SPSS واإلصدار 20 من برنامج Epi Info اإلصدار 7 من برنامجالنتائج: بلغ العدد اإلمجايل للسجالت املشمولة بالتحلیل 5897 سجاًل، منها %54 إلناث. وكان متوسط السن 39.56 )االنحراف املعیاري 12.29( للدراسة اخلاضعون وكان .11.1% ُعوط السَّ متعاطي ونسبة .8% املدخنني نسبة وكانت .83.2% املتزوجني ونسبة ،61.5% األمیة ومعدل سنة، %19، ونسبة السمنة 3.85 يوم أسبوعیًا يف املتوسط. وكانت نسبة زيادة الوزن 2.76 يوم أسبوعیًا واخلرضوات بمعدل الفواكه بمعدل يتناولون العامة %33.7، ونسبة السمنة يف منطقة البطن %57.1. وكانت نسبة الذين يعانون ارتفاع ضغط الدم %32.4، وارتفاع مستوى السكر يف الدم 12.5%،
ومها نسبتان نمطیتان.االستنتاجات: كانت عوامل اخلطر القابلة للتغیری املتعلقة باألمراض غری السارية واسعة االنتشار يف املدن الرئیسیة للبلد. ومن الرضوري حتديد هذه مة خصیصًا للرتكیز عىل األمراض غری العوامل عند حماولة الرتكیز عىل انتشار األمراض غری السارية يف املدن احلرضية. ويلزم القیام بتدخالت ُمصمَّ
السارية يف أفغانستان.
EMHJ – Vol. 26 No. 4 – 2020Research article
398
12. Global health estimates: deaths by cause, age, sex and country, 2000–2012. Geneva: World Health Organization; 2014.
13. WHO Fact sheet. Noncommunicable diseases. Updated, June 2017. Geneva: World Health Organization; 2017 (www.who.int/mediacentre/factsheets/fs355/en/, accessed 1 September 2017).
14. Global status report on noncommunicable diseases 2010. Geneva: World Health Organization; 2011 (http://www.who.int/nmh/publications/ncd_report_full_en.pdf, accessed 29 July 2015).
15. Kankeu HT, Saksena P, Xu K, Evans DB. The financial burden from noncommunicable diseases in low- and middle-income coun-tries: a literature review. Health Res Policy Syst. 2013 Aug 16;11:31. doi:10.1186/1478-4505-11-31
16. The political declaration of the United Nations General Assembly on the prevention and control of non-communicable diseases: commitments of Member States and the way forward. Technical discussion paper. Fifty-ninth session of the Regional Commit-tee for the Eastern Mediterranean, August2012. Provisional agenda item 4(a) (EM/RC59/3) (http://applications.emro.who.int/docs/RC_technical_papers_2012_3_14578_EN.pdf, accessed 29 July 2015).
17. Salehuddin M, Choudhury KN, Islami N, Zillurahman M, Gosh S, Majib M. Burden of non-communicable diseases in South Asia – a clinical review. University Heart J. 2010, July;6(2).
18. Health systems strengthening in countries of the Eastern Mediterranean Region: challenges, priorities and options for future action. Technical discussion paper. Fifty-ninth session of the Regional Committee for the Eastern Mediterranean, October 2012. Cairo: World Health Organization; 2012 (EM/RC59/Tech.Disc.1) (http://applications.emro.who.int/docs/RC_technical_pa-pers_2012_Tech_Disc_1_14613_EN.pdf, accessed 20 December 2013).
19. Prevention and control of noncommunicable diseases. Outcome of the high-level meeting of the General Assembly on the prevention and control of noncommunicable diseases and the first global conference on health lifestyles and noncommunicable disease control. Sixty-fifth World Health Assembly, 20 April 2012. Provisional agenda item 13.1 (A65/6). Geneva: World Health Organization; 2012 (http://apps.who.int/gb/ebwha/pdf_files/WHA65/A65_6-en.pdf, accessed 20 December 2019).
20. Noncommunicable diseases country profiles 2014. Geneva: World Health Organization; 2014 (https://www.who.int/nmh/publica-tions/ncd-profiles-2014/en/, accessed 20 December 2019).
21. Diabetes programme. Country and regional data on diabetes. Prevalence of diabetes in the WHO Eastern Mediterranean Region. Geneva: World Health Organization; 2015 (http://www.who.int/diabetes/facts/world_figures/en/index2.html, accessed 20 Decem-ber 2019).
22. Mohmand KA, Sharifi K, Bahram AA. Smoking prevalence survey in Kabul City. Kabul. Social and Health Development Program; 2010. Afghan J Public Health. 2014;2(1):21–5. (http://anpha.af/wp-content/uploads/2016/10/afjph_2014_volume_2_issue_1-2.pdf, accessed 15 January 2020).
23. Saeed KMI. Prevalence of risk factors for NCDs in the adult population of urban areas in Kabul city, Afghanistan. Cent Asian J Glob Health. 2013;2(2):10. 5195/cajgh.2013.69
24. Ministry of Public Health, National Health Policy (2015–2020), Kabul Afghanistan
25. Bonita R, deCourten M, Dwyer T, Jamrozik K, Winkelmann R. Surveillance of risk factors for noncommunicable diseases: the WHO STEP-wise approach. Geneva: World Health Organization; 2002 (WHO/NMH/CCS/01.2002).
26. WHO STEPwise approach to surveillance (STEPS). Geneva: World Health Organization; (http://www.who.int/chp/steps/en, accessed 20 December 2019)
27. Riley L, Guthold R, Cowan M, Savin S, Bhatti L, Armstrong T, et al. The World Health Organization STEP wise approach to noncommunicable disease risk-factor surveillance: methods, challenges, and opportunities. Am J Public Health. 2016;106:74–8. doi:10.2105/AJPH.2015.302962
28. Obesity: preventing and managing the global epidemic. Geneva: World Health Organization; 2000 (WHO Technical Report Series No. 894).
29. The IDF consensus worldwide definitions of the metabolic syndrome. Brussels: International Diabetes Federation; 2006 (http://www.idf.org/webdata/docs/IDF_Meta_def_final.pdf, accessed 29 July 2015).
30. Whitworth JA; World Health Organization, International Society of Hypertension Writing Group. 2003 World Health Organ-ization (WHO)/International Society of Hypertension (ISH) statement on management of hypertension. J Hypertens. 2003 Nov;21(11):1983–92. doi:10.1097/00004872-200311000-00002
31. Diabetes. Fact sheet no. 312. Updated January 2015. Geneva: World Health Organization; 2015 (http://www.who.int/mediacentre/factsheets/fs312/en/, accessed 29 July 2015).
32. Health management information system (HMIS). In: Annual report 1391. Kabul: Ministry of Public Health; 2012.
33. Disease early warning system (DEWS) surveillance. In: Annual report. Kabul: Afghan National Public Health Institute, Ministry of Public Health; 2013.
34. WHO STEPS. Chronic disease risk factor surveillance. Data book, I.R. Iran 1388 (2009) (http://www.who.int/chp/steps/Iran_Data-Book_2009.pdf?ua=1, accessed 29 July 2015).
35. Pan B, Chen X, Wu X, Li J, Li J, Li Y, et al. Prevalence of noncommunicable diseases and their risk factors in Guangzhou, China. Prev Chronic Dis. 2014 Mar 27;11:E49. doi:10.5888/pcd11.130091
36. Stevens GA, Singh GM, Lu Y, Danaei G, Lin JK, Finucane MM, et al. National, regional, and global trends in adult overweight and obesity prevalence. Popul Health Metr. 2012;10(1):22–2. doi:10.1186/1478-7954-10-22
Research article
399
EMHJ – Vol. 26 No. 4 – 2020
37. Kebede Y, Abula T, Ayele B, Feleke A, Degu G, Kifle A, et al. Substances abuse for the Ethiopian health center team. Ethiop Public Health Train Initiative. 2005;81.
38. Mohmand KA, Sharifi K, Ahad Bahram A. The burden of cigarette smoking among males in Kabul, Afghanistan. Afghan J Public Health. 2014 January;(2):l.
39. Alam SE. Prevalence and pattern of smoking in Pakistan. J. Pak. Med. Assoc. 1998 March;64–66.
40. Meysamie A, Ghaletaki R, Haghazali M, et al. Pattern of tobacco use among the Iranian adult population: results of the na-tional Survey of Risk Factors of Non-Communicable Diseases (SuRFNCD-2007). Tob Control. 2010;19(2):125–128. doi:10.1136/tc.2009.030759.
41. E Jindal SK, Aggarwal AN, Chaudhry K, et al. Tobacco smoking in India: Prevalence, quit-rates and respiratory morbidity. Indian J Chest Dis Allied Sci. 2006;48(1):37–42.
42. Nath A, Garg S, Deb S, Ray A, Kaur R. A study of the profile of behavioral risk factors of non-communicable diseases in an urban setting using the WHO STEPS 1 approach. Ann Trop Med Public Health. 2009;(2):15–9.
43. Finucane MM, Stevens GA, Cowan MJ, Danaei G, Lin JK, Paciorek CJ, et al. Nnational, regional, and global trends in body-mass index since 1980: systematic analysis of health examination surveys and epidemiological studies with 960 country-years and 9.1 million participants. Lancet. 2011 Feb 12;377(9765):557–67. doi:10.1016/S0140-6736(10)62037-5
44. Garg A, Anand T, Sharma U, Kishore J, Chakraborty M, Ray PC, et al. Prevalence of risk factors for chronic noncommunica-ble diseases using who STEPS approach in an adult population in Delhi. J Family Med Prim Care. 2014 Apr–Jun;3(2):112–8. doi:10.4103/2249-4863.137617
45. Haghdoost AA, Sadeghirad B, Rezazadehkermani M. Epidemiology and heterogeneity of hypertension in Iran: a systematic review. Arch Iran Med. 2008 Jul;11(4):444–52.
46. Esteghamati A, Meysamie A, Khalilzadeh O, Rashidi A, Haghazali M, Asgari F, et al. Third national surveillance of risk factors of NCDs (SuRFNCD-2007) in Iran: methods and results on prevalence of diabetes, hypertension, obesity, central obesity, and dyslipidemia. BMC Public Health. 2009;9:167. PMID:19480675.
47. Shera AS, Basit A, Fawwad A, Hakeem R, Ahmedani MYM, Zafar M. Pakistan national diabetes survey: prevalence of glu-cose intolerance and associated factors in the Punjab province of Pakistan. Prim Care Diabetes. 2010;4(2):79–83. doi:10.1016/j.pcd.2010.01.003
48. Aryal KK, Mehata S, Neupane S, Vaidya A, Dhimal M, Dhakal P, et al. The burden and determinants of non communicable diseases risk factors in Nepal: findings from a nationwide STEPS survey.PLoS ONE. 2015;10(8): e0134834. doi:10.1371/journal.pone.0134834
EMHJ – Vol. 26 No. 4 – 2020Research article
400
Developing a national minimum data set for hospital information systems in the Islamic Republic of IranZahra Rampisheh,1 Mohammad Esmaeil Kameli,2 Javad Zarei,3 Akram Vahedi Barzaki,4 Marziyhe Meraji 5 and Ali Mohammadi 6
1Preventive Medicine and Public Health Research Center, Department of Community Medicine, School of Medicine, Iran University of Medical Sciences, Tehran, Islamic Republic of Iran. 2Department of Community Medicine, School of Medicine, Iran University of Medical Sciences, Tehran, Islamic Republic of Iran. 3Department of Health Information Technology, School of Allied Medical Sciences, Ahvaz Jundishapur University of Medical Sciences, Ahvaz, Islamic Republic of Iran. 4Health Information Management Research Center, Kashan University of Medical Sciences, Kashan, Islamic Republic of Iran. 5Department of Medical Records and Health Information Technology, Faculty of Paramedical Sciences, Mashhad University of Med-ical Sciences, Mashhad, Islamic Republic of Iran. 6Department of Health Information Technology, School of Paramedicine, Kermanshah University of Medical Sciences, Kermanshah, Islamic Republic of Iran. (Correspondence to: Ali Mohammadi:[email protected]).
Introduction Data quality in a hospital information system plays an important role in health policy-making. Low quality of the data increases the rate of medical errors and lowers the quality of care (1). Designing a structure for standard-ized data collection supports disease information man-agement and leads to better quality of care (2). Standard health care data usually indicate minimum data elements that should be collected (3).
A minimum data set is a standard data collection tool (4). In each area, the minimum data set contains many data elements for demographic data, health and treatment status, reimbursement resources, and patient transfer location (5). The main objective of the minimum data set is to build a national database that can serve as an information management source to equip decision-makers and policy-makers with accurate and up-to-date information (6). The minimum data set of each area strengthens the relationship between the studies conducted and extraction of research results, improves plans, strategies and policies, and provides the
opportunity for equity in the health system (7).In the health care system, data sets identify data
elements that should be collected for each patient and provide definitions for each element based on standards. Data comparison is used for different purposes including external accreditation, evaluation of internal performance, and research and statistical studies. Therefore, it is important to determine standard data sets to manage the clinical performance of health organizations in every country (8).
Although minimum data sets are specific to each country, they should be able to allow data comparison at an international level. In this regard, many countries have developed national general or specialized minimum data sets for their health information systems (9). These include: Qatar (2014) (10), Denmark (1987), Germany (MDIM 1995), United Kingdom of Great Britain and Northern Ireland (NHS-MDS, 1993), the Netherlands (1997), Australia (1995) (11), Canada (1998) (12), New Zealand (1992) (13) and the United States of America (1974) (14).
In the Islamic Republic of Iran, the content of hospital
AbstractBackground: Standardized data collection supports disease information management and leads to better quality of care. The Islamic Republic of Iran lacks a standard data set for data collection in hospitals.Aims: The aim of this study was to design a minimum data set for hospital information systems in the Islamic Republic of Iran.Methods: This study was conducted in 2015. Data sets of other countries, hospital records, hospital information systems and electronic health record systems in the Islamic Republic of Iran were reviewed for data elements for the minimum data set. Data elements were collected using a data extraction form and were categorized into similar classes, which were divided into administrative and clinical sections. The list of data elements was reviewed by experts in technical offices of the Iranian Ministry of Health and Medical Education, and a minimum data set was drawn up.Results: There were nine and 18 data classes in the administrative and clinical sections with a total of 166 and 684 data elements respectively. After review by the expert panel, 159 administrative and 621 clinical data elements were retained as the minimum data set for the Iranian hospital information system.Conclusion: Our dataset can be used by the Iranian health ministry, hospital information system companies and health surveillance centres for more efficient management of health data. Keywords: Minimum data set, hospital information systems, health records, Iran
Citation: Rampisheh Z; Kameli M; Zarei J; Vahedi Barzaki A; Meraji M; Mohammadi A. Developing a national minimum data set for hospital informa-tion systems in the Islamic Republic of Iran. East Mediterr Health J. 2020;26(4):400–409. https://doi.org/10.26719/emhj.19.046
Received: 25/11/16; accepted: 26/07/18
Copyright © World Health Organization (WHO) 2020. Open Access. Some rights reserved. This work is available under the CC BY-NC-SA 3.0 IGO license (https://creativecommons.org/licenses/by-nc-sa/3.0/igo).

Research article
401
EMHJ – Vol. 26 No. 4 – 2020
records, electronic health record systems (Samaneh Parvande Electronic Salamat [SEPAS] established by the Iranian Ministry of Health for data collection), and hospital information systems vary and the data elements of these systems are often incompatible because of the lack of any minimum data set. Collection of standard data and maximizing their quality in the Islamic Republic of Iran requires the development of a minimum data set for hospital information systems. Therefore, in view of the lack of a standard data set in the country, this study was conducted to design a minimum data set to be used in hospital information systems.
MethodsThis descriptive cross-sectional study was conducted in 2015. The data were collected from SEPAS, hospital infor-mation system documents of companies approved by the Iranian Ministry of Health and Medical Education, and inpatient records used in the Islamic Republic of Iran. Moreover, a review of the literature was done to find rele-vant resources, including documents, reports, guidelines and websites related to data elements of hospital, disease, administrative, equipment and medical intervention in-formation systems by searching the Internet and print material.
The resources retrieved from the Internet search were selected based on the criteria in Table 1 and evaluated until saturation was achieved. The SEPAS documents were similar and data elements of the records were standard; therefore, the data elements in the SEPAS system and one of the records were evaluated. In addition, the data elements of the documents of 26 hospital information system companies approved by the Ministry of Health and Medical Education were evaluated.
A data extraction sheet was used for data collection. The data elements retrieved from the Internet, SEPAS system, hospital information system companies and hospital records were extracted separately and collected in four separate files: 1) Iranian and foreign studies as
electronic and print material, 2) SEPAS system documents, 3) hospital information system documents and 4) medical records. The data elements retrieved from each source were categorized based on similar classes and subjects, and a complete file was created by combining all four files. The new file was categorized into administrative and clinical sections and each section was classified into different data classes.
Classification of data elements into administrative and clinical sections and their subclasses was done according to information management standards: the classification proposed by American National Standards Institute, American Society for Testing and Materials standards for Core Health Data Elements, reference books, classifications found in retrieved studies (4,15,16), hospital records, hospital information system and SEPAS system. The views of the Information and Statistics Management Office of Ministry of Health and Medical Education were also considered.
For each class, the data elements of different resources (retrieved from, e.g. the Internet, health information system documents and SEPAS) were reviewed. Among common data elements, those with a more complete and comprehensive definition, format, domain, justification, code and source were included in the class. All uncommon data elements were also included. A Farsi or English title and definition was provided for the elements that only appeared in English or Farsi texts; in other words, all listed data elements had English and Farsi titles and a definition in Farsi.
The data elements for each data class were included in a checklist. The content validity of the checklist was assessed by 10 experts of the Ministry of Health and Medical Education technical offices, including four health information management experts, four physicians and two information technology experts. They were asked accept or reject each data element for inclusion in the hospital information system.
Table 1 Search strategy for retrieving data elements of minimum data set for hospital information system in the Islamic Republic of IranSites, criteria, strategy Descriptions, characteristicsSearch engines Yahoo, Google, Google Scholar
Websites World Health Organization,
Databases PubMed, Web of Science, Scopus, EMBASE, IEEE (https://www.ieee.org/publications/periodicals.html) Cochrane, SID (https://www.sid.ir/fa/journal/), Magiran, IranMedex, Civilica, Irandoc (up to September 2015)
Inclusion criteria Literature in English and Farsi
Papers, annual reports, reports, guidelines and peer-reviewed research published up to September 2015 from valid sources, with full text, a clearly stated purpose, and keywords in the title or abstract.
Exclusion criteria Non-peer-reviewed papers, reports and forms retrieved from personal blogs and abstracts with no accessible full text.
Search terms “Patient minimum data set”, “Patient data element”, “Hospital information system” And “Data element”, “Hospital Information system” And “Minimum data set”, “Health information system” And “Minimum data set”, “Hospital information database”
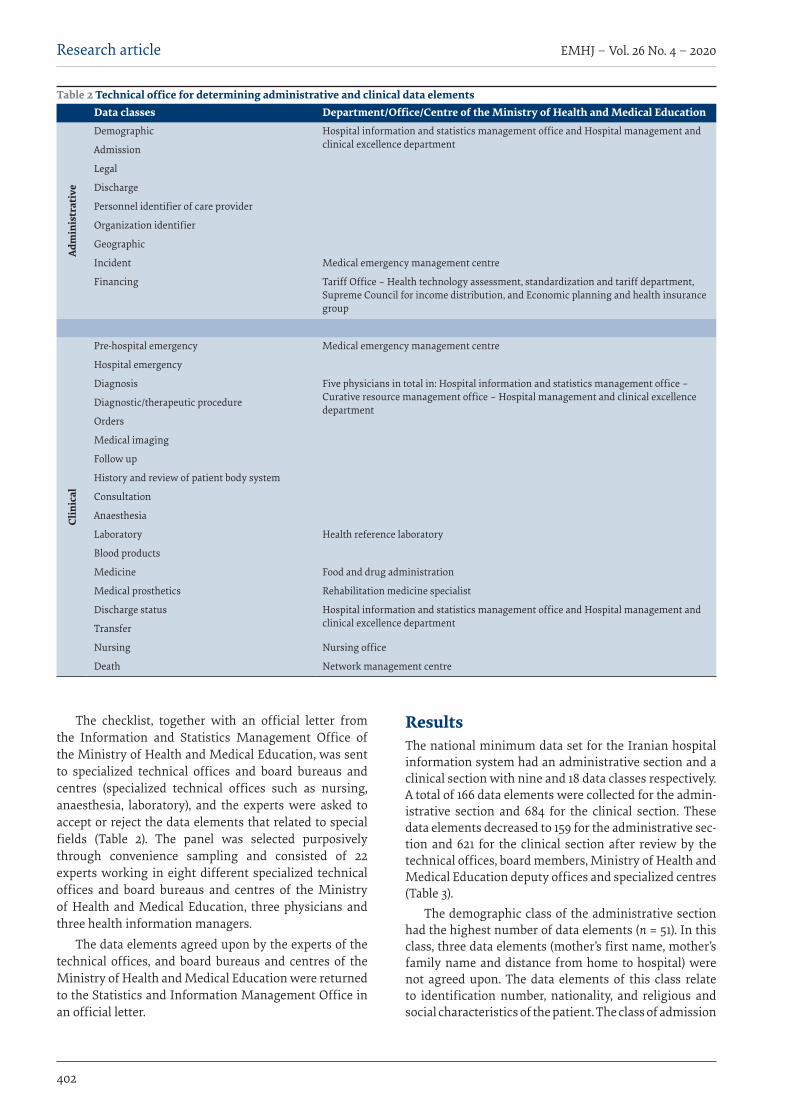
EMHJ – Vol. 26 No. 4 – 2020Research article
402
The checklist, together with an official letter from the Information and Statistics Management Office of the Ministry of Health and Medical Education, was sent to specialized technical offices and board bureaus and centres (specialized technical offices such as nursing, anaesthesia, laboratory), and the experts were asked to accept or reject the data elements that related to special fields (Table 2). The panel was selected purposively through convenience sampling and consisted of 22 experts working in eight different specialized technical offices and board bureaus and centres of the Ministry of Health and Medical Education, three physicians and three health information managers.
The data elements agreed upon by the experts of the technical offices, and board bureaus and centres of the Ministry of Health and Medical Education were returned to the Statistics and Information Management Office in an official letter.
ResultsThe national minimum data set for the Iranian hospital information system had an administrative section and a clinical section with nine and 18 data classes respectively. A total of 166 data elements were collected for the admin-istrative section and 684 for the clinical section. These data elements decreased to 159 for the administrative sec-tion and 621 for the clinical section after review by the technical offices, board members, Ministry of Health and Medical Education deputy offices and specialized centres (Table 3).
The demographic class of the administrative section had the highest number of data elements (n = 51). In this class, three data elements (mother’s first name, mother’s family name and distance from home to hospital) were not agreed upon. The data elements of this class relate to identification number, nationality, and religious and social characteristics of the patient. The class of admission
Table 2 Technical office for determining administrative and clinical data elements Data classes Department/Office/Centre of the Ministry of Health and Medical Education
Adm
inis
trat
ive
Demographic Hospital information and statistics management office and Hospital management and clinical excellence departmentAdmission
Legal
Discharge
Personnel identifier of care provider
Organization identifier
Geographic
Incident Medical emergency management centre
Financing Tariff Office – Health technology assessment, standardization and tariff department, Supreme Council for income distribution, and Economic planning and health insurance group
Clin
ical
Pre-hospital emergency Medical emergency management centre
Hospital emergency
Diagnosis Five physicians in total in: Hospital information and statistics management office – Curative resource management office – Hospital management and clinical excellence department
Diagnostic/therapeutic procedure
Orders
Medical imaging
Follow up
History and review of patient body system
Consultation
Anaesthesia
Laboratory Health reference laboratory
Blood products
Medicine Food and drug administration
Medical prosthetics Rehabilitation medicine specialist
Discharge status Hospital information and statistics management office and Hospital management and clinical excellence departmentTransfer
Nursing Nursing office
Death Network management centre
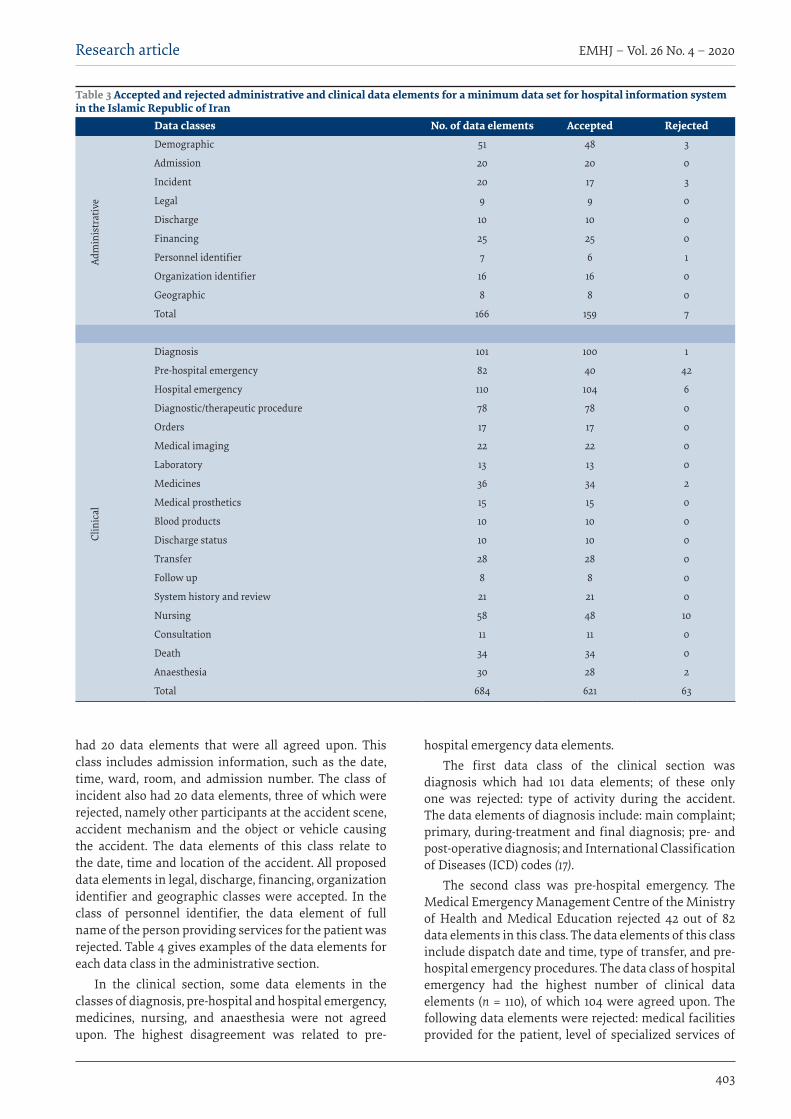
Research article
403
EMHJ – Vol. 26 No. 4 – 2020
had 20 data elements that were all agreed upon. This class includes admission information, such as the date, time, ward, room, and admission number. The class of incident also had 20 data elements, three of which were rejected, namely other participants at the accident scene, accident mechanism and the object or vehicle causing the accident. The data elements of this class relate to the date, time and location of the accident. All proposed data elements in legal, discharge, financing, organization identifier and geographic classes were accepted. In the class of personnel identifier, the data element of full name of the person providing services for the patient was rejected. Table 4 gives examples of the data elements for each data class in the administrative section.
In the clinical section, some data elements in the classes of diagnosis, pre-hospital and hospital emergency, medicines, nursing, and anaesthesia were not agreed upon. The highest disagreement was related to pre-
hospital emergency data elements. The first data class of the clinical section was
diagnosis which had 101 data elements; of these only one was rejected: type of activity during the accident. The data elements of diagnosis include: main complaint; primary, during-treatment and final diagnosis; pre- and post-operative diagnosis; and International Classification of Diseases (ICD) codes (17).
The second class was pre-hospital emergency. The Medical Emergency Management Centre of the Ministry of Health and Medical Education rejected 42 out of 82 data elements in this class. The data elements of this class include dispatch date and time, type of transfer, and pre-hospital emergency procedures. The data class of hospital emergency had the highest number of clinical data elements (n = 110), of which 104 were agreed upon. The following data elements were rejected: medical facilities provided for the patient, level of specialized services of
Table 3 Accepted and rejected administrative and clinical data elements for a minimum data set for hospital information system in the Islamic Republic of Iran
Data classes No. of data elements Accepted Rejected
Adm
inis
trat
ive
Demographic 51 48 3
Admission 20 20 0
Incident 20 17 3
Legal 9 9 0
Discharge 10 10 0
Financing 25 25 0
Personnel identifier 7 6 1
Organization identifier 16 16 0
Geographic 8 8 0
Total 166 159 7
Clin
ical
Diagnosis 101 100 1
Pre-hospital emergency 82 40 42
Hospital emergency 110 104 6
Diagnostic/therapeutic procedure 78 78 0
Orders 17 17 0
Medical imaging 22 22 0
Laboratory 13 13 0
Medicines 36 34 2
Medical prosthetics 15 15 0
Blood products 10 10 0
Discharge status 10 10 0
Transfer 28 28 0
Follow up 8 8 0
System history and review 21 21 0
Nursing 58 48 10
Consultation 11 11 0
Death 34 34 0
Anaesthesia 30 28 2
Total 684 621 63
EMHJ – Vol. 26 No. 4 – 2020Research article
404
the emergency department, role of service provider, and consultant identifier. In the medicines class, the data elements on current dose and dose unit were rejected. In the anaesthesia class, post-operative pain management methods and hypertension following the use of pre-anaesthetic drugs were the two data elements that were rejected. In the nursing data class, no consensus was reached on the data elements: type of care, duration of admission to the intensive care unit, drug code, drug permission and treating physician. All the data elements of the other classes in the clinical section were accepted by the experts. Table 5 gives examples of the data elements for each data class in the clinical section.
Discussion The proposed minimum data set of the Iranian hospital information system has administrative and clinical sec-tions. Some specialized publications (4,15) and studies on specialized minimum data sets have also used this classi-fication (18,19).
Administrative data are used for patient registration, medical centre identification, insurance and reimbursement (16), medical research, outcome evaluation and administrative reports (20). In this study, the administrative data were categorized into nine different data classes. They were are more comprehensive than similar hospital minimum data sets, such as those of Qatar (10), Australia (11), New Zealand (13) and the United States (14) and have more data elements, especially in the legal, incident and geographic data classes. The first class in this section is demographics. A number of other studies have considered this class as well (2,3,19,21–23).
Demographic data elements differ between those we propose, and the data elements currently used in Iranian hospital records and the data elements of other national data sets (24), and some essential data elements are needed in order to have comprehensive data. Another difference is the data elements between our set and other data sets relates to ethnicity and race. They are not included in our proposed demographic data set because they are not much needed in the Islamic Republic of Iran due to the racial and ethnic composition of the Iranian population. However, these data elements are used in most minimum data sets in countries with ethnic and migratory populations such as the United States (14,25,26).
In the class of admission, some data elements related to patient admission to the medical centre, such as the date and time of admission, ward, room and bed number, and transferring hospital or centre, were proposed. Most of these data elements are similar to data elements for admission in other studies in the Islamic Republic of Iran (18,21) and the minimum data sets of other countries (10,13,25,27).
As for the class of incident, in order to assist incident registration, some data elements related to the person’s activity during the incident and the incident location, mechanism, and intention (e.g. intention to cause injury) were proposed. Recording these data might help implement the system of International Classification of
External Causes of Injury (ICECI) (28). Moreover, these data are among the main data of the minimum data set for traffic incidents and injuries (29,30). However, the proposed data set for the class of incident contained fewer data elements compared with specialized data sets for injuries such as the IDB-JAMIE minimum data set (31).
In the minimum data set designed for the Iranian hospital information system, in order to record data elements on informed consent and informing of legal authorities, the class of legal data was proposed. This class has also been considered in an minimum data set for orthopaedic injuries (18). Most data elements in this class do not appear in other minimum data sets (10,14,25,26,31).
Type of insurance coverage, costs and method of payment for care received are data elements included in the class of financing. Final diagnosis and disease code are also included in this class in order to support a prospective payment system in the hospital. Recording these data has an important role in implementing diagnosis-related groups in Iranian hospitals (32). These data are similar to the financial data elements in most minimum data sets in other countries (10,14,24).
In the class of organization identifier, some data elements such as institute name, identity, and organizational affiliation are similar to the data determined for the service-providing organization in other studies (2,18,19,33) and minimum data sets in other countries (10,24,25,27). However, the data elements of longitude and latitude coordinates to determine the exact location of the accident, website and email address of the health centre were also proposed for our data set. The longitude and latitude coordinates are also recorded in emergency-related data sets in many countries and in traffic incidents in the Islamic Republic of Iran (12,30). Recording these data elements helps to study planning, accessing and distributing of health services based on geographic information systems (34). This data element was proposed in view of the importance of hospital websites in assisting the delivery of health services to patients and its role in the future (35).
In the class of personnel identifier, data elements related to identification of the health staff providing the care, including the first and last name, identity, role, academic qualification, and electronic signature, were considered. The class of geographic data elements was proposed to record accurate location data about the patient’s home according to geographical divisions of the country. This was done because, at the time of the study, one of the concerns of the Iranian health ministry was to provide data to accurately define patients’ locations in order to determine the level of access to services and assist in the fair distribution of health services, and to determine the prevalence of diseases.
The proposed clinical section had 18 data classes. Compared with similar minimum data sets in other countries (10,14,24,27), our proposed clinical data set has more data elements. We tried to include as many clinical data elements of the patient’s medical record as possible.
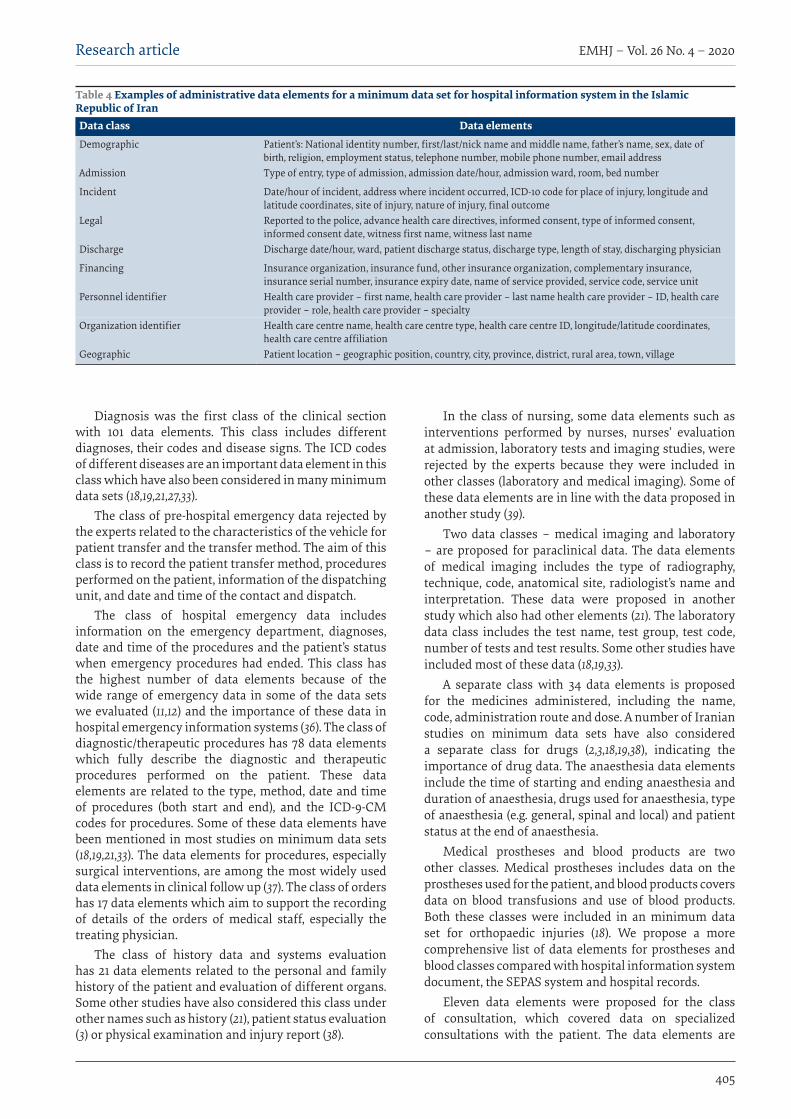
Research article
405
EMHJ – Vol. 26 No. 4 – 2020
Diagnosis was the first class of the clinical section with 101 data elements. This class includes different diagnoses, their codes and disease signs. The ICD codes of different diseases are an important data element in this class which have also been considered in many minimum data sets (18,19,21,27,33).
The class of pre-hospital emergency data rejected by the experts related to the characteristics of the vehicle for patient transfer and the transfer method. The aim of this class is to record the patient transfer method, procedures performed on the patient, information of the dispatching unit, and date and time of the contact and dispatch.
The class of hospital emergency data includes information on the emergency department, diagnoses, date and time of the procedures and the patient’s status when emergency procedures had ended. This class has the highest number of data elements because of the wide range of emergency data in some of the data sets we evaluated (11,12) and the importance of these data in hospital emergency information systems (36). The class of diagnostic/therapeutic procedures has 78 data elements which fully describe the diagnostic and therapeutic procedures performed on the patient. These data elements are related to the type, method, date and time of procedures (both start and end), and the ICD-9-CM codes for procedures. Some of these data elements have been mentioned in most studies on minimum data sets (18,19,21,33). The data elements for procedures, especially surgical interventions, are among the most widely used data elements in clinical follow up (37). The class of orders has 17 data elements which aim to support the recording of details of the orders of medical staff, especially the treating physician.
The class of history data and systems evaluation has 21 data elements related to the personal and family history of the patient and evaluation of different organs. Some other studies have also considered this class under other names such as history (21), patient status evaluation (3) or physical examination and injury report (38).
In the class of nursing, some data elements such as interventions performed by nurses, nurses’ evaluation at admission, laboratory tests and imaging studies, were rejected by the experts because they were included in other classes (laboratory and medical imaging). Some of these data elements are in line with the data proposed in another study (39).
Two data classes – medical imaging and laboratory – are proposed for paraclinical data. The data elements of medical imaging includes the type of radiography, technique, code, anatomical site, radiologist’s name and interpretation. These data were proposed in another study which also had other elements (21). The laboratory data class includes the test name, test group, test code, number of tests and test results. Some other studies have included most of these data (18,19,33).
A separate class with 34 data elements is proposed for the medicines administered, including the name, code, administration route and dose. A number of Iranian studies on minimum data sets have also considered a separate class for drugs (2,3,18,19,38), indicating the importance of drug data. The anaesthesia data elements include the time of starting and ending anaesthesia and duration of anaesthesia, drugs used for anaesthesia, type of anaesthesia (e.g. general, spinal and local) and patient status at the end of anaesthesia.
Medical prostheses and blood products are two other classes. Medical prostheses includes data on the prostheses used for the patient, and blood products covers data on blood transfusions and use of blood products. Both these classes were included in an minimum data set for orthopaedic injuries (18). We propose a more comprehensive list of data elements for prostheses and blood classes compared with hospital information system document, the SEPAS system and hospital records.
Eleven data elements were proposed for the class of consultation, which covered data on specialized consultations with the patient. The data elements are
Table 4 Examples of administrative data elements for a minimum data set for hospital information system in the Islamic Republic of IranData class Data elementsDemographic Patient’s: National identity number, first/last/nick name and middle name, father’s name, sex, date of
birth, religion, employment status, telephone number, mobile phone number, email addressAdmission Type of entry, type of admission, admission date/hour, admission ward, room, bed number
Incident Date/hour of incident, address where incident occurred, ICD-10 code for place of injury, longitude and latitude coordinates, site of injury, nature of injury, final outcome
Legal Reported to the police, advance health care directives, informed consent, type of informed consent, informed consent date, witness first name, witness last name
Discharge Discharge date/hour, ward, patient discharge status, discharge type, length of stay, discharging physician
Financing Insurance organization, insurance fund, other insurance organization, complementary insurance, insurance serial number, insurance expiry date, name of service provided, service code, service unit
Personnel identifier Health care provider – first name, health care provider – last name health care provider – ID, health care provider – role, health care provider – specialty
Organization identifier Health care centre name, health care centre type, health care centre ID, longitude/latitude coordinates, health care centre affiliation
Geographic Patient location – geographic position, country, city, province, district, rural area, town, village
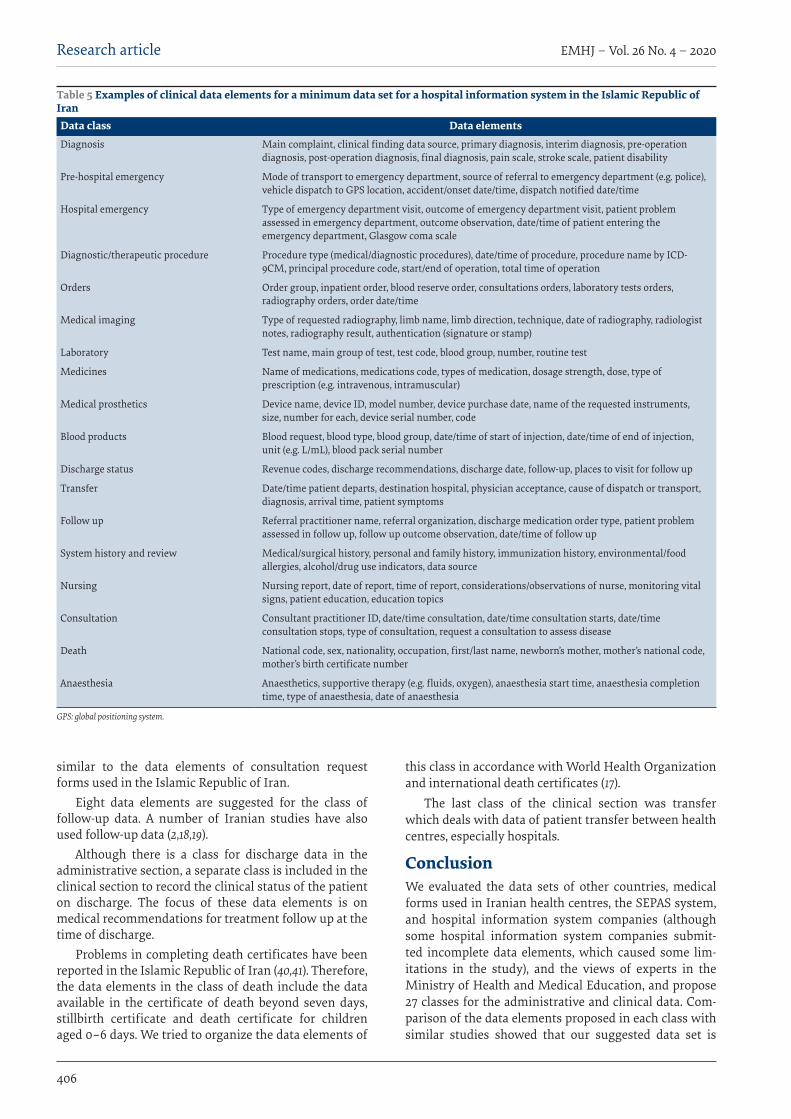
EMHJ – Vol. 26 No. 4 – 2020Research article
406
similar to the data elements of consultation request forms used in the Islamic Republic of Iran.
Eight data elements are suggested for the class of follow-up data. A number of Iranian studies have also used follow-up data (2,18,19).
Although there is a class for discharge data in the administrative section, a separate class is included in the clinical section to record the clinical status of the patient on discharge. The focus of these data elements is on medical recommendations for treatment follow up at the time of discharge.
Problems in completing death certificates have been reported in the Islamic Republic of Iran (40,41). Therefore, the data elements in the class of death include the data available in the certificate of death beyond seven days, stillbirth certificate and death certificate for children aged 0–6 days. We tried to organize the data elements of
this class in accordance with World Health Organization and international death certificates (17).
The last class of the clinical section was transfer which deals with data of patient transfer between health centres, especially hospitals.
ConclusionWe evaluated the data sets of other countries, medical forms used in Iranian health centres, the SEPAS system, and hospital information system companies (although some hospital information system companies submit-ted incomplete data elements, which caused some lim-itations in the study), and the views of experts in the Ministry of Health and Medical Education, and propose 27 classes for the administrative and clinical data. Com-parison of the data elements proposed in each class with similar studies showed that our suggested data set is
Table 5 Examples of clinical data elements for a minimum data set for a hospital information system in the Islamic Republic of IranData class Data elementsDiagnosis Main complaint, clinical finding data source, primary diagnosis, interim diagnosis, pre-operation
diagnosis, post-operation diagnosis, final diagnosis, pain scale, stroke scale, patient disability
Pre-hospital emergency Mode of transport to emergency department, source of referral to emergency department (e.g. police), vehicle dispatch to GPS location, accident/onset date/time, dispatch notified date/time
Hospital emergency Type of emergency department visit, outcome of emergency department visit, patient problem assessed in emergency department, outcome observation, date/time of patient entering the emergency department, Glasgow coma scale
Diagnostic/therapeutic procedure Procedure type (medical/diagnostic procedures), date/time of procedure, procedure name by ICD-9CM, principal procedure code, start/end of operation, total time of operation
Orders Order group, inpatient order, blood reserve order, consultations orders, laboratory tests orders, radiography orders, order date/time
Medical imaging Type of requested radiography, limb name, limb direction, technique, date of radiography, radiologist notes, radiography result, authentication (signature or stamp)
Laboratory Test name, main group of test, test code, blood group, number, routine test
Medicines Name of medications, medications code, types of medication, dosage strength, dose, type of prescription (e.g. intravenous, intramuscular)
Medical prosthetics Device name, device ID, model number, device purchase date, name of the requested instruments, size, number for each, device serial number, code
Blood products Blood request, blood type, blood group, date/time of start of injection, date/time of end of injection, unit (e.g. L/mL), blood pack serial number
Discharge status Revenue codes, discharge recommendations, discharge date, follow-up, places to visit for follow up
Transfer Date/time patient departs, destination hospital, physician acceptance, cause of dispatch or transport, diagnosis, arrival time, patient symptoms
Follow up Referral practitioner name, referral organization, discharge medication order type, patient problem assessed in follow up, follow up outcome observation, date/time of follow up
System history and review Medical/surgical history, personal and family history, immunization history, environmental/food allergies, alcohol/drug use indicators, data source
Nursing Nursing report, date of report, time of report, considerations/observations of nurse, monitoring vital signs, patient education, education topics
Consultation Consultant practitioner ID, date/time consultation, date/time consultation starts, date/time consultation stops, type of consultation, request a consultation to assess disease
Death National code, sex, nationality, occupation, first/last name, newborn’s mother, mother’s national code, mother’s birth certificate number
Anaesthesia Anaesthetics, supportive therapy (e.g. fluids, oxygen), anaesthesia start time, anaesthesia completion time, type of anaesthesia, date of anaesthesia
GPS: global positioning system.
Research article
407
EMHJ – Vol. 26 No. 4 – 2020
more comprehensive and could help hospitals and other health care centres to record and report health data effi-ciently. Incorporation of the data elements proposed in our study into other specialized data sets developed for the Islamic Republic of Iran may be useful to develop an
expanded national health data set. Moreover, our data-set can be used by the Ministry of Health and Medical Education, hospital information system companies and health surveillance centres for more efficient manage-ment of health data.
AcknowledgementsThis study was a national project supported by Ministry of Health and approved in Kashan University of Medical Sciences (grant No: 94113).
Funding: This study was funded by the Iranian Ministry of Health.
Competing interests: None declared.
Mise au point d’ un ensemble de données minimum au niveau national pour les systèmes d’information hospitaliers en République islamique d’IranRésuméContexte : La collecte de données standardisées facilite la gestion de l’information sur les maladies et se traduit par une meilleure qualité des soins. La République islamique d’Iran ne dispose pas d’un ensemble de données standard permettant de collecter des données dans les hôpitaux.Objectifs : La présente étude avait pour objectif de mettre au point un ensemble de données minimum destiné aux systèmes d’information hospitaliers en République islamique d’Iran.Méthodes : L’étude a été menée en 2015. Les ensembles de données issus d’autres pays, de dossiers hospitaliers, de systèmes d’information hospitaliers et de systèmes de dossiers médicaux électroniques disponibles en République islamique d’Iran ont été passés en revue afin de sélectionner les éléments à inclure dans l’ensemble de données minimum. Les éléments de données ont été collectés à l’aide d’un formulaire d’extraction, puis classés dans des catégories similaires, elles-mêmes divisées en sections administrative et clinique. La liste des éléments de données a été revue par les experts des services techniques du ministère iranien de la Santé et de l’Enseignement médical, et un ensemble de données minimum a été défini.Résultats : Les sections administrative et clinique comportaient neuf et dix-huit catégories de données, avec un total de 166 et de 684 éléments de données respectivement. Suite à un examen par un groupe d’experts, 159 éléments de données administratives et 621 pour la partie clinique ont été retenus pour constituer l’ensemble de données minimum destiné au système d’information hospitalier iranien.Conclusion : Cet ensemble de données peut être utilisé par le ministère susmentionné, les sociétés en charge des systèmes d’information hospitaliers et les centres de surveillance de la santé pour parvenir à une gestion plus efficace des données sanitaires.
تصميم جمموعة دنيا من البيانات الوطنية لنُظم معلومات املستشفيات يف مجهورية إيران اإلسالمية زهرا رام پیشه، حممد اسامعیل کاملی، جواد زارعی، اکرم واحدی برزکی، مرضیه معراجی، علی حممدی
اخلالصةاخللفية: يدعم مجع البیانات القیاسیة إدارة معلومات األمراض ويؤدي إىل رفع مستوى جودة الرعاية. وال تتوافر لدى مجهورية إيران اإلسالمیة
جمموعة بیانات قیاسیة جلمع البیانات داخل املستشفیات.األهداف: هدفت هذه الدراسة إىل تصمیم جمموعة دنیا من البیانات لتشغیل نُظم معلومات املستشفیات يف مجهورية إيران اإلسالمیة.
طرق البحث: ُأجريت هذه الدراسة يف عام 2015. وجرى استعراض جمموعات البیانات لدى ُبلدان أخرى، وکذلك سجالت املستشفیات، وُنُظم البیانات إلنشاء املجموعة التوصل إىل عنارص إيران اإلسالمیة بغرض معلومات املستشفیات وُنُظم السجالت الصحیة اإللكرتونیة يف مجهورية أقسام إىل ثم ُقسمت فئات متشاهبة، إىل العنارص البیانات، وُصنفت نموذج استخالص باستخدام البیانات البیانات. ومُجعت عنارص الدنیا من إدارية ورسيرية. واستعرض خرباء باملكاتب التقنیة التابعة لوزارة الصحة والتعلیم الطبي اإليرانیة قائمة عنارص البیانات، ووضعوا جمموعة دنیا من
البیانات.النتائج: کان هناك 9 و 18 فئة بیانات يف کل من القسمني اإلداري والرسيري، بمجموع 166 و 684 عنرص بیانات، عىل التوايل. وبعد انتهاء فريق اخلرباء من االستعراض، اْسُتبقَي 159 عنرص بیانات إداري و 621 عنرص بیانات رسيري باعتبارها جمموعة البیانات الدنیا الالزمة لنظام معلومات
املستشفیات بجمهورية إيران اإلسالمیة.
EMHJ – Vol. 26 No. 4 – 2020Research article
408
References1. Mohammed SA, Yusof MM. Towards an evaluation framework for information quality management (IQM) practices for health
information systems—evaluation criteria for effective IQM practices. J Eval Clin Pract. 2013;19(2):379–87. https://doi.org/10.1111/j.1365-2753.2012.01839.x
2. Karimi S, Saghaeiannejad IS, Farzandipour M, Esmaeili Ghayoumabadi M. [Comparative study of minimum data sets of health information management of organ transplantation in selected countries and presenting appropriate solution for Iran]. Health Information Management. 2011;7(Special Issue):497–505. (In Farsi)
3. Hosseini A, Moghaddasi H, Jahanbakhsh M. [Designing minimum data sets of diabetes mellitus: basis of effectiveness indica-tors of diabetes management]. Health Information Management. 2010;7(3):330–40. (In Farsi)
4. Abdelhak M, Grostick S, Hanken MA, Ellen J. Health information: management of a strategic resource. Fourth edition. Philadel-phia: Elsevier – Health Sciences Division; 2012.
5. Cai S, Mukamel DB, Veazie P, Temkin-Greener H. Validation of the Minimum Data Set in identifying hospitalization events and payment source. J Am Med Dir Assoc. 2011;12(1):38–43. https://doi.org/10.1016/j.jamda.2010.02.001
6. Kowal PR, Wolfson LJ, Dowd JE. Creating a minimum data set on ageing in sub-Saharan Africa. S Afr J Gerontol. 2000;9:18–23.
7. Ghaneie M, Rezaie A, Ghorbani N, Heidari R, Arjomandi M, Zare M. Designing a minimum data set for breast cancer: a starting point for breast cancer registration in Iran. Iran J Public Health. 2013;42(Suppl 1):66–73.
8. Sadoughi F, Ghazisaeidi M, Mehraji M, Kimiafar Kh, Ramezanghorbani N. [Health Information management technology]. Teh-ran: Jafari Publication; 2011. (In Farsi)
9. Bloemhoff A, Hoyinck S, Dekker R, Mulder S. Development of minimum data sets on injuries: background report. Amsterdam: Consumer Safety Institute; 2001.
10. Qatar patient minimum data set (MDS). Doha: Supreme Council of Health; 2015 (SCH/HFID/MDS/V4 2015).
11. Victorian emergency minimum dataset (VEMD). Melbourne: Department of Health & Human Services; 2012.
12. Emergency health services – patient care reporting minimum data set. Alberta: Health Information Standards Committee for Alberta; 2011.
13. National Health Board. National minimum dataset (NMDS) – hospital events. Data dictionary. Wellington: Ministry of Health; 2014.
14. Preliminary recommendations for core health data elements 1996. Hyattsville: National Committee on Vital and Health Statis-tics; 1996 (https://www.cdc.gov/nchs/data/ncvhs/nchvs94.pdf, accessed 25 September 2017).
15. Davis N, LaCour M. Health information technology. Third edition. St Louis: Elsevier; 2014.
16. Wager KA, Lee FW, Glaser JP. Managing a health care information systems: a practical approach for health care executives. San Francisco: John Wiley & Sons; 2005.
17. International statistical classification of diseases and related health problems, 10th revision. Geneva: World Health Organization; 2011.
18. Ahmadi M, Mohammadi A, Chraghbaigi R, Fathi T, Baghini MS. Developing a minimum data set of the information manage-ment system for orthopedic injuries in Iran. Iran Red Crescent Med J. 2014;16(7):e17020. https://doi.org/10.5812/ircmj.17020
19. Ahmadi M, Alipour J, Mohammadi A, Khorami F. Development a minimum data set of the information management system for burns. Burns. 2015;41(5):1092–9. https://doi.org/10.1016/j.burns.2014.12.009
20. Zhan C, Miller M. Administrative data based patient safety research: a critical review. Qual Saf Health Care. 2003;12(Suppl 2):ii58-ii63. https://doi.org/10.1136/qhc.12.suppl_2.ii58
21. Ahmadi M, Bashiri A. [A minimum data set of radiology reporting system for exchanging with electronic health record system in Iran.] J Payavard Salamat. 2014;8(2):121–33. (In Farsi)
22. Arastoo AA, Nickbakht M, Ghasemzadeh R, Azizi A, Zahednejad S, Latifi SM. Developing a national minimum data set for physi-otherapy in Iran: a Delphi study. Eur J Sci Res. 2013;107(4):573–9.
23. Kalankesh LR, Dastgiri S, Rafeey M, Rasouli N, Vahedi L. Minimum data set for cystic fibrosis registry: a case study in Iran. Acta Inform Med. 2015;23(1):18–21. https://doi.org/10.5455/aim.2015.23.18-21
24. Disability Services National Minimum Data Set: data guide, July 2016. Canberra: Australian Institute of Health and Welfare; 2016 (https://www.aihw.gov.au/getmedia/1026f60a-cc97-40fb-a6ef-46c25ec006a6/ds-nmds-data-guide-2016-17.pdf.aspx , accessed 3 October 2019).
25. Pollock DA, Adams DL, Bernardo LM, Bradley V, Brandt MD, Davis TE, et al. Data elements for emergency department systems, Release 1.0 (DEEDS): a summary report. J Emerg Nurs. 1998;24(1):35–44.
د الصحي استخدام جمموعة البیانات الناشئة عن هذه االستنتاج: يمكن لوزارة الصحة اإليرانیة ورشکات ُنُظم معلومات املستشفیات ومراکز الرتصُّالدراسة من أجل زيادة کفاءة إدارة البیانات الصحیة.
Research article
409
EMHJ – Vol. 26 No. 4 – 2020
26. Long-term care facility resident assessment. Instrument 3.0. User’s Manual, version 1.13. Baltimore: Centers for Medicare & Medicaid Services; 2015.
27. Admitted patient care NMDS 2016–17. Canberra: Australian Institute of Health and Welfare; 2017 https://meteor.aihw.gov.au/content/index.phtml/itemId/612171, accessed 3 August 2019).
28. International classification of external causes of injuries (ICECI) version 1.2. Amsterdam: Consumer Safety Institute and Ade-laide: AIHW National Injury Surveillance Unit; 2004.
29. Injury surveillance. National minimum data set. National health data dictionary, version 12. Canberra: Australian Institute of Health and Welfare; 2003.
30. Mohammadi A, Ahmadi M, Gharagozlu A. Developing a minimum data set for an information management system to study traffic accidents in Iran. Iran Red Crescent Med J. 2016;18(3):e23677. https://doi.org/10.5812/ircmj.23677
31. IDB-JAMIE minimum data set (IDB-MDS). Data dictionary. Netherlands: European Association for Injury Prevention and Safety Promotion Office. 2013.
32. Ghaffari Sh , Abolhallaj M , Pouragha B. [Feasibility of implementing diagnosis related groups: a case study in Iran’s hospitals.] Hakim. 2012;15(2):147–57. (In Farsi)
33. Safdari R, Shahmoradi L, Ebrahimi M. [Minimum data set of anatomical pathology information system from the perspective of experts. J Payavard Salamat.] 2015;9(3):300–14. (In Farsi)
34. Zhan FB, Lu Y, Giordano A, Hanford EJ. Geographic information system (GIS) as a tool for disease surveillance and environmen-tal health research. In: Proceedings of ICSSSM’05. 2005 International Conference on Services Systems and Services Manage-ment, Vol. 2. IEEE; 2005:1465–70.
35. Salarvand Sh, Sheikh Abumasoudi R, Kashani F, Samadbeik M, Salarvand H. [Assessing the necessitate quality indicators of hospitals’ websites (a literature review)]. Hospital. 2016;15(1):87–100. (In Farsi)
36. Moghaddasi H, Rabiei R, Mastaneh Z. [Pre-hospital emergency information system in America and England: a review.] Payesh. 2014;13(4):383–91. (In Farsi)
37. Jangi M, Azizi A, Kamali Yousef Abad M, Tara SM. [Systematic design of the minimum data set storage: an essential need to create purposed for archiving]. J Health Biomedical Informatics. 2015;1(2):113–21. (In Farsi)
38. Safdari R, Dargahi H, Halabchi F, Shadanfar K, Abdolkhani R. [A comparative study of the athlete health records’ minimum data set in selected countries and presenting a model for Iran.] J Payavard Salamat. 2015;8(2):134–45. (In Farsi)
39. Rafii F, Ahmadi M, Hoseini A. [Nursing minimum data set: an essential need for Iranian health care system.] Iran Journal of Nursing. 2011;24(71):19–27. (In Farsi)
40. Meraji M, Barabadi M. [Errors in the documentation of the death certificate: a case study.] J Health Biomed Informatics. 2015;2(3):168–75. (In Farsi)
41. Keyvanara M, Zardoeigolanbar S, Karimi S, Isfahani SS. [The quality of death certificates record in the educational and non-edu-cational hospitals in Kermanshah, Iran]. Health Information Management. 2011;8:23–32. (In Farsi)
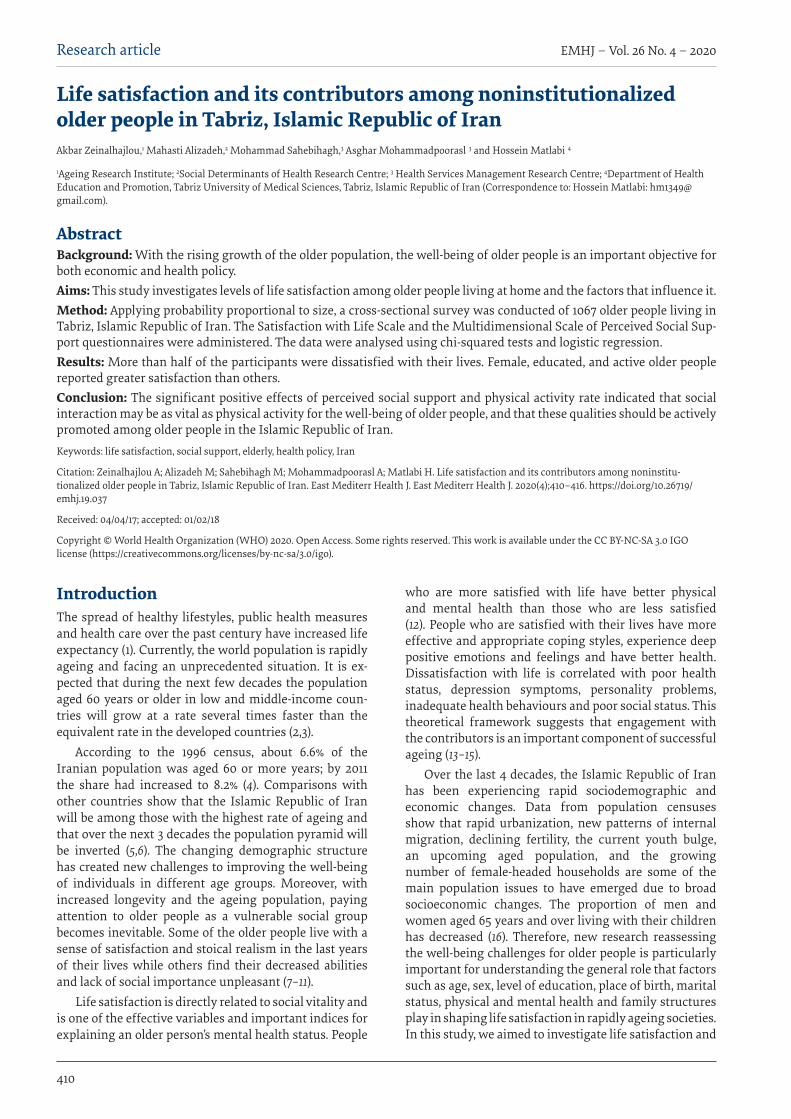
EMHJ – Vol. 26 No. 4 – 2020Research article
410
Life satisfaction and its contributors among noninstitutionalized older people in Tabriz, Islamic Republic of IranAkbar Zeinalhajlou,1 Mahasti Alizadeh,2 Mohammad Sahebihagh,3 Asghar Mohammadpoorasl 3 and Hossein Matlabi 4
1Ageing Research Institute; 2Social Determinants of Health Research Centre; 3 Health Services Management Research Centre; 4Department of Health Education and Promotion, Tabriz University of Medical Sciences, Tabriz, Islamic Republic of Iran (Correspondence to: Hossein Matlabi: [email protected]).
IntroductionThe spread of healthy lifestyles, public health measures and health care over the past century have increased life expectancy (1). Currently, the world population is rapidly ageing and facing an unprecedented situation. It is ex-pected that during the next few decades the population aged 60 years or older in low and middle-income coun-tries will grow at a rate several times faster than the equivalent rate in the developed countries (2,3).
According to the 1996 census, about 6.6% of the Iranian population was aged 60 or more years; by 2011 the share had increased to 8.2% (4). Comparisons with other countries show that the Islamic Republic of Iran will be among those with the highest rate of ageing and that over the next 3 decades the population pyramid will be inverted (5,6). The changing demographic structure has created new challenges to improving the well-being of individuals in different age groups. Moreover, with increased longevity and the ageing population, paying attention to older people as a vulnerable social group becomes inevitable. Some of the older people live with a sense of satisfaction and stoical realism in the last years of their lives while others find their decreased abilities and lack of social importance unpleasant (7–11).
Life satisfaction is directly related to social vitality and is one of the effective variables and important indices for explaining an older person’s mental health status. People
who are more satisfied with life have better physical and mental health than those who are less satisfied (12). People who are satisfied with their lives have more effective and appropriate coping styles, experience deep positive emotions and feelings and have better health. Dissatisfaction with life is correlated with poor health status, depression symptoms, personality problems, inadequate health behaviours and poor social status. This theoretical framework suggests that engagement with the contributors is an important component of successful ageing (13–15).
Over the last 4 decades, the Islamic Republic of Iran has been experiencing rapid sociodemographic and economic changes. Data from population censuses show that rapid urbanization, new patterns of internal migration, declining fertility, the current youth bulge, an upcoming aged population, and the growing number of female-headed households are some of the main population issues to have emerged due to broad socioeconomic changes. The proportion of men and women aged 65 years and over living with their children has decreased (16). Therefore, new research reassessing the well-being challenges for older people is particularly important for understanding the general role that factors such as age, sex, level of education, place of birth, marital status, physical and mental health and family structures play in shaping life satisfaction in rapidly ageing societies. In this study, we aimed to investigate life satisfaction and
AbstractBackground: With the rising growth of the older population, the well-being of older people is an important objective for both economic and health policy.Aims: This study investigates levels of life satisfaction among older people living at home and the factors that influence it.Method: Applying probability proportional to size, a cross-sectional survey was conducted of 1067 older people living in Tabriz, Islamic Republic of Iran. The Satisfaction with Life Scale and the Multidimensional Scale of Perceived Social Sup-port questionnaires were administered. The data were analysed using chi-squared tests and logistic regression.Results: More than half of the participants were dissatisfied with their lives. Female, educated, and active older people reported greater satisfaction than others. Conclusion: The significant positive effects of perceived social support and physical activity rate indicated that social interaction may be as vital as physical activity for the well-being of older people, and that these qualities should be actively promoted among older people in the Islamic Republic of Iran.Keywords: life satisfaction, social support, elderly, health policy, Iran
Citation: Zeinalhajlou A; Alizadeh M; Sahebihagh M; Mohammadpoorasl A; Matlabi H. Life satisfaction and its contributors among noninstitu-tionalized older people in Tabriz, Islamic Republic of Iran. East Mediterr Health J. East Mediterr Health J. 2020(4);410–416. https://doi.org/10.26719/emhj.19.037
Received: 04/04/17; accepted: 01/02/18
Copyright © World Health Organization (WHO) 2020. Open Access. Some rights reserved. This work is available under the CC BY-NC-SA 3.0 IGO license (https://creativecommons.org/licenses/by-nc-sa/3.0/igo).
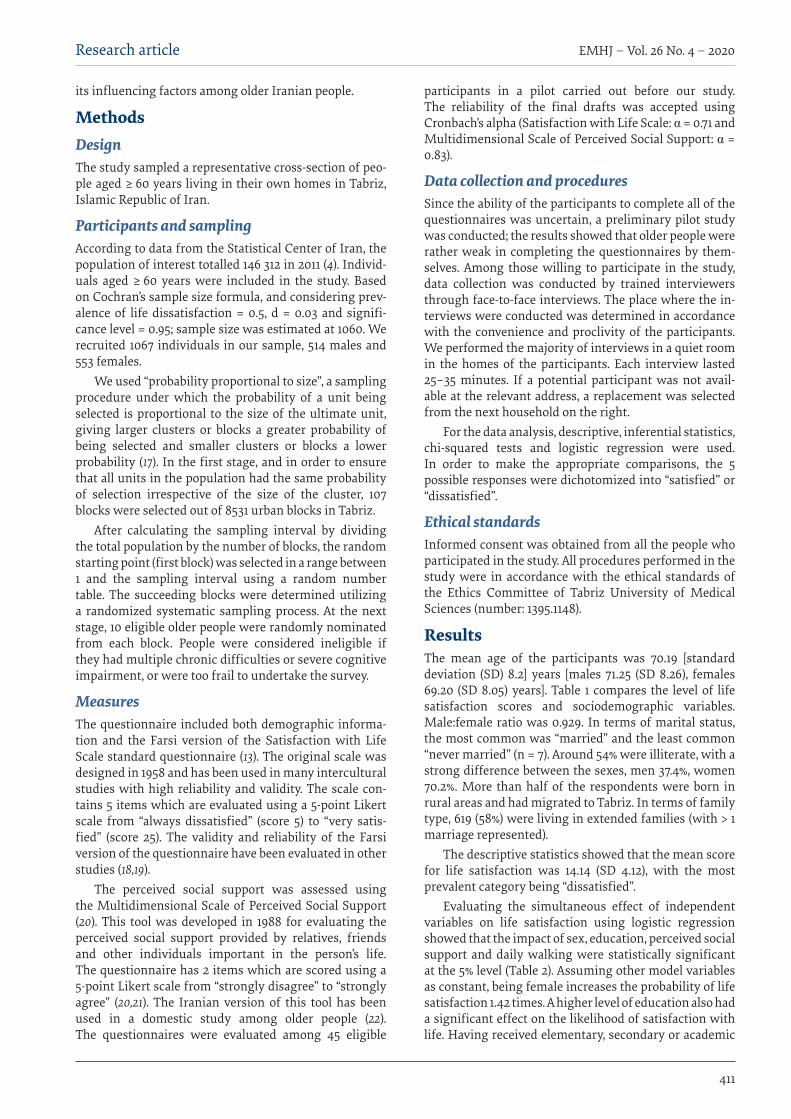
Research article
411
EMHJ – Vol. 26 No. 4 – 2020
its influencing factors among older Iranian people.
MethodsDesign The study sampled a representative cross-section of peo-ple aged ≥ 60 years living in their own homes in Tabriz, Islamic Republic of Iran.
Participants and samplingAccording to data from the Statistical Center of Iran, the population of interest totalled 146 312 in 2011 (4). Individ-uals aged ≥ 60 years were included in the study. Based on Cochran’s sample size formula, and considering prev-alence of life dissatisfaction = 0.5, d = 0.03 and signifi-cance level = 0.95; sample size was estimated at 1060. We recruited 1067 individuals in our sample, 514 males and 553 females.
We used “probability proportional to size”, a sampling procedure under which the probability of a unit being selected is proportional to the size of the ultimate unit, giving larger clusters or blocks a greater probability of being selected and smaller clusters or blocks a lower probability (17). In the first stage, and in order to ensure that all units in the population had the same probability of selection irrespective of the size of the cluster, 107 blocks were selected out of 8531 urban blocks in Tabriz.
After calculating the sampling interval by dividing the total population by the number of blocks, the random starting point (first block) was selected in a range between 1 and the sampling interval using a random number table. The succeeding blocks were determined utilizing a randomized systematic sampling process. At the next stage, 10 eligible older people were randomly nominated from each block. People were considered ineligible if they had multiple chronic difficulties or severe cognitive impairment, or were too frail to undertake the survey.
Measures The questionnaire included both demographic informa-tion and the Farsi version of the Satisfaction with Life Scale standard questionnaire (13). The original scale was designed in 1958 and has been used in many intercultural studies with high reliability and validity. The scale con-tains 5 items which are evaluated using a 5-point Likert scale from “always dissatisfied” (score 5) to “very satis-fied” (score 25). The validity and reliability of the Farsi version of the questionnaire have been evaluated in other studies (18,19).
The perceived social support was assessed using the Multidimensional Scale of Perceived Social Support (20). This tool was developed in 1988 for evaluating the perceived social support provided by relatives, friends and other individuals important in the person’s life. The questionnaire has 2 items which are scored using a 5-point Likert scale from “strongly disagree” to “strongly agree” (20,21). The Iranian version of this tool has been used in a domestic study among older people (22). The questionnaires were evaluated among 45 eligible
participants in a pilot carried out before our study. The reliability of the final drafts was accepted using Cronbach’s alpha (Satisfaction with Life Scale: α = 0.71 and Multidimensional Scale of Perceived Social Support: α = 0.83).
Data collection and proceduresSince the ability of the participants to complete all of the questionnaires was uncertain, a preliminary pilot study was conducted; the results showed that older people were rather weak in completing the questionnaires by them-selves. Among those willing to participate in the study, data collection was conducted by trained interviewers through face-to-face interviews. The place where the in-terviews were conducted was determined in accordance with the convenience and proclivity of the participants. We performed the majority of interviews in a quiet room in the homes of the participants. Each interview lasted 25–35 minutes. If a potential participant was not avail-able at the relevant address, a replacement was selected from the next household on the right.
For the data analysis, descriptive, inferential statistics, chi-squared tests and logistic regression were used. In order to make the appropriate comparisons, the 5 possible responses were dichotomized into “satisfied” or “dissatisfied”.
Ethical standardsInformed consent was obtained from all the people who participated in the study. All procedures performed in the study were in accordance with the ethical standards of the Ethics Committee of Tabriz University of Medical Sciences (number: 1395.1148).
Results The mean age of the participants was 70.19 [standard deviation (SD) 8.2] years [males 71.25 (SD 8.26), females 69.20 (SD 8.05) years]. Table 1 compares the level of life satisfaction scores and sociodemographic variables. Male:female ratio was 0.929. In terms of marital status, the most common was “married” and the least common “never married” (n = 7). Around 54% were illiterate, with a strong difference between the sexes, men 37.4%, women 70.2%. More than half of the respondents were born in rural areas and had migrated to Tabriz. In terms of family type, 619 (58%) were living in extended families (with > 1 marriage represented).
The descriptive statistics showed that the mean score for life satisfaction was 14.14 (SD 4.12), with the most prevalent category being “dissatisfied”.
Evaluating the simultaneous effect of independent variables on life satisfaction using logistic regression showed that the impact of sex, education, perceived social support and daily walking were statistically significant at the 5% level (Table 2). Assuming other model variables as constant, being female increases the probability of life satisfaction 1.42 times. A higher level of education also had a significant effect on the likelihood of satisfaction with life. Having received elementary, secondary or academic
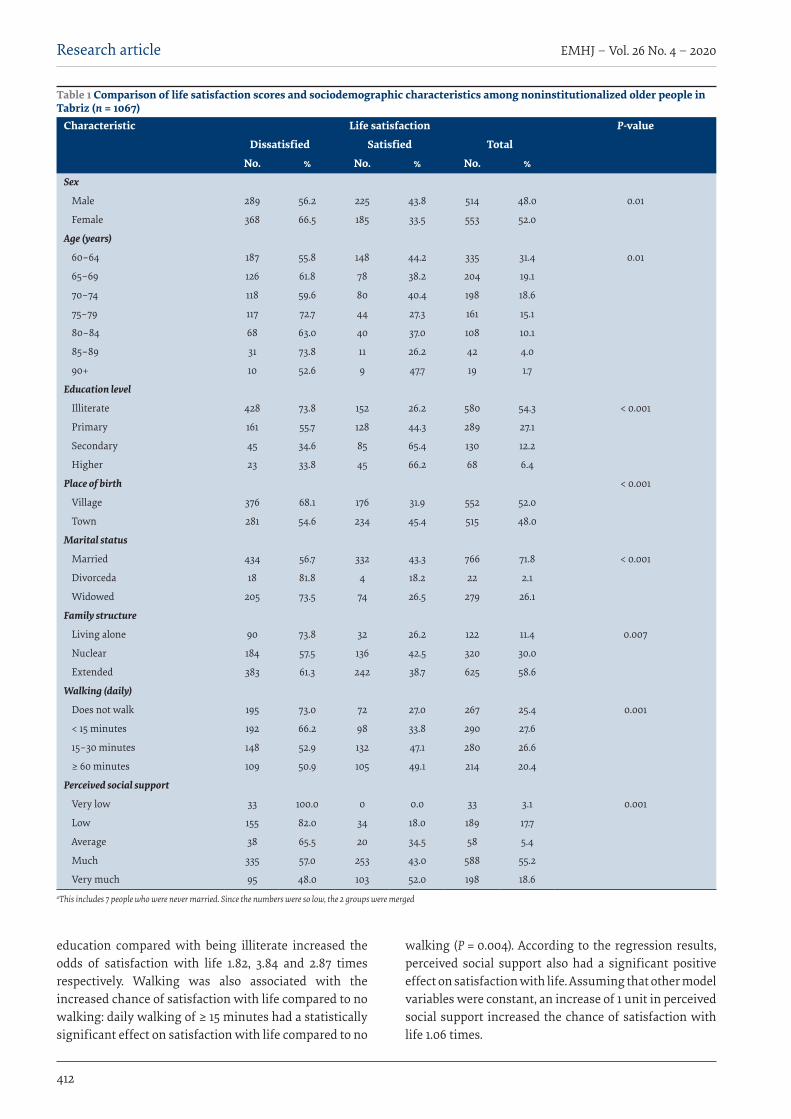
EMHJ – Vol. 26 No. 4 – 2020Research article
412
education compared with being illiterate increased the odds of satisfaction with life 1.82, 3.84 and 2.87 times respectively. Walking was also associated with the increased chance of satisfaction with life compared to no walking: daily walking of ≥ 15 minutes had a statistically significant effect on satisfaction with life compared to no
walking (P = 0.004). According to the regression results, perceived social support also had a significant positive effect on satisfaction with life. Assuming that other model variables were constant, an increase of 1 unit in perceived social support increased the chance of satisfaction with life 1.06 times.
Table 1 Comparison of life satisfaction scores and sociodemographic characteristics among noninstitutionalized older people in Tabriz (n = 1067)
Characteristic Life satisfaction P-value
Dissatisfied Satisfied Total
No. % No. % No. %Sex
Male 289 56.2 225 43.8 514 48.0 0.01
Female 368 66.5 185 33.5 553 52.0
Age (years)
60–64 187 55.8 148 44.2 335 31.4 0.01
65–69 126 61.8 78 38.2 204 19.1
70–74 118 59.6 80 40.4 198 18.6
75–79 117 72.7 44 27.3 161 15.1
80–84 68 63.0 40 37.0 108 10.1
85–89 31 73.8 11 26.2 42 4.0
90+ 10 52.6 9 47.7 19 1.7
Education level
Illiterate 428 73.8 152 26.2 580 54.3 < 0.001
Primary 161 55.7 128 44.3 289 27.1
Secondary 45 34.6 85 65.4 130 12.2
Higher 23 33.8 45 66.2 68 6.4
Place of birth < 0.001
Village 376 68.1 176 31.9 552 52.0
Town 281 54.6 234 45.4 515 48.0
Marital status
Married 434 56.7 332 43.3 766 71.8 < 0.001
Divorceda 18 81.8 4 18.2 22 2.1
Widowed 205 73.5 74 26.5 279 26.1
Family structure
Living alone 90 73.8 32 26.2 122 11.4 0.007
Nuclear 184 57.5 136 42.5 320 30.0
Extended 383 61.3 242 38.7 625 58.6
Walking (daily)
Does not walk 195 73.0 72 27.0 267 25.4 0.001
< 15 minutes 192 66.2 98 33.8 290 27.6
15–30 minutes 148 52.9 132 47.1 280 26.6
≥ 60 minutes 109 50.9 105 49.1 214 20.4
Perceived social support
Very low 33 100.0 0 0.0 33 3.1 0.001
Low 155 82.0 34 18.0 189 17.7
Average 38 65.5 20 34.5 58 5.4
Much 335 57.0 253 43.0 588 55.2
Very much 95 48.0 103 52.0 198 18.6aThis includes 7 people who were never married. Since the numbers were so low, the 2 groups were merged
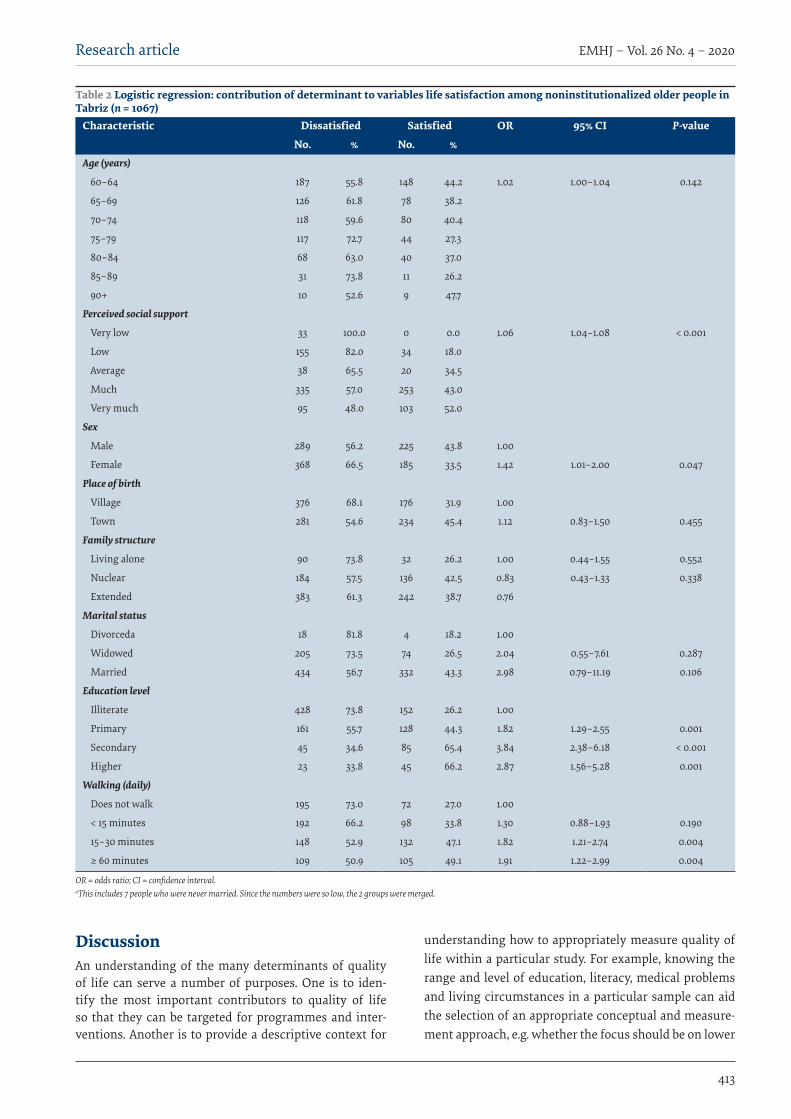
Research article
413
EMHJ – Vol. 26 No. 4 – 2020
DiscussionAn understanding of the many determinants of quality of life can serve a number of purposes. One is to iden-tify the most important contributors to quality of life so that they can be targeted for programmes and inter-ventions. Another is to provide a descriptive context for
understanding how to appropriately measure quality of life within a particular study. For example, knowing the range and level of education, literacy, medical problems and living circumstances in a particular sample can aid the selection of an appropriate conceptual and measure-ment approach, e.g. whether the focus should be on lower
Table 2 Logistic regression: contribution of determinant to variables life satisfaction among noninstitutionalized older people in Tabriz (n = 1067)
Characteristic Dissatisfied Satisfied OR 95% CI P-value
No. % No. %Age (years)
60–64 187 55.8 148 44.2 1.02 1.00–1.04 0.142
65–69 126 61.8 78 38.2
70–74 118 59.6 80 40.4
75–79 117 72.7 44 27.3
80–84 68 63.0 40 37.0
85–89 31 73.8 11 26.2
90+ 10 52.6 9 47.7
Perceived social support
Very low 33 100.0 0 0.0 1.06 1.04–1.08 < 0.001
Low 155 82.0 34 18.0
Average 38 65.5 20 34.5
Much 335 57.0 253 43.0
Very much 95 48.0 103 52.0
Sex
Male 289 56.2 225 43.8 1.00
Female 368 66.5 185 33.5 1.42 1.01–2.00 0.047
Place of birth
Village 376 68.1 176 31.9 1.00
Town 281 54.6 234 45.4 1.12 0.83–1.50 0.455
Family structure
Living alone 90 73.8 32 26.2 1.00 0.44–1.55 0.552
Nuclear 184 57.5 136 42.5 0.83 0.43–1.33 0.338
Extended 383 61.3 242 38.7 0.76
Marital status
Divorceda 18 81.8 4 18.2 1.00
Widowed 205 73.5 74 26.5 2.04 0.55–7.61 0.287
Married 434 56.7 332 43.3 2.98 0.79–11.19 0.106
Education level
Illiterate 428 73.8 152 26.2 1.00
Primary 161 55.7 128 44.3 1.82 1.29–2.55 0.001
Secondary 45 34.6 85 65.4 3.84 2.38–6.18 < 0.001
Higher 23 33.8 45 66.2 2.87 1.56–5.28 0.001
Walking (daily)
Does not walk 195 73.0 72 27.0 1.00
< 15 minutes 192 66.2 98 33.8 1.30 0.88–1.93 0.190
15–30 minutes 148 52.9 132 47.1 1.82 1.21–2.74 0.004
≥ 60 minutes 109 50.9 105 49.1 1.91 1.22–2.99 0.004
OR = odds ratio; CI = confidence interval. aThis includes 7 people who were never married. Since the numbers were so low, the 2 groups were merged.

EMHJ – Vol. 26 No. 4 – 2020Research article
414
AcknowledgementsWe are most grateful for the assistance given by the facilitators and participants, and also the Deputy of Tabriz University of Medical Sciences for research and technology. Professor Tony Warnes of the University of Sheffield kindly provided advice on the English expression in the paper.
Funding: Funding for this study was provided by the Social Determinants of Health Research Centre, Tabriz University of Medical Sciences.
Competing interests: None declared.
versus higher levels of functioning, or what methods of data collection are optimal. Finally, scores on such deter-minants can be useful covariates in studies attempting to explain quality of life outcomes, facilitating the isolation of the unique influence of the independent variables of primary interest (23).
Our findings showed significant relationships between satisfaction with life and sex, perceived social support, level of education and daily walking. These findings are consistent with those reported by Borg et al. among older people in Sweden (24) and by Beygzadeh et al. among older people in Shiraz (25).
Old age is the retirement period, which means not only loss of job but also exclusion from social interactions in the workplace (26). Furthermore, the modernization and industrialization of societies is accompanied by changes in the workforce and in family structures that tend to isolate older people, who are increasingly exposed to feelings of loneliness and rejection and psychological risks (27). A reduction in social interactions results in constricted social networks and, consequently, reduced perceived social support. Loneliness can be considered the result of reduced perceived social support. Previous research has demonstrated a significant inverse relationship between loneliness and satisfaction with life (28). Our findings on the significant positive effect of perceived social support and satisfaction with life are consistent with those reported by Adams et al. (29) and
Tamannayeefar et al. (30). In another study, satisfaction with friends showed a significant correlation with life satisfaction among Swedish older people (31). Moreover, the significant positive relationship we found between level of education and life satisfaction replicates the findings of Ho et al. in a study among older people in Hong Kong (32). They also found a significant relationship between physical status and life satisfaction, as did we in Tabriz.
Our study had some limitations. The participants were selected from a group of relatively healthy and younger older people. Although our results were unequivocally positive, the findings may not be representative of the Iranian population as a whole since our sample was selected only among a limited geographical, cultural and religious setting.
Conclusion Given the results of the present study, particularly the sig-nificantly low satisfaction with life among older women and the strong influence of the perceived social network in generating satisfaction with life, the current perspec-tives may be reconciled to identify the specific mecha-nisms that govern the apparent increase in associational involvement with age among older adults. As an example, opening up educational institutions may address the lack of a social network since our research identified this fac-tor as important in life satisfaction.
Niveau de satisfaction dans la vie et facteurs contributifs chez les personnes âgées non institutionnalisées résidant à Tabriz (République islamique d’Iran)RésuméContexte : Compte tenu de l’augmentation croissante de la population âgée, le bien-être de cette tranche d’âge constitue un objectif important pour les politiques économique et sanitaire.Objectifs : La présente étude portait sur les niveaux de satisfaction à l’égard de la vie chez les personnes âgées vivant à domicile et les facteurs qui l’influencent.Méthode : En appliquant une probabilité proportionnelle à la taille, une étude transversale a été menée auprès de 1067 personnes âgées résidant à Tabriz. Les questionnaires correspondant à l’Échelle de satisfaction dans la vie et à l’Échelle multidimensionnelle de soutien social perçu ont été administrés. Les données ont été analysées à l’aide de tests du khi carré et de la régression logistique.Résultats : Plus de la moitié des participants étaient insatisfaits de leur vie. Les femmes âgées, actives et éduquées faisaient état d’un niveau de satisfaction plus élevé que les autres. Conclusion : Les effets positifs significatifs du soutien social perçu et du taux d’activité physique indiquaient que l’interaction sociale peut jouer un rôle aussi essentiel que l’activité physique pour le bien-être des personnes âgées. De ce fait, ces qualités devraient être activement encouragées parmi les personnes âgées en République islamique d’Iran.
Research article
415
EMHJ – Vol. 26 No. 4 – 2020
References1. Ataei SH. Changing global patterns of health and illness: a demographic transition and epidemiological transition. Medical
History. 2012;4:11–24.
2. 10 facts on ageing and the life course. Geneva: World Health Organization; (http://www.who.int/features/factfiles/ageing/age-ing_facts/en/, accessed 12 July 2016).
3. World population ageing. New York: United Nations Department of Economic and Social Affairs, Population Division; 2015 (ST/ESA/SER.A/390; https://www.un.org/en/development/desa/population/publications/pdf/ageing/WPA2015_Report.pdf, accessed 29 April 2019).
4. Detailed results of the general population and housing census. Tehran: Statistical Center of Iran; 2012.
5. Mirzaie M. Factors affecting the elderly self-perceived health status. Iranian J Ageing. 2008;3(2);547–55.
6. Imani A, Dastgiri S, Azizi Zeinalhajlou A. Population aging and burden of diseases. Depiction of Health. 2015;6(2):54–61.
7. Pison G. Population ageing will be faster in the south than in the north. Population and Societies. 2009;457:1–4.
8. Country implementation profiles. New York: United Nations, ICPD; 2012.
9. Ardelt M. Wisdom and life satisfaction in old age. J Gerontol B: Psychol Sci Soc Sci. 1997;52:15–27. PMID:9008672
10. Inglehart R. Culture shift in advanced industrial society. Princeton, New Jersey: Princeton University Press; 1990.
11. Deiner E, Suh E, Lucas RE, Smith HL. Subjective well-being: three decades of progress. Psychological Bull. 1999;125;276–302.
12. Faraji T, Khademiyan T. A study on the effect of life satisfaction on the social delight. Quarterly of Sociological Studies of Youth. 2013;4(10);87–102.
13. Pavot W, Diener E. The Satisfaction with Life Scale and the emerging construct of life satisfaction. J Positive Psychol 2008;3:137–52
14. Swami V, Chamorro-Premuzic T, Sinniah D, Maniam T, Kannan K. General health mediates the relationship between loneliness, life satisfaction and depression. Soc Psychiatry Psychiatr Epidemiol. 2007;42:161–6. doi:10.1007/s00127-006-0140-5
15. Ng ST, Tey NP, Asadullah MN. What matters for life satisfaction among the oldest-old? Evidence from China. PLoS ONE. 2017;12(2):1–16. https://doi.org/10.1371/journal.pone.0171799.
16. Kousheshi M, Khosravi A, Alizadeh M, Torkashvand M, Aghaei N. Population ageing in Iran: socio-economic, demographic and health characteristics of the elderly. Tehran: UNFPA and University of Tehran; 2014 (https://iran.unfpa.org/sites/default/files/pub-pdf/Population%20Ageing%20in%20I.%20R.%20Iran_2.pdf, accessed 14 April 2019).
17. Lavrakas PJ. Encyclopedia of survey research methods. Thousand Oaks, California: SAGE Publications; 2008.
18. Sheikhi M, Houman HA, Ahadi Allameh H, Sepah Mansour M. [Psychometric properties of the Satisfaction with Life Scale (SWLS)]. J Modern Industrial Organization Psychology 2010;1:17–25 (in Farsi).
19. Bayani AA, Koocheky AM, Goodarzi H. The reliability and validity of the satisfaction with life scale. J Iranian Psychologists 2007;3;259–60 (in Farsi)..
درجة الرضا عن احلياة والعوامل املسامهة يف حتقيق ذلك يف صفوف السكان األكرب سنا من غري املقيمني يف مؤسسات الرعاية يف تربيز، مجهورية إيران اإلسالمية
أكرب زين احلاجلو، مهستی علیزاده، حممد صاحبي حق، أصغر حممد بوراصل، حسني مطلبياخلالصة
السیاسات االقتصادية والسیاسات يمثل هدفا مهام لكل من املسنني بات موضوع عافیة السكانیة األكرب سنا، للفئات املتزايد النمو اخللفية: مع الصحیة.
األهداف: استقصت هذه الدراسة مستويات الرضا عن احلیاة يف صفوف األشخاص األكرب سنا الذين يعیشون يف املنزل، والعوامل املؤثرة علیها.طريقة البحث: من خالل تطبیق االحتامل املتناسب مع احلجم، ُأجري مسح مقطعي شمل 1067 شخصا من األشخاص األكرب سنا الذين يعیشون لت البیانات باستخدام اختبارات يف تربيز. وُطبِّق كل من استبیايْن مقیاس الرضا عن احلیاة ومقیاس الدعم االجتامعي امللموس املتعدد األبعاد. وُحلِّ
مربع كاي واالنحدار اللوجستي.النتائج: أبدى أكثر من نصف املشاركني عدم رضاهم عن حیاهتم. بینام أبدى األشخاص األكرب سنا من اإلناث، واملتعلمني، واألكثر نشاطا رضا
أكثر من سواهم. االستنتاج: تشري اآلثار اإلجيابیة املهمة املرتتبة عىل الدعم االجتامعي امللموس ومعدل النشاط البدين إىل أن التفاعل االجتامعي قد يكون مهام لتحقیق عافیة األشخاص األكرب سنا بقدر أمهیة النشاط البدين هلم، وأنه يتعني تعزيز تلك اخلصائص بصورة فعالة يف صفوف األشخاص األكرب سنا يف
مجهورية إيران اإلسالمیة.
EMHJ – Vol. 26 No. 4 – 2020Research article
416
20. Zimet GD, Dahlem NW, Zimet SG, Farley GK. The Multidimensional Scale of Perceived Social Support. J Person Assess. 1988;52;30–41. http://dx.doi.org/10.1207/s15327752jpa5201_2
21. Stanley M, Beck J, Zebb B. Psychometric properties of the MSPSS in older adults. Aging Ment Health. 1998;2:186–93.
22. Emaminaeini M, Bakhtiyari M, Hatami H, Khodakarim S, Sahaf R. Depression and perceived social support in the elderly. Irani-an J Ageing. 2017;12(2):192–207. http://dx.doi.org/10.21859/sija-1202192
23. Abeles RP, Gift H, Ory MG. Aging and quality of life, 1st ed. New York: Springer; 1994.
24. Borg C, Hallberg IR, Blomqvist K. Life satisfaction among older people with reduced self‐care capacity: the relationship to social, health and financial aspects. J Clin Nurs. 2006;15;607–18. doi:10.1111/j.1365-2702.2006.01375.x
25. Beygzadeh Z, Rezaei A, Khalouei Y. [The relationship between social support and life satisfaction with happiness among home-dwelling older adults in Shiraz]. Iranian J Ageing 2015;10;1–10 (in Farsi).
26. Maddah SB. [The status of social and leisure time activities in the elderly residing in Tehran and Sweden[. Iranian J Ageing 2008;3;597–606 (in Farsi).
27. Heinrich LM, Gullone E. The clinical significance of loneliness: a literature review. Clin Psychol Rev. 2006;26;695–718. doi:10.1016/j.cpr.2006.04.002
28. Koochaki G, Hojjati H, Sanagoo A. [The relationship between loneliness and life satisfaction of the elderly in Gorgan and Gona-bad cities]. J Research Development in Nursing & Midwifery. 2012;9;61–68 (in Farsi).
29. Adams GA, King LA, King D W. Relationships of job and family involvement, family social support, and work-family conflict with job and life satisfaction. J Applied Psychol. 1996;1;411–20.
30. Tamannayeefar MR, Mansoori Nik A. [The prediction of life satisfaction based personality factors, social support and spiritual well-being]. J Psychol. 2013;8;67–80 (in Farsi).
31. McCamish-Svensson C, Samuelsson G, Hagberg B, Svensson T, Dehlin O. Social relationships and health as predictors of life satisfaction in advanced old age: results from a Swedish longitudinal study. Int J Aging Hum Dev. 1999;48:301–24. doi:10.2190/GX0K-565H-08FB-XF5G
32. Ho S, Woo J, Lau J, Chan S, Yuen Y, Chan Y. Life satisfaction and associated factors in older Hong Kong Chinese. J Am Geriatr Soc. 1995;43:252–5. PMID:7884112

Research article
417
EMHJ – Vol. 26 No. 4 – 2020
Myths about modern and traditional contraceptives held by women in Minia, Upper EgyptEhab Eshak 1,2
1Department of Public Health and Preventive Medicine, Faculty of Medicine, Minia University, Minia City, Egypt. 2Public Health Department of Social Medicines, Graduate School of Medicine, Osaka University, Osaka, Japan. (Correspondence to: Ehab Eshak: [email protected]).
IntroductionAccording to the Egyptian Ministry of Health and Pop-ulation, the proportion of contraceptives users in 2014 was still less than 50% and was far below the correspond-ing proportion of married women (> 80%) who desire no more children (1). With the rapid growth of the Egyptian population from 20.8 to 98.1 million inhabitants in the past 50 years (2), strenuous efforts have been made to promote maternal and child health through family plan-ning programmes that empower families to make in-formed decisions on the number of children and interval between children they want and to reduce unintended pregnancies.
The use and type of contraceptives should be guided by women’s health status (3). However, in low- and middle-income countries, culture and other non-medical factors have been shown to play an important role in women’s decision to use contraceptives (4). Despite evidence on the positive effect of contraceptive use, not only on controlling fertility but also on women’s health, family welfare and social life in general (5), myths and misconceptions about modern contraceptives are still prevalent in such communities (6–8) and may prevent their use, which can lower general health of the women
(7–9) and may be obstacles to effective family planning programmes (7,8,10).
Myths and misconceptions about contraceptives are very common in deprived areas and low- and middle-income communities (4,6–8,11,12). In Egypt, especially in rural areas, poverty, illiteracy and misguided religious beliefs have created a culture and environment that have helped spread misinformation about modern contraceptives since their introduction in 1967 (13,14).
Evidence on these issues is from the 1980s and more recent studies are lacking. Furthermore, those earlier studies focused on misconceptions about oral contraceptive pills only. For example, one study showed that 57% and 52% of urban and rural Egyptians respectively believed that using oral contraceptive pills had substantial health risks (15). The most prevalent myths were that contraceptive pills cause severe headache (86% in rural and 95% in urban communities), anaemia (55% and 53%), sterility (20% and 37%), breast cancer (21% and 16%) and birth defects (17% and 11%) (15).
Therefore, the current study aimed to assess the prevalence of myths about various modern contraceptive methods used by women in Minia governorate in Upper Egypt and evaluate their effect on ever and current use of
AbstractBackground: Misconceptions about modern contraceptives affect their use in low- and middle-income countries.Aims: This study aimed to determine the prevalence of myths about modern contraceptives and their association with ever and current use of contraceptives by women in Minia, Upper Egypt.Methods: This was a cross-sectional study of 1212 married Egyptian women aged 18–49 years attending urban and rural health centres in Minia. Data were collected using a structured interview questionnaire and analysed by logistic regres-sion analysis; odds ratios (OR) and 95% confidence intervals (CI) were calculated.Results: Most of the women (88.7%) had one or more misconceptions about contraceptives. The most prevalent miscon-ceptions were that birth control pills cause cancer and intrauterine devices (IUDs) can penetrate the uterus and move to the heart. The current use of birth control pills and IUDs was significantly lower in women with misguided beliefs than those without such beliefs; adjusted OR = 0.59 (95% CI: 0.37–0.90) and adjusted OR = 0.50 (95% CI: 0.34–0.76) respective-ly. Belief in an increasing number of myths was associated with lower odds of ever use of birth control pills: OR = 0.72 (95% CI: 0.57–0.96), OR = 0.61 (95% CI: 0.43–0.91), OR = 0.48 (95% CI: 0.29–0.69) and OR = 0.43 (95% CI: 0.24–0.63) in wom-en with 1, 2, 3 and ≥ 4 misconceptions versus those with none. Conclusions: Myths about contraceptives are common in women in Minia and may have a significant effect on their choice and use of contraceptive method. Reproductive health programmes to refute such misguided beliefs are recom-mended.Keywords: reproductive health, contraception, prevalence, female, Egypt
Citation: Eshak E. Myths about modern and traditional contraceptives held by women in Minia, Upper Egypt. East Mediterr Health J. 2020;26(4):417–425. https://doi.org/10.26719/emhj.19.053
Received: 02/05/18; accepted: 13/08/18
Copyright © World Health Organization (WHO) 2020. Open Access. Some rights reserved. This work is available under the CC BY-NC-SA 3.0 IGO license (https://creativecommons.org/licenses/by-nc-sa/3.0/igo).
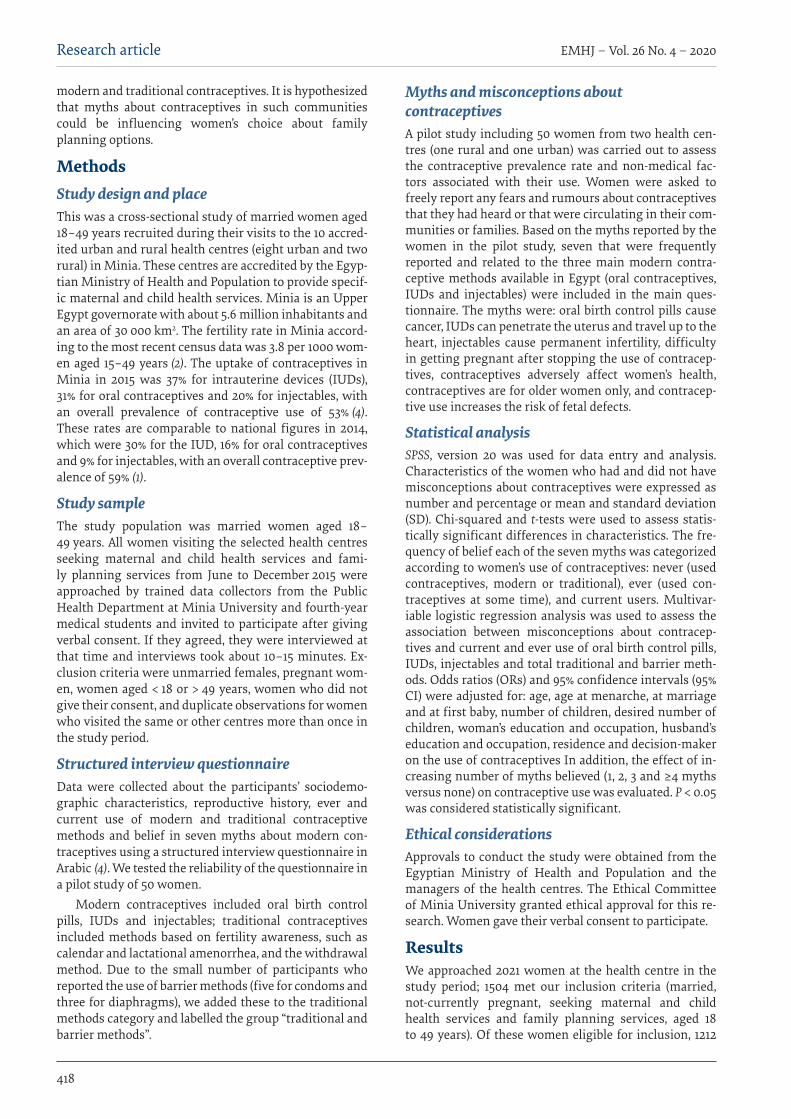
EMHJ – Vol. 26 No. 4 – 2020Research article
418
modern and traditional contraceptives. It is hypothesized that myths about contraceptives in such communities could be influencing women’s choice about family planning options.
MethodsStudy design and placeThis was a cross-sectional study of married women aged 18–49 years recruited during their visits to the 10 accred-ited urban and rural health centres (eight urban and two rural) in Minia. These centres are accredited by the Egyp-tian Ministry of Health and Population to provide specif-ic maternal and child health services. Minia is an Upper Egypt governorate with about 5.6 million inhabitants and an area of 30 000 km2. The fertility rate in Minia accord-ing to the most recent census data was 3.8 per 1000 wom-en aged 15–49 years (2). The uptake of contraceptives in Minia in 2015 was 37% for intrauterine devices (IUDs), 31% for oral contraceptives and 20% for injectables, with an overall prevalence of contraceptive use of 53% (4). These rates are comparable to national figures in 2014, which were 30% for the IUD, 16% for oral contraceptives and 9% for injectables, with an overall contraceptive prev-alence of 59% (1).
Study sampleThe study population was married women aged 18–49 years. All women visiting the selected health centres seeking maternal and child health services and fami-ly planning services from June to December 2015 were approached by trained data collectors from the Public Health Department at Minia University and fourth-year medical students and invited to participate after giving verbal consent. If they agreed, they were interviewed at that time and interviews took about 10–15 minutes. Ex-clusion criteria were unmarried females, pregnant wom-en, women aged < 18 or > 49 years, women who did not give their consent, and duplicate observations for women who visited the same or other centres more than once in the study period.
Structured interview questionnaireData were collected about the participants’ sociodemo-graphic characteristics, reproductive history, ever and current use of modern and traditional contraceptive methods and belief in seven myths about modern con-traceptives using a structured interview questionnaire in Arabic (4). We tested the reliability of the questionnaire in a pilot study of 50 women.
Modern contraceptives included oral birth control pills, IUDs and injectables; traditional contraceptives included methods based on fertility awareness, such as calendar and lactational amenorrhea, and the withdrawal method. Due to the small number of participants who reported the use of barrier methods (five for condoms and three for diaphragms), we added these to the traditional methods category and labelled the group “traditional and barrier methods”.
Myths and misconceptions about contraceptivesA pilot study including 50 women from two health cen-tres (one rural and one urban) was carried out to assess the contraceptive prevalence rate and non-medical fac-tors associated with their use. Women were asked to freely report any fears and rumours about contraceptives that they had heard or that were circulating in their com-munities or families. Based on the myths reported by the women in the pilot study, seven that were frequently reported and related to the three main modern contra-ceptive methods available in Egypt (oral contraceptives, IUDs and injectables) were included in the main ques-tionnaire. The myths were: oral birth control pills cause cancer, IUDs can penetrate the uterus and travel up to the heart, injectables cause permanent infertility, difficulty in getting pregnant after stopping the use of contracep-tives, contraceptives adversely affect women’s health, contraceptives are for older women only, and contracep-tive use increases the risk of fetal defects.
Statistical analysisSPSS, version 20 was used for data entry and analysis. Characteristics of the women who had and did not have misconceptions about contraceptives were expressed as number and percentage or mean and standard deviation (SD). Chi-squared and t-tests were used to assess statis-tically significant differences in characteristics. The fre-quency of belief each of the seven myths was categorized according to women’s use of contraceptives: never (used contraceptives, modern or traditional), ever (used con-traceptives at some time), and current users. Multivar-iable logistic regression analysis was used to assess the association between misconceptions about contracep-tives and current and ever use of oral birth control pills, IUDs, injectables and total traditional and barrier meth-ods. Odds ratios (ORs) and 95% confidence intervals (95% CI) were adjusted for: age, age at menarche, at marriage and at first baby, number of children, desired number of children, woman’s education and occupation, husband’s education and occupation, residence and decision-maker on the use of contraceptives In addition, the effect of in-creasing number of myths believed (1, 2, 3 and ≥4 myths versus none) on contraceptive use was evaluated. P < 0.05 was considered statistically significant.
Ethical considerationsApprovals to conduct the study were obtained from the Egyptian Ministry of Health and Population and the managers of the health centres. The Ethical Committee of Minia University granted ethical approval for this re-search. Women gave their verbal consent to participate.
ResultsWe approached 2021 women at the health centre in the study period; 1504 met our inclusion criteria (married, not-currently pregnant, seeking maternal and child health services and family planning services, aged 18 to 49 years). Of these women eligible for inclusion, 1212
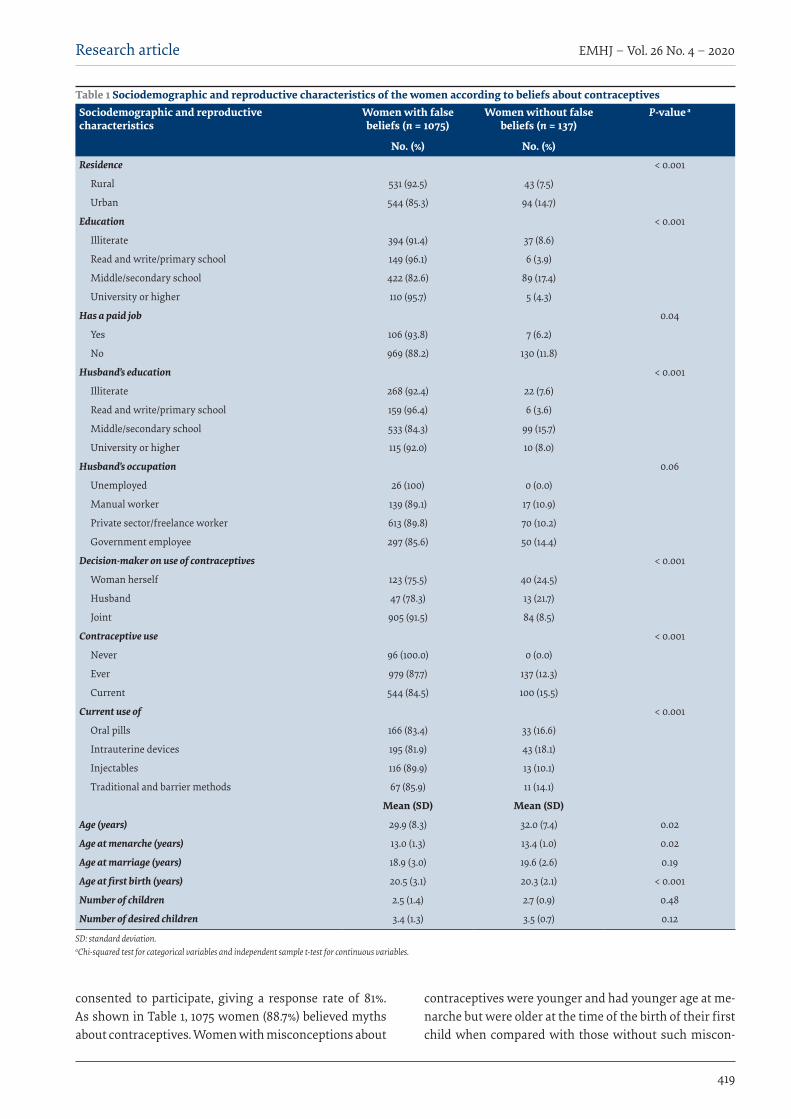
Research article
419
EMHJ – Vol. 26 No. 4 – 2020
consented to participate, giving a response rate of 81%. As shown in Table 1, 1075 women (88.7%) believed myths about contraceptives. Women with misconceptions about
contraceptives were younger and had younger age at me-narche but were older at the time of the birth of their first child when compared with those without such miscon-
Table 1 Sociodemographic and reproductive characteristics of the women according to beliefs about contraceptives Sociodemographic and reproductive characteristics
Women with false beliefs (n = 1075)
Women without false beliefs (n = 137)
P-value a
No. (%) No. (%)Residence < 0.001
Rural 531 (92.5) 43 (7.5)
Urban 544 (85.3) 94 (14.7)
Education < 0.001
Illiterate 394 (91.4) 37 (8.6)
Read and write/primary school 149 (96.1) 6 (3.9)
Middle/secondary school 422 (82.6) 89 (17.4)
University or higher 110 (95.7) 5 (4.3)
Has a paid job 0.04
Yes 106 (93.8) 7 (6.2)
No 969 (88.2) 130 (11.8)
Husband’s education < 0.001
Illiterate 268 (92.4) 22 (7.6)
Read and write/primary school 159 (96.4) 6 (3.6)
Middle/secondary school 533 (84.3) 99 (15.7)
University or higher 115 (92.0) 10 (8.0)
Husband’s occupation 0.06
Unemployed 26 (100) 0 (0.0)
Manual worker 139 (89.1) 17 (10.9)
Private sector/freelance worker 613 (89.8) 70 (10.2)
Government employee 297 (85.6) 50 (14.4)
Decision-maker on use of contraceptives < 0.001
Woman herself 123 (75.5) 40 (24.5)
Husband 47 (78.3) 13 (21.7)
Joint 905 (91.5) 84 (8.5)
Contraceptive use < 0.001
Never 96 (100.0) 0 (0.0)
Ever 979 (87.7) 137 (12.3)
Current 544 (84.5) 100 (15.5)
Current use of < 0.001
Oral pills 166 (83.4) 33 (16.6)
Intrauterine devices 195 (81.9) 43 (18.1)
Injectables 116 (89.9) 13 (10.1)
Traditional and barrier methods 67 (85.9) 11 (14.1)
Mean (SD) Mean (SD)
Age (years) 29.9 (8.3) 32.0 (7.4) 0.02
Age at menarche (years) 13.0 (1.3) 13.4 (1.0) 0.02
Age at marriage (years) 18.9 (3.0) 19.6 (2.6) 0.19
Age at first birth (years) 20.5 (3.1) 20.3 (2.1) < 0.001
Number of children 2.5 (1.4) 2.7 (0.9) 0.48
Number of desired children 3.4 (1.3) 3.5 (0.7) 0.12
SD: standard deviation. aChi-squared test for categorical variables and independent sample t-test for continuous variables.
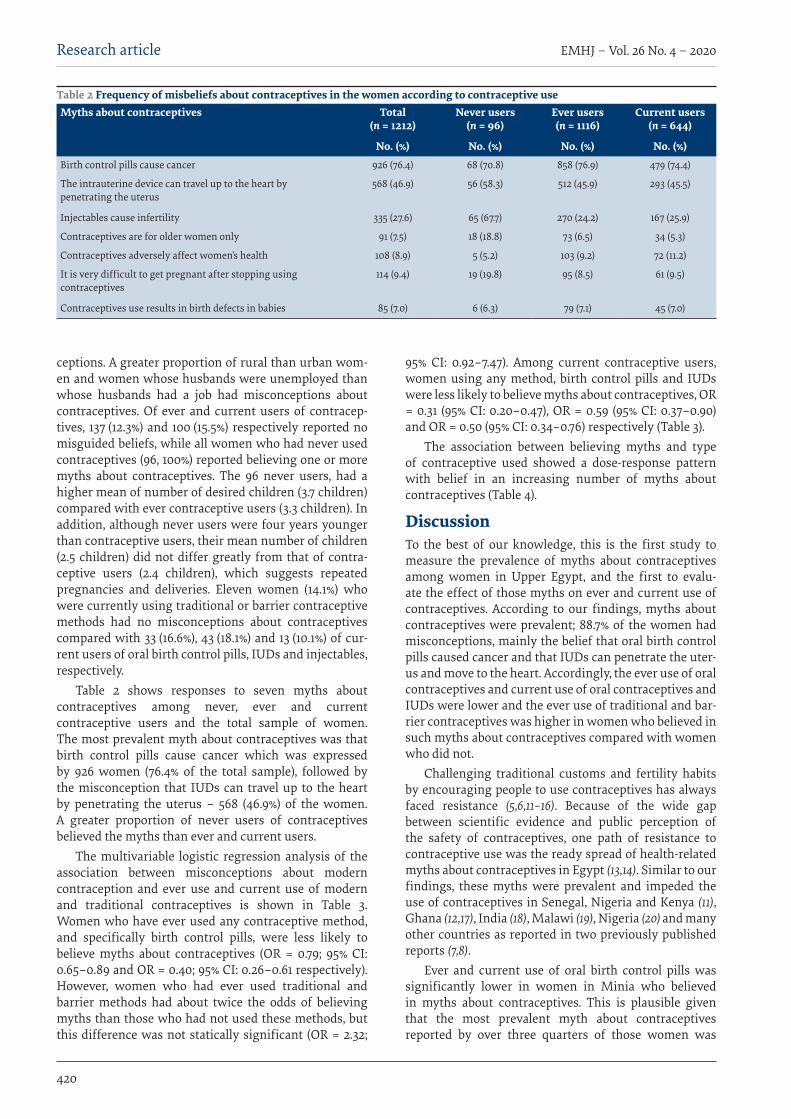
EMHJ – Vol. 26 No. 4 – 2020Research article
420
ceptions. A greater proportion of rural than urban wom-en and women whose husbands were unemployed than whose husbands had a job had misconceptions about contraceptives. Of ever and current users of contracep-tives, 137 (12.3%) and 100 (15.5%) respectively reported no misguided beliefs, while all women who had never used contraceptives (96, 100%) reported believing one or more myths about contraceptives. The 96 never users, had a higher mean of number of desired children (3.7 children) compared with ever contraceptive users (3.3 children). In addition, although never users were four years younger than contraceptive users, their mean number of children (2.5 children) did not differ greatly from that of contra-ceptive users (2.4 children), which suggests repeated pregnancies and deliveries. Eleven women (14.1%) who were currently using traditional or barrier contraceptive methods had no misconceptions about contraceptives compared with 33 (16.6%), 43 (18.1%) and 13 (10.1%) of cur-rent users of oral birth control pills, IUDs and injectables, respectively.
Table 2 shows responses to seven myths about contraceptives among never, ever and current contraceptive users and the total sample of women. The most prevalent myth about contraceptives was that birth control pills cause cancer which was expressed by 926 women (76.4% of the total sample), followed by the misconception that IUDs can travel up to the heart by penetrating the uterus – 568 (46.9%) of the women. A greater proportion of never users of contraceptives believed the myths than ever and current users.
The multivariable logistic regression analysis of the association between misconceptions about modern contraception and ever use and current use of modern and traditional contraceptives is shown in Table 3. Women who have ever used any contraceptive method, and specifically birth control pills, were less likely to believe myths about contraceptives (OR = 0.79; 95% CI: 0.65–0.89 and OR = 0.40; 95% CI: 0.26–0.61 respectively). However, women who had ever used traditional and barrier methods had about twice the odds of believing myths than those who had not used these methods, but this difference was not statically significant (OR = 2.32;
95% CI: 0.92–7.47). Among current contraceptive users, women using any method, birth control pills and IUDs were less likely to believe myths about contraceptives, OR = 0.31 (95% CI: 0.20–0.47), OR = 0.59 (95% CI: 0.37–0.90) and OR = 0.50 (95% CI: 0.34–0.76) respectively (Table 3).
The association between believing myths and type of contraceptive used showed a dose-response pattern with belief in an increasing number of myths about contraceptives (Table 4).
DiscussionTo the best of our knowledge, this is the first study to measure the prevalence of myths about contraceptives among women in Upper Egypt, and the first to evalu-ate the effect of those myths on ever and current use of contraceptives. According to our findings, myths about contraceptives were prevalent; 88.7% of the women had misconceptions, mainly the belief that oral birth control pills caused cancer and that IUDs can penetrate the uter-us and move to the heart. Accordingly, the ever use of oral contraceptives and current use of oral contraceptives and IUDs were lower and the ever use of traditional and bar-rier contraceptives was higher in women who believed in such myths about contraceptives compared with women who did not.
Challenging traditional customs and fertility habits by encouraging people to use contraceptives has always faced resistance (5,6,11–16). Because of the wide gap between scientific evidence and public perception of the safety of contraceptives, one path of resistance to contraceptive use was the ready spread of health-related myths about contraceptives in Egypt (13,14). Similar to our findings, these myths were prevalent and impeded the use of contraceptives in Senegal, Nigeria and Kenya (11), Ghana (12,17), India (18), Malawi (19), Nigeria (20) and many other countries as reported in two previously published reports (7,8).
Ever and current use of oral birth control pills was significantly lower in women in Minia who believed in myths about contraceptives. This is plausible given that the most prevalent myth about contraceptives reported by over three quarters of those women was
Table 2 Frequency of misbeliefs about contraceptives in the women according to contraceptive use Myths about contraceptives Total
(n = 1212)Never users
(n = 96)Ever users (n = 1116)
Current users (n = 644)
No. (%) No. (%) No. (%) No. (%)Birth control pills cause cancer 926 (76.4) 68 (70.8) 858 (76.9) 479 (74.4)
The intrauterine device can travel up to the heart by penetrating the uterus
568 (46.9) 56 (58.3) 512 (45.9) 293 (45.5)
Injectables cause infertility 335 (27.6) 65 (67.7) 270 (24.2) 167 (25.9)
Contraceptives are for older women only 91 (7.5) 18 (18.8) 73 (6.5) 34 (5.3)
Contraceptives adversely affect women’s health 108 (8.9) 5 (5.2) 103 (9.2) 72 (11.2)
It is very difficult to get pregnant after stopping using contraceptives
114 (9.4) 19 (19.8) 95 (8.5) 61 (9.5)
Contraceptives use results in birth defects in babies 85 (7.0) 6 (6.3) 79 (7.1) 45 (7.0)

Research article
421
EMHJ – Vol. 26 No. 4 – 2020
that oral contraceptives cause cancer. Since they became available in the 1960s, oral contraceptives have been the most stigmatized contraceptive method as result of disinformation and myths. Such falsehoods started in the 1980s with the rumour that oral contraceptives cause “weakness” (13), a non-medical based condition of lethargy, dizziness and fatigue associated with contraceptive pill use, and the myth was prevalent in Egypt (13), Botswana and the Islamic Republic of Iran (21). Other myths reported worldwide include the association between the oral contraceptives and ovarian, endometrial and breast cancer (22).
Despite the scientific evidence that IUDs are one of the
safest forms of contraceptive (23), and its discontinuation rate is the lowest among contraceptive users in Egypt (1,4), the second most prevalent myth about contraceptives in women in Minia was that IUDs can travel up to the heart by penetrating the uterus. The current use of IUDs was 50% lower among women who believed this myth. Similar misrepresentations have been important barriers to IUD uptake in other low- and middle-income countries (7,8,24).
The use of oral birth control pills and IUDs decreased as the number of myths believed by women about contraceptives increased, while the ever use of traditional and barrier contraceptives increased among those who
Table 3 Women’s belief in myths about contraceptives and current and ever use of contraceptives: multivariable logistic regression analysisContraceptive use Beta SE P-value OR (95%CI) a
Current use of:
Any contraceptives
Crude model –0.97 0.20 < 0.001 0.38 (0.26–0.56)
Adjusted modelb –1.17 .224 < 0.001 0.31 (0.20–0.47)
Birth control pills
Crude model –0.55 0.22 0.01 0.58 (0.38–0.88)
Adjusted modelb –0.52 0.25 0.03 0.59 (0.37–0.90)
Intrauterine device
Crude model –0.73 0.20 < 0.001 0.48 (0.33–0.72)
Adjusted modelb –0.69 0.24 < 0.001 0.50 (0.34–0.76)
Injectables
Crude model 0.14 0.31 0.64 1.15 (0.63–2.11)
Adjusted modelb 0.04 0.34 0.99 1.04 (0.54–2.03)
Traditional and barrier methods
Crude model –0.27 0.34 0.42 0.76 (0.39–1.48)
Adjusted modelb –0.12 0.38 0.79 0.88 (0.42–1.54)
Ever use of:
Any contraceptives
Crude model –0.19 0.39 0.01 0.82 (0.68–0.91)
Adjusted modelb –0.23 0.52 < 0.001 0.79 (0.65–0.89)
Birth control pills
Crude model –0.75 0.19 < 0.001 0.47 (0.33–0.68)
Adjusted modelb –0.91 0.22 < 0.001 0.40 (0.26–0.61)
Intrauterine device
Crude model 0.28 0.23 0.22 1.33 (0.85–2.08)
Adjusted modelb 0.33 0.26 0.19 1.39 (0.88–2.26)
Injectables
Crude model –0.08 0.19 0.68 0.92 (0.64–1.35)
Adjusted modelb 0.09 0.23 0.20 0.91 (0.58–1.42)
Traditional and barrier methods
Crude model 1.04 0.52 0.05 2.82 (1.02–7.81)
Adjusted modelb 0.84 0.60 0.18 2.32 (0.92–7.47)
SE: standard error; OR: odds ratio; CI: confidence interval. aThe reference category was women who did not belief in myths. bAdjusted for age, age at menarche, at marriage and at first baby, number of children, desired number of children, woman’s education and occupation, husband’s education and occupation, residence and decision-maker on use of contraceptives.
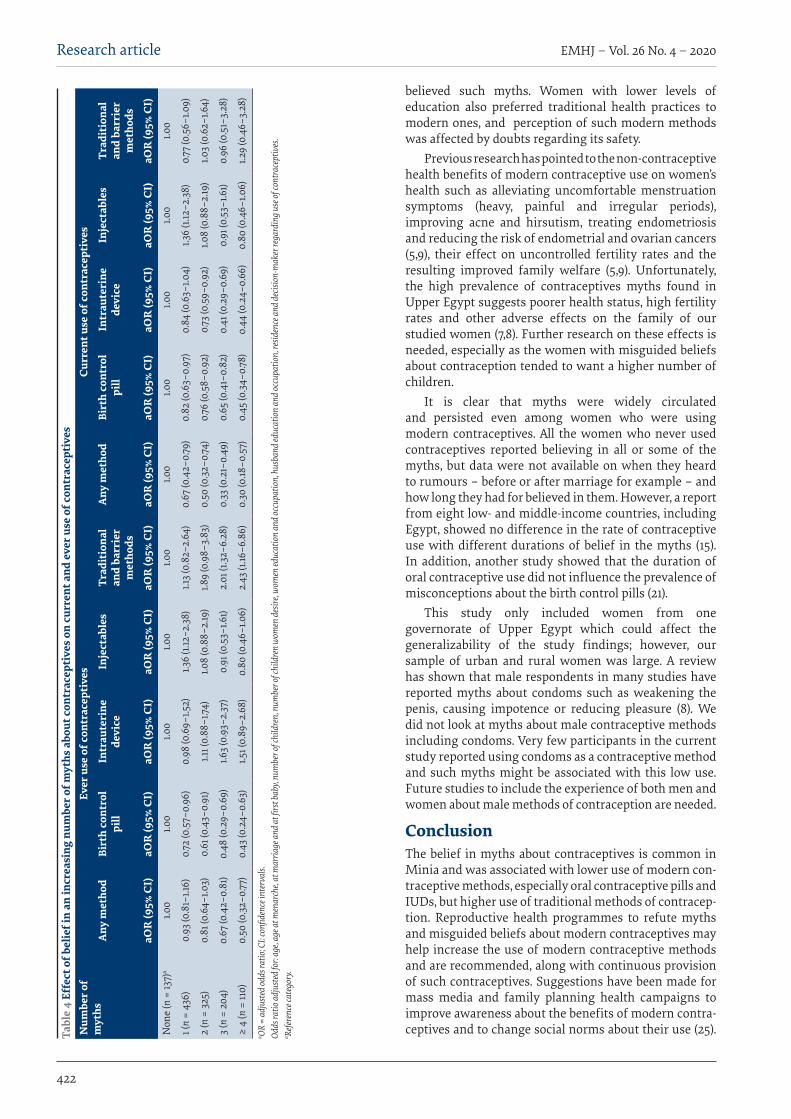
EMHJ – Vol. 26 No. 4 – 2020Research article
422
believed such myths. Women with lower levels of education also preferred traditional health practices to modern ones, and perception of such modern methods was affected by doubts regarding its safety.
Previous research has pointed to the non-contraceptive health benefits of modern contraceptive use on women’s health such as alleviating uncomfortable menstruation symptoms (heavy, painful and irregular periods), improving acne and hirsutism, treating endometriosis and reducing the risk of endometrial and ovarian cancers (5,9), their effect on uncontrolled fertility rates and the resulting improved family welfare (5,9). Unfortunately, the high prevalence of contraceptives myths found in Upper Egypt suggests poorer health status, high fertility rates and other adverse effects on the family of our studied women (7,8). Further research on these effects is needed, especially as the women with misguided beliefs about contraception tended to want a higher number of children.
It is clear that myths were widely circulated and persisted even among women who were using modern contraceptives. All the women who never used contraceptives reported believing in all or some of the myths, but data were not available on when they heard to rumours – before or after marriage for example – and how long they had for believed in them. However, a report from eight low- and middle-income countries, including Egypt, showed no difference in the rate of contraceptive use with different durations of belief in the myths (15). In addition, another study showed that the duration of oral contraceptive use did not influence the prevalence of misconceptions about the birth control pills (21).
This study only included women from one governorate of Upper Egypt which could affect the generalizability of the study findings; however, our sample of urban and rural women was large. A review has shown that male respondents in many studies have reported myths about condoms such as weakening the penis, causing impotence or reducing pleasure (8). We did not look at myths about male contraceptive methods including condoms. Very few participants in the current study reported using condoms as a contraceptive method and such myths might be associated with this low use. Future studies to include the experience of both men and women about male methods of contraception are needed.
ConclusionThe belief in myths about contraceptives is common in Minia and was associated with lower use of modern con-traceptive methods, especially oral contraceptive pills and IUDs, but higher use of traditional methods of contracep-tion. Reproductive health programmes to refute myths and misguided beliefs about modern contraceptives may help increase the use of modern contraceptive methods and are recommended, along with continuous provision of such contraceptives. Suggestions have been made for mass media and family planning health campaigns to improve awareness about the benefits of modern contra-ceptives and to change social norms about their use (25). Ta
ble
4 Ef
fect
of b
elie
f in
an in
crea
sing
num
ber o
f myt
hs a
bout
con
trac
epti
ves o
n cu
rren
t and
eve
r use
of c
ontr
acep
tive
s N
umbe
r of
myt
hsEv
er u
se o
f con
trac
epti
ves
Curr
ent u
se o
f con
trac
epti
ves
Any
met
hod
Birt
h co
ntro
l pi
llIn
trau
teri
ne
devi
ceIn
ject
able
sTr
adit
iona
l an
d ba
rrie
r m
etho
ds
Any
met
hod
Birt
h co
ntro
l pi
llIn
trau
teri
ne
devi
ceIn
ject
able
sTr
adit
iona
l an
d ba
rrie
r m
etho
ds
aOR
(95%
CI)
aOR
(95%
CI)
aOR
(95%
CI)
aOR
(95%
CI)
aOR
(95%
CI)
aOR
(95%
CI)
aOR
(95%
CI)
aOR
(95%
CI)
aOR
(95%
CI)
aOR
(95%
CI)
Non
e (n
= 13
7)a
1.00
1.00
1.00
1.00
1.00
1.00
1.00
1.0
0 1.0
0 1.0
0
1 (n
= 43
6)0.
93 (0
.81–
1.16)
0.72
(0.5
7–0.
96)
0.98
(0.6
9–1.5
2)1.3
6 (1.
12–2
.38)
1.13
(0.8
2–2.
64)
0.67
(0.4
2–0.7
9)0.
82 (0
.63–
0.97
)0.
84 (0
.63–
1.04)
1.36
(1.12
–2.38
)0.7
7 (0
.56–
1.09)
2 (n
= 3
25)
0.81
(0.6
4–1.0
3)0.
61 (0
.43–
0.91
)1.1
1 (0.
88–1
.74)
1.08
(0.8
8–2.
19)
1.89
(0.9
8–3.
83)
0.50
(0.3
2–0.7
4)0.7
6 (0
.58–
0.92
)0.7
3 (0
.59–
0.92
)1.0
8 (0
.88–
2.19
)1.0
3 (0
.62–
1.64)
3 (n
= 2
04)
0.67
(0.4
2–0.
81)
0.48
(0.2
9–0.
69)
1.63
(0.9
3–2.
37)
0.91
(0.5
3–1.6
1)2.
01 (1
.32–
6.28
)0.
33 (0
.21–
0.49
)0.
65 (0
.41–
0.82
)0.
41 (0
.29–
0.69
)0.
91 (0
.53–
1.61)
0.96
(0.5
1–3.
28)
≥ 4
(n =
110)
0.50
(0.3
2–0.7
7)0.
43 (0
.24–
0.63
)1.5
1 (0.
89–2
.68)
0.80
(0.4
6–1.0
6)2.
43 (1
.16–6
.86)
0.30
(0.18
–0.5
7)0.
45 (0
.34–
0.78)
0.44
(0.2
4–0.
66)
0.80
(0.4
6–1.0
6)1.2
9 (0
.46–
3.28
)a OR
= ad
juste
d od
ds ra
tio; C
I: co
nfide
nce i
nter
vals.
Od
ds ra
tio ad
just
ed fo
r: ag
e, ag
e at m
enar
che,
at m
arria
ge an
d at
firs
t bab
y, nu
mbe
r of c
hild
ren,
num
ber o
f chi
ldre
n w
omen
des
ire, w
omen
educ
atio
n an
d oc
cupa
tion,
hus
band
educ
atio
n an
d oc
cupa
tion,
resid
ence
and
decis
ion-
mak
er re
gard
ing u
se of
cont
race
ptiv
es.
a Refer
ence
cate
gory
.
Research article
423
EMHJ – Vol. 26 No. 4 – 2020
However, training of reproductive health service provid-ers to interact with and respond to incorrect information held by clients is recommended. These health service pro-viders can also involve the community through counsel-
ling sessions and seminars, which include satisfied con-
traceptive users to share their experiences, to help dispel
pervasive myths in their local communities.
AcknowledgementsWe thank all the workers in the health centres of the study.
Funding: None.
Competing interests: None declared.
Mythes concernant les méthodes de contraception modernes et traditionnelles entretenus par les femmes de Minya en Moyenne-ÉgypteRésuméContexte : Les idées fausses concernant les méthodes contraceptives modernes ont une incidence sur leur utilisation dans les pays à revenu faible et intermédiaire.Objectifs : La présente étude avait pour objectif de déterminer la prévalence des mythes concernant les méthodes contraceptives modernes et leur association avec une utilisation de contraceptifs, antérieure ou au moment de la réalisation de l’étude, par les femmes de Minya en Moyenne-Égypte.Méthodes : Il s’agissait d’une étude transversale portant sur 1212 Égyptiennes mariées, âgées de 18 à 49 ans, fréquentant les centres de santé des zones urbaines et rurales de Minya. Les données ont été recueillies à l’aide d’un questionnaire d’entretien structuré et traitées dans le cadre d’une analyse de régression logistique ; les odds ratios (OR) et les intervalles de confiance à 95 % (IC) ont été calculés.Résultats : La plupart des femmes (88,7 %) avaient une ou plusieurs idées fausses sur les méthodes de contraception. Les idées les plus répandues étaient que la pilule contraceptive provoque des cancers et que les dispositifs intra-utérins (DIU) peuvent perforer l’utérus et migrer vers le cœur. Le taux d’utilisation de la pilule contraceptive et des DIU au moment de l’étude était significativement plus faible chez les femmes ayant des croyances erronées que chez celles qui n’en avaient pas, OR ajusté = 0,59 (IC à 95 % : 0,37-0,90) et OR ajusté = 0,50 (IC à 95 % : 0,34-0,76) respectivement. La croyance dans un nombre de plus en plus important de mythes était associée à une probabilité plus faible d’un éventuel recours à la pilule contraceptive : OR = 0,72 (IC à 95 % : 0,57-0,96), OR = 0,61 ; IC à 95 % : 0,43-0,91), OR = 0,48 (IC à 95 % : 0,29-0,69) et OR = 0,43 (IC à 95 % : 0,24-0,63) chez les femmes ayant un nombre d’idées fausses égal à 1, 2, 3 ou supérieur ou égal à 4 comparativement à celles qui n’en avaient aucune. Conclusions : Les mythes concernant les moyens de contraception sont largement répandus chez les femmes de Minya et peuvent avoir une incidence notable sur le choix et l’utilisation d’une méthode contraceptive. Il est recommandé de mettre en place des programmes de santé génésique permettant de réfuter ces croyances erronées.
األساطري حول موانع احلمل احلديثة والتقليدية يف صفوف السيدات يف حمافظة املنيا، صعيد مرصإهياب إسحق
اخلالصةاخللفية: تؤثر املفاهيم املغلوطة بشأن موانع احلمل عىل استخدامها يف البلدان املنخفضة واملتوسطة الدخل.
األهداف: هدفت هذه الدراسة إىل حتديد معدل انتشار األساطري حول موانع احلمل احلديثة واقرتاهنا باالستخدام السابق واحلايل ملوانع احلمل يف صفوف السيدات يف املنيا، بصعيد مرص.
الصحية املراكز عىل يرتددن ممن سنة 49 و 18 بني أعامرهن ترتاوح متزوجة مرصية سيدة 1212 املقطعية الدراسة هذه شملت البحث: طرق احلرضية والريفية يف املنيا. وُجعت البيانات باستخدام استبيان منظم قائم عىل املقابالت، وُحللت البيانات باستخدام حتليل االنحدار اللوجستي؛
وتم احتساب نسبة االحتامل وفرتات الثقة بنسبة 95%.النتائج: كان لدى غالبية النساء )%88.7) مفهوما واحدا أو أكثر مغلوطا بشأن موانع احلمل. وكان أكثر تلك املفاهيم املغلوطة شيوعا هو أن حبوب تنظيم النسل تسبب الرسطان وأن وسائل منع احلمل الرمحية يمكنها اخرتاق الرحم والوصول إىل القلب. وتبني أن االستخدام احلايل حلبوب تنظيم النسل ووسائل منع احلمل الرمحية كان منخفضا بصورة جوهرية يف صفوف النساء اللوايت لدهين معتقدات خاطئة أكثر من غريهن من النساء اللوايت بعدد التوايل. وارتبط االقتناع aOR = 0.50; 95% CI: 0.34–0.76 ((aOR = 0.59; 95% CI: 0.37–0.90))، عىل املعتقدات؛ مل تكن لدهين تلك aOR = 0.72; 95% CI: 0.57–0.96((، (aOR = 0.61; أكرب من اخلرافات بانخفاض أكرب يف احتامالت استخدام السابق حلبوب تنظيم النسل:) aOR = 0.43; 95% CI: 0.24–0.63 (CI: 0.43–0.91 %95)) يف صفوف النساء اللوايت لدهين معتقد واحد، واثنني، وثالثة، وأربعة معتقدات أو

EMHJ – Vol. 26 No. 4 – 2020Research article
424
References1. El-Zanaty F, Way A. Egypt demographic and health survey, 7th ed. Cairo: Ministry of Health and Population, National Population
Council Press; 2014.
2. CAPMAS 2019 Demographic indicators. Cairo: Central Agency for Public Mobilization and Statistics (CAPMAS); 2019.
3. Practice guidelines for family physicians. In: Family planning. Second edition. Cairo: Ministry of Health and Population; 2004:27–47.
4. Eshak ES, Sayed SI, Kamel EG, El-Sheref MA. Non-medical predictors for ever and current use of contraceptives among women in Minia, Upper Egypt. J Public Health. 2018;26:663–71. https://doi.org/10.1007/s10389-018-0912-x
5. Tyrer L. Introduction of the pill and its impact. Contraception. 1999;59:11S–16S. https://doi.org/10.1016/s0010-7824(98)00131-0
6. Contraceptive myths and counseling messages. Baltimore: INFO Project, Johns Hopkins Bloomberg School of Public Health and International Planned Parenthood Federation; 2007 (https://www.k4health.org/toolkits/iud/contraceptive-myths-and-coun-seling-messages, accessed 3 December 2019).
7. Russo JA, Miller E, Gold M A. Myths and misconceptions about long-acting reversible contraception (LARC). J Adolesc Health. 2013;52(4 Suppl):S14–21. https://doi.org/10.1016/j.jadohealth.2013.02.003
8. Eram U. Myths and beliefs about contraceptive methods: a review article. Saudi J Med Pharm Sci. 2017;3(1):9–12. DOI: 10.21276/sjmps.2017.3.2
9. ESHRE Capri Workshop Group. Noncontraceptive health benefits of combined oral contraception, Hum Reprod Update. 2005;11(5):513–25. https://doi.org/10.1093/humupd/dmi019
10. Radovich E, el-Shitany A, Sholkamy H, Benova L. Rising up: Fertility trends in Egypt before and after the revolution. PLoS One. 2018;13(1):e0190148. https://doi.org/10.1371/journal.pone.0190148
11. Gueye A, Speizer IS, Corroon M, Okigbo CC. Belief in family planning myths at the individual and community levels and mod-ern contraceptive use in urban Africa. Int Perspect Sex Reprod Health. 2015;41(4):191–9. https://doi.org/10.1363/4119115
12. Sakara A, Namoog MY, Badu-Nyarko SK. Misconceptions and rumours about family planning among Moslem males in Tamale Metropolis, Ghana. Glob J Interdiscip Soc Sci. 2014;4(1):9–14. http://197.255.68.203/handle/123456789/7898
13. DeClerque J, Tsui AO, Abul-Ata MF, Barcelona D. Rumor, misinformation and oral contraceptive use in Egypt. Soc Sci Med. 1986;23(1):83–92. https://doi.org/10.1016/0277-9536(86)90327-8
14. Private Practitioner Family Planning Project. Family planning dialogue. Rumors of contraception: myths vs facts. New Egypt J Med. 1990;4(2 Suppl):1–21.
15. Grubb GS. Women’s perceptions of the safety of the pill: a survey in eight developing countries. J Biosoc Sci. 1987;19(3):313–21. https://doi.org/10.1017/s0021932000016965
16. Paz Soldan V A. How family planning ideas are spread within social groups in rural Malawi. Stud Fam Plan. 2004;35(4):275–90. https://doi.org/10.1111/j.0039-3665.2004.00031.x
17. Hindin MJ, McGough LJ, Adanu R M. Misperceptions, misinformation and myths about modern contraceptive use in Ghana. J Fam Plan Reprod Health Care. 2014;40(1):30–5. https://doi.org/10.1136/jfprhc-2012-100464
18. Shubhra A, Najam R, Agarwal A. A clinical study on social stigma and trends of contraception at a tertiary care centre. Int J Re-prod Contracept, Obstet Gynecol. 2016;5(12):4271–4. https://doi.org/10.18203/2320-1770.ijrcog20164326
19. Chipeta EK, Chimwaza W, Kalilani-Phiri L. Contraceptive knowledge, beliefs and attitudes in rural Malawi: misinformation, misbeliefs and misperceptions. Malawi Med J. 2010;22(2):38–41. https://doi.org/10.4314/mmj.v22i2.58790
20. Ankomah A, Anyanti J, Oladosu M. Myths, misinformation, and communication about family planning and contraceptive use in Nigeria. Open Access J Contracept. 2011;2(1):95–105. https://doi.org/10.2147/oajc.s20921
21. Hamani Y, Sciaki-Tamir Y, Deri-Hasid R, Miller-Pogrund T, Milwidsky A, Haimov-Kochman R. Misconceptions about oral contra-ception pills among adolescents and physicians. Hum Reprod. 2007;22(12):3078–83. https://doi.org/10.1093/humrep/dem259
22. Ali SH, Abass IM. Misconceptions about oral contraceptive pill used among women at primary health care centers in Holy Kar-bala city. IOSR J Nurs Health Sci. 2015;4(6):70–7. https://doi.org/10.9790/1959-04637077
23. Ali MM, Sadler RK, Cleland J, Ngo TD, Shah I H. Long-term contraceptive protection, discontinuation and switching behaviour: intrauterine device (IUD) use dynamics in 14 developing countries. London: World Health Organization and Marie Stopes Inter-national; 2011.
أكثر، يف مقابل النساء اللوايت ليست لدهين أية معتقدات مغلوطة عىل اإلطالق. االستنتاجات: تشيع املفاهيم املغلوطة حول موانع احلمل بني السيدات يف املنيا وقد يؤثر ذلك تأثريا بالغا عىل اختيارهن واستخدامهن لوسيلة منع
احلمل. ويوىص برضورة تفنيد برامج الصحة اإلنجابية لتلك املفاهيم املغلوطة.

Research article
425
EMHJ – Vol. 26 No. 4 – 2020
24. Robinson N, Moshabela M, Owusu-Ansah L, Kapungu C, Geller S. Barriers to intrauterine device uptake in a rural setting in Ghana. Health Care Women Int. 2016;37(2):197–215. https://doi.org/10.1080/07399332.2014.946511
25. Hutchinson PL, Meekers D. Estimating causal effects from family planning health communication campaigns using panel data: the “your health, your wealth” campaign in Egypt. PLoS One. 2012;7(9):e46138. https://doi.org/10.1371/journal.pone.0046138
EMHJ – Vol. 26 No. 4 – 2020Research article
426
Impact of the 2017 American College of Cardiology/American Heart Association Hypertension Guideline on the prevalence of hypertension in young Saudi womenMaha Al-Mohaissen,1 Qumasha Al-Obaid,1 Wafa AlGhamdi,1 Haneen Al-Alyani,1 Sheima Dahman,1 Nora Al-Wahhabi,1 Noura Al-Awaji 1 and Terry Lee 2
1Department of Clinical Sciences, College of Medicine, Princess Nourah bint Abdulrahman University, Riyadh, Saudi Arabia (Correspondence to: Maha Al-Mohaissen: [email protected]). 2Centre for Health Evaluation and Outcome Sciences, Vancouver, British Columbia, Canada.
IntroductionThe American College of Cardiology/American Heart As-sociation (ACC/AHA) recently redefined the thresholds for the diagnosis of hypertension in adults. The new di-agnostic cut-off value of ≥130/80 mmHg is to replace the previous JNC7 threshold of ≥ 140/90 mmHg for the diag-nosis of hypertension (1). While the 2017/ACC/AHA guide-line recommends lifestyle modification for all hyperten-sives, it only recommends blood pressure (BP)-lowering medications for adults with stage 1 hypertension, for secondary prevention in patients with clinical cardiovas-cular disease or for primary prevention in adults with an estimated 10-year atherosclerotic cardiovascular disease risk of ≥ 10%, and those with stage 2 hypertension (1).
Accumulating evidence has shown that reduction of systolic BP to a target of < 130 mmHg significantly decreases the risk of myocardial infarction, stroke, heart failure and major cardiovascular events in adults (2).
Implementation of the 2017/ACC/AHA hypertension guideline is, therefore, expected to translate into reduction in cardiovascular mortality and morbidity (3). However, compared to JNC7, the new lower 2017/ACC/AHA diagnostic thresholds will increase the disease burden worldwide, annual costs of antihypertensive treatment, the proportion of uncontrolled hypertensives, (3–6), and likely the number of adverse events among treated patients (3). Decreasing the diagnostic thresholds for hypertension is also expected to increase the number of statin-eligible adults according to the 2016 cholesterol guideline (7). Although not all authorities have adopted the ≥ 130/80 mmHg thresholds, their diagnostic cut-off values and goals have been reduced, particularly in high risk patients (8). With the change in hypertension definition, estimation of the new prevalence of hypertension with the lower cut-off values in communities, therefore, becomes paramount and data are accumulating from different sources globally (4–6,9–11).
AbstractBackground: The diagnostic criteria for hypertension have recently been redefined by the American College of Cardiolo-gy/American Heart Association (ACC/AHA). Data on the new prevalence of hypertension in different countries are emerg-ing, but none, to date, from Saudi Arabia.Aims: This study aimed to determine the impact of the 2017 ACC/AHA hypertension guideline on the prevalence and de-terminants of hypertension in young Saudi women. Methods: 518 female college students, 17–29 years of age were prospectively enrolled in a survey during the period from January 1, 2016, to April 15, 2016 at Princess Nourah University. The participants completed a previously validated ques-tionnaire, that assessed their risk factors for hypertension, and their blood pressure, weight and height were measured.Results: Application of the 2017 ACC/AHA diagnostic criteria resulted in approximately 7-fold increase in the prevalence of hypertension, from 4.1% to 27.1% (P < 0.001). At a cut-off value of ≥140/90, hypertension was significantly associated with increased age, increased body mass index (BMI), increased heart rate, history of chronic illnesses, prior diagnosis with diabetes mellitus and family history of hypertension. Whereas, with the ≥130/80 cut-off value, only increased BMI and heart rate were significant predictors (P < 0.001). Conclusion: The prevalence of hypertension markedly increased among young adult Saudi women with the 2017 ACC/AHA classification for hypertension, and the main predictors were increased BMI and heart rate. Further studies on the new prevalence and predictors of hypertension in the Saudi population are warranted. This information is important for healthcare authorities to plan cost effective screening, prevention and control programmes.Keywords: hypertension, ACC/AHA diagnostic criteria, prevalence, predictors, women
Citation: Al-Mohaissen M; Al-Obaid Q; AlGhamdi W; Al-Alyani H; Dahman S; Al-Wahhabi N; et al. Impact of the 2017 American College of Cardi-ology/American Heart Association Hypertension Guideline on the prevalence of hypertension in young Saudi women. East Mediterr Health J. 2020;26(4):426–434. https://doi.org/10.26719/emhj.19.080
Received: 03/07/18; accepted: 26/02/19
Copyright © World Health Organization (WHO) 2020. Open Access. Some rights reserved. This work is available under the CC BY-NC-SA 3.0 IGO li-cense (https://creativecommons.org/licenses/by-nc-sa/3.0/igo).

Research article
427
EMHJ – Vol. 26 No. 4 – 2020
Studies on the prevalence of hypertension in Saudi Arabia have all used the previous diagnostic thresholds of ≥ 140/90 mmHg. A prevalence of 26.1–27.2% among Saudis aged ≥ 30 years was found (12,13) and 15.2% in those aged 15 years or older (13). For the 15–24 years age group, a prevalence up to 8.8% was reported (14). These estimates are expected to be higher had the ≥ 130/80 mmHg thresholds been used. The magnitude of increase in the prevalence in hypertension in SA with the new ACC/AHA guideline is unknown to date.
In this study we aimed to assess the effect of the 2017/ACC/AHA hypertension guideline on the prevalence of hypertension and predictors of hypertension in young Saudi women.
MethodsStudy populationWe re-analysed the data of 518 adult Saudi females aged 17–29 years who participated in a hypertension survey conducted in 2016 on undergraduate and postgraduate students at Princess Nourah bint Abdulrahman Universi-ty, Riyadh. We evaluated the change in the prevalence of hypertension among these young women following the introduction of the 2017/ACC/AHA guideline using the new thresholds (15).
The participants were enrolled prospectively during the period from 1 January 2016 to 15 April 2016. The sampling is detailed in the original study (15). With 530 participants, the estimated prevalence would be expected to have a precision of 2% with alpha 0.05 (16). Those diagnosed with cardiac disease and pregnant women were excluded.
Questionnaire and data collectionThe questionnaire and method of data collection has been described previously (15). In brief, following approval of the study by our Institutional Review Board, the students were invited to participate in the study. Participation was voluntary, and the study followed the principles of the Helsinki Declaration. An anonymous self-administered questionnaire was distributed (13) [the questionnaire was part of the Saudi Health Interview Survey (17)]. The final questionnaire comprised 65 questions assessing sociode-mographic characteristics, BP history and risk factors for hypertension.
The participants’ BP, heart rate, weight, and height were measured and recorded on entry to the study. For BP measurement, we followed The National Health and Nutrition Examination Survey instructions. The Omron M6 Comfort (HEM7223-E) automated BP device was used. Three brachial BP readings were taken at 5 minute intervals for each participant while resting. The first reading was discarded and the second and third readings were averaged and recorded. In cases where only 2 readings were available, the second reading was recorded (18).
Statistical analysisData analysis was performed using SAS, version 9.4. Con-tinuous variables are reported as means and standard deviations (or medians and interquartile ranges as ap-propriate) and categorical variables as numbers and per-centages. Comparisons between the hypertension and normal groups were performed using the Chi-squared test, Fisher’s exact test, t-test, or the Wilcoxon rank sum test as appropriate. We compared the difference in the prevalence of hypertension as diagnosed via the 2017/ACC/AHA and the JNC7 guidelines using McNemar’s test (due to matched pairs of women across the 2 guidelines). A P-value < 0.05 was considered statistically significant.
ResultsA total of 530 students were enrolled in the initial survey. Twelve participants (2.3%) had undetermined BP status (BP measurements were taken but they omitted to answer the question regarding being on treatment for hyperten-sion) and were excluded. The baseline characteristics of the remaining 518 participants are displayed in Table 1. Table 2 shows the new analysis of the BP and heart rate results according to the new2017 /ACC/AHA guidelines. All the hypertensives (those on treatment for hyperten-sion or with BP ≥ 130/80) had elevated their diastolic BP (mean 83.3 mmHg, range 73.5–107.0 mmHg). None of the hypertensive subjects had a systolic BP ≥ 130 mmHg.
The prevalence of hypertension in the study population according to the2017 /ACC/AHA and JNC7 guidelines is shown in Table 3. According to the 2017/ACC/AHA classification, 27.1% of participants would be classified as having hypertension, which was significantly higher than the prevalence of 4.1% if the JNC7 classification was applied (P < 0.001). We found that 85% of the hypertensives in the study had stage 1 hypertension (systolic BP = 130–139 mmHg and/or diastolic BP = 80–89 mmHg), and 15% had stage 2 hypertension (BP ≥ 140/90 mmHg). All of the 119 participants with stage 1 hypertension according to the 2017/ACC/AHA guideline also fulfilled the JNC7 criteria for prehypertension (systolic BP = 120–139 mmHg and or diastolic BP = 80–89 mmHg) (Table 3).
Table 4 shows the predictors of hypertension in the study population according to the JNC7 and 2017/ACC/AHA guidelines. At a cut-off value of ≥ 140/90, significant predictors of hypertension were increased age, body mass index (BMI) and heart rate; known diabetes; and family history of hypertension. Prior diagnosis of chronic disease was more common in the hypertension group, 23.8% vs 10.3% (P = 0.05). The percentage of participants who exercised regularly was lower in the hypertension group but this was not statistically significant (23.1% vs 30.0%, P = 0.592). None of the dietary constituents had an association with hypertension. When analysed using the 2017/ACC/AHA cut-offs, only BMI and heart rate emerged as statistically significant. There was no association between hypertension and other established risk factors for hypertension, including diabetes mellitus, age,
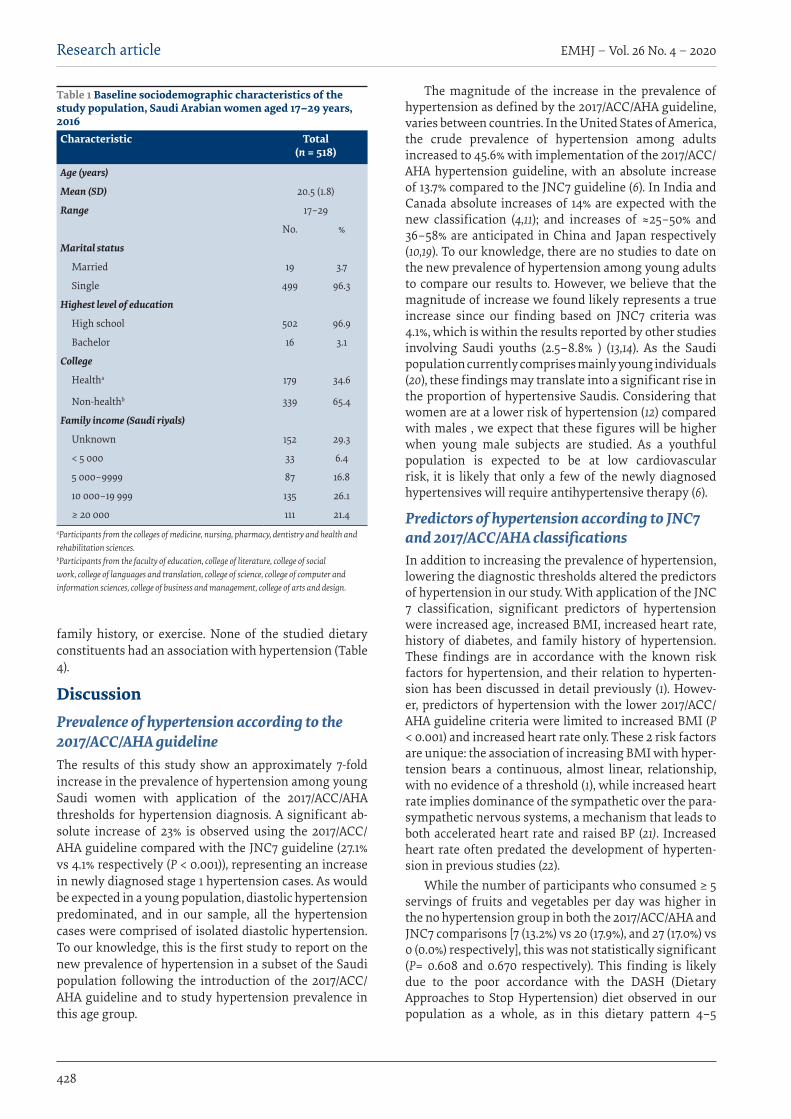
EMHJ – Vol. 26 No. 4 – 2020Research article
428
family history, or exercise. None of the studied dietary constituents had an association with hypertension (Table 4).
DiscussionPrevalence of hypertension according to the 2017/ACC/AHA guidelineThe results of this study show an approximately 7-fold increase in the prevalence of hypertension among young Saudi women with application of the 2017/ACC/AHA thresholds for hypertension diagnosis. A significant ab-solute increase of 23% is observed using the 2017/ACC/AHA guideline compared with the JNC7 guideline (27.1% vs 4.1% respectively (P < 0.001)), representing an increase in newly diagnosed stage 1 hypertension cases. As would be expected in a young population, diastolic hypertension predominated, and in our sample, all the hypertension cases were comprised of isolated diastolic hypertension. To our knowledge, this is the first study to report on the new prevalence of hypertension in a subset of the Saudi population following the introduction of the 2017/ACC/AHA guideline and to study hypertension prevalence in this age group.
The magnitude of the increase in the prevalence of hypertension as defined by the 2017/ACC/AHA guideline, varies between countries. In the United States of America, the crude prevalence of hypertension among adults increased to 45.6% with implementation of the 2017/ACC/AHA hypertension guideline, with an absolute increase of 13.7% compared to the JNC7 guideline (6). In India and Canada absolute increases of 14% are expected with the new classification (4,11); and increases of ≈25–50% and 36–58% are anticipated in China and Japan respectively (10,19). To our knowledge, there are no studies to date on the new prevalence of hypertension among young adults to compare our results to. However, we believe that the magnitude of increase we found likely represents a true increase since our finding based on JNC7 criteria was 4.1%, which is within the results reported by other studies involving Saudi youths (2.5–8.8% ) (13,14). As the Saudi population currently comprises mainly young individuals (20), these findings may translate into a significant rise in the proportion of hypertensive Saudis. Considering that women are at a lower risk of hypertension (12) compared with males , we expect that these figures will be higher when young male subjects are studied. As a youthful population is expected to be at low cardiovascular risk, it is likely that only a few of the newly diagnosed hypertensives will require antihypertensive therapy (6).
Predictors of hypertension according to JNC7 and 2017/ACC/AHA classificationsIn addition to increasing the prevalence of hypertension, lowering the diagnostic thresholds altered the predictors of hypertension in our study. With application of the JNC 7 classification, significant predictors of hypertension were increased age, increased BMI, increased heart rate, history of diabetes, and family history of hypertension. These findings are in accordance with the known risk factors for hypertension, and their relation to hyperten-sion has been discussed in detail previously (1). Howev-er, predictors of hypertension with the lower 2017/ACC/AHA guideline criteria were limited to increased BMI (P < 0.001) and increased heart rate only. These 2 risk factors are unique: the association of increasing BMI with hyper-tension bears a continuous, almost linear, relationship, with no evidence of a threshold (1), while increased heart rate implies dominance of the sympathetic over the para-sympathetic nervous systems, a mechanism that leads to both accelerated heart rate and raised BP (21). Increased heart rate often predated the development of hyperten-sion in previous studies (22).
While the number of participants who consumed ≥ 5 servings of fruits and vegetables per day was higher in the no hypertension group in both the 2017/ACC/AHA and JNC7 comparisons [7 (13.2%) vs 20 (17.9%), and 27 (17.0%) vs 0 (0.0%) respectively], this was not statistically significant (P= 0.608 and 0.670 respectively). This finding is likely due to the poor accordance with the DASH (Dietary Approaches to Stop Hypertension) diet observed in our population as a whole, as in this dietary pattern 4–5
Table 1 Baseline sociodemographic characteristics of the study population, Saudi Arabian women aged 17–29 years, 2016Characteristic Total
(n = 518)
Age (years)
Mean (SD) 20.5 (1.8)
Range 17–29
No. %
Marital status
Married 19 3.7
Single 499 96.3
Highest level of education
High school 502 96.9
Bachelor 16 3.1
College
Healtha 179 34.6
Non-healthb 339 65.4
Family income (Saudi riyals)
Unknown 152 29.3
< 5 000 33 6.4
5 000–9999 87 16.8
10 000–19 999 135 26.1
≥ 20 000 111 21.4aParticipants from the colleges of medicine, nursing, pharmacy, dentistry and health and rehabilitation sciences. bParticipants from the faculty of education, college of literature, college of social work, college of languages and translation, college of science, college of computer and information sciences, college of business and management, college of arts and design.
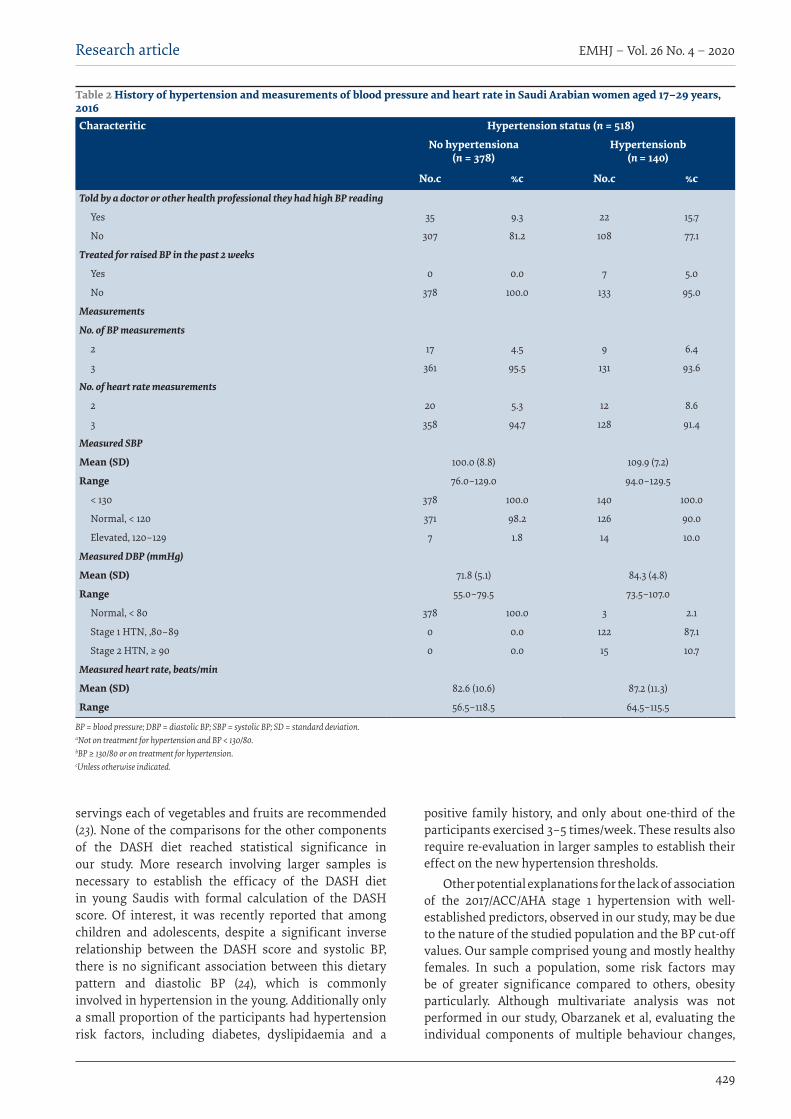
Research article
429
EMHJ – Vol. 26 No. 4 – 2020
servings each of vegetables and fruits are recommended (23). None of the comparisons for the other components of the DASH diet reached statistical significance in our study. More research involving larger samples is necessary to establish the efficacy of the DASH diet in young Saudis with formal calculation of the DASH score. Of interest, it was recently reported that among children and adolescents, despite a significant inverse relationship between the DASH score and systolic BP, there is no significant association between this dietary pattern and diastolic BP (24), which is commonly involved in hypertension in the young. Additionally only a small proportion of the participants had hypertension risk factors, including diabetes, dyslipidaemia and a
positive family history, and only about one-third of the participants exercised 3–5 times/week. These results also require re-evaluation in larger samples to establish their effect on the new hypertension thresholds.
Other potential explanations for the lack of association of the 2017/ACC/AHA stage 1 hypertension with well-established predictors, observed in our study, may be due to the nature of the studied population and the BP cut-off values. Our sample comprised young and mostly healthy females. In such a population, some risk factors may be of greater significance compared to others, obesity particularly. Although multivariate analysis was not performed in our study, Obarzanek et al, evaluating the individual components of multiple behaviour changes,
Table 2 History of hypertension and measurements of blood pressure and heart rate in Saudi Arabian women aged 17–29 years, 2016Characteritic Hypertension status (n = 518)
No hypertensiona (n = 378)
Hypertensionb (n = 140)
No.c %c No.c %c
Told by a doctor or other health professional they had high BP reading
Yes 35 9.3 22 15.7
No 307 81.2 108 77.1
Treated for raised BP in the past 2 weeks
Yes 0 0.0 7 5.0
No 378 100.0 133 95.0
Measurements
No. of BP measurements
2 17 4.5 9 6.4
3 361 95.5 131 93.6
No. of heart rate measurements
2 20 5.3 12 8.6
3 358 94.7 128 91.4
Measured SBP
Mean (SD) 100.0 (8.8) 109.9 (7.2)
Range 76.0–129.0 94.0–129.5
< 130 378 100.0 140 100.0
Normal, < 120 371 98.2 126 90.0
Elevated, 120–129 7 1.8 14 10.0
Measured DBP (mmHg)
Mean (SD) 71.8 (5.1) 84.3 (4.8)
Range 55.0–79.5 73.5–107.0
Normal, < 80 378 100.0 3 2.1
Stage 1 HTN, ,80–89 0 0.0 122 87.1
Stage 2 HTN, ≥ 90 0 0.0 15 10.7
Measured heart rate, beats/min
Mean (SD) 82.6 (10.6) 87.2 (11.3)
Range 56.5–118.5 64.5–115.5
BP = blood pressure; DBP = diastolic BP; SBP = systolic BP; SD = standard deviation. aNot on treatment for hypertension and BP < 130/80. bBP ≥ 130/80 or on treatment for hypertension. cUnless otherwise indicated.

EMHJ – Vol. 26 No. 4 – 2020Research article
430
found that while several lifestyle behaviour changes are important for reduction of BP, they were difficult to detect when weight was included in multivariate models (25). It is also important to note that, the “blood pressure zone” termed prehypertension in the JNC7 guideline is currently unequally split in the 2017/ACC/AHA classification between high normal BP and stage 1 hypertension. In our study, 100% of those with stage 1 hypertension according to the 2017/ACC/AHA guide also fulfilled the criteria for prehypertension. Therefore, it is our expectation that many of the pathophysiological processes and clinical characteristics of prehypertension may now be applicable to the 2017/ACC/AHA stage 1 hypertension, which constitutes the majority of hypertensives in our sample. Prehypertension is characterized by autonomic and metabolic dysfunction (26) and has been correlated with the metabolic syndrome, dyslipidaemia, diabetes, obesity (27)/ increased BMI, high visceral adipose index, and increased heart rate (28). Autonomic dysfunction coexists with prehypertension and is closely related to changes in BP and lipid metabolism (26). Increased resting heart rate was associated with higher blood pressure, lower pulse pressure and increased risk of prehypertension and hypertension for males and females, and waist–height ratio, as a measure of abdominal obesity, further increased this association (29). Our results suggest that the autonomic and metabolic dysfunction observed with prehypertension may continue to manifest in the new stage 1 hypertension. Although prehypertension is considered one of the predictors of the development of hypertension (27), not all people with prehypertension progress to develop hypertension as defined by JNC7 (30). The current hypertension classification is based on shared cardiovascular outcomes rather than pathophysiology. Further studies on the associations if hypertension the new classification are warranted.
Hypertension in young SaudisStudies from Saudi Arabia have shown a progressive build-up of risk factors for hypertension at an early age. The prevalence of hypertension risk factors among Sau-
di schoolchildren has reached epidemic levels due to the adoption of unhealthy lifestyle habits, particularly seden-tary lifestyle and poor diet (31). It is estimated that 34.2% of Saudi schoolchildren have abnormal BMI (32). This figure increases to 48.4% mong university students (33), and further increases are expected with time (34). While many prior studies from Saudi Arabia have recommended focusing on the modifiable risk factors for hypertension as a preventive and therapeutic measure (15,31,33,35), this goal remains far from reach due to the huge gap between knowledge and attitudes and practices among young adults. Despite having good knowledge, few young Sau-dis actually adopt healthy lifestyle measures to reduce their cardiovascular risk (33).
In their recommendations on the management of obesity, the Canadian hypertension guidelines advise approaching weight loss management in a multidisciplinary fashion that includes behavioural intervention in addition to dietary education and promotion of physical activity (8). Concentrated efforts in training on healthy habits should be initiated in early childhood to increase their efficacy (31), improve children’s development, and prevent adulthood disease and disability (36). Parental involvement improves both children’s and parents’ behaviours (37). Development of family-based prevention programmes for obesity in children is therefore important (38).
Early detection of hypertension in young womenWith the evidence showing that lower BP values result in reduced mortality and morbidity (2), establishing the true prevalence of hypertension and its risk factors in the community, particularly among the young, becomes a necessity. This information is important for health care planning including early diagnosis, management and prevention campaigns, with the aim of reducing future hypertension and related complications (15). Women have a greater projected hypertension prevalence compared with men, particularly in the age groups 35–64 years (34), and had a greater risk for stroke compared with men. As
Table 3 Cross-tabulation of the blood pressure results among Saudi Arabian women aged 17–29 years, as defined by the JNC7 and 2017/ACC/AHA classificationsJNC7 2017/ACC/AHA Total
Normala Elevated BPb Stage 1 HTN Stage 2 HTNd
No. % No. % No. % No. % No. %Normala 371 100 0 – 0 – 0 – 371 71.6
Prehypertensione 0 – 7 5.6 119 94.4 0 – 126 24.4
HTNd 0 – 0 – 0 – 21 100 21 4.0
Total 371 71.6 7 1.4 119 23.0 21 4.0 518 100
BP = blood pressure; HTN = hypertension. Numbers in brackets were percentages within the subtotal under JNC7 or percentages within the total of 518 as appropriate. aBP< 120/80. bBP of 120–129/<80. cBP=130–139/80–89 mmHg and not on treatment for hypertension. dBP≥140/90 or on treatment for hypertension. eBP= 120–139/80–89.
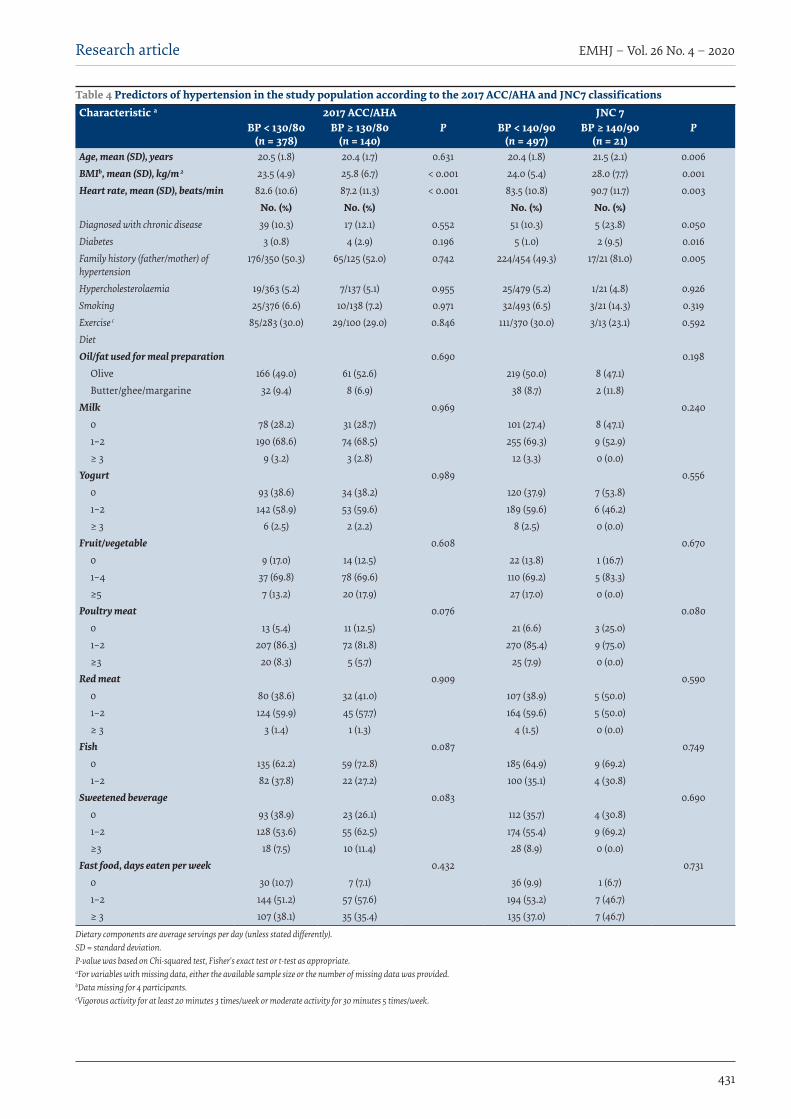
Research article
431
EMHJ – Vol. 26 No. 4 – 2020
Table 4 Predictors of hypertension in the study population according to the 2017 ACC/AHA and JNC7 classificationsCharacteristic a 2017 ACC/AHA JNC 7
BP < 130/80 (n = 378)
BP ≥ 130/80 (n = 140)
P BP < 140/90 (n = 497)
BP ≥ 140/90 (n = 21)
P
Age, mean (SD), years 20.5 (1.8) 20.4 (1.7) 0.631 20.4 (1.8) 21.5 (2.1) 0.006BMIb, mean (SD), kg/m 2 23.5 (4.9) 25.8 (6.7) < 0.001 24.0 (5.4) 28.0 (7.7) 0.001Heart rate, mean (SD), beats/min 82.6 (10.6) 87.2 (11.3) < 0.001 83.5 (10.8) 90.7 (11.7) 0.003
No. (%) No. (%) No. (%) No. (%)Diagnosed with chronic disease 39 (10.3) 17 (12.1) 0.552 51 (10.3) 5 (23.8) 0.050Diabetes 3 (0.8) 4 (2.9) 0.196 5 (1.0) 2 (9.5) 0.016Family history (father/mother) of hypertension
176/350 (50.3) 65/125 (52.0) 0.742 224/454 (49.3) 17/21 (81.0) 0.005
Hypercholesterolaemia 19/363 (5.2) 7/137 (5.1) 0.955 25/479 (5.2) 1/21 (4.8) 0.926Smoking 25/376 (6.6) 10/138 (7.2) 0.971 32/493 (6.5) 3/21 (14.3) 0.319Exercise c 85/283 (30.0) 29/100 (29.0) 0.846 111/370 (30.0) 3/13 (23.1) 0.592DietOil/fat used for meal preparation 0.690 0.198
Olive 166 (49.0) 61 (52.6) 219 (50.0) 8 (47.1)Butter/ghee/margarine 32 (9.4) 8 (6.9) 38 (8.7) 2 (11.8)
Milk 0.969 0.2400 78 (28.2) 31 (28.7) 101 (27.4) 8 (47.1)1–2 190 (68.6) 74 (68.5) 255 (69.3) 9 (52.9)≥ 3 9 (3.2) 3 (2.8) 12 (3.3) 0 (0.0)
Yogurt 0.989 0.5560 93 (38.6) 34 (38.2) 120 (37.9) 7 (53.8)1–2 142 (58.9) 53 (59.6) 189 (59.6) 6 (46.2)≥ 3 6 (2.5) 2 (2.2) 8 (2.5) 0 (0.0)
Fruit/vegetable 0.608 0.6700 9 (17.0) 14 (12.5) 22 (13.8) 1 (16.7)1–4 37 (69.8) 78 (69.6) 110 (69.2) 5 (83.3)≥5 7 (13.2) 20 (17.9) 27 (17.0) 0 (0.0)
Poultry meat 0.076 0.0800 13 (5.4) 11 (12.5) 21 (6.6) 3 (25.0)1–2 207 (86.3) 72 (81.8) 270 (85.4) 9 (75.0)≥3 20 (8.3) 5 (5.7) 25 (7.9) 0 (0.0)
Red meat 0.909 0.5900 80 (38.6) 32 (41.0) 107 (38.9) 5 (50.0)1–2 124 (59.9) 45 (57.7) 164 (59.6) 5 (50.0)≥ 3 3 (1.4) 1 (1.3) 4 (1.5) 0 (0.0)
Fish 0.087 0.7490 135 (62.2) 59 (72.8) 185 (64.9) 9 (69.2)1–2 82 (37.8) 22 (27.2) 100 (35.1) 4 (30.8)
Sweetened beverage 0.083 0.6900 93 (38.9) 23 (26.1) 112 (35.7) 4 (30.8)1–2 128 (53.6) 55 (62.5) 174 (55.4) 9 (69.2)≥3 18 (7.5) 10 (11.4) 28 (8.9) 0 (0.0)
Fast food, days eaten per week 0.432 0.7310 30 (10.7) 7 (7.1) 36 (9.9) 1 (6.7)1–2 144 (51.2) 57 (57.6) 194 (53.2) 7 (46.7)≥ 3 107 (38.1) 35 (35.4) 135 (37.0) 7 (46.7)
Dietary components are average servings per day (unless stated differently). SD = standard deviation. P-value was based on Chi-squared test, Fisher's exact test or t-test as appropriate. aFor variables with missing data, either the available sample size or the number of missing data was provided. bData missing for 4 participants. cVigorous activity for at least 20 minutes 3 times/week or moderate activity for 30 minutes 5 times/week.

EMHJ – Vol. 26 No. 4 – 2020Research article
432
hypertension is the most prevalent modifiable risk fac-tor for stroke globally in both sexes (39), efforts should be made to reduce or halt the projected rise in hypertension, particularly among women.
The new diagnostic cut-offs represent a challenge to the health care system in Saudi Arabia considering that with the previous classification, 57.8% of hypertensive Saudis were undiagnosed, and only 45% of treated hypertensives had controlled BP (13). The additional hypertension cases based on the new classification will increase the disease prevalence and management burden on the health care system (4).
LimitationsAlthough the majority of the hypertensives in our study had stage 1 hypertension, and were young women, who are expected to have a low risk profile (6), these women will constitute a burden to the health care system as they
will require education on nonpharmacological interven-tions and regular follow-up (1). Knowing the important predictors of hypertension in this subgroup will help fo-cus the management efforts in a cost–effective manner.
Another limitation in our study is that the questionnaire lacked a question on whether or not the participants had their BP measured recently. In our study, 77.1% of the hypertensives had never been told they had high BP reading. This number is significant considering that these values would have fallen in the prehypertension readings according to the previous JNC classification. One possible explanation may be that these participants (or some of them) were never screened for hypertension.
Funding: This research was funded by the Cardiovascu-lar Disease in Women Research Chair at Princess Nourah bint Abdulrahman University. (Grant No. CDW-2018-01).
Competing interests: None declared.
Impact des lignes directrices 2017 sur l’hypertension de l’American College of Cardiology/American Heart Association sur la prévalence de l’hypertension chez les jeunes femmes saoudiennesRésuméContexte : Les critères de diagnostic de l’hypertension ont récemment été redéfinis par l’American College of Cardiology/American Heart Association (ACC/AHA). Des données sur la nouvelle prévalence de l’hypertension dans différents pays commence à voir le jour, mais il n’y a, pour l’heure, aucune donnée pour l’Arabie saoudite. Objectifs : La présente étude avait pour objectif de déterminer l’impact des lignes directrices 2017 sur l’hypertension de l’ACC/AHA sur la prévalence et les déterminants de l’hypertension chez les jeunes femmes saoudiennes. Méthodes : 518 étudiantes de l’Université Princesse Nourah, âgées de 17 à 29 ans ont été recrutées de manière prospective pour participer à une enquête entre le 1er janvier et le 15 avril 2016. Les participantes ont rempli un questionnaire préalablement validé, qui évaluait les facteurs de risque de l’hypertension et indiquait leur tension artérielle, leur poids et leur taille.Résultats : L’application des critères de diagnostic définis par les lignes directrices 2017 sur l’hypertension de l’ACC/AHA s’est traduite par une multiplication approximative par 7 de la prévalence de l’hypertension, qui est passée de 4,1 % à 27,1 % (p < 0,001). À une valeur seuil supérieure ou égale à 140/90, l’hypertension était significativement associée à l’âge, à un indice de masse corporelle (IMC) plus élevé, à une fréquence cardiaque accrue, à des antécédents de maladies chroniques, à un diagnostic antérieur de diabète sucré et à des antécédents familiaux d’hypertension. En revanche, avec une valeur seuil supérieure ou égale à 130/80, seule l’augmentation de l’IMC et de la fréquence cardiaque constituait des facteurs prédictifs significatifs (p < 0,001). Conclusion : La prévalence de l’hypertension a nettement augmenté chez les jeunes femmes adultes saoudiennes suite à l’application des lignes directrices 2017 de l’ACC/AHA sur l’hypertension. Les principaux facteurs prédictifs étaient l’augmentation de l’IMC et de la fréquence cardiaque. Des études supplémentaires sur les nouvelles données concernant la prévalence et les facteurs prédictifs de l’hypertension dans la population saoudienne sont nécessaires. Ces informations sont importantes pour les autorités sanitaires afin de prévoir la mise en place de programmes de dépistage, de prévention de l’hypertension et de lutte contre cette affection ayant un bon rapport coût-efficacité.
األثر الناجم عن املبدأ التوجيهي املعني بارتفاع ضغط الدم الصادر عام 2017 عن الكلية األمريكية ألمراض القلب/اجلمعية األمريكية للقلب عىل معدل انتشار ارتفاع ضغط الدم يف صفوف الشابات السعوديات
مها املحيسن، قامشة العبيد، وفاء الغامدي، حنني العلياين، شيامء دمهان، نورا الوهايب، نورا العوجي، تريي يلاخلالصة
اخللفية: قامت الكلية األمريكية ألمراض القلب/اجلمعية األمريكية للقلب مؤخرا بإعادة تعريف معايري تشخيص ارتفاع ضغط الدم. وأخذت العربية اململكة من بيانات اآلن حتى تتضمن مل أهنا غري متفرقة، ُبلدان يف الدم ضغط الرتفاع اجلديدة االنتشار معدالت حول تظهر البيانات
السعودية.
Research article
433
EMHJ – Vol. 26 No. 4 – 2020
References1. Whelton PK, Carey RM, Aronow WS, Casey DE, Jr., Collins KJ, Dennison Himmelfarb C, et al. 2017 ACC/AHA/AAPA/ABC/ACPM/
AGS/APhA/ASH/ASPC/NMA/PCNA Guideline for the prevention, detection, evaluation, and management of high blood pressure in adults: executive summary: a report of the American College of Cardiology/American Heart Association Task Force on Clinical Practice Guidelines. Hypertension. 2018;71(6):1269–324. https://doi.org/10.1161/HYP.0000000000000066
2. Reboussin DM, Allen NB, Griswold ME, Guallar E, Hong Y, Lackland DT, et al. Systematic Review for the 2017 ACC/AHA/AAPA/ABC/ACPM/AGS/APhA/ASH/ASPC/NMA/PCNA Guideline for the prevention, detection, evaluation, and management of high blood pressure in adults: a report of the American College of Cardiology/American Heart Association Task Force on Clinical Prac-tice Guidelines. J Am Coll Cardiol. 2018;71(19):2176–98. https://doi.org/10.1016/j.jacc.2017.11.004
3. Bundy JD, Mills KT, Chen J, Li C, Greenland P, He J. Estimating the association of the 2017 and 2014 hypertension guidelines with cardiovascular events and deaths in us adults: an analysis of national data. JAMA Cardiol. 2018 Jul 1;3(7):572–81. doi:10.1001/ja-macardio.2018.1240
4. Wander GS, Ram CVS. Global Impact of 2017 American Heart Association/American College of Cardiology hypertension guide-lines: a perspective from India. Circulation. 2018;137(6):549–50. https://doi.org/10.1161/CIRCULATIONAHA.117.032877
5. Vaucher J, Marques-Vidal P, Waeber G, Vollenweider P. Population impact of the 2017 ACC/AHA guidelines compared with the 2013 ESH/ESC guidelines for hypertension management. Eur J Prev Cardiol. 2018 Jul;25(10):1111–3. doi:10.1177/2047487318768938
6. Muntner P, Carey RM, Gidding S, Jones DW, Taler SJ, Wright JT, Jr., et al. Potential US population impact of the 2017 ACC/AHA high blood pressure guideline. Circulation. 2018;137(2):109–18. https://doi.org/10.1161/CIRCULATIONAHA.117.032582
7. Egan BM, Li J, Davis RA, Fiscella KA, Tobin JN, Jones DW, et al. Differences in primary cardiovascular disease prevention between the 2013 and 2016 cholesterol guidelines and impact of the 2017 hypertension guideline in the United States. J Clin Hy-pertens (Greenwich). 2018 Jun;20(6):991–1000. doi:10.1111/jch.13314
8. Nerenberg KA, Zarnke KB, Leung AA, Dasgupta K, Butalia S, McBrien K, et al. Hypertension Canada’s 2018 Guidelines for Di-agnosis, Risk Assessment, Prevention, and Treatment of Hypertension in Adults and Children. Can J Cardiol. 2018;34(5):506-25. https://doi.org/10.1016/j.cjca.2018.02.022
9. Vaduganathan M, Pareek M, Qamar A, Pandey A, Olsen MH, Bhatt DL. Baseline blood pressure, the 2017 ACC/AHA high blood pressure guidelines, and long-term cardiovascular risk in SPRINT. Am J Med. 2018 Aug;131(8):956–60. doi:10.1016/j.am-jmed.2017.12.049
10. Wang JG, Liu L. Global Impact of 2017 American College of Cardiology/American Heart Association hypertension guidelines: a perspective from China. Circulation. 2018;137(6):546–8. https://doi.org/10.1161/CIRCULATIONAHA.117.032890
11. Schiffrin EL. Global Impact of the 2017 American College of Cardiology/American Heart Association hypertension guidelines: a perspective from Canada. Circulation. 2018;137(9):883–5. https://doi.org/10.1161/CIRCULATIONAHA.117.032849
12. Al-Nozha MM, Abdullah M, Arafah MR, Khalil MZ, Khan NB, Al-Mazrou YY, et al. Hypertension in Saudi Arabia. Saudi Med J. 2007;28(1):77–84. PMID:17206295
13. El Bcheraoui C, Memish ZA, Tuffaha M, Daoud F, Robinson M, Jaber S, et al. Hypertension and its associated risk factors in the Kingdom of Saudi Arabia, 2013: a national survey. Int J Hypertens. 2014;2014:564679. https://doi.org/10.1155/2014/564679
14. Saeed AA, Al-Hamdan NA, Bahnassy AA, Abdalla AM, Abbas MA, Abuzaid LZ. Prevalence, awareness, treatment, and control of hypertension among Saudi adult population: a national survey. Int J Hypertens. 2011;2011:174135. https://doi.
األمريكية الكلية عن 2017 عام الصادر الدم ضغط بارتفاع املعني التوجيهي املبدأ عن الناجم األثر حتديد إىل الدراسة هذه هدفت األهداف: ألمراض القلب/اجلمعية األمريكية للقلب عىل معدل انتشار وحمددات ارتفاع ضغط الدم يف صفوف الشابات السعوديات.
طرق البحث: استبق الدراسة تسجيل 518 طالبة جامعية ترتاوح أعامرهن بني17 و 29 سنة يف مسح ُأجري يف الفرتة من 1 يناير/كانون الثاين 2016 وحتى 15 أبريل/نيسان 2016 يف جامعة األمرية نورة بنت عبد الرمحن. واستكملت املشاركات استبيانا جماز مسبقا هدف إىل حتديد عوامل خطر
إصابتهن بارتفاع ضغط الدم، وقياس ضغط الدم لدهين، وكذلك قياس أوزاهنن وأطواهلن.النتائج: أسفر استخدام معايري تشخيص الكلية األمريكية ألمراض القلب/اجلمعية األمريكية للقلب عن وجود زيادة يف معدل انتشار ارتفاع ضغط الدم بمقدار 7 أضعاف تقريبا، إذ ارتفعت النسبة من %4.1 إىل P < 0.001( 27.1%(. وعند وصول القيمة احلدية إىل 90/140 أو أعىل، بدا االرتباط م العمر، وزيادة منسب كتلة اجلسم، وزيادة رسعة القلب، وتاريخ اإلصابة بأمراض مزمنة، والتشخيص املسبق واضحا بني ارتفاع ضغط الدم وتقدُّبالسكرّي، وتاريخ اإلصابة بارتفاع ضغط الدم يف األرسة. وعندما بلغت القيمة احلدية 80/130 أو أعىل، كانت زيادة منسب كتلة اجلسم وزيادة
.)P < 0.001( رسعة القلب العاملني امُلنبئنْي الوحيدْين املرتبطنْي بارتفاع ضغط الدماالستنتاج: زاد معدل انتشار ارتفاع ضغط الدم بصورة ملحوظة يف صفوف الشابات السعوديات البالغات وفق تصنيف الكلية األمريكية ألمراض القلب/اجلمعية األمريكية للقلب الصادر عام 2017 بشأن ارتفاع ضغط الدم، ومتثلت العوامل الرئيسية املنبِئة يف زيادة منسب كتلة اجلسم وزيادة السكان صفوف يف الدم ضغط بارتفاع املنبِئة والعوامل اجلديدة االنتشار معدالت حول الدراسات من مزيد بإجراء ويوىص القلب. رسعة السعوديني. وتنطوي تلك املعلومات عىل أمهية بالنسبة للسلطات الصحية من أجل التخطيط الفّعال من حيث التكلفة لربامج التحري، والوقاية،
واملكافحة.
EMHJ – Vol. 26 No. 4 – 2020Research article
434
org/10.4061/2011/174135
15. Al-Mohaissen MA, Al-Obaid QY, AlGhamdi WA, Al-Alyani HS, Dahman SM, Al-Wahhabi NA, et al. Prevalence and determinants of hypertension and high normal blood pressure among young adult Saudi females: insights into preventive strategies. Fam Community Health. 2017;40(3):221–30. https://doi.org/10.1097/FCH.0000000000000154
16. Sample size calculators. San Francisco: UCSF Clinical and Translational Science Institute; 2019 (http://www.sample-size.net/confidence-interval-proportion/, accessed 3 August 2019).
17. El Bcheraoui C, Memish ZA, Tuffaha M, Daoud F, Robinson M, Jaber S, et al. Hypertension and its associated risk factors in the Kingdom of Saudi Arabia, 2013: a national survey.Int J Hypertens. 2014;2014:564679. doi:10.1155/2014/564679
18. National Health and Nutrition Examination Survey (NHANES): Health tech/blood pressure procedures manual. Atlanta: Centers for Disease Control and Prevention; 2009 (https://www.cdc.gov/nchs/data/nhanes/nhanes_09_10/BP.pdf, acessed 4 June 2018).
19. Kario K. Global Impact of 2017 American Heart Association/American College of Cardiology hypertension guidelines: a perspec-tive from Japan. Circulation. 2018;137(6):543–5. https://doi.org/10.1161/CIRCULATIONAHA.117.032851
20. Demographic survey. Riyadh: General Authority for Statistics; 2016 (https://www.stats.gov.sa/sites/default/files/en-demograph-ic-research-2016_2.pdf, accessed 17 June 2018).
21. Nicoll R, Henein MY. Caloric restriction and its effect on blood pressure, heart rate variability and arterial stiffness and dilata-tion: a review of the evidence. Int J Mol Sci. 2018;19(3). https://doi.org/10.3390/ijms19030751
22. Reule S, Drawz PE. Heart rate and blood pressure: any possible implications for management of hypertension? Curr Hypertens Rep. 2012;14(6):478–84. https://doi.org/10.1007/s11906-012-0306-3
23. Your guide to lowering your blood pressure with DASH, DASH eating plan. Bethesda: National Institutes of Health National Heart Lung and Blood Institute; 2006. (https://www.nhlbi.nih.gov/files/docs/public/heart/new_dash.pdf, accessed 3 August 2019).
24. Cohen JFW, Lehnerd ME, Houser RF, Rimm EB. Dietary approaches to stop hypertension diet, weight status, and blood pres-sure among children and adolescents: National Health and Nutrition Examination Surveys 2003–2012. J Acad Nutr Diet. 2017 Sep;117(9):1437-1444.e2. doi:10.1016/j.jand.2017.03.026
25. Obarzanek E, Vollmer WM, Lin PH, Cooper LS, Young DR, Ard JD, et al. Effects of individual components of multiple behavior changes: the PREMIER trial. Am J Health Behav. 2007;31(5):545–60. https://doi.org/10.5555/ajhb.2007.31.5.545
26. Jung MH, Ihm SH, Lee DH, Choi Y, Chung WB, Jung HO, et al. Prehypertension is a comorbid state with autonomic and metabol-ic dysfunction. J Clin Hypertens (Greenwich). 2018;20(2):273–9. https://doi.org/10.1111/jch.13180
27. Zhang W, Li N. Prevalence, risk factors, and management of prehypertension. Int J Hypertens. 2011;2011:605359. doi:10.4061/2011/605359
28. Hu L, Huang X, You C, Li J, Hong K, Li P, et al. Prevalence and risk factors of prehypertension and hypertension in southern Chi-na. PLoS One. 2017;12(1):e0170238. https://doi.org/10.1371/journal.pone.0170238
29. Yan Y, Zhang Y, Yang Q, Dong K, Duan F, Liang S, et al. Association between resting heart rate and hypertension in Chinese with different waist-to-height ratio: a population-based cross-sectional study. J Am Soc Hypertens. 2018 Dec;12(12):e93-e101. doi:10.1016/j.jash.2018.08.005
30. Niiranen TJ, Larson MG, McCabe EL, Xanthakis V, Vasan RS, Cheng S. Prognosis of prehypertension without progression to hypertension. circulation. 2017;136(13):1262–4. https://doi.org/10.1161/CIRCULATIONAHA.117.029317
31. Syed Meraj A, Mohammed Al M. A study on the prevalence of risk factors for diabetes and hypertension among school children in Majmaah, Kingdom of Saudi Arabia. J Public Health Res. 2017;6(2):829. https://doi.org/10.4081/jphr.2017.829
32. Hothan KA, Alasmari BA, Alkhelaiwi OK, Althagafi KM, Alkhaldi AA, Alfityani AK, et al. Prevalence of hypertension, obesity, hematuria and proteinuria amongst healthy adolescents living in Western Saudi Arabia. Saudi Med J. 2016;37(10):1120–6. https://doi.org/10.15537/smj.2016.10.14784
33. Baig M, Gazzaz ZJ, Gari MA, Al-Attallah HG, Al-Jedaani KS, Mesawa AT, et al. Prevalence of obesity and hypertension among Uni-versity students’ and their knowledge and attitude towards risk factors of Cardiovascular Disease (CVD) in Jeddah, Saudi Arabia. Pak J Med Sci. 2015;31(4):816–20. https://doi.org/10.12669/pjms.314.7953
34. Al-Quwaidhi AJ, Pearce MS, Critchley JA, Sobngwi E, O’Flaherty M. Trends and future projections of the prevalence of adult obesity in Saudi Arabia, 1992–2022. East Mediterr Health J. 2014;20(10):589–95. PMID:25356689
35. Saeed AA, Al-Hamdan NA. Isolated diastolic hypertension among adults in Saudi Arabia: prevalence, risk factors, predictors and treatment. results of a national survey. Balkan Med J. 2016;33(1):52–7. https://doi.org/10.5152/balkanmedj.2015.153022
36. Early childhood education. Atlanta: Centers for Disease Control and Prevention, Office of the Associate Director for Policy; 2016 (https://www.cdc.gov/policy/hst/hi5/earlychildhoodeducation/index.html, accessed 3 August 2019).
37. McGowan L, Cooke LJ, Gardner B, Beeken RJ, Croker H, Wardle J. Healthy feeding habits: efficacy results from a cluster-rand-omized, controlled exploratory trial of a novel, habit-based intervention with parents. Am J Clin Nutr. 2013;98(3):769–77. https://doi.org/10.3945/ajcn.112.052159
38. Birch LL, Davison KK. Family environmental factors influencing the developing behavioral controls of food intake and childhood overweight. Pediatr Clin North Am. 2001;48(4):893–907. PMID:11494642
39. Madsen TE, Howard VJ, Jimenez M, Rexrode KM, Acelajado MC, Kleindorfer D, et al. Impact of conventional stroke risk factors on stroke in women: an update. Stroke. 2018;49(3):536–42. https://doi.org/10.1161/STROKEAHA.117.018418
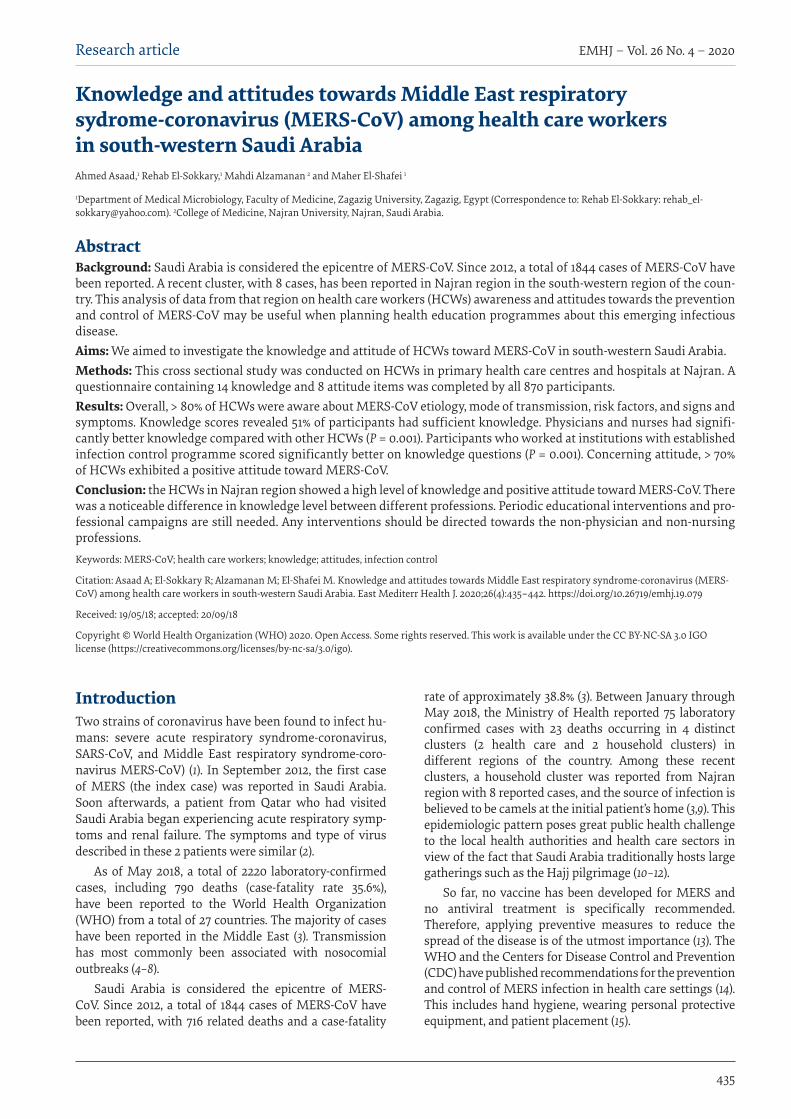
Research article
435
EMHJ – Vol. 26 No. 4 – 2020
Knowledge and attitudes towards Middle East respiratory sydrome-coronavirus (MERS-CoV) among health care workers in south-western Saudi Arabia Ahmed Asaad,1 Rehab El-Sokkary,1 Mahdi Alzamanan 2 and Maher El-Shafei 1
1Department of Medical Microbiology, Faculty of Medicine, Zagazig University, Zagazig, Egypt (Correspondence to: Rehab El-Sokkary: [email protected]). 2College of Medicine, Najran University, Najran, Saudi Arabia.
IntroductionTwo strains of coronavirus have been found to infect hu-mans: severe acute respiratory syndrome-coronavirus, SARS-CoV, and Middle East respiratory syndrome-coro-navirus MERS-CoV) (1). In September 2012, the first case of MERS (the index case) was reported in Saudi Arabia. Soon afterwards, a patient from Qatar who had visited Saudi Arabia began experiencing acute respiratory symp-toms and renal failure. The symptoms and type of virus described in these 2 patients were similar (2).
As of May 2018, a total of 2220 laboratory-confirmed cases, including 790 deaths (case-fatality rate 35.6%), have been reported to the World Health Organization (WHO) from a total of 27 countries. The majority of cases have been reported in the Middle East (3). Transmission has most commonly been associated with nosocomial outbreaks (4–8).
Saudi Arabia is considered the epicentre of MERS-CoV. Since 2012, a total of 1844 cases of MERS-CoV have been reported, with 716 related deaths and a case-fatality
rate of approximately 38.8% (3). Between January through May 2018, the Ministry of Health reported 75 laboratory confirmed cases with 23 deaths occurring in 4 distinct clusters (2 health care and 2 household clusters) in different regions of the country. Among these recent clusters, a household cluster was reported from Najran region with 8 reported cases, and the source of infection is believed to be camels at the initial patient’s home (3,9). This epidemiologic pattern poses great public health challenge to the local health authorities and health care sectors in view of the fact that Saudi Arabia traditionally hosts large gatherings such as the Hajj pilgrimage (10–12).
So far, no vaccine has been developed for MERS and no antiviral treatment is specifically recommended. Therefore, applying preventive measures to reduce the spread of the disease is of the utmost importance (13). The WHO and the Centers for Disease Control and Prevention (CDC) have published recommendations for the prevention and control of MERS infection in health care settings (14). This includes hand hygiene, wearing personal protective equipment, and patient placement (15).
AbstractBackground: Saudi Arabia is considered the epicentre of MERS-CoV. Since 2012, a total of 1844 cases of MERS-CoV have been reported. A recent cluster, with 8 cases, has been reported in Najran region in the south-western region of the coun-try. This analysis of data from that region on health care workers (HCWs) awareness and attitudes towards the prevention and control of MERS-CoV may be useful when planning health education programmes about this emerging infectious disease. Aims: We aimed to investigate the knowledge and attitude of HCWs toward MERS-CoV in south-western Saudi Arabia. Methods: This cross sectional study was conducted on HCWs in primary health care centres and hospitals at Najran. A questionnaire containing 14 knowledge and 8 attitude items was completed by all 870 participants. Results: Overall, > 80% of HCWs were aware about MERS-CoV etiology, mode of transmission, risk factors, and signs and symptoms. Knowledge scores revealed 51% of participants had sufficient knowledge. Physicians and nurses had signifi-cantly better knowledge compared with other HCWs (P = 0.001). Participants who worked at institutions with established infection control programme scored significantly better on knowledge questions (P = 0.001). Concerning attitude, > 70% of HCWs exhibited a positive attitude toward MERS-CoV. Conclusion: the HCWs in Najran region showed a high level of knowledge and positive attitude toward MERS-CoV. There was a noticeable difference in knowledge level between different professions. Periodic educational interventions and pro-fessional campaigns are still needed. Any interventions should be directed towards the non-physician and non-nursing professions. Keywords: MERS-CoV; health care workers; knowledge; attitudes, infection control
Citation: Asaad A; El-Sokkary R; Alzamanan M; El-Shafei M. Knowledge and attitudes towards Middle East respiratory syndrome-coronavirus (MERS-CoV) among health care workers in south-western Saudi Arabia. East Mediterr Health J. 2020;26(4):435–442. https://doi.org/10.26719/emhj.19.079
Received: 19/05/18; accepted: 20/09/18
Copyright © World Health Organization (WHO) 2020. Open Access. Some rights reserved. This work is available under the CC BY-NC-SA 3.0 IGO license (https://creativecommons.org/licenses/by-nc-sa/3.0/igo).
EMHJ – Vol. 26 No. 4 – 2020Research article
436
Given the mode of MERS transmission, health care workers (HCWs) in contact with MERS patients are expected to be at a high risk of infections. Previous clinical studies have shown that the seroprevalence of MERS-CoV among HCWs who had had contact with MERS patients ranged from 0.3% to 20.9%. Therefore, use of personal protective equipment is crucial to reducing transmission. Gowns and gloves are recommended as a contact precaution, and surgical masks are recommended as a droplet precaution (16–19). However, these effective infection prevention and control practices depend on awareness and compliance among HCWs at all levels (15). A poor level of knowledge has been implicated in the rapid spread of the infection in hospitals (18). Despite many previous Saudi Arabian studies examining the knowledge and practices in regard to MERS among HCWs in different regions of the country (10,11,20,21), data from the south-western region are scarce. In addition, HCWs represent a major section of the Saudi Arabian population and constitute a considerable source of infected cases in the country (16,17). Najran region alone has 7 general hospitals and 55 primary health care centres, with a total of 3320 HCWs, including 784 physicians and 1842 nurses, according to the Ministry of Health statistics (9).
This study aimed to investigate the knowledge and attitude of HCWs toward MERS infection in south-western Saudi Arabia. The findings may be useful in recommending any remedial measures and additional interventions in the study area to improve awareness and attitudes among HCWs.
MethodsSampleThis cross-sectional, descriptive study of a representative sample of Saudi HCWs (physicians, dentists, pharma-cists, nurses and laboratory staff) in primary health care centres and hospitals in Najran, a city in south-western Saudi Arabia, was conducted from June to October 2016. The study was conducted according to the international guidelines of Strengthening the Reporting for Observa-tional Studies in Epidemiology; STROBE (22). The sample size required for the study was estimated to be 685, based on an average previous estimate of 54% MERS aware-ness among Saudi HCWs (10), with an absolute precision of 2% and at a 95% confidence interval. To avoid loss of participants, a total sample of 870 HCWs was included in the present study. A stratified proportional allocation random sample was used. The stratification factors taken into consideration were the age, sex, type of health care speciality and relative number and type of health care fa-cility.
The study followed the principles of the Helsinki Declaration and ethical approval was obtained from the ethics and research committee of Najran University. Written consent was obtained from all participants.
Questionnaire interviewA standardized questionnaire was distributed and com-pleted by all participants inside their health care facilities
(primary health care centres and hospitals) during the first 2-month period of the study. The self-administered questionnaire was developed, with some modifications, using the frequently asked questions from the WHO and the Saudi Ministry of Health websites (9,23).
The questionnaire was initially designed in English and translated into Arabic by experts in infectious diseases and biostatistics to match with the local colloquial Arabic terminology used by physicians and health educators in the community. After translation and back translation (24), the questionnaire was pilot tested on 20 HCWs (7 doctors, 6 nurses and 13 technicians) who are not included among the study participants to determine acceptability and the clarity of the questions, and to confirm its face validity; it was then modified accordingly.
The questionnaire comprised 3 parts addressing knowledge and attitude of HCWs regarding MERS. The first part covered demographic data such as age, sex, current job and participants’ source of knowledge on MERS (6 items). The second part assessed the knowledge of HCWs by asking questions about the etiology, incubation period, symptoms, risk group, consequences, source of transmission, prevention and treatment of MERS (11 items). A scoring system was applied to assess the level of knowledge of each subject, as has been previously used (with some modifications) (11): 2 points for each correct answer, 1 point for an incorrect answer. A total of ≥ 12 points (≥ 60% of total marks) was considered sufficient knowledge. Participants were grouped into 2 categories according to their level of knowledge: insufficient (< 12 points), and sufficient (≥ 12 points). The third part of the questionnaire assessed the attitude of HCWs regarding MERS using a set of 8 yes/no questions.
Statistical analysisData were coded, validated and analysed using SPSS, ver-sion 22. Frequencies and proportions were used to pres-ent the data. Chi-squared was used as the test of signifi-cance at the 5% level.
ResultsA total of 820 HCWs completed the questionnaire, a re-sponse rate of 94.3%. The age range of the participants was 23–58 years, median (IQR) 31 (28–38) years and mean 33.7 (standard deviation 8.6) years. Table 1 shows the base-line characteristics of the respondents. More than two-thirds (563) were male. The study group included 200 (24.4%) nurses, 185 (22.6%) physicians and 435 (53.0%) oth-er HCWs; 132 (71.4%) physicians and 124 nurses worked in primary health care centres. More than half of the re-spondents 476 (58%) perceived that they had sufficient knowledge about MERS. The main sources of MERS information were the Ministry of Health website 410 (50.0%) and social media 296 (36.1%).
Table 2 shows the current status of MERS knowledge among HCWs. The majority, 762 (92.9%), were aware that the disease is a viral infection, 748 (91.2%) were familiar with its mode of transmission and 688 (83.9%) with the signs and symptoms. A majority of participants agreed

Research article
437
EMHJ – Vol. 26 No. 4 – 2020
that patients with chronic diseases [760 (92.7%)] and HCWs [692 (84.4%)] are at a higher risk of infection. However, the participants’ knowledge about questions related to MERS vaccination, treatment by antibiotics, diarrhoea as a possible symptom, and the incubation period was poor.
The knowledge scores were correlated against the baseline characteristics of the respondents (Table 3). Females had statistically significantly better knowledge than males (P = 0.002). Sufficient knowledge was significantly correlated with age (P = 0.001). Moreover, physicians and nurses had significantly better knowledge compared with other HCWs (P = 0.001). As expected, HCWs at institutions with established infection control programmes scored significantly better (P = 0.001).
Over 70% of HCWs exhibited a positive attitude toward MERS. The majority of participants (79%) knew that MERS infection could be prevented by using isolation and standard precautions. Besides, 88.4% felt that the information in Saudi society was sufficient to deal with MERS and 95.7% that their institutions would be able to control any emerging MERS epidemic (Table 4).
DiscussionCurrently, MERS is a daily discussion topic in the media and among the public, especially among patients and HCWs. This analysis of data from south-western Saudi Arabia tries to inform on awareness and attitudes towards the prevention and control of MERS among HCWs: our findings may be useful when planning health education programmes about this emerging infectious disease.
We found that 50% of the participants depended on the Ministry of Health website as a main source of information about MERS. This differs from the findings of previously published studies, where social media and television were the main sources of information (11,13,19–21,25). This indicates that the educational materials posted online by the Ministry of Health encouraged the busy HCWs to use them. At the same time, it sets a great responsibility on health care authorities to increase the accessibility of such materials by varying the means of information delivery, aiming to improve knowledge levels. A finding of considerable concern is that 36% of HCWs used social media as a source of information. Because of the difficulty in determining the validity and scientific content of information sources as well as the possibility of misinformation being presented, HCWs should practice careful evaluation of MERS-related educational materials (1).
The findings of this study suggest a good relationship between information available in the media about MERS and the depth of knowledge among HCWs. For example, about 97% of the participants knew about the preventive measures, 92.9% about the causative agent of the disease, 91% about the mode of transmission, and 83.9% about the clinical symptoms. These results are consistent with findings from previous studies (11,13,25,26). On the other hand, fewer participants were knowledgeable about diarrhoea as a symptom of disease, vaccine availability and the incubation period.
As per CDC recommendations, Saudi Arabia has led the relevant authorities to initiate educational campaign targeted towards HCWs. These mainly focused on the prevention, treatment and symptoms of MERS (9,15). Nevertheless, greater encouragement is needed for HCWs to refer to the Ministry of Health websites.
In this study, only 51% of participants had sufficient knowledge about MERS. Such unsatisfactory results highlight the need for greater efforts to raise general awareness among HCWs about MERS. As expected, age was significantly associated with higher proportions of sufficient knowledge. A number of previous studies also found that older HCWs showed higher rates of knowledge and awareness (11,20,27).
We found that there was variability among HCWs in their knowledge level. For example participants who worked in places where a preventive programme and infection control policies are applied had greater levels of sufficient knowledge than those working in places without an infection control programme. Physicians
Table 1 Baseline characteristics of health care workers, Najran, 2016Characteristic Participants
(n = 820) No. (%)
Sex
Male 563 (68.7)
Female 257 (31.3)
Age (years)
21–30 338 (41.2)
31–40 326 (39.8)
41–50 120 (14.6)
50 36 (4.4)
Occupation
Nurse 200 (24.4)
Physician 185 (22.6)
Pharmacist 148 (18)
Technician 105 (12.8)
Dentist 102 (12.4)
Laboratory worker 60 (7.3)
Do you have sufficient knowledge about MERS-CoV?
Yes 476 (58.0)
No 322 (39.3)
Don’t know 22 (2.7)
Source of knowledge about MERS-CoV
Ministry of Health website 410 (50.0)
Social media 296 (36.1)
Newspaper 72 (8.8)
TV 42 (5.1)
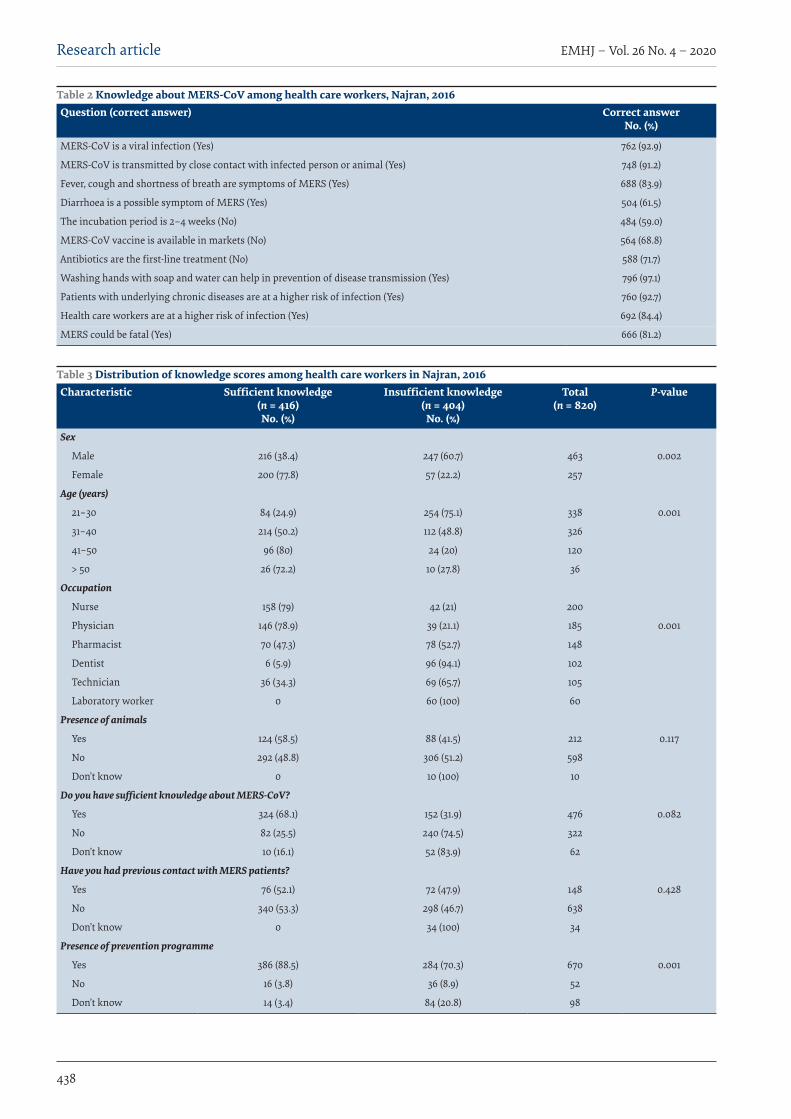
EMHJ – Vol. 26 No. 4 – 2020Research article
438
Table 2 Knowledge about MERS-CoV among health care workers, Najran, 2016Question (correct answer) Correct answer
No. (%)
MERS-CoV is a viral infection (Yes) 762 (92.9)
MERS-CoV is transmitted by close contact with infected person or animal (Yes) 748 (91.2)
Fever, cough and shortness of breath are symptoms of MERS (Yes) 688 (83.9)
Diarrhoea is a possible symptom of MERS (Yes) 504 (61.5)
The incubation period is 2–4 weeks (No) 484 (59.0)
MERS-CoV vaccine is available in markets (No) 564 (68.8)
Antibiotics are the first-line treatment (No) 588 (71.7)
Washing hands with soap and water can help in prevention of disease transmission (Yes) 796 (97.1)
Patients with underlying chronic diseases are at a higher risk of infection (Yes) 760 (92.7)
Health care workers are at a higher risk of infection (Yes) 692 (84.4)
MERS could be fatal (Yes) 666 (81.2)
Table 3 Distribution of knowledge scores among health care workers in Najran, 2016Characteristic Sufficient knowledge
(n = 416) No. (%)
Insufficient knowledge (n = 404)
No. (%)
Total (n = 820)
P-value
Sex
Male 216 (38.4) 247 (60.7) 463 0.002
Female 200 (77.8) 57 (22.2) 257
Age (years)
21–30 84 (24.9) 254 (75.1) 338 0.001
31–40 214 (50.2) 112 (48.8) 326
41–50 96 (80) 24 (20) 120
> 50 26 (72.2) 10 (27.8) 36
Occupation
Nurse 158 (79) 42 (21) 200
Physician 146 (78.9) 39 (21.1) 185 0.001
Pharmacist 70 (47.3) 78 (52.7) 148
Dentist 6 (5.9) 96 (94.1) 102
Technician 36 (34.3) 69 (65.7) 105
Laboratory worker 0 60 (100) 60
Presence of animals
Yes 124 (58.5) 88 (41.5) 212 0.117
No 292 (48.8) 306 (51.2) 598
Don’t know 0 10 (100) 10
Do you have sufficient knowledge about MERS-CoV?
Yes 324 (68.1) 152 (31.9) 476 0.082
No 82 (25.5) 240 (74.5) 322
Don’t know 10 (16.1) 52 (83.9) 62
Have you had previous contact with MERS patients?
Yes 76 (52.1) 72 (47.9) 148 0.428
No 340 (53.3) 298 (46.7) 638
Don’t know 0 34 (100) 34
Presence of prevention programme
Yes 386 (88.5) 284 (70.3) 670 0.001
No 16 (3.8) 36 (8.9) 52
Don’t know 14 (3.4) 84 (20.8) 98

Research article
439
EMHJ – Vol. 26 No. 4 – 2020
and nurses had better knowledge levels than other professions, as seen elsewhere (20,28,29). Any upcoming educational programmes could be designed to target those professions which demonstrated a greater incidence of insufficient knowledge level, i.e. in our study this included dentists, pharmacists, technicians and laboratory personnel.
Those HCWs who had previous contact with infected patients showed a high level of insufficient knowledge, which is an unexpected result and points to the importance of health care authorities setting up awareness campaigns for patient contacts which also include their managing health team.
Generally, most participants had a positive attitude towards active participation in infection control programmes and the role of guidelines in prevention of the infection. They believed in the ability of the government to control an epidemic. However, 22.2% showed negative attitudes towards vaccination. This could be explained by a lack of proper knowledge about the preventive role of active immunization.
Although the majority of respondents were not able to determine their actual knowledge level, about 93% believe that HCWs must avail themselves of all information about the virus. The majority agreed that patients infected with MERS should be intensively treated. Moreover, almost 70% of our participants were worried about MERS infection for their family. Similar findings have been reported in many previous studies (20,26,27).
This study had some limitations. Firstly, the questionnaire data may have been subject to recall bias and misclassification. However, we can expect that HCWs have the necessary medical knowledge to correctly respond to all items of the questionnaire tool. Secondly, our study was limited to the south-western region of Saudi Arabia, thus the results presented here may not be generalizable to the rest of the country. Finally, the lack of detailed information about the attitude of HCWs towards MERS is a potential limitation. Therefore, carrying out further large-scale studies from other regions in Saudi Arabia is important to further explore awareness and attitude of HCWs at the national level.
Conclusion The HCWs in Najran region showed a high level of knowledge and positive attitudes towards MERS. How-ever, there is a noticeable difference in knowledge level between the professions. Periodic educational interven-tions using locally-adjusted methods are indicated as these could contribute to improving any deficiencies in knowledge, e.g. the incubation period, and diarrhoea as a possible symptom. Greater educational efforts about pre-vention should be directed to dentists, technicians, phar-macists and laboratory workers, and patient contacts (in-cluding the treating team) should be more involved in the process of education about infectious diseases.
Funding: None.
Competing interests: None declared.
Table 4 Attitude of health care workers toward MERS-CoV, Najran, 2016Item (correct answer) Response
No. (%)a
Are you worried one of your family members may get an infection?
Yes 570 (69.5)
Transmission of MERS can be prevented by using standard and isolation precautions given by CDC, WHO, APIC, etc? (Yes)
Yes 647 (78.9)
Prevalence of MERS can be reduced by active participation of health care worker in hospital infection control programme? (Yes)Yes 605 (73.8)
If a MERS-CoV vaccine were available, would you have it?
Yes 638 (77.8)
Intensive treatment should be given to diagnosed patients? (Yes)
Yes 778 (94.9)
Health care workers must avail themselves of all information about the virus? (Yes)
Yes 762 (92.9)
Is the available information about MERS-CoV in Saudi society sufficient?
Yes 725 (88.4)
Are the government institutions able to control the epidemic?
Yes 785 (95.7)
CDC = Centers for Disease Control and Prevention, WHO = World Health Organization, APIC = Association for Professionals in Infection Control and Epidemiology.. aAll respondents answered either yes or no. There were no missing values or don’t know responses.
EMHJ – Vol. 26 No. 4 – 2020Research article
440
Connaissances et attitudes vis-à-vis du coronavirus du syndrome respiratoire du Moyen-Orient (MERS-CoV) parmi les agents de santé dans le sud-ouest de l’Arabie saoudite RésuméContexte : L’Arabie saoudite est considérée comme étant l’épicentre du MERS-CoV. Depuis 2012, un total de 1844 cas de MERS-CoV ont été déclarés. Récemment, un groupe de huit cas a été notifié dans la région de Najran dans le sud-ouest du pays. La présente analyse des données de cette région portant sur le niveau de sensibilisation et les attitudes des agents de santé vis-à-vis de la lutte contre le MERS-CoV et de sa prévention peut être utile dans le cadre de la planification des programmes d’éducation sanitaire concernant cette maladie infectieuse émergente. Objectifs : Notre objectif était d’examiner les connaissances et les attitudes des agents de santé vis-à-vis du MERS-CoV dans le sud-ouest de l’Arabie saoudite. Méthodes : La présente étude transversale a été menée auprès d’agents de santé dans les centres de soins de santé primaires et les hôpitaux de Najran. Un questionnaire contenant 14 items sur les connaissances et 8 items sur les attitudes a été rempli par les 870 participants. Résultats : Globalement, plus de 80 % des agents de santé avaient des connaissances sur l’étiologie, le mode de transmission, les facteurs de risque ainsi que sur les signes et les symptômes du MERS-CoV. Les scores de connaissance ont montré que 51 % des participants avaient un niveau suffisant. Les médecins et les personnels infirmiers présentaient un niveau de connaissance significativement plus élevé que les autres aux agents de soins de santé (p = 0,001). Les participants qui travaillaient dans des institutions dotées d’un programme de lutte contre les infections bien établi obtenaient des scores significativement plus élevés aux questions portant sur les connaissances (p = 0,001). S’agissant des attitudes, plus de 70 % des agents de santé ont montré une attitude positive vis-à-vis du MERS-CoV. Conclusion : les agents de santé de la région de Najran faisaient preuve d’un niveau élevé de connaissances et avaient une attitude positive vis-à-vis du MERS-CoV. On a observé une différence non négligeable concernant le niveau de connaissances entre les différentes professions. Des interventions éducatives et des campagnes périodiques à l’intention des professionnels demeurent nécessaires. Toute intervention devrait cibler les membres du personnel soignant qui ne sont ni médecins ni infirmiers.
معلومات واجتاهات العاملني يف جمال الرعاية الصحية جتاه فريوس كورونا املسبب ملتالزمة الرشق األوسط التنفسية يف جنوب غرب اململكة العربية السعودية
أمحد أسعد، رحاب السكري، مهدي الزمانان، ماهر الشافعياخلالصة
اخللفية: ُتعدُّ اململكة العربية السعودية بؤرة لفريوس كورونا املسبب ملتالزمة الرشق األوسط التنفسية. فمنذ عام 2012، بلغ عدد احلاالت اإلمجالية امُلبلغ هبا واملصابة بفريوس كورونا املسبب ملتالزمة الرشق األوسط التنفسية 1844 حالة. وُأبلغ مؤخرا عن جمموعة تضم 8 حاالت يف منطقة نجران جنوب غريب البالد. وقد يكون هذا التحليل للبيانات املستمدة من تلك املنطقة عن وعي عاميل الرعاية الصحية ومواقفهم جتاه الوقاية من فريوس
كورونا املسبب ملتالزمة الرشق األوسط التنفسية ومكافحته مفيدا يف التخطيط لربامج التثقيف الصحي املعنية هبذا املرض املعدي. األهداف: هدفنا استقصاء معلومات واجتاهات العاملني يف جمال الرعاية الصحية يف جنوب غريب اململكة العربية السعودية نحو فريوس كورونا
املسبب ملتالزمة الرشق األوسط التنفسية. نجران. يف األولية الصحية الرعاية ومستشفيات مراكز يف الصحية الرعاية جمال يف العاملني عىل املقطعية الدراسة هذه ُأجريت البحث: طرق
واْسُتكمل استبيان يتألف من 14 بندا للمعلومات و 8 بنود تتعلق باالجتاهات بواسطة مجيع املشاركني يف االستبيان البالغ عددهم 870 مشاركا. األوسط الرشق ملتالزمة املسبب كورونا بفريوس اإلصابة بسبب امللمني الصحية الرعاية يف العاملني نسبة جتاوزت عامة، بصورة النتائج: التنفسية، وطريقة انتقاله، وعوامل اخلطر املرتبطة به، وعالماته، وأعراضه نسبة %80. وأوضحت الدرجات املعرفية أن %51 من املشاركني كانت الصحية الرعاية يف العاملني بسائر مقارنة بكثري أفضل معلومات التمريض وطواقم األطباء لدى وكان الفريوس. عن كافية معلومات لدهيم (p = 0.001). وحقق املشاركون الذين عملوا يف مؤسسات هبا برامج راسخة ملكافحة العدوى درجات أفضل بكثري فيام يتعلق بأسئلة املعلومات)p = 0.001). وفيام يتعلق باالجتاهات، فقد أظهر ما يزيد عن %70 من العاملني يف الرعاية الصحية موقفا إجيابيا إزاء فريوس كورونا املسبب ملتالزمة
الرشق األوسط التنفسية. املسبب ملتالزمة إجيابية جتاه فريوس كورونا الصحية يف منطقة نجران مستوى معلومات مرتفعا واجتاهات الرعاية العاملني يف االستنتاج: أظهر الرشق األوسط التنفسية. كانت هناك اختالفات ملحوظة يف مستوى املعلومات بني خمتلف املهن. وال تزال احلاجة ماسة إىل القيام بتدخالت تثقيفية
دورية ومحالت للتوعية املهنية. وينبغي توجيه أي تدخل نحو باقي املهن غري الطبية والتمريضية.
Research article
441
EMHJ – Vol. 26 No. 4 – 2020
References1. Meyer B, García -Bocanegra I, Wernery U, Wernery R, Sieberg A, Müller MA, et al. Serologic assessment of possibility for MERS-
CoV infection in equids. Emerg Infect Dis. 2015 Jan;21(1):181–2. doi:10.3201/eid2101.141342
2. Zaki AM, Van Boheemen S, Bestebroer TM, Osterhaus AD, Fouchier RA. Isolation of a novel coronavirus from a man with pneu-monia in Saudi Arabia. N Engl J Med. 2012:367 (19):1814–20. doi:10.1056/NEJMoa1211721
3. Middle East respiratory syndrome coronavirus (MERS-CoV). Geneva: World Health Organization; 2018 (http://who.int/emergen-cies/mers-cov/en/, accessed 12 July 2018).
4. Assiri A, McGeer A, Perl TM, Price CS, Al Rabeeah AA, Cummings DA, et al. Hospital outbreak of Middle East respiratory syn-drome coronavirus. N Engl J Med. 2013;369(5):407–16. doi:10.1056/NEJMoa1306742
5. Al-Abdallat MM, Payne DC, Alqasrawi S, Rha B, Tohme RA, Abedi GR, et al. Hospital-associated outbreak of Middle East respira-tory syndrome coronavirus: a serologic, epidemiologic, and clinical description. Clin Infect Dis. 2014:59:1225–33. doi:10.1093/cid/ciu359
6. Oboho IK, Tomczyk SM, Al-Asmari AM, Banjar AA, Al-MugtiH, Aloraini MS, et al. 2014 MERS-CoV outbreak in Jeddah - a link to health care facilities. N Engl J Med. 2015:372 (9):846–54. doi:10.1056/NEJMoa1408636
7. Korea Centers for Disease Control and Prevention. Middle East respiratory syndrome coronavirus outbreak in the Republic of Korea. Osong Public Health Res Perspect 2015:6(4):269–78.
8. Park HY, Lee EJ, Ryu YW, Kim Y, Kim H, Lee H, et al. Epidemiological investigation of MERS-CoV spread in a single hospital in South Korea, May to June 2015. Euro Surveill. 2015:20 (25):1–6. doi:10.2807/1560-7917.es2015.20.25.21169
9. FAQs Coronavirus (MERS-CoV). Riyadh: Ministry of Health; 2018 (http://www.moh.gov.sa/en/CCC/FAQs/Corona/Pages/default.aspx/, accessed 12 July 2018).
10. Al-Mohrej OA, Al-Shirian SD, Al-Otaibi SK, Tamim HM, Masuadi EM, Fakhoury HM. Is the Saudi public aware of Middle East respiratory syndrome? J Infect Pub Health. 2016:9(3):259–66. doi:10.1016/j.jiph.2015.10.003
11. Almutairi KM, Al Helih EM, Moussa M, Boshaiqah AE, Saleh Alajilan A, Vinluan JM, et al. Awareness, attitudes, and prac-tices related to coronavirus pandemic among public in Saudi Arabia. Fam Comm Health. 2015:38 (4):332–340. doi:10.1097/FCH.0000000000000082
12. Schnirring L. Hospital emerges as epicenter of Riyadh MERS outbreak. Minneapolis: Center for Infectious Disease Research and Policy, University of Minnesota; 2015 (http://www.cidrap.umn.edu/news-perspective/2015/08/hospital-emerges-epicenter-ri-yadh-mers-outbreak, accessed 5 September 2019).
13. Al-Hazmi A, Gosadi I, Somily A, Alsubaie S, Saeed AB. Knowledge, attitude and practice of secondary schools and universi-ty students toward Middle East Respiratory Syndrome epidemic in Saudi Arabia: a cross-sectional study. Saudi J Biolog Sci. 2018;25(3):572–7. https://doi.org/10.1016/j.sjbs.2016.01.032
14. de Groot RJ, Baker SC, Baric RS, Brown CS, Drosten C, Enjuanes L, et al. Middle east respiratory syndrome corona-virus (MERS-CoV); announcement of the Coronavirus Study Group. J Virol. 2013:5:13–15. doi:10.1128/JVI.01244-13
15. Interim infection prevention and control recommendations for hospitalized patients with middle east respiratory syndrome coronavirus (MERS-CoV). Atlanta: Centers for Disease Control and Prevention; 2015 (https://www.tn.gov/content/dam/tn/health/documents/reportable-diseases/middle-east-respiratory-syndrome-mers-cov/CDC-infection-prevention-control.pdf, accessed 5 September 2019).
16. Assiri A, McGeer A, Perl TM, Price CS, Al Rabeeah AA, Cummings DA, et al. Hospital outbreak of Middle East respiratory syn-drome coronavirus. N Engl J Med. 2013:369(5):407–16. doi:10.1056/NEJMoa1306742
17. Oboho IK, Tomczyk SM, Al-Asmari AM, Banjar AA, Al-Mugti H, Aloraini MS, et al. 2014 MERS-CoV outbreak in Jeddah – a link to health care facilties. N Engl J Med. 2015:372:846–54. doi:10.1056/NEJMoa1408636
18. Kim SG. Healthcare workers infected with Middle East respiratory syndrome coronavirus and infection control. J Kor Med Assoc. 2015:58:647–54. doi:10.5124/jkma.2015.58.7.647
19. Kim CJ, Choi WS, Jung Y, Kiem S, Seol HY, Woo HJ, et al. Surveillance of the Middle East respiratory syndrome (MERS) coronavi-rus (CoV) infection in healthcare workers after contact with confirmed MERS patients: Incidence and risk factors of MERS-CoV seropositivity. Clin Microbiol Infect. 2016:22 (10):880–6. doi:10.1016/j.cmi.2016.07.017
20. Khan MU, Shah S, Ahmad A, Fatokun O. Knowledge and attitude of healthcare workers about Middle East Respiratory Syndrome in multispecialty hospitals of Qassim, Saudi Arabia. BMC Pub Health. 2014;14:1281.
21. Kharma MY, Alalwani MS, Amer MF, Tarakji B, Aws G. Assessment of the awareness level of dental students toward Middle East Respiratory Syndrome-coronavirus. J Int Soc Prev Comm Dent. 2015:5 (3):163–9. doi:10.4103/2231-0762.159951
22. STROBE checklist, version 4. Bern: Institute of Social and Preventive Medicine University of Bern; 2007 (http://www.strobe-statement.org/index.php?id=available-checklists, accessed 5 September 2019).
23. World Health Organization. Frequently asked questions on Middle East respiratory syndrome coronavirus (MERS-CoV). Geneva: World Health Organization; 2018 (http://www.who.int/csr/disease/coronavirus_infections/faq/en/, accessed 12 July 2018).
24. Process of translation and adaptation of instruments. Geneva: World Health Organization; 2018 (http://www.who.int/substance_abuse/research_tools/translation/en/, accessed 12 July 2018).

EMHJ – Vol. 26 No. 4 – 2020Research article
442
25. ALdowyan NM, Ahmed AS, El-Gharabawy RM. Knowledge, Attitude and Practice (KAP) Study about Middle East Respiratory Syndrome Coronavirus (MERS-CoV) among Population in Saudi Arabia. Internat Arch Med. 2017:10 (254):1–12. doi:https://doi.org/10.3823/2524
26. Al-Mohaissen M. Awareness among a Saudi Arabian university community of Middle East respiratory syndrome coronavirus following an outbreak. East Mediter Health J. 2017:23 (5):351–60. PMID:28730588
27. Hoda J. Identification of information types and sources by the public for promoting awareness of Middle East respiratory syn-drome coronavirus in Saudi Arabia. Health Educ Res. 2016:31 (1):12–23. doi:10.1093/her/cyv061
28. Reusken CB, Farag EA, Haagmans BL, Mohran KA, Godeke G, Raj S, et al. Occupational exposure to dromedaries and risk for MERS-CoV infection, Qatar, 2013—2014. Emerg Infect Dis. 2015;21(8):1422–5. doi:10.3201/eid2108.150481
29. Alkot M, Albouq AM, Shakuri AM, Subahi SM. Knowledge, attitude, and practice toward MERS-CoV among primary health-care workers in Makkah Al-Mukarramah: an intervention study. Int J Med Sci Pub Health. 2016:5:952. doi:10.5455/ijm-sph.2016.15012016330
Research article
443
EMHJ – Vol. 26 No. 4 – 2020
Complementary and alternative medicine use for weightmanagement among females in Jordan: a community-based surveyMayadah Bashir Shehadeh,1 Ghadeer Suaifan,1 Alaa Abu-Odeh2 and Rula Darwish3
1Department of Pharmaceutical Sciences. 2School of Pharmacy, University of Jordan, Amman, Jordan (Correspondence to: Mayadah Shehadeh: [email protected]). 3Department of Pharmaceutics and Pharmaceutical Biotechnology, University of Jordan, Amman, Jordan.
IntroductionDespite recent advances in care and management, the obesity epidemic has reached an alarming level world-wide in both developing and developed countries. Glob-ally, one billion adults have been identified as being over-weight and 300 million as obese (1). Jordan is ranked 25th among countries suffering from obesity, with a preva-lence of 49.7% (2). Overweight and obesity among women in Jordan has reached alarming levels (30.0% and 38.8% respectively). Changes in physical activity, lifestyle, so-cioeconomic status and dietary habits are factors which have been found to be associated with precipitating obe-sity (3–5).
Obesity causes substantial morbidity, mortality and chronic complications. Recent research has highlighted it as a risk factor for coronary heart disease. In addition, obesity is associated with hypertension, diabetes, dyslipidaemia, cancer, osteoarthritis of weight-bearing joints and deteriorating quality of life (3,6).
Enormous advances have been accomplished in modern medicine, however, complementary and
alternative medicine (CAM) still interests people greatly. In many developing countries, traditional medicine is the primary health care system, with about 70–80% of the population relying on it (7). One-third of adults in the United States of America have used some form of CAM according to the 2002 National Health Interview Survey and several population-based studies (4,5,7,8). Herbs (35.5%) and hijama (cupping) (20.4%) are the most widely used forms of CAM in Jordan for cancer patients and the chronically ill (9). Other commonly used CAM therapies include herbal products, deep breathing exercises, meditation, chiropractic, yoga, massage and diet-based therapies (4,10,11). Complementary and alternative medicine encompasses various ancient and new approaches which are not taught widely in medical schools and are not generally used in hospitals for the purpose of preventing or treating disease. By definition, complementary practices are used together with conventional medicine, while alternative methods are used instead of conventional therapy (4,10,11).
“Back to nature” is one of several aspects that have encouraged the expansion of CAM use: it adds to the
AbstractBackground: The relationship between obesity and various chronic diseases is well documented. In Jordan, the preva-lence of overweight (30.0%) and obesity (38.8%) among females is on the rise, encouraging many adults to rely on alterna-tive health care methods to manage their weight.Aims: We explored the status of complementary and alternative medicine use for weight management among adult fe-males in Jordan and the possible relationship between complementary and alternative medicine use and body mass index.Methods: An interviewer-administered, structured questionnaire was used to collect data on the use and safety of com-plementary and alternative medicine for weight management from 858 women in 2015. Responses were coded and ana-lysed using SPSS, version 20.Results: Around 40% of the respondents reported using some form of complementary and alternative medicine for weight management. Commercial dietary supplements (31.2%), herbal remedies (26.7%) and folk remedies (18.0%) were commonly used. Green tea and fibre tablets were the most widely used herbal supplements. Logistic regression analysis indicated that overweight participants are more frequent complementary and alternative medicine users compared to obese. Rel-atives and friends were the main sources of information about complementary and alternative medicine. Only 31.9% of women believed that complementary and alternative medicine modalities were safe; around half believed they were not safe during pregnancy (52.5%) and lactation (48.0%). Only 49.7% were aware of side-effects and 41.5% of drug interactions. Conclusion: This study revealed that complementary and alternative medicine is often used for weight management. Awareness of the safe use of complementary and alternative medicine with other medications and during pregnancy and lactation should be addressed. Keywords: alternative medicine, dietary supplements, weight management, women, Jordan
Citation: Shehadeh M; Suaifan G; Abu-Odeh A; Darwish R. Complementary and alternative medicine use for weight management among females in Jordan; a community-based survey. East Mediterr Health J. 2020;26(4):443–452.https://doi.org/10.26719/emhj.19.098
Received: 10/02/18; accepted: 03/09/18
Copyright © World Health Organization (WHO) 2020. Open Access. Some rights reserved. This work is available under the CC BY-NC-SA 3.0 IGO li-cense (https://creativecommons.org/licenses/by-nc-sa/3.0/igo).
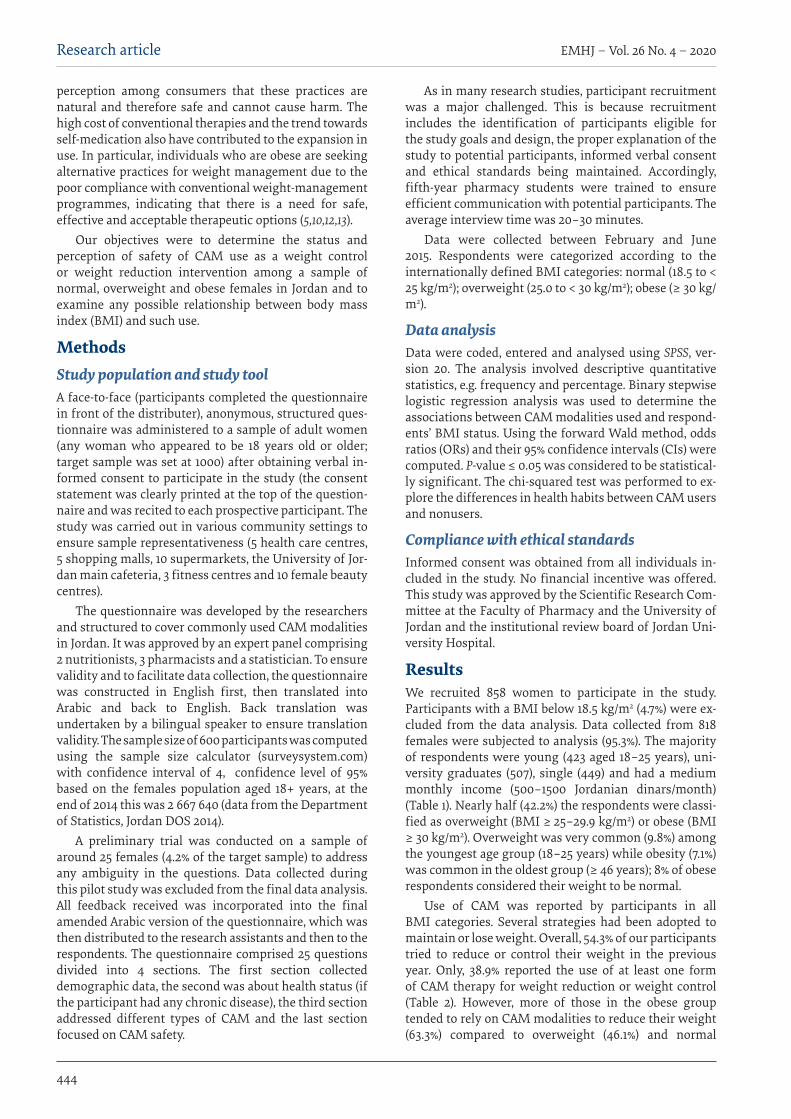
EMHJ – Vol. 26 No. 4 – 2020Research article
444
perception among consumers that these practices are natural and therefore safe and cannot cause harm. The high cost of conventional therapies and the trend towards self-medication also have contributed to the expansion in use. In particular, individuals who are obese are seeking alternative practices for weight management due to the poor compliance with conventional weight-management programmes, indicating that there is a need for safe, effective and acceptable therapeutic options (5,10,12,13).
Our objectives were to determine the status and perception of safety of CAM use as a weight control or weight reduction intervention among a sample of normal, overweight and obese females in Jordan and to examine any possible relationship between body mass index (BMI) and such use.
MethodsStudy population and study toolA face-to-face (participants completed the questionnaire in front of the distributer), anonymous, structured ques-tionnaire was administered to a sample of adult women (any woman who appeared to be 18 years old or older; target sample was set at 1000) after obtaining verbal in-formed consent to participate in the study (the consent statement was clearly printed at the top of the question-naire and was recited to each prospective participant. The study was carried out in various community settings to ensure sample representativeness (5 health care centres, 5 shopping malls, 10 supermarkets, the University of Jor-dan main cafeteria, 3 fitness centres and 10 female beauty centres).
The questionnaire was developed by the researchers and structured to cover commonly used CAM modalities in Jordan. It was approved by an expert panel comprising 2 nutritionists, 3 pharmacists and a statistician. To ensure validity and to facilitate data collection, the questionnaire was constructed in English first, then translated into Arabic and back to English. Back translation was undertaken by a bilingual speaker to ensure translation validity. The sample size of 600 participants was computed using the sample size calculator (surveysystem.com) with confidence interval of 4, confidence level of 95% based on the females population aged 18+ years, at the end of 2014 this was 2 667 640 (data from the Department of Statistics, Jordan DOS 2014).
A preliminary trial was conducted on a sample of around 25 females (4.2% of the target sample) to address any ambiguity in the questions. Data collected during this pilot study was excluded from the final data analysis. All feedback received was incorporated into the final amended Arabic version of the questionnaire, which was then distributed to the research assistants and then to the respondents. The questionnaire comprised 25 questions divided into 4 sections. The first section collected demographic data, the second was about health status (if the participant had any chronic disease), the third section addressed different types of CAM and the last section focused on CAM safety.
As in many research studies, participant recruitment was a major challenged. This is because recruitment includes the identification of participants eligible for the study goals and design, the proper explanation of the study to potential participants, informed verbal consent and ethical standards being maintained. Accordingly, fifth-year pharmacy students were trained to ensure efficient communication with potential participants. The average interview time was 20–30 minutes.
Data were collected between February and June 2015. Respondents were categorized according to the internationally defined BMI categories: normal (18.5 to < 25 kg/m2); overweight (25.0 to < 30 kg/m2); obese (≥ 30 kg/m2).
Data analysis Data were coded, entered and analysed using SPSS, ver-sion 20. The analysis involved descriptive quantitative statistics, e.g. frequency and percentage. Binary stepwise logistic regression analysis was used to determine the associations between CAM modalities used and respond-ents’ BMI status. Using the forward Wald method, odds ratios (ORs) and their 95% confidence intervals (CIs) were computed. P-value ≤ 0.05 was considered to be statistical-ly significant. The chi-squared test was performed to ex-plore the differences in health habits between CAM users and nonusers.
Compliance with ethical standardsInformed consent was obtained from all individuals in-cluded in the study. No financial incentive was offered. This study was approved by the Scientific Research Com-mittee at the Faculty of Pharmacy and the University of Jordan and the institutional review board of Jordan Uni-versity Hospital.
Results We recruited 858 women to participate in the study. Participants with a BMI below 18.5 kg/m2 (4.7%) were ex-cluded from the data analysis. Data collected from 818 females were subjected to analysis (95.3%). The majority of respondents were young (423 aged 18–25 years), uni-versity graduates (507), single (449) and had a medium monthly income (500–1500 Jordanian dinars/month) (Table 1). Nearly half (42.2%) the respondents were classi-fied as overweight (BMI ≥ 25–29.9 kg/m2) or obese (BMI ≥ 30 kg/m2). Overweight was very common (9.8%) among the youngest age group (18–25 years) while obesity (7.1%) was common in the oldest group (≥ 46 years); 8% of obese respondents considered their weight to be normal.
Use of CAM was reported by participants in all BMI categories. Several strategies had been adopted to maintain or lose weight. Overall, 54.3% of our participants tried to reduce or control their weight in the previous year. Only, 38.9% reported the use of at least one form of CAM therapy for weight reduction or weight control (Table 2). However, more of those in the obese group tended to rely on CAM modalities to reduce their weight (63.3%) compared to overweight (46.1%) and normal

Research article
445
EMHJ – Vol. 26 No. 4 – 2020
weight (28.9%) (Table 3).
Commercial dietary products (29.5%), herbal remedies (24.7%) and herbal dietary supplements (16.9%) were the most commonly used CAM modalities (Figure 1). Non-prescription medications (77; 9.4%), massage (28; 3.4%), aromatherapy (25; 3.1%), yoga (25; 3.1%) and acupuncture
(12; 1.5%) were less popular among participants (P < 0.05) (Figure 1).
The main source of information about herbal dietary products (19.4%) and herbal remedies (25.8%) was relatives and friends, followed by the herbalist (attar) (10.1% and 11.0% respectively), pharmacists (9.0% and 7.0%,
Table 1 Demographic characteristics of our sample of Jordanian women participants Characteristic Overall Normal weight Overweight Obese
No. % No. % No. %Sample size 818 471 57.6 219 26.8 128 15.6
Age (years)
18–25 423 330 78.0 80 18.9 13 3.1
26–30 78 46 59.0 22 28.2 10 12.8
31–35 69 34 49.3 22 31.9 13 18.8
36–40 56 18 32.1 27 48.2 11 19.6
41–45 74 22 29.7 30 40.5 22 29.7
≥ 46 114 19 16.7 37() 32.5 58 50.9
No answer a 4 2 1 1
Education level
Primary school 28 7 25.0 4 14.3 17 60.7
High school 98 30 30.6 35 35.7 33 33.7
Community college 113 45 39.8 33 29.2 35 31.0
University graduate 507 345 68.1 130 25.6 32 6.3
Postgraduate 59 37 62.7 13 22.0 9 15.3
No answer b 13 7 3 2
Income (JOD/month)b
Less than 500 (low) 156 73 46.8 44 28.2 39 25.0
500–1500 (medium) 420 262 62.4 105 25.0 53 12.6
More than 1500 (high) 217 122 56.2 62 28.6 33 15.2
No answer a 25 14 8 3
Marital status
Single 449 341 75.9 91 20.3 17 3.7
Married 328 121 36.9 116 12.2 91 27.4
Divorced 17 8 47.0 6 35.3 3 17.6
Widowed 22 1 4.5 5 22.7 16 72.7
No answer a 2 0 1 1
Occupation
School student 18 14 77.8 1 5.6 3 16.7
University student 336 262 78.0 67 19.9 7 2.1
Business owner 22 8 36.4 8 36.4 6 27.3
Private sector employee 84 57 67.9 18 21.4 9 10.7
Public sector employee 117 54 46.2 45 38.5 18 15.4
Housewife 188 53 29.2 66 35.1 69 36.7
Retired 13 2 15.4 2 15.4 9 69.2
Unemployed 23 11 47.8 8 34.8 4 17.4
Other 4 2 50.0 1 25.0 1 25.0
No answer a 13 8 3 2aNot included in statistical analysis. bUS$ 1 = JOD 0.71 (Jordanian dinars). Normal weight (18.5 to < 25 kg/m2); overweight (25.0 to < 30 kg/m2); obese (< 30 kg/m2).
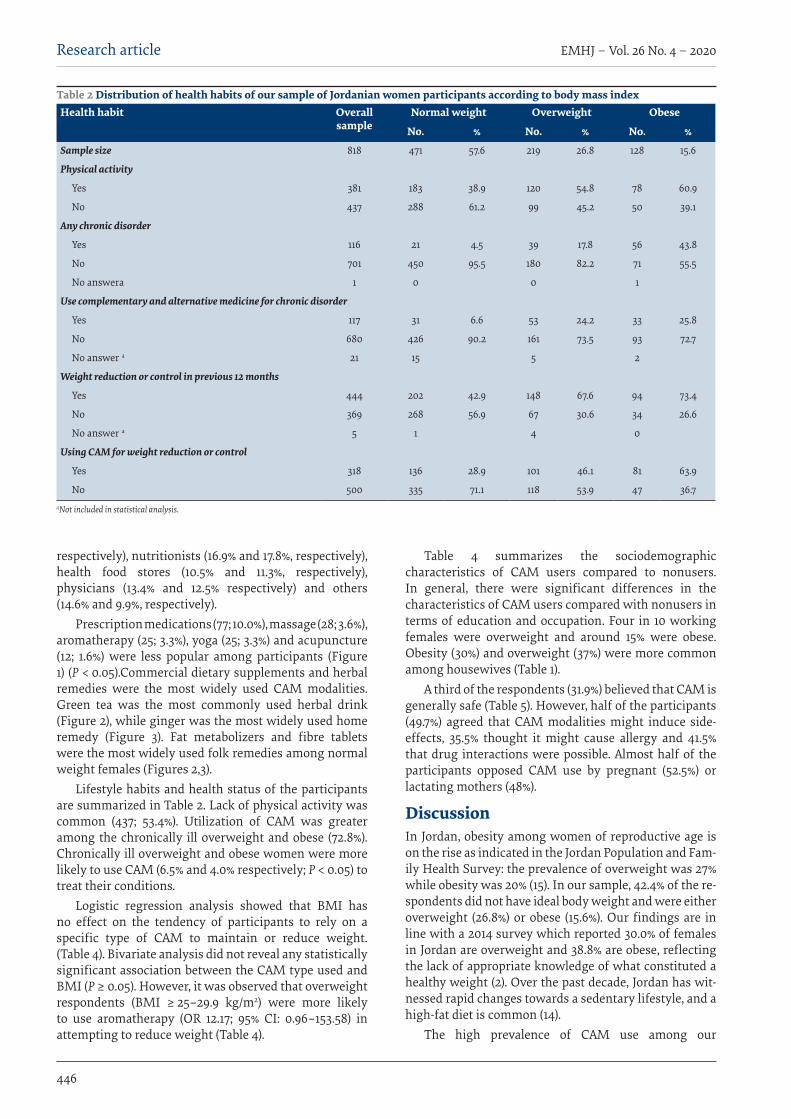
EMHJ – Vol. 26 No. 4 – 2020Research article
446
respectively), nutritionists (16.9% and 17.8%, respectively), health food stores (10.5% and 11.3%, respectively), physicians (13.4% and 12.5% respectively) and others (14.6% and 9.9%, respectively).
Prescription medications (77; 10.0%), massage (28; 3.6%), aromatherapy (25; 3.3%), yoga (25; 3.3%) and acupuncture (12; 1.6%) were less popular among participants (Figure 1) (P < 0.05).Commercial dietary supplements and herbal remedies were the most widely used CAM modalities. Green tea was the most commonly used herbal drink (Figure 2), while ginger was the most widely used home remedy (Figure 3). Fat metabolizers and fibre tablets were the most widely used folk remedies among normal weight females (Figures 2,3).
Lifestyle habits and health status of the participants are summarized in Table 2. Lack of physical activity was common (437; 53.4%). Utilization of CAM was greater among the chronically ill overweight and obese (72.8%). Chronically ill overweight and obese women were more likely to use CAM (6.5% and 4.0% respectively; P < 0.05) to treat their conditions.
Logistic regression analysis showed that BMI has no effect on the tendency of participants to rely on a specific type of CAM to maintain or reduce weight. (Table 4). Bivariate analysis did not reveal any statistically significant association between the CAM type used and BMI (P ≥ 0.05). However, it was observed that overweight respondents (BMI ≥ 25–29.9 kg/m2) were more likely to use aromatherapy (OR 12.17; 95% CI: 0.96–153.58) in attempting to reduce weight (Table 4).
Table 4 summarizes the sociodemographic characteristics of CAM users compared to nonusers. In general, there were significant differences in the characteristics of CAM users compared with nonusers in terms of education and occupation. Four in 10 working females were overweight and around 15% were obese. Obesity (30%) and overweight (37%) were more common among housewives (Table 1).
A third of the respondents (31.9%) believed that CAM is generally safe (Table 5). However, half of the participants (49.7%) agreed that CAM modalities might induce side-effects, 35.5% thought it might cause allergy and 41.5% that drug interactions were possible. Almost half of the participants opposed CAM use by pregnant (52.5%) or lactating mothers (48%).
Discussion In Jordan, obesity among women of reproductive age is on the rise as indicated in the Jordan Population and Fam-ily Health Survey: the prevalence of overweight was 27% while obesity was 20% (15). In our sample, 42.4% of the re-spondents did not have ideal body weight and were either overweight (26.8%) or obese (15.6%). Our findings are in line with a 2014 survey which reported 30.0% of females in Jordan are overweight and 38.8% are obese, reflecting the lack of appropriate knowledge of what constituted a healthy weight (2). Over the past decade, Jordan has wit-nessed rapid changes towards a sedentary lifestyle, and a high-fat diet is common (14).
The high prevalence of CAM use among our
Table 2 Distribution of health habits of our sample of Jordanian women participants according to body mass indexHealth habit Overall
sampleNormal weight Overweight Obese
No. % No. % No. %
Sample size 818 471 57.6 219 26.8 128 15.6
Physical activity
Yes 381 183 38.9 120 54.8 78 60.9
No 437 288 61.2 99 45.2 50 39.1
Any chronic disorder
Yes 116 21 4.5 39 17.8 56 43.8
No 701 450 95.5 180 82.2 71 55.5
No answera 1 0 0 1
Use complementary and alternative medicine for chronic disorder
Yes 117 31 6.6 53 24.2 33 25.8
No 680 426 90.2 161 73.5 93 72.7
No answer a 21 15 5 2
Weight reduction or control in previous 12 months
Yes 444 202 42.9 148 67.6 94 73.4
No 369 268 56.9 67 30.6 34 26.6
No answer a 5 1 4 0
Using CAM for weight reduction or control
Yes 318 136 28.9 101 46.1 81 63.9
No 500 335 71.1 118 53.9 47 36.7aNot included in statistical analysis.

Research article
447
EMHJ – Vol. 26 No. 4 – 2020
participants, mainly among those who were overweight, may be attributed to several factors. According to previous studies, influencing factors might include; the accessibility and availability of CAM products; the discrepancy between the expectations of the participants and the results achieved with conventional calorie reduction plans leading to a negative perception for their weight loss pattern; believing that CAM modalities are safe; difficulty in maintaining a healthy lifestyle; and
the low rate of fulfilment of the objectives of a weight management nutrition plan (5,16,17).
Our study indicated that both young females (18–25 years old) 45.6% and older individuals (≥ 46 years old) 17.6% were more likely to use CAM. Green tea is the second most popular beverage worldwide after water (18) and we found it to be the most commonly used herbal drink by normal, overweight and obese participants
Table 3 Comparison of sociodemographic characteristics of complementary and alternative medicine users and nonusers in a sample of Jordanian women (n = 818)Characteristic CAM user CAM non-user P-value
No. % No. %BMI
Normal 136 28.9a 335 71.1a < 0.001
Overweight 101 46.1a 118 53.9a
Obese 81 63.3a 47 36.7a
Age (years) 318
18–25 145 45.6 278 55.0 < 0.05
26–30 31 9.7 47 9.4
31–35 24 7.5 45 9.0
36–40 23 7.2 33 6.6
41–45 36 11.3 38 7.6
≥ 46 56 17.6 58 11.6
Income (JOD/month)b
Less than 500 (low) 57 7.0 99 12.1 0.145
500–1500 (medium) 154 18.8 266 32.5
More than 1500 (high) 100 12.2 117 14.3
No answer c 7 18
Education
Primary school 6 0.7 22 2.7 0.024
High school 42 5.1 56 6.8
Community college 55 6.7 58 7.1
University graduate 184 22.5 323 39.5
Postgraduate 27 3. 3 32 3.9
No answer c 4 9
Occupation
School student 3 0. 4 15 1.8 < 0.001
University student 107 13.1 229 28.0
Business owner 11 1.3 11 1.3
Private sector employee 30 3.7 54 6.6
Public sector employee 47 5.8 70 8.6
Housewife 96 11.8 92 11.3
Retired 8 1.0 5 0.6
Unemployed 10 1.2 13 1.6
Other 0 0.0 4 0.5
No answer c 5 7aCalculated from the corresponding group. bUS$ 1 = JOD 0.71 (Jordanian dinars). cNot included in statistical analysis. P-value was based on chi-squared test, P < 0.05; P < 0.001. Body mass index (BMI): normal (18.5 to < 25 kg/m2); overweight (25.0 to < 30 kg/m2); obese (≥ 30 kg/m2).
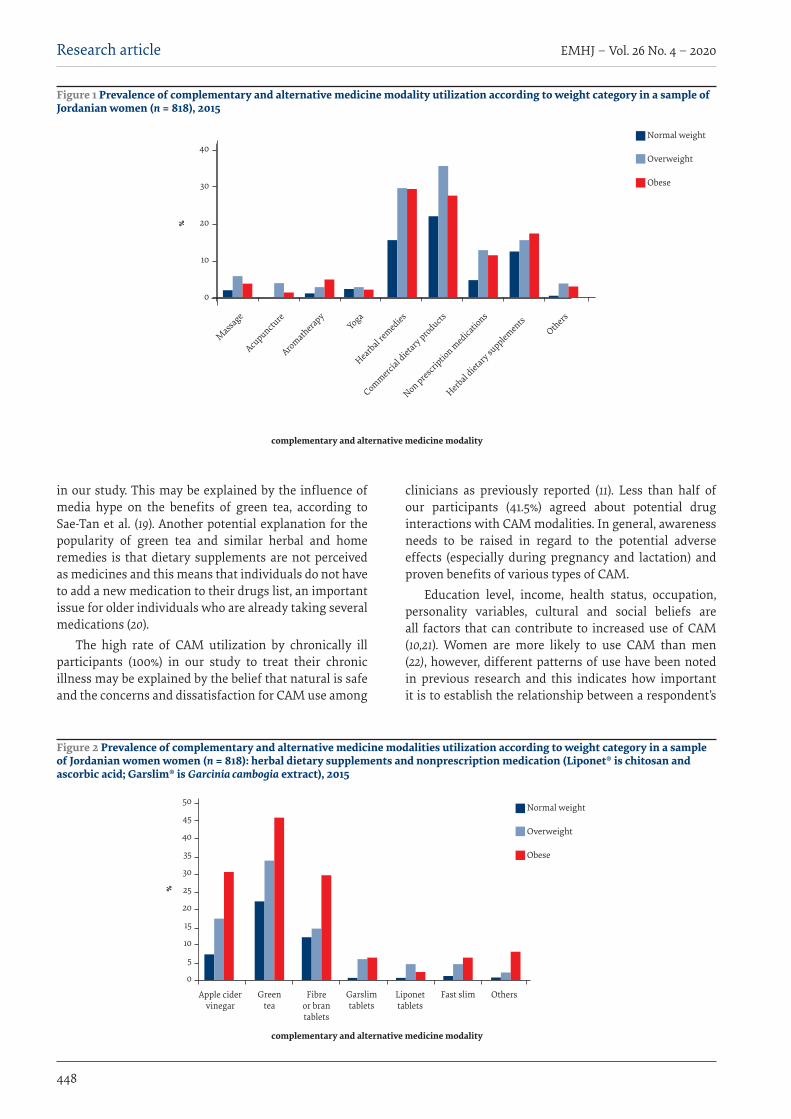
EMHJ – Vol. 26 No. 4 – 2020Research article
448
in our study. This may be explained by the influence of media hype on the benefits of green tea, according to Sae-Tan et al. (19). Another potential explanation for the popularity of green tea and similar herbal and home remedies is that dietary supplements are not perceived as medicines and this means that individuals do not have to add a new medication to their drugs list, an important issue for older individuals who are already taking several medications (20).
The high rate of CAM utilization by chronically ill participants (100%) in our study to treat their chronic illness may be explained by the belief that natural is safe and the concerns and dissatisfaction for CAM use among
clinicians as previously reported (11). Less than half of our participants (41.5%) agreed about potential drug interactions with CAM modalities. In general, awareness needs to be raised in regard to the potential adverse effects (especially during pregnancy and lactation) and proven benefits of various types of CAM.
Education level, income, health status, occupation, personality variables, cultural and social beliefs are all factors that can contribute to increased use of CAM (10,21). Women are more likely to use CAM than men (22), however, different patterns of use have been noted in previous research and this indicates how important it is to establish the relationship between a respondent’s
Figure 1 Prevalence of complementary and alternative medicine modality utilization according to weight category in a sample of Jordanian women (n = 818), 2015
Normal weight
Overweight
Obese
40
30
20
10
0
complementary and alternative medicine modality
Massa
ge
%
Acupunctu
re
AromatherapyYoga
Hearbal remedies
Commercial d
ietary products
Non prescriptio
n medica
tions
Herbal dietary su
pplementsOthers
50
45
40
35
30
25
20
15
10
5
0
%
Apple cider vinegar
Green tea
Fibre or bran tablets
Garslim tablets
Liponet tablets
Fast slim Others
Normal weight
Overweight
Obese
Figure 2 Prevalence of complementary and alternative medicine modalities utilization according to weight category in a sample of Jordanian women women (n = 818): herbal dietary supplements and nonprescription medication (Liponet® is chitosan and ascorbic acid; Garslim® is Garcinia cambogia extract), 2015
complementary and alternative medicine modality
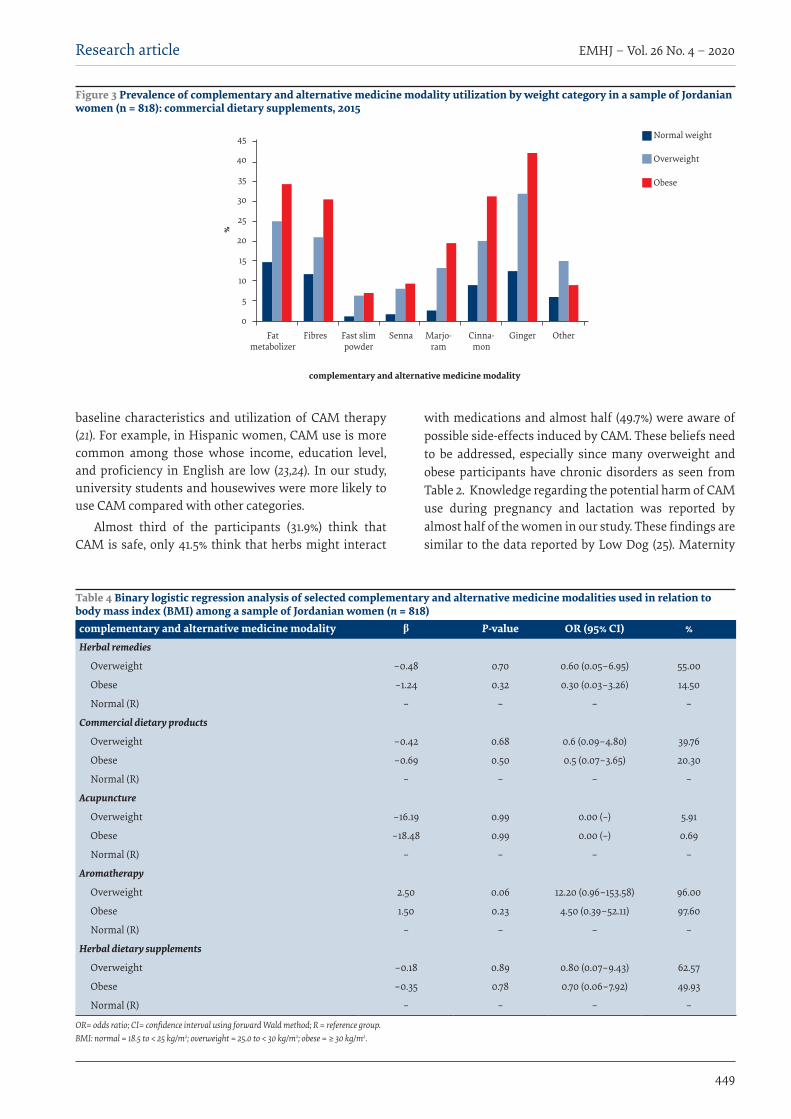
Research article
449
EMHJ – Vol. 26 No. 4 – 2020
Table 4 Binary logistic regression analysis of selected complementary and alternative medicine modalities used in relation to body mass index (BMI) among a sample of Jordanian women (n = 818)complementary and alternative medicine modality β P-value OR (95% CI) %Herbal remedies
Overweight –0.48 0.70 0.60 (0.05–6.95) 55.00
Obese –1.24 0.32 0.30 (0.03–3.26) 14.50
Normal (R) – – – –
Commercial dietary products
Overweight –0.42 0.68 0.6 (0.09–4.80) 39.76
Obese –0.69 0.50 0.5 (0.07–3.65) 20.30
Normal (R) – – – –
Acupuncture
Overweight –16.19 0.99 0.00 (–) 5.91
Obese –18.48 0.99 0.00 (–) 0.69
Normal (R) – – – –
Aromatherapy
Overweight 2.50 0.06 12.20 (0.96–153.58) 96.00
Obese 1.50 0.23 4.50 (0.39–52.11) 97.60
Normal (R) – – – –
Herbal dietary supplements
Overweight –0.18 0.89 0.80 (0.07–9.43) 62.57
Obese –0.35 0.78 0.70 (0.06–7.92) 49.93
Normal (R) – – – –
OR= odds ratio; CI= confidence interval using forward Wald method; R = reference group. BMI: normal = 18.5 to < 25 kg/m2; overweight = 25.0 to < 30 kg/m2; obese = ≥ 30 kg/m2.
Normal weight
Overweight
Obese
45
40
35
30
25
20
15
10
5
0
%
Fat metabolizer
Fibres Fast slim powder
Senna Marjo-ram
Cinna-mon
Ginger Other
Figure 3 Prevalence of complementary and alternative medicine modality utilization by weight category in a sample of Jordanian women (n = 818): commercial dietary supplements, 2015
baseline characteristics and utilization of CAM therapy (21). For example, in Hispanic women, CAM use is more common among those whose income, education level, and proficiency in English are low (23,24). In our study, university students and housewives were more likely to use CAM compared with other categories.
Almost third of the participants (31.9%) think that CAM is safe, only 41.5% think that herbs might interact
with medications and almost half (49.7%) were aware of possible side-effects induced by CAM. These beliefs need to be addressed, especially since many overweight and obese participants have chronic disorders as seen from Table 2. Knowledge regarding the potential harm of CAM use during pregnancy and lactation was reported by almost half of the women in our study. These findings are similar to the data reported by Low Dog (25). Maternity
complementary and alternative medicine modality
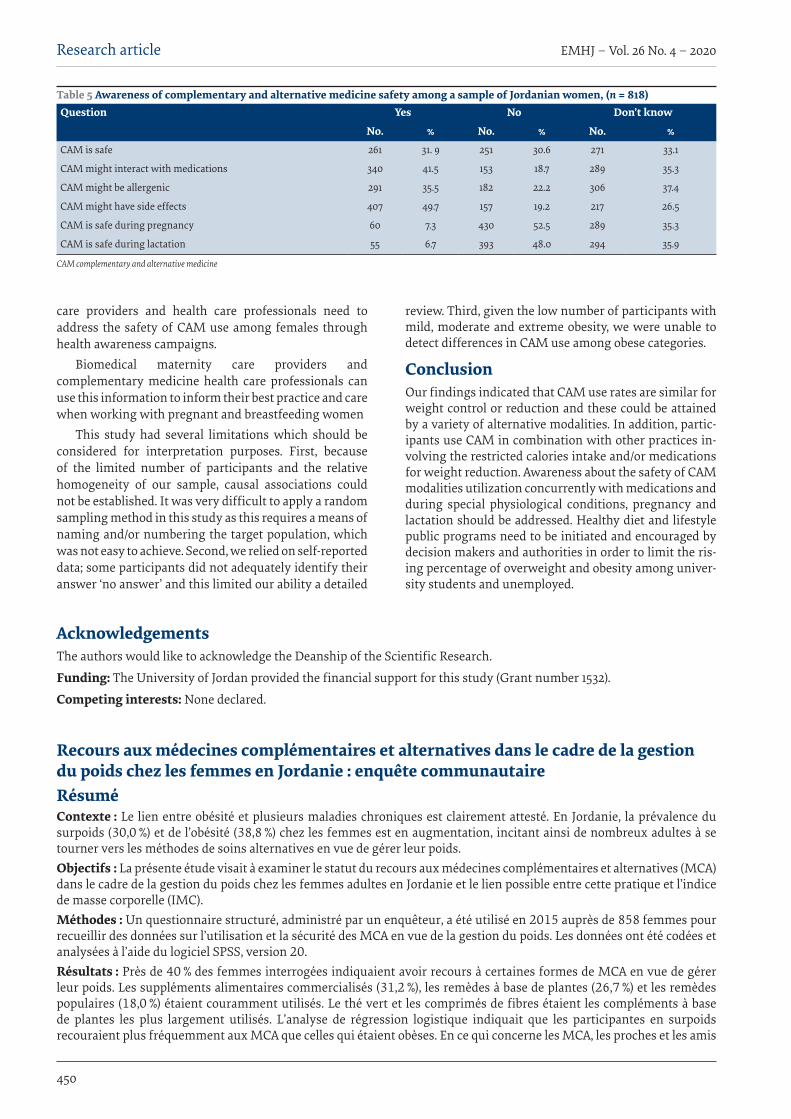
EMHJ – Vol. 26 No. 4 – 2020Research article
450
AcknowledgementsThe authors would like to acknowledge the Deanship of the Scientific Research.
Funding: The University of Jordan provided the financial support for this study (Grant number 1532).
Competing interests: None declared.
Table 5 Awareness of complementary and alternative medicine safety among a sample of Jordanian women, (n = 818)Question Yes No Don’t know
No. % No. % No. %CAM is safe 261 31. 9 251 30.6 271 33.1
CAM might interact with medications 340 41.5 153 18.7 289 35.3
CAM might be allergenic 291 35.5 182 22.2 306 37.4
CAM might have side effects 407 49.7 157 19.2 217 26.5
CAM is safe during pregnancy 60 7.3 430 52.5 289 35.3
CAM is safe during lactation 55 6.7 393 48.0 294 35.9
CAM complementary and alternative medicine
care providers and health care professionals need to address the safety of CAM use among females through health awareness campaigns.
Biomedical maternity care providers and complementary medicine health care professionals can use this information to inform their best practice and care when working with pregnant and breastfeeding women
This study had several limitations which should be considered for interpretation purposes. First, because of the limited number of participants and the relative homogeneity of our sample, causal associations could not be established. It was very difficult to apply a random sampling method in this study as this requires a means of naming and/or numbering the target population, which was not easy to achieve. Second, we relied on self-reported data; some participants did not adequately identify their answer ‘no answer’ and this limited our ability a detailed
review. Third, given the low number of participants with mild, moderate and extreme obesity, we were unable to detect differences in CAM use among obese categories.
ConclusionOur findings indicated that CAM use rates are similar for weight control or reduction and these could be attained by a variety of alternative modalities. In addition, partic-ipants use CAM in combination with other practices in-volving the restricted calories intake and/or medications for weight reduction. Awareness about the safety of CAM modalities utilization concurrently with medications and during special physiological conditions, pregnancy and lactation should be addressed. Healthy diet and lifestyle public programs need to be initiated and encouraged by decision makers and authorities in order to limit the ris-ing percentage of overweight and obesity among univer-sity students and unemployed.
Recours aux médecines complémentaires et alternatives dans le cadre de la gestion du poids chez les femmes en Jordanie : enquête communautaireRésumé Contexte : Le lien entre obésité et plusieurs maladies chroniques est clairement attesté. En Jordanie, la prévalence du surpoids (30,0 %) et de l’obésité (38,8 %) chez les femmes est en augmentation, incitant ainsi de nombreux adultes à se tourner vers les méthodes de soins alternatives en vue de gérer leur poids.Objectifs : La présente étude visait à examiner le statut du recours aux médecines complémentaires et alternatives (MCA) dans le cadre de la gestion du poids chez les femmes adultes en Jordanie et le lien possible entre cette pratique et l’indice de masse corporelle (IMC).Méthodes : Un questionnaire structuré, administré par un enquêteur, a été utilisé en 2015 auprès de 858 femmes pour recueillir des données sur l’utilisation et la sécurité des MCA en vue de la gestion du poids. Les données ont été codées et analysées à l’aide du logiciel SPSS, version 20.Résultats : Près de 40 % des femmes interrogées indiquaient avoir recours à certaines formes de MCA en vue de gérer leur poids. Les suppléments alimentaires commercialisés (31,2 %), les remèdes à base de plantes (26,7 %) et les remèdes populaires (18,0 %) étaient couramment utilisés. Le thé vert et les comprimés de fibres étaient les compléments à base de plantes les plus largement utilisés. L’analyse de régression logistique indiquait que les participantes en surpoids recouraient plus fréquemment aux MCA que celles qui étaient obèses. En ce qui concerne les MCA, les proches et les amis
Research article
451
EMHJ – Vol. 26 No. 4 – 2020
References1. James PT. Obesity: the worldwide epidemic. Clin Dermatol. 2004;22(4):276–80. PMID:15475226
2. Al Nsour M, Al Kayyali G, Naffa S. Overweight and obesity among Jordanian women and their social determinants. East Medi-terr Health J. 2014;19(12):1014. PMID:24684099
3. Khader Y, Batieha A, Ajlouni H, El-Khateeb M, Ajlouni K. Obesity in Jordan: prevalence, associated factors, comorbidities, and change in prevalence over ten years. Metab Syndr Relat Disord. 2008 Jun;6(2):113–20. doi:10.1089/met.2007.0030
4. Pittler MH, Ernst E. Dietary supplements for body-weight reduction: a systematic review. Am J Clin Nutr. 2004 Apr;79(4):529–36.PMID:15051593
5. Amariles P, González LI, Giraldo NA. Prevalence of self-treatment with complementary products and therapies for weight Loss: A randomized, cross-sectional study in overweight and obese patients in Colombia. Curr Ther Res Clin Exp. 2006 Jan;67(1):66–78. doi:10.1016/j.curtheres.2006.02.001
6. Ajlouni K, Jaddou H, Batieha A. Obesity in Jordan. Int J Obes Relat Metab Disord. 1998 Jul;22(7):624–8. PMID:9705020
7. Zoorob R, Chakrabarty S, O’Hara H, Kihlberg C. Which CAM modalities are worth considering? J Fam Pract. 2014;63(10):585. PMID:25343156
8. Sharpe PA, Blanck HM, Williams JE, Ainsworth BE, Conway JM. Use of complementary and alternative medicine for weight control in the United States. J Altern Complement Med.. 2007;13(2):217–22. doi:10.1089/act.2007.13407
9. Wazaify M, Alawwa I, Yasein N, Al-Saleh A, Afifi FU. Complementary and alternative medicine (CAM) use among Jordanian patients with chronic diseases. Complement Ther Clin Pract. 2013 Aug;19(3):153–7. doi:10.1016/j.ctcp.2013.03.001
10. Barnes PM, Bloom B, Nahin RL. Complementary and alternative medicine use among adults and children: United States, 2007. Hyattsville: US Department of Health and Human Services, Centers for Disease Control and Prevention; 2008.
11. Shehadeh M, Suaifan G, Darwish R. Complementary and alternative modalities; a new vein in weight control and reduction interventions. A pilot study in Jordan. Int J Biol Biomed. 2017;2:1–5.
constituaient les principales sources d’information. Seuls 31,9 % des femmes estimaient que les modalités du recours aux MCA étaient sûres ; près de la moitié pensaient que ces types de médecines n’étaient pas recommandées pendant la grossesse (52,5 %) et l’allaitement (48,0 %). Seulement 49,7 % avaient connaissance des effets secondaires et 41,5 % des interactions médicamenteuses. Conclusion : Cette étude a révélé que les MCA sont souvent utilisées dans la cadre de la gestion du poids. Il convient d’augmenter la sensibilisation à l’égard de cette pratique en association avec d’autres médicaments et pendant la grossesse et l’allaitement.
استخدام الطب التكمييل والبديل للتحكم بالوزن بني اإلناث يف األردن: مسح جمتمعيميادة بشري شحادة، غدير اسعيفان، آالء أبو عودة، رىل درويش
اخلالصة اخللفية: هناك توثيق جيد للعالقة بني البدانة واإلصابة بمختلف األمراض املزمنة. ويف األردن، يزداد معدل انتشار زيادة الوزن (%30.0) والبدانة (%38.8) بني اإلناث عىل نحو مطرد، األمر الذي دفع الكثري من البالغني إىل االعتامد عىل وسائل الرعاية الصحية البديلة من أجل التحكم يف أوزاهنم.
األهداف: هدفت الدراسة إىل الكشف عن مدى وضع استخدام الطب التكمييل والبديل من أجل التحكم يف الوزن بني اإلناث البالغات يف األردن والعالقة املحتملة بني استخدام الطب التكمييل والبديل ومؤرش كتلة اجلسم.
طرق البحث: اْسُتخدم استبيان قائم عىل إجراء املقابالت بصورة منظمة من أجل مجع بيانات من 858 سيدة يف عام 2015 حول استخدام الطب زت استجابات املشاركات وخضعت للتحليل باستخدام اإلصدار 20 من برنامج التكمييل والبديل ومأمونيته فيام يتعلق بالتحكم يف الوزن. وُرمِّ
.SPSS
النتائج: أبلغ %40 من املشاركات باستخدامهن نوعا من أنواع الطب التكمييل والبديل للتحكم يف أوزاهنن. وتبني شيوع استخدام املكمالت الغذائية التجارية (%31.2)، والعالجات العشبية (%26.7) والعالجات الشعبية (%18.0). وكان الشاي األخرض وأقراص األلياف هي األكثر استخداما من التكمييل للطب املستخدمات أكثر هن الزائد الوزن ذوات املشاركات أن اللوجستي االنحدار حتليل وأوضح األخرى. العشبية املكمالت بني والبديل، مقارنة باملشاركات البدينات. وكان األقارب واألصدقاء هم املصدر الرئييس للمعلومات بشأن الطب التكمييل والطب البديل. واعتقد %31.9 فقط من النساء أن األساليب املتبعة يف الطب التكمييل والطب البديل مأمونة؛ بينام اعتقد نحو نصف النساء أن تلك األساليب غري مأمونة
أثناء احلمل (%52.5) وأثناء اإلرضاع (%48.0). وكان %49.7 فقط عىل وعي باآلثار اجلانبية، و %41.5 عىل وعي بالتفاعالت الدوائية. االستنتاج: كشفت هذه الدراسة عن استخدام الطب التكمييل والطب البديل يف كثري من األحيان بغرض التحكم يف الوزن. ولذا، يتعني التصدي
إلذكاء الوعي باالستخدام اآلمن للطب التكمييل والطب البديل مع األدوية األخرى وأثناء احلمل واإلرضاع.
EMHJ – Vol. 26 No. 4 – 2020Research article
452
12. Calixto JB. Efficacy, safety, quality control, marketing and regulatory guidelines for herbal medicines (phytotherapeutic agents). Braz J Med Biol Res. 2000;33(2):179–89. doi:10.1590/s0100-879x2000000200004
13. Awad A, Al-Shaye D. Public awareness, patterns of use and attitudes toward natural health products in Kuwait: a cross-sectional survey. BMC Complement Altern Med. 2014 Mar 19;14:105. doi:10.1186/1472-6882-14-105
14. Abumweis S, Tayyem R, Bawadi H, Al-Hazzaa H, Abdulrahman O. Eating habits, physical activity, and sedentary behaviors of Jordanian adolescents’ residents of Amman. Mediterr J Nutrit Metabol. 2014. 67–74.
15. Jordan Population and Family Health Survey. Amman: Department of Statistics; Calverton, Maryland: Macro International, 2008.
16. Thompson RL, Thomas DE. A cross-sectional survey of the opinions on weight loss treatments of adult obese patients attending a dietetic clinic. Int J Obes Relat Metab Disord. 2000 Feb;24(2):164–70. PMID:10702766
17. Foster GD, Wadden TA, Phelan S, Sarwer DB, Sanderson RS. Obese patients’ perceptions of treatment outcomes and the factors that influence them. Arch Intern Med. 2001;161(17):2133–9. doi:10.1001/archinte.161.17.2133
18. Brandt PA. Coffee or tea? A prospective cohort study on the associations of coffee and tea intake with overall and cause-specfic mortality in men versus women. Eur. J. Epidemiol. 2018; 33:183–200. doi:/10.1007/s10654-018-0359-y
19. Sae-Tan S, Grove KA, Lambert JD. Weight control and prevention of metabolic syndrome by green tea. Pharmacol Res. 2011 Aug;64(2):146–54. doi:10.1016/j.phrs.2010.12.013.
20. Shehadeh M. Complementary and alternative modalities; a new vein in weight control and reduction interventions. A pilot study in Jordan. Int J Biol Biomed. 2017;2:1–5.
21. Barnes PM, Powell-Griner E, McFann K, Nahin RL, eds. Complementary and alternative medicine use among adults: United States, 2002. Seminars in Integrative Medicine; 2004:2(2):64–71.
22. Bardaweel S, Shehadeh M, Suaifan G, Kilani M-V. Complementary and alternative medicine utilization by a sample of in-fertile couples in Jordan for infertility treatment: Clinics-Based Survey. BMC Complement Altern Med. 2013 Feb 16;13:35. doi:10.1186/1472-6882-13-35
23. Mikhail N, Wali S, Ziment I. Use of alternative medicine among Hispanics. J Altern Complement Med. 2004;10(5):851–9. doi:10.1089/acm.2004.10.851
24. Chao MT, Wade C, Kronenberg F, Kalmuss D, Cushman LF. Women’s reasons for complementary and alternative medicine use: Racial/ethnic differences. J Altern Complement Med. 2006;12(8):719–20. doi:10.1089/acm.2006.12.719
25. Low Dog T. The use of botanicals during pregnancy and lactation. Altern Ther Health Med., 2009; 15(1):54-8. PMID:19161049
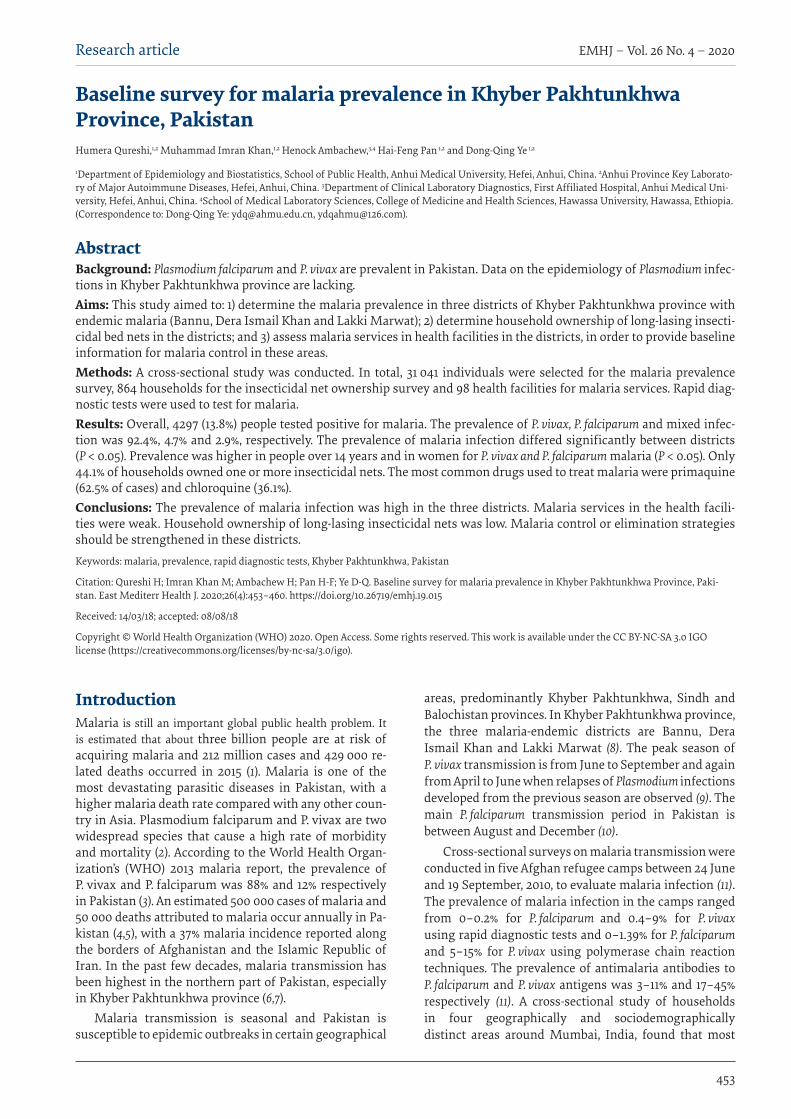
Research article
453
EMHJ – Vol. 26 No. 4 – 2020
Baseline survey for malaria prevalence in Khyber Pakhtunkhwa Province, Pakistan Humera Qureshi,1,2 Muhammad Imran Khan,1,2 Henock Ambachew,3,4 Hai-Feng Pan 1,2 and Dong-Qing Ye 1,2
1Department of Epidemiology and Biostatistics, School of Public Health, Anhui Medical University, Hefei, Anhui, China. 2Anhui Province Key Laborato-ry of Major Autoimmune Diseases, Hefei, Anhui, China. 3Department of Clinical Laboratory Diagnostics, First Affiliated Hospital, Anhui Medical Uni-versity, Hefei, Anhui, China. 4School of Medical Laboratory Sciences, College of Medicine and Health Sciences, Hawassa University, Hawassa, Ethiopia. (Correspondence to: Dong-Qing Ye: [email protected], [email protected]).
IntroductionMalaria is still an important global public health problem. It is estimated that about three billion people are at risk of acquiring malaria and 212 million cases and 429 000 re-lated deaths occurred in 2015 (1). Malaria is one of the most devastating parasitic diseases in Pakistan, with a higher malaria death rate compared with any other coun-try in Asia. Plasmodium falciparum and P. vivax are two widespread species that cause a high rate of morbidity and mortality (2). According to the World Health Organ-ization’s (WHO) 2013 malaria report, the prevalence of P. vivax and P. falciparum was 88% and 12% respectively in Pakistan (3). An estimated 500 000 cases of malaria and 50 000 deaths attributed to malaria occur annually in Pa-kistan (4,5), with a 37% malaria incidence reported along the borders of Afghanistan and the Islamic Republic of Iran. In the past few decades, malaria transmission has been highest in the northern part of Pakistan, especially in Khyber Pakhtunkhwa province (6,7).
Malaria transmission is seasonal and Pakistan is susceptible to epidemic outbreaks in certain geographical
areas, predominantly Khyber Pakhtunkhwa, Sindh and Balochistan provinces. In Khyber Pakhtunkhwa province, the three malaria-endemic districts are Bannu, Dera Ismail Khan and Lakki Marwat (8). The peak season of P. vivax transmission is from June to September and again from April to June when relapses of Plasmodium infections developed from the previous season are observed (9). The main P. falciparum transmission period in Pakistan is between August and December (10).
Cross-sectional surveys on malaria transmission were conducted in five Afghan refugee camps between 24 June and 19 September, 2010, to evaluate malaria infection (11). The prevalence of malaria infection in the camps ranged from 0–0.2% for P. falciparum and 0.4–9% for P. vivax using rapid diagnostic tests and 0–1.39% for P. falciparum and 5–15% for P. vivax using polymerase chain reaction techniques. The prevalence of antimalaria antibodies to P. falciparum and P. vivax antigens was 3–11% and 17–45% respectively (11). A cross-sectional study of households in four geographically and sociodemographically distinct areas around Mumbai, India, found that most
AbstractBackground: Plasmodium falciparum and P. vivax are prevalent in Pakistan. Data on the epidemiology of Plasmodium infec-tions in Khyber Pakhtunkhwa province are lacking. Aims: This study aimed to: 1) determine the malaria prevalence in three districts of Khyber Pakhtunkhwa province with endemic malaria (Bannu, Dera Ismail Khan and Lakki Marwat); 2) determine household ownership of long-lasing insecti-cidal bed nets in the districts; and 3) assess malaria services in health facilities in the districts, in order to provide baseline information for malaria control in these areas. Methods: A cross-sectional study was conducted. In total, 31 041 individuals were selected for the malaria prevalence survey, 864 households for the insecticidal net ownership survey and 98 health facilities for malaria services. Rapid diag-nostic tests were used to test for malaria. Results: Overall, 4297 (13.8%) people tested positive for malaria. The prevalence of P. vivax, P. falciparum and mixed infec-tion was 92.4%, 4.7% and 2.9%, respectively. The prevalence of malaria infection differed significantly between districts (P < 0.05). Prevalence was higher in people over 14 years and in women for P. vivax and P. falciparum malaria (P < 0.05). Only 44.1% of households owned one or more insecticidal nets. The most common drugs used to treat malaria were primaquine (62.5% of cases) and chloroquine (36.1%).Conclusions: The prevalence of malaria infection was high in the three districts. Malaria services in the health facili-ties were weak. Household ownership of long-lasing insecticidal nets was low. Malaria control or elimination strategies should be strengthened in these districts. Keywords: malaria, prevalence, rapid diagnostic tests, Khyber Pakhtunkhwa, Pakistan
Citation: Qureshi H; Imran Khan M; Ambachew H; Pan H-F; Ye D-Q. Baseline survey for malaria prevalence in Khyber Pakhtunkhwa Province, Paki-stan. East Mediterr Health J. 2020;26(4):453–460. https://doi.org/10.26719/emhj.19.015
Received: 14/03/18; accepted: 08/08/18
Copyright © World Health Organization (WHO) 2020. Open Access. Some rights reserved. This work is available under the CC BY-NC-SA 3.0 IGO license (https://creativecommons.org/licenses/by-nc-sa/3.0/igo).

EMHJ – Vol. 26 No. 4 – 2020Research article
454
households were familiar with bed nets as an essential control strategy, but only 30% used them and only 4% used insecticide-treated bed nets. Prevention practices and knowledge differed across the four areas (12). A study in the Federally Administrated Tribal Areas of Pakistan reported that, 626 of 691 patients of all age groups and both sexes were positive for malaria using polymerase chain reaction. Among these positive cases, P. vivax (81.1%), P. falciparum (13.8%) and mixed infections (4.9%) containing both P. falciparum and P. vivax were reported (11).
An epidemiological study was conducted in some areas of Pakistan but investigation of malaria transmission on a nationwide scale has been hindered by the shortage of data from several areas (10). Surveillance of and reporting methods for Plasmodium infections are weak and epidemiological data inadequate.
It is most important to understand the burden of malaria in a specific area to obtain usable information for different stakeholders involved in prevention and control of malaria. Therefore, the present study aimed to determine the baseline burden of malaria and health facilities providing malaria services in three endemic districts of Khyber Pakhtunkhwa, Pakistan.
MethodsStudy design, area and periodThis was a cross-sectional study conducted in three dis-tricts of Khyber Pakhtunkhwa with endemic malaria: Bannu, Dera Ismail Khan and Lakki Marwat districts. The estimated total population in the study area was 3 634 186 (1 218 416 in Bannu, 1 239 247 in Dera Ismail Khan, and 1 176 523 in Lakki Marwat). The study was done between August and October 2015, which is the peak season for malaria transmission.
Before the survey, in 2014, the prevalence of malaria had peaked for several reasons, mainly socioeconomic as a result of an unstable political environment and the migration of people from North Waziristan to neighbouring districts in Khyber Pakhtunkhwa. A total of 950 000 people were displaced (73% women and children) and were resettled in local communities and camps (13).
Sample selection All 98 health care centres offering rapid diagnostic test-ing for malaria were surveyed in the three endemic dis-tricts (36 in Bannu, 37 in Dera Ismail Khan and 25 in Lak-ki Marwat). <body 1>Epidemiological data were obtained using a multistage cluster sampling technique: health care centres were first selected followed by simple ran-dom selection of households in urban and rural areas of the three districts. A total of 31 041 individuals and 864 households were included in this study. The strata were urban and rural locations. The data were categorized ac-cording to sex, age and Plasmodium species.
Rapid diagnostic test Malaria rapid diagnostic tests detect evidence of malaria
parasites in human blood. These tests allow reliable de-tection of malaria infections especially in remote areas with limited access to good quality microscopy services. Rapid diagnostic tests are comparatively easy to perform and interpret; they rapidly provide results, require lim-ited training and allow malaria diagnosis by the public. These tests detect specific antigens produced by malaria parasites that exist in the blood of an infected individual. Some rapid diagnostic test kits detect a single species, ei-ther P. vivax or P. falciparum, some detect multiple species (P. vivax, P. falciparum, P. ovale and P. malariae) and some can differentiate between P. falciparum and non-P. falciparum infections. For rapid diagnostic tests, blood is usually ob-tained from a finger-prick and results are available with-in 15–30 minutes.
Data collectionThe main data collection tool used in this study was a sur-vey questionnaire, which consisted of three parts: regis-tration form for the rapid diagnostic test, malaria facility service form for the health care centres and a long-lasting insecticidal nets (LLINs) form for households. Demo-graphic data including age, sex, place of residence, the name of the health care centre, individual identification code were incorporated in the database for the rapid di-agnostic test examination. The form on LLINs comprised questions on the family size and the total number of LLINs. The malaria facility service form comprised infor-mation on malaria diagnosis, treatment and LLIN distri-bution at the health care centre.
To assure the quality of data collected, a variety of quality control activities were implemented. Data collectors were trained, rapid diagnostic tests were rechecked (10% positive and 20% negative), experienced professionals provided supervision, and the integrity and completeness of the data were monitored.
Data analysisSPSS, version 23 was used for data analysis. Means and standard deviations (SD) were calculated for continuous variables and frequencies and percentages for categorical variables. The chi-squared test was used to explore the relationship between categorical variables. P ≤ 0.05 was considered statistically significant.
Ethical considerations Ethical clearance for the study was obtained from the Institutional Review Board of Anhui Medical University, China. Permission to conduct the research and relevant information was obtained from the Directorate of the Malaria Control Programme, Pakistan.
For the LLIN survey, we obtained verbal consent from the householders who filled the questionnaires and were interviewed.
ResultsFigure 1 shows the overall rate of malaria diagnosis at health centres and net ownership in households.
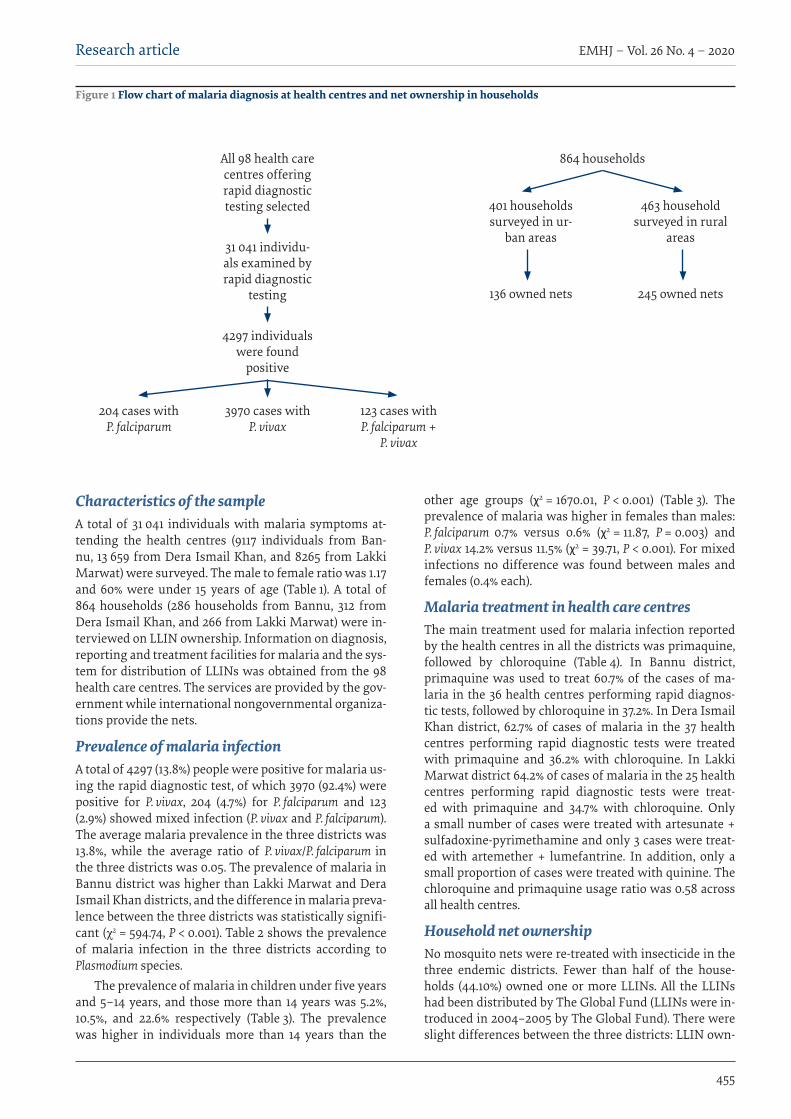
Research article
455
EMHJ – Vol. 26 No. 4 – 2020
Characteristics of the sampleA total of 31 041 individuals with malaria symptoms at-tending the health centres (9117 individuals from Ban-nu, 13 659 from Dera Ismail Khan, and 8265 from Lakki Marwat) were surveyed. The male to female ratio was 1.17 and 60% were under 15 years of age (Table 1). A total of 864 households (286 households from Bannu, 312 from Dera Ismail Khan, and 266 from Lakki Marwat) were in-terviewed on LLIN ownership. Information on diagnosis, reporting and treatment facilities for malaria and the sys-tem for distribution of LLINs was obtained from the 98 health care centres. The services are provided by the gov-ernment while international nongovernmental organiza-tions provide the nets.
Prevalence of malaria infectionA total of 4297 (13.8%) people were positive for malaria us-ing the rapid diagnostic test, of which 3970 (92.4%) were positive for P. vivax, 204 (4.7%) for P. falciparum and 123 (2.9%) showed mixed infection (P. vivax and P. falciparum). The average malaria prevalence in the three districts was 13.8%, while the average ratio of P. vivax/P. falciparum in the three districts was 0.05. The prevalence of malaria in Bannu district was higher than Lakki Marwat and Dera Ismail Khan districts, and the difference in malaria preva-lence between the three districts was statistically signifi-cant (χ2 = 594.74, P < 0.001). Table 2 shows the prevalence of malaria infection in the three districts according to Plasmodium species.
The prevalence of malaria in children under five years and 5–14 years, and those more than 14 years was 5.2%, 10.5%, and 22.6% respectively (Table 3). The prevalence was higher in individuals more than 14 years than the
other age groups (χ2 = 1670.01, P < 0.001) (Table 3). The prevalence of malaria was higher in females than males: P. falciparum 0.7% versus 0.6% (χ2 = 11.87, P = 0.003) and P. vivax 14.2% versus 11.5% (χ2 = 39.71, P < 0.001). For mixed infections no difference was found between males and females (0.4% each).
Malaria treatment in health care centresThe main treatment used for malaria infection reported by the health centres in all the districts was primaquine, followed by chloroquine (Table 4). In Bannu district, primaquine was used to treat 60.7% of the cases of ma-laria in the 36 health centres performing rapid diagnos-tic tests, followed by chloroquine in 37.2%. In Dera Ismail Khan district, 62.7% of cases of malaria in the 37 health centres performing rapid diagnostic tests were treated with primaquine and 36.2% with chloroquine. In Lakki Marwat district 64.2% of cases of malaria in the 25 health centres performing rapid diagnostic tests were treat-ed with primaquine and 34.7% with chloroquine. Only a small number of cases were treated with artesunate + sulfadoxine-pyrimethamine and only 3 cases were treat-ed with artemether + lumefantrine. In addition, only a small proportion of cases were treated with quinine. The chloroquine and primaquine usage ratio was 0.58 across all health centres.
Household net ownershipNo mosquito nets were re-treated with insecticide in the three endemic districts. Fewer than half of the house-holds (44.10%) owned one or more LLINs. All the LLINs had been distributed by The Global Fund (LLINs were in-troduced in 2004–2005 by The Global Fund). There were slight differences between the three districts: LLIN own-
Figure 1 Flow chart of malaria diagnosis at health centres and net ownership in households
All 98 health care centres offering rapid diagnostic testing selected
31 041 individu-als examined by rapid diagnostic
testing
4297 individuals were found
positive
204 cases with P. falciparum
3970 cases with P. vivax
123 cases with P. falciparum +
P. vivax
864 households
401 households surveyed in ur-
ban areas
463 household surveyed in rural
areas
136 owned nets 245 owned nets
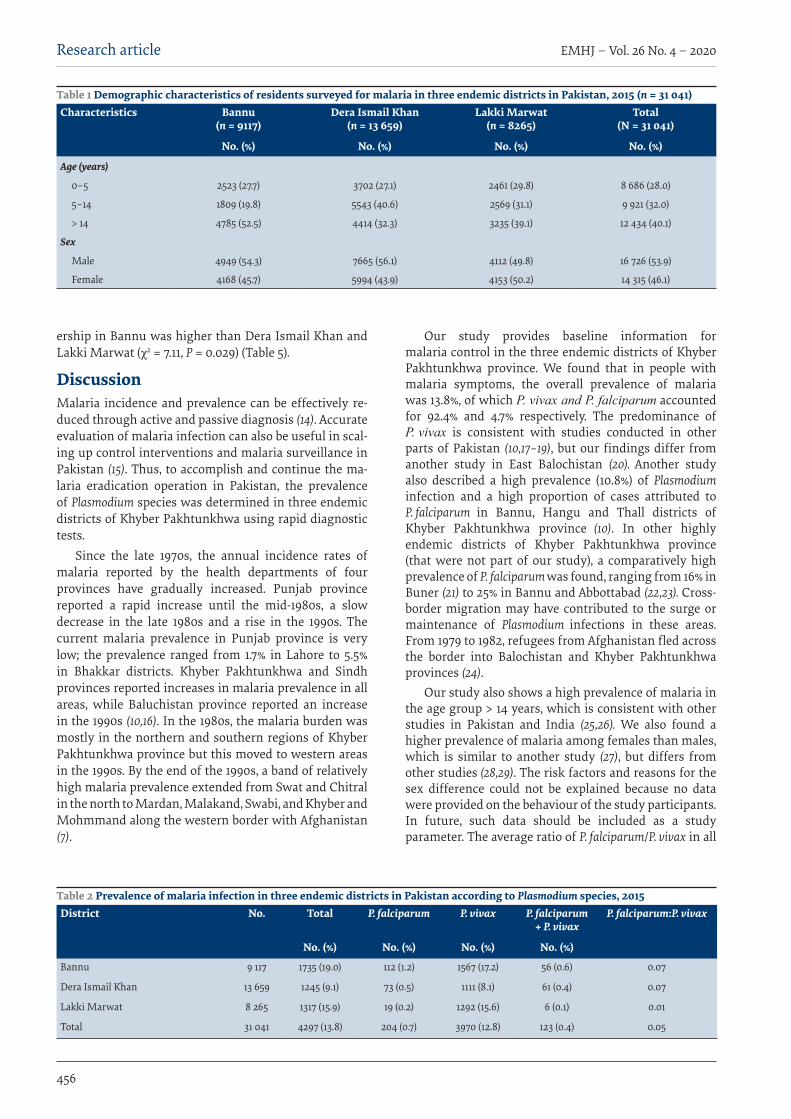
EMHJ – Vol. 26 No. 4 – 2020Research article
456
ership in Bannu was higher than Dera Ismail Khan and Lakki Marwat (χ2 = 7.11, P = 0.029) (Table 5).
DiscussionMalaria incidence and prevalence can be effectively re-duced through active and passive diagnosis (14). Accurate evaluation of malaria infection can also be useful in scal-ing up control interventions and malaria surveillance in Pakistan (15). Thus, to accomplish and continue the ma-laria eradication operation in Pakistan, the prevalence of Plasmodium species was determined in three endemic districts of Khyber Pakhtunkhwa using rapid diagnostic tests.
Since the late 1970s, the annual incidence rates of malaria reported by the health departments of four provinces have gradually increased. Punjab province reported a rapid increase until the mid-1980s, a slow decrease in the late 1980s and a rise in the 1990s. The current malaria prevalence in Punjab province is very low; the prevalence ranged from 1.7% in Lahore to 5.5% in Bhakkar districts. Khyber Pakhtunkhwa and Sindh provinces reported increases in malaria prevalence in all areas, while Baluchistan province reported an increase in the 1990s (10,16). In the 1980s, the malaria burden was mostly in the northern and southern regions of Khyber Pakhtunkhwa province but this moved to western areas in the 1990s. By the end of the 1990s, a band of relatively high malaria prevalence extended from Swat and Chitral in the north to Mardan, Malakand, Swabi, and Khyber and Mohmmand along the western border with Afghanistan (7).
Our study provides baseline information for malaria control in the three endemic districts of Khyber Pakhtunkhwa province. We found that in people with malaria symptoms, the overall prevalence of malaria was 13.8%, of which P. vivax and P. falciparum accounted for 92.4% and 4.7% respectively. The predominance of P. vivax is consistent with studies conducted in other parts of Pakistan (10,17–19), but our findings differ from another study in East Balochistan (20). Another study also described a high prevalence (10.8%) of Plasmodium infection and a high proportion of cases attributed to P. falciparum in Bannu, Hangu and Thall districts of Khyber Pakhtunkhwa province (10). In other highly endemic districts of Khyber Pakhtunkhwa province (that were not part of our study), a comparatively high prevalence of P. falciparum was found, ranging from 16% in Buner (21) to 25% in Bannu and Abbottabad (22,23). Cross-border migration may have contributed to the surge or maintenance of Plasmodium infections in these areas. From 1979 to 1982, refugees from Afghanistan fled across the border into Balochistan and Khyber Pakhtunkhwa provinces (24).
Our study also shows a high prevalence of malaria in the age group > 14 years, which is consistent with other studies in Pakistan and India (25,26). We also found a higher prevalence of malaria among females than males, which is similar to another study (27), but differs from other studies (28,29). The risk factors and reasons for the sex difference could not be explained because no data were provided on the behaviour of the study participants. In future, such data should be included as a study parameter. The average ratio of P. falciparum/P. vivax in all
Table 1 Demographic characteristics of residents surveyed for malaria in three endemic districts in Pakistan, 2015 (n = 31 041)Characteristics Bannu
(n = 9117)Dera Ismail Khan
(n = 13 659)Lakki Marwat
(n = 8265)Total
(N = 31 041)
No. (%) No. (%) No. (%) No. (%)
Age (years)
0–5 2523 (27.7) 3702 (27.1) 2461 (29.8) 8 686 (28.0)
5–14 1809 (19.8) 5543 (40.6) 2569 (31.1) 9 921 (32.0)
> 14 4785 (52.5) 4414 (32.3) 3235 (39.1) 12 434 (40.1)
Sex
Male 4949 (54.3) 7665 (56.1) 4112 (49.8) 16 726 (53.9)
Female 4168 (45.7) 5994 (43.9) 4153 (50.2) 14 315 (46.1)
Table 2 Prevalence of malaria infection in three endemic districts in Pakistan according to Plasmodium species, 2015 District No. Total P. falciparum P. vivax P. falciparum
+ P. vivaxP. falciparum:P. vivax
No. (%) No. (%) No. (%) No. (%)
Bannu 9 117 1735 (19.0) 112 (1.2) 1567 (17.2) 56 (0.6) 0.07
Dera Ismail Khan 13 659 1245 (9.1) 73 (0.5) 1111 (8.1) 61 (0.4) 0.07
Lakki Marwat 8 265 1317 (15.9) 19 (0.2) 1292 (15.6) 6 (0.1) 0.01
Total 31 041 4297 (13.8) 204 (0.7) 3970 (12.8) 123 (0.4) 0.05

Research article
457
EMHJ – Vol. 26 No. 4 – 2020
three districts was 0.05. LLINs have played an important role in reducing
malaria transmission over the past few decades. In the initial stage, LLINs were introduced in Pakistan, including in Khyber Pakhtunkhwa, and implemented by The Global Fund in Pakistan. Different approaches were used for distribution of the nets including the use of community health workers, campaigns to raise people’s awareness about LLINs and their importance, and private outlets. In 2012, the procedure was reformed and a comprehensive LLIN distribution strategy was developed and implemented in endemic districts of Pakistan with the support of The Global Fund (30,31).
Household ownership of LLINs in the three endemic districts was very low (44.1%); large numbers of LLINs should be disseminated freely to the residents to protect them from Plasmodium infection. During the household survey, it was noted that some people had not used the LLINs distributed three years before. Malaria health education should be provided in schools to encourage the use of LLINs (30–32). In the three endemic districts, comprehensive interventions should be provided, such as antimalarial drugs, bed nets and malaria health education.
Malaria control needs an integrated approach, including prevention (mainly vector control) and early treatment, with effective antimalarial agents. In 2010, all countries in which P. falciparum malaria is endemic have progressively updated their treatment policy from use of monotherapy with drugs such as chloroquine,
amodiaquine and sulfadoxine-pyrimethamine to the currently recommended artemisinin-based combination therapies. The combination therapies are generally highly effective and well tolerated. This has contributed significantly to reductions in worldwide mortality and morbidity from malaria. Unfortunately, resistance to artemisinin has arisen recently in P. falciparum in south-east Asia, which threatens these gains (33).
According to our results, the main treatment used for malaria infection in the health centres in all the districts was primaquine, followed by chloroquine. Overall in the three districts, primaquine was used to treat 62.5% of the cases of malaria in the 98 health centres performing rapid diagnostic tests, followed by chloroquine in 36.1%. Only a small number of cases were treated with artesunate + sulfadoxine-pyrimethamine while only three cases were treated with artemether + lumefantrine. In 2004, the cure rate with chloroquine treatment was reported to be 58% in Punjab and only 17 % in Sindh and Balochistan (4). While the effectiveness of sulfadoxine-pyrimethamine and amodiaquine in Balochistan resulted in a treatment success rate of 44 % and 47% respectively. The treatment rate with artesunate + sulfadoxine-pyrimethamine in the Federally Administered Tribal Areas in 2004 was 97%. Similarly, the tested efficiency of artesunate + sulfadoxine-pyrimethamine in Sindh, Balochistan and the Federally Administered Tribal Areas provided a treatment success rate of 100% in 2008. Likewise in 2009, the treatment rate with artemether and lumefantrine in the Federally Administered Tribal Areas, Balochistan, Khyber Pakhtunkhwa and Sindh was also 100% (4).
Table 3 Prevalence of malaria infection by age and sex and Plasmodium species in three endemic districts in Pakistan, 2015 Characteristic No. P. falciparum P. vivax P. falciparum + P. vivax Total P. falciparum:P. vivax
No. (%) No. (%) No. (%) No. (%)Age (years)
0–< 5 8 686 99 (1.1) 336 (3.9) 13 (0.2) 448 (5.2) 0.29
5–14 9 921 49 (0.5) 933 (9.4) 58 (0.6) 1040 (10.5) 0.05
> 14 12 434 56 (0.4) 2701 (21.7) 52 (0.4) 2809 (22.6) 0.02
Total 31 041 204 (0.7) 3970 (12.8) 123 (0.4) 4297 (13.8) 0.05
Sex
Male 16 726 101 (0.6) 1930 (11.5) 64 (0.4) 2095 (12.5) 0.05
Female 14 315 103 (0.7) 2040 (14.2) 59 (0.4) 2202 (15.4) 0.05
Total 31 041 204 (0.7) 3970 (12.8) 123 (0.4) 4297 (13.8) 0.05
Table 4 Malaria treatment in health centres performing rapid diagnostic tests in three endemic districts in Pakistan, 2015 District Health
centresACT
(AS+SP)Chloroquine Primaquine ACT
(ART+LF)Tab
quinineTotal Chloroquine:
primaquine
No. No. (%) No. (%) No. (%) No. (%) No. (%)Bannu 36 120 (0.3) 13 810 (37.2) 22 494 (60.7) 1 (0.0) 644 (1.7) 37 069 0.61
Dera Ismail Khan 37 133 (0.5) 9992 (36.2) 17 320 (62.7) 0 (0.0) 182 (0.7) 27 627 0.58
Lakki Marwat 25 19 (0.1) 11 935 (34.7) 22 110 (64.2) 2 (0.0) 352 (1.0) 34 418 0.54
Total 98 272 (0.27) 35 737 (36.1) 61 924 (62.5) 3 (0.0) 1178 (1.2) 99 114 0.58
ACT (AS+SP): artemisinin combination therapy (artesunate+sulfadoxine-pyrimethamine); ACT (ART+LF): artemisinin combination therapy (artemether + lumefantrine)
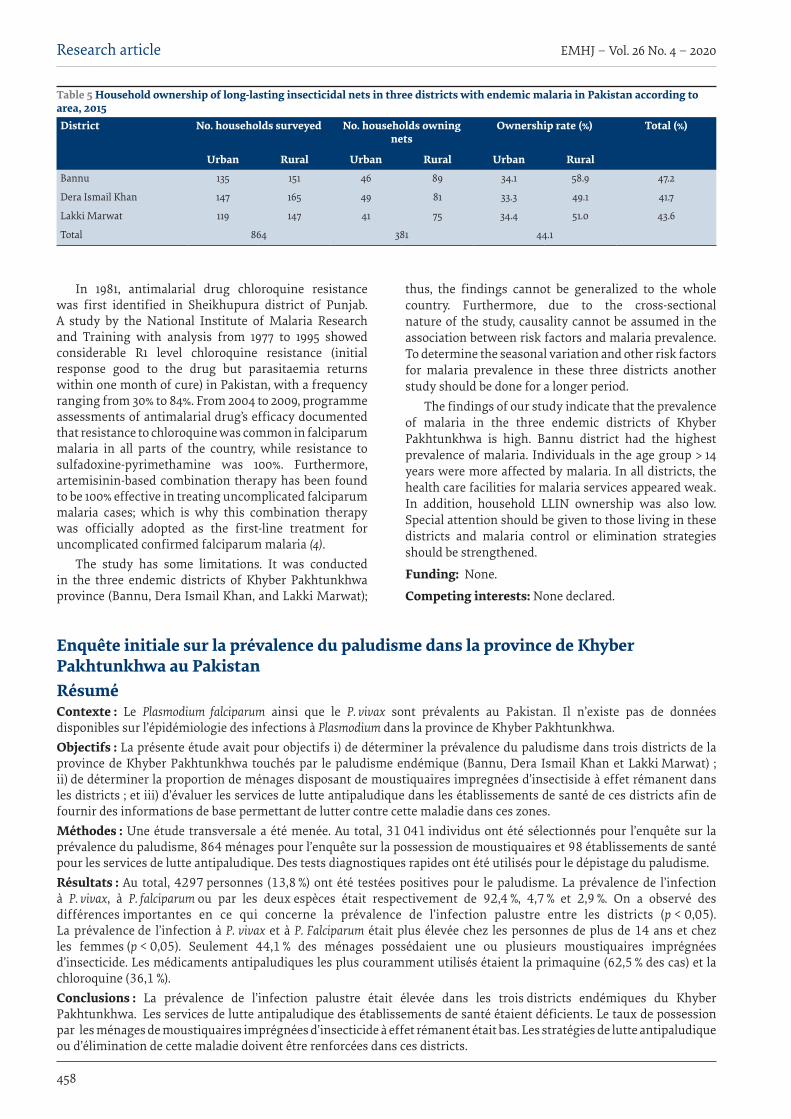
EMHJ – Vol. 26 No. 4 – 2020Research article
458
In 1981, antimalarial drug chloroquine resistance was first identified in Sheikhupura district of Punjab. A study by the National Institute of Malaria Research and Training with analysis from 1977 to 1995 showed considerable R1 level chloroquine resistance (initial response good to the drug but parasitaemia returns within one month of cure) in Pakistan, with a frequency ranging from 30% to 84%. From 2004 to 2009, programme assessments of antimalarial drug’s efficacy documented that resistance to chloroquine was common in falciparum malaria in all parts of the country, while resistance to sulfadoxine-pyrimethamine was 100%. Furthermore, artemisinin-based combination therapy has been found to be 100% effective in treating uncomplicated falciparum malaria cases; which is why this combination therapy was officially adopted as the first-line treatment for uncomplicated confirmed falciparum malaria (4).
The study has some limitations. It was conducted in the three endemic districts of Khyber Pakhtunkhwa province (Bannu, Dera Ismail Khan, and Lakki Marwat);
thus, the findings cannot be generalized to the whole country. Furthermore, due to the cross-sectional nature of the study, causality cannot be assumed in the association between risk factors and malaria prevalence. To determine the seasonal variation and other risk factors for malaria prevalence in these three districts another study should be done for a longer period.
The findings of our study indicate that the prevalence of malaria in the three endemic districts of Khyber Pakhtunkhwa is high. Bannu district had the highest prevalence of malaria. Individuals in the age group > 14 years were more affected by malaria. In all districts, the health care facilities for malaria services appeared weak. In addition, household LLIN ownership was also low. Special attention should be given to those living in these districts and malaria control or elimination strategies should be strengthened.
Funding: None.
Competing interests: None declared.
Table 5 Household ownership of long-lasting insecticidal nets in three districts with endemic malaria in Pakistan according to area, 2015District No. households surveyed No. households owning
netsOwnership rate (%) Total (%)
Urban Rural Urban Rural Urban RuralBannu 135 151 46 89 34.1 58.9 47.2
Dera Ismail Khan 147 165 49 81 33.3 49.1 41.7
Lakki Marwat 119 147 41 75 34.4 51.0 43.6
Total 864 381 44.1
Enquête initiale sur la prévalence du paludisme dans la province de Khyber Pakhtunkhwa au Pakistan RésuméContexte : Le Plasmodium falciparum ainsi que le P. vivax sont prévalents au Pakistan. Il n’existe pas de données disponibles sur l’épidémiologie des infections à Plasmodium dans la province de Khyber Pakhtunkhwa. Objectifs : La présente étude avait pour objectifs i) de déterminer la prévalence du paludisme dans trois districts de la province de Khyber Pakhtunkhwa touchés par le paludisme endémique (Bannu, Dera Ismail Khan et Lakki Marwat) ; ii) de déterminer la proportion de ménages disposant de moustiquaires impregnées d’insectiside à effet rémanent dans les districts ; et iii) d’évaluer les services de lutte antipaludique dans les établissements de santé de ces districts afin de fournir des informations de base permettant de lutter contre cette maladie dans ces zones. Méthodes : Une étude transversale a été menée. Au total, 31 041 individus ont été sélectionnés pour l’enquête sur la prévalence du paludisme, 864 ménages pour l’enquête sur la possession de moustiquaires et 98 établissements de santé pour les services de lutte antipaludique. Des tests diagnostiques rapides ont été utilisés pour le dépistage du paludisme. Résultats : Au total, 4297 personnes (13,8 %) ont été testées positives pour le paludisme. La prévalence de l’infection à P. vivax, à P. falciparum ou par les deux espèces était respectivement de 92,4 %, 4,7 % et 2,9 %. On a observé des différences importantes en ce qui concerne la prévalence de l’infection palustre entre les districts (p < 0,05). La prévalence de l’infection à P. vivax et à P. Falciparum était plus élevée chez les personnes de plus de 14 ans et chez les femmes (p < 0,05). Seulement 44,1 % des ménages possédaient une ou plusieurs moustiquaires imprégnées d’insecticide. Les médicaments antipaludiques les plus couramment utilisés étaient la primaquine (62,5 % des cas) et la chloroquine (36,1 %). Conclusions : La prévalence de l’infection palustre était élevée dans les trois districts endémiques du Khyber Pakhtunkhwa. Les services de lutte antipaludique des établissements de santé étaient déficients. Le taux de possession par les ménages de moustiquaires imprégnées d’insecticide à effet rémanent était bas. Les stratégies de lutte antipaludique ou d’élimination de cette maladie doivent être renforcées dans ces districts.
Research article
459
EMHJ – Vol. 26 No. 4 – 2020
References1. World malaria report 2016. Geneva: World Health Organization; 2016.
2. Shaikh S, Memon H, Iohano B, Shaikh A, Ahmed I, Baird JK. Severe disease in children hospitalized with a diagnosis of Plasmo-dium vivax in south-eastern Pakistan. Malar J. 2012;11:144. https://doi.org/10.1186/1475-2875-11-144 PMID: 22551061
3. Country profile Pakistan. In: World malaria report 2015. Geneva: World Health Organization; 2015:146 (https://apps.who.int/iris/bitstream/handle/10665/200018/9789241565158_eng.pdf;jsessionid=63FDD0E1A9AF52A55EFB636F3F7C23AA?sequence=1, accessed 4 September 2019).
4. Kakar Q, Khan MA, Bile KM. Malaria control in Pakistan: new tools at hand but challenging epidemiological realities. East Medi-terr Health J. 2010;16(Suppl):S54–60. PMID: 21495589
5. Khan A, Godil FJ, Naseem R. Chloroquine-resistant Plasmodium vivax in Pakistan: an emerging threat. Lancet Glob Health. 2016;4(11):e790. https://doi.org/10.1016/S2214-109X(16)30251-0 PMID: 27765288
6. Khan NU, Zalan A, Waqas M, Elahi S, Ud Din I, Haq F, et al. Incidence of malaria in Khyber Pakhtunkhwa Pakistan – a meta-anal-ysis. Ann Rev Res. 2018;3(4). https://doi.org/10.19080/ARR.2018.03.555619
7. Kazmi JH, Pandit K. Disease and dislocation: the impact of refugee movements on the geography of malaria in NWFP, Pakistan. Soc Sci Med. 2001;52(7):1043–55. https://doi.org/10.1016/S0277-9536(00)00211-2 PMID: 11266048
8. Khatoon L, Baliraine FN, Bonizzoni M, Malik SA, Yan G. Genetic structure of Plasmodium vivax and Plasmodium falciparum in the Bannu district of Pakistan. Malar J. 2010;9:112. https://doi.org/10.1186/1475-2875-9-112 PMID: 20416089
9. Bouma MJ, Dye C, van der Kaay HJ. Falciparum malaria and climate change in the northwest frontier province of Pakistan. Am J Trop Med Hyg. 1996;55(2):131–7. https://doi.org/10.4269/ajtmh.1996.55.131 PMID: 8780449
10. Khattak AA, Venkatesan M, Nadeem MF, Satti HS, Yaqoob A, Strauss K, et al. Prevalence and distribution of human Plasmodium infection in Pakistan. Malar J. 2013;12:297. https://doi.org/10.1186/1475-2875-12-297 PMID: 23984968
11. Wahid S, Stresman GH, Kamal SS, Sepulveda N, Kleinschmidt I, Bousema T, et al. Heterogeneous malaria transmission in long-term Afghan refugee populations: a cross-sectional study in five refugee camps in northern Pakistan. Malar J. 2016;15:245. https://doi.org/10.1186/s12936-016-1305-7 PMID: 27121196
12. Dhawan G, Joseph N, Pekow PS, Rogers CA, Poudel KC, Bulzacchelli MT. Malaria-related knowledge and prevention practices in four neighbourhoods in and around Mumbai, India: a cross-sectional study. Malar J. 2014;13:303. https://doi.org/10.1186/1475-2875-13-303 PMID: 25102949
13. Pakistan: North Waziristan Displacement. World Health Organization; July 17, 2014 (http://origin.who.int/hac/donorinfo/dono-ralert_pakistan-180714.pdf, accessed 4 September 2019).
مسح مرجعي ملعدل انتشار املالريا يف إقليم خيرب باختونخوا، باكستان محريا قوريش، حممد ُعمران خان، هينوك أمباتشو، هاي فينج بان، دونج كينج يي
اخلالصةاخللفية: تنترش كل من املتصورة املنجلية واملتصورة النشيطة يف باكستان. ويتعذر احلصول عىل بيانات السامت الوبائية حلاالت العدوى التي تسببها
املتصورة يف إقليم خيرب باختونخوا. األهداف: هدفت هذه الدراسة إىل حتديد معدل انتشار املالريا ومعدل امتالك األرس للناموسيات املتينة املعاجلة بمبيد احلرشات وتقييم خدمات املالريا يف املرافق الصحية يف ثالث مناطق باإلقليم مستوطنة باملالريا )وهي بانو، وديرا إسامعيل خان، والكي مروات( من أجل توفري املعلومات
األساسية ملكافحة املالريا يف تلك املناطق. طرق البحث: ُأجريت دراسة مقطعية باستخدام أسلوب املعاينة العنقودية. وإمجاال، فقد اختري 31041 فردا ملسح معدل انتشار املالريا، و 864 أرسة
ملسح امتالك الناموسيات، و 98 مرفقا صحيا ملسح خدمات املالريا. واستخدمت االختبارات التشخيصية الرسيعة الختبار املالريا. النتائج: من بني األفراد اخلاضعني لالختبار والبالغ عددهم 31041 فردا، جاءت نتيجة اختبار املالريا إجيابية لدى 4297 فردا (%13.8). وبلغ معدل التوايل. وكانت هناك اختالفات %4.7، و%2.9 عىل و ،92.4% بينهام املشرتكة املنجلية، والعدوى النشيطة، واملتصورة باملتصورة العدوى انتشار امتداد دون سواها عىل املناطق تلك أعىل يف االنتشار معدل وكان .(P < 0.05) الثالثة املناطق بني باملالريا العدوى انتشار معدل بني جوهرية 14 عاما (P < 0.05)، ويف صفوف النساء بالنسبة للعدوى باملتصورة النشيطة واملتصورة املنجلية(P < 0.05). ومل يمتلك ناموسية واحدة أو أكثر معاجلة بمبيدات احلرشات سوى %44.1 من األرس. وكانت األدوية األكثر شيوعا املستخدمة يف عالج املالريا الربيامكني )يف %62.5 من احلاالت(
والكلوروكني (36.1%).االستنتاجات: كان معدل انتشار املالريا مرتفعا يف املناطق الثالثة املستوطنة باملرض يف إقليم خيرب باختونخوا. واتسمت خدمات املالريا يف املرافق الصحية بالضعف. وكان معدل امتالك األرس لناموسيات متينة معاجلة بمبيدات احلرشات منخفضا. لذا، ينبغي تعزيز اسرتاتيجيات مكافحة املالريا
أو القضاء عليها يف تلك املناطق.

EMHJ – Vol. 26 No. 4 – 2020Research article
460
14. Zoghi S, Mehrizi AA, Raeisi A, Haghdoost AA, Turki H, Safari R, et al. Survey for asymptomatic malaria cases in low transmis-sion settings of Iran under elimination programme. Malar J. 2012;11:126. https://doi.org/10.1186/1475-2875-11-126 PMID: 22533733
15. Yasinzai MI, Kakarsulemankhel JK. Incidence of human infection in northern hilly region of Balochistan, adjoining with NWFP, Pakistan: district Zhob. Pak J Biol Sci. 2008;11(12):1620–4. https://doi.org/10.3923/pjbs.2008.1620.1624 PMID: 18819652
16. Rowland M, Rab MA, Freeman T, Durrani N, Rehman N. Afghan refugees and the temporal and spatial distribution of malaria in Pakistan. Soc Sci Med. 2002;55(11):2061–72. https://doi.org/10.1016/S0277-9536(01)00341-0 PMID: 12406471
17. Hussain I, Qureshi NA, Afzal M, Shaheen N, Ali A, Ashraf A. Prevalence and distribution of human Plasmodium infection in Federally Administrative Tribal Areas of Pakistan. Acta Parasitol. 2016;61(3):537–43. https://doi.org/10.1515/ap-2016-0071 PMID: 27447217
18. Muhammad AM, Huma Q, Nauman S. Malaria indicator survey in 38 high risk districts of Pakistan, 2013–14. Islamabad: Pakistan Medical Research Council; 2014 (http://dmc.gov.pk/documents/pdfs/3Final%20MIS%20Report-From%20Printe-30%20April%202015%20(2).pdf, accessed 4 September 2019).
19. Karim AM, Hussain I, Malik SK, Lee JH, Cho IH, Kim YB, et al. Epidemiology and clinical burden of malaria in the war-torn area, Orakzai Agency in Pakistan. PLoS Negl Trop Dis. 2016;10(1):e0004399. https://doi.org/10.1371/journal.pntd.0004399 PMID: 26809063
20. Yasinzai MI, Kakarsulemankhel JK. Prevalence of human malaria infection in bordering areas of East Balochistan, adjoining with Punjab: Loralai and Musakhel. J Pak Med Assoc. 2009;59(3):132–5. PMID: 19288935
21. Noor M, Hussain A. Prevalence of malaria in general population of district Buner. J Pak Ins Med Sci. 2003;17:75–80.
22. Idris M, Sarwar J, Fareed J. Pattern of malarial infection diagnosed at Ayub teaching hospital Abbotabad. J Ayub Med Coll Abbot-tabad. 2007;19(2):35–6. PMID: 18183716
23. Khatoon L, Baliraine FN, Bonizzoni M, Malik SA, Yan GY. Prevalence of antimalarial drug resistance mutations in Plasmodi-um vivax and Plasmodium falciparum from a malaria endemic area of Pakistan. Am J Trop Med Hyg. 2009;81(3):525–8. PMID: 19706926
24. World malaria situation in 1990. Bull World Health Organ. 1992;70(6):801–13.
25. Ibrahim KS, Khan S, Akhtar N. Epidemiological finding of malaria in district Buner Khyber Pakhtunkhwa, Pakistan. World J of Med Sci. 2014;11(4):478–82. https://doi.org/10.5829/idosi.wjms.2014.11.4.9153
26. Dayanand KK, Punnath K, Chandrashekar V, Achur RN, Kakkilaya SB, Ghosh SK, et al. Malaria prevalence in Mangaluru city area in the southwestern coastal region of India. Malar J. 2017;16(1):492. https://doi.org/10.1186/s12936-017-2141-0 PMID: 29258505
27. Khan MW, Khan MN, Khan RA. Epidemiology and parasitological survey of malarial parasites in Khyber Pakhtunkhwa, Paki-stan. J Pak Med Assoc. 2018;68(1):145–6. PMID: 29371740
28. Ullah Z, Khattak AA, Bano R, Hussain J, Awan UA, Rahman SU, et al. High incidence of malaria along the Pak-Afghan bordering area. J Pak Med Assoc. 2018;68(1):42–5. PMID: 29371716
29. Jabeen S, Farrukh U, Hameed SA, Kanwal S, Qayyum M. An investigation on the prevalence and efficiency of immunochromato-graphic testing in suspected malarial patients of Rawalpindi and Islamabad, Pakistan. Turk J Med Sci. 2016;46(5):1329–34. https://doi.org/10.3906/sag-1504-112 PMID: 27966339
30. Directorate of Malaria Control and Save the Children. Long lasting insecticidal nets (LLINs). Distributions strategy. Islamabad: Directorate of Malaria Control, Ministry of Health; 2015 (http://dmc.gov.pk/documents/pdfs/Distribution%20strategy-LLINs.pdf, accessed 4 September 2019).
31. Assessment of community performance and acceptance for use of different types of LLINs in Pakistan. Islamabad: Directorate of Malaria Control, Ministry of Health; 2009 (http://dmc.gov.pk/documents/pdfs/LLINs_Protocols.pdf, accessed 4 September 2019).
32. Stevens ER, Aldridge A, Degbey Y, Pignandi A, Dorkenoo MA, Hugelen-Padin J. Evaluation of the 2011 long-lasting, insecti-cide-treated net distribution for universal coverage in Togo. Malar J. 2013;12:162. https://doi.org/10.1186/1475-2875-12-162 PMID: 23680434
33. Guidelines for the treatment of malaria, 3rd edition. Geneva: World Health Organization; 2015 (http://apps.who.int/medicine-docs/documents/s21839en/s21839en.pdf, accessed 4 September 2019).
Research article
461
EMHJ – Vol. 26 No. 4 – 2020
Prevalence of hepatitis B and anti-hepatitis C virus antibody among people who inject drugs in the Lebanese populationAntoine Abou Rached,1,2 Mary Nakhoul,1 Carine Richa,1 Afif Jreij,1 Pierre Abi Hanna1 and Walid Ammar 2
1Faculty of Medical Science, Lebanese University, Hadath, Lebanon (Correspondence to: Abou Rached Antoine: [email protected]). 2Min-istry of Public Health, Beirut, Lebanon.
IntroductionThe World Health Organization (WHO) estimates that in 2015, 257 million persons, 3.5% of the world population, were living with chronic HBV infection. The African and Western Pacific regions accounted for 68% of those in-fected. Also, it is estimated that 71 million persons were living with HCV infection in 2015, i.e. 1% of the world population (1). In 2015, viral hepatitis was responsible for 1.34 million deaths. Mortality from viral hepatitis has in-creased by 22% since 2000 (1).
Transmission of HBV and HCV has been causally associated with injection drug use by people who inject drugs (PWIDs) due to sharing of needles and injection equipment contaminated with infected blood. Seroprevalence rates for HBV and HCV vary considerably among PWIDs depending on the geographic region and time period for the PWID populations tested.
Injection drug use, unsafe sex and unsterile tattoos are the main modes of transmission of HBV in patient not vaccinated. Injection drug use remains the main mode of transmission in industrialized countries, whereas unsterile tattoos and piercings in nonprofessional settings might play an increasing role in young populations (2).
Unsafe therapeutic injection practices and blood transfusions are also important routes of infection (3). Unsafe health care practices (including unsafe health care
injections) and injection drug use remain the leadings modes of transmission of HCV. Areas with high rates of infection are located in the Eastern Mediterranean Region and the European Region. In the Eastern Mediterranean Region, the most common cause of transmission of infection is unsafe health care injections (4,5). In the European Region, injection drug use accounts for a substantial proportion of infections (6).
According to the latest United Nations Office on Drugs and Crime report, around 16.5 million people (0.4% of the total world population) aged 15–64 years use heroin or opium (7).
Lebanon is ranked among the countries with a low endemicity profile for both viruses having a prevalence of 1.74% for HBV and 0.21% for HCV (8); HCV genotype 3 is the most prevalent genotype in the Lebanese PWID population followed by genotype 1 (9). The prevalence of these infections among PWID in Lebanon has previously been estimated at 2.5–5% for HBV and more than 50% for HCV, based on small scale reports (10).
The aim of this study was to determine the prevalence of both infections in PWIDs in the Lebanese population based on a screening strategy applied by a number of nongovernmental organizations and to establish the correlation between both infections and other possible underlying factors within this high-risk group.
AbstractBackground: People who inject drugs (PWIDs) are prone to a number of blood-borne viral infections. Hepatitis B virus (HBV) and hepatitis C virus (HCV) constitute an important public health concern in this high risk group.Aims: We aimed to determine the prevalence of HBV and HCV antibody among PWIDs in Lebanon.Methods: We conducted a prospective cross-sectional study between June 2015 and June 2016 on PWIDs recruited through Lebanese nongovernmental organizations in collaboration with the Lebanese Ministry of Public Health. The participants were tested for HBs antigen and HCV antibody using rapid test kits. The prevalence of each virus was then calculated. The correlation between both infections and other possible risk factors was also analysed.Results: A total of 250 people were included in our study, of whom 98% were males. Mean age was 31.9 (standard devia-tion 8.7) years. The prevalence of HBsAg and anti-HCV among PWIDs was 1.2% and 15.6%, respectively. Older age, longer duration of drug use and lack of awareness were significantly correlated with a higher rate of HCV infection (P < 0.01). The high rate of needle sharing among our PWIDs significantly affected the prevalence of anti-HCVAb. Conclusion: PWIDs remain the subpopulation most affected with chronic HCV in Lebanon. Keywords: HPV, HCV, people who inject drugs, Lebanon
Citation: Abou Rached A; Nakhoul M; Richa C; Jreij A; Abi Hanna P; Ammar W. Prevalence of hepatitis B and anti-hepatitis C virus antibody among people who inject drugs in the Lebanese population. East Mediterr Health J. 2020;26(4):461–467. https://doi.org/10.26719/emhj.19.094
Received: 13/10/17; accepted: 02/09/18
Copyright © World Health Organization (WHO) 2020. Open Access. Some rights reserved. This work is available under the CC BY-NC-SA 3.0 IGO license (https://creativecommons.org/licenses/by-nc-sa/3.0/igo).
EMHJ – Vol. 26 No. 4 – 2020Research article
462
MethodsStudy designWe carried out this cross sectional study between June 2015 and June 2016 on injection drug users recruited through the Middle East and North Africa Harm Reduc-tion Association (MENAHRA) in collaboration with many other nongovernmental organizations throughout Leba-non.
Study conduct and data collectionAs part of a strategy to control blood-borne viral infec-tions such as HIV and viral hepatitis in high risk groups by the Lebanese Ministry of Public Health, screening for HCV antibodies and HBs antigen and HIV in the PWID population was carried out followed by a vaccination protocol against HBV in seronegative patients. This work was done in collaboration with nongovernmental organ-izations throughout Lebanon. These organizations were registered in Beirut and their geographic distribution covered Lebanese territory from north to south, Beqaa and Beirut. They included ESCALE, SIDC, SKOUN, AJEM, the nongovernmental organization platform of SAIDA, Oum el Nour, Jeunesse contre la drogue, Cenacle de la lumiere, Nusroto and Bonheur du ciel. The PWIDs pre-senting to these organizations were from different re-gions in Lebanon.
All the PWIDs patients presented to the aforementioned nongovernmental organizations were included in our study, after a clear explanation of the aims of the study, independently of their age, sex or duration of drug use. There were no exclusions.
All participants were able to read, 95% signed a consent form in Arabic. Their agreement was guided by the responsible person in the nongovernmental organization. At the time of the study, participants were not under the effects of drugs. They were tested for HBs Ag and HCV Ab using rapid test kits: RDT HEPATITIS B (SD Bioline HBsAg-01FK10W), HBsAg, RDT HEPATITIS C (SD Bioline HCV-02FK10), HCVAb, which are based on enzyme immune assay. None of the PWIDs included were prisoners but some had a previous history of incarceration that is not reported here.
Data collection included age, sex, nationality, presence of any other predisposing factor for viral hepatitis acquisition, other high risk behaviours such as sharing needles, men who have sex with men, sex working, living with someone infected with HBV and/or HCV, sex with a person infected with HBV/HCV, history of blood transfusion, the presence of piercings and tattoos. Further inquiry included the level of awareness and education, which were assessed by asking participants if they had ever heard about HBV/HCV, viral transmission through contaminated blood and unsafe sexual practices or about the existence of HBV vaccination for prevention. They were also asked about any previous HBV vaccination.
All these data were gathered by the responsible person in each nongovernmental organization and were registered in an Excel document.
Statistical analysisThe prevalence of HBV and anti-HCV antibody among the PWIDs in the study was calculated.
The correlation between the age of participants and test positivity was calculated. The impact of viral hepatitis risk factors of on the prevalence of HBV and anti-HCV antibody was also analysed. The prevalence of needle-sharing between the PWIDs as well as the duration of drug injection were specifically addressed in addition to their association with serologic positivity of HBV and HCV. Similarly, we investigated the knowledge of participants about viral hepatitis and mode of transmission and how it could affect their life. The proportion of participants vaccinated for HBV was also calculated to inform a future viral prevention programme.
The statistical analysis on these associations was done using the Chi-squared (χ2) test; P-value < 0.01 was considered the threshold for statistically significant correlation.
ResultsA total of 250 people were included in our study, repre-senting 95% of the total number of PWIDs recruited dur-ing the period of the study by the different nongovern-mental organizations.
Male sex was predominant, representing 98% of the studied population; only 5 women participated (2% of the population). The majority of PWIDs were adolescents and young adults, with 75% aged under 35 (mean = 31.9; standard deviation 8.7) years. There were 9 Palestinians and 1 Afghan participant; the remaining 240 were Lebanese
Only 3 participants were positive for HBs Ag, prevalence 1.2%. All of the HBV-positive PWIDs were male and Lebanese. Their mean age was 29.7 years. Although they appeared to be younger compared to other PWIDs seronegative for HBV (mean age = 31.91 years), the difference in age was not statically significant (P = 0.66).
We found 39 patients were positive for HCV antibody, prevalence 15.6%. One individual was co-infected with HBV. All were males, 3 were Palestinians and the remaining 36 were Lebanese. The mean age was 35.8 years. They were significantly older than the PWID population seronegative for HCV included in this study (P = 0.01).
The association between men who have sex with men, sex working, living with someone infected with HBV/HCV, sex with a person infected with HBV/HCV, history of blood transfusion, history of tattoos or piercings and the frequency of HBV and HCV in our PWIDs population showed that none of these risk factors significantly affected the prevalence of either infection (Table 1).
Among the study population, 83 participants reported sharing needles (33.2%). Two of the 3 HBV positive (66.7%) and 21 of the 39 HCV positive (53.8%) individuals had a history of sharing needles. We noted a significant association between needle sharing and the occurrence

Research article
463
EMHJ – Vol. 26 No. 4 – 2020
of HCV infection (P = 0.0029), but for HBV it was not significant (P = 0.22).
The mean duration of drug use was 125.0 weeks among our PWID population and 240.5 weeks among the HCV-positive participants, with a statistically significant association between longer duration of injection drug use and positive HCV serology (P = 0.001).
Concerning awareness of viral hepatitis, 54 PWIDs (21.6%) had never heard about HBV/HCV and the risk of transmission through contaminated blood or needle stick or unsafe sexual practices. These groups have a significant risk for infection with HCV (P = 0.01). Additionally, 164 PWIDs (65.6%) had never heard that HBV can be prevented by vaccination.
Only 45 PWIDs (18%) had received the HBV vaccine prior to our study. None of them tested positive for HBV.
DiscussionOur study has provided an updated evaluation for HBV and HCV prevalence among PWIDs in Lebanon, i.e. 1.2% and 15.6%, respectively.
The prevalence of hepatitis B in this group of the population is lower than among the general population overall (1.74%) (8), but when compared to the same age group in the general population it is higher. Data on other high risk groups in Lebanon give a prevalence of 1.6% in haemodialysis patients (11), 0.99% in men who have sex with men (12), 0.28% in thalassaemic patients (13), 2.4% among prisoners secondary to unprotected sexual intercourse and tattooing as well as PWIDs (14), and 6.9% in HIV patients (15). A previous study on PWIDs in Lebanon found a prevalence of 0–5% for HBV infection (10).
This prevalence of HBV in the PWID population was lower than figures reported in the surrounding Middle Eastern countries (10). The prevalence of surface HBV
antigen in a European review for PWIDs was available for 21 of the 34 countries; this ranged from 0% to 21.3% (16). In 10 countries it exceeded 10% (10). The HBs Ag prevalence in PWIDs was on average 9 times higher than in the general population (in 6 of the 8 countries that had both estimates available). In Romania and Ireland, HBs Ag estimate among the general population was higher (5.6% vs 4.7%, 0.1% vs 0.0%, respectively) (16).
In our study, only 18% of PWIDs were actually vaccinated against HBV while 65% did not know that HBV can be prevented by vaccination. Knowing the importance of vaccination in HBV prevention, these findings reflect a significant lack of education and awareness programmes for PWIDs in our country as well as an inefficient strategy for reaching and vaccinating this group.
The prevalence of anti-HCV antibody in our PWIDs was significantly higher than among the general Lebanese population and among haemodialysis patients and prisoners, making injection drug users the population group most affected. Mahfoud et al. reported a higher anti-HCV antibody prevalence reaching 52.8% in 106 Lebanese PWIDs (17). These individuals appeared to be older than our participants (mean age 40 years); more than 75% of the infected subjects had tattoos and almost all of them had a history of imprisonment. These factors may explain the higher results. Another study found that 27.6% of 309 PWIDs in Lebanon were anti-HCV positive and this was associated with incarceration, sharing/reusing needles and a history of sexually transmitted disease in the previous year (Table 2). Both of these studies were conducted using the respondent driven sampling method, which can reach hidden populations such as PWIDs but at the expense of a somehow lower data accuracy in comparison with population based-surveys.
Table 1 Association between risk factors for viral hepatitis and the frequency of hepatitis B virus (HBV) and hepatitis C virus (HCV) in the intra-venous drug user (IVDU) population, Lebanon, 2015–2016 (n = 250)Risk factor HCV HBV
Frequency Correlation with HCV in IVDU population
Frequency Correlation with HBV in general population
No. % P-value** No. % P-value*Men who have sex with men 0 0.0 –a 0 0.0 –a
Sex worker 2 5.1 0.579 0 0.0 0.738
Living with someone infected with HBV/HCV
0 0.0 0.333 0 0.0 0.804
Sex with a person infected with HBV/HCV 0 0.0 0.456 0 0.0 0.848
History of blood transfusion 4 10.2 0.13 0 0.0 0.710
History of sharing needles 21 53.8 0.0029 0 0.0 0.221
Never heard of HBV/HCV or its mode of transmission
9 23.0 0.01 3 100 0.20
Presence of piercing 4 10.2 0.110 0 0.0 0.370
Presence of tattoos 17 43.5 0.570 0 0.0 0.170
**Significant at the 0.01 level (2-tailed). aCannot be computed (at least 1 of the variables is constant). There were no men who have sex with men among participants
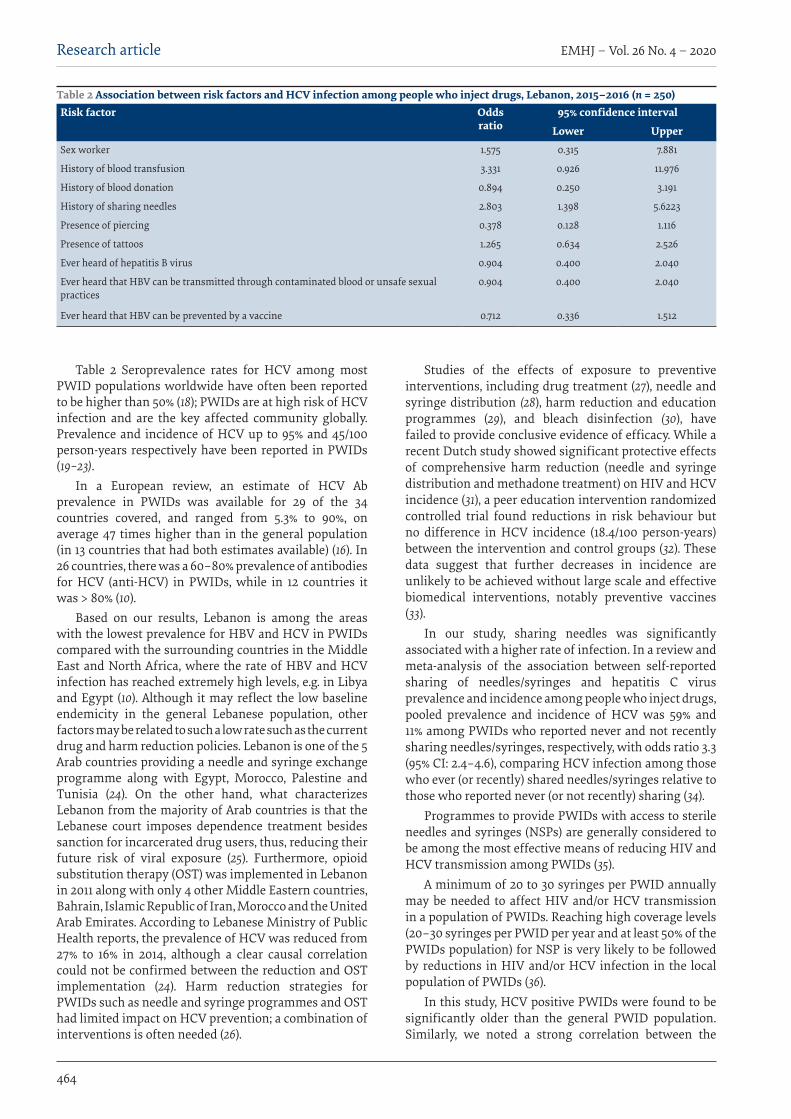
EMHJ – Vol. 26 No. 4 – 2020Research article
464
Table 2 Seroprevalence rates for HCV among most PWID populations worldwide have often been reported to be higher than 50% (18); PWIDs are at high risk of HCV infection and are the key affected community globally. Prevalence and incidence of HCV up to 95% and 45/100 person-years respectively have been reported in PWIDs (19–23).
In a European review, an estimate of HCV Ab prevalence in PWIDs was available for 29 of the 34 countries covered, and ranged from 5.3% to 90%, on average 47 times higher than in the general population (in 13 countries that had both estimates available) (16). In 26 countries, there was a 60–80% prevalence of antibodies for HCV (anti-HCV) in PWIDs, while in 12 countries it was > 80% (10).
Based on our results, Lebanon is among the areas with the lowest prevalence for HBV and HCV in PWIDs compared with the surrounding countries in the Middle East and North Africa, where the rate of HBV and HCV infection has reached extremely high levels, e.g. in Libya and Egypt (10). Although it may reflect the low baseline endemicity in the general Lebanese population, other factors may be related to such a low rate such as the current drug and harm reduction policies. Lebanon is one of the 5 Arab countries providing a needle and syringe exchange programme along with Egypt, Morocco, Palestine and Tunisia (24). On the other hand, what characterizes Lebanon from the majority of Arab countries is that the Lebanese court imposes dependence treatment besides sanction for incarcerated drug users, thus, reducing their future risk of viral exposure (25). Furthermore, opioid substitution therapy (OST) was implemented in Lebanon in 2011 along with only 4 other Middle Eastern countries, Bahrain, Islamic Republic of Iran, Morocco and the United Arab Emirates. According to Lebanese Ministry of Public Health reports, the prevalence of HCV was reduced from 27% to 16% in 2014, although a clear causal correlation could not be confirmed between the reduction and OST implementation (24). Harm reduction strategies for PWIDs such as needle and syringe programmes and OST had limited impact on HCV prevention; a combination of interventions is often needed (26).
Studies of the effects of exposure to preventive interventions, including drug treatment (27), needle and syringe distribution (28), harm reduction and education programmes (29), and bleach disinfection (30), have failed to provide conclusive evidence of efficacy. While a recent Dutch study showed significant protective effects of comprehensive harm reduction (needle and syringe distribution and methadone treatment) on HIV and HCV incidence (31), a peer education intervention randomized controlled trial found reductions in risk behaviour but no difference in HCV incidence (18.4/100 person-years) between the intervention and control groups (32). These data suggest that further decreases in incidence are unlikely to be achieved without large scale and effective biomedical interventions, notably preventive vaccines (33).
In our study, sharing needles was significantly associated with a higher rate of infection. In a review and meta-analysis of the association between self-reported sharing of needles/syringes and hepatitis C virus prevalence and incidence among people who inject drugs, pooled prevalence and incidence of HCV was 59% and 11% among PWIDs who reported never and not recently sharing needles/syringes, respectively, with odds ratio 3.3 (95% CI: 2.4–4.6), comparing HCV infection among those who ever (or recently) shared needles/syringes relative to those who reported never (or not recently) sharing (34).
Programmes to provide PWIDs with access to sterile needles and syringes (NSPs) are generally considered to be among the most effective means of reducing HIV and HCV transmission among PWIDs (35).
A minimum of 20 to 30 syringes per PWID annually may be needed to affect HIV and/or HCV transmission in a population of PWIDs. Reaching high coverage levels (20–30 syringes per PWID per year and at least 50% of the PWIDs population) for NSP is very likely to be followed by reductions in HIV and/or HCV infection in the local population of PWIDs (36).
In this study, HCV positive PWIDs were found to be significantly older than the general PWID population. Similarly, we noted a strong correlation between the
Table 2 Association between risk factors and HCV infection among people who inject drugs, Lebanon, 2015–2016 (n = 250)Risk factor Odds
ratio95% confidence interval
Lower UpperSex worker 1.575 0.315 7.881
History of blood transfusion 3.331 0.926 11.976
History of blood donation 0.894 0.250 3.191
History of sharing needles 2.803 1.398 5.6223
Presence of piercing 0.378 0.128 1.116
Presence of tattoos 1.265 0.634 2.526
Ever heard of hepatitis B virus 0.904 0.400 2.040
Ever heard that HBV can be transmitted through contaminated blood or unsafe sexual practices
0.904 0.400 2.040
Ever heard that HBV can be prevented by a vaccine 0.712 0.336 1.512

Research article
465
EMHJ – Vol. 26 No. 4 – 2020
duration of their drug injection practices and anti-HCV positivity. Backmund et al. reported a correlation between older age, longer duration of drug use and positivity of HCV serology among drug users (37).
Further analysis of the study population has showed that a low index of awareness of HCV and mode of transmission was associated with a higher prevalence of infection. As limiting exposure to HCV is the only way of preventing viral transmission, it is of extreme importance to implement targeted educational programmes for all PWIDs in Lebanon and to inform them about the different modes of transmission as well as the possible methods of prevention.
Our study has some limitations. As the estimated
drug user population in Lebanon is about 10 000–15 000 individuals (38), of whom 35% are PWIDs (39); our study population provides an estimation of HCV and HBV serology in this population group followed by the nongovernmental organizations and it could result in an underestimate of the exact prevalence of HCV and HBV in this population. Furthermore, illicit drug users are a hard to reach population as they tend to deny and hide their practices, which may be a basis for contempt in Lebanese society. Nor did we report on whether our PWIDs had a history of imprisonment, where viral spread may occur more frequently.
Funding: None.
Competing interests: None declared.
Prévalence des virus de l’hépatite B et de l’hépatite C chez les consommateurs de drogues injectables dans la population libanaiseRésuméContexte : Les consommateurs de drogues injectables sont exposés à un certain nombre d’infections virales transmises par le sang. Les virus de l’hépatite B (HBV) et de l’hépatite C (HCV) constituent une préoccupation de santé publique majeure dans ce groupe à risque élevé.Objectif : La présente étude avait pour objectif de déterminer la prévalence du HBV et du HCV chez les consommateurs de drogues injectables au Liban.Méthodes : Entre juin 2015 et juin 2016, nous avons mené une étude transversale prospective sur des consommateurs de drogues injectables recrutés par l’intermédiaire d’organisations non gouvernementales libanaises, en collaboration avec le ministère de la Santé publique libanais. Les participants ont été soumis à des tests de dépistage des antigènes de surface de l’hépatite B et des anticorps anti-HCV à l’aide de kits de dépistage rapide. La prévalence de chaque virus a ensuite été calculée. La corrélation entre les deux infections et d’autres facteurs de risque possibles a également été examinée.Résultats : Au total, 250 personnes ont été incluses dans l’étude, dont 98 % d’hommes. L’âge moyen était de 31,9 ans (écart type 8,7). La prévalence des antigènes de surface du virus de l’hépatite B et des anticorps anti-HCV, parmi les consommateurs de drogues injectables, était respectivement de 1,2 % et de 15,6 %. On a observé une corrélation significative entre l’âge, une durée plus longue de consommation de drogue, le manque de sensibilisation et le taux plus élevé d’infection à HCV (p < 0,01). Le taux élevé de partage de seringues chez les consommateurs de drogues injectables avait une incidence significative sur la prévalence des anticorps anti-HCV. Conclusion : Les consommateurs de drogues injectables restent la sous-population la plus touchée par l’hépatite C chronique au Liban.
معدل انتشار فريوس التهاب الكبد B وفريوس التهاب الكبد C يف صفوف األفراد الذين يتعاطون املخدرات حقنا يف الفئات السكانية يف لبنان
أنطوان أبو راشد، ماري نخول، كارين ريكا، عفيف جريج، بيري أيب حنا، وليد عامراخلالصة
اخللفية: إن األشخاص الذين يتعاطون املخدرات حقنا معرضون لإلصابة بعدد من العداوى الفريوسية املنقولة عن طريق الدم. ويشكل فريوس التهاب الكبد B وفريوس التهاب الكبد C مصدرا للقلق البالغ عىل مستوى الصحة العامة ضمن هذه الفئة املعرضة خلطر مرتفع.
األهداف: هدفنا إىل حتديد معدل انتشار فريوس التهاب الكبد B وفريوس التهاب الكبد C يف صفوف األشخاص الذين يتعاطون املخدرات حقنا يف لبنان.
طرق البحث: أجرينا دراسة استباقية مقطعية بني يونيو/حزيران 2015 و يونيو/حزيران 2016 عىل األشخاص الذين يتعاطون املخدرات حقنا، والذين حشدهتم املنظامت غري احلكومية اللبنانية بالتعاون مع وزارة الصحة العامة يف لبنان. وخضع املشاركون يف اختبار ملستضدات التهاب الكبد B وأضداد فريوس التهاب الكبد C باستخدام عتائد االختبار الرسيع. ثم تم احتساب معدل انتشار كل فريوس عىل حدة. كام جرى حتليل العالقة
االرتباطية بني كال النوعني من العدوى وعوامل خطر أخرى حمتملة.

EMHJ – Vol. 26 No. 4 – 2020Research article
466
References1. Global hepatitis report 2017. Geneva: World Health Organization; 2017:83 (http://www.who.int/iris/handle/10665/255016, accesed
25 August 2019).
2. Tohme RA, Holmberg SD. Transmission of hepatitis C virus infection through tattooing and piercing: a critical review. Clin Infect Dis. 2012;54(8):1167–78. doi:10.1093/cid/cir991
3. Shepard CW, Finelli L, Alter MJ. Global epidemiology of hepatitis C virus infection. Lancet Infect Dis. 2005;5(9):558–67. doi:10.1093/cid/cir991
4. Mohsen A, Bernier A, LeFouler L, Delarocque-Astagneau E, El-Daly M, El-Kafrawy S, et al. Hepatitis C virus acquisition among Egyptians: analysis of a 10-year surveillance of acute hepatitis C. Trop Med Int Health. 2015;20(1):89–97. doi:10.1111/tmi.12410
5. Khan AJ, Luby SP, Fikree F, Karim A, Obaid S, Dellawala S, et al. Unsafe injections and the transmission of hepatitis B and C in a periurban community in Pakistan. Bull World Health Organ. 2000;78(8):956–63. PMID:10994278
6. Mitruka K, Tsertsvadze T, Butsashvili M, Gamkrelidze A, Sabelashvili P, Adamia E, et al. Launch of a nationwide hepatitis C elimi-nation program--Georgia, April 2015. MMWR Morb Mortal Wkly Rep. 2015;64(28):753–7. PMID:26203628
7. United Nations Office on Drugs and Crime. World Drug Report 2013. New York: United Nations; 2013 (Sales No. E.13.XI.6).
8. Abou Rached A, Abou Kheir S, Saba J, Ammar W. Epidemiology of hepatitis B and hepatitis C in Lebanon. Arab J Gastroenterol. 2016;17(1):29–33. doi:10.1016/j.ajg.2016.01.002
9. Abou Rached A, Yaghi C, Khalil L, Saba J, Ammar W. Prevalence of hepatitis C virus genotypes and subtypes in Lebanese popula-tion and major high risk groups. Arab J Gastroenterol. 2017;18(2):114–7. doi:10.1016/j.ajg.2017.05.001
10. Nelson PK, Mathers BM, Cowie B, Hagan H, Des Jarlais D, Horyniak D, et al. Global epidemiology of hepatitis B and hepatitis C in people who inject drugs: results of systematic reviews. Lancet. 2011;378(9791):571–83. doi:10.1016/S0140-6736(11)61097-0
11. Abou Rached A, El Khoury L, El Imad T, Geara AS, Jreijiry J, Ammar W. Incidence and prevalence of hepatitis B and hepatitis C viruses in hemodialysis patients in Lebanon. World J Nephrol. 2016;5(1):101–7. doi:10.5527/wjn.v5.i1.101
12. Kassak K, Mahfoud Z, Kreidieh K, Shamra S, Afifi R, Ramia S. Hepatitis B virus and hepatitis C virus infections among fe-male sex workers and men who have sex with men in Lebanon: prevalence, risk behaviour and immune status. Sex Health. 2011;8(2):229–33. doi:10.1071/SH10080
13. Othman AA, Eissa AA, Markous RD, Ahmed BD, Al-Allawi NA. Hepatitis C virus genotypes among multiply transfused hemoglo-binopathy patients from Northern Iraq. Asian J Transfus Sci. 2014;8(1):32–4. doi:10.4103/0973-6247.126687
14. Mahfoud Z, Kassak K, Kreidieh K, Shamra S, Ramia S. Prevalence of antibodies to human immunodeficiency virus (HIV), hepati-tis B and hepatitis C and risk factors in prisoners in Lebanon. J Infect Dev Ctries. 2010;4(3):144–9. PMID:20351454
15. Ramia S, Mokhbat J, Ramlawi F, El-Zaatari M. Occult hepatitis B virus infection in HIV-infected Lebanese patients with isolated antibodies to hepatitis B core antigen. Int J STD AIDS. 2008;19(3):197–9. doi:10.1258/ijsa.2007.007200
16. Hahne SJ, Veldhuijzen IK, Wiessing L, Lim TA, Salminen M, Laar M. Infection with hepatitis B and C virus in Europe: a system-atic review of prevalence and cost-effectiveness of screening. BMC Infect Dis. 2013;13:181. doi:10.1186/1471-2334-13-181
17. Mahfoud Z, Kassak K, Kreidieh K, Shamra S, Ramia S. Distribution of hepatitis C virus genotypes among injecting drug users in Lebanon. Virol J. 2010;7:96. doi:10.1186/1743-422X-7-96
18. Malekinejad M, Navadeh S, Lotfizadeh A, Rahimi-Movaghar A, Amin-Esmaeili M, Noroozi A. High hepatitis C virus preva-lence among drug users in Iran: systematic review and meta-analysis of epidemiological evidence (2001–2012). Int J Infect Dis. 2015;40:116-30. doi:10.1016/j.ijid.2015.09.022
19. Hagan H, Pouget ER, Des Jarlais DC, Lelutiu-Weinberger C. Meta-regression of hepatitis C virus infection in relation to time since onset of illicit drug injection: the influence of time and place. Am J Epidemiol. 2008;168(10):1099–109. doi:10.1093/aje/kwn237
20. Maher L, Jalaludin B, Chant KG, Jayasuriya R, Sladden T, Kaldor JM, et al. Incidence and risk factors for hepatitis C seroconver-sion in injecting drug users in Australia. Addiction. 2006;101(10):1499–508. doi:10.1111/j.1360-0443.2006.01543.x
21. Thorpe LE, Ouellet LJ, Hershow R, Bailey SL, Williams IT, Williamson J, et al. Risk of hepatitis C virus infection among young adult injection drug users who share injection equipment. Am J Epidemiol. 2002;155(7):645–53. doi:10.1093/aje/155.7.645
النتائج: ضمت الدراسة عددا إمجاليا بلغ 250 شخصا، %98 منهم من الذكور. وكان متوسط العمر 31.9 سنة )بانحراف معياري 8.7(. وبلغ معدل انتشار مستضدات التهاب الكبد B وأضداد فريوس التهاب الكبد C يف صفوف األشخاص الذين يتعاطون املخدرات حقنا %1.2 و %15.6 عىل التوايل. C وظهر ارتباط قوي بني كل من تقدم العمر، واستطالة مدة تعاطي املخدرات، ونقص الوعي بارتفاع معدل اإلصابة بعدوى فريوس التهاب الكبد (P < 0.01). وأدى ارتفاع معدل التشارك يف استخدام اإلبر يف صفوف األشخاص الذين يتعاطون املخدرات حقنا يف لبنان إىل التأثري بصورة ُيعتدُّ
.C هبا عىل معدل انتشار أضداد فريوس التهاب الكبداالستنتاج: يظل األشخاص الذين يتعاطون املخدرات حقنا هم الفئة الفرعية من السكان األشد تأثرا بالتهاب الكبد C املزمن يف لبنان.

Research article
467
EMHJ – Vol. 26 No. 4 – 2020
22. Hahn JA, Page-Shafer K, Lum PJ, Bourgois P, Stein E, Evans JL, et al. Hepatitis C virus seroconversion among young injection drug users: relationships and risks. J Infect Dis. 2002;186(11):1558–64. doi:10.1086/345554
23. Page K, Hahn JA, Evans J, Shiboski S, Lum P, Delwart E, et al. Acute hepatitis C virus infection in young adult injection drug users: a prospective study of incident infection, resolution, and reinfection. J Infect Dis. 2009;200(8):1216–26. doi:10.1086/605947
24. El-Khoury J, Abbas Z, Nakhle PE, Matar MT. Implementing opioid substitution in Lebanon: inception and challenges. Int J Drug Policy. 2016;31:178–83. doi:10.1016/j.drugpo.2016.02.015
25. Al-Shazly F, Tinasti K. Incarceration or mandatory treatment: Drug use and the law in the Middle East and North Africa. Int J Drug Policy. 2016;31:172–7. doi:10.1016/j.drugpo.2016.02.012
26. Hagan H, Pouget ER, Des Jarlais DC. A systematic review and meta-analysis of interventions to prevent hepatitis C virus infec-tion in people who inject drugs. J Infect Dis. 2011;204(1):74–83. PMID:21628661
27. Havinga P, van der Velden C, de Gee A, van der Poel A. Differences in sociodemographic, drug use and health characteris-tics between never, former and current injecting, problematic hard-drug users in the Netherlands. Harm Reduct J. 2014;11:6. doi:10.1186/1477-7517-11-6
28. Palmateer N, Kimber J, Hickman M, Hutchinson S, Rhodes T, Goldberg D. Evidence for the effectiveness of sterile injecting equipment provision in preventing hepatitis C and human immunodeficiency virus transmission among injecting drug users: a review of reviews. Addiction. 2010;105(5):844–59. doi:10.1111/j.1360-0443.2009.02888.x
29. Wright NM, Tompkins CN. A review of the evidence for the effectiveness of primary prevention interventions for hepatitis C among injecting drug users. Harm Reduct J. 2006;3:27. doi:10.1186/1477-7517-3-27
30. Kapadia F, Vlahov D, Des Jarlais DC, Strathdee SA, Ouellet L, Kerndt P, et al. Does bleach disinfection of syringes protect against hepatitis C infection among young adult injection drug users? Epidemiology. 2002;13(6):738–41. doi:10.1097/01.EDE.0000032363.40442.1
31. Van Den Berg C, Smit C, Van Brussel G, Coutinho R, Prins M, Amsterdam C. Full participation in harm reduction programmes is associated with decreased risk for human immunodeficiency virus and hepatitis C virus: evidence from the Amsterdam Cohort Studies among drug users. Addiction. 2007;102(9):1454–62. doi:10.1111/j.1360-0443.2007.01912.x
32. Garfein RS, Golub ET, Greenberg AE, Hagan H, Hanson DL, Hudson SM, et al. A peer-education intervention to reduce injec-tion risk behaviors for HIV and hepatitis C virus infection in young injection drug users. AIDS. 2007;21(14):1923–32. doi:10.1097/QAD.0b013e32823f9066
33. Hahn JA, Wylie D, Dill J, Sanchez MS, Lloyd-Smith JO, Page-Shafer K, et al. Potential impact of vaccination on the hepatitis C virus epidemic in injection drug users. Epidemics. 2009;1(1):47–57. doi:10.1016/j.epidem.2008.10.002
34. Palmateer NE, Hutchinson SJ, Innes H, Schnier C, Wu O, Goldberg DJ, et al. Review and meta-analysis of the association between self-reported sharing of needles/syringes and hepatitis C virus prevalence and incidence among people who inject drugs in Europe. Int J Drug Policy. 2013;24(2):85–100. doi:10.1016/j.drugpo.2012.08.006
35. WHO, UNODC, UNAIDS technical guide for countries to set targets for universal access to HIV prevention, treatment and care for injecting drug users. 2009, Geneva: World Health Organization; 2009.
36. Vickerman P, Hickman M, Rhodes T, Watts C. Model projections on the required coverage of syringe distribution to prevent HIV epidemics among injecting drug users. J Acquir Immune Defic Syndr. 2006;42(3):355–61. doi:10.1097/01.qai.0000219788.73539.47
37. Backmund M, Reimer J, Meyer K, Gerlach JT, Zachoval R. Hepatitis C virus infection and injection drug users: prevention, risk factors, and treatment. Clin Infect Dis. 2005;40(Suppl. 5):S330–5. doi:10.1086/427475
38. National health statistics report. Beirut: Ministry of Public Health; 2012.-
39. Karam EG, Ghandour LA, Maalouf WE, Yamout K, Salamoun MM. A rapid situation assessment (RSA) study of alcohol and drug use in Lebanon. J Med Liban. 2010;58(2):76-85.

EMHJ – Vol. 26 No. 4 – 2020Review
468
The public health care system and primary care services in SaudiArabia: a system in transitionMushabab Al Asmri,1 Mohammed J. Almalki,2 Gerry Fitzgerald 3 and Michele Clark 4
1Asser Health Affairs, Ministry of Health, Riyadh, Saudi Arabia. 2Faculty of Public Health and Tropical Medicine, Jazan University, Jazan, Saudi Arabia. 3School of Public Health, Faculty of Health, Queensland University of Technology, Brisbane, Australia. 4School of Clinical Sciences, Queensland Univer-sity of Technology, Brisbane, Australia. (Correspondence to: Mohammed Almalki: [email protected]).
IntroductionIn spite of substantial improvements in the Saudi Arabian health services sector in the past few decades, the country is facing a number of challenges in its primary health care system. These challenges include increased demand be-cause of rapid population growth, high costs of health care services, inequitable access, concerns about the quality and safety of care, a growing burden of chronic diseases, a less than effective electronic health system (eHealth), poor co-operation and coordination between other sectors of care, and a highly centralized structure (1–5). The government has developed and implemented a number of initiatives which include the Strategic Plan of the Ministry of Health 2010–2020 to effectively tackle these challenges (6). These initiatives resulted in the replacement of seven ministers of health in almost two years, which indicates the serious administrative and practical difficulties in tackling these challenges in the health care system.
Most review papers in Saudi Arabia have focused on hospital-based medical services with limited consideration of primary health care services, which are the first point of access to health care in the Saudi Arabian health care system. The primary health care sector provides essential health care services to Saudi Arabians and to expatriates
working in the public sector (7). No reform of the Saudi Arabian health care system can be complete without first considering the primary health care services at the heart of the health care system.
This narrative review aimed to explore the challenges facing the Saudi Arabian health care system with a focus on primary health care services. It further discusses and analyses the barriers to and drivers of health sector reforms, including the effect of demographic and economic factors on the health care system. The review also recommends mechanisms for effective reform of primary health care services as the nucleus of overall health care system.
MethodsData relating to the Saudi Arabian health care system were extracted from published literature in the following databases: PubMed, MEDLINE, CINAHL, Saudi Medical Journal, Eastern Mediterranean Health Journal, and the portal of the Ministry of Health in Saudi Arabia. A further search using Google Scholar search engine was carried out to identify other relevant papers and documents, govern-ment reports and information published in Arabic. All the studies and documents were analysed for their content and the relevant information was synthesized and report-ed.
AbstractBackground: Saudi Arabia has invested heavily in its health care system by establishing health care infrastructures to improve health of the nation. However, it remains to be seen whether it is efficient and effective in providing health care services needed. Primary health care, which is the basis of universal health coverage, needs to be assessed on its perfor-mance, challenges and future opportunities to serve the Saudi Arabian population.Aims: This review aimed to identify challenges within the Saudi Arabian health care system with a focus on primary health care services, and to analyse the interrelated factors in order to suggest remedial reforms to further strengthen and improve the health care system.Methods: A narrative review of previous studies and governmental reports was undertaken to extract, analyse, synthe-size and report the findings.Results: The review found a number of key areas for improvement in the primary health care system. These areas include: the scope, structure, infrastructure, financing, increased demand, increased costs and workforce capacity. Other critical challenges include inequitable access to health services, quality and safety of services, the growing burden of chronic dis-eases, lack of an effective information system, management and leadership issues, and gaps in the referral system.Conclusion: The Saudi Arabian health care system needs comprehensive reform with a focus on primary health care.Keywords: delivery of health care, health services, primary health care, Saudi Arabia
Citation: Al Asmri M; Almalki MJ; Fitzgerald G; Clark M. The public health care system and primary care services in Saudi Arabia: a system in transi-tion. East Mediterr Health J. 2020;26(4):468–476. https://doi.org/10.26719/emhj.19.049
Received: 04/10/16; accepted: 07/08/18
Copyright © World Health Organization (WHO) 2020. Open Access. Some rights reserved. This work is available under the CC BY-NC-SA 3.0 IGO license (https://creativecommons.org/licenses/by-nc-sa/3.0/igo).
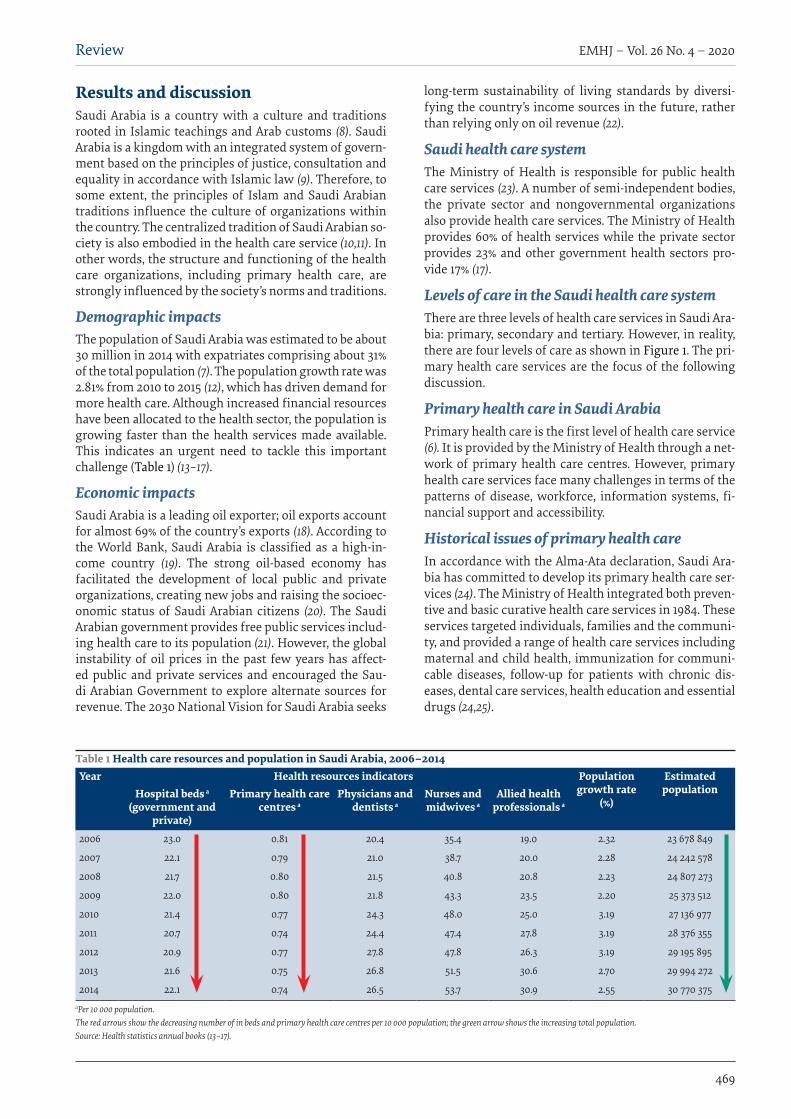
Review
469
EMHJ – Vol. 26 No. 4 – 2020
Results and discussionSaudi Arabia is a country with a culture and traditions rooted in Islamic teachings and Arab customs (8). Saudi Arabia is a kingdom with an integrated system of govern-ment based on the principles of justice, consultation and equality in accordance with Islamic law (9). Therefore, to some extent, the principles of Islam and Saudi Arabian traditions influence the culture of organizations within the country. The centralized tradition of Saudi Arabian so-ciety is also embodied in the health care service (10,11). In other words, the structure and functioning of the health care organizations, including primary health care, are strongly influenced by the society’s norms and traditions.
Demographic impacts The population of Saudi Arabia was estimated to be about 30 million in 2014 with expatriates comprising about 31% of the total population (7). The population growth rate was 2.81% from 2010 to 2015 (12), which has driven demand for more health care. Although increased financial resources have been allocated to the health sector, the population is growing faster than the health services made available. This indicates an urgent need to tackle this important challenge (Table 1) (13–17).
Economic impacts Saudi Arabia is a leading oil exporter; oil exports account for almost 69% of the country’s exports (18). According to the World Bank, Saudi Arabia is classified as a high-in-come country (19). The strong oil-based economy has facilitated the development of local public and private organizations, creating new jobs and raising the socioec-onomic status of Saudi Arabian citizens (20). The Saudi Arabian government provides free public services includ-ing health care to its population (21). However, the global instability of oil prices in the past few years has affect-ed public and private services and encouraged the Sau-di Arabian Government to explore alternate sources for revenue. The 2030 National Vision for Saudi Arabia seeks
long-term sustainability of living standards by diversi-fying the country’s income sources in the future, rather than relying only on oil revenue (22).
Saudi health care system The Ministry of Health is responsible for public health care services (23). A number of semi-independent bodies, the private sector and nongovernmental organizations also provide health care services. The Ministry of Health provides 60% of health services while the private sector provides 23% and other government health sectors pro-vide 17% (17).
Levels of care in the Saudi health care systemThere are three levels of health care services in Saudi Ara-bia: primary, secondary and tertiary. However, in reality, there are four levels of care as shown in Figure 1. The pri-mary health care services are the focus of the following discussion.
Primary health care in Saudi ArabiaPrimary health care is the first level of health care service (6). It is provided by the Ministry of Health through a net-work of primary health care centres. However, primary health care services face many challenges in terms of the patterns of disease, workforce, information systems, fi-nancial support and accessibility.
Historical issues of primary health care In accordance with the Alma-Ata declaration, Saudi Ara-bia has committed to develop its primary health care ser-vices (24). The Ministry of Health integrated both preven-tive and basic curative health care services in 1984. These services targeted individuals, families and the communi-ty, and provided a range of health care services including maternal and child health, immunization for communi-cable diseases, follow-up for patients with chronic dis-eases, dental care services, health education and essential drugs (24,25).
Table 1 Health care resources and population in Saudi Arabia, 2006–2014Year Health resources indicators Population
growth rate (%)
Estimated populationHospital beds a
(government and private)
Primary health care centres a
Physicians and dentists a
Nurses and midwives a
Allied health professionals a
2006 23.0 0.81 20.4 35.4 19.0 2.32 23 678 849
2007 22.1 0.79 21.0 38.7 20.0 2.28 24 242 578
2008 21.7 0.80 21.5 40.8 20.8 2.23 24 807 273
2009 22.0 0.80 21.8 43.3 23.5 2.20 25 373 512
2010 21.4 0.77 24.3 48.0 25.0 3.19 27 136 977
2011 20.7 0.74 24.4 47.4 27.8 3.19 28 376 355
2012 20.9 0.77 27.8 47.8 26.3 3.19 29 195 895
2013 21.6 0.75 26.8 51.5 30.6 2.70 29 994 272
2014 22.1 0.74 26.5 53.7 30.9 2.55 30 770 375aPer 10 000 population. The red arrows show the decreasing number of in beds and primary health care centres per 10 000 population; the green arrow shows the increasing total population. Source: Health statistics annual books (13–17).

EMHJ – Vol. 26 No. 4 – 2020Review
470
Primary health care services have improved considerably in the past four decades which has resulted in better health outcomes, for example a lower infant mortality rate, lower incidence of communicable diseases and an increase in average life expectancy (6). According to the Ministry of Health, there were 2281 public primary health care centres across the country in 2014 (17).
Saudi Arabia has seen changes in disease patterns with a shift away from communicable diseases to chronic diseases which are becoming more prevalent (6). These diseases place an increased burden on existing health care services (1,6,26–28). This change in disease pattern suggests that primary health care services, including patient follow-up strategies and preventive and health education activities, are insufficient. Recent data from the Saudi Health Information Survey show high rates of diabetes – 14.8% for males and 11.7% for females. Diabetes prevalence was 19.9%, almost double in those who were obese in comparison with non-obese (28). There is a real need to develop primary health care services directed to patients with chronic diseases and people who are most at high risk of these diseases.
Health system financing and expenditureSaudi Arabian citizens have free access to all levels of public health care services available in the country, which is funded by the central government. The Ministry of Health expenditure per capita has increased substantial-ly by 0.41% (17), which is equivalent to US$ 299 per capita (13–17,29–32). However, Saudi Arabia still spends less per capita on health than a number of industrialized nations (Figure 2) (33).
Ministry of Health planners and leaders focus primarily on hospitals rather than primary health care
centres. According to one report, more than 90% of the Ministry of Health budget allocated for infrastructure and development projects was spent on hospitals (21). Low expenditure on primary health care centres has resulted in 80% of primary health care buildings being rented; as such they are not specifically designed to provide health care services and they lack the necessary structural features to provide primary care (21,34).
According to government regulations, the budget for the Ministry of Health is released after approval of the Ministry of Finance. This practice may influence the performance and efficiency of the Ministry of Health and delay its work in all sectors including the primary health care services.
A comparison of the primary health care systems in Saudi Arabia and Cuba shows that health leaders and the government in Cuba saw primary health care as the cornerstone of successful health care together with a focus on the social determinants of health. Cuba’s approach has contributed to making its primary health care among the best in the world (35). The Saudi Arabian Ministry of Health should shift the focus of the health system from hospital-based health care services to the primary preventive and promotive health care services to deal effectively and efficiently with the increasing burden of chronic diseases.
Workforce of primary health careShortage of health care professionals is a global concern (36). The Saudi Arabian health care system is not immune to this challenge, and most health care professionals in Saudi Arabia are expatriates (1). In 2014, the primary health care workforce included 9304 physicians and dentists (3 per 10 000 inhabitants), 18 136 nurses (5.9 per
Provide specialized diagnostic, curative, surgical and rehabilitative services. In addition, these facilities work as research and teaching centres. They receive referred patients from the third level of care. However, admission to these facilities is very limited.
Provide advanced diagnostic, curative, surgical and rehabilitative services. Patients who need specialized health services are trans-ferred to the fourth level of care.
Provide diagnostic and curative services through emergency de-partments, outpatient clinics, hospitalization and minor surgeries. Patients who need a higher level of health services are transferred to the third level of care.
Provide the basic curative, preventive and promotive services. Pa-tients who need a higher level of health services are transferred to the second level of care.
FOURTH LEVELReferral hospitals
(Medical cities)
THIRD LEVEL Central hospitals
SECOND LEVELGeneral hospitals
and peripheral (community)
hospitals
FIRST LEVELPrimary health care
Figure 1 Levels of care in the Saudi Arabia health care system

Review
471
EMHJ – Vol. 26 No. 4 – 2020
10 000 inhabitants), and 9690 allied health workers (17). The health care workforce for primary health care servic-es has increased with nurses outnumbering physicians and allied health workers between 2010 and 2014 (Figure 3) (13–17).
Many health care professionals, particularly nurses, move to management or other non-nursing departments within their organizations (37). This trend is also seen among physicians. A ministerial committee review found that the number of primary health care physicians was 40% less than the required (21). In 2013 the total number
of physicians (excluding dentists) per 10 000 population in Saudi Arabia was 2.3 (16). The scarcity of physicians in Saudi Arabia is high compared with other countries (Figure 4) (16,38).
Despite the shortage of physicians, they continue to dominate because they hold key positions within the health care system (39,40). Physicians occupy a number of management and leadership positions at central and regional levels of the health authorities, which makes shortages of primary health care physicians worse.
1000
9000
8000
7000
6000
5000
4000
3000
2000
1000
0
Saudi Arabia Australia United States of America
United Kingdom France
Country
Hea
lth
expe
ndit
ure
per c
apit
a (U
S$)
1.147.33
5.002.36
9.869.74
3.958.02
4.263.36
Figure 2 Health expenditure per capita in various countries, 2016 (33)
20000
18000
16000
14000
12000
10000
8000
6000
4000
2000
02010 2011 2012 2013 2014
Year
Num
bers
Physicians
Nurses
Allied health personnel
Figure 3 Total number of primary health care professionals in Saudi Arabia, 2010–2014 (13–17)
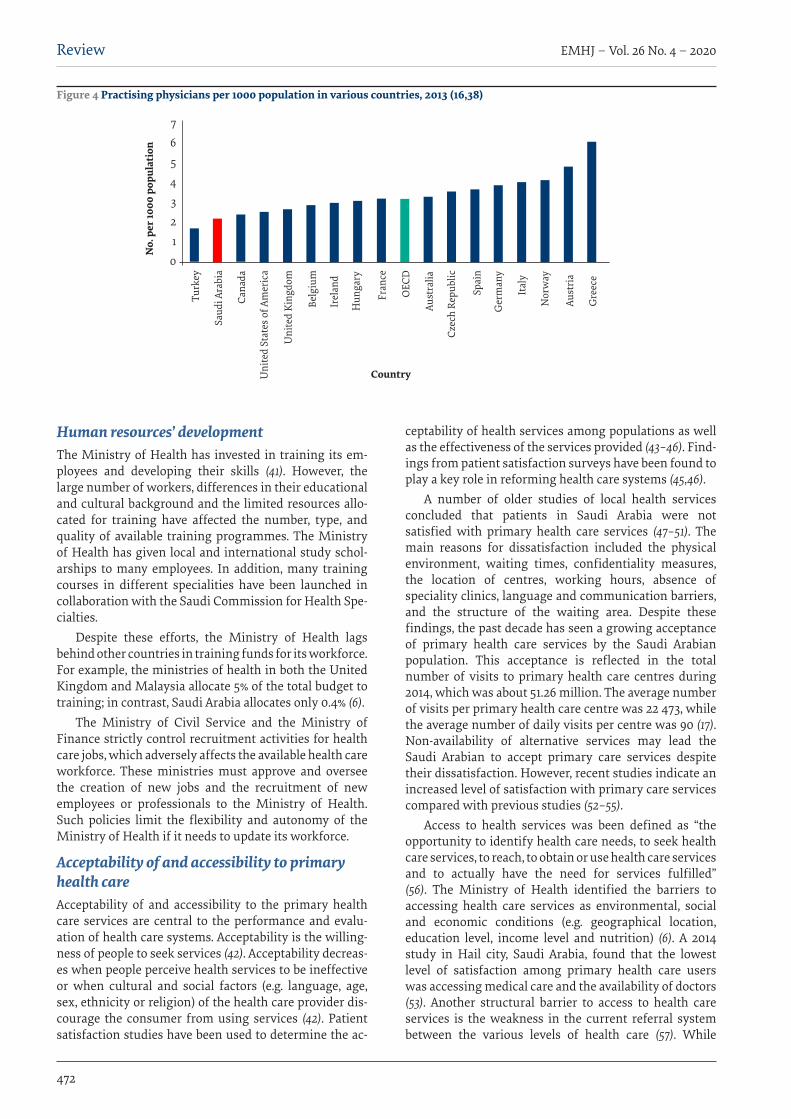
EMHJ – Vol. 26 No. 4 – 2020Review
472
Human resources’ development The Ministry of Health has invested in training its em-ployees and developing their skills (41). However, the large number of workers, differences in their educational and cultural background and the limited resources allo-cated for training have affected the number, type, and quality of available training programmes. The Ministry of Health has given local and international study schol-arships to many employees. In addition, many training courses in different specialities have been launched in collaboration with the Saudi Commission for Health Spe-cialties.
Despite these efforts, the Ministry of Health lags behind other countries in training funds for its workforce. For example, the ministries of health in both the United Kingdom and Malaysia allocate 5% of the total budget to training; in contrast, Saudi Arabia allocates only 0.4% (6).
The Ministry of Civil Service and the Ministry of Finance strictly control recruitment activities for health care jobs, which adversely affects the available health care workforce. These ministries must approve and oversee the creation of new jobs and the recruitment of new employees or professionals to the Ministry of Health. Such policies limit the flexibility and autonomy of the Ministry of Health if it needs to update its workforce.
Acceptability of and accessibility to primary health careAcceptability of and accessibility to the primary health care services are central to the performance and evalu-ation of health care systems. Acceptability is the willing-ness of people to seek services (42). Acceptability decreas-es when people perceive health services to be ineffective or when cultural and social factors (e.g. language, age, sex, ethnicity or religion) of the health care provider dis-courage the consumer from using services (42). Patient satisfaction studies have been used to determine the ac-
ceptability of health services among populations as well as the effectiveness of the services provided (43–46). Find-ings from patient satisfaction surveys have been found to play a key role in reforming health care systems (45,46).
A number of older studies of local health services concluded that patients in Saudi Arabia were not satisfied with primary health care services (47–51). The main reasons for dissatisfaction included the physical environment, waiting times, confidentiality measures, the location of centres, working hours, absence of speciality clinics, language and communication barriers, and the structure of the waiting area. Despite these findings, the past decade has seen a growing acceptance of primary health care services by the Saudi Arabian population. This acceptance is reflected in the total number of visits to primary health care centres during 2014, which was about 51.26 million. The average number of visits per primary health care centre was 22 473, while the average number of daily visits per centre was 90 (17). Non-availability of alternative services may lead the Saudi Arabian to accept primary care services despite their dissatisfaction. However, recent studies indicate an increased level of satisfaction with primary care services compared with previous studies (52–55).
Access to health services was been defined as “the opportunity to identify health care needs, to seek health care services, to reach, to obtain or use health care services and to actually have the need for services fulfilled” (56). The Ministry of Health identified the barriers to accessing health care services as environmental, social and economic conditions (e.g. geographical location, education level, income level and nutrition) (6). A 2014 study in Hail city, Saudi Arabia, found that the lowest level of satisfaction among primary health care users was accessing medical care and the availability of doctors (53). Another structural barrier to access to health care services is the weakness in the current referral system between the various levels of health care (57). While
Country
Turk
ey
Saud
i Ara
bia
Cana
da
Uni
ted
Stat
es o
f Am
eric
a
Uni
ted
King
dom
Belg
ium
Irel
and
Hun
gary
Fran
ce
OEC
D
Aust
ralia
Czec
h Re
publ
ic
Spai
n
Ger
man
y
Ital
y
Nor
way
Aust
ria
Gre
ece
No.
per
1000
pop
ulat
ion
7
6
5
4
3
2
1
0
Figure 4 Practising physicians per 1000 population in various countries, 2013 (16,38)
Review
473
EMHJ – Vol. 26 No. 4 – 2020
general, central and specialized public hospitals accept only referred cases, private hospitals are free to accept patients without referral. Furthermore, there is no system for sending patients back to primary health care services from general, central or specialized hospitals. More efforts are needed to reform this gap and to ensure a better continuity of primary care.
A study in Riyadh, Saudi Arabia, examined the factors influencing access to and use of primary health care centres in urban and rural areas (55). The findings highlighted important differences between urban and rural populations. For rural patients these factors included the distance to the primary health care centre, cleanliness of the centre, understanding the treatment and receiving health prevention and promotion services. Urban respondents were shown to want increased opening hours particularly in the evenings (55).
According to the World Health Organization (WHO), “The role of government with regard to sustainable health systems is to guarantee equity of access and to ensure that essential health system functions are maintained.” (58). As a first level of contact between people and the health care system, primary health care services of good quality should be accessible and available to the whole population.
Primary care health information systemThe Ministry of Health in Saudi Arabia developed a four-year (2008–2011) project to improve eHealth in health care organizations and facilities (59,60). However, the eHealth strategy was first implemented during 2011 in the hospitals in major cities (60). A study in 2013 aimed to identify the information needs and information-seeking behaviour of primary care physicians in Saudi Arabia (61). The findings indicated that the absence of an electronic system was a main contributor to the weaknesses of pri-mary health care services. Primary health care physicians did not have up-to-date patient information. High-quality computing services, including electronic health records and clinical decision-making support tools, are essential to a good-quality health care service (62). Such initia-tives can help deliver effective patient-centred care (63). Therefore, providing eHealth facilities within the current primary health care services is crucial to serve patients’ needs and to enhance the knowledge base of physicians and other health care professionals.
New primary health care reformTo improve the quality of primary health care services, it is important to identify gaps in existing systems through review of the literature and existing health care policies and observations, and then develop and implement ap-propriate reforms in order to fill the gaps. This means the focus should be on primary health care structure, infra-structure, financing, management and leadership. The Ministry of Health has tried to reform the health system including primary health care services through its new reform strategy for 2010–2020 (6). The new strategy calls for the establishment of more primary health care cen-
tres to meet the growing need for health services. In addi-tion, it calls for the establishment of planned institution-al work and the strengthening of monitoring of quality and performance.
Another objective of the strategy is to develop an accurate database to integrate primary health care centres. The strategy also includes the decentralization of management and empowerment of the administrative, technical and finance sectors within each level of health care. The implementation of an effective referral system from primary health care to the next level and back to primary health care is also an important objective in the proposed strategy. The development of the primary health care workforce through further education and training and new recruitment and retention strategies to address workforce shortages is also part of the reform strategy.
Although it is almost six years since the strategy was publicly announced, few changes have been introduced (personal observation). To ensure the success of this strategy, the Ministry of Health in collaboration with regional directorates must set operational plans for its implementation. In addition, a substantial portion of the Ministry of Health budget should be directed to primary health care services in order to promote population health in Saudi Arabia. The importance of such changes has increased because the Ministry of Health has recently decided to provide paid primary health care services to expatriates who work in the private sector (64), thus potentially placing an even greater burden on the primary health care system. To support this trend and promote population health, upcoming programmes and initiatives of the Saudi Vision 2030 for health should focus more on public health and primary health care services.
ConclusionThe Saudi Arabian health care system is going through a period of evolution. This has been brought about by the new vision of the Ministry of Health and the develop-ment of a national health strategy to meet the challenges. There is an urgent need to take new initiatives to improve the health care services in Saudi Arabia with a focus on reforms of primary health care services. Such reforms re-quire the challenges in many areas of health and health to be tackled including: scope, structure, infrastructure, financing, increased demand, increased costs, workforce, inequitable access to the services, quality and safety of services, growing burden of chronic diseases, informa-tion systems, management and leadership issues, and the referral system.
Funding: None.
Competing interests: None declared.
EMHJ – Vol. 26 No. 4 – 2020Review
474
AnalyseSystème de santé public et services de soins de santé primaires en Arabie saoudite : un système en transitionRésuméContexte : L’Arabie saoudite a investi massivement dans son système de soins de santé en créant des infrastructures de soins de santé en vue d’améliorer la santé de la nation. Cependant, il reste à voir si ce système est efficace et efficient pour la prestation de services de soins de santé nécessaires. Les soins de santé primaires, qui constituent la base de la couverture sanitaire universelle, devraient être évalués en termes de résultats, de défis et d’opportunités pour l’avenir afin de répondre aux besoins de la population saoudienne.Objectifs : La présente analyse avait pour objectif d’identifier les défis à relever au sein du système de santé saoudien en mettant l’accent sur les services de soins de santé primaires et d’examiner les facteurs interdépendants afin de proposer des réformes correctives visant à renforcer et à améliorer le système de santé.Méthodes : Un examen narratif d’études précédentes et des rapports gouvernementaux a été réalisé afin d’extraire, d’analyser, de synthétiser les résultats et d’en rendre compte.Résultats : L’analyse a mis en évidence plusieurs domaines clés nécessitant des améliorations concernant le système de soins de santé primaires ; il s’agit notamment du champ d’application, de la structure, des infrastructures, du financement, de la demande accrue des soins, de l’augmentation des coûts et des capacités du personnel de santé. Parmi les autres défis majeurs, on mentionnera les inégalités d’accès aux services de santé, la qualité et la sécurité des services, la charge croissante des maladies chroniques, l’absence de système d’information efficace, les problèmes de gestion et d’encadrement ainsi que les lacunes du système d’orientation-recours.Conclusion : Le système de santé de l’Arabie saoudite nécessite une réforme complète mettant l’accent sur les soins de santé primaires.
نظام الرعاية الصحية العامة وخدمات الرعاية األولية يف اململكة العربية السعودية: نظام يشهد حتوالمشبب األسمري، حممد املالكي، جريي فيتزجريالد، ميشيل كالرك
اخلالصةاخللفية: ضخت اململكة العربية السعودية استثامرات كبرية يف نظام رعايتها الصحي من خالل إنشاء بنى حتتية للرعاية الصحية بقصد حتسني صحة األفراد يف الدولة. غري أن األنظار ترتقب لرتى إذا ما كان هذا النظام فّعاال وكفؤا من حيث تقديم خدمات الرعاية الصحية املطلوبة. وتتطلب الرعاية الصحية، التي متثل األساس للتغطية الصحية الشاملة، تقييم أدائها، وحتدياهتا، وحتديد فرصها املستقبلية من أجل خدمة السكان يف اململكة العربية
السعودية.األهداف: هدف هذا االستعراض إىل الوقوف عىل التحديات املاثلة يف نظام الرعاية الصحية يف اململكة العربية السعودية، مع إيالء تركيز خاص إىل خدمات الرعاية الصحية األولية، وحتليل العوامل املتداخلة لتقديم اقرتاحات عالجية هتدف إىل زيادة تقوية نظام الرعاية الصحية وتعمل عىل
حتسينه.طرق البحث: ُأجري استعراض رسدي لدراسات سابقة وتقارير حكومية من أجل استخالصها، وحتليلها، وتوليفها وإبالغ نتائجها.
والبنية النطاق، والرتكيب، املجاالت: تلك األولية. وتتضمن الصحية الرعاية نظام للتحسني ضمن رئيسية النتائج: وجد االستعراض جماالت التساوي يف احلصول التحديات األخرى املهمة عدم العاملة. وتتضمن املتزايدة، وقدرة القوى املتزايد، والتكاليف التحتية، والتمويل، والطلب عىل اخلدمات الصحية، وجودة اخلدمات ومأمونيتها، والعبء املتزايد الناجم عن األمراض املزمنة، وغياب نظام فعال للمعلومات، ومسائل تتصل
باإلدارة والقيادة، والثغرات يف نظام اإلحالة.االستنتاج: حيتاج نظام الرعاية الصحية يف اململكة العربية السعودية إىل اإلصالح الشامل، مع الرتكيز بصورة خاصة عىل الرعاية الصحية األولية.
References1. Almalki M, FitzGerald G, Clark M. Health care system in Saudi Arabia: an overview. East Mediterr Health J. 2011;17(10):784–93.
2. Yusuf N. Private and public healthcare in Saudi Arabia: future challenges. Int J Bus Econ Dev. 2014;2(1):114–8.
3. Walston S, Al-Harbi Y, Al-Omar B. The changing face of healthcare in Saudi Arabia. Ann Saudi Med. 2008;28(4):243–50.
4. Almutairi KM, Moussa M. Systematic review of quality of care in Saudi Arabia. a forecast of a high quality health care. Saudi Med J. 2014;35(8):802–9.
5. Aljuaid M, Mannan F, Chaudhry Z, Rawaf S, Majeed A. Quality of care in university hospitals in Saudi Arabia: a systematic review. BMJ Open. 2016;6:e008988.
Review
475
EMHJ – Vol. 26 No. 4 – 2020
6. [Strategic plan of the Ministry of Health 2010–2020 – Saudi Arabia]. [In Arabic]. Riyadh: Ministry of Health; 2010 (http://www.moh.gov.sa/Portal/WhatsNew/Documents/OKIstragi260p.pdf , accessed 1 March 2017).
7. Statistical Year Book 2014. Kingdom of Saudi Arabia. Riyadh: Central Department of Statistics and Information; 2014 (https://www.moh.gov.sa/en/Ministry/Statistics/book/Documents/Statistical-Book-for-the-Year-1435.pdf. accessed 27 August 2019)
8. Long DE. Culture and customs of Saudi Arabia. Westport, CT: Greenwood Press; 2005.
9. Bureau of Experts at the Council of Ministers. [Basic Law of Governance – Saudi Arabia]. Riyadh: The Council of Ministers; 1991. [in Arabic] (https://laws.boe.gov.sa/BoeLaws/Laws/LawDetails/16b97fcb-4833-4f66-8531-a9a700f161b6/2, accessed 24 August 2019).
10. Albougami A. Role of language and communication in providing quality healthcare by expatriate nurses in Saudi Arabia. J Health Spec. 2015;3(3):166–72.
11. Almutairi KM. Culture and language differences as a barrier to provision of quality care by the health workforce in Saudi Arabia. Saudi Med J. 2015;36(4):425–31.
12. United Nations – Population Division. World population prospects 2017 (https://esa.un.org/unpd/wpp/DataQuery/, accessed 29 April 2018).
13. Health statistics annual book 2010. Riyadh: Ministry of Health; 2010.
14. Health statistics annual book 2011. Riyadh: Ministry of Health; 2011.
15. Health statistics annual book 2012. Riyadh: Ministry of Health; 2012.
16. Health statistics annual book 2013. Riyadh: Ministry of Health; 2013.
17. Statistical year book 2014. Riyadh: Ministry of Health; 2014.
18. National accounts indicators. Riyadh: Central Department of Statistics and Information; 2016 (https://www.stats.gov.sa/sites/default/files/national_accounts_indicators_2016.pdf, accessed 27 August 2019).
19. The World Bank. Data: Saudi Arabia (http://data.worldbank.org/country/saudi-arabia, accessed 12 January 2016).
20. [The Saudi economy in figures 1434/1435H (2013G)]. Riyadh: Ministry of Economy and Planning; 2013. [In Arabic]
21. Alrabiyah OA, Alfaleh F. [The Saudi health system reform: initiation, development and the challenges facing it]. Riyadh: Science Press and Publishing; 2010. [In Arabic]
22. The Saudi Vision 2030. Riyadh: Vision2030 Office; 2016 (https://vision2030.gov.sa/en/node, accessed 29 July 2019).
23. The executive regulation of the Saudi health system. Riyadh: Ministry of Health; 2003.
24. Al Mazrou Y, Salem A. Primary health care guide. Riyadh: Ministry of Health; 2004.
25. Alharthi F, Alenad A, Baitalmal H, Alkhurashi A. Health over a century. Riyadh: Ministry of Health and ASBAR Centre for Studies Research & Communication; 1999.
26. Aldakhil M. Saudi food guide: palm healthy food. Riyadh: Ministry of Health; 2012.
27. Adult obesity at-a-glance. Saudi Health Information Survey for non-communicable diseases in the Kingdom of Saudi Arabia. Riyadh: Ministry of Health; 2014.
28. Diabetes at-a-glance. Saudi Health Information Survey for non-communicable diseases in Kingdom of Saudi Arabia. Riyadh: Ministry of Health; 2014.
29. Health statistics annual book, 2006. Riyadh: Ministry of Health; 2006.
30. Health statistics annual book, 2007. Riyadh: Ministry of Health; 2007.
31. Health statistics annual book, 2008. Riyadh: Ministry of Health; 2008.
32. Health statistics annual book, 2009. Riyadh: Ministry of Health; 2009.
33. World Bank. Current health expenditure per capita (current US$). 2016 (https://data.worldbank.org/indicator/SH.XPD.CHEX.PC.CD, accessed 29 July 2019).
34. Almalki MJ. Quality of work life and turnover intention in primary healthcare organisations: a cross-sectional study of registered nurses in Saudi Arabia. Brisbane: Queensland University of Technology; 2012.
35. Whiteford L, Branch L. Primary health care in Cuba: the other revolution. Lanham: Rowman & Littlefield Publishing Group, Inc.; 2007.
36. Global Health Workforce Alliance. Health workforce shortage focus of high level Irish conference. News release. 2012 (http://www.who.int/workforcealliance/media/news/2012/irishforum2012/en/, accessed 12 January 2016).
37. Almalki MJ, FitzGerald G, Clark M. The relationship between quality of work life and turnover intention of primary health care nurses in Saudi Arabia. BMC Health Serv Res. 2012;12(1):314.
38. Doctors per 1000 of population. Paris: Organisation for Economic Co-operation and Development (OECD); 2014 (https://data.oecd.org/healthres/doctors.htm#indicator-chart, accessed 2 January 2016).
39. Amir AK. The Saudi healthcare system: a view from the minaret. World Health Popul. 2012;13(3):52–64.
40. Littlewood J, Yousuf S. Primary health care in Saudi Arabia: applying global aspects of health for all, locally. J Adv Nurs. 2000;32(3):675–81.
EMHJ – Vol. 26 No. 4 – 2020Review
476
41. [Annual Report of the Ministry of Health]. Riyadh: Ministry of Health; 2017. [in Arabic]
42. Evans DB, Hsu J, Boerma T. Universal health coverage and universal access. Bull World Health Organ. 2013;91(8):546–546A.
43. Cabrera-Barona P, Blaschke T, Kienberger, S. Explaining accessibility and satisfaction related to healthcare: a mixed-methods approach. Soc Indic Res. 2017;133:719–39.
44. George A, Rubin G. Non-attendance in general practice: a systematic review and its implications for access to primary health care. Fam Pract. 2003;20(2):178–84.
45. Mellor D, Davison T, McCabe M, George K, Moore K, Ski C. Satisfaction with general practitioner treatment of depression among residents of aged care facilities. J Aging Health. 2006;18(3):435–57.
46. Raivio R, Jääskeläinen J, Holmberg-Marttila D, Mattila KJ. Decreasing trends in patient satisfaction, accessibility and continuity of care in Finnish primary health care–a 14-year follow-up questionnaire study. BMC Fam Pract. 2014;15(1):98.
47. Al-Faris E, Khoja T, Falouda M, Saeed A. Patient’s satisfaction with accessibility and services offered in Riyadh health centers. Saudi Med J. 1996;17(1):11–7.
48. Ali MES, Mahmoud MEA. A study of patient satisfaction with primary health care services in Saudi Arabia. J Community Health. 1993;18(1):49–54.
49. Al-Sakkak MA, Al-Nowaiser NA, Al-Khashan HI, Al-Abdrabulnabi AA, Jaber RM. Patient satisfaction with primary health care services in Riyadh. Saud. Med J. 2008;29(3):432–6.
50. Mansour AA, Al-Osimy MH. A study of satisfaction among primary health care patients in Saudi Arabia. J Community Health. 1993; 18(3):163–73.
51. Al-Qatari G, Haran D. Determinants of users’ satisfaction with primary health care settings and services in Saudi Arabia. Int J Qual Health Care. 1999;11(6):523–31.
52. Almoajel A, Fetohi E, Alshamrani A. Patient satisfaction with primary health care in Jubail City, Saudi Arabia. World J Med Sci. 2014;11(2):255–64.
53. Alshammari F. Patient satisfaction in primary health care centers in Hail City, Saudi Arabia. Am J Appl Sci. 2014;11(8):1234–40.
54. Mohamed EY, Sami W, Alotaibi A, Alfarag A, Almutairi A, Alanzi F. Patients’ satisfaction with primary health care centers’ servic-es, Majmaah, Kingdom of Saudi Arabia. Int J Health Sci. 2015;9(2):163–70.
55. Alfaqeeh G, Cook E J, Randhawa G, Ali N. Access and utilisation of primary health care services comparing urban and rural areas of Riyadh Province, Kingdom of Saudi Arabia. BMC Health Serv Res. 2017;17:106.
56. Levesque J-F, Harris MF, Russell G. Patient-centred access to health care: conceptualising access at the interface of health sys-tems and populations. Int J Equity Health. 2013;12(1):18.
57. Senitan M, Alhaiti A, Gillespie J. “Ehalati”: evaluation of the referral system in primary health care centres in Saudi Arabia. Int J Integr Care. 2018;18(s2):326.
58. Health for All in the 21st Century. Geneva: World Health Organization; 1997 (http://applications.emro.who.int/docs/em_rc44_10_annex_en.pdf, accessed 29 July 2019).
59. Qurban H, Austria RD. Public perception on e-health services: implications of preliminary findings of KFMMC for military hos-pitals in KSA. Paper presented at the European and Mediterranean Conference on Information Systems, Dubai, 25–26 May, 2008.
60. [National e-health strategy]. Riyadh: Ministry of Health; 2013. [In Arabic]
61. Alghanim SA. Information needs and seeking behavior among primary care physicians in Saudi Arabia: implications for policy and practice. Sci Res Essays. 2011;6(8):1849–55.
62. Hasanain R, Vallmuur K, Clark M. Progress and challenges in the implementation of electronic medical records in Saudi Arabia: a system review. Health Informatics – an International Journal. 2014;3(2):3214.
63. Liyanage H, Correa A, Liaw S, Kuziemsky C, Terry A, de Lusignan S. Does informatics enable or inhibit the delivery of pa-tient-centred, coordinated, and quality-assured care: a Delphi study. Yearb Med Inform. 2015;10(1):22–9.
64. [Organizational guide for the paid health services program]. Riyadh: Ministry of Health; 2018. [In Arabic].

Review
477
EMHJ – Vol. 26 No. 4 – 2020
Factors associated with tuberculosis diagnosis and treatment delays in Middle East and North Africa: a systematic reviewDalya Eltayeb,1 Elize Pietersen,2 Mark Engel 2 and Leila Abdullahi 3
1Department of Public Health and Family Medicine; 2Department of Medicine, Faculty of Health Sciences; 3Vaccines for Africa Initiative, University of Cape Town, Anzio Road Observatory, Cape Town, South Africa (Correspondence to: Dalya Eltayeb: [email protected]).
IntroductionTuberculosis (TB) remains a major global health problem (1). In 2015, an estimated 4.3 million cases were neither detected nor treated in national TB programmes globally (1).
A diagnostic delay of two months will result in transmission of TB to an average of 8 contacts (2) and within a year, this number will increase eight to 15 persons; the increase would be even higher in settings of overcrowding and higher social capital (3). Furthermore, delays between admission and initiation of treatment will result in the exposure to TB of an average of 23.9 health care workers (4). Therefore, to curb TB transmission and reduce poor disease outcomes and adverse social and economic consequences, timely diagnosis and prompt initiation of anti-TB treatment is vital (5).
Reasons for delayed TB diagnosis can be attributed to both patients and the health care system (6). Patients may delay in seeking help while the health care system may delay in suspecting TB and initiating relevant investigations. Delays, and ultimately TB control, are affected by patient factors such as sociodemographic characteristics, stigmatization effects of TB, fear of high individual expenses, symptoms on presentation and health care factors such as absence of a refined TB
suspicion index, infrastructure and organization of the health system (7).
The World Bank’s description of the Middle East and North Africa (MENA) region covers the 21 members of the Arab League, plus the Islamic Republic of Iran, Israel and Turkey (8). The MENA region is challenged with delayed detection of TB, which negatively affects treatment and control in the region (9). Factors in the region that have destabilized health care delivery are political instability and economic sanctions. Health care resources are thus stretched beyond control, and the quality of health care service delivery deteriorated to a level that can be described as “below standard” (9).
There is a scarcity of systematic reviews addressing TB diagnostic and treatment delays (10). Furthermore, these reviews included older studies, are applicable to high HIV prevalence settings, and specifically did not include diagnostic and treatment delays in MENA countries.
We conducted a systematic review to address this paucity of data. We wished to evaluate the evidence regarding factors associated with TB diagnostic and treatment delays in the MENA region. Successful identification of such factors may actually lead to interventions which may ultimately increase effective TB control.
AbstractBackground: Political instability, economic sanctions and substandard quality of health care negatively affect tuberculo-sis (TB) control in the Middle East and North Africa (MENA) region.Aims: We aimed to elucidate factors contributing to delays in TB diagnosis and treatment in MENA countries.Methods: Two reviewers independently appraised eligible articles identified through comprehensive searching and ex-tracted data which were subjected to meta-analysis.Results: Delays in TB diagnosis were associated with older age and low income [(OR = 1.49; 95% CI: 1.31–1.70) and (OR = 1.26; 95% CI: 1.09–1.45)] respectively (n = 17 studies). Being female was associated with patient delay and health system de-lay [(OR = 1.24; 95% CI: 1.02–1.50) and (OR = 1.68; 95% CI: 1.18–2.38)] respectively. Knowledge and perception of TB, having employment and low levels of crowding were each protective against patient delay. The GRADE system rated the evidence as of low quality.Conclusion: This review provides evidence for facilitators and barriers to TB diagnosis and health system delays. For successful TB control in the MENA region, TB awareness and interventions targeting the elderly and those from lower-in-come settings, particularly directed at gender differences, are essential.Keywords: Tuberculosis case finding, delayed diagnosis, tuberculosis control, Middle East and North Africa, health care–seeking behaviour, delivery of health care
Citation: Eltayeb D; Pietersen E; Engel M; Abdullahi L. Factors associated with tuberculosis diagnosis and treatment delays in Middle East and North Africa: a systematic review. East Mediterr Health J. 2020;26(4):477–487. https://doi.org/10.26719/2020.26.4.477
Received: 12/02/18; accepted: 30/08/18
Copyright © World Health Organization (WHO) 2020. Open Access. Some rights reserved. This work is available under the CC BY-NC-SA 3.0 IGO li-cense (https://creativecommons.org/licenses/by-nc-sa/3.0/igo).
EMHJ – Vol. 26 No. 4 – 2020Review
478
MethodsProtocolThe review protocol has been published in the PROSPE-RO International Prospective Register of systematic re-views, (http://www.crd.york.ac.uk/PROSPERO) registra-tion number CRD42015023337.
Search methods for identification of studiesThis systematic review adheres to Preferred Reporting Items for Systematic reviews and Meta-Analyses (PRIS-MA) guidelines 2009 (11). We searched MEDLINE using combinations of the following keywords: TB, tuberculo-sis, mycobacterium, patient delay, health seeking delay, care-seeking delay, health system delay, health facility delay, health provider delay, diagnosis delay, total delay and treatment delay. Key terms (factors or enablers and barriers) that did not provide new articles were excluded from the final search strategy. Search strategies incorpo-rated both medical subject headings (MeSH) and free-text terms using controlled vocabularies applicable to da-tabases. Published and unpublished articles, irrespective of language used, were interrogated up to June 2015.
Electronic searches were carried out on the following published databases: Cochrane Central Register of Controlled Trials (CENTRAL), Web of Science, PubMed, CINAHL, Psychlnfo and Scopus. Grey literatures were searched using Index Medicus for the Eastern Mediterranean Region (IMEMR), (Africa-wide) allied health and Google scholar. In addition, we searched conference proceedings and reference lists of relevant articles.
Observational studies (case–control, cross-sectional and population-based) were considered for review. Studies which reported patient and health system delays in patients diagnosed with, or suspected of, pulmonary TB (PTB) were included. Andersen’s behavioural model of health care utilization was used to classify factors regarded as primary outcomes for the study (12). These factors were defined as predisposing factors (factors influencing the initial performance of behaviour); enabling factors (factors making it possible for individuals to enact their behaviour) and need factors (factors following behaviour enactment and influence continued behaviour). Secondary outcomes were: magnitude of patient delay (defined as time interval from onset of TB symptoms to first visit of any health provider), health system delay (defined as time interval from the first health provider visit to initiation of treatment) and total delay, which includes both patient and health system delays (defined as time interval from onset of TB symptoms to initiation of treatment).
Data collection and analysisSelection of studies and data extraction
Two reviewers (DE and EP) independently screened titles and abstracts of all identified articles to select potential eligible studies; reviewed full texts of potentially eligible studies; nominated the final set of articles for inclusion
into the review; extracted data using a standardized data extraction form and reviewed risk of bias. A third review-er (ME or LA) facilitated disagreements regarding study selection and data extraction.Assessment of risk of bias
We noticed a 2-study design, a descriptive phase and an analysis phase, in 12/20 studies. In these studies the descriptive phase, a cross-sectional design, was used to determine the extent of delay while during the analy-sis phase, a nested case–control design, patient delay was compared to the median time of delay. The quality of these studies was assessed based on results from the analysis phase. Two authors used the Newcastle–Ottawa Quality Assessment Scale for case–control studies (13) to assess the risk of bias in these 12 studies.
Cross-sectional and descriptive surveys were assessed according to an assessment tool by Hoy et al. (14) as adapted by Werfalli et al. (15). This adapted assessment tool allows for allocation of a composite score to assist with relative comparison between studies. Data analysis and synthesis
The results of each study were expressed as an odds ra-tio (OR) with the corresponding 95% confidence interval (CI) for dichotomous data. Studies that compared similar types of outcomes were grouped to get feasible results on an overall estimate of effect. Random effects meta-analy-sis was used due to heterogeneity in study results. Prev-alence of TB delay from different studies was pooled in a meta-analysis using Review Manager, 5.3.
Assessment of heterogeneity and subgroup analysisStatistical heterogeneity between the study results were examined using the χ2 test for homogeneity (with signif-icance defined at the alpha-level of 10%) and quantified using the I-squared statistic. The χ2 test for subgroup dif-ferences was used to test for subgroup interactions.
Grading the quality of evidenceWe used GRADEpro software to appraise limitations to validity in terms of the quality of evidence on the 12/20 observational studies pooled in the meta-analysis.
ResultsStudy flow and description of studiesFull-text evaluations were performed on 32 articles, of which 12 were deemed unsuitable for inclusion in the re-view (Figure 1) (references available from corresponding author upon request). Reasons for exclusion were: in 2 studies participants did not meet the inclusion criteria; in 2 other studies participants were not from the MENA countries; and in the last 8 studies the outcomes meas-ures did not address TB delay.
The 20 studies included in this systematic review were published between 2001 and 2015; 18 had a cross-sectional study design while 2 were nested case–control studies. Participants included in the studies ranged from TB
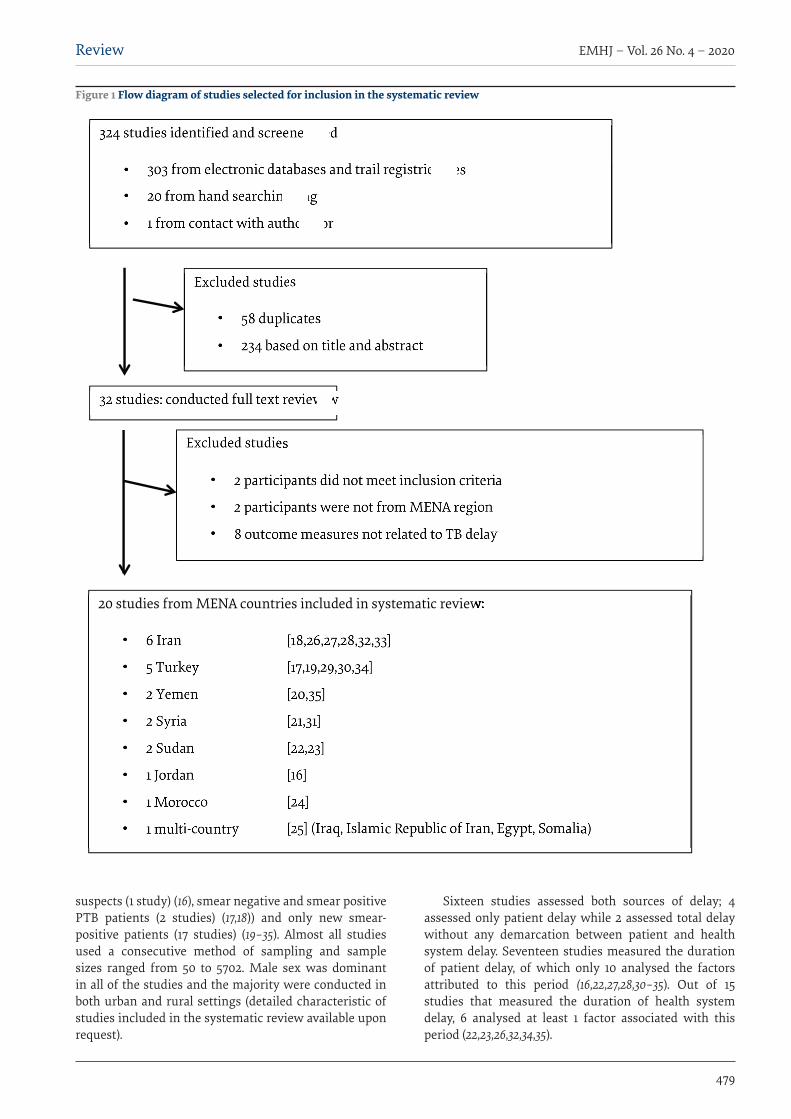
Review
479
EMHJ – Vol. 26 No. 4 – 2020
suspects (1 study) (16), smear negative and smear positive PTB patients (2 studies) (17,18)) and only new smear-positive patients (17 studies) (19–35). Almost all studies used a consecutive method of sampling and sample sizes ranged from 50 to 5702. Male sex was dominant in all of the studies and the majority were conducted in both urban and rural settings (detailed characteristic of studies included in the systematic review available upon request).
Sixteen studies assessed both sources of delay; 4 assessed only patient delay while 2 assessed total delay without any demarcation between patient and health system delay. Seventeen studies measured the duration of patient delay, of which only 10 analysed the factors attributed to this period (16,22,27,28,30–35). Out of 15 studies that measured the duration of health system delay, 6 analysed at least 1 factor associated with this period (22,23,26,32,34,35).
Figure 1 Flow diagram of studies selected for inclusion in the systematic review

EMHJ – Vol. 26 No. 4 – 2020Review
480
Assessment of risk of bias We found 11 studies had a low risk of bias (16,19–25a–25d), 7 had a moderate risk of bias (17,26–31) and 5 had a high risk of bias (18,32–35) (Tables 1,2). We considered the WHO report as a single study with coverage of 4 countries that met our inclusion criteria (25).
Patient delayPatient delay was measured in 17/20 studies. Measures of patient delay depended on patient recall of first symp-toms for PTB. The majority of studies measured delay as a dichotomous variable based on a cut-off point, usually the median. The shortest (12.5 days) and longest (73 days) mean duration of patient delay was reported in the Islam-ic Republic of Iran (26,33). However, the quality of these studies should be considered before drawing any conclu-sion from this observation.
Factors associated with patient delayAt least one factor attributing to patient delay was ana-lysed in 10 studies (16,18–25,35). Studies mostly assessed predisposing factors such as patient sociodemographic characteristics, TB knowledge and perception about TB. Enabling factors were less often assessed, while none of the studies assessed at least one needs factor.
Predisposing factors that were significantly associated with patient delay were older age (OR = 1.24; 95% CI: 1.02 to 1.50), female sex (OR = 1.42; 95% CI: 1.19 to 1.69), unemployment (OR = 0.83; 95% CI: 0.72 to 0.95), low patient income (OR = 1.95; 95% CI: 1.07 to 3.55) and low crowding index (OR = 0.75; 95% CI: 0.57 to 0.99) (Figure 2).
Factors found to be significantly associated with patient delay were: inadequate TB knowledge (20,25a), although in 4 studies the summary OR was not significant for literacy (16,20,21,35); residing in rural areas (16); presence of chronic health problem (21,22); contact with a TB case (21) [yet protective against delay in another study (19)]; self-medication (25a) [although not significantly associated in another study (23)]; and high cost of medical services (20).
Factors found to be protective against patient delay were high TB perception (16,35); however, this predisposed to delay in 1 study (22); TB-related stigma was found to be protective from patient delay in 1 study (16) and predisposed to patient delay in another (25a). Marital status, smoking, a HIV positive status and travelling time were not associated with patient delay in any of the studies that interrogated these factors.
Health care provider (OR = 0.77; 95% CI: 0.70 to 0.85) (Figure 2) was the only enabling factor that had sufficient information to calculate summary OR. The type of provider at first consultation, i.e. consulting a non-health care provider, was associated with extended patient delay (19,20,21,23,25a). The high cost of medical services was significantly associated with patient delay in one study (20).
Health system delayDuration of health system delay was measured in 15/20 studies. All 15 studies used the health facility’s record of first consultation as entry point to health care and 13/15 used start of treatment as the endpoint of time spent in the health system. Two studies used TB diagnosis as the endpoint. The majority of the studies measured delay versus non-delay as a dichotomous variable based on a cut-off point, usually the median. In patients who had health system delay, the shortest mean duration of health system delay (5 days) was reported in Iraq (25a) whereas the longest mean duration (129.25 days) was reported in the Islamic Republic of Iran (28).
Factors associated with health system delayAt least one factor associated with health system delay was analysed in 6/15 studies (19,23–25,29,34). Enabling fac-tors such as type of facility, type of providers at first visit, number of visits, number of providers consulted before reaching a TB diagnosis and expenses plus travel time were assessed. These factors were related to the aspect of health system delay in which patient return for diagnosis and treatment were required.
Predisposing factors that assessed health system delay were female sex, older age and patient income. Being female was significantly associated with health system delay (OR = 2.12; 95% CI: 1.24 to 3.60) (Figure 3) in 3 studies that contributed to the summary OR (19,23,24). Older age and patient income were not associated with health system delay in any of the studies that interrogated this factor. The enabling factors that were associated with health system delay were: high cost of medical services (25c); visiting a non-health care provider, i.e. a traditional healer and community or village healer at first visit (25c); more than 3 visits to a health care provider (24); and repeated visits to the same provider (23). Studies that reported lack of examination of sputum on the first visit (25b), obtaining a negative smear result for acid-fast bacilli (25b) and underutilization of chest X-ray and smear microscopy (Turkey and Sudan) (19,23), and a low suspicion index in 3 studies from Turkey (17,19,34) were not combinable to calculate the OR.
Visiting a public, compared with a private facility, at first consultation was the only enabling factor that we had sufficient information for to calculate summary OR. In 3 studies (21,24,25b), visiting a private facility was significantly associated with health system delay (OR = 1.41; 95% CI: 1.06 to 1.88) (Figure 3).
Heterogeneity Patient delay factors
Heterogeneity was significant in terms of sex (P < 0.1; I² = 45%), patient’s income (P < 0.00001; I² = 92%), and crowd-ing (P = 0.15; I² = 47%). Upon further investigation, we found one study as the source of heterogeneity in terms of sex (16). Participants in this study were TB suspects rather than the confirmed TB cases in the other studies.
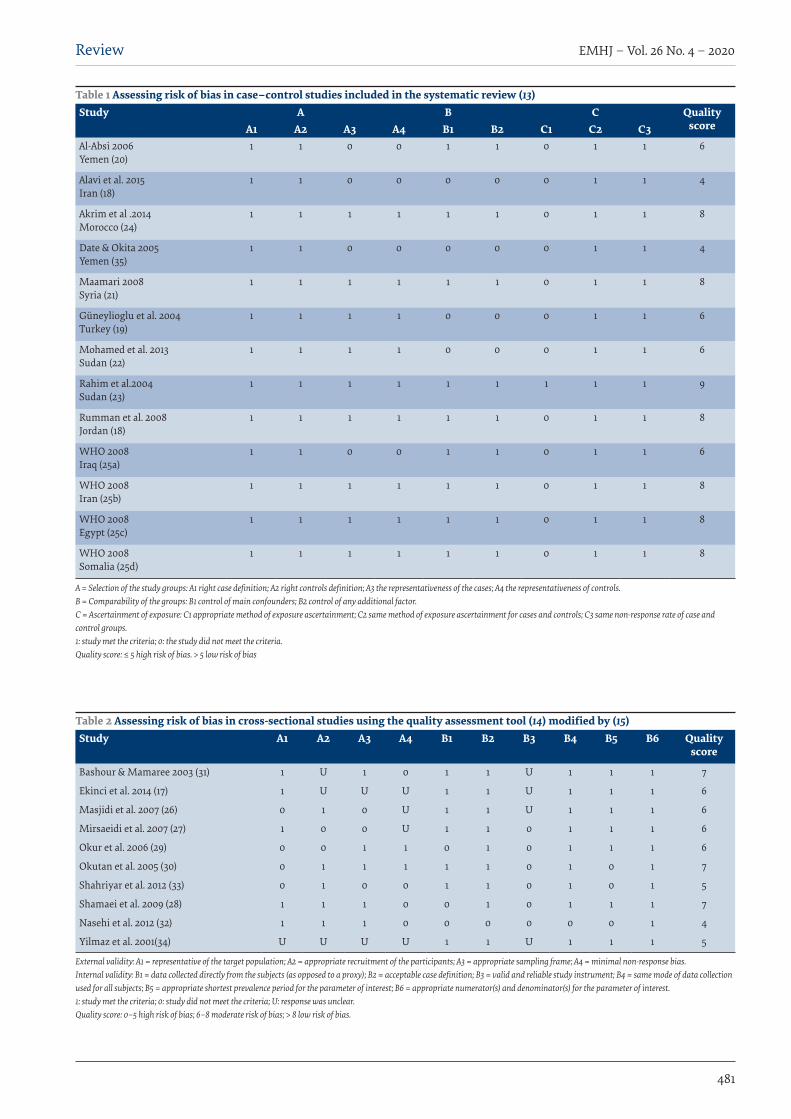
Review
481
EMHJ – Vol. 26 No. 4 – 2020
Table 1 Assessing risk of bias in case–control studies included in the systematic review (13)Study A B C Quality
scoreA1 A2 A3 A4 B1 B2 C1 C2 C3Al-Absi 2006Yemen (20)
1 1 0 0 1 1 0 1 1 6
Alavi et al. 2015Iran (18)
1 1 0 0 0 0 0 1 1 4
Akrim et al .2014Morocco (24)
1 1 1 1 1 1 0 1 1 8
Date & Okita 2005Yemen (35)
1 1 0 0 0 0 0 1 1 4
Maamari 2008Syria (21)
1 1 1 1 1 1 0 1 1 8
Güneylioglu et al. 2004Turkey (19)
1 1 1 1 0 0 0 1 1 6
Mohamed et al. 2013Sudan (22)
1 1 1 1 0 0 0 1 1 6
Rahim et al.2004Sudan (23)
1 1 1 1 1 1 1 1 1 9
Rumman et al. 2008Jordan (18)
1 1 1 1 1 1 0 1 1 8
WHO 2008Iraq (25a)
1 1 0 0 1 1 0 1 1 6
WHO 2008Iran (25b)
1 1 1 1 1 1 0 1 1 8
WHO 2008Egypt (25c)
1 1 1 1 1 1 0 1 1 8
WHO 2008Somalia (25d)
1 1 1 1 1 1 0 1 1 8
A = Selection of the study groups: A1 right case definition; A2 right controls definition; A3 the representativeness of the cases; A4 the representativeness of controls. B = Comparability of the groups: B1 control of main confounders; B2 control of any additional factor. C = Ascertainment of exposure: C1 appropriate method of exposure ascertainment; C2 same method of exposure ascertainment for cases and controls; C3 same non-response rate of case and control groups. 1: study met the criteria; 0: the study did not meet the criteria. Quality score: ≤ 5 high risk of bias. > 5 low risk of bias
Table 2 Assessing risk of bias in cross-sectional studies using the quality assessment tool (14) modified by (15)Study A1 A2 A3 A4 B1 B2 B3 B4 B5 B6 Quality
score
Bashour & Mamaree 2003 (31) 1 U 1 0 1 1 U 1 1 1 7
Ekinci et al. 2014 (17) 1 U U U 1 1 U 1 1 1 6
Masjidi et al. 2007 (26) 0 1 0 U 1 1 U 1 1 1 6
Mirsaeidi et al. 2007 (27) 1 0 0 U 1 1 0 1 1 1 6
Okur et al. 2006 (29) 0 0 1 1 0 1 0 1 1 1 6
Okutan et al. 2005 (30) 0 1 1 1 1 1 0 1 0 1 7
Shahriyar et al. 2012 (33) 0 1 0 0 1 1 0 1 0 1 5
Shamaei et al. 2009 (28) 1 1 1 0 0 1 0 1 1 1 7
Nasehi et al. 2012 (32) 1 1 1 0 0 0 0 0 0 1 4
Yilmaz et al. 2001(34) U U U U 1 1 U 1 1 1 5
External validity: A1 = representative of the target population; A2 = appropriate recruitment of the participants; A3 = appropriate sampling frame; A4 = minimal non-response bias. Internal validity: B1 = data collected directly from the subjects (as opposed to a proxy); B2 = acceptable case definition; B3 = valid and reliable study instrument; B4 = same mode of data collection used for all subjects; B5 = appropriate shortest prevalence period for the parameter of interest; B6 = appropriate numerator(s) and denominator(s) for the parameter of interest. 1: study met the criteria; 0: study did not meet the criteria; U: response was unclear. Quality score: 0–5 high risk of bias; 6–8 moderate risk of bias; > 8 low risk of bias.
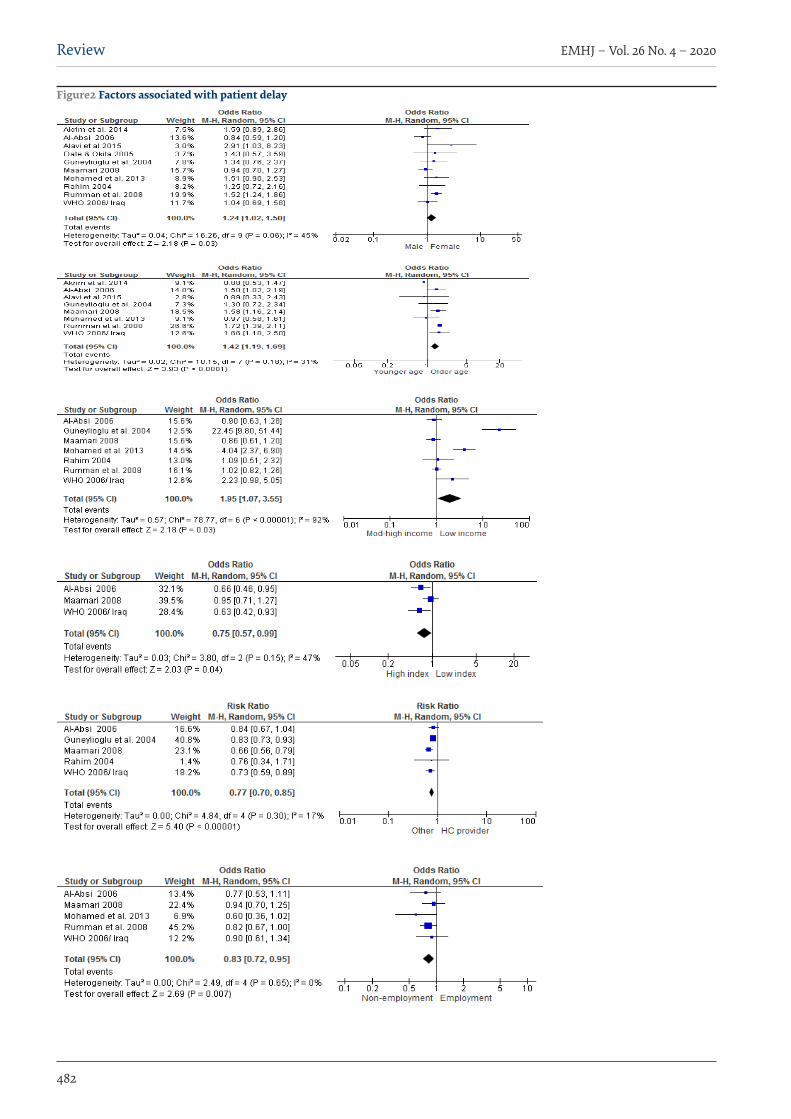
EMHJ – Vol. 26 No. 4 – 2020Review
482
Figure2 Factors associated with patient delay

Review
483
EMHJ – Vol. 26 No. 4 – 2020
Removal of this study from the meta-analysis for sub-group analysis rendered the heterogeneity nonsignifi-cant (H, P = 0.47; I2 = 0%). Two studies were different from the rest in terms of patient income (19,22); removal of these studies from the meta-analysis rendered the heter-ogeneity nonsignificant (H, P = 0.30; I2 = 18%). Removal of the study having a higher cut-off point for the crowding index eliminated heterogeneity (H, P = 0.84; I2 = 0%) when considering this outcome (21).Health system factors
Heterogeneity was significant (P = 0.14; I² = 49%) in terms of sex and was based on a single study (19). Removal of this study from the meta-analysis rendered the heteroge-neity nonsignificant (H, P = 1.00; I2 = 0%).
Grade quality of evidenceThe GRADE system produced a low quality grading for evidence in this review. This was a result of the short-comings inherent in the observational study design of articles included in the review, plausibility of bias and small size estimates, which all have implications for the generalizability of estimates; for example, measurement of outcomes in these studies was dependent on patient self-reporting which created a possibility of recall bias. Nevertheless, the effects of exposure in these 12 studies were assessed as being similar and consistent thus, mak-ing them amenable to a meta-analysis.
Discussion OverviewThis review, which evaluated facilitators and barriers to TB diagnosis and health system delay, provides evidence for TB awareness and interventions targeting the elderly
and those from lower-income settings, as a strategy for successful TB control in the MENA region. The predis-posing factors that were significantly associated with patient delay were older age, being female, unemploy-ment, low patient income, and crowding. Notably, being female was the only factor associated with both patient and health system delay.
Implications for practiceTuberculosis control programme managers in the MENA region need to be cognizant of the range of factors which impact on patient and health systems delays. Such factors need to be considered when proposing policy interven-tions to reduce and contain transmission of TB disease, thus enhancing TB service delivery aimed at increased case detection rates in the MENA region.
This review provides evidence for the need to focus on health system enabling factors and to act on opportunities that will lead to a reduction in delays. Efforts to increase public awareness and to promote health education about TB, especially in outreach areas, should be prioritized. Maintaining a high suspicion index for TB among all health care providers is mandatory. This can be achieved through effective training, including monitoring and evaluation, of health care professionals.
Implications for researchThis systematic review underlined a couple of re-search-related caveats. The majority of studies had a cross-sectional study design which, while useful when measuring prevalence and identifying associations, nev-ertheless lack sthe ability to determine causality as do cohort studies (7). Recently, the MENA region has seen the fastest growing HIV epidemic. HIV-related data from
Figure 3 Gender and facility at 1st consultation vs. health system delay
EMHJ – Vol. 26 No. 4 – 2020Review
484
the region is lacking. Research related to diagnostic, pa-tient and health system delays associated with TB among HIV patient is required to assist national TB programme managers in constructing policies and planning inter-ventions.
The health system in general, and TB control in particular, in the region is expected to be severely impacted by the actual political instability and complex emergencies in the region, which will provide an environment where TB is very likely to occur. Hence, it is vital to establish structures to contain any potential flare-up of cases in these circumstances. These structures might be achieved through factors identified by this work, and research assessing the post-crises situation and illustrating the gaps and needs for TB control.
In summary, this review provides evidence for facilitators on barriers to TB diagnosis and health
system delays in the MENA region. For successful TB control in this region, TB awareness and interventions targeting the elderly and those in lower-income brackets, especially taking male–female differences into account, are essential.
LimitationsMost studies recruited patients from public health fa-cilities and TB management units near the capital of the country. No recruitment from private health facilities or from the peripheries was done. The generalizability of this systematic review is limited as patients recruited from private health facilities and marginalized or remote areas were not included in the analysis.
Funding: None.
Competing interests: None declared.
Facteurs associés aux retards en matière de diagnostic et de traitement de la tuberculose dans la Région du Moyen-Orient et de l’Afrique du Nord : analyse systématiqueRésuméContexte : L’instabilité politique, les sanctions économiques et la qualité inférieure des soins de santé ont une incidence négative sur la lutte contre la tuberculose dans la Région du Moyen-Orient et de l’Afrique du Nord.Objectifs : La présente étude avait pour objectif de mettre en évidence les facteurs qui contribuent aux retards dans le diagnostic et le traitement de la tuberculose dans les pays de cette Région.Méthodes: Deux examinateurs ont passé en revue indépendamment les articles éligibles aux critères de l’étude qu’ils ont identifiés au moyen de recherches exhaustives. Ensuite, ils ont extrait des données qui ont été soumises à une méta-analyse.Résultats : Les retards dans le diagnostic de la tuberculose étaient associés à un âge plus élevé et à un revenu faible (odds ratio [OR] = 1,49 ; intervalle de confiance [IC] à 95 % : 1,31-1,70) et (OR = 1,26 ; IC à 95 % : 1,09-1,45) respectivement (n = 17 études). L’appartenance au sexe féminin était associée à un retard dans la prise en charge tant au niveau des patients que des systèmes de santé [(OR = 1,24 ; IC à 95 % : 1,02-1,50) et (OR = 1,68 ; IC à 95 % : 1,18-2,38) respectivement. La connaissance et la perception de la tuberculose, le fait d’avoir un emploi et un faible niveau de promiscuité jouaient un rôle déterminant pour limiter les retards dans la prise en charge des patients. Le système GRADE (grade donné aux recommandations, examen, élaboration et évaluation) a évalué les données comme étant de faible qualité.Conclusion : La présente analyse fournit aux facilitateurs des bases factuelles sur les obstacles en matière de diagnostic de la tuberculose ainsi que sur les retards liés aux systèmes de santé. Pour réussir à lutter contre la tuberculose dans la Région du Moyen-Orient et de l’Afrique du Nord, la sensibilisation à la maladie et les interventions ciblant les personnes âgées et celles issues des milieux à revenu faible sont essentielles, en accordant une attention particulière aux différences entre les sexes.
العوامل املرتبطة بالتأخر يف تشخيص السل وعالجه يف الرشق األوسط وشامل أفريقيا: استعراض منهجيداليا الطيب، إليز بيرتسون، مارك إنجيل، ليىل عبد اهلل
اخلالصةالرعاية الصحية سلبا عىل جهود مكافحة السل يف منطقة الرشق السيايس، والعقوبات االقتصادية، وتدين نوعية انعدام االستقرار يؤثر اخللفية:
األوسط وشامل أفريقيا.األهداف: استهدفنا توضيح العوامل املسهمة يف تأخري تشخيص السل وعالجه يف ُبلدان منطقة الرشق األوسط وشامل أفريقيا.
للتحليل البيانات وخضعت الشامل واستخالص البحث دت من خالل ُحدِّ التي املؤهلة املقاالت بتقييم قام مراجعان مستقالن البحث: طرق التلوي.
Review
485
EMHJ – Vol. 26 No. 4 – 2020
References1. Global tuberculosis report 2016. Geneva: World Health Organization; 2016 (http://apps.who.int/iris/bitstream/10665/250441/1/978
9241565394-eng.pdf, accessed 28 September 2019).
2. Asch S, Leake B, Anderson R, Gelberg L. Why do symptomatic patients delay obtaining care for tuberculosis? Am J Respir Crit Care Med. 1998;157(4 I):1244–8.
3. Global tuberculosis report 2014. Geneva: World Health Organization; 2014 (http://apps.who.int/iris/bitstream/10665/137094/1/9789241564809_eng.pdf, accessed 28 September 2019).
4. Rao VK, Iademarco EP, Fraser VJ, Kollef MH. Delays in the suspicion and treatment of tuberculosis among hospitalized patients. Ann Intern Med. 1999;130(5):404–11.
5. Lönnroth K, Corbett E, Golub J, Godfrey-Faussett P, Uplekar M, Weil D, et al. Systematic screening for active tuberculosis: Ration-ale, definitions and key considerations. Int J Tuberculosis Lung Dis. 2013 Mar;17(3):289–98. doi:10.5588/ijtld.12.0797
6. Cock D. Editorial. Tuberculosis control : did the programme fail or did we fail the programme? Trop Med Int Heal. 1997;2(8):715–8 (http://onlinelibrary.wiley.com/doi/10.1046/j.1365-3156.1997.d01-388.x/epdf, accessed 28 September 2019).
7. Finnie RKC, Khoza LB, van den Borne B, Mabunda T, Abotchie P, Mullen PD. Factors associated with patient and health care system delay in diagnosis and treatment for TB in sub-Saharan African countries with high burdens of TB and HIV. Trop Med Int Heal. 2011 Apr 14;16(4):394–411. doi:10.1111/j.1365-3156.2010.02718.x
8. Definition: MENA. Washington DC: World Bank; 2014 (https://www.worldbank.org/en/region/mena, accessed 25 January 2020
9. Pierre-Louis AM, Ayodeji F, Karam HS. Public health in the Middle East and North Africa : meeting the challenges of the twen-ty-first century. Washington DC: World Bank; 2004 (https://openknowledge.worldbank.org/handle/10986/15012 License: CC BY 3.0 IGO, accessed 28 September 2019).
10. Thomas C. A literature review of the problems of delayed presentation for treatment and non-completion of treatment for tuberculosis in less developed countries and ways of addressing these problems using particular implementation of the DOTS strategy. J Manag Med. 2002;16(4–5):371–400. PMID:124636
11. Moher D, Liberati A, Tetzlaff J, Altman DG. Preferred reporting items for systematic reviews and meta-analyses: the PRISMA statement. BMJ. 2009 Jul 21;339:b2535. doi:10.1136/bmj.b2535.
12. Jahangir E, Irazola V, Rubinstein A. Need, enabling, predisposing, and behavioral determinants of access to preventative care in Argentina: analysis of the national survey of risk factors. PLoS One. 2012;7(9):e45053. doi:10.1371/journal.pone.0045053
13. Wells G, Shea B, O’Connell D, Robertson J, Peterson J, Welch V, et al. The Newcastle–Ottawa Scale (NOS) for assessing the quality if nonrandomized studies in meta-analyses. Evid based public Heal. 2012 (http://www.evidencebasedpublichealth.de/download/Newcastle_Ottowa_Scale_Pope_Bruce.pdf, accessed 28 September 2019).
14. Hoy D, Brooks P, Woolf A, Blyth F, March L, Bain C, et al. Assessing risk of bias in prevalence studies: modification of an existing tool and evidence of interrater agreement. Elsevier Inc J Clin Epidemiol. 2012;65:934–9. doi:10.1016/j.jclinepi.2011.11.014
15. Werfalli M, Musekiwa A, Engel ME, Ross I, Kengne AP, Levitt NS. The prevalence of type 2 diabetes mellitus among older people in Africa: a systematic review study protocol. BMJ Open. 2014 Jun 17;4(6):e004747. doi:10.1136/bmjopen-2013-004747
16. Rumman KA, Sabra NA, Bakri F, Seita A, Bassili A. Prevalence of tuberculosis suspects and their healthcare-seeking behavior in urban and rural Jordan. Am J Trop Med Hyg. 2008;79(4):545–51. PMID:18840742
17. Ekinci GH, Karakaya E, Ongel EA, Haciomeroglu O, Yilmaz A. Patient and Doctor Delays in smear-negative and smear-positive pulmonary tuberculosis patients attending a referral hospital in Istanbul, Turkey. ScientificWorldJournal. 2014;2014:158186. doi:10.1155/2014/158186
18. Alavi SM, Bakhtiyariniya P, Albagi A. Factors associated with delay in diagnosis and treatment of pulmonary tuberculosis. Jundishapur J Microbiol. 2015;8(3):8–11. (http://www.jjmicrobiol.com/?page=article&article_id=19238, accessed 28 September 2019).
19. Güneylioglu D, Yilmaz A, Bilgin S, Bayram U, Akkaya E. Factors affecting delays in diagnosis and treatment of pulmonary tuber-culosis in a tertiary care hospital in Istanbul, Turkey. Med Sci Monit. 2004;10(2):CR62–7. PMID:147370
(OR = 1.26; 95% CI: 1.09–1.45) و (OR = 1.49; 95% CI: 1.31–1.70) النتائج: اقرتن تأخري تشخيص السل بتقدم العمر وانخفاض الدخلعىل التوايل )17 دراسة(. وارتبط النوع االجتامعي لإلناث بتأخر تشخيص املرىض وتأخر النظام الصحي [(OR = 1.24; 95% CI: 1.02–1.50) و (OR = 1.68; 95% CI: 1.18–2.38)] عىل التوايل. ووجد الباحثون أن املعرفة بالسل وفهمه، ووجود وظيفة، وانخفاض مستويات االزدحام، كان كل منها كفيال باحلامية من تأخر تشخيص املرىض وعالجهم. وصنف نظام تصنيف التوصيات وتقديرها ووضعها وتقييمها البّينات املتاحة بأهنا
منخفضة اجلودة.االستنتاج: يقدم هذا االستعراض بّينات للميّسين بشأن العقبات التي تؤدي إىل تأخر تشخيص السل وعالجه. ولكي تتكلل جهود مكافحة السل يف منطقة الرشق األوسط وشامل أفريقيا بالنجاح، فإن احلاجة متس إىل إذكاء الوعي بالسل وتوجيه التدخالت إىل كبار السن واألفراد يف السياقات
ذات الدخل املنخفض، مع توجيهها بشكل خاص نحو مراعاة الفروق بني اجلنسني.
EMHJ – Vol. 26 No. 4 – 2020Review
486
20. Al Absi AN. Case finding in tuberculosis patients: diagnostic and treatment delays and their determinants. Yemeni Heal Med Res J. 2006;3(11):30–64.
21. Maamari F. Case-finding tuberculosis patients: diagnostic and treatment delays and their determinants. East Mediterr Health J. 2008;14(3):531–45. PMID:18720617
22. Mohamed EY, Abdalla SM, Khamis AA, Abdelbadea A, Abdelgadir MA. Factors associated with patient delay in accessin pulmo-nary tuberculosis care, Gezira State, Sudan, 2009. East Mediterr Health J. 2013;19:114–8. PMID:23516819
23. Rahim MSAA. Delay in the diagnosis and treatment of new smear- positive pulmonary tuberculosis in Khartoum State, Sudan [thesis]. Olso: University of Oslo; 2004 (http://urn.nb.no/URN:NBN:no-10327, accessed 28 September 2019).
24. Akrim et al. Determinants of consultation, diagnosis and treatment delays among new smear-positive pulmonary tuberculosis patients in Morocco: a cross-sectional study. East Mediterr Heal J. 2014 Dec;20(11):707. doi:10.26719/2014.20.11.707
25. Diagnostic and treatment delay in tuberculosis in 7 countries of the Eastern Mediterranean Region,; 25a,25b,25c,25d donated to studies conducted in Iraq, Iran, Egypt and Somalia respectively. Cairo: World Health Organization Regional Office.for the Eastern Mediterranean; 2008 (WHO-EM/TDR/009/E/10.06/1000) (http://applications.emro.who.int/dsaf/dsa710.pdf, accessed 28 September 2019).
26. Masjedi MR, Cheragvandi A, Hadian M, Velayati AA. Reasons for delay in the management of patients with pulmonary tubercu-losis. East Mediterr Heal J. 2002;8(2–3):324–9. PMID:15339120
27. Mirsaeidi SM, Tabarsi P, Mohajer K, Falah-Tafti S, Jammati HR, Farnia P, et al. A long delay from the first symptom to definite diagnosis of pulmonary tuberculosis. Arch Iran Med. 2007;10(2):190–3.
28. Shamaei M, Marjani M, Baghaei P, Chitsaz E, Rezaei Tabar E, Abrishami Z, et al. Drug abuse profile - patient delay, diagnosis delay and drug resistance pattern - among addict patients with tuberculosis. Int J STD AIDS. 2009;20(5):320–3. doi:10.1258/ijsa.2008.008299
29. Okur E, Yilmaz A, Saygi A, Selvi A, Süngün F, Öztürk E, et al. Patterns of delays in diagnosis amongst patients with smear-pos-itive pulmonary tuberculosis at a teaching hospital in Turkey. Clin Microbiol Infect. 2006 Jan;12(1):90–2. https://doi.org/10.1111/j.1469-0691.2005.01302.x
30. Okutan O, Kartaloglu Z, Cerrahoglu K, Ilvan A, Tozkoparan E, Aydilek R. Delay in the diagnosis of Turkish servicemen with pulmonary tuberculosis. Mil Med. 2005;170(3):211–3.
31. Bashour H, Mamaree F. Gender differences and tuberculosis in the Syrian Arab Republic: patients’ attitudes, compliance and outcomes. East Mediterr Health J. 2003 Jul;9(4):757–68. PMID:15748072
32. Nasehi M, Hassanzadeh J, Rezaianzadeh A, Zeigami B, Tabatabaee H, Ghaderi E. Diagnosis delay in smear positive tuberculosis patients. J Res Med Sci. 2012;17(11):1001–4. PMID:23833571
33. Shahriyar M, Niazi A, Karimian R, Naroii E, Pishjoo M, Nikoseresht M, et al. Causes of delay in diagnosis of smear-positive pul-monary tuberculosis patients referred to the tuberculosis center of Zahedan. Zahedan J Res Med Sci. 2012;14(8):29–32.
34. Yilmaz A, Boa S, Sulu E, Durucu M, Yilmaz D, Baran A, et al. Delays in the diagnosis and treatment of hospitalized patients with smear-positive pulmonary tuberculosis. Respir Med. 2001;95(10):802–5. doi:10.1053/rmed.2001.1156
35. Date J, Okita K. Gender and literacy: factors related to diagnostic delay and unsuccessful treatment of tuberculosis in the moun-tainous area of Yemen. Int J Tuberc Lung Dis. 2005;9(6):680–5. PMID:15971397
WHO events addressing public health priorities
487
EMHJ – Vol. 26 No. 4 – 2020
Findings of the midterm review of the implementation of the global health sector strategy and regional action plan for viral hepatitis
1 This report is based on the Summary Report on the Consultation of findings of the midterm review of the implementation of the global health sector strategy and regional action plan for viral hepatitis, 3–5 December 2019, Lahore, Pakistan (http://applications.emro.who.int/docs/EMSTD205E.pdf?ua=1).
Citation: Findings of the midterm review of the implementation of the global health sector strategy and regional action plan for viral hepatitis. East Mediterr Health J. 2020;26(4):487–488 https://doi.org/10.26719/2020.26.4.487
Copyright © World Health Organization (WHO) 2020. Open Access. Some rights reserved. This work is available under the CC BY-NC-SA 3.0 IGO license (https://creativecommons.org/licenses/by-nc-sa/3.0/igo).
IntroductionDuring May 2016, the World Health Assembly endorsed the World Health Organization (WHO) global health sec-tor strategy on viral hepatitis 2016–2021 (1), which aims to inspire countries to eliminate viral hepatitis as a public health threat by 2030, reducing new infections by 90% and mortality by 65% (1). Accordingly, the WHO Eastern Mediterranean Region developed the regional action plan for the implementation of the global health sector strate-gy on viral hepatitis 2017–2021 (2), with a vision, goal and targets aligned with those of the global strategy. The pur-pose of the regional action plan is to provide a roadmap and priority actions to achieve an Eastern Mediterranean Region free of new hepatitis infections and where peo-ple living with chronic hepatitis have access to affordable and effective prevention, treatment and care (2).
Between September and December 2019, a midterm review of the implementation of the global health sector strategy and regional action plan took place, to assess the response to viral hepatitis at the regional and national levels. Following this, the WHO Regional Office for the Eastern Mediterranean (WHO/EMRO) organized a regional consultation on the findings of the midterm review in Lahore, Pakistan, 3–5 December 2019 (3). The consultation was attended by participants from countries of the Region as well as representatives from global partner and civil society organizations, and staff from WHO.
The objectives of the consultation were to:• review and validate the findings of the midterm
review of the implementation of the global health sector strategy and the regional action plan for viral hepatitis;
• identify impediments to progress towards national, regional and global targets, as well as identifying challenges and sharing best practices and lessons learned; and
• develop a roadmap for accelerated action towards achieving the 2021 targets and sustaining action towards hepatitis elimination by 2030.
Summary of discussionsParticipants reviewed the burden of viral hepatitis in the Region by country, as well as progress towards the
global elimination targets and the milestones of the re-gional action plan. Gaps were identified including the need to strengthen key interventions, such as hepatitis B birth dose, harm reduction and scaling up testing and treatment for both hepatitis B and C infection. Egypt’s ex-perience with hepatitis elimination was discussed, high-lighting the country’s efforts from the establishment of a national committee for viral hepatitis in 2006 up to the recent mass campaign to screen 60 million Egyptians and treat more than 3.5 million for hepatitis C infection (4).
Recommendations
To WHO
• Providing technical support to Member States for policy dialogue and hepatitis response, including development of norms and standards, price negotiation, advocacy and resource mobilization.
• Exchanging best practices in health information and hepatitis response, including governance and community actions, as well as access to testing and treatment.
To Member States
• Designating focal points for national and subnational coordination of hepatitis response, as well as technical advisory groups with clear terms of reference to assist in identifying data sources and the review of strategies.
• Developing centralized national databases for hepatitis testing and treatment that include both the private and public sectors.
• Standardizing tools for hepatitis screening and treatment that are linked to the surveillance systems.
• Scaling up hepatitis B virus testing for pregnant women and 3-dose vaccination for infants.
• Developing national hepatitis guidelines, testing algorithms, and enhancing laboratory quality.
• Ensuring that hepatitis services are covered within health insurance schemes.

EMHJ – Vol. 26 No. 4 – 2020WHO events addressing public health priorities
488
References1. World Health Organization. Global health sector strategy on viral hepatitis 2016-2021. Geneva: World Health Organization; 2016
(https://www.who.int/hepatitis/strategy2016-2021/ghss-hep/en/).
2. World Health Organization Regional Office for the Eastern Mediterranean (WHO/EMRO). Regional action plan for the imple-mentation of the global health sector strategy on viral hepatitis 2017–2021. Cairo: WHO/EMRO; 2017 (https://apps.who.int/iris/handle/10665/258729).
3. World Health Organization Regional Office for the Eastern Mediterranean (WHO/EMRO). Consultation on findings of the mid-term review of the implementation of the global health sector strategy and regional action plan for viral hepatitis. Cairo: WHO/EMRO; 2020 (http://applications.emro.who.int/docs/EMSTD205E.pdf?ua=1).
4. The World Bank. Eliminating Hepatitis C from Egypt: 2017 Update on current trends and policy recommendations. Washington DC: The World Bank; 2017 (http://documents.worldbank.org/curated/en/164381517333701631/pdf/123068-WP-P157533-PUBLIC-Eliminating-Hepatitis-C-from-Egypt-2017-Update.pdf).

Eastern Mediterranean Health Journal
IS the official health journal published by the Eastern Mediterranean Regional Office of the World Health Organization. It is a forum for the presentation and promotion of new policies and initiatives in public health and health services; and for the exchange of ideas, concepts, epidemiological data, research findings and other information, with special reference to the Eastern Mediterranean Region. It addresses all members of the health profession, medical and other health educational institutes, interested NGOs, WHO Collaborating Centres and individuals within and outside the Region.
املجلة الصحية لرشق املتوسط هى املجلة الرسمية التى تصدر عن املكتب اإلقليمى لرشق املتوسط بمنظمة الصحة العاملية. وهى منرب لتقديم السياسات واملبادرات اجلديدة يف الصحة العامة واخلدمات الصحية والرتويج هلا، ولتبادل اآلراء واملفاهيم واملعطيات الوبائية ونتائج األبحاث وغري ذلك من املعلومات، وخاصة ما يتعلق منها بإقليم رشق املتوسط. وهى موجهة إىل كل أعضاء املهن الصحية، والكليات الطبية وسائر املعاهد التعليمية، وكذا املنظامت غري احلكومية املعنية، واملراكز املتعاونة مع منظمة
الصحة العاملية واألفراد املهتمني بالصحة ىف اإلقليم وخارجه.
La Revue de Santé de la Méditerranée Orientale
EST une revue de santé officielle publiée par le Bureau régional de l’Organisation mondiale de la Santé pour la Méditerranée orientale. Elle offre une tribune pour la présentation et la promotion de nouvelles politiques et initiatives dans le domaine de la santé publique et des services de santé ainsi qu’à l’échange d’idées, de concepts, de données épidémiologiques, de résultats de recherches et d’autres informa-tions, se rapportant plus particulièrement à la Région de la Méditerranée orientale. Elle s’adresse à tous les professionnels de la santé, aux membres des instituts médicaux et autres instituts de formation médico-sanitaire, aux ONG, Centres collaborateurs de l’OMS et personnes concernés au sein et hors de la Région.
Correspondence
Editor-in-chief
Eastern Mediterranean Health JournalWHO Regional Office for the Eastern MediterraneanP.O. Box 7608 Nasr City, Cairo 11371 Egypt Tel: (+202) 2276 5000 Fax: (+202) 2670 2492/(+202) 2670 2494 Email: [email protected]
Members of the WHO Regional Committee for the Eastern Mediterranean Afghanistan . Bahrain . Djibouti . Egypt . Islamic Republic of Iran . Iraq . Jordan . Kuwait . Lebanon Libya . Morocco . Oman . Pakistan . Palestine . Qatar . Saudi Arabia . Somalia . Sudan . Syrian Arab RepublicTunisia . United Arab Emirates . Yemen
البلدان أعضاء اللجنة اإلقليمية ملنظمة الصحة العاملية لرشق املتوسط األردن . أفغانستان . اإلمارات العربية املتحدة . باكستان . البحرين . تونس . ليبيا . مجهورية إيران اإلسالمية
اجلمهورية العربية السورية . جيبويت . السودان . الصومال . العراق . ُعامن . فلسطني . قطر . الكويت . لبنان . مرص . املغرباململكة العربية السعودية . اليمن
Membres du Comité régional de l’OMS pour la Méditerranée orientale Afghanistan . Arabie saoudite . Bahreïn . Djibouti . Égypte . Émirats arabes unis . République islamique d’Iran Iraq . Libye . Jordanie . Koweït . Liban . Maroc . Oman . Pakistan . Palestine . Qatar . République arabe syrienne Somalie . Soudan . Tunisie . Yémen
Subscriptions and Permissions
Publications of the World Health Organization can be obtained from Knowledge Sharing and Production, World Health Organization, Regional Office for the Eastern Mediterranean, PO Box 7608, Nasr City, Cairo 11371, Egypt (tel: +202 2670 2535, fax: +202 2670 2492; email: [email protected]). Requests for permission to reproduce, in part or in whole, or to translate publications of WHO Regional Office for the Eastern Mediterranean – whether for sale or for noncommercial distribution – should be addressed to WHO Regional Office for the Eastern Mediterranean, at the above address; email: [email protected].
EMHJ is a trilingual, peer reviewed, open access journal and the full contents are freely available at its website: http://www/emro.who.int/emhj.htm
EMHJ information for authors is available at its website: http://www.emro.who.int/emh-journal/authors/
EMHJ is abstracted/indexed in the Index Medicus and MEDLINE (Medical Literature Analysis and Retrieval Systems on Line), ISI Web of knowledge, the Cumulative Index to Nursing and Allied Health Literature (CINAHL), Embase, Lexis Nexis, Scopus and the Index Medicus for the WHO Eastern Mediterranean Region (IMEMR).
© World Health Organization (WHO) 2020. Open Access. Some rights reserved.This work is available under the CC BY-NC-SA 3.0 IGO licence (https://creativecommons.org/licenses/by-nc-sa/3.0/igo).
Disclaimer The designations employed and the presentation of the material in this publication do not imply the expression of any opinion whatsoever on the part of WHO concerning the legal status of any country, territory, city or area or of its authorities, or concerning the delimitation of its frontiers or boundaries. Dotted and dashed lines on maps represent approximate border lines for which there may not yet be full agreement.
The mention of specific companies or of certain manufacturers’ products does not imply that they are endorsed or recommended by WHO in preference to others of a similar nature that are not mentioned. Errors and omissions excepted, the names of proprietary products are distinguished by initial capital letters.
All reasonable precautions have been taken by WHO to verify the information contained in this publication. However, the published material is being distributed without warranty of any kind, either expressed or implied. The responsibility for the interpretation and use of the material lies with the reader. In no event shall WHO be liable for damages arising from its use.
The authors alone are responsible for the views expressed in this publication and they do not necessarily represent the views, decisions or policies of the institutions with which they are affiliated.
If authors are staff members of the World Health Organization, the authors alone are responsible for the views expressed in this publication and do not necessarily represent the decisions, policy or views of the World Health Organization.
ISSN 1020-3397
Cover 26-02.indd 4-6Cover 26-02.indd 4-6 2/23/2020 10:30:31 AM2/23/2020 10:30:31 AM