Earnings in 2H21 Expected to Remain Relatively Good ...
9
See the last page for disclaimer Page 1 of 9 Equity Research Equity Research Report Company Report 股 票 研 究 公 司 报 告 证 券 研 究 报 告 非 银 金 融 行 业 Non-Bank Finance Sector 海 通 国 际 Haitong Int'l (00665 HK) Company Report: Haitong Int'l (00665 HK) Richard Cao 曹柱 (86755) 2397 6870 公司报告:海通国际 (00665 HK) [email protected] 8 September 2021 Earnings in 2H21 Expected to Remain Relatively Good, Maintain "Buy" 2021年下半年盈利预计维持相对较好,维持“买入” In 1H21, the Company realized total revenue and other income of HK$3,743.4 mn, slightly down 0.1% YoY. The slight decrease in revenue was mainly due to the decrease in interest income and other income and gains or losses. Commission and fee income increased by 38.6% YoY to HK$1,657.6 mn. The Company's cost-to-income ratio decreased by 20.3 ppts YoY to 65.4%, which was a main contributor for its growth of net profit. The Company's shareholders’ net profit reached HK$1,080.5 mn, up 107.2% YoY. Impairment losses of the Company amounted to HK$226.6 mn, down 70.7% YoY. If excluding the impact from impairment losses, net profit increased by 1.0% to HK$1,307.1 mn. The Company realized EPS of HK$0.1838, up 106.5% YoY. We hold a prudently optimistic view on the Hong Kong stock market and we expect the Hong Kong stock market to remain range-bound for the rest of 2021. We expect that the Company's investment banking business will continue to benefit the projected good performance of Hong Kong’s IPO raising market and record relatively good growth in 2H21. We expect EPS for FY21/ FY22/ FY23 to grow YoY by 13.4%/ 15.9%/ 16.2% to HK$0.3740/ HK$0.4336/ HK$0.5036, respectively. Considering the change in market valuation, we revise down our TP for the Company from HK$3.82 to HK$3.21, which is equivalent to 8.6x/ 7.4x/ 6.4x 2021-2023 PER and 0.6x/ 0.6x/ 0.6x 2021-2023 PBR. Meanwhile, we maintain "Buy" rating for the Company. 2021 年上半年公司实现总收入及其他收入 3,743.4 百万港元,同比微降 0.1%。收入小幅 下降主要是由于利息收入和其他收入及收益或亏损的减少。佣金及手续费收入同比增长 38.6%至 1,657.6 百万港元。公司的成本收入比同比下降 20.3 个百分点至 65.4%,是其净 利润增长的主要贡献因素。公司股东净利润达到 1,080.5 百万港元,同比增长 107.2%。公 司的减值计提达 226.6 百万港元,同比下降 70.7%。剔除减值计提影响,净利润则增长 1.0% 至 1,307.1 百万港元。公司实现每股收益 0.1838 港元,同比增长 106.5%。 2021 年余下时间,我们对香港股市持审慎乐观态度,我们预计香港股市将维持区间波动。 2021 年下半年,我们预期公司的投资银行业务将继续受惠于香港 IPO 融资市场预期的良 好表现,并录得相对较好的增长。我们预计,2021-2023 年公司的每股收益将分别同比增 长 13.4%、15.9%、16.2%至 0.3740 港元、0.4336 港元、0.5036 港元。考虑到市场估值 的变化,我们将我们对公司的目标价从 3.82 港元下调至 3.21 港元,相当于 8.6 倍/7.4 倍 /6.4 倍的 2021-2023 年市盈率以及 0.6 倍/0.6 倍/0.6 倍 2021-2023 年市净率。同时,我们 维持对公司的“买入”投资评级。 Rating: Buy Maintained 评级: 买入 (维持) 6-18m TP 目标价: HK$3.21 Revised from 原目标价: HK$3.82 Share price 股价: HK$2.280 Stock performance 股价表现 [Table_PriceChange] Change in Share Price 股价变动 1 M 1 个月 3 M 3 个月 1 Y 1 年 Abs. % 绝对变动 % 6.5 1.3 20.6 Rel. % to HS Index 相对恒指变动 % 5.9 9.8 13.5 Avg. share price(HK$) 平均股价(港元) 2.2 2.2 2.2 Source: Bloomberg, Guotai Junan International. Year End Turnover Net Profit EPS EPS PER BPS PBR DPS Yield ROE 年结 收入 股东净利 每股净利 每股净利变动 市盈率 每股净资产 市净率 每股股息 股息率 净资产收益率 12/31 (HK$ '000) (HK$ '000) (HK$) (△%) (x) (HK$) (x) (HK$) (%) (%) 2019A 8,205,165 1,550,858 0.268 47.1 8.5 4.679 0.5 0.131 5.7 5.9 2020A 8,232,436 1,932,877 0.330 22.8 6.9 4.831 0.5 0.161 7.1 7.0 2021F 7,504,046 2,208,086 0.374 13.4 6.1 4.952 0.5 0.184 8.1 7.7 2022F 8,472,112 2,560,026 0.434 15.9 5.3 5.176 0.4 0.213 9.4 8.6 2023F 9,585,025 2,973,660 0.504 16.2 4.5 5.438 0.4 0.248 10.9 9.5 Shares in issue (m) 总股数 (m) 6,037.5 Major shareholder 大股东 Haitong Securities 64.9% Market cap. (HK$ m) 市值 (HK$ m) 15,576.8 Free float (%) 自由流通比率 (%) 35.1 3 month average vol. 3 个月平均成交股数 (‘000) 6,750.9 FY21 Net gearing (%) FY21 净负债/股东资金 (%) 162.7 52 Weeks high/low (HK$) 52 周高/低 (HK$) 2.790 / 1.710 FY21 Cost/Turnover (%) 21 年开支/收入(%) 64.9 Source: the Company, Guotai Junan International. (20.0) (10.0) 0.0 10.0 20.0 30.0 40.0 50.0 Sep-20 Nov-20 Jan-21 Mar-21 May-21 Jul-21 Sep-21 % of return HSI Haitong International
-
Upload
khangminh22 -
Category
Documents
-
view
0 -
download
0
Transcript of Earnings in 2H21 Expected to Remain Relatively Good ...
See the last page for disclaimer Page 1 of 9
中
外
运
输
Eq
uit
y R
ese
arc
h
Eq
uit
y R
ese
arc
h R
ep
ort
证
券 研
究 报
告
Co
mp
an
y R
ep
ort
股
票
研
究
公
司
报
告
证
券
研
究
报
告
[Tab
le_I
nfo1
]
非
银
金
融
行
业
No
n-B
an
k F
ina
nce
Se
cto
r
[Tab
le_I
nfo2
]
海
通
国
际
Hait
on
g I
nt'
l (0
06
65
HK
)
[Table_Title] Company Report: Haitong Int'l (00665 HK)
Richard Cao 曹柱
(86755) 2397 6870
公司报告: 海通国际 (00665 HK) [email protected]
8 September 2021
[Table_Summary] Earnings in 2H21 Expected to Remain Relatively Good, Maintain "Buy" 2021年下半年盈利预计维持相对较好,维持“买入”
In 1H21, the Company realized total revenue and other income of
HK$3,743.4 mn, slightly down 0.1% YoY. The slight decrease in revenue
was mainly due to the decrease in interest income and other income and
gains or losses. Commission and fee income increased by 38.6% YoY to
HK$1,657.6 mn. The Company's cost-to-income ratio decreased by 20.3 ppts
YoY to 65.4%, which was a main contributor for its growth of net profit. The
Company's shareholders’ net profit reached HK$1,080.5 mn, up 107.2% YoY.
Impairment losses of the Company amounted to HK$226.6 mn, down 70.7%
YoY. If excluding the impact from impairment losses, net profit increased by
1.0% to HK$1,307.1 mn. The Company realized EPS of HK$0.1838, up
106.5% YoY.
We hold a prudently optimistic view on the Hong Kong stock market and we
expect the Hong Kong stock market to remain range-bound for the rest of
2021. We expect that the Company's investment banking business will
continue to benefit the projected good performance of Hong Kong’s IPO
raising market and record relatively good growth in 2H21. We expect EPS for
FY21/ FY22/ FY23 to grow YoY by 13.4%/ 15.9%/ 16.2% to HK$0.3740/
HK$0.4336/ HK$0.5036, respectively. Considering the change in market
valuation, we revise down our TP for the Company from HK$3.82 to
HK$3.21, which is equivalent to 8.6x/ 7.4x/ 6.4x 2021-2023 PER and 0.6x/
0.6x/ 0.6x 2021-2023 PBR. Meanwhile, we maintain "Buy" rating for the
Company.
2021 年上半年公司实现总收入及其他收入 3,743.4 百万港元,同比微降 0.1%。收入小幅
下降主要是由于利息收入和其他收入及收益或亏损的减少。佣金及手续费收入同比增长
38.6%至 1,657.6 百万港元。公司的成本收入比同比下降 20.3 个百分点至 65.4%,是其净
利润增长的主要贡献因素。公司股东净利润达到 1,080.5 百万港元,同比增长 107.2%。公
司的减值计提达 226.6 百万港元,同比下降 70.7%。剔除减值计提影响,净利润则增长 1.0%
至 1,307.1 百万港元。公司实现每股收益 0.1838 港元,同比增长 106.5%。
2021 年余下时间,我们对香港股市持审慎乐观态度,我们预计香港股市将维持区间波动。
2021 年下半年,我们预期公司的投资银行业务将继续受惠于香港 IPO 融资市场预期的良
好表现,并录得相对较好的增长。我们预计,2021-2023 年公司的每股收益将分别同比增
长 13.4%、15.9%、16.2%至 0.3740 港元、0.4336 港元、0.5036 港元。考虑到市场估值
的变化,我们将我们对公司的目标价从 3.82 港元下调至 3.21 港元,相当于 8.6 倍/7.4 倍
/6.4 倍的 2021-2023 年市盈率以及 0.6 倍/0.6 倍/0.6 倍 2021-2023 年市净率。同时,我们
维持对公司的“买入”投资评级。
[Table_Rank] Rating: Buy
Maintained
评级: 买入 (维持)
[Table_Price] 6-18m TP 目标价: HK$3.21
Revised from 原目标价: HK$3.82
Share price 股价: HK$2.280
Stock performance
股价表现
[Table_QuotePic]
[Table_PriceChange] Change in Share Price
股价变动
1 M
1 个月
3 M
3 个月
1 Y
1 年
Abs. % 绝对变动 %
6.5 1.3 20.6
Rel. % to HS Index 相对恒指变动 %
5.9 9.8 13.5
Avg. share price(HK$)
平均股价(港元) 2.2 2.2 2.2
Source: Bloomberg, Guotai Junan International.
[Table_Profit] Year End Turnover Net Profit EPS EPS PER BPS PBR DPS Yield ROE
年结 收入 股东净利 每股净利 每股净利变动 市盈率 每股净资产 市净率 每股股息 股息率 净资产收益率
12/31 (HK$ '000) (HK$ '000) (HK$) (△%) (x) (HK$) (x) (HK$) (%) (%)
2019A 8,205,165 1,550,858 0.268 47.1 8.5 4.679 0.5 0.131 5.7 5.9
2020A 8,232,436 1,932,877 0.330 22.8 6.9 4.831 0.5 0.161 7.1 7.0
2021F 7,504,046 2,208,086 0.374 13.4 6.1 4.952 0.5 0.184 8.1 7.7
2022F 8,472,112 2,560,026 0.434 15.9 5.3 5.176 0.4 0.213 9.4 8.6
2023F 9,585,025 2,973,660 0.504 16.2 4.5 5.438 0.4 0.248 10.9 9.5
[Table_BaseData] Shares in issue (m) 总股数 (m) 6,037.5 Major shareholder 大股东 Haitong Securities 64.9%
Market cap. (HK$ m) 市值 (HK$ m) 15,576.8 Free float (%) 自由流通比率 (%) 35.1
3 month average vol. 3 个月平均成交股数 (‘000) 6,750.9 FY21 Net gearing (%) FY21 净负债/股东资金 (%) 162.7
52 Weeks high/low (HK$) 52 周高/低 (HK$) 2.790 / 1.710 FY21 Cost/Turnover (%) 21 年开支/收入(%) 64.9
Source: the Company, Guotai Junan International.
(20.0)
(10.0)
0.0
10.0
20.0
30.0
40.0
50.0
Sep-20 Nov-20 Jan-21 Mar-21 May-21 Jul-21 Sep-21
% of return
HSI Haitong International

Co
mp
an
y R
ep
ort
See the last page for disclaimer Page 2 of 9
[Table_RightMar1]
8 S
ep
tem
be
r 2
02
1
[Table_RightMar2]
Ha
ito
ng
In
t'l 海
通国
际 (0
06
65
HK
)
[Table_PageHeader] Haitong Int'l (00665 HK)
In 1H21, the Company realized total revenue and other income of HK$3,743.4 mn, slightly down 0.1% YoY, with
lower-than-expected interest income and other income and gains or losses. The slight decrease in revenue was mainly
due to the decrease in interest income and other income and gains or losses. Commission and fee income increased by 38.6%
YoY to HK$1,657.6 mn, of which, commission and fee income from brokerage business, investment banking business, and
asset management business increased YoY by 20.4%, 48.8%, and 75.5% to HK$475.2 mn, HK$798.1 mn, and HK$271.1 mn,
respectively. The average daily turnover in Hong Kong for 1H21 was HK$188.2 bn, up 60.1% YoY. Funds raised by IPOs
rocketed by 148.3% YoY. On the whole, we think that the Company’s growth in commission and fee income was mainly as a
result of the good performance of the Hong Kong market and partially due to the Company’s transformation to focus on
fee-based business. The Company recorded interest income of HK$989.4 mn, down 27.4% YoY, of which, interest income from
advances to customers in margin financing decreased by 11.9% YoY to HK$454.8 mn, whose decease is expected to be
primarily attributable to the decrease and structure adjustment of the balance of advances to customers and the decline of the
market interest rate level. The Company recorded net trading and investment income of HK$1,187.8 mn, up 23.0% YoY, which
was mainly due to the significant turnaround of net income from financial assets held for trading and market making activities
and the growth of net gain from investment securities at fair value, while net trading income on financial products declined YoY.
The Company’s other income and gains or losses recorded net losses of HK$91.3 mn, compared with net gains of HK$224.3
mn in 1H2020.
The Company's 1H21 shareholders' net profit missed expectations primarily due to lower-than-expected total revenue
and other income. In 1H21, the Company’s total expenses amounted to HK$2,222.8 mn, down 9.0% YoY, which mainly came
from the decline in finance costs. Finance costs declined by 47.8% YoY to HK$616.2 mn. Impairment losses of the Company
amounted to HK$226.6 mn, down 70.7% YoY. The Company's cost-to-income ratio decreased by 20.3 ppts YoY to 65.4%,
which was a main contributor for its growth in net profit. The Company's shareholders’ net profit reached HK$1,080.5 mn, up
107.2% YoY. If excluding the impact from impairment losses, net profit increased by 1.0% to HK$1,307.1 mn. The Company
realized EPS of HK$0.1838, up 106.5% YoY, and declared an interim dividend of HK$0.09, whose payout ratio achieved nearly
50.3%. Annualized ROAE and net profit margin for 1H21 amounted to 7.5% and 28.9%, respectively, up 3.7 ppts YoY and 15.0
ppts YoY, respectively.
Figure-1: Haitong International – YoY growth of total revenue and other income, total expenses and shareholders' net profit
Figure-2: Haitong International – cost-to-income ratio
Source: the Company, Guotai Junan International.
Source: the Company, Guotai Junan International.
-60.0%
-40.0%
-20.0%
0.0%
20.0%
40.0%
60.0%
80.0%
100.0%
120.0%
2019 2020 2021F 2022F 2023F 1H20 1H21
Total revenue and other income Total expenses Shareholders' net profit
77.4%72.1%
64.9% 63.9%63.0%
85.8%
65.4%
0.0%
10.0%
20.0%
30.0%
40.0%
50.0%
60.0%
70.0%
80.0%
90.0%
100.0%
2019 2020 2021F 2022F 2023F 1H20 1H21

Co
mp
an
y R
ep
ort
See the last page for disclaimer Page 3 of 9
[Table_RightMar1]
8 S
ep
tem
be
r 2
02
1
[Table_RightMar2]
Ha
ito
ng
In
t'l 海
通国
际 (0
06
65
HK
)
[Table_PageHeader] Haitong Int'l (00665 HK)
Figure-3: Haitong International – ROAE Figure-4: Haitong International – net profit margin
Source: the Company, Guotai Junan International. Source: the Company, Guotai Junan International.
The Company's global investment banking business continued to lead the market. In 1H21, the Company's investment
banking business continued to lead the market and achieved a fee income of HK$798.1 mn, up 48.8% YoY, among which
commission on underwriting and placing amounted to HK$687.7 mn, up 47.9% YoY, and financial advisory and consultancy fee
income amounted to HK$110.5 mn, up 54.8% YoY. In 1H21, the Company completed 22 IPOs, ranking no. 1 among investment
banks in Hong Kong in terms of number of projects underwritten and underwriting amount. The Company also completed 8
equity financing projects in overseas capital markets, in which 5 were in the United States and 3 in India. On the DCM front, the
Company completed a total of 136 bond issuance projects. The Company ranked no. 3 in the China Risk G3+CNY bond
markets and no. 2 in Asia (ex-Japan) G3 corporate high yield bond markets in terms of number of issuance among financial
institutions worldwide. Among which, the Company completed 27 green and sustainable bond issuance projects amounted to
US$7.97 bn with doubled number of projects and financing size as compared to full year of 2020.
We hold a prudently optimistic view on the Hong Kong stock market and we expect the Hong Kong stock market to
remain range-bound for the rest of 2021. At the beginning of 2021, as the research and development and vaccination of
COVID-19 vaccines in major economies have been steadily advancing, market expectations for global economic recovery and
corporate profit growth have improved obviously, driving the rapid rise of Hong Kong stocks. However, due to the impact of
inflation pressure in the United States, periphery stock market volatility increased and the Hong Kong stocks' technology sector
saw a correction drag on index performance. Later, the US Federal Reserve (the "US Fed") reiterated that it would continue to
maintain the current interest rate level and asset purchase which resulted in market inflation concerns being partially eased;
Hong Kong stocks generally maintained a volatile trend. As at 7 September 2021, the Hang Seng index closed at 26,353.6
points, down 3.2% YTD. In the rest of 2021, China's and global economic recovery is expected to continue. According to the US
Federal Reserve’s projection in July 2021, the board members of the Federal Open Market Committee (FOMC) expressed to
continue to maintain the benchmark rate at 0-0.25%, and it is expected that it would be appropriate to maintain this target range
until the objectives of employment and inflation have been reached. China-concept stocks are seeking Hong Kong as their first
choice of secondary listing, and this is expected to further promote the optimization of the structure of Hong Kong’s stock market,
attracting stronger southbound inflows and spurring the market trading volume. The abovementioned factors are expected to
benefit the Hong Kong stock market. However, around the world, although COVID-19 vaccines have been gradually rolled out,
COVID-19 mutations have increased uncertainties surrounding the COVID-19 outbreak, and the impact of the COVID-19
outbreak on the global economy still has uncertainties. Meanwhile, other macro instabilities including geopolitical risks,
particularly relating to tension between the US and China, more-than-expected inflation in the US, and shifts in the US Federal
Reserve's policies, remain. These factors are expected to put pressure on the Hong Kong stock market. On the whole, we hold
a prudently optimistic view on the Hong Kong stock market and we expect the Hong Kong stock market to remain range-bound
for the rest of 2021.
We expect EPS for FY21/ FY22/ FY23 to grow YoY by 13.4%/ 15.9%/ 16.2% to HK$0.3740/ HK$0.4336/ HK$0.5036,
respectively. In 2H21, we expect that the Company's brokerage business will still grow at a relatively stable pace; in 2H21, the
financing amount of Hong Kong’s IPO raising market is expected to continue to be maintained at a good level given
China-concept stocks' secondary listing on the Hong Kong stock market. Considering its strength of investment banking
business, we expect that the Company's investment banking business will continue to benefit the projected good performance
of Hong Kong’s IPO raising market and record relatively good growth; we project that the Company's finance costs will continue
5.9%
7.0%
7.7%
8.6%
9.5%
3.8%
7.5%
0.0%
1.0%
2.0%
3.0%
4.0%
5.0%
6.0%
7.0%
8.0%
9.0%
10.0%
2019 2020 2021F 2022F 2023F 1H20 1H21
18.9%
23.5%
29.4% 30.2% 31.0%
13.9%
28.9%
0.0%
5.0%
10.0%
15.0%
20.0%
25.0%
30.0%
35.0%
2019 2020 2021F 2022F 2023F 1H20 1H21
43.2%
31.4%
42.6%
16.1%18.9%
14.7%
0.0%
5.0%
10.0%
15.0%
20.0%
25.0%
30.0%
35.0%
40.0%
45.0%
50.0%
2015 2016 2017 2018 2019 1H20

Co
mp
an
y R
ep
ort
See the last page for disclaimer Page 4 of 9
[Table_RightMar1]
8 S
ep
tem
be
r 2
02
1
[Table_RightMar2]
Ha
ito
ng
In
t'l 海
通国
际 (0
06
65
HK
)
[Table_PageHeader] Haitong Int'l (00665 HK)
to be maintained at a relatively low level given that the Company's leverage ratio is expected to remain at a low level; and we
expect that the Company's impairment losses will continue to decrease compared with that in 2H21. On the whole, we expect
that the Company's earnings will still record relatively good growth in 2H21. We revise down our forecasts on shareholders' net
profit for FY21/ FY22/ FY23 by 11.8%/ 8.5%/ 5.3%, respectively. We forecast the Company's shareholders' net profit for FY21/
FY22/ FY23 to grow YoY by 14.2%/ 15.9%/ 16.2% to HK$2,208.1 million/ HK$2,560.0 million/ HK$2,973.7 million, respectively.
We expect EPS for FY21/ FY22/ FY23 to grow YoY by 13.4%/ 15.9%/ 16.2% to HK$0.3740/ HK$0.4336/ HK$0.5036,
respectively.
Table-1: Key Assumptions and Adjustments
HK$ thousand New estimation Old estimation Change
2021F 2022F 2023F 2021F 2022F 2023F 2021F 2022F 2023F
Commission and fee income 3,231,801 3,549,970 3,942,772 3,398,846 3,751,037 4,150,539 (4.9%) (5.4%) (5.0%)
Interest income 1,959,142 2,176,485 2,445,183 2,258,722 2,408,676 2,589,303 (13.3%) (9.6%) (5.6%)
Net trading and investment income 2,371,490 2,722,302 3,170,002 3,074,079 3,420,206 3,810,951 (22.9%) (20.4%) (16.8%)
Total revenue and other income 7,504,046 8,472,112 9,585,025 8,621,686 9,454,563 10,407,887 (13.0%) (10.4%) (7.9%)
Total expenses (4,869,152) (5,417,248) (6,036,575) (5,642,112) (6,126,245) (6,670,551) (13.7%) (11.6%) (9.5%)
Profit before tax 2,634,894 3,054,863 3,548,450 2,979,574 3,328,318 3,737,336 (11.6%) (8.2%) (5.1%)
Profit after tax 2,208,086 2,560,026 2,973,660 2,503,334 2,796,336 3,139,979 (11.8%) (8.5%) (5.3%)
Shareholders' net profit 2,208,086 2,560,026 2,973,660 2,503,334 2,796,336 3,139,979 (11.8%) (8.5%) (5.3%)
Basic EPS (HK$) 0.3740 0.4336 0.5036 0.4269 0.4633 0.5202 (12.4%) (6.4%) (3.2%)
Source: Guotai Junan International.
We revise down our TP for the Company from HK$3.82 to HK$3.21 and maintain "Buy" rating. According to our financial
forecasts, Haitong International is currently trading at 6.3x 2021 PER and 5.4x 2022 PER, and 0.5x 2021 PBR and 0.5x 2022
PBR. The Company's investment banking business and global layout outperformed its main peers. We expect the following
factors to support the Company's valuation in the near future: 1) the Company has redefined asset structure and business focus,
and strengthened its fee-based business; 2) the Company’s strength in investment banking business is projected to make it
benefit from the projected good prospects of Hong Kong’s IPO raising market in 2021;3) the Company's provisioning pressure
for its troubled assets is expected to continue to decline in the near future; and 4) the Company's earnings is projected to still
record relatively good growth in 2H21. Considering the change in market valuation, we revise down our TP for the Company
from HK$3.82 to HK$3.21, which is equivalent to 8.6x/ 7.4x/ 6.4x 2021-2023 PER and 0.6x/ 0.6x/ 0.6x 2021-2023 PBR.
Meanwhile, we maintain "Buy" rating for the Company.
Figure-5: Haitong International – Forward PER Figure-6: Haitong International – Forward PBR
Source: Bloomberg, Guotai Junan International. Source: Bloomberg, Guotai Junan International.
Major Risks
Extremely loose monetary policies around the world have increased relevant potential risks.
COVID-19 mutations have increased uncertainties surrounding the COVID-19 outbreak.
The impact from the COVID-19 outbreak on the capital market may possibly be beyond our expectation.
The commission rate for the industry is likely to continue to face downward pressure over the next few years, which will
4.0
5.0
6.0
7.0
8.0
9.0
10.0
11.0
12.0
Jan
-17
Mar
-17
Jun
-17
Au
g-1
7
No
v-1
7
Jan
-18
Ap
r-1
8
Jul-
18
Sep
-18
De
c-1
8
Feb
-19
May
-19
Jul-
19
Oct
-19
De
c-1
9
Mar
-20
Jun
-20
Au
g-2
0
No
v-2
0
Jan
-21
Ap
r-2
1
Jun
-21
Sep
-21
PER mean -1SD
-2SD +1SD +2SD
0.0
0.2
0.4
0.6
0.8
1.0
1.2
1.4
Jan
-17
Mar
-17
Jun
-17
Au
g-1
7
No
v-1
7
Jan
-18
Ap
r-1
8
Jul-
18
Sep
-18
De
c-1
8
Feb
-19
May
-19
Jul-
19
Oct
-19
De
c-1
9
Mar
-20
Jun
-20
Au
g-2
0
No
v-2
0
Jan
-21
Ap
r-2
1
Jun
-21
Sep
-21
PBR mean -1SD
-2SD +1SD +2SD

Co
mp
an
y R
ep
ort
See the last page for disclaimer Page 5 of 9
[Table_RightMar1]
8 S
ep
tem
be
r 2
02
1
[Table_RightMar2]
Ha
ito
ng
In
t'l 海
通国
际 (0
06
65
HK
)
[Table_PageHeader] Haitong Int'l (00665 HK)
negatively affect the brokerage business of the Company.
The competition among Chinese brokers in Hong Kong is intensifying.
The performance of the Hong Kong market and other overseas capital markets may possibly be beyond our expectation.
Possible failure to meet regulatory requirements might lead to penalties for the Company.
Trade conflict, geopolitical risks, and emerging economic risks may increase.
Tension between China and the US could intensify.

Co
mp
an
y R
ep
ort
See the last page for disclaimer Page 6 of 9
[Table_RightMar1]
8 S
ep
tem
be
r 2
02
1
[Table_RightMar2]
Ha
ito
ng
In
t'l 海
通国
际 (0
06
65
HK
)
[Table_PageHeader] Haitong Int'l (00665 HK)
Table-2: Peers Comparison
Company Stock Code CURR Last price
PE PB ROE
(%) D/Y (%) Market Cap
20A 21F 22F 23F 20A 21F 22F 23F 21F 21F HK$ mil
Hong Kong -- mainly operating in HK
Guotai Junan International 1788 HK HK$ 1.36 8.0 7.0 6.2 5.7 0.9 0.8 0.7 0.7 12.0 7.4 13,082
Haitong International Securi 665 HK HK$ 2.28 6.9 5.8 5.0 4.6 0.5 0.5 0.4 0.4 8.6 8.5 13,766
Sun Hung Kai & Co Ltd 86 HK HK$ 4.28 3.3 2.4 2.2 2.0 0.4 0.3 0.3 0.3 13.6 6.1 8,472
Shenwan Hongyuan Hk Ltd 218 HK HK$ 1.19 10.6 n.a. n.a. n.a. 0.5 n.a. n.a. n.a. n.a. n.a. 1,858
First Shanghai Investments 227 HK HK$ 0.30 n.a. n.a. n.a. n.a. 0.2 n.a. n.a. n.a. n.a. n.a. 511
Cisi Fin 6058 HK HK$ 0.20 n.a. n.a. n.a. n.a. 0.2 n.a. n.a. n.a. n.a. n.a. 788
Cmbc Capital Holdings Ltd 1141 HK HK$ 0.10 11.9 n.a. n.a. n.a. 1.8 n.a. n.a. n.a. n.a. n.a. 4,684
Bright Smart Securities And 1428 HK HK$ 1.67 6.0 4.0 n.a. n.a. 1.5 1.3 n.a. n.a. 34.9 6.1 2,834
Bocom International Holdings 3329 HK HK$ 1.81 5.8 4.2 3.7 3.5 0.7 0.6 0.6 0.5 15.2 12.2 4,949
Southwest Securities Interna 812 HK HK$ 0.06 n.a. n.a. n.a. n.a. 0.8 n.a. n.a. n.a. n.a. n.a. 220
Cinda International Holdings 111 HK HK$ 0.49 3.7 n.a. n.a. n.a. 0.3 n.a. n.a. n.a. n.a. n.a. 311
Simple Average 7.0 4.7 4.3 4.0 0.7 0.7 0.5 0.5 16.9 8.0
Weighted Average 7.0 5.2 4.6 4.3 0.8 0.6 0.5 0.5 13.1 7.9
Hong Kong -- mainly operating in mainland China
Citic Securities Co Ltd-H 6030 HK HK$ 21.10 16.2 11.4 9.9 8.7 1.3 1.2 1.1 1.0 10.6 3.7 21.10
Haitong Securities Co Ltd-H 6837 HK HK$ 7.59 7.5 6.0 5.4 4.8 0.5 0.5 0.5 0.4 8.8 5.1 7.59
Gf Securities Co Ltd-H 1776 HK HK$ 15.64 10.5 8.6 7.4 6.5 1.0 0.9 0.8 0.8 10.8 3.6 15.64
Huatai Securities Co Ltd-H 6886 HK HK$ 12.46 9.2 7.1 6.3 5.7 0.7 0.7 0.6 0.6 9.9 4.7 12.46
China Galaxy Securities Co-H 6881 HK HK$ 4.61 5.8 5.1 4.8 4.6 0.5 0.5 0.4 0.4 9.4 5.9 4.61
Central China Securities C-H 1375 HK HK$ 1.56 69.3 n.a. n.a. n.a. 0.5 n.a. n.a. n.a. n.a. n.a. 1.56
Guolian Securities Co Ltd-H 1456 HK HK$ 3.83 12.2 n.a. n.a. n.a. 0.7 n.a. n.a. n.a. n.a. n.a. 3.83
Hengtai Securities Co Ltd-H 1476 HK HK$ 3.11 17.3 n.a. n.a. n.a. 0.8 n.a. n.a. n.a. n.a. n.a. 3.11
China International Capita-H 3908 HK HK$ 22.35 12.4 9.9 8.4 7.3 1.4 1.2 1.0 0.9 12.3 1.8 22.35
Dfzq-H 3958 HK HK$ 8.15 19.1 11.4 10.0 8.5 0.8 0.8 0.7 0.7 8.2 4.1 8.15
Everbright Securities Co L-H 6178 HK HK$ 6.76 12.0 6.8 6.0 6.3 0.5 0.5 0.4 0.4 7.2 4.3 6.76
China Merchants Securities-H 6099 HK HK$ 12.76 10.7 8.7 7.6 6.6 1.0 0.9 0.8 0.7 10.3 3.5 12.76
Csc Financial Co Ltd-H 6066 HK HK$ 10.06 7.5 6.8 6.1 5.4 1.1 0.9 0.8 0.7 13.4 4.6 10.06
Guotai Junan Securities Co-H 2611 HK HK$ 11.50 8.5 6.0 5.4 5.0 0.7 0.6 0.6 0.5 10.4 6.5 11.50
Simple Average 15.6 8.0 7.0 6.3 0.8 0.8 0.7 0.7 10.1 4.3
Weighted Average 11.9 8.4 7.4 6.5 1.0 0.9 0.8 0.7 10.6 3.9
China
Citic Securities Co-A 600030 CH CNY
Guotai Junan Securities Co-A 601211 CH CNY 27.15 23.4 18.1 15.4 13.2 1.9 1.8 1.7 1.6 10.4 2.3 27.15
Shenwan Hongyuan Co-A 000166 CH CNY 18.76 15.6 11.9 10.5 9.4 1.3 1.1 1.1 1.0 9.9 3.2 18.76
Haitong Securities Co Ltd-A 600837 CH CNY 6.07 19.6 17.9 16.6 15.6 1.7 1.6 1.5 1.4 9.2 1.6 6.07
Guosen Securities Co Ltd-A 002736 CH CNY 13.81 15.3 12.9 11.5 10.1 1.2 1.1 1.0 0.9 8.7 2.4 13.81
Gf Securities Co Ltd-A 000776 CH CNY 12.39 17.2 14.6 13.2 10.7 1.7 1.6 1.4 n.a. 10.2 2.0 12.39
Orient Securities Co Ltd-A 600958 CH CNY 23.89 18.1 15.3 13.1 11.4 1.9 1.7 1.6 1.4 11.3 2.0 23.89
Huatai Securities Co Ltd-A 601688 CH CNY 18.08 47.6 29.2 24.3 20.7 2.1 2.0 1.9 1.8 7.7 1.5 18.08
China Merchants Securities-A 600999 CH CNY 18.68 15.6 12.5 11.0 9.7 1.3 1.2 1.1 1.0 9.9 2.5 18.68
Everbright Securitie Co -A 601788 CH CNY 19.63 18.5 15.4 13.4 11.7 1.9 1.6 1.5 1.4 10.6 1.9 19.63
Changjiang Securities Co L-A 000783 CH CNY 17.09 34.2 20.1 18.0 n.a. 1.6 1.4 1.3 n.a. 7.4 1.6 17.09
Sinolink Securities Co Ltd-A 600109 CH CNY 8.07 21.2 17.3 15.4 16.1 1.6 1.5 1.4 1.3 8.2 1.5 8.07
Southwest Securities Co Lt-A 600369 CH CNY 12.05 19.6 17.6 15.3 17.2 1.6 1.5 1.4 1.3 8.5 0.5 12.05
Guoyuan Securities Co Ltd-A 000728 CH CNY 5.38 29.9 29.9 26.9 n.a. 1.4 n.a. n.a. n.a. 4.8 n.a. 5.38
Pacific Securities Co/The-A 601099 CH CNY 8.30 24.0 24.8 21.8 n.a. 1.2 1.2 1.1 n.a. 4.5 2.4 8.30
Northeast Securities Co Lt-A 000686 CH CNY 3.49 n.a. n.a. n.a. n.a. 2.5 n.a. n.a. n.a. n.a. n.a. 3.49
Industrial Securities Co-A 601377 CH CNY 9.17 16.1 n.a. n.a. n.a. 1.3 n.a. n.a. n.a. n.a. n.a. 9.17
Shanxi Securities Co Ltd-A 002500 CH CNY 11.52 19.2 17.1 14.8 12.2 2.0 1.9 1.7 1.6 11.3 1.1 11.52
Sealand Securities Co Ltd -A 000750 CH CNY 6.91 30.0 n.a. n.a. n.a. 1.5 n.a. n.a. n.a. n.a. n.a. 6.91
Founder Securities Co Ltd-A 601901 CH CNY 4.37 33.6 n.a. n.a. n.a. 1.3 n.a. n.a. n.a. n.a. n.a. 4.37
Soochow Securities Co Ltd-A 601555 CH CNY 8.71 67.0 27.2 25.6 n.a. 1.8 n.a. n.a. n.a. 6.4 n.a. 8.71
Western Securities Co Ltd-A 002673 CH CNY 10.43 22.7 20.1 18.0 16.8 1.5 1.4 1.3 1.2 6.9 1.4 10.43
Dongxing Securities Co Lt-A 601198 CH CNY 8.44 26.5 n.a. n.a. n.a. 1.4 n.a. n.a. n.a. n.a. n.a. 8.44
Sdic Capital Co Ltd-A 600061 CH CNY 12.24 21.9 n.a. n.a. n.a. 1.6 n.a. n.a. n.a. n.a. n.a. 12.24
First Capital Securities C-A 002797 CH CNY 9.77 10.1 32.6 28.7 n.a. 1.0 2.1 1.9 n.a. n.a. 1.1 9.77

Co
mp
an
y R
ep
ort
See the last page for disclaimer Page 7 of 9
[Table_RightMar1]
8 S
ep
tem
be
r 2
02
1
[Table_RightMar2]
Ha
ito
ng
In
t'l 海
通国
际 (0
06
65
HK
)
[Table_PageHeader] Haitong Int'l (00665 HK)
Central China Securities C-A 601375 CH CNY 7.73 36.8 23.4 19.8 n.a. 2.3 3.0 2.7 n.a. n.a. 0.8 7.73
China Galaxy Securities Co-A 601881 CH CNY 5.22 261.0 n.a. n.a. n.a. 1.8 n.a. n.a. n.a. n.a. n.a. 5.22
Csc Financial Co Ltd-A 601066 CH CNY 11.25 15.8 14.5 13.3 12.2 1.4 1.3 1.3 1.2 9.5 2.1 11.25
China International Captal-A 601995 CH CNY 33.70 28.1 27.8 24.0 21.0 4.5 3.7 3.3 3.0 13.3 1.1 33.70
Simple Average 59.38 n.a. n.a. n.a. n.a. n.a. n.a. n.a. n.a. 12.9 n.a. 59.38
Weighted Average 33.7 20.0 17.7 13.9 1.7 1.7 1.6 1.4 9.1 1.7
Taiwan
Yuanta Financial Holding Co 2885 TT TWD 24.30 12.2 9.1 9.5 9.0 1.1 1.1 1.0 1.0 13.2 6.3 83,055
Sinopac Financial Holdings 2890 TT TWD 14.00 12.8 9.8 9.8 8.7 1.0 1.0 0.9 0.9 10.1 6.4 44,435
Simple Average 12.5 9.4 9.7 8.8 1.1 1.0 1.0 0.9 11.6 6.4
Weighted Average 12.4 9.3 9.6 8.9 1.1 1.0 1.0 0.9 12.1 6.3
Korea
Mirae Asset Daewoo Co Ltd 006800 KS KRW 8,870.00 7.3 5.8 6.4 6.3 0.5 0.6 0.5 0.5 10.0 3.2 37,720
Samsung Securities Co Ltd 016360 KS KRW 49,200.00 8.7 5.2 6.1 5.9 0.8 0.7 0.7 0.6 15.1 7.2 29,408
Korea Investment Holdings Co 071050 KS KRW 91,900.00 6.2 3.6 4.9 4.6 0.9 0.8 0.7 0.6 23.4 4.1 34,279
Nh Investment & Securities C 005940 KS KRW 13,150.00 6.8 4.8 5.5 5.2 0.6 0.6 0.6 0.5 13.1 6.8 24,769
Simple Average 7.3 4.9 5.7 5.5 0.7 0.7 0.6 0.6 15.4 5.3
Weighted Average 7.2 4.9 5.7 5.5 0.7 0.7 0.6 0.6 15.4 5.1
Japan
Nomura Holdings Inc 8604 JP JPY 575.90 8.5 11.5 7.5 7.2 0.7 0.7 0.6 0.6 5.7 6.0 131,669
Daiwa Securities Group Inc 8601 JP JPY 665.90 17.0 9.4 11.2 10.7 0.8 0.8 0.7 0.7 8.5 6.3 80,012
Mizuho Financial Group Inc 8411 JP JPY 1,607.00 90.9 8.7 7.4 7.4 4.8 0.4 0.4 0.4 5.3 4.7 288,521
Simple Average 38.8 9.8 8.7 8.4 2.1 0.6 0.6 0.6 6.5 5.7
Weighted Average 57.4 9.5 8.0 7.9 3.1 0.5 0.5 0.5 5.9 5.3
U.S.
Jpmorgan Chase & Co JPM US USD 159.49 17.9 11.4 13.5 12.4 2.0 1.8 1.8 1.6 16.7 2.4 3,704,320
Bank Of America Corp BAC US USD 41.05 21.8 12.8 13.5 12.0 1.4 1.4 1.3 1.2 11.1 1.9 2,684,938
Citigroup Inc C US USD 71.17 15.0 7.2 9.2 8.0 0.8 0.8 0.7 0.6 11.1 2.9 1,121,183
Goldman Sachs Group Inc GS US USD 411.31 16.4 7.8 11.1 10.4 1.7 1.5 1.4 1.3 20.6 1.6 1,124,378
Morgan Stanley MS US USD 104.25 15.9 14.2 14.4 12.8 2.0 1.9 1.9 1.8 14.0 2.0 1,478,449
Simple Average 17.4 10.7 12.3 11.1 1.6 1.5 1.4 1.3 14.7 2.2
Weighted Average 18.2 11.3 12.9 11.6 1.7 1.6 1.5 1.4 14.6 2.2
Europe
Ubs Group Ag-Reg UBSG SW CHF 15.44 9.0 9.0 9.1 8.2 1.0 1.0 0.9 0.8 10.3 2.3 485,820
Credit Suisse Group Ag-Reg CSGN SW CHF 9.79 9.0 12.2 7.2 6.4 0.6 0.6 0.5 0.5 2.4 1.7 220,705
Deutsche Bank Ag-Registered DBK GR EUR 10.82 154.5 10.8 8.4 7.5 0.4 0.4 0.4 0.4 3.0 2.1 206,296
Barclays Plc BARC LN GBp 185.64 21.1 6.1 7.4 7.0 0.6 0.5 0.5 0.5 9.1 3.3 337,038
Bnp Paribas BNP FP EUR 54.35 10.2 8.6 8.3 7.7 0.7 0.6 0.6 0.6 7.2 6.5 626,862
Simple Average 40.8 9.3 8.1 7.3 0.7 0.6 0.6 0.6 6.4 3.2
Weighted Average 27.6 8.9 8.2 7.5 0.7 0.7 0.6 0.6 7.3 3.8
Source: Bloomberg, Guotai Junan International.
Co
mp
an
y R
ep
ort
See the last page for disclaimer Page 8 of 9
[Table_RightMar1]
8 S
ep
tem
be
r 2
02
1
[Table_RightMar2]
Ha
ito
ng
In
t'l 海
通国
际 (0
06
65
HK
)
[Table_PageHeader] Haitong Int'l (00665 HK)
Financial Statements and Ratios
[Table_FinancialRatio] Financial Ratio [Table_CompanyRatingDefinition]
[Table_IncomeStatement] Income Statement
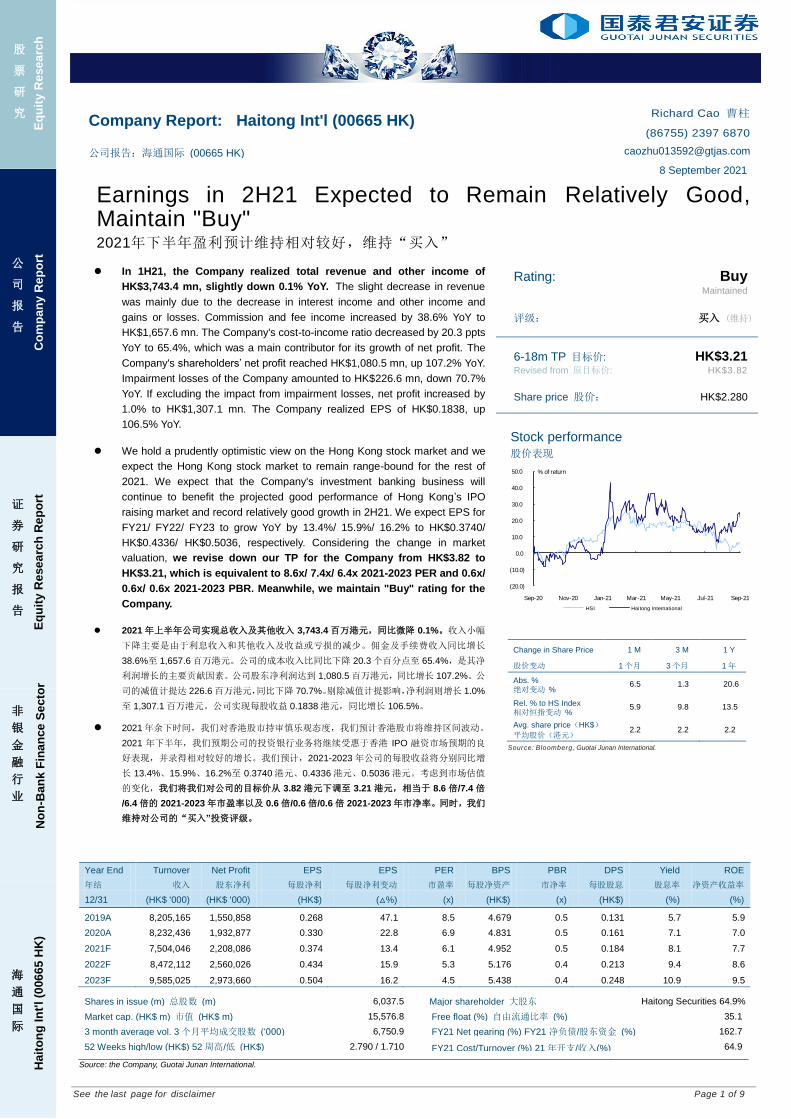
Year end 31 Dec (HK$ thousand) 2019A 2020A 2021F 2022F 2023F
Commission and fee income 2,291,922 2,864,575 3,231,801 3,549,970 3,942,772
Interest income 2,941,593 2,464,585 1,959,142 2,176,485 2,445,183
Net trading and investment income 3,010,459 3,000,587 2,371,490 2,722,302 3,170,002
Total revenue 8,243,974 8,329,747 7,562,433 8,448,757 9,557,957
Other income and gains or losses (38,809) (97,311) (58,387) 23,355 27,068
Total rev. and other inc. 8,205,165 8,232,436 7,504,046 8,472,112 9,585,025
Salaries & allowances, bonus & pension (1,380,918) (1,564,995) (1,906,786) (2,144,301) (2,416,395)
Commission expenses (179,351) (257,958) (181,158) (197,658) (216,403)
Amortisation and depreciation (225,566) (252,091) (283,602) (299,768) (317,454)
Impairment charges, net of reversal (634,489) (986,115) (334,137) (362,541) (363,638)
Operating expenses (804,439) (726,174) (969,589) (1,086,200) (1,219,300)
Finance costs (3,129,773) (2,144,511) (1,193,878) (1,326,782) (1,503,384)
Total expenses (6,354,536) (5,931,844) (4,869,152) (5,417,248) (6,036,575)
Operating profit 1,850,629 2,300,592 2,634,894 3,054,863 3,548,450
Profit before tax 1,850,629 2,300,592 2,634,894 3,054,863 3,548,450
Income tax (299,771) (367,715) (426,809) (494,837) (574,790)
Profit after tax 1,550,858 1,932,877 2,208,086 2,560,026 2,973,660
Non-controlling interest 0 0 0 0 0
Shareholders' profit / loss 1,550,858 1,932,877 2,208,086 2,560,026 2,973,660
Basic EPS 0.268 0.330 0.374 0.434 0.504
[Table_CashFlowStatement] Cash Flow Statement
Year end 31 Dec (HK$ thousand) 2019A 2020A 2021F 2022F 2023F
Profit before tax 1,850,629 2,300,592 2,634,894 3,054,863 3,548,450
Depreciation and amortization 225,566 252,091 283,602 299,768 317,454
Interest income (2,941,593) (2,464,585) (1,959,142) (2,176,485) (2,445,183)
Others 3,703,786 2,543,799 1,000,086 1,116,184 1,237,463
Change in working capital (4,774,837) 57,106 3,393,302 (6,128,545) (8,123,233)
Interest received 3,029,768 2,915,820 1,959,142 2,176,485 2,445,183
Dividend received 121,622 634,821 576,417 621,378 677,923
Interest paid (3,001,002) (2,357,585) (1,193,878) (1,326,782) (1,503,384)
Tax paid (36,498) (646,785) (426,809) (494,837) (574,790)
Cash from operating activities (1,822,559) 3,235,274 6,267,615 (2,857,970) (4,420,117)
Change of PPE and intangibles (85,390) (86,913) (83,182) (82,312) (80,791)
Disposal of investments 154,440 0 0 0 0
Cash from investing activities 69,050 (86,913) (83,182) (82,312) (80,791)
Debt financing (562,765) (2,356,189) (3,592,239) 4,430,309 6,110,283
Proceeds from change of shares (71,853) (230,980) (89,537) (92,877) (52,791)
Dividends paid to shareholders (261,015) (350,861) (1,249,581) (1,197,272) (1,389,480)
Other financing activities (170,079) (145,014) (121,724) (127,111) (124,098)
Cash from financing activities (1,065,712) (3,083,044) (5,053,080) 3,013,048 4,543,914
Net changes in cash (2,819,221) 65,317 1,131,353 72,766 43,006
Cash at beg of year 7,088,829 4,269,608 4,334,925 5,466,278 5,539,045
Cash at end of year 4,269,608 4,334,925 5,466,278 5,539,045 5,582,050
Source: the Company, Guotai Junan International.
[Table_BalanceSheet] Balance Sheet
Year end 31 Dec (HK$ thousand) 2019A 2020A 2021F 2022F 2023F
Cash & cash equivalents 4,269,608 4,334,925 5,466,278 5,539,045 5,582,050
Cash held on behalf of customers 15,134,126 19,553,711 20,128,832 21,914,946 24,457,897
Financial investment assets 98,426,393 89,170,033 80,966,390 87,281,768 95,224,409
Advances to customers 25,907,689 23,950,422 21,974,558 23,691,540 25,818,779
Accounts receivable 8,683,114 5,576,807 7,485,519 8,146,182 8,897,740
Prepayments, deposits and other recs 1,762,781 1,106,453 1,159,203 1,267,791 1,390,354
Goodwill and other intangible assets 485,916 480,148 445,640 412,274 380,170
Property and equipment 706,275 812,208 890,499 952,918 994,321
Others 898,600 1,457,809 1,475,303 1,602,179 1,752,784
Total Assets 156,274,502 146,442,516 139,992,221 150,808,642 164,498,504
Financial liabilities 20,975,620 20,502,925 15,919,794 17,344,052 18,999,794
Accounts payable 19,107,219 22,921,539 24,239,838 26,324,994 28,670,397
Borrowings 58,291,346 55,885,140 52,292,901 56,723,211 62,833,494
Repurchase agreements 27,455,006 10,680,425 9,996,878 10,843,824 12,011,932
Others 3,414,730 8,135,318 8,306,160 9,012,183 9,877,353
Total Liabilities 129,243,921 118,125,347 110,755,572 120,248,263 132,392,969
Total Shareholders' Equity 27,030,581 28,317,169 29,236,650 30,560,379 32,105,536
Minority Interest 0 0 0 0 0
Total Equity 27,030,581 28,317,169 29,236,650 30,560,379 32,105,536
[Table_FinancialRatio] Financial Ratios
2019A 2020A 2021F 2022F 2023F
Total rev. and other inc. growth 29.1% 0.3% (8.8%) 12.9% 13.1%
Shareholders' net profit growth 51.6% 24.6% 14.2% 15.9% 16.2%
Basic EPS growth 47.1% 22.8% 13.4% 15.9% 16.2%
Cost-to-income ratio (77.4%) (72.1%) (64.9%) (63.9%) (63.0%)
Net profit margin 18.9% 23.5% 29.4% 30.2% 31.0%
ROAA 1.0% 1.3% 1.5% 1.8% 1.9%
ROAE 5.9% 7.0% 7.7% 8.6% 9.5%
Leverage ratio 522.2% 448.1% 410.0% 421.8% 436.2%
Co
mp
an
y R
ep
ort
See the last page for disclaimer Page 9 of 9
[Table_RightMar1]
8 S
ep
tem
be
r 2
02
1
[Table_RightMar2]
Ha
ito
ng
In
t'l 海
通国
际 (0
06
65
HK
)
[Table_PageHeader] Haitong Int'l (00665 HK)
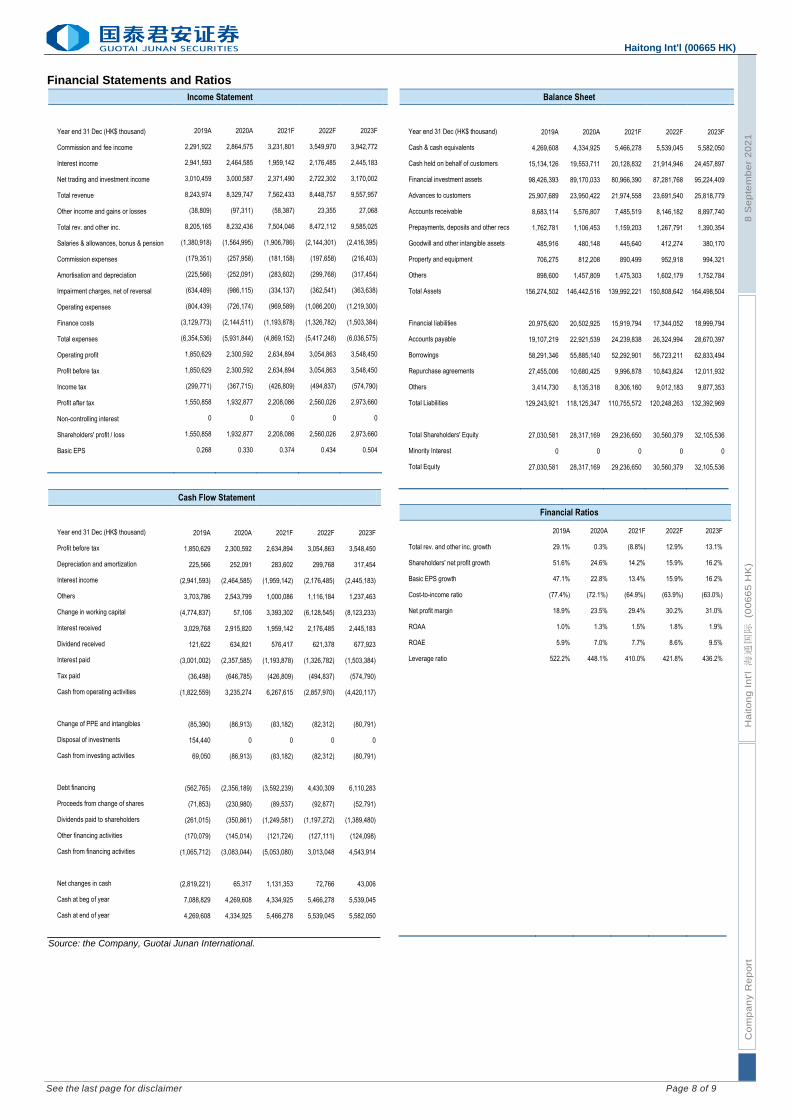
Company Rating Definition
The Benchmark: Hong Kong Hang Seng Index
Time Horizon: 6 to 18 months
Rating Definition
Buy 买入 Relative Performance>15%; or the fundamental outlook of the company or sector is favorable.
Accumulate 收集 Relative Performance is 5% to 15%; or the fundamental outlook of the company or sector is favorable.
Neutral 中性 Relative Performance is -5% to 5%; or the fundamental outlook of the company or sector is neutral.
Reduce 减持 Relative Performance is -5% to -15%; or the fundamental outlook of the company or sector is unfavorable.
Sell 卖出 Relative Performance <-15%; or the fundamental outlook of the company or sector is unfavorable.
[Table_IndustryRatingDefinition] Sector Rating Definition
The Benchmark: Hong Kong Hang Seng Index
Time Horizon: 6 to 18 months
Rating Definition
Outperform 跑赢大市 Relative Performance>5%; or the fundamental outlook of the sector is favorable.
Neutral 中性 Relative Performance is -5% to 5%; or the fundamental outlook of the sector is neutral.
Underperform 跑输大市 Relative Performance<-5%; or the fundamental outlook of the sector is unfavorable.
[Table_DISCLOSUREOFINTERESTS] DISCLOSURE OF INTERESTS
(1) The Analysts and their associates do not serve as an officer of the issuer mentioned in this Research Report. (2) The Analysts and their associates do not have any financial interests in relation to the issuer mentioned in this Research Report. (3) Except for GUOTAI JUNAN I (01788 HK),JINSHANG BANK (02558 HK),HAITIAN ANTENNA (08227 HK),XPENG-W (09868 HK),Guotai
Junan and its group companies do not hold equal to or more than 1% of the market capitalization of the issuer mentioned in this Research Report.
(4) Guotai Junan and its group companies have not had investment banking relationships with the issuer mentioned in this Research Report within the preceding 12 months.
(5) Guotai Junan and its group companies are not making a market in the securities in respect of the issuer mentioned in this Research Report.
(6) Guotai Junan and its group companies have not employed an individual serving as an officer of the issuer mentioned in this Research Report. There is no officer of the issuer mentioned in this Research Report associated with Guotai Junan and its group companies.
DISCLAIMER This Research Report does not constitute an invitation or offer to acquire, purchase or subscribe for securities by Guotai Junan Securities (Hong Kong) Limited ("Guotai Junan"). Guotai Junan and its group companies may do business that relates to companies covered in research reports, including investment banking, investment services, etc. (for example, the placing agent, lead manager, sponsor, underwriter or invest proprietarily). Any opinions expressed in this report may differ or be contrary to opinions or investment strategies expressed orally or in written form by sales persons, dealers and other professional executives of Guotai Junan group of companies. Any opinions expressed in this report may differ or be contrary to opinions or investment decisions made by the asset management and investment banking groups of Guotai Junan. Though best effort has been made to ensure the accuracy of the information and data contained in this Research Report, Guotai Junan does not guarantee the accuracy and completeness of the information and data herein. This Research Report may contain some forward-looking estimates and forecasts derived from the assumptions of the future political and economic conditions with inherently unpredictable and mutable situation, so uncertainty may contain. Investors should understand and comprehend the investment objectives and its related risks, and where necessary consult their own financial advisers prior to any investment decision. This Research Report is not directed at, or intended for distribution to or use by, any person or entity who is a citizen or resident of or located in any jurisdiction where such distribution, publication, availability or use would be contrary to applicable law or regulation or which would subject Guotai Junan and its group companies to any registration or licensing requirement within such jurisdiction. © 2021 Guotai Junan Securities (Hong Kong) Limited. All Rights Reserved. 27/F., Low Block, Grand Millennium Plaza, 181 Queen’s Road Central, Hong Kong. Tel.: (852) 2509-9118 Fax: (852) 2509-7793 Website: www.gtja.com.hk