Twin screw granulation : effects of properties of primary powders
Upload
independentCategory
view
4download
0
ELSEVIER
Int. Darry Journal 7 (1997) 341-348
c‘, 1997 Elsevier Science Ltd
All rights reserved. Printed in GReat Britain
PII: SO958-6946(97)00017-4 095%6946197 $17.00 + 0.00
Early Prediction of the Shelf-life of Medium-heat Whole Milk Powders Using Stepwise Multiple Regression and Principal Component Analysis
Bo R. Nielsen n, Henrik Stapelfeldt a and Leif H. Skibsted “*
“Depurtment of Dairy and Food Science, Royal Veterinary and Agricultural University, Rolighed~wqj 30.
DK-1958 Frederiksberg C, Denmark
(Received 7 October 1996; accepted 6 April 1997)
ABSTRACT
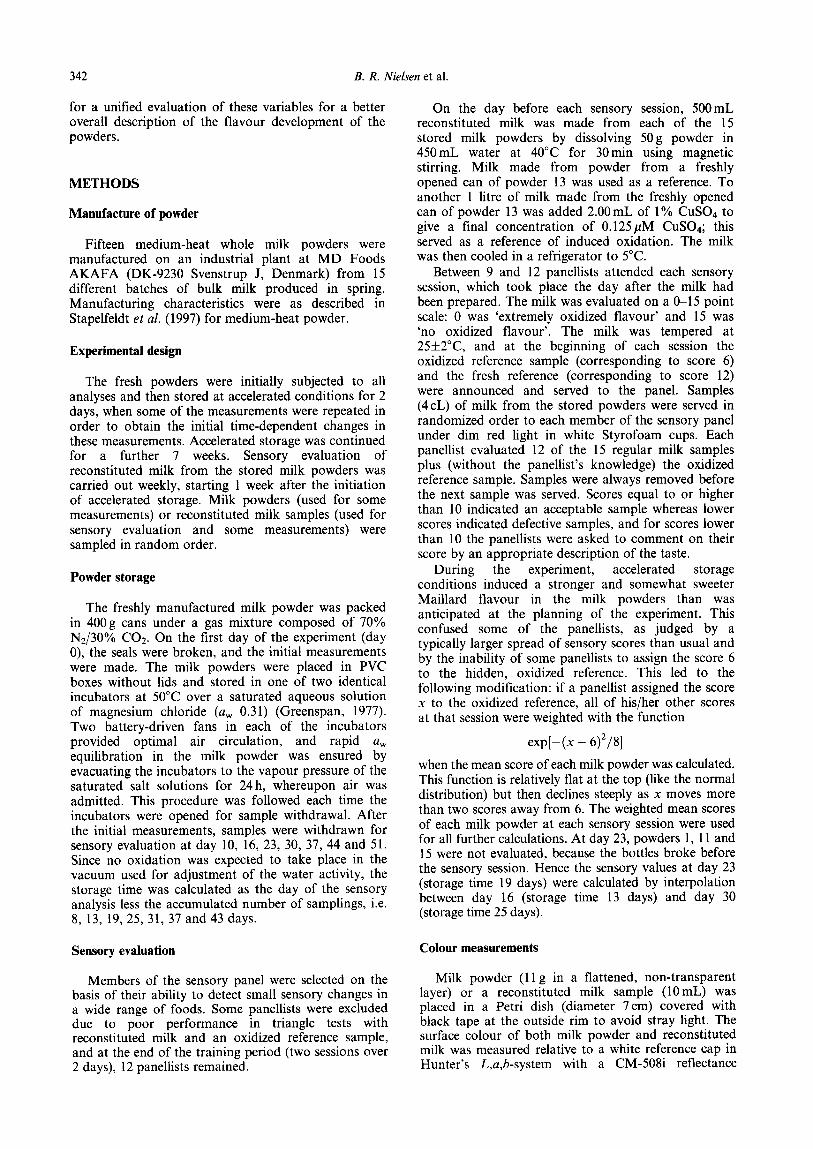
Fifteen medium-heat whole milk powders manufactured at the same plant under identical processing conditions from 15 different batches of raw milk were subjected to accelerated storage at 50°C and a water activity of 0.3 1 in air. With a view to the development of a new prediction method, 22 chemical and technological variables and 13 time-dependent changes over 2 days were measured at the beginning of the experiment. The development of oxidized flavour in the stored powders was subsequently assessed weekly for 6 weeks by a sensory panel. The shelf-life of each powder was determined as the time at which the mean flavour score crossed a threshold value (8 or 6 on a scale from 15 to 0). The relationship between shelf-life and the properties of the fresh powders, together with the time-dependent changes, was investigated by the use of stepwise multiple regression with maximum R2 improvement, and pseudo-optimal sets of regression equations were found which minimized the PRESS (predicted sum of squares) statistic. The initial time-dependent change of TBA-reactive substances was the variable which correlated best (r = -0.66) with the shelf-life at flavour threshold 8. followed by the yellowness Hunter b-value of the powder (r = 0.54) while the variables which alone correlated best with the shelf-life at flavour threshold 6 were the density of milk powder after 1250 tappings (r=O.58), TBA-reactive substances (r= -0.56), and the density of milk powder after 100 tappings (r=O.53). The variables selected by PRESS minimization for the regression equation of threshold 8 (R2 = 0.949) were the a-lactalbumin content, the time-dependent change in /?-lactoglobulin, the time-dependent change in TBA-reactive substances, the density after 1250 tappings, and the solubihty index. The variables selected for the regression equation of threshold 6 (R2=0.980) were the a-lactalbumin content, the time-dependent change in fl- lactoglobulin, the density after 1250 tappings, the total fat content, the time-dependent change in the redness Hunter a-value of the powder, and the initial moisture content. Good predictive abilities of the regression equations were indicated by small PRESS values, and the method appears ready for validation in industrial production. Differences between the milk powders were recognized by principal component analysis. One powder deviated clearly, but not extremely, from the other 14 powders on the first and second principal components, mainly because of a large initial amount of free radicals, a rapid generation of further free radicals, and a low initial concentration of fluorescent oxidation products. The first 7 principal components explained only 84% of the total variation, and no other groupings of the milk powders were apparent. ic? 1997 Elsevier Science Ltd. All rights reserved
Keywords: medium-heat whole milk powder; sensory evaluation; shelf-life prediction; principal component analysis; multiple regression
INTRODUCTION
A large number of investigations have confirmed the general experience in the milk powder production industry that good storage stability of milk powder results when optimum conditions of manufacture, packaging and storage are employed (Caric, 1994; Baldwin and Ackland, 1991; van Mil and Jans, 1991). The milk powder industry is, however, from time to time confronted by situations where powders demonstrate lower storage stability than expected. Milk powder producers, therefore, have a general wish to be able to predict storage stability from measurements at an early stage after manufacture, in order to optimize sales logistics. With this objective in mind, 15 medium- heat milk powders were produced from a respective
*Corresponding author.
number of bulk milks under identical manufacturing conditions. The milk powders were subjected to an array of analyses before storage and to sensory evaluation in order to find a model for the prediction of storage stability. The combined production/storage experiment used a wide variety of analytical methods currently being developed to characterize oxidative processes in milk powder under normal or mildly accelerated storage conditions (Stapelfeldt et al., 1997; Stapelfeldt and Skibsted, 1994). These methods were selected to cover different stages of oxidative changes and included electron spin resonance spectrometry for measurement of free radicals during initiation of oxidation, and fluorescence spectroscopy for measurement of modification of proteins by reaction with secondary lipid oxidation products. Since the different measurements may not be related causally to the sensory quality, statistical methods were adapted
341
342 B. R. Nielsen et al.
for a unified evaluation of these variables for a better overall description of the flavour development of the powders.
session, 500 mL each of the 15 50g powder in using magnetic from a freshly
METHODS
On the day before each sensory reconstituted milk was made from stored milk powders by dissolving 450 mL water at 40°C for 30min stirring. Milk made from powder ” . _^
Manufacture of powder
Fifteen medium-heat whole milk powders were manufactured on an industrial plant at MD Foods AKAFA (DK-9230 Svenstrup J, Denmark) from 15 different batches of bulk milk produced in spring. Manufacturing characteristics were as described in Stapelfeldt et al. (1997) for medium-heat powder.
opened can ot powder 13 was used as a reference. To another 1 litre of milk made from the freshly opened can of powder 13 was added 2.00 mL of 1% CuS04 to give a final concentration of 0.125 ,uM CuS04; this served as a reference of induced oxidation. The milk was then cooled in a refrigerator to 5°C.
Experimental design
The fresh powders were initially subjected to all analyses and then stored at accelerated conditions for 2 days, when some of the measurements were repeated in order to obtain the initial time-dependent changes in these measurements. Accelerated storage was continued for a further 7 weeks. Sensory evaluation of reconstituted milk from the stored milk powders was carried out weekly, starting 1 week after the initiation of accelerated storage. Milk powders (used for some measurements) or reconstituted milk samples (used for sensory evaluation and some measurements) were sampled in random order.
Between 9 and 12 panellists attended each sensory session, which took place the day after the milk had been prepared. The milk was evaluated on a &15 point scale: 0 was ‘extremely oxidized flavour’ and 15 was ‘no oxidized flavour’. The milk was tempered at 25f2”C, and at the beginning of each session the oxidized reference sample (corresponding to score 6) and the fresh reference (corresponding to score 12) were announced and served to the panel. Samples (4cL) of milk from the stored powders were served in randomized order to each member of the sensory panel under dim red light in white Styrofoam cups. Each panellist evaluated 12 of the 15 regular milk samples plus (without the panellist’s knowledge) the oxidized reference sample. Samples were always removed before the next sample was served. Scores equal to or higher than 10 indicated an acceptable sample whereas lower scores indicated defective samples, and for scores lower than 10 the panellists were asked to comment on their score by an appropriate description of the taste.
Powder storage
The freshly manufactured milk powder was packed in 400g cans under a gas mixture composed of 70% N2/30% CO*. On the first day of the experiment (day 0), the seals were broken, and the initial measurements were made. The milk powders were placed in PVC boxes without lids and stored in one of two identical incubators at 50°C over a saturated aqueous solution of magnesium chloride (a, 0.31) (Greenspan, 1977). Two battery-driven fans in each of the incubators provided optimal air circulation, and rapid a, equilibration in the milk powder was ensured by evacuating the incubators to the vapour pressure of the saturated salt solutions for 24 h, whereupon air was admitted. This procedure was followed each time the incubators were opened for sample withdrawal. After the initial measurements, samples were withdrawn for sensory evaluation at day 10, 16, 23, 30, 37, 44 and 51. Since no oxidation was expected to take place in the vacuum used for adjustment of the water activity, the storage time was calculated as the day of the sensory analysis less the accumulated number of samplings, i.e. 8, 13, 19,25, 31, 37 and 43 days.
During the experiment, accelerated storage conditions induced a stronger and somewhat sweeter Maillard flavour in the milk powders than was anticipated at the planning of the experiment. This confused some of the panellists, as judged by a typically larger spread of sensory scores than usual and by the inability of some panellists to assign the score 6 to the hidden, oxidized reference. This led to the following modification: if a panellist assigned the score x to the oxidized reference, all of his/her other scores at that session were weighted with the function
exp[-(x - 6)2/8]
when the mean score of each milk powder was calculated. This function is relatively flat at the top (like the normal distribution) but then declines steeply as x moves more than two scores away from 6. The weighted mean scores of each milk powder at each sensory session were used for all further calculations. At day 23, powders 1, 11 and 15 were not evaluated, because the bottles broke before the sensory session. Hence the sensory values at day 23 (storage time 19 days) were calculated by interpolation between day 16 (storage time 13 days) and day 30 (storage time 25 days).
Sensory evaluation Colour measurements
Members of the sensory panel were selected on the Milk powder (11 g in a flattened, non-transparent basis of their ability to detect small sensory changes in layer) or a reconstituted milk sample (10mL) was a wide range of foods. Some panellists were excluded placed in a Petri dish (diameter 7cm) covered with due to poor performance in triangle tests with black tape at the outside rim to avoid stray light. The reconstituted milk and an oxidized reference sample, surface colour of both milk powder and reconstituted and at the end of the training period (two sessions over milk was measured relative to a white reference cap in 2 days), 12 panellists remained. Hunter’s L,a,b-system with a CM-508i reflectance
Shelfllij? prediction of milk powder 343
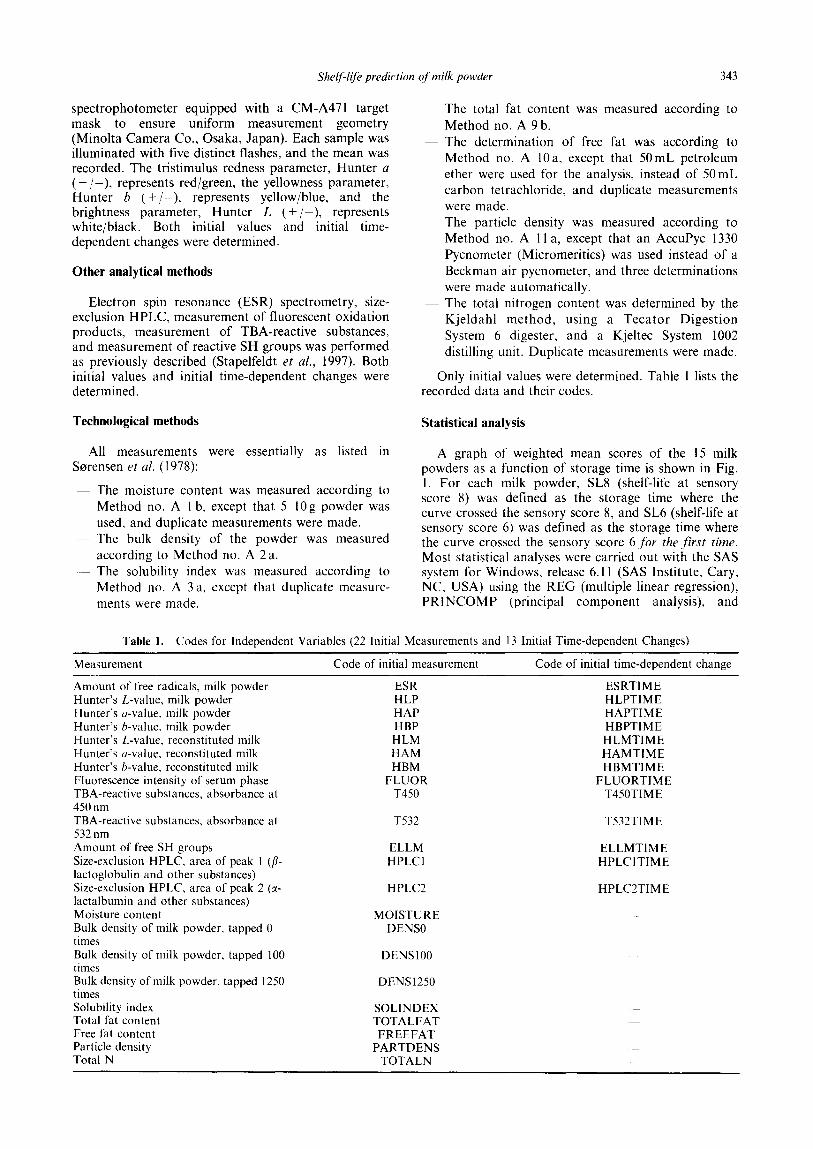
spectrophotometer equipped with a CM-A47 1 target mask to ensure uniform measurement geometry (Minolta Camera Co., Osaka, Japan). Each sample was illuminated with five distinct flashes, and the mean was recorded. The tristimulus redness parameter, Hunter a ( + /-), represents red/green, the yellowness parameter, Hunter h (t-i-), represents yellow/blue, and the brightness parameter, Hunter L ( + /-), represents white/black. Both initial values and initial time- dependent changes were determined.
~ The total fat content was measured according to
Method no. A 9 b.
-- The determination of free fat was according to Method no. A 10 a, except that 50 mL petroleum ether were used for the analysis, instead of 50mL carbon tetrachloride, and duplicate measurements
were made.
Other analytical methods
~ The particle density was measured according to
Method no. A 11 a, except that an AccuPyc 1330
Pycnometer (Micromeritics) was used instead of a
Beckman air pycnometer, and three determinations were made automatically.
Electron spin resonance (ESR) spectrometry, size- exclusion HPLC, measurement of fluorescent oxidation products, measurement of TBA-reactive substances, and measurement of reactive SH groups was performed as previously described (Stapelfeldt et al., 1997). Both initial values and initial time-dependent changes were determined.
- The total nitrogen content was determined by the Kjeldahl method, using a Tecator Digestion
System 6 digester, and a Kjeltec System 1002
distilling unit. Duplicate measurements were made.
Only initial values were determined. Table 1 lists the recorded data and their codes.
Technological methods Statistical analysis
All measurements were essentially as listed in S0rensen et al. (1978):
~ The moisture content was measured according to
Method no. A 1 b, except that 5log powder was used, and duplicate measurements were made.
~~ The bulk density of the powder was measured
according to Method no. A 2a.
~ The solubility index was measured according to Method no. A 3 a, except that duplicate measure- ments were made.
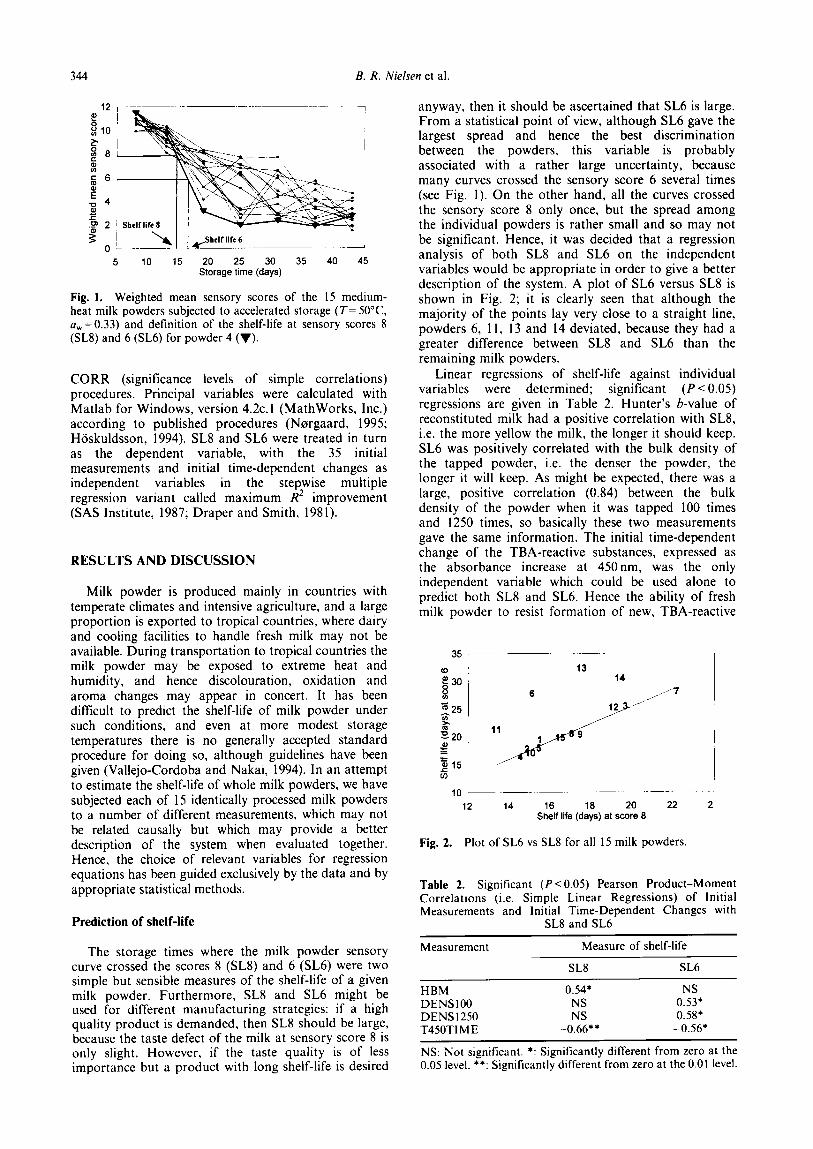
A graph of weighted mean scores of the 15 milk powders as a function of storage time is shown in Fig. 1. For each milk powder, SL8 (shelf-life at sensory score 8) was defined as the storage time where the curve crossed the sensory score 8, and SL6 (shelf-life at sensory score 6) was defined as the storage time where the curve crossed the sensory score 6,for the first time. Most statistical analyses were carried out with the SAS system for Windows, release 6.11 (SAS Institute, Cary. NC, USA) using the REG (multiple linear regression), PRINCOMP (principal component analysis), and
Table 1. Codes for Independent Variables (22 Initial Measurements and 13 Initial Time-dependent Changes)
Measurement Code of initial measurement Code of initial time-dependent change
Amount of free radicals, milk powder Hunter’s L-value, milk powder Hunter’s u-value, milk powder Hunter’s h-value. milk powder Hunter’s L-value, reconstituted milk Hunter’s a-value, reconstituted milk Hunter’s h-value. reconstituted milk Fluorescence intensity of serum phase TBA-reactive substances, absorbance at 450 nm TBA-reactive substances, absorbance at 532 nm Amount of free SH groups Size-exclusion HPLC, area of peak 1 (B- lactoglobulin and other substances) Size-exclusion HPLC, area of peak 2 (x- lactalbumin and other substances) Moisture content Bulk density of milk powder, tapped 0 times Bulk density of milk powder, tapped 100 times Bulk density of milk powder, tapped 1250 times Solubility index Total fat content Free fat content Particle density Total N
ESR HLP HAP HBP HLM HAM HBM
FLUOR T450
T532
ELLM HPLCI
HPLC2
MOISTURE DENS0
DENS100
DENS1250
SOLINDEX TOTALFAT FREEFAT
PARTDENS TOTALN
ESRTIME HLPTIME HAPTIME HBPTIME HLMTIME HAMTIME HBMTIME
FLUORTIME T4SOTIME
T532TIME
ELLMTIME HPLCITIME
HPLCZTIME
344 B. R. Nielsen et al.
5 10 15 20 25 30 35 40 45 Storage lime (days)
Fig. 1. Weighted mean sensory scores of the 15 medium- heat milk powders subjected to accelerated storage (T= 50°C a,=0.33) and definition of the shelf-life at sensory scores 8 (SL8) and 6 (SL6) for powder 4 (V).
CORR (significance levels of simple correlations) procedures. Principal variables were calculated with Matlab for Windows, version 4.2c.l (MathWorks, Inc.) according to published procedures (Norgaard, 1995; Hiiskuldsson, 1994). SL8 and SL6 were treated in turn as the dependent variable, with the 35 initial measurements and initial time-dependent changes as independent variables in the stepwise multiple regression variant called maximum R* improvement (SAS Institute, 1987; Draper and Smith, 1981).
RESULTS AND DISCUSSION
Milk powder is produced mainly in countries with temperate climates and intensive agriculture, and a large proportion is exported to tropical countries, where dairy and cooling facilities to handle fresh milk may not be available. During transportation to tropical countries the milk powder may be exposed to extreme heat and humidity, and hence discolouration, oxidation and aroma changes may appear in concert. It has been difficult to predict the shelf-life of milk powder under such conditions, and even at more modest storage temperatures there is no generally accepted standard procedure for doing so, although guidelines have been given (Vallejo-Cordoba and Nakai, 1994). In an attempt to estimate the shelf-life of whole milk powders, we have subjected each of 15 identically processed milk powders to a number of different measurements, which may not be related causally but which may provide a better description of the system when evaluated together. Hence, the choice of relevant variables for regression equations has been guided exclusively by the data and by appropriate statistical methods.
Prediction of shelf-life
The storage times where the milk powder sensory curve crossed the scores 8 (SL8) and 6 (SL6) were two simple but sensible measures of the shelf-life of a given milk powder. Furthermore, SL8 and SL6 might be used for different manufacturing strategies: if a high quality product is demanded, then SLX should be large, because the taste defect of the milk at sensory score 8 is only slight. However, if the taste quality is of less importance but a product with long shelf-life is desired
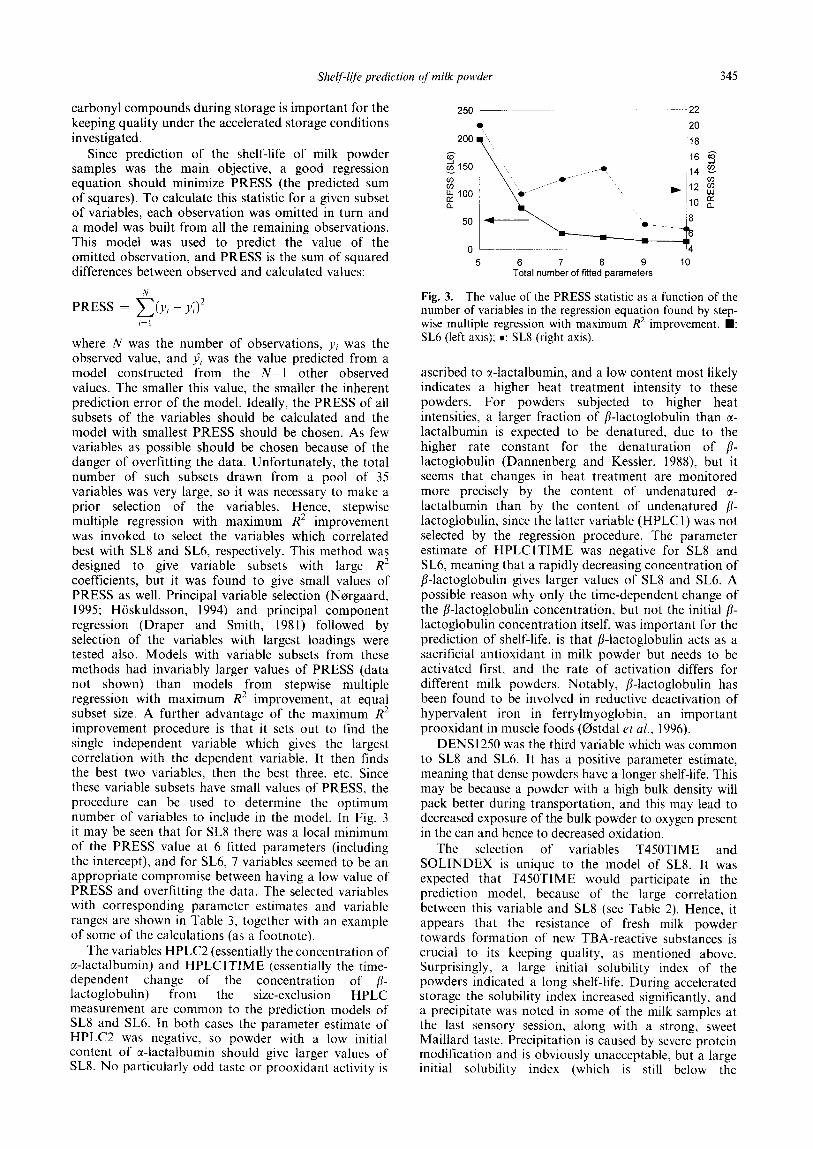
anyway, then it should be ascertained that SL6 is large. From a statistical point of view, although SL6 gave the largest spread and hence the best discrimination between the powders, this variable is probably associated with a rather large uncertainty, because many curves crossed the sensory score 6 several times (see Fig. 1). On the other hand, all the curves crossed the sensory score 8 only once, but the spread among the individual powders is rather small and so may not be significant. Hence, it was decided that a regression analysis of both SL8 and SL6 on the independent variables would be appropriate in order to give a better description of the system. A plot of SL6 versus SL8 is shown in Fig. 2; it is clearly seen that although the majority of the points lay very close to a straight line, powders 6, 11, 13 and 14 deviated, because they had a greater difference between SL8 and SL6 than the remaining milk powders.
Linear regressions of shelf-life against individual variables were determined; significant (P < 0.05) regressions are given in Table 2. Hunter’s 6-value of reconstituted milk had a positive correlation with SL8, i.e. the more yellow the milk, the longer it should keep. SL6 was positively correlated with the bulk density of the tapped powder, i.e. the denser the powder, the longer it will keep. As might be expected, there was a large, positive correlation (0.84) between the bulk density of the powder when it was tapped 100 times and 1250 times, so basically these two measurements gave the same information. The initial time-dependent change of the TBA-reactive substances, expressed as the absorbance increase at 450nm, was the only independent variable which could be used alone to predict both SL8 and SL6. Hence the ability of fresh milk powder to resist formation of new, TBA-reactive
35 -. ~. ---.-
(D : 13 P30, 14 H 6 *_ 7 _.I_ fi
25 ,,..
3
10 12 14 16 la 20 22 2
Shelf lie (days) at score 6
Fig. 2. Plot of SL6 vs SL8 for all 15 milk powders.
Table 2. Significant (P < 0.05) Pearson Product-Moment Correlations (i.e. Simple Linear Regressions) of Initial Measurements and Initial Time-Dependent Changes with
SL8 and SL6
Measurement Measure of shelf-life
SL8 SL6
HBM 0.54* NS DENS100 NS 0.53* DENSI 250 NS 0.58* T450TIME -0.66** -0.56*
NS: Not significant. *: Significantly different from zero at the 0.05 level. **: Significantly different from zero at the 0.01 level.
Shelf-lifr prediction of‘milk powder 345
carbonyl compounds during storage is important for the keeping quality under the accelerated storage conditions investigated.
Since prediction of the shelf-life of milk powder samples was the main objective, a good regression equation should minimize PRESS (the predicted sum of squares). To calculate this statistic for a given subset of variables, each observation was omitted in turn and a model was built from all the remaining observations. This model was used to predict the value of the omitted observation, and PRESS is the sum of squared differences between observed and calculated values:
PRESS = &J, - Y;)2 1-I
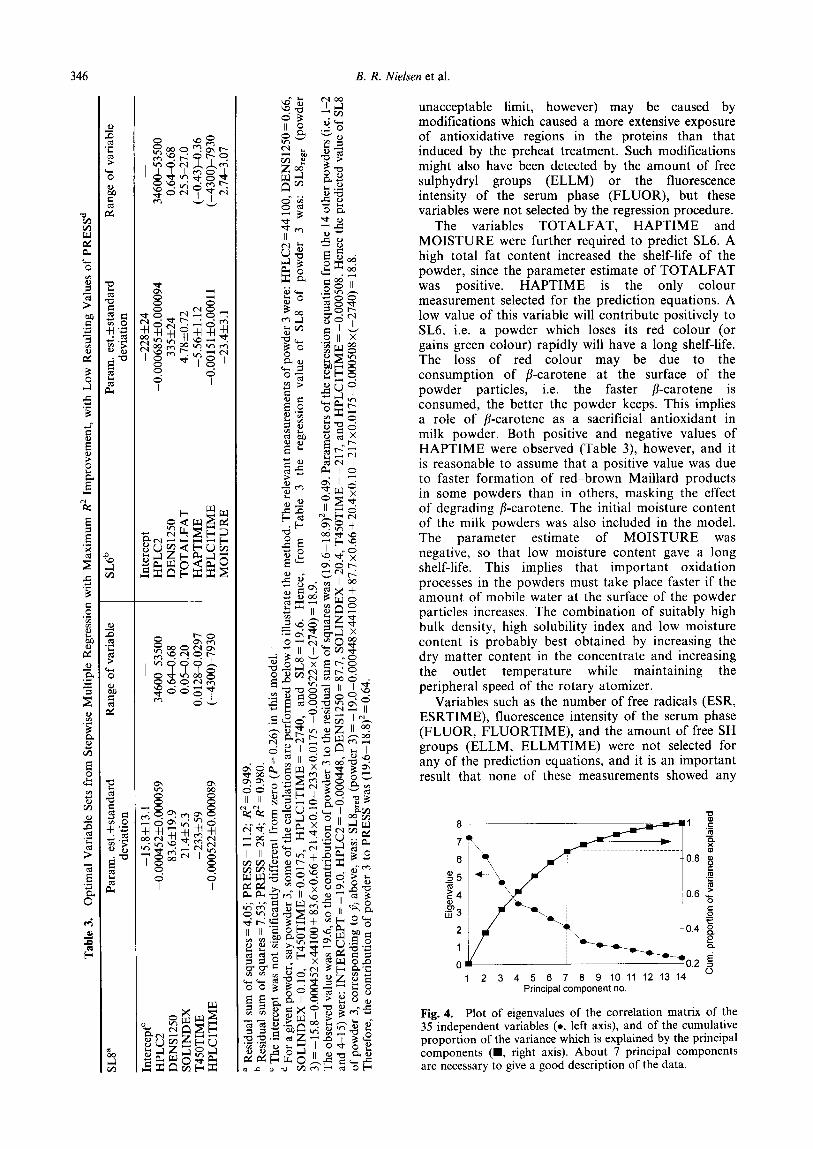
where N was the number of observations, y; was the observed value, and +i was the value predicted from a model constructed from the N-l other observed values. The smaller this value, the smaller the inherent prediction error of the model. Ideally, the PRESS of all subsets of the variables should be calculated and the model with smallest PRESS should be chosen. As few variables as possible should be chosen because of the danger of overfitting the data. Unfortunately, the total number of such subsets drawn from a pool of 35 variables was very large, so it was necessary to make a prior selection of the variables. Hence, stepwise multiple regression with maximum R2 improvement was invoked to select the variables which correlated best with SL8 and SL6, respectively. This method was designed to give variable subsets with large R2 coeflicients, but it was found to give small values of PRESS as well. Principal variable selection (Norgaard, 1995; Hiiskuldsson, 1994) and principal component regression (Draper and Smith, 1981) followed by selection of the variables with largest loadings were tested also. Models with variable subsets from these methods had invariably larger values of PRESS (data not shown) than models from stepwise multiple regression with maximum R2 improvement, at equal subset size. A further advantage of the maximum R’ improvement procedure is that it sets out to find the single independent variable which gives the largest correlation with the dependent variable. It then finds the best two variables, then the best three, etc. Since these variable subsets have small values of PRESS, the procedure can be used to determine the optimum number of variables to include in the model. In Fig. 3 it may be seen that for SL8 there was a local minimum of the PRESS value at 6 fitted parameters (including the intercept), and for SL6, 7 variables seemed to be an appropriate compromise between having a low value of PRESS and overlitting the data. The selected variables with corresponding parameter estimates and variable ranges are shown in Table 3, together with an example of some of the calculations (as a footnote).
The variables HPLC2 (essentially the concentration of x-lactalbumin) and HPLClTIME (essentially the time- dependent change of the concentration of fl- lactoglobulin) from the size-exclusion HPLC measurement are common to the prediction models of SL8 and SL6. In both cases the parameter estimate of HPLC2 was negative, so powder with a low initial content of cc-lactalbumin should give larger values of SL8. No particularly odd taste or prooxidant activity is
5 6 7 8 9 10 Total number of fitted parameters
Fig. 3. The value of the PRESS statistic as a function of the number of variables in the regression equation found by step- wise multiple regression with maximum R* improvement. n : SL6 (left axis); l : SL8 (right axis).
ascribed to a-lactalbumin, and a low content most likely indicates a higher heat treatment intensity to these powders. For powders subjected to higher heat intensities, a larger fraction of /$lactoglobulin than c(- lactalbumin is expected to be denatured, due to the higher rate constant for the denaturation of /J’- lactoglobulin (Dannenberg and Kessler, 1988) but it seems that changes in heat treatment are monitored more precisely by the content of undenatured c(- lactalbumin than by the content of undenatured fi- lactoglobulin, since the latter variable (HPLC 1) was not selected by the regression procedure. The parameter estimate of HPLClTIME was negative for SL8 and SL6, meaning that a rapidly decreasing concentration of b-lactoglobulin gives larger values of SL8 and SL6. A possible reason why only the time-dependent change of the ,&lactoglobulin concentration, but not the initial fi- lactoglobulin concentration itself, was important for the prediction of shelf-life, is that ,!Glactoglobulin acts as a sacrificial antioxidant in milk powder but needs to be activated first, and the rate of activation differs for different milk powders. Notably, B-lactoglobulin has been found to be involved in reductive deactivation of hypervalent iron in ferrylmyoglobin, an important prooxidant in muscle foods (Ostdal et al., 1996).
DENS1 250 was the third variable which was common to SL8 and SL6. It has a positive parameter estimate, meaning that dense powders have a longer shelf-life. This may be because a powder with a high bulk density will pack better during transportation. and this may lead to decreased exposure of the bulk powder to oxygen present in the can and hence to decreased oxidation.
The selection of variables T45OTIME and SOLINDEX is unique to the model of SL8. It was expected that T450TIME would participate in the prediction model, because of the large correlation between this variable and SL8 (see Table 2). Hence, it appears that the resistance of fresh milk powder towards formation of new TBA-reactive substances is crucial to its keeping quality, as mentioned above. Surprisingly, a large initial solubility index of the powders indicated a long shelf-life. During accelerated storage the solubility index increased significantly, and a precipitate was noted in some of the milk samples at the last sensory session, along with a strong, sweet Maillard taste. Precipitation is caused by severe protein modification and is obviously unacceptable, but a large initial solubility index (which is still below the
B. R. Nielsen et al.
unacceptable limit, however) may be caused by modifications which caused a more extensive exposure of antioxidative regions in the proteins than that induced by the preheat treatment. Such modifications might also have been detected by the amount of free sulphydryl groups (ELLM) or the fluorescence intensity of the serum phase (FLUOR), but these variables were not selected by the regression procedure.
The variables TOTALFAT, HAPTIME and MOISTURE were further required to predict SL6. A high total fat content increased the shelf-life of the powder, since the parameter estimate of TOTALFAT was positive. HAPTIME is the only colour measurement selected for the prediction equations. A low value of this variable will contribute positively to SL6, i.e. a powder which loses its red colour (or gains green colour) rapidly will have a long shelf-life. The loss of red colour may be due to the consumption of /?-carotene at the surface of the powder particles, i.e. the faster p-carotene is consumed, the better the powder keeps. This implies a role of B-carotene as a sacrificial antioxidant in milk powder. Both positive and negative values of HAPTIME were observed (Table 3) however, and it is reasonable to assume that a positive value was due to faster formation of red-brown Maillard products in some powders than in others, masking the effect of degrading p-carotene. The initial moisture content of the milk powders was also included in the model. The parameter estimate of MOISTURE was negative, so that low moisture content gave a long shelf-life. This implies that important oxidation processes in the powders must take place faster if the amount of mobile water at the surface of the powder particles increases. The combination of suitably high bulk density, high solubility index and low moisture content is probably best obtained by increasing the dry matter content in the concentrate and increasing the outlet temperature while maintaining the peripheral speed of the rotary atomizer.
Variables such as the number of free radicals (ESR, ESRTIME), fluorescence intensity of the serum phase (FLUOR, FLUORTIME), and the amount of free SH groups (ELLM, ELLMTIME) were not selected for any of the prediction equations, and it is an important result that none of these measurements showed any
1 2 3 4 5 6 7 8 9 10 11 12 13 14 Principal component no.
Fig. 4. Plot of eigenvalues of the correlation matrix of the 35 independent variables (0, left axis), and of the cumulative proportion of the variance which is explained by the principal components (W, right axis). About 7 principal components are necessary to give a good description of the data.
SheljJifi prediction qf milk powder 341
6, I 7 I
F12 6
3
15 E
t 14
!O
ii -2
i
" 5
4 13 m 8 t 1 12
I
4’ I -6
2;
4 -2 0 2 4 6 PCscore 1
4, I
2 -1 t
-2 T
-3 1
4
12
11
8
1 15
5
7 b 9
14 13
2
310 :
6 I
4 I -6 -4 -2 0 2 4
PCscore3
3/ 13
I 2T
C 15 3
I#’ / * 6 1
2 11 io, 4
ii I 12
2 9
-1 14
-2 1
b
7
-3 4 IO
-3 -2 -1 0 1 2 3 4 PCscore 5
PC loading 1
0.8 TsmlYF.
0.6 t HllM e 1
=441 WJW#S
. I HPLC2 HPUl
-0.6 ] ' TU2 tmMllME
-0.8 : -
-0.8 -0.6 -0.4 -0.2 0 0.2 0.4 0.6 0.8 I PC loading 3
0.6 , I
I HAP I -0.4
I -0.6 i i
-0.8 -0.6 -0.4 -0.2 0 0.2 0.4 0.6 PC loading 5
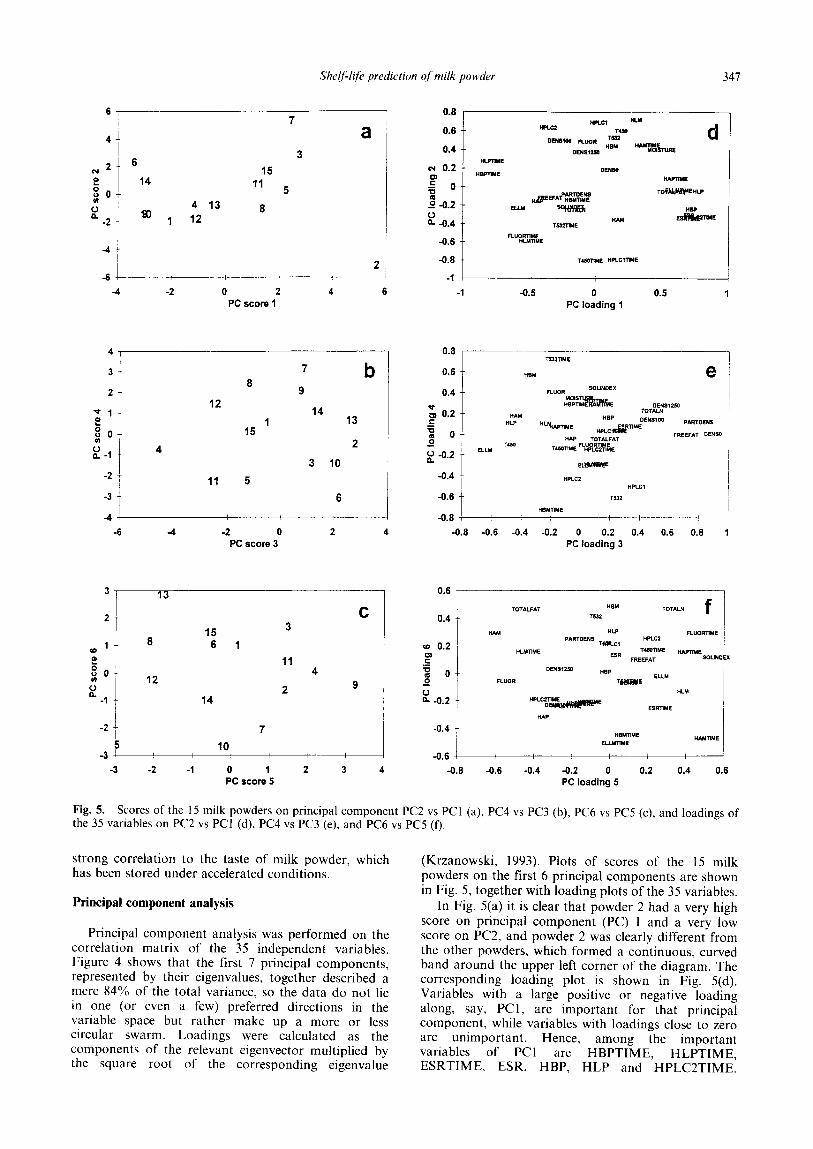
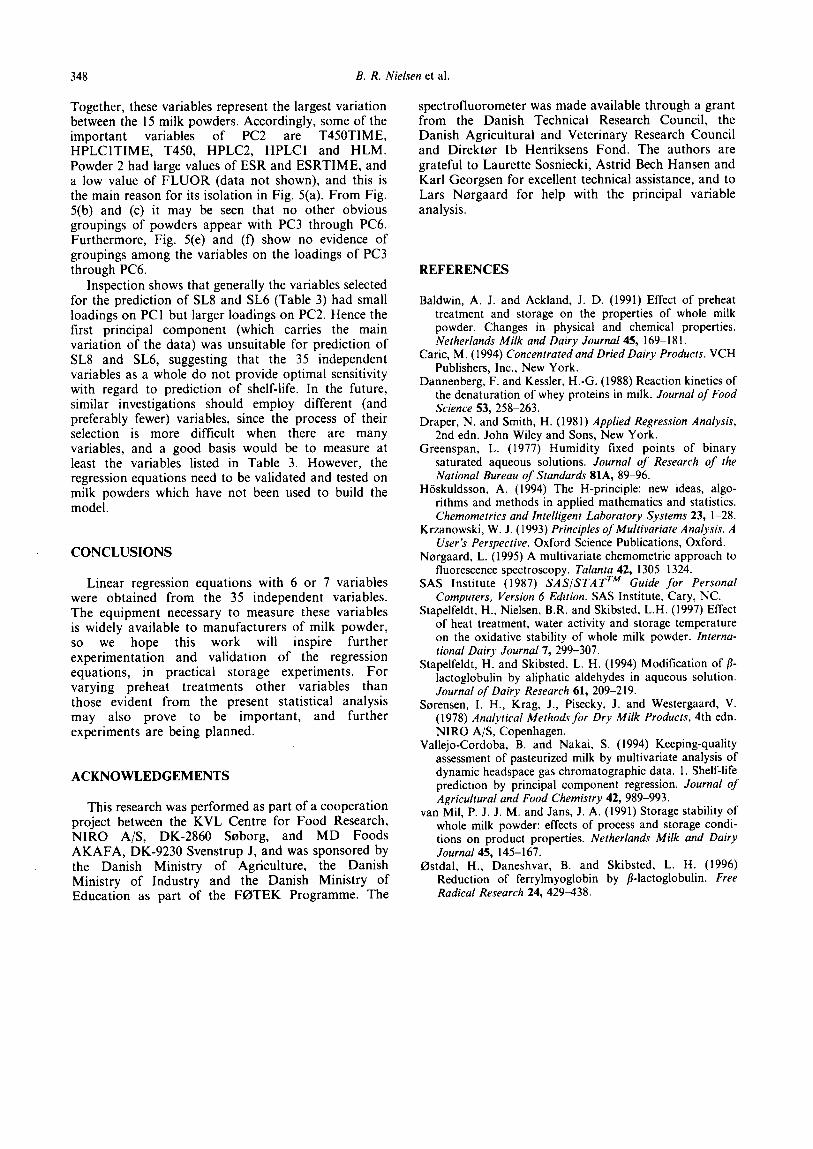
Fig. 5. Scores of the 15 milk powders on principal component PC2 vs PC1 (a), PC4 vs PC3 (b), PC6 vs PC5 (c), and loadings of the 35 variables on PC2 vs PC1 (d), PC4 vs PC3 (e), and PC6 vs PCS (f).
strong correlation to the taste of milk powder, which has been stored under accelerated conditions.
Principal component analysis
Principal component analysis was performed on the correlation matrix of the 35 independent variables. Figure 4 shows that the first 7 principal components, represented by their eigenvalues, together described a mere 84% of the total variance, so the data do not lie in one (or even a few) preferred directions in the variable space but rather make up a more or less circular swarm. Loadings were calculated as the components of the relevant eigenvector multiplied by the square root of the corresponding eigenvalue
(Krzanowski, 1993). Plots of scores of the 15 milk powders on the first 6 principal components are shown in Fig. 5, together with loading plots of the 35 variables.
In Fig. 5(a) it is clear that powder 2 had a very high score on principal component (PC) 1 and a very low score on PC2, and powder 2 was clearly different from the other powders, which formed a continuous, curved band around the upper left corner of the diagram. The corresponding loading plot is shown in Fig. 5(d). Variables with a large positive or negative loading along, say, PCl, are important for that principal component, while variables with loadings close to zero are unimportant. Hence, among the important variables of PC1 are HBPTIME, HLPTIME, ESRTIME, ESR, HBP, HLP and HPLC2TIME.
348 B. R. Nielsen et al.
Together, these variables represent the largest variation between the 15 milk powders. Accordingly, some of the important variables of PC2 are T450TIME, HPLCITIME, T450, HPLC2, HPLCl and HLM. Powder 2 had large values of ESR and ESRTIME, and a low value of FLUOR (data not shown), and this is the main reason for its isolation in Fig. 5(a). From Fig. 5(b) and (c) it may be seen that no other obvious groupings of powders appear with PC3 through PC6. Furthermore, Fig. 5(e) and (f) show no evidence of groupings among the variables on the loadings of PC3 through PC6.
Inspection shows that generally the variables selected for the prediction of SL8 and SL6 (Table 3) had small loadings on PC1 but larger loadings on PC2. Hence the first principal component (which carries the main variation of the data) was unsuitable for prediction of SL8 and SL6, suggesting that the 35 independent variables as a whole do not provide optimal sensitivity with regard to prediction of shelf-life. In the future, similar investigations should employ different (and preferably fewer) variables, since the process of their selection is more difficult when there are many variables, and a good basis would be to measure at least the variables listed in Table 3. However, the regression equations need to be validated and tested on milk powders which have not been used to build the model.
CONCLUSIONS
Linear regression equations with 6 or 7 variables were obtained from the 35 independent variables. The equipment necessary to measure these variables is widely available to manufacturers of milk powder, so we hope this work will inspire further experimentation and validation of the regression equations, in practical storage experiments. For varying preheat treatments other variables than those evident from the present statistical analysis may also prove to be important, and further experiments are being planned.
ACKNOWLEDGEMENTS
This research was performed as part of a cooperation project between the KVL Centre for Food Research, NIRO A/S, DK-2860 Soborg, and MD Foods AKAFA, DK-9230 Svenstrup J, and was sponsored by the Danish Ministry of Agriculture, the Danish Ministry of Industry and the Danish Ministry of Education as part of the F0TEK Programme. The
spectrofluorometer was made available through a grant from the Danish Technical Research Council, the Danish Agricultural and Veterinary Research Council and Direktor Ib Henriksens Fond. The authors are grateful to Laurette Sosniecki, Astrid Beth Hansen and Karl Georgsen for excellent technical assistance, and to Lars Norgaard for help with the principal variable analysis.
REFERENCES
Baldwin, A. J. and Ackland, J. D. (1991) Effect of preheat treatment and storage on the properties of whole milk powder. Changes in physical and chemical properties. Netherlands Milk and Dairy Journal 45, 169-18 I.
Caric, M. ( 1994) Concentrated and Dried Dairy Products. VCH Publishers, Inc., New York.
Dannenberg, F. and Kessler, H.-G. (1988) Reaction kinetics of the denaturation of whey proteins in milk. Journal of Food Science 53, 258-263.
Draper, N. and Smith, H. (1981) Applied Regression Analysis, 2nd edn. John Wiley and Sons, New York.
Greenspan, L. (1977) Humidity fixed points of binary saturated aqueous solutions. Journal of Research of the National Bureau of Standards 81A, 89-96.
Hoskuldsson, A. (1994) The H-principle: new ideas, algo- rithms and methods in applied mathematics and statistics. Chemometrics and Intelligent Laboratory Systems 23, l-28.
Krzanowski, W. J. (1993) Principles of Multivariate Analysis. A User’s Perspective. Oxford Science Publications, Oxford.
Nsrgaard, L. (1995) A multivariate chemometric approach to fluorescence spectroscopy. Talanta 42, 13051324.
SAS Institute (1987) SAS/STATTM Guide for Personal Computers, Version 6 Edition. SAS Institute, Cary, NC.
Stapelfeldt, H., Nielsen, B.R. and Skibsted, L.H. (1997) Effect of heat treatment, water activity and storage temperature on the oxidative stability of whole milk powder. Interna- tional Dairy Journal 7, 299-307.
Stapelfeldt, H. and Skibsted, L. H. (1994) Modification of fl- lactoglobuhn by aliphatic aldehydes in aqueous solution. Journal of Dairy Research 61, 209-219.
Sorensen, I. H., Krag, J., Pisecky, J. and Westergaard, V. (1978) Analytical Methods for Dry Milk Products, 4th edn. NIRO A/S, Copenhagen.
Vallejo-Cordoba, B. and Nakai, S. (1994) Keeping-quality assessment of pasteurized milk by multivariate analysis of dynamic headspace gas chromatographic data. 1. Shelf-life prediction by principal component regression. Journal of Agricultural and Food Chemistry 42, 989-993.
van Mil, P. J. J. M. and Jans, J. A. (1991) Storage stability of whole milk powder: effects of process and storage condi- tions on product properties. Netherlands Milk and Dairy Journal 45, 14% 167.
Ostdal, H., Daneshvar, B. and Skibsted, L. H. (1996) Reduction of ferrylmyoglobin by /I-lactoglobulin. Free Radicul Research 24, 429438.
Copyright © 2022 FDOKUMEN