
RAR-independent RXR signaling induces t(15;17) leukemia cell maturation
Transcriptomics of host-virus interactions:
Immune responses to avian influenza virus in chicken

The research described in this thesis was conducted at the Division of Immunology,
Department of Infectious Diseases and Immunology, Faculty of Veterinary Medicine,
Utrecht University, The Netherlands.
COLOFON
© S. Reemers, 2010. No part of this publication may be reproduced or transmitted without
prior permission of the author.
Published papers were reprinted with permission from the publisher.
ISBN: 978-90-393-5331-8
Cover: Erwin van Hoof - SiteOn - www.siteon.nl
Printed by: Wöhrmann Print Service, Zutphen, The Netherlands.
The research described in this thesis was financed by a BSIK VIRGO consortium grant
(Grant no. 03012), The Netherlands.
The printing of this thesis was financially supported by: Intervet Schering-Plough Animal
Health, Shimadzu and the Infection & Immunity Center Utrecht.

Transcriptomics of host-virus interactions: Immune responses to avian influenza virus in chicken
Transcriptomics van virus-gastheer interacties: Immuunresponsen tegen aviair influenza virus in de kip
(met een samenvatting in het Nederlands)
Proefschrift
ter verkrijging van de graad van doctor aan de Universiteit Utrecht op gezag van de rector magnificus, prof. dr. J C Stoof, ingevolge het besluit van het college voor promoties
in het openbaar te verdedigen op maandag 10 mei 2010 des middags te 12.45 uur
door
Sylvia Samantha Natascha Reemers
geboren op 22 augustus 1978 te Eindhoven

Promotor: Prof. dr. W. van Eden Co-promotor: Dr. ir. L. Vervelde

Contents
Chapter 1 General introduction 7
Chapter 2 Cellular host transcriptional responses to Influenza A virus 23
in chicken tracheal organ cultures differ from responses in
in vivo infected trachea
Chapter 3 Chicken Lung Lectin is a functional C-type lectin and 45
inhibits haemagglutination by Influenza A Virus
Chapter 4 Transcriptional expression levels of chicken collectins 63
are affected by avian influenza A virus inoculation
Chapter 5 Differential gene expression and host response profiles 75
against avian influenza virus within the chicken lung
due to anatomy and airflow
Chapter 6 Lack of immune activation as a correlate of protection 113
after challenge with avian influenza virus:
a transcriptomics analysis of adjuvanted vaccines
Chapter 7 Early host responses to avian influenza A virus are 135
prolonged and enhanced at transcriptional level depending
on maturation of the immune system
Chapter 8 General discussion 167
Summary 181
Nederlandse samenvatting 187
Dankwoord 193
List of abbreviations 198
Curriculum vitae 200


General introduction
Chapter 1


General introduction
9
“Fowl plague” was first described in 1878 as a disease affecting chickens in Italy. In 1902
the causative agent was isolated, though it was not until 1955 that it was identified as a
member of the genus Influenzavirus A belonging to the Orthomyxoviridae family
(Horimoto et al., 2001; Tollis et al., 2002). Today influenza viruses are a major cause of
respiratory infections in both humans and animals and outbreaks are carefully monitored.
Over a time span of 45 years, from 1959-2004, there has been a sharp increase in the
number of outbreaks in poultry worldwide. These range from minor outbreaks to outbreaks
having devastating effects worldwide on human health issues with fear for generation of
new pandemics and on the poultry industry like the Italian 1999-2000, Dutch 2003,
Canadian 2004 and ongoing Asian outbreaks (Capua et al., 2006).
Influenza A virus
Influenza A virus is an enveloped, single stranded RNA virus and the genome consists of 8
negative sensed RNA segments variable in size coding for 10 proteins (Fig. 1). The three
surface proteins are haemagglutin in (HA), neuraminidase (NA) and matrix protein 2 (M2).
The seven internal proteins are matrix protein 1 (M1), nucleoprotein (NP), the polymerase
complex (PB1, PB2 and PA) and non-structural proteins NS1 and NS2. A relatively new
protein was encoded named PB1-F2, which is expressed from a second open reading frame
from PB1 (Chen et al., 2001).
Of the surface proteins, HA and NA are the most prominent features of the viral envelope
and currently 16 HA and 9 NA subtypes are identified which are used to subtype the virus
strains (Fouchier et al., 2005). HA and NA are spike-like proteins embedded in the viral
membrane and play a role in virus attachment, while M2 acts as an ion channel and is
important in the uncoating of the virus in the endosome. Of the internal proteins NP
encapsidates each genomic RNA segment, which associates with the viral polymerase
composed of PB1, PB2 and PA to form the coiled ribonucleoprotein (RNP). The RNP is
linked to the viral envelope via M1, which is associated to both. NS2 is present in small
quantities in the virions where it is associated with the RNP, making NS1, which plays a
critical role in inhibiting the host antiviral defenses, the only true non-structural protein that
is not packed into the virion (Brown, 2000; Horimoto et al., 2001; Tollis et al., 2002; Lee et
al., 2009). PB1-F2 is suggested to be involved in cell death of immune cells which react to
influenza virus infection (Chen et al., 2001).

Chapter 1
10
A. B.
Figure 1. A) Electron microscopy image of Influenza A virus (www.esrf.eu/files/press/ Influenza-Virus.jpg). B)
Schematic overview of an influenza A virion (Horimoto, et al., 2005).
Life cycle
Influenza virus binds to a target cell via an interaction of the HA protein with a sialic acid
linked to galactose by an α-2,3 or α-2,6 linkage on the host cell. Once bound, virions are
internalised in the target cell mainly via clathrin-dependent endocytosis, but entry via
clathrin- and caveolin-independent endocytosis has also been reported and is equally
efficient for viral fusion once the virus is internalized (Lakadamyali et al., 2004). Once
vesicles fuse with endosomes the low pH within the endosome causes a conformational
change of the HA protein exposing the fusion protein leading to fusion of the viral and
endosomal membranes. Through opening of the M2 ion channel protein, the M1 protein is
also exposed to an increased proton concentration. This causes dissociation of M1, which is
associated with the RNPs and the viral envelope, releasing the RNPs into the cytoplasm.
The RNPs are imported into the nucleus where transcription and replication of viral RNA
(vRNA) occurs via the vRNA polymerase consisting of PB1, PB2 and PA (Baigent et al.,
2003). During transcription the vRNA polymerase catalyzes RNA polymerization,
catalyzes polyadenylation of mRNA and cleaves capped host cell RNAs in the nucleus to
generate capped RNA fragments serving as primers for viral mRNA synthesis, which is
called cap-snatching (Shih et al., 1996; Honda et al., 2002). The viral mRNA is translated
in the cytoplasm into viral proteins that are transported into the nucleus. In the nucleus
replicated vRNA binds to newly synthesised polymerase complex, NP and M1 proteins to
form M1-vRNP complexes which are exported to the cytoplasm. Envelop proteins migrate
via the Golgi apparatus to the plasma membrane where they envelop the M1-vRNP
complex to form sialylated progeny virions. During budding of the new virions the NA
protein cleaves the sialic acids leading to the release of mature virions (Baigent et al.,
2003).
General introduction
11
Host range
Members of the influenzavirus A, of which influenza A is the only serotype (Brown, 2000),
infect a wide variety of species like, pigs, birds, horses, minks, seals, whales and humans
often causing serious disease. However, the virus is considered avirulent in the natural hosts
for avian influenza virus, wild waterfowl, gulls and shorebirds, which maintain all subtypes
of HA and NA proteins (Suarez, 2000; Webby et al., 2001; Suzuki, 2005).
Host range restrictions of influenza virus are based on effective entry and replication of the
virus in a specific host. This requires the balanced functions of HA and NA, but also of the
internal proteins. Influenza virus infectivity is mainly influenced by the type of galactose
linkage of the sialic receptor on the host cell to which HA binds and thus also depends on
the distribution of these receptors in the host. Avian influenza viruses prefer α-2,3 linkage,
while human influenza viruses prefer a α-2,6 linkage (Van Riel et al., 2007; Lee et al.,
2009). It was generally believed that avian influenza viruses are limited in their host range
and thus were restricted in their ability to infect humans, although rare interspecies
transmissions have been detected. However, in 1997 an outbreak of 18 human infections in
Hong Kong was caused by avian influenza virus that was directly transmitted to humans
(Ito et al., 2000; Subbarao et al., 2000). Single amino acid substitutions at the receptor
binding site of HA converted avian H5N1 viruses to recognize the human receptor
(Yamada et al., 2006). Through the antigenic variability of influenza A the virus is able to
subvert the immune response. This antigenic variability is obtained due to mutation
(antigenic drift) and reassortment (antigenic shift). The RNA polymerase of influenza has a
low fidelity and also lacks proofreading capacity, which results in a rapid rate of mutation
in the viral genome. Antigenic drift occurs when genes coding for HA and NA undergo
point mutations at the antigenic site of the proteins. This change in antigenicity causes the
annual outbreaks of influenza epidemics and necessity to annually adjust the virus strains in
the influenza vaccine. Antigenic shift occurs when 2 different virus particles, possibly from
different species, co-infect a single target cell. By reassortment of genome segments the
progeny viruses can have RNA segments from both the original viruses. Such a new virus
has the potential to cause a pandemic (Parvin et al., 1986; Zambon, 1999; Horimoto et al,
2001).
Pathogenicity in chickens
The disease caused by avian influenza viruses infecting poultry ranges from asymptomatic
infection to acute, fatal disease. According to their ability to cause disease in chickens avian
influenza viruses can be divided into two groups, highly pathogenic avian influenza (HPAI)
and low pathogenic avian influenza (LPAI). HA protein has a key role in influenza virus
pathogenicity since proteolytic cleavage of HA precursor by host proteases is essential for

Chapter 1
12
viral infectivity. HA of HPAI viruses are cleaved by ubiquitous proteases which are present
in a wide range of host organs thus supporting systemic infection, while HA of LPAI
viruses are thought to be cleaved by proteases localized mostly in respiratory and intestinal
organs resulting in mild or asymptomatic infection.
HPAI viruses are very virulent viruses in which mortality rates may approach 100% and
appear to be pantropic with respect to systemic virus replication and ability to produce
gross lesions. The most severe lesions result in inflammation, haemorrhage with necrosis
and cellular death of skin, brain, heart, adrenal gland, pancreas and other visceral organs
(Tollis et al., 2002). Post-mortem examination revealed oedema of the head and upper part
of the neck, presence of bile-green mucous liquid in the oral cavity and oesophagus,
pancreatitis, congestion of internal organs, occasionally necrotic foci in the spleen and
hemorrhagic cecal tonsils and in some cases urate deposits in the kidney could be seen
(Mutinelli et al., 2003). These viruses have been restricted to subtypes H5 and H7 and have
a preference for infecting the lower respiratory tract (Alexander, 2000; Horimoto et al.,
2005).
LPAI viruses cause milder infections and appear to be restricted in their capability for
replication and production of lesions in individual organs and tissues (Alexander, 2000;
Tollis et al., 2002; Horimoto et al., 2005). Lesions were detected in the ovary and oviduct
with colliquation of ovarian follicles and congestion of the lung and trachea (Mutinelli et
al., 2003). LPAI viruses seem more transmissible from infected to susceptible birds than
HPAI viruses. This is probably due to the rapid death of birds infected with HPAI virus,
which reduces the amount of virus excreted, and the preference of LPAI virus for infecting
the upper part of the respiratory tract, increasing the transmission via aerosols breath or
coughing (Tollis et al., 2002).
Avian respiratory tract
The structure and airflow of the avian respiratory system is unique among vertebrates.
Birds have rather small, rigid lungs compared to the large, flexible lungs of mammals. They
lack a diaphragm and instead use airsacs that act like bellows to ventilate the lungs. The
trachea bifurcates at the syrinx into the primary bronchus, like in mammals, and runs
throughout the entire length of the lungs, exiting into the ostium of the abdominal airsacs.
Four groups of secondary bronchi (medioventral, lateroventral, mediodorsal and
laterodorsal) originate from the primary bronchus. Branching off from the secondary
bronchi are the parabronchi that connect the dorsal and ventral secondary bronchi (Fig. 2A).
The parabronchi, like the alveoli in mammals, are surrounded by a network of blood
capillaries and are the functional units of gas exchange in the lung (Duncker, 1974; Reese
et al., 2006).

General introduction
13
Air enters the respiratory tract via the trachea and flows into the lung via the primary
bronchus. While the airflow in mammals is two directional, birds have a unidirectional
airflow which is driven by difference in pressure throughout the respiratory tract. During
inspiration the posterior and anterior airsacs expand lowering the pressure. This causes the
air to flow from the trachea and bronchi into the posterior airsacs, simultaneously, flowing
into the lung through the parabronchi into the anterior airsacs (Fig. 2B). During expiration
the volume of the posterior and anterior airsacs is reduced. This causes the air to flow out of
the posterior airsacs into the lung through the parabronchi, simultaneously air from the
anterior airsacs flows into the trachea out of the body (Fig. 2C). The advantage of this
unidirectional airflow is that birds constantly have oxygen rich air in their lungs (Duncker,
1974; Reese et al., 2006).
Besides its primary function for gas exchange, the respiratory tract is a barrier between the
external and internal environment. In the lung highly organised lymphoid structures and
diffusely distributed lymphoid cells are present. Lymphoid nodules, named bronchus
associated lymphoid tissue (BALT), in the lung have much similarity with Peyer’s patches
in the gut (Kothlow et al., 2008). BALT is located at the bifurcations of primary bronchus
into secondary bronchi (Fig. 2A) and is influenced by age and environmental stimuli like
infection. BALT is not observed before 2-3 weeks after hatching and develops into mature
structures found in 6-8 week old birds. Distinct T cell and B cell areas and frequently
germinal centres are displayed covered by characteristic follicle-associated epithelium
(FAE). The FAE consist of ciliated and non-ciliated cells of which the numbers differ
according to the age of the bird in that the FAE of older birds consists of more ciliated cells.
Cells displaying some features similar to M-cells in the gut have been described, but
particle uptake by these cells has not been seen. The germinal centre is mainly made up by
IgM+ B cells, while smaller numbers of IgY+ and IgA+ B cells are present. CD4+ T cells
cover the germinal centre, while CD8+ T cells are diffusely distributed between the
lymphoid nodules (Jeurissen et al., 1994; Reese et al., 2006; Kothlow et al., 2008).
A. B. Inspiration C. Expiration
Figure 2. A) Schematic representation of the right avian lung showing the main bronchi. Red dots mark the
localization of the BALT nodules in the primary bronchus. Legend: PB primary bronchus; 1: medioventral
secondary bronchi; 2: mediodorsal secondary bronchi; 3: lateroventral secondary bronchi; A: ostium to the
clavicular air sac; B: ostium to the cranial thoracis air sac; C: ostium to the caudal thoracis air sac; D: ostium to the
6
1
2
3
54
1
2
3
5
6
4

Chapter 1
14
abdominal air sac. (Reprinted from “The avian lung-associated immune system: a review”, Vol. 37, S. Reese et al.,
p. 313, 2006, with permission from EDP Sciences). Schematic representation of airflow through the avian lung
during B) inspiration and C) expiration. Legend: 1. Primary bronchus, 2. lung, 3. clavicular air sac, 4. cranial
thoracic air sac, 5. caudal thoracic air sac, 6. abdominal air sac. (Adapted and reprinted from “Avian
Immunology”, first edition 2008, Kothlow S. et al., chapter 14, The Avian Respiratory immune system, 2008, with
permission from Elsevier).
Early immune response in the respiratory tract
Although adaptive responses are important for the control and clearance of AIV infection,
innate responses are critical for blocking of virus entry and virus replication, and for the
induction of virus specific adaptive responses (Fig. 3). Virus entry in the respiratory tract is
blocked by several mechanisms. Mucus on top of the epithelial cells is the first barrier that
blocks virus entry by trapping the virus, which together with the mucus is transported out of
the respiratory tract by the constant movement of cilia. Neutralizing components located in
the mucus like secretory IgA (sIgA), complement molecules, collectins or antimicrobial
peptides such as β-defensins, also block virus entry. sIgA has been shown to neutralize
influenza virus infectivity in both mammals and chicken (Taylor et al., 1985; Tamura et al.,
2004). Both mammalian collectins and defensins have neutralizing activity against
influenza (Hartshorn et al., 1997; Klotman et al., 2006), but for chicken collectins
(Hogenkamp et al., 2006) and β-defensins, which are named gallinacins (Xiao et al., 2004)
this has not been clarified yet. Complement molecules become activated by binding directly
to the virus or to an antibody-virus complex or by hydrolysis of C3 (Favoreel et al., 2003).
This leads to the activation of the complement cascade inducing inflammatory responses,
enhancing phagocytosis of the antigens and enhancing cytolysis of target cells.
When virus entry is not successfully blocked, AIV will infect the epithelial cells resulting in
the production of pro-inflammatory cytokines such as IL-1β and IL-6, chemokines such as
CXCLi2 (IL-8) and RANTES, and interferons IFN-α and -β (Julkunen et al., 2000). This
attracts macrophages and DC to the place of infection, which upon activation or AIV
infection also start producing cytokines and chemokines attracting more antigen presenting
cells (APC) but also heterophils, T cells, B cells and natural killer (NK) cells. IL-18
produced by APC can prime T cells and NK cells for IFN-γ production (Julkunen et al.,
2001).
Influenza virus that passes the epithelial cells is recognized by Toll-like receptors (TLRs)
which are pattern recognition receptors that recognize pathogen-associated molecular
patterns (PAMP). Upon recognition of PAMP, the TLR signalling pathway is activated
leading to production of pro-inflammatory cytokines, chemokines, IFN-α and -β. TLR-
activated DC mature and can activate naïve T cells via antigen presentation on MHC in
combination with co-stimulatory molecules such as CD80 and CD86 thereby inducing an

General introduction
15
adaptive response (Lee et al., 2007). In mammals TLR3, TLR7, TLR8 and TLR9 recognize
viral nucleic acids of which dsRNA is recognized by TLR3, ssRNA by TLR7 and TLR8,
while TLR9 recognizes viral DNA (Kawai et al., 2008). TLR3, TLR7 and TLR8 have been
directly implicated in influenza infection in mice (Sen et al., 2005). TLR9 has not, however
TLR9-agonists are assumed to play an potential role in protection against influenza virus
infection (Wong et al., 2009). In chickens, TLR3, TLR7 and TLR8 are found of which
TLR8 is disrupted and non-functional. No TLR9 orthologue is found although chickens
respond to TLR9-agonists (Juul-Madsen et al., 2008; Jenkins et al., 2009). Two TLR7
splice variants, TLR15 and TLR21, are speculated to elicit the response to TLR9 ligands
(Philbin et al., 2005; Jenkins et al., 2009). Several studies report that TLR expression in
chicken is affected by influenza infection and imply induction of anti-viral responses via
TLR signalling triggered by influenza virus infection (Degen et al., 2006; Karpala et al.,
2008; Xing et al., 2008).
Figure 3. Early immune responses to AIV infection in the respiratory tract.
Influenza viruses have evolved strategies to ensure their survival in the host. Influenza virus
can directly interfere with IFN-γ-stimulated signal transduction via the Jak/Stat pathway
and enables the virus to inhibit IFN-γ-inducible gene expression of MHC class II (Uetani et
al., 2008). Viral NS1 protein is a tri-functional viral immunosuppressor. Innate immunity is
Interferons IFN-α IFN-β
Antiviral effect
Influenza A virus
Mucus
Epithelial cells
IgA Collectins
Chemokines RANTES IL-
8
Chemokines RANTES MIP-3α MIP-1β
Cytokines IL-1β IL-6
IL-18
Macrophage Dendritic cell
NK cell
T cell
B cell
Chemotatic effect
Interferons IFN-α IFN-β
Proinflammatory effect
IFN-γ production

Chapter 1
16
inhibited due to binding of NS1to RIG-I which inhibits activation of IRF-3 blocking the
transcription of IFN-β (Mibayashi et al., 2007), while inhibition of NF-κB by NS1 blocks
induction of both IFN-α and -β (Wang et al., 2000). Furthermore, NS1 inhibits adaptive
immunity by attenuating human DC maturation and the capacity of DC to induce T-cell
responses (Fernandez-Sesma et al., 2006) and NS1 is able to block apoptosis via inhibition
of caspase 9 (Ehrhardt et al., 2007). Besides blocking host responses influenza viruses also
use host proteins for virus replication and transcription. Viral factors such as the
polymerase complex, RNP and NP are known to interact with cellular factors such as
histones, the cytoskeleton and importins. These cellular factors are not only used for viral
RNA synthesis, but are also implicated in processes needed for virus replication such as
import and export of viral factors from the nucleus and transport to the cell membrane
(Engelhardt et al., 2006; Naffakh et al., 2008; Nagata et al., 2008). Efficient infection by
influenza viruses thus depends on the ability of the virus to interact with host factors needed
for virus replication and counteracting host defense responses.
Control of avian influenza virus outbreaks
Influenza outbreaks in humans and animals have been reported with increased frequency in
recent years and LPAI H5 and H7 viruses have the property to become HPAI viruses during
circulation in poultry. Therefore much research is conducted on improving surveillance and
diagnostic methods and development of antiviral drugs and effective vaccines. Poultry
vaccines preferably provide a broad protection against different influenza virus strains,
especially HPAI strains, provide clinical protection and prevent transmission to achieve
efficient control of the disease. In order to induce protection, a vaccine has to give a desired
type of adaptive response which is mostly a combination between humoral and cell-
mediated immunity. Neutralizing antibodies against HA or NA protein provide immediate
protection against influenza virus infection by reducing infectivity or restricting replication
, while viral clearance mainly depends on cell-mediated immunity. Due to the mutation rate
of influenza virus strains humoral immunity is poorly protective against antigenic drift
variants of strains to which immunity was originally obtained. Cytotoxic T lymphocytes
recognize epitopes of NP, PB2 and PA proteins which are highly conserved among
influenza strains. Therefore cell-mediated immunity against these epitopes could protect
against infection of various influenza strains (Subbarao et al., 2007; Van den Berg et al.,
2008).
The type of response induced by a vaccine largely depends on the composition of the
antigen and the type of adjuvant present in the vaccine. There are several vaccines licensed
for poultry; inactivated vaccines, reverse genetics inactivated vaccines and vector based
vaccines (Swayne, 2008; Van den Berg et al., 2008). Inactivated vaccines contain whole
influenza virus which is chemically or physically inactivated. For poultry homologous (HA
General introduction
17
and NA subtype similar to the field strain) or heterologous (same HA but different NA
subtype) inactivated vaccines are used. Inactivated vaccines induce large cross-protection
against diverse field strains in poultry in contrast to humans. Reverse genetics inactivated
vaccines are created in cell lines using plasmid based techniques. The backbone of the virus
is made with 6 plasmids containing the sequence of the internal proteins. Together with two
plasmids containing the sequence of the HA and NA protein of the circulating strain, all
plasmids are co-transfected in appropriate cell lines. Recombinant virus is isolated and
inactivated. For this type of vaccine a homologous H5N1 and heterologous H5N3 are
licensed and used in traditional oil emulsified inactivated vaccines in poultry (Swayne,
2008; Van den Berg et al., 2008). Vector based vaccines use a virus, bacterial or plasmid
DNA as a vector to deliver protective proteins. For chickens, vectors based on fowlpox
virus and Newcastle Disease Virus (NDV) containing influenza virus H5 protein sequences
are licensed (Swayne, 2008; Van den Berg et al., 2008).
The inactivated virus is associated with an adjuvant to increase the immunogenicity of the
vaccine. In poultry, adjuvants like oil emulsions, for example water-in-oil (w/o),
aluminium-based formulations, such as aluminium hydroxide, and nonmethylated CpG
oligonucleotides (CpG) are used of which CpG is not commercially available but used for
experimental purposes (Hilgers et al., 1998; Spickler et al., 2003; Wang, et al., 2009).
Oil emulsions and aluminium-based adjuvants are known to generally induce a Th2
response (Hogenesch, 2002; Hilgers et al., 1998), but oil emulsions may also be capable of
activating CTL under certain conditions (Spickler et al., 2003). In mammals it is assumed
that oil emulsions and aluminium-based formulations act as a depot slowly releasing the
antigen at the site of injection, although actual mechanisms are still under debate
(Aucouturier et al., 2001; Marrack et al., 2009). Both types of adjuvants are able to induce
inflammation stimulating recruitment of eosinophils, neutrophils, APC and lymphocytes
and enhance antigen uptake and activation of APC (Aucouturier et al., 2001; Marrack et al.,
2009). Aluminium salts and oil emulsions do not act directly on dendritic cells (DC), but
they promote a pro-inflammatory environment which may indirectly activate DC in a TLR
independent manner (Tritto et al., 2009). In chickens immunisation of inactivated NDV
with an aluminium-based adjuvants caused proliferation and accumulation of macrophages
(Yamanaka et al., 2003). Vaccination of birds against O. rhinotracheale using w/o or
aluminium salts inhibits pathology of the airways and results in an increased HI titre
(Murthy et al., 2007), and birds vaccinated with a w/o adjuvanted inactivated H5N1 vaccine
had an increased HI titer, a strong secondary antibody response as shown by a high HI titer
after challenge and were protected from clinical signs and mortality (Sasaki et al., 2009).
CpG induces a Th1 like response inducing APC function and the production of cytokines
and chemokines supportive for antigen specific immunity in mammals (Dalpke et al., 2001;
Klinman, et al., 2004). CpG acts directly on DC in a TLR dependent manner (Ishii et al.,

Chapter 1
18
2007). Addition of CpG to H5N1 AIV vaccines induces a protective response in chickens
with enhanced antigen specific antibody production, increased HI titre and IFN-γ and a
decreased IL-10 protein concentration in serum (Wang, et al., 2009). Birds immunised with
NDV vaccine adjuvanted with CpG, showed virus-specific antibodies, stronger PBMC
proliferation and protection against clinical signs and mortality to NDV challenge
(Linghua, et al., 2007).
Scope of the thesis
Influenza virus infection is one of the major causes of respiratory disease in both humans
and animals. Although much research is performed to elucidate the course of events that
follow AIV infection, the interaction between the virus and the host at molecular and
cellular level at an early stage of infection is unclear. The aim of this thesis is to gain
insight in early host responses after primary avian influenza virus infection and viral
challenge in immunised chickens at host transcriptional level. Elucidating mechanisms
involved in innate and specific immune responses may contribute to a better understanding
of influenza virus induced pathology and to new concepts for vaccine development.
To define early immune responses to avian influenza virus infection, gene expression of
immune-related genes in epithelial cells after exposure to avian influenza virus was studied
in vitro. Since no chicken epithelial cell line was available we used tracheal organ cultures
(TOC) as an in vitro infection model. In chapter 2 we determined early immune responses
to infection with avian influenza virus H9N2 in TOC. We also assessed whether TOC was a
suitable model to study early immune responses to avian influenza infection in vitro at host
transcriptional level by comparing early immune responses in TOC with early immune
response in in vivo infected trachea.
Part of the early innate response are collectins, which for mammalians have been described
to have strong neutralizing activity against influenza A virus in vitro. In chapter 3 we
investigated whether recombinant chicken collectin cLL has a similar protective capacity
and was able to inhibit in vitro H9N2 infection of TOC. Since mammalian collectins are
implicated to play an important role in the innate defense to influenza A virus infection in
vivo, we also studied in vivo whether chicken collectins could play a similar role during
H9N2 infection in chickens in chapter 4. Furthermore, the possible effect of age on chicken
collectin expression was determined.
Gene expression patterns after H9N2 infection in primary infected chickens and in
immunised chickens after viral challenge were studied in vivo to define early host responses
throughout the respiratory tract and to define correlates of protection. To be able to study
immune responses in the respiratory tract we first had to know where the virus was located.
It was unknown if the virus is distributed equally within the respiratory tract and whether

General introduction
19
possible differences affect local immune responses. Therefore, the effect of differences in
anatomy and airflow in the lung and the trachea on gene expression, virus distribution and
subsequently host responses was studied in uninfected and H9N2 infected chickens in
chapter 5. Once the distribution of the virus in the respiratory tract was determined we
focused on early host responses throughout the respiratory tract. Avian influenza virus
infection triggers innate responses, which the virus tries to inhibit. However, the virus also
uses certain host factors for replication and transcription as described in mammals. In
chapter 6 we determined early host responses to H9N2 infection and analysed the effect of
host-factor hijacking by the virus on host gene expression. Since differences in maturity of
the immune system may affect innate responses, 1-week and 4-week-old birds were used.
After defining early host responses in primary infected birds we aimed at defining
correlates of protection after challenge of birds vaccinated with various adjuvants.
Vaccination can provide protection to avian influenza virus infections. However, adjuvants
stimulate the immune response via different mechanisms and may provide protection via
different response patterns. In chapter 7 we aimed at getting a better understanding of the
characteristics of these response patterns and determining correlates of protection.
References
1. Alexander, D.J., 2000. A review of avian influenza in different bird species. Vet. Microbiol. 74, 3-13.
2. Aucouturier, J., Dupuis, L., Ganne, V., 2001. Adjuvants designed for veterinary and human vaccines.
Vaccine 19, 2666-2672.
3. Baigent, S.J., McCauley, J.W., 2003. Influenza type A in humans, mammals and birds: determinants of
virus virulence, host-range and interspecies transmission. Bioessays 25, 657-671.
4. Brown, E.G., 2000. Influenza virus genetics. Biomed. Pharmacother. 54, 196-209.
5. Capua, I., Alexander, D.J., 2006. The challenge of avian influenza to the veterinary community. Avian
Pathol. 35, 189-205.
6. Chen, W., Calvo, P.A., Malide, D., Gibbs, J., Schubert, U., Bacik, I., Basta, S., O'Neill, R., Schickli, J.,
Palese, P., Henklein, P., Bennink, J.R., Yewdell, J.W., 2001. A novel influenza A virus mitochondrial
protein that induces cell death. Nat. Med. 7, 1306-1312.
7. Dalpke, A., Zimmermann, S., Heeg, K., 2001. CpG-oligonucleotides in vaccination: signaling and
mechanisms of action. Immunobiology 204, 667-676.
8. Degen, W.G., Smith, J., Simmelink, B., Glass, E.J., Burt, D.W., Schijns, V.E., 2006. Molecular
immunophenotyping of lungs and spleens in naive and vaccinated chickens early after pulmonary avian
influenza A (H9N2) virus infection. Vaccine 24, 6096-6109.
9. Duncker, H.R., 1974. Structure of the avian respiratory tract. Respir. Physiol. 22, 1-19.
10. Ehrhardt, C., Wolff, T., Pleschka, S., Planz, O., Beermann, W., Bode, J.G., Schmolke, M., Ludwig, S.,
2007. Influenza A virus NS1 protein activates the PI3K/Akt pathway to mediate antiapoptotic signaling
responses. J. Virol. 81, 3058-3067.
11. Engelhardt, O.G., Fodor, E., 2006. Functional association between viral and cellular transcription
during influenza virus infection. Rev. Med. Virol. 16, 329-345.
12. Favoreel, H.W., Van de Walle, G.R., Nauwynck, H.J., Pensaert, M.B., 2003. Virus complement
evasion strategies. J. Gen. Virol. 84, 1-15.

Chapter 1
20
13. Fernandez-Sesma, A., Marukian, S., Ebersole, B.J., Kaminski, D., Park, M.S., Yuen, T., Sealfon, S.C.,
Garcia-Sastre, A., Moran, T.M., 2006. Influenza virus evades innate and adaptive immunity via the
NS1 protein. J. Virol. 80, 6295-6304.
14. Fouchier, R.A., Munster, V., Wallensten, A., Bestebroer, T.M., Herfst, S., Smith, D., Rimmelzwaan,
G.F., Olsen, B., Osterhaus, A.D., 2005. Characterization of a novel influenza A virus hemagglutinin
subtype (H16) obtained from black-headed gulls. J. Virol. 79, 2814-2822.
15. Hartshorn, K.L., White, M.R., Shepherd, V., Reid, K., Jensenius, J.C., Crouch, E.C., 1997.
Mechanisms of anti-influenza activity of surfactant proteins A and D: comparison with serum
collectins. Am. J. Physiol. 273, L1156-1166.
16. Hilgers, L.A., Nicolas, I., Lejeune, G., Dewil, E., Boon, B., 1998. Effect of various adjuvants on
secondary immune response in chickens. Vet. Immunol. Immunopathol. 66, 159-171.
17. Hogenesch, H., 2002. Mechanisms of stimulation of the immune response by aluminum adjuvants.
Vaccine 31, S34-39.
18. Hogenkamp, A., van Eijk, M., van Dijk, A., van Asten, A.J., Veldhuizen, E.J., Haagsman, H.P., 2006.
Characterization and expression sites of newly identified chicken collectins. Mol. Immunol. 43, 1604-
1616.
19. Honda, A., Mizumoto, K., Ishihama, A., 2002. Minimum molecular architectures for transcription and
replication of the influenza virus. Proc. Natl. Acad. Sci. U. S. A. 99, 13166-13171.
20. Horimoto, T., Kawaoka, Y., 2001. Pandemic threat posed by avian influenza A viruses. Clin.
Microbiol. Rev. 14, 129-149.
21. Horimoto, T., Kawaoka, Y., 2005. Influenza: lessons from past pandemics, warnings from current
incidents. Nat. Rev. Microbiol. 3, 591-600.
22. Ishii, K.J., Akira, S., 2007. Toll or toll-free adjuvant path toward the optimal vaccine development. J.
Clin. Immunol. 4, 363-371.
23. Ito, T., Kawaoka, Y., 2000. Host-range barrier of influenza A viruses. Vet. Microbiol. 74, 71-75.
24. Jenkins, K.A., Lowenthal, J.W., Kimpton, W., Bean, A.G., 2009. The in vitro and in ovo responses of
chickens to TLR9 subfamily ligands. Dev. Comp. Immunol. 33, 660-667.
25. Jeurissen, S., Vervelde, L., Janse, E., 1994, Structure and function of lymphoid tissues of chicken.
Poultry Science Rev. 5, 183-207.
26. Julkunen, I., Sareneva, T., Pirhonen, J., Ronni, T., Melen, K., Matikainen, S., 2001. Molecular
pathogenesis of influenza A virus infection and virus-induced regulation of cytokine gene expression.
Cytokine Growth Factor Rev. 12, 171-180.
27. Juul-Madsen, H.R., Viertlboeck, B., Smith, A.L., Göbel, T., 2008. Avian innate immune responses. In
Avian Immunology (eds F. Davison, B. Kaspers and K.A. Schat), pp 129-158. Academic Press,
London.
28. Karpala, A.J., Lowenthal, J.W., Bean, A.G., 2008. Activation of the TLR3 pathway regulates IFNbeta
production in chickens. Dev. Comp. Immunol. 32, 435-444.
29. Kawai, T., Akira, S., 2008. Toll-like receptor and RIG-I-like receptor signaling. Ann. N. Y. Acad. Sci.
1143, 1-20.
30. Klinman, D.M., Currie, D., Gursel, I., Verthelyi, D., 2004. Use of CpG oligodeoxynucleotides as
immune adjuvants. Immunol. Rev. 199, 201-216.
31. Klotman, M.E. and Chang, T.L., 2006. Defensins in innate antiviral immunity. Nat. Rev. Immunol. 6,
447-546.
32. Kothlow, S. and Kaspers, B., 2008. The avian respiratory immune system. In Avian Immunolgy (eds F.
Davison, B. Kaspers and K.A. Schat), pp 273-298. Academic Press, London.
33. Lakadamyali, M., Rust, M.J., Zhuang, X., 2004. Endocytosis of influenza viruses. Microbes Infect. 6,
929-936.

General introduction
21
34. Lee, C.W., Saif, Y.M., 2009. Avian influenza virus. Comp. Immunol. Microbiol. Infect. Dis. 32, 301-
310.
35. Lee, M.S., Kim, Y.J., 2007. Signaling pathways downstream of pattern-recognition receptors and their
cross talk. Annu. Rev. Biochem. 76, 447-480.
36. Linghua, Z., Xingshan, T., Fengzhen, Z., 2007. Vaccination with Newcastle disease vaccine and CpG
oligodeoxynucleotides induces specific immunity and protection against Newcastle disease virus in
SPF chicken. Vet. Immunol. Immunopathol. 115, 216-222.
37. Marrack, P., McKee, A.S., Munks, M.W., 2009. Towards an understanding of the adjuvant action of
aluminium. Nat. Rev. Immunol. 9, 287-293.
38. Mibayashi, M., Martinez-Sobrido, L., Loo, Y.M., Cardenas, W.B., Gale, M., Jr., Garcia-Sastre, A.,
2007. Inhibition of retinoic acid-inducible gene I-mediated induction of beta interferon by the NS1
protein of influenza A virus. J. Virol. 81, 514-524.
39. Murthy, T.R., Dorairajan, N., Balasubramaniam, G.A., Dinakaran, A.M., Kalaimathi, R., 2007. The
effect of vaccination of pullets against Ornithobacterium rhinotracheale infection. Avian Pathol. 36,
481-485.
40. Mutinelli, F., Capua, I., Terregino, C., Cattoli, G., 2003. Clinical, gross, and microscopic findings in
different avian species naturally infected during the H7N1 low- and high-pathogenicity avian influenza
epidemics in Italy during 1999 and 2000. Avian Dis. 47, 844-848.
41. Naffakh, N., Tomoiu, A., Rameix-Welti, M.A., van der Werf, S., 2008. Host restriction of avian
influenza viruses at the level of the ribonucleoproteins. Annu. Rev. Microbiol. 62, 403-424.
42. Nagata, K., Kawaguchi, A., Naito, T., 2008. Host factors for replication and transcription of the
influenza virus genome. Rev. Med. Virol. 18, 247-260.
43. Parvin, J.D., Moscona, A., Pan, W.T., Leider, J.M., Palese, P., 1986. Measurement of the mutation
rates of animal viruses: influenza A virus and poliovirus type 1. J. Virol. 59, 377-383.
44. Philbin, V.J., Iqbal, M., Boyd, Y., Goodchild, M.J., Beal, R.K., Bumstead, N., Young, J., Smith, A.L.,
2005. Identification and characterization of a functional, alternatively spliced Toll-like receptor 7
(TLR7) and genomic disruption of TLR8 in chickens. Immunology 114, 507-521.
45. Reese, S., Dalamani, G., Kaspers, B., 2006. The avian lung-associated immune system: a review. Vet.
Res. 37, 311-324.
46. Sasaki, T., Kokumai, N., Ohgitani, T., Sakamoto, R., Takikawa, N., Lin, Z., Okamatsu, M., Sakoda, Y.,
Kida, H., 2009. Long lasting immunity in chickens induced by a single shot of influenza vaccine
prepared from inactivated non-pathogenic H5N1 virus particles against challenge with a highly
pathogenic avian influenza virus. Vaccine 27, 5174-5177.
47. Sen, G.C., Sarkar, S.N., 2005. Transcriptional signaling by double-stranded RNA: role of TLR3.
Cytokine Growth Factor Rev. 16, 1-14.
48. Shih, S.R., Krug, R.M., 1996. Surprising function of the three influenza viral polymerase proteins:
selective protection of viral mRNAs against the cap-snatching reaction catalyzed by the same
polymerase proteins. Virology 226, 430-435.
49. Spickler, A.R., Roth, J.A., 2003. Adjuvants in veterinary vaccines: modes of action and adverse effects.
J. Vet. Intern. Med. 17, 273-281.
50. Suarez, D.L., 2000. Evolution of avian influenza viruses. Vet. Microbiol. 74, 15-27.
51. Subbarao, K., Joseph, T., 2007. Scientific barriers to developing vaccines against avian influenza
viruses. Nat. Rev. Immunol. 7, 267-278.
52. Subbarao, K., Shaw, M.W., 2000. Molecular aspects of avian influenza (H5N1) viruses isolated from
humans. Rev. Med. Virol. 10, 337-348.
53. Suzuki, Y., 2005. Sialobiology of influenza: molecular mechanism of host range variation of influenza
viruses. Biol. Pharm. Bull. 28, 399-408.
Chapter 1
22
54. Swayne, D.E., 2008. Avian influenza vaccines and therapies for poultry. Comp. Immunol. Microbiol.
Infect. Dis. 32, 351-363.
55. Tamura, S. and Kurata, T., 2004. Defense mechanisms against influenza virus infection in the
respiratory tract mucosa. Jpn. J. Infect. Dis. 57, 236-247.
56. Taylor, H.P. and Dimmock, N.J., 1985. Mechanism of neutralization of influenza virus by secretory
IgA is different from that of monomeric IgA or IgG. J. Exp. Med. 161, 198-209.
57. Tollis, M., Di Trani, L., 2002. Recent developments in avian influenza research: epidemiology and
immunoprophylaxis. Vet. J. 164, 202-215.
58. Tritto, E., Mosca, F., De Gregorio, E., 2009. Mechanism of action of licensed vaccine adjuvants.
Vaccine 25-26, 3331-3334.
59. Uetani, K., Hiroi, M., Meguro, T., Ogawa, H., Kamisako, T., Ohmori, Y., Erzurum, S.C., 2008.
Influenza A virus abrogates IFN-gamma response in respiratory epithelial cells by disruption of the
Jak/Stat pathway. Eur. J. Immunol. 38, 1559-1573.
60. Van den Berg, T., Lambrecht, B., Marche, S., Steensels, M., Van Borm, S., Bublot, M., 2008. Influenza
vaccines and vaccination strategies in birds. Comp Immunol Microbiol. Infect. Dis. 31, 121-165.
61. Van Riel, D., Munster, V.J., de Wit, E., Rimmelzwaan, G.F., Fouchier, R.A., Osterhaus, A.D., Kuiken,
T., 2007. Human and avian influenza viruses target different cells in the lower respiratory tract of
humans and other mammals. Am. J. Pathol. 171, 1215-1223.
62. Wang, X., Li, M., Zheng, H., Muster, T., Palese, P., Beg, A.A., Garcia-Sastre, A., 2000. Influenza A
virus NS1 protein prevents activation of NF-kappaB and induction of alpha/beta interferon. J. Virol. 74,
11566-11573.
63. Wang, Y., Shan, C., Ming, S., Liu, Y., Du, Y., Jiang, G., 2009. Immunoadjuvant effects of bacterial
genomic DNA and CpG oligodeoxynucleotides on avian influenza virus subtype H5N1 inactivated oil
emulsion vaccine in chicken. Res. Vet. Sci. 86, 399-405.
64. Webby, R.J., Webster, R.G., 2001. Emergence of influenza A viruses. Philos. Trans. R. Soc. Lond. B.
Biol. Sci. 356, 1817-1828.
65. Wong, J.P., Christopher, M.E., Viswanathan, S., Karpoff, N., Dai, X., Das, D., Sun, L.Q., Wang, M.,
Salazar, A.M., 2009. Activation of toll-like receptor signaling pathway for protection against influenza
virus infection. Vaccine 27, 3481-3483.
66. Xiao, Y., Hughes, A.L., Ando, J., Matsuda, Y., Cheng, J.F., Skinner-Noble, D., Zhang, G., 2004. A
genome-wide screen identifies a single beta-defensin gene cluster in the chicken: implications for the
origin and evolution of mammalian defensins. BMC Genomics 5, 56.
67. Xing, Z., Cardona, C.J., Li, J., Dao, N., Tran, T., Andrada, J., 2008. Modulation of the immune
responses in chickens by low-pathogenicity avian influenza virus H9N2. J. Gen. Virol. 89, 1288-1299.
68. Yamada, S., Suzuki, Y., Suzuki, T., Le, M.Q., Nidom, C.A., Sakai-Tagawa, Y., Muramoto, Y., Ito, M.,
Kiso, M., Horimoto, T., Shinya, K., Sawada, T., Kiso, M., Usui, T., Murata, T., Lin, Y., Hay, A., Haire,
L.F., Stevens, D.J., Russell, R.J., Gamblin, S.J., Skehel, J.J., Kawaoka, Y., 2006. Haemagglutinin
mutations responsible for the binding of H5N1 influenza A viruses to human-type receptors. Nature
444, 378-382.
69. Yamanaka, M., Okabe, T., Nakai, M., Goto, N., 1993. Local pathological reactions and immune
response of chickens to ISA-70 and other adjuvants containing Newcastle disease virus antigen. Avian
Dis. 37, 459-466.
70. Zambon, M.C., 1999. Epidemiology and pathogenesis of influenza. J. Antimicrob. Chemother. 44
Suppl B, 3-9.

Cellular host transcriptional responses to Influenza A
virus in chicken tracheal organ cultures differ from
responses in in vivo infected trachea
Sylvia S. Reemers1, Marian J. Groot Koerkamp2, Frank C. Holstege2, Willem van Eden1,
Lonneke Vervelde1
1Department of Infectious Diseases and Immunology, Faculty Veterinary Medicine, Utrecht University, Yalelaan
1, 3584 CL Utrecht, The Netherlands 2Genomics Laboratory, Department of Physiological Chemistry, Utrecht Medical Centre, Universiteitsweg 100,
3584 CG Utrecht, The Netherlands
Veterinary Immunology and Immunopathology, 2009; 132: 91-100
Chapter 2

Transcriptional host responses to AIV infection in TOC
25
Abstract
In this study a viral infection of a tissue culture model system was compared to an in vivo
infection, which is of importance to gauge the utility of the model system. The aim was to
characterize early immune responses induced by avian influenza virus using tracheal organ
cultures (TOC) as a model system. First, the in vitro system was optimized to ensure that
host transcription responses were only influenced by virus infection and not by differences
in viral load. Upper and lower trachea could both be used in the cultures because the virus
load was the same. Cilia motility was not affected in non-infected TOC and only slightly in
infected TOC at 24 h post inoculation. Gene expression profiles of early immune responses
were analyzed in in vitro infected TOC, and were compared to responses found in in vivo
infected trachea. The gene expression profile in infected TOC suggested up regulation of
innate anti-viral responses that were triggered by attachment, entry and uptake of virus
leading to several signalling cascades including NF-κB regulation. Genes associated with
IFN mediated responses were mainly type I IFN related. Overlapping gene expression
profiles between non-infected and infected TOC suggested that tissue damage during
excision induced wound healing responses that masked early host responses to the virus.
These responses were confirmed by real-time quantitative RT-PCR showing up regulation
of IL-1β and IL-6. Microarray analysis showed that gene expression profiles of infected and
non-infected TOC had a large overlap. This overlap contained many immune-related genes
associated with inflammatory responses, apoptosis and immune system process and
development. Infected TOC and in vivo infected trachea shared few significantly
differentially expressed genes. The gene expression profile of infected TOC contained
fewer genes which were expressed at reduced amplitude of change. Genes that were
common between TOC and trachea were associated with early immune responses likely
triggered by virus attachment and entry. Most of the genes were associated with IFN-
mediated responses, mainly type I IFN related. Our study implicates that although the TOC
model is suitable for culturing of virus and lectin or virus binding studies, it is not suitable
for measuring early immune responses upon viral infection at host transcriptional level.
Introduction
Avian influenza virus (AIV) causes infection of the respiratory tract, triggering a cascade
of both innate and specific immune responses. In the last decade our knowledge on these
host defenses against and pathogenic mechanisms of influenza virus infections has
tremendously increased. It has been demonstrated that early immune responses are critical
in defining the severity and pathological outcome of AIV infection in mice and macaques
(Kash et al., 2006; Kobasa et al., 2007). Yet little is known about the early immune
response and host factors that play a role in the induction phase of the responses to AIV in

Chapter 2
26
the chicken. By using in vitro models, experimental conditions can be highly controlled and
both mechanisms of viral infection and host defenses can be studied.
Numerous respiratory epithelial cell lines have been frequently used to study influenza
virus infection (Chan et al., 2005; Veckman et al., 2006). An alternative for cell lines is the
use of primary cell cultures. Primary respiratory epithelial cell cultures have been
developed for various species including human (Matrosovich et al., 2004), hamster (Newby
et al., 2006), mouse (You et al., 2002), pig (Steimer et al., 2006) and since recently chicken
(Zaffuto et al., 2008). Another alternative has been the use of organ cultures as infection
model, such as lung slice cultures (Booth et al., 2004) and tracheal organ cultures (TOC),
which mimic natural infection events more closely and can also be used under controlled
conditions. To date early immune responses to AIV in the chicken have not been
systematically characterized at global gene transcriptional levels. This report is the first one
exploring the use of organ cultures for illustrating these responses at host transcriptional
level.
TOC are susceptible to respiratory virus infections in vitro and are commonly used to study
host-pathogen interaction (Schmidt et al., 1974), to grow virus, and as diagnostic tool
(Cook et al., 1976). In this study an organ culture model system was compared to an in vivo
infection which is of importance to gauge the utility of the model system. We investigated
early immune responses to AIV infection and explored the value of using the in vitro TOC
model for influenza studies by comparing responses in infected TOC with in vivo AIV
infected trachea using a high-throughput genomics approach.
Materials and methods
Virus
Avian influenza A virus, subtype H9N2, isolate A/Chicken/United Arab Emirates/99 was
produced in eggs according to routine procedures. Virus was kindly provided by Intervet
Schering-Plough Animal Health.
In vitro infection model
Tracheas of 18 day-old Cobb broiler embryos (Lagerwey) were aseptically removed and
transferred to warm culture medium containing DMEM, 20 mM HEPES and penicillin/
streptomycin. Tracheas were cut into 3 mm rings resulting in 6 rings per trachea. For
optimization of the in vitro infection model, rings from 1 trachea were divided into two
groups. Each group consisted of 3 rings derived from either the lower or the upper part of
the trachea. These were transferred to a 12-well plate (3 rings per well; TOC) containing
culture medium. TOC were inoculated with increasing concentrations of virus; 101-105
EID50 H9N2/ml in a total volume of 0.5 ml culture medium per well and incubated at 37°C,

Transcriptional host responses to AIV infection in TOC
27
5 % CO2. After 1 h 1.5 ml culture medium was added and incubation continued. TOC were
harvested at 24 h post inoculation (p.i.) and stored in RNAlater (Ambion) at -80°C.
For the experimental set up, infected and non-infected TOC were incubated in either 0.5 ml
culture medium or 0.5 ml culture medium containing 105 EID50 H9N2/ml. After 1 h 1.5 ml
culture medium was added and incubation continued. TOC were harvested at 0, 3, 6, 15 and
24 h.p.i. and stored in RNAlater at -80°C.
TOC harvested at 0 h were non-infected controls harvested directly after preparation and
were not cultured or inoculated. Infected and non-infected TOC originated from the same
trachea and were time matched during harvesting, which enabled us to control for
variations in physiology and bird to bird variation thus only detect changes due to virus
infection.
In vivo infection model
One-day-old White Leghorns were housed under SPF conditions and all experiments were
carried out according to protocols approved by the Intervet Animal Welfare Committee.
Chickens were divided into 2 groups over 2 isolators, infected and non-infected, containing
20 animals per group. Fourteen-day-old chickens were inoculated via aerosol spray with 20
ml 107.7 EID50 H9N2 AIV. The control group was inoculated via aerosol spray with 20 ml
saline. Aerosol spray was made with an aerographer and compressor at a pressure of 1.5
Atm, resulting in droplets with an average diameter of 50 μm. Chickens remained in the
aerosol spray in a closed isolator (0.79 m3) for 10 min, after which the isolator was
ventilated as before. At day 1 p.i. chickens were killed (n=5 per time point per group) and
the upper part of the tracheas were isolated and stored in RNAlater at -80°C.
RNA isolation
TOC or trachea, stored in RNAlater, were homogenized (Retsch Mixer Mill 301, Fisher
Scientific) and total RNA was isolated using the RNeasy Mini Kit and DNase treated using
the RNase-free DNase Set following manufacturer’s instructions (Qiagen Benelux B.V).
Purified RNA was eluted in 30 μl RNase-free water and stored at -80°C. All RNA samples
were checked for quantity using a spectrophotometer (Shimadzu) and quality using a 2100
Bioanalyzer (Agilent Technologies). Isolated RNA was used for both real-time quantitative
RT-PCR and microarray analysis.
Real-time quantitative reverse transcription-PCR (qRT-PCR)
cDNA was generated with reverse transcription using iScript cDNA Synthesis Kit (Biorad
Laboratories B.V.).
Real-time qRT-PCR was performed with a MyiQ Single-Color real-time PCR Detection
System (Biorad) using iQ SYBR green supermix (Biorad) and the TaqMan Universal PCR
Chapter 2
28
Master Mix (Applied Biosystems). Primers (Invitrogen-Life Technologies) and probes
(Applied Biosystems) were designed according to previously published sequences (Sijben
et al., 2003; Rothwell et al., 2004; Degen et al., 2006; Eldaghayes et al., 2006).
Amplification and detection of specific GAPDH and H9 haemagglutinin (HA) products
was achieved with SYBR green, 400 nM primers and using the following cycle profile: one
cycle of 95°C for 5 min, 40 cycles of 92°C for 10 s, 55°C for 10 s and 72°C 30 s. For
detection of the cytokines and 28S, product specific probes were used according to the
cycle profile described in Ariaans et al. (2008). Primers were used at 600 nM and probes at
100 nM concentration.
To generate standard curves GAPDH, H9 HA and IL-4 PCR-fragments were cloned and
used to generate log10 dilution series regression lines. RNA from LPS stimulated HD11
cells was used to generate standard curves for IL-10 and RNA from ConA stimulated
splenocytes was used for standard curves of the remaining cytokines and 28S. GAPDH was
used as a reference gene for correction of H9 HA RNA expression and 28S as reference
gene for the cytokines. Corrections for variation in RNA preparation and sampling were
performed according to Eldaghayes et al. (2006). Results are expressed in terms of the
threshold cycle value (Ct) and given as corrected 40-Ct values.
A paired t-test was used to determine the statistical significance between infected and non-
infected TOC samples from the same bird. To determine the statistical significance between
infected and non-infected trachea and between TOC and trachea at 24 h an ANOVA with a
Tukey post-hoc test was used. For both tests a p-value < 0.05 was considered significant.
Microarray analysis
For microarray analysis the Gallus gallus Roslin/ARK CoRe Array Ready Oligo Set V1.0
(Operon Biotechnologies) was used. The array was spotted onto Codelink activated slides
(GE Healthcare) and contains 20,460 oligo probes representing chicken genes, and 3828
control spots, used for QC and normalisation purposes (Van de Peppel et al., 2003). RNA
amplification and labelling was performed according to Roepman et al. (2005). All
hybridizations contained 2.5 µg cRNA per channel on a HS4800Pro hybstation (Tecan
Benelux BVBA).
For determining early responses in TOC to H9N2 infection, infected samples were co-
hybridised with non-infected samples of the same trachea. In order to investigate the gene
expression profile over time in infected TOC, a 0 h non-infected control reference sample
was co-hybridized with infected and non-infected TOC samples at 24 h.p.i. The 0 h non-
infected control reference sample was created by pooling equal amounts of RNA extracted
from 0 h non-infected control TOC samples.

Transcriptional host responses to AIV infection in TOC
29
For the in vivo experiment, infected and non-infected trachea samples were co-hybridised
with a trachea reference sample. This reference sample consisted of pooled RNA extracted
from tracheas of 4 chickens that were not included in the infection experiment.
Slides were scanned with an G2565AA scanner (Agilent Technologies) at 100% laser
power, 30% PMT. Resulting image files were analyzed using Imagene 8.0 (BioDiscovery,
Inc.). Within slide normalisation was performed with Printtip Loess on mean data without
background subtraction. Groups of replicates were analysed using ANOVA (R version
2.2.1/MAANOVA version 0.98-7, http://www.r-project.org/). In a fixed effect analysis,
sample, array and dye effects were modelled. P-values were determined by a permutation
F2-test, in which residuals were shuffled 5000 times globally. Genes with p < 0.05 after
family wise error correction were considered significantly differentially expressed and were
selected to be included for further analysis. Visualisation and cluster-analysis was
performed using GeneSpring 7.2 (Agilent Technologies). Ensembl Gallus gallus (assembly:
WASHUC2, May 2006, genebuild: Ensembl, Aug 2006, database version: 47.2e) was used
for gene names, description and GO-annotations.
In accordance with proposed MIAME standards primary data are available in the public
domain through Expression Array Manager at
http://www.ebi.ac.uk/arrayexpress/?#ae=main[0] under accession number E-MTAB-12.
Results
In vitro TOC infection model
The TOC infection model had to be optimised to ensure that host transcription responses
were only influenced by virus infection and not by differences in viral load.
To ensure that the inoculation dose would result in consistent viral load of the TOC, H9 HA
RNA levels were measured with real-time qRT-PCR. TOC infected with 103 EID50/ml had
significant differences in H9 mRNA levels between the replicates and between TOC of the
upper and lower part of trachea (data not shown). There was no significant difference in H9
HA RNA levels between TOC of the upper and lower part of trachea for TOC infected with
a dose of 104 and 105 EID50/ml. However, based on standard deviations TOC infected with
105 EID50/ml had a 0.4 Ct smaller difference between the replicates than TOC infected with
104 EID50/ml (data not shown). Based on these results an infection dose of 105 EID50/ml
was used for further experiments and TOC of upper and lower part of trachea were divided
randomly.
In order to determine the kinetics of H9 HA RNA expression in TOC, infected and non-
infected TOC were harvested at 0, 3, 6, 15 and 24 h.p.i. H9 HA RNA was detected from 3
h.p.i. and levels increased over time (Fig. 1A). The differences between replicates were
very small at every time point. Therefore, differences in responses caused by a difference in
viral load will not affect the gene expression within a treatment group.

Chapter 2
30
To ensure that the tracheal rings were viable in non-infected TOC and to investigate if
influenza virus infection affected cilia motility like avian pneumoviruses and influenza
viruses in respiratory epithelium do (Diaz-Rodriguez and Boudreault, 1982; Naylor and
Jones, 1994) we microscopically examined the motility of cilia in both infected and non-
infected TOC at 0, 3, 6, 15 and 24 h.p.i. No difference in cilia motility was detected in non-
infected TOC. In infected TOC at 24 h.p.i., 10-20% of the epithelial cell layer showed no
cilia motility, whereas in non-infected TOC at 24 h of culturing the whole epithelial cell
layer showed cilia activity (data not shown).
Expression of genes relevant for immune responses to H9N2 infection in TOC
In order to elucidate the expression of genes involved in host defenses in H9N2 infected
TOC, infected and non-infected TOC within the same time point were compared using
microarray analysis. The data were consistent and even small differences were measured as
significantly differentially expressed. At 3, 6 and 15 h.p.i. no significantly differentially
expressed genes were found, but at 24 h.p.i. 108 genes were significantly differentially
expressed. Of these genes, 106 genes were up regulated and 2 genes were down regulated
(supplemental Table S1). Based on the GO terms host-pathogen interaction, external
stimulus and immune response, we created an immune-related term that was used for
selection of immune-related genes. Of the 108 genes, 22 were immune-related genes that
were divided into GO terms using GSEA to obtain more details on the biological processes
they were involved in (Table 1). All 22 immune-related genes were up regulated and 8 of
these genes are associated with IFN mediated responses like ISG12-2. STAT4, OASL,
MDA5, LY6E are induced by type I IFNs, while CYSLTR2 is induced by IFN-γ. On the
other hand SOCS1 is able to inhibit IFN-γ expression and USP18 can inhibit signal
transduction pathways triggered by type I IFNs. When looking at the cellular position based
on GO terms of the immune-related genes LY6E, ISG12-2, CYSLTR2, DGKE, CD8A,
STAB1, TIMD4 and TLR5 reside in a membrane, PTK2B, OASL, MDA5 and SOCS1
reside in the cytoplasm and STAT4, USP18 and ZEB1 reside in the nucleus. IL19 and
MASP2 are secreted molecules. There was no significant difference in gene expression
between infected TOC and non-infected TOC at 3, 6 and 15 h.p.i.. This suggested that
tissue excision and culturing caused host responses in non-infected TOC similar to host
responses caused by H9N2 infection in infected TOC. Therefore the gene expression
profiles of infected and non-infected TOC within a 24 h period were determined by
comparing infected or non-infected TOC at 24 h to non-infected control TOC at 0 h. The
comparison of non-infected TOC at 24 h of culturing with non-infected control TOC at 0 h
represented wound healing responses. Responses in infected TOC at 24 h.p.i. compared to

Transcriptional host responses to AIV infection in TOC
31
Fig
ure
1. A
) R
eal-
tim
e qR
T-P
CR
of H
9 H
A R
NA
leve
ls n
orm
alis
ed to
GA
PDH
ove
r ti
me
in T
OC
infe
cted
in v
itro
wit
h 10
5 EID
50/m
l H9N
2 an
d at
24
h.p.
i. in
trac
hea
of b
irds
spra
y in
ocul
ated
wit
h 10
7.7 E
ID50
/ml H
9N2.
B)
Rea
l-ti
me
qRT
-PC
R o
f m
RN
A le
vels
nor
mal
ised
to 2
8S o
f IL
-1β,
IL
-6 a
nd I
FN-β
ove
r ti
me
in in
fect
ed a
nd n
on-i
nfec
ted
TO
C
and
at 2
4 h
p.i i
n tr
ache
a of
infe
cted
and
non
-inf
ecte
d bi
rds
(* p
< 0
.05)
. Res
ults
are
pre
sent
ed a
s 40
-Ct a
nd e
rror
s ba
rs s
how
SE
M f
or p
oole
d ex
pres
sion
leve
l in
four
TO
C
(fro
m f
our
bird
s) a
nd f
our
trac
heas
per
trea
tmen
t.
Tab
le 1
. Im
mun
e-re
late
d ge
nes
sign
ific
antl
y di
ffer
entia
lly
expr
esse
d (p
< 0
.05)
in H
9N2
infe
cted
com
pare
d to
non
-inf
ecte
d T
OC
at 2
4 h.
p.i.
wit
h as
soci
ated
GO
term
s. A
ll
gene
s w
ere
up r
egul
ated
.
Gen
e n
ame
GO
an
nota
tion
STAT4*
PTK2B
OASL*
MDA5*
LY6E*
ISG12-2*
CYSLTR2*
CCDC18
DGKE
GENE A*1
GENE B2
CD8A
IL19
MASP2
SOCS1*
STAB1
TIAL1
TIMD4
TLR5
TRAF3IP2
USP18*
ZEB1
Mem
bran
e
x
x x
x
x
x
x x
Cyt
opla
sm
x
x x
x
Nuc
leus
x
x
x
Ext
race
llul
ar r
egio
n
x
x
Sign
al tr
ansd
uctio
n x
x
x
x
x
x
x
x
Infe
cted
TO
C
Infe
cted
trac
hea
Infe
cted
TO
C
Infe
cted
trac
hea
0481216
03
615
2424
0481216
03
615
2424
0481216
03
615
2424
6 01216 4
Corrected 40-Ct + SEM
Hou
rs p
.i.
IL-1β
03
61
524
24*
Hou
rs p
.i.
03
61
52
424
Hou
rs p
.i.
03
61
524
24
6 0
12
16 4
Corrected 40-Ct + SEM
6 0
1216 4
Corrected 40-Ct + SEM
IL-6
*
*
IFN
-β
**
0481216
03
615
2424
0481216
03
615
2424
0481216
03
615
2424
6 01216 4
Corrected 40-Ct + SEM
Hou
rs p
.i.
IL-1β
03
61
524
24*
Hou
rs p
.i.
03
61
52
424
Hou
rs p
.i.
03
61
524
24
6 0
12
16 4
Corrected 40-Ct + SEM
6 0
1216 4
Corrected 40-Ct + SEM
IL-6
*
*
IFN
-β
**
No
n-in
fect
ed T
OC
Infe
cted
TO
C
No
n-in
fect
ed tr
ach
ea
Infe
cted
trac
hea
No
n-in
fect
ed T
OC
Infe
cted
TO
C
No
n-in
fect
ed tr
ach
ea
Infe
cted
trac
hea
0510152025
36
1524
24
36
1524
24
Hou
rs p
.i.
25 20 15 10 5 0
Corrected 40-Ct + SEM
0510152025
36
1524
24
36
1524
24
Hou
rs p
.i.
0510152025
36
1524
24
36
1524
24
Hou
rs p
.i.
25 20 15 10 5 0
Corrected 40-Ct + SEM
25 20 15 10 5 0
Corrected 40-Ct + SEM
A.
B.

Chapter 2
32
Prot
ein
bind
ing
x
x
x
x
x
x
Imm
une
resp
onse
x
x
x x
x
Apo
ptos
is
x
x
x
x
Res
pons
e to
vir
us
x x
Def
ense
res
pons
e
x x
T c
ell a
ctiv
atio
n
x
x
Infl
amm
ator
y re
spon
se
x
x
JAK
-ST
AT
cas
cade
x
x
Reg
ulat
ion
of N
F-k
B c
asca
de
x x
Cel
l adh
esio
n
x
Cel
l pro
life
rati
on
x
Lys
osom
e
x
Res
pons
e to
str
ess
x
Ant
igen
pre
sent
atio
n/pr
oces
sing
x
Com
plem
ent a
ctiv
atio
n
x
Def
ense
res
pons
e to
bac
teri
um
x
Cel
l adh
esio
n
x
Cel
l-ce
ll s
igna
llin
g
x
Ubi
quiti
n-de
p. p
rote
in c
atab
olic
pr
oces
s
x
Neg
. reg
. epi
thel
ial
cell
diff
eren
tiat
ion
x
Tra
nspo
rt
x
* G
enes
invo
lved
in in
terf
eron
med
iate
d re
spon
ses;
1 G
EN
E A
: EN
SGA
LG
0000
0006
384;
2 G
EN
E B
: EN
SGA
LG
0000
0007
208

Transcriptional host responses to AIV infection in TOC
33
non-infected control TOC at 0 h represented host responses to H9N2 infection and wound
healing responses. The overlap between significantly differentially expressed genes in the
gene expression profile of infected TOC in one set and in the gene expression profile of
wound healing in non-infected TOC in the other set represents the overlap in responses
caused by wound healing and virus infection and was depicted in a Venn diagram (Fig.
2A). An overlap of 1268 genes between the profiles was found, containing 84 genes
involved in immune responses, of which 41 genes were up regulated and 43 genes were
down regulated (Fig. 2B). Immune-related genes were divided into GO terms to obtain
more details on the biological processes they were involved in. GO terms that mostly
contained down regulated genes could be divided into three categories containing relating
GO terms. Most genes are associated with response to stress, chemical and biotic stimuli,
defense to pathogens and regulation of NF-κB. The other two categories consisted of GO
terms negative regulation of apoptosis and negative regulation of programmed cell death,
and protein folding and protein binding. Together these genes suggest that cells are not
responding to stimuli, protein production has come to a hold and apoptosis and
programmed cell death are no longer inhibited. Death of the cells can either be induced via
virus infection or tissue damage due to preparation and culturing of TOC. GO terms that
contained more up regulated than down regulated genes could also be divided into
categories containing relating GO terms. Response to wounding and to external stimuli
indicated wound healing responses of the TOC due to tissue damage caused by excision
and culturing of TOC and to virus infection. This resulted in cell death as suggested by up
regulation of genes involved in regulation of apoptosis and programmed cell death, anti-
apoptosis and negative regulation of cellular process. Genes associated with immune
system processes and development were also up regulated suggesting the initiation of an
immune response. This response involved genes that are related to inflammatory responses,
leukocyte migration and differentiation, defense responses, hemapoiesis, hemapoietic or
lymphoid organ development and carbohydrate binding. These suggested cell attraction,
migration and adhesion and phagocytosis of virus or cell debris by MΦs inducing an
inflammatory response. Virus and cell debris were likely degraded in lysosomes or lytic
vacuoles suggested by the up regulation of genes that were part of the GO terms lysosome,
lytic vacuole and vacuole. Besides cell death, the TOC structure was possibly also renewed
as suggested by up regulation of genes associated with cell development, positive
regulation of cell differentiation, organelle part and regulation of developmental processes.
Up regulation of genes involved in protein metabolic process, cellular protein process and
lipid raft was in accordance with this and suggested an active communication in and
between cells. These data showed a large overlap of host responses, particularly early
immune responses, between H9N2 infection and wound healing.

Chapter 2
34
A.
B.
Figure 2. A) Venn diagram of significantly differentially expressed genes (p < 0.05) involved in host responses to
H9N2 infection and in wound healing in TOC on the left and host responses involved in wound healing on the
right (n = 4). The grey area represents the overlapping genes between the expression profiles and indicates the
overlap between responses to H9N2 infection and wound healing responses. The numbers in the circles indicate
the altered genes for each condition. B) Overlap of 93 immune-related genes between responses to H9N2 infection
in infected TOC and wound healing responses in non-infected TOC. Red represents up regulation and green down
regulation in infected (T24-i) and non-infected (T24-ni) TOC at 24 h.p.i. compared to non-infected control TOC at
0 h.
Cytokine mRNA expression in infected and non-infected TOC
In order to confirm the microarray data on the early responses induced by viral entry and
replication, we measured mRNA expression of different cytokines using real-time qRT-
PCR. mRNA levels of infected TOC were compared to non-infected TOC within the same
0 hr non-infected TOC vs
24 hr non-infected TOC
906 2771268
0 hr non-infected TOC vs
24 hr p.i. infected TOC
0 hr non-infected TOC vs
24 hr non-infected TOC
906 2771268
0 hr non-infected TOC vs
24 hr p.i. infected TOC
ni
nini
ni
T24
-ni
T24
-i
T24
-i
T24
-ni
Transcriptional host responses to AIV infection in TOC
35
time point. In infected TOC IL-6, IL-8, IFN-α and IFN-β were significantly up regulated at
24 h.p.i., but no significant changes were detected in IL-1β, IL-4, IL-10, IL-18 and IFN-γ
levels compared to non-infected TOC (Fig. 1B and data not shown). IL-6, IL-8 and IL-10
mRNA levels were also up regulated from 3 h of culturing in non-infected TOC compared
to non-infected control TOC at 0 h and remained elevated up to 24 h of culturing (Fig. 1B
and data not shown). With microarray analysis IL-6, IL-8, IFN-α and IFN-β were not
significantly differentially expressed in infected TOC compared to non-infected TOC. Real-
time qRT-PCR is more sensitive than microarray analysis and differences in IL-6, IL-8,
IFN-α and IFN-β levels between infected and non-infected TOC measured with real-time
qRT-PCR were small, which explain why these cytokines were not found with microarray
analysis. Moreover, for real-time qRT-PCR a paired T-test was used to determine
significant differences, which rules out biological differences, because infected and non-
infected TOC from the same animal were compared. For microarray analysis, stringent
statistics with multiple testing was used, which does not take into account that infected and
non-infected TOC hybridized together on a slide were from the same animal. Resulting
from this is that small differences were significant for real-time qRT-PCR, but not for
microarray analysis, and are not shown in the gene lists.
Comparison of in vitro and in vivo gene expression after H9N2 infection
To compare responses in in vitro infected TOC with in vivo infected trachea, results should
not be affected by differences in viral load between TOC and trachea. H9 HA RNA levels
of infected trachea at 24 h.p.i. were compared with TOC at 24 h.p.i. (Fig. 1A). There was
no significant difference in H9 HA RNA level between infected TOC and trachea at 24
h.p.i.
Scatterplots were made of the expression ratio of infected samples compared to a reference
sample on one axis and of non-infected samples to a reference sample on the other axis for
both TOC and trachea (Fig. 3A to C). For trachea a broad scatterplot was seen (Fig. 3A),
suggesting a high amplitude of change in infected trachea compared to non-infected
trachea. Whereas for TOC the response is more moderate with a scatterplot close to the
diagonal 1-fold indication line (Fig. 3B and C), suggesting a low amplitude of change
between infected and non-infected TOC. Moreover, the expression profile of infected
trachea involved more significantly differentially expressed genes than that of infected
TOC (Fig. 3A-C white dots), and few genes were shared between both expression profiles.
Responses in infected samples were compared to non-infected samples at 24 h for both
TOC and trachea representing responses to H9N2 infection. A Venn diagram was generated
of significantly differentially expressed genes to elucidate the overlap between the
expression profile of H9N2 infection in TOC in one set and in trachea in the other set (Fig.
3D). A small overlap in response was seen between TOC and trachea consisting of 34
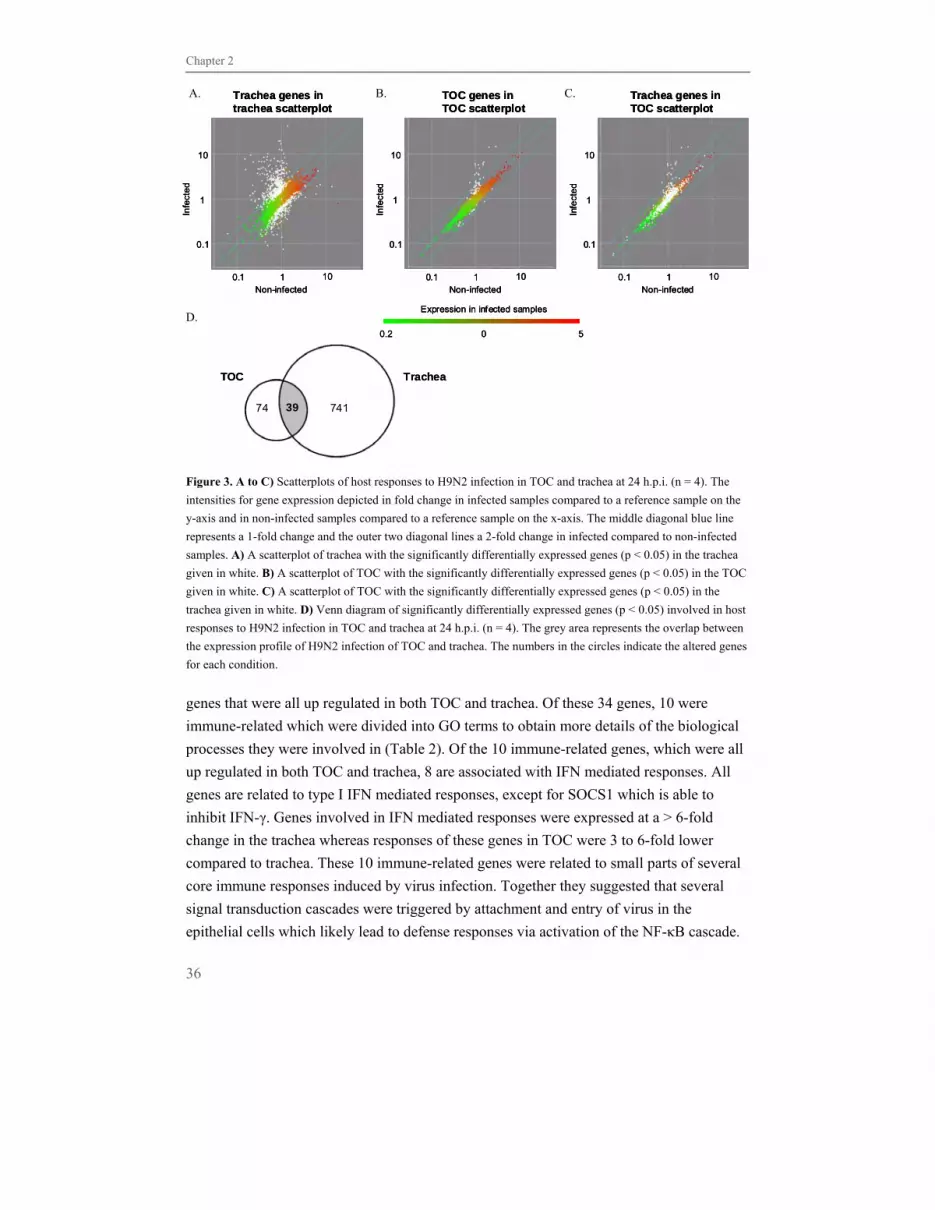
Chapter 2
36
A. B. C.
D.
Figure 3. A to C) Scatterplots of host responses to H9N2 infection in TOC and trachea at 24 h.p.i. (n = 4). The
intensities for gene expression depicted in fold change in infected samples compared to a reference sample on the
y-axis and in non-infected samples compared to a reference sample on the x-axis. The middle diagonal blue line
represents a 1-fold change and the outer two diagonal lines a 2-fold change in infected compared to non-infected
samples. A) A scatterplot of trachea with the significantly differentially expressed genes (p < 0.05) in the trachea
given in white. B) A scatterplot of TOC with the significantly differentially expressed genes (p < 0.05) in the TOC
given in white. C) A scatterplot of TOC with the significantly differentially expressed genes (p < 0.05) in the
trachea given in white. D) Venn diagram of significantly differentially expressed genes (p < 0.05) involved in host
responses to H9N2 infection in TOC and trachea at 24 h.p.i. (n = 4). The grey area represents the overlap between
the expression profile of H9N2 infection of TOC and trachea. The numbers in the circles indicate the altered genes
for each condition.
genes that were all up regulated in both TOC and trachea. Of these 34 genes, 10 were
immune-related which were divided into GO terms to obtain more details of the biological
processes they were involved in (Table 2). Of the 10 immune-related genes, which were all
up regulated in both TOC and trachea, 8 are associated with IFN mediated responses. All
genes are related to type I IFN mediated responses, except for SOCS1 which is able to
inhibit IFN-γ. Genes involved in IFN mediated responses were expressed at a > 6-fold
change in the trachea whereas responses of these genes in TOC were 3 to 6-fold lower
compared to trachea. These 10 immune-related genes were related to small parts of several
core immune responses induced by virus infection. Together they suggested that several
signal transduction cascades were triggered by attachment and entry of virus in the
epithelial cells which likely lead to defense responses via activation of the NF-κB cascade.
TOC Trachea
74 74139
TOC Trachea
74 74139
Expression in infected samples
0.2 0 5
Non-infected
Infe
cte
d
Trachea genes in trachea scatterplot
1010.1
10
1
0.1
Non-infected
Infe
cted
TOC genes in TOC scatterplot
1010.1
10
1
0.1
Non-infected
Infe
cte
d
Trachea genes in TOC scatterplot
1010.1
10
1
0.1
Expression in infected samples
0.2 0 5
Expression in infected samples
0.2 0 5
Non-infected
Infe
cte
d
Trachea genes in trachea scatterplot
1010.1
10
1
0.1
Non-infected
Infe
cte
d
Trachea genes in trachea scatterplot
1010.1
10
1
0.1
Non-infected
Infe
cted
TOC genes in TOC scatterplot
1010.1
10
1
0.1
Non-infected
Infe
cted
TOC genes in TOC scatterplot
1010.1
10
1
0.1
Non-infected
Infe
cte
d
Trachea genes in TOC scatterplot
1010.1
10
1
0.1
Non-infected
Infe
cte
d
Trachea genes in TOC scatterplot
1010.1
10
1
0.1
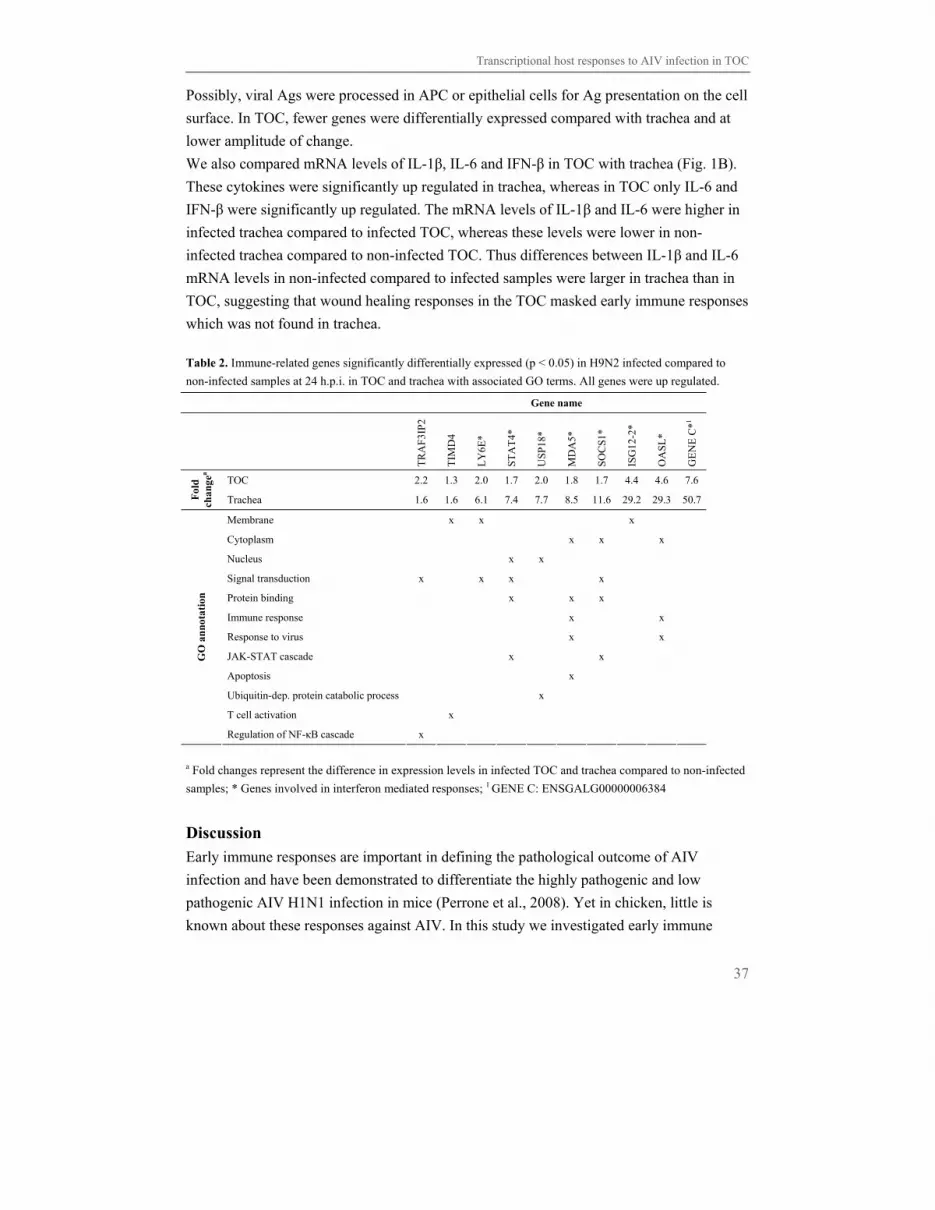
Transcriptional host responses to AIV infection in TOC
37
Possibly, viral Ags were processed in APC or epithelial cells for Ag presentation on the cell
surface. In TOC, fewer genes were differentially expressed compared with trachea and at
lower amplitude of change.
We also compared mRNA levels of IL-1β, IL-6 and IFN-β in TOC with trachea (Fig. 1B).
These cytokines were significantly up regulated in trachea, whereas in TOC only IL-6 and
IFN-β were significantly up regulated. The mRNA levels of IL-1β and IL-6 were higher in
infected trachea compared to infected TOC, whereas these levels were lower in non-
infected trachea compared to non-infected TOC. Thus differences between IL-1β and IL-6
mRNA levels in non-infected compared to infected samples were larger in trachea than in
TOC, suggesting that wound healing responses in the TOC masked early immune responses
which was not found in trachea.
Table 2. Immune-related genes significantly differentially expressed (p < 0.05) in H9N2 infected compared to
non-infected samples at 24 h.p.i. in TOC and trachea with associated GO terms. All genes were up regulated.
Gene name
TR
AF
3IP
2
TIM
D4
LY
6E*
ST
AT
4*
USP
18*
MD
A5*
SO
CS1
*
IS
G12
-2*
OA
SL
*
GE
NE
C*1
TOC 2.2 1.3 2.0 1.7 2.0 1.8 1.7 4.4 4.6 7.6
Fol
d
chan
gea
Trachea 1.6 1.6 6.1 7.4 7.7 8.5 11.6 29.2 29.3 50.7
Membrane x x x
Cytoplasm x x x
Nucleus x x
Signal transduction x x x x
Protein binding x x x
Immune response x x
Response to virus x x
JAK-STAT cascade x x
Apoptosis x
Ubiquitin-dep. protein catabolic process x
T cell activation x
GO
an
nota
tion
Regulation of NF-κB cascade x
a Fold changes represent the difference in expression levels in infected TOC and trachea compared to non-infected
samples; * Genes involved in interferon mediated responses; 1 GENE C: ENSGALG00000006384
Discussion
Early immune responses are important in defining the pathological outcome of AIV
infection and have been demonstrated to differentiate the highly pathogenic and low
pathogenic AIV H1N1 infection in mice (Perrone et al., 2008). Yet in chicken, little is
known about these responses against AIV. In this study we investigated early immune

Chapter 2
38
responses upon viral infection at host transcriptional level in the chicken and explored the
use of TOC as an in vitro model system. The virus strain H9N2 is important as it has
regularly been detected in land-based poultry and it is able to make cross species infection
(Butt et al., 2005). TOC were susceptible to H9N2 infection in vitro and H9 HA RNA
levels increased over time, indicating not only viral entry but also replication. Several
respiratory viruses such as influenza, infectious bronchitis virus and turkey rhinotracheitis
virus (or avian pneumovirus) are known to cause ciliostasis in respiratory epithelium (Diaz-
Rodriguez and Boudreault, 1982; Naylor and Jones, 1994; Cavanagh et al., 2007).
Macroscopical examination revealed that ciliostasis was detected in 10-20% of the
epithelium of infected TOC at 24 h.p.i. Pathogenesis of influenza virus infection has been
investigated in equine and duck TOC (Kocan et al., 1977; O'Niell et al., 1984), where
scattered loss of cilia and disruption of the epithelial cell layer was reported. Our results in
chickens are consistent with these studies.
Immune responses to influenza infection in the respiratory tract have been studied
extensively in vitro in human and mouse. Elevated expression levels of inflammatory
cytokines and chemokines such as IL-1β, IL-6, IL-8, IL-18, IFN-α and -β have been
reported as early as 6 h.p.i. depending on the strain of influenza used (Julkunen et al., 2001;
Chan et al., 2005). In our in vitro study also elevated expression levels of IL-6, IL-8, IFN-α
and IFN-β were found in infected TOC at 24 h.p.i., suggesting the initiation of an acute host
response by induction of an increased MHC class I expression and anti-viral activity by
IFNs and inflammatory effects of IL-6 and IL-8 mobilizing and activating lymphocytes.
Genomics tools are more and more used to study host-pathogen interactions (Kash et al.,
2006). Our study was focused on gene expression profiles of early responses to low
pathogenic AIV using the TOC model system. Responses in infected and non-infected TOC
at 24 h showed very similar gene expression profiles. In both cultures, genes associated
with responses to external stimuli and stress, regulation of NF-κB, protein folding and
processing, apoptosis, and immune system process and development were significantly
differentially expressed, suggesting the initiation of an immune response. Genes related to
inflammatory responses found in the gene profile of non-infected TOC corresponded to
those found using real-time qRT-PCR in non-infected TOC from 3 h of culturing. IL-6, IL-
8 and IL-10 expression levels were up regulated in non-infected TOC. In mammals, IL-6,
IL-8 and IL-10 are known to be expressed in damaged tissue (Yamamura et al., 1992). As
expected, excision of the trachea into rings caused damage and resulted in up regulation of
IL-6, IL-8 and IL-10. The preparation of TOC likely induced strong inflammatory
responses, largely masking an early immune response triggered by AIV infection. Culturing
of TOC several days before infection will most likely not improve the inflammatory
responses induced by preparation of the TOC. Cilia activity slowly changed over a period
of 5 days with a maximum loss of 20%, but histopathological changes in the TOC were

Transcriptional host responses to AIV infection in TOC
39
found (data not shown). Still several genes associated with innate anti-viral responses were
significantly differentially up regulated in the gene expression profile of infected compared
to non-infected TOC at 24 h. Together these genes related to a virus induced immune
response in which attachment and entry of virus in the epithelial cells triggered several
signal transduction cascades leading to defense responses via activation of the NF-κB
cascade, inflammatory responses and complement activation via the lectin pathway. Via
these responses chemokines and IFNs can be secreted, likely triggering expression of IFN-
induced genes and attracting APC and T cells, residing in the lamina propria of the TOC, to
the place of infection. Virus might have been taken up by APC and transported to
lysosomes where the virus is degraded or virus is processed in the endosomes for Ag
presentation on the cell surface.
To validate whether early immune responses to AIV in in vitro infected TOC are similar to
in vivo responses at host transcriptional level, a comparison was made with in vivo H9N2
infected trachea. Higher levels of IL-1β and IL-6 were found in trachea, which could be
caused by an influx of MΦs, that cannot occur in TOC. Differences in fold change and the
small overlap in genes found between TOC and trachea are most likely caused by masking
of the immune responses in TOC due to wound healing responses, although some genes are
involved in both wound healing and immune responses to pathogens. The number of genes
that were in common in host response to H9N2 between TOC and trachea was very low.
These genes up regulated and related to innate anti-viral responses, likely triggered by
attachment and entry of virus leading to several signal transduction cascades. Most of the
common genes are associated with IFN mediated responses. These were mainly type I IFN
related corresponding with the up regulation in both TOC and trachea of IFN-α and IFN-β.
These findings suggest that these common immune responses are more involved in host
responses to AIV infection than in wound healing responses and likely play a dominant
role.
There is a clear need for detailed knowledge of the mechanisms of early immune responses
in the induction phase of AIV infection to enable modulating of the outcome. Studies
conducted in in vitro respiratory models can play an important role in elucidating host-
pathogen interactions. However, tissue culture model systems have to be compared to in
vivo infections to gauge the utility of the model system. This study showed that host
responses in TOC are masked by wound healing responses and thus influence any study
into host transcriptional responses. Although TOC and trachea shared similar immune-
related genes, which may play a dominant role in immune responses to influenza virus
infection, the number of shared genes significantly differentially expressed in both TOC
and trachea was very low. Therefore the results obtained from organ cultures or primary
cells for investigating any host responses at transcriptional level should be interpreted with
Chapter 2
40
caution. This makes TOC a good in vitro model for culturing of virus, and lectin or virus
binding studies, but not for studying gene expression profiles of host responses.
Acknowledgements
We thank Daphne van Haarlem from the Faculty of Veterinary Medicine for technical
assistance and Winfried Degen and Virgil Schijns from Intervet Schering-Plough Animal
Health for their collaboration on the in vivo experiment. From the Genomics Laboratory we
would like to thank Diane Bouwmeester, Dik van Leenen and Tony Miles for technical
assistance and Erik Sluiters and Patrick Kemmeren for bioinformatical assistance. This
work was supported by a BSIK VIRGO consortium grant (Grant no. 03012), The
Netherlands.
References
1. Ariaans, M.P., Matthijs, M.G., van Haarlem, D., van de Haar, P., van Eck, J.H., Hensen, E.J., Vervelde,
L., 2008. The role of phagocytic cells in enhanced susceptibility of broilers to colibacillosis after
Infectious Bronchitis Virus infection. Vet. Immunol. Immunopathol. 123, 240-250.
2. Booth, J.L., Coggeshall, K.M., Gordon, B.E., Metcalf, J.P., 2004. Adenovirus type 7 induces
interleukin-8 in a lung slice model and requires activation of Erk. J. Virol. 78, 4156-4164.
3. Butt, K.M., Smith, G.J., Chen, H., Zhang, L.J., Leung, Y.H., Xu, K.M., Lim, W., Webster, R.G., Yuen,
K.Y., Peiris, J.S., Guan, Y., 2005. Human infection with an avian H9N2 influenza A virus in Hong
Kong in 2003. J. Clin. Microbiol. 43, 5760-5767.
4. Cavanagh, D., Casais, R., Armesto, M., Hodgson, T., Izadkhasti, S., Davies, M., Lin, F., Tarpey, I.,
Britton, P., 2007. Manipulation of the infectious bronchitis coronavirus genome for vaccine
development and analysis of the accessory proteins. Vaccine 25, 5558-5562.
5. Chan, M.C., Cheung, C.Y., Chui, W.H., Tsao, S.W., Nicholls, J.M., Chan, Y.O., Chan, R.W., Long,
H.T., Poon, L.L., Guan, Y., Peiris, J.S., 2005. Proinflammatory cytokine responses induced by
influenza A (H5N1) viruses in primary human alveolar and bronchial epithelial cells. Respir. Res. 6,
135-147.
6. Cook, J.K., Darbyshire, J.H., Peters, R.W., 1976. The use of chicken tracheal organ cultures for the
isolation and assay of avian infectious bronchitis virus. Arch. Virol. 50, 109-118.
7. Degen, W.G., Smith, J., Simmelink, B., Glass, E.J., Burt, D.W., Schijns, V.E., 2006. Molecular
immunophenotyping of lungs and spleens in naive and vaccinated chickens early after pulmonary avian
influenza A (H9N2) virus infection. Vaccine 24, 6096-6109.
8. Diaz-Rodriguez, P., Boudreault, A., 1982. Inhibition of ciliary activity in organ cultures of ferret
trachea in reference to genetic and biological characters in influenza virus strains. Can. J. Microbiol.
28, 809-814.
9. Eldaghayes, I., Rothwell, L., Williams, A., Withers, D., Balu, S., Davison, F., Kaiser, P., 2006.
Infectious bursal disease virus: strains that differ in virulence differentially modulate the innate
immune response to infection in the chicken bursa. Viral Immunol. 19, 83-91.
10. Julkunen, I., Sareneva, T., Pirhonen, J., Ronni, T., Melen, K., Matikainen, S., 2001. Molecular
pathogenesis of influenza A virus infection and virus-induced regulation of cytokine gene expression.
Cytokine Growth Factor Rev. 12, 171-180.
Transcriptional host responses to AIV infection in TOC
41
11. Kash, J.C., Tumpey, T.M., Proll, S.C., Carter, V., Perwitasari, O., Thomas, M J., Basler, C.F., Palese,
P., Taubenberger, J.K., Garcia-Sastre, A., Swayne, D.E., Katze, M.G., 2006. Genomic analysis of
increased host immune and cell death responses induced by 1918 influenza virus. Nature 443, 578-581.
12. Kobasa, D., Jones, S. ., Shinya, K., Kash, J. ., Copps, J., Ebihara, H., Hatta, Y., Kim, J.H., Halfmann,
P., Hatta, M., Feldmann, F., Alimonti, J.B., Fernando, L., Li, Y., Katze, M.G., Feldmann, H., Kawaoka,
Y., 2007. Aberrant innate immune response in lethal infection of macaques with the 1918 influenza
virus. Nature 445, 319-323.
13. Kocan, A.A., Daubney, G.A., Kocan, K.M., 1977. Structural changes associated with type-A influenza
in mallard duck tracheal organ culture. Avian Dis. 22, 535-541.
14. Matrosovich, M.N., Matrosovich, T.Y., Gray, T., Roberts, N.A., Klenk, H.D., 2004. Human and avian
influenza viruses target different cell types in cultures of human airway epithelium. Proc. Natl. Acad.
Sci. U.S.A. 101, 4620-4624.
15. Naylor, C.J., Jones, R.C., 1994. Demonstration of a virulent subpopulation in a prototype live
attenuated turkey rhinotracheitis vaccine. Vaccine 12, 1225-1230.
16. Newby, C.M., Rowe, R.K., Pekosz, A. 2006. Influenza A virus infection of primary differentiated
airway epithelial cell cultures derived from Syrian golden hamsters. Virology 354, 80-90.
17. O'Niell, F.D., Issel, C.J., Henk, W.G., 1984. Electron microscopy of equine respiratory viruses in organ
cultures of equine fetal respiratory tract epithelium. Am. J. Vet. Res. 45, 1953-1960.
18. Perrone, L.A., Plowden, J.K., Garcia-Sastre, A., Katz, J.M., Tumpey, T.M., 2008. H5N1 and 1918
pandemic influenza virus infection results in early and excessive infiltration of macrophages and
neutrophils in the lungs of mice. PLoS Pathog. 4, e1000115.
19. Roepman, P., Wessels, L.F., Kettelarij, N., Kemmeren, P., Miles, A.J., Lijnzaad, P., Tilanus, M.G.,
Koole, R., Hordijk, G.J., van der Vliet, P.C., Reinders, M.J., Slootweg, P.J., Holstege, F.C. 2005. An
expression profile for diagnosis of lymph node metastases from primary head and neck squamous cell
carcinomas. Nat. Genet. 37, 182-186.
20. Rothwell, L., Young, J.R., Zoorob, R., Whittaker, C.A., Hesketh, P., Archer, A., Smith, A.L., Kaiser, P.
2004. Cloning and characterization of chicken IL-10 and its role in the immune response to Eimeria
maxima. J. Immunol. 173, 2675-2682.
21. Schmidt, R.C., Maassab, H.F., Davenport, F.M., 1974. Infection by influenza A viruses of tracheal
organ cultures derived from homologous and heterologous hosts. J. Infect. Dis. 129, 28-36.
22. Sijben, J.W., Klasing, K.C., Schrama, J.W., Parmentier, H.K., van der Poel, J.J., Savelkoul, H.F.,
Kaiser, P., 2003. Early in vivo cytokine genes expression in chickens after challenge with Salmonella
typhimurium lipopolysaccharide and modulation by dietary n--3 polyunsaturated fatty acids. Dev.
Comp. Immunol. 27, 611-619.
23. Steimer, A., Laue, M., Franke, H., Haltner-Ukomado, E., Lehr, C.M., 2006. Porcine alveolar epithelial
cells in primary culture: morphological, bioelectrical and immunocytochemical characterization.
Pharm. Res. 23, 2078-2093.
24. Van de Peppel, J., Kemmeren, P., van Bakel, H., Radonjic, M., van Leenen, D., Holstege, F.C., 2003.
Monitoring global messenger RNA changes in externally controlled microarray experiments. EMBO
Rep. 4, 387-393.
25. Veckman, V., Osterlund, P., Fagerlund, R., Melen, K., Matikainen, S., Julkunen, I., 2006. TNF-alpha
and IFN-alpha enhance influenza-A-virus-induced chemokine gene expression in human A549 lung
epithelial cells. Virology 345, 96-104.
26. Yamamura, M., Wang, X.H., Ohmen, J.D., Uyemura, K., Rea, T.H., Bloom, B.R., Modlin, R.L., 1992.
Cytokine patterns of immunologically mediated tissue damage. J. Immunol. 149, 1470-1475.

Chapter 2
42
27. You, Y., Richer, E.J., Huang, T., Brody, S.L., 2002. Growth and differentiation of mouse tracheal
epithelial cells: selection of a proliferative population. Am. J. Physiol. Lung Cell. Mol. Physiol. 283,
L1315-1321.
28. Zaffuto, K.M., Estevez, C.N., Afonso, C.L., 2008. Primary chicken tracheal cell culture system for the
study of infection with avian respiratory viruses. Avian Pathol. 37, 25-31.
Supplementary data
Table S1. Genes significantly differentially expressed (p < 0.05) in H9N2 infected compared to non-infected TOC
at 24 h.p.i. with associated Ensembl ID.
Description Ensembl ID Fold
changea
Fibromodulin precursor ENSGALG00000003546 1.26
Stabilin-1 precursor ENSGALG00000001535 1.27
TIA1 cytotoxic granule-associated RNA binding protein-like 1 ENSGALG00000009427 1.27
Matrilin-3 precursor ENSGALG00000016478 1.27
T-cell immunoglobulin and mucin domain containing 4 ENSGALG00000003876 1.28
Hypothetical protein (Uniprot/SPTREMBL;Acc:Q5ZJE8) ENSGALG00000008104 1.28
Protein DmX-like 2 ENSGALG00000004805 1.28
Laforin ENSGALG00000012275 1.29
Formimidoyltransferase-cyclodeaminase ENSGALG00000006131 1.29
Hypothetical protein (Uniprot/SPTREMBL;Acc:Q5ZLQ2) ENSGALG00000006378 1.30
Collagen alpha-1(VI) chain precursor ENSGALG00000005974 1.30
Hypothetical protein LOC419466 ENSGALG00000003774 1.30
Sodium channel protein type 3 subunit alpha ENSGALG00000011040 1.31
Probable urocanate hydratase ENSGALG00000006306 1.33
Teneurin-1 ENSGALG00000008442 1.33
Histone-lysine N-methyltransferase, H3 lysine-36 and H4 lysine-20 specific ENSGALG00000002971 1.33
Interleukin-19 precursor ENSGALG00000000911 1.33
Rho-associated coiled coil forming kinase 2 ENSGALG00000016451 1.35
Hyaluronan synthase 3 ENSGALG00000000630 1.38
Protein NOV precursor ENSGALG00000016112 1.39
Hypothetical protein (Uniprot/SPTREMBL;Acc:Q5ZI42) ENSGALG00000008517 1.44
CD8 alpha chain ENSGALG00000015816 1.47
Signal transducer and activator of transcription 4 ENSGALG00000007651 1.72
Cartilage matrix protein precursor ENSGALG00000000548 1.48
Protein PTHB1 ENSGALG00000012188 1.50
High-affinity cAMP-specific and IBMX-insensitive 3',5'-cyclic phosphodiesterase 8B ENSGALG00000004339 1.52
Septin 5 ENSGALG00000001688 1.53
Toll-like receptor 5 ENSGALG00000009392 1.53
Serine/threonine kinase NLK ENSGALG00000005699 1.57
Sn1-specific diacylglycerol lipase alpha ENSGALG00000013306 1.58
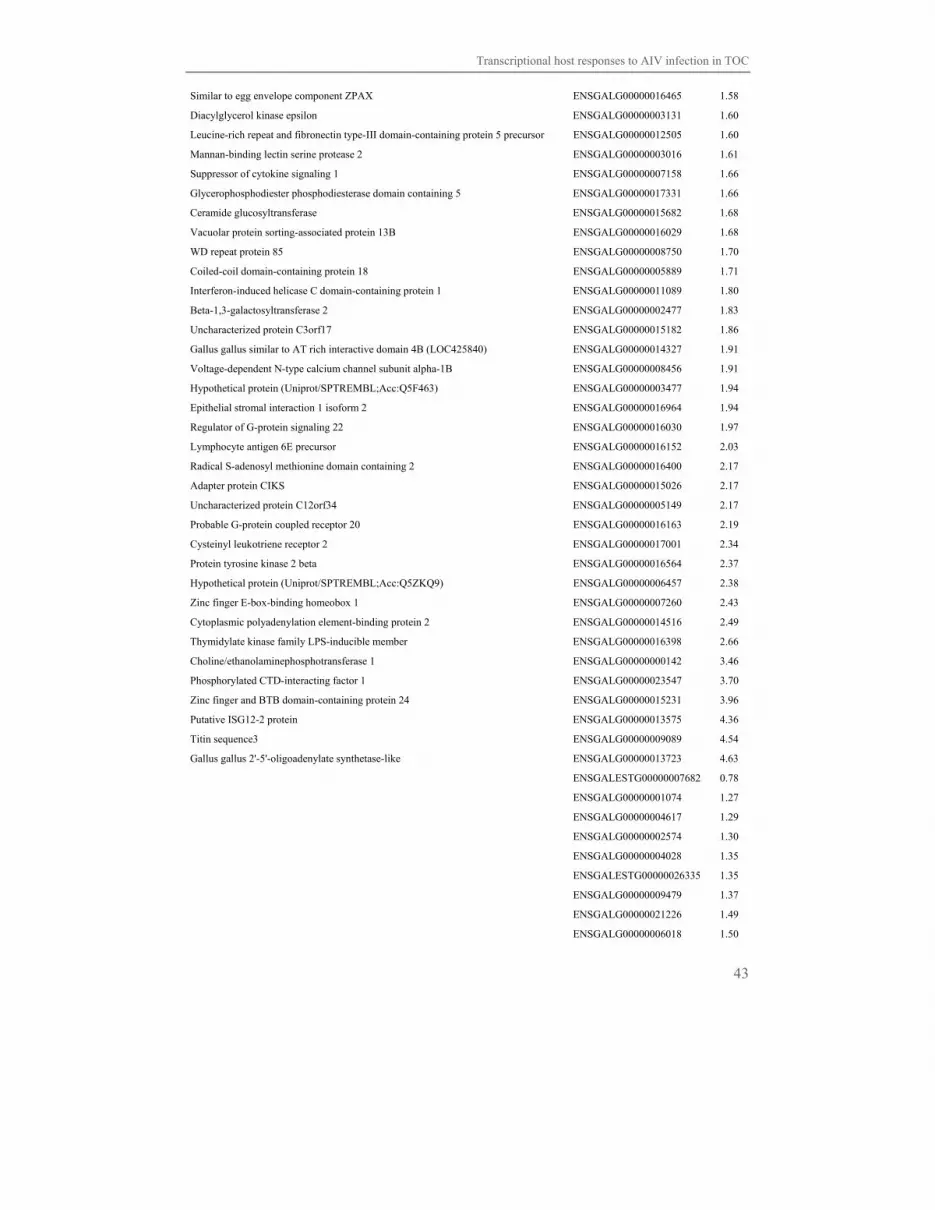
Transcriptional host responses to AIV infection in TOC
43
Similar to egg envelope component ZPAX ENSGALG00000016465 1.58
Diacylglycerol kinase epsilon ENSGALG00000003131 1.60
Leucine-rich repeat and fibronectin type-III domain-containing protein 5 precursor ENSGALG00000012505 1.60
Mannan-binding lectin serine protease 2 ENSGALG00000003016 1.61
Suppressor of cytokine signaling 1 ENSGALG00000007158 1.66
Glycerophosphodiester phosphodiesterase domain containing 5 ENSGALG00000017331 1.66
Ceramide glucosyltransferase ENSGALG00000015682 1.68
Vacuolar protein sorting-associated protein 13B ENSGALG00000016029 1.68
WD repeat protein 85 ENSGALG00000008750 1.70
Coiled-coil domain-containing protein 18 ENSGALG00000005889 1.71
Interferon-induced helicase C domain-containing protein 1 ENSGALG00000011089 1.80
Beta-1,3-galactosyltransferase 2 ENSGALG00000002477 1.83
Uncharacterized protein C3orf17 ENSGALG00000015182 1.86
Gallus gallus similar to AT rich interactive domain 4B (LOC425840) ENSGALG00000014327 1.91
Voltage-dependent N-type calcium channel subunit alpha-1B ENSGALG00000008456 1.91
Hypothetical protein (Uniprot/SPTREMBL;Acc:Q5F463) ENSGALG00000003477 1.94
Epithelial stromal interaction 1 isoform 2 ENSGALG00000016964 1.94
Regulator of G-protein signaling 22 ENSGALG00000016030 1.97
Lymphocyte antigen 6E precursor ENSGALG00000016152 2.03
Radical S-adenosyl methionine domain containing 2 ENSGALG00000016400 2.17
Adapter protein CIKS ENSGALG00000015026 2.17
Uncharacterized protein C12orf34 ENSGALG00000005149 2.17
Probable G-protein coupled receptor 20 ENSGALG00000016163 2.19
Cysteinyl leukotriene receptor 2 ENSGALG00000017001 2.34
Protein tyrosine kinase 2 beta ENSGALG00000016564 2.37
Hypothetical protein (Uniprot/SPTREMBL;Acc:Q5ZKQ9) ENSGALG00000006457 2.38
Zinc finger E-box-binding homeobox 1 ENSGALG00000007260 2.43
Cytoplasmic polyadenylation element-binding protein 2 ENSGALG00000014516 2.49
Thymidylate kinase family LPS-inducible member ENSGALG00000016398 2.66
Choline/ethanolaminephosphotransferase 1 ENSGALG00000000142 3.46
Phosphorylated CTD-interacting factor 1 ENSGALG00000023547 3.70
Zinc finger and BTB domain-containing protein 24 ENSGALG00000015231 3.96
Putative ISG12-2 protein ENSGALG00000013575 4.36
Titin sequence3 ENSGALG00000009089 4.54
Gallus gallus 2'-5'-oligoadenylate synthetase-like ENSGALG00000013723 4.63
ENSGALESTG00000007682 0.78
ENSGALG00000001074 1.27
ENSGALG00000004617 1.29
ENSGALG00000002574 1.30
ENSGALG00000004028 1.35
ENSGALESTG00000026335 1.35
ENSGALG00000009479 1.37
ENSGALG00000021226 1.49
ENSGALG00000006018 1.50

Chapter 2
44
ENSGALG00000020220 1.50
ENSGALG00000023709 1.54
ENSGALG00000011784 1.56
ENSGALG00000006396 1.60
ENSGALG00000023644 1.63
ENSGALG00000001744 1.71
ENSGALG00000005567 1.91
ENSGALG00000013057 1.97
ENSGALG00000021863 2.04
ENSGALG00000020219 2.33
ENSGALG00000002902 2.43
ENSGALG00000017206 2.43
ENSGALG00000007208 3.11
ENSGALG00000002806 4.42
ENSGALESTG00000009290 5.27
ENSGALG00000006384 7.59
ChEST832f13 0.71
ChEST583m7 1.26
ChEST300f17 1.36
ChEST834i23 1.41
ENSGALT00000008995.1 1.42
ENSGALT00000009361.1 1.44
ChEST267l24 1.55
ChEST721o9 1.68
Contig_28_forward 1.71
ChEST432a1 1.71
ChEST1017a23 1.73
ChEST622g7 1.75
ENSGALT00000019233.1 1.95
ENSGALT00000022021.1 2.19
ENSGALT00000025401.1 2.54
ChEST822p4 2.72
Contig_12_reverse 4.43
ENSGALT00000023527.1 5.52
a Fold changes represent the difference in expression levels in infected TOC and trachea.

Chicken Lung Lectin is a functional C-type lectin and
inhibits haemagglutination by Influenza A Virus
Astrid Hogenkamp1, Sylvia S.N. Reemers1, Najiha Isohadouten1, Roland A.P. Romijn2,
Wieger Hemrika2, Mitchell R. White3, Boris Tefsen4, Lonneke Vervelde1, Martin van Eijk1,
Edwin J.A. Veldhuizen1, Henk P. Haagsman1
1 Department of Infectious Diseases and Immunology, Faculty of Veterinary Medicine, Utrecht University, P.O.
Box 80.175, 3508 TD Utrecht, The Netherlands 2ABC Expression Center, Utrecht University, Padualaan 8, 3584 CH Utrecht, The Netherlands 3Boston University School of Medicine, Department of Medicine, Boston MA, USA 4 Department of Molecular Cell Biology and Immunology, Vrije Universiteit Medical Center, 1081 BT
Amsterdam, The Netherlands
Adapted from Veterinary Microbiology, 2009; 130: 37-46
Chapter 3


Structure and functionality of cLL
47
Abstract
Many proteins of the calcium-dependent (C-type) lectin family have been shown to play an
important role in innate immunity. They can bind to a broad range of carbohydrates, which
enables them to interact with ligands present on the surface of micro-organisms. We
previously reported the finding of a new putative chicken lectin, which was predominantly
localized to the respiratory tract, and thus termed chicken lung lectin (cLL). In order to
investigate the biochemical and biophysical properties of cLL, the recombinant protein was
expressed, affinity purified and characterized. Recombinant cLL was expressed as four
differently sized peptides, which is most likely due to post-translational modification.
Crosslinking of the protein led to the formation of two high-molecular weight products,
indicating that cLL forms trimeric and possibly even multimeric subunits. cLL was shown
to have lectin activity, preferentially binding to a-mannose in a calcium-dependent manner.
Furthermore, cLL was shown to inhibit the haemagglutination-activity of human isolates of
Influenza A Virus (IAV), subtype H3N2 and H1N1 and potentially has an anti-viral activity
against avian IAV. These result show that cLL is a true C-type lectin with a very distinct
sugar specificity, and that this chicken lectin could play an important role in innate
immunity.
Introduction
The innate immune system provides a first line defense against potential pathogens,
bridging the interval between exposure to the pathogen and the specific response of the
adaptive immune system. The effectiveness of the innate immune system highly depends on
the recognition of pathogens. For this purpose, the innate immune system relies on pattern
recognition molecules which are capable of binding to regular patterns of carbohydrates
present on the surface of pathogens. Within this group of pattern recognition molecules, the
calcium dependent (C-type) lectins represent a family of proteins which are found
throughout the animal kingdom (Day, 1994). These proteins share a structural homology in
their carbohydrate recognition domains (CRD) but differ with respect to their carbohydrate
specificity. We recently reported the discovery of a chicken lectin which was designated
chicken Lung Lectin (cLL) due to its predominant expression in the chicken respiratory
system (Hogenkamp et al., 2006). Based on sequence homology, cLL was identified as a C-
type lectin, and although it could not be classified as a collectin due to its lack of a collagen
domain, the sequence of its CRD was found to be most homologous to that of the collectin
Surfactant Protein A (SP-A) (39% - 45% similarity, depending on the species, (Hogenkamp
et al., 2006)). To our knowledge, no other C-type lectins with more structural similarities to
cLL have been identified to date. Collectins and several other C-type lectins have been
identified as important molecules in innate immunity. For example, SP-A plays an
Chapter 3
48
important role in innate defense against invading bacterial pathogens in the lung
(Hogenkamp et al., 2007; Wright et al., 2001), as well as viruses, including Influenza A
Virus (IAV). Other lectins such as RegIIIγ (Narushima et al., 1997), and its human
homologue HIP/PAP (Lasserre et al., 1992) that directly affect the gut flora composition,
and have been shown to have direct antimicrobial properties (Cash et al., 2006). Tetranectin
is a secreted C-type lectin (Berglund et al., 1992; Sorensen et al., 1995) which has also been
found in chicken (unpublished data, GenBank accession no. AJ277116). Its function is not
quite clear yet, but it has been suggested to play a role in cellular immunity (Stoevring et
al., 2005). In this study, we expressed recombinant cLL to investigate the structural and
functional characteristics of this protein. The carbohydrate-specificity of cLL was tested,
and the putative protective role of cLL was studied by investigating haemagglutination-
inhibition and neutralization of viral infectivity of various IAV strains.
Materials and Methods
RNA extraction and cDNA synthesis
Total cellular RNA from lung tissue from healthy female Ross 308 broiler chicken was
extracted using TRIzol (Invitrogen) and Magnalyser Green Beads (Roche Diagnostics
GmbH). The cDNAs used as templates in PCR were synthesized using 1 µg DNase I
treated RNA with M-MLV-RT and 500 µg/ml oligo dT12-18 primers (Invitrogen) in a 20
µl reaction volume with incubation at 37°C for 50 min.
Polymerase chain reaction and amplified DNA fragment isolation
To amplify cDNA of the mature peptide sequence of cLL, a PCR reaction was performed
using FastStart DNA Taq-polymerase (Roche Diagnostics Gmbh), cLL-specific forward
primer 5'- GGATCCAAACCAACACAGATTTTTCC-3', and cLL-specific reverse primer
5'- GCGGCCGCAAACTGGCAGACAACAAG-3' (Hogenkamp et al., 2006). The forward
primer contained the BamHI restriction site sequence, and cLL reverse primer contained the
NotI restriction site sequence. Amplification comprised of initial denaturation at 95°C for 2
min, followed by 40 cycles consisting of 95°C for 30s, 49°C for 30s, 72°C for 1 min and a
final extension at 72°C for 7 min. PCR-products were analyzed by agarose gel
electrophoresis and purified with a QIAEX agarose gel extraction kit (Qiagen).
Cloning and sequencing of the PCR products
The purified PCR fragments were ligated into a pCR 4-TOPO plasmid vector (Invitrogen).
Ligated plasmids were transfected into TOP10 Escherichia coli cells by heatshock. Clones
were selected by growth on Luria-Bertani broth (LB)-plates containing 100 µg/ml
kanamycin. Positive clones were screened with PCR for correct product size and
sequenced. Sequence reactions were performed using an ABI PRISM BigDye Terminator
Structure and functionality of cLL
49
v3.0 Ready Reaction Cycle Sequencing kit (Applied Biosystems). All reactions were
carried out in both directions using the T7 and T3 primer sites and separated on an ABI
PRISM 3100 fluorescent DNA sequencer (Applied Biosystems). cLL-inserts were isolated
from positive clones using BamHI and NotI restriction sites and ligated into a pABC-
cystatin-hisN vector with a cystatin signal peptide and an in-frame N-terminal His-tag.
Transfection
HEK293-EBNA cells (ATCC CRL10852) were grown in 90% Freestyle (Gibco) and 10%
Ca2+-free Dulbecco's modified Eagle's medium (DMEM) (Gibco), containing 5% FCS
(Invitrogen), 1% pluronic (Sigma-Aldrich), 10 mM HEPES, 4 mM L-glutamine, 200 U/l
penicillin G, 0.1 mg/l streptomycin and 50 μg/ml geneticin. Cells were maintained in
exponential growth using Erlenmeyer flasks at 120 rpm on an orbital shaker mounted in a
Reach-In CO2 incubator (Clean Air Techniek). HEK293-EBNA cells were transfected
using DNA-PEI (Polysciences) according to Durocher et al. (2002). Briefly, 24 hrs before
transfection, cells were seeded at 2.5 x 10⁵/ml in medium without FCS. The next day DNA-
PEI complexes were formed by a 10 min incubation of plasmid DNA at 20 μg/ml with PEI
at 40 μg/ml in Optimem (Gibco), 25 μl of this mixture was used for each ml of cell culture
to be transfected. Small scale transfections (4 ml) were performed in 6 well plates, large
scale transfections were performed in a Bioreactor (New Brunswich Scientific).
Purification of cLL
The supernatant of transfected HEK293-EBNA cells was collected after 6 days and
concentrated to a final volume of approximately 250 ml using a hollow fiber column
(molecular-mass cut-off 10 kDa, Amersham Biosciences). Purification of cLL was
performed by affinity chromatography (adapted from Van Eijk et al., 2002). Briefly, 1 ml
(bed-volume) mannan-sepharose (Sigma), equilibrated in 50 mM Tris-HCl, 5 mM CaCl2,
and 0.05% (vol/vol) Tween-80, pH 7.4 was added to the supernatant and CaCl2 was added
to a final concentration of 5 mM. The mixture was stirred overnight at 4°C. Sepharose
beads were washed with 25 ml washing buffer (50 mM Tris-HCl, 5 mM CaCl2, 500 mM
NaCl, 0.05% Tween-80, pH 7.4). This washing procedure was repeated with 25 ml washing
buffer without Tween-80. cLL was eluted with 50 mM Tris-HCl, 5 mM EDTA, pH 7.4.
The eluted protein was concentrated using Amicon Ultra centrifugal filter units with a
molecular weight cutoff of 10 kDa (Millipore), after which the buffer was changed to 5 mM
Tris-HCl, 150 mM NaCl, pH 7.4 by repetitive washing. Purified cLL was stored in aliquots
at -20°C.

Chapter 3
50
Electrophoresis and Western Blot Analysis
Proteins (0.1-1 µg/lane) were analyzed by SDS-PAGE as described by Laemmli (Laemmli,
1970) using 10% polyacrylamide gels. Protein bands were visualized by Coomassie
staining. For immunoblot analysis, proteins (0.1-1 µg/lane) were transferred
electrophoretically from the gels onto nitrocellulose membrane. Immunostaining was
performed using mouse anti-His6 monoclonal antibody (Roche Diagnostics Gmbh).
Primary antibodies were detected by peroxidase-conjugated goat anti-rabbit
immunoglobulin G (IgG) (Sigma).
Enzymatic deglycosylation of cLL
N-deglycosylation treatment of cLL was performed using N-glycanase PNGase F
(ProZyme, Inc.) according to the manufacturer's instructions. Briefly, 45 µl cLL (230
µg/ml) was mixed with a 10 µl incubation buffer (0.25 M sodium phosphate, pH 7.0) 2.5 µl
denaturation solution (2% SDS and 1 M β-mercaptoethanol). The sample was heated to
100°C for 5 min, after which the sample was cooled and 2.5 µl detergent solution (15%
NP-40) was added. 2 µl of N-glycanase (5 U/ml) was added, and after 16 hr of incubation
at 37°C, samples were concentrated using Microcon centrifugal filter units (MWCO 10
kDa) (Millipore). Samples were immediately processed for further analysis. O-
deglycosylation treatment was performed using 1 µl 0.5 mU/µl O-Glycosidase (Roche
Diagnostics Gmbh) according to the protocol used for N-glycanase-PNG-ase. However, for
O-glycosidase treatment the cLL storage buffer was changed to phosphate buffer (pH 7.0)
using Microcon centrifugal filter units (MWCO 10 kDa) (Millipore). Deglycosylation by
both N-glycanase-PNG-ase and O-glycosidase was carried out similarly to O-
deglycosylation, but in this case both enzymes were added simultaneously.
DIG-Glycan detection
To assess possible glycosylation of cLL and enzymatically treated cLL, the DIG-Glycan
detection kit (Roche Diagnostics Gmbh) was used according to the manufacturer's
instructions. Briefly, samples containing cLL were loaded onto gel and subsequently
transferred from the gel onto nitrocellulose membrane.
The presence of glycoconjugates was assessed by labeling oxidized sugars with
DIG-0-3-succinyl-ε-aminocaproic acid hydrazide, which was subsequently detected using
anti-digoxigenin-AP and staining with NBT/X-phosphate.
Bis (Sulfosuccinimidyl) suberate (BS)-crosslinking of cLL
Crosslinking of cLL using Bis (Sulfosuccinimidyl) suberate (BS3) (Pierce) was performed
according to the manufacturer's instructions. Briefly, the cLL storage buffer was changed to
10 mM HEPES buffer, pH 7.5 containing 3 mM EDTA using Microcon centrifugal filter
Structure and functionality of cLL
51
units (MWCO 10 kDa) (Millipore). Final concentration of cLL was approximately 170
µg/ml. BS3 (50 mM) was added to the protein solution and incubated at room temperature
for 30 min. The reaction was stopped by adding SDS-PAGE sample buffer to the mixture,
which was subsequently heated to 100°C and loaded onto the gel for further analysis.
MALDI TOF-TOF
After protein separation on 12% SDS-PAGE and fixation in 50% methanol and 7% acetic
acid, cLL was visualized using GelCode Blue Stain reagent (Pierce). The four visible bands
were cut from the gel individually and subjected to in-gel tryptic digestion as previously
described (Van Balkom et al., 2005). Subsequently, these bands were identified by matrix-
assisted laser desorbtion/ionization (MALDI) TOF-TOF analysis. The samples, dissolved
in 0.1% acetic acid, were concentrated using μC18-ZipTips (Millipore) and eluted directly
on the target plates in 1 μl of a saturated solution of R-cyano-4-hydroxycinnamic acid in
50% (v/v) acetonitrile. Data were acquired on a MALDI TOF-TOF instrument (Applied
Biosystems 4700 Proteomics Analyzer) in positive reflectron mode at a laser intensity of
3800 and a bin time of 0.5 ns.
Carbohydrate specificity
Polyacrylamide (PAA)-coupled glycoconjugates (~20% substitution; Lectinity) were coated
(5 µg/ml) in 0.2 M sodium cacodylate buffer (pH 9.2) on maxisorb plates (NUNC)
overnight at 4°C. Plates were blocked with 1% ELISA-grade BSA (Fraction V, fatty acid
free; Calbiochem) in TSM (20 mM Tris-HCL pH 7.4, 150 mM NaCl, 2 mM CaCl2, 2 mM
MgCl2) and cLL was added (10 µg/ml) for 2-3 hrs at 37°C in the presence or absence of 10
mM EDTA. After washing with TSM containing 0.1% Tween-20, 1 μg/ml anti-His6
antibody (Roche Diagnostics Gmbh) was added for 1 hr at room temperature. Binding was
detected using a peroxidase-labeled anti-mouse IgG antibody (Jackson) and measured in a
Benchmark Microplate Reader using the Microplate Manager software (both from Biorad).
Virus inhibition assays
A. Testing the activity of cLL against avian IAV
Tracheal organ cultures (TOC)
Tracheas of 18 day-old Cobb broiler embryos were aseptically removed and placed
immediately in warm culture medium containing DMEM (Gibco) containing 2.38 g HEPES
(Sigma) and 50,000 units penicillin/50,000 μg streptomycin (Gibco) per 500 ml. They were
cut into 3 mm rings resulting in 6 TOC per trachea. TOC were transferred to a 24-well plate
containing culture medium.

Chapter 3
52
Virus and immune serum
Avian IAV, subtype H9N2, isolate A/Chicken/United Arab Emirates/99 was produced in
eggs according to routine procedures. Chicken immune serum was obtained from SPF
chickens 5 weeks after vaccination with H9N2. Virus and immune serum was kindly
provided by Intervet Schering-Plough Animal Health.
Experimental design
TOC were divided randomly and transferred to a 24-well plate (2 TOC per well) containing
culture medium. Culture medium was modified to infection medium by adding 3.5 mM
CaCl2 (Merck). Pre-mixes of virus and lectin were made by combining virus (2*105 EID50
H9N2 / ml infection medium) with chicken lung lectin (cLL; 25 μg/ml), virus with chicken
immune serum, and virus with infection medium as negative control. All tubes were
vortexed briefly and incubated for 1 hour at 37°C, 5 % CO2. Subsequently, culture medium
was removed and 0.25 ml per well premix was added to TOC. Plates were incubated for 1
hour at 37°C, 5 % CO2 after which 0.5 ml infection medium was added. TOC were
harvested at 4 hours post inoculation and stored in RNAlater (Ambion) at -80°C. Test were
run in quintuplicate.
In the first experiment cLL batch 1 (1.1) was used, in the second experiment cLL batch 2
(2.2), in the third experiment cLL batch 3 (3.3) and batch 1 (3.1) and 2 (3.2) were retested.
Real-Time quantitative reverse transcription-polymerase chain reaction (RT-PCR)
Total RNA was isolated using the RNeasy Mini Kit (Qiagen) following manufacturer’s
instructions. Purified RNA was eluted in 30 μl RNase-free water and stored at -80°C.
Reverse transcription was performed using iScript cDNA Synthesis Kit (Biorad
Laboratories B.V.).
Quantitative RT-PCR was performed with a MyiQ Single-Color Real-Time PCR Detection
System (Biorad) using iQ SYBR green supermix (Biorad). Primers (Invitrogen) for
detection of specific GAPDH and H9 haemagglutinin (HA) products were designed
according to previously published sequences (Degen et al., 2006) and used at 400 nM
concentration. Amplification and detection of specific products was achieved with the
following cycle profile: one cycle of 95°C for 5 min, 40 cycles of 92°C for 10 sec, 55°C for
10 sec and 72°C 30 sec. To generate standard curves GAPDH and H9 PCR-fragments were
cloned and used to generate log10 dilution series regression lines. GAPDH was used as a
reference gene for correction of H9 HA RNA expression and 28S as reference gene for the
cytokines. Corrections for variation in RNA preparation and sampling were performed
according to Eldaghayes et al. (2006). Results are expressed in terms of the threshold cycle
value (Ct) and given as corrected 40-Ct values.
Structure and functionality of cLL
53
B. Testing the activity of cLL against human isolates of IAV
Virus preparations
IAV was grown in the chorioallantoic fluid of 10-day-old chicken eggs and purified on a
discontinuous sucrose gradient as described previously (Hartshorn et al., 1988). Virus
stocks were dialyzed against PBS, aliquoted, and stored at -70°C. A/Phillipines/82 (H3N2)
(Phil), and its bovine serum β inhibitor-resistant variant Phil/BS, were provided by Dr. E.
M. Anders (Department of Microbiology, University of Melbourne, Melbourne, Australia).
A/Puerto Rico/8/34 (H1N1) (PR-8), which lacks the high-mannose glycans on the
haemagglutinin molecule, was provided by Dr. J. Abramson (Department of Pediatrics,
Bowman Gray School of Medicine, Wake Forest University, Winston Salem, NC).
Neutralization of infectivity
Madin-Darby canine kidney (MDCK) cell monolayers were prepared in 96-well plates and
grown to confluence. These layers were then infected with a PBS++ (PBS with 1 mM
calcium and 0.5 mM magnesium; Gibco) -diluted IAV preparation (Phil strain) which was
preincubated for 30 min at 37°C in the presence or absence (control) of increasing amounts
of cLL. After exposure of the MDCK cells to the IAV or IAV/cLL mixture for 30 min at
37°C, the cells were washed three times in serum-free DMEM (Gibco) containing 1% (w/v)
penicillin-streptomycin and subsequently incubated for 7 hrs at 37°C. Next, the monolayers
were washed, fixed, and FITC-labeled for IAV nucleoprotein as described previously
(Hartshorn et al., 2002), after which fluorescent foci were counted.
Haemagglutination-inhibition assay
Haemagglutination (HAA)-inhibition was measured by serially diluting collectin
preparations in round-bottom 96-well plates (Serocluster U-Vinyl plates; Costar) using
PBS++ as diluent (25 µl per well). After adding 25 µl of IAV solution, giving a final
concentration of 40 HAA U/ml or 4 HAA U/well, the IAV/cLL mixture was preincubated
for 15 min, followed by the addition of 50 µl of human erythrocyte suspension in PBS++.
The entire procedure was performed at room temperature. The minimal concentration of
cLL, required to fully inhibit the HAA caused by the virus, was determined by reading the
plates after 2 hrs. HAA was detected as the formation of a pellet of erythrocytes.
Statistical analysis
Statistical analysis was performed using SPSS version 12.0.1 for Windows. Analysis of
mean values between groups was carried out using Levene's Test for Equality of Variances.
When equality of variance was assumed, mean values between groups were compared with
an independent t-test, in which p<0.05 was considered to indicate statistical significance.

Chapter 3
54
<---------------------- Signal peptide ---------------------><-1-><-- HIS-tag ---><-2-><----------------------- M-A-R-P-L-C-T-L-L-L-L-M-A-T-L-A-G-A-L-A-G-S-H-H-H-H-H-H-G-S-K-P-T-Q-I-F-P- ---------- N-terminal region -------------------------->< ---------------------------- Neck Domain -------------- V-P-G-F-K-A-E-R-G-I-S-Q-A-Y-L-P-G-F-P-S-V-A-G-S-E-M-D-D-A-V-L-Q-L-K-D-R-I-S- ------------------------------><------------------------------------------------------------------------------------------------------K-L-E-G-V-L-Y-L-Q-G-K-I-T-K-S-G-G-K-I-F-A-T-S-G-K-T-A-D-F-H-A-T-V-K-M-C-Q-E- ------------------------------------------ Carbohydrate Recognition Domain ---------------------------------- A-G-G-C-I-A-S-P-R-N-A-D-E-N-A-A-I-L-H-F-V-K-Q-F-N-R-Y-A-Y-L-G-I-K-E-S-L-I-P- ----------------------------------------------------------------------------------------------------------------------------------------G-T-F-Q-F-L-N-G-G-E-L-S-Y-T-N-W-Y-S-H-E-P-S-G-K-G-E-E-E-C-V-E-M-Y-T-D-G-T- ---------------------------------------------------------->< --3-- > W-N-D-R-R-C-N-Q-N-R-L-V-V-C-Q-F-A-A-A
Figure 1. Predicted amino acid sequence of recombinant cLL. 1: extra Gly-Ser-residues added after signal peptide;
2: extra Gly-Ser-residues added as a result of inserting the BamHI restriction site into the sequence; 3: extra
Alanine-residues added as a result of inserting the NotI restriction site into the sequence
Results
Production and characterization of recombinant cLL
Preliminary results from the small scale transfections (not shown) showed that cLL was
most effectively secreted using the mature peptide sequence ligated into the pABC-cystatin-
hisN vector with a cystatin signal peptide and an in-frame N-terminal His-tag. Therefore,
this vector was selected for large-scale (1 liter) transfections. The predicted amino-acid
sequence of cLL expressed in this vector is shown in Figure 1. Affinity purification of the
recombinant protein using mannan-sepharose yielded approximately 500-800 µg of protein
per 1L batch (Fig. 2A). Analysis of the purified product on SDS PAGE showed that four
different bands varying in size between approximately 22 kDa and 27 kDa were present.
Western Blot analysis using anti-His6 antibody showed a positive signal for all four bands
(Fig. 2B) in the untreated cLL-sample (Lane 1) indicating that all four bands were
recombinant products. To identify whether different glycosylation patterns of the protein
could account for the observed multiplet, a DIG-glycan staining was performed. Results of
this DIG-glycan detection are shown in Figure 2C and indicate that all of the 4 recombinant
protein bands contained sugar moieties. However, enzymatic treatment with N-glycanase /
PNGase or O-glycanase of cLL did not result in a size shift (lane 2-6), that would indicate
loss of sugar moieties. The multimeric state of cLL was investigated by crosslinking
experiments using Bis (Sulfosuccinimidyl) suberate. SDS PAGE analysis of the crosslinked
cLL showed that monomeric cLL bands were not present anymore while two high-
molecular weight bands of approximately 85 kDa and 160 kDa were present (Fig. 3).

Structure and functionality of cLL
55
Figure 2. Production and structural characterization of
cLL. (A) Coomassie staining of cLL eluted from mannan-
sepharose beads. (B) Western Blot-analysis of the eluted
cLL and enzymatically treated cLL using anti-His6. (C)
DIG-glycan detection for both Sham-treated and
enzymatically treated cLL. (B&C): 1: untreated cLL, 2:
Sham-treated N-Glycanase-PNGase, 3: N-Glycanase-
PNGase-treated cLL, 4: N-Glycanase-PNGase and O-
glycosidase-treated cLL, Lane 5: O-glycosidase-treated
cLL, Lane 6: Sham-treatment O-glycosidase.
Analysis by MALDI-TOF-TOF
MALDI-TOF-TOF analysis was performed in order to investigate the cause of appearance
of four bands. However, the spectra of the trypsin-digested protein of all four bands were
similar, and could not explain the size difference observed on SDS-PAGE. Several peaks in
the spectra could be assigned to sequences in the recombinant protein, including the N- and
C-terminus which were retrieved for all four bands (data not shown).
Figure 3. BS-crosslinking of cLL. Left lane: untreated cLL; Right lane:
crosslinked cLL.
Carbohydrate specificity
Carbohydrate specificity of cLL was tested by use of PAA-coupled glycoconjugates. cLL
was observed to preferentially bind to α-mannose-PAA and trimannose-PAA (Man3), but
not to any of the other glycoconjugates (Fig. 4). Binding to α-mannose-PAA and Man3-Paa
was also tested in the presence of EDTA, which significantly reduced the binding,
indicating that cLL binding to α-mannose and Man3 is calcium-dependent.
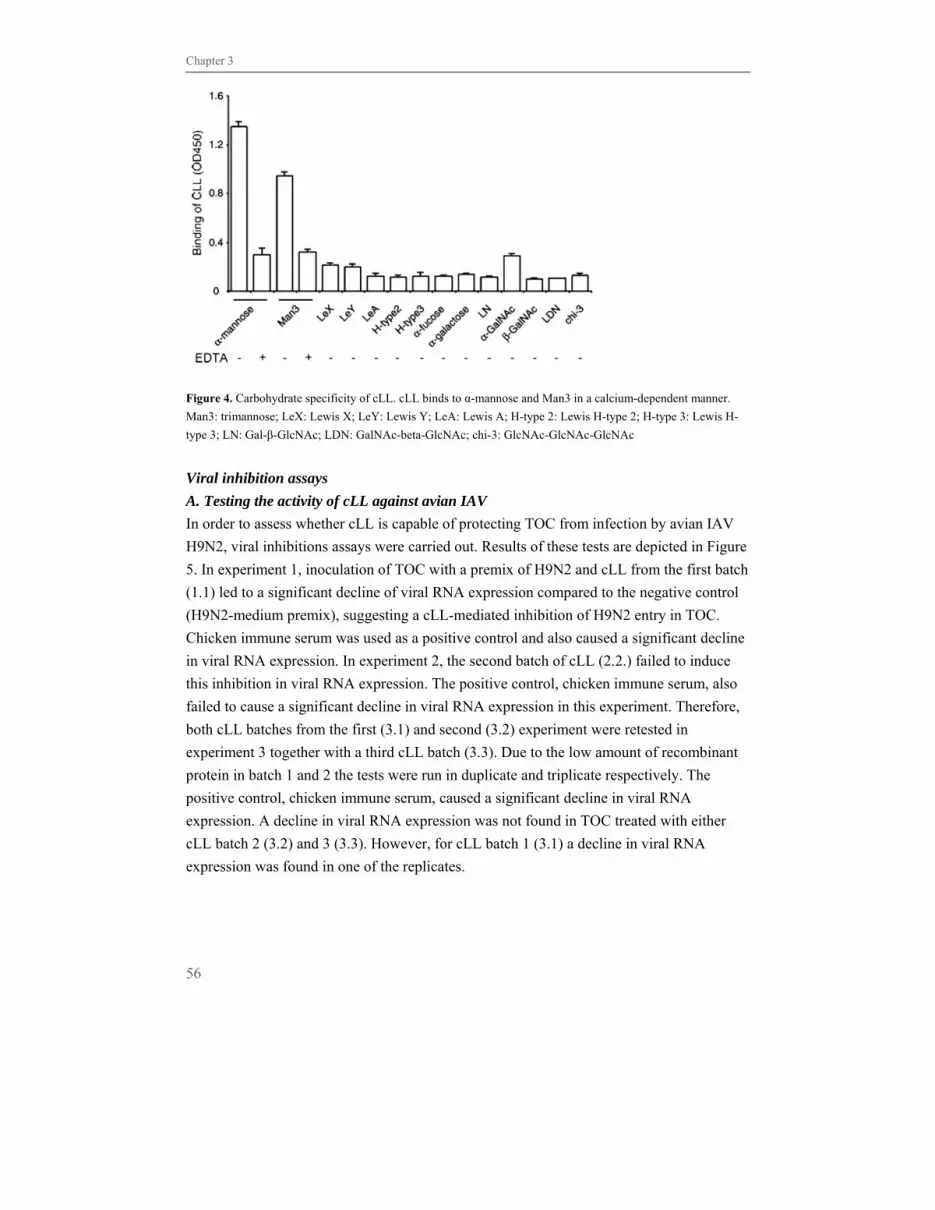
Chapter 3
56
Figure 4. Carbohydrate specificity of cLL. cLL binds to α-mannose and Man3 in a calcium-dependent manner.
Man3: trimannose; LeX: Lewis X; LeY: Lewis Y; LeA: Lewis A; H-type 2: Lewis H-type 2; H-type 3: Lewis H-
type 3; LN: Gal-β-GlcNAc; LDN: GalNAc-beta-GlcNAc; chi-3: GlcNAc-GlcNAc-GlcNAc
Viral inhibition assays
A. Testing the activity of cLL against avian IAV
In order to assess whether cLL is capable of protecting TOC from infection by avian IAV
H9N2, viral inhibitions assays were carried out. Results of these tests are depicted in Figure
5. In experiment 1, inoculation of TOC with a premix of H9N2 and cLL from the first batch
(1.1) led to a significant decline of viral RNA expression compared to the negative control
(H9N2-medium premix), suggesting a cLL-mediated inhibition of H9N2 entry in TOC.
Chicken immune serum was used as a positive control and also caused a significant decline
in viral RNA expression. In experiment 2, the second batch of cLL (2.2.) failed to induce
this inhibition in viral RNA expression. The positive control, chicken immune serum, also
failed to cause a significant decline in viral RNA expression in this experiment. Therefore,
both cLL batches from the first (3.1) and second (3.2) experiment were retested in
experiment 3 together with a third cLL batch (3.3). Due to the low amount of recombinant
protein in batch 1 and 2 the tests were run in duplicate and triplicate respectively. The
positive control, chicken immune serum, caused a significant decline in viral RNA
expression. A decline in viral RNA expression was not found in TOC treated with either
cLL batch 2 (3.2) and 3 (3.3). However, for cLL batch 1 (3.1) a decline in viral RNA
expression was found in one of the replicates.

Structure and functionality of cLL
57
Figure 5. Limited virus entry inhibition by cLL. Viral RNA expression in TOC after inoculation with H9N2 +
medium (negative control), H9N2 + chicken immune serum (positive control) and H9N2 + cLL for 4 h. In the first
experiment cLL batch 1 (1.1.) was used, in the second experiment cLL batch 2 (2.1) and in the third experiment
cLL batch 3 (3.3). In the third experiment batch 1 (3.1) and batch 2 (3.2) were retested. * = significantly different
from the negative control within an experiment (p<0.05).
B. Testing the activity of cLL against human isolates of IAV
Neutralization of infectivity
In order to investigate whether cLL was capable of protecting MDCK cell monolayers from
infection by Phil-strain, Phil/BS-strain or PR-8 strain IAV, virus preparations were
preincubated with increasing concentrations of cLL prior to adding them to the cells. No
differences were observed in the number of fluorescent foci, indicating that cLL does not
interfere with infection of these cells (data not shown).
cLL mediated HAA-inhibition
In the HAA-inhibition-assay, cLL was capable of inhibiting HA-activity of all three human
isolates of IAV tested. The mean concentrations at which erythrocytes were no longer
agglutinated by the virus are depicted in Figure 6. Phil/BS was inhibited at a much lower
concentration of cLL than its parent strain Phil. Haemagglutination-activity of PR-8 was
inhibited at a concentration comparable to that of Phil.
Discussion
We previously reported the finding of cLL which, based on sequence homology, was
predicted to be a C-type lectin (Hogenkamp et al., 2006). The sequence of its CRD is most
similar to SP-A, but cLL does not contain a collagenous domain and therefore could not be
classified as a collectin. To our knowledge, this protein lacks further similarity to other C-
type lectins and should therefore be regarded as a novel type of lectin (Hogenkamp et al.,
2006).
1.1
2.2
3.3
3.1
3.2
Mean value0
2
4
6
8
10
12
14
H9N2 + medium
H9N2 + immune serum
H9N2 + cLL
Cor
rect
ed 4
0-C
t
* *
*
1.1
2.2
3.3
3.1
3.2
Mean value0
2
4
6
8
10
12
14
H9N2 + medium
H9N2 + immune serum
H9N2 + cLL
Cor
rect
ed 4
0-C
t
* *
*

Chapter 3
58
Figure 6. Haemagglutination activity-inhibition by cLL. Minimal concentration of cLL (μg/ml) necessary to
inhibit HA-activity of human isolates of IAV. Values are mean concentration ± s.d. of three separate experiments.
In this study, recombinant cLL was used to further characterize structural and functional
properties of this lectin. It was found that cLL appeared as four differently sized products
on SDS-PAGE gel (Fig. 2A and B). No potential GPI-modification sites were found in the
sequence, and since the sequence of cLL does not contain any potential N- glycosylation
sites, it is highly unlikely that differential N-glycosylation could account for the appearance
of four products instead of one. However, a positive signal was observed for all bands using
the DIG-glycan detection kit (Fig. 2C). Aspecific DIG-labeling or staining may explain this
result. Accordingly, enzymatic treatment with N-Glycanase and/or O-glycosidase did not
result in a size shift (Fig. 2B and C), and no difference in intensity of DIG-glycan staining
was observed between enzymatically treated samples. However, it cannot be excluded that
cLL contains sugar moieties that are insufficiently removed by enzymatic treatment. As for
O-linked glycans, it is known that these glycans are highly heterogeneous while in general
O-glycosidases show a restricted specificity for subclasses of O-linked sugars. Therefore,
we can not exclude the possibility that O-linked glycans are indeed present and result in
heterogeneity of the cLL polypeptide chains as illustrated by results presented in Figure 2.
The four bands obtained by SDS-PAGE analysis on purified cLL were subjected to
MALDI-TOF-TOF and resulted in identical spectra in which the C- and N-terminal
fragments could be retrieved for all four bands, identifying all bands as (isoforms of) cLL.
This method is rather stringent, therefore it is possible that posttranslational modifications
are removed during the procedure. Further analysis using 2D gel electrophoresis combined
with liquid chromatography coupled to tandem mass spectrometry (LC-MS/MS) may
reveal what causes the differences in mass. As this concerns a recombinant protein, it
would be very interesting to find out whether the same size differences are present in native
cLL.
In mammalian species, collectin monomers are known to organize into higher order
multimers (King et al., 1989; Crouch et al., 1994). Crosslinking cLL led to the formation of
two high molecular weight products (Fig. 3), suggesting that this protein is capable of
forming trimeric subunits and higher order subunits. As the largest product observed in the

Structure and functionality of cLL
59
crosslinking was ~160 kDa, corresponding to six monomeric subunits of cLL, it is possible
that cLL is capable of forming hexameric multimers. In support of the assumption that cLL
can form trimers at the least, the presence of heptad repeats in the cLL-amino acid sequence
could allow for the formation of trimeric subunits (Hogenkamp et al., 2006). Furthermore,
it is known that the carbohydrate-binding activity of C-type lectins is quite weak when they
are in their monomeric form (Kishore et al., 1996). During the procedure of affinity-
purifying cLL by use of mannan-sepharose beads, the beads were washed twice with a
relatively large volume of washing buffer. These conditions would most likely be too
stringent if carbohydrate-binding by cLL were weak, making it more likely that this protein
is present as a trimer or a higher multimeric form.
Analysis of the carbohydrate-specificity of cLL revealed that the protein binds to α-
mannose and Man3 in a calcium-dependent manner, but other carbohydrates tested
(including galactose) were not bound by cLL (Fig. 4). It is possible that the presence of a
Glu-Pro-Ser motif in the CRD of cLL accounts for the relatively high specificity of cLL.
Most other mannose type-collectins contain a Glu-Pro-Asn motif (Drickamer, 1992) and
most SP-As contain a Glu-Pro-Arg motif, whilst retaining their preference for mannose
over galactose (McCormack et al., 1994). However, it was shown that substitution of one
amino acid is enough to change the sugar binding specificity of C-type lectins (Drickamer,
1992). It would be interesting to determine if construction of a similar Glu-Pro-Ser motif in
other C-type lectins would result in a comparable specificity for mannose.
The activity of cLL against avian and human isolates of IAV was tested in viral inhibition
assays. Incubating TOC with a premix of avian IAV H9N2 and cLL led to a decline in viral
RNA expression in TOC when the first batch of cLL was used. This result was not
reproducible using other batches of cLL. These results indicate that cLL may have
neutralising activity against avian IAV H9N2, but the activity is not strong. Differences in
posttranslational modifications have been shown to affect collectin functionality while the
binding activity is not affected (Mikerov et al., 2007). Differences in posttranslational
modifications between the chicken and human HEK cells used for protein expression might
have an influence on the cLL neutralisation activity.
In HAA-inhibition assays cLL showed strong activity against the Phil/BS strain (Fig. 6).
Two other strains tested, Phil strain and PR-8, were less susceptible to cLL inhibition. The
infection of MDCK cells by IAV could not be inhibited by cLL which may be explained by
the, compared to collectins, relative weak interaction of cLL with these IAV strains. The
change in equilibrium between cLL-bound and free virus particles could result in a constant
supply of free IAV as MDCK cell infection draws free virus particles from the medium.
This may explain the discrepancy between the results from the MDCK cell infections and
the HAA-inhibition assays. It is not yet clear what mechanism underlies the susceptibility
of the different IAV strains with respect to the inhibition of haemagglutination by cLL. The

Chapter 3
60
Phil/BS strain (subtype H3N2) differs from the parent Phil strain, in that the high-mannose
oligosaccharide overlying the sialic acid receptor-binding site of the HA molecule is absent
(Hartley et al., 1992). It is possible that this reveals targets for cLL binding that are not
available in the parent strain, resulting in increased binding. The PR-8 strain also lacks high
mannose glycans on the HA molecule (Schwarz et al., 1981), but since this concerns a
H1N1 subtype of IAV it is possible that differences in targets available on the HA molecule
or the neuraminidase may result in decreased binding. It will be interesting to see what
mediates cLL binding to IAV, since binding of SP-A (to which cLL is most similar) is
thought to occur via binding of the sialic acid receptor of the virus to sialylated N-linked
oligosaccharide present in the CRD of SP-A (Benne et al., 1995). It is possible that cLL,
similar to SP-D (Hartshorn et al., 2000), binds to HA and neuraminidase in a C-type lectin-
like manner, but the exact mechanism remains to be elucidated.
In summary, the chicken lung lectin was successfully expressed in HEK293-EBNA cells.
The purified protein proved to be a C-type lectin, as predicted from its sequence. Analysis
of its carbohydrate specificity revealed that this protein has an unusual high preference for
binding a-mannose and trimannose. The results of the viral inhibition assays showed that
cLL might have an anti-viral activity against avian IAV. Furthermore, cLL has moderate
HAA-inhibition activity against the human IAV strains Phil and PR-8 and a strong
inhibitory activity against Phil/BS. These results indicate that cLL could play an important
part in the innate immune system of chickens.
Acknowledgements
The authors would like to thank Kevan Hartshorn, Irma van Die, and Albert van Dijk for
support and helpful discussions. Laurie Bruinsma is thanked for her practical assistance.
This work was supported by a research grant (Adaptation and Resistance Program) from the
Animal Sciences Group (Wageningen University and Research Center) and the Faculty of
Veterinary Medicine (Utrecht University), The Netherlands. The authors acknowledge the
support by the Commission of the European Community (Contract Number 512093).
Sylvia Reemers was financially supported by a BSIK VIRGO consortium grant (Grant no.
03012), The Netherlands.
References
1. Benne, C.A., Kraaijeveld, C.A., Van Strijp, J.A., Brouwer, E., Harmsen, M., Verhoef, J., Van Golde,
L.M., Van Iwaarden, J.F., 1995. Interactions of surfactant protein A with influenza A viruses: binding
and neutralization. J. Infect. Dis. 171, 335-341.
2. Berglund, L., Petersen, T.E., 1992. The gene structure of tetranectin, a plasminogen binding protein.
FEBS Lett, 309, 15-19.
3. Cash, H.L., Whitham, C.V., Behrendt, C.L., Hooper, LV., 2006. Symbiotic bacteria direct expression
of an intestinal bactericidal lectin. Science 313, 1126-1130.

Structure and functionality of cLL
61
4. Crouch, E., Persson, A., Chang, D., Heuser, J., 1994. Molecular structure of pulmonary surfactant
protein D (SP-D). J. Biol. Chem. 269, 17311-17319.
5. Day, A.J., 1994. The C-type carbohydrate recognition domain (CRD) superfamily. Biochem. Soc.
Trans. 22, 83-88.
6. Degen, W.G., Smith, J., Simmelink, B., Glass, E.J., Burt, D.W., Schijns, V.E., 2006. Molecular
immunophenotyping of lungs and spleens in naive and vaccinated chickens early after pulmonary avian
influenza A (H9N2) virus infection. Vaccine 24, 6096-6109.
7. Drickamer, K., 1992. Engineering galactose-binding activity into a C-type mannose-binding protein.
Nature 360, 183-186.
8. Durocher, Y., Perret, S., Kamen, A., 2002. High-level and high-throughput recombinant protein
production by transient transfection of suspension-growing human 293-EBNA1 cells. Nucleic Acids
Res. 30, E9.
9. Eldaghayes, I., Rothwell, L., Williams, A., Withers, D., Balu, S., Davison, F., Kaiser, P., 2006.
Infectious bursal disease virus: strains that differ in virulence differentially modulate the innate
immune response to infection in the chicken bursa. Viral Immunol. 19, 83-91.
10. Hartley, C.A., Jackson, D.C., Anders, E.M., 1992. Two distinct serum mannose-binding lectins
function as beta inhibitors of influenza virus: identification of bovine serum beta inhibitor as
conglutinin. J. Virol. 66, 4358-4363.
11. Hartshorn, K.L., Collamer, M., Auerbach, M., Myers, J.B., Pavlotsky, N., Tauber, A.I., 1988. Effects of
influenza A virus on human neutrophil calcium metabolism. J. Immunol. 141, 1295-1301.
12. Hartshorn, K.L., Holmskov, U., Hansen, S., Zhang, P., Meschi, J., Mogues, T., White, M.R., Crouch,
E.C., 2002. Distinctive anti-influenza properties of recombinant collectin 43. Biochem. J. 366, 87-96.
13. Hartshorn, K.L., White, M.R., Voelker, D.R., Coburn, J., Zaner, K., Crouch, E.C., 2000. Mechanism of
binding of surfactant protein D to influenza A viruses: importance of binding to haemagglutinin to
antiviral activity. Biochem. J. 351, 449-458.
14. Hogenkamp, A., Van Eijk, M., Haagsman, H.P., 2007. Collectins - Interactions with pathogens. In:
Kilpatrick D. (Ed. Collagen-Related Lectins in Innate Immunity. Research Signpost, Kerala, India, pp.
119-177.
15. Hogenkamp, A., Van Eijk, M., Van Dijk, A., Van Asten, A.J., Veldhuizen, E.J., Haagsman, H.P., 2006.
Characterization and expression sites of newly identified chicken collectins. Mol. Immunol. 43, 1604-
1616.
16. King, R.J., Simon, D., Horowitz, P.M., 1989. Aspects of secondary and quaternary structure of
surfactant protein A from canine lung. Biochim. Biophys. Acta 1001, 294-301.
17. Kishore, U., Wang, J.Y., Hoppe, H.J., Reid, K.B., 1996. The alpha-helical neck region of human lung
surfactant protein D is essential for the binding of the carbohydrate recognition domains to
lipopolysaccharides and phospholipids. Biochem. J. 318, 505-511.
18. Laemmli, U.K., 1970. Cleavage of structural proteins during the assembly of the head of bacteriophage
T4. Nature 227, 680-685.
19. Lasserre, C., Christa, L., Simon, M.T., Vernier, P., Brechot, C., 1992. A novel gene (HIP) activated in
human primary liver cancer. Cancer Res. 52, 5089-5095.
20. McCormack, F.X., Kuroki, Y., Stewart, J.J., Mason, R.J., Voelker, D.R., 1994. Surfactant protein A
amino acids Glu195 and Arg197 are essential for receptor binding, phospholipid aggregation,
regulation of secretion, and the facilitated uptake of phospholipid by type II cells. J. Biol. Chem. 269,
29801-29807.
21. Mikerov, A.N., Wang, G., Umstead, T.M., Zacharatos, M., Thomas, N.J., Phelps, D.S., Floros, J., 2007.
Surfactant protein A2 (SP-A2) variants expressed in CHO cells stimulate phagocytosis of Pseudomonas
aeruginosa more than do SP-A1 variants. Infect. Immun. 75, 1403-1412.

Chapter 3
62
22. Narushima, Y., Unno, M., Nakagawara, K., Mori, M., Miyashita, H., Suzuki, Y., Noguchi, N.,
Takasawa, S., Kumagai, T., Yonekura, H., Okamoto, H., 1997. Structure, chromosomal localization
and expression of mouse genes encoding type III Reg, RegIII alpha, RegIII beta, RegIII gamma. Gene
185, 159-168.
23. Schwarz, R.T., Klenk, H.D., 1981. Carbohydrates of influenza virus. IV. Strain-dependent variations.
Virology 113, 584-593.
24. Sorensen, C.B., Berglund, L., Petersen, T.E., 1995. Cloning of a cDNA encoding murine tetranectin.
Gene 152, 243-245.
25. Stoevring, B., Jaliashvili, I., Thougaard, A.V., Ensinger, C., Hogdall, C.K., Rasmussen, L.S.,
Sellebjerg, F., Christiansen, M., 2005. Tetranectin in cerebrospinal fluid: biochemical characterisation
and evidence of intrathecal synthesis or selective uptake into CSF. Clin. Chim. Acta 359, 65-71.
26. Van Balkom, B.W., Van Gestel, R.A., Brouwers, J.F., Krijgsveld, J., Tielens, A.G., Heck, A.J., Van
Hellemond, J.J., 2005. Mass spectrometric analysis of the Schistosoma mansoni tegumental sub-
proteome. J. Proteome Res. 4, 958-966.
27. Van Eijk, M., Van de Lest, C.H., Batenburg, J.J., Vaandrager, A.B., Meschi, J., Hartshorn, K.L., Van
Golde, L.M., Haagsman, H.P., 2002. Porcine surfactant protein D is N-glycosylated in its carbohydrate
recognition domain and is assembled into differently charged oligomers. Am. J. Respir. Cell. Mol.
Biol. 26, 739-747.
28. Wright, J.R., Borron, P., Brinker, K.G., Folz, R.J., 2001. Surfactant Protein A: regulation of innate and
adaptive immune responses in lung inflammation. Am. J. Respir. Cell. Mol. Biol. 24, 513-517.

Transcriptional expression levels of chicken collectins
are affected by avian influenza A virus inoculation
Sylvia S. Reemers, Edwin J.A. Veldhuizen, Cherina Fleming, Daphne A. van Haarlem,
Henk Haagsman, Lonneke Vervelde
Department of Infectious Diseases and Immunology, Faculty Veterinary Medicine, Utrecht University, Yalelaan 1,
3584 CL Utrecht, The Netherlands
Veterinary Microbiology, 2010; 141: 379-384
Chapter 4

Effects of AIV inoculation on expression of chicken collectins
65
Abstract
Mammalian collectins have been found to play an important role in the defense against
influenza A virus H9N2 inoculation, but for chicken collectins this has not yet been
clarified. The aim of this study was to determine the effect of avian influenza A virus (AIV)
inoculation on collectin gene expression in the respiratory tract of chickens and whether
this was affected by age. For this purpose 1- and 4-week-old chickens were inoculated
intratracheally with PBS or H9N2 AIV. Chickens were killed at 0, 8, 16 and 24 h post
inoculation and trachea and lung were harvested for analysis. Viral RNA expression and
mRNA expression of chicken collectins 1 and 2 (cCL-1 and cCL-2), chicken lung lectin
(cLL) and chicken surfactant protein A (cSP-A) were determined using real-time
quantitative RT-PCR. In lung, a decrease in mRNA expression of cCL-2, cLL and cSP-A
after inoculation with H9N2 was seen in both 1- and 4-week-old birds, although at different
time points, while in trachea changes were only seen in 4-week-old birds and expression
was increased. Moreover, collectin expression correlated with viral RNA expression in lung
of 1-week-old birds. These results suggest that both age and location in the respiratory tract
affect changes in collectin mRNA expression after inoculation with H9N2 and indicate a
possible role for collectins in the host response to AIV in the respiratory tract of chickens.
Introduction
The first line of defense against invading pathogens in the respiratory tract is provided by
the innate immune system. This phylogenetically ancient system does not require previous
exposure to a pathogen and acts within hours after the first encounter. Especially in the
early stages of life, the host is highly dependent on innate immunity for protection because
the adaptive immune system is not fully developed yet. An important group of effector
molecules of the innate immune system comprises collectins, proteins characterized by a
collagen- and a C-type lectin domain. These proteins are pattern recognition molecules that
can bind and neutralize a wide array of pathogens including bacteria and viruses
(Hogenkamp et al., 2007).
For mammalian collectins, several in vitro studies have described a strong neutralizing
activity against influenza A virus (Hartshorn et al., 1997; Van Eijk et al., 2003; White et al.,
2008). Collectins are thought to bind carbohydrate residues present on influenza
haemagglutinin and neuraminidase, thereby aggregating viral particles and preventing
invasion of host cells (Reading et al., 2007). In addition, a highly reduced clearance of
influenza virus was observed in mice lacking either surfactant protein A or surfactant
protein D, implicating the importance of these mammalian collectins in defense against
influenza virus inoculations in vivo (Sano et al., 2005). In chicken, five collectins have been
described thus far, which are mannan binding lectin (Laursen et al., 1998), surfactant
Chapter 4
66
protein A (cSP-A) and chicken collectins 1, 2 and 3 (cCL-1-3) (Hogenkamp et al., 2006). In
addition, a chicken lung lectin (cLL) with high sequence homology to cSP-A was reported.
Whether chicken collectins can protect against influenza A virus inoculation has not been
clarified, but cLL has been shown to possess in vitro haemagglutination inhibiting activity
(Hogenkamp et al., 2008).
Avian influenza virus (AIV) enters the respiratory epithelium using sialic acid receptors
linked to galactose by an α-2,3 linkage, although the pattern of receptor distribution in
chickens is less defined than in mammals (Wan et al., 2006). H9N2 AIV has been shown to
have a preference for infecting the upper part of the respiratory tract (Nili et al., 2002).
After spray inoculation, viral replication was detected at 24 hours post inoculation in both
trachea and lung of chickens. Virus was first detected in the epithelium of the trachea,
intrapulmonary bronchus and in adjacent parabronchi, and thereafter spread to other
parabronchi deeper in the lung (Reemers et al., 2009).
The aim of the current work was to determine changes in gene expression of chicken
collectins upon AIV inoculation in the respiratory tract of 1- and 4-week-old chickens and
the effect of age on collectin gene expression after AIV inoculation.
Materials and methods
Inoculation model
AIV, subtype H9N2, isolate A/Chicken/United Arab Emirates/99 was kindly provided by
Intervet Schering-Plough Animal Health. The experiment was carried out according to
protocols approved by the Animal Experiment Committee of Utrecht University. One-week
and four-week-old Lohmann Brown layer chickens were inoculated intratracheally with
either 0.1 ml PBS or 107.7 EID50 H9N2. Before inoculation 5 control chickens per age were
killed and at 8, 16 and 24 h post inoculation (p.i.) 5 control and 5 H9N2 inoculated
chickens per age were killed. The cranial part of the lung containing the intrapulmonary
bronchus and the upper trachea were used for analysis.
Real-time quantitative RT-PCR (qRT-PCR)
Lung and trachea were homogenized and total RNA was isolated using the RNeasy Mini
Kit and DNase treated (Qiagen) as described previously (Reemers et al., 2009). cDNA was
generated with reverse transcription using iScript cDNA Synthesis Kit (Biorad Laboratories
B.V.).
Detection of GAPDH, H9 haemagglutinin (HA) and 28S products was performed as
described by Reemers et al. (2009). Real-time qRT-PCR was performed for cCL-1, cCL-2,
cLL and cSP-A using primers and probes depicted in Table 1 according to the following
cycle protocol: 2 min at 50°C, 10 min at 95°C (denaturation); 40 cycles: 15 s at 95°C and
60 s at 60°C. GAPDH was used as a reference gene for correction of viral HA RNA

Effects of AIV inoculation on expression of chicken collectins
67
expression and 28S as reference gene for collectin mRNA expression. Corrections for
variation in RNA preparation and sampling were performed as previously described
(Reemers et al., 2009). Results are expressed in terms of the threshold cycle value (Ct) and
given as corrected 40-Ct values.
Table 1. Real-time qRT-PCR primers and probes
Target Probe or primera
sequence (5’-3’) Accession No.b
cCL-1 F R Probe
5'- ATTGTCAAAGAAGAGAAGAATTACAGAG -3' 5'- GAGGAGATGTAATCAGCAAGCAG -3' 5'- (FAM) – CGTTGGTCACCTCATCTTTAGGCATGGC – (BHQ) - 3'
DQ129668
cCL-2 F R Probe
5'- GGGAGCCCAACAATGCCTATG -3' 5'- GTAATATGACATGCAACATCATTCCAC -3' 5'- (FAM) – TGCCACCATCTCCACACAGTCCTCCTC – (BHQ) -3'
DQ129669
cLL F R Probe
5'- CTTACAAGGGAAGATAACAAAGTCTGG -3' 5'- CATTCCTTGGAGATGCAATACACC -3' 5'- (FAM) - CTCCTGGCACATTTTCACCGTAGCATGG – (BHQ) - 3'
DQ129667
cSP-A F R Probe
5'- GGAATGACAGAAGGTGCAATCAG -3' 5'- GCAATGTTGAGTTTATTAGCTACAAATG -3' 5'- (FAM) – CCGCCTTGTTGTCTGCCAGTTTTAGTGC – (BHQ) - 3'
AF411083
a F, forward; R, reverse; b Genomic DNA sequence
Statistical analysis
Significance between H9N2 inoculated and control samples and between age groups within
a time point was determined with an ANOVA. Significance between time points within age
groups and treatment groups was determined with an ANOVA and Tukey post-hoc test.
Correlation between viral RNA and collectin mRNA expression was based on the Pearson
correlation coefficient (r) and determined using SPSS 15.0 software. Data were expressed
as means with standard error of the mean (SEM). A p-value < 0.05 was considered
significant.
Results
Viral RNA expression in lung and trachea
Viral RNA expression was detected in lung and trachea of all H9N2 inoculated birds (Fig.
1). There was no significant difference in viral RNA levels in lung between 1- and 4-week-
old birds within a time point or between time points within an age group. In trachea there
was no significant difference between 1-week and 4-week-old birds within a time point.
Only the decline of viral RNA expression in trachea of 1-week-old birds at 24 h.p.i. was
significantly different from the expression at 16 h.p.i.
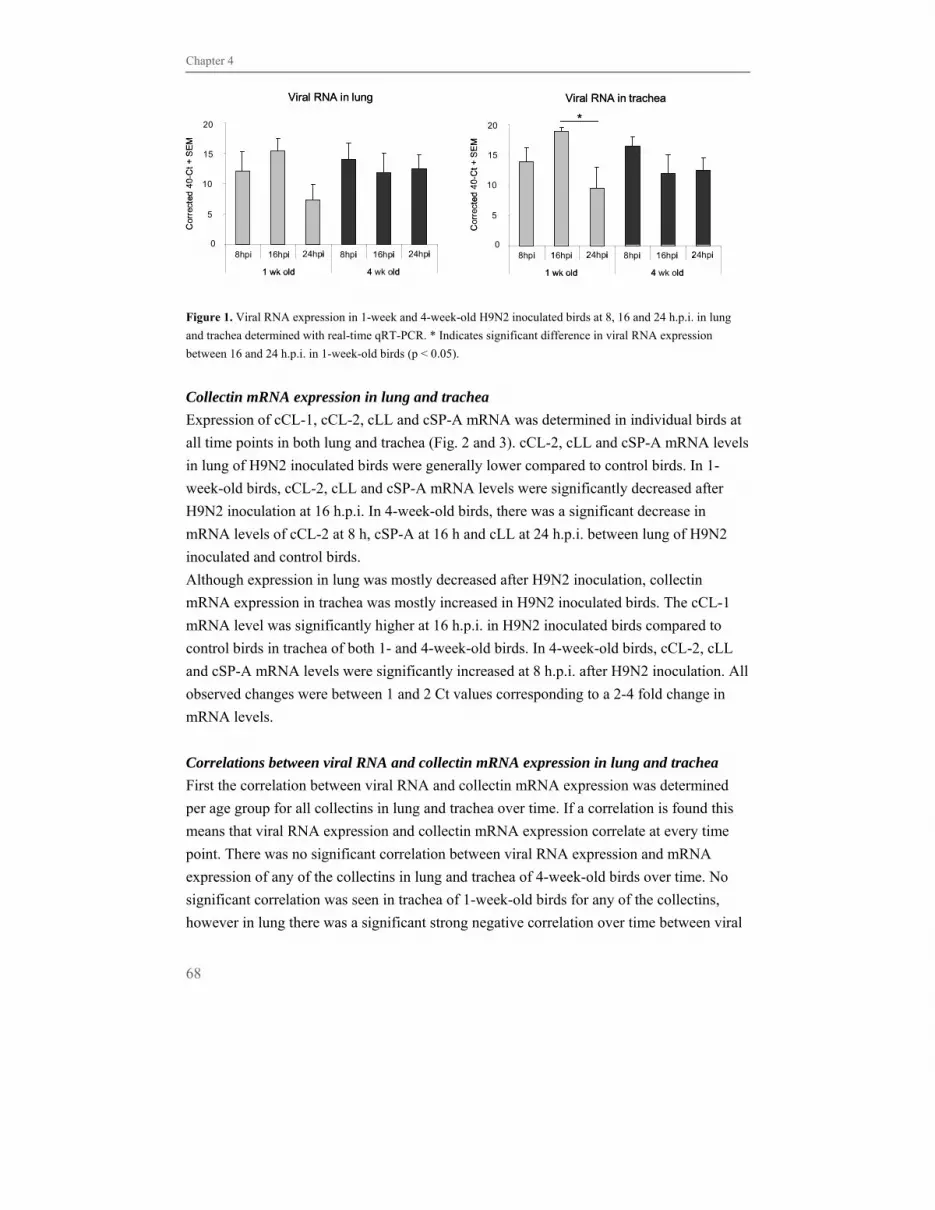
Chapter 4
68
Figure 1. Viral RNA expression in 1-week and 4-week-old H9N2 inoculated birds at 8, 16 and 24 h.p.i. in lung
and trachea determined with real-time qRT-PCR. * Indicates significant difference in viral RNA expression
between 16 and 24 h.p.i. in 1-week-old birds (p < 0.05).
Collectin mRNA expression in lung and trachea
Expression of cCL-1, cCL-2, cLL and cSP-A mRNA was determined in individual birds at
all time points in both lung and trachea (Fig. 2 and 3). cCL-2, cLL and cSP-A mRNA levels
in lung of H9N2 inoculated birds were generally lower compared to control birds. In 1-
week-old birds, cCL-2, cLL and cSP-A mRNA levels were significantly decreased after
H9N2 inoculation at 16 h.p.i. In 4-week-old birds, there was a significant decrease in
mRNA levels of cCL-2 at 8 h, cSP-A at 16 h and cLL at 24 h.p.i. between lung of H9N2
inoculated and control birds.
Although expression in lung was mostly decreased after H9N2 inoculation, collectin
mRNA expression in trachea was mostly increased in H9N2 inoculated birds. The cCL-1
mRNA level was significantly higher at 16 h.p.i. in H9N2 inoculated birds compared to
control birds in trachea of both 1- and 4-week-old birds. In 4-week-old birds, cCL-2, cLL
and cSP-A mRNA levels were significantly increased at 8 h.p.i. after H9N2 inoculation. All
observed changes were between 1 and 2 Ct values corresponding to a 2-4 fold change in
mRNA levels.
Correlations between viral RNA and collectin mRNA expression in lung and trachea
First the correlation between viral RNA and collectin mRNA expression was determined
per age group for all collectins in lung and trachea over time. If a correlation is found this
means that viral RNA expression and collectin mRNA expression correlate at every time
point. There was no significant correlation between viral RNA expression and mRNA
expression of any of the collectins in lung and trachea of 4-week-old birds over time. No
significant correlation was seen in trachea of 1-week-old birds for any of the collectins,
however in lung there was a significant strong negative correlation over time between viral
0
5
10
15
20
8 hr 16 hr 24 hr 8 hr 16 hr 24 hr
1 wk 4 wk
16hpi16hpi 24hpi 8hpi 24hpi
1 wk old 4 wk old
0
Viral RNA in lung
15
20
8hpi
5
10C
orre
cted
40-
Ct
+ S
EM
0
5
10
15
20
8 hr 16 hr 24 hr 8 hr 16 hr 24 hr
1 wk 4 wk
16hpi16hpi 24hpi 8hpi 24hpi
1 wk old 4 wk old
0
Viral RNA in lung
15
20
8hpi
5
10C
orre
cted
40-
Ct
+ S
EM
0
5
10
15
20
8 hr 16 hr 24 hr 8 hr 16 hr 24 hr
1wk 4w k
8hpi 16hpi 24hpi 8hpi 16hpi 24hpi
1 wk old 4 wk old
0
Viral RNA in trachea
5
10
15
20
Cor
rect
ed4
0-C
t +
SE
M
*
0
5
10
15
20
8 hr 16 hr 24 hr 8 hr 16 hr 24 hr
1wk 4w k
8hpi 16hpi 24hpi 8hpi 16hpi 24hpi
1 wk old 4 wk old
0
Viral RNA in trachea
5
10
15
20
Cor
rect
ed4
0-C
t +
SE
M
*
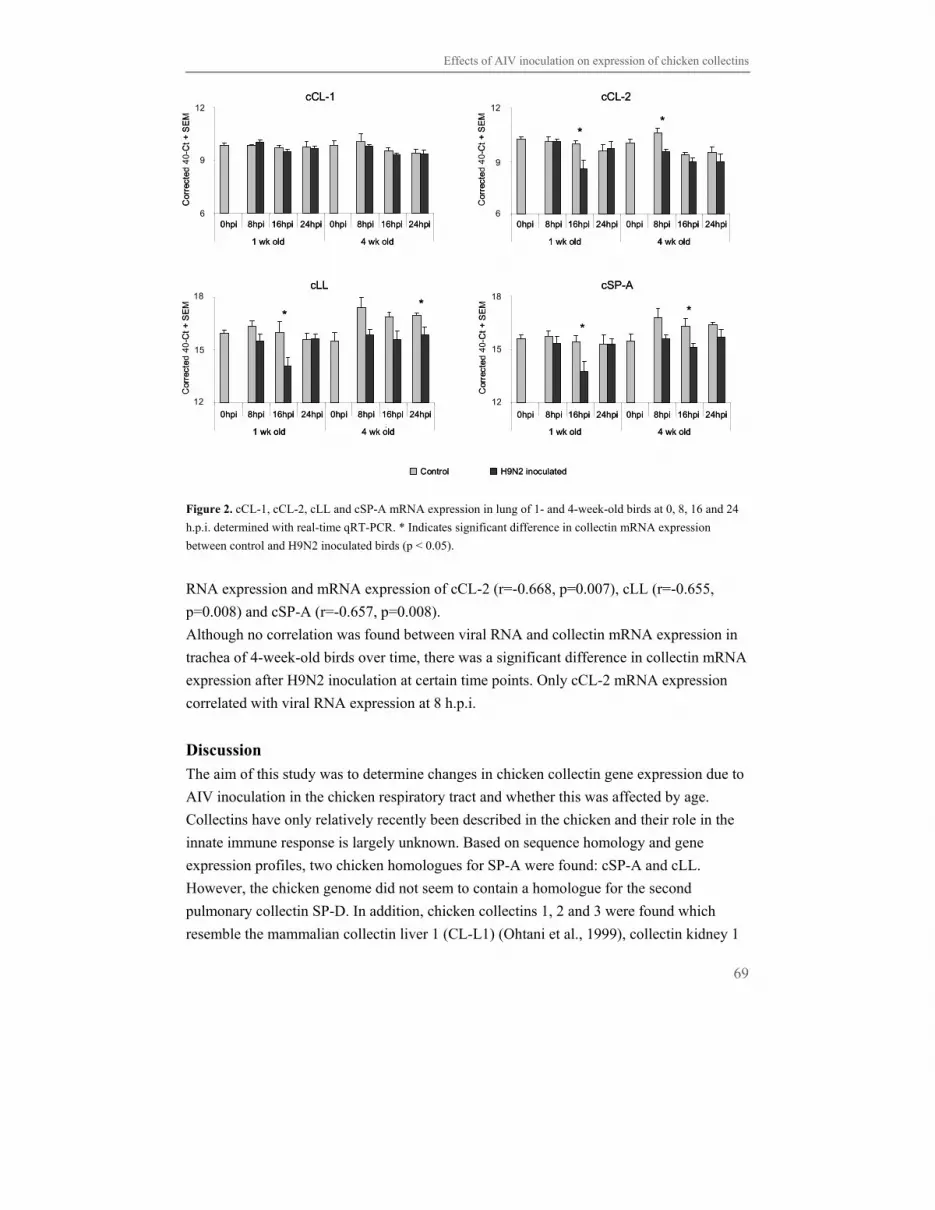
Effects of AIV inoculation on expression of chicken collectins
69
Figure 2. cCL-1, cCL-2, cLL and cSP-A mRNA expression in lung of 1- and 4-week-old birds at 0, 8, 16 and 24
h.p.i. determined with real-time qRT-PCR. * Indicates significant difference in collectin mRNA expression
between control and H9N2 inoculated birds (p < 0.05).
RNA expression and mRNA expression of cCL-2 (r=-0.668, p=0.007), cLL (r=-0.655,
p=0.008) and cSP-A (r=-0.657, p=0.008).
Although no correlation was found between viral RNA and collectin mRNA expression in
trachea of 4-week-old birds over time, there was a significant difference in collectin mRNA
expression after H9N2 inoculation at certain time points. Only cCL-2 mRNA expression
correlated with viral RNA expression at 8 h.p.i.
Discussion
The aim of this study was to determine changes in chicken collectin gene expression due to
AIV inoculation in the chicken respiratory tract and whether this was affected by age.
Collectins have only relatively recently been described in the chicken and their role in the
innate immune response is largely unknown. Based on sequence homology and gene
expression profiles, two chicken homologues for SP-A were found: cSP-A and cLL.
However, the chicken genome did not seem to contain a homologue for the second
pulmonary collectin SP-D. In addition, chicken collectins 1, 2 and 3 were found which
resemble the mammalian collectin liver 1 (CL-L1) (Ohtani et al., 1999), collectin kidney 1
Control H9N2 inoculatedControl H9N2 inoculated
6
9
12
0 hr 8 hr 16 hr 24 hr 0 hr 8 hr 16 hr 24 hr
1 wk 4 w k
12
9
Cor
rect
ed4
0-C
t +
SE
M
cCL-1
60hpi 8hpi 16hpi 24hpi
1 wk old
0hpi 8hpi 16hpi 24hpi
4 wk old
6
9
12
0 hr 8 hr 16 hr 24 hr 0 hr 8 hr 16 hr 24 hr
1 wk 4 w k
12
9
Cor
rect
ed4
0-C
t +
SE
M
cCL-1
60hpi 8hpi 16hpi 24hpi
1 wk old
0hpi 8hpi 16hpi 24hpi
4 wk old
0hpi 8hpi 16hpi 24hpi
1 wk old
0hpi 8hpi 16hpi 24hpi
4 wk old
6
9
12
0 hr 8 hr 16 hr 24 hr 0 hr 8 hr 16 hr 24 hr
1 w k 4 wk
12
9
6
Cor
rect
ed4
0-C
t +
SE
M
cCL-2
**
0hpi 8hpi 16hpi 24hpi
1 wk old
0hpi 8hpi 16hpi 24hpi
4 wk old
6
9
12
0 hr 8 hr 16 hr 24 hr 0 hr 8 hr 16 hr 24 hr
1 w k 4 wk
12
9
6
Cor
rect
ed4
0-C
t +
SE
M
cCL-2
**
0hpi 8hpi 16hpi 24hpi
1 wk old
0hpi 8hpi 16hpi 24hpi
4 wk old
0hpi 8hpi 16hpi 24hpi
1 wk old
0hpi 8hpi 16hpi 24hpi
4 wk old
12
15
18
0 hr 8 hr 16 hr 24 hr 0 hr 8 hr 16 hr 24 hr
1 w k 4 wk
18
15
12
Cor
rect
ed4
0-C
t +
SE
M
cLL
**
0hpi 8hpi 16hpi 24hpi
1 wk old
0hpi 8hpi 16hpi 24hpi
4 wk old
12
15
18
0 hr 8 hr 16 hr 24 hr 0 hr 8 hr 16 hr 24 hr
1 w k 4 wk
18
15
12
Cor
rect
ed4
0-C
t +
SE
M
cLL
**
0hpi 8hpi 16hpi 24hpi
1 wk old
0hpi 8hpi 16hpi 24hpi
4 wk old
0hpi 8hpi 16hpi 24hpi
1 wk old
0hpi 8hpi 16hpi 24hpi
4 wk old
12
15
18
0 hr 8 hr 16 hr 24 hr 0 hr 8 hr 16 hr 24 hr
1 wk 4 w k
18
15
12
Cor
rect
ed4
0-C
t +
SE
M
cSP-A
**
0hpi 8hpi 16hpi 24hpi
1 wk old
0hpi 8hpi 16hpi 24hpi
4 wk old
12
15
18
0 hr 8 hr 16 hr 24 hr 0 hr 8 hr 16 hr 24 hr
1 wk 4 w k
18
15
12
Cor
rect
ed4
0-C
t +
SE
M
cSP-A
**
0hpi 8hpi 16hpi 24hpi
1 wk old
0hpi 8hpi 16hpi 24hpi
4 wk old
0hpi 8hpi 16hpi 24hpi
1 wk old
0hpi 8hpi 16hpi 24hpi
4 wk old

Chapter 4
70
Figure 3. cCL-1, cCL-2, cLL and cSP-A mRNA expression in trachea of 1- and 4-week-old birds at 0, 8, 16 and
24 h.p.i. determined with real-time qRT-PCR. * Indicates significant difference in collectin mRNA expression
between control and H9N2 inoculated birds (p < 0.05).
(CL-K1) (Keshi et al., 2006) and collectin placenta 1 (CL-P1) (Ohtani et al., 2001). The
biological roles of CL-L1 and CL-K1 have not been determined yet, leaving no indication
for a possible role of chicken collectins cCL-1 and cCL-2. However, both cCL-1 and cCL-2
are expressed in the chicken respiratory tract (Hogenkamp et al., 2007). The cCL-3
homologue CL-P1 is different from other collectins in the way that it is a type II membrane
protein. It acts as a scavenger receptor on endothelial cells, while all other collectins are
soluble effector molecules involved in direct neutralization of pathogens. A role for cCL-3
in direct neutralization of viruses in the lung is therefore unlikely.
Based on this similarity to mammalian collectins and the location of expression in the
chicken we investigated the changes in mRNA expression of cSP-A, cLL, cCL-1 and cCL-
2 after an H9N2 AIV inoculation in the chicken respiratory tract. In the lung of 1 week-old
birds, a down regulation was observed for cLL, cSP-A and cCL-2 mRNA, at 16 h.p.i. This
time point significantly correlated to the observed peak in viral load in the lung. In addition
the expression of cCL-2 and cSP-A mRNA was down regulated in 4-week-old birds at 8
and 16 h.p.i., but no correlation to viral RNA expression was found. This indicates that
expression of cSP-A, cLL and cCL-2 mRNA expression is affected by H9N2 inoculation
3
6
9
0hr 8hr 16hr 24hr 0hr 8hr 16hr 24hr
1 wk 4wk
*
*
9
6
3
Cor
rect
ed4
0-C
t +
SE
M
cCL-1
0hpi 8hpi 16hpi 24hpi
1 wk old
0hpi 8hpi 16hpi 24hpi
4 wk old
3
6
9
0hr 8hr 16hr 24hr 0hr 8hr 16hr 24hr
1 wk 4wk
*
*
9
6
3
Cor
rect
ed4
0-C
t +
SE
M
cCL-1
0hpi 8hpi 16hpi 24hpi
1 wk old
0hpi 8hpi 16hpi 24hpi
4 wk old
0hpi 8hpi 16hpi 24hpi
1 wk old
0hpi 8hpi 16hpi 24hpi
4 wk old
3
6
9
0hr 8hr 16hr 24hr 0hr 8hr 16hr 24hr
1 wk 4wk
9
6
3
Cor
rect
ed4
0-C
t +
SE
M
cCL-2
*
0hpi 8hpi 16hpi 24hpi
1 wk old
0hpi 8hpi 16hpi 24hpi
4 wk old
3
6
9
0hr 8hr 16hr 24hr 0hr 8hr 16hr 24hr
1 wk 4wk
9
6
3
Cor
rect
ed4
0-C
t +
SE
M
cCL-2
*
0hpi 8hpi 16hpi 24hpi
1 wk old
0hpi 8hpi 16hpi 24hpi
4 wk old
0hpi 8hpi 16hpi 24hpi
1 wk old
0hpi 8hpi 16hpi 24hpi
4 wk old
12
15
18
0hr 8hr 16hr 24hr 0hr 8hr 16hr 24hr
1 wk 4wk
*18
15
cLL
12
Cor
rect
ed4
0-C
t +
SE
M
0hpi 8hpi 16hpi 24hpi
1 wk old
0hpi 8hpi 16hpi 24hpi
4 wk old
12
15
18
0hr 8hr 16hr 24hr 0hr 8hr 16hr 24hr
1 wk 4wk
*18
15
cLL
12
Cor
rect
ed4
0-C
t +
SE
M
0hpi 8hpi 16hpi 24hpi
1 wk old
0hpi 8hpi 16hpi 24hpi
4 wk old
0hpi 8hpi 16hpi 24hpi
1 wk old
0hpi 8hpi 16hpi 24hpi
4 wk old
9
12
15
0hr 8hr 16hr 24hr 0hr 8hr 16hr 24hr
1 wk 4wk
15
12
9
Cor
rect
ed4
0-C
t +
SE
M
cSP-A
*
0hpi 8hpi 16hpi 24hpi
1 wk old
0hpi 8hpi 16hpi 24hpi
4 wk old
9
12
15
0hr 8hr 16hr 24hr 0hr 8hr 16hr 24hr
1 wk 4wk
15
12
9
Cor
rect
ed4
0-C
t +
SE
M
cSP-A
*
0hpi 8hpi 16hpi 24hpi
1 wk old
0hpi 8hpi 16hpi 24hpi
4 wk old
0hpi 8hpi 16hpi 24hpi
1 wk old
0hpi 8hpi 16hpi 24hpi
4 wk old
Control H9N2 inoculatedControl H9N2 inoculated

Effects of AIV inoculation on expression of chicken collectins
71
early after inoculation and in 1-week-old birds is directly related to viral RNA expression in
lung. Interestingly, in the trachea, all significant changes due to H9N2 inoculation were
related to up regulation of collectin mRNA expression, suggesting host collectin responses
after H9N2 inoculation are site specific. cCL-1 was up regulated at 16 h.p.i. in trachea of
both 1- and 4-week-old birds, while cCL-1 mRNA expression was not affected by H9N2
inoculation in lung. This suggests that changes of cCL-1 mRNA expression after H9N2
inoculation are dependent on the location in the respiratory tract. cCL-2 expression was
affected by H9N2 inoculation in 4-week-old birds at 8 h.p.i. in both lung and trachea,
although down regulated in lung and up regulated in trachea, indicating that cCL-2 mRNA
expression changes time specifically at 8 h.p.i. after H9N2 inoculation. In lung, changes in
mRNA expression of cCL-2, cLL and cSP-A after H9N2 inoculation were seen in both 1-
and 4-week-old birds, although at different time points, while in trachea changes were only
seen in 4-week-old birds. This suggests that both age and location in the respiratory tract
affect changes in collectin mRNA expression after H9N2 inoculation, though one has to
keep in mind that changes found at early time points are caused by the virus inoculum
whereas at 24 h.p.i. viral replication might affect the outcome. In mammals site specific
expression and secretion of collectins in the airways has been reported (Coalson et al.,
1998; Rooney, 2001). Furthermore, down regulation of SP-A gene expression through p38
MAPK and PI-3 kinase pathways have been described in lung epithelial cells (Miakotina et
al., 2002a; Miakotina et al., 2002b). Epithelial cells in the lung differ from tracheal ciliated
epithelial cells supporting the possibility of site specific collectin expression after H9N2
inoculation in the chicken. Whether similar signalling pathways are involved in regulation
of chicken collectins needs to be addressed to clarify our observed tissue specific changes
of these collectins.
Without knowing the exact function of chicken (col)lectins in innate defense , it is difficult
to relate the observed changes in gene expression to a biological effect. In mammals, an up
regulation of collectins has frequently been observed in both bacterial and viral infections
(Murray et al., 2002; Grubor et al., 2004), which is usually interpreted as a direct response
of the host to increase its defense against the incoming pathogens. A down regulation of
collectins upon infection is less frequently reported, but could reflect a survival strategy of
the pathogen to overcome the host’s hostile environment, as has been described for other
innate immune proteins such as Toll like receptors and defensins (Wang et al., 2000; Shin
et al., 2007). However, whether this applies to AIV in the chicken lung and why the altered
expression of chicken (col)lectins is tissue specific is not clear at this moment and requires
further investigation.
In conclusion, the results obtained in this study show that mRNA expression of chicken
collectins cCL-1, cCL-2, and cSP-A and cLL are affected by H9N2 AIV inoculation. The
effect is tissue specific, showing up regulated mRNA expression in the trachea and down

Chapter 4
72
regulation in the lung. Furthermore, changes in collectin mRNA expression are age
specific, showing differential gene expression in 1- and 4-week old birds. These observed
changes in collectin mRNA expression implicate that chicken collectins can play an
important role in innate defense against viral infection, especially in neonates. More
research is needed to relate the changes in collectin mRNA expression after H9N2 AIV
inoculation to a biological function and clarify the function of collectins within the innate
response to infection.
Acknowledgements
We thank Astrid Hogenkamp from the Department of Pharmaceutical Sciences for
stimulating discussions. This study is financially supported by a BSIK VIRGO consortium
grant (Grant no. 03012), the EU sixth framework program Flupath (Grant no. 044220) and
the Dutch consortium Veterinary Network Avian Influenza (FES).
References
1. Coalson, J.J., Winter, V., Yang, F., 1998. Site specificity of surfactant protein expression in airways of
baboons during gestation. Anat. Rec. 250, 300-315.
2. Grubor, B., Gallup, J.M., Meyerholz, D.K., Crouch, E.C., Evans, R.B., Brogden, K.A., Lehmkuhl,
H.D., Ackermann, M.R., 2004. Enhanced surfactant protein and defensin mRNA levels and reduced
viral replication during parainfluenza virus type 3 pneumonia in neonatal lambs. Clin. Diagn. Lab.
Immunol. 11, 599-607.
3. Hartshorn, K.L., White, M.R., Shepherd, V., Reid, K., Jensenius, J.C., Crouch, E.C., 1997.
Mechanisms of anti-influenza activity of surfactant proteins A and D: comparison with serum
collectins. Am. J. Physiol. 273, L1156-1166.
4. Hogenkamp, A., Isohadouten, N., Reemers, S.S.N., Romijn, R.A., Hemrika, W., White, M.R., Tefsen,
B., Vervelde, L., Van Eijk, M., Veldhuizen, E.J.A., Haagsman, H.P., 2008. Chicken Lung Lectin is a
functional C-type lectin and inhibits haemagglutination by Influenza A Virus. Vet. Microbiol. 130, 37-
46.
5. Hogenkamp, A., Van Eijk, M., Haagsman, H.P., 2007. Collectins - Interactions with pathogens. In:
Kilpatrick, D. (Ed.), Collagen-Related Lectins in Innate Immunity, Research Signpost, Kerala, India,
pp. 119-178.
6. Hogenkamp, A., Van Eijk, M., Van Dijk, A., Van Asten, A.J., Veldhuizen, E.J.A., Haagsman, H.P.,
2006. Characterization and expression sites of newly identified chicken collectins. Mol. Immunol. 43,
1604-1616.
7. Keshi, H., Sakamoto, T., Kawai, T., Ohtani, K., Katoh, T., Jang, S.J., Motomura, W., Yoshizaki, T.,
Fukuda, M., Koyama, S., Fukuzawa, J., Fukuoh, A., Yoshida, I., Suzuki, Y., Wakamiya, N., 2006.
Identification and characterization of a novel human collectin CL-K1. Microbiol. Immunol. 50, 1001-
1013.
8. Laursen, S.B., Dalgaard, T.S., Thiel, S., Lim, B.L., Jensen, T.V., Juul-Madsen, H.R., Takahashi, A.,
Hamana, T., Kawakami, M., Jensenius, J.C., 1998. Cloning and sequencing of a cDNA encoding
chicken mannan-binding lectin (MBL) and comparison with mammalian analogues. Immunology 93,
421-430.
9. Miakotina, O.L., Goss, K.L., Snyder, J.M., 2002a. Insulin utilizes the PI 3-kinase pathway to inhibit
SP-A gene expression in lung epithelial cells. Respir. Res. 3, 27.

Effects of AIV inoculation on expression of chicken collectins
73
10. Miakotina, O.L., Snyder, J.M., 2002b. TNF-alpha inhibits SP-A gene expression in lung epithelial cells
via p38 MAPK. Am. J. Physiol. Lung Cell. Mol. Physiol. 283, L418-427.
11. Murray, E., Khamri, W., Walker, M.M., Eggleton, P., Moran, A.P., Ferris, J.A., Knapp, S., Karim,
Q.N., Worku, M., Strong, P., Reid, K.B., Thursz, M.R., 2002. Expression of surfactant protein D in the
human gastric mucosa and during Helicobacter pylori infection. Infect. Immun. 70, 1481-1487.
12. Nili, H., Asasi, K., 2002. Natural cases and an experimental study of H9N2 avian influenza in
commercial broiler chickens of Iran. Avian Pathol. 31, 247-252.
13. Ohtani, K., Suzuki, Y., Eda, S., Kawai, T., Kase, T., Keshi, H., Sakai, Y., Fukuoh, A., Sakamoto, T.,
Itabe, H., Suzutani, T., Ogasawara, M., Yoshida, I., Wakamiya, N., 2001. The membrane-type collectin
CL-P1 is a scavenger receptor on vascular endothelial cells. J. Biol. Chem. 276, 44222-44228.
14. Ohtani, K., Suzuki, Y., Eda, S., Kawai, T., Kase, T., Yamazaki, H., Shimada, T., Keshi, H., Sakai, Y.,
Fukuoh, A., Sakamoto, T., Wakamiya, N., 1999. Molecular cloning of a novel human collectin from
liver (CL-L1). J. Biol. Chem. 274, 13681-13689.
15. Reading, P.C., Tate, M.D., Pickett, D.L., Brooks, A.G., 2007. Glycosylation as a target for recognition
of influenza viruses by the innate immune system. Adv. Exp. Med. Biol. 598, 279-292.
16. Reemers, S.S., Van Haarlem, D.A., Groot Koerkamp, M.J., Vervelde, L., 2009. Differential gene
expression and host response profiles against avian influenza virus within the chicken lung due to
anatomy and airflow. J. Gen. Virol. 90, 2134-2146.
17. Rooney, S.A., 2001. Regulation of surfactant secretion. Comp. Biochem. Physiol. A Mol. Integr.
Physiol. 129, 233-243.
18. Sano, H., Kuroki, Y., 2005. The lung collectins, SP-A and SP-D, modulate pulmonary innate
immunity. Mol. Immunol. 42, 279-287.
19. Shin, H., Mally, M., Kuhn, M., Paroz, C., Cornelis, G.R., 2007. Escape from immune surveillance by
Capnocytophaga canimorsus. J. Infect. Dis. 195, 375-386.
20. Van Eijk, M., White, M.R., Crouch, E.C., Batenburg, J.J., Vaandrager, A.B., Van Golde,
L.M.,Haagsman, H.P., Hartshorn, K.L., 2003. Porcine pulmonary collectins show distinct interactions
with influenza A viruses: role of the N-linked oligosaccharides in the carbohydrate recognition domain.
J. Immunol. 171, 1431-1440.
21. Wan, H., Perez, D.R., 2006. Quail carry sialic acid receptors compatible with binding of avian and
human influenza viruses. Virology 346, 278-286.
22. Wang, T., Lafuse, W.P., Zwilling, B.S., 2000. Regulation of toll-like receptor 2 expression by
macrophages following Mycobacterium avium infection. J. Immunol. 165, 6308-6313.
23. White, M., Kingma, P., Tecle, T., Kacak, N., Linders, B., Heuser, J., Crouch, E., Hartshorn, K., 2008.
Multimerization of surfactant protein D, but not its collagen domain, is required for antiviral and
opsonic activities related to influenza virus. J. Immunol. 181, 7936-7943.


Differential gene expression and host response profiles
against avian influenza virus within the chicken lung due
to anatomy and airflow
Sylvia S. Reemers1, Daphne A. van Haarlem1, Marian J. Groot Koerkamp2, Lonneke
Vervelde1
1Department of Infectious Diseases and Immunology, Faculty Veterinary Medicine, Utrecht University, Yalelaan
1, 3584 CL Utrecht, The Netherlands 2Genomics Laboratory, Department of Physiological Chemistry, Utrecht Medical Centre, Universiteitsweg 100,
3584 CG Utrecht, The Netherlands
Journal of General Virology, 2009; 90: 2134-2146
Chapter 5


Airflow and anatomy affect host responses to AIV infection in the avian lung
77
Abstract
Sampling the complete organ instead of defined parts might affect the analysis at both
cellular and transcriptional level. We defined host responses to H9N2 avian influenza virus
(AIV) in trachea and different parts of the lung. Chickens were spray inoculated with either
saline or H9N2 AIV. Trachea and lung were sampled at 1 and 3 days post inoculation
(d.p.i.) for immunocytochemistry, real-time qRT-PCR and gene expression profiling. The
trachea was divided into upper and lower trachea and lung into 4 segments according to
anatomy and airflow. Two segments contained the primary and secondary bronchi cranial
vs caudal (part L1 and L3) and two segments contained the tertiary bronchi cranial vs
caudal (part L2 and L4). Between upper and lower trachea in both control and infected
birds minor differences in gene expression and host responses were found. In the lung of
control birds differences in anatomy were reflected in gene expression, and in the lung of
infected birds virus deposition enhanced the differences in gene expression. Differential
gene expression in trachea and lung suggested common responses to a wide range of agents
and site specific responses. In trachea site specific response were related to heat shock and
lysozyme activity. In lung L1, containing most virus, site specific responses related to
genes involved in innate responses, interleukin activity and endocytosis. Our study
implicates that anatomy of the chicken lung has to be taken into account when investigating
in vivo responses to respiratory virus infections.
Introduction
Avian influenza virus (AIV) infection is a continuing threat to both humans and birds
worldwide. In order to control outbreaks, research into new intervention strategies and
vaccines is ongoing. Therefore studies into pathogenesis and host-virus interactions are
being performed (Kash et al., 2004; Baskin et al., 2005; Degen et al., 2006). Host-virus
interactions depend on the ability of the virus to enter to host cells. The molecules used by
avian and human influenza viruses to enter the respiratory tract are sialic acid linked to
galactose by respectively an α-2,3 or α-2,6 linkage and are not equally distributed.
Differences in virus entry generally correspond with variation in the type of sialic acid
expressed in the respective host species (Shinya et al., 2006; Van Riel et al., 2007). The
pattern of receptor distribution in chickens was shown to be less defined than in mammals
(Wan et al., 2005). In chickens uneven spread of low pathogenic AIV (LPAI) has been
shown for H9N2 with a preference for infecting the upper part of the respiratory tract (Nili
et al., 2002). Difference in distribution of virus within the respiratory tract has an impact on
the host responses, as shown for infected macaques (Baas et al., 2006). Host responses to
respiratory viral infections have only been investigated in the whole lung, one part of the

Chapter 5
78
lung or a pool of samples without taking the anatomy and airflow, bidirectional in
mammals and unidirectional in birds, through the respiratory tract into account.
Herein we describe that gene expression within the lung of control chickens was affected
by anatomy, and airflow affected virus deposition and thereby the localised host responses.
The trachea and lung of saline and H9N2 AIV inoculated birds were sampled 1 and 3 days
post inoculation (d.p.i.). The trachea was divided in upper and lower trachea and the lung
into 4 parts based on airflow (Fig. 1). The airflow is unidirectional and ventilation is
performed by the air sacs (Fedde et al., 1998). Between upper and lower trachea in both
control and H9N2 infected birds minor differences in gene expression were seen. In the
different parts of the lung in control birds gene expression differed significantly in that
expression was similar in L1 and L3 and in L2 and L4. In infected birds L1 and L3
contained larger and more virus infected areas than L2 and L4, which enhanced differences
in gene expression already seen in control birds. Our data showed that anatomy and airflow
in lung of both control and infected birds affect gene expression, virus deposition and
subsequently host responses. The trachea and lung shared expression of genes involved in
common host responses, but several genes were expressed site specifically. Our study
suggests that anatomy and airflow especially of the avian lung have to be taken into account
when investigating in vivo host responses to respiratory virus infections.
Methods
Infection model
Avian influenza A virus, subtype H9N2, isolate A/Chicken/United Arab Emirates/99 was
provided by Intervet Schering-Plough Animal Health.
One-day-old White Leghorn chickens were housed under SPF conditions and all
experiments were carried out according to protocols approved by the Intervet Animal
Welfare Committee.
Chickens were divided into 2 groups over 2 isolators, infected and non-infected, containing
20 birds per group. Fourteen-day-old chickens were inoculated via aerosol spray with either
20 ml 107.7 EID50 H9N2 AIV or with 20 ml saline per isolator. Each isolator contained 20
birds, and of these birds 8 were used for the experiment described here. Chickens remained
in the closed isolator for 10 min, after which the isolator was ventilated as before. At 1 and
3 d.p.i. chickens were killed (n = 4 per time point per group) and trachea and left lung were
isolated and stored in RNAlater (Ambion) at -80°C for RNA isolation and liquid nitrogen
for immunocytochemistry. Trachea was divided into upper and lower trachea and lung was
divided into 4 pieces (Fig. 1), lung L1 to L4.

Airflow and anatomy affect host responses to AIV infection in the avian lung
79
A. B. C.
Figure 1. A) Right chicken lung with a blunt probe indicating the localization of the primary bronchus. The lung
was divided in 4 parts, L1 to L4 according to airflow and lung anatomy, with the primary bronchus entering the
lung in L1. The syrinx with the primary bronchus is shown on the left side. The white blocks indicate the part of
the lung segments used for RNA isolation. The remainder of the segments was used for immunocytochemistry.
Illustration of the air flow pattern during B) inspiration and C) expiration in the avian lung. During inhalation, air
flows through the primary bronchus into the caudal air sacs or through the mediodorsal and lateroventral
secondary bronchi. This caudal to cranial flow pattern is also evident during expiration. 1. Primary bronchus, 2.
lung, 3. clavicular air sac, 4. cranial thoracic air sac, 5. caudal thoracic air sac, 6. abdominal air sac. Adapted and
reprinted with permission (Kothlow et al., 2008), Copyright 2008.
Immunocytochemistry
Detection of viral NP and cellular influxes in cryosections was described previously by
Vervelde et al. (1996). Viral NP was detected with a mouse monoclonal antibody to NP of
H9N2 (provided by Intervet Int.). KUL-01+ cells (macrophages; Mast et al., 1998) and
CD4+ cells were detected with monoclonal antibodies KUL-01 and CT-4 (Southern
Biotech). For the detection of CD8α+ cells a mixture of monoclonal antibodies EP72
(Southern Biotech) and AV14 (kind gift of Dr T.F. Davison, Institute for Animal Health,
Compton UK; Withers et al., 2005) was used to avoid differences in staining due to
polymorphism in the chicken CD8α molecule (Breed et al., 1996; Luhtala et al., 1997).
RNA isolation
Total RNA was isolated from upper and lower trachea (5 mm per part of the trachea) and
all 4 segments of the lung (an 1x5 mm part per segment of the lung; Fig. 1A) using the
RNeasy Mini Kit and DNase treated using the RNase-free DNase Set following
manufacturer’s instructions (Qiagen). All RNA samples were checked for quantity using a
spectrophotometer (Shimadzu) and quality using a 2100 Bioanalyzer (Agilent
Technologies).
Real-time quantitative RT-PCR (qRT-PCR)
cDNA was generated from 500 ng RNA with reverse transcription using iScript cDNA
Synthesis Kit (Biorad Laboratories B.V.). Real-time qRT-PCR was performed using iQ
SYBR green supermix (Biorad) and the TaqMan Universal PCR Master Mix (Applied
Biosystems, AB). Primers (Invitrogen) and probes (AB) were described by Degen et al.
L2
L1 L3
L4
Primary bronchus
6
1 2
3
5
Inspiration
1
2
3
5
6
Expiration
4 4

Chapter 5
80
(2006) and Eldaghayes et al. (2006). Detection of GAPDH and H9 haemagglutinin (HA)
was described by Degen et al. (2006). Primers were used at 400 nM concentration.
Detection of interleukins (IL), interferon beta (IFN-β) and 28S was described by Ariaans et
al. (2008). Primers were used at 600 nM and probes at 100 nM concentration. Corrections
for variation in RNA preparation and sampling were performed according to Eldaghayes et
al. (2006).
A paired t-test was used to determine the statistical significance between upper and lower
trachea samples from the same bird. To determine the statistical significance between parts
of the lung an ANOVA with a Tukey post-hoc test was used. A p-value < 0.05 was
considered significant.
Oligonucleotide microarray analysis
For microarray analysis the Gallus gallus Roslin/ARK CoRe Array Ready Oligo Set V1.0
(Operon Biotechnologies) was used. The array was spotted onto Codelink activated slides
(GE Healthcare) and contains 20,460 oligo probes representing chicken genes, and 3828
control spots, used for QC and normalisation purposes (Van de Peppel et al., 2003). RNA
amplification and labelling were performed according to Roepman et al. (2005). All
hybridizations contained 2.5 µg cRNA per channel on a HS4800Pro hybstation (Tecan
Benelux BVBA). All trachea and lung samples were co-hybridised with respectively a
trachea or lung reference sample. These reference samples consisted of RNA extracted
from tracheas or lungs of 4 chickens that were not included in the infection experiment.
Slides were scanned with an G2565AA scanner (Agilent Technologies) at 100% laser
power, 30% PMT. Resulting image files were analyzed using Imagene 8.0 (BioDiscovery,
Inc.). Within slide normalisation was performed with Printtip Loess (Yang et al., 2002) on
mean data without background subtraction. Groups of replicates were analysed using
ANOVA (Wu et al., 2003). In a fixed effect analysis, sample, array and dye effects were
modelled. P-values were determined by a permutation F2-test, in which residuals were
shuffled 5000 times globally. Genes with p < 0.05 after family wise error correction were
considered significantly differentially expressed and were selected to be included for
further analysis. Visualisation and cluster-analysis were performed using GeneSpring 7.2
(Agilent Technologies). Ensembl Gallus gallus (assembly: WASHUC2, May 2006,
genebuild: Ensembl, Aug 2006, database version: 47.2e) was used for gene names,
description and Gene Ontology (GO) annotations. Primary data are available in the public
domain through Expression Array Manager (www.ebi.ac.uk/arrayexpress/?#ae=main[0])
under accession numbers E-TABM-637 for trachea and E-TABM-636 for lung.

Airflow and anatomy affect host responses to AIV infection in the avian lung
81
Results
Responses in upper and lower trachea are similar
Trachea of control birds at 3 d.p.i. was used to analyse global and immune related gene
expression. The immune related category was based on the Gene Ontology (GO) terms
host-pathogen interaction, external stimulus and immune response. Gene expressions were
depicted in a scatterplot in which upper and lower trachea were plotted against each other
(Fig. 2A). Only few genes were significantly (p < 0.05) and with ≥ 2-fold difference
expressed (Table 1). These genes are involved in clathrin-independent vesicular transport,
nuclear organization, energy metabolism and calcium binding.
IL-1β, IL-6 and IFN-β mRNA expression was measured in trachea of control birds at 3
d.p.i. (Fig. 2B) and no significant differences in expression were found between upper and
lower trachea.
In the trachea of control birds the lamina propria consisted of one to three cell layers with
no lymphoid infiltrates. Few CD4+, CD8α+ and mainly KUL-01+ cells were found in the
lamina propria of both upper and lower trachea (Fig. 2E).
Upon infection we found that the viral RNA level in upper trachea was significantly higher
than in lower trachea at both 1 and 3 d.p.i. (Fig. 2C). Samples of 3 d.p.i. were used to
analyse cytokine expression and global gene expression. The difference in viral RNA level
did not result in significant differences in IL-1β, IL-6 and IFN-β mRNA expression
between upper and lower trachea (Fig. 2B), but in infected birds the mRNA levels of IL-1β
and IL-6 mRNA increased ~6 Ct values compared to control birds. IFN-β mRNA
expression also increased, but to a lesser extend, ~2 Ct values. Gene expression in upper
and lower trachea of infected birds was plotted against each other in a scatterplot (Fig. 2D).
Inoculation with H9N2 resulted in differential gene expression of ~1700 genes compared to
control birds, but only few genes were significantly and with ≥ 2-fold difference expressed
(Table 1). Three genes were down regulated, cysteine, glycine-rich protein 3 and a
chemokine gene. The up regulated genes were involved in metabolic processes,
metallopeptidase activity, regulation of cytokinesis, and endothelial cell activation.
At 1 and 3 d.p.i. virus was located in the epithelial cells and the mucoid glands. The lamina
propria was slightly swollen at 1 d.p.i., with influxes of CD4+ and KUL-01+ cells, whereas
at 3 d.p.i. the lamina propria consisted of multiple cell layers due to cellular influxes. KUL-
01+ cells were located in the epithelial cell layer and in the lamina propria, these cells had a
round appearance, indicative for activation, whereas in the submucosa these cells were
more dendritic shaped. Influxes of CD8α+ cells were found in the lamina propria from 3
d.p.i. and were smaller than the CD4+ cell influxes. All cellular influxes were localised and
not found throughout the whole trachea with no differences between upper and lower
trachea (Fig. 2E).
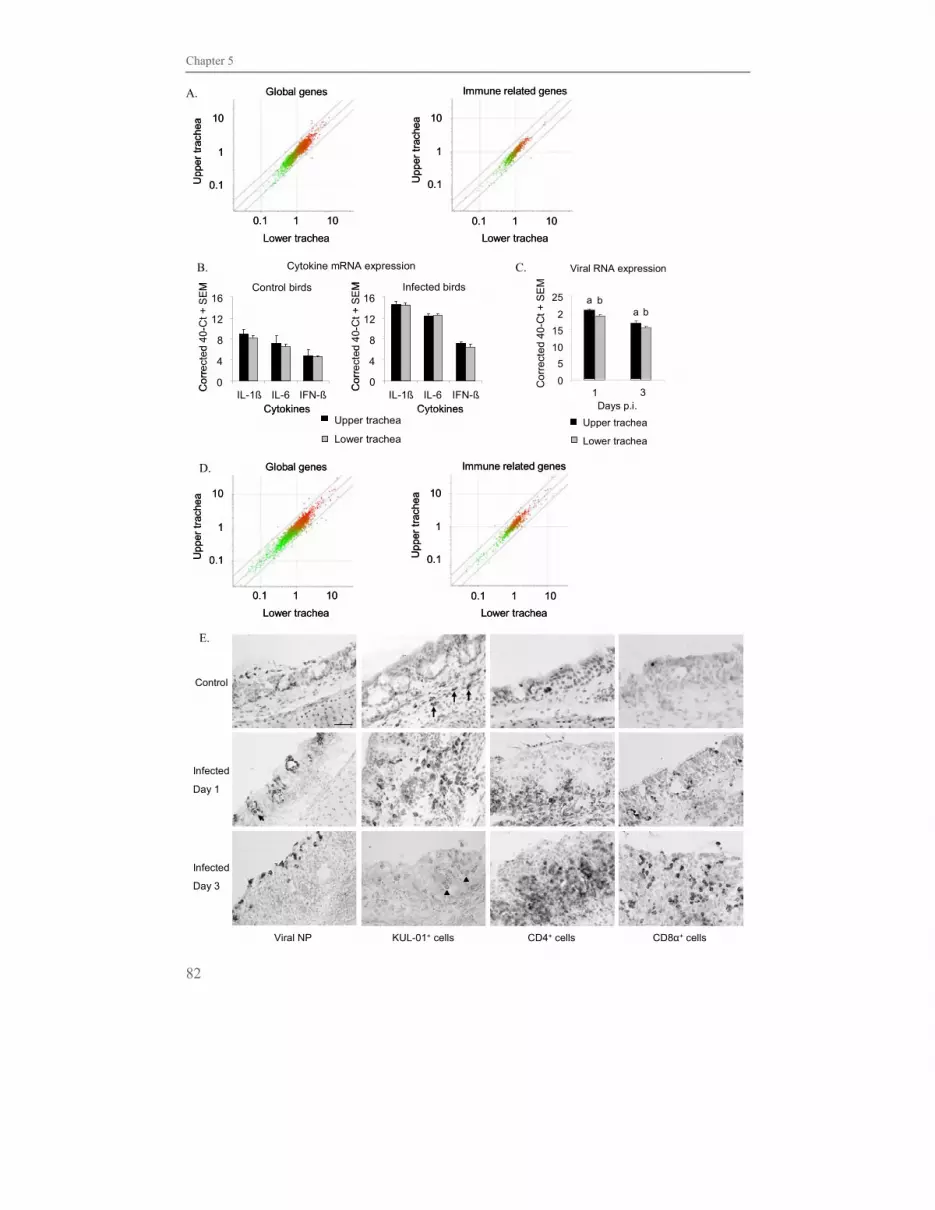
Chapter 5
82
A.
0
4
8
12
16
IL1b IL6 IFNb
0
4
8
12
16
IL1b IL6 IFNb
Upper trachea
Lower trachea
Control birds
Cytokines
12
8
4
0IL-1ß IL-6 IFN-ß
16
Co
rre
cte
d4
0-C
t +
SE
M
Cytokine mRNA expression
Infected birds
12
8
4
0IL-1ß IL-6 IFN-ß
16
Co
rre
cte
d4
0-C
t +
SE
M
Cytokines
0
4
8
12
16
IL1b IL6 IFNb
0
4
8
12
16
IL1b IL6 IFNb
Upper trachea
Lower trachea
Control birds
Cytokines
12
8
4
0IL-1ß IL-6 IFN-ß
16
Co
rre
cte
d4
0-C
t +
SE
M
Cytokine mRNA expression
Infected birds
12
8
4
0IL-1ß IL-6 IFN-ß
16
Co
rre
cte
d4
0-C
t +
SE
M
Cytokines
0.1
1
10
0.1 1 10
Upp
er t
rach
ea
Lower trachea
Immune related genesGlobal genes
0.1
1
10
0.1 1 10
Upp
er t
rach
ea
Lower trachea
0.1
1
10
0.1 1 10
Upp
er t
rach
ea
Lower trachea
Immune related genesGlobal genes
0.1
1
10
0.1 1 10
Upp
er t
rach
ea
Lower trachea
0.1
1
10
0.1 1 10
Upp
er t
rach
ea
Lower trachea
Immune related genesGlobal genes
0.1
1
10
0.1 1 10
Upp
er t
rach
ea
Lower trachea
0.1
1
10
0.1 1 10
Upp
er t
rach
ea
Lower trachea
Immune related genesGlobal genes
0.1
1
10
0.1 1 10
Upp
er t
rach
ea
Lower trachea
0
5
10
15
20
25
1 2
Upper trachea
Lower trachea
Upper trachea
Lower trachea
Co
rre
cte
d 4
0-C
t +
SE
M
Viral RNA expression
25
2015
10
5
01 3Days p.i.
aa
bb
Cor
rect
ed 4
0-C
t + S
EM
Viral NP KUL-01+ cells CD4+ cells CD8α+ cells
ed
ed
ol
ed
ed
olControl
Infected
Day 1
Infected
Day 3
B. C.
D.
E.

Airflow and anatomy affect host responses to AIV infection in the avian lung
83
Figure 2. A) Scatterplot of global and immune related genes in upper versus lower trachea of control birds at 3
d.p.i. Genes in red were up regulated and in green down regulated. The middle diagonal line represents a 1-fold
change and the two outer diagonal lines a 2-fold change difference between upper and lower trachea. B) IL-1β, IL-
6 and IFN-β mRNA expression in trachea at 3 d.p.i. C) Viral RNA levels in trachea of infected birds at 1 and 3
d.p.i. Bars within a time point with different letters were significantly different (p < 0.05). D) Scatterplot of global
and immune related genes in upper versus lower trachea of infected birds at 3 d.p.i. E) Cryosections of trachea at 1
and 3 d.p.i. stained for viral NP, KUL-01+, CD4+ and CD8α+ cells. Upon infection, KUL-01+ cells (macrophages)
change from dendritic (arrows) to round morphology (arrowheads). Bar, 50 μm.
Table 1. Genes expressed significantly at ≥ 2-fold difference in upper trachea versus lower trachea at 3 d.p.i. in
control birds and infected birds.
Gene description Ensembl ID Fold
change†
Control Syntaxin 8 ENSGALT00000001879 0.50
birds Nesprin-1 ENSGALT00000021996 2.04
ENSGALG00000018428 2.08
genomic:Un_random+27728607-27728677
2.09
ENSGALESTG00000000019 * 2.11
Hypothetical protein LOC418424 ENSGALT00000024836 2.14
ENSGALT00000035596 2.21
AMP deaminase 1 ENSGALT00000003247 2.22
ENSGALT00000003550 2.26
ENSGALG00000023715 2.58
Parvalbumin, thymic ENSGALT00000005489 * 3.93
Infected Cysteine and glycine-rich protein 3 ENSGALT00000006436 0.30
birds Cardiac phospholamban ENSGALT00000024024 0.32
Chemokine ENSGALT00000041379 * 0.44
Potassium channel subfamily K member 2 ENSGALG00000009687 2.09
Aminoacylase 1-like protein 2 ENSGALT00000025446 2.09
ENSGALT00000025298 2.18
Proline-rich protein 6 ENSGALT00000007174 2.26
ENSGALT00000007194 2.60
ENSGALT00000015324 2.60
Coiled-coil domain containing 78 isoform 1 ENSGALT00000003811 2.63
GTP-binding protein RAD ENSGALT00000008251 2.84
Ankyrin repeat domain-containing protein 1 ENSGALT00000010491 3.81
* Immune related gene; † Expression ratio in lower trachea dived by expression ratio in upper trachea
Differential responses in lung segments L1, L2, L3 and L4
Lung was divided into 4 pieces according to unidirectional airflow and lung anatomy. In
this study the airflow through the air sacs is being ignored for simplicity, because it does
not affect the airflow through the lung.

Chapter 5
84
Global and immune related gene expression in lung L1 to L4 of control birds at 3 d.p.i.
were compared by hierarchical clustering. L1 clustered with L3 and L2 clustered with L4
for both global and immune related genes (Fig. 3A), coinciding with airflow and lung
anatomy.
No significant difference in IL-1β and IFN-β mRNA expression between L1 to L4 was
found (Fig. 3B). However, IL-6 mRNA expression in L1 and L3 was significantly higher
than in L2 and L4.
In a non-infected lung, the KUL-01+, CD4+ and CD8α+ cells were spread throughout the
lung in the parabronchi, interparabronchial septa and lamina propria of larger airways.
KUL-01+ and CD8α+ cells were found closer to the lumen compared to CD4+ cells, and the
number of KUL-01+ cells exceeded that of CD4+ and CD8α+ cells (Fig. 3F).
After inoculation (Fig. 3C) at both 1 and 3 d.p.i. no significant differences in viral RNA
levels were found between L1 and L3 and between L2 and L4. Though, at both time points
the viral RNA level was higher in L1 and L3 than in L2 and L4, being significantly
different at 1 d.p.i. for L2 and at both time points for L4. The effect of uneven virus
distribution on IL-1β, IL-6 and IFN-β mRNA expression was shown at 3 d.p.i. (Fig. 3B).
IL-1β and IL-6 mRNA levels were similar in L1 and L3, but significantly higher than in L2
and L4. In all 4 parts of the lung IL-1β and IL-6 mRNA expression was significantly higher
in infected birds than in control birds. The IFN-β mRNA levels in infected birds were low
and not significantly different between L1 to L4, nor different from control birds.
A hierarchical clustering on both global and immune related gene expression was
performed on infected birds at 3 d.p.i. (Fig. 3D). In infected birds the same clustering was
observed as in control birds, but the clustering of L1-L3 and of L2-L4 in infected birds was
even stronger for both global and immune related genes, since the branches leading to
cluster L1-L3 and L2-L4 were longer and the branches leading to the individual lung parts
were shorter compared to the cluster tree in control birds.
Using immunocytochemistry virus deposition and cellular influxes in the lung parts were
studied (Fig. 3E). In both L1 and L3 virus infected areas were found in the primary and
secondary bronchi and adjacent parabronchi. At 3 d.p.i. more virus was located in the
parabronchi compared to 1 d.p.i. In L2 and L4 infected areas were located in the
parabronchi and an increase over time was seen. In L1 the largest infected areas were found
followed by L3, L4 and L2 were similar and contained fewer and smaller infected areas
(Fig. 3E). At 1 d.p.i. influxes of KUL-01+, CD4+ and CD8α+ cells were seen in both L1 and
L4 in the bronchi and parabronchi (Fig. 3F). Cellular influxes co-localised with virus

Airflow and anatomy affect host responses to AIV infection in the avian lung
85
LL
LL
LL
LL
L1 L2 L3 L4
LL
LL
LL
LL
LL
L
LL
LL
NP KUL 01 ll CD4 ll CD8 ll
L1 L2L3 L4
Globalgenes
L1 L2L3 L4
Immune relatedgenes
L1 L2L3 L4
Globalgenes
L1 L2L3 L4
Immune genes
L1 L2L3 L4
Globalgenes
L1 L2L3 L4
Immune relatedgenes
L1 L2L3 L4
Globalgenes
L1 L2L3 L4
Immune genes
0
5
10
15
IL1b IL6 IFNb
L1 L3
L2 L4
15
10
5
0IL-1ß IL-6 IFN-ß
Cytokines
Control birds
Co
rre
cted
40-C
t + S
EM
a a b b
Cytokine mRNA expression
0
5
10
15
IL1b IL6 IFNb
a a ba a b b
15
10
5
0IL-1ß IL-6 IFN-ß
Cytokines
Infected birds
Cor
rect
ed
40-C
t +
SE
M
b
0
5
10
15
IL1b IL6 IFNb
L1 L3
L2 L4
L1 L3
L2 L4
15
10
5
0IL-1ß IL-6 IFN-ß
Cytokines
Control birds
Co
rre
cted
40-C
t + S
EM
a a b b
Cytokine mRNA expression
0
5
10
15
IL1b IL6 IFNb
a a ba a b b
15
10
5
0IL-1ß IL-6 IFN-ß
Cytokines
Infected birds
Cor
rect
ed
40-C
t +
SE
M
b
L1 L2L3 L4
Globalgenes
L1 L2L3 L4
Immune relatedgenes
L1 L2L3 L4
Globalgenes
L1 L2L3 L4L1 L2L3 L4
Immune genes
L1 L2L3 L4
Globalgenes
L1 L2L3 L4
Immune relatedgenes
L1 L2L3 L4
Globalgenes
L1 L2L3 L4L1 L2L3 L4
Immune genes
L1 L2 L3 L4
Control
Infected
NP CD4+ cells
↑ from day 1
KUL-01+ cells
↑ from day 1
CD8α+ cells
↑ from day 1
0
5
10
15
20
25
1 2
Viral RNA expression
Cor
rect
ed 4
0-C
t + S
EM 25
20
15
10
5
01 3
Day p.i.
L1 L3
L2 L4
a aa a
b bab b
0
5
10
15
20
25
1 2
Viral RNA expression
Cor
rect
ed 4
0-C
t + S
EM 25
20
15
10
5
01 3
Day p.i.
L1 L3
L2 L4
L1 L3
L2 L4
a aa a
b bab b
A. B.
C. D.
E.
F.
Chapter 5
86
Figure 3. A) Hierarchical clustering on expression of global and immune related genes in lung L1 to L4 in control
birds at 3 d.p.i. Genes in red were up regulated and in green down regulated. B) IL-1β, IL-6 and IFN-β mRNA
expression in lung L1 to L4 at 3 d.p.i. Bars with different letters were significantly different (p < 0.05). C) Viral
RNA levels in infected birds at 1 and 3 d.p.i. Bars within a time point with different letters were significantly
different (p < 0.05). D) Hierarchical clustering on expression of global and immune related genes in lung L1 to L4
in infected birds at 3 d.p.i. Genes in red were up regulated and in green down regulated. E) Cryosections of lung
L1 to L4 stained for viral NP at 3 d.p.i. The parabronchi of the different parts of the lung are affected to a different
extend. L indicates luminal side of a parabronchus. Bar, 75 μm. F) Cryosections of lung L1 stained for viral NP
and for KUL-01+, CD4+ and CD8α+ cells at 3 d.p.i. Upon infection, KUL-01+ cells (macrophages) change from
dendritic (arrows) to round morphology (arrowheads). Bar, 75 μm.
infected areas, and the number of cells positively correlated with the size of the virus
infected areas. At 1 d.p.i. KUL-01+ cells in infected areas were mainly round, whereas in
non-infected areas they were dendritic shaped. The number of KUL-01+, CD4+ and CD8α+
cell influxes increased over time.
Differences between lung L1 and L4
In both control and infected birds gene expression differed most between L1 and L4. These
significantly differentially expressed genes were depicted in a graph showing three major
GO categories and an immune related category (Fig. 4A). In control birds more genes were
expressed at a higher rate in L1 compared to L4 for all four categories. Immune related
genes that significantly differed between L1 and L4 were depicted in a heatmap (Fig. 4B).
Genes expressed in a higher rate in L1 were mainly involved in cell adhesion and motility
like VTN and TSPAN1, T cell and B cell related like ITFG1 and PIGR and involved in
chemotactic activities like CCL20, CX3CR1 and CHIA. In infected birds more genes were
expressed at a higher rate in L4 compared to L1 for the categories molecular function,
cellular component and biological processes, but not for immune related genes. Immune
related genes that significantly differed between L1 and L4 were depicted in a heatmap
(Fig. 4C). These genes were mainly involved in lymphocyte activation, apoptosis,
chemokine and interleukin activity. Genes expressed in a higher rate in L1 were mainly
involved in lymphocyte activation, mainly T cell related, such as CD3E, CD28 and ICOS,
and chemokine and interleukin activity like CCL19, SOCS1, CXCLi1, IL-1β, IL-7Rα and
IL-16. In L4 mainly genes involved in apoptosis, stress responses and MHC pathways were
more expressed compared to L1 like BCLX, BNIP3L, HSP70, HSPB2, MHC class II.
Induction of host responses against H9N2 in upper trachea and lung L1 and L4
To determine chicken host responses against H9N2 in the respiratory tract at transcriptional
level, immune related genes that were significantly differentially expressed between control
and infected birds were analysed. Most genes were significantly differentially expressed in
trachea and lung L1, respectively 244 and 272 immune related genes, whereas lung L4

Airflow and anatomy affect host responses to AIV infection in the avian lung
87
Figure 4. Differences in responses between lung L1 and L4. A) Genes that significantly (p < 0.05) differed in
expression between L1 and L4 in control and infected birds at 3 d.p.i. are categorized into three major GO terms
and an immune related category. Heatmap of immune related genes significantly (p < 0.05) differentially
expressed in L1 compared to L4, B) in control birds and C) in infected birds. Genes expressed at a higher rate in
L1 are shown in red and at a higher rate in L4 in green.
significantly differentially expressed 86 immune related genes. Genes were divided into
functional groups based on GO interpretations of which the groups containing most genes
were depicted in a graph (Fig. 5). The complete gene sets were listed in the supplemented
data (Table S1-S3).
A shortened gene list, indicating the location in the respiratory tract at which genes were
significantly induced due to H9N2 infection, was depicted in Table 2. This list was based
on the functional groups shown in Figure 5 and depicted a global overview of the location
of expression and expression rate of genes (up or down) within a functional group. Most
(b) (c)
L1 L4L1 L4L1 L4
0 50 100 150
Immune related
GO biologicalprocess
GO cellularcomponent
GO molecularfunction
150# genes sign. diff. expressed
in L1 and L4
0 50 100 150
Immune related
GO biologicalprocess
GO cellularcomponent
GO molecularfunctionGO molecular function
GO Cellular component
GO Biological process
50 100 150# genes sign. diff. expressed
in L1 and L4
0
Control birds
GO molecular function
GO Cellular component
GO Biological process
Immune related
50 100
Infected birds
0
Lung L1
Lung L4
Immune related
0 50 100 150
Immune related
GO biologicalprocess
GO cellularcomponent
GO molecularfunction
150# genes sign. diff. expressed
in L1 and L4
0 50 100 150
Immune related
GO biologicalprocess
GO cellularcomponent
GO molecularfunctionGO molecular function
GO Cellular component
GO Biological process
50 100 150# genes sign. diff. expressed
in L1 and L4
0
Control birds
GO molecular function
GO Cellular component
GO Biological process
Immune related
50 100
Infected birds
0
Lung L1
Lung L4
Lung L1
Lung L4
Immune related
A.
B. C.

Chapter 5
88
striking facts were that much fewer genes were differentially expressed in lung L4, and
most genes were up regulated independent of the location and functional group.
In trachea and both lung L1 and L4 genes involved in chemokine and cytokine signalling
were most common, sharing many similar genes. In contrast to the up regulation of
chemokine related genes, several genes related to growth factors were down regulated.
Of the genes involved in innate responses and interferon signalling, only the genes
negatively involved in interferon signalling (FLN29, USP18) and related to IFN-γ
signalling (IRF10) were expressed in trachea, lung L1 and L4. Other genes involved in
IFN-γ signalling (IFI35, MIME, IFI30), and type I interferon signalling (IRFs) were
expressed at certain locations rather than in trachea and both lung segments. Genes
involved in NF-κB signalling were expressed in trachea and L1, but in L4 no genes related
to NF-κB signalling were found.
Genes involved in antigen presentation were all up regulated. MHC class IV or B-G, which
is only expressed in lung L1 and ASB2, which was only expressed in trachea were down
regulated.
Up regulation of genes that supported an increased T cell response were mostly expressed
in lung L1 and trachea. Several genes were exclusively expressed in L1 and were involved
in co-stimulation (CD86, CTLA4, PDL2), T cell activation (ZAP70, TXK), T cell
proliferation IGSF2, (TNFRSF4) and CD3 signal transduction (TRAT1). Many genes
involved in B cell activity were expressed especially in lung L1 and trachea. All B cell
related genes were up regulated except for BRAG, which is expressed only in trachea, and
PIGR which were both down regulated. In lung L4, genes related to T and B cell responses
were rarely expressed.
Several genes involved in cell migration and adhesion were exclusively expressed in
trachea (CD9, THBS4) or in lung L1 (MAEA, VCAM1). Genes involved in monocyte
activity were equally expressed in all three parts of the respiratory tract, sharing similar
genes.
Infection with H9N2 caused mostly up regulation of genes involved in the regulation of
apoptosis mainly via caspase activity. Most genes involved in apoptosis were expressed in
trachea and lung L1, whereas in lung L4 few apoptosis related genes were expressed.
Several genes involving oxidative stress were up regulated, but mainly in trachea and lung
L1. Lung L4 only expressed p40-phox. Gene expression related to complement activity
mainly seemed to occur via the classical route. In L4 only CD93 and ITGB2 were
expressed.

Airflow and anatomy affect host responses to AIV infection in the avian lung
89
Discussion To be able to study host responses to respiratory viruses, we first wanted to know whether
sampling certain locations would affect the outcome of the study. The aim of this study was
to determine if gene expression differed between upper and lower trachea and between
different parts of the lung in control birds, and whether this was affected by H9N2 AIV
infection, and secondly to study the early host responses against LPAI H9N2.
Besides the trachea and lung, other structures such as the paranasal organs, paraocular
Harderian gland (HG) and the conjunctiva associated lymphoid tissue come in contact with
aerosolized virus or particles (Corbanie et al., 2006). Although cells capable of rapid
responses against pathogens are present in these tissues (Kothlow and Kaspers, 2008), only
the humoral responses to pathogens have been described for the chicken. Upon infection
with infectious bronchitis virus or Newcastle disease virus an increase in virus-specific
IgA-antibody forming cells (AFC) in the HG is found (Van Ginkel et al., 2008; Russell et
al., 1993), whereas most IgG-AFC reside in the spleen (Russell et al., 1993). In mice
intranasal immunisation with influenza virus results in local long-term specific antibody
production. These AFC reside in larger numbers in the diffuse region rather than in the
organised region of the NALT (Liang et al., 2001; Etchart et al., 2006) showing that also
within the nasal compartment of mice sampling of specific parts of the tissue will results in
a different outcome as shown for antibody production, but which most likely will also be
found at host transcriptional level.
In our study, trachea was divided into upper and lower trachea as H9N2 LPAI has a
preference for infecting the upper part of the respiratory tract (Nili et al., 2002), which
coincided with our data at both 1 and 3 d.p.i.. However, only minor differences in gene
expression were seen between upper and lower trachea in both control and infected birds,
suggesting that gene expression within the trachea was not affected by a difference in virus
deposition.
Lung was divided into 4 pieces according to unidirectional airflow and lung anatomy. Lung
L1 was most similar to L3 and L2 resembled L4. In this paper we described that the
differences in anatomy and airflow were reflected upon gene expression in control birds
and upon infection with H9N2, host responses in the different parts of the lung were even
more diverse. Furthermore, airflow and anatomy affected virus deposition within the lung.
During inhalation, air flows through the primary bronchus, bypassing the cranially-located
openings of the medio-ventral secondary bronchi and flows into the caudal air sacs or
through the mediodorsal and lateroventral secondary bronchi (Fig. 1). This caudal to cranial
flow pattern is also evident during expiration. In the caudal part of L1 and L3, which
contained the bifurcations to the mediodorsal and lateroventral secondary bronchi, viral

Chapter 5
90
Fig
ure
5. H
ost r
espo
nses
aga
inst
H9N
2 in
fect
ion
in u
pper
trac
hea,
lung
L1
and
L4.
Im
mun
e re
late
d ge
ne s
ets,
bas
ed u
pon
GO
inte
rpre
tati
on, s
igni
fica
ntly
(p
< 0
.05)
diff
eren
tiall
y ex
pres
sed
in in
fect
ed c
ompa
red
to c
ontr
ol b
irds
.
Tab
le 2
. Im
mun
e re
late
d ge
nes
indu
ced
by H
9N2
infe
ctio
n in
upp
er tr
ache
a (U
T),
lung
L1
and
L4
at 3
d.p
.i.
Gen
e I
D†
UT
L
1 L
4 G
ene
ID†
UT
L
1 L
4
Gen
e ID
† U
T
L1
L4
G
ene
ID
† U
T
L1
L4
Cyt
okin
es a
nd c
hem
okin
es
PT
+3
E09
694
+
TL
R a
nd N
F–κ
B s
igna
lling
SL
A
E16
234
+ +
+
BA
FF
E16
852
+*
+
U
SP18
E
1305
7 +
+
+
TL
R1
E17
485
+ +
+
TN
FRSF
4 E
0187
5
+
CC
L4
E00
951
+ +
Cel
l mig
rati
on, m
acro
phag
e re
spon
ses
T
LR
3 E
1346
8 +
T
RA
T1
E15
362
+
CC
Li3
E
0095
6
+ +
C
AD
11
E05
278
– –
–
TL
R4
E
0700
1
+ +
T
+K
E14
127
+
CC
Li7
E
1458
5 +
+ +
C
D34
E
0117
7 –
–
T
LR
7 E
1659
0 +
+ +
Z
AP
70
E01
486
+
CC
R5
E11
732
+ +
+
CD
9 E
1727
4 –
T
LR
15
E08
166
+
+
Ap
opto
sis,
o+
idat
ive
stre
ss, c
ompl
emen
t
C+C
Li2
E
1166
8 +
+
C
SF3R
E
0211
2 +
+
+
CA
RD
9 E
0188
9 +
+
B
CL
2A1
E06
511
+
+
GH
R
E14
855
– –
TH
BS4
E
1480
4 –
N
FKB
IA
E10
063
+
BC
L2L
14
E11
544
+ +
NM
I E
1248
0 +
+ +
V
CA
M1
E05
257
+
NFK
BIE
E
1017
1 +
+
C
ASP
8 E
0835
5 +
+
05
1015
2025
3035
Apo
ptos
is
Com
plem
ent
Inte
rfero
n re
late
d
Ant
igen
pre
sent
atio
n
Inte
rleuk
in
Che
mok
ine
Mon
ocyt
e
B c
ell
T ce
llT
cel
l
B c
ell
Mon
ocyt
e
Che
mok
ines
Inte
rleuk
in
Ant
igen
pre
sent
atio
n
Inte
rfer
on in
duce
d
Com
plem
ent
Apo
ptos
is
05
1015
2025
3035
# ge
nes
sign
. diff
. exp
ress
ed
betw
een
naiv
e an
d in
fect
ed b
irds
05
1015
2025
3035
Apo
ptos
is
Com
plem
ent
Inte
rfero
n re
late
d
Ant
igen
pre
sent
atio
n
Inte
rleuk
in
Che
mok
ine
Mon
ocyt
e
B c
ell
T ce
llT
cel
l
B c
ell
Mon
ocyt
e
Che
mok
ines
Inte
rleuk
in
Ant
igen
pre
sent
atio
n
Inte
rfer
on in
duce
d
Com
plem
ent
Apo
ptos
is
05
1015
2025
3035
# ge
nes
sign
. diff
. exp
ress
ed
betw
een
naiv
e an
d in
fect
ed b
irds
Upp
er t
rach
ea
Lung
L1
Lung
L4
Upp
er t
rach
ea
Lung
L1
Lung
L4

Airflow and anatomy affect host responses to AIV infection in the avian lung
91
SOC
S3
E07
189
+ +
+
ZY
+ E
1468
8 +
+
T
NIP
2 E
1566
6 +
+
CID
EA
E
0001
8 –
–
STA
T4
E07
651
+ +
+
CST
A
E14
412
+ +
+
T
NIP
3 E
1196
1
+
D
AP
E
1300
2 –
–
TG
FB
3 E
1034
6 –
– –
IG
SF6
E07
059
+ +
+
T
RA
F1
E01
583
+
+
G
ZM
A
E13
548
+
+
Inna
te im
mun
e an
d IF
N r
esp
onse
MA
EA
E
1331
0
–
T
RA
F3
E11
389
+
PAN
+1
E17
213
+
+ +
AV
ID
E23
622
+
+
RG
S18
E
2114
3 +
+ +
TR
AF
5 E
0986
4
+
R
ASS
F2
E00
206
+
+ +
AV
R2
E02
441
+
+
IL1B
E
0053
4 +
+ +
TR
AIP
E
0290
8 +
RIP
K1
E12
827
+
+
CL
L1
E16
113
–
IL13
RA
2 E
2031
6 +
+
B
and
T c
ell r
esp
onse
s
TFI
P8
E02
196
+
+ +
FLN
29
E04
802
+ +
+
IL18
E
0787
4
+
B
CA
P29
E
0800
9 +
+
TN
FAIP
8L1
E04
266
+
+
GA
L4
E19
843
+
LY
75
E11
153
+ +
BL
NK
E
0697
3 +
+
+
ER
O1L
E
1240
4 +
+
IFI3
0 E
0338
9
+ +
L
Y86
E
1280
1
+ +
PIG
R
E00
919
– –
MA
FF
E12
277
+
IFI3
5 E
0283
2 +
+
L
Y96
E
1564
8 +
+ +
RG
S1
E02
549
+
+
N
CF1
E
0118
9 +
IRF1
E
0678
5 +
+
A
ntig
en p
rese
nta
tion
(M
HC
pat
hw
ays)
BR
AG
E
0970
4 –
N
O+
O1
E05
572
+
IRF1
0 E
0644
8 +
+ +
A
SB
2 E
1088
1 –
C
D28
E
0866
9 +
+
p40–
pho+
E
1252
0 +
+
+
IRF3
E
1429
7 +
+
C
D74
E
0459
4 +
+
C
D3D
E
0741
8 +
+
SOD
3 E
1855
7
+
IRF8
E
0575
7 +
+
C
TSB
E
1666
6 +
+
C
D86
E
1436
2
+
C
1QB
E
2156
9 +
+
MA
RC
O
E12
119
+ +
C
TSC
E
1723
9 +
+ +
CT
LA
4 E
0866
6
+
C
1QC
E
2360
5 +
+
MD
A5
E11
089
+ +
DM
A
E00
158
+ +
+
G
IMA
P7
E05
136
+
+
C
1S
E14
603
+
MIM
E
E04
732
– –
MH
C B
–G
E24
357
–
IGSF
2 E
1546
7
+
C
3AR
1 E
1321
8 +
+
MM
P7
E17
184
+ +
MH
C I
E
0017
8 +
+ +
IL2R
G
E05
638
+
+ +
C
D59
E
2446
8
–
M+
E
1614
2 +
+ +
M
HC
II β
E00
141
+
IL18
R1
E16
786
+
+
C
D93
E
0835
9
–
OA
SL
E
1372
3 +
+ +
T
SPA
N8
E10
152
+ +
+
P
DL
2 E
1503
2
+
IT
GB
2 E
0751
1 +
+
+
* +
or
- re
pres
ents
up
or d
own
regu
late
d ge
ne e
xpre
ssio
n in
infe
cted
com
pare
d to
con
trol
bir
ds; †
Ens
embl
ID
; E (
in th
e ID
col
umn)
= E
NS
GA
LG
0000
00

Chapter 5
92
RNA levels were significantly higher and virus infected areas were larger than in L2 and
L4. This correlated with results of studies on deposition of airborne microspheres in the
avian respiratory tract, which indicate that airborne particles are not distributed uniformly
in the lung and deposition is influenced by particle size, size of the airway and that particles
are intercepted at bifurcations within the respiratory tract (Hayter et al., 1974; Mensah et
al., 1982; Corbanie et al., 2006). Differences in virus deposition enhanced in infected birds
the differences in gene expression already seen in control birds. This coincided with the
finding in the lung of macaques that differences in H1N1 influenza virus mRNA result in
differences in gene expression (Baas et al., 2006). A functional consequence of the flow
pattern in the avian lung resulting in an uneven spread of virus may explain the absence of
bronchus associated lymphoid tissue in the cranial part of the lung. Although organized
BALT nodules are not observed before the third week after hatching, a similar time course
of BALT development in SPF and conventional chickens was found (Fagerland et al.,
1993) and infections with pathogenic micro-organisms increase the number of BALT
nodules significantly (Van Alstine et al., 1988). This most likely resulted in the higher
expression rate of genes involved in cell adhesion and motility, chemotactic and interleukin
activities and T and B cell related genes in L1 compared to L4, in both control and infected
birds.
By analyzing host responses in lung L1 and L4 separately, gene expression patterns were
not diluted and could be used to define overall and site specific responses to H9N2
infection. After comparing gene expression in trachea, lung L1 and L4 we found that most
changes occurred in trachea and L1. Most genes expressed in L4 were also expressed in
trachea and L1 indicating these were part of a common host response, independent of the
amount viral RNA. Most of these shared responses are described previously as being part of
a common response to pathogens (Jenner et al., 2005; Pennings et al., 2008) and involve up
regulation of genes related to chemokine activity and inflammatory responses as described
in primate and rodent influenza models (Pennings et al., 2008). These corresponded with
increased IL-1β and IL-6 mRNA expression and the massive influx of KUL-01+ cells in
trachea and lung of infected birds. Trachea and L1 had overlap in gene expression that was
not shared by L4 indicating that these responses were affected by viral load.
Several site specific responses were measured upon infection. TLRs contribute to innate
responses of which TLRs 3, 7-9 recognise nucleosides that are important in viral
recognition. In chicken TLR9 has not been identified, but it is speculated that the two TLR7
splice variants (Philbin et al., 2005; Jenkins et al., 2009), TLR15 or TLR21, may elicit
responses to the mammalian TLR9 ligands. After infection with H9N2, up regulation of
TLR3 was found in trachea correlating to an increase in TLR3 mRNA in lung and brain of
chickens upon infection with high pathogenic AIV (Karpala et al., 2008). TLR1 and 7 were
up regulated in trachea, lung L1 and L4. Both TLR1 and TLR7 are up regulated in human

Airflow and anatomy affect host responses to AIV infection in the avian lung
93
primary macrophages infected with influenza or Sendai virus (Miettinen et al., 2001)
indicating that up regulation of these genes is most likely part of a common host response
to viruses. TLR15 expression remains unchanged after in vitro H9N2 infection (Xing et al.,
2008) in contrast to our data showing that upon H9N2 infection in vivo TLR15 was up
regulated in L1.
Several genes were especially expressed in L1 and were involved in innate responses,
interleukin activity and vesicle trafficking. Molecules involved in innate immunity to
pathogens such as CLL1, PTX3 and GAL4 were only up regulated in L1. C-type lectins and
PTX3 are known to have antiviral activity against influenza (Hogenkamp et al., 2008;
Reading et al., 2008). In mice beta-defensins, like GAL4, are up regulated in the airway
epithelial cells due to influenza virus infection (Chong et al., 2008).
ANXA6, DDEF2, PICALM and ZFYVE20 are involved in vesicle trafficking like
endocytosis and phagocytosis and were only expressed in L1, and in contrast to most genes
they were down regulated. Changes in expression of these genes have not been described in
a virus infection model yet, although the endocytosis pathway is known to play an
important role in the entry of influenza virus into host cells (Lakadamyali et al., 2004).
Whether down regulation of these genes was induced by host cells to inhibit viral entry or
by antigen presenting cells to control dissemination of virus remains to be investigated.
Although not described in this paper, the avian respiratory tract also contains multiple air
sacs which work as bellows to enable ventilation of the lungs. Upon inoculation with IBV
or influenza virus decreased lucency of the air sacs and cellular influxes containing CD4+,
CD8+, γδ-TCR+ and KUL-01+ cells and heterophilic infiltrates are found (Perkins et al.,
2002; Matthijs et al., 2009). It is highly likely that the air flow also results in different
responses in the air sacs, because only certain air sacs will be exposed to the inhaled air
containing the virus.
To our knowledge we are the first to give an overview of host responses to AIV at
transcriptional level in the trachea and in the lung taking into account the effect of anatomy
and airflow through the respiratory tract. Gene expression within the lungs of control birds
already differed significantly. Moreover, airflow affected virus deposition and subsequently
the gene expression indicating that sampling at specific sites within the lung affects the
outcome of the study into respiratory infections in chickens. Changes in gene expression
and cellular influxes were significantly more pronounced in the parts of the respiratory tract
where virus deposition was highest. These findings suggest that not only responses against
avian influenza virus are affected locally, but most pathogens that are not evenly spread
throughout an organ will induce localised responses and careful sampling of the organ will
be essential.
Chapter 5
94
Acknowledgements
We thank Peter van de Haar, Dik van Leenen, Cheuk Ko and Linda Bakker for their
technical assistance and Dr Winfried Degen for the collaboration on the in vivo experiment.
This work was supported by a BSIK VIRGO consortium grant (Grant no. 03012), The
Netherlands.
References
1. Ariaans, M.P., Matthijs, M.G., Van Haarlem, D., Van de Haar, P., Van Eck, J.H., Hensen, E.J.,
Vervelde, L., 2008. The role of phagocytic cells in enhanced susceptibility of broilers to colibacillosis
after Infectious Bronchitis Virus infection. Vet. Immunol. Immunopathol. 123, 240-250.
2. Baas, T., Baskin, C.R., Diamond, D.L., Garcia-Sastre, A., Bielefeldt-Ohmann, H., Tumpey, T.M.,
Thomas, M.J., Carter, V.S., Teal, T.H., Van Hoeven, N., Proll, S., Jacobs, J.M., Caldwell, Z.R.,
Gritsenko, M.A., Hukkanen, R.R., Camp, D.G. 2nd, Smith, R.D., Katze, M.G., 2006. Integrated
molecular signature of disease: analysis of influenza virus-infected macaques through functional
genomics and proteomics. J. Virol. 80, 10813-10828.
3. Baskin, C.R., García-Sastre, A., Tumpey, T.M., Bielefeldt-Ohmann, H., Carter, V.S., Nistal-Villán, E.,
Katze, M.G., 2004. Integration of clinical data, pathology, and cDNA microarrays in influenza virus-
infected pigtailed macaques (Macaca nemestrina). J. Virol. 78, 10420-10432.
4. Breed, D.G., Carr, P., Vermeulen, A.N., 1996. Differential binding of two monoclonal antibodies
directed against the chicken CD8 alpha molecule. Vet. Immunol. Immunopathol. 52, 117-125.
5. Chong, K.T., Thangavel, R.R., Tang, X., 2008. Enhanced expression of murine beta-defensins (MBD-
1, -2,- 3, and -4) in upper and lower airway mucosa of influenza virus infected mice. Virology 380,
136-143.
6. Corbanie, E.A., Matthijs, M.G., Van Eck, J.H., Remon, J.P., Landman, W.J., Vervaet, C., 2006.
Deposition of differently sized airborne microspheres in the respiratory tract of chickens. Avian Pathol.
35, 475-485.
7. Degen, W.G., Smith, J., Simmelink, B., Glass, E.J., Burt, D.W., Schijns, V.E., 2006. Molecular
immunophenotyping of lungs and spleens in control and vaccinated chickens early after pulmonary
avian influenza A (H9N2) virus infection. Vaccine 24, 6096-6109.
8. Eldaghayes, I., Rothwell, L., Williams, A., Withers, D., Balu, S., Davison, F., Kaiser, P., 2006.
Infectious bursal disease virus: strains that differ in virulence differentially modulate the innate
immune response to infection in the chicken bursa. Viral Immunol. 19, 83-91.
9. Etchart, N., Baaten, B., Andersen, S.R., Hyland, L., Wong, S.Y., Hou, S., 2006. Intranasal
immunisation with inactivated RSV and bacterial adjuvants induces mucosal protection and abrogates
eosinophilia upon challenge. Eur. J. Immunol. 36, 1136-1144.
10. Fagerland. J.A., Arp, L.H., 1993. Structure and development of bronchus-associated lymphoid tissue in
conventionally reared broiler chickens. Avian Dis. 37, 10-18.
11. Fedde, M.R., 1998. Relationship of structure and function of the avian respiratory system to disease
susceptibility. Poult. Sci. 77, 1130-1138.
12. Hayter, R.B., Besch, E.L., 1974. Airborne-particle deposition in the respiratory tract of chickens. Poult.
Sci. 53, 1507-1511.
13. Hogenkamp, A., Isohadouten, N., Reemers, S.S., Romijn, R.A., Hemrika, W., White, M.R., Tefsen, B.,
Vervelde, L., Van Eijk, M., Veldhuizen, E.J., Haagsman, H.P., 2008. Chicken lung lectin is a

Airflow and anatomy affect host responses to AIV infection in the avian lung
95
functional C-type lectin and inhibits haemagglutination by influenza A virus. Vet. Microbiol. 130, 37-
46.
14. Jenkins, K.A., Lowenthal, J.W., Kimpton, W., Bean, A.G., 2009. The in vitro and in ovo responses of
chickens to TLR9 subfamily ligands. Dev. Comp. Immunol. 33, 660-667.
15. Jenner, R.G., Young, R.A., 2005. Insights into host responses against pathogens from transcriptional
profiling. Nat. Rev. Microbiol. 3, 281-294.
16. Julkunen, I., Melén, K., Nyqvist, M., Pirhonen, J., Sareneva, T., Matikainen, S., 2001. Inflammatory
responses in influenza A virus infection. Vaccine 19, S32-S37.
17. Karpala, A.J., Lowenthal, J.W., Bean, A.G., 2008. Activation of the TLR3 pathway regulates IFNbeta
production in chickens. Dev. Comp. Immunol. 32, 435-444.
18. Kash, J.C., Basler, C.F., García-Sastre, A., Carter, V., Billharz, R., Swayne, D.E., Przygodzki, R.M.,
Taubenberger, J.K., Katze, M.G., Tumpey, T.M., 2004. Global host immune response: pathogenesis
and transcriptional profiling of type A influenza viruses expressing the hemagglutinin and
neuraminidase genes from the 1918 pandemic virus. J. Virol. 78, 9499-9511.
19. Kothlow, S., Kaspers, B., 2008. The avian respiratory immune system. In Avian Immunology, 1st edn,
273-288. Edited by F. Davison, B. Kaspers, K. Schat. London: Academic Press.
20. Lakadamyali, M., Rust, M.J., Zhuang, X., 2004. Endocytosis of influenza viruses. Microbes Infect. 6,
929-936.
21. Liang, B., Hyland, L., Hou, S., 2001. Nasal-associated lymphoid tissue is a site of long-term virus-
specific antibody production following respiratory virus infection of mice. J. Virol. 75, 5416-5420.
22. Luhtala, M., Tregaskes, C.A., Young, J.R., Vainio, O., 1997. Polymorphism of chicken CD8-alpha, but
not CD8-beta. Immunogenetics 46, 396-401.
23. Mast, J., Goddeeris, B.M., Peeters, K., Vandesande, F., Berghman, L.R., 1998. Characterisation of
chicken monocytes, macrophages and interdigitating cells by the monoclonal antibody KUL01. Vet.
Immunol. Immunopathol. 61, 343-357.
24. Matthijs, M.G., Ariaans, M.P., Dwars, R.M., Van Eck, J.H., Bouma, A., Stegeman, A., Vervelde, L.,
2009. Course of infection and immune responses in the respiratory tract of IBV infected broilers after
superinfection with E. coli. Vet. Immunol. Immunopathol. 127, 77-84.
25. Mensah, G.A., Brain, J.D., 1982. Deposition and clearance of inhaled aerosol in the respiratory tract of
chickens. J. Appl. Physiol. 53, 1423-1428.
26. Miettinen, M., Sareneva, T., Julkunen, I., Matikainen, S., 2001. IFNs activate toll-like receptor gene
expression in viral infections. Genes Immun. 2, 349-355.
27. Nili, H., Asasi, K., 2002. Natural cases and an experimental study of H9N2 avian influenza in
commercial broiler chickens of Iran. Avian Pathol. 31, 247-252.
28. Pennings, J.L., Kimman, T.G., Janssen, R., 2008. Identification of a common gene expression response
in different lung inflammatory diseases in rodents and macaques. PLoS ONE 3, e2596.
29. Perkins, L.E., Swayne, D.E., 2002. Susceptibility of laughing gulls (Larus atricilla) to H5N1 and H5N3
highly pathogenic avian influenza viruses. Avian Dis. 46, 877-885.
30. Philbin, V.J., Iqbal, M., Boyd, Y., Goodchild, M.J., Beal, R.K., Bumstead, N., Young, J., Smith, A.L.,
2005. Identification and characterization of a functional, alternatively spliced Toll-like receptor 7
(TLR7) and genomic disruption of TLR8 in chickens. Immunology 114, 507-521.
31. Reading, P.C., Bozza, S., Gilbertson, B., Tate, M., Moretti, S., Job, E.R., Crouch, E.C., Brooks, A.G.,
Brown, L.E., Bottazzi, B., Romani, L., Mantovani, A., 2008. Antiviral activity of the long chain
pentraxin PTX3 against influenza viruses. J. Immunol. 180, 3391-3398.
32. Roepman, P., Wessels, L.F., Kettelarij, N., Kemmeren, P., Miles, A.J., Lijnzaad, P., Tilanus, M.G.,
Koole, R., Hordijk, G.J., Van der Vliet, P.C., Reinders, M.J., Slootweg, P.J., Holstege, F.C. 2005. An

Chapter 5
96
expression profile for diagnosis of lymph node metastases from primary head and neck squamous cell
carcinomas. Nat. Genet. 37, 182-186.
33. Russell, P.H., Koch, G., 1993. Local antibody forming cell responses to the Hitchner B1 and Ulster
strains of Newcastle disease virus. Vet. Immunol. Immunopathol. 37, 165-180.
34. Shinya, K., Ebina, M., Yamada, S., Ono, M., Kasai, N., Kawaoka, Y., 2006. Avian flu: influenza virus
receptors in the human airway. Nature 440, 435-436.
35. Van Alstine, W.G., Arp, L.H., 1988. Histologic evaluation of lung and bronchus-associated lymphoid
tissue in young turkeys infected with Bordetella avium. Am. J. Vet. Res. 49, 835–839.
36. Van de Peppel, J., Kemmeren, P., Van Bakel, H., Radonjic, M., Van Leenen, D., Holstege, F.C., 2003.
Monitoring global messenger RNA changes in externally controlled microarray experiments. EMBO
Rep. 4, 387-393.
37. Van Ginkel, F.W., Van Santen, V.L., Gulley, S.L., Toro, H., 2008. Infectious bronchitis virus in the
chicken Harderian gland and lachrymal fluid: viral load, infectivity, immune cell responses, and effects
of viral immunodeficiency. Avian Dis. 52, 608-617.
38. Van Riel, D., Munster, V.J., de Wit, E., Rimmelzwaan, G.F., Fouchier, R.A., Osterhaus, A.D., Kuiken,
T., 2007. Human and avian influenza viruses target different cells in the lower respiratory tract of
humans and other mammals. Am. J. Pathol. 171, 1215-1223.
39. Vervelde, L., Vermeulen, A.N., Jeurissen, S.H., 1996. In situ characterization of leucocyte
subpopulations after infection with Eimeria tenella in chickens. Parasite Immunol. 18, 247-256.
40. Wan, H., Perez, D.R., 2005. Quail carry sialic acid receptors compatible with binding of avian and
human influenza viruses. Virology 346, 278-286.
41. Withers, D.R., Young, J.R., Davison, T.F., 2005. Infectious bursal disease virus-induced
immunosuppression in the chick is associated with the presence of undifferentiated follicles in the
recovering bursa. Viral Immunol. 18, 127-137.
42. Wu, H., Kerr, M., Cui, X., Churchill, G., 2003. MAANOVA: a software package for the analysis of
spotted cDNA microarray experiments. In The analysis of gene expression data: methods and software,
pp. 49. Edited by G. Parmigiani, E.S. Garrett, R.A. Irizarry, S.L. Zeger. NY: Springer.
43. Xing, Z., Cardona, C.J., Li, J., Dao, N., Tran, T., Andrada, J., 2008. Modulation of the immune
responses in chickens by low-pathogenicity avian influenza virus H9N2. J. Gen. Virol. 89, 1288-1299.
44. Yang, Y.H., Dudoit, S., Luu, P., Lin, D.M., Peng, V., Ngai, J., Speed, T.P., 2002. Normalization for
cDNA microarray data: a robust composite method addressing single and multiple slide systematic
variation. Nucleic Acids Res. 30, e15.
Supplementary data
Table S1. Expression of immune related genes induce by H9N2 infection in upper trachea 3 d.p.i.
Decription Ensembl ID Fold
change†
Cytokine/chemokine activity
Eosinophil chemotactic cytokine ENSGALG00000023760 0.02
Cytokine-like protein 1 ENSGALG00000015015 0.33
TNF receptor-associated factor 3 interacting protein 1 ENSGALG00000004236 0.44
Cytokine ENSGALG00000024470 0.46
Transforming growth factor beta-3 precursor ENSGALG00000010346 0.48

Airflow and anatomy affect host responses to AIV infection in the avian lung
97
Growth hormone receptor precursor ENSGALG00000014855 0.54
Transforming growth factor beta-2 precursor ENSGALG00000009612 0.60
Chemokine (C-C motif) receptor 2 ENSGALG00000011733 1.62
Cytokine ENSGALG00000002329 1.69
CX3C chemokine receptor 1 ENSGALG00000011955 1.74
CX3C chemokine ENSGALG00000021467 1.77
Lymphocyte antigen 75 ENSGALG00000011153 1.89
Chemokine (C-C motif) ligand 20 (MIP-3a) ENSGALG00000003003 1.99
Chemokine (C-C motif) receptor 5 ENSGALG00000011732 1.99
Tumor necrosis factor (ligand) superfamily, member 13b (BAFF) ENSGALG00000016852 2.03
Granulocyte colony stimulating factor 3 receptor ENSGALG00000002112 2.20
Decoy receptor 3 ENSGALG00000006106 2.22
Small inducible cytokine B13 precursor ENSGALG00000010336 2.38
Platelet-activating factor receptor ENSGALESTG00000001511 2.83
N-myc-interactor ENSGALG00000012480 3.17
Suppressor of cytokine signaling 1 ENSGALG00000007158 3.71
Chemokine ENSGALG00000024466 4.05
Lymphocyte antigen 6E precursor ENSGALG00000016152 4.41
Suppressor of cytokine signaling 3 ENSGALG00000007189 4.90
Signal transducer and activator of transcription 4 ENSGALG00000007651 5.45
Interferon-induced GTP-binding protein Mx ENSGALG00000016142 6.16
Macrophage inflammatory protein 1-beta homolog (CCL4) ENSGALG00000000951 6.96
Lymphocyte antigen 96 precursor ENSGALG00000015648 7.19
K60 protein ENSGALG00000011668 8.93
2'-5'-oligoadenylate synthetase-like (OASL) ENSGALG00000013723 14.22
Chemokine ah221 ENSGALG00000014585 14.26
Apoptosis
Cell death activator CIDE-A (Cell death-inducing DFFA-like effector A) ENSGALG00000000018 0.23
Death-associated protein ENSGALG00000013002 0.50
Sprouty homolog 2 ENSGALG00000016906 0.58
Uveal autoantigen with coiled-coil domains and ankyrin repeats ENSGALG00000008143 0.59
RING finger protein 122 ENSGALG00000001640 0.63
Myeloid cell leukemia protein MCL-1 ENSGALG00000014628 1.41
Receptor (TNFRSF)-interacting serine-threonine kinase 1 ENSGALG00000012827 1.64
Apoptosis facilitator Bcl-2-like 14 protein ENSGALG00000011544 1.66
Tumor necrosis factor, alpha-induced protein 8-like protein 1 ENSGALG00000004266 1.78
TNF, alpha-induced protein 8 ENSGALG00000002196 1.85
Tumor necrosis factor receptor superfamily member 21 precursor ENSGALG00000016719 1.89
Fas ligand receptor soluble form ENSGALG00000006351 1.89
Initiator caspase ENSGALG00000008346 1.92
Caspase-7 precursor ENSGALG00000008933 1.93
Caspase 1 ENSGALG00000001049 2.09
BCL2-antagonist/killer 1 ENSGALG00000003182 2.26
Caspase 8 ENSGALG00000008355 2.28

Chapter 5
98
Granzyme A ENSGALG00000013548 2.61
Ras association domain family 2 ENSGALG00000000206 3.41
Pannexin-1 ENSGALG00000017213 8.28
T cell
Gallus gallus Thy-1 cell surface antigen (THY1) ENSGALG00000006751 0.47
CD82 antigen ENSGALG00000008044 0.53
Tumor necrosis factor receptor superfamily member 11A precursor ENSGALG00000012891 1.43
DNA-binding protein Ikaros ENSGALG00000013086 1.44
CD2-associated protein ENSGALG00000016720 1.57
Psychosine receptor ENSGALG00000010595 1.68
FYN binding protein ENSGALG00000003792 1.81
T-cell immunoglobulin and mucin domain containing 4 ENSGALG00000003876 2.00
TNF receptor superfamily, member 18 ENSGALG00000001882 2.01
T-cell-specific surface glycoprotein CD28 homolog precursor ENSGALG00000008669 2.07
Inducible T-cell co-stimulator precursor ENSGALG00000008656 2.08
TCR gamma alternate reading frame protein isoform 2 ENSGALG00000019602 2.46
GTPase, IMAP family member 7 ENSGALG00000005136 2.59
Lymphocyte cytosolic protein 2 ENSGALG00000002113 2.63
T-cell surface glycoprotein CD3 epsilon chain ENSGALG00000007416 2.65
CD3D antigen, delta polypeptide ENSGALG00000007418 3.15
GTPase,IMAP family member 4 ENSGALG00000005650 3.44
Src-like-adaptor ENSGALG00000016234 3.59
Lymphocyte cytosolic protein 1 (L-plastin) ENSGALG00000016986 4.68
Interferon induced
Mimecan/Osteoglycin. ENSGALG00000004732 0.44
Interferon regulatory factor 3 (IRF-3) ENSGALG00000014297 1.48
Interferon-induced 35 kDa protein (IFP 35) ENSGALG00000002832 1.85
Interferon regulatory factor 8 (IRF-8) ENSGALG00000005757 1.87
TRAF-type zinc finger domain containing 1 (FLN29) (TRAFD1) ENSGALG00000004802 2.06
Interferon regulatory factor 10 ENSGALG00000006448 3.71
Interferon regulatory factor 1 (IRF-1) ENSGALG00000006785 3.88
Interferon-induced helicase C domain-containing protein 1 ENSGALG00000011089 3.96
Ubiquitin specific peptidase 18 ENSGALG00000013057 4.57
Interferon induced transmembrane protein 5 ENSGALG00000004243 7.19
Putative ISG12-2 protein ENSGALG00000013575 15.90
Interleukin
Oncostatin-M specific receptor subunit beta precursor. ENSGALG00000003747 0.51
Interleukin 7 ENSGALG00000022798 1.36
Interleukin 22 receptor, alpha 1 ENSGALG00000004221 1.57
Interleukin-7 receptor alpha chain ENSGALG00000013372 2.04
Interleukin-18 receptor 1 precursor ENSGALG00000016786 2.30
Interleukin 10 receptor, beta ENSGALG00000015941 2.67
Interleukin-20 receptor alpha chain ENSGALG00000013869 3.32
Interleukin 2 receptor, gamma ENSGALG00000005638 3.66
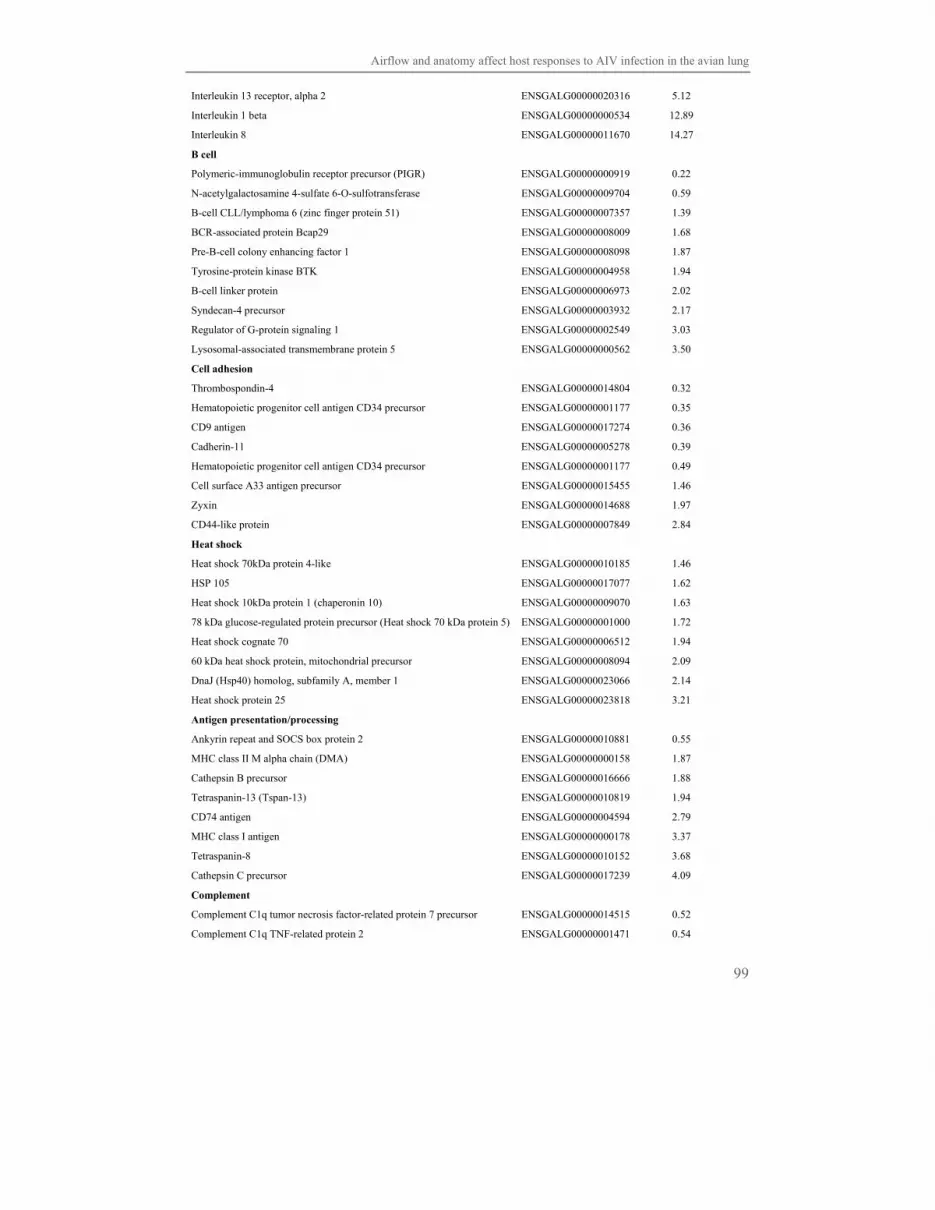
Airflow and anatomy affect host responses to AIV infection in the avian lung
99
Interleukin 13 receptor, alpha 2 ENSGALG00000020316 5.12
Interleukin 1 beta ENSGALG00000000534 12.89
Interleukin 8 ENSGALG00000011670 14.27
B cell
Polymeric-immunoglobulin receptor precursor (PIGR) ENSGALG00000000919 0.22
N-acetylgalactosamine 4-sulfate 6-O-sulfotransferase ENSGALG00000009704 0.59
B-cell CLL/lymphoma 6 (zinc finger protein 51) ENSGALG00000007357 1.39
BCR-associated protein Bcap29 ENSGALG00000008009 1.68
Pre-B-cell colony enhancing factor 1 ENSGALG00000008098 1.87
Tyrosine-protein kinase BTK ENSGALG00000004958 1.94
B-cell linker protein ENSGALG00000006973 2.02
Syndecan-4 precursor ENSGALG00000003932 2.17
Regulator of G-protein signaling 1 ENSGALG00000002549 3.03
Lysosomal-associated transmembrane protein 5 ENSGALG00000000562 3.50
Cell adhesion
Thrombospondin-4 ENSGALG00000014804 0.32
Hematopoietic progenitor cell antigen CD34 precursor ENSGALG00000001177 0.35
CD9 antigen ENSGALG00000017274 0.36
Cadherin-11 ENSGALG00000005278 0.39
Hematopoietic progenitor cell antigen CD34 precursor ENSGALG00000001177 0.49
Cell surface A33 antigen precursor ENSGALG00000015455 1.46
Zyxin ENSGALG00000014688 1.97
CD44-like protein ENSGALG00000007849 2.84
Heat shock
Heat shock 70kDa protein 4-like ENSGALG00000010185 1.46
HSP 105 ENSGALG00000017077 1.62
Heat shock 10kDa protein 1 (chaperonin 10) ENSGALG00000009070 1.63
78 kDa glucose-regulated protein precursor (Heat shock 70 kDa protein 5) ENSGALG00000001000 1.72
Heat shock cognate 70 ENSGALG00000006512 1.94
60 kDa heat shock protein, mitochondrial precursor ENSGALG00000008094 2.09
DnaJ (Hsp40) homolog, subfamily A, member 1 ENSGALG00000023066 2.14
Heat shock protein 25 ENSGALG00000023818 3.21
Antigen presentation/processing
Ankyrin repeat and SOCS box protein 2 ENSGALG00000010881 0.55
MHC class II M alpha chain (DMA) ENSGALG00000000158 1.87
Cathepsin B precursor ENSGALG00000016666 1.88
Tetraspanin-13 (Tspan-13) ENSGALG00000010819 1.94
CD74 antigen ENSGALG00000004594 2.79
MHC class I antigen ENSGALG00000000178 3.37
Tetraspanin-8 ENSGALG00000010152 3.68
Cathepsin C precursor ENSGALG00000017239 4.09
Complement
Complement C1q tumor necrosis factor-related protein 7 precursor ENSGALG00000014515 0.52
Complement C1q TNF-related protein 2 ENSGALG00000001471 0.54
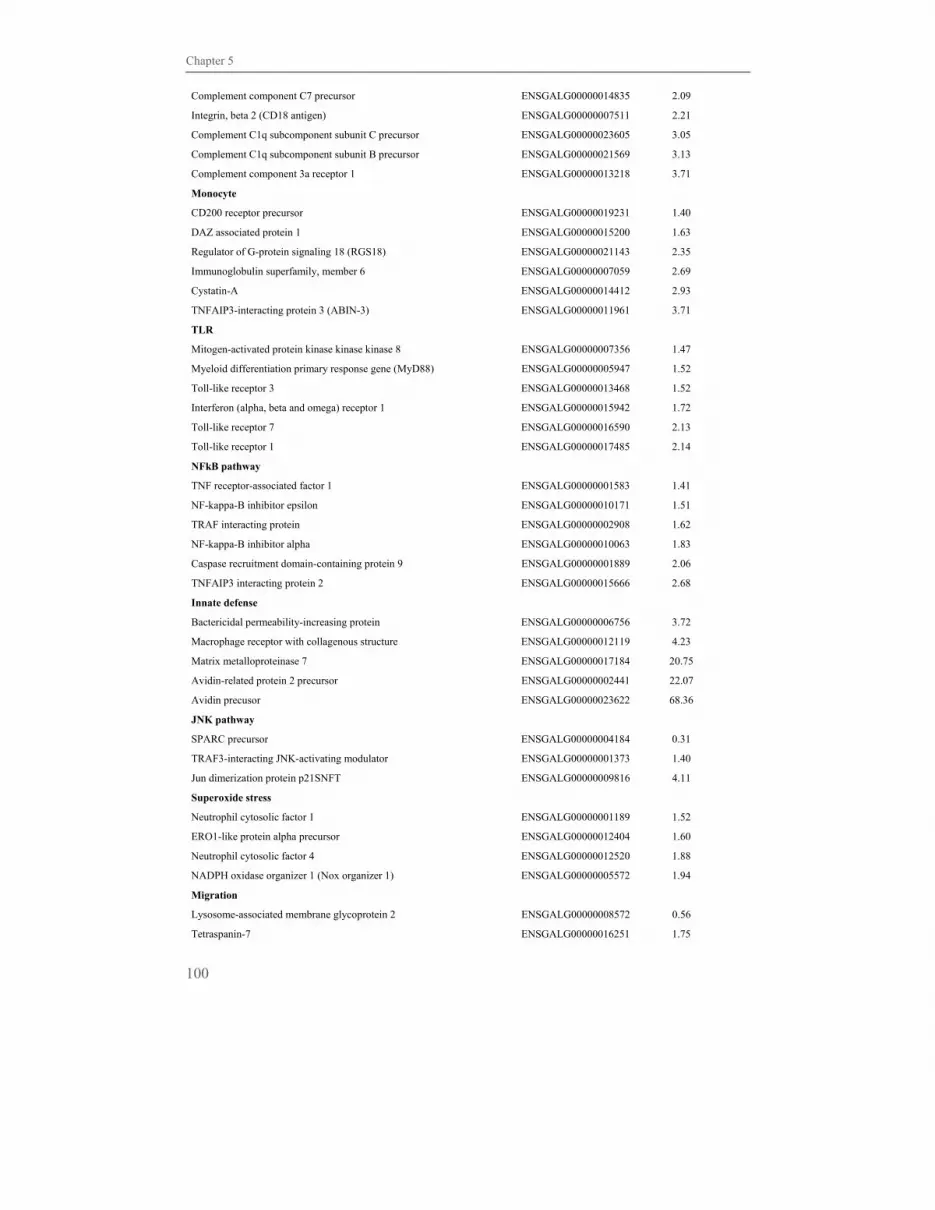
Chapter 5
100
Complement component C7 precursor ENSGALG00000014835 2.09
Integrin, beta 2 (CD18 antigen) ENSGALG00000007511 2.21
Complement C1q subcomponent subunit C precursor ENSGALG00000023605 3.05
Complement C1q subcomponent subunit B precursor ENSGALG00000021569 3.13
Complement component 3a receptor 1 ENSGALG00000013218 3.71
Monocyte
CD200 receptor precursor ENSGALG00000019231 1.40
DAZ associated protein 1 ENSGALG00000015200 1.63
Regulator of G-protein signaling 18 (RGS18) ENSGALG00000021143 2.35
Immunoglobulin superfamily, member 6 ENSGALG00000007059 2.69
Cystatin-A ENSGALG00000014412 2.93
TNFAIP3-interacting protein 3 (ABIN-3) ENSGALG00000011961 3.71
TLR
Mitogen-activated protein kinase kinase kinase 8 ENSGALG00000007356 1.47
Myeloid differentiation primary response gene (MyD88) ENSGALG00000005947 1.52
Toll-like receptor 3 ENSGALG00000013468 1.52
Interferon (alpha, beta and omega) receptor 1 ENSGALG00000015942 1.72
Toll-like receptor 7 ENSGALG00000016590 2.13
Toll-like receptor 1 ENSGALG00000017485 2.14
NFkB pathway
TNF receptor-associated factor 1 ENSGALG00000001583 1.41
NF-kappa-B inhibitor epsilon ENSGALG00000010171 1.51
TRAF interacting protein ENSGALG00000002908 1.62
NF-kappa-B inhibitor alpha ENSGALG00000010063 1.83
Caspase recruitment domain-containing protein 9 ENSGALG00000001889 2.06
TNFAIP3 interacting protein 2 ENSGALG00000015666 2.68
Innate defense
Bactericidal permeability-increasing protein ENSGALG00000006756 3.72
Macrophage receptor with collagenous structure ENSGALG00000012119 4.23
Matrix metalloproteinase 7 ENSGALG00000017184 20.75
Avidin-related protein 2 precursor ENSGALG00000002441 22.07
Avidin precusor ENSGALG00000023622 68.36
JNK pathway
SPARC precursor ENSGALG00000004184 0.31
TRAF3-interacting JNK-activating modulator ENSGALG00000001373 1.40
Jun dimerization protein p21SNFT ENSGALG00000009816 4.11
Superoxide stress
Neutrophil cytosolic factor 1 ENSGALG00000001189 1.52
ERO1-like protein alpha precursor ENSGALG00000012404 1.60
Neutrophil cytosolic factor 4 ENSGALG00000012520 1.88
NADPH oxidase organizer 1 (Nox organizer 1) ENSGALG00000005572 1.94
Migration
Lysosome-associated membrane glycoprotein 2 ENSGALG00000008572 0.56
Tetraspanin-7 ENSGALG00000016251 1.75

Airflow and anatomy affect host responses to AIV infection in the avian lung
101
Matrix metalloproteinase 9 ENSGALG00000006992 2.90
Lysozym activity
Lysozyme C precursor ENSGALG00000009963 0.18
Lysozyme g precursor ENSGALG00000016761 2.13
Vesicule trafficking
Microtubule-associated proteins 1A/1B light chain 3C precursor ENSGALG00000010741 0.61
C-type lectin domain family 3, member B ENSGALG00000011883 0.20
NK cell
Peroxiredoxin-1(Natural killer cell-enhancing factor A) ENSGALG00000010243 4.57
Ig-like receptor
Similar to immunoglobulin-like receptor CHIR-B4 ENSGALG00000022376 2.08
Differentiation
CCAAT/enhancer-binding protein beta ENSGALG00000008014 2.17
Hemapoetic cell linage
Myeloid leukemia factor 1 ENSGALG00000009654 0.39
Respiratory gas exchange
Surfactant, pulmonary-associated protein A2 (SP-A1) ENSGALG00000002503 0.02
Miscellaneous
Surfactant, pulmonary-associated protein A2 (SP-A2 ENSGALG00000002496 0.07
Lactoperoxidase precursor ENSGALG00000000979 0.11
Uncharacterized protein CXorf41 (Sarcoma antigen NY-SAR-97) ENSGALG00000004870 0.19
CDNA FLJ44366 fis, clone TRACH3008629, weakly similar to Cadherin- related tumor suppressor (Hypothetical protein FLJ23834)
ENSGALG00000008109 0.20
Prostate stem cell antigen precursor ENSGALG00000016153 0.22
LIM and senescent cell antigen-like-containing domain protein 1 ENSGALG00000014148 0.35
Serine/threonine/tyrosine-interacting-like protein 1 ENSGALG00000001963 0.36
Podoplanin precursor ENSGALG00000004095 0.37
72 kDa type IV collagenase precursor (Matrix metalloproteinase-2) ENSGALG00000003580 0.38
CD36 antigen ENSGALG00000008439 0.41
Regulator of G-protein signalling 3 RGS3L isoform ENSGALG00000008881 0.47
Growth hormone receptor precursor ENSGALG00000014855 0.48
Dual specificity phosphatase 26 ENSGALG00000001633 0.50
Rhombotin-1 ENSGALG00000005967 0.51
Beta-galactoside-binding lectin (C-16) ENSGALG00000011480 0.51
GDNF family receptor alpha-1 precursor ENSGALG00000009173 0.51
Ly-6 antigen/uPA receptor-like domain-containing protein ENSGALG00000012467 0.51
Sperm-associated antigen 16 protein ENSGALG00000003148 0.54
Heat shock factor protein 3 ENSGALG00000004644 0.57
Thymic dendritic cell-derived factor 1 ENSGALG00000010746 0.59
Metalloproteinase inhibitor 3 precursor ENSGALG00000012568 0.63
NADH dehydrogenase [ubiquinone] flavoprotein 3, mitochondrial precursor
ENSGALG00000022813 0.64
Platelet-derived growth factor D precursor ENSGALG00000017179 0.64
RAS-like family 11 member B ENSGALG00000013948 0.66
Calcium binding atopy-related autoantigen 1 ENSGALG00000004372 0.70

Chapter 5
102
Dolichyl-diphosphooligosaccharide--protein glycosyltransferase subunit DAD1
ENSGALG00000000196 0.75
Sarcoma antigen NY-SAR-48 isoform a ENSGALG00000003727 1.30
52 kDa repressor of the inhibitor of the protein kinase ENSGALG00000000838 1.33
NMDA receptor-regulated protein 1 ENSGALG00000009782 1.40
Sarcoma antigen NY-SAR-79 ENSGALG00000012103 1.42
RRP5 protein homolog (Programmed cell death protein 11) ENSGALG00000008265 1.48
Leptin receptor (CD295 antigen) ENSGALG00000011058 1.51
Hypothetical protein LOC422107 ENSGALG00000007713 1.53
Condensin complex subunit 3 ENSGALG00000014425 1.54
Putative RNA methyltransferase NOL1 ENSGALG00000014445 1.64
Small nuclear ribonucleoprotein Sm D1 ENSGALG00000011842 1.64
Sjogren syndrome antigen B ENSGALG00000009677 1.65
Fanconi anemia, complementation group L ENSGALG00000007879 1.69
Tissue factor precursor (CD142 antigen) ENSGALG00000005619 1.71
Ribosomal protein S6 kinase 2 alpha ENSGALG00000000366 1.75
SEC6-like protein C14orf73 ENSGALG00000011443 1.86
Proliferating cell nuclear antigen (PCNA) ENSGALG00000000169 1.97
Shugoshin-like 1 ENSGALG00000011281 2.05
Tetraspanin-1 ENSGALG00000010343 2.17
Gallus gallus hypothetical LOC426928 (LOC426928), mRNA ENSGALG00000002869 2.21
Programmed cell death 1 ligand 1 precursor (CD274) ENSGALG00000015031 2.41
Targeting protein for Xklp2 ENSGALG00000006267 2.77
PHD finger protein 11 ENSGALG00000019094 2.96
Ankyrin repeat domain-containing protein 22 ENSGALG00000006315 3.07
Undescribed
genomic:1+100209867-100209940 genomic:1+100209867-100209940
0.12
ENSGALG00000001004 ENSGALG00000001004 0.32
ENSGALG00000024386 ENSGALG00000024386 0.34
ENSGALG00000007735 ENSGALG00000007735 0.48
ENSGALG00000003338 ENSGALG00000003338 0.51
ENSGALG00000002431 ENSGALG00000002431 0.54
genomic:Un_random-9337222-9337263 genomic:Un_random-9337222-9337263
0.68
genomic:14-4187818-4187887 genomic:14-4187818-4187887
1.92
genomic:2+863896-863967 genomic:2+863896-863967 1.95
ENSGALG00000000974 ENSGALG00000000974 2.19
genomic:2+61818365-61818434 genomic:2+61818365-61818434
2.54
ENSGALG00000010338 ENSGALG00000010338 2.60
ENSGALESTG00000000019 ENSGALESTG00000000019 2.64
ENSGALG00000001478 ENSGALG00000001478 2.80
ENSGALG00000011806 ENSGALG00000011806 3.21
ENSGALG00000006384 ENSGALG00000006384 17.21
† Expression ratio in upper trachea of infected birds compared to expression ratio in upper trachea of naïve birds
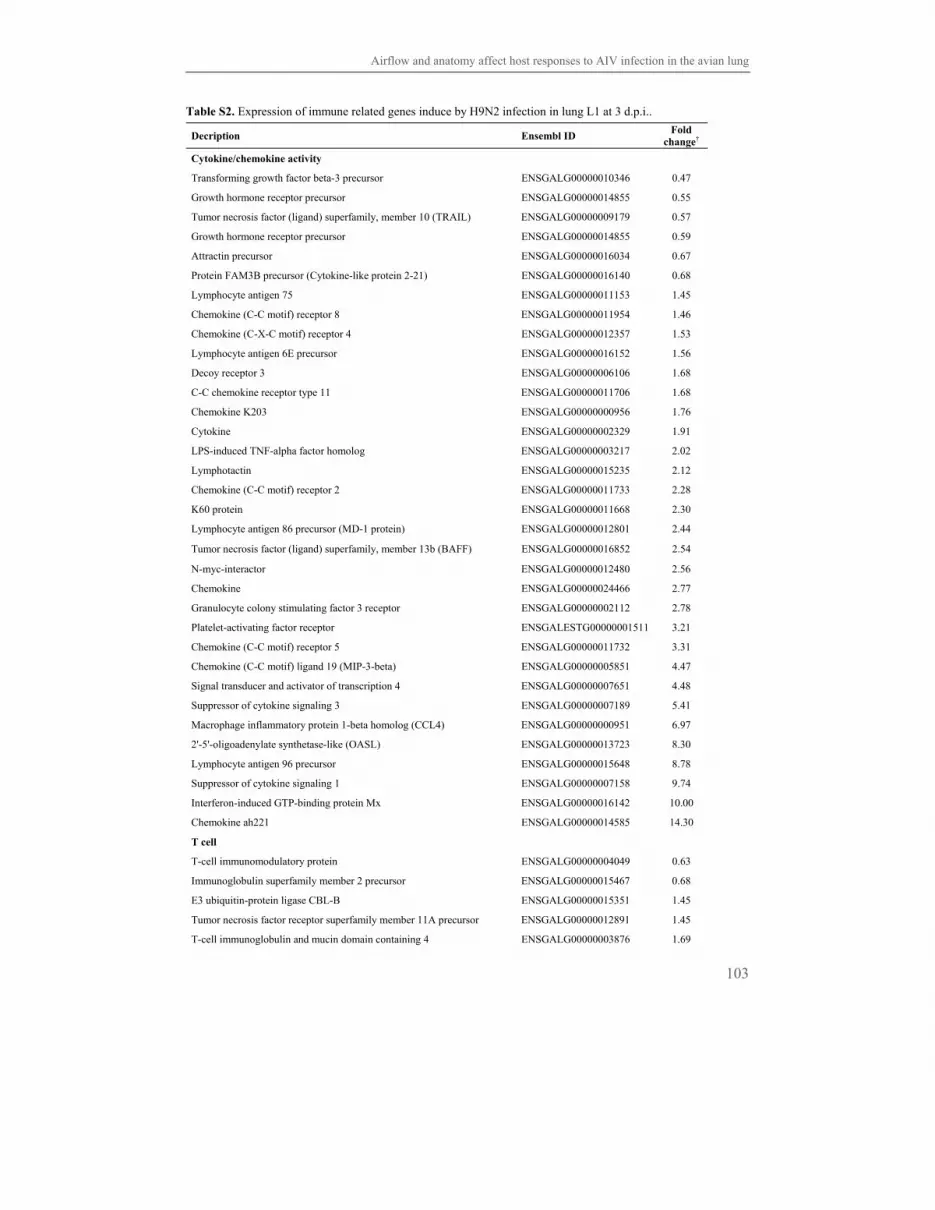
Airflow and anatomy affect host responses to AIV infection in the avian lung
103
Table S2. Expression of immune related genes induce by H9N2 infection in lung L1 at 3 d.p.i..
Decription Ensembl ID Fold
change†
Cytokine/chemokine activity
Transforming growth factor beta-3 precursor ENSGALG00000010346 0.47
Growth hormone receptor precursor ENSGALG00000014855 0.55
Tumor necrosis factor (ligand) superfamily, member 10 (TRAIL) ENSGALG00000009179 0.57
Growth hormone receptor precursor ENSGALG00000014855 0.59
Attractin precursor ENSGALG00000016034 0.67
Protein FAM3B precursor (Cytokine-like protein 2-21) ENSGALG00000016140 0.68
Lymphocyte antigen 75 ENSGALG00000011153 1.45
Chemokine (C-C motif) receptor 8 ENSGALG00000011954 1.46
Chemokine (C-X-C motif) receptor 4 ENSGALG00000012357 1.53
Lymphocyte antigen 6E precursor ENSGALG00000016152 1.56
Decoy receptor 3 ENSGALG00000006106 1.68
C-C chemokine receptor type 11 ENSGALG00000011706 1.68
Chemokine K203 ENSGALG00000000956 1.76
Cytokine ENSGALG00000002329 1.91
LPS-induced TNF-alpha factor homolog ENSGALG00000003217 2.02
Lymphotactin ENSGALG00000015235 2.12
Chemokine (C-C motif) receptor 2 ENSGALG00000011733 2.28
K60 protein ENSGALG00000011668 2.30
Lymphocyte antigen 86 precursor (MD-1 protein) ENSGALG00000012801 2.44
Tumor necrosis factor (ligand) superfamily, member 13b (BAFF) ENSGALG00000016852 2.54
N-myc-interactor ENSGALG00000012480 2.56
Chemokine ENSGALG00000024466 2.77
Granulocyte colony stimulating factor 3 receptor ENSGALG00000002112 2.78
Platelet-activating factor receptor ENSGALESTG00000001511 3.21
Chemokine (C-C motif) receptor 5 ENSGALG00000011732 3.31
Chemokine (C-C motif) ligand 19 (MIP-3-beta) ENSGALG00000005851 4.47
Signal transducer and activator of transcription 4 ENSGALG00000007651 4.48
Suppressor of cytokine signaling 3 ENSGALG00000007189 5.41
Macrophage inflammatory protein 1-beta homolog (CCL4) ENSGALG00000000951 6.97
2'-5'-oligoadenylate synthetase-like (OASL) ENSGALG00000013723 8.30
Lymphocyte antigen 96 precursor ENSGALG00000015648 8.78
Suppressor of cytokine signaling 1 ENSGALG00000007158 9.74
Interferon-induced GTP-binding protein Mx ENSGALG00000016142 10.00
Chemokine ah221 ENSGALG00000014585 14.30
T cell
T-cell immunomodulatory protein ENSGALG00000004049 0.63
Immunoglobulin superfamily member 2 precursor ENSGALG00000015467 0.68
E3 ubiquitin-protein ligase CBL-B ENSGALG00000015351 1.45
Tumor necrosis factor receptor superfamily member 11A precursor ENSGALG00000012891 1.45
T-cell immunoglobulin and mucin domain containing 4 ENSGALG00000003876 1.69
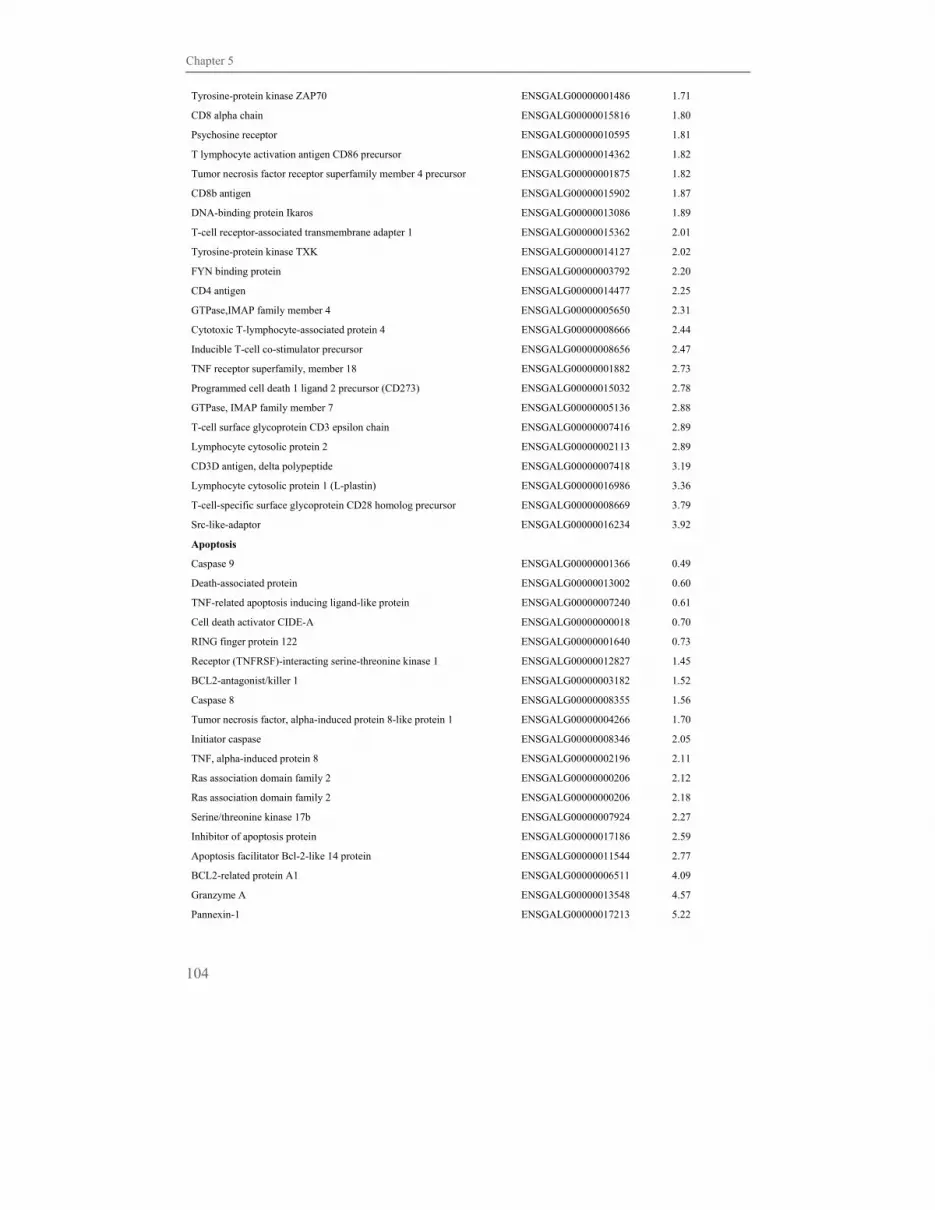
Chapter 5
104
Tyrosine-protein kinase ZAP70 ENSGALG00000001486 1.71
CD8 alpha chain ENSGALG00000015816 1.80
Psychosine receptor ENSGALG00000010595 1.81
T lymphocyte activation antigen CD86 precursor ENSGALG00000014362 1.82
Tumor necrosis factor receptor superfamily member 4 precursor ENSGALG00000001875 1.82
CD8b antigen ENSGALG00000015902 1.87
DNA-binding protein Ikaros ENSGALG00000013086 1.89
T-cell receptor-associated transmembrane adapter 1 ENSGALG00000015362 2.01
Tyrosine-protein kinase TXK ENSGALG00000014127 2.02
FYN binding protein ENSGALG00000003792 2.20
CD4 antigen ENSGALG00000014477 2.25
GTPase,IMAP family member 4 ENSGALG00000005650 2.31
Cytotoxic T-lymphocyte-associated protein 4 ENSGALG00000008666 2.44
Inducible T-cell co-stimulator precursor ENSGALG00000008656 2.47
TNF receptor superfamily, member 18 ENSGALG00000001882 2.73
Programmed cell death 1 ligand 2 precursor (CD273) ENSGALG00000015032 2.78
GTPase, IMAP family member 7 ENSGALG00000005136 2.88
T-cell surface glycoprotein CD3 epsilon chain ENSGALG00000007416 2.89
Lymphocyte cytosolic protein 2 ENSGALG00000002113 2.89
CD3D antigen, delta polypeptide ENSGALG00000007418 3.19
Lymphocyte cytosolic protein 1 (L-plastin) ENSGALG00000016986 3.36
T-cell-specific surface glycoprotein CD28 homolog precursor ENSGALG00000008669 3.79
Src-like-adaptor ENSGALG00000016234 3.92
Apoptosis
Caspase 9 ENSGALG00000001366 0.49
Death-associated protein ENSGALG00000013002 0.60
TNF-related apoptosis inducing ligand-like protein ENSGALG00000007240 0.61
Cell death activator CIDE-A ENSGALG00000000018 0.70
RING finger protein 122 ENSGALG00000001640 0.73
Receptor (TNFRSF)-interacting serine-threonine kinase 1 ENSGALG00000012827 1.45
BCL2-antagonist/killer 1 ENSGALG00000003182 1.52
Caspase 8 ENSGALG00000008355 1.56
Tumor necrosis factor, alpha-induced protein 8-like protein 1 ENSGALG00000004266 1.70
Initiator caspase ENSGALG00000008346 2.05
TNF, alpha-induced protein 8 ENSGALG00000002196 2.11
Ras association domain family 2 ENSGALG00000000206 2.12
Ras association domain family 2 ENSGALG00000000206 2.18
Serine/threonine kinase 17b ENSGALG00000007924 2.27
Inhibitor of apoptosis protein ENSGALG00000017186 2.59
Apoptosis facilitator Bcl-2-like 14 protein ENSGALG00000011544 2.77
BCL2-related protein A1 ENSGALG00000006511 4.09
Granzyme A ENSGALG00000013548 4.57
Pannexin-1 ENSGALG00000017213 5.22

Airflow and anatomy affect host responses to AIV infection in the avian lung
105
Interleukin
Interleukin 1 receptor-like 1 isoform LV ENSGALG00000016785 1.45
Interleukin-22 precursor ENSGALG00000009904 1.47
Interleukin 21 receptor ENSGALG00000006318 1.59
Interleukin 6 ENSGALG00000010915 1.69
Interleukin 13 receptor, alpha 1 ENSGALG00000006032 1.76
Interleukin 15 precursor ENSGALG00000009870 1.76
Sushi domain-containing protein 3. ENSGALG00000005231 1.97
Interleukin 10 receptor, beta ENSGALG00000015941 2.03
Interleukin-20 receptor alpha chain ENSGALG00000013869 2.21
Interleukin-7 receptor alpha chain ENSGALG00000013372 2.30
Interleukin-18 receptor 1 precursor ENSGALG00000016786 3.08
Interleukin 8 ENSGALG00000011670 3.23
Interleukin-18 ENSGALG00000007874 3.62
Interleukin 13 receptor, alpha 2 ENSGALG00000020316 3.82
Interleukin 2 receptor, gamma ENSGALG00000005638 3.98
Interleukin 16 ENSGALG00000006388 4.01
Interleukin 1 beta ENSGALG00000000534 6.08
Interferon induced
Interferon-related developmental regulator 1 ENSGALG00000009448 0.56
Mimecan/Osteoglycin. ENSGALG00000004732 0.67
Interferon regulatory factor 8 (IRF-8) ENSGALG00000005757 1.59
Interferon (alpha, beta and omega) receptor 1 ENSGALG00000015942 1.64
TRAF-type zinc finger domain containing 1 (FLN29) (TRAFD1) ENSGALG00000004802 1.87
Interferon-induced 35 kDa protein (IFP 35) ENSGALG00000002832 1.89
Interferon regulatory factor 1 (IRF-1) ENSGALG00000006785 2.03
Interferon induced transmembrane protein 5 ENSGALG00000004243 2.13
Ubiquitin specific peptidase 18 ENSGALG00000013057 2.48
Interferon-induced helicase C domain-containing protein 1 ENSGALG00000011089 3.58
Gamma- interferon-inducible protein IP-30 ENSGALG00000003389 3.75
Interferon regulatory factor 10 ENSGALG00000006448 3.77
Putative ISG12-2 protein ENSGALG00000013575 7.88
Antigen presentation
MHC B-G antigen isoform 1 precursor ENSGALG00000024357 0.49
MHC class IV antigen ENSGALG00000024365 0.57
L-amino-acid oxidase ENSGALG00000000081 1.75
MHC class I antigen ENSGALG00000000178 1.91
MHC class II beta chain ENSGALG00000000141 2.06
CD74 antigen ENSGALG00000004594 2.24
Tetraspanin-8 ENSGALG00000010152 2.30
MHC class II M alpha chain (DMA) ENSGALG00000000158 2.34
Bone marrow stromal cell antigen 1 ENSGALG00000014509 2.94
Cathepsin B precursor ENSGALG00000016666 3.81
Cathepsin C precursor ENSGALG00000017239 4.67

Chapter 5
106
B cell
Polymeric-immunoglobulin receptor precursor (PIGR) ENSGALG00000000919 0.39
B-cell linker protein ENSGALG00000006973 2.63
Kelch-like 6 ENSGALG00000002263 1.45
BCR-associated protein Bcap29 ENSGALG00000008009 1.60
Syndecan-4 precursor ENSGALG00000003932 1.69
Raftlin ENSGALG00000011241 1.72
Tyrosine-protein kinase BTK ENSGALG00000004958 2.20
B6.1 ENSGALG00000015461 2.64
B-cell CLL/lymphoma 6 ENSGALG00000007357 2.79
Lysosomal-associated transmembrane protein 5 ENSGALG00000000562 3.31
Regulator of G-protein signaling 1 ENSGALG00000002549 3.39
Innate defence
Collectin sub-family member 10 ENSGALG00000016113 0.50
Beta-galactoside-binding lectin (14 kDa lectin) ENSGALG00000012420 0.62
Gallinacin-4 precursor ENSGALG00000019843 1.53
Macrophage receptor with collagenous structure ENSGALG00000012119 3.09
Bactericidal permeability-increasing protein ENSGALG00000006756 3.54
Pentraxin-related PTX3 ENSGALG00000009694 4.86
Matrix metalloproteinase 7 ENSGALG00000017184 9.66
Avidin-related protein 2 precursor ENSGALG00000002441 41.22
Avidin precusor ENSGALG00000023622 56.65
Adhesion
Cadherin-11 ENSGALG00000005278 0.55
Hematopoietic progenitor cell antigen CD34 precursor ENSGALG00000001177 0.58
cAMP-dependent protein kinase type II-beta regulatory subunit ENSGALG00000008060 0.65
Catenin (cadherin-associated protein), beta 1, 88kDa ENSGALG00000011905 0.71
Lectin, galactoside-binding, soluble, 3 (galectin 3) ENSGALG00000012173 1.43
Alpha 4 integrin (CD49D) ENSGALG00000008978 1.66
Zyxin ENSGALG00000014688 2.29
Gallus gallus vascular cell adhesion molecule 1 (VCAM1) ENSGALG00000005257 2.75
CD44-like protein ENSGALG00000007849 3.35
NF-kB pathway
Nuclear receptor coactivator 6 ENSGALG00000001182 0.46
Receptor-interacting serine/threonine-protein kinase 4 ENSGALG00000016145 0.62
TNF receptor-associated factor 5 ENSGALG00000009864 1.56
NF-kappa-B inhibitor epsilon ENSGALG00000010171 1.67
TNFAIP3-interacting protein 3 (ABIN-3) ENSGALG00000011961 1.71
TNF receptor-associated factor 3 ENSGALG00000011389 1.72
TNFAIP3 interacting protein 2 ENSGALG00000015666 1.78
TNF receptor-associated factor 1 ENSGALG00000001583 1.78
Caspase recruitment domain-containing protein 9 ENSGALG00000001889 2.52
Complement
Complement C1q tumor necrosis factor-related protein 7 precursor ENSGALG00000014515 0.55
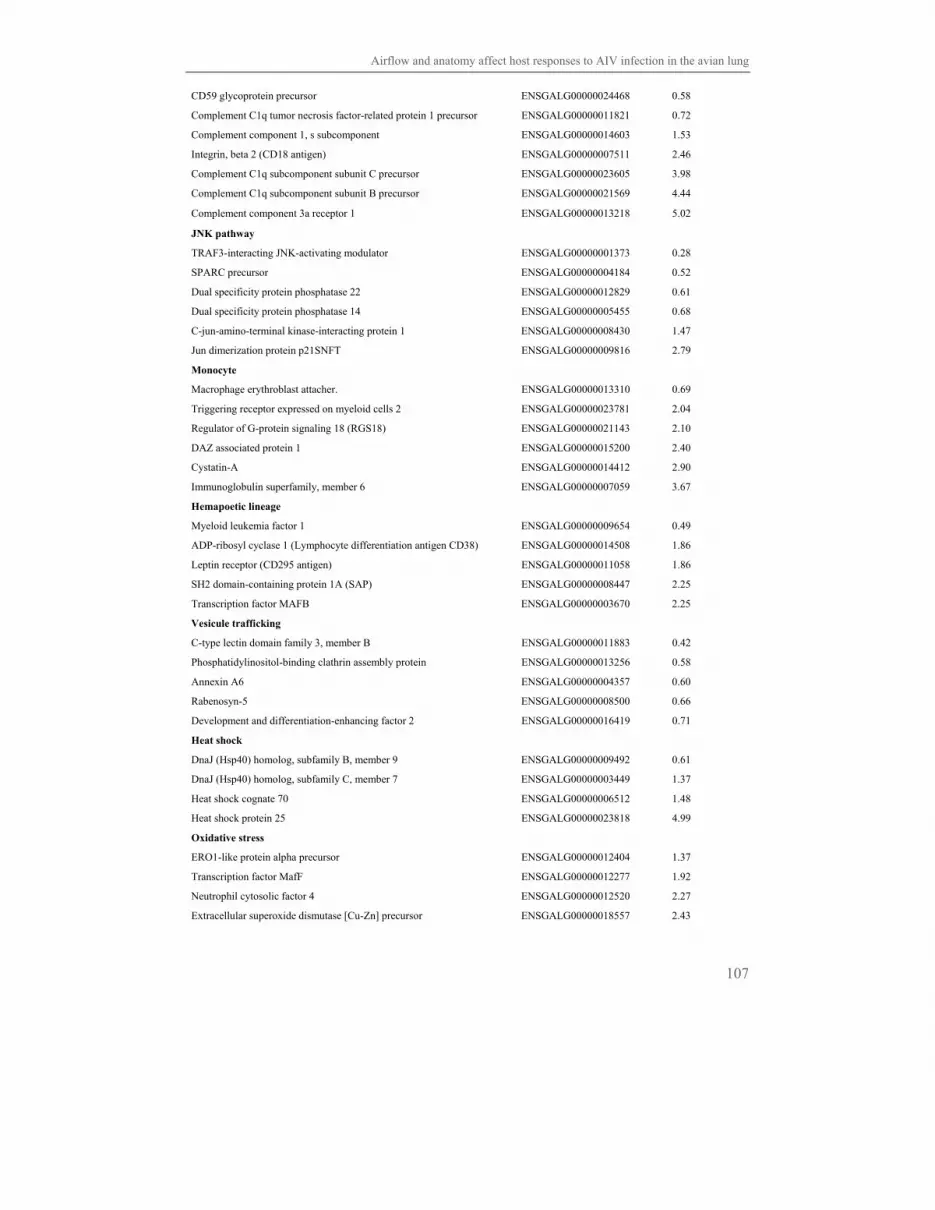
Airflow and anatomy affect host responses to AIV infection in the avian lung
107
CD59 glycoprotein precursor ENSGALG00000024468 0.58
Complement C1q tumor necrosis factor-related protein 1 precursor ENSGALG00000011821 0.72
Complement component 1, s subcomponent ENSGALG00000014603 1.53
Integrin, beta 2 (CD18 antigen) ENSGALG00000007511 2.46
Complement C1q subcomponent subunit C precursor ENSGALG00000023605 3.98
Complement C1q subcomponent subunit B precursor ENSGALG00000021569 4.44
Complement component 3a receptor 1 ENSGALG00000013218 5.02
JNK pathway
TRAF3-interacting JNK-activating modulator ENSGALG00000001373 0.28
SPARC precursor ENSGALG00000004184 0.52
Dual specificity protein phosphatase 22 ENSGALG00000012829 0.61
Dual specificity protein phosphatase 14 ENSGALG00000005455 0.68
C-jun-amino-terminal kinase-interacting protein 1 ENSGALG00000008430 1.47
Jun dimerization protein p21SNFT ENSGALG00000009816 2.79
Monocyte
Macrophage erythroblast attacher. ENSGALG00000013310 0.69
Triggering receptor expressed on myeloid cells 2 ENSGALG00000023781 2.04
Regulator of G-protein signaling 18 (RGS18) ENSGALG00000021143 2.10
DAZ associated protein 1 ENSGALG00000015200 2.40
Cystatin-A ENSGALG00000014412 2.90
Immunoglobulin superfamily, member 6 ENSGALG00000007059 3.67
Hemapoetic lineage
Myeloid leukemia factor 1 ENSGALG00000009654 0.49
ADP-ribosyl cyclase 1 (Lymphocyte differentiation antigen CD38) ENSGALG00000014508 1.86
Leptin receptor (CD295 antigen) ENSGALG00000011058 1.86
SH2 domain-containing protein 1A (SAP) ENSGALG00000008447 2.25
Transcription factor MAFB ENSGALG00000003670 2.25
Vesicule trafficking
C-type lectin domain family 3, member B ENSGALG00000011883 0.42
Phosphatidylinositol-binding clathrin assembly protein ENSGALG00000013256 0.58
Annexin A6 ENSGALG00000004357 0.60
Rabenosyn-5 ENSGALG00000008500 0.66
Development and differentiation-enhancing factor 2 ENSGALG00000016419 0.71
Heat shock
DnaJ (Hsp40) homolog, subfamily B, member 9 ENSGALG00000009492 0.61
DnaJ (Hsp40) homolog, subfamily C, member 7 ENSGALG00000003449 1.37
Heat shock cognate 70 ENSGALG00000006512 1.48
Heat shock protein 25 ENSGALG00000023818 4.99
Oxidative stress
ERO1-like protein alpha precursor ENSGALG00000012404 1.37
Transcription factor MafF ENSGALG00000012277 1.92
Neutrophil cytosolic factor 4 ENSGALG00000012520 2.27
Extracellular superoxide dismutase [Cu-Zn] precursor ENSGALG00000018557 2.43
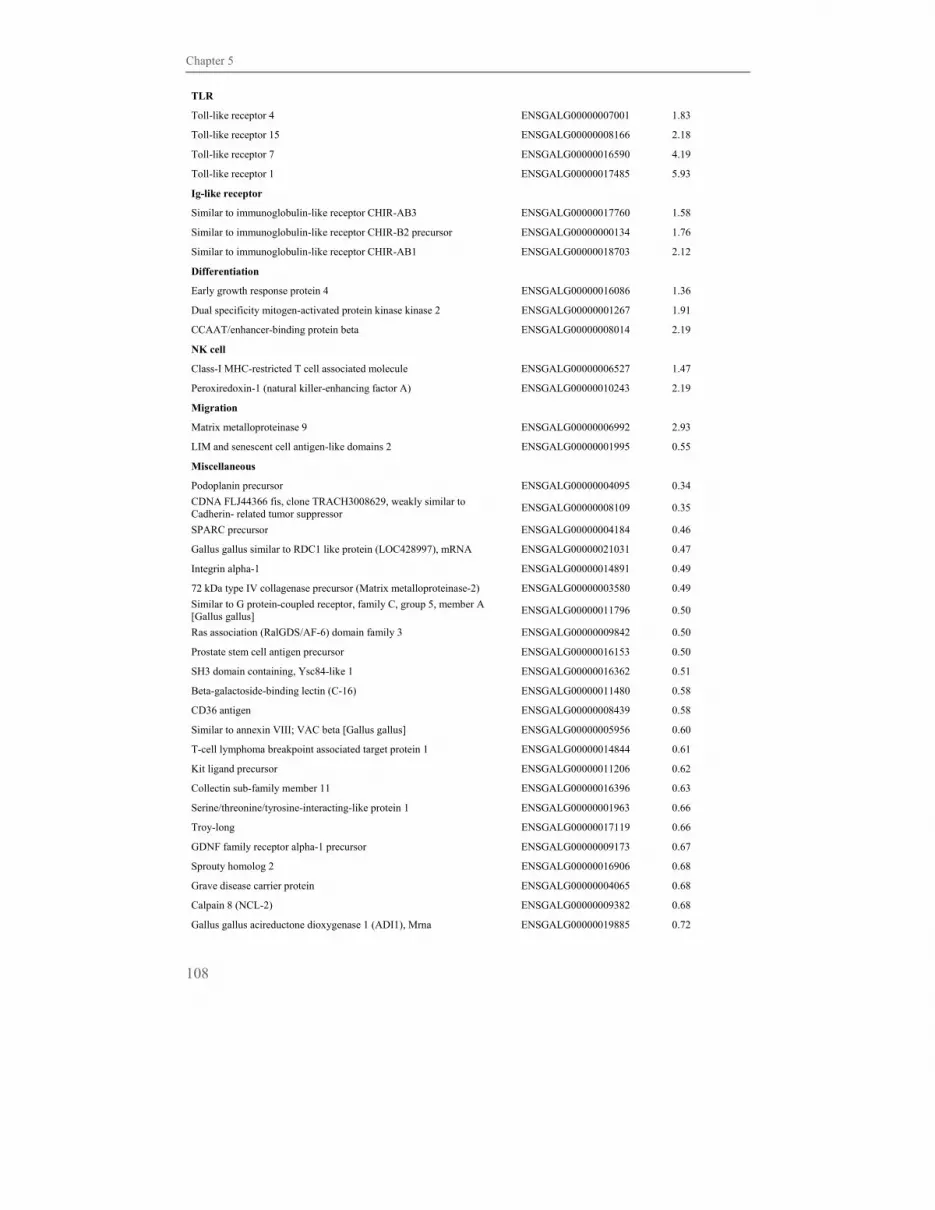
Chapter 5
108
TLR
Toll-like receptor 4 ENSGALG00000007001 1.83
Toll-like receptor 15 ENSGALG00000008166 2.18
Toll-like receptor 7 ENSGALG00000016590 4.19
Toll-like receptor 1 ENSGALG00000017485 5.93
Ig-like receptor
Similar to immunoglobulin-like receptor CHIR-AB3 ENSGALG00000017760 1.58
Similar to immunoglobulin-like receptor CHIR-B2 precursor ENSGALG00000000134 1.76
Similar to immunoglobulin-like receptor CHIR-AB1 ENSGALG00000018703 2.12
Differentiation
Early growth response protein 4 ENSGALG00000016086 1.36
Dual specificity mitogen-activated protein kinase kinase 2 ENSGALG00000001267 1.91
CCAAT/enhancer-binding protein beta ENSGALG00000008014 2.19
NK cell
Class-I MHC-restricted T cell associated molecule ENSGALG00000006527 1.47
Peroxiredoxin-1 (natural killer-enhancing factor A) ENSGALG00000010243 2.19
Migration
Matrix metalloproteinase 9 ENSGALG00000006992 2.93
LIM and senescent cell antigen-like domains 2 ENSGALG00000001995 0.55
Miscellaneous
Podoplanin precursor ENSGALG00000004095 0.34
CDNA FLJ44366 fis, clone TRACH3008629, weakly similar to Cadherin- related tumor suppressor
ENSGALG00000008109 0.35
SPARC precursor ENSGALG00000004184 0.46
Gallus gallus similar to RDC1 like protein (LOC428997), mRNA ENSGALG00000021031 0.47
Integrin alpha-1 ENSGALG00000014891 0.49
72 kDa type IV collagenase precursor (Matrix metalloproteinase-2) ENSGALG00000003580 0.49
Similar to G protein-coupled receptor, family C, group 5, member A [Gallus gallus]
ENSGALG00000011796 0.50
Ras association (RalGDS/AF-6) domain family 3 ENSGALG00000009842 0.50
Prostate stem cell antigen precursor ENSGALG00000016153 0.50
SH3 domain containing, Ysc84-like 1 ENSGALG00000016362 0.51
Beta-galactoside-binding lectin (C-16) ENSGALG00000011480 0.58
CD36 antigen ENSGALG00000008439 0.58
Similar to annexin VIII; VAC beta [Gallus gallus] ENSGALG00000005956 0.60
T-cell lymphoma breakpoint associated target protein 1 ENSGALG00000014844 0.61
Kit ligand precursor ENSGALG00000011206 0.62
Collectin sub-family member 11 ENSGALG00000016396 0.63
Serine/threonine/tyrosine-interacting-like protein 1 ENSGALG00000001963 0.66
Troy-long ENSGALG00000017119 0.66
GDNF family receptor alpha-1 precursor ENSGALG00000009173 0.67
Sprouty homolog 2 ENSGALG00000016906 0.68
Grave disease carrier protein ENSGALG00000004065 0.68
Calpain 8 (NCL-2) ENSGALG00000009382 0.68
Gallus gallus acireductone dioxygenase 1 (ADI1), Mrna ENSGALG00000019885 0.72

Airflow and anatomy affect host responses to AIV infection in the avian lung
109
ATP-binding cassette sub-family G member 2 ENSGALG00000005792 0.73
SH3 domain-binding protein 1 3BP-1 ENSGALG00000012422 1.40
Platelet receptor Gi24 precursor ENSGALG00000004673 1.41
hypothetical protein LOC422107 ENSGALG00000007713 1.41
Putative RNA methyltransferase NOL1 ENSGALG00000014445 1.46
Ribosomal protein S6 kinase 2 alpha ENSGALG00000000366 1.51
B-cell CLL/lymphoma 11A ENSGALG00000007866 1.90
PHD finger protein 11 ENSGALG00000019094 2.26
Transmembrane 7 superfamily member 4 ENSGALG00000016075 2.32
Programmed cell death 1 ligand 1 precursor (CD274) ENSGALG00000015031 2.54
Undecribed
ENSGALG00000006699 ENSGALG00000006699 0.26
genomic:1+100209867-100209940 genomic:1+100209867-100209940
0.32
ENSGALG00000007735 ENSGALG00000007735 0.42
ENSGALG00000002431 ENSGALG00000002431 0.53
ENSGALG00000024386 ENSGALG00000024386 0.54
ENSGALG00000011796 ENSGALG00000011796 0.59
ENSGALG00000008759 ENSGALG00000008759 0.61
ENSGALG00000014349 ENSGALG00000014349 0.62
ENSGALG00000006229 ENSGALG00000006229 1.38
ENSGALG00000003338 ENSGALG00000003338 1.48
ENSGALG00000023017 ENSGALG00000023017 1.52
ENSGALG00000013546 ENSGALG00000013546 1.70
ENSGALG00000014659 ENSGALG00000014659 1.85
ENSGALESTG00000003599 ENSGALESTG00000003599 1.87
ENSGALESTG00000030371 ENSGALESTG00000030371 1.89
genomic:2+863896-863967 genomic:2+863896-863967 2.31
ENSGALG00000023540 ENSGALG00000023540 2.49
ENSGALESTG00000009220 ENSGALESTG00000009220 2.54
ENSGALESTG00000000209 ENSGALESTG00000000209 2.64
ENSGALG00000001478 ENSGALG00000001478 2.81
ENSGALG00000000974 ENSGALG00000000974 3.01
genomic:2+61818365-61818434 genomic:2+61818365-61818434
3.15
ENSGALG00000010338 ENSGALG00000010338 5.25
ENSGALG00000009103 ENSGALG00000009103 5.76
ENSGALG00000006384 ENSGALG00000006384 12.82
† Expression ratio in lung L1 of infected birds compared to expression ratio in lung L1 of naïve birds
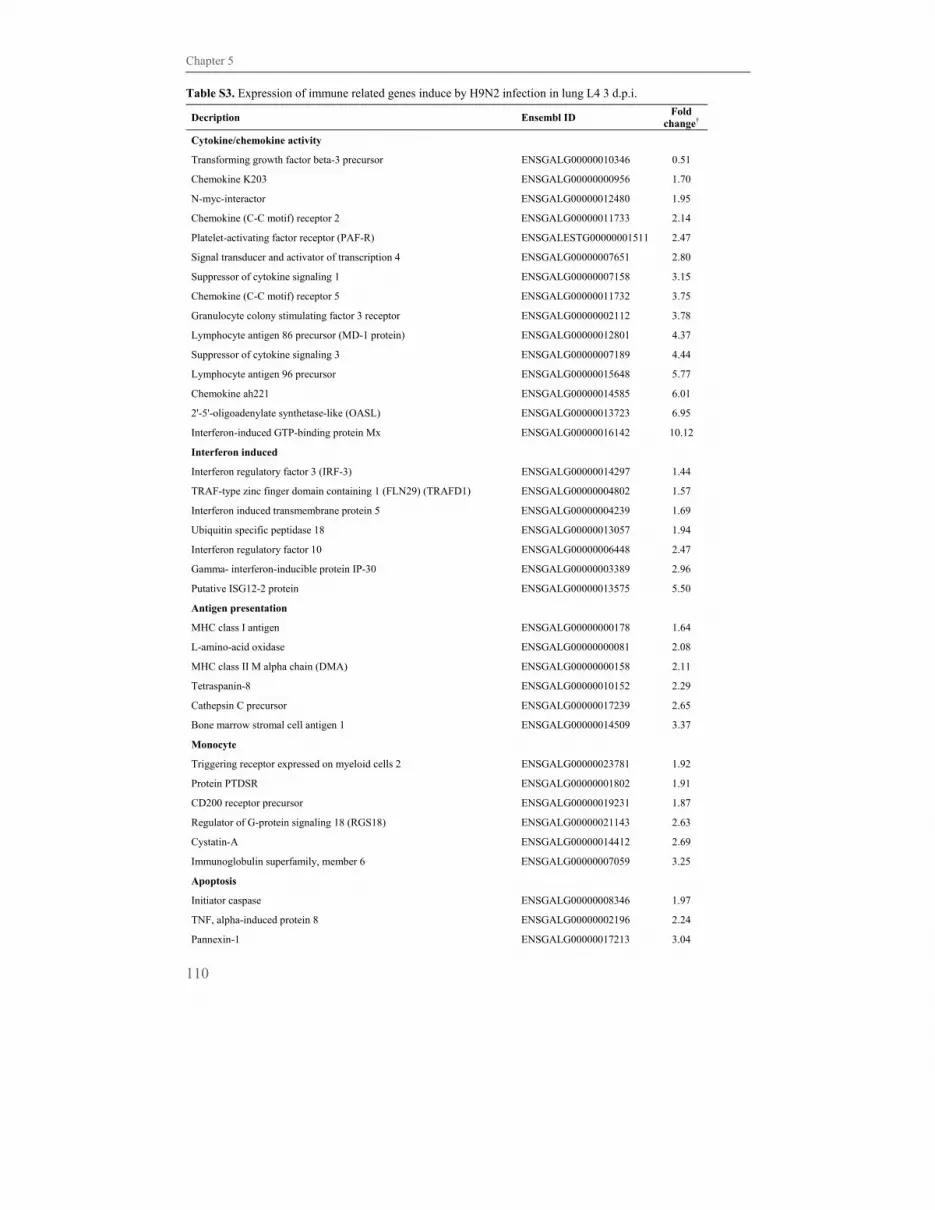
Chapter 5
110
Table S3. Expression of immune related genes induce by H9N2 infection in lung L4 3 d.p.i.
Decription Ensembl ID Fold
change†
Cytokine/chemokine activity
Transforming growth factor beta-3 precursor ENSGALG00000010346 0.51
Chemokine K203 ENSGALG00000000956 1.70
N-myc-interactor ENSGALG00000012480 1.95
Chemokine (C-C motif) receptor 2 ENSGALG00000011733 2.14
Platelet-activating factor receptor (PAF-R) ENSGALESTG00000001511 2.47
Signal transducer and activator of transcription 4 ENSGALG00000007651 2.80
Suppressor of cytokine signaling 1 ENSGALG00000007158 3.15
Chemokine (C-C motif) receptor 5 ENSGALG00000011732 3.75
Granulocyte colony stimulating factor 3 receptor ENSGALG00000002112 3.78
Lymphocyte antigen 86 precursor (MD-1 protein) ENSGALG00000012801 4.37
Suppressor of cytokine signaling 3 ENSGALG00000007189 4.44
Lymphocyte antigen 96 precursor ENSGALG00000015648 5.77
Chemokine ah221 ENSGALG00000014585 6.01
2'-5'-oligoadenylate synthetase-like (OASL) ENSGALG00000013723 6.95
Interferon-induced GTP-binding protein Mx ENSGALG00000016142 10.12
Interferon induced
Interferon regulatory factor 3 (IRF-3) ENSGALG00000014297 1.44
TRAF-type zinc finger domain containing 1 (FLN29) (TRAFD1) ENSGALG00000004802 1.57
Interferon induced transmembrane protein 5 ENSGALG00000004239 1.69
Ubiquitin specific peptidase 18 ENSGALG00000013057 1.94
Interferon regulatory factor 10 ENSGALG00000006448 2.47
Gamma- interferon-inducible protein IP-30 ENSGALG00000003389 2.96
Putative ISG12-2 protein ENSGALG00000013575 5.50
Antigen presentation
MHC class I antigen ENSGALG00000000178 1.64
L-amino-acid oxidase ENSGALG00000000081 2.08
MHC class II M alpha chain (DMA) ENSGALG00000000158 2.11
Tetraspanin-8 ENSGALG00000010152 2.29
Cathepsin C precursor ENSGALG00000017239 2.65
Bone marrow stromal cell antigen 1 ENSGALG00000014509 3.37
Monocyte
Triggering receptor expressed on myeloid cells 2 ENSGALG00000023781 1.92
Protein PTDSR ENSGALG00000001802 1.91
CD200 receptor precursor ENSGALG00000019231 1.87
Regulator of G-protein signaling 18 (RGS18) ENSGALG00000021143 2.63
Cystatin-A ENSGALG00000014412 2.69
Immunoglobulin superfamily, member 6 ENSGALG00000007059 3.25
Apoptosis
Initiator caspase ENSGALG00000008346 1.97
TNF, alpha-induced protein 8 ENSGALG00000002196 2.24
Pannexin-1 ENSGALG00000017213 3.04
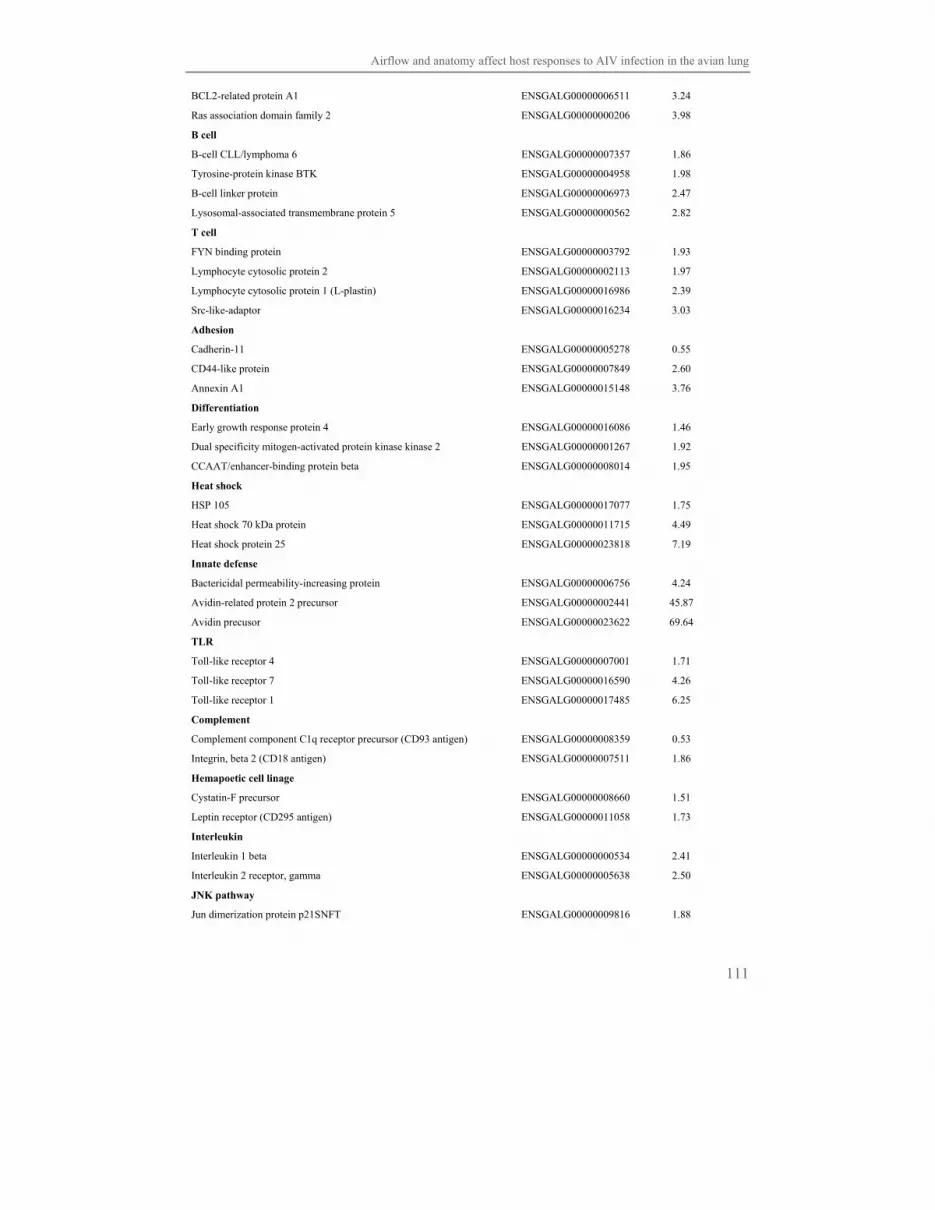
Airflow and anatomy affect host responses to AIV infection in the avian lung
111
BCL2-related protein A1 ENSGALG00000006511 3.24
Ras association domain family 2 ENSGALG00000000206 3.98
B cell
B-cell CLL/lymphoma 6 ENSGALG00000007357 1.86
Tyrosine-protein kinase BTK ENSGALG00000004958 1.98
B-cell linker protein ENSGALG00000006973 2.47
Lysosomal-associated transmembrane protein 5 ENSGALG00000000562 2.82
T cell
FYN binding protein ENSGALG00000003792 1.93
Lymphocyte cytosolic protein 2 ENSGALG00000002113 1.97
Lymphocyte cytosolic protein 1 (L-plastin) ENSGALG00000016986 2.39
Src-like-adaptor ENSGALG00000016234 3.03
Adhesion
Cadherin-11 ENSGALG00000005278 0.55
CD44-like protein ENSGALG00000007849 2.60
Annexin A1 ENSGALG00000015148 3.76
Differentiation
Early growth response protein 4 ENSGALG00000016086 1.46
Dual specificity mitogen-activated protein kinase kinase 2 ENSGALG00000001267 1.92
CCAAT/enhancer-binding protein beta ENSGALG00000008014 1.95
Heat shock
HSP 105 ENSGALG00000017077 1.75
Heat shock 70 kDa protein ENSGALG00000011715 4.49
Heat shock protein 25 ENSGALG00000023818 7.19
Innate defense
Bactericidal permeability-increasing protein ENSGALG00000006756 4.24
Avidin-related protein 2 precursor ENSGALG00000002441 45.87
Avidin precusor ENSGALG00000023622 69.64
TLR
Toll-like receptor 4 ENSGALG00000007001 1.71
Toll-like receptor 7 ENSGALG00000016590 4.26
Toll-like receptor 1 ENSGALG00000017485 6.25
Complement
Complement component C1q receptor precursor (CD93 antigen) ENSGALG00000008359 0.53
Integrin, beta 2 (CD18 antigen) ENSGALG00000007511 1.86
Hemapoetic cell linage
Cystatin-F precursor ENSGALG00000008660 1.51
Leptin receptor (CD295 antigen) ENSGALG00000011058 1.73
Interleukin
Interleukin 1 beta ENSGALG00000000534 2.41
Interleukin 2 receptor, gamma ENSGALG00000005638 2.50
JNK pathway
Jun dimerization protein p21SNFT ENSGALG00000009816 1.88

Chapter 5
112
Migration
Matrix metalloproteinase 9 ENSGALG00000006992 2.91
Oxidative burst
Neutrophil cytosolic factor 4 ENSGALG00000012520 2.08
Miscellaneous
Podoplanin precursor ENSGALG00000004095 0.36
GDNF family receptor alpha-1 precursor ENSGALG00000009173 0.55
T-cell lymphoma breakpoint associated target protein 1 ENSGALG00000014844 0.59
Targeting protein for Xklp2 ENSGALG00000006267 0.61
Fanconi anemia, complementation group L ENSGALG00000007879 0.63
ENSGALG00000006152 ENSGALG00000006152 1.67
PHD finger protein 11 ENSGALG00000019094 1.74
Glioma pathogenesis-related protein ENSGALG00000010224 1.94
Transmembrane 7 superfamily member 4 ENSGALG00000016075 2.94
Undescribed
ENSGALG00000023540 ENSGALG00000023540 1.90
ENSGALG00000000974 ENSGALG00000000974 2.30
ENSGALG00000001478 ENSGALG00000001478 2.33
ENSGALESTG00000009220 ENSGALESTG00000009220 2.50
ENSGALG00000009103 ENSGALG00000009103 6.51
ENSGALG00000006384 ENSGALG00000006384 8.73
† Expression ratio in lung L4 of infected birds compared to expression ratio in lung L4 of naïve birds
Lack of immune activation as a correlate of protection
after challenge with avian influenza virus: a
transcriptomics analysis of adjuvanted vaccines
Sylvia S. Reemers1, Christine Jansen1, Marian J. Groot Koerkamp2, Daphne van Haarlem1,
Peter van de Haar1, Winfried Degen3, Willem van Eden1, Lonneke Vervelde1
1 Department of Infectious Diseases and Immunology, Faculty Veterinary Medicine, Utrecht University, Yalelaan
1, 3584 CL Utrecht, The Netherlands 2 Genomics Laboratory, Department of Physiological Chemistry, Utrecht Medical Centre, Universiteitsweg 100,
3584 CG Utrecht, The Netherlands 3 Intervet Schering-Plough Animal Health, Wim de Körverstraat 35, 5831 AN Boxmeer, The Netherlands
Submitted for publication
Chapter 6

Lack of immune activation relates to protection after AIV challenge
115
Abstract
To gain more insight in underlying mechanisms correlating to protection against avian
influenza virus (AIV) infection, we investigated correlates of protection after AIV H9N2
infection and studied the contribution of different adjuvants to a protective response at host
transcriptional level. One-day-old chickens were immunised with inactivated H9N2
supplemented with w/o, Al(OH)3, CpG or without adjuvant. Two weeks later, birds were
homologously challenged and at 1 to 4 days post challenge (d.p.c.) trachea and lung were
collected. Birds immunised with H9N2+w/o or H9N2+Al(OH)3 were protected against
challenge infection based on low viral RNA expression. Microarray analysis showed that in
protected birds the number of immune related genes induced after challenge and the
amplitude of change of gene expression were lower compared to unprotected birds. The
gene expression profile of protected birds showed that expression was especially up
regulated at 1 d.p.c., while in unprotected birds higher and prolonged gene expression was
found. This suggests that lack of immune activation correlates to protection.
Immunocytochemical examination of the lung confirmed the microarray data; smaller
cellular influxes were found in protected birds which correlated to the number and location
of virus infected cells. In conclusion, we show that in addition to a limited number of
differentially expressed genes correlating with protection, such as CCL20, IAP and CD59,
lack of immune activation is the most important correlate of protection after challenge with
AIV.
Introduction
Avian influenza virus (AIV) infection causes problems world wide and affects both humans
and animals. Therefore, much effort is invested in development of new vaccines and
improvement of vaccine efficacy of which vaccine adjuvants are one aspect. Vaccine
adjuvants are molecules with immune stimulating properties and enhance the
immunogenicity of a co-administered antigen. There is a large variety of adjuvants such as
inorganic salts like aluminium hydroxide (Al(OH)3), emulsions like water-in-oil (w/o) and
synthetic products like non-methylated CpG oligonucleotides (CpG), which enhance
immunogenicity via diverse and often not fully understood mechanisms. Recent findings
show that adjuvants act either Toll-like receptor (TLR) independent like Al(OH)3 and w/o
or TLR dependent like CpG. This difference in mode of action consequently results in a
difference in immune activation and induction of a protective host response (Ishii et al.,
2007).
The use of aluminium salts and oil emulsions as adjuvants in human and veterinary
vaccines is generally associated with induction of Th2 responses (Cox et al., 1997, Hilgers
et al., 1998, Hogenesch, 2002, Marrack et al., 2009). Some studies have suggested that
Chapter 6
116
aluminium salts and oil emulsions act as a depot slowly releasing the antigen at the site of
injection (Aucouturier et al., 2001, Tritto et al., 2009). Both types of adjuvants have the
ability to enhance antigen uptake and activation of mammalian APC, and induce
inflammation which stimulates recruitment of eosinophils, neutrophils, APC and
lymphocytes (Aucouturier et al., 2001, Marrack et al., 2009). Although aluminium salts and
oil emulsions do not act directly on dendritic cells (DC), they promote a pro-inflammatory
environment which may indirectly activate DC in a TLR independent manner (Tritto et al.,
2009). In birds vaccinated against O. rhinotracheale, addition of w/o or aluminium salts
inhibits pathology of the airways and results in an increased haemagglutination inhibition
(HI) titre especially in w/o adjuvanted birds (Murthy et al., 2007). Vaccination with a w/o
adjuvanted inactivated H5N1 vaccine results in an increased HI titer, a strong secondary
antibody response indicated by a high HI titer after challenge and protection from clinical
signs and mortality (Sasaki et al., 2009).
CpG has been known to induce Th1 responses leading to a protective cytotoxic response in
a TLR dependent manner in mammals acting directly on DC (Ishii et al., 2007). CpG
induces the enhancement of virus-specific antibodies, APC function and the production of
cytokines and chemokines supportive for cellular antigen specific immunity in mice
(Dalpke et al., 2001, Klinman et al., 2004). In chicken addition of CpG to recombinant
plasmids DNA vaccine encoding the VP2 gene of infectious bursal disease virus (IBDV)
induces an increased antigen specific serum antibody titer, increased lymphoproliferation
and provides protection against gross lesions, clinical signs and mortality (Mahmood et al.,
2006). Addition of CpG to E. coli bacterin also induces an increased antigen specific serum
antibody titer, reduces the number of bacteria from the airsacs, pericardium and cellulites
and provides protection against mortality (Gomis et al., 2007).
In this study we set out to investigate correlates of protection after challenge with the AIV
H9N2 and study the contribution of different adjuvants to this protective immune response.
Therefore, chickens were immunised with H9N2 vaccine in presence of w/o, Al(OH)3, CpG
or without adjuvant, and these birds together with non-immunised birds were challenged
with live H9N2 14 days post immunisation. At 1 to 4 days post challenge (d.p.c.) viral
RNA expression, gene expression profiles and cellular influxes were determined in trachea
and lung. Together with HI and AIV nucleoprotein (NP)-specific antibody titers in serum
we defined characteristics of protective responses and differences in the mode of action
between the different adjuvants. Birds immunised in presence of w/o and Al(OH)3 were
protected and had similar correlates of protection that related to a limited number of
differentially expressed genes and to lack of immune activation and high HI and AIV NP-
specific antibody titers
Lack of immune activation relates to protection after AIV challenge
117
Materials and methods
Infection model
Avian influenza A virus, subtype H9N2, isolate A/Chicken/United Arab Emirates/99 was
kindly provided by Intervet/Schering-Plough Animal Health.
One-day-old White Leghorn chickens were housed under SPF conditions and all
experiments were carried out according to protocols approved by the Animal Welfare
Committee.
Chickens were divided into 6 groups over 6 isolators, containing 20 animals per group.
One-day-old chickens were immunised s.c. with 0.25 ml inactivated AIV H9N2
(Intervet/Schering-Plough Animal Health) supplemented with w/o, Al(OH)3, CpG or
without adjuvant. The non-immunised-non-challenged (NINC) and non-immunised-
challenged (NIC) groups were immunised s.c. with saline. The w/o adjuvant was kindly
provided by Intervet/Schering-Plough Animal Health. Al(OH)3 consisted of an Al(OH)3-gel
(Brenntag) with a final concentration in the vaccine of 0.5%. CpG was custom made and
consisted of the whole phosphorothioate backbone purified via ethanol precipitation
(TibMolbiol). Two weeks after the immunization blood samples were taken from each bird
for measuring HI titers and AIV NP-specific antibody titers after which they were
inoculated via aerosol spray with 20 ml 107.7 EID50 H9N2 AIV per isolator. The NINC
group was inoculated via aerosol spray with 20 ml saline. Chickens remained in the aerosol
spray in a closed isolator for 10 min, after which the isolator was ventilated as before. This
led to the following 6 experimental groups: non-immunised-non-challenged (NINC), non-
immunised and H9N2 challenged (NIC), H9N2 immunized and challenged (IC), H9N2 +
adjuvant w/o immunized and challenged (IC+w/o), H9N2 + adjuvant Al(OH)3 immunized
and challenged (IC+Al(OH) 3), H9N2 + adjuvant CpG immunized and challenged
(IC+CpG).
At 1 to 4 days post challenge (d.p.c.) chickens were killed (n = 4 per time point per group;
n=2 for NIC at 4 d.p.c. due to death caused by infection of 2 birds) and trachea and left lung
were isolated and stored in RNAlater (Ambion) at -80°C for RNA isolation or fixed in
liquid nitrogen for immunocytochemistry. The trachea was divided into upper and lower
trachea of which upper trachea was used for analysis. The lung was divided into 4 parts L1
to L4 according to anatomy and airflow (Fig. 1). Segment L1, containing the primary
bronchus and secondary bronchi, and L4, containing the paleopulmonic parabronchi, were
used for analysis. Selection of organ parts used for analysis was based on viral load and
virus induced gene expression as previously described (Reemers et al., 2009a).

Chapter 6
118
A. B. C.
Figure 1. A) “Right chicken lung with a blunt probe indicating the localization of the primary bronchus.” The lung
was divided in 4 parts, L1 to L4 according to airflow and lung anatomy (27), with the primary bronchus entering
the lung in L1 shown on the left side. Segment L1, containing the primary bronchus and secondary bronchi, and
L4, containing the paleopulmonic parabronchi, were used for analysis. The white blocks indicate the part of the
lung segments used for RNA isolation, while the adjacent part within the segment was used for
immunocytochemistry. “Illustration of the unidirectional air flow pattern, which flows from caudal to cranial
during B) inspiration and C) expiration in the avian lung. 1. Primary bronchus, 2. lung, 3. clavicular air sac, 4.
cranial thoracic air sac, 5. caudal thoracic air sac, 6. abdominal air sac.” Adapted and reprinted with permission
(Kothlow et al., 2008), Copyright 2008.
H9-specific HI and AIV NP-specific antibody titers
H9-specific haemagglutination inhibition (HI) titers in serum were determined by a HI
assay as previously described (Degen et al., 2006).
AIV NP-specific antibody titers in serum were determined by enzyme-linked
immunosorbent assay (ELISA). Briefly, Nunc Maxisorp flatbottom plates were coated with
mouse monoclonal antibody (mAb) to nucleoprotein (NP) of H9N2 at 37ºC overnight.
Antibody coated plates were washed three times with PBS/Tween and blocked with 10 mM
PBS + 1% BSA for 1h at room temperature. Formalin inactivated AIV H9N2 antigen was
added and incubated for 1h at 37ºC after which plates were washed three times with
PBS/Tween. Chicken sera were 2-fold serially diluted in PBS/Tween and incubated for 1h
at 37ºC. Plates were washed with PBS/Tween and incubated for 30 minutes at 37ºC with
HRP-conjugated rabbit anti-chicken IgG (Nordic Immunological Laboratories). After
washing with PBS/Tween plates were developed with TMB substrate for 10 minutes at
room temperature in the dark. The reaction was stopped by adding 4N H2SO4 and the
absorbance was measured at 450 nm.
Immunocytochemistry
Virus and cellular influxes were detected in lung by immunocytochemistry as previously
described (Vervelde et al., 1996). Viral NP was detected with mAb to NP of H9N2
(provided by Intervet/Schering-Plough Animal Health). Macrophages and CD4+ cells were
detected with mAb KUL-01 (Mast et al., 1998) and CT-4 (Southern Biotech). For detection
of CD8α+ cells a mix of mAb EP72 (Southern Biotech) and AV14 (kind gift of Dr T.F.
Davison, Institute for Animal Health, Compton UK (Withers et al., 2005)) was used to
L2
L1 L3
L4
Primary bronchus
6
1 2
3
5
Inspiration
1
2
3
5
6
Expiration
4 4

Lack of immune activation relates to protection after AIV challenge
119
avoid differences in staining due to polymorphism in the chicken CD8α molecule (Breed et
al., 1996, Luhtala et al., 1997).
RNA isolation
Total RNA was isolated from trachea (5 mm part) and lung L1 and L4 (1x5 mm part) using
the RNeasy Mini Kit (Qiagen) as previously described (Reemers et al., 2009b). All RNA
samples were checked for quantity using a spectrophotometer (Shimadzu) and quality using
a 2100 Bioanalyzer (Agilent Technologies).
Real-time quantitative reverse transcription-PCR (qRT-PCR)
cDNA was generated from 500 ng RNA with reverse transcription using iScript cDNA
Synthesis Kit (Biorad Laboratories B.V).
Real-time qRT-PCR was used for detection of GAPDH and H9 haemagglutinin (HA)
products as previously described (Reemers et al., 2009b). Expression of GAPDH mRNA,
which was used as a reference gene for correction of viral RNA expression, was not
affected by H9N2 AIV (data not shown). Corrections for variation in RNA preparation and
sampling were performed as previously described (Eldaghayes et al., 2006). Results are
expressed in terms of the threshold cycle value (Ct) and given as corrected 40-Ct values.
To determine the statistical significance between groups and time points of trachea and lung
an ANOVA with a Tukey post-hoc test was used. A p-value < 0.05 was considered
significant.
Oligonucleotide microarray analysis
Microarray analysis was performed as previously described (Reemers et al., 2009a) using
the Gallus gallus Roslin/ARK CoRe Array Ready Oligo Set V1.0 (Operon
Biotechnologies). All trachea and lung samples were co-hybridised with respectively a
trachea or lung reference sample. These reference samples consisted of pooled RNA
extracted from tracheas or lungs of 4 chickens that were not included in the inoculation
experiment.
Microarray arrays were analysed as previously described (Reemers et al., 2009a). Ensembl
Gallus gallus, (assembly: WASHUC2, May 2006, genebuild: Ensembl, Aug 2006, database
version: 47.2e) was used for gene names, description and Gene Ontology (GO) annotations.
For pathway analysis Database for Annotation, Visualization and Integrated Discovery
(DAVID) 2008 was used.
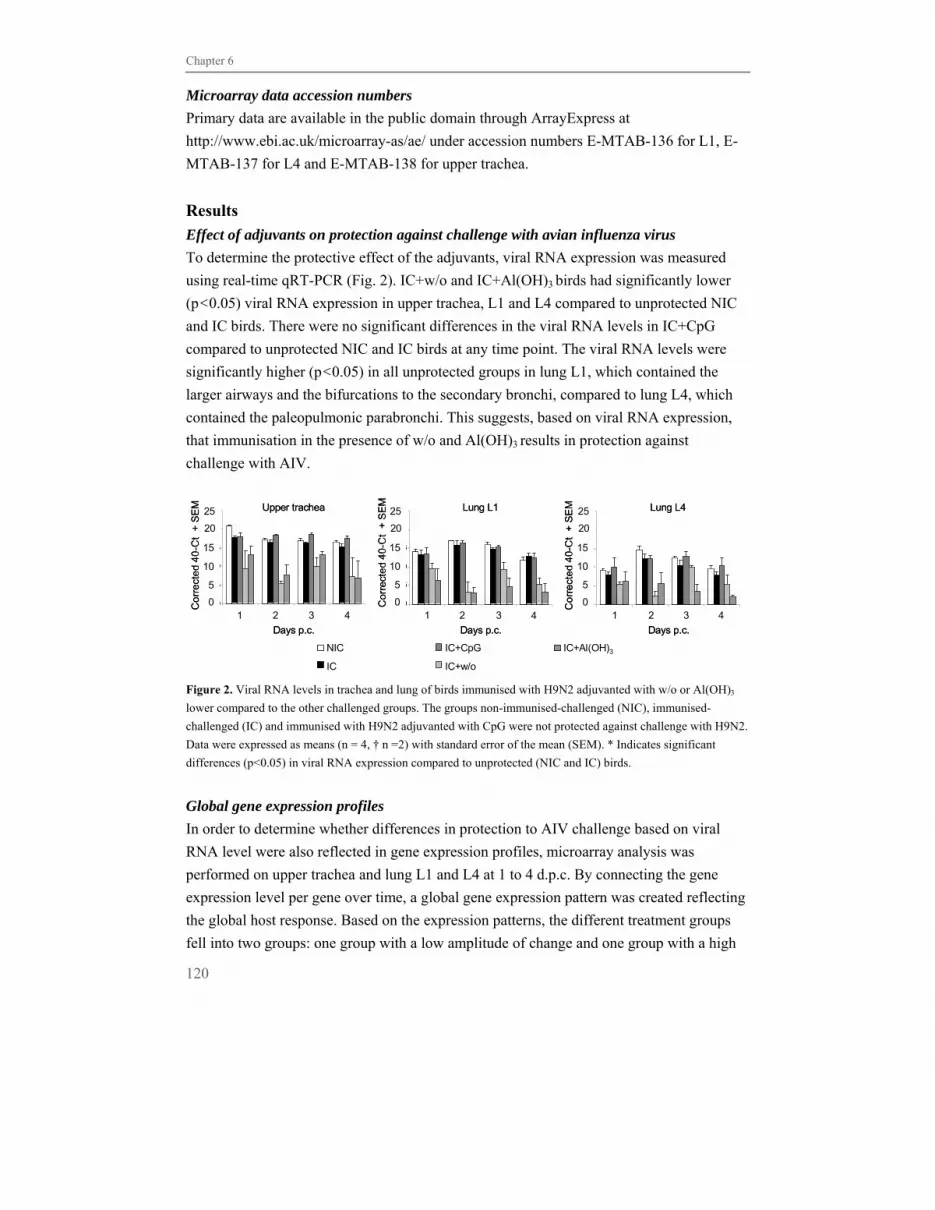
Chapter 6
120
Microarray data accession numbers
Primary data are available in the public domain through ArrayExpress at
http://www.ebi.ac.uk/microarray-as/ae/ under accession numbers E-MTAB-136 for L1, E-
MTAB-137 for L4 and E-MTAB-138 for upper trachea.
Results
Effect of adjuvants on protection against challenge with avian influenza virus
To determine the protective effect of the adjuvants, viral RNA expression was measured
using real-time qRT-PCR (Fig. 2). IC+w/o and IC+Al(OH)3 birds had significantly lower
(p<0.05) viral RNA expression in upper trachea, L1 and L4 compared to unprotected NIC
and IC birds. There were no significant differences in the viral RNA levels in IC+CpG
compared to unprotected NIC and IC birds at any time point. The viral RNA levels were
significantly higher (p<0.05) in all unprotected groups in lung L1, which contained the
larger airways and the bifurcations to the secondary bronchi, compared to lung L4, which
contained the paleopulmonic parabronchi. This suggests, based on viral RNA expression,
that immunisation in the presence of w/o and Al(OH)3 results in protection against
challenge with AIV.
Figure 2. Viral RNA levels in trachea and lung of birds immunised with H9N2 adjuvanted with w/o or Al(OH)3
lower compared to the other challenged groups. The groups non-immunised-challenged (NIC), immunised-
challenged (IC) and immunised with H9N2 adjuvanted with CpG were not protected against challenge with H9N2. Data were expressed as means (n = 4, † n =2) with standard error of the mean (SEM). * Indicates significant
differences (p<0.05) in viral RNA expression compared to unprotected (NIC and IC) birds.
Global gene expression profiles
In order to determine whether differences in protection to AIV challenge based on viral
RNA level were also reflected in gene expression profiles, microarray analysis was
performed on upper trachea and lung L1 and L4 at 1 to 4 d.p.c. By connecting the gene
expression level per gene over time, a global gene expression pattern was created reflecting
the global host response. Based on the expression patterns, the different treatment groups
fell into two groups: one group with a low amplitude of change and one group with a high
NIC IC+CpG IC+Al(OH)3
IC IC+w/o
0
5
10
15
20
25
1 2 3 4
Days p.c.
1 2 3 4
25
20
15
10
5
0Co
rrec
ted
40
-Ct
+ S
EM Upper trachea
0
5
10
15
20
25
1 2 3 4
Lung L1
1 2 3 4
25
20
15
10
5
0Co
rrec
ted
40
-Ct
+ S
EM
Days p.c.
0
5
10
15
20
25
1 2 3 4
Lung L4
1 2 3 4
25
20
15
10
5
0Co
rre
cte
d 4
0-C
t +
SE
M
Days p.c.
NIC IC+CpG IC+Al(OH)3
IC IC+w/o
NIC IC+CpG IC+Al(OH)3
IC IC+w/o
0
5
10
15
20
25
1 2 3 4
Days p.c.
1 2 3 4
25
20
15
10
5
0Co
rrec
ted
40
-Ct
+ S
EM Upper trachea
0
5
10
15
20
25
1 2 3 4
Lung L1
1 2 3 4
25
20
15
10
5
0Co
rrec
ted
40
-Ct
+ S
EM
Days p.c.
0
5
10
15
20
25
1 2 3 4
Lung L4
1 2 3 4
25
20
15
10
5
0Co
rre
cte
d 4
0-C
t +
SE
M
Days p.c.

Lack of immune activation relates to protection after AIV challenge
121
Figure. 3. A) A lower amplitude of change in global gene expression patterns over time was found in upper
trachea, lung L1 and L4 of protected (IC+w/o and IC+Al(OH)3) versus unprotected (NIC, IC and IC+CpG) birds
(n = 4, except for NIC 4 d.p.c. n = 2). Red indicates up regulation and green down regulation. Gene expression
rates of individual birds are compared to expression rates in a reference sample consisting of pooled lungs or
0.01
100
10
1
0.1
NINC IC+ CpG
IC+ w/o
IC+ Al(OH)3
ICNIC0.01
100
10
1
0.1
NINC IC+ CpG
IC+ w/o
IC+ Al(OH)3
ICNIC
100
10
1
0.1
0.01NINC IC+
CpGIC+ w/o
IC+ Al(OH)3
ICNIC
100
10
1
0.1
0.01NINC IC+
CpGIC+ w/o
IC+ Al(OH)3
ICNIC
NINC IC+ CpG
IC+ w/o
IC+ Al(OH)3
IC
100
10
1
0.1
0.01NICNINC IC+
CpGIC+ w/o
IC+ Al(OH)3
IC
100
10
1
0.1
0.01NIC
A. B. Genes significantly differentially expressed between IC and adjuvanted birds
261
150
138
267
5041
143
IC+ w/o
IC+ Al(OH)3
IC+ CpG
261
150
138
267
5041
143
261
150
138
267
5041
143
IC+ w/o
IC+ Al(OH)3
IC+ CpG
1256549 449
176
16547
40
IC+ w/o
IC+ Al(OH)3
IC+ CpG
1256549 449
176
16547
40
1256549 449
176
16547
40
IC+ w/o
IC+ Al(OH)3
IC+ CpG
127
31
728
1358
525
122111
IC+ w/o
IC+ Al(OH)3
IC+ CpG
127
31
728
1358
525
122111
127
31
728
1358
525
122111
IC+ w/o
IC+ Al(OH)3
IC+ CpG
Upper trachea
Lung L1
Lung L4
Upper trachea
Lung L1
Lung L4
A. B.

Chapter 6
122
pooled trachea of uninfected birds. B) Venn diagrams showing genes significantly differentially expressed at any
day post challenge between IC birds and IC+CpG, IC+w/o and IC+Al(OH)3 birds in upper trachea, lung L1 and L4
(n = 4). The numbers within the segments indicate the number of genes that were significantly differentially
expressed between the IC group and an adjuvanted group. Most overlap in gene expression was found between the
protected groups IC+w/o and IC+Al(OH)3.
amplitude of change (Fig. 3A). The gene expression patterns of the unprotected NIC, IC
and IC+CpG group showed that many genes were significantly differentially expressed
with a high amplitude of change. The protected groups, IC+w/o and IC+Al(OH)3, and the
non-challenged NINC group had a gene expression pattern with a low amplitude of change.
In the trachea more genes were expressed at a higher amplitude of change compared to lung
L1 and L4, but the global gene expression patterns of trachea, lung L1 and to a lesser extent
in L4 showed a similar trend. Thus, gene expression patterns can act as correlate of
protection in which a signature with a low amplitude of change was related to the protected
and non-challenged birds and a signature with a high amplitude of change to the
unprotected birds.
We determined which genes were significantly differentially expressed in IC+w/o,
IC+Al(OH)3 and IC+CpG compared to IC birds to determine adjuvant induced genes. Venn
diagrams were made to show number of genes that were overlapping or unique to the
adjuvant (Fig. 3B). Most overlap in genes was seen between the protected IC+w/o and
IC+Al(OH)3 birds. Innate defense and interferon related genes were differentially expressed
in all adjuvanted groups (in white), but are not correlates of protection. The number and the
genes expressed differed between locations within the respiratory tract, with lung L1 and
L4 being most similar.
Immune related gene expression profiles
To determine immune related correlates of protection after challenge, gene expression
profiles of unprotected IC and IC+CpG birds and of protected IC+w/o and IC+Al(OH)3
birds were compared to the non-immunised-non-challenged NINC birds. An immune
related gene category was created based on the GO terms host-pathogen interaction,
external stimulus and immune response. Immune related genes that were significantly
differentially expressed in the protected groups compared to the unprotected IC group were
selected, divided into functional groups according to the GO annotations, and depicted in
heatmaps (Fig. 4). In general these immune related genes expressed in protected birds were
also significantly differentially expressed in unprotected birds, but at a much lower
expression level in protected birds. Of these genes, 44 genes were significantly
differentially expressed throughout the respiratory tract, trachea, lung L1 and L4, in
protected compared to unprotected IC birds (Supplemented data Fig. S1) and related mainly
to defense and inflammatory responses and cell differentiation. Again these genes were
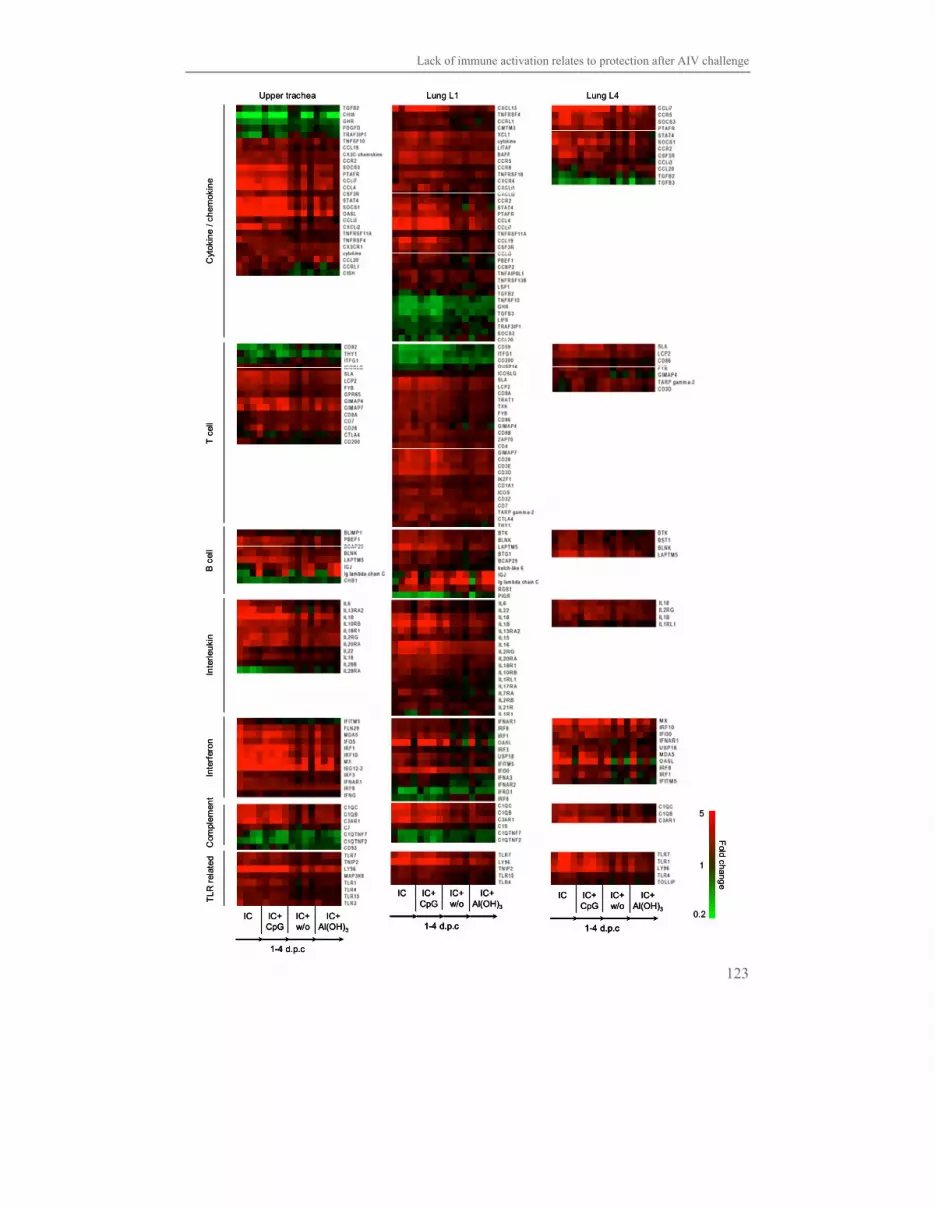
Lack of immune activation relates to protection after AIV challenge
123
Cyt
okin
e / c
hem
okin
eT
cel
lB
cel
lIn
terl
euki
nIn
terf
eron
Com
plem
ent
TLR
rel
ated
Lung L1 Lung L4Upper trachea
IC+ w/o
IC IC+ CpG
IC+ Al(OH)3
1-4 d.p.c
IC+ w/o
IC IC+ CpG
IC+ Al(OH)3
1-4 d.p.cIC+ w/o
IC IC+ CpG
IC+ Al(OH)3
1-4 d.p.c
Cyt
okin
e / c
hem
okin
eT
cel
lB
cel
lIn
terl
euki
nIn
terf
eron
Com
plem
ent
TLR
rel
ated
Lung L1 Lung L4Upper trachea
IC+ w/o
IC IC+ CpG
IC+ Al(OH)3
1-4 d.p.c
IC+ w/o
IC IC+ CpG
IC+ Al(OH)3
1-4 d.p.c1-4 d.p.c
IC+ w/o
IC IC+ CpG
IC+ Al(OH)3
1-4 d.p.c
IC+ w/o
IC IC+ CpG
IC+ Al(OH)3
1-4 d.p.c1-4 d.p.cIC+ w/o
IC IC+ CpG
IC+ Al(OH)3
1-4 d.p.c
IC+ w/o
IC IC+ CpG
IC+ Al(OH)3
1-4 d.p.c1-4 d.p.c
1
5
0.2
Fold ch
ang
e
1
5
0.2
Fold ch
ang
e
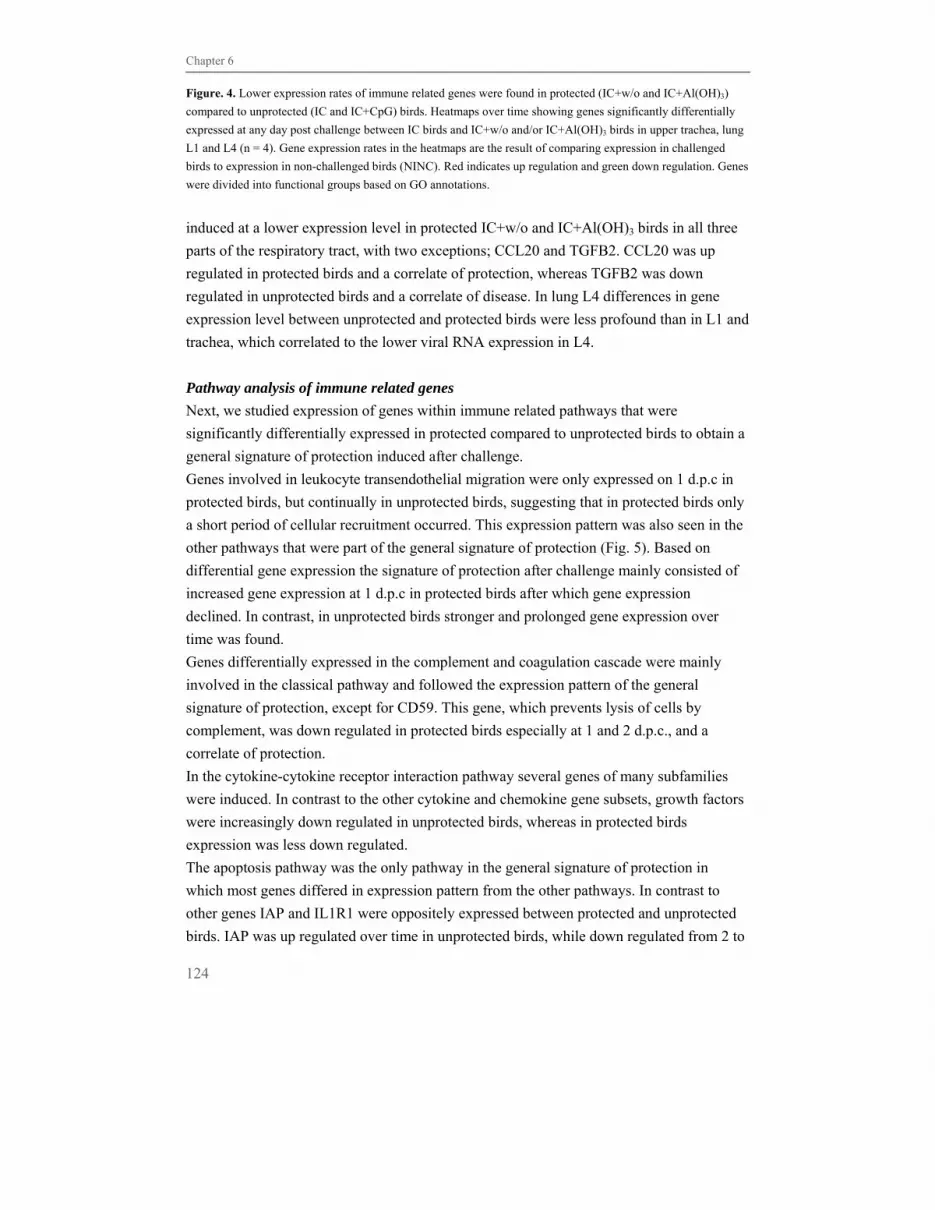
Chapter 6
124
Figure. 4. Lower expression rates of immune related genes were found in protected (IC+w/o and IC+Al(OH)3)
compared to unprotected (IC and IC+CpG) birds. Heatmaps over time showing genes significantly differentially
expressed at any day post challenge between IC birds and IC+w/o and/or IC+Al(OH)3 birds in upper trachea, lung
L1 and L4 (n = 4). Gene expression rates in the heatmaps are the result of comparing expression in challenged
birds to expression in non-challenged birds (NINC). Red indicates up regulation and green down regulation. Genes
were divided into functional groups based on GO annotations.
induced at a lower expression level in protected IC+w/o and IC+Al(OH)3 birds in all three
parts of the respiratory tract, with two exceptions; CCL20 and TGFB2. CCL20 was up
regulated in protected birds and a correlate of protection, whereas TGFB2 was down
regulated in unprotected birds and a correlate of disease. In lung L4 differences in gene
expression level between unprotected and protected birds were less profound than in L1 and
trachea, which correlated to the lower viral RNA expression in L4.
Pathway analysis of immune related genes
Next, we studied expression of genes within immune related pathways that were
significantly differentially expressed in protected compared to unprotected birds to obtain a
general signature of protection induced after challenge.
Genes involved in leukocyte transendothelial migration were only expressed on 1 d.p.c in
protected birds, but continually in unprotected birds, suggesting that in protected birds only
a short period of cellular recruitment occurred. This expression pattern was also seen in the
other pathways that were part of the general signature of protection (Fig. 5). Based on
differential gene expression the signature of protection after challenge mainly consisted of
increased gene expression at 1 d.p.c in protected birds after which gene expression
declined. In contrast, in unprotected birds stronger and prolonged gene expression over
time was found.
Genes differentially expressed in the complement and coagulation cascade were mainly
involved in the classical pathway and followed the expression pattern of the general
signature of protection, except for CD59. This gene, which prevents lysis of cells by
complement, was down regulated in protected birds especially at 1 and 2 d.p.c., and a
correlate of protection.
In the cytokine-cytokine receptor interaction pathway several genes of many subfamilies
were induced. In contrast to the other cytokine and chemokine gene subsets, growth factors
were increasingly down regulated in unprotected birds, whereas in protected birds
expression was less down regulated.
The apoptosis pathway was the only pathway in the general signature of protection in
which most genes differed in expression pattern from the other pathways. In contrast to
other genes IAP and IL1R1 were oppositely expressed between protected and unprotected
birds. IAP was up regulated over time in unprotected birds, while down regulated from 2 to
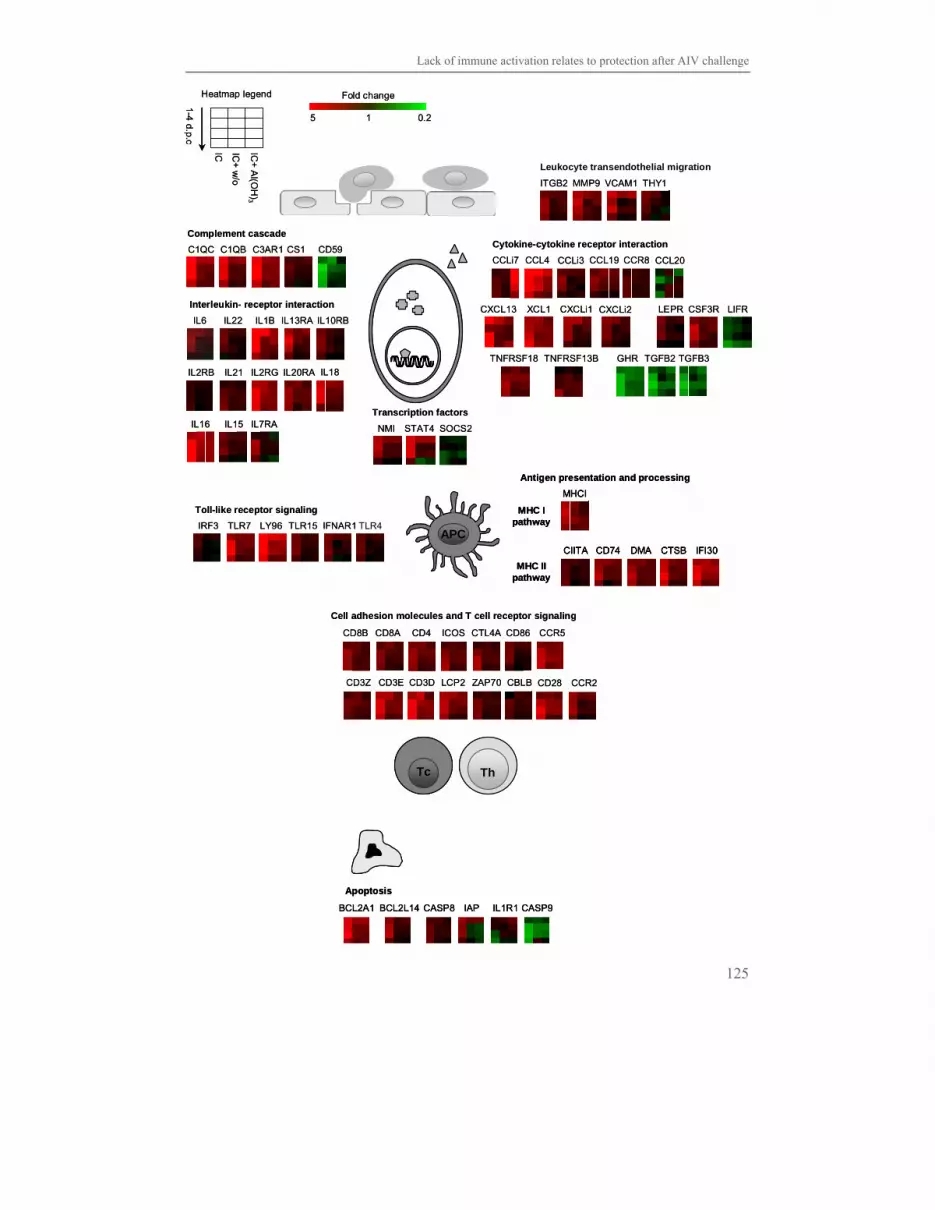
Lack of immune activation relates to protection after AIV challenge
125
ThThTcTc
IC IC+
w/o
IC+
Al(O
H)3
1-4 d.p.c
Heatmap legend
IC IC+
w/o
IC+
Al(O
H)3
1-4 d.p.c
Heatmap legend
Leukocyte transendothelial migration
ITGB2 VCAM1MMP9 THY1ITGB2 VCAM1MMP9 THY1
APCAPC
Antigen presentation and processing
MHCI
CIITA DMA CTSB IFI30CD74
MHC I pathway
MHC II pathway
Antigen presentation and processing
MHCI
CIITA DMA CTSB IFI30CD74
MHC I pathway
MHC II pathway
Antigen presentation and processing
MHCIMHCI
CIITA DMA CTSB IFI30CD74CIITA DMA CTSB IFI30CD74
MHC I pathway
MHC II pathway
Toll-like receptor signaling
IRF3 LY96 TLR15 IFNAR1TLR7
Toll-like receptor signaling
IRF3 LY96 TLR15 IFNAR1TLR7 TLR4
Cytokine-cytokine receptor interaction
CCL20CCLi7 CCL4 CCLi3 CCL19 CCR8
LEPR LIFRCSF3R
TNFRSF18 TNFRSF13B GHR TGFB2 TGFB3
CXCL13 CXCLi1XCL1 CXCLi2
Cytokine-cytokine receptor interaction
CCL20CCLi7 CCL4 CCLi3 CCL19 CCR8
LEPR LIFRCSF3R
TNFRSF18 TNFRSF13B GHR TGFB2 TGFB3
CXCL13 CXCLi1XCL1 CXCLi2
Transcription factors
NMI SOCS2STAT4
Transcription factors
NMI SOCS2STAT4
Complement cascade
CD59C1QC C3AR1 CS1C1QB
Complement cascade
CD59C1QC C3AR1 CS1C1QB
CD3Z CD3D LCP2CD3E ZAP70
Cell adhesion molecules and T cell receptor signaling
CD8B CD4 ICOSCD8A CD86 CCR5CTL4A
CD28CBLB CCR2CD3Z CD3D LCP2CD3E ZAP70
Cell adhesion molecules and T cell receptor signaling
CD8B CD4 ICOSCD8A CD86 CCR5CTL4A
CD28CBLB CCR2
IL16 IL7RAIL15
Interleukin- receptor interaction
IL6 IL1B IL13RA IL10RBIL22
IL2RB IL2RG IL20RAIL21 IL18
IL16 IL7RAIL15
Interleukin- receptor interaction
IL6 IL1B IL13RA IL10RBIL22
IL2RB IL2RG IL20RAIL21 IL18
BCL2A1 CASP8 IAPBCL2L14
Apoptosis
CASP9IL1R1BCL2A1 CASP8 IAPBCL2L14
Apoptosis
CASP9IL1R1BCL2A1 CASP8 IAPBCL2L14
Apoptosis
CASP9IL1R1
15 0.2
Fold change
15 0.2
Fold change

Chapter 6
126
Figure 5. Brief and low expression of significantly differentially expressed pathways in protected birds as
correlate of protection. Pathways showing genes significantly differentially expressed at any day post challenge
between IC birds and both IC+w/o and IC+Al(OH)3 birds in lung L1 (n = 4). Gene expression rates in the gene
individual heatmaps are the result of comparing expression in IC+w/o, IC+Al(OH)3 and IC birds to expression in
NINC birds. Red indicates up regulation and green down regulation. Pathways analysis was performed using
DAVID and based on KEGG.
4 d.p.c. in protected birds. IL1R1 was down regulated in unprotected birds and up regulated
in protected birds. CASP9 was strongly down regulated in unprotected birds over time, but
in protected birds was less down regulated and only from 1 to 3 d.p.c.
Subsequently we looked for pathways that were significantly differentially expressed in
either IC+w/o or IC+Al(OH)3 birds compared to unprotected IC birds. Not one immune
related pathway was uniquely significantly induced in either w/o or Al(OH)3 immunised
birds. However, within the pathways described above, unique genes were found within an
adjuvant group (Supplemented data Fig. S2). For w/o 41 adjuvant unique genes were found
and for Al(OH)3 35 genes. Again expression rates of the adjuvant specific genes were lower
in protected IC+w/o or IC+Al(OH)3 birds compared to unprotected IC birds. In conclusion,
although IC+w/o or IC+Al(OH)3 birds expressed some adjuvant specific genes, the
expression pattern of these genes remained similar to the general gene expression signature
of protection after challenge emphasising the relation of this pattern with a protective
response.
Effect of adjuvants on recruitment of leukocytes in the lung
Gene profiling resulted in a signature of protection after AIV challenge: a low viral RNA
expression associated with a low amplitude of change in gene expression. Next, we
analysed cell influxes in the respiratory tract using immunocytochemical staining for viral
NP, KUL-01+ (macrophages), CD4+ and CD8α+ cells.
In general, independent of the treatment, virus infected cells were detected at 1 d.p.c. in the
larger airways and in adjacent parabronchi in L1. Thereafter more virus infected cells were
found in the adjacent parabronchi. In L4 less and smaller virus infected areas were found
than in L1, corresponding to the viral RNA levels. In protected IC+w/o and IC+Al(OH)3
birds, less and smaller virus infected areas in L1 were found compared to the unprotected
(NIC, IC and IC+CpG) birds, but the location of infected areas was similar. No differences
were found between unprotected groups, the number and size of virus infected areas was
similar in IC and IC+CpG birds to those seen in NIC birds for both L1 and L4.
Influxes of KUL-01+, CD4+ and CD8α+ cells were seen in lung L1 and L4 in all birds from
1 d.p.c. Independent of the adjuvant, larger influxes of KUL-01+ macrophages and CD4+
cells were seen in L1 than in L4 correlating to the number of virus infected cells. The cell

Lack of immune activation relates to protection after AIV challenge
127
influxes co-localised with virus infected areas. The size of the CD4+ and KUL-01+ cell
influxes correlated to the number of virus infected cells, resulting in fewer influxes in
protected birds. Influxes of CD8α+ cells did not differ between protected and unprotected
birds. Influxes of CD8α+ cells were less dense than KUL-01+ and CD4+ cell influxes (Fig.
6), but also co-localised with virus infected areas.
The recruitment of leukocytes in the lung corresponded to the gene profiles of protected
and unprotected birds. Less virus entry into the lung resulted in smaller influxes of
macrophages and CD4+ cells, linked to absence of immune activation after challenge
therefore having fewer and lower gene expression in protected birds.
Figure 6. Less influx of CD4+ cells and KUL-01+ macrophages in lung of protected (IC+w/o and IC+Al(OH)3)
compared to unprotected (NIC, IC and IC+CpG) birds. Cryosections of lung L1 of non-immunised-non-challenged
(NINC) birds, unprotected non-immunised-challenged (NIC) birds, unprotected immunised-challenged (IC+CpG)
birds and protected immunised-challenged (IC+w/o) birds stained for viral NP and KUL-01+ macrophages at 2
d.p.c. and for CD4+ and CD8α+ cells at 4 d.p.c. L indicates luminal side of a parabronchus. Bar is 100 μm.
Effect of adjuvants on humoral responses
Since the cause of the lower viral load in the respiratory tract might be prevention of viral
entry by virus-specific antibodies, H9-specific HI titres were measured in blood samples
taken two weeks after immunisation prior to challenge (Fig. 7A). A significant increase in
HI titer was only found in IC+w/o and IC+Al(OH)3 birds. IC+Al(OH)3 birds had the
NIC
NINC
IC+ CpG
Viral NP KUL-01+ CD4+ CD8a+
IC+ w/o
L
LL
L
L
L
L
L
NIC
NINC
IC+ CpG
Viral NP KUL-01+ CD4+ CD8a+
IC+ w/o
L
LL
L
L
L
L
L

Chapter 6
128
highest HI titre, which was significantly higher compared to IC+w/o birds. However, this
was to be expected because the maximum antibody titer post-vaccination is generally
delayed in w/o vaccinated birds when compared to Al(OH)3 vaccinated birds. AIV NP-
specific antibody titers were also measured (Fig. 7B) and a significant increase was found
in protected IC+w/o and IC+Al(OH)3 birds.
A. B.
Figure 7. Protected IC+w/o and IC+Al(OH)3 birds had a significant increase in A) HI titer and B) AIV NP-
specific antibody titer in contrast to unprotected NIC, IC and IC+CpG birds. Serum was collected at 14 days after
immunisation prior to challenge of all birds (n = 16 per group). Data are expressed as means with standard error of
the mean (SEM). * Indicates a significant difference (p<0.05).
Discussion
Avian influenza virus (AIV) infection has severe consequences, not only for the worldwide
economy but also for human health. As no vaccines have been found yet that protect
against a broad range of influenza virus strains much effort is invested in development of
new vaccines and improvement of vaccine efficacy. To this end, knowledge on correlates of
protection against AIV infection is warranted.
In this study we set out to investigate possible correlates of protection after challenge with a
low pathogenic AIV and studied the role of the different immunepotentiators w/o, Al(OH)3
and CpG. Correlates of protection were investigated using microarrays, and gene
expression profiles were studied in more detail using qRT-PCR and immunocytochemical
analysis of the lung. Immunisation of day-old birds in with H9N2+w/o or HN2+Al(OH)3
provided protection based on low viral RNA expression against homologues H9N2
challenge 2 weeks later, while immunisation with H9N2+CpG did not. When differences in
gene expression patterns of protected and unprotected birds were compared, no specific sets
of genes were associated with protection. Previous studies report subsets of genes defining
disease pathology of influenza virus infection in mammals (Baskin et al., 2002, Pennings et
al., 2008, Cillóniz et al., 2009), but no gene subsets have been described relating to
protection. Differences in the patterns of gene expression were observed. In protected birds
gene expression rates in lung and trachea were lower and diminished after 1 d.p.c., while
gene expression patterns and pathway analysis showed stronger and prolonged gene
0
5
10
15
10
5
10
15
Mea
n 2l
og s
erum
tite
r
0
5
10
15
10
5
10
15
Mea
n 2l
og s
erum
tite
r
NINC
NIC
IC
IC+CpG
IC+w/o
IC+Al(OH)3
NINC
NIC
IC
IC+CpG
IC+w/o
IC+Al(OH)3
NINC
NIC
IC
IC+CpG
IC+w/o
IC+Al(OH)30
1
2
3
4
5
10
1
2
3
4
5
Mea
n 2l
og s
erum
tite
r
0
1
2
3
4
5
10
1
2
3
4
5
Mea
n 2l
og s
erum
tite
r
*
*
*
0
5
10
15
10
5
10
15
Mea
n 2l
og s
erum
tite
r
0
5
10
15
10
5
10
15
Mea
n 2l
og s
erum
tite
r
NINC
NIC
IC
IC+CpG
IC+w/o
IC+Al(OH)3
NINC
NIC
IC
IC+CpG
IC+w/o
IC+Al(OH)3
NINC
NIC
IC
IC+CpG
IC+w/o
IC+Al(OH)3
NINC
NIC
IC
IC+CpG
IC+w/o
IC+Al(OH)3
NINC
NIC
IC
IC+CpG
IC+w/o
IC+Al(OH)3
NINC
NIC
IC
IC+CpG
IC+w/o
IC+Al(OH)30
1
2
3
4
5
10
1
2
3
4
5
Mea
n 2l
og s
erum
tite
r
0
1
2
3
4
5
10
1
2
3
4
5
Mea
n 2l
og s
erum
tite
r
*
*
*
*
*

Lack of immune activation relates to protection after AIV challenge
129
expression in unprotected birds. These data suggest that short term activation of the
immune system is associated with protection after challenge, while prolonged activation of
the immune system leads to progressive AIV infection. Indeed immunocytochemistry
showed smaller influxes of KUL-01+ macrophages and CD4+ cells in the lung of protected
birds compared to unprotected birds which parallels the microarray data. Thus, rather than
finding certain genes or pathways that correlate with protection, we conclude that lack of
immune activation is the strongest predictor and correlate of progression after challenge.
That lack of immune activation is associated with protection against progressive infection
has been reported previously for other viral infections. For example, persistent immune
activation after HIV-1 infection has been shown to correlate with progressive disease
(Hazenberg et al., 2003) and non-pathogenic SIV infection in sooty mangabeys was
associated with attenuated immune activation despite the presence of high levels of viral
replication (Silvestri et al., 2003). Apparently uncontrolled immune activation is also
reported for high pathogenic influenza virus. The broad tissue specificity and systemic
replication seem to determine the pathogenicity of H5N1 viruses in animals. Virus induced
cytokine dysregulation contributes to disease severity, in that high viral load results in
intense inflammatory responses and fatal outcome (Baskin et al., 2002, De Jong et al.,
2006, Kash et al., 2006, Perrone et al., 2008). Thus, although activation of the immune
system is necessary in order to get an anti-viral immune response, too much activation may
lead to immune pathology and progressive disease.
To our knowledge, this is the first time that a correlation between lack of immune
activation and absence of pathogenesis after challenge with AIV is described for the
chicken. This lack of immune activation in protected birds is likely caused by presence of
virus-specific antibodies that reduce viral entry and subsequently attenuate immune
activation. Protected birds had a high HI titre while unprotected birds had no HI titre
correlating to the difference in viral RNA expression.
These results have severe implications for vaccine design. Vaccines that are merely directed
to induce virus-specific CTL do not necessarily prevent immune pathology (Moskophidis et
al., 1998), suggesting that antibody based vaccines are better candidates to induce
protection. However, vaccines that only induce antibodies may be very effective for a
certain strain of AIV, but cross protection against other strains is limited (Rimmelzwaan et
al., 2008). It may also induce escape mutants due to antigenic shift under the influence of
immune pressure (Rimmelzwaan et al., 2008). In contrast, CTL have been shown to be
largely directed against epitopes within conserved viral proteins and contribute to
protection against AIV infection (Jameson et al., 1999). Furthermore, H9N2 viruses have
been demonstrated to induce cross-protection against highly pathogenic H5N1 based on
cellular immunity (Seo et al., 2001). This suggests that a vaccine inducing both humoral
and cellular immunity may prevent immune pathology and induce strong CTL responses.

Chapter 6
130
Furthermore, the type of adjuvant used is also important. We showed that protection to low
AIV was only obtained after immunisation in the presence of immunopotentiators w/o and
Al(OH)3. These adjuvants are known to induce a humoral response (Hogenesch, 2002,
Jansen et al., 2007) providing high virus-specific antibody responses. Furthermore, w/o
emulsions have been demonstrated to also enhance cellular immune responses (Aucouturier
et al., 2001, Tritto et al., 2009). Immunisation in the presence of CpG, which induces
activation of macrophages, NK cells and antigen specific CTL did not result in protection
(Klinman et al., 2004) .
In our study the differences between the adjuvants is most likely explained by the
difference in HI titre; adjuvants that induce neutralizing antibodies may prevent viral entry
and are associated with protection. This observation is in contrast with other studies which
show that addition of CpG to E. coli bacterin or recombinant plasmids DNA vaccine
encoding the VP2 gene of IBDV provide protection from mortality and induced increased
antigen specific antibody titers (Mahmood et al., 2006, Gomis et al., 2007). This may be
due to the age of the birds that were used in the different studies. We immunised day-old
birds which were challenged 14 days later, while the other studies immunised birds from 7
or 10 days of age and challenged birds at 21 or 30 days of age. Previous data showed that
immunization of 1-day-old broilers with BSA resulted in a much lower and slower antibody
production compared to immunization at 1 or 2 weeks of age (Mast et al., 1999). This
suggests that age of the vaccinated birds may be an important factor in the choice of
adjuvant, which is highly relevant for the poultry industry.
In summary, we show that in addition to high HI and AIV NP-specific antibody titers and a
limited number of differentially expressed genes correlating with protection, such as
CCL20, IAP and CD59, lack of immune activation is the most important correlate of
protection after challenge with AIV.
Acknowledgements
We thank Marijn Driessen, Nicolette Scholtes and Virgil Schijns from Intervet/Schering-
Plough Animal Health for their collaboration on the in vivo experiment. From the Animal
Breeding and Genomics Centre, Wageningen UR, we would like to thank Dirkjan Schokker
and Ina Hulsegge for pathway analysis assistance. From the Genomics Laboratory we
would like to thank Dik van Leenen and Diane Bouwmeester for technical assistance and
Erik Sluiters and Patrick Kemmeren for bioinformatical assistance. This work was
supported by a BSIK VIRGO consortium grant (Grant no. 03012), The Netherlands.

Lack of immune activation relates to protection after AIV challenge
131
References
1. Aucouturier, J., Dupuis, L., Ganne, V. 2001. Adjuvants designed for veterinary and human vaccines.
Vaccine 19, 2666-2672.
2. Baskin, C.R., Bielefeldt-Ohmann, H., Tumpey, T.M., Sabourin, P.J., Long, J.P., García-Sastre, A.,
Tolnay, A.E., Albrecht, R., Pyles, J.A., Olson, P.H., Aicher, L.D., Rosenzweig, E.R., Murali-Krishna,
K., Clark, E.A., Kotur, M.S., Fornek, J.L., Proll, S., Palermo, R.E., Sabourin, C.L., Katze, M.G., 2009.
Early and sustained innate immune response defines pathology and death in nonhuman primates
infected by highly pathogenic influenza virus. Proc. Natl. Acad. Sci. U. S. A. 106, 3455-3460.
3. Breed, D.G., Carr, P., Vermeulen, A.N., 1996. Differential binding of two monoclonal antibodies
directed against the chicken CD8 alpha molecule. Vet. Immunol. Immunopathol. 52, 117-125.
4. Cillóniz, C., Shinya, K., Peng, X., Korth, M.J., Proll, S.C., Aicher, L.D., Carter, V.S., Chang, J.H.,
Kobasa, D., Feldmann, F., Strong, J.E., Feldmann, H., Kawaoka, Y., Katze, M.G., 2009. Lethal
influenza virus infection in macaques is associated with early dysregulation of inflammatory related
genes. PLoS Pathog. 5, e1000604.
5. Cox, J.C., Coulter, A.R., 1997. Adjuvants--a classification and review of their modes of action.
Vaccine 15, 248-256.
6. Dalpke, A., Zimmermann, S., Heeg, K., 2001. CpG-oligonucleotides in vaccination: signaling and
mechanisms of action. Immunobiology 204, 667-676.
7. De Jong, M.D., Simmons, C.P., Thanh, T.T., Hien, V.M., Smith, G.J., Chau, T.N., Hoang, D.M., Chau,
N.V., Khanh, T.H., Dong, V.C., Qui, P.T., Cam, B.V., Ha do, Q., Guan, Y., Peiris, J.S., Chinh, N.T.,
Hien, T.T., Farrar, J., 2006. Fatal outcome of human influenza A (H5N1) is associated with high viral
load and hypercytokinemia. Nat. Med. 12, 1203-1207.
8. Degen, W. G., Smith, J., Simmelink, B., Glass, E.J., Burt, D.W., Schijns, V.E., 2006. Molecular
immunophenotyping of lungs and spleens in naive and vaccinated chickens early after pulmonary avian
influenza A (H9N2) virus infection. Vaccine 24, 6096-6109.
9. Eldaghayes, I., Rothwell, L., Williams, A., Withers, D., Balu, S., Davison, F., Kaiser, P., 2006.
Infectious bursal disease virus: strains that differ in virulence differentially modulate the innate
immune response to infection in the chicken bursa. Viral Immunol. 19, 83-91.
10. Gomis, S., Babiuk, L., Allan, B., Willson, P., Waters, E., Hecker, R., Potter, A., 2007. Protection of
chickens against a lethal challenge of Escherichia coli by a vaccine containing CpG
oligodeoxynucleotides as an adjuvant. Avian Dis. 51, 78-83.
11. Hazenberg, M.D., Otto, S.A, Van Benthem, B.H., Roos, M.T., Coutinho, R.A., Lange, J.M., Hamann,
D., Prins, M., Miedema, F., 2003. Persistent immune activation in HIV-1 infection is associated with
progression to AIDS. AIDS 17, 1881-1888.
12. Hilgers, L.A., Nicolas, I., Lejeune, G., Dewil, E., Boon, B., 1998. Effect of various adjuvants on
secondary immune response in chickens. Vet. Immunol. Immunopathol. 66, 159-171.
13. Hogenesch, H. 2002. Mechanisms of stimulation of the immune response by aluminum adjuvants.
Vaccine. 20, S34-S39.
14. Ishii, K.J., Akira, S., 2007. Toll or toll-free adjuvant path toward the optimal vaccine development. J.
Clin. Immunol. 4, 363-371.
15. Jameson, J., Cruz, J., Terajima, M., Ennis, F.A., 1999. Human CD8+ and CD4+ T lymphocyte memory
to influenza A viruses of swine and avian species. J. Immunol. 162, 7578-7583.
16. Jansen, T., Hofmans, M.P., Theelen, M.J., Manders, F.G., Schijns, V.E., 2007. Dose and timing
requirements for immunogenicity of viral poultry vaccine antigen: investigations of emulsion-based
depot function. Avian Pathol. 36, 361-365.
Chapter 6
132
17. Kash, J.C., Tumpey, T.M., Proll, S.C., Carter, V., Perwitasari, O., Thomas, M.J., Basler, C.F., Palese,
P., Taubenberger, J.K., García-Sastre, A., Swayne, D.E., Katze, M.G., 2006. Genomic analysis of
increased host immune and cell death responses induced by 1918 influenza virus. Nature 443, 578-581.
18. Klinman, D.M., Currie, D., Gursel, I., Verthelyi, D., 2004. Use of CpG oligodeoxynucleotides as
immune adjuvants. Immunol. Rev. 199, 201-216.
19. Kothlow, S., Kaspers, B., 2008. The avian respiratory immune system. In Avian Immunology, 1st edn,
273-288. Edited by F. Davison, B. Kaspers, K. Schat. London: Academic Press.
20. Luhtala, M., Tregaskes, C.A., Young, J.R., Vainio, O., 1997. Polymorphism of chicken CD8-alpha, but
not CD8-beta. Immunogenetics. 46, 396-401.
21. Mahmood, M.S., Siddique, M., Hussain, I., Khan, A., Mansoor, M.K., 2006. Protection capability of
recombinant plasmid DNA vaccine containing VP2 gene of very virulent infectious bursal disease virus
in chickens adjuvanted with CpG oligodeoxynucleotide. Vaccine 24, 4838-4846.
22. Marrack, P., McKee, A.S, Munks, M.W., 2009. Towards an understanding of the adjuvant action of
aluminium. Nat. Rev. Immunol. 4, 287-293.
23. Mast, J., Goddeeris, B.M., Peeters, K., Vandesande, F., Berghman, L.R., 1998. Characterisation of
chicken monocytes, macrophages and interdigitating cells by the monoclonal antibody KUL01. Vet.
Immunol. Immunopathol. 61, 343-357.
24. Mast, J., Goddeeris, B.M., 1999. Development of immunocompetence of broiler chickens. Vet.
Immunol. Immunopathol. 70, 245-256.
25. Moskophidis, D., Kioussis, D., 1998. Contribution of virus-specific CD8+ cytotoxic T cells to virus
clearance or pathologic manifestations of influenza virus infection in a T cell receptor transgenic mouse
model. J. Exp. Med. 188, 223-232.
26. Murthy, T.R., Dorairajan, N., Balasubramaniam, G.A., Dinakaran, A.M., Kalaimathi, R., 2007. The
effect of vaccination of pullets against Ornithobacterium rhinotracheale infection. Avian Pathol. 36,
481-485.
27. Pennings, J.L., Kimman, T.G., Janssen, R., 2008. Identification of a common gene expression response
in different lung inflammatory diseases in rodents and macaques. PLoS ONE 3, e2596.
28. Perrone, L.A., Plowden, J.K., García-Sastre, A., Katz, J.M., Tumpey, T.M., 2008. H5N1 and 1918
pandemic influenza virus infection results in early and excessive infiltration of macrophages and
neutrophils in the lungs of mice. PLoS Pathog. 4, e1000115.
29. Reemers, S.S., Van Haarlem, D.A., Groot Koerkamp, M.J., Vervelde, L., 2009a. Differential gene
expression and host response profiles against avian influenza virus within the chicken lung due to
anatomy and airflow. J. Gen. Virol. 90, 2134-2146.
30. Reemers, S.S., Groot Koerkamp, M.J., Holstege, F.C., Van Eden, W., Vervelde, L., 2009b. Cellular
host transcriptional responses to Influenza A virus in chicken tracheal organ cultures differ from
response in in vivo infected trachea. Vet. Immunol. Pathol. 132, 91-100.
31. Rimmelzwaan, G.F., McElhaney, J.E., 2008. Correlates of protection: novel generations of influenza
vaccines. Vaccine 26, D41-D44.
32. Sasaki, T., Kokumai, N., Ohgitani, T., Sakamoto, R., Takikawa, N., Lin, Z., Okamatsu, M., Sakoda, Y.,
Kida, H., 2009. Long lasting immunity in chickens induced by a single shot of influenza vaccine
prepared from inactivated non-pathogenic H5N1 virus particles against challenge with a highly
pathogenic avian influenza virus. Vaccine 27, 5174-5177.
33. Seo, S.H., Webster, R.G., 2001. Cross-reactive, cell-mediated immunity and protection of chickens
from lethal H5N1 influenza virus infection in Hong Kong poultry markets. J. Virol. 75, 2516-2525.
34. Silvestri, G., Sodora, D.L., Koup, R.A., Paiardini, M., O'Neil, S.P., McClure, H.M., Staprans, S.I.,
Feinberg, M.B., 2003. Nonpathogenic SIV infection of sooty mangabeys is characterized by limited
bystander immunopathology despite chronic high-level viremia. Immunity 18, 441-452.

Lack of immune activation relates to protection after AIV challenge
133
35. Tritto, E., Mosca, F., De Gregorio, E., 2009. Mechanism of action of licensed vaccine adjuvants.
Vaccine 25-26, 3331-3334.
36. Vervelde, L., Vermeulen, A.N., Jeurissen, S.H., 1996. In situ characterization of leucocyte
subpopulations after infection with Eimeria tenella in chickens. Parasite Immunol. 18, 247-256.
37. Withers, D.R., Young, J.R., Davison, T.F., 2005. Infectious bursal disease virus-induced
immunosuppression in the chick is associated with the presence of undifferentiated follicles in the
recovering bursa. Viral Immunol. 18, 127-137.
Supplementary data
Figure S1. Lower expression rates of immune related genes were found in protected (IC+w/o and IC+Al(OH)3)
compared to unprotected (IC and IC+CpG) birds of genes expressed in trachea, lung L1 and L4. Heatmaps over
time showing genes significantly differentially expressed at any day post challenge between IC and IC+w/o birds
and/or IC+Al(OH)3 birds that were shared between upper trachea, lung L1 and L4 (n = 4). Gene expression rates in
the heatmaps are the result of comparing expression in challenged birds to expression in NINC birds. Red
indicates up regulation and green down regulation.
Upper trachea Lung L1 Lung L4
IC+ w/o
IC IC+ CpG
IC+ Al(OH)3
unprotected protected
1-4 d.p.c
IC+ w/o
IC IC+ CpG
IC+ Al(OH)3
unprotected protected
1-4 d.p.c
IC+ w/o
IC IC+ CpG
IC+ Al(OH)3
unprotected protected
1-4 d.p.c
15 0.2
Fold

Chapter 6
134
Figure S2. Significant differentially expressed genes that are uniquely expressed within an adjuvant group. These
genes were mainly expressed at a higher rate and for a longer period of time in unprotected birds. Heatmaps over
time showing adjuvant unique genes expressed at any day post challenge between IC birds and IC+w/o and
IC+Al(OH)3 birds in lung L1 (n = 4). Gene expression rates in the heatmaps are the result of comparing expression
in challenged birds to expression in NINC birds. Red indicates up regulation and green down regulation.
Al(OH)3 specific w/o specific
IC IC+ w/o
1-4 d.p.c
IC IC+ Al(OH)3
1-4 d.p.c
15 0.2
Fold change

Early host responses to avian influenza A virus are
prolonged and enhanced at transcriptional level
depending on maturation of the immune system
Sylvia S. Reemers1, Dik van Leenen2, Marian J. Groot Koerkamp2, Daphne van Haarlem1,
Peter van de Haar1, Willem van Eden1, Lonneke Vervelde1
1 Department of Infectious Diseases and Immunology, Faculty Veterinary Medicine, Utrecht University, Yalelaan
1, 3584 CL Utrecht, The Netherlands 2 Genomics Laboratory, Department of Physiological Chemistry, Utrecht Medical Centre, Universiteitsweg 100,
3584 CG Utrecht, The Netherlands
Molecular Immunology, 2010; in press
Chapter 7


Immunological maturation affects the strength and duration of transcriptional host responses to AIV infection
137
Abstract
Newly hatched chickens are more susceptible to infectious diseases than older birds
because of an immature immune system. The aim of this study was to determine to what
extent host responses to avian influenza virus (AIV) inoculation are affected by age in 1-
and 4-week (wk) old birds. Birds were inoculated with H9N2 AIV or saline control. The
trachea and lung were sampled at 0, 8, 16 and 24 hours post inoculation (h.p.i.) and gene
expression profiles determined using microarray analysis. Firstly, saline controls of both
groups were compared to analyse the changes in gene profiles related to development.
Genes related to tissue development and immunological maturation were significantly
differentially expressed. In 1-wk-old birds, higher expression of genes related to
development of the respiratory immune system and innate responses were found, whereas
in 4-wk-old birds genes were up regulated that relate to the presence of higher number of
leukocytes in the respiratory tract. After inoculation with H9N2, gene expression was most
affected at 16 h.p.i. in 1-wk-old birds and at 16 and 24 h.p.i. in 4-wk-old birds in the
trachea and especially in the lung. In 1-wk-old birds less immune related genes including
innate related genes were induced and which might be due to age-dependent reduced
functionality of APC, T cells and NK cells. In contrast cytokine and chemokines gene
expression was related to viral load in 1-wk-old birds and less in 4-wk-old birds.
Interestingly, expression of cellular host factors that block virus replication by interacting
with viral factors was independent of age or tissue for most host factors. These data show
that differences in development are reflected in gene expression and suggest that the
strength of host responses at transcriptional level may be a key factor in age-dependent
susceptibility to infection, and the cellular host factors involved in virus replication are not.
Introduction
Young animal are highly susceptible to opportunistic pathogens that are common in their
environment. Susceptibility to disease decreases as the bird matures, suggesting that this
phenomenon is due to immaturity of the immune system (Raj et al., 1997, Hume et al.,
1998, Beal et al., 2005). Neonatal immune dysfunction has also been reported for mammals
(Gasparoni et al., 2003, Chelvarajan et al., 2004, Velilla et al., 2006). At present,
vaccination of young chicks is commonly practised to establish immunity in a flock. In
newly hatched birds, the activation, phagocytosis and bactericidal activities of heterophils
and macrophages were shown to be age-dependent in that they increase with age (Kodama
et al., 1976, Wells et al., 1998, Kogut et al., 2002). T cells from 1-day-old chicks hardly
proliferate in response to mitogens and produce less IFN and IL-2 (Lowenthal et al., 1994).
Immunization of 1-day-old broilers with BSA resulted in a much lower and slower antibody
production compared to immunization at 1 or 2 weeks of age (Mast et al., 1999).

Chapter 7
138
The respiratory tract is constantly exposed to pathogens like influenza virus and to provide
adequate protection, inhaled pathogens are removed by mucus, neutralizing molecules like
IgA, complement and antimicrobial peptides. When virus entry is not successfully blocked,
influenza virus will infect the epithelial cells resulting in the production of pro-
inflammatory cytokines, chemokines and interferons (Julkunen et al., 2001). This attracts
macrophages and DC, which upon activation or influenza virus infection also start
producing cytokines and chemokines attracting more APC and lymphocytes to the place of
infection. The trachea, lung and air sacs contribute to the respiratory immune system, but
the lung plays a special role because it contains secondary lymphoid structures (Kothlow et
al., 2008). Newly hatched birds have dispersed T cells, B cells, leukocytes and monocytes
present throughout the lung. At 2 weeks of age areas with lymphocyte infiltrates are found
around the bifurcations of the caudal secondary bronchi. These organized structures show
similarity to Peyer’s patches and are called bronchus associated lymphoid tissue (BALT;
Jeurissen et al., 1989, Fagerland et al., 1993). Avian BALT is not comparable to inducible
BALT in mice and human (Moyron-Quiroz et al., 2004, Rangel-Moreno et al., 2006),
because its presence is independent of antigenic stimulation (Reese et al., 2006). In the
trachea no organized lymphoid structures have been reported, but infection with various
pathogens results in lymphoid infiltration and in formation of lymphoid follicles (Gaunson
et al., 2006, Matthijs et al., 2009, Reemers et al., 2009b).
For replication and transcription of the influenza virus genome, the virus uses both viral and
cellular host factors. Viral factors like the polymerase complex or nucleoprotein have been
known to interact with mammalian host factors like importins or histones during influenza
virus infection (Engelhardt et al., 2006, Naffakh et al., 2008, Nagata et al., 2008). The virus
must stimulate expression of host factors that are needed for replication ongoing during
infection to ensure virus multiplication. However, some host factors that interact with viral
factors are used in host defense responses and can limit viral replication.
To investigate the effect of age on the early host response and on host factors affecting viral
replication in the respiratory tract, we inoculated 1- and 4-week (wk) old birds with H9N2
avian influenza virus (AIV) or saline. The trachea and lung were sampled at 0, 8, 16 and 24
hours post inoculation (h.p.i.) and gene expression was studied using microarray analysis.
Differences between 1- and 4-wk-old saline inoculated control birds were mainly related to
tissue development and immunological maturation. Differences between 1- and 4-wk-old
H9N2 inoculated birds were related to strength and the timing of host responses at
transcriptional level. Expression of cellular host factors that block viral replication by
interacting with viral factors was independent of age and tissue.

Immunological maturation affects the strength and duration of transcriptional host responses to AIV infection
139
Materials and methods
Experimental design
Lohmann Brown chickens of 1 and 4 weeks of age were divided into 2 groups per age, a
saline and AIV inoculated group. The birds were inoculated intratracheally (i.t.) with either
0.1 ml PBS or with 0.1 ml 107.7 EID50 H9N2 AIV, isolate A/Chicken/United Arab
Emirates/99 (kindly provided by Intervet Schering-Plough Animal Health). At 0, 8, 16 and
24 hours post inoculation (h.p.i.) 5 birds per time point per group and per age were killed.
The upper trachea and the left lung were isolated and stored in RNAlater (Ambion) at -
80°C for RNA isolation. The segment of the lung containing the primary and secondary
bronchi was used for analysis. Selection of the upper trachea and the lung segment used for
analysis was based on high viral load and high virus-induced gene expression as described
previously (Reemers et al., 2009b). All experiments were carried out according to protocols
approved by the Animal Experiment Committee of Utrecht University (Utrecht, The
Netherlands).
RNA isolation
The trachea (5 mm part) and lung (1x5 mm part) were homogenized (Mixer Mill 301,
Retsch) and total RNA was isolated using the RNeasy Mini Kit and DNase treated using the
RNase-free DNase Set following manufacturer’s instructions (Qiagen). All RNA samples
were checked for quantity using a spectrophotometer (Shimadzu) and quality using a 2100
Bioanalyzer (Agilent Technologies).
Real-time quantitative reverse transcription-PCR (qRT-PCR)
cDNA was generated from 500 ng RNA using reverse transcription using iScript cDNA
Synthesis Kit (Biorad Laboratories B.V.). Real-time qRT-PCR was used for detection of
GAPDH, viral H9 haemagglutinin (HA), interleukins (IL-1β, IL-8, IL-18), interferon alpha
(IFN-α) and 28S as previously described (Reemers et al., 2009a). Amplification and
detection of specific GAPDH and viral H9 HA products was achieved using iQ SYBR
green supermix (Biorad). For amplification and detection of IL-1β, IL-8, IL-18, IFN-α and
28S TaqMan Universal PCR Master Mix (Applied Biosystems) was used.
Statistical analysis qRT-PCR data
To determine the statistical significance in viral RNA expression between time points
within an age group and between age groups within a time point in the trachea and lung an
ANOVA with a Tukey post-hoc test was used. To determine the statistical significance in
cytokine mRNA expression between control birds and H9N2 inoculated birds within a time
point and age group in the trachea and lung an ANOVA was used. Correlations between
viral RNA and cytokine mRNA expression were based on the Pearson correlation

Chapter 7
140
coefficient (r) and determined using SPSS 15.0 software. A p-value < 0.05 was considered
significant.
Oligonucleotide microarray analysis
Microarray analysis was performed as described previously (Reemers et al., 2009b) using
the Gallus gallus Roslin/ARK CoRe Array Ready Oligo Set V1.0 (Operon
Biotechnologies). All the trachea and lung samples were co-hybridised with respectively a
trachea or lung reference sample. These reference samples consisted of pooled RNA
extracted from tracheas or lungs of 4 chickens that were not included in this experiment.
Microarray arrays were analysed as previously described (Reemers et al., 2009b). Ensembl
Gallus gallus, (assembly: WASHUC2, May 2006, genebuild: Ensembl, Aug 2006, database
version: 47.2e) was used for gene names and description. For analysis of gene lists and
Gene Ontology (GO) analysis Database for Annotation, Visualization and Integrated
Discovery (DAVID) 2008 was used. Primary data are available in the public domain
through Expression Array Manager at http://www.ebi.ac.uk/microarray-as/aer/?#ae-main[0]
under accession number E-TABM-771 for the lung and E-TABM-772 for the trachea.
Results
Age-dependent gene expression in control birds
Before we compared virus-induced host responses between 1- and 4-wk-old birds we
determined the effect of age on gene expression in control birds. Differences would affect
virus-induced gene profiles and a direct comparative study between the age groups would
not be possible. The number of genes in the lung that differed significantly between 1- and
4-wk-old control birds at 0, 8, 16 and 24 h.p.i. were respectively 230, 167, 74 and 227
genes, and in the trachea 58, 104, 47 and 19 genes. On each set of genes Gene Ontology
(GO) analysis was performed using DAVID and the resulting top three functional groups of
every gene set were depicted in Table S1 in the supplementary data. These functional
groups were mainly related to tissue development, but most functional groups contained
genes that also play a role in immune responses. Furthermore, several functional groups
relating to immune related processes like immune system response, lymphocyte activation
and chemotaxis were also significantly differentially expressed between 1- and 4-wk old
control birds, but did not belong to the top 5 of functional groups found. The number of
immune related genes that were significantly differentially expressed between 1- and 4-wk-
old control birds was determined. The immune related category was based on the GO
annotations host-pathogen interaction, external stimulus and immune response. The number
of immune related genes at 0, 8, 16, and 24 h.p.i. were in the lung respectively 34, 33, 13
and 38 genes and in the trachea 7, 17, 4 and 4 genes (Supplementary data Table S2 and S3).
In the lung these genes were involved in antigen presentation/binding, apoptosis, cell

Immunological maturation affects the strength and duration of transcriptional host responses to AIV infection
141
differentiation and proliferation, chemotaxis, innate immune response, protein folding and
binding and signal transduction. In the trachea less genes were differentially expressed than
in the lung, but the ones expressed were involved in similar biological processes. Most
genes were expressed at a higher rate in 4-wk-old birds in both the lung and trachea. Genes
higher expressed in the lung and trachea of 1-wk-old birds were mostly involved in
apoptosis, cell adhesion and proliferation, innate immune responses, protein binding and
folding, and signal transduction.
These results indicated that gene expression levels differed significantly between 1- and 4-
wk-old control birds due to development of the tissue itself and maturation of the immune
system. Therefore, host responses induced by H9N2 inoculation in 1- and 4-wk-old birds
could only be compared indirectly by comparing expression patterns between control and
H9N2 inoculated birds within an age group.
Early gene expression patterns after H9N2 inoculation
In the lung and trachea of all H9N2 inoculated birds viral RNA was detected using qRT-
PCR (Fig. 1A). There was no significant difference in viral RNA levels between 1-wk and
4-wk-old birds in both the lung and trachea at any time point.
To determine the effect of H9N2 inoculation at transcriptional level over time, we
compared gene expression rates in H9N2 inoculated birds to age matched control birds
within a time point. Differences in gene expression rates were given as fold change and
depicted over time generating gene expression patterns. For the lung and trachea gene
expression patterns were generated for global genes (Fig. 1B) and immune related genes
(data not shown, but patterns similar to those of global genes). After inoculation, genes
were mostly up regulated and not down regulated in both the lung and trachea independent
of age. In the lung more genes were up regulated than in the trachea, but gene expression
patterns in the lung and trachea were similar. The biggest difference was found between the
age groups. In 1-wk-old birds gene expression was most affected by H9N2 inoculation at
16 h.p.i. and the amplitude of change declined at 24 h.p.i. In 4-wk-old birds the effect of
H9N2 inoculation on gene expression increased over time and gene expression was affected
most at 16 and 24 h.p.i. Therefore the overall gene expression pattern in response to H9N2
inoculation differed between 1- and 4-wk-old birds. Genes involved in development (based
on GO annotation terms developmental process, developmental maturation, multicellular
organismal development, anatomical structure development) did not follow this expression
pattern and did not differ in expression between H9N2 inoculated birds and age matched
control birds in both age groups (data not shown).

Chapter 7
142
A.
B.
Figure 1. A) Viral RNA expression in lung and trachea of 1- and 4-wk-old H9N2 inoculated birds. Viral RNA
expression was determined using qRT-PCR (n = 4) and data were expressed as means with standard error of the
mean (SEM). B) Gene expression patterns of global genes induced after H9N2 inoculation in lung and trachea.
Gene expression of global genes was determined using microarray analysis. Gene expression rates in 1- and 4-wk-
old H9N2 inoculated birds were compared to gene expression rates in age and time matched control birds (n = 4).
Red indicated up regulated genes and green down regulated genes.
Early gene expression after H9N2 inoculation
In order to determine early responses to H9N2 inoculation in the respiratory tract we
compared gene expression in H9N2 inoculated birds to age matched control birds within a
time point. The number of global and immune related genes significantly differentially
induced after H9N2 inoculation at 8, 16 and 24 h.p.i. in the lung and trachea of 1- and 4-
wk-old birds were depicted in Figure 2A. In the lung and trachea more genes were
differentially expressed after H9N2 inoculation in 4- compared to 1-wk-old birds except for
global genes at 16 h.p.i. Immune related genes significantly differentially expressed after
H9N2 inoculation were depicted in Table 1 for the lung and Table 2 for the trachea. Since
basal gene expression levels differed between 1- and 4-wk-old birds in both the lung and
trachea, a direct comparison between host responses to H9N2 inoculation could not be
0
5
10
15
20
8h 16h 24h 8h 16h 24h
1wk 4wk
0
5
10
15
20
24 2416 1688
1 wk 4 wk
Cor
rect
40-
Ct +
SE
M
Lung
Age
h.p.i.0
5
10
15
20
8h 16h 24h 8h 16h 24h
1wk 4wk
0
5
10
15
20
24 2416 1688
1 wk 4 wk
Cor
rect
40-
Ct +
SE
M
Lung
Age
h.p.i.0
5
10
15
20
8h 16h 24h 8h 16h 24h
1wk 4wk
0
5
10
15
20
Cor
rect
40-
Ct +
SE
M
Trachea
24 2416 1688
1 wk 4 wk Age
h.p.i.0
5
10
15
20
8h 16h 24h 8h 16h 24h
1wk 4wk
0
5
10
15
20
Cor
rect
40-
Ct +
SE
M
Trachea
24 2416 1688
1 wk 4 wk Age
h.p.i.
1
10
100
0.1
0.018 16 24 8 16 24 h.p.i.
1 wk 4 wk
Gen
e ex
pre
ssio
n r
ate
(fol
d c
han
ge)
Lung
Age
1
10
100
0.1
0.018 16 24 8 16 24 h.p.i.
1 wk 4 wk
Gen
e ex
pre
ssio
n r
ate
(fol
d c
han
ge)
Lung
Age
h.p.i.
1
10
100
0.1
0.018 16 24 8 16 24
1 wk 4 wk
Gen
e ex
pre
ssio
n r
ate
(fol
d c
han
ge)
Trachea
Age
h.p.i.
1
10
100
0.1
0.018 16 24 8 16 24
1 wk 4 wk
Gen
e ex
pre
ssio
n r
ate
(fol
d c
han
ge)
Trachea
Age
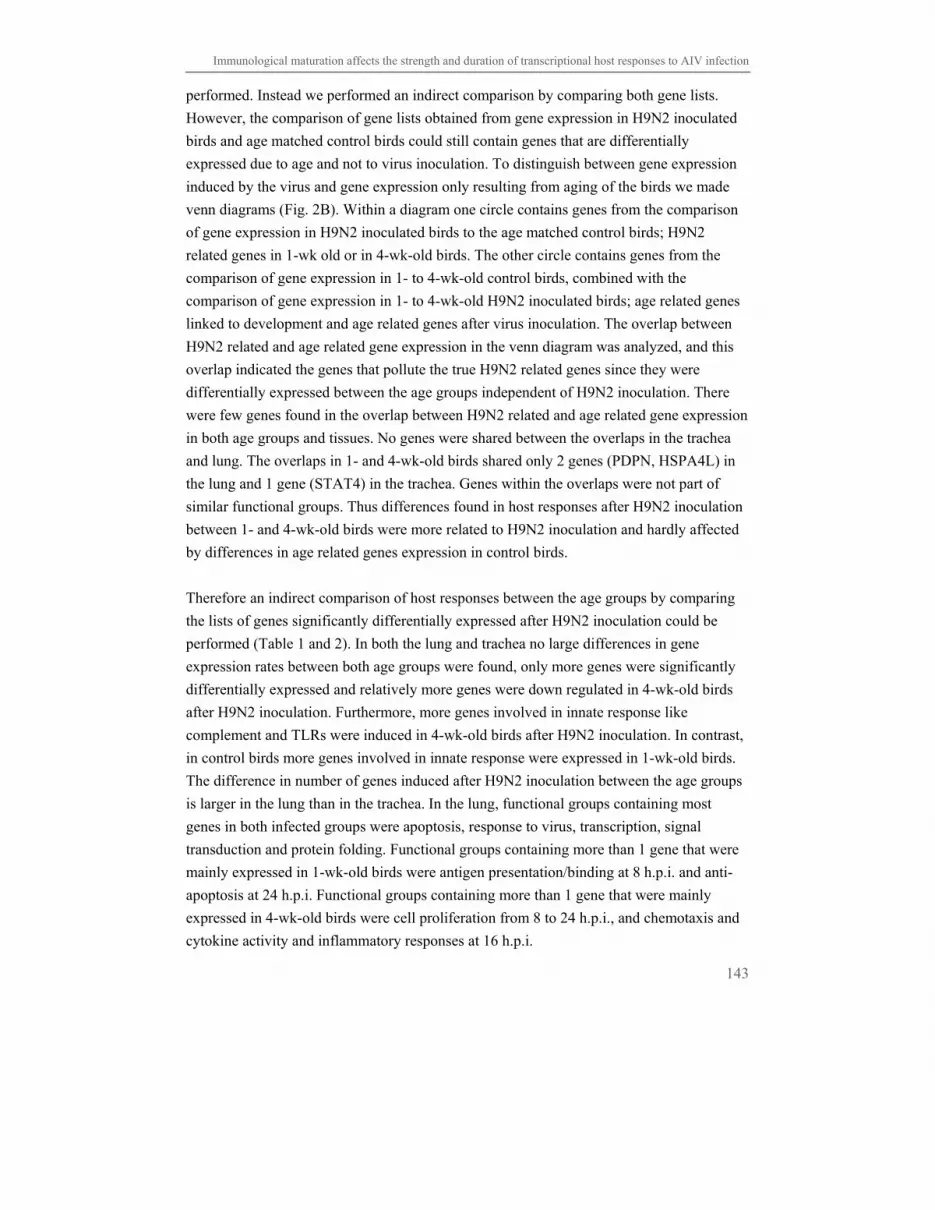
Immunological maturation affects the strength and duration of transcriptional host responses to AIV infection
143
performed. Instead we performed an indirect comparison by comparing both gene lists.
However, the comparison of gene lists obtained from gene expression in H9N2 inoculated
birds and age matched control birds could still contain genes that are differentially
expressed due to age and not to virus inoculation. To distinguish between gene expression
induced by the virus and gene expression only resulting from aging of the birds we made
venn diagrams (Fig. 2B). Within a diagram one circle contains genes from the comparison
of gene expression in H9N2 inoculated birds to the age matched control birds; H9N2
related genes in 1-wk old or in 4-wk-old birds. The other circle contains genes from the
comparison of gene expression in 1- to 4-wk-old control birds, combined with the
comparison of gene expression in 1- to 4-wk-old H9N2 inoculated birds; age related genes
linked to development and age related genes after virus inoculation. The overlap between
H9N2 related and age related gene expression in the venn diagram was analyzed, and this
overlap indicated the genes that pollute the true H9N2 related genes since they were
differentially expressed between the age groups independent of H9N2 inoculation. There
were few genes found in the overlap between H9N2 related and age related gene expression
in both age groups and tissues. No genes were shared between the overlaps in the trachea
and lung. The overlaps in 1- and 4-wk-old birds shared only 2 genes (PDPN, HSPA4L) in
the lung and 1 gene (STAT4) in the trachea. Genes within the overlaps were not part of
similar functional groups. Thus differences found in host responses after H9N2 inoculation
between 1- and 4-wk-old birds were more related to H9N2 inoculation and hardly affected
by differences in age related genes expression in control birds.
Therefore an indirect comparison of host responses between the age groups by comparing
the lists of genes significantly differentially expressed after H9N2 inoculation could be
performed (Table 1 and 2). In both the lung and trachea no large differences in gene
expression rates between both age groups were found, only more genes were significantly
differentially expressed and relatively more genes were down regulated in 4-wk-old birds
after H9N2 inoculation. Furthermore, more genes involved in innate response like
complement and TLRs were induced in 4-wk-old birds after H9N2 inoculation. In contrast,
in control birds more genes involved in innate response were expressed in 1-wk-old birds.
The difference in number of genes induced after H9N2 inoculation between the age groups
is larger in the lung than in the trachea. In the lung, functional groups containing most
genes in both infected groups were apoptosis, response to virus, transcription, signal
transduction and protein folding. Functional groups containing more than 1 gene that were
mainly expressed in 1-wk-old birds were antigen presentation/binding at 8 h.p.i. and anti-
apoptosis at 24 h.p.i. Functional groups containing more than 1 gene that were mainly
expressed in 4-wk-old birds were cell proliferation from 8 to 24 h.p.i., and chemotaxis and
cytokine activity and inflammatory responses at 16 h.p.i.

Chapter 7
144
Tab
le 1
. Im
mun
e re
late
d ge
nes
indu
ced
afte
r H
9N2
inoc
ulat
ion
in lu
ng o
f 1-
and
4-w
k-ol
d bi
rds
at 8
, 16
and
24 h
.p.i.
1-
wk-
old
4-
wk-
old
8
h.p.
i
16 h
.p.i.
24 h
.p.i.
8 h.
p.i
16
h.p
.i.
24
h.p
.i.
Func
tion
al g
roup
G
ene
Rat
io
G
ene
Rat
io
G
ene
Rat
io
G
ene
Rat
io
G
ene
Rat
io
G
ene
Rat
io
H
SP70
2.
06
H
SP90
B1
2.67
HSP
90B
1 0.
63
Ant
i-ap
opto
sis
H
SPA
5 2.
86
C
TSB
1.
48
A
ntig
en p
rese
ntat
ion/
bind
ing
M
HC
II
0.
62
B
CA
P29
1.82
DA
P 0.
75
F
ASL
1.
68
IAP
3.58
IAP
2.33
IAP
2.43
P
AK
2 1.
60
PD
CD
1 0.
64
TG
FB2
0.66
Apo
ptos
is
TG
FB3
0.57
Cal
cium
ion
bind
ing
F
AM
20C
0.
67
CT
NN
A1
0.76
M
SL
N
0.56
SD
C4
0.65
Cel
l adh
esio
n
SD
C4
2.13
Cel
l div
isio
n
SGO
L1
0.67
PB
EF1
2.
70
PB
EF1
2.
25
PCN
A
0.71
PCN
A
0.65
PD
L1
3.42
PDL
1 2.
66
PD
PN
0.54
PDPN
0.
64
PDPN
0.
47
Cel
l pro
life
rati
on
T
PX2
0.61
TPX
2 0.
56

Immunological maturation affects the strength and duration of transcriptional host responses to AIV infection
145
C
CL
i7
2.81
C
CR
L1
2.05
Che
mot
axis
and
cyt
okin
e ac
tivit
y
IL
18
3.06
C
1QB
2.
52
C
1S
1.52
Com
plem
ent
C
3AR
1 1.
87
Def
ense
res
pons
e
BP
I 1.
44
Dev
elop
men
t
IFIT
M5
1.66
M
YD
88
1.93
T
LR
1 1.
88
Infl
amm
ator
y re
spon
se
T
LR
3 2.
11
Inna
te i
mm
une
resp
onse
C
MA
P27
1.52
D
GK
E
2.99
Intr
acel
lula
r si
gnal
ling
SO
CS
1 6.
68
Man
nose
bin
ding
BS
G
1.53
Prot
ein
a.a.
dep
hosp
hory
lati
on
DU
SP1
0.62
FLN
29
2.46
FL
N29
2.
54
FL
N29
1.
82
PHF
11
3.43
PHF
11
2.82
PHF
11
2.60
Prot
ein
bind
ing
SH3Y
L1
0.64
D
NA
JA1
2.06
H
SC
70
2.38
HS
C70
1.
70
H
SP60
1.
85
H
SP60
1.
59
Prot
ein
fold
ing
H
SPA
4L
1.75
HSP
A4L
1.
44
Prot
ein
mod
ific
atio
n
O
AS
L
7.58
OA
SL
7.
89
O
AS
L
5.17
Prot
eoly
sis
C
TSL
1.
56
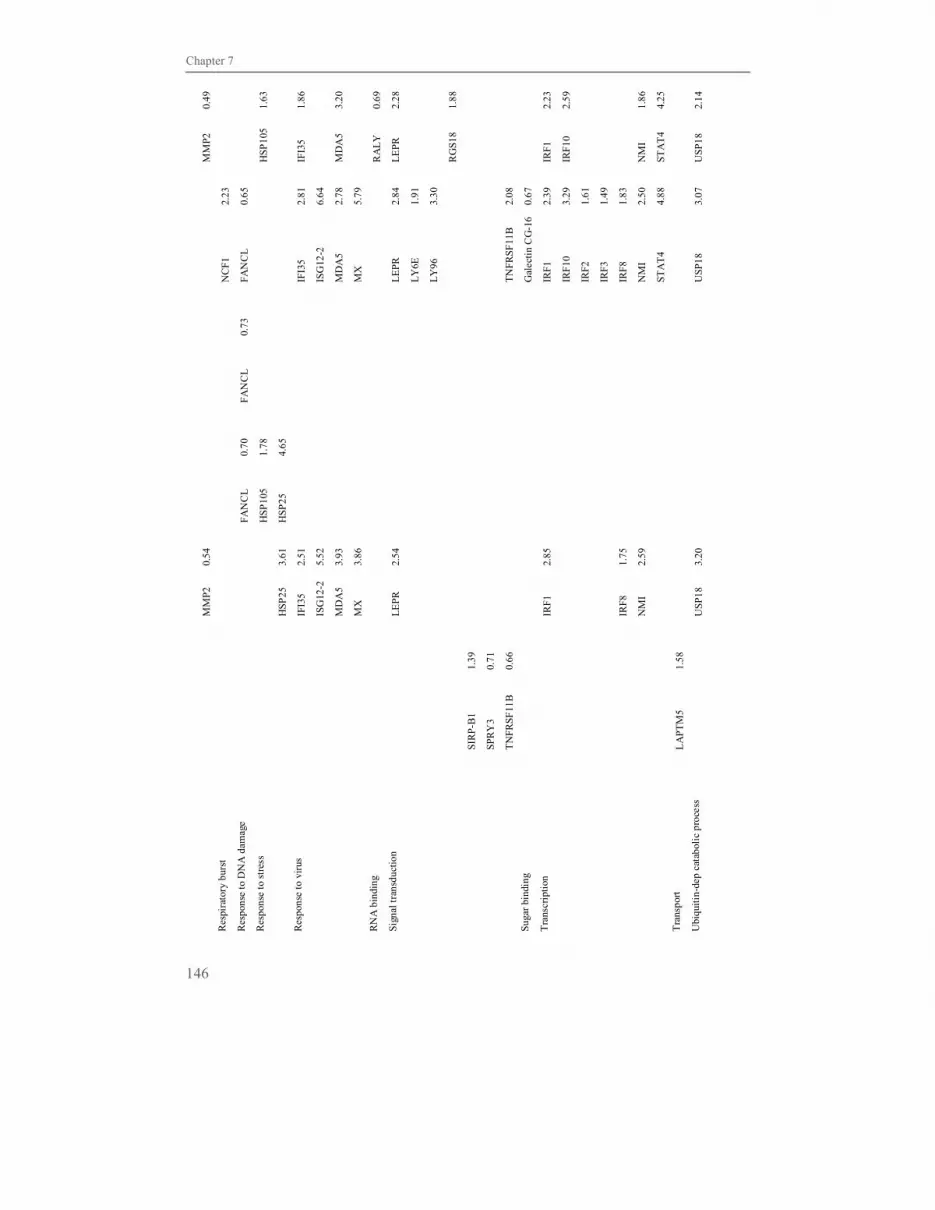
Chapter 7
146
M
MP2
0.
54
MM
P2
0.49
Res
pira
tory
bur
st
N
CF1
2.
23
Res
pons
e to
DN
A d
amag
e
FAN
CL
0.
70
F
AN
CL
0.
73
FA
NC
L
0.65
H
SP10
5 1.
78
H
SP10
5 1.
63
Res
pons
e to
str
ess
HSP
25
3.61
HSP
25
4.65
IFI3
5 2.
51
IF
I35
2.81
IFI3
5 1.
86
ISG
12-2
5.
52
IS
G12
-2
6.64
MD
A5
3.93
MD
A5
2.78
MD
A5
3.20
Res
pons
e to
vir
us
MX
3.
86
M
X
5.79
RN
A b
indi
ng
RA
LY
0.
69
LE
PR
2.54
LE
PR
2.
84
L
EPR
2.
28
L
Y6E
1.
91
L
Y96
3.
30
RG
S18
1.88
SI
RP-
B1
1.39
SP
RY
3 0.
71
Sign
al tr
ansd
uctio
n
T
NFR
SF11
B
0.66
T
NFR
SF11
B
2.08
Suga
r bi
ndin
g
Gal
ecti
n C
G-1
6 0.
67
IRF1
2.
85
IR
F1
2.39
IRF1
2.
23
IR
F10
3.29
IRF1
0 2.
59
IR
F2
1.61
IR
F3
1.49
IRF8
1.
75
IR
F8
1.83
NM
I 2.
59
N
MI
2.50
NM
I 1.
86
Tra
nscr
ipti
on
ST
AT
4 4.
88
ST
AT
4 4.
25
Tra
nspo
rt
L
APT
M5
1.58
Ubi
quit
in-d
ep c
atab
olic
pro
cess
U
SP18
3.
20
U
SP18
3.
07
U
SP18
2.
14

Immunological maturation affects the strength and duration of transcriptional host responses to AIV infection
147
Imm
une
rela
ted
gene
s si
gnif
ican
tly
diff
eren
tial
ly in
duce
d af
ter
H9N
2 in
ocul
atio
n in
lung
of
1- a
nd 4
-wk-
old
bird
s at
8, 1
6 an
d 24
h.p
.i. w
ere
dete
rmin
ed u
sing
MA
AN
OV
A. A
p-va
lue
< 0
.05
was
con
side
red
sign
ific
ant.
Rat
io r
epre
sent
s th
e fo
ld c
hang
e ex
pres
sion
rat
e in
H9N
2 in
ocul
ated
bir
ds c
ompa
red
to a
ge a
nd ti
me
mat
ched
con
trol
bir
ds. G
enes
are
divi
ded
into
fun
ctio
nal g
roup
s ba
sed
on G
O a
naly
sis
usin
g D
AV
ID.
Tab
le 2
. Im
mun
e re
late
d ge
nes
indu
ced
afte
r H
9N2
inoc
ulat
ion
in tr
ache
a of
1-
and
4-w
k-ol
d bi
rds
at 8
, 16
and
24 h
.p.i.
1-
wk-
old
4-w
k-ol
d
8
h.p.
i
16 h
.p.i.
24 h
.p.i.
8 h.
p.i
16
h.p
.i.
24
h.p
.i.
Fun
ctio
nal
gro
up
G
ene
Rat
io
G
ene
Rat
io
G
ene
Rat
io
G
ene
Rat
io
G
ene
Rat
io
G
ene
Rat
io
Act
ivat
ion
of M
AP
K a
ctiv
ity
C
1QT
NF
2 0.
58
H
SP
70
2.26
HS
P70
2.
05
H
SP
90B
1 1.
70
H
SP
A5
2.34
HS
PA
5 2.
89
BC
L2A
1 1.
81
C
IDE
A
0.
51
TR
AIL
1.
70
B c
ell m
arke
r
B
u-1
1.50
PCP4
0.
69
Cal
cium
ion
bind
ing
BR
I3B
P 0.
74
M
HC
B-G
0.
31
TN
IP3
1.85
Mis
cell
aneo
us
T
RA
F3IP
3 3.
04

Chapter 7
148
CD
34
0.60
C
D47
1.
34
CD
H28
0.
57
LG
AL
S3B
P
1.70
SDC
4 1.
83
Cel
l adh
esio
n
TIN
AG
0.
55
B
TG
1 1.
34
P
BE
F1
1.56
PBE
F1
2.26
Cel
l pro
life
rati
on
PDPN
0.
61
CC
Li7
8.
07
CC
Li7
2.
45
C
MT
M3
0.61
Che
mot
axis
and
cyt
okin
e ac
tivit
y
TR
AIL
-lik
e 0.
67
Com
plem
ent
C1S
1.
58
Def
ense
res
pons
e
L
YG
2.
35
Dev
elop
men
t
IF
ITM
5 2.
95
LY
86
0.59
MY
D88
1.
93
Infl
amm
ator
y re
spon
se
TL
R3
1.92
Intr
acel
lula
r si
gnal
ling
A
SB
9 0.
67
AS
B9
0.69
Lys
ozom
e or
gani
satio
n
PSA
P
1.40
Mis
cell
aneo
us
IGS
F3
0.55
Pro
tein
bin
ding
P
HF
11
2.71
PH
F11
2.
41
DN
AJA
1 1.
83
DN
AJB
9 1.
33
H
SC
70
2.04
HS
C70
2.
10
HS
P60
1.
76
Pro
tein
fol
ding
HS
PA
4L
1.63
Pro
tein
mod
ific
atio
n
O
AS
L
7.88

Immunological maturation affects the strength and duration of transcriptional host responses to AIV infection
149
Res
pira
tory
bur
st
NC
F1
1.82
H
SP10
5 1.
61
H
SP10
5 2.
24
HSP
25
3.22
Res
pons
e to
str
ess
RPS
6KA
1.
61
IFI3
5 2.
25
IRF3
1.
43
MD
A5
3.55
M
DA
5 2.
70
Res
pons
e to
vir
us
MX
3.
26
A
SB
2 0.
63
LE
PR
1.99
L
EP
R
1.69
LY
6E
2.36
MA
RC
O
1.59
Sign
al tr
ansd
uctio
n
SPR
Y2
0.71
Suga
r bi
ndin
g
CD
69
1.69
PD
L2
0.64
T c
ell
prol
ifer
atio
n
TIM
D4
1.37
IRF
1 2.
64
IRF
10
2.29
NA
RG
1 1.
54
NM
I 2.
50
SOC
S3
2.69
SO
CS
3 4.
51
Tra
nscr
ipti
on
STA
T4
4.20
ST
AT
4 3.
35
Ubi
quiti
n-de
p ca
tabo
lic
proc
ess
USP
18
3.32
Ves
icle
traf
fick
ing
CL
EC
3B
0.57
Mis
cell
aneo
us
IGSF
3 0.
55
Imm
une
rela
ted
gene
s si
gnif
ican
tly
diff
eren
tial
ly in
duce
d af
ter
H9N
2 in
ocul
atio
n in
trac
hea
of 1
- and
4-w
k-ol
d bi
rds
at 8
, 16
and
24 h
.p.i.
wer
e de
term
ined
usi
ng M
AA
NO
VA
.
A p
-val
ue <
0.0
5 w
as c
onsi
dere
d si
gnif
ican
t. R
atio
rep
rese
nts
the
fold
cha
nge
expr
essi
on r
ate
in H
9N2
inoc
ulat
ed c
ompa
red
to a
ge a
nd ti
me
mat
ched
con
trol
bir
ds. G
enes
are
divi
ded
into
fun
ctio
nal g
roup
s ba
sed
on G
O a
naly
sis
usin
g D
AV
ID.

Chapter 7
150
A.
B.
Figure 2. A) The number of global and immune related genes significantly differentially expressed after H9N2
inoculation in lung and trachea. Gene expression of H9N2 inoculated birds were compared to age and time
matched control birds (n = 4) using microarray analysis and significance was determined with MAANOVA
(p<0.05). B) Overlap between age related and H9N2 related gene expression in trachea and lung of both age
groups depicted in venn diagrams. The age related gene set consists of genes significantly differentially expressed
0 100 200 300
24
16
8
24
16
8
Tra
chea
Lung
No. genes significantly differentially expressed after infection
Global genes
0 100 200 300
24
16
8
24
16
8
Tra
chea
Lung
No. genes significantly differentially expressed after infection
Global genesh.p.i.
Lung 1 wk
66 7 37
Lung 1 wk
66 7 37
Lung 4 wk
64 9 59
Lung 4 wk
64 9 59
Trachea 1 wk
35 4 35
Trachea 1 wk
35 4 35
Trachea 4 wk
33 6 39
Trachea 4 wk
33 6 39
Age related
H9N2 related
Age related
H9N2 related
A+ B
CorD
A+ B
CorD
1 wk control 1 wk H9N2 infected
4 wk control 4 wk H9N2 infected
A B
C
D
1 wk control 1 wk H9N2 infected
4 wk control 4 wk H9N2 infected
A B
C
D
Venn diagram legend
0 20 40 60
24
16
8
24
16
8
Tra
chea
Lung
No. genes significantly differentially expressed after to infection
Immune related genes
0 20 40 60
24
16
8
24
16
8
Tra
chea
Lung
No. genes significantly differentially expressed after to infection
Immune related genesh.p.i.
Age:
1 wk
4 wk
Age:
1 wk
4 wk

Immunological maturation affects the strength and duration of transcriptional host responses to AIV infection
151
between 1- and 4-wk-old birds within a time point and treatment group in lung and trachea (comparison A+B; n =
4). The H9N2 related gene set consists of genes significantly differentially expressed between control and H9N2
inoculated birds within a time point and age group in lung and trachea (comparison C or D; n = 4). Gene sets were
obtained with microarray analysis and significance was determined using MAANOVA (p<0.05).
In the trachea, functional groups containing most genes in both 1- and 4-wk-old birds were
signal transduction and cell adhesion, but genes were expressed at different time points
(Table 2).
A functional group containing more than 1 gene that was mainly expressed in 1-wk-old
birds was response to virus at 16 h.p.i. However, at 16 h.p.i. no genes were significantly
differentially expressed after H9N2 inoculation in 4-wk-old birds, which seemed to be
caused by large variation within this group. Up regulation of genes related to response to
virus were seen at 16 h.p.i., but in individual birds and not consistent in the whole group. A
functional group containing more than 1 gene that was mainly expressed in 4-wk-old birds
was protein folding at 24 h.p.i.
Cytokine mRNA expression levels
Microarray analysis suggested IL-1β, IL-8 and IL-18 mRNA expression was up regulated
and IFN-α expression was not affected after H9N2 inoculation in 1- and 4-wk-old birds.
Although up regulation of IL-1β, IL-8 and IL-18 genes was rarely significant because of the
very strict microarray statistics that was applied, we did see an up regulation from 8 to 24
h.p.i. of up to 4-fold change compared to age matched control birds. The qRT-PCR data did
show a significant up regulation in H9N2 inoculated compared to control birds for IL-1β,
IL-8 and IL-18 in the lung and trachea of 1- and 4-wk-old birds at several time points (Fig.
3). In both the lung and trachea IFN-α mRNA expression was not significantly different
between H9N2 inoculated and control birds in both qRT-PCR and microarray data. The
difference in significances between microarray and qRT-PCR data are caused by
differences in the statistics that were used. Based on qRT-PCR and microarray analysis, IL-
1β, IL-8 and IL-18 mRNA expression in the lung and trachea was up regulated in a pattern
similar over time (data not shown). mRNA expression in 1-wk-old birds peaked at 16 h.p.i.,
whereas it peaked in 4-wk-old birds at 24 h.p.i.
To determine whether mRNA expression was related to viral RNA expression, correlation
coefficients were calculated between viral RNA expression and cytokine mRNA expression
in both the lung and trachea. We first determined this correlation for all cytokines per age
group over time, because if a correlation between cytokine mRNA and viral RNA
expression is found, this means they correlate at every time point. In 1-wk-old birds there
was a significant strong positive correlation between viral RNA expression and mRNA
expression of IL-1β, IL-8, IL-18 and IFN-α in the lung and mRNA expression of IL-1β,
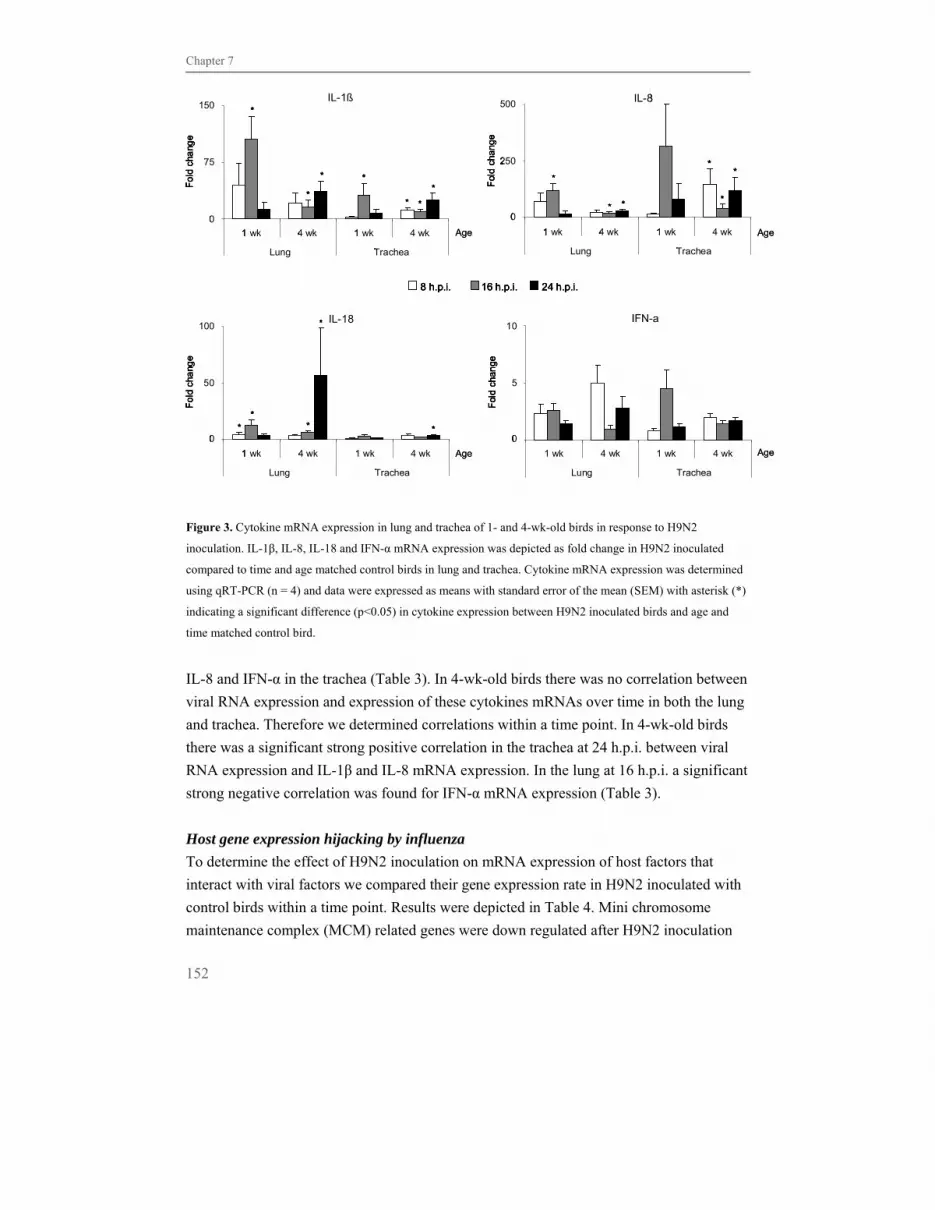
Chapter 7
152
Figure 3. Cytokine mRNA expression in lung and trachea of 1- and 4-wk-old birds in response to H9N2
inoculation. IL-1β, IL-8, IL-18 and IFN-α mRNA expression was depicted as fold change in H9N2 inoculated
compared to time and age matched control birds in lung and trachea. Cytokine mRNA expression was determined
using qRT-PCR (n = 4) and data were expressed as means with standard error of the mean (SEM) with asterisk (*)
indicating a significant difference (p<0.05) in cytokine expression between H9N2 inoculated birds and age and
time matched control bird.
IL-8 and IFN-α in the trachea (Table 3). In 4-wk-old birds there was no correlation between
viral RNA expression and expression of these cytokines mRNAs over time in both the lung
and trachea. Therefore we determined correlations within a time point. In 4-wk-old birds
there was a significant strong positive correlation in the trachea at 24 h.p.i. between viral
RNA expression and IL-1β and IL-8 mRNA expression. In the lung at 16 h.p.i. a significant
strong negative correlation was found for IFN-α mRNA expression (Table 3).
Host gene expression hijacking by influenza
To determine the effect of H9N2 inoculation on mRNA expression of host factors that
interact with viral factors we compared their gene expression rate in H9N2 inoculated with
control birds within a time point. Results were depicted in Table 4. Mini chromosome
maintenance complex (MCM) related genes were down regulated after H9N2 inoculation
0
5
10
1wk 4wk 1wk 4wk
Lung Trachea
1 wk 4 wk 1 wk 4 wk
Lung Trachea
10
5
0
Fol
d c
hang
e
IFN-a
0
5
10
1wk 4wk 1wk 4wk
Lung Trachea
1 wk 4 wk 1 wk 4 wk
Lung Trachea
10
5
0
Fol
d c
hang
e
IFN-a
0
50
100
1wk 4wk 1wk 4wk
Lung Trachea
1 wk 4 wk 1 wk 4 wk
Lung Trachea
100
50
0
Fol
d ch
ang
e
IL-18
**
*
*
*0
50
100
1wk 4wk 1wk 4wk
Lung Trachea
1 wk 4 wk 1 wk 4 wk
Lung Trachea
100
50
0
Fol
d ch
ang
e
IL-18
**
*
*
*
0
250
500
1wk 4wk 1wk 4wk
Lung Trachea
1 wk 4 wk 1 wk 4 wk
Lung Trachea
500
250
0
Fol
d c
hang
e
IL-8
*
* *
*
*
*
0
250
500
1wk 4wk 1wk 4wk
Lung Trachea
1 wk 4 wk 1 wk 4 wk
Lung Trachea
500
250
0
Fol
d c
hang
e
IL-8
*
* *
*
*
*
0
75
150
1wk 4wk 1wk 4wk
Lung Trachea
1 wk 4 wk 1 wk 4 wk
Lung Trachea
150
75
0
Fol
d ch
ang
e
IL-1ß
*
*
* *
* *
*
0
75
150
1wk 4wk 1wk 4wk
Lung Trachea
1 wk 4 wk 1 wk 4 wk
Lung Trachea
150
75
0
Fol
d ch
ang
e
IL-1ß
*
*
* *
* *
*
IFN-aIL-18
IL-8IL-1ß
Age
Age Age
Age
8 h.p.i. 16 h.p.i. 24 h.p.i.8 h.p.i. 16 h.p.i. 24 h.p.i.
0
5
10
1wk 4wk 1wk 4wk
Lung Trachea
1 wk 4 wk 1 wk 4 wk
Lung Trachea
10
5
0
Fol
d c
hang
e
IFN-a
0
5
10
1wk 4wk 1wk 4wk
Lung Trachea
1 wk 4 wk 1 wk 4 wk
Lung Trachea
10
5
0
Fol
d c
hang
e
IFN-a
0
50
100
1wk 4wk 1wk 4wk
Lung Trachea
1 wk 4 wk 1 wk 4 wk
Lung Trachea
100
50
0
Fol
d ch
ang
e
IL-18
**
*
*
*0
50
100
1wk 4wk 1wk 4wk
Lung Trachea
1 wk 4 wk 1 wk 4 wk
Lung Trachea
100
50
0
Fol
d ch
ang
e
IL-18
**
*
*
*
0
250
500
1wk 4wk 1wk 4wk
Lung Trachea
1 wk 4 wk 1 wk 4 wk
Lung Trachea
500
250
0
Fol
d c
hang
e
IL-8
*
* *
*
*
*
0
250
500
1wk 4wk 1wk 4wk
Lung Trachea
1 wk 4 wk 1 wk 4 wk
Lung Trachea
500
250
0
Fol
d c
hang
e
IL-8
*
* *
*
*
*
0
75
150
1wk 4wk 1wk 4wk
Lung Trachea
1 wk 4 wk 1 wk 4 wk
Lung Trachea
150
75
0
Fol
d ch
ang
e
IL-1ß
*
*
* *
* *
*
0
75
150
1wk 4wk 1wk 4wk
Lung Trachea
1 wk 4 wk 1 wk 4 wk
Lung Trachea
150
75
0
Fol
d ch
ang
e
IL-1ß
*
*
* *
* *
*
IFN-aIL-18
IL-8IL-1ß
Age
Age Age
Age
8 h.p.i. 16 h.p.i. 24 h.p.i.8 h.p.i. 16 h.p.i. 24 h.p.i.

Immunological maturation affects the strength and duration of transcriptional host responses to AIV infection
153
while other genes affected by H9N2 inoculation were up regulated. MCM2 and MCM4
were down regulated after H9N2 inoculation at an early stage at 8-16 h.p.i. in the lung of
both 1- and 4-wk-old birds and the trachea of 1-wk-old birds. Interferon-induced GTP-
binding protein Mx (MX) was up regulated at 16 h.p.i. in the lung of 1- and 4-wk-old birds
and in the trachea of 1-wk-old birds. HSP70 and HSC70 were both up regulated in a later
stage after H9N2 inoculation at 24 h.p.i. in both the lung and trachea of 1- and 4-wk-old
birds. The effect of H9N2 inoculation on expression of these genes was independent of age
and organ. DEAD box helicase related genes DDX3, DDX18 and DDX50 were only up
regulated in the trachea of 4-wk-old birds at 24 h.p.i., while in 1-wk-old birds or in the lung
expression of DDX genes were not affected by H9N2 inoculation. Expression of other
genes coding for host factors known to bind to viral factors and being involved in influenza
virus replication like importins (or karyopherin), SFPQ/CPSF, core histones, RACK I and
ERK were not significantly differentially expressed. Genes coding for other host factors
that play a role in influenza virus replication like CRM1 (exportin-1), BAT1/UAP56
(DEAD-box helicase), NXP-2, RanBP5, eIF-4GI, PAB II, Tat-SF1 were not annotated on
this microarray.
Discussion
Previous studies have shown age-dependent development of resistance to infection in both
mammals and birds (Hume et al., 1998, Mukiibi-Muka et al., 1999, Velilla et al., 2006). In
mammals neonatal immune responses seem to be dominated by T helper cell type 2
(Adkins, 1999), with for example reduced numbers of dendritic cells and impaired antigen-
presenting cell (APC) function (Velilla et al., 2006). In birds the genetic background also
plays an important role in susceptibility to pathogens like Salmonella enterica. However, at
young age both susceptible and resistant lines were highly susceptible to infection (Beal et
al., 2005). Here we describe the differences in gene expression in early host responses to
AIV in the respiratory tract between 1- and 4-wk-old birds and investigated the effect of
age on gene expression of cellular host factors that interact with viral factors of which some
are needed for viral replication.
Before we compared virus-induced host responses between 1- and 4-wk-old birds we
determined the effect of age on gene expression in control birds. Differences in gene
expression between 1- and 4-wk-old control birds mainly related to tissue developmental
processes and immune related functional groups. Most of these immune related genes were
expressed in a higher rate in 4- compared to 1-wk-old control birds and most likely related
to the higher number of leukocytes present in the respiratory tract of 4-wk-old birds. Genes
expressed at higher rate in 1-wk-old birds are likely an indication for the ongoing
development of the respiratory immune system. Genes involved in innate immune

Chapter 7
154
IL
-1β
IL
-8
IL
-18
IF
N-α
Tis
sue
Age
T
ime
(h.p
.i.)
r p
r
p
r p
r
p
1 w
k 8,
16,
24
0.
95
1.92
E-0
6
0.94
5.
90E
-06
0.
87
2.40
E-0
4
0.59
0.
042
Lun
g 4
wk
16
-
-
-
-0
.96
0.03
4
1 w
k 8,
16,
24
0.
58
0.04
7
0.65
0.
023
-
0.61
0.
036
Tra
chea
4
wk
24
0.99
0.
014
0.
97
0.03
4
-
-
Cor
rela
tion
s be
twee
n vi
ral R
NA
and
cyt
okin
e m
RN
A e
xpre
ssio
n w
ere
base
d on
the
Pea
rson
cor
rela
tion
coe
ffic
ient
(r)
and
det
erm
ined
usi
ng S
PSS
15.
0 so
ftw
are.
A p
-val
ue f
or
2-ta
iled
sig
nifi
canc
e (p
) <
0.0
5 w
as c
onsi
dere
d si
gnif
ican
t.
Tab
le 4
. Eff
ect o
f H9N
2 in
ocul
atio
n on
gen
e ex
pres
sion
of
prot
eins
that
can
inte
ract
wit
h in
flue
nza
viru
s in
lung
and
trac
hea
of 1
- and
4-w
k-ol
d bi
rds
at 8
, 16
and
24 h
.p.i.
Lun
g T
rach
ea
1 w
k 4
wk
1 w
k 4
wk
Age
H
ost
fact
or
Inte
ract
ing
vira
l fa
ctor
P
ropo
sed
func
tion
H
ost
fact
or
chic
ken
8 16
24
8
16
24
8 16
24
8
16
24
h.p
.i.
Kar
yoph
erin
-α 2
-β
NP
Nuc
lear
impo
rt v
RN
P K
PNA
2 -
- -
- -
- -
- -
- -
-
MxA
N
P In
hibi
t nuc
lear
impo
rt v
RN
P M
X
- ↑
- -
↑ -
- ↑
- -
- -
ER
K
M1
E
RK
-
- -
- -
- -
- -
- -
-
RA
CK
1 M
1 M
1 ph
osph
oryl
atio
n R
AC
K1
- -
- -
- -
- -
- -
- -
Hsp
70
NP/
RN
P N
ucle
ar e
xpor
t vR
NP
H
sp70
-
- ↑
- -
- -
- ↑
- -
↑
Hsc
70
M1
Inhi
bit n
ucle
ar e
xpor
t, vR
NP,
M1,
NP
Hsc
70
- -
↑ -
- ↑
- -
↑ -
- ↑
CPS
F4
- -
- -
- -
- -
- -
- -
CPS
F5
- -
- -
- -
- -
- -
- -
SFPQ
/CPS
F N
S1
Inhi
bits
nuc
lear
exp
ort c
ellu
lar
mR
NA
s, n
ot v
iral
mR
NA
s
CPS
F6
- -
- -
- -
- -
- -
- -
Tab
le 3
. Sig
nifi
cant
cor
rela
tion
s be
twee
n vi
ral R
NA
exp
ress
ion
and
cyto
kine
mR
NA
exp
ress
ion
in lu
ng a
nd tr
ache
a of
1-
and
4-w
k-ol
d bi
rds
at 8
, 16
and
24 h
.p.i.
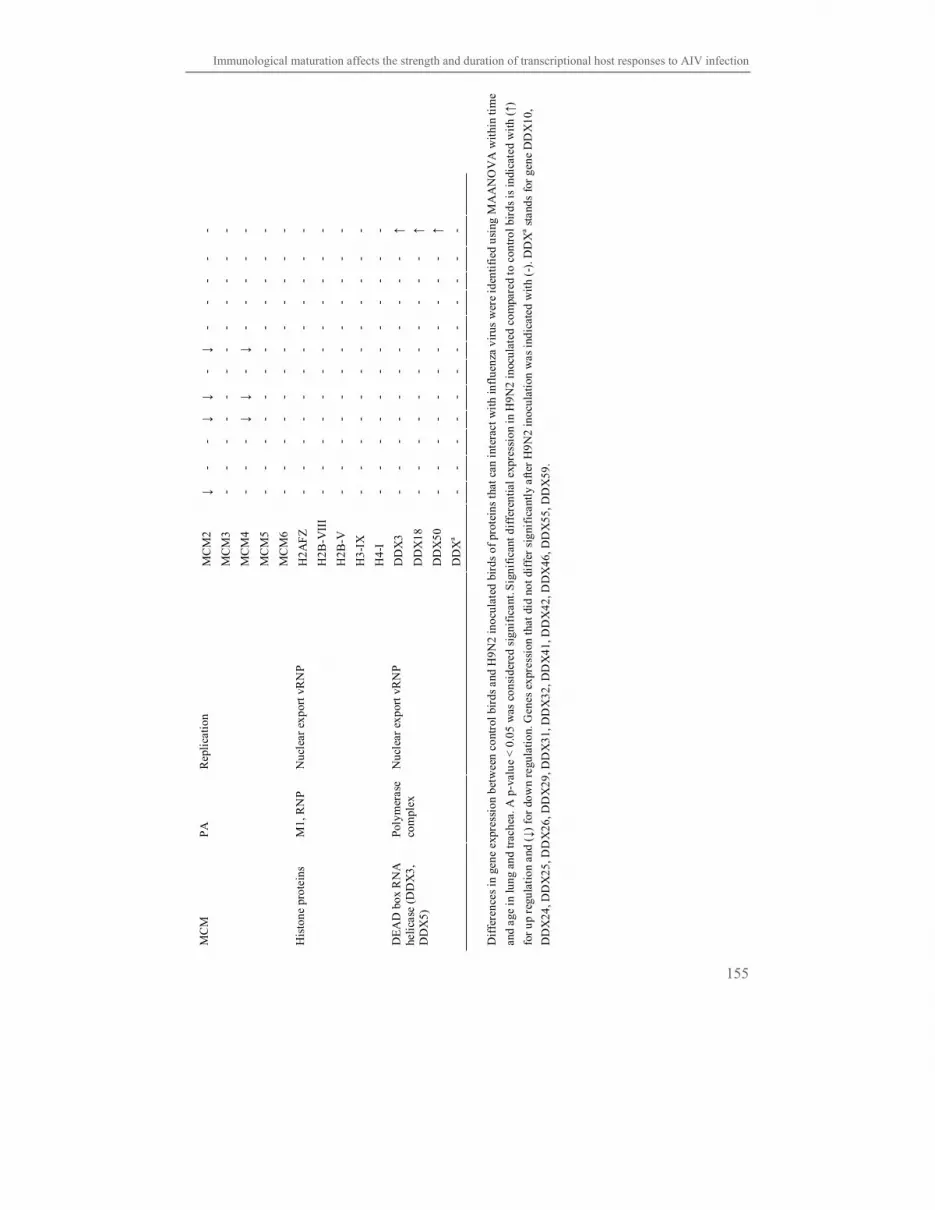
Immunological maturation affects the strength and duration of transcriptional host responses to AIV infection
155
MC
M2
↓ -
- ↓
↓ -
↓ -
- -
- -
MC
M3
- -
- -
- -
- -
- -
- -
MC
M4
- -
- ↓
↓ -
↓ -
- -
- -
MC
M5
- -
- -
- -
- -
- -
- -
MC
M
PA
R
epli
cati
on
MC
M6
- -
- -
- -
- -
- -
- -
H2A
FZ
-
- -
- -
- -
- -
- -
-
H2B
-VII
I -
- -
- -
- -
- -
- -
-
H2B
-V
- -
- -
- -
- -
- -
- -
H3-
IX
- -
- -
- -
- -
- -
- -
His
tone
pro
tein
s M
1, R
NP
Nuc
lear
exp
ort v
RN
P
H4-
I -
- -
- -
- -
- -
- -
-
DD
X3
- -
- -
- -
- -
- -
- ↑
DD
X18
-
- -
- -
- -
- -
- -
↑
DD
X50
-
- -
- -
- -
- -
- -
↑
DE
AD
box
RN
A
heli
case
(D
DX
3,
DD
X5)
Poly
mer
ase
com
plex
N
ucle
ar e
xpor
t vR
NP
DD
Xa
- -
- -
- -
- -
- -
- -
Dif
fere
nces
in g
ene
expr
essi
on b
etw
een
cont
rol b
irds
and
H9N
2 in
ocul
ated
bir
ds o
f pr
otei
ns th
at c
an in
tera
ct w
ith
infl
uenz
a vi
rus
wer
e id
enti
fied
usi
ng M
AA
NO
VA
wit
hin
tim
e
and
age
in lu
ng a
nd tr
ache
a. A
p-v
alue
< 0
.05
was
con
side
red
sign
ific
ant. S
igni
fica
nt d
iffe
rent
ial e
xpre
ssio
n in
H9N
2 in
ocul
ated
com
pare
d to
con
trol
bir
ds is
indi
cate
d w
ith
(↑)
for
up r
egul
atio
n an
d (↓
) fo
r do
wn
regu
lati
on. G
enes
exp
ress
ion
that
did
not
dif
fer
sign
ific
antl
y af
ter
H9N
2 in
ocul
atio
n w
as in
dica
ted
wit
h (-
). D
DX
a sta
nds
for
gene
DD
X10
,
DD
X24
, DD
X25
, DD
X26
, DD
X29
, DD
X31
, DD
X32
, DD
X41
, DD
X42
, DD
X46
, DD
X55
, DD
X59
.

Chapter 7
156
responses were also higher expressed in 1-wk-old control birds and may indicate that
protective responses in young birds are more dependent on innate responses (Levy, 2007).
In the trachea less genes were significantly differentially expressed between 1- and 4-wk-
old control birds compared to the lung. For the trachea constitutive lymphoid tissue has not
been described unlike for the lung (Kothlow et al., 2008), which would explain the lower
number of differentially expressed genes between 1- and 4-wk-old control birds.
Difference in virus deposition within the respiratory tract has an influence on gene
expression (Baas et al., 2006, Reemers et al., 2009b). Since no significant differences in
viral RNA expression were found between 1- and 4-wk-old birds, differences in gene
expression after H9N2 inoculation are caused by differences in host response between the
age groups. We showed that these differences were not influenced by differences in gene
expression between the age groups in control birds and are thus directly related to H9N2
inoculation.
Although genes involved in innate responses were expressed at higher rate in 1-wk-old
control birds, after H9N2 inoculation genes involved in innate responses were more
induced in 4-wk-old birds. In the lung, more genes related to cell proliferation, chemotaxis
and cytokine activity, inflammatory response and transcription were expressed in 4-wk-old
birds. This suggests a different host response at transcriptional level in 1- compared to 4-
wk-old birds likely relating to age-related differences in immune responses. APC play an
important role during innate immune responses. Neonatal APC from mice and humans have
been reported to be less effective in supporting proliferation of T cells (Petty et al., 1998)
probably due to lower expression of MHCI, MHCII and costimulatory molecules (Hunt et
al., 1994). Furthermore, they are defective in cytokine production upon LPS stimulation or
influenza virus infection (Chelvarajan et al., 2004, Zhou et al., 2006) and require a higher
level of activation than adult APC (Petty et al., 1998), which has been proposed to be due to
defects in TLR signalling (De Wit et al., 2003, Velilla et al., 2006). In our study MHCI and
MHCII were less expressed in 1-wk-old birds which might suggest a similar immaturity of
APC as found in mice. Cytokine genes and TLR signalling related genes were more
expressed in 4-wk-old birds, while MHCII was down regulated in 1-wk-old birds after
H9N2 inoculation relating to functional impairment described for mammalian APC.
In the trachea the largest and clearest differences between 1- and 4-wk-old birds were the
time points of expression and the number of genes expressed, but no large differences
between functional groups were found, unlike in the lung. This possibly indicates that
maturity of the respiratory immune system has less effect on the trachea than on the lung
correlating with the lack of constitutive lymphoid tissue which has not been described in
the avian trachea so far.
Elevated expression levels of inflammatory cytokines and chemokines due to influenza
infection have been reported as early as 6 h.p.i. depending on the influenza strain (Julkunen
Immunological maturation affects the strength and duration of transcriptional host responses to AIV infection
157
et al., 2001, Chan et al., 2005). Also in this study up regulation of IL-1β, IL-8 and IL-18
mRNA expression was found after H9N2 inoculation in both age groups. The level of viral
RNA expression correlated with the mRNA expression levels of IL-1β, IL-8, IL-18 and
IFN-α over time in 1-wk-old birds, but for 4-wk-old birds correlation was only seen at later
time points after H9N2 inoculation. Although the mean IFN-α mRNA expression was not
significantly up regulated, there were correlations between viral RNA en IFN-α mRNA
expression for individual birds at both 1- and 4-wk of age. These data indicate that
induction of gene expression of inflammatory cytokines and chemokines after H9N2
inoculation is more related to viral load in 1-wk-old birds compared to 4-wk-old birds.
Influenza viral proteins bind to several mammalian host proteins which promote viral
replication or induce host responses (Engelhardt et al., 2006, Naffakh et al., 2008, Nagata et
al., 2008). MCM2 and MCM4 are part of the minichromosome maintenance complex
which is proposed to activate virus genome replication at the early phase of infection when
there is no newly synthesised NP present (Nagata et al., 2008). These genes were down
regulated early after H9N2 inoculation which may be an attempt of the host to block viral
replication. At 16 h.p.i. blocking of viral replication is possibly enhanced by up regulation
of MX, which for humans binds to viral NP and this binding likely prevents nuclear import
of incoming vRNP (Turan et al., 2004, Naffakh et al., 2008). In the chicken some MX
proteins are found to have a similar inhibitory function while others do not depend on breed
and virus strain, for which a possible explanation is the high polymorphism in the chicken
MX gene (Ko et al., 2002, Benfield et al., 2008). For chickens HSP70 and HSC70 were up
regulated at 24 h.p.i. possibly preventing assembly of new virions, since HSP70 prevents
binding of viral M1 to vRNP (Hirayama et al., 2004) and HSC70 binds to viral M1 (Nagata
et al., 2008) resulting in inhibition of nuclear export. A common response of the host to
block viral replication seemed to occur, because gene expression of MCMs, MX, HSP70
and HSC70 was regulated independent of age and tissue. Interestingly DDX3, DDX18 and
DDX50 were only up regulated in the trachea of 4-wk-old birds at 24 h.p.i. when newly
assembled RNPs are exported to be packaged into progeny virions. The influenza
polymerase complex is known to interact with DDX3, which plays an important role in
RNA nuclear export and cytoplasmic mRNA localisation (Jorba et al., 2008), promotes
export of HIV-1 RNAs from the nucleus to cytoplasm (Ishaq et al., 2008) and is required
for HCV RNA replication (Ariumi et al., 2007). This may indicate that DDX is needed for
influenza virus replication at a later stage after virus inoculation when newly assembled
RNPs are exported to be packaged into progeny virions and expression is possibly age and
tissue related.
In summary, gene expression in control birds and host responses to AIV inoculation in the
trachea and especially the lung are correlated with the development and maturation of the
respiratory immune system. Differences in immune related gene expression after H9N2

Chapter 7
158
inoculation in the lung can be related to the higher levels of stimulation needed to activate
neonatal host responses and age-dependent functionality of leukocytes. However,
expression of most cellular host factors that block viral replication by interacting with viral
factors is independent of age. These findings suggest that the strength of virus-induced host
responses is affected by maturation of the respiratory immune system and may be a key
factor in age-dependent host responses to infection. However, the differences found at
transcriptional level were not yet translated to differences in viral load between the age
groups, due to the time frame in which we measured the responses. This study shows
multiple factors could be involved in neonatal impaired response, such as functional
impairment APC, NK cells and T cells and more research into the contribution of these
factors is needed to get a better understanding of the functional capability of the neonatal
immune system and the relation to susceptibility.
Acknowledgements
We thank Christine Jansen and Eveline de Geus from the department of Infectious Diseases
and Immunology of the Faculty of Veterinary Medicine Utrecht for their technical
assistance, Cheuk Ko, Sander van Hooff and Patrick van Kemmeren from the Genomics
Laboratory, UMC Utrecht for performing the microarrays and bioinformatical assistance.
This work was supported by a BSIK VIRGO consortium grant (Grant no. 03012), The
Netherlands.
References
1. Adkins, B., 1999. T-cell function in newborn mice and humans. Immunol. Today. 20, 330-335.
2. Ariumi, Y., Kuroki, M., Abe, K., Dansako, H., Ikeda, M., Wakita, T., Kato, N., 2007. DDX3 DEAD-
box RNA helicase is required for hepatitis C virus RNA replication. J. Virol. 81, 13922-13926.
3. Baas, T., Baskin, C.R., Diamond, D.L., Garcia-Sastre, A., Bielefeldt-Ohmann, H., Tumpey, T.M.,
Thomas, M.J., Carter, V.S., Teal, T.H., Van Hoeven, N., Proll, S., Jacobs, J.M., Caldwell, Z.R.,
Gritsenko, M.A., Hukkanen, R.R., Camp, D.G. 2nd, Smith, R.D., Katze, M.G., 2006. Integrated
molecular signature of disease: analysis of influenza virus-infected macaques through functional
genomics and proteomics. J. Virol. 80, 10813-10828.
4. Beal, R.K., Powers, C., Wigley, P., Barrow, P.A., Kaiser, P., Smith, A.L., 2005. A strong antigen-
specific T-cell response is associated with age and genetically dependent resistance to avian enteric
salmonellosis. Infect. Immun. 73, 7509-7516.
5. Benfield, C.T., Lyall, J.W., Kochs, G., Tiley, L.S., 2008. Asparagine 631 variants of the chicken Mx
protein do not inhibit influenza virus replication in primary chicken embryo fibroblasts or in vitro
surrogate assays. J. Virol. 82, 7533-7539.
6. Chan, M.C., Cheung, C.Y., Chui, W.H., Tsao, S.W., Nicholls, J.M., Chan, Y.O., Chan, R.W., Long,
H.T., Poon, L.L., Guan, Y., Peiris, J.S., 2005. Proinflammatory cytokine responses induced by
influenza A (H5N1) viruses in primary human alveolar and bronchial epithelial cells. Respir. Res. 6,
135-147.
Immunological maturation affects the strength and duration of transcriptional host responses to AIV infection
159
7. Chelvarajan, R.L., Collins, S.M., Doubinskaia, I.E., Goes, S., Van Willigen, J., Flanagan, D., De
Villiers, W.J., Bryson, J.S., Bondada, S., 2004. Defective macrophage function in neonates and its
impact on unresponsiveness of neonates to polysaccharide antigens. J. Leukoc. Biol. 75, 982-994.
8. De Wit, D., Tonon, S., Olislagers, V., Goriely, S., Boutriaux, M., Goldman, M., Willems, F., 2003.
Impaired responses to toll-like receptor 4 and toll-like receptor 3 ligands in human cord blood. J.
Autoimmun. 21, 277-281.
9. Engelhardt, O.G., Fodor, E., 2006. Functional association between viral and cellular transcription
during influenza virus infection. Rev. Med. Virol. 16, 329-345.
10. Fagerland, J.A., Arp, L.H., 1993. Structure and development of bronchus-associated lymphoid tissue in
conventionally reared broiler chickens. Avian Dis. 37, 10-18.
11. Gasparoni, A., Ciardelli, L., Avanzini, A., Castellazzi, A.M., Carini, R., Rondini, G., Chirico, G., 2003.
Age-related changes in intracellular TH1/TH2 cytokine production, immunoproliferative T lymphocyte
response and natural killer cell activity in newborns, children and adults. Biol. Neonate 84, 297-303.
12. Gaunson, J.E., Philip, C.J., Whithear, K.G., Browning, G.F., 2006. The cellular immune response in the
tracheal mucosa to Mycoplasma gallisepticum in vaccinated and unvaccinated chickens in the acute
and chronic stages of disease. Vaccine 24, 2627-2633.
13. Hirayama, E., Atagi, H., Hiraki, A., Kim, J., 2004. Heat shock protein 70 is related to thermal
inhibition of nuclear export of the influenza virus ribonucleoprotein complex. J. Virol. 78, 1263-1270.
14. Hume, M.E., Byrd, J.A., Stanker, L.H., Ziprin, R.L., 1998. Reduction of caecal Listeria monocytogenes
in Leghorn chicks following treatment with a competitive exclusion culture (PREEMPT). Lett. Appl.
Microbiol. 26, 432-436.
15. Hunt, D.W., Huppertz, H.I., Jiang, H.J., Petty, R.E., 1994. Studies of human cord blood dendritic cells:
evidence for functional immaturity. Blood. 84, 4333-4343.
16. Ishaq, M., Hu, J., Wu, X., Fu, Q., Yang, Y., Liu, Q., Guo, D., 2008. Knockdown of cellular RNA
helicase DDX3 by short hairpin RNAs suppresses HIV-1 viral replication without inducing apoptosis.
Mol. Biotechnol. 39, 231-238.
17. Jeurissen, S.H., Janse, E.M., Koch, G., De Boer, G.F., 1989. Postnatal development of mucosa-
associated lymphoid tissues in chickens. Cell Tissue Res. 258, 119-124.
18. Jorba, N., Juarez, S., Torreira, E., Gastaminza, P., Zamarreño, N., Albar, J.P., Ortín, J., 2008. Analysis
of the interaction of influenza virus polymerase complex with human cell factors. Proteomics 8, 2077-
2088.
19. Julkunen, I., Sareneva, T., Pirhonen, J., Ronni, T., Melen, K., Matikainen, S., 2001. Molecular
pathogenesis of influenza A virus infection and virus-induced regulation of cytokine gene expression.
Cytokine Growth Factor Rev. 12, 171-180.
20. Ko, J.H., Jin, H.K., Asano, A., Takada, A., Ninomiya, A., Kida, H., Hokiyama, H., Ohara, M., Tsuzuki,
M., Nishibori, M., Mizutani, M., Watanabe, T., 2002. Polymorphisms and the differential antiviral
activity of the chicken Mx gene. Genome Res. 12, 595-601.
21. Kodama, H,, Sato, G., Mikami, T., 1976. Age-dependent resistance of chickens to salmonella in vitro:
phagocytic and bactericidal activities of splenic phagocytes. Am. J. Vet. Res. 37, 1091-1094.
22. Kogut, M., Rothwell, L., Kaiser, P., 2002. Differential effects of age on chicken heterophil functional
activation by recombinant chicken interleukin-2. Dev. Comp. Immunol. 26, 817-830.
23. Kothlow, S., Kaspers, B., 2008. The avian respiratory immune system. In: Davison, F., Kaspers, B.,
Schat, K. (Eds.), Avian Immunology, 1st ed. Academic Press, London, pp. 273-288.
24. Levy, O., 2007. Innate immunity of the newborn: basic mechanisms and clinical correlates. Nat. Rev.
Immunol. 7, 379-390.
25. Lowenthal, J.W., Connick, T.E., McWaters, P.G., York, J.J., 1994. Development of T cell immune
responsiveness in the chicken. Immunol. Cell Biol. 72, 115-122.
Chapter 7
160
26. Mast, J., Goddeeris, B.M., 1999. Development of immunocompetence of broiler chickens. Vet.
Immunol. Immunopathol. 70, 245-256.
27. Matthijs, M.G., Ariaans, M.P., Dwars, R.M., Van Eck, J.H., Bouma, A., Stegeman, A., Vervelde, L.,
2009. Course of infection and immune responses in the respiratory tract of IBV infected broilers after
superinfection with E. coli. Vet. Immunol. Immunopathol. 127, 77-84.
28. Moyron-Quiroz, J.E., Rangel-Moreno, J., Kusser, K., Hartson, L., Sprague, F., Goodrich, S.,
Woodland, D.L., Lund, F.E., Randall, T.D., 2004 Role of inducible bronchus associated lymphoid
tissue (iBALT) in respiratory immunity. Nat. Med. 10, 927-934.
29. Mukiibi-Muka, G., Jones, R. C., 1999. Local and systemic IgA and IgG responses of chicks to avian
reoviruses: effects of age of chick, route of infection and virus strain. Avian Pathol. 28, 54-60.
30. Naffakh, N., Tomoiu, A., Rameix-Welti, M.A., Van der Werf, S., 2008. Host restriction of avian
influenza viruses at the level of the ribonucleoproteins. Annu. Rev. Microbiol. 62, 403-424.
31. Nagata, K., Kawaguchi, A., Naito, T., 2008. Host factors for replication and transcription of the
influenza virus genome. Rev. Med. Virol. 18, 247-260.
32. Petty, R.E., Hunt, D.W., 1998. Neonatal dendritic cells. Vaccine 16, 1378-1382.
33. Raj, G.D., Jones, R.C., 1997. Effect of T-cell suppression by cyclosporin on primary and persistent
infections of infectious bronchitis virus in chickens. Avian Pathol. 26, 257-276.
34. Rangel-Moreno, J., Hartson, L., Navarro, C., Gaxiola, M., Selman, M., Randall, T.D., 2006. Inducible
bronchus-associated lymphoid tissue (iBALT) in patients with pulmonary complications of rheumatoid
arthritis. J. Clin. Invest. 116, 3183-3194.
35. Reemers, S.S., Groot Koerkamp, M.J., Holstege, F.C., Van Eden, W., Vervelde, L., 2009a. Cellular
host transcriptional responses to influenza A virus in chicken tracheal organ cultures differ from
responses in in vivo infected trachea. Vet. Immunol. Immunopathol. Vet. Immunol. Pathol. 132, 91-
100.
36. Reemers, S.S., Van Haarlem, D.A., Groot Koerkamp, M.J., Vervelde, L., 2009b. Differential gene
expression and host response profiles against avian influenza virus within the chicken lung due to
anatomy and airflow. J. Gen. Virol. 90, 2134-2146.
37. Reese, S., Dalamani, G., Kaspers, B., 2006. The avian lung-associated immune system: a review. Vet.
Res. 37, 311-324.
38. Turan, K., Mibayashi, M., Sugiyama, K., Saito, S., Numajiri, A., Nagata, K., 2004. Nuclear MxA
proteins form a complex with influenza virus NP and inhibit the transcription of the engineered
influenza virus genome. Nucleic Acids Res. 32, 643-652.
39. Velilla, P.A., Rugeles, M.T., Chougnet, C.A., 2006. Defective antigen-presenting cell function in
human neonates. Clin. Immunol. 121, 251-259.
40. Wells, L.L., Lowry, V.K., DeLoach, J.R., Kogut, M.H., 1998. Age-dependent phagocytosis and
bactericidal activities of the chicken heterophil. Dev. Comp. Immunol. 22, 103-109.
41. Zhou, J., Law, H.K., Cheung,, C.Y., Ng, I.H., Peiris, J.S., Lau, Y.L., 2006. Differential expression of
chemokines and their receptors in adult and neonatal macrophages infected with human or avian
influenza viruses. J. Infect. Dis. 194, 61-70.

Immunological maturation affects the strength and duration of transcriptional host responses to AIV infection
161
Supplementary data
Tab
le S
1. T
op th
ree
func
tion
al g
roup
s ba
sed
on G
O th
at w
ere
sign
ific
antly
dif
fere
ntia
lly
expr
esse
d be
twee
n 1-
and
4-w
k-ol
d co
ntro
l bir
ds in
lung
and
trac
hea
at 0
, 8, 1
6 an
d 24
h.p
.i..
Lun
g
Tra
chea
Tim
e (h
.p.i.
) T
op
Fun
ctio
nal g
roup
N
umbe
r of
gen
es
invo
lved
Fun
ctio
nal g
roup
N
umbe
r of
gen
es
invo
lved
0 1
Mul
tice
llula
r or
gani
smal
pro
cess
39
Dev
elop
men
tal p
roce
ss
15
2
Dev
elop
men
tal p
roce
ss
36
M
ulti
cellu
lar
orga
nism
al p
roce
ss
14
3
Mul
tice
llula
r or
gani
smal
dev
elop
men
t 30
Mul
tice
llula
r or
gani
smal
dev
elop
men
t 12
8 1
Mul
tice
llula
r or
gani
smal
pro
cess
37
Cel
lula
r ca
rboh
ydra
te m
etab
olic
pro
cess
5
2
Dev
elop
men
tal p
roce
ss
35
C
arbo
hydr
ate
met
abol
ic p
roce
ss
5
3
Cel
l com
mun
icat
ion
30
A
lcoh
ol m
etab
olic
pro
cess
5
16
1 Si
gnal
tran
sduc
tion
14
M
ulti
cellu
lar
orga
nism
al p
roce
ss
10
2
Ana
tom
ical
str
uctu
re d
evel
opm
ent
10
A
nato
mic
al s
truc
ture
dev
elop
men
t 7
3
Sys
tem
dev
elop
men
t 8
S
yste
m p
roce
ss
6
24
1 C
ellu
lar
proc
ess
108
G
luco
se m
etab
olic
pro
cess
2
2
Bio
logi
cal r
egul
atio
n 51
Alc
ohol
met
abol
ic p
roce
ss
2
3
Cel
l com
mun
icat
ion
45
C
ellu
lar
carb
ohyd
rate
met
abol
ic p
roce
ss
2
Dif
fere
nces
in g
ene
expr
essi
on in
lung
and
trac
hea
of 1
- and
4-w
k-ol
d co
ntro
l bir
ds a
t 8, 1
6 an
d 24
h.p
.i. w
ere
dete
rmin
ed u
sing
MA
AN
OV
A w
ithi
n a
tim
e po
int.
A p
-val
ue <
0.05
was
con
side
red
sign
ific
ant.
Gen
es s
igni
fica
ntly
dif
fere
ntia
lly
expr
esse
d w
ere
subj
ecte
d to
GO
ana
lysi
s us
ing
DA
VID
, red
ucin
g ge
ne li
sts
into
fun
ctio
nall
y re
late
d ge
ne
grou
ps. T
he to
p 3
func
tion
al g
roup
s an
d th
e nu
mbe
r of
gen
es s
igni
fica
ntly
dif
fere
ntia
lly
expr
esse
d w
ithi
n th
is g
roup
are
sho
wn.

Chapter 7
162
Tab
le S
2.
Imm
une
rela
ted
gene
s di
ffer
enti
ally
exp
ress
ed b
etw
een
1- a
nd 4
-wk-
old
cont
rol b
irds
in lu
ng a
t 0, 8
, 16
and
24 h
.p.i.
0 h.
p.i.
8
h.p.
i.
16 h
.p.i.
24 h
.p.i.
Fun
ctio
nal g
roup
Gen
e ID
R
atio
Gen
e ID
R
atio
Gen
e ID
R
atio
Gen
e ID
R
atio
Ant
i-ap
opto
sis
H
SP70
E
1171
5 0.
70
C
D74
E
0459
4 0.
59
C
D74
E
0459
4 0.
51
D
MA
E
0015
8 0.
73
IF
I30
E03
389
0.69
IG
J E
1155
1 0.
53
IG
J E
1155
1 0.
47
IG
J E
1155
1 0.
45
IG
LC
E
2113
9 0.
16
IG
LC
E
2113
9 0.
22
IG
LC
E
2113
9 0.
23
IG
LC
E
2113
9 0.
13
M
HC
I
E02
614
0.21
M
HC
I a
E
2435
0 0.
43
M
HC
II
b E
0014
1 0.
51
M
HC
II
b E
0014
1 0.
54
M
HC
II
b E
0014
1 0.
65
Ant
igen
pre
sent
atio
n/bi
ndin
g
Y
FV
E24
348
0.31
B
NIP
3L
E00
231
1.70
C
ASP
7 E
0893
3 0.
79
C
ASP
9 E
0136
6 1.
39
D
AP
E13
002
1.36
PA
K2
E06
426
2.36
PAK
2 E
0642
6 1.
87
Apo
ptos
is
PD
CD
1 E
0745
4 2.
06
PD
CD
1 E
0745
4 1.
72
B
CL
6 E
0735
7 0.
59
B
CL
6 E
0735
7 0.
65
B c
ell d
iffe
rent
iatio
n
B
LN
K
E06
973
0.77
B c
ell m
arke
r
Bu-
1 E
1546
1 0.
66
B c
ell m
atur
atio
n
BT
K
E04
958
0.69
BT
K
E04
958
0.70
C
AD
11
E05
278
1.49
C
ell a
dhes
ion
C
D44
-lik
e E
0784
9 0.
74
C
D44
-lik
e E
0784
9 0.
69
Cel
l dif
eren
tiat
ion
IF
RD
1 E
0944
8 1.
67

Immunological maturation affects the strength and duration of transcriptional host responses to AIV infection
163
PD
GFD
E
1717
9 0.
70
PD
PN
E04
095
1.70
Cel
l pro
life
rati
on
S
PAR
C
E04
184
1.54
C
X3C
R1
E11
955
0.77
IL
16
E06
388
0.68
IL16
E
0638
8 0.
64
IL
16
E06
388
0.57
X
CL
1 E
1523
5 0.
51
X
CL
1 E
1523
5 0.
45
Che
mot
axis
X
CR
1 E
1173
5 0.
74
Coa
gula
tion
F3
E05
619
0.68
C
1QB
E
2156
9 0.
76
Com
plem
ent
C
4BP
A
E01
175
1.35
Cyt
okin
e re
cept
or a
ctiv
ity
G
HR
E
1485
5 1.
56
Dev
elop
men
t
IFIT
M5
E04
243
2.25
IFIT
M5
E04
243
1.83
Foca
l adh
esio
n
LIM
S2
E01
995
1.41
GT
P bi
ndin
g
GIM
AP
7 E
0513
6 0.
64
Imm
une
resp
onse
cyto
kine
E
0232
9 0.
69
cy
toki
ne
E02
329
0.67
C
MA
P27
E
1969
6 1.
65
G
AL
6 E
1666
8 1.
62
Inna
te im
mun
e re
spon
se
T
LR
7 E
1659
0 0.
74
Man
nose
bin
ding
BS
G
E01
328
1.87
Prot
ein
amin
o ac
id
deph
osph
oryl
atio
n
DU
SP1
E03
706
0.60
A
NX
A6
E04
357
1.79
AN
XA
6 E
0435
7 1.
81
K
BT
BD
8 E
0756
9 1.
39
L
CP
1 E
1698
6 0.
67
T
AR
P g
2 E
1960
2 0.
52
T
AR
P g
2 E
1960
2 0.
47
T
AR
P g2
E
1960
2 0.
58
T
IMP4
E
0496
9 0.
65
T
IMP4
E
0496
9 0.
65
T
XK
E
1412
7 0.
77
T
XK
E
1412
7 0.
76
SL
A
E16
234
0.64
Prot
ein
bind
ing
SU
SD3
E05
231
1.56

Chapter 7
164
H
SPA
4L
E10
185
0.74
Pr
otei
n fo
ldin
g
H
SPB
2 E
0794
2 2.
14
H
SPB
2 E
0794
2 1.
75
Prot
ein
mat
urat
ion
H
SP47
E
1121
4 1.
66
C
APN
3 E
0903
6 1.
85
C
APN
3 E
0903
6 1.
50
Prot
eoly
sis
C
TSD
E
0661
3 1.
45
IG
SF2
E15
467
1.53
IGSF
2 E
1546
7 1.
43
L
Y96
E
1564
8 0.
60
PR
KA
R2B
E
0806
0 1.
46
R
ASS
F2
E00
206
0.65
R
ASS
F3
E09
842
1.31
SI
RP-
B1
E06
171
2.67
SIR
P-B
1 E
0617
1 2.
24
SI
RP-
B1
E06
171
1.86
SP
R3
E07
448
2.31
SPR
3 E
0744
8 1.
72
Sign
al tr
ansd
uctio
n
SO
CS
3 E
0718
9 0.
65
Sign
al tr
ansd
uctio
n in
hibi
tor
R
GS1
E
0254
9 0.
47
C
D3D
E
0741
8 0.
54
C
D3D
E
0741
8 0.
56
C
D3D
E
0741
8 0.
62
C
D3D
E
0741
8 0.
55
C
D3E
E
0741
6 0.
74
C
D3E
E
0741
6 0.
64
C
D3E
E
0741
6 0.
75
T c
ell a
ctiv
atio
n
C
D7
E01
631
0.71
CD
7 E
0163
1 0.
66
C
D7
E01
631
0.74
T c
ell d
iffe
rent
iati
on
IL
2RG
E
0563
8 0.
69
T c
ell p
roli
fera
tion
TIM
D4
E03
876
0.71
M
AFF
E
1227
7 1.
42
Tra
nscr
ipti
on
T
ITF1
E
2042
3 1.
33

Immunological maturation affects the strength and duration of transcriptional host responses to AIV infection
165
B
RI3
BP
E02
913
1.51
M
HC
B-G
E
2435
7 1.
84
M
IM1
E06
323
2.17
E06
699
0.38
E07
735
1.54
E17
614
2.48
E
1761
4 2.
11
Mis
cell
aneo
us
E21
142
0.59
E
2114
2 0.
49
E21
142
0.40
mm
une
rela
ted
gene
s si
gnif
ican
tly
diff
eren
tial
ly e
xpre
ssed
in lu
ng b
etw
een
1- a
nd 4
-wk-
old
cont
rol b
irds
at 8
, 16
and
24 h
.p.i.
wer
e de
term
ined
usi
ng M
AA
NO
VA
. A p
-val
ue
< 0
.05
was
con
side
red
sign
ific
ant.
Rat
io r
epre
sent
s th
e fo
ld c
hang
e ex
pres
sion
rat
e in
1-
com
pare
d to
4-w
k-ol
d ti
me
mat
ched
con
trol
bir
ds. T
he E
nsem
bl I
D n
umbe
r is
dep
icte
d
n th
e ID
col
umn
in w
hich
E s
tand
s fo
r E
NSG
AL
G00
0000
. Gen
es a
re d
ivid
ed in
to f
unct
iona
l gro
ups
base
d on
GO
ana
lysi
s us
ing
DA
VID
.
Tab
le S
3. I
mm
une
rela
ted
gene
s di
ffer
entia
lly
expr
esse
d be
twee
n 1-
and
4-w
k-ol
d co
ntro
l bir
ds in
trac
hea
at 0
, 8, 1
6 an
d 24
h.p
.i.
0
h.p.
i.
8 h.
p.i.
16
h.p
.i.
24
h.p
.i.
Fun
ctio
nal g
roup
Gen
e ID
R
atio
Gen
e ID
R
atio
Gen
e ID
R
atio
Gen
e ID
R
atio
IG
LC
E
2113
9 0.
19
IG
LC
E
2113
9 0.
16
IG
J E
1155
1 0.
35
IG
J E
1155
1 0.
37
C
D74
E
0459
4 0.
51
M
HC
II β
E00
141
0.51
Ant
igen
pre
sent
atio
n/bi
ndin
g
L
Y75
E
1115
3 0.
66
Apo
ptos
is
R
BM
5 E
0462
6 0.
58
C
D34
E
0117
7 0.
66
C
D44
-lik
e E
0784
9 0.
72
Cel
l adh
esio
n
C
D36
E
0843
9 1.
54
Coa
gula
tion
F3
E05
619
0.63
Com
plem
ent
C
D93
E
0835
9 1.
40
Intr
acel
lula
r si
gnal
ing
casc
ade
A
SB
9 E
1656
3 0.
73

Chapter 7
166
Lip
id tr
ansp
orte
r ac
tivi
ty
SF
TP
A1
E02
503
2.32
Prot
ein
amin
o ac
id d
epho
spho
ryla
tion
DU
SP26
E
0163
3 1.
66
T
IMP4
E
0496
9 0.
62
Prot
ein
bind
ing
T
AK
1L
E15
822
1.85
Pro
tein
fol
ding
HSP
B2
E07
942
1.39
Sign
al tr
ansd
uctio
n
LY
6E
E16
152
0.72
Supe
roxi
de d
ism
utas
e ac
tivi
ty
SO
D3
E18
557
0.57
Tra
nscr
ipti
on
ST
AT
4 E
0765
1 0.
67
Ves
icle
traf
fick
ing
C
LE
C3B
E
1188
3 0.
44
C
LE
C3B
E
1188
3 0.
48
IG
SF3
E15
469
0.61
E21
142
0.45
ev
a E
0741
2 0.
68
E13
378
1.70
E
1337
8 1.
70
E13
378
1.80
E03
338
1.93
Mis
cell
aneo
us
E11
796
6.52
Imm
une
rela
ted
gene
s si
gnif
ican
tly
diff
eren
tial
ly e
xpre
ssed
in tr
ache
a be
twee
n 1-
and
4-w
k-ol
d co
ntro
l bir
ds a
t 8, 1
6 an
d 24
h.p
.i. w
ere
dete
rmin
ed u
sing
MA
AN
OV
A. A
p-
valu
e <
0.0
5 w
as c
onsi
dere
d si
gnif
ican
t. R
atio
rep
rese
nts
the
fold
cha
nge
expr
essi
on r
ate
in 1
- co
mpa
red
to 4
-wk-
old
tim
e m
atch
ed c
ontr
ol b
irds
. The
Ens
embl
ID
num
ber
is
depi
cted
in th
e ID
col
umn
in w
hich
E s
tand
s fo
r E
NSG
AL
G00
0000
. Gen
es a
re d
ivid
ed in
to f
unct
iona
l gro
ups
base
d on
GO
ana
lysi
s us
ing
DA
VID
.

General discussion
Chapter 8


General discussion
169
Upon entry of the respiratory tract, avian influenza virus (AIV) triggers early immune
responses in the host that are aimed to prevent or control this infection. Although much
research is performed to elucidate the course of events that follow after AIV infection, the
interaction between the virus and the host at molecular and cellular level at an early stage of
infection is unclear. More insight into mechanisms underlying innate and adaptive immune
responses leading to pathogenesis or elimination of AIV may contribute to a better
understanding of AIV induced pathogenesis and new concepts for vaccine development.
Early innate responses blocking virus entry
Although adaptive responses are important for the control and clearance of AIV infection,
innate responses are critical for blocking of virus entry and virus replication, and the
induction of virus specific adaptive response. In the airways, virus entry is blocked via
several mechanisms such as mucus, secretory IgA (Tamura et al., 2004), complement
molecules (Favoreel et al., 2003) or antimicrobial peptides such as gallinacins (Xiao et al.,
2004) that neutralize the virus. Also part of the innate immune system are the collectins,
which belong to a family of pattern recognition receptors. Mammalian collectins are
described to have a strong neutralizing activity against influenza A virus and enhance
complement mediated phagocytosis by macrophages (Hartshorn et al., 1997; Gil et al.,
2009). For chicken several collectins have been identified (Hogenkamp et al., 2006), but
whether these collectins have the same functional properties as their mammalian
counterparts was elusive. We showed that chicken collectins were regulated in expression
during AIV infection and might play a role in the host response to AIV in the respiratory
tract of chickens (chapter 3 and 4). Further research using recombinant collectin proteins
and collectin specific antibodies will give more insight into the functional properties of
chicken collectins and their function during early host responses to AIV.
Early innate responses upon infection
When virus entry is not successfully blocked, AIV infects the epithelial cells resulting in
the production of pro-inflammatory cytokines, chemokines and interferons (Julkunen et al.,
2000). This attracts macrophages and DC, which upon activation or AIV infection also start
producing cytokines and chemokines, attracting more APC and lymphocytes to the place of
infection. Between the different strains of influenza A virus varying levels of cytokine
production are reported. In mammals higher cytokine responses are seen for strains causing
lethal infections (Sandbulte et al., 2008; Cillóniz et al., 2009). Hypercytokinemia is
proposed to be related to virulence of the strain and the outcome of the infection (De Jong
et al., 2006; Kobasa et al., 2007). In chicken the level of cytokine expression is also related
to the virulence of the influenza virus strain and increased pathogenicity for H5N1 (Suzuki
Chapter 8
170
et al., 2009). A direct comparison between different strains is not reported, but in our study
we also saw a high level of cytokine expression in chickens primary infected with low
pathogenic H9N2 (chapter 7). Could this indicate that in chicken the virulence of the strain
is not the main factor in defining cytokine expression levels as in mammals? Between the
study of Suzuki et al. (2009) and our study the infection dose differed, which could have
caused difference in host response (chapter 5). Also in chicken differences in susceptibility
to infection between various breeds have been reported (Sironi et al., 2008) resulting in a
difference in host response. Furthermore, a difference in age affects responses (chapter 6).
A direct comparison between host responses induced by AIV strains varying in virulence
and pathogenesis is needed to answer the question whether virulence of the strain defines
cytokine responses in a similar manner as in mammals.
Macrophages play an important role during steady-state conditions and early responses
upon AIV entry in the respiratory tract. During steady-state conditions, mammalian alveolar
macrophages suppress induction of DC maturation (Holt et al., 1993; Bilyk et al., 1995) and
T cell proliferation (Strickland et al., 1993; Upham et al., 1997). Upon activation after AIV
entry, macrophages become highly phagocytic cells and start producing cytokines,
interferons, but also IL-18 stimulating IFN-γ production by NK cells and T cells, hereby
stimulating viral clearance. This indicates the importance of macrophages during early
defence responses to AIV infection and in activation of adaptive responses. However,
several reports also link macrophages to immunopathology. Influenza strains capable of
causing lethal influenza virus infection are known to induce larger and earlier macrophage
influxes in the lungs of mice compared to non-lethal strains and this excessive
inflammation is proposed to contribute to influenza virus pathogenesis (Perrone et al.,
2008). Influenza virus infected human macrophages were shown to up regulate TRAIL
production, which was related to their cytotoxicity towards influenza virus infected T cells
in vitro (Zhou et al., 2006; Korteweg et al., 2008). Furthermore, a direct role for
macrophages in promoting apoptosis of lung epithelial cells, lung leakage and decreased
survival upon influenza virus infection is shown in mice (Herold et al., 2009). However,
another study in mice demonstrates that although macrophages may contribute to
pathogenesis due to their large numbers in the airways they are crucial in controlling the
infection (Tumpey et al., 2005). We saw a massive influx of macrophages early during AIV
especially in unprotected birds (chapter 7), but down regulation of TRAIL in unprotected
birds. This suggests macrophages are important for virus clearance in the avian respiratory
tract, but likely play a role in immunopathology during AIV infection due to their large
numbers in the respiratory tract of chickens, which is not related to TRAIL expression as
described for mammals.

General discussion
171
Age-dependent innate responses are not reflected in early virus infection
As mentioned before a difference in age is reflected in host responses. The immune system
of neonates is not yet fully matured, which may be a cause of increased susceptibility to
infectious diseases in both chickens and humans (Raj et al., 1997, Gasparoni et al., 2003,
Beal et al., 2005). In chicken, age-dependent functionality is shown for activation,
phagocytosis and bactericidal activities of heterophils and macrophages (Kodama et al.,
1976, Wells et al., 1998, Kogut et al., 2002), proliferation and IFN-γ and IL-2 production of
T cells (Lowenthal et al., 1994) and antibody production (Mast et al., 1999). Maternal
antibodies that protect the neonate from disease in the early weeks of life are also proposed
to interfere with development of protective responses in both chickens and humans (Crowe
et al., 2003; Negash et al., 2004). We also detected differences in host responses at
transcriptional level within 24 hours after AIV inoculation between 1- and 4-week-old
chickens, which were likely related to functionality of macrophages, NK cells and T cells
(chapter 6). However, we did not see a difference in viral RNA expression between these
age groups indicating that age-dependent functionality of early innate responses has no
effect upon virus infection within 24 hours after inoculation. A possible explanation could
be that it was too early to measure age-related differences in host responses at protein level,
and therefore no difference in their effect on AIV infection could be seen. That would
suggest that there is no difference in functionality of early innate molecules that block viral
entry between the age groups upon AIV inoculation. If the effect of age-dependent
responses on AIV infection in relation to increased disease susceptibility in chicks is to be
elucidated, these responses and their effect upon AIV infection need to be studied for a
longer period of time.
The challenge route affects host responses
When studying host responses to respiratory virus infections in vivo, several aspects that
may have an influence on these responses should be kept in mind. A study in macaques
shows significant differences in gene expression in the lung of influenza virus infected
animals between sites containing viral RNA and sites lacking viral RNA (Baas et al., 2006).
We showed that in the avian lung airflow and anatomy caused differences in viral load
within the lung resulting in differences in host responses at transcriptional level (chapter 5).
This indicates that pathogens do not spread evenly through the avian lung and accurate
sampling is essential when investigating in vivo responses to respiratory virus infections.
If the airflow and anatomy influence virus deposition and subsequently host responses, the
challenge route most likely also affects host responses. Previous studies showed that the
size of particles affects the deposition of particles within the avian respiratory tract
(Corbanie et al., 2006). Therefore airborne particles administered via spray inoculation

Chapter 8
172
would likely penetrate deeper into the lungs than particles administered intratracheally in a
liquid. This causes higher viral RNA expression in lungs of spray inoculated birds
compared to birds inoculated intratracheally (unpublished data Degen et al.), resulting in
differences in host responses. Furthermore, spray inoculation in naïve birds causes less
variation in viral RNA expression and host responses at transcriptional level compared to
intratracheally inoculated birds (chapter 6 and 7). This means more differences in gene
expression due to inoculation can be measured and fewer birds would be needed to measure
these host responses when spray inoculation is used.
Microarray analysis for screening of new adjuvants and vaccines
For optimal efficacy a vaccine needs both an antigen and a strong immune activator as an
adjuvant. Adjuvants are able to steer the immune response in mammals into a Th1 mediated
response as described for CpG (Klinman, et al., 2004), a Th2 mediated response as reported
for aluminium salts (Marrack et al., 2009) or a combination of Th1 and Th2 mediated
response under certain condition as described for oil emulsions (Spickler et al., 2003). Due
to this ability, the adjuvant added to a vaccine has to be chosen carefully in order to induce
an optimal immune response leading to protection. Much research is being performed in
development of new vaccines and adjuvants for protection against AIV infection, especially
adjuvants that can be applied to mucosal surfaces. In chicken protective ability of vaccines
and adjuvants is tested using techniques that determine virus specific antibodies, viral load
and virus shedding, cytokine expression and clinical signs (Degen et al., 2006; Maas et al.,
2009; Wang et al., 2009). We immunised birds with three different adjuvants to gain more
insight into protective host responses to AIV infection in the chicken using microarray
analysis (chapter 7). Based on gene expression profiles it was clear that in 1-day-old birds,
Al(OH)3 and water-in-oil (w/o) were able to induce a protective response to challenge 2
weeks later while CpG was not. Microarray analysis is described to be a useful tool for
diagnosis of the metastatic state of cancer (Roepman et al., 2005) or for screening of
disease related biomarkers that could be used for early disease diagnosis, follow-up
progression or development of new treatment methods for Alzheimer’s disease (Ho et al.,
2009), inflammatory bowel diseases (Wu et al., 2007), HIV (Giri et al., 2006), influenza A
virus (Cameron et al., 2008) and other pathogenic virus or bacterial infections in mammals
(Ramilo et al., 2007; Yoo et al., 2009). These results show that microarray analysis could
be used as a tool to screen new vaccines and adjuvants for their ability to provide
protection. For the poultry industry this screening technique may be somewhat expensive
and is likely more suited for screening of human vaccines and adjuvants. However,
microarray analysis has the advantage that, besides a screening tool for the protective
ability of vaccines and adjuvants, it gives insight into how protection is provided in one
overview at genome level, which cannot be achieved with other screening techniques.

General discussion
173
Neutralizing antibodies or CTL?
Immunisation in presence of CpG as immunomodulator is described to provide protection
against influenza virus challenge in both chicken and mice (Wang et al., 2009; Wong et al.,
2009). We found that CpG was unable to induce a protective response in 1-day-old birds to
a homologues AIV challenge 2 weeks later (chapter 7). In mice addition of CpG to an
influenza virus M2e peptide vaccine is shown to enhance M2e peptide specific T cell
responses and antibody titers, but fails to provide protection. In combination with
aluminium salts and CpG, M2e peptide specific T cell responses and antibody titers are also
enhanced and mice are protected to a low challenge dose, but with a high challenge dose
protection is less strong than when only aluminium salts were added (Wu et al., 2009). CTL
are known to provide protection against influenza virus infection in mice (Kreijtz et al.,
2009). Age-related defects in antigen-presenting cell function are shown to lead to poor T
cell clonal expansion and function in mice (Plowden et al., 2004; Velilla et al., 2006 ).
These impaired responses may have caused the lack of protection in CpG immunised birds
(chapter 7). Furthermore, M2 peptide immunisation in pigs causes enhancement of disease
rather than protection, which is proposed to be caused by inability of M2 specific antibodies
to neutralize the virus and prevent viral entry (Heinen et al., 2002). These data indicate that
although CTL are known to provide protection against influenza virus infection,
neutralizing antibodies play a crucial role for providing early protection against AIV
infection by inhibiting viral entry and a lack in these antibodies results in less protection or
even enhancement of disease. In our study protected birds immunised with Al(OH)3 and
w/o did have high neutralizing antibody titers, while unprotected CpG immunised birds did
not (chapter 7), which shows the importance of neutralizing antibodies to prevent viral
entry resulting in protection.
Future perspectives
Influenza virus infection is one of the major causes of respiratory disease in both humans
and animals and vaccination against influenza virus is used to protect against infection and
control outbreaks depending on the country. Poultry vaccines preferably provide a broad
protection against different influenza virus strains especially HPAI strains, provide clinical
protection and prevent transmission to achieve efficient control of the disease. Currently
induction and maturation stages of innate and specific immune responses leading to
protection or pathogenesis are poorly understood. Much research is performed to get more
insight into these processes in order to obtain new leads for development of vaccines. In
this thesis we displayed several aspects of early host responses after primary AIV infection
and viral challenge in immunised chickens at host transcriptional level. The use of genome-
wide microarray analysis in combination with more classical techniques, such as histology

Chapter 8
174
and serology, allowed us to gain more insight into possible correlates of protection or
pathogenesis at cellular and transcriptional level.
For development of vaccines that can be used in young as well as older birds, it is crucial to
gain insight into age-related host responses. Age proved to have a major effect on early host
responses to AIV infection at transcriptional level, but no effects on virus RNA expression
were found. The effect of age on host responses has been described at later stage during
infection, but it is unknown to what extent and through which mechanisms the host
responses to AIV infection are affected by age. If age does not affect host responses at an
early, but at a later stage during infection, research into new concepts of age-independent
vaccines should therefore focus on induction stages of adaptive responses. Research into
age-related responses should therefore be performed over a longer time period so not only
effects on early innate responses, but also adaptive responses can be investigated.
Furthermore, besides virus RNA expression, shedding, transmission and clinical signs of
the birds should be monitored to gain insight into age-related disease susceptibility.
The effect of age may also relate to defects in the induction of protective responses induced
by CpG. While in our study birds immunised with CpG were not protected against AIV
challenge, previous studies did report protection against AIV infection in CpG immunised
birds (Degen et al., personal comment; Wang et al., 2009; Linghua et al., 2007). The birds
in these studies were older than our birds and age-related host responses may cause this
difference in protective immunity. CpG is known to act in a TLR-dependent manner (Ishii
et al., 2007) and likely age-related defects in antigen-presenting cell (APC) function leading
to poor T cell clonal expansion and function as described for mice (Plowden et al., 2004;
Velilla et al., 2006 ) are involved. To gain insight into this difference in immunity provided
by CpG between young and adult birds a comparative study between these age groups
needs to be performed. Preferably spray inoculation should be used, since this gives less
variation in virus RNA expression and host gene expression between the birds.
CpG, a TLR-dependent Th1 skewing adjuvant, did not provide protection in our study.
However, w/o and Al(OH)3, TLR-independent Th2 skewing adjuvants, did provide
protection against homologues challenge. Could this failure of CpG to perform also be
related to defects in functionality of APC as mentioned above resulting in differences in
induction of cell-mediated responses? This suggests that although CTL are known to
provide protection against influenza virus infection, in young birds a high concentration of
neutralizing antibodies is foremost important in providing protection. New concepts for
age-independent vaccines should therefore focus on adjuvants that can induce both a strong
humoral and cell-mediated response.
By comparing host responses after challenge in birds immunised with various adjuvants we
investigated whether correlates of protection could be found and how protection is
provided. Gene expression profiles, cellular influxes, HI and virus-specific IgG titers were

General discussion
175
found to be correlates of protection. These correlates of protection proved to be
independent of the adjuvant, but the mechanisms by which this protection was induced by
the different adjuvants remained elusive. Knowledge into mechanisms by which adjuvants
induce protection may help in the improvement of vaccine efficacy. By analyzing host
responses after immunization at the infection site, the spleen and lungs and after challenge
in the spleen and lungs a complete overview of correlates of protection and the mechanism
by which this protection is induced by the different adjuvants can be obtained. From our
results microarray analyses proved to be a useful tool for screening protective responses.
Combining microarray analyses with classical techniques as FACS analysis, histology and
serology will give the advantage of an overview of host responses at transcriptional, protein
and cellular level.
In conclusion
Early host responses are important in providing protection against AIV infection,
controlling infection and activating adaptive host responses. As discussed in this thesis
various factors influence these responses. While the challenge route and sampling method
influence investigation into host response, age and adjuvants directly affect host responses.
The direct effects of these factors on host responses are important in the development of
new vaccines against AIV infection. The findings presented in this thesis enhance our
knowledge on the course of events that follow early after AIV infection and lead to
pathogenesis or elimination of AIV, which will contribute to more insight into AIV induced
pathogenesis and new concepts for vaccine development.
References
1. Baas, T., Baskin, C.R., Diamond, D.L., García-Sastre, A., Bielefeldt-Ohmann, H., Tumpey, T.M.,
Thomas. M.J., Carter, V.S., Teal, T.H., Van Hoeven, N., Proll, S., Jacobs, J.M., Caldwell, Z.R.,
Gritsenko, M.A., Hukkanen, R.R., Camp, D.G. 2nd, Smith, R.D., Katze, M.G., 2006. Integrated
molecular signature of disease: analysis of influenza virus-infected macaques through functional
genomics and proteomics. J. Virol. 80, 10813-10828.
2. Beal, R.K., Powers, C., Wigley, P., Barrow, P.A., Kaiser, P., Smith, A.L., 2005. A strong antigen-
specific T-cell response is associated with age and genetically dependent resistance to avian enteric
salmonellosis. Infect. Immun. 73, 7509-7516.
3. Bilyk, N., Holt, P.G., 1995. Cytokine modulation of the immunosuppressive phenotype of pulmonary
alveolar macrophage populations. Immunology 86, 231-237.
4. Cameron, C.M., Cameron, M.J., Bermejo-Martin, J.F., Ran, L., Xu, L., Turner, P.V., Ran, R., Danesh,
A., Fang, Y., Chan, P.K., Mytle, N., Sullivan, T.J., Collins, T.L., Johnson, M.G., Medina, J.C., Rowe,
T., Kelvin, D.J., 2008. Gene expression analysis of host innate immune responses during Lethal H5N1
infection in ferrets. J. Virol. 82, 11308-11317.
5. Cillóniz, C., Shinya, K., Peng, X., Korth, M.J., Proll, S.C., Aicher, L.D., Carter, V.S., Chang, J.H.,
Kobasa, D., Feldmann, F., Strong, J.E., Feldmann, H., Kawaoka, Y., Katze, M.G., 2009. Lethal

Chapter 8
176
influenza virus infection in macaques is associated with early dysregulation of inflammatory related
genes. PLoS Pathog. 5, e1000604.
6. Corbanie, E.A., Matthijs, M.G., Van Eck, J.H., Remon, J.P., Landman, W.J., Vervaet, C., 2006.
Deposition of differently sized airborne microspheres in the respiratory tract of chickens. Avian Pathol.
35, 475-485.
7. Crowe, J.E. Jr, Williams, J.V., 2003. Immunology of viral respiratory tract infection in infancy.
Paediatr. Respir. Rev. 4, 112-119.
8. De Jong, M.D., Simmons, C.P., Thanh, T.T., Hien, V.M., Smith, G.J., Chau, T.N., Hoang, D.M., Chau,
N.V., Khanh, T.H., Dong, V.C., Qui, P.T., Cam, B.V., Ha do, Q., Guan, Y., Peiris, J.S., Chinh, N.T.,
Hien, T.T., Farrar, J., 2006. Fatal outcome of human influenza A (H5N1) is associated with high viral
load and hypercytokinemia. Nat. Med. 12, 1203-1207.
9. Degen, W.G., Smith, J., Simmelink, B., Glass, E.J., Burt, D.W., Schijns, V.E., 2006. Molecular
immunophenotyping of lungs and spleens in naive and vaccinated chickens early after pulmonary avian
influenza A (H9N2) virus infection. Vaccine 24, 6096-6109.
10. Favoreel, H.W., Van de Walle, G.R., Nauwynck, H.J., Pensaert, M.B., 2003. Virus complement
evasion strategies. J. Gen. Virol. 84, 1-15.
11. Gasparoni, A., Ciardelli, L., Avanzini, A., Castellazzi, A.M., Carini, R., Rondini, G., Chirico, G., 2003.
Age-related changes in intracellular TH1/TH2 cytokine production, immunoproliferative T lymphocyte
response and natural killer cell activity in newborns, children and adults. Biol. Neonate 84, 297-303.
12. Gil, M., McCormack, F.X., Levine, A.M., 2009. Surfactant protein A modulates cell surface expression
of CR3 on alveolar macrophages and enhances CR3-mediated phagocytosis. J. Biol. Chem. 284, 7495-
7504.
13. Giri, M.S., Nebozhyn, M., Showe, L., Montaner, L.J., 2006. Microarray data on gene modulation by
HIV-1 in immune cells: 2000-2006. J. Leukoc. Biol. 80, 1031-1043.
14. Hartshorn, K.L., White, M.R., Shepherd, V., Reid, K., Jensenius, J.C., Crouch, E.C., 1997.
Mechanisms of anti-influenza activity of surfactant proteins A and D: comparison with serum
collectins. Am. J. Physiol. 273, L1156-1166.
15. Heinen, P.P., Rijsewijk, F.A., De Boer-Luijtze, E.A., Bianchi, A.T., 2002. Vaccination of pigs with a
DNA construct expressing an influenza virus M2-nucleoprotein fusion protein exacerbates disease after
challenge with influenza A virus. J. Gen. Virol. 83, 1851-1859.
16. Herold, S., Steinmueller, M., von Wulffen, W., Cakarova, L., Pinto, R., Pleschka, S., Mack, M., Kuziel,
W.A., Corazza, N., Brunner, T., Seeger, W., Lohmeyer, J., 2009. Lung epithelial apoptosis in influenza
virus pneumonia: the role of macrophage-expressed TNF-related apoptosis-inducing ligand. J. Exp.
Med. 205, 3065-3077.
17. Ho, L., Fivecoat, H., Wang, J., Pasinetti, G.M., 2009. Alzheimer's disease biomarker discovery in
symptomatic and asymptomatic patients: Experimental approaches and future clinical applications.
Exp. Gerontol. doi:10.1016/j.exger.2009.09.007.
18. Hogenkamp, A., Van Eijk, M., Van Dijk, A., Van Asten, A.J., Veldhuizen, E.J.A., Haagsman, H.P.,
2006. Characterization and expression sites of newly identified chicken collectins. Mol. Immunol. 43,
1604-1616.
19. Holt, P.G., Oliver, J., Bilyk, N., McMenamin, C., McMenamin, P.G., Kraal, G., Thepen, T., 1993.
Downregulation of the antigen presenting cell function(s) of pulmonary dendritic cells in vivo by
resident alveolar macrophages. J. Exp. Med. 177, 397-407.
20. Ishii, K.J., and S. Akira. 2007. Toll or toll-free adjuvant path toward the optimal vaccine development.
J. Clin. Immunol. 4:363-371.
General discussion
177
21. Julkunen, I., Sareneva, T., Pirhonen, J., Ronni, T., Melén, K., Matikainen, S., 2001. Molecular
pathogenesis of influenza A virus infection and virus-induced regulation of cytokine gene expression.
Cytokine Growth Factor Rev. 12, 171-180.
22. Klinman, D.M., Currie, D., Gursel, I., Verthelyi, D., 2004. Use of CpG oligodeoxynucleotides as
immune adjuvants. Immunol. Rev. 199, 201-216.
23. Kobasa, D., Jones, S.M., Shinya, K., Kash, J.C., Copps, J., Ebihara, H., Hatta, Y., Kim, J.H., Halfmann,
P., Hatta, M., Feldmann, F., Alimonti, J.B., Fernando, L., Li, Y., Katze, M.G., Feldmann, H., Kawaoka.
Y., 2007. Aberrant innate immune response in lethal infection of macaques with the 1918 influenza
virus. Nature 445, 319-323.
24. Kodama, H., Sato, G., Mikami, T., 1976. Age-dependent resistance of chickens to salmonella in vitro:
phagocytic and bactericidal activities of splenic phagocytes. Am. J. Vet. Res. 37, 1091-1094.
25. Kogut, M., Rothwell, L., Kaiser, P., 2002. Differential effects of age on chicken heterophil functional
activation by recombinant chicken interleukin-2. Dev. Comp. Immunol. 26, 817-830.
26. Korteweg, C., Gu, J., 2008. Pathology, molecular biology, and pathogenesis of avian influenza A
(H5N1) infection in humans. Am. J. Pathol. 172, 1155-1170.
27. Kreijtz, J.H., Bodewes, R., Van den Brand, J.M., De Mutsert, G., Baas, C., Van Amerongen, G.,
Fouchier, R.A., Osterhaus, A.D., Rimmelzwaan, G.F., 2009. Infection of mice with a human influenza
A/H3N2 virus induces protective immunity against lethal infection with influenza A/H5N1 virus.
Vaccine 27, 4983-4989.
28. Linghua, Z., Xingshan, T., Fengzhen, Z., 2007. Vaccination with Newcastle disease vaccine and CpG
oligodeoxynucleotides induces specific immunity and protection against Newcastle disease virus in
SPF chicken. Vet. Immunol. Immunopathol. 115, 216-222.
29. Lowenthal, J.W., Connick, T.E., McWaters, P.G., York, J.J., 1994. Development of T cell immune
responsiveness in the chicken. Immunol. Cell Biol. 72, 115-122.
30. Maas, R., Tacken, M., Van Zoelen, D., Oei, H., 2009. Dose response effects of avian influenza (H7N7)
vaccination of chickens: serology, clinical protection and reduction of virus excretion. Vaccine 27,
3592-3597.
31. Marrack, P., McKee, A.S., Munks, M.W., 2009. Towards an understanding of the adjuvant action of
aluminium. Nat. Rev. Immunol. 9, 287-293.
32. Mast, J., Goddeeris, B.M., 1999. Development of immunocompetence of broiler chickens. Vet.
Immunol. Immunopathol. 70, 245-256.
33. Negash, T., al-Garib, S.O., Gruys, E., 2004. Comparison of in ovo and post-hatch vaccination with
particular reference to infectious bursal disease. A review. Vet. Q. 26, 76-87.
34. Perrone, L.A., Plowden, J.K., García-Sastre, A., Katz, J.M., Tumpey, T.M., 2008. H5N1 and 1918
pandemic influenza virus infection results in early and excessive infiltration of macrophages and
neutrophils in the lungs of mice. PLoS Pathog. 4, e1000115.
35. Plowden, J., Renshaw-Hoelscher, M., Gangappa, S., Engleman, C., Katz, J.M., Sambhara, S., 2004.
Impaired antigen-induced CD8+ T cell clonal expansion in aging is due to defects in antigen presenting
cell function. Cell. Immunol. 229, 86-92.
36. Raj, G.D., Jones, R.C., 1997. Infectious bronchitis virus: Immunopathogenesis of infection in the
chicken. Avian Pathol. 26, 677-706.
37. Ramilo, O., Allman, W., Chung, W., Mejias, A., Ardura, M., Glaser, C., Wittkowski, K.M., Piqueras,
B., Banchereau, J., Palucka, A.K., Chaussabel, D., 2007. Gene expression patterns in blood leukocytes
discriminate patients with acute infections. Blood 109, 2066-2077.
38. Roepman, P., Wessels, L.F., Kettelarij, N., Kemmeren, P., Miles, A.J., Lijnzaad, P., Tilanus, M.G.,
Koole, R., Hordijk, G.J., Van der Vliet, P.C., Reinders, M.J., Slootweg, P.J., Holstege, F.C., 2005. An

Chapter 8
178
expression profile for diagnosis of lymph node metastases from primary head and neck squamous cell
carcinomas. Nat. Genet. 37, 182-186.
39. Sandbulte, M.R., Boon, A.C., Webby, R.J., Riberdy, J.M., 2008. Analysis of cytokine secretion from
human plasmacytoid dendritic cells infected with H5N1 or low-pathogenicity influenza viruses.
Virology 381, 22-28.
40. Sironi, L., Williams, J.L., Moreno-Martin, A.M., Ramelli, P., Stella, A., Jianlin, H., Weigend, S.,
Lombardi, G., Cordioli, P., Mariani, P., 2008. Susceptibility of different chicken lines to H7N1 highly
pathogenic avian influenza virus and the role of Mx gene polymorphism coding amino acid position
631. Virology 380, 152-156.
41. Spickler, A.R., Roth, J.A., 2003. Adjuvants in veterinary vaccines: modes of action and adverse effects.
J. Vet. Intern. Med. 17 :273-281.
42. Strickland, D.H., Thepen, T., Kees, U.R., Kraal, G., Holt, P.G., 1993. Regulation of T-cell function in
lung tissue by pulmonary alveolar macrophages. Immunology 80, 266-272.
43. Suzuki, K., Okada, H., Itoh, T., Tada, T., Mase, M., Nakamura, K., Kubo, M., Tsukamoto, K., 2009.
Association of increased pathogenicity of Asian H5N1 highly pathogenic avian influenza viruses in
chickens with highly efficient viral replication accompanied by early destruction of innate immune
responses. J. Virol. 83, 7475-7486.
44. Tamura, S., Kurata, T., 2004. Defense mechanisms against influenza virus infection in the respiratory
tract mucosa. Jpn. J. Infect. Dis. 57, 236-247.
45. Tumpey, T.M., García-Sastre, A., Taubenberger, J.K., Palese, P., Swayne, D.E., Pantin-Jackwood,
M.J., Schultz-Cherry, S., Solórzano, A., Van Rooijen, N., Katz, J.M., Basler, C.F., 2005. Pathogenicity
of influenza viruses with genes from the 1918 pandemic virus: functional roles of alveolar
macrophages and neutrophils in limiting virus replication and mortality in mice. J. Virol. 79, 14933-
14944.
46. Upham, J.W., Strickland, D.H., Robinson, B.W., Holt, P.G., 1997. Selective inhibition of T cell
proliferation but not expression of effector function by human alveolar macrophages. Thorax 52, 786-
795.
47. Velilla, P.A., Rugeles, M.T., Chougnet, C.A., 2006. Defective antigen-presenting cell function in
human neonates. Clin. Immunol. 121, 251-259.
48. Wang, Y., Shan, C., Ming, S., Liu, Y., Du, Y., Jiang, G., 2009. Immunoadjuvant effects of bacterial
genomic DNA and CpG oligodeoxynucleotides on avian influenza virus subtype H5N1 inactivated oil
emulsion vaccine in chicken. Res. Vet. Sci. 86, 399-405.
49. Wells, L.L., Lowry, V.K., DeLoach, J.R., Kogut, M.H., 1998. Age-dependent phagocytosis and
bactericidal activities of the chicken heterophil. Dev. Comp. Immunol. 22, 103-109.
50. Wong, J.P., Christopher, M.E., Viswanathan, S., Karpoff, N., Dai, X., Das, D., Sun, L.Q., Wang, M.,
Salazar, A.M., 2009. Activation of toll-like receptor signaling pathway for protection against influenza
virus infection. Vaccine 27, 3481-3483.
51. Wu, F., Dassopoulos, T., Cope, L., Maitra, A., Brant, S.R., Harris, M.L., Bayless, T.M., Parmigiani, G.,
Chakravarti, S., 2007. Genome-wide gene expression differences in Crohn's disease and ulcerative
colitis from endoscopic pinch biopsies: insights into distinctive pathogenesis. Inflamm. Bowel Dis. 13,
807-821.
52. Wu, F., Yuan, X.Y., Li, J., Chen, Y.H., 2009. The co-administration of CpG-ODN influenced
protective activity of influenza M2e vaccine. Vaccine 27, 4320-4324.
53. Xiao, Y., Hughes, A.L., Ando, J., Matsuda, Y., Cheng, J.F., Skinner-Noble, D., Zhang, G., 2004. A
genome-wide screen identifies a single beta-defensin gene cluster in the chicken: implications for the
origin and evolution of mammalian defensins. BMC Genomics 5, 56.

General discussion
179
54. Yoo, S.M., Choi, J.H., Lee, S.Y., Yoo, N.C., 2009. Applications of DNA microarray in disease
diagnostics. J. Microbiol. Biotechnol. 19, 635-646.
55. Zhou, J., Law, H.K., Cheung, C.Y., Ng, I.H., Peiris, J.S., Lau, Y.L., 2006. Functional tumor necrosis
factor-related apoptosis-inducing ligand production by avian influenza virus-infected macrophages. J.
Infect. Dis. 193, 945-953.


Summary
Summary
182
Upon entry of the respiratory tract avian influenza virus (AIV) triggers early immune
responses in the host that are aimed to prevent or in case of already established infection
control this infection. Although much research is performed to elucidate the course of
events that follow after AIV infection, the interactions between the virus and the host at
molecular level at an early stage of infection are unclear. More insight in the mechanisms
underlying innate and adaptive immune responses leading to pathogenesis or elimination of
the AIV may contribute to a better understanding of AIV induced pathogenesis and new
concepts for vaccine development. In this thesis we unravelled several aspects of early host
responses after primary AIV infection and viral challenge in immunised chickens at host
transcriptional level. The use of genome-wide microarray analysis in combination with
more classical techniques allowed us to elucidate possible correlates of protection or
pathogenesis at cellular and transcriptional level. This last chapter summarises the findings
in this thesis.
Respiratory epithelial cells are the first target of AIV infection and their initial response
will affect the development of the host immune response. In mammals early host responses
to AIV infection have been investigated using respiratory epithelial cell lines and primary
epithelial cell cultures. Since chicken respiratory epithelial cell lines or primary cell
cultures were not available at the time, we decided to explore the use of tracheal organ
cultures (TOC) for this purpose as described in chapter 2. Although H9N2 AIV was able to
infect and replicate in TOC, virus specific gene expression profiles were masked by wound
healing responses that are induced by preparation of TOC independent of the virus
infection. Therefore only a small overlap was found in host response genes between
infected TOC and in vivo infected trachea. We were able to keep TOC in culture for a
longer time period, but histopathological changes occurred which would also affect host
responses at transcriptional level. This implies that although TOC is a suitable model for
culturing of virus and lectin or virus binding studies, it is not suitable for measuring early
immune responses upon viral infection at transcriptional level.
Upon entry of the respiratory tract AIV encounters several barriers that are able to block the
virus from entering epithelial cells. One of these barriers are collectins which in mammals
can bind and neutralize a wide range of pathogens including influenza A virus. Mammalian
collectins have been implicated to play an important role in the early defense against
influenza A virus infection, but for chicken collectins this is not yet clarified. In chapter 3
recombinant chicken Lung Lectin (cLL) was used to characterize structural and functional
properties of this collectin. Purified recombinant cLL has lectin activity, but failed to
neutralise influenza virus infectivity of the human isolates, while for an avian virus isolate
neutralisation was seen once. On the other hand recombinant cLL proved to have
haemagglutination inhibiting activity to at least one human influenza virus strain. How

Summary
183
expression of chicken collectins is affected by influenza virus infection in the chicken is
unknown and this was analyzed in chapter 4. Collectin mRNA expression was down
regulated in lung and up regulated in trachea after AIV inoculation, indicating tissue
specific expression. We also detected that the effect of AIV inoculation on collectin mRNA
expression was age specific in both the trachea and lung and viral RNA expression only
correlated with collectin mRNA expression in the lung of 1-wk-old but not in 4-wk-old
birds. Without knowing the exact function of chicken collectins in innate defenses, it is
difficult to relate the observed changes in gene expression to a biological effect. However,
these findings indicate that in lung collectins may play a role in limiting respiratory
infection in neonatal chickens.
Before we could start with the in vivo analysis of early host responses to AIV infection in
the respiratory tract at the molecular level, there was a simple question unanswered in
literature. It was described that differences in influenza virus deposition in the lung of
macaque had an affect on host responses at transcriptional level. Whether this uneven virus
deposition occurred in the chicken was unknown. In chapter 5 we investigated whether
differences in anatomy and airflow in the avian respiratory tract affected deposition of virus
and subsequent host responses. Although the upper trachea contained more viral RNA than
the lower trachea there were no significant differences in gene expression. Lung was
divided into 4 segments according to airflow and anatomy, which proved to affect virus
deposition in that lung segments containing the larger airways and the bifurcations to the
secondary bronchi contained highest viral RNA levels. In lung differences in viral RNA
distribution enhanced the differences in gene expression that were already seen in non-
infected birds. Host responses shared by trachea, lung L1 (cranial) and L4 (caudal) have
been previously described as common response to pathogens in mouse, rat, macaque and
human indicating that these are common responses independent of the amount of viral RNA
or the type of respiratory inflammatory disease. These common responses involved
chemokine activity and inflammatory responses correlating to massive KUL-01+
macrophage influxes. However, in trachea and L1 more genes were expressed due to
infection and larger KUL-01+, CD4+ and CD8α+ cell influxes were found compared to L4.
These findings suggest that an unequal deposition of pathogens throughout an organ will
induce localised responses and sampling at specific sites will affect the outcome of the
study.
The development of the avian immune system starts early during embryogenesis and
reaches maturity several weeks after hatching. It is unknown to what extent and through
which mechanisms the host responses to AIV infection are affected by age. For replication
and transcription of the influenza virus genome, the virus uses both viral and cellular host

Summary
184
factors. Whether age affects expression of these host factors and thereby AIV replication is
also unknown. In chapter 6 the effect of age on early host responses to AIV and on host
factors affecting replication in the respiratory tract were analyzed. Gene expression
between 1- and 4-wk-old birds was compared in PBS inoculated control birds and in H9N2
AIV inoculated birds early after inoculation. When comparing 1- and 4-wk-old control
birds, most genes were expressed at a higher rate in 4-wk-old birds, while genes related to
innate responses and development of the respiratory immune system were expressed at a
higher rate in 1-wk-old birds. These differences in gene expression between the age groups
related to differences in tissue development and maturation of the immune system. In AIV
inoculated birds gene expression was most affected at 16 h.p.i. in 1-wk-old birds, and at 16
and 24 h.p.i. in 4-wk-old birds. Furthermore, in 1-wk-old birds less genes were affected by
AIV inoculation than in 4-wk-old birds and which might be due to age-dependent reduced
functionality of APC, T cells and NK cells. Expression of cellular host factors that block
virus replication by interacting with viral factors was independent of age or tissue for most
host factors. These data show that differences in development are reflected in gene
expression and suggest that the strength of host responses at transcriptional level may be a
key factor in age-dependent susceptibility to infection, and the cellular host factors involved
in virus replication are not.
To gain more insight in the mechanisms leading to protection after vaccination with
different adjuvants, w/o, Al(OH)3 and CpG, we investigated correlates of protection after
AIV challenge, described in chapter 7. H9N2+w/o and H9N2+Al(OH)3 vaccinated birds
were protected based on low viral RNA expression. We found that protection after AIV
challenge correlated to a lower number of genes induced after challenge and gene
expression patterns with a low amplitude of change. The gene expression profile of
protected birds showed that expression was especially up regulated at 1 d.p.c., while in
unprotected birds higher and prolonged gene expression was found. Protected birds had
smaller cellular influxes en high neutralizing antibody titers. These findings suggest that
lack of immune activation is the most important correlate of protection after challenge with
AIV most likely due to high neutralizing antibody titers resulting in lower viral RNA
expression.
Early host responses to respiratory virus infections are complex processes providing the
first defense against AIV infection and are influenced by various factors as discussed in this
thesis. The research into host responses is influenced by the sampling method, because
airflow and anatomy affect virus distribution in the lung enhancing differences in host
responses between different segments in the lung already seen in uninfected birds. This
points out the importance of sampling approach which has to be taken into account when

Summary
185
investigating in vivo responses to respiratory virus infections in large organs. Host
responses themselves are directly affected by the age and adjuvants. Prolonged and
enhanced responses relate to the maturation of the respiratory immune system and may be
key factors in age-dependent susceptibility to infection and induction of protective
responses. A high neutralizing antibody titer is a know correlate of a protective response.
This correlate of protection relates to lower gene expression levels and less cellular influxes
indicating that a lack of immune activation is the most important correlate of protection
after AIV challenge. The findings presented in this thesis enhance our knowledge on the
course of events that follow early after AIV infection leading to pathogenesis or elimination
of AIV.


Nederlandse samenvatting

Nederlandse samenvatting
188
Influenza A virus
Vogelgriep werd voor het eerst beschreven in 1878 als een ziekte die kippen infecteert. Pas
in 1955 werd de veroorzaker van vogelgriep ontdekt, een influenza A virus. Tegenwoordig
zijn er vele varianten van influenza A virus bekend die in vogels, maar ook onder andere in
mensen, varkens, paarden, katachtigen, fretten en walvissen infecties veroorzaken vooral in
de luchtwegen.
De ziekteverschijnselen in kippen variëren van een lichte hoest tot de dood, wat
samenhangt met de het type influenza virus. Laag pathogeen aviair influenza virus (LPAI)
veroorzaakt geen of lichte ziekteverschijnselen en infecties zijn voornamelijk terug te
vinden in de luchtwegen. Hoog pathogeen aviair influenza virus (HPAI) veroorzaakt
ernstige ziekteverschijnselen zoals de dood binnen 2 dagen en veroorzaakt naast in de
luchtwegen ook infecties in andere organen, inclusief de hersenen.
De luchtwegen van vogels
De luchtwegen van de kip zijn anders dan die van zoogdieren zoals de mens. Kippen
hebben geen middenrif zoals zoogdieren, maar in plaats daarvan hebben ze luchtzakken die
ze gebruiken als blaasbalgen om verse lucht door de longen te laten stromen. De longen van
de kip zijn klein en star vergeleken met de grote, flexibele longen van zoogdieren die
uitzetten bij inademing. Daarnaast stroomt de lucht bij zoogdieren via dezelfde weg de
longen in en uit, terwijl bij kippen de lucht circulair door de longen stroomt en dus via een
andere weg de longen uitstroomt als dat het binnen gekomen is. Hierdoor heeft de kip altijd
zuurstofrijke lucht in de longen. Naast ademhaling spelen de longen ook een belangrijke rol
in het immuunsysteem van de luchtwegen, respiratoir immuunsysteem genaamd. In de
longen liggen naast de grote luchtwegen gebieden waar cellen van het immuunsysteem bij
elkaar liggen in een organiseerde structuur, zogenaamde lymfeknopen. In de longen worden
deze gebieden BALT (bronchus associated lymphoid tissue) genoemd. De BALT
ontwikkelt zich nadat een kuiken uit het ei is gekomen en is terug te vinden vanaf 2-3
weken na uitkomst. Volledig ontwikkelde BALT is terug te vinden vanaf 6-8 weken.
Daarnaast hebben factoren van buitenaf, zoals een infectie, ook een positief effect op de
ontwikkeling van de BALT.
De vroege immuunrespons in de luchtwegen
Voordat influenza virus cellen van de luchtwegen kan infecteren, moet het eerst voorbij een
eerste blokkade zien te komen. Deze blokkade bestaat uit slijm wat bovenop de
epitheelcellen ligt die de buitenste cellaag van de luchtwegen vormen. In dit slijm komen
van allerlei stoffen voor, geproduceerd door epitheelcellen en cellen van het
immuunsysteem, die ervoor zorgen dat het virus niet kan binden aan de epitheelcellen en

Nederlandse samenvatting
189
daarmee infectie blokkeren. Het slijm met daarin gevangen virus wordt door trilhaartjes op
de epitheelcellen omhoog, de luchtwegen uit bewogen. Als influenza virus voorbij de
slijmblokkade komt, kan het de epitheelcellen infecteren. De geïnfecteerde cellen scheiden
stoffen uit die de omgeving en het immuunsysteem alarmeren, de zogenaamde cytokines en
chemokines. Hierdoor worden allerlei processen op gang gebracht die er uiteindelijk voor
zorgen dat de infectie onder controle wordt gehouden en het virus en geïnfecteerde cellen
worden opgeruimd. Witte bloedcellen spelen hierin een belangrijke rol. Macrofagen,
dendritische cellen (DC) en natural killer (NK) cellen spelen een belangrijke rol in de
vroege immuunrespons, terwijl verschillende soorten T-cellen (CD4+ T-cellen en CD8+ T-
cellen) een belangrijke rol spelen in een later stadium van de immuunrespons. Macrofagen
en DC zijn zogenaamde antigeen presenterende cellen. Zij nemen lichaamsvreemde stoffen
(antigeen), wat in dit geval aviair influenza virus is, in zich op, breken het af tot kleine
stukjes en presenteren deze stukjes virus aan hun celoppervlak waarmee ze T-cellen kunnen
activeren. CD4+ T-cellen zijn helpende cellen, zij sturen andere cellen van het
immuunsysteem aan en ondersteunen deze cellen in het uitvoeren van hun functie in de
immuunrespons. CD8+ T-cellen en NK-cellen doden geïnfecteerde cellen of cellen die virus
hebben opgenomen. Cellen van het immuunsysteem worden aangestuurd door cytokines en
chemokines die worden uitgescheiden waardoor ze weten waar de infectie plaatsvindt en
wat ze moeten doen. Daarnaast zorgt cel-cel contact via eiwitten aan het celoppervlak, die
receptoren worden genoemd, ervoor dat cellen weten wat voor soort ziekteverwekker de
infectie veroorzaakt, welke cellen geïnfecteerd zijn en wat ze moeten doen om de infectie
onder controle te krijgen.
Controle van aviair influenza virus (AIV) uitbraken
Vaccins worden al decennia lang gebruikt om uitbraken van allerlei infectieziekten onder
controle te houden of te voorkomen, maar werken niet voor alle infectieziekten even
succesvol. Door vaccinatie wordt een immuunrespons opwekt tegen de ziekteverwekker in
het vaccin, in dit geval AIV, en een succesvolle immuunrespons leidt over het algemeen tot
een immunologisch geheugen tegen deze AIV variant. Bij een volgende infectie met deze
AIV variant zorgt het immunologisch geheugen voor een goede en snelle immuunrespons
om de infectie te stoppen. Een vaccin tegen AIV heeft tot doel een langdurige
immunologische bescherming te bieden tegen liefst zoveel mogelijk varianten AIV. In
kippen worden hiervoor geïnactiveerd virus of geselecteerde delen van het virus, zoals het
HA oppervlakte eiwit van het virus, gebruikt. Toedienen van geïnactiveerd virus of
geselecteerd virus eiwitten is echter onvoldoende om een immuunrespons te veroorzaken
die een goed immunologisch geheugen opwekt. Daarom wordt er nog een hulpstof aan het
vaccin toegevoegd, genaamd adjuvant. Er zijn verschillende adjuvants zoals olie emulsies,
aluminium zouten en bacterieel DNA die allemaal op hun eigen manier de immuunrespons

Nederlandse samenvatting
190
tegen een vaccin versterken zodat er een langdurig immunologisch geheugen wordt
opgebouwd.
Eén van de belangrijkste vragen in de bestrijding van influenza virus infecties is hoe een
sterke en veelzijdige bescherming tegen allerlei virus varianten kan worden geïnduceerd.
Hiervoor is het van belang te weten hoe een vroege immuunrespons tegen influenza eruit
ziet. Daarnaast kunnen bestaande vaccins een idee geven over de manier waarop
bescherming wordt geïnduceerd en hoe een dergelijk beschermende immuunrespons eruit
ziet. In dit proefschrift gaat het voornamelijk over de vroege immuunrespons tegen AIV
infectie in de luchtwegen van de kip, welke factoren invloed hebben op deze
immuunrespons en hoe een beschermende immuunrespons eruit ziet op genexpressie
niveau. Hierin geeft de mate van genexpressie de mate van aan- of uitschakelen van genen
aan.
In dit proefschrift
Immuunresponsen tegen AIV infectie kunnen worden bestudeerd in een dier, in vivo
genaamd, maar ook in cellen gekweekt in het lab, dit wordt in vitro genoemd. In vitro heeft
als voordeel dat het beter onder controle te houden is dan in vivo. Een nadeel van in vitro is
dat het vaak om 1 type cel gaat terwijl een organisme uit meerdere typen cellen bestaat die
onderling communiceren. Een tussenvorm is een orgaan cultuur waarin het controleerbare
van in vitro wordt gecombineerd met de multi-variëteit aan cellen van in vivo zonder dat de
orgaan structuur verloren gaat. In hoofdstuk 2 is onderzoek gedaan naar vroege
immuunresponsen tegen AIV infectie in een orgaan cultuur bestaande uit smalle ringetjes
van de luchtpijp (trachea), genaamd tracheale orgaan cultuur (TOC). Door het prepareren
van TOC uit de trachea bleken immuunresponsen te worden opgewekt die de
immuunresponsen tegen AIV infectie maskeerden. Door deze maskering kwamen de
immuunresponsen gemeten in vitro in TOC niet overeen met immuunresponsen tegen AIV
infectie gemeten in vivo in de trachea. Dit maakt TOC ongeschikt als model om
immuunresponsen tegen AIV infectie te meten in vitro op genexpressie niveau.
Een onderdeel van de vroege immuunrespons vormt een groep eiwitten genaamd
collectines. In zoogdieren is gebleken dat collectines de infectie voor een deel blokkeren
door te binden aan het influenza virus, maar voor kippen collectines is dit nog niet
aangetoond. In hoofdstuk 3 wordt de structuur en functionaliteit van een nieuw kippen
collectine dat voorkomt in de luchtwegen van de kip, genaamd chicken lung lectin (cLL),
onderzocht. De structuur van cLL kwam overeen met de karakteristieke structuur van
collectines. Daarnaast bleek cLL te kunnen binden aan menselijke varianten influenza virus
en de infectie van AIV in TOC af te remmen, hoewel dit niet herhaalbaar was. Hieruit blijkt
dat cLL een mogelijke rol speelt in het afremmen van AIV infecties, maar dat hiernaar nog
meer onderzoek moet worden gedaan om dit met zekerheid vast te kunnen stellen. Verder is

Nederlandse samenvatting
191
het onbekend of AIV infectie in de kip invloed heeft op de productie van kippen collectines
op genexpressie niveau en of een verschil in leeftijd hierin een rol speelt. Dit is bestudeerd
in hoofdstuk 4 in de trachea en longen van jonge en oudere kippen voor verschillende
kippen collectins. Wij vonden dat AIV infectie een effect had op de productie van
verschillende kippen collectines op genexpressie niveau en dat dit effect leeftijd en orgaan
afhankelijk is. Verder onderzoek naar de precieze functie die kippen collectines vervullen
tijdens de vroege immuunrespons moet uitwijzen wat deze verschillen voor invloed hebben
op de afweer tegen AIV in de luchtwegen van de kip.
Zoals eerder al beschreven zijn de luchtwegen van de kip anders dan van zoogdieren.
Kippen hebben een circulaire luchtstroom door de longen en andere receptoren waaraan
AIV kan binden die net als in zoogdieren niet gelijkmatig door het luchtwegen systeem zijn
verspreid. De AIV stam H9N2 is een LPAI die er de voorkeur aan geeft om hoog in de
luchtwegen infecties te veroorzaken. Uit onderzoek in makaken is gebleken dat een
ongelijke verdeling van virus in de longen een effect heeft op de immuunresponsen die
worden gemeten op genexpressie niveau. In hoofdstuk 5 is onderzocht of verschil in
luchtstroom en anatomie in de trachea en longen van de kip een effect heeft op de verdeling
van virus in de luchtwegen en de immuunrespons op genexpressie niveau. Er was weinig
verschil in immuunrespons tussen het bovenste en onderste deel van de trachea in zowel
ongeïnfecteerde als geïnfecteerde kippen. In de long van ongeïnfecteerde kippen kwam de
immuunrespons in de twee delen waarin de hoofdluchtweg of primaire bronchus loopt met
elkaar overeen en verschilde die van de immuunrespons in de twee delen waarin de kleinere
luchtwegen of tertiaire bronchi zich bevonden. In geïnfecteerde dieren bevond het meeste
virus RNA zich in de twee delen waarin de hoofdluchtweg zich bevond. Dit verschil in
virusverdeling versterkte het verschil in immuunrespons wat al te zien was in de long van
ongeïnfecteerde dieren. Dit geeft aan dat het verschil in luchtstroom en anatomie binnen de
kippenlong invloed heeft op de virusverdeling en de immuunrespons, waardoor bestuderen
van maar een klein deel van de long invloed heeft op het resultaat van de studie.
De luchtwegen, en vooral de longen, spelen een belangrijke rol in de immuunrespons tegen
AIV infectie. Het respiratoir immuunsysteem ontwikkelt zich nadat het kuiken uit het ei is
gekomen waardoor jonge dieren verschillen in immuunrespons van oudere dieren. In
hoofdstuk 6 is bestudeerd in welke mate de immuunrespons tegen AIV infectie in de
luchtwegen op genexpressie niveau wordt beïnvloed door een verschil in leeftijd. Daarvoor
werd de immuunrespons in 1 en in 4 weken oude ongeïnfecteerde en AIV geïnfecteerde
dieren met elkaar vergeleken. In ongeïnfecteerde dieren werden vooral verschillen gezien in
expressie van genen die een rol spelen bij ontwikkeling van weefsel en organen en
immunologische ontwikkeling. In geïnfecteerde dieren kwamen er minder immunologische
genen tot expressie en voor een kortere periode in jonge dieren dan in oudere dieren. Deze
verschillen lijken gekoppeld te kunnen worden aan de functionele ontwikkeling van T

Nederlandse samenvatting
192
cellen, NK cellen en APC. Deze resultaten tonen aan dat immunologische ontwikkeling
invloed heeft op de immuunrespons tegen AIV infectie in de luchtwegen van de kip en
suggereren dat de sterkte en duur van de immuunrespons leeftijdsafhankelijk zijn.
Expressie van genen die een rol spelen bij blokkering van virusvermeerdering was
leeftijdsonafhankelijk.
In hoofdstuk 7 werden immuunresponsen tegen AIV infectie in de luchtwegen van kippen
die gevaccineerd zijn met verschillende adjuvantia vergeleken. De vergelijking van de
immuunrespons in dieren die beschermd zijn tegen AIV infectie met dieren die
onbeschermd zijn kan een idee geven over de manier waarop bescherming wordt
geïnduceerd en hoe een dergelijk beschermende immuunrespons eruit ziet. In onze studie
werden dieren gevaccineerd met een geïnactiveerd H9N2 virus in combinatie met een olie
emulsie (w/o), een aluminium zout (Al(OH)3), bacterieel DNA (CpG) of zonder adjuvant.
Daarna werden gevaccineerde en ongevaccineerde dieren geïnfecteerd met levend H9N2
virus. Dieren gevaccineerd met w/o en Al(OH)3 waren beschermd. Beschermde dieren
hadden weinig virus RNA in de longen en trachea, lagere genexpressie niveaus, vooral
sterke genexpressie op dag 1 na infectie die daarna afnam, minder CD4+ T cellen en
macrofagen in de longen en veel virus-neutraliserende antilichamen in het bloed vergeleken
met onbeschermde dieren. Bij onbeschermde dieren was het tegenovergestelde te zien wat
duidde op een heftige immuunrespons die door zijn sterkte zelf schade leek te veroorzaken.
Deze data suggereren dat naast veel virus-neutraliserende antilichamen in het bloed en lage
genexpressie, de afwezigheid van een sterke immuunrespons de belangrijkste factor is die
samenhangt met bescherming tegen een herhaalde infectie.
Conclusie
Vroege immuunresponsen zijn belangrijk voor de blokkering en onder controle houden van
de infectie, maar ook voor het induceren van een specifieke immuunrespons. De studies in
dit proefschrift dragen in de eerste plaats bij tot een beter inzicht in de vroege respiratoire
immuunrespons tegen AIV in de kip en hoe een beschermende immuunrespons verloopt na
een herhaalde infectie. Daarnaast blijkt uit de studies beschreven in dit proefschrift dat
verschillende factoren invloed hebben op de vroege immuunrespons tegen AIV infectie in
de luchtwegen. Zo heeft de locatie waar monsters in de long worden genomen invloed op
de uitkomst van de studie. De immuunrespons zelf wordt direct beïnvloed door leeftijd van
de dieren en de adjuvantia in een vaccin. Voor de ontwikkeling van nieuwe vaccins tegen
AIV is het van belang dat het effect van deze factoren in ogenschouw wordt genomen.

Dankwoord

Dankwoord
194
Eindelijk is het dan zover, de hoofdstukken voor dit proefschrift zijn af! Dan is het nu tijd
voor het belangrijkste en meeste gelezen deel van een proefschrift: het dankwoord. Hier wil
ik graag de vele mensen bedanken die direct of indirect een bijdrage hebben geleverd aan
dit boekje, zonder jullie had het er nooit zo uit gezien! Een aantal van hen wil ik daarom
graag bij naam noemen.
Allereerst mijn co-promotor Lonneke Vervelde, aanstekelijk vaatje positiviteit en energie,
rots in de branding, “chicken killer queen”. De afgelopen 5 jaar lijken één lange achtbaanrit
met een geweldige finale (recordje papers submitten). Door jouw onwrikbare geloof in mij,
je aanmoediging en enthousiasme (de kip is ook absoluut een super cool beest!) vond ik bij
twijfel steeds de energie en het geloof om door te zetten. Ik heb zoveel van je geleerd en
vond onze samenwerking bijzonder en erg gezellig. Thanks, big hug!
Mijn promotor Willem van Eden. Dank je voor alle vrijheid die je me gegeven hebt binnen
dit project waardoor ik ruimte had om me te ontwikkelen en me op de microarray ik-zie-
door-de-stippen-het-bos-niet-meer wereld te storten. Ik waardeer de snelheid en je kritische
oog waarmee je mijn stukken nakeek op het eind van mijn AIO tijd (mijn kommafobie is al
aan het afnemen).
Alle mensen van de kippengroep. Toen ik begon als AIO was het nog maar een klein
groepje. Mijn kippen-AIO-voorbeeld Mark, altijd in voor een praatje of advies (zit je nog
steeds op de labvloer om eens goed na te kunnen denken?); Daphne met haar gouden
handjes die altijd voor je klaar staat; Evert, die discussiëren naar een kunstvorm heeft
verheven. Daarna groeide de groep snel. Eveline, die schreeuwen-in-de-wei sessies waren
heerlijk; Christine, boordevol positiviteit en geen probleem te groot, ik ben ook erg blij om
nu met je samen te werken in mijn nieuwe project; Peter, geen apparaat of computer
probleem wat je niet op kon lossen; Willem de onverstoorbare; kip/koe Ad (nieuw ras denk
ik), de rust zelve met praktische tips tijdens de werkbespreking; Stefan, gezellig babbelen in
de flowkast of achter de facs; Kjell, kort maar onvergeetbaar; Christoph, always in for a
quick chat. Ontzettend bedank voor al jullie hulp, maar zeker ook voor alle gezelligheid in
en buiten het lab. Wanneer is het volgende kippenetentje en gaan we na Oz nu Hongarije op
z’n kop zetten?
And of course the chicken students Manon, Marie-Luise (we had lots of fun together and I
still miss your contagious laughter), Tim (al andere kleuren in exel gevonden?), Pauline,
Hillary, Ad (lekker nuchter) and Alida who lightened up the lab in their own way.
Al mijn roomies. Huidige roomies Rachel, Wiebren, Josée, Sanne, Manoek en Jeroen, dank
je voor de stiltes als ik weer een paperdeadline probeerde te halen.

Dankwoord
195
Old roomies Daphne, Christine, Peter, Christoph, Kim (my writing course buddy) it was
short but fun!
Oud-oud roomies Lotte en Daniëlle, bij jullie kon ik altijd stoom afblazen en was er een
bemoedigend woord of advies, dank je, en later ook Marieke en Frank (kom op, de laatste
loodjes!).
Verder alle nog niet genoemde mede-AIOs de afgelopen jaren: Erwin (zo moeilijk waren je
4 vragen toch niet, maar wel leuk), Teun (hoe blijf je altijd zo kalm?), (sportie-) Aad en
Natascha, (regelneef) Marij, Martijn (waar blijven die bitterballen tijdens de journal club?),
Chantal, Bram en Annette. Voor degene die nog hard bezig zijn heel veel succes en ik kijk
uit naar jullie schitterende boekjes (onthoud: uiteindelijk komt alles goed, zo niet dan toch,
echt waar) en allen bedankt voor de gezelligheid.
Uiteraard wil ik ook alle mensen bedanken die door hun aanwezigheid de afdeling
immunologie tot een leerzame en gezellige werkplek hebben gemaakt de afgelopen 5 jaar.
Het record met zoveel mogelijk mensen om 1 lunchtafel proppen en het fameuze
koekjesrooster dragen daar zeker aan bij. Femke, Ildiko, Willemien, Dietmar, Alice, Ineke,
Victor, Ton, Ruurd, Mieke, Elles, Esther, Jeroen, Cornelis, Ger, Janine, Peter van Kooten,
Peter Reinink…..en alle andere bedankt! Marielle, dank je voor alle regeldingetjes.
Ook wil ik de mensen van de groep van Frank Holstege bedanken voor al hun hulp bij mijn
microarray experimenten, zonder hen was microarray data een wereld van gekleurde
stippen gebleven. In het bijzonder wil ik bedanken Marian Groot Koerkamp voor alle
brainstorm sessies, genespring tips en er altijd te zijn als ik weer eens binnen kwam
stormen voor advies en Dik van Leenen voor het oplossen van mijn vele vetes met de
bioanalyzer en de computer. Ook Tony Miles voor zijn praktische tips voor in het lab en
Engels schrijven (en cauliflower with cheese).
Ik wil graag alle mensen van Intervet die betrokken waren bij dit project bedanken.
Winfried Degen en Virgil Schijns bedankt voor de prettige samenwerking en het snel
doorloosden van mijn stukken door de patent afdeling, we waren een leuk kippenfront in de
muizen en humane wereld.
Natuurlijk ook al mijn andere Virgo-collega’s bedankt voor de samenwerking, jullie
enthousiasme en alle interessante discussies.
Henk Haagsman, Edwin Veldhuizen, Astrid Hogenkamp en Cherina Fleming dank je voor
de samenwerking en de introductie in de wereld van de collectines. Er valt daar nog zoveel
te ontdekken!
Dankwoord
196
Natuurlijk wil ik ook mijn familie en mijn vrienden buiten het lab bedanken en in het
bijzonder Bregje, Erwin (wat is de kaft mooi geworden!), Rudy en Anke. Dank je voor
jullie geduld en interesse, maar vooral voor jullie steun en de hoognodige ontspannende
momenten. Hopelijk heb ik nu weer wat meer tijd zodat ik weer wat vaker kan komen
binnenvallen.
De weg naar dit proefschrift was lang en soms zwaar. Ik mag me gelukkig prijzen dat ik
vijf mensen om me heen heb die er altijd voor me zijn en zonder hun aanmoediging was ik
nooit zover gekomen.
Mijn lieve schoonouders, Cor en Thea, dank je voor jullie opbeurende woorden alle steun
en adviezen en de heerlijke ontspannende weekendjes weg.
Lieve pap en mam, dank je voor jullie onvoorwaardelijke steun en vertrouwen in mij. Alle
interesse in “die DNA dingen” die er altijd is en voor alles wat jullie mij hebben
meegegeven.
Lieve Jeroen, wat hebben we veel meegemaakt samen. Dank je voor alle liefde, steun en
vertrouwen die je me altijd gegeven hebt, maar ook voor je geduld en de vele avondjes
koken vooral in het afgelopen jaar, en nog zoveel meer. Ik hoop dat we nog vele mooie
tijden zullen beleven samen. Zullen we beginnen bij een mooi duikseizoen?
Sylvia


List of abbreviations
198
List of abbreviations
AFC Antibody forming cells
Ag Antigen
AIV Avian influenza virus
Al(OH)3 Aluminium hydroxide
APC Antigen presenting cells
BALT Bronchus associated lymphoid tissue
cCL-1 Chicken collectin 1
cCL-2 Chicken collectin 2
cCL-3 Chicken collectin 3
cLL Chicken lung lectin
CpG Nonmethylated CpG oligonucleotides
CRD Carbohydrate recognition domains
cSP-A Chicken surfactant protein A
Ct threshold cycle value
CTL Cytotoxic T lymphocytes
d.p.c. Days post challenge
DAVID Database for Annotation, Visualization and Integrated Discovery
DC Dendritic cells
DDX DEAD box helicase
EID50 Embryo infectious dose 50
ELISA Enzyme-linked immunosorbent assay
FAE Follicle-associated epithelium
GO Gene Ontology
h.p.i. Hours post inoculation
HA Hemagglutinin
HAA-inhibition Haemagglutination inhibition
HG Harderian gland
HI titer Hemagglutinin inhibition titer
HPAI Highly pathogenic avian influenza
IAV Influenza A virus
IFN Interferon
IL Interleukin
LPAI Low pathogenic avian influenza
M1 Matrix protein 1
M2 Matrix protein 2
mAb Monoclonal antibody
List of abbreviations
199
MCM Mini chromosome maintenance complex
MDCK Madin-Darby canine kidney
MHC Major histocompatibility complex
MIAME Minimum Information About a Microarray Experiment
MФ Macrophage
NA Neuraminidase
NDV Newcastle Disease Virus
NK cells Natural killer cells
NP Nucleoprotein
NS1 Non-structural protein 1
NS2 Non-structural protein 2
p.i. Post inoculation
PAMP Pathogen-associated molecular patterns
qRT-PCR Real-time quantitative reverse transcription-PCR
r Pearson correlation coefficient
RNP Ribonucleoprotein
SEM Standard error of the mean
sIgA Secretory IgA
SP-A Surfactant protein A
SP-D Surfactant protein D
SPF Specific-pathogen-free
TLR Toll-like receptor
TOC Tracheal organ cultures
vRNA Viral RNA
vRNP Viral ribonucleoprotein
w/o Water-in-oil
wk Week

Curriculum Vitae
200
Curriculum Vitae
Sylvia Reemers werd op 22 augustus 1978 te Veldhoven geboren. In 1994 behaalde zij het
MAVO diploma aan het Koningshof te Veldhoven, in 1996 het HAVO diploma aan het
Sondervick College te Veldhoven en in 1998 het VWO diploma aan het Sondervick
College te Veldhoven, waarna zij met haar studie bioprocestechnologie aan Universiteit van
Wageningen begon. Haar eerste stage liep zij in het Laboratorium voor Virologie aan de
Universiteit van Wageningen onder leiding van Dr. ir. Marielle Van Hulten. Hier deed zij
onderzoek naar capside formatie en bepaling van de positie van de structurele eiwitten in
het virion van het White Spot Syndrome Virus (WSSV) en screenen van een
antilichamenbank op specifieke antilichamen met behulp van phage display. In haar
volgende stage deed zij onderzoek naar inductie van specifieke CD8+ T-lymfocyten tegen
twee verschillende HIV immunogenen tot expressie gebracht in een recombinant
adenovirus. Dit onderzoek werd uitgevoerd op de Human Immunology Unit van het
Weatherall Institute of Molecular Medicine, Oxford University, Oxford, United Kingdom
onder leiding van Dr. Joseph Nkolola en Dr. Tomas Hanke. Vervolgens deed zij een stage
bij de afdeling Virologie aan de Faculteit Diergeneeskunde van de Universiteit van Utrecht
onderleiding van Dr. Berend-Jan Bosch waar zij onderzoek deed naar het remmende effect
van bepaalde domeinen van het MHV en SARS coronavirus spike eiwit op virus-cel fusie
en cel-cel fusie. In maart 2004 werd het doctoraal diploma met veel genoegen behaald.
Vanaf maart 2005 begon zij als assistent in opleiding op de afdeling Immunologie aan de
Faculteit Diergeneeskunde van de Universiteit van Utrecht. Dit onderzoek uitgevoerd
onderleiding van Dr. ir. Lonneke Vervelde staat beschreven in dit proefschrift.
Vanaf september 2009 is zij werkzaam als post-docteraal onderzoeker bij Dr. Christine
Jansen op de afdeling Immunologie aan de Faculteit Diergeneeskunde van de Universiteit
van Utrecht.
Copyright © 2022 FDOKUMEN